
Program and Abstracts of 2013 Congress / Programme et ...
491
-
Upload
khangminh22 -
Category
Documents
-
view
6 -
download
0
Transcript of Program and Abstracts of 2013 Congress / Programme et ...


Sponsors On behalf of all the delegates, the Canadian Water Resources Association,
the Canadian Meteorological and Oceanographic Society, and the Canadian Geophysical Union
wish to acknowledge and thank the major supporters of our Joint Scientific Congress 2013.
Platinum Sponsors
~ CAMPSEL':' SCIENTIFIC
- WHEN MEASUREMENTS MATTER
Gold Sponsors
Meteo ~ The Weather Media V@' Network
Silver Sponsors UNIVERSITY OF SASKATCHEWAN City of
Saskatoon Global Institute for Water Security A:COM
()~" Water Security UI Agency ,~ Stantec
Other Sponsors
IfIHOSK~ <P.
~ • Taylor & Francis _ .. Golder CI==l.A. ......... n SaskPower I n 9 T,y~'&f'''''.<>"" Associates '" .... "'.............. ""wedng II,. ""u,..
.+. Envlronnement Canacla
With Support From
~~~~monl .+. t:::.-:: and Ocean. ~: 81 Oceana
-1-MIX _ .... IJ _ ... -
!..~ FSC- C103458
..
We welcome you to the
CMOS SCMO Canadian Meteorological and Oceanographic Society
Socu3te canadlenne de meteorologie et d'oceanographle
4ih Annual Congress of the Canadian Meteorological and
Oceanographic Society,
Canadian Geophysical
Union Union Geophysique
Canadienne
39th Annual Canadian Geophysical Union Meeting and
CWRA ACRH Canadian Associatton Water Canadienne Resources des Aessources
.......oiiio ..... ___ Association Hydriques
66th Annual Canadian Water Resources Association Conference
Saskatoon 2013
May 26-30
Editor: Anna Cole
PROGRAM
www.cmos.ca/congress2013
Abstracts and session schedules available online at:
https:/Iwwwl.cmos.ca/abstracts/congress schedule.asp
ISBN 978-0-9880587-1-2

Wi-Fi Internet Access
Wireless Internet access is available at TCU Place and in the Hilton meeting
rooms. We encourage you to access the abstracts and session schedules
online using your mobile devices rather than printing this material.
leu Place: Network name: Internet Access, Username: congress2013,
Password: saskatoon
Hilton: Network name: ATTwifi, Click on the "I have a coupon
code/promotion code", Agree to the terms of service, click next. Promo code:
guest2013, Ignore the "404 not found" error message .
. W' Wi-Fi at TCU Place courtesy of Campbell Scientific
https://wwwl.cmos.ca/abstracts/congress schedule.asp
Table of Contents
Welcome from Minister Kent ............. ..... ............................................................. ........................... 6
Welcome from Minister Ashfield .... ... ... .... ........................... .. ......................................................... 7
Welcome from the Premier ... ......... ... .... ........ .. ... ... ... ......... ... .. ... .......... ... .. ........... ....... .... .... .. ... .. .... .. 8
Welcome from Minister Cheveldayoff ................... .. ... .. ... ..... .. .... .. ... .. .. ... .. ......... ..... ........ ... ........ .. .. . 9
Welcome from the Mayor of Saskatoon .............................. ................................ ......................... 10
A Word about the Societies .............. ................................... .... .......................... .. ..... ..................... 11
Welcome from the President of CGU ................................... ................................ .. ........ .... ........... 13
Welcome from the President of CWRA .. ...... .......................... ............................. ............ .............. 14
Welcome from the Science Program and Local Arrangements Committees .......... ...................... 15
Science Program Committee ..................... ............................... ... .................................................. 15
Local Arrangements Committee ...... ..... ..... .. .. ....................... ... .................................... .................. 16
Exhibitor's List ... .. .... ... ...... .. .. ......... ... ............... ... .. ... ..... .. ................... .. ............. ................... .. ........ 17
Venue Maps: TCU Place .... .. ................. .. .... .. .. .... ... ... .............. .. .. ..... .. .... .. ... ............ , ..... .. ... ... .. ... .. ... 18
Venue Maps: Hilton Garden Inn .......... .......... ........................ .......... .......................... ......... ........... 21
Social Agenda ................................... .................................. ........................................................... 23
Public Lecture ... ............................... ............ .. ................... ... ................................ ... ... .... ................ 25
Plenary Speakers & Topics ..................... ..................... ................ ............................................ ...... 26
Sunday at a glance ........................ ..... .... ....................... .. .. .... ..... ... .. .......... ....... .. .... ..... .. ................. 36
Week at a glance .................................................................................................. ......................... 37
Session Schedules ....... .................... ...... .. .. ........................... ..... .. .................. ... ..... ........ ..... ............ 42 Abstracts...........................................................................................................................abstracts 1

NOTES
- 5 -

Welcome from Minister Kent
I am very pleased to welcome you to the first ever Joint Scientific Congress of the Canadian Meteorological and Oceanographic Society, the Canadian Water Resources Association, and the Canadian Geophysical Union.
This year's theme "Bridging Environmental Science, Policy and Resource Management" is timely and important to the scientific community, and to Canadians.
Improving our understanding of how changes in the earth's atmosphere, oceans and land impact each other is critical to our health and safety, as well as that of the environment. Deciding how to use the information to shape policies that protect our environment and contribute to our economic prosperity is equally crucial.
As a co-sponsor of this Congress, Environment Canada is pleased to support this opportunity for participants from all three organizations to share their observations, research, and ideas with one another. I value your commitment and wish you much success.
I am confident the knowledge, linkages in your areas of expertise, and relationships gained at this joint meeting will lead to even better policy development, environmental protection and opportunities to work together in the future.
Peter Kent Minister of the Environment
-6-

Welcome from Minister Ashfield
As Canada's Minister of Fisheries and Oceans, it is a sincere
pleasure to welcome you to the first-ever Joint Scientific Congress
of the Canadian Meteorological and Oceanographic Society,
Canadian Geophysical Union and Canadian Water Resources
Association.
The theme you have chosen for this Congress - Bridging
Environmental Science, Policy and Resource Management - is
reflected in my Department's ecosystem-based management
approach and in our use of scientific research to provide resource
and habitat management advice. Many of our activities and
scientists will be showcased in presentations during this Congress.
The federal government is a crucial contributor to the science
community in many fields being presented at this Congress.
Fisheries and Oceans Canada, for example, provides research facilities and conducts research that is at
the forefront in finding solutions to some of the world's most challenging issues in the areas of fish
population health, oceanography, and meteorology.
In addition, Canadian Coast Guard vessels provide platforms to support important scientific research in
Canadian waters, including in the North.
At the same time, we recognize that our Department benefits from work being done outside
government and we see forums such as this Congress as important venues through which we can
strengthen our collaborations.
We are proud to support the work of the Canadian Meteorological and Oceanographic Society, including
hosting of this Congress. We look forward to continued interactions with the Canadian Meteorological
and Oceanographic Society, the Canadian Geophysical Union and the Canadian Water Resources
Association.
Together, we can help ensure that we build on the progress to date and affirm Canada's place as a world
leader in science research and in using this research to provide critical and timely advice to benefit
Canadians.
I hope you have a productive and informative Congress.
The Honourable Keith Ashfield, P.e., M.P.
Minister of Fisheries and Oceans
-7-

Welcome from the Premier
On behalf of the Government of Saskatchewan, I am pleased to welcome you
to the first-ever Joint Scientific Congress of the Canadian Meteorological and
Oceanographic Society, Canadian Geophysical Union and the Canadian Water
Resources Association in Saskatoon.
Themed "Bridging Environmental Science, Policy, and Resource Management",
this conference will bring together over
1000 atmospheric, water, solid earth and
oceans experts, with a host of
presentations on state·of·the·art research,
exhibits, and workshops. Both teachers and students will have an
opportunity to learn about meteorology, oceanography and much
more.
This event provides numerous opportunities for networking,
information sharing and fellowship. I offer my sincere thanks to the
organizers, sponsors and volunteers of this outstanding event.
Congratulations to all award winners.
Best wishes for a successful conference and if this is your first visit to
Saskatchewan, welcome.
Brad Wall, Premier.
-8-

Welcome from Minister Cheveldayoff
It is a pleasure to welcome you to Saskatchewan for
"Bridging Environmental Science, Policy and Resource
Management", the 2013 Joint Scientific Congress of the
CMOS, CGU and CWRA. I am very pleased that you have
chosen to hold your conference in Saskatoon, one of the
fastest growing cities in Saskatchewan.
Saskatchewan is experiencing unprecedented growth. Our
population has increased by more than 80,000 since 2008.
Our economy is thriving and we are recognized across the
country for our competitiveness, investment opportunities,
growth and innovation.
With this growth we are experiencing new challenges and
those challenges include the environment and water management. To address those
challenges and support the Saskatchewan Plan for Growth we have taken a number of
initiatives. We are developing the Saskatchewan Environmental Code and have set new
direction for water management with the 2S Year Saskatchewan Water Security Plan. We
created the Water Security Agency with the mandate to ensure protection of water quality,
maintenance of aquatic habitats and sustainable water supplies, and to lead implementation of
the Water Security Plan.
Our government will continue to work hard to meet the challenges of growth and are looking
forward to the exchange of ideas and information at this conference.
I wish you a successful conference.
Honourable Ken Cheveldayoff Minister of Environment Minister Responsible for Water Security Agency
- 9-

Welcome from the Mayor of Saskatoon
On behalf of the citizens of Saskatoon, it is my pleasure to extend a warm welcome to all those attending the 2013 Joint Scientific Congress of the Canadian Meteorological and Oceanographic Society, Canadian Geophysical Union, and Canadian Water Resources Association. It is a privilege to host this historic meeting in our city.
Your conference is sure to afford delegates many opportunities for insight, knowledge, and collaboration as you share scientific research results and participate in workshops and social events. I extend my appreciation to organizers for ensuring that an informative and engaging agenda will be in place for all delegates.
Schedules permitting, I invite you to enjoy the experiences which Saskatoon has to offer. Our vibrant city is home to wonderful cultural and recreational amenities, scenic trails along the river valley, diverse shopping and dining establishments, and world-class hospitality.
Best wishes for a successful and productive meeting in Saskatoon.
Donald J. Atchison
Mayor
- 10 -

A Word about the Societies
CMOS The Canadian Meteorological and Oceanographic Society (CMOS) is the national
society of individuals and organizations dedicated to advancing atmospheric and
oceanic sciences and related environmental disciplines in Canada. The Society's
aim is to promote meteorology and oceanography in Canada. It is a non
governmental organization serving the interests of meteorologists, climatologists,
oceanographers, limnologists, hydrologists, and cryospheric scientists across
Canada and internationally. CMOS has a rich history dating back to 1939 when it was known as the
Canadian Branch of the Royal Meteorological Society. CMOS was officially created in 1967 as the
Canadian Meteorological Society and adopted its present name in 1977, following an invitation by the
Canadian Meteorological Society to the oceanographic community in Canada to join the Society.
CGU
On October 24, 1945, the National Research Council (NRC) of Canada convened the
first meeting of an Associate Committee to advise it on the needs of geophysics, with
J. T. Wilson as the Chairman of the committee. In 1946, this committee was
amalgamated with the Canadian committee for the International Union of Geodesy
and Geophysics (IUGG) to form the Associate Committee of Geodesy and Geophysics
(ACGG) of the NRC. Activities of geophysicists in Canada were coordinated by ACGG by forming a
number of subcommittees.
In 1974, the ACGG was replaced by a professional society called "The Canadian Geophysical Union, a
joined Division of the Geological Association of Canada (GAC) and of the Canadian Association of
Physicists (CAP)", and with J. T. Wilson as its first president. The Canadian Geophysical Union became an
independent organization in 1988, but today geophysicists can still join CGU by joining CAP or the
Geophysics Division of GAC. CGU comprises four scientific sections: Hydrology (since 1993), Geodesy
(since 2002), Solid Earth (since 2009) and Biogeosciences (since 2009). Now with about 500 members,
CGU serves as the national focus for geophysical sciences and carries on the traditional responsibility of
representing Canada in the IUGG through a Canadian National Committee (CNC/IUGG).
-11-
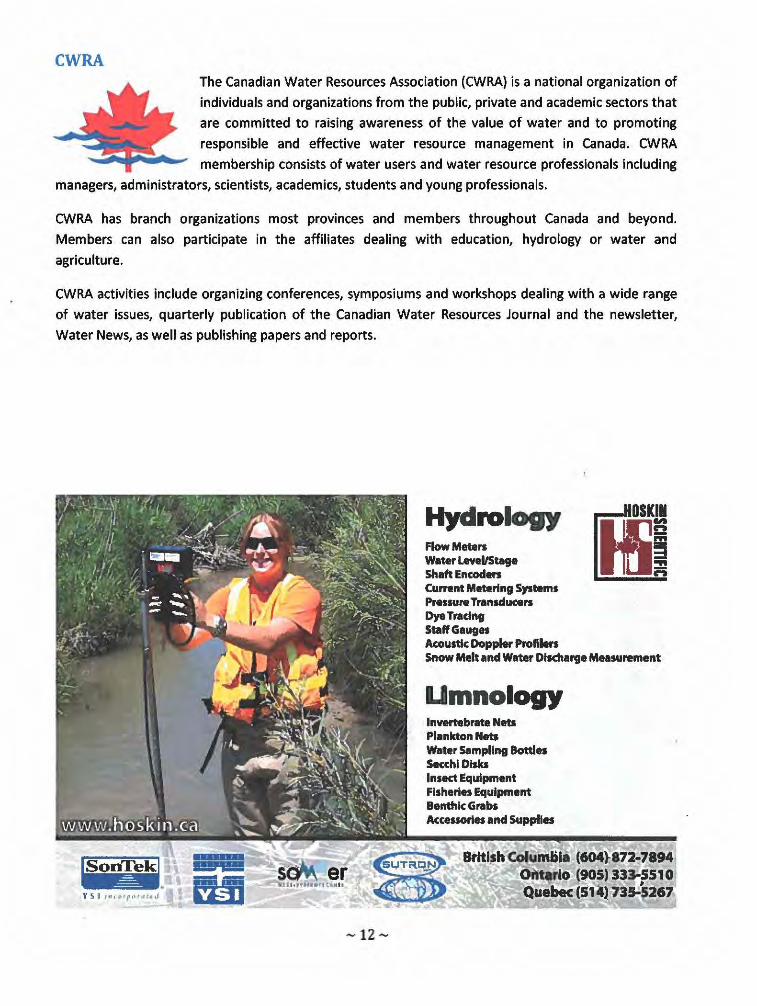
CWRA The Canadian Water Resources Association (CWRA) is a national organization of
individuals and organizations from the public, private and academic sectors that
are committed to raising awareness of the value of water and to promoting
responsible and effective water resource management in Canada. CWRA
membership consists of water users and water resource professionals including
managers, administrators, scientists, academics, students and young professionals.
CWRA has branch organizations most provinces and members throughout Canada and beyond.
Members can also participate in the affiliates dealing with education, hydrology or water and
agriculture.
CWRA activities include organizing conferences, symposiums and workshops dealing with a wide range
of water issues, quarterly publication of the Canadian Water Resources Journal and the newsletter,
Water News, as well as publishing papers and reports.
-12-
Hydrology Flow Mete .. Water LewllStage Shaft Encoders Current Mlllering System. P .... u .. TrIInsduce .. Dye Tradng Staff Gauge. Acoustic Doppler Profi .... Snow Malt and Weter Discharge Musurement
Umnology In_brata Nets Plankton Nets Water Sampling Bolli .. Sacchl Disks Insect Equipment FI.heri .. Equipment Benthic Grab. Accessorl .. and Supplies

Welcome from the President of CMOS It is indeed a pleasure to playa part in welcoming you all to the first ever Joint Scientific Congress of the
Canadian Meteorological and Oceanographic Society, the Canadian Geophysical Union and the Canadian
Water Resources Association in Saskatoon, a city with a rich history of scientific contributions in these
fields. The exciting scientific program consists of over 60 diverse themes on which scientists and policy
makers from industry, academia and government will be presenting results of their state-of-the-art
research. In addition to these, the congress features exhibits,
poster presentations, workshops and social events that
include the annual awards luncheon and banquet, all of
which you are more than welcome to visit or attend. There
should be ample opportunity to catch up with old
acquaintances and to make new contacts, especially with
participants from the other two societies. Craig Smith,
Virginia Wittrock, Geoff Strong and their excellent team of
volunteers have devoted many hours to making this meeting
a success and they will certainly be available to answer your
questions. Have a good meeting!
Peter Bartello
CMOS President
Welcome from the President of CGU I am pleased to welcome you to this historic joint conference between CGU, CMOS and CWRA, where
we meet together in Saskatoon under the timely umbrella of "Bridging Environmental Science, Policy
and Resource Management". This joint meeting represents our increasing collaborations and
interdisciplinary approach to key science issues of our time. At the Welcome/Registration desk, you will
find representatives of all 3 societies ready to assist you. During the
conference, I urge you to take full advantage of this opportunity to
renew old collaborations and develop new ones with your many
colleagues assembled here.
CGU members are asked to please make room in your schedule to
attend the CGU Annual General Meeting, section meetings, and the
CGU Banquet. We look forward to seeing you in the sessions and
meetings, and wish you an interesting and productive conference.
Gail Atkinson
CGU President

Welcome from the President of CWRA It is my great pleasure to welcome you to the first joint conference between three sister organizations:
CGU, CMOS and CWRA. Our association is the water partner in this triumvirate. The mission of the
Canadian Water Resources Association is to promote effective water management. Our members
understand that in order to fulfill this mission, we must join our efforts to those of colleagues from the
earth and atmospheric sciences. The Saskatoon conference, entitled "Bridging Environmental Science,
Policy and Resource Management", offers a unique
opportunity for engineers, scientists and managers to
share information in a historical multidisciplinary
forum. Bridging the earth-water-atmosphere divides is
what nature does best every day. We must therefore
heed the call of the planet and increase our
collaborations in order to become better stewards of
our environment.
I look forward to lively discussions and interesting
presentations and hope that you will find this
conference informative and stimulating.
Andre St-Hilaire
Canadian Water Resources Association President
Ani
www.atstec~ok>&v..«ll
35 Auriga Drive, Unit 111/211 Ottawa ON KlE 887
Toll Free: 1-888-845-4913
- ..:, 1
Weather Radar Sodar Vlslbility Sensors
and more .......
Forecasting Observing/CARS Meteorological Training
Leader In Aviation Communication ond Meteorological Services www.atsservice' .C8

Welcome from the Science Program and Local Arrangements Committees On behalf of the Science Program ,and local Arrangements Committees, we welcome you to Saskatoon and to the first ever joint meeting of the CMOS, CGU, and CWRA, We hope that you find the scientific program interesting, informative, and fruitful. We also hope that you find the social program enjoyable with ample opportunity to socialize with friends and colleagues while taking in the natural and manmade attractions that Saskatoon has to offer.
Our theme, "Bridging Environmental Science, Policy, and Resource Management" was chosen to highlight the relationships and interdependency between our science, the development of policy, and the management and protection of our abundant but precious natural resources. All three aspects of this theme have obvious significance here on the Prairies and throughout Canada. A large number of people at this meeting will be focusing on water, which is a crucial commodity in this part of Canada. We often have too much or too little, sometimes in the same year! We anticipate some interesting discussions on water, as it relates to our theme, during the special sessions and workshops.
Geoff Strong, Bob Halliday, and Rod Blais Science Committee Co-Chairs
Craig Smith Local Arrangements Committee Chair
Science Program Committee Bob Halliday, CWRA Co-chair
Geoff Strong, CMOS Co-chair
Garth Van der Kamp
Paul Myers Norman McFarlane
Sam Butler
Preparations for this meeting started nearly 4 years ago, with countless hours of work contributed by our many volunteers. Without volunteer support, this meeting would not be possible and we extend our gratitude to each and every one of them. And of course, it wouldn't be much of a meeting without you, the delegates, so enjoy your stay in Saskatoon and have a productive Congress.
Bob Kochtubajda
Russell Boals
Rod Blais, CGU Co-chair
Karl-Erich Lindenschmidt
Abdel-Zaher Kamal Abdel-Razek
-15-

Local Arrangements Committee LAC Chair Craig Smith
AV Liaison Jaime Hogan
Communications and Virginia Wittrock
Publications Lead
Educator's Day Coordinator Joe Eley
Educator's Day Support Kyle Hodder
Exhibits Oscar Koren
Facilities-Accommodations Barrie Bonsai
Facilities Support Gord Bell
Facilities-Venue Brenda Toth
local Exhibits Lead Chris Spence
Media Liaison John Paul Cragg
Member at Large Curtis Hallborg
Program Book Anna Cole
Registration lead Ron Hopkinson
Signage Aston Chipanshi
Social Program lead Stephnie Watson
Social Program Support Garry Mak
Sponsorship lead Dwight Clarke
Sponsorship Support Ray Pentland
Student Awards Coordinator Cherie Westbrook
Treasurer Bruce Davison
Volunteers lead Warren Helgason
Webmaster David Waldner
-16-
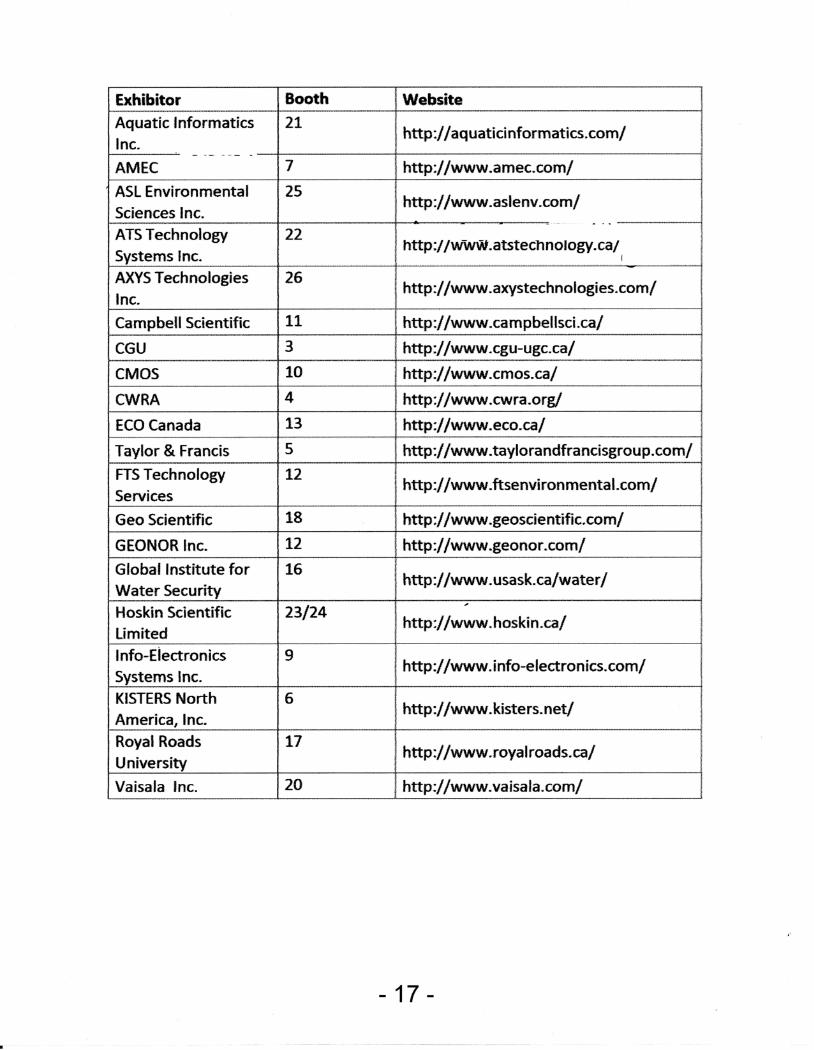
Exhibitor Booth Website Aquatic Informatics 21
http://aquaticinformatics.com/ Inc.
- -- -- - -
AMEC 7 http://www.amec.com/
ASL Environmental 25 http://www.aslenv.com/
Sciences Inc. . o. ATS Technology 22 Systems Inc.
http://www.atsteclmology.ca/ I
AXYS Technologies 26 http://www.axystechnologies.com/
Inc. Campbell Scientific 11 _o ___ -ittp:/Iwww.camPbellsci.ca/ . CGU 3 http://www.cgu-ugc.ca/
CMOS 10 http://www.cmos.ca/
CWRA 4 http://www.cwra.orgj
ECO Canada 13 http://www.eco.ca/
Taylor & Francis 5 http://www.taylorandfrancisgroup.com/ FTS Technology 12
http://www.ftsenvironmental.com/ Services
Geo Scientific 18 http://www.geoscientific.com/
GEONOR Inc. 12 http://www.geonor.com/
Global Institute for 16 http://www.usask.ca/water/
Water Security Hoskin Scientific 23/24
,
http://www.hoskin.ca/ Limited Info-Eiectronics 9
http://www.info-electronics.com/ Systems Inc. KISTERS North 6
http://www.kisters.net/ America, Inc. I Royal Roads 17 I http://www.royalroads.ca/ University Vaisala Inc. 20 http://www.vaisala.com/
- 17 -

..... CXl I
Exhibitor's Lounge
GRANDCIICLE Upper levels closed
Use Main Floor Aceess
MIDTO'Mol MALL r..c:::s.SECOND FLOOR I
UPPER FLOOR LEVEL
,
/1-,\
GRAND SAlON Exhibits/Health Breaks
- \ - I - :
" _ ! ..
-- ----- ~. ~ ~ ... ~ -"'- ------- ~. . ~ ~
Salon D Salon C Salon B
Stairway
Elevator
Washrooms
Science Sessions
SalonA
1liE BAY SECOND FLOOR
<: III ::I = III
:s: Dl '0 !I: -,l n c::::: "tl -Dl t"l III

I .... '" I
.-.. ........ ..2
:11
- '0{ ~:
~
:~
7
.:.
••
1'-:- ,-III'ORAOE i -'.'- - I
I
:-".; "'\I"..
r STAOELEFT I
STAGE
" STAGE RIGHT
...- a. Speakar Roady
!
Room
MIDT(MIN PlAZA MAIN FLOOR
MAIN FLOOR LEVEL
AUDITORIUM AVENUE
11tEATRE
Plenaries
I:AST LOUNGE
Gallery D
---r--
'-II ~ . . -v • •
'Regal •
• •
Gallery C
. ~~~c, 0'---.- - 0 - 0
1V1'1
ACCESS FROII MID'l'O\\oI< PLAZA
Gallery B
'.
Stairway
\ Elevator \
\ \
\ " Washrooms
H'lt / 1 \ I . on / \ \ Science
~' \ \ Sessions , \ \
. , \ \ : \
i • \ \
--
Gallery A
\ \ \ ~ \ \ 'Q.
Gallery Suite 1
\ ' .ft. ~ \ ~ ""'" .... \ . ~ \ \ '.:.l. \ \ \~
\
\ i \
\ \

N o !
•
UNDERGROUNDPARKADE
LOWER FLOOR LEVEL
C!lfTl!NNlAllIAU. 'A'
CENTENNlAlllAll '8' •
• CElITEIIfIIAI. ~ 'C
•
I I L Stairway
-- Elevator
- Washrooms ----
... :, ======~.~"~P~A~R=KA=DE==ENTRY=============== , . , .. _ - _ .. - .. - ' _ .. ,::-:::-,.;::-.;:-. .::,;:;-:;:::-;:::::;;0:._ .. ___ .. - .. _/'_~ .... ' ..... - .. - .. ._ , .. ;==PA=~=KA==D.=""~II:':~~':'==~::: . .... -' ........ ~ .... ,;:...,.....-~~ .. ~ /fi.~";;'~~.
v1 i' I ~r----'--I ~ i
• • •
ntEBAY lOWER lEVEl
• •
", • • j

Venue Maps: Hilton Garden Inn
w til N N
>
Restaurant & pub
Hotel Desk
0lIl<8 ~
Coffee shop Stal,-"all - • •
1'1 Ave N
Hilton Garden Inn Basement Level
- 21 -
Hilton Garden Inn Main Floor
.NI .NI .J'lI
•• COMMO' ~ALTHB LLROOM
SOUTH CENTRE NORTH
~ ~ ~
l lAo
Estevan

I almllll!t I Hilton Garden Inn Second Floor
Patio
www.hosldn.ca
British Columbl. (604) 872-78M Ontario (905) 333-5510 Quebec (514) 735-5267
-staIr-well -
t Hukseflux ) Thermal Sensors
- 22 -
. •
~ t= ... QI III
QI .a 3: Il
(
« QI u C .-... a..
c 0 ... ~ .. ~
... III ro w
Regina
Kendal
Solar RadIIItIon
PNRIIt Wutfler
PrecIpitation
Baromebic Pressure
RH • Temperature
Ultrasonic. Medlanlcal Anemometer.
Intiegratad Weather Stations
Snow Depth
sc:Jw.. er onset ""I_I·ur.ll!~" ' 1 lOst 011'1,"""

Social Agenda Please note that one Icebreaker Reception, one luncheon, and one Banquet ticket is included in the full
Congress registration package. Additional tickets are available for purchase at the time of registration or
from the registration desk. The buffet lunches (Monday, Wednesday and Thursday) are also included in
the full registration package.
Icebreaker Reception Please join us Sunday evening, May 26 from 17:30-21:00 in the Regal Room at TCU Place for some
socialization after registration for the first ever joint CMOS/CWRA/CGU Icebreaker. This is a great
opportunity to get reacquainted with colleagues and old friends and maybe make some new ones. We
have some "surprise" entertainment planned that we think you will enjoy. Cash bar opens at 17:30 with
food and entertainment to follow. The Regal Room can be found right behind the main registration desk
at TCU Place and will be the location of the Poster Session later in the week.
Awards Luncheons Both CMOS and CWRA will be hosting awards luncheons from 12:00 to 14:00 on Tuesday May 28'h. For
planning purposes, we request that you attend the luncheon for the society in which you declared your
affiliation when registering.
The CWRA Awards luncheon will be located in the Centennial Hall B at TCU Place. This is a served
lunch. The CWRA will be awarding the annual scholarships, including the Ken Thompson and Memorial
scholarships, and presenting the Hoskin Scientific Best Student Poster award.
The CMOS Patterson-Parsons luncheon will be located in Centennial Hall A on the lower level of TCU
Place. The Patterson Distinguished Service Medal will be presented by the Meteorological Service of
Canada for distinguished service to meteorology in Canada. The Timothy R. Parsons Award for
Excellence in Ocean Sciences will be awarded by Fisheries and Oceans Canada to recognize a Canadian
Scientist for outstanding lifetime contributions to multidisciplinary facets of ocean sciences or for a
recent exceptional achievement while working within a Canadian institution.
The CGU luncheon will be located in the Estevan Room on the lower level of the Hilton.
- 23 -

Banquets All three societies will be hosting an Awards Banquet on the evening of Wednesday May 29th
• Service for
the banquets will begin at 19:00. Prior to seating, there will be a cocktail hour for all three societies
from 18:00-19:00 in the TCU Place Grand Salon/Exhibit area. For planning purposes, we request that
you honour your choice of banquet made during registration. Volunteers will be guiding delegates to the
appropriate banquet so don't hesitate to ask a volunteer for instructions.
CMOS Banquet: lCU Place Centennial Hall A
CGU Banquet: lCU Place Centennial Hall B
CWRA Banquet: Hilton Commonwealth
Other Social Events Other social events are planned during the week of the Congress. Please check the Congress website
(http://www.cmos.ca/ congress2013/ index.htm ) for more details.
Agronomy. Soil Science Instrumentation
aT ...... -.
Onurlo (905) UJ-S510 I Quebec (514) 735-5167 www.hoskln.co
"*' Eijke!!t.!!!!p
- 24-
D onset HOlD hIJ lotten

Public Lecture A public lecture by Paulette Fox is scheduled on Tuesday evening at 7 pm in the TCUP Gallery A. Entertainment will be provided by the Poundmaker Drummers from 6:30 pm - 7 pm, with a cash bar open in TCUP Regal Room during this time. Details may be found on the website. Ms Fox's presentation is entitled "Linking Indigenous Knowledge Systems with Science and Integrated Policy Development and Management Frameworks".
Ms. Paulette M. Fox is known by "Naatowaawaawahkaki" or Holy Walking Woman in her language. She is from the Blackfoot People and was raised in the Blood Tribe community. She maintains her role of "Iiyoahkimi akii" (or Beaver Woman) and takes part in several ceremonies among the Blackfoot Confederacy. She has worked professionally with Indigenous communities in Canada, the United States and in China. Her work has focused around the development of integrated systems that include and are founded on Indigenous Environmental Knowledge Frameworks; including the development of the environmental protection division for her community which has led other First Nations in the development of similar systems and. She has been involved and invited to numerous dialogues and roundtables considering the various linkages and themes around Water, Food & Climate Security, Science, Policy, Technology and Traditional Knowledge.
Ms. Fox has worked with the Assembly of First Nations (AFN) Environmental Stewardship Unit advising in areas of Fish eries, Species at Risk, Water, Human Bio-monitoring and the First Nations Environmental Health Innovation Network. She has represented First Nations in Alberta and in Canada for direct policy development as well as policy advocacy regarding the inclusion of indigenous knowledge systems. Her work with non-profit organizations demonstrates her commitment to cross-cultural dialogue and includes member of Board of Directors for the Oldman Watershed Council, the Milk River Watershed Council of Canada, and the Water Matters Society.
Ms. Fox developed and delivered courses and training modules on Blackfoot Environmental Knowledge Systems based on her thesis: "Using GIS to link Blaclifoot environmental knowledge with ecological databases" and was awarded an NSERC scholarship and featured by L 'actualite in 2001-02 among 25 youth recognized for their leadership in Canada. She is currently working in collaboration with various partners in designing groundwater research aimed at creating and enhancing capacity for First Nations communities and learning more about the source. She has taught at the local Red Crow Community College, First Nations Self Government program at the Banff Centre as well as various guest lectures, seminars, and workshops. She has presented on her research and programs to various audiences and plenaries and including indigenous ethnic minority groups in south China.
Fox is an advocate of youth cultural and environmental awareness, training and exchange. Her love of the backcountry and the outdoors combined with years of coaching and mentoring are a natural fit with the inherited cultural responsibilities of ensuring the Blackfoot language and ways are past down to the next generation. She works as an associate with Harmony Walkers Inc. and is a First Nations Engagement and Relations Advisor with the Integrated Resource Management Stewardship Branch of the Alberta Government. Fox and family reside on the Blood Reserve in southern Alberta.
-25-

Plenary Speakers & Topics
Howard Wheater Global Institute for Water Security at the University of Saskatchewan
Monday, May 27 8:30 a.m.
Professor Howard Wheater is Canada Excellence Research Chair in Water Security and Director of the Global Institute for Water Security
at the University of Saskatchewan. A leading expert in hydrological science and sustainable water resource management, he has extensive international experience of flood, water resource and water quality issues. He is a Fellow of the Royal Academy of Engineering and the American Geophysical Union and winner of the Prince Sultan bin
Abdulaziz International Prize for Water. He is currently vice-chair of the World Climate
Research Programme's Global Energy and Water Cycle Exchange (GEWEX) project, leads UNESCO's GW ADI arid zone water resources program, is Chair of the Council of Canadian Academies Expert Panel on Sustainable Management of Water in the Agricultural Landscapes of Canada, and sits on an International Court of Arbitration concerning the Indus Waters Treaty.
Water Security in Western Canada: Science and Management Challenges Howard Wheater, Global Institute for Water Security at the University of Saskatchewan
The talk will outline the multiple dimensions of water security and define a set of thematic challenges for science, policy and governance, drawing on a case study of the Saskatchewan River Basin (SRB) in western Canada. A science agenda will be defined, based on the development of the SRB as a large scale observatory, to develop the underpinning science
needed to improve our understanding of water futures under societal and environmental change. It will be argued that new integration is needed of the natural sciences, engineering and social sciences, that non-stationarity poses issues of decision-making under deep uncertainty, and that new approaches to decision support are needed. It will be proposed that vulnerability analysis can be combined with scenario-based modelling to address issues of water security, and that knowledge translation is an important element in framing water futures.
Ted Shepherd Department of Meteorology, University of Reading. UK
Monday, May 27 9:15 a.m.
Ted Shepherd was born in Saskatoon. He obtained a B.Sc. degree in
Mathematics and Physics from the University of Toronto in 1979, and a Ph.D. degree in Meteorology from MIT in 1984 (working under the supervision of Jule Charney and Peter Rhines). After a postdoctoral
- 26-

fellowship with Michael McIntyre at DAMTP, University of Cambridge, he took up a faculty position at the University of Toronto in 1988. He was promoted to associate professor in 1993 and to full professor in 1996. From 2005-2010 he served as the Associate Chair for Graduate
Studies in Physics. In 2012 he moved to the University of Reading in the UK to become the inaugural Grantham Professor in Climate Science.
In the early part of his career Shepherd pioneered the application of Hamiltonian dynamics to geophysical fluid dynamics. Subsequently he turned his attention to the dynamics of the Earth's middle atmosphere (stratosphere and mesosphere), where he became a leading authority on
middle atmosphere dynamics and climate modelling, and chemistry-climate interactions. In this capacity he led, for over 20 years, a highly successful university-government collaboration to develop and use the Canadian Middle Atmosphere Model (CMAM), creating an entirely new research community in Canada. The CMAM has achieved a number of notable firsts, and is
currently regarded as one of the leading chemistry-climate models in the world.
Shepherd was a co-chair of the Scientific Steering Group of the World Climate Research Programme's SPARC Project from 2007 to 2012. He has also played key roles in the WMOIUNEP Ozone Assessments of 1998, 2002, 2006 and 20 I 0 - in 2006 as a member of the Assessment's Steering Committee - as well as the IPCCffEAP Special Report on Ozone and Climate (2005), and he is a Review Editor for the IPCC AR5. For five years (2001 through 2005) he was the Chief Editor of the Journal of the Atmospheric Sciences, the leading journal in fundamental atmospheric science. He has won the top awards of the Canadian Meteorological and Oceanographic Society (President's Prize, 1995) and the Meteorological Service of Canada
(patterson Medal, 2005), and is a Fellow of the CMOS, the American Meteorological Society, the American Geophysical Union, and the Royal Society of Canada.
Understanding Uncertainty in Climate Models: Robustness of the Atmospheric Circulation Response to Climate Change Ted Shepherd. Department of Meteorology •. University of Reading, UK
Although climate change is often characterised as "global warming", the impact of climate change will vary greatly from region to region. Regional aspects of climate change are controlled
by atmospheric circulation patterns, which moreover exhibit considerable chaotic variability. Model predictions of the atmospheric circulation response to climate change are in many cases highly uncertain, presumably because of systematic errors in the climate models (e.g. the location of the jet stream). The fact that these errors have stubbornly persisted despite increases in spatial resolution suggests that they are somehow linked to unresolved processes, whose
effects need to be parameterised in the models. Thus, improving climate models requires a better understanding of multi-scale interactions. There are good reasons to believe that model bias, the divergence of model projections, and chaotic variability are somehow related. This talk will present some examples of these kinds of uncertainties and some potential ways forward.
-27 -

W. Richard Peltier Department of Physics, University of Toronto
Tuesday. May 28 8:30 a.m.
W. Richard Peltier, DSc, and Fellow of the Royal
Society of Canada, is more commonly known as 'Dick' Peltier, received his undergraduate degree in physics from the University of British Columbia and his doctoral degree in physics from the University of Toronto.
Research Interests: include atmospheric and oceanic waves, geophysical fluid dynamics, physics of the planetary interior, and the planetary climate. One writer wrote that "Dick Peltier's lab is the planet itself'.
This renowned physicist has spent the past 34 years learning the complex science behind virtually every physical force that governs our planet - from ancient ice ages to how oceans work. He has developed powerful models, using sophisticated mathematical concepts, to depict what has happened to our climate over the past 600 million years - and, based on that information, what is likely to happen far into the future if we don't change our environmentallydamaging ways. Peltier's work has "helped pioneer Earth system science", a field that studies the interactions between the land, atmosphere, water and biosphere together.
His many awards and notable positions include recipient of the Sloan, Steacie, Killam and Guggenheim Fellowships, is Past President of the Canadian Geophysical Union, Past President of the IUGG Committee on Mathematical Geophysics, and elected Fellow of the American Geophysical Union and the American Meteorological Society. He is also a past recipient of the Kirk Bryan Award of the Geological Society of America, the Patterson Medal of the Meteorological Service of Canada, the J. Tuzo Wilson Medal of the Canadian Geophysical Union, and the Bancroft Award and the Miroslav Romanowski Medal of the Royal Society of Canada.
In 2004 he was the recipient of the Vetlesen Prize of the G. Unger Vetlesen Foundation of New York, often considered to be the equivalent of the Nobel Prize in the Earth Sciences. He was a Lead Author on the IPCC Fourth Assessment Report entitled Climate Change 2007. In 2009 he was awarded the Canadian Association of Physicists Gold Medal for Achievement in Physics. In 2010, Dick was chosen by the Franklin Institute to receive the Bower Award and Prize for Achievement in Science, the first Canadian to receive this award, and joining a very select group of previous recipients that includes Marie Curie, Thomas Edison, Albert Einstein and Stephen HaWking. In 20 II, Dick was awarded the Gerhard Herzberg Canada Gold Medal for Science and Engineering, awarded annually in recognition of "research contributions characterized by both excellence and influence" to a Canadian scientist. In addition to being well-known for his research, Dick is founding director of the University of Toronto's Centre for Global Change Science, and has been an outspoken critic of government cuts to climate research funding.
-28-

The Thermohaline Circulation of the Oceans: Impacts on Climate Variability and Change W. Richard Peltier, Department of Physics, University of Toronto
Although the wind driven circulation of the oceans is reasonably well understood, the same cannot be claimed for the thermohaline circulation. In part this is a consequence of the fact that the timescales of the variability associated with it, both forced and internal, tend to be multi
decadal or longer. I will review what is known concerning THe variability and its role in long timescale climate change from both a transient forced perspective and from the perspective of its statistical equilibrium strength under fixed boundary conditions that differ radically from
modern.
Under modern climate conditions there exists clear evidence that the THe is deeply involved in
the so-called Atlantic Multi-decadal Oscillation (AMO). Under Last Glacial Maximum boundary conditions there is also evidence, based upon the PaITh tracer of the overturning strength, that the North Atlantic Deep Water (NADW) cell was about 40 % weaker than modern. During the last glacial-interglacial transition, recent research has established that the famous-Younger Dryas (YD) hemispheric cooling event was forced by a massive flood of fresh water out onto the surface of the Arctic Ocean through the Mackenzie River outlet and to the subsequent slow down of the THe that this "water-hosing" event produced. Modern coupled atmosphere-ocean climate
models are able to successfully explain the related observational constraints, a fact that should be construed to provide a useful test of the models that we employ to make global warming projections when these models are asked to perform under conditions to which they have not been tuned. A fundamental issue concerning the ocean component of these models continues to be the representations they employ of diapycnal turbulent diffusivity. Recent results concerning this process that appear to be important to understanding how ventilated polar waters return to shallower depth, often in the opposite hemisphere, will be reviewed.
Robie Macdonald Institute of Ocean Sciences, Department of Fisheries and Oceans
Tuesday, May 28 9:15 a.m.
Robie Macdonald is an oceanographic geochemist at the Institute of Ocean Sciences, Department of Fisheries and Oceans. During the past four decades he has worked on aquatic pathways in coastal waters of the Pacific Ocean, in lakes and rivers, and in the Arctic Ocean. His interests lie in interaction of cycles, especially those of fresh water, organic carbon and contaminants. He has adapted or adopted a wide range of geochemical techniques to study sediments, particulates and water, with the objectives of determining sources of materials to the ocean, how materials move from one place to another, and how long they remain in the water. This work has led
-29-

to investigations of how contaminant cycles are impacted by environmental variability and climate change. Rob has been involved as a lead author or co-author in a number of large national and international assessments and his research on pathways is published in over 200 journal articles, one coedited book on the organic carbon cycle of the Arctic Ocean plus numerous book chapters. He is a fellow of the Chemical Institute of Canada, the Royal Society of Canada and the American Geophysical Union, and has been has been awarded several other honours including the CMOS President's Prize (2000). Rob's avocation is mountaineering and he has spent much of his spare time in the interior ranges of Vancouver Island, the Coast Range, the Rockies, the North Cascades and the Swiss Alps.
Seasonal Ice in the Arctic Ocean is Vanishing - So, What Else is New? Robie MacDonald, Institute of Ocean Sciences, Department of Fisheries and Oceans
It has become clear in my lifetime that summer sea ice in the Arctic Ocean will become a thing of the past, probably within decades. The evidence for this, collected by satellite images and under-the-ice nuclear submarine missions, is stunningly clear: each year seems to hold another record low in ice cover, further still below the projections of the most pessimistic models. But when you seek evidence for other system changes, the data base thins very quickly with the result that biological and geochemical changes likely to manifest themselves in the new Arctic Ocean are mostly a matter for speculation based partly on paleo records and partly on incomplete understanding of how ice controls biogeochemical cycles. The void in coherent biogeochemical time series does not help. I will present my "geochemical" view from studying freshwater, organic carbon and contaminant tracers to propose how the cycles of these components will change in the Arctic Ocean as a consequence of the shift from multi-year permanent pack ice, to first-year seasonal ice.
Dr. Garry Rogers Geological Survey of Canada
Wednesday, May 29 8:30 a.m.
Dr. Garry Rogers is a Senior Research Scientist with the Geological
Survey of Canada specializing in earthquake studies. He is also an
adjunct professor at the University of Victoria where he is leading the
development of NEPTUNE Canada's offshore seismograph network.
He currently serves in a professional capacity on a number of
committees including the National Research Council ' s Standing
Committee for Earthquake Design, which is responsible for the
earthquake provisions in Canada's National Building Code, on the
scientific advisory committee to the Earthquake program of the US Geological Survey and as
Canada's representative on the Pacific Tsunami Waming System.
Earthquake and Tsunami Hazards on Canada's West Coast Garry Rogers, Geological Survey of Canada
The west coast of Canada is defined by active plate boundaries and has a significant seismic and
tsunami hazard. A reminder of this was the M 7.7 October 27, 2012 earthquake off Haida Gwaii
- 30-

that caused very strong shaking over 150 kin of coastline and a tsunami of up to 4 m at some
locations. Fortunately that coast is a national park reserve and uninhabited.
There is very oblique convergence of the Pacific and North American plates in the region of Haida Gwaii resulting in large strike-slip and large thrust earthquakes. The subduction of oceanic plates beneath Vancouver Island has caused major earthquakes within the Earth's crust, deeper earthquakes within the subducting plates and huge thrust earthquakes offshore on the subduction
boundary. The last great subduction earthquake, aM 9.0 event, happened over 300 years ago on January 26, 1700 and left geological deposits documenting its strong shaking and the large tsunami it produced. Paleoseismic investigations suggest at least 19 similar events in the past 10,000 years.
The use of techniques such as GPS, broadband seismic analysis, high resolution swath bathymetry, freeze coring of soft sediments have lead to new knowledge that helps to define this
dynamic environment and to quantify the hazard that it represents.
• Don White Geological Survey of Canada
Wednesday, May 29 9:15 a.m.
Don White is a senior research scientist with the
Geological Survey of Canada. He is an applied seismologist whose research interests include seismic applications to C02 storage monitoring and mineral exploration. Since 2003, Don White has been the theme
leader for MMV research in the International Energy Agency (lEA) Greenhouse Gas WeybumMidale C02 Monitoring and Storage Project, where he has directed and integrated multidisciplinary research to advance development and demonstration of measurement, monitoring and verification methodologies. He serves as the Chair of the Science and
Engineering Research Committee for the Aquistore C02 Storage Project which is demonstrating C02 storage in a saline formation. Don White serves on the International Energy Agency Greenhouse Gas R&D Monitoring Network Steering Committee and the Society of Exploration Geophysicists C02 Research Committee. He is an Adjunct Professor at the Ottawa-Carleton
Earth Science Centre.
The Aquistore Project: Commercial-Scale C02 Storage in a Saline Aquifer in Saskatchewan, Canada D.I. White, Geological Survey of Canada
Carbon capture and storage (CCS) represents a likely component in international strategies to reduce greenhouse gas emissions. Coal-burning power plants are a primary target for this technology. The Aquistore Project, located near Estevan, Saskatchewan, is one of the first integrated commercial-scale C02 storage projects in the world that is designed to demonstrate C02 storage in a deep saline aquifer.
Starting in 201312014, up to 500 ktonneslyear of C02 captured from the nearby Boundary Dam coal-fired power plant will be transported via pipeline to the storage site. The C02 will be injected into a brinefilled sandstone formation at - 3300 m depth using the deepest well in Saskatchewan. The suitability of the geological formations that will host the injected C02 has been predetermined through 3D characterization using high-resolution 3D seismic images and deep well information. These data show that I) there are no significant faults in the immediate area of the storage site, 2) the regional sealing formation is continuous in the area, and 3) the reservoir is not adversely affected by knolls on the surface of the underlying Precambrian basement.
A key element of the Aquistore research program is the further development of methods to monitor the security and subsurface distribution of the injected C02. A permanent areal seismic monitoring array has been deployed which comprises 630 geophones installed at 20 m depth on a 2.5x2.5 km regular grid. The objective of this array is to test "sparse array" seismic imaging and to provide continuous passive monitoring for injection-related microseismicity. A network of surface tiltmeters and GPS stations has been deployed which in conjunction with InSAR analysis will be used to monitor injection-related surface deformation. Other methods that are being tested include downhole electromagnetic methods and timelapse gravity monitoring. Deployment of a fibre-<>ptic DAS (distributed acoustic sensor) system is being tested as an alternative to the costly downhole deployment of conventional geophones.
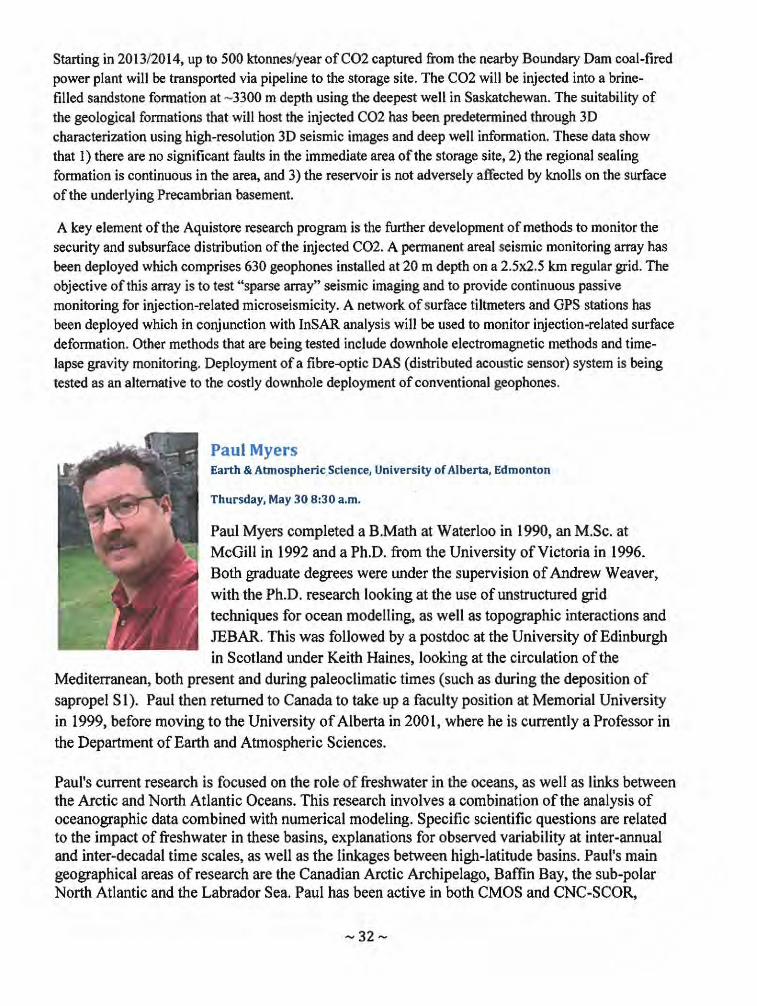
Paul Myers Earth & Atmospheric Science, University of Alberta, Edmonton
Thursday, May 30 8:30 a.m.
Paul Myers completed a B.Math at Waterloo in 1990, an M.Sc. at
McGill in 1992 and a Ph.D. from the University of Victoria in 1996.
Both graduate degrees were under the supervision of Andrew Weaver,
with the Ph.D. research looking at the use of unstructured grid
techniques for ocean modelling, as well as topographic interactions and
JEBAR. This was followed by a postdoc at the University of Edinburgh
in Scotland under Keith Haines, looking at the circulation of the
Mediterranean, both present and during paleoclimatic times (such as during the deposition of
sapropel S I). Paul then returned to Canada to take. up a faculty position at Memorial University
in 1999, before moving to the University of Alberta in 2001, where he is currently a Professor in
the Department of Earth and Atmospheric Sciences.
Paul's current research is focused on the role of freshwater in the oceans, as well as links between the Arctic and North Atlantic Oceans. This research involves a combination of the analysis of oceanographic data combined with numerical modeling. Specific scientific questions are related to the impact of freshwater in these basins, explanations for observed variability at inter-annual and inter-decadal time scales, as well as the linkages between high-latitude basins. Paul's main geographical areas of research are the Canadian Arctic Archipelago, Baffin Bay, the sub-polar North Atlantic and the Labrador Sea. Paul has been active in both CMOS and CNC-SCOR,

locally through the Alberta Chapter (which he has chaired), in congress organization, as well as nationally. Paul was the president of CMOS in 2007-2008 and is presently the chair ofCNCSCOR (2012-2015). He was the CNC-SCOR Tour Speaker to eastern Canada in 2011.
Freshwater Processes, Transport and Feedbacks between the Arctic and SubPolar North Atlantic Oceans Prof. Paul Myers, Earth & Atmospheric Science, University of Alberta, Edmonton
Canada is surrounded by three oceans, including the Arctic Ocean to the north and the Atlantic Ocean to the east. As high latitude climate evolves, changes in sea ice, river runoff, glacial melt
and ocean circulation are expected to impact oceanic salinities at high latitudes. Some of this freshwater is presently being stored in the Arctic Ocean, while some of it is exported to the
Atlantic Ocean where it is expected to have impacts on stratification, water formation, take-up of gases such as carbon dioxide, as well as circulation. This presentation will start by looking at how the impact of changes in the Arctic may be transferred through the Canadian Arctic Archipelago and Baffin Bay into the North Atlantic Ocean. Feedbacks from the Atlantic into the
West Greenland Current and Baffin Bay will also be examined, including potential impacts on Greenland's coastal tide water glaciers, as well as possible ramifications for the circulation passing through the Canadian Arctic Archipelago (and thus feeding back on the Arctic Ocean).
Dr. John Pomeroy Centre for Hydrology, University of Saskatchewan, Saskatoon
Thursday, May 30 9:15 a.m.
Dr. John Pomeroy is the Canada Research Chair in Water Resources and Climate Change (Tier I), Professor of
Geography and Director of the Centre for Hydrology at the University of Saskatchewan, an Honorary Professor of the Centre for Glaciology, Aberystwyth University, Wales and Chinese Academy of Sciences, Lanzhou and an Institute
Professor of the Biogeoscience Institute of the University of Calgary. He serves as President of
the International Commission for Snow and Ice Hydrology, leads the Canadian Rockies Hydrological Observatory and was recently Chair of the IAHS Decade on Prediction in
Ungauged Basins, Principal Investigator for the IP3 Cold Regions Hydrology Network and CoPrincipal Investigator for the Drought Research Initiative. Dr. Pomeroy has authored over 200
research articles and several books. His current research interests are on the impact of land use and climate change on cold and semi-arid region hydrology, snow physics, mountain hydrology, water security and hydrological predictions in ungauged basins including floods and droughts.
-33 -

Regime Change in Canada: Hydrology's Response to Climate Change in Cold Regions John Pomeroy, Centre for Hydrology, University of Saskatchewan, Saskatoon
A changing climate has profound implications for hydrology and water resources from small to continental scales, and is manifested quite distinctively in the cold regions where the solid phase of water plays an important role in the hydrological cycle. Cold regions are already experiencing a variety of changes to precipitation regimes, with some regions wetting substantially, but also
with some experiencing periods of diminished precipitation. These variations in precipitation have resulted in severe floods and droughts and long term changes to lake and wetland storage. However, most cold regions have experienced notable warming over the last 50 years and this is affecting the phase of precipitation, melt energy and evaporative energy, resulting in declines in the extent of seasonal snowpacks, glaciers and permafrost in many parts of Canada. The
hydrology resulting from these changes is less predictable because it is driven by hydrological processes that are now operating in fundamentally different ways from the past. For instance,
small ephemeral prairie streams whose flows have been dominated by snowmelt since records began have recently peaked from rainfall and begun to flow throughout the year. Rain on melting snow events are normally associated with flooding in British Columbia, but last year contributed to high flows from mountain streams in the Canadian Rockies and Yukon. Late summer flows from westem mountains are reduced as glacier coverage and late summer ice melt decline and alpine evapotranspiration increases. This loss of predictability has important consequences for water resources management techniques that have relied on stationarity. This talk will review some of the key changes occurring in cold regions hydrology due to changing atmospheric inputs. It will then examine the sensitivity of various cold regions hydrological regimes to further climate perturbations that are anticipated this century. Snow processes can
respond in a very non-linear manner to climate warming; this can results in dramatic hydrological regime change. The fragility of certain water resource systems will then be
considered in light of these hydrological changes.
- 34 -

;..TURNER ' J' DESIGNS --.... ----r-
We translate your knowledge into social marketing programs that people 'get' -so they can protect their health and the environment. LET'S TALK,
MARKETING FOR HEALTH AND ENVIRONMENT
AIR SHIFT GROUP
-35-
Call or email us: airshiftgroup.com [email protected] 250.372.5900 ...:1 @airshittgroup
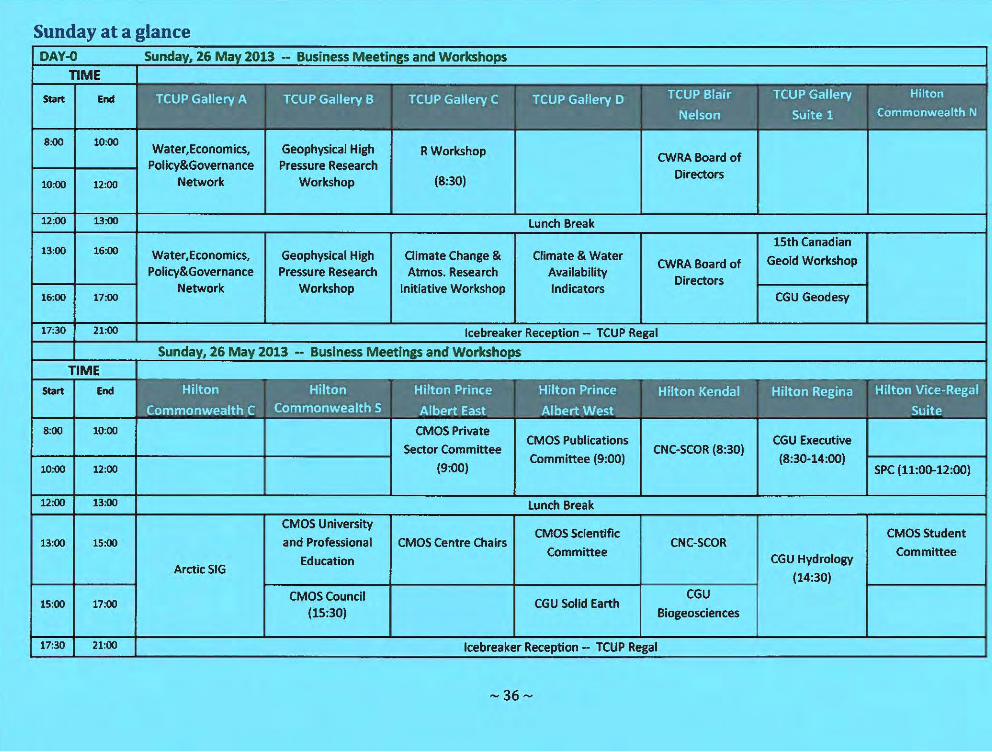
Sunday at a glance DAY-O Sunday, 26 May 2013 -- Business Meetings and Workshops
TIME
Start End TCU!' Gallery A 11"~~~ TCUP Gallery C mmtU§Jp!] "!·HlI:JItU'i' m!!.:r.rn Commonwealth N
8:00 10:00 Water, Economics, Geophysical High R Workshop CWRA Board of Policy&Governance Pressure Research
Directors 10:00 12:00 Network Workshop (8:30)
12:00 13:00 Lunch Break
15th Canadian 13:00 16:00 Water,Economics, Geophysical High Climate Change & Climate & Water Geoid Workshop CWRA Board of
Policy&Governance Pressure Research Atmos. Research Availability Directors
Network Workshop Initiative Workshop Indicators 16:00 17:00 CGU Geodesy
17:30 21:00 Icebreaker Reception -- TCUP Regal
Sunday, 26 May 2013 - Business Meetings and Workshops
TIME
Start End I;Dn·hml~·~1 CDmJll.!~ ' .. .. 8:00 10:00 CMOS Private
CMOS Publications CGU Executive Sector Committee
Committee (9:00) CNC-SCOR (8:30)
(8:30-14:00) 10:00 12:00 (9:00) SPC (11:00-12:00)
12:00 13:00 Lunch Break
CMOS University CMOS Scientific CMOS Student
13:00 15:00 and Professional CMOS Centre Chairs CNC-SCOR Committee Committee
CGU Hydrology Education ArcticSIG
(14:30)
CMOS Council CGU Solid Earth
CGU 15:00 17:00
(15:30) Biogeosciences
17:30 21:00 Icebreaker Reception - TCUP Regal
-36-

Week at a glance DAY-l MOl
8:30 I 9:15
9:15 I 10:00
10:30 I 12:00 I
13:30 I 15:00 I
15:30 17:00
17:00 19:00
Opening Ceremonies
Climate Change &. Carbon Cycle - I
Climate Change '" Carbon Cycle - 2
Supporting Climate Services- 1
>HI TCUP Salon 0
Mathe,:: _Of Planet 1 General Hydrology - 1 I Water Resource CANCID-I -
Gravity. Geoid &. Radar Meteorology
Management in Agricultural Drought and Applications- 1 Changing Climate - I '" Flooding
Height Systems
1:00-13:30 - TCUP C ....... W Hall
Mathematics of Planet I I Nater Resoun:e Lake Winnipeg Extreme Values IIWlar Meteorology
Earth _ 2 General Hydrology - 2 Management m Eutrophication and IDF Curves- and Applications- 2 Changing Climate - 2 WORKSHOP 1
HEALTH BREAK 15:00-15:30 TCUP GraDd SaloD aDd Hiltoa [ ,..1: ..... i"'" L ____ [ ...... L ___ -- ~ I T .1 •• n l : __ : _
Mathematics of Planet Ea!1!t - 3
I\.~-I M<HS<UR> IfIfUf\A.,;)n\
CMOSAGM
Coastal Oceonography PrairicLakeand Agricultural Land Cloud, Aeroso~ and POSTER Groundwater - 1 Reservoir
'" Inland Waters - 1 Management - I Management &. Water Radiation Processes installations
LUNCH - 12:00-13:30 - TCUP C .... IlDia.lIlaD
Coastal Occonography Prairie Lake and Anthropogcnically Policy &. POSTERs on Groundwater - 2 Reservoir Disturbed Peatlands -& Inland Waters - 2 Management - 2 1
Governance display
--,0 - TCUP Graltd SeIo. alld HiItt
Time Lapse Coastal Occooography
Anthropogcnically Water Management POSTERs on Monitoring of '" Inland Wate,, - 3
Disturbed Peatlands - Issues display Geohamrds 2
-37 -
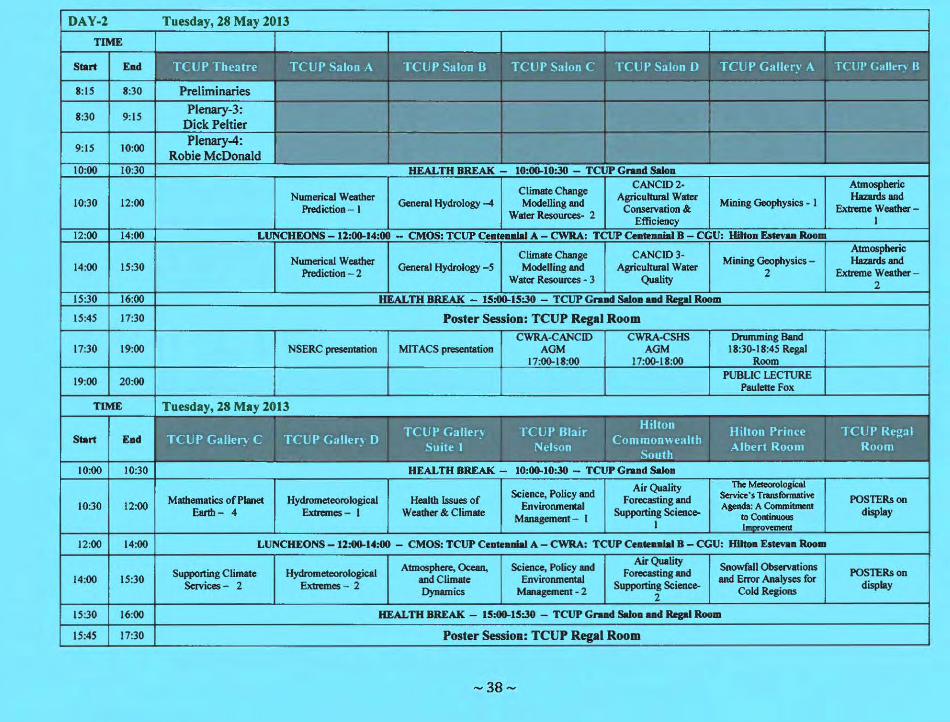
DAY-2 Tuesday, 28 May 2013
TIME
S", .. Eod 'iD!fiJi'ttqtlm 'li!I.Wiitim')'. 'lII!llV OliO 'iIiJliWl1QVCif TCUP Salon U TCUP Galler~' A TCIiP Gallen Il
8:15 8:30 Preliminaries
8:30 9:15 Plenary-3:
Dick Peltier
9:15 10:00 Plenary-4:
Robie McDonald 10:00 10:30 HEALTH BREAK - 10:00-10:30 - TCUP Grud Salon
Climate Change CANCIO 2- Atmospheric
Nwnerical Weather AgricutturaJ. Water HazMdsand 10:30 12:00
Prediction - I General Hydrology-t Modelling and Conservation &
Mining Geophysics - 1 Extreme Weather -Water Resoun:es- 2 Efficiency I
12:00 14:00 LUNCHEONS -12:00-14:00 - CMOS: TCUP Ce .... oiaI A - CWRA: TCUP C ........ I B eGU: HUton Esteva. Roo.
Climate Change CANCIO 3-Atmospberic
Numerical Weather Mining Geophysics - HazMds and 14:00 15:30
Prediction - 2 General Hydrology-5 Modelling and Agricuhural Water
2 Extreme Weather -Water Resources - 3 Quality
2 15:30 16:00 HEALTH BREAK - 15:00-15:30 TCUP Grand SalOD aad oIRoom
15:45 17:30 Poster Session: TCUP Regal Room
CWRA-CANCIO CWRA-CSHS Drumming Band 17:30 19:00 NSERC presenl8lion MIT ACS presentation AGM AGM 18:30-18:45 Regal
17:00-18:00 17:00-18:00 Room
19:00 20:00 PUBLIC LECTIJRE
Paulette Fo"
TIME Tuesday, 28 May 2013
s"''' E.d ie- 'r;m1lJg gCI TCUP Gallcr~ ID ,e_., 'I~ HII:1.: 1'. 10:00 10:30 HEALTH BREAK - 10:00-10:30 - TCUP Grand SaIo.
Air Quality The Meteorological
Mathematics of Planet Hydrometcorologica1 Health Issues of Science, Policy and Forecasting and Service's Transformative POS'lERs on
10:30 12:00 Environmental Agenda: A Commitment Eartb - 4 Extremes - I Weather & Climate
Management - I Supporting Scienc~ to Continuous display
I I overneR!
12:00 14:00 LUNCHEONS -12:00-14:00 - CMOS: TCUP C.nteoDloI A - CWRA: TCUP C ..... oiaI B - CGU: MUIG. E, ..... Roo ..
Atmosphere, Ocean, Science, Policy and Air Quality Snowfall Observations
14:00 15:30 Supporting Climate Hydrometeorological andCIima%e Environmental
Forecasting and and Error Analyses for POSlERson
Services - 2 Extmnes - 2 Dynamics MlWUlgement - 2
Supporting Science-Cold Regions
display 2
15:30 16:00 HEALTH BREAK - 15:00-15:30 - TCUP Graod SoIon .. d Rqal Room
15:45 17:30 Poster Session: TCUP Regal Room
-38-

DAY-3 Wednesday, 29 May 2013
11ME
Start E.d 'iJi!IPIIIIIZllD Uill.11 Paj16\ U' ill4." ttnfD 'i1ifM11@(i1 u'IIi4."rmm TCUP Gallery A 'i1.i!11A'iljtIi)Ijl S:15 8:30 Preliminaries
S:30 9:15 Plenary-5:
G Ro ers
9:15 10:00 Plenary-6: Don White
10:00 10:30 HEALTH BREAK - 10:00-Ul-.JO - TCUP Gruel SoIoa
Climate Analysis, Climate Change CANCJD.4 - Irrigation Geophysical Snow, Ice, Pennafrost 10:30 12:00 Modelling &: General Hydrology - 6 Modelling & Water
& Drainage Applications in CO2 Processes - I Prediction - 1 Resources - 4 Storage
12:00 13:30 LUNCH - 12:00-13:30 - TCUP C ..... alaIHaD
Climate Analysis. Monitoring Polar Applications - Management of Snow. Ice, Po:nnalrost 13:30 15:00 Modelling&: Operations/Clla.Heoges - Growld and SurfiIce
Prediction - 2 1 1
Watet - 1 Processes- 2
15:00 15:30 HEALTH BREAK - 15:00-15:30 - TCUP Gra.d Solo. aDd HUIoD
Higb Resolution Monitoring Polar Applications - Seismic Hazard Maps Management of Snow, Ice, Pennafrost 15:30 17:00 Modelling Operations/Challe°Ses -
2 for Building Code Use Ground and Surface Processes - 3 2 Water-2
Banquets Pre-Banquet CMOS: TCUP Cent A
19:00 22:00 CGU: TCUP Cent B Cocktails: Grand CWRAAGM
CWRA: Hikon SalonlExhibit Area 17:00-18:00
Commonwcalth 17:30-18:30
11ME Wednesday, 29 May 2013
~lllIril .-a-''';iI UIWIF G:DItD + 'I';IP Start E.d ,W'sVllIIDLG • . • : I' I'
10:00 10:30 HEALTH BREAK - 10:00-10:30 - TCUP Grand Salon
Was:ershed Biogeochemical Nor1hem Ecosystem Operational Posters remain
10:30 12:00 Response to Response to Stable lsoIope Trac= Assessment - I Climate/Land-use Strossors - I
Oceanography W18ltended
12:00 13:30 LUNCH - 12:00-13:30 - TCUP C.D .. aalaI HaD
Northern Ecosystem An OpeD FORm on
13:30 15:00 Lithospheric Structure Watershed
Response to Combatting Aquatic the Intergovernmental Posters remain
of North America Assessment - 2 Stressors - 2 Invasive Species Oceanographic Wl8ttended Commission IOC
15:00 15:30 HEALTH BREAK - 15:00-15:30 - TCUP GraDd Saloa •• d IOIIOB
Watershed Northern Geophysical rugb Posters remain 15:30 17:00 Assessment - 3
Ecosystem Response Pressure Research with Wl8tteoded to Strossors - 3 S hrotron Radiation
-39-

DAY-4 Thursday, 30 May 2013
TIME
Sta .. EDd "iiiJliIi ift1tim 'il!1Di4:iim.h' 'ii.iW4.ii tmII it 'il!1Di4:i1 r'M TCUP Salon D TCUP Gallery A
8:15 8:30 Preliminaries
8:30 9:15 Plenary-7:
PaulM ers
9:15 10:00 Plenary-8:
John Pomero
10:00 10:30 HEALTH BREAK - 10:00-10:30 - TCUP G ... Dd SaloD
Low-Frequency Renewable Energy Water Cycle in Heavy Precipitation Snow, Ice, 10:30 12:00 Variability & Polar Applications - 3 Integrated Modelling Pennafrost
Predictability Extraction & Impacts - I Framework - 1 over Mountains - 1 Processes - 4
12:00 13:30 LUNCH - 12:00-13:30 - TCUP CeDteDDiaI HaD
Renewable Energy Water Cycle in Heavy Precipitation Snow, Ice, 13:30 15:00 Extraction & Impacts - 2 Polar Applications - 4 Integrated Modelling over Mountains - 2 Pennafrost
Framework. - 2 Processes - 5
15:00 15:30 HEALTH BREAK - 15:00-15:30 - TCUP G ... nd Sol ••
TIME Thursday, 30 May 2013
Sta .. EDd TCUP Gallery C ~lillr'ngiJI ~., ,.~ dlIn!Iii CI'IIIL~,"n~!1Ub
IIIIIrim "hillIDu\ ". '"
10:00 10:30 HEALTH BREAK - 10:00-10:30 - TCUP GI'8.d Sol ••
Atmospheric Future Earth: Atmospheric Forecast Posters remain 10:30 12:00 Composition & Research for Global lEACHER'S DAY Improvement - 1 unattended
Processes Sustainabir 12:00 13:30 LUNCH - 12:00-13:30 - TCUP CODte.Dia1 HoD
Emerging Technologies Future Earth: Aunospheric Forecast 13:30 15:00 and Concepts in Rock Research for Global lEACHER'S DAY Improvement - 2
Poster Removals Ph ics Sustainabir
15:00 15:30 HEALTH BREAK - 15:00-15:30 - TCUP G .... d Sol ••
-40-

in C z
, ~ • ,

Session Schedules
Visit https:llwww1.cmos.ca/abstracts/congress schedule.asp to create your personalized agenda
and to access the most current schedule.
A limited number of printed copies of the detailed daily agenda will be available at the
registration desk upon request. To facilitate a greener conference and ensure accuracy, the 30
page detailed schedule was not included in the program book. We apologize for the
inconvenience and encourage you to use your mobile devices, if available, rather than printing
the agenda. The schedule for each session will be posted near the entrance at each of the
session rooms.
~ Water means the WORLD to US.
The Global Institute for Water Security IGIWS) coordinates leading expertise and capacity in water research at the University of Saskatchewan and its partner institutions. Our interdisciplinary science, engineering and social science teams work with industrial and government partners to understand how climate change, land management practices and development of natural resources are affecting our water environment. We work to develop improved knowledge and modelling tools needed to sustainably manage uncertain water futures - in Canada and internationally.
iii UNIVERSITY OF V SASKATCHEWAN
Gloh.11 Trt!-u tulc for Water Sea.llrlty
- 42-
www.usask.calwater


Canadian Geophysical Union Union Geophysique Canadienne
www.cgu-ugc.ca
Canadian Society of Soil Science Societe Canadienne de la Science du Sol
www.csss.ca
ANNUAL MEETING I RENCONTRE ANNUELLE
under the theme
ADVANCES IN GEOPHYSICAL & SOIL SCIENCES May 4-8 Mai, 2014
Banff Park Lodge, Banff, Alberta
CGU/UGC SESSIONS ... ... CSSS/SCSS SESSIONS Geodesy & Geodynamics Pedology Hydrology & Cryosllhere Organic Amendments Seismo-Tectonics & Imaging Meta-Analysis & Scaling-Up Biogeosciences & Apillications Climate Change & Soil Function Environmental Considerations Land Reclamation & Remediation General Geophysics & more... General Soil Science & more ...
jointly with the
2014 Mantle Convection and Lithosphere Dynamics Workshop sponsored by the Computational Infrastructure for Geodynamics
www.geodynamics.org
New/Joint Sessions: contact Rod Blais at [email protected]
Field Trip to the Columbia Icefields on 4 May/Mai 2014
ABSTRACTS / RESUMES: 14 February/Fevrier 2014
www.ucalgary.ca/-cguconf

Water: What Js the Future We Want? ..... Our Environmental, Socioeconomic and Political 'Agendas
Eau : A quel avenir aspirons-nou Nos programmes environnementaux, socioeconomiques et p
Hamilton, ON June 2-4/juin 2-4, 2014
Photo Credit:
- 45 -


Congress Abstracts pdf Documents
Please use the Find Command to search this document by author or any word in the text. In the index located at the end of some documents, the name of each author is followed by the ID number of all the corresponding abstracts and their presentation sequence number.
Résumés du congrès documents pdf
Veuillez utiliser la commande Find/Trouver pour chercher un auteur ou tout autre séquence de mots dans ce document. Dans l’index situé à la fin de quelques documents, le nom des auteurs est suivi des numéros d’identification et de présentation de tous les résumés correspondants.

2013-05-27
Plenary Day 1 / Plénière Jour 1
Room / Endroit (TCUP Theatre), Chair / Président (Bob Halliday / Norm McFarlane ), Date (27/05/2013), Time / Heure (08:30 - 10:00)
P1.1 ID:6910 INVITED/INVITÉ 08:30
Water Security in western Canada: science and management challenges
Howard Wheater Global Institute for Water Security Contact: [email protected]
The talk will outline the multiple dimensions of water security and define a set of thematic challenges for science, policy and governance, drawing on a case study of the Saskatchewan River Basin (SRB) in western Canada. A science agenda will be defined, based on the development of the SRB as a large scale observatory, to develop the underpinning science needed to improve our understanding of water futures under societal and environmental change. It will be argued that new integration is needed of the natural sciences, engineering and social sciences, that non-stationarity poses issues of decision-making under deep uncertainty, and that new approaches to decision support are needed. It will be proposed that vulnerability analysis can be combined with scenario-based modelling to address issues of water security, and that knowledge translation is an important element in framing water futures.
P1.2 ID:6914 INVITED/INVITÉ 09:15
Understanding uncertainty in climate models: Robustness of the atmospheric circulation response to climate change
Ted Shepherd Department of Meteorology, University of Reading Contact: [email protected]
Although climate change is often characterised as “global warming”, the impact of climate change will vary greatly from region to region. Regional aspects of climate change are controlled by atmospheric circulation patterns, which moreover exhibit considerable chaotic variability. Model predictions of the atmospheric circulation response to climate change are in many cases highly uncertain, presumably because of systematic errors in the climate models (e.g. the location of the jet stream). The fact that these errors have stubbornly persisted despite increases in spatial resolution suggests that they are somehow linked to unresolved processes, whose effects need to be parameterised in the models. Thus, improving climate models requires a better understanding of multi-scale interactions. There are good reasons to believe that model bias, the

divergence of model projections, and chaotic variability are somehow related. This talk will present some examples of these kinds of uncertainties and some potential ways forward.
Symposium on the Mathematics of Planet Earth PART 1 / Colloque sur les mathématiques de la planète Terre PARTIE 1
Room / Endroit (TCUP Salon A), Chair / Président (Boulaem Khouider ), Date (27/05/2013), Time / Heure (10:30 - 12:00)
1B1.1 ID:6560 INVITED/INVITÉ 10:30Stochastic Modelling of the Climate System: Past successes and future applications.
Richard Kleeman Courant Institute Contact: [email protected]
Stochastic modelling of the climate dynamical system is justified mathematically by the fact that the system has a natural fast times scale from the atmosphere and a natural much slower timescale from the ocean. Simple models of various climatic phenomena have been rather successful in accounting for a range of phenomena such as predictability limits, spectra and non-Gaussian effects. We provide a critical review and also show how this perspective can lead to explanations for apparently disconnected climatic phenomena. In particular we shall propose a new stochastic mechanism for the Pacific Decadal Oscillation.
1B1.2 ID:6320 11:00Bayesian Inference for the Stochastic Multicloud Model. Michele De La Chevrotiere 1, Boualem Khouider 1, Andrew Majda 2 1 Mathematics and Statistics, University of Victoria 2 Mathematics, Courant Institute of Mathematical Sciences, New York University Contact: [email protected]
The state-of-the-art cumulus parametrizations used in global climate models (GCM) are based on the quasi-equilibrium theory, which amounts to assuming a large separation of scales between convective processes and the grid-scale eddies. However, deep convection in the tropics is organized into a hierarchy of scales ranging from the convective cell of roughly one to ten kilometres to mesoscale cloud clusters of hundreds of kilometres to synoptic and planetary
scale wave disturbances comprising the Madden-Julian oscillation (MJO) and a spectrum of convectively coupled waves (CCWs). In fact, the failure of GCMs to capture well the tropical variability associated with the MJO and CCWs is often associated with the poor performance of the underlying cumulus parameterizations. Recently, Khouider et al. (2010, Comm. Math. Sci., 8, 187-216) developed a Stochastic Multicloud (SMC) model to represent the missing variability in global climate models due to unresolved features of organized tropical convection. In the SMC model, convective elements are viewed as Markov processes with state transition probabilities that are conditioned on the large scale environmental variables, like the convective available potential energy (CAPE) and middle troposphere moisture content, and a set of cloud timescale control parameters. The model has successfully been tested, for a range of values of the control parameters, in the simple setting of one-column and slab equatorial circulation models (Khouider et al., 2010, Comm. Math. Sci., 8, 187-216). We propose an information theoretic approach to the SMC model based on a Bayesian approach to infer those timescale control parameters from simulated and in situ data. Prior information is combined with data likelihood to construct the parameters' posterior distribution, which are approximated using a Monte Carlo Markov Chain (MCMC) simulation technique. To minimize the associated computational overhead, we developed fully parallelized linear solvers such as a scalable Krylov based method. In this talk, we present validation results of our posterior simulator, and some preliminary inferential tests using the Giga LES dataset, a Large-Eddy Simulation of maritime deep tropical convection. This is a work in progress, part of M. De La Chevrotiere's PhD thesis.
1B1.3 ID:6693 11:15Parametric estimation of stochastic wind speed models via the infinitesimal generator William Thompson 1, Adam Monahan 2, Daan Crommelin 3 1 University of British Columbia 2 University of Victoria 3 CWI Amsterdam Contact: [email protected]
Parameter estimation for dynamical models from data is a common problem in many areas of science. The problem is further complicated if the data is assumed to follow stochastic dynamics as distinguishing between the accepted stochasticity and various errors is difficult. In this poster, We present a method that can used to fit stochastic differential equation models to time series data by minimizing the norm of an eigenvalue problem related to the infinitesimal generator for an assumed dynamical model. We first estimate the dynamics of simulated data from simple linear models to help determine ways to make the estimation scheme more robust and reduce biases. Finally, we apply this method to 45 years worth of wind speed data to generate global parameter fields and compare statistics of the original and simulated data to illustrate the success of this method.

1B1.4 ID:6432 11:30
Using Hidden Markov Models to Separate Distinct Regimes of Nocturnal Boundary Layer Variability Adam Monahan , Timothy Rees School of Earth and Ocean Sciences, University of Victoria Contact: [email protected]
It is observed that extremes of near-surface wind speeds are larger at night (relative to the mean wind speed) than during the day. Previous research has suggested that the long tail of the nocturnal wind speed probability distribution is associated with the presence of two distinct regimes in the nocturnal boundary layer (NBL): one in which the stratification and shear are strong and the other in which they are weak. Using data from tall towers at Cabauw, Netherlands and Los Alamos, USA, we will demonstrate how these regimes can be separated using Hidden Markov Model (HMM) analysis. In an HMM, the observed variability is assumed to be influenced by an unobserved variable undergoing transitions between discrete regimes and described by a Markov chain. An HMM analysis estimates both the character of variability within each regime and the trajectory of the "hidden sates". For the data under consideration, the classification of observed states by regime by the HMM analysis allows computations of marginal distributions of wind and temperature, thereby providing a clear picture of the regime dynamics and the physical controls on extreme winds in the NBL.
1B1.5 ID:6802 11:45
Extreme learning machines applied to nonlinear regression problems in the environmental sciences Aranildo Lima 1, Alex Cannon 2, William Hsieh 1 1 University of British Columbia 2 Pacific Climate Impacts Consortium Contact: [email protected]
Environmental scientists have increasingly used nonlinear regression and classification methods developed originally in the field of machine learning/artificial intelligence, with artificial neural networks (NN) being the most commonly used. However, many of the environmental problems, e.g. downscaling general circulation model (GCM) output, involve large datasets, rendering the use of nonlinear machine learning methods such as NN computationally very expensive. For a much faster alternative approach to NN, the extreme learning machine (ELM) method has been developed recently. The ELM shares the same architecture as the feedforward one-hidden-layer NN, but instead of solving for the model weights using nonlinear optimization, ELM simply assigns random weights for the hidden neurons and solve for the remaining weights using linear
optimization with a standard least squares algorithm. In this work, we tested the ELM on about a dozen environmental science problems. There are three daily precipitation downscaling problems, for (1) Vancouver, BC with 3 predictors from NCEP/NCAR Reanalysis, (2) the station Stave, BC with 25 predictors (from GFS model output and climate indices), and (3) Newton Rigg, UK with 106 predictors from GCM output. The other datasets tested different predictands, including annual maximum daily precipitation, daily air temperature, sulphur dioxide concentration, wind speed, river sediment concentration, forest fire, ammonium concentration in coastal water, equatorial Pacific sea surface temperature, etc. We compared the ELM results with linear models such as multiple linear regression (MLR) and lasso, and nonlinear models such as feedforward NN, radial basis function NN, support vector regression with evolutionary strategy (SVR-ES), and random forest (RF). We concluded that ELM is indeed extremely fast (sometimes the speed difference can be orders of magnitude) and in terms of skill scores it is very competitive against the best nonlinear methods over the dozen environmental datasets tested.
General Hydrology PART 1 / Hydrologie en général PARTIE 1
Room / Endroit (TCUP Salon B), Chair / Président (Sean Carey), Date (27/05/2013), Time / Heure (10:30 - 12:00)
1B2.1 ID:6283 10:30
Spatial Heterogeneity in the Water Balances of Contrasting Land Covers in Canada’s Boreal Plains Ecozone Alan Barr 1, Garth Van Der Kamp 2, Andy Black 3, Harry Mccaughey 4 1 Climate Research Division, Environment Canada; Global Institute for Water Security, U. of S. 2 Water Science and Technology Directorate, Environment Canada 3 Faculty of Land and Food Systems, U.B.C. 4 Department of Geography, Queen’s U. Contact: [email protected]
The Boreal Plains ecozone of Western Canada is hydrologically complex because of its subtle topographic relief and diverse heterogeneous vegetation. This study contrasts the hydrologic functioning of Boreal Plains upland, lowland and wetland ecosystems, based on more than ten years of water balance data

from a network of flux-tower research sites in central Saskatchewan. The sites were established as part of the Boreal Ecosystem Research and Monitoring Sites and the Fluxnet-Canada Research Network, and continued as part of the Canadian Carbon Program. The data, from contrasting land covers (wetland fen, lowland black spruce, upland aspen, upland mature jack pine, and upland juvenile jack pine), include: cumulative precipitation P, evapotranspiration E, and soil water storage S derived from root-zone soil water content and water table elevation. Stand-level outflow, computed as R = P – E – ∆S at the flux towers, is compared with streamflow from the associated White Gull Creek watershed. The 2000-2011 study period includes prolonged wet and dry periods, with tenfold variations in annual streamflow, from 30 mm y-1 during the Oct 2002 - Sept 2003 hydrologic year to 324 mm y-1 for 2010-11. Our analysis will explore differences in annual outflow from the contrasting land-cover types in relation to their differences in evapotranspiration, and in response to interannual variations in precipitation and storage. It will also explore the importance of lateral water exchanges between the forested uplands and wetlands.
1B2.2 ID:6710 10:45
Hydrology of small basins within the Athabasca Basin of northern Saskatchewan Jaime Hogan , Brent Topp Golder Associates Ltd. Contact: [email protected]
The Athabasca Plain makes up a large area of northern Saskatchewan and extends from the Alberta-Saskatchewan border to the west, to Lake Athabasca and the Fond du Lac River in the north, to Wollaston Lake in the east. This boreal landscape is defined by the underlying sandstone and the glaciofluvial and glacial lake plain deposits on its surface, including countless drumlins, eskers, lakes and wetlands. The hydrology of this region is as distinct as its landscape. The sub-humid climate, well-connected lakes and well-drained landscapes provide a stable streamflow regime year-round. Floods magnitudes and bankfull discharge characteristics are highly related to basin area. Annual flood peaks occur from both snowmelt and rainfall events and differences in instantaneous and daily peaks are small. Streamflow data collection by the Water Survey of Canada exists for many of the region’s larger rivers. However, stream morphology, hydrology and hydraulic data have also been collected in smaller basins over the past years and decades for a limited number of locations for mining operations. Historical observations for several small sub-basins located across the Athabasca Basin will be examined.
1B2.3 ID:6517 11:00
Peatland Type vs. Wildfire Severity: What Controls the Ecohydrological Resilience of Peatlands to Wildfire in the Western Boreal Plain? Max Lukenbach 1, Kevin Devito 2, Nicholas Kettridge 3, Richard Petrone 4, James

Waddington 1 1 McMaster University 2 University of Alberta 3 University of Birmingham 4 Wilfrid Laurier University Contact: [email protected]
Peatlands cover ~25% of the Western Boreal Plain and are frequently affected by wildfire. While studies have examined post-fire vegetation recovery in boreal peatlands, factors controlling water-availability after wildfire are poorly understood. This study assessed the effect of peatland type and wildfire severity on pore water pressure (Ψ) and moisture content (θ) in a bog, fen, and swamp at the Utikuma Lake Research Study Area. Although wildfire severity was high in the swamp, high soil moisture and water tables resulted in high Ψ values (>-30mb). In contrast, Ψ values in fen hummocks, fen hollows, bog hummocks and bog hollows were not in equilibrium with the water table 41%, 18%, 7% and 42% of the time, respectively and decreased below -100mb 7%, 8%, 6%, and 35% of the time in these same sites, respectively. Extreme Ψ values below -500mb were observed in fen and bog hollows even, though water tables were within 30cm of the surface During an extended dry period in August, surface θ in the bog and fen were 5.7±4.1%, 18.8±11.7%, 8.7±3.3%, and 10±7.5% in fen hummocks, fen hollows, bog hummocks, bog hollows, respectively. The observed reduction in water availability near the surface of the bog and fen is attributed to a loss of capillary transport in the unsaturated zone. Although locations with deeper water tables would be expected to undergo high moisture stress, Ψ values in bog hummocks suggest low stress even though water tables were typically 40-70cm below the surface. Therefore, we argue that the interaction between peat physical properties, which vary as a function of peatland type and microtopography, and wildfire severity act together to affect the ecohydrological resilience of peatlands to wildfire. These results also suggest that the trajectory and timing of vegetation recovery is likely more spatially variable and complex than originally perceived.
1B2.4 ID:6577 11:15
Hydrology and geochemistry of a hypersaline spring fen in the oil sands region of Alberta
Corey Wells , Jonathan Price University of Waterloo Contact: [email protected]
In the Athabasca oil sands region wetlands comprise up to 60% of the landscape and support a range of important environmental processes, which are threatened by accelerated resource development. As deep groundwater discharge features, the presence of saline fen peatlands may complicate nearby sub-surface oil sands extraction, as well as the secure storage of process water at depth. A better understanding of the connection between the surficial peatland and the
underlying strata is required. A hypersaline spring fen adjacent to a proposed SAGD deepwater disposal zone was instrumented to evaluate its hydrology and function as a discharge feature. A distinct spatial gradient in salinity was observed both in near-surface groundwater and samples extracted from deeper mineral till, with electrical conductivity increasing from an average of 18 mS cm-1 in the north half of the fen to over 45 mS cm-1 in the south. Hydrometric measurements indicate that discharge is stronger at the south fen where salinity is highest however the observed recharge/discharge pattern at the fen is weak and highly variable within and between years. Low rates of groundwater flux through underlying low conductivity till may be underestimated using piezometer bail tests due to the probable influence of locally conductive zones (i.e., fractures) not captured by the piezometer network, or because of the ephemeral nature of discharge. Discharge from a saline groundwater plume south of the fen at the erosional limit of the Cretaceous Grand Rapids formation is identified as the source of salinity. Composition of fen groundwater points to discharge that has come into contact Devonian evaporite and is not of deep basin brine origin. Developing an improved understanding of the hydrological function of these systems will aid in the management of an important ecological resource while supporting safe compliance with strict environmental policies related to oil sands extraction.
1B2.5 ID:6620 11:30
Characterizing Evapotranspiration in a Western Boreal Plain Saline Fen, Fort McMurray, Alberta Tahni Phillips 1, R. Petrone 1, S. Brown 1, J. Price 2 1 Wilfrid Laurier University 2 University of Waterloo Contact: [email protected]
The reclamation of post oil-mining sites is an important component to the Canadian oil sands mining process. Despite the dominance of fens in the Western Boreal Plain (WBP), these systems have been neglected in past reclamation projects. This has been attributed to a lack of knowledge and familiarity with the function of fens within the local ecosystem. Further complicating their reclamation is the excessive salts from marine sediment that underlain the mining area and enter the reclaimed landscapes creating high saline conditions (Trites & Bayley, 2009). By extensively studying natural fens in the Fort McMurray area more information can be obtained on these systems, which can be used as a baseline for reclamation design and monitoring to ensure the sustainability of constructed systems. Currently, there exists a research gap in saline fens, with little knowledge of their key ecohydrological processes. This study seeks to narrow this gap by compiling information on the microclimatic and ecohydrological function of a natural patterned saline fen. As the WBP exists within a sub-humid climate experiencing a water-deficit, evaporation has been considered very important to its water

budget (Brown et al., 2010). Thus, the main objective of this study is to investigate the dominant ecohydrological processes of the saline system over the growing season and to determine what hydrological and climatic variables the processes are most strongly responding to. Dominant vegetation communities and microtopography features were targeted and sampling took place over the growing season in 2012.
1B2.6 ID:6454 11:45
Hydraulic conductivity of near surface soils in Sphagnum dominated peatlands: Do microforms matter? Maria Strack , Jordanna Branham Geography, University of Calgary Contact: [email protected]
Peatlands cover approximately 12% of Canada’s land area and represent ecosystems in which local hydrology drives many ecosystem functions. Within a peatland small deviations in surface elevation result in microforms, areas on the scale of metres that differ in depth to water table, plant type and rate of biogeochemical cycling. Although the difference in surface elevation between higher hummocks and low-lying hollows is centimetres to metres, models of peatland development have suggested that differences in vegetation and organic matter decomposition between microforms could lead to differences in peat physical and hydrologic properties that could feedback to whole ecosystem hydrological and biogeochemical function; however, hydrological parameters for peatland microforms have not been quantified. This study determined bulk density, pore size distribution and saturated hydraulic conductivity (K) at hummocks and hollows of four Sphagnum dominated Canadian peatlands. Peatlands included a bog and poor fen in both Alberta and Quebec allowing for investigation of differences in peat hydrophysical properties between peatland types, climate regions and microforms. Hydraulic conductivity was determined in the laboratory on peat from the surface (3-8 cm) and the saturated zone (20 cm below the local water table position). Peatland type, climate region, microform and depth of peat were all significant descriptors of variation in K. As has been reported, deeper peat had lower K than surface peat. Hummocks generally had higher K than hollows although differences between microforms varied depending on the peatland type and climate region. Differences in K between samples were correlated to macroporosity. These results indicate that there are microtopographic differences in peat hydrophysical properties; however, the strong decline in K with depth indicates that differences in local water table resulting in a change in depth of water flow are likely a stronger control on local K than surface vegetation structure.
Water Resource Management in a Changing Climate - PART 1 / Gestion de l'eau et le changement du climat PARTIE 1
Room / Endroit (TCUP Salon C), Chair / Président (Virginia Wittrock ), Date (27/05/2013), Time / Heure (10:30 - 12:00)
1B3.1 ID:6601 10:30Water Resources Sustainability Under Changing Cimate and Land Use Conditions in Northern Okanagan Kibreab Assefa 1, Hollaender Hartmut 1, Adam Wie 2, Allan Woodbury 1 1 University of Manitoba 2 University of British Columbia Contact: [email protected]
Water resources sustainability under changing climate and land use conditions in Northern Okanagan Assefa, K.A.1, Holländer, H.M. 1, Wie, A.X. 2, Woodbury, A. 1 1 Department of Civil Engineering, University of Manitoba, Winnipeg, MB 2 University of British Columbia Okanagan, Kelowna, BC. Sustainable use of water resources requires a water management policy that takes all water sources of a watershed into consideration. The current water regulation policy in the Okanagan Basin, however, is designed for surface water without considering the groundwater storage. As a result, water resources are being over exploited with excessive pumping from deep aquifers as well as shallow wells. We aim in this study for a sustainable water resources management concept in a pilot watershed in North Okanagan, Deep Creek watershed, which accounts for current conditions, projected climate and land use change as well as increasing agricultural water demand. We used gridded surfaces of climate data projected from four Global Climate Models and three emission scenarios (Neilsen et.al., 2010), as well as the land use and water demand projections reported by Janmaat and Anputhas (2010) in a numerical model which integrates overland flow, channel flow, unsaturated flow, and groundwater flow. The model was calibrated using three-year stream flow data. We forced the model with historical climate data to simulate the various hydrological components in the past 30 years (1977-2006). Next, we used the data on climate change, land use change and projected water demand to simulate the future water budget in two twenty-years intervals (2010-2029 and 2030-2049).

The historical simulation result shows that the catchment yields 10.9 Mm³/year of total runoff, 37% of which is base flow. The fraction of this water resource which is available for supplementary irrigation can generally cover the actual irrigation demand of 2.0 Mm3/year. Future simulation results show a drastic increase of 35 to 100% in surface runoff and a relatively milder increase of 7 to 25% in base flow. However, this water resource cannot be fully used in the supplementary irrigation season for two major reasons. First, the current water resource policy does not allow additional water abstraction from surface water sources beyond the licensed amount. Secondly, about 82% of the surface water is received during the periods when there is no need for supplementary irrigation. Therefore, the additional demand which is projected to increase to 4.8 Mm³/year by Janmaatand Anputhas (2010) is expected to be covered by groundwater resource only. This suggests the need for a better water resource management and policy to efficiently use the actual available water resources in the Deep Creek watershed. In fact, the primary problem in the watershed is not water resource scarcity. It is rather the inappropriate water policy that separates the two water sources. Therefore, we believe that it should be possible to use the water resources of the basin sustainably given the current water policy is changed.
1B3.2 ID:6774 10:45
The Water Adaptation Project: climate change adaptation for water resource management in Yukon
Holly Goulding Water Resources Branch, Yukon Environment Contact: [email protected]
The Water Adaptation Project (WAP) was a two year project (2009-2011) undertaken by the Water Resources Branch of Environment Yukon, with funding from Aboriginal Affairs and Northern Development Canada. This project sought to address gaps in the knowledge, collection, amalgamation and dissemination of all sources of water information for the benefit of water users’ response to climate change in Yukon. The WAP was born out of needs identified in the Yukon Government Water Management Framework Initiative and integrated into the Yukon Government Climate Change Action Plan. The project involved extensive consultation with federal, territorial, municipal, and First Nation governments, industry and community groups, with direct involvement of water and natural resource managers. This engagement, including visioning sessions, interviews, focus groups and feedback from a technical advisory committee, was necessary for the project to successfully increase the availability of water resources data and information in Yukon, and contribute to the ability of water managers to adapt their water programs to a changing hydrologic regime. Major deliverables of the project included:

- yukonwater.ca, a website that provides information on Yukon water resources and water management, and includes an interactive online catalogue of water data collection sites in the territory; and - a vulnerability assessment of Yukon water resources to climate change, documenting water use activities, climate change impacts on Yukon hydrologic regimes and water quality, and water data collection programs, as well as identifying gaps in knowledge and emerging pressures. Not without challenges, the WAP was able to successfully bridge the gap between science, policy and resource management in Yukon as a result of the meaningful participation of many champions from these sectors. The results of the vulnerability assessment and the yukonwater.ca website will be presented, in addition to a reflection on the approach, challenges, and successes of the project.
1B3.3 ID:6608 11:00
Changes in water availability for the Saskatchewan River Delta Jay Sagin 1, Kwok Chun 1, Elmira Hassanzadeh 2, Karl-Erich Lindenschmidt 3, Tim Jardine 4, Howard Wheater 5 1 Postdoctoral Fellow, Global Institute for Water Security, University of Saskatchewan 2 PhD student, Department of Civil and Geological Engineering, University of Saskatchewan 3 Associate Professor, Global Institute for Water Security, University of Saskatchewan 4 Assistant Professor, Toxicology Centre, University of Saskatchewan 5 Professor, Global Institute for Water Security, University of Saskatchewan Contact: [email protected]
The Saskatchewan River Delta (SRD), located at the Saskatchewan/Manitoba border, is a flat area of low elevation with a complex series of water environments consisting of river channels, lakes and wetlands that have important ecological and cultural value. This region is affected by an accumulation of effects of water diversion and extraction occurring upstream in the Saskatchewan River Basin (SRB). Annual discharge has been reduced since the beginning of last century, and storage of water by Gardiner (Lake Diefenbaker) and E.B. Campbell (Tobin Lake) dams have been attributed to the cause of the discharge reduction. This study seeks to determine the relative contribution of impoundments and variable climate regimes in driving this hydrological change. By including considerations of possible decadal climate variability, such as the Pacific Decadal Oscillations (PDO), the North Atlantic Oscillation (NAO) and Arctic Oscillation (AO), a trend study is undertaken for the time series of discharges affecting the SRD. By using this approach, future changes associated with further water resource development, including the withdrawal of water for irrigation, municipal and drinking water, oil and gas extraction, and potash production, can be explored in association with modeled water flow and climate scenarios. These scenarios will be included in the Value-

based Water Resources Management Model (VWRMM) for the SRB. The VWRMM has been established in the System Dynamics (SD) environment, which helps to better understand the behavior and complexity of water resources system. Based on the results of the present stage of work, implications and preliminary prediction of future SRD conditions are also discussed.
1B3.4 ID:6402 11:15
Conjunctive Optimization of Demand and Supply in Integrated River Basin Management Models
Nesa Ilich Optimal Solutions Ltd. Contact: [email protected]
River basin management models differ substantially from simulation models, since they typically use some type of mathematical optimization to help address numerous options that decision makers face regarding basin-wide water allocation. New paradigms have emerged that provide substantial improvements to previous modeling. They include a combination of multiple time step optimization (MTO), which optimizes basin allocation at all nodes and for all relevant time steps, in conjunction with the new equal deficit sharing constraint, which de facto optimizes the amount of hedging applied to water demand in dry years, thus enabling firm supply at reduced rates as a function of the reduced hydrologic input and the priority of allocation. The new approach is flexible. When combined with stochastic hydrologic input, it can provide excellent basis for statistical inference of the model solutions, which is valuable for building short term operating rules.
CANCID 1- Agricultural Drought and Flooding / Sècheresses et inondations en milieu agricole
Room / Endroit (TCUP Salon D), Chair / Président (Abdel-Zaher Kamal Abdel-Razek ), Date (27/05/2013), Time / Heure (10:30 - 12:00)
1B4.1 ID:6535 INVITED/INVITÉ 10:30Agricultural Drought and Flooding
Laurie Tollefson Agriculture and Agri-Food Canada Contact: [email protected]

Drought and flooding are costly and dangerous natural disasters. Most regions of Canada have experienced drought but the Canadian Prairies and the interior of British Columbia are considered more susceptible.Drought can have a major impact on water sensitive sectors including agriculture, industry, recreation, etc. Water supplies become stressed with the result being depleted soil moisture, reduced stream flow, lake and reservoir levels and reduced groundwater supplies. Flooding is often caused by hydro meteorological conditions which occur in the form of excess snowmelt runoff,rain,icejams etc. Anthropogenic cause of flooding includes drainage pattern changes resulting from urbanization and flooding due to dam breakage. Climate change is occurring and will affect societies and ecosystems through the medium of water in terms of scarcity and excess moisture. The major challenge with water availability is variability of supply. Increased water scarcity is predicted particularly in Western Canada due to climate change and competitiveness from other sectors. Reduced supply has significant adverse economic impacts in the agricultural sector. More temperate regions will deal with the opposite challenge which is flooding and drainage resulting from increased precipitation and extreme weather events. Adaptation to these challenges in critical.
1B4.2 ID:6558 11:00
Irrigation Water Requirements under Future Drought Conditions in the South Saskatchewan River Irrigation District
Evan Kraemer University of Regina Contact: [email protected]
As an important agricultural region, the Prairies are vulnerable to changes and variations in climate. Most projected future climates from global climate models indicate the Prairies will experience increased variability resulting in longer and/or more severe drought events. Prolonged drought events will result in depletion of water resources, particularly in Southern Saskatchewan in which 98% of stream flow into Lake Diefenbaker originates in Alberta and Montana. Irrigation accounts for the greatest water abstraction in the province and the most intensively irrigated area is the South Saskatchewan River Irrigation District (SSRID) located north of Lake Diefenbaker. Expansion of irrigation is also planned for the near- and long-term in this region. In this analysis, irrigation water requirements (IWR) are calculated using the CropWat model and downscaled GCM outputs with the aim of comparing IWR under several climate and supply scenarios to provide an estimate of current and future irrigation water requirements. The GCMs are chosen based on their sensitivity to the Pacific Decadal Oscillation and will provide a range of estimates representing high to low relative changes in climate variables. Future drought scenarios are extracted from GCM outputs using the Standardized Precipitation- Evapotranspiration Index. Once future drought events are chosen, daily climate variables for drought events are input into the CropWat model to give an estimate of IWR for those conditions for a given crop type.

1B4.3 ID:6765 11:15
Determinants of summer weather patterns on the US-Canadian Prairies: -implications for Long-Lead forecasting of grain yields Ray Garnett , Madhav Khandekar Consultant Contact: [email protected]
Summary: In order to assess the drivers of weather extremes over the prairie region, a data matrix was created for exploring 170 potential monthly predictors of drought severity, summer precipitation and summer temperature. Applying composite, correlation and regression a comprehensive data analysis produced a suite of composites and regression models for providing climatic outlooks a few weeks to a few months in advance of the critical May-July growing period. This was done for the prairies as a whole and four agricultural ecological zones or sub regions. This research has identified several useful (and disparate) factors like MJO (Madden-Julian Oscillation) & PDO (Pacific Decadal Oscillation), both linked to large-scale circulation patterns in the equatorial and north Pacific Ocean. This study has also identified the role of solar variability on the Prairie climate, via use of the AP index (a measure of solar variability which can be extracted from an International solar data archive as monthly values). For operational utility, we have used accumulated values of some of the above-mentioned indices prior to grain-growing season on the Prairies. Such accumulated values of various indices provide usable empirical techniques to identify summer weather extremes (like dry or wet summers: ‘hot & dry’ OR ‘cold & wet’ summers), which further helps to develop estimates of grain yields for the season with a lead-time of three to four months.
1B4.4 ID:6738 11:30
A stochastic simulation framework for describing the inter-team dynamics of drought management in the Saskatoon Invitational Drought Tournament.Ali Nazemi , Graham Strickert Global Institute for Water Security, University of Saskatchewan Contact: [email protected]
Droughts have major impacts on human civilization. It is widely recognized that the human dimensions of drought have received little attention. To better understand the human dimensions of drought management practice, the Invitational Drought Tournament (IDT)-2012 in Saskatoon is analyzed. IDT is a developmental framework designed to observe the institutional decision making process including mitigation, preparation and response to the multi-year drought events with varying levels of severity. IDT provides a forum for multi- disciplinary stakeholders, i.e. teams, to discuss adaptation strategies and to evaluate and vote on effectiveness of the respective adaptation strategies put forward by the
tournament’s participants. By analyzing voting patterns obtained in different levels and/or stages of the tournament, four distinct voting patterns are identified. It is also shown that voting patterns can be different in individual and team levels; however, competition among participants is the inherent property of the IDT. Strong competition among participants, therefore, necessitates applying a robust regulatory system to guarantee the identification of the best management practice during the tournament. A sensitivity analysis is performed to identify the most reliable regulation among a pool of options. To do so, the IDT is formulated in a mutually independent modular framework. Using the empirical distributions of the extracted voting patterns in Saskatoon’s IDT, 100 realizations of the tournament are simulated using each regulatory option. The result shows that an independent and objective view on the proposed adaptation strategies is certainly required to identify the best management practice. Our result also highlights that the level of competition is higher in teams rather than individuals. More data, however, is needed to validate the extracted empirical probability distribution functions and check the sensitivity of the simulation.
Coastal Oceanography and Inland Waters PART 1/ Océanographie côtière et eaux intérieures PARTIE 1
Room / Endroit (TCUP Gall. Suite 1), Chair / Président (Jinyu Sheng ), Date (27/05/2013), Time / Heure (10:30 - 12:00)
1B5.1 ID:6828 10:30
Observing storm surges from space Guoqi Han 1, Zhimin Ma 2, Dake Chen 3, Brad De Young 2, Nancy Chen 1 1 Fisheries and Oceans Canada 2 Memorial University 3 Second Institute of Oceanography Contact: [email protected]
Coastal tide gauges can be used to monitor variations of a storm surge along the coast, but not in the cross-shelf direction. As a result, the cross-shelf structure of a storm surge has rarely been observed. In this study we focus on Hurricane Igor-induced storm surge off Newfoundland, Canada. Altimetric observations at about 2:30, September 22, 2010 UTC (hours after the passage of Hurricane Igor) reveal prominent cross-shelf variation of sea surface height during the storm passage, including a large nearshore slope and a mid-shelf depression. A significant coastal surge of 1 m derived from satellite altimetry is found to be consistent with tide-gauge measurements at nearby St. John’s station. The post-

storm sea level variations at St. John’s and Argentia are argued to be associated with free equatorward-propagating continental shelf waves (with phase speeds of 11-13 m/s), generated along the northeast Newfoundland coast hours after the storm moved away from St. John’s. The cross-shelf e-folding scale of the shelf wave was estimated to be ~100 km. We further show approximate agreement of altimetric and tide-gauge observations in the Gulf of Mexico during Hurricane Katrina (2005) and Isaac (2012). The study for the first time in the literature shows the robustness of satellite altimetry to observe storm surges, complementing tide-gauge observations for the analysis of storm surge characteristics and for the validation and improvement of storm surge models.
1B5.2 ID:6360 10:45
Estimating Sea-level Allowances for Atlantic Canada under Conditions of Sea-level Rise Li Zhai 1, Blair Greenan 1, John Hunter 2, Thomas James 3, Guoqi Han 4 1 Bedford Institute of Oceanography 2 Antarctic Climate & Ecosystems Cooperative Research Centre 3 Natural Resources Canada 4 Northwest Atlantic Fisheries Centre Contact: [email protected]
Fisheries and Oceans Canada (DFO) has a substantial investment in coastal infrastructure including harbours, communication towers, lighthouses, office and storage facilities, and laboratories. An adaptation project has been initiated to provide science advice on the issue of sea level rise to DFO management sectors. This advice is given in the form of vertical allowances, which are defined as the amount by which an asset needs to be raised in order to maintain the same likelihood of future flooding events as that site has experienced in the recent past (Hunter, 2012). The allowances are determined by the combination of the statistics of present tides and storm surges (storm tides) and the regional projections of sea level rise and associated uncertainty. Tide-gauge data for nine pilot sites from Canadian Atlantic coast are used to derive the scale parameter of present sea-level extremes using Gumbel distribution function. The allowances in the 21st century with respect to year 1990 were computed at 10-year intervals for the Intergovernmental Panel on Climate Change (IPCC) A1FI emission scenario. For Atlantic Canada, the allowances are regionally variable and, for the period 1990-2050, range between -13 and 38 cm, while, for period 1990-2100, they range between 7 and 108 cm. The negative allowances in the Gulf of St. Lawrence are caused by land uplift due to the glacial isostatic adjustment (GIA) effect. The GIA model projections agree with the rate of vertical land motion derived from GPS data.
1B5.3 ID:6868 11:00
Numerical examination of the effect of the physical environment on the movement of the American Eel in the Gulf of St. Lawrence

Kyoko Ohashi , Jinyu Sheng Department of Oceanography, Dalhousie University Contact: [email protected]
The Ocean Tracking Network (OTN) Canada is a research program whose aim is to further our understanding of changing ocean dynamics and their impact on ocean ecosystems, animal movement, and the dynamics of marine animal populations. As part of OTN Canada, we use a numerical particle-tracking scheme in combination with time-varying, three-dimensional fields of circulation and hydrography simulated by a numerical ocean circulation model to study the movement of particles in the Gulf of St. Lawrence. The interaction between the physical environment and factors such as release location of the particles and swimming behaviour is examined. The particular types of swimming behaviour studied include selective tidal stream transport, diel vertical migration, and preferences for higher salinity and various compass directions; these are behaviours that are thought to be employed by the American Eel, which is an important species in our study region.
1B5.4 ID:6399 11:15Tidal dynamics in Lake Melville, Labrador Zhaoshi Lu , Brad Deyoung , Entcho Demirov Department of Physics and Physical Oceanography, Memorial University Contact: [email protected]
Lake Melville is a large and complex sub-Arctic fjord on the Labrador coast. The circulation in the lake is driven by tidal, freshwater and surface atmospheric forcing and is strongly influenced by the complex bottom topography the sea-ice and the water exchange with the coastal Labrador Sea. This presentation is focused on the tidal dynamics of the lake. The shallow Narrows at the entrance to the lake restricts tidal energy, reduces the range by a factor of 3 for the tidal elevation. We present results from a model study of tidally driven transport and mixing in Lake Melville. The primary goal of this study is to provide necessary information for environmental assessment of anthropogenic impact on the lake. The numerical model is the Finite Volume Coastal Ocean Model (FVCOM). The computational grid is triangular unstructured with high resolution in the key areas of interest. The model is forced with wind, surface heat flux, tidal elevation along the open boundaries and freshwater discharges of four main rivers inside the lake. The amplitude and phase of simulated tidal harmonics M2 and K1 are compared with observed values of these characteristics. The energetic of the tidal flows in and outside the lake are compared. We will use the model to explore the impact of the sill on the tidal dynamics of the lake.
1B5.5 ID:6362 11:30
A nitrogen budget for the Strait of Georgia, a coastal sea Jill Sutton , Sophie Johannessen , Robie Macdonald
(Presented by Robie Macdonald ) Fisheries and Oceans Contact: [email protected]
Coastal seas face increasing pressures from human activities. Like all oceans, nearshore waters are threatened by the effects of global climate change. Coastal oceans are also threatened by nutrient loadings, which may lead to eutrophication, hypoxia in subsurface or basin waters, and a decline in pH where regeneration occurs. Nitrogen is frequently identified as the limiting nutrient in estuarine and coastal waters, suggesting that management of nitrogen released from human activities into the ocean (e.g., wastewater disposal, farming, burning of fuels) would be an effective way to solve problems related to eutrophication. However, before proposing what may be very expensive actions, it is crucial to understand the local nitrogen cycle to the point of being able to account for all sources and sinks. Here, we present a budget for dissolved and particulate nitrogen based on measurements of sources (e.g., rivers, outfalls, aquaculture), sinks (sediment deposition) and particulate fluxes within the Strait. We also distinguish between particulates produced within the marine system and terrigenous or anthropogenic input of particulates, assisted in part by measurements of δ15N. For the Strait of Georgia, natural inputs and cycling of nitrogen predominate, producing a system generally replete in nitrogen and, therefore, light limited. The relatively small anthropogenic nitrogen loading has little opportunity to produce measureable effects, except possibly at the local scale.
Gravity, Geoid and Height Systems / Gravité, géode et systèmes d'élévation
Room / Endroit (TCUP Gall. A), Chair / Président (Marc Veronneau ), Date (27/05/2013), Time / Heure (10:30 - 12:00)
1B6.1 ID:6471 10:30
Towards the Canadian Geodetic Vertical Datum of 2013 (CGVD2013) Marc Véronneau , Jianliang Huang Natural Resources Canada Contact: [email protected]
For more than a century, the levelling technique has been serving well Canada in realizing and maintaining its vertical datum through a network of some 90,000 benchmarks anchored to the ground and stable structures. Despite this large

number of benchmarks, the coverage remains fairly sparse in southern Canada and basically inexistent in northern Canada. A substantial number of these benchmarks have disappeared or can be considered unstable. Nevertheless levelling remains the most precise technique to determine height differences locally. However, it is inefficient and costly when surveying a country as large as Canada. Global Navigation Satellite Systems such as GPS offer an efficient and precise alternative for height determination at any location globally. These heights are referenced to an ellipsoid, which is a simple mathematical representation of the Earth that, unfortunately, does not provide meaningful elevations. A geoid model, the separation between the ellipsoid and the geoid, allows the transformation from these ellipsoidal heights to orthometric heights that are compatible with levelling-derived heights and referenced to the mean sea level. With the introduction of the Canadian Geodetic Vertical Datum of 2013 (CGVD2013) in November, Canada will now define its geodetic vertical datum by an equipotential surface (geoid) and realize it by a geoid model covering entirely North America (land, lakes and oceans). This modernization of the geodetic vertical datum will replace the levelling- and benchmark-construct CGVD28. The presentation will give a status of the Height Modernization project including definition of the new datum, technical development in progress, difference between old and new datums, and feedback on the promotion of CGVD2013 through webinars.
1B6.2 ID:6571 10:45
Spectral Characteristics of GOCE Level 1b Gradiometer Data E. Sinem Ince , Spiros D. Pagiatakis (Presented by Sinem Ince ) York University Contact: [email protected]
The latest studies on the gravity field determination focus on GOCE-based data and global gravity field models. It is known that GOCE data are capable of improving the knowledge of the Earth’s gravitational field in some specific spectral domain. However, there are different characteristics of GOCE components which are not completely known yet. In this study, two month length GOCE Level 1b gradiometer derived accelerations and gravity gradients in different directions are investigated in frequency domain in order to find out the spectral components of the data. Moreover, effects of the applied procedures (such as corrections, calibrations, assumptions, filtering and transformation between reference frames) followed in the development of datasets are analyzed. The outcome of the study is expected to help us understand the milestones involved in the development of final products of GOCE data from raw measurements and search for any improvement that can be done.
1B6.3 ID:6782 11:00Evaluation of Stokes-Helmert geoid model computation using a synthetic

gravity field Marcelo Santos 1, Vanicek Petr 1, Kingdon Robert 1, Kuln Michael 2, Elmann Artu 3, Featherstone Will 2, Martinec Zednek 4, Hirt Chris 2, Avalos-Naranjo David 1 1 University of New Brunswick 2 Curtin University of Technology 3 Tallin University of Technology 4 Dublin Institute for Advanced Studies Contact: [email protected]
We report on testing the UNB (University of New Brunswick) software suite for accurate regional geoid model determination by use of Stokes-Helmert’s method against an Australian synthetic field (ASF) as “ground truth”. This testing has taken several years and has led to discoveries of several significant errors (larger than 5mm in the resulting geoid models) both in the UNB software as well as the ASF. It was our hope that, after correcting the errors in UNB software, we would be able to come up with some definite numbers as far as the achievable accuracy for a geoid model computed by the UNB software. Unfortunately, it turned out that the ASF contained errors, some of as yet unknown origin, that will have to be removed before that ultimate goal can be reached. Regardless, the testing has taught us some valuable lessons, which we describe in this paper. As matters stand now, it seems that given errorless gravity data on 1’ by 1’ grid, a digital elevation model of a reasonable accuracy and no topographical density variations, the Stokes-Helmert approach as realised in the UNB software suite is capable of delivering an accuracy of the geoid model of no constant bias, standard deviation of about 25 mm and a maximum range of about 200 mm. We note that the UNB software suite does not use any corrective measures, such as biases and tilts or surface fitting, so the resulting errors reflect only the errors in modelling the geoid.
1B6.4 ID:6332 11:15
Comparison of gravimetric geoid models over the Great Lakes region Daniel Roman 1, Xiaopeng Li 2 1 NOAA's National Geodetic Survey 2 Earth Resource Technology, Inc. Contact: [email protected]
Aerogravity collected in the Great Lakes region as a part of the Gravity for the Redefinition of the American Vertical Datum (GARV-D) provide an excellent opportunity to analyze the consistency of geoid height models of the region. This becomes imperative when considering that Canada is moving to adopt their Canadian Gravimetric Geoid 2013 (CGG2013) product as the basis for defining their vertical datum later this year. The aerogravity were not incorporated into the earlier United States Gravimetric Geoid 2012 (USGG2012) model, so they offer real insight into all models. An experimental geoid developed was developed using the aerogravity data. This model is consistent with the long wavelength signal from GRACE and GOCE incorporated into CGG2013 to ensure a more
consistent direct comparison over the region. Additional comparisons are also made between the experimental model and USGG2012 and between CGG2013 and USGG2012. These comparisons take on added significance in view of the development of the International Great Lakes Datum of 2015 (IGLD 15) and the intended release of a gravimetric geoid height model for a vertical datum in the U.S. in 2022.
1B6.5 ID:6473 11:30
Adjustments of the Canadian levelling networks in CGVD2013 Marc Véronneau , Jianliang Huang (Presented by Marc Veronneau ) Natural Resources Canada Contact: [email protected]
Canada is moving to the Canadian Geodetic Vertical Datum of 2013 (CGVD2013), which will be realized by a geoid model, by November 2013. During the transition period a large number of stakeholders will continue using benchmarks across Canada, so each benchmark will be published with a new elevation integrated into CGVD2013. The old elevations in CGVD28 will continue to be published along with the new elevations. Prior to CGVD2013, scientific geoid models developed at Natural Resources Canada were constrained to geoid heights representing the separation between the ellipsoid and CGVD28, creating hybrid geoid models that fit to CGVD28. Now, the reverse procedure is applied, i.e., the adjustment of levelling network is constrained to a series of orthometric heights determined from accurate GPS ellipsoidal heights and a geoid model, adjusting the heights of the benchmarks to CGVD2013. In this study, we have conducted a number of experimental adjustments of the levelling networks (Continental, Vancouver Island, Prince Edward Island, Newfoundland, etc.) by making use of Canadian Gravimetric Geoid Model of 2010, which is shifted to represent the Canada-USA agreed reference surface. The adjustments include a minimum-constraint solution and a series of multi-constraint solutions at selected stations forming the Canadian Active Control System (CACS) and Canadian Base Network (CBN). The adjustments differ also by the procedure: 1) include all levelling observations in a single adjustment; or 2) include levelling observations by epochs in a step by step approach. The adjustments also include a crustal motion correction to the levelling legacy data from a GPS-derived vertical velocity model. The new adjustments must remove the distortion in CGVD28, but maintain the high precision of the levelling data regionally while confirming to CGG2010 nationally. Each solution is compared to the 2500 ‘GPS on Benchmarks’ stations in Canada to analyze how close each solution is to CGVD1013.

Climate Change and the carbon cycle PART 1 / Changement climatique et cycle du carbone PARTIE 1
Room / Endroit (TCUP Gall. C), Chair / Président (Kirsten Zickfeld ), Date (27/05/2013), Time / Heure (10:30 - 12:00)
1B8.1 ID:6602 INVITED/INVITÉ 10:30The runaway greenhouse revisited in the context of past, present and future climate change
Colin Goldblatt University of Victoria Contact: [email protected]
A stable climate on Earth requires that the atmosphere is in energy balance. For hot moist atmospheres, however, there is an upper limit on the thermal emission which is decoupled from the surface temperature. If net absorbed solar radiation exceeds this limit the planet will heat uncontrollably, the so-called "runaway greenhouse", which would sterilise the planet. I will present new calculations of the clear-sky radiation limits: the thermal radiation limit is lower than previously reported (282Wm-2 rather than 310Wm-2) and much more solar radiation would be absorbed (294Wm-2 rather than 222Wm-2). Thus, it appears that a runaway greenhouse may be theoretically possible under the present solar constant, and that triggering a runaway greenhouse is possible given sufficient greenhouse warming. However, numerical calculations indicate that around 30,000ppmv of CO2 would be required to do this and Cenozoic palaeoclimate comparisons suggest that a few thousand ppmv of CO2 is insufficient. At the present level of ignorance, it appears that an anthropogenically triggered runaway greenhouse is implausible unless clouds do something weird.
1B8.2 ID:6289 11:00Sensitivity simulations of the deglacial rise in CO2: The Last Glacial Maximum to the present according to the UVic Earth System Climate Model
Lawrence Mysak 1, Christopher Simmons 1, Damon Matthews 2 1 McGill Univ. 2 Concordia Univ. Contact: [email protected]
The University of Victoria Earth System Climate Model of intermediate complexity (v. 2.9) is used to investigate carbon cycle dynamics from the Last Glacial Maximum (LGM) to the present. Incorporating an ocean GCM (with 1.8° x 3.6° resolution and 19 levels), a simple 1D atmosphere, a representation of land

surface processes and vegetation (TRIFFID), and a comprehensive carbon cycle, this particular model is able to perform transient simulations over the entire glacial termination and interglacial period within an efficient time frame. From a spin-up generated for LGM conditions, two types of transient experiments were conducted: (1) prescribed carbon (PC) simulations, where the carbon reservoirs in simulations beginning from the LGM are forced to adjust to the observed atmospheric CO2 trends in the Vostok and the Taylor Dome/Law Dome ice cores, and (2) free carbon (FC) simulations, where carbon reservoirs, including atmospheric CO2, evolve with no outside influence beyond prescribed orbital forcing and glacial ice retreat. Within these two formats, a variety of sensitivity studies tested a 700 PgC deglacial release of carbon (approximating permafrost release), CO2 and CH4 radiative forcing, and different weathering rates. A comparison of the prescribed and free carbon simulations provides useful details about the important processes involved in the deglacial increase in CO2 and why the model's FC simulations failed to reproduce the ~90 ppm post-glacial CO2 rise. In particular, the model's PC simulations accurately revitalized the deep North Atlantic circulation following the timing established in proxy records [Galbraith et al., 2007] and produced a much better-circulated ocean than the FC simulations (which only provide a modest increase of 20 ppm CO2 over the entire period and a largely unrecovered North Atlantic meridional circulation). It was further determined that the warming effect of radiative forcing from greenhouse gases (and not ice-albedo warming) is predominantly responsible for the recovery of North Atlantic deepwater formation and greater ocean circulation, which in turn leads to less deep-ocean carbon storage and a carbon source for the atmosphere and terrestrial reservoirs. Furthermore, much greater sediment storage in the FC simulations (versus the PC simulations) implies another 200 PgC potential source for the atmosphere. Sensitivity simulations also reveal that weathering rates have a non-negligible effect on atmospheric CO2 on these time scales, contributing to the order of 10 ppm the resulting CO2 in the FC simulations. The varying the extent of Antarctic ice shelves also yields a 5-10 ppm effect on CO2 during the Holocene in most experiments.
1B8.3 ID:6880 11:15Global greenhouse influence: an alternative approach to greenhouse gas comparisons Trevor Smith , Damon Matthews Concordia University Contact: [email protected]
Greenhouse gas metrics have attempted to solve the problems that arise when comparing species that express their heating capacity and atmospheric residence periods along different timescales. Global Warming Potential [GWP] has been relied upon heavily in international spheres for determining the relative radiative forcing [RF] capacities of different greenhouse gas emissions. This metric has been criticized for its arbitrary 100-year time horizon, its use of a sociopolitically irrelevant output unit (RF) and its inability to realistically handle

the importance of short-lived warming species. In this research, we propose an alternative gas metric for quantifying the warming capacity of both short- and long-lived greenhouse gases in addition to carbon dioxide [CO2.]. The Greenhouse Gas Index [GGI] is calculated as a function of model simulated global surface air temperature response output based on historical emissions estimations and RF values for non-CO2 gases. A coupled carbon-climate model of intermediate complexity is used in determining historical temperature change from preindustrial time period to year 2005 for CO2, nitrous oxide [N2O], methane [CH4] and sulphate aerosol [SO2]. In order to account for time horizon, curves of anticipated RF decline following trace gas emissions cessations are prescribed to the model and the resulting changes in recent surface air temperature are used to weigh the influence of historical emissions. Transient climate response to CO2 is found to be comparable to other contemporary studies, within confidence of recent estimations. The resulting values found for additional, non-CO2 emissions present an alternative approach to gas metric calculation that are not reliant on 100-year time horizons while allowing for better representation of near- to long-term impacts of greenhouse gas emissions. By developing this gas metric using observed data and a comprehensive carbon-climate model to determine temperature anomaly, this metric also presents a more relevant indicator for climate change mitigation policy purposes.
1B8.4 ID:6733 11:30
National contributions to observed global warming Damon Matthews , Tanya Graham , Serge Keverian , Trevor Smith , Donny Seto , Jonathan Moorman Concordia University Contact: [email protected]
There is considerable interest in identifying country-level contributions to global warming as a way of allocating historical responsibility for observed climate change. This task is made difficult by uncertainty associated with national estimates of historical emissions of CO2 from land-use change, non- CO2 greenhouse gases, and aerosols, as well as by uncertainty in the climate response to emissions of gases with widely varying atmospheric lifetimes. Here, we present a new estimate of national contributions to historical climate warming, accounting for CO2 emissions from fossil fuels and land-use change, as well as non-CO2 greenhouse gas and aerosol emissions. In this paper, we have improved on previous estimates in several ways: (1) we have used an improved method to allocate regional estimates of land-use change CO2 emissions to individual countries, based on historical changes in forest area; (2) to quantify the contribution of national CO2 emissions to observed warming, we have made use of recent estimates of the climate response to cumulative emissions to estimate the temperature change associated with each individual country's cumulative

CO2 emissions; (3) to quantify the climate response to non-CO2 greenhouse gas and aerosol emissions, we have allocated warming to each country based on a calculation of cumulative emissions weighted by the lifetime of the temperature response to historical emissions of each type of gas, such that more recent emissions are given more weight than older emissions. We show that including the warming from non-CO2 gases as well as the cooling effect of aerosol emissions is important to generate a full representation of national contributions to historical climate warming.
1B8.5 ID:6591 11:45
Reversibility of CO2-induced climate change Kirsten Zickfeld 1, Michael Eby 2, Andrew Weaver 2 1 Simon Fraser University 2 University of Victoria Contact: [email protected]
We present the results of simulations with a range of Earth System Models of Intermediate Complexity designed to explore the extent to which CO 2-induced climate change is reversible on human timescales. All simulations follow the Representative Concentration Pathways (RCPs) and their extensions to year 2300, after which radiative forcing is kept constant at RCP levels for another 700 years. At year 3000, atmospheric CO2 is left to evolve freely or is artificially restored to pre-industrial levels over 100 to 1000 years. In simulations with freely evolving CO2 (i.e. zero CO 2 emissions), global mean surface air temperature remains approximately constant and sea level continues to rise due to thermal expansion for several centuries. In simulations with “ramp-down” of CO2 over 100 and 1000 years, global mean temperature eventually starts to cool and sea level to fall. However, due to ocean thermal inertia, surface air temperature and sea level exhibit a substantial lag relative to atmospheric CO2 and are still substantially higher than pre-industrial several centuries after atmospheric CO2 is restored to pre- industrial levels. The ramp-down of CO2 from RCP to pre-industrial levels over 100-1000 years requires large negative emissions (i.e. net removal of CO2 from the atmosphere), which are likely unrealistic with technologies currently available to capture CO2 from the atmosphere.
Groundwater's role in the hydrological cycle PART 1 / Rôle de l'eau souterraine dans le cycle hydrologique PARTIE 1

Room / Endroit (TCUP Gall. D), Chair / Président (Andrew Ireson ), Date (27/05/2013), Time / Heure (10:30 - 12:00)
1B9.1 ID:6451 INVITED/INVITÉ 10:30Generalizing groundwater-surface water interactions in riparian interfaces on heterogeneous landscapes – Canada’ s Boreal Plain Kevin Devito 1, Nick Kettridge 2, Simon Landhäusser 3, Carl Mendoza 4, Rich Petrone 5, Joe Riddell 6, Uldis Silins 3, Brian Smerdon 7, Jessica Snedden 3, Mike Waddington 8 1 Department of Biological Sciences, University of Alberta, Edmonton, Alberta 2 School of Geography, Earth and Environmental Sciences University of Birmingham 3 Department of Renewable Resources, University of Alberta 4 Department of Earth and Atmospheric Sciences, University of Alberta 5 Cold Regions Research Centre, Wilfrid Laurier University, Waterloo, Ontario 6 Alberta Geological Survey, Edmonton, Alberta 7 CSIRO Land and Water, Glen Osmond, SA, Australia 8 School of Geography & Earth Sciences, McMaster University, Hamilton, Ontario Contact: [email protected]
The Boreal Plain (BP) eco-region of western Canada is experiencing unprecedented industrial development stressing the need to assess the role of riparian areas in mitigating land use impacts on water quantity and quality. We compare findings from local scale transect studies at the Utikuma Region Study Area (URSA) to characterize the variability in hydrological processes of riparian interfaces typical of the BP. The interaction of sub-humid climate and deep, heterogeneous surficial deposits result in low upland runoff, complex surface –groundwater interactions, and variability in the hydrologic function of riparian interfaces. The recurring role of riparian areas on hydrological linkages from uplands to aquatic systems was removal of soil water and groundwater by vegetation and translocation of water to adjacent hillslopes regardless of groundwater function. Water table depressions at the base of hillslopes were commonly observed. Aquatic-riparian flow reversals and losing conditions were common and perched stream, pond and wetland systems were observed in areas of contrasting soil texture. Riparian functions were highly variable in coarse textured landforms and influenced by both local and larger scale flow systems. Riparian interactions on fine textured lacustrine plain landscapes were largely restricted to near surface discharge and recharge flow through. In contrast, on poorly drained and mixed textured moraine landforms, riparian systems were often isolated or interacted with recharge or perched groundwater systems. Our findings not only point to the need to improve our understanding of how riparian functions vary with surficial glacial landforms and groundwater or surface water network location, but also highlight the importance of vegetation interactions in controlling the water budget. Integrating groundwater from a range of scales have large implications in the development of conceptual frameworks and directing modeling efforts in assessing the mitigating role of riparian areas on land use practices in heterogeneous glacial landscapes.
1B9.2 ID:6493 10:45Effects of climatic gradient on groundwater recharge in the Canadian prairies Masaki Hayashi , Christopher Farrow , Getachew Adem Mohammed University of Calgary Contact: [email protected]
The Canadian Prairies is characterized by the cold, semi-arid climate and the undulating landscape draped by thick deposit of clay-rich glacial till. Precipitation during plant growing season is almost completely consumed by evapotranspiration, leaving little, if any, for groundwater recharge. Consequently, snowmelt is considered the main source of groundwater recharge. Frozen soil has much reduced infiltration capacity during the melt period, causing snowmelt water to flow overland into topographic depressions, in addition to wind-driven snow drift from uplands to depressions. This causes depression-focussed infiltration of snowmelt water and subsequent groundwater recharge. Previous studies of depression-focussed recharge were conducted in central Saskatchewan, where the snowpack remains frozen throughout the winter and generates a distinct input of snowmelt runoff and infiltration in spring. In western parts of the Canadian Prairies, mid-winter warm weather events may deplete the snowpack and reduce the amount of snowmelt in spring, resulting in little groundwater recharge in some years. We will analyze detailed hydro-meteorological data collected at the West Nose Creek watershed near Calgary during 2003-2013 to demonstrate the effects of inter-annual variability of winter temperature and precipitation patterns on groundwater recharge, and discuss the effects of climatic gradient within the Canadian Prairies on the seasonality of groundwater recharge using numerical model simulation.
1B9.3 ID:6786 11:00Rethinking the hydrodynamics of the Western Canada Sedimentary Basin
Grant Ferguson Dept. of Civil and Geological Engineering,University of Saskatchewan Contact: [email protected]
Concepts of regional groundwater flow developed in the 1960s through research in the Canadian Prairies by pioneers such as Toth, Meyboom and Freeze have been applied throughout the world. These ideas have long provided a starting point for understanding the hydrodynamics of the Western Canada Sedimentary Basin (WCSB) but it is questionable whether these classic concepts adequately capture the current state of this basin. There have been approximately 700,000 wells installed into this WCSB and a significant fraction of these wells are suspected to leak. These leaks occur due to past practices that did not provide adequate environmental protection or due to failures of modern wells, which are known to occur even when best practices are followed. In addition to the potential pathways introduced by these wells, there is a significant amount of fluid
produced and injected into various reservoirs in the WCSB. For example, the reservoir formed by the Winnipeg and Deadwood Formations at the base of the WCSB receives nearly 1000 L/s of brine from waste disposal wells in Saskatchewan. This amount is equivalent to the recharge over several thousand square km in this region. The legacy of these wells is unclear but the assumption that the deeper units of the WCSB will allow for isolation of various contaminants over long time scales is questionable given the industrialization of this environment.
1B9.4 ID:6429 11:15
Mapping Saskatchewan’s Groundwater Resources Kei Lo , Nolan Shaheen , Cas Rogal Water Security Agency Contact: [email protected]
The Saskatchewan Research Council (SRC) initiated a groundwater mapping program in the 1960’s. The goal of the program was to delineate the spatial extent and distribution of potential groundwater resources in the agricultural sector of Saskatchewan based on NTS map sheets at the 1:250,000 scale. It established the foundation for hydrostratigraphic mapping and development of geological cross sections in Saskatchewan, leading to the first (1st) generation groundwater maps. The 2nd generation maps (1986-1999) provided refinement to the 1st generation map series by delineated potential groundwater resources within the Quaternary deposits. It also further defined the bedrock geology in the Province. The maps illustrated the spatial extent and distribution of bedrock and glacial aquifers and are considered hydrostratigraphic maps because it did not include information on the water quality, potential yield or vulnerability of the aquifers. The Saskatoon map sheet (73B) was not completed in the 2nd generation mapping. In 2004, the Saskatchewan Watershed Authority initiated the 3rd generation mapping for south-western Saskatchewan. The Cypress Hills (72F), Prelate (72K), Wood Mountain (72G), and Swift Current (72J) map sheets were completed as the initial stages of the mapping program. Maps were produced on the ESRI ArcGIS platform. The Water Security Agency recognized the need for better groundwater knowledge and access to reliable data. A new mapping program was initiated in 2010, engaging the private sector to develop the protocols, standards, and methodologies to be used across the province. The current mapping program represents a first concerted, widespread effort at mapping groundwater potential, quality, and vulnerability. The maps update the accuracy and detail of the groundwater resources to include data obtained since the 2nd generation mapping and integrates the surficial geology maps into the geologic framework.

1B9.5 ID:6374 11:30Climate change impact on salt dynamics in a prairie wetland Uri Nachshon 1, Andrew Ireson 1, Garth Van Der Kamp 2, Samuel Davies 3, Howard Wheater 1 1 Saskatchewan University 2 Environment Canada 3 Imperial college London Contact: [email protected]
The ‘prairies’ - the glaciated plains of the North American continent, are a complex hydrological system characterized by hummocky terrain, where the depressions are occupy by large number of wetlands, marked by seasonal or semi- permanent ponds. The prairie vadose zone and many of its water bodies contain high salt concentrations, mainly sulfate salts; and the salt distribution and accumulation in the landscape is highly associated with the hydrological processes. High variability in the climatic conditions over the recent years had great effect on the prairie wetlands spatial distribution, ponds volumes, and chemical composition. Understanding of the geochemical and hydrological processes, under changing environmental conditions is crucial in order to better understand and cope with the risk of future soil and water salinization. In this work we explore the salt dynamics under relatively dry and wet climatic conditions at a field site near St. Denis, Saskatchewan, using field data from the last 20 years. Measurements include meteorological data, soil salinity, groundwater levels and pond volume, salinity, and chemical composition. The summers of 2010 and 2012 were exceptionally rainy, resulting in unusually high pond water levels. The large pond volumes were accompanied by a marked increase of the salinity of the pond water, contrary to what might have been expected intuitively. The increase in pond salinity under the extreme wet conditions indicates on significant fluxes of brackish solutions from the ground water to the pond. Here we present the field measurements together with numerical modeling to quantify and better understand the subsurface salt dynamic processes and the potential risk of salinization for the prairie environment under changing climate.
1B9.6 ID:6877 11:45
Effect of hydrologic condition on solute flushing in a fine-grained macroporous soil Michael Callaghan 1, Josh Bishop 2, Edwin Cey 1, Laurence Bentley 1 1 University of Calgary 2 WorleyParsons Canada Contact: [email protected]
In fine-grained soil, the majority of drainage occurs through macropores. However, the majority of salt mass is stored in the soil matrix. The key to effective salt flushing is to move salt from the matrix into the macropores to efficiently transport the salt. Consequently, matrix-macropore mass exchange

plays a critical role in mixing in situ pore water with infiltrating water from surface. The objective of this research is to improve remediation of salt-affected soils by defining optimum hydrologic conditions for soil matrix flushing. The study site is located 40 km southwest of Edmonton, Alberta, Canada, at the location of a former oil and gas production facility, now removed. Past operations at the site have resulted in salt impacts to soil and shallow groundwater. A remedial tile drain system was installed to collect saline leachate from the rooting zone and route it for disposal. Macropores in the form of root holes and fractures were documented in shallow soils. A tracer experiment was conducted to investigate the role of matrix-macropore mass exchange on solute transport. A tracer, 2,6-difluorobenzoic acid, was applied with irrigation water to the surface of a 20 m by 20 m experimental plot. Tracer concentrations were monitored in the tile drain effluent, in soil water samplers, monitoring wells and soil core. Data collected over three field seasons show effective flushing occurred when irrigation water was applied to maintain slightly unsaturated conditions. Similar irrigation and rainfall amounts applied to wetter soils resulted in saturated conditions and negligible flushing. A numerical model was developed in the HYDRUS software package using a dual permeability formulation. Model results show that under saturated soil conditions, the chloride within the soil is not effectively flushed from the soil matrix into the macropores. Maintaining slightly unsaturated conditions improves mass exchange from the matrix into the macropores.
Prairie Lake and Reservoir Management PART 1 / Gestion des lacs et réservoirs des Prairies PARTIE 1
Room / Endroit (TCUP Blair Nelson), Chair / Président (Rebecca North ), Date (27/05/2013), Time / Heure (10:30 - 12:00)
1B10.1 ID:6736 10:30
Introduction to the Lake Diefenbaker Study Jeff Hudson 1, Jeff Sereda 2, David Vandergucht 1, Rebecca North 3, Howard Wheater 4, John-Mark Davies 2 1 University of Saskatchewan 2 Saskatchewan Water Security Agency 3 University of Saskatchewan and Global Institute of Water Security 4 Global Institute of Water Security Contact: [email protected]

Lake Diefenbaker was created on the South Saskatchewan River in 1967. The reservoir represents the largest supply of good quality water in southern Saskatchewan. The system is 225 km in length and can store >9 billion cubic metres. The reservoir was built for many uses (e.g., hydro-power, municipal water, and irrigation) and is a pivotal resource in the economic future of the region. The capability of this reservoir to continue to provide water of reasonable quality under rapid economic development and under a changing climate is unknown. A comprehensive evaluation of its sensitivity to current and future activities (e.g., that affect nutrients) is essential to manage and protect this resource. We have taken a multidisciplinary approach to gain an understanding of the reservoir. This approach includes the development of a nutrient budget, a nutrient status and sensitivity study, an algal assessment, an investigation algal dynamics via satellite imagery, a nutrient sourcing study, and a microbial pathogen study. Our research over the past two years (2011-2012) has significantly increased our understanding of this large prairie reservoir.
1B10.2 ID:6346 10:45
Physical and chemical characterization of Lake Diefenbaker during the 2011 and 2012 ice free seasons David Vandergucht , Jessica Johansson , Kristine Hunter , Hayden Yip , Kerry Head , Chance Prestie , Oghenemise Abirhire , Rebecca North , Jeff Sereda , Jeff Hudson University of Saskatchewan Contact: [email protected]
Lake Diefenbaker is a large reservoir on the South Saskatchewan River that receives approximately 98 % of its incoming flow from its extensive watershed in Alberta. The reservoir is 225 km long and has a maximum depth of 58 m. Physical and chemical parameters were measured in the main reservoir channel from June-October in 2011 and 2012. The reservoir was thermally stratified from June to mid-October. Thermocline depth was typically near 20 m in July and gradually deepened until fall turnover. The minimum hypolimnetic oxygen concentration measured was 3.2 mg L-1. Early summer inflows were particularly high in 2011 and were also above average in 2012. This period of elevated inflows was associated with a relatively high sediment load and likely explains trends in increasing euphotic depths (range 0.9-12.4 m) and decreasing total phosphorus concentrations (range 7.9-104 µg L-1) from upstream to downstream sites and over the course of the season. Total nitrogen concentrations (range 226 – 1075 µg L-1) generally declined over the course of the season but increased from upstream to downstream sites. Chlorophyll a concentrations (range 0.5–16.2 µg L-1) were highest in June and October and were lowest in August at most sites. Overall nutrient concentrations were higher in 2011 than 2012 and this difference appears to be driven largely by the higher inflows in 2011.
1B10.3 ID:6771 11:00Characterizing Phosphorus and Nitrogen Loadings under Years with Differing Hydrologic Regimes: A Case Study of a Complex Prairie ReservoirJessica Johansson 1, Kristine Hunter 1, David Vandergucht 1, Jeff Sereda 2, Rebecca North 1, Kerry Head 1, Hayden Yip 1, Jeff Hudson 1 1 University of Saskatchewan 2 Water Security Agency Contact: [email protected]
Lake Diefenbaker is a large, deep, riverine reservoir that experiences dramatic fluxes in tributary nutrient loadings. Prior to the start of this research in May 2011, little was known of the nutrient dynamics of the system and previous sampling efforts were inconsistent and disconnected. The purpose of this study is to examine the biogeochemical cycles of phosphorus (P) and nitrogen (N) in Lake Diefenbaker through the characterization and quantification of its' dominant nutrient pathways using a mass balance framework. External phosphorus (P) and nitrogen (N) loadings to Lake Diefenbaker are dominated by the South Saskatchewan River, which contributed upwards of 90% of the total tributary nutrient load from May 2011-Oct 2012. These loadings vary both seasonally, with the highest nutrient loadings occurring in June alongside peak flows; and from year-to-year, with higher nutrient loads delivered during wetter years. Tributary N loadings were considerably higher than P loadings across all months during the sampling period (ex. 2240 ton total N/month vs. 950 ton total P/month for June 2011) – however the composition of each nutrient differed greatly. P from tributary input predominantly arrived to Lake Diefenbaker in particulate form, whereas the dissolved fraction of N comprised a comparably larger component of N loadings. The temporal variation in P and N loadings and their species composition will greatly impact how P and N will cycle throughout the reservoir. This becomes evident when calculating nutrient retention (tributary input-output/input) in the reservoir, and considering the other dominant nutrient pathways in the system (atmospheric deposition, sedimentation, internal loading, and internal regeneration).
1B10.4 ID:6415 11:15
Nutrient inputs to Lake Diefenbaker reservoir through shoreline erosion and slumping Curtis Hewlett , Rebecca North , Jessica Johansson , David Vandergucht , Jeff Hudson University of Saskatchewan Contact: [email protected]
The objective of this study was to determine to what extent soils from shoreline erosion and slumping are contributing to the overall nutrient budget of Lake Diefenbaker (SK, CAN), a large reservoir along the South Saskatchewan River basin. Damming of the South Saskatchewan River resulted in the formation of

the reservoir in 1967 which is approximately 225 km long with 800 km of shoreline; agriculture is the dominant surrounding land use. In recent years, there have been concerns regarding symptoms of eutrophication, including reports of noxious algal blooms. Soil erosion and slumping are common along the reservoir with near vertical banks surrounding much of the system. We collected comprehensive soil samples from 32 banks around the lake taking into consideration the varying soil types, stratification of subsoils, and slopes. We measured the biologically available phosphorus and total carbon and nitrogen concentrations of the soils. These concentrations were then combined with estimated erosion rates and erodibility coefficients for the various soil types, and were used to calculate rates of nutrient input from the eroded soils. Preliminary results show a mean of 0.75 mg P kg-1 soil, which is substantially lower than similar studies. Understanding this previously unaccounted for source of nutrients will contribute to a more complete understanding of the nutrient budget for Lake Diefenbaker.
1B10.5 ID:6370 11:30
Dissolved organic carbon fingerprinting: A tool for sourcing and tracking nutrients Jeff Sereda 1, Leah Dirk 2, Kristine Hunter 2, Jess Johansson 2, David Vandergucht 2, Chance Prestie 2, Jeff Hudson 2 1 Water Security Agency 2 University of Saskatchewan Contact: [email protected]
Lake Diefenbaker is a large reservoir along the South Saskatchewan River experiencing symptoms of eutrophication. Managing nutrient inputs will be critical to the preservation of water quality in the lake. A large portion of nutrients entering the lake may be associated with dissolved organic carbon (DOC). DOC derived from different sources often has a unique composition which can be exploited to source and track it through the environment. Fluorometric and spectrophotometric characterization (fingerprinting) of DOC was investigated as a tool for sourcing and tracking the movement of DOC and associated nutrients [nitrogen (N) and phosphorus (P)] into Lake Diefenbaker, SK. Fluorometric and spectrophotometic indices included: fluorescence index (FI), freshness index (β:α), humification index (HIX), specific ultra-violet absorbance (SUVA), and the attenuation coefficient at 350 nm (a350). DOC and nutrient samples were collected monthly (June through October) from the four primary sites of DOC and nutrient input: South Saskatchewan River (SRR), Swift Current Creek (SCC), an aquaculture facility, and municipal sewage lagoons (MSL). FI values were not significantly different among sites; whereas, β:α, SUVA, HIX, and a350 for samples collected from the SSR and SCC had unique “fingerprints” (autochthonous in nature) that distinguished these samples from other sites. HIX values from the aquaculture facility were significantly greater (indicating the DOC was more humic) than for samples collected from the other three sites. HIX and β:α were significantly less and greater from the MSL than samples from other

sites, respectively. There was no relationship between DOC indices and nutrient concentrations. In summary, DOC fingerprinting may be useful for determining carbon sources to Lake Diefenbaker, but additional research is required to develop fingerprints for sourcing nutrients.
1B10.6 ID:6763 11:45
Spatial characterization of phosphorous and nitrogen limitation in Lake Diefenbaker: Influence of upstream processes and anthropogenic activitiesKristine Hunter 1, Jess Johansson 1, David Vandergucht 1, Rebecca North 1, Jeff Sereda 2, Jeff Hudson 1 1 University of Saskatchewan 2 Water Security Agency Contact: [email protected]
Management of a system requires an understanding of the factors that control primary producers. There is controversy in the literature over the relative importance of phosphorus (P) and nitrogen (N) as limiting nutrients to phytoplankton in freshwater systems. Lake Diefenbaker (SK, Canada) is a multi-purpose reservoir located on the South Saskatchewan River. Lake residents have noticed an increase in algal blooms and a decrease in water quality in recent years. To address these symptoms of eutrophication, we conducted a series of nutrient status assays to determine the type (P and/or N) and degree of nutrient deficiency in the reservoir. Sampling sites were located in both the main channel and in a set of embayments containing cattle operations, aquaculture, and urban influences. Temporal patterns were also assessed from monthly samples collected from June to October in 2011 and 2012. Both years received higher than normal flows; however, 2012 had less flooding than the previous year. N limitation was more prevalent in 2011, and P limitation was more dominant in 2012. Nutrient limitation differences between the two years were likely due to considerably higher flows in 2011, resulting in higher P inputs. Nutrient deficiencies in the embayments closely resembled the nutrient status in the corresponding main channel sites in both years. However, the embayment housing the aquaculture facility in the fall of 2012 showed indications of N deficiency, while the main channel sites showed signs of P limitation. The hydrological regime (flow) has important implications for the nutrient status of the reservoir and appears to influence both the type and severity of nutrient limitation.
Cloud, Aerosol and Radiation Processes / Processus des nuages, aérosols et radiation
Room / Endroit (Hilton Commonwealth - N), Chair / Président (Congress Scientific Committee ), Date (27/05/2013), Time / Heure (10:30 - 12:00)
1B11.1 ID:6768 10:30Sources of sulfate in Arctic aerosols and their relationship to cloud formation Ann-Lise Norman 1, Ofelia Rempillo 1, Michelle Seguin 1, Sangeeta Sharma 2, Desiree Toom-Sauntry 2, Leonard Barrie 3 1 The University of Calgary 2 Environment Canada 3 The Cyprus Institute Contact: [email protected]
Cloud formation and persistence plays a key role in assessing the impact climate change will have on the Arctic. As the Arctic warms and sea ice decreases, emissions of dimethyl sulfide (DMS) through open leads and from surface waters may result in a greater proportion of aerosols in the Arctic of biogenic origin. DMS oxidation, either on the surface of pre-existing aerosols or through binary nucleation of biogenic sulfate, can affect the number and chemical properties of cloud condensation nuclei (CCN) which in turn are important to droplet growth, cloud formation and albedo. Atmospheric DMS, SO2, MSA and aerosol sulfate from biogenic, terrestrial and anthropogenic sources in the Arctic, determined from isotope apportionment, suggest aerosol formation, growth and contribution to CCN, may be intimately linked to aerosol source. The results from a number of Arctic aerosol studies highlight the different roles that biogenic, anthropogenic and sea salt sulfate play in the formation of particles contributing to cloud formation.
1B11.2 ID:6651 10:45
Microphyical processes associated with the formation of Arctic mixed-phase clouds.
Jonathan Doyle , Julie Thériault Université du Québec à Montréal Contact: [email protected]
Weather forecast and climate simulations developed for mid- latitude application often struggle when simulating the high Arctic regions. In particular, mixed-phase clouds are usually misrepresented or not present. The occurrence of this type of

cloud is crucial for the prediction of precipitation which is an important factor of the arctic climate.Furthermore, mixed-phase clouds are observed approximately 10 % of the year contributing an estimated 40- 50 W m-2 to surface warming, which has significant impacts on sea ice and permafrost. Uncertainties associated with modelling mixed-phase clouds are likely due to the limited knowledge of the thermodynamic and physical mechanisms involved with coexisting ice and liquid water. The goal of this study is to improve understanding of the conditions in which Arctic mixed-phase clouds are formed and sustained for a long period. To investigate this question, a microphsyics scheme coupled with a one-dimensional model is being developed with an improved treatment of freezing microphysics, aerosols, and radiative processes. Currently the ice-microphysical processes are reconsidered to detail the coexistence of ice and liquid water. The available in situ and remote sensing data sets from the high Arctic research station in Eureka, Nunavut are used to develop the parameterization of the ice- phase processes and recalibrate the existing ones. This study will present some preliminary results demonstrating the ability to reproduce several selected cases observed at Eureka. Ultimately, the improved representation of mixed- phase clouds will allow the investigation of the coupled effects of aerosol and radiation, as well as the associated feedbacks within mixed-phase cloud formation.
1B11.3 ID:6869 11:00
Validation of aerosols properties’ algorithms for the future GCOM-C/SGLI satellite Jules R. Dim 1, Satoru Fukuda 1, Teruyuki Nakajima 2, Tamio Takamura 3 1 EORC/JAXA 2 AORI/University of Tokyo 3 CEReS/Chiba University Contact: [email protected]
A new Earth observation polar-orbit satellite, the Global Change Observation Mission-Climate (GCOM-C) carrying a multi-channel and high resolution optical sensor, the Second Generation GLobal Imager (SGLI), will be launched very soon. The objective of this satellite is to monitor long-term climate change and facilitate the understanding of the global radiation and the carbon cycle mechanism. One of the climate variables to be monitored is the aerosols. In this study, we evaluate the performance of two aerosols algorithms (Land and Ocean), developed for the GCOM-C/SGLI satellite retrieval of the aerosol optical thickness (AOT). The algorithms investigated take advantage of some of the particular spectral channels of this satellite sensor to retrieve the AOT. The results of these retrievals are evaluated against equivalent products of a compatible satellite, the Terra MODerate resolution Image Spectroradiometer (Terra-MODIS). They show that, both the Land and Ocean aerosols properties’ algorithms perform well in most of the globally distributed scenes selected. Also, the values obtained are within or close to the AOT accuracy targets of the GCOM-C/SGLI satellite (0.05 for Ocean and 0.1 for Land aerosols). However,
during the retrieval process, difficulties have been noticed in the production of quantitative and qualitative outputs, at land areas having a relatively strong surface albedo and high elevation, respectively. The Land algorithm appears to be too sensitive to these surface characteristics.
1B11.4 ID:6827 11:15
Multi-year analysis of Aerosol optical properties over Fort McMurray, AB Auromeet Saha 1, Norman T. O'Neill 1, Ihab Abboud 2, James Freemantle 1, Kevin Strawbridge 2 1 Université de Sherbrooke 2 Environment Canada Contact: [email protected]
Sunphotometer measurements of spectral aerosol optical depth (AOD) were acquired at Fort McMurray, Alberta (~30 km south of the oil sands complex) over a seven year period (2005-2012) using AEROCAN data. AEROCAN, a federated sub-network of AERONET (NASA's AEorosol RObotic NETwork), is run by Environment Canada in scientific partnership with the Université de Sherbrooke. We will report results on seasonal and inter-annual AOD variations and attempt to relate these variations to aerosol type (smoke versus regional and local pollution) using surface PM2.5 measurements, passive and active satellite retrievals, transport models and optical estimates of aerosol scale height. In addition, we will report on the deconvolution of the AOD spectra into fine (sub-micron) and coarse (super-micron) optical depth and the seasonal and inter-annual variations for these fundamental aerosol constituents (the deconvolution permits one to separate out fine mode smoke and pollution from coarse mode dust and clouds). Comparisons with results from other regional AEROCAN stations will also be presented to investigate any regional spectral AOD anomalies at Fort McMurray.
1B11.5 ID:6420 11:30
Investigation of the 'Escalator Effect' in the Kilmore East Fire of February, 2009 Using GEM-AC: Initial Results of GEM-AC Aerosol Heating Jennifer Beale 1, Kirill Semeniuk 1, Alex Lupu 1, Jacek W. Kaminski 1, John C. Mcconnell 1, Norm T. O'Neill 2, Norbert Glatthor 3, Michael Hoepfner 3, Paul I. Palmer 4 1 CRESS, York University 2 CARTEL, Universite de Sherbrooke 3 Institut fur Meteorologie und Klimaforschung, Karlsruhe Institut fur Technologie 4 School of GeoSciences, University of Edinburgh Contact: [email protected]
In early February 2009, Southeast Australia was swept by intense bush fires which burned an area of about 3000 km2. MLS measurements show CO, HCN, and CH3OH combustion products injected directly into the stratosphere. This

study is a continuation of the study by Glatthor et al (2013) which compared MIPAS observations to a high-resolution model run of the Global Environmental Multiscale with Air Quality (GEM-AQ) model. There is generally good agreement between the GEM-AQ simulation and the observations, but the lack of radiatively active aerosols within GEM-AQ likely accounts for the model's discrepancy in plume evolution during the first 1-10 days. In this study we use GEM-AC, an extended climate version of GEM-AQ with complementary M7 and CAMx microphysics, and add black carbon (BC) and organic carbon (OC) estimates as part of the burning process and assess their role in the lifting of the biomass-burning material. Aerosol heating is implemented for 3 hydrophobic and 4 hydrophylic aerosol modes via 3D look-up tables of the aerosol single-scattering albedo, asymmetry parameter, and extinction efficiency. GEM-AC can be run with a global variable (GV) grid where the core has uniform grid spacing and the exterior grid expands. Our simulations use ~300 m vertical resolution and 50x50 km2 resolution in the inner core with an ~4000x4000 km2 horizontal extent, and input the gas and aerosol species at several different heights suggested by higher resolution (2x2 km2) simulations. We track both the gases and the aerosols and assess the impact of OC and BC heating.
1B11.6 ID:6447 11:45
Meteorological aspects of the summer 2012 Siberian wildfire smoke episodes over south coastal British Columbia Robert Nissen 1, Bruce Ainslie 1, Kevin Strawbridge 2 1 Meteorological Service of Canada, Environment Canada, Vancouver, Canada 2 Air Quality Processes Research Section, Environment Canada, Toronto, Canada Contact: [email protected]
Western North America was repeatedly affected by smoke from massive wildfires taking place in eastern Siberia during the summer of 2012. South coastal British Columbia, which is usually upwind of fires that characteristically break out in the Interior of the province, found itself on the frontline of the incoming trans-Pacific smoke. Even at the considerable distance from the source emissions, the smoke plume was still sufficiently concentrated to significantly affect air quality and visibility in the Lower Fraser Valley, including greater Vancouver. In this presentation, the pathways of the smoke plumes towards North America are determined with the assistance of tools such as back trajectories, upper air analyses, and satellite imagery, and the passage and intensity of the plumes over the Lower Fraser Valley are diagnosed using data sources such as lidar observations, webcam imagery and air quality parameter measurements. Implications for air quality management will also be discussed.
Agricultural land management and water / Gestion des terres agricoles et eau
Room / Endroit (Hilton Commonwealth- S), Chair / Président (Jane Elliott ), Date (27/05/2013), Time / Heure (10:30 - 12:00)
1B13.1 ID:6675 10:30Regional-scale modelling of water quality in the Red-Assiniboine Basin: the first binational application of the SPARROW model Glenn Benoy 1, Wayne Jenkinson 2, Ted Yuzyk 1 1 International Joint Commission 2 National Research Council Contact: [email protected]
Across North America, river networks and their watersheds straddle major sections of the Canada-United States (US) border. In an effort to model water quality dynamics of transboundary basins, the International Joint Commission (IJC) launched a binational modelling project of the Red-Assiniboine Basin through its International Watersheds Initiative (IWI). The US Geological Survey (USGS) SPARROW (SPAtially Referenced Regressions On Watershed attributes) model is being used to relate observed long-term nutrients loads across the basin to nutrient sources and transport processes. A precursor to SPARROW modelling is the estimation of annual nutrient loads at discharge and water quality monitoring stations throughout the river network. The USGS program Fluxmaster was used to calculate long-term mean annual nitrogen and phosphorus loads (base year 2001) for ~25 Canadian stations and ~70 US stations. Watershed attributes, including descriptors of climate, physiography, land-use, and agricultural activity, were harmonized over the Canadian and US spatial extents, georeferenced to a harmonized stream and sub-catchment network, and regressed against nutrient loads. Simple drainage area models and source (fertilizer + manure, rural point sources, and land cover) explained 73-79% of the variation in N and 77-84% of the variation in P. These relationships can be used to map nutrient sources and yields by jurisdiction or by watershed and predict nutrient loads anywhere in the stream network. Key stakeholders, including the International Red River Board and the province of Manitoba, are planning to use model results in the development of nutrient management policies.
1B13.2 ID:6286 10:45
Nutrient indicators of agricultural impacts in the tributaries of a large lake Rebecca North 1, Jennifer Winter 2, Peter Dillon 3

1 University of Saskatchewan 2 Environmental Monitoring and Reporting Branch, Ontario Ministry of the Environment 3 Trent University Contact: [email protected]
Lake Simcoe, Ontario, Canada, is a large lake surrounded by a mix of urban, agricultural, and less developed areas and is showing adverse effects of excess nutrient inputs. Knowledge of both the quantity and quality of nutrients and seston entering the lake is important, as large reductions in phosphorus (P) loads have been proposed to help restore the lake and its coldwater fishery. Here, we examined land use effects on P quality (i.e. bioavailability) and its relationship to seston in the tributaries of Lake Simcoe. Indicators of agricultural impacts were examined in thirteen tributaries of Lake Simcoe, which were selected to represent a range of land use types. P bioavailability was assessed through analysis of different forms of P and stoichiometric indicators of nutrient status in seston. Nutrient sources were examined using the δ15N of seston. The proportion of cropland in the sub-watershed had the strongest relationship with P as reflected in higher soluble reactive P concentrations and lower indicators of P deficiency. Agricultural land use effects were complicated; they contributed highly bioavailable P to streams that were P deficient, and at the same time, contributed high seston loads causing turbidity, resulting in subsequent light deficiency. In the Lake Simcoe Watershed, animal manure application on cropland could be a source of nutrients related to the δ15N variability and correspondingly, bioavailable P. Management efforts should therefore include best management practices to reduce manure application to croplands and to prevent runoff from areas where manure is stored.
1B13.3 ID:6626 11:00Assessing the vegetative, hydrologic and topographic influences on the stable isotopes of carbon in fatty acids used in soil and sediment tracing Dominic Reiffarth 1, Ellen Petticrew 2, Philip Owens 3, David Lobb 4 1 Chemistry Program, University of Northern British Columbia, Prince George, BC 2 Geography Program, University of Northern British Columbia, Prince George, BC 3 Environmental Science Program, University of Northern British Columbia, Prince George, BC 4 Department of Soil Science, University of Manitoba, Winnipeg, MB Contact: [email protected]
Best management practices (BMPs) rely in part on tracing the movement of soil and sediment throughout a watershed. In recent years, naturally occurring organics (biomarkers) deposited by plants onto the soil have become of interest in tracing. Suitable biomarkers need to be recalcitrant in the soil without undergoing modification, be suitable for transport, isolatable and detectable by analytical methods; furthermore, the biomarkers need to exhibit unique qualities that enable the source of the biomarker to be distinguished in the endmember. Fatty acids (FAs) meet the above criteria and have been used to varying degrees of success in tracing. The unique quality the FAs exhibit is the ratio of the two stable isotopes of carbon, 13C and 12C. A variety of factors influence the 13C:12C
ratio. Major factors include type of plant (C4 versus C3) and species (e.g. pine versus alfalfa). More subtle factors include topography and hydrology, nutrient availability and photosynthetic rate, among others. Research approaches undertaken in the Horsefly, BC (HRW), and South Tobacco Creek (STCW), MB, watersheds where the suitability of FAs as a spatial and temporal tracer is being investigated will be presented. An extensive sampling regime in the STCW, a highly managed watershed, has been designed to capture variability of the FA-isotope signal produced by a variety of agricultural crops and modified by soil moisture and topography. The HRW consists mostly of haying agriculture and natural, mixed forest; sampling in the HRW has been undertaken to investigate the detectability of FAs after long-range channel transport in an agriculturally non-diverse temperate watershed. The research being conducted is part of a larger investigation into BMPs, and, specifically in the STCW, links to water quality issues affecting Lake Winnipeg.
1B13.4 ID:6796 11:15
Seasonal trends of suspended sediment concentrations and phosphorus export in subsurface runoff from tile-drained fields in Southwestern Ontario. Gilian Opolko 1, Michael English 1, Merrin Macrae 2 1 Wilfrid Laurier University 2 University of Waterloo Contact: [email protected]
Nutrient loading from non-point sources has been identified as a potential cause of accelerated eutrophication in the western basin of Lake Erie, and is a concern throughout extensive regions of Canada and USA. Conservation tillage methods, once identified as solutions to nutrient loading through reduced rates of erosion, are now being identified as potential causes for the increase in concentrations of bioavailable phosphorus (P) in surface waters. In this study, three plots with different tillage treatments including: conventional till (CT), minimum till (MT) and no-till (NT), were selected in a tile-drained agricultural field near St. Marys, Ontario. The Tiles in each of the plots were instrumented with in-line subsurface weirs and automated water samplers that collected tile-flow at 2-8 hour intervals during storm events for 18 months. Samples were also collected during baseflow periods for comparison to storm events. The water samples were analyzed for concentrations of suspended sediment [SS], total P [TP], total dissolved P [TDP], and soluble reactive P [SRP]. Preliminary results show considerable increases in SS concentrations in event samples from CT fields. For all plots, TP constitutes the largest fraction of P. All fractions of P are highest for CT, followed MT and NT. TDP and SRP fractions show weak seasonal trends with the highest concentrations during the fall and winter, but do not appear to differ among the three plots. Particle size analysis of soil, and laboratory experiments observing the role of preferential flow in the transport of sediment and P in soil monoliths are currently in process to understand the mechanisms behind patterns observed in the field. The effect of tillage practice on P-export from agricultural catchments

is important for the implementation of best management practices for the Lake Erie watershed.
1B13.5 ID:6513 11:30
Influence of tillage practice on phosphorus export in agricultural soils from tile drainage and extracted soil monolith experiments Vito Lam 1, Merrin Macrae 1, Mike English 2, Yutao Wang 3, Ivan O'Halloran 3 1 University of Waterloo 2 Wilfrid Laurier University 3 University of Guelph Contact: [email protected]
Agricultural watersheds have been identified as a source of nutrients to surface water bodies. To reduce phosphorus (P) loading to water bodies and the eutrophication of these systems, no-till management practices have been employed across much of North America, decreasing the potential for soil erosion and surface runoff. However, recent work has suggested that no-till may not be a best management practice (BMP) due to increases in soil P- stratification at the surface and an increased density of macropore networks, which may increase the loading of dissolved forms of P via preferential transport into tile drains. There is also uncertainty to if these patterns are observed in Ontario tile-drained soils, and if patterns observed during the summer months persist throughout the entire year. The objectives of this project are to quantify year round losses of runoff, soluble P (SRP) and total P (TP) from drainage tiles beneath conventional, minimum and no-till plots in the Lake Simcoe watershed, and to investigate the role of seasonality on runoff and P losses. Results demonstrate that both runoff and P-export are very episodic across all tillage plots, and most losses occurred during a few key events that occurred under heavy precipitation or snowmelt events. In general, peaks in P concentrations were associated with runoff peaks across all seasons. SRP represented the largest fraction of TP during the winter months, whereas particulate losses of P were greatest when soils were bare in March/April and November rainstorms. Although strong temporal patterns in P export via drainage tiles were observed, patterns did not appear to differ among tillage treatments and instead appear to be related to field topography.
1B13.6 ID:6404 11:45
Evaluation of conversion of annual cropland to forage as a BMP to protect water quality on the prairies.
Jane Elliott 1, Kui Liu 2, David Lobb 2, Don Flaten 2, Jim Yarotski 3 1 Environment Canada, National Hydrology Research Centre 2 University of Manitoba 3 Agriculture and Agri-Food Canada Contact: [email protected]
In most temperate regions, the conversion of annual cropland to forage is considered to be a beneficial management practice (BMP) for protecting surface water quality. Reduced erosion and fertilizer use in land under forages have been reported to lead to a reduction in nutrient transport to surface water in some climates. However, on the Canadian prairies, where surface water recharge occurs mainly during snowmelt when nutrients are transported primarily in dissolved forms, the effectiveness of conversion to forage as a BMP has yet to be demonstrated. As part of Agriculture and Agri-Food Canada’s South Tobacco Creek Watershed Evaluation of BMPs project in Manitoba, nutrient and sediment transport were measured on two pairs of annual crop and forage watersheds from 2004 to 2012. Edge of field flow measurement and water sampling were conducted at the outlets of the watersheds (ranging in size from 5 to 12 ha). At the midpoint of the study, the land use in each watershed was switched so that the effect of conversion to forage (and from forage to annual crop) could be fully evaluated. Results for nitrogen (N) transport were mixed but in most years more phosphorus (P) was transported from the forage watersheds than from the annual crop watersheds. The greater P losses from the forage fields were attributed to the contribution of dissolved P from the forage biomass to snowmelt runoff. On average 81% of N and 73% of P transported in runoff were in the dissolved form.
Radar Meteorology and Applications PART 1 / Météorologie radar et applications PARTIE 1
Room / Endroit (Hilton Prince Albert), Chair / Président (Bob Kochtubajda ), Date (27/05/2013), Time / Heure (10:30 - 12:00)
1B14.1 ID:6435 INVITED/INVITÉ 10:30
Daily, weekly, and annual cycles of precipitation and convection over the continental United States
Frédéric Fabry McGill University Contact: [email protected]
Continental composites of reflectivity over the United States from 1996 to present were composited and analysed to reveal patterns of occurrence of precipitation and convection. They reveal how: - Climatologies as a function of dBZ threshold illustrate the different regimes of

precipitation in different areas; - Daily cycles of precipitation in the summer show how convection is generated in coastal areas (from the sea breeze) and on the foothills of the Rocky Mountains, the latter then travelling at night over the Great Plains; - Hot spots of convection initiation occurrence can be identified; - The footprint of changes in human activity between weekdays and weekends influence precipitation patterns,
1B14.2 ID:6383 INVITED/INVITÉ 11:00
Operational dual-polarization radar: An overview of the U.S. WSR-88D radar network
Matthew Kumjian National Center for Atmospheric Research Contact: [email protected]
Over the past several years, the operational WSR-88D radar network of the United States National Weather Service has been undergoing an upgrade to have polarimetric capabilities. The upgraded radars provide the standard radar moments of reflectivity factor, Doppler velocity, and Doppler spectrum width, along with the new polarimetric variables of differential reflectivity, propagation differential phase and specific differential phase, and the co-polar cross- correlation coefficient. In addition to these raw variables, a number of new products are available, including enhanced quantitative precipitation estimates and hydrometeor classification. In this talk, an overview of polarimetric WSR-88D radars and the data they provide will be given. In addition, the meteorological applications of polarimetric radar data in warm- and cold-season precipitation will be presented and discussed. The advantages of the new operational products will be highlighted. Examples of operational benefits experienced so far will be given.
1B14.3 ID:6809 11:30
Radar, Synoptic and Meso-scale Analyses on the August 20th, 2009 Tornado Outbreak Event Yoshio Asuma 1, Arnold Ashton 2, David Hudak 2 1 Hokkaido University / University of the Ryukyus 2 Environment Canada Contact: [email protected]
A major severe weather outbreaks occurred on August 20th, 2009 in southern Ontario associated with the passage of a cold front. In total, 18 tornadoes occurred in the late afternoon and early evening. This event marked a Canadian record for the largest number of tornados in a single day. This event was

analyzed using Environment Canada’s C-band dual polarization radar at King City just north of Toronto as well as supporting satellite and synoptic data. This case was then modeled with the Weather Research and Forecasting (WRF) Model, a next-generation mesoscale numerical weather prediction system developed in the US. The modeling strategy was to run a hierarchy of scale resolutions to gain a better understanding the physical processes mechanisms for the tornado outbreak. The synoptic context was that southern Ontario was in a warm sector that was associated with an occluded low pressure system over the Lake Superior. A cold front then moved over the area from the west later in the day. The radar analysis showed that the band echoes associated with the cold frontal zone moved into southern Ontario from the west while smaller sized isolated echoes moved from the south in the warm sector and merged into the cold frontal zone. The small isolated echoes developed their tornadic signatures as they were engulfed into the cold frontal zone. The results of the WRF modeling suggested that the convective unstable atmospheric condition was established with warm and moist air from the south in the lower level and the drier air from the south-west in the middle and upper levels. WRF model simulated the synoptic environment very well. However there were some deficiencies noted in the model’s ability to accurately locate and characterize the tornadic activity.
1B14.4 ID:6452 11:45
Nowcasting visibility during snow using a weather radar (duanni) Mary Qian 1, Gerhard Reuter 2 (Presented by Gerhard W. Reuter ) 1 Environment Canada 2 University of Alberta Contact: [email protected]
To estimate the visibility during snowfall, we compare hourly visibility (Vis) measurements with radar reflectivity factor (Z) measurements sampled over Edmonton International Airport during snowfall events from October 2010 to April 2011. The (Z, Vis) scatter diagrams showed that increasing Z was correlated with decreasing Vis. For a given Z observation, we found probability distribution of Vis. The interquartile range with Z ≥ 20 dBZ was smaller than the IQR with Z < 20 dBZ. The scatter was not significant affected by temperature profile or the wet bulb potential temperature. Strong wind speed (≥15 knots) along with high reflectivity was associated low Vis (< 2 sm). Radar reflectivity data has valuable information for visibility, yet is not a substitute for human observations.
Symposium on the Mathematics of Planet Earth PART 2 / Colloque sur les mathématiques de la planète Terre PARTIE 2
Room / Endroit (TCUP Salon A), Chair / Président (N. McFarlane ), Date (27/05/2013), Time / Heure (13:30 - 15:00)
1C1.1 ID:6711 INVITED/INVITÉ 13:30Extreme value theory and its role in understanding observed precipitation changes.
Francis Zwiers Pacific Climate Impacts Consortium Contact: [email protected]
Extreme value theory is used routinely in climatology to analyse precipitation data, for example, to provide estimates of the magnitude of rare events that might be expected to occur only once during the life of a new building. Such applications typically assume stationary climates. Extreme value theory is also being used, in a slightly more sophisticated way, to determine whether the intensity of extremes has changed over time, and to link those changes to proximal causes. Most studies proceed by attempting to make comparisons between observations and models on a more or less local, point-wise basis, often at the grid box scale, and then aggregating to larger scales. While several models of spatial extremes have been developed by statisticians, they remain difficult to apply, particularly over larger regions. Several other, more basic, challenges also currently limit our ability to better evaluate climate models and understand observed changes in precipitation extremes. These include so-called “scaling issues” (rain gauges observe point values while models simulate grid-box area averages), limited spatial coverage from an observing network that was not designed primarily for climate purposes, and data inhomogeneity arising from changes over time in spatial coverage, instruments, siting and exposure, and so on. Despite the challenges, there is evidence of an intensification of precipitation extremes globally over the past 60 years, and emerging evidence that anthropogenic emissions of greenhouse gases play a role. This work shows that the overall historical intensification of precipitation extremes observed over global land areas appears to follow the Clausius-Clayeron relation, while climate models appear to have somewhat lower sensitivities to warming over global land areas.
1C1.2 ID:6400 14:00At What Time of Day Do Daily-Maximum Near Surface Winds Occur?

Robert Fajber 1, Adam Monahan 2 1 School of Earth and Ocean Sciences, University of Victoria 2 School of Earth and ocean Sciences, University of Victoria Contact: [email protected]
Under clear sky conditions, near-surface winds are characterized by a pronounced diurnal cycle. In the bottom several tens of metres above the surface, mean wind speeds are greatest at mid-day; for some tens to hundreds of metres above this, mean wind speeds are generally greatest at night. Using long time series of 10-min average winds at 10m and 200m from a tall tower at Cabauw in the Netherlands, we will consider the timing of daily wind speed extremes relative to the diurnal cycle, asking: at what time of day do the largest daily wind speeds occur? If a time series has an autocorrelation scale similar or longer than the length of the time window used, such an analysis will be complicated by the tendency for extrema to occur at the beginning and end of the window. As large-scale driving variability (represented by the geostrophic winds) has autocorrelation timescales of a day or longer, this "edge effect" will influence estimates of the timing of daily extrema. We will demonstrate that with appropriate averaging, it is possible to separate this "edge effect" from the physically-driven nonstationarity in the timing of wind speed extremes.
1C1.3 ID:6456 INVITED/INVITÉ 14:15
Capturing intermittent and low-frequency variability in high-dimensional data through nonlinear Laplacian spectral analysis
Dimitrios Giannakis Courant Institute of Mathematical Sciences, New York University Contact: [email protected]
Nonlinear Laplacian spectral analysis (NLSA) is a method for spatiotemporal analysis of high-dimensional data, which represents spatial and temporal patterns through singular value decomposition of a family of maps acting on scalar functions on the nonlinear data manifold. Through the use of orthogonal basis functions (determined by means of graph Laplace-Beltrami eigenfunction algorithms) and time-lagged embedding, NLSA captures intermittency, rare events, and other nonlinear dynamical features which are not accessible through classical linear approaches such as singular spectrum analysis. We present applications of NLSA to detection of decadal and intermittent variability in the North Pacific sector of comprehensive climate models, and multiscale physical modes of the Madden-Julian Oscillation in infrared brightness temperature satellite data.
1C1.4 ID:6330 14:45
Dynamics and practical predictability of extratropical wintertime low-frequency variability in a low-dimensional system
Masaru Inatsu 1, Naoto Nakano 2, Hitoshi Mukougawa 3
1 Hokkaido University 2 Tohoku University 3 Kyoto University Contact: [email protected]
Dynamics and practical predictability of extratropical low-frequency variability (LFV) in Northern Hemisphere winter are examined in the framework of a two-dimensional (2D) stochastic differential equation (SDE) on the phase space spanned by two leading empirical orthogonal function modes of low-pass-filtered 500-hPa geopotential height variations. The drift vector and diffusion tensor of the 2D SDE with multiplicative noise are theoretically connected with deterministic and stochastic error growth, respectively; both are statistically estimated from a reanalysis dataset. Projected onto the 2D phase space is the practical predictability of the LFV estimated by the 10-day forecast spread based on the 1-month ensemble prediction operationally conducted by the Japan Meteorological Agency (JMA). It is shown that the forecast spread of the LFV prediction by the JMA model for relatively shorter prediction period when the model bias does not hamper the forecast is primarily explained by the stochastic error growth associated with the diffusion tensor and the deterministic error growth due to the Jacobian of the drift vector plays a secondary role. A non- Gaussian PDF of the LFV is also related to the norm of the diffusion tensor. Hence, the stochastic processes mostly control the dynamics and predictability of the LFV in the 2D phase space.
General Hydrology PART 2 / Hydrologie en général PARTIE 2
Room / Endroit (TCUP Salon B), Chair / Président (Sean Carey ), Date (27/05/2013), Time / Heure (13:30 - 15:00)
1C2.1 ID:6593 13:45
Mitigating environmental impacts of open waste rock storage with reclamation soil covers Yekaterina Dobrovolskaya 1, Bing Cheng Si 2 1 School of Environment and Sustainability, University of Saskatchewan 2 Department of Soil Science, College of Agriculture and Bioresources, University of Saskatchewan Contact: [email protected]
Mining operations lead to considerable land disturbance and accumulation of large amounts of waste rock. Capping waste rock with soil cover has recently proved to be a reliable reclamation technique in the long term. This study was

conducted to examine whether a considerable increase of water storage is possible after separation of coarse- textured soil into size fractions and layering them into finer-over-coarser soil cover. Such a layering sequence is also more susceptible to preferential flow. Therefore, whether preferential flow can be mitigated by increasing the number of layers and extending interlayer transitions in finer-over-coarser soil systems, was another question addressed. Intermittent infiltration experiments were conducted on homogeneous covers composed of natural sand, two-layered covers with abrupt and gradual interlayer transition as well as on a four-layered cover during intermittent ponding infiltration under initially air-dry (IAD) and field capacity (FC) conditions. Water storage capacities were determined from a sampling of soil covers on water content at FC. Water storage capacities were statistically significantly higher in two-layered covers than in homogeneous covers, when a gravel layer was placed at the bottom of the covers. Under shallow water table conditions, WSCs were equal in homogeneous and the two-layered cover with transition (12.8 cm/m), higher in the two-layered cover (13.8 cm/m), and the highest in the four-layered soil cover (15.4 cm/m). Wetting front was stable in the homogeneous cover under both IAD and FC conditions and in the two-layered cover with transition under IAD. Potentially unstable flow was observed only in the two-layered soil cover under both initial water contents. Other covers were only partially unstable under both initial water contents. Overall, water storage capacity did increase with increasing number of layers in tested soil covers, and susceptibility to preferential flow decreased with increasing number of layers in to more than two in soil cover.
1C2.2 ID:6421 14:00
Spatiotemporal variability in hillslope runoff temperatures and its influence on winter stream temperature for a coastal forested catchment. Jason Leach , Dan Moore University of British Columbia Contact: [email protected]
Winter stream temperature influences salmonid development and survival. Our previous research has highlighted that, for streams in the rain-on-snow zone of the Pacific Northwest, advective fluxes associated with hillslope runoff are a more important control on winter thermal regimes than stream surface energy exchanges such as net radiation. The objective of this study was to examine empirically the dominant controls on the spatiotemporal variability of hillslope runoff temperatures as a basis for developing a process-based predictive model. Field work was conducted at a small (8 ha) forested mountainous headwater catchment located in the rain-on-snow zone near Vancouver, British Columbia. Subsurface temperatures were measured hourly at the foot of 35 hillslopes over a range of soil depths (0.05 to 0.8 m) from November 2011 to March 2012. Upslope contributing area, depth of subsurface temperature measurement, elevation, aspect, and forest cover for each site were used in statistical models to help explain the spatiotemporal variability in subsurface temperature. Subsurface
temperatures were positively related to upslope contributing area, but no significant relationship was found for the other predictor variables (depth, elevation, aspect, and forest cover). The model fit was strongest during periods between rain and snowmelt events when spatial variability in subsurface temperatures was greatest, and weakest during rain and snowmelt events when subsurface temperatures across the catchment were more uniform. These results suggest that vertical heat conduction (represented by depth, aspect, and forest cover) is a less important control on subsurface temperature than heat advection associated with lateral hillslope flow (represented by upslope contributing area). Therefore, variability in hillslope contributing area and associated runoff processes must be considered when predicting winter stream temperatures in coastal headwater catchments.
1C2.3 ID:6780 14:15
Water residence time in a Tropical dry forest catchment, Jalisco, Mexico Kegan Farrick , Brian Branfireun Western University Contact: [email protected]
The residence time of water is an excellent indicator of the linkages among the storage, flow paths and water sources in a catchment, and can be determined using simple convolution models. There has been a significant increase in the use of water residence times in a range of landscapes to elucidate hydrological processes, however to our knowledge, this approach has not been applied to tropical dry forest catchments. Tropical dry forests comprise more than 40% of all tropical forests and more than 20% of forests worldwide. The extent of these systems, the sensitivity of their associated intermittent streams to strongly seasonal precipitation inputs, and forecasted climate change impacts make the application of residence times essential for predicting both current and future water availability in these already water-limited watersheds. This hydrological investigation examined the controls on the annual residence time of four catchments (0.18 – 3.13 km2) in central Jalisco State, Mexico. Rainfall and streamflow were continuously monitored and bulk precipitation and baseflow stream samples were collected on a weekly basis from each of the catchments and analysed for δ18O. Preliminary data show that approximately 165 mm of rainfall over a 50 day period was required to initiate an average baseflow between 0.02-0.3 L/s-1 at the monitored catchments. The δ18O composition of baseflow reflected the temporal patterns of δ18O composition of rainfall at the highest elevations with an asyncrhony of 7 – 14 days. This pattern suggests a tightly coupled relationship between rainfall inputs and streamflow.
1C2.4 ID:6667 14:30
Groundwater Response to Effluent Infiltrating from At-grade Source Lines to Shallow Groundwater

Amanuel Oqbit Weldeyohannes 1, Gary Kachanoski 2, Miles Dyck 3 1 Department of Renewable Resources, 751 GSB, University of Alberta, Edmonton, AB, T6G 2H12 Office of the President, Memorial University of Newfoundland, St. John's, NL A1C 5S7 3 Department of. Renewable Resources, 751 GSB, University of Alberta, Edmonton, AB, T6G 2H1 Contact: [email protected]
Local groundwater response to secondarily treated effluent infiltrating from at-grade line sources has been investigated to understand the resilience of the vadose zone for effluent remediation before it reaches the groundwater. The study was conducted at Wetaskiwin Rest Stop, Alberta (N52°53.709 W113°38.548). The site has received ultraviolet (UV) disinfected wastewater for more than four years via a pressurized at-grade line sources. A detailed characterization of the groundwater hydrology, wastewater plume extent and direction was conducted using a grid of dense groundwater wells (N=99), which were installed over a 1.5 ha area within and outside the effluent source zone. Following the site characterization, effluent flux density and groundwater level were measured at hourly intervals. In addition, groundwater levels in the remaining 88 wells were also recoded manually on a regular basis. The time series data was processed using wavelet signal analysis method. Results showed that the groundwater response directly below the source zone was evident. Furthermore, the coherency and cross spectrum between effluent flux density and groundwater level fluctuation revealed a time scale-dependent groundwater response. Thus, consideration of time scale-dependent groundwater response beneath the effluent infiltration fields typical of on-site wastewater treatment systems (OWTS) and shallow groundwater boundary conditions is very vital. It helps in determining the travel time of pathogens prior to reaching the groundwater and processes thereof as well as for developing a sound groundwater management plan. Key words: Groundwater response, effluent infiltration, OWTS, time series signal and wavelet analysis.
1C2.5 ID:6604 14:45
Stemflow production by 40 urban trees: Factors contributing to storm runoff generation and mitigation in Kamloops, British Columbia
Julie Schooling , Darryl Carlyle-Moses Thompson Rivers University Contact: [email protected]
Water quantity and quality issues in urban environments originate where rain falls, making source controls one of the most critical components of integrated stormwater management strategies. Tree canopies intercept and funnel fractions of gross precipitation to the base of tree trunks, but in widely varying proportions. This research is gathering stemflow data for 40 deciduous trees representing 22 species in semi-arid Kamloops, British Columbia. Diameter at breast height

ranges from 10–69 cm. The majority of trees in this urban park setting are independent, but a number have close neighbours, allowing us to analyze the influence of this factor. Based on analysis of preliminary stemflow data, trees’ physical characteristics, and storm meteorological data, we present profiles of trees on a spectrum of least to most stemflow production. These findings will be applicable to selection, situation, and science-based management of appropriate trees by landscape architects, urban designers, and urban foresters. Synthesized results may inform refinement of models that assess stormwater-related impacts of urban development and tree removal or planting. Future research is needed on root zone extent and infiltration capacity in various soils, potential for groundwater recharge, and chemical composition of stemflow for these and other species.
Water Resource Management in a Changing Climate -PART 2 / Gestion de l'eau et le changement du climat PARTIE 2
Room / Endroit (TCUP Salon C), Chair / Président (Virginia Wittrock ), Date (27/05/2013), Time / Heure (13:30 - 15:00)
1C3.1 ID:6783 13:30Irrigation Water Management under Normal, Drought, and Flood Conditions in a Run-of-River Irrigation Scheme – A Case study of the Bwanje Valley Irrigation Scheme, Malawi. James Johnstone 1, Henrie Njoloma 2, John Fitzgibbon 1 1 University of Guelph 2 Government of Malawi Contact: [email protected]
Irrigation has underpinned the green revolution for the past 70 years. However, climate change is predicted to lead to an increase in floods and droughts and how well existing run- of-river irrigation schemes respond to these conditions is an extremely important research topic in order to preserve the gains of the green revolution. Incorporating an irrigation water management framework into a social- ecological systems framework, irrigation water management under normal, flood, and drought conditions was researched using the case study approach at the Bwanje Valley Irrigation Scheme (BVIS) in Malawi in 2011. The BVIS is a farmer-cooperative that diverts water from the ephemeral Namikokwe River into the 800-

hectare irrigation scheme. At the BVIS, a total of 2067 farmers grow rice in the rainy season (December-April) and maize in the dry season (May- November) across the three branch canals of the irrigation scheme. A total of 68 semi-structured interviews and nine focus groups were conducted with farmers, cooperative staff, water guards, extension officers, local government officials, and traditional authorities, and revealed how irrigation water management changes depending on water availability. When supply exceeds demand, existing irrigation water management provides sufficient water to farmers, but when demand exceeds supply irrigation water management proves inadequate. Indeed, when demand exceeds supply irrigation water management deteriorates to the point where farmers use their networks, incentives, or theft in order to secure water for their crops. In conclusion, with local floods and droughts occurring on a yearly basis at the BVIS and existing irrigation water management proving ineffective, any increase in floods and droughts from climate change would most likely lead to unsustainable outcomes for the BVIS.
1C3.2 ID:6336 14:00
Municipal Wastewater Effluent Strategy: Impacts and Source Water Protection Ondiveerapan Thirunavukkarasu 1, Thon Phommavong 2, Sam Ferris 1 1 Water Security Agency 2 Ministry of Environment Contact: [email protected]
Canada-wide Strategy for the Management of Municipal Wastewater Effluent requires all wastewater treatment plants in Canada including Saskatchewan to achieve National Performance Standards (NPS). As outlined in the strategy, an assessment of receiving environment is to be conducted to determine whether or not the levels of substances discharged into receiving environment are protective of aquatic organisms. For levels that are not protective, an Effluent Discharge Objective (EDO) should be established. During last two years (2011 and 2012) all communities that are discharging treated effluent into fish bearing waters in Saskatchewan are requested to conduct an effluent characterization study to determine the impacts on surface water and establish EDOs. Drinking Water and Wastewater Management Division (DWWMD) of Water Security Agency (WSA) is working with these communities to assess the impacts of treated wastewater on receiving environment. The study involves collection of effluent samples from the discharge point of wastewater treatment plants and analysis includes both acute and chronic toxicity testing, and other parameters, such as pathogens, nutrients, pesticides and metals. DWWMD is also conducting mixing zone sampling for small communities by collecting water samples from upstream and downstream locations of surface water. Once this study is complete, the communities must conduct an Environmental Risk Assessment and establish site-specific EDOs by 2017. The results showed that nearly 90% of samples passed acute toxicity testing and repeat sampling is being conducted in this year for failed samples. Using available data, dilution factor and mass balance

approach, site-specific EDOs are established for very small communities in the province. This paper includes the results of sampling/research studies that are conducted to determine the impacts of treated wastewater on Saskatchewan Rivers and Streams. This paper also outlines the regulatory framework, wastewater management, source water protection and related implementation activities in Saskatchewan.
1C3.3 ID:6629 14:15
Thermal Mitigation Measures in Urban Stormwater Management Facilities Steve Brown 1, Andrew Sobchak 2 1 Stantec Consulting Ltd. 2 Tributary Consulting Inc. Contact: [email protected]
It has long been recognized that the alteration of thermal regime can have a significant impact on the flora and fauna of aquatic ecosystems and often the most desirable aquatic species are sensitive to in-stream temperatures. Many factors influence in-stream thermal conditions including local hydrology, groundwater discharge, riparian cover and surrounding land uses. Because land use plays a role in stream temperature regimes, urban development can contribute to changes in thermal conditions through reduction in groundwater recharge (and hence baseflow levels) and/or through increasing the temperature of surface runoff discharging to aquatic systems. With climate change a growing concern, Regulatory agencies are increasingly requiring mitigation of the potential thermal impacts from urban stormwater management facilities on in-stream systems, but little guidance is available from actual case studies to assist in the design and implementation of these measures. This presentation will provide a summary of the need for thermal mitigation measures, briefly review literature available on the subject and then discuss typical approaches to thermal mitigation measures. Finally, a case study of an underground trench designed to reduce stormwater discharge temperatures in a subdivision constructed in Baden, Ontario in the early 2000’s will be examined. The design constraints and principles will be reviewed, along with monitoring data collected by continuous data loggers installed on site over a period of several years. The presentation will conclude with recommendations for the design and implementation of future thermal mitigation measures and suggest opportunities for further study of the subject.
1C3.4 ID:6934 14:30Climate Change May Affect Metals Retention In Northern Saskatchewan Lakes But Oil Sands Emissions Do Not
Findlay Macdermid , Peter Dillon Trent University

Contact: [email protected]
This paper presents the results of two research projects related to the deposition of contaminants in Saskatchewan that may originate in the Fort McMurray region. This issue was investigated using lichen surveys to measure contaminant dispersion and lake sediment cores to establish deposition history. Results show that while one lake is accumulating metals in sediments, it is unlikely that this is related to oil sands air emissions. The implication of this work is that increased accumulation of metals is driven by factors related to primary productivity and one of these potential factors is climate change.
Coastal Oceanography and Inland Waters PART 2 / Océanographie côtière et eaux intérieures PARTIE 2
Room / Endroit (TCUP Gall. Suite 1), Chair / Président (Guoqi Han ), Date (27/05/2013), Time / Heure (13:30 - 15:00)
1C5.1 ID:6894 13:30
A Nested-Grid Ocean Circulation Modelling System for the Gulf of St. Lawrence and Scotian Shelf based on NEMO Jinyu Sheng , Jorge Urrego-Blanco Department of Oceanography, Dalhousie University Contact: [email protected]
A nested-grid ocean circulation modelling system was developed for the eastern Canadian shelf with a child sub-model nested inside a parent sub-model. The parent sub-model has a horizontal resolution of ~(1/4) degree for the northwest Atlantic Ocean between 32W and 81W and between 33N and 57N. The child sub-model has a horizontal resolution of ~(1/12) degree for the Gulf of St. Lawrence and the Scotian Shelf. Both the parent and child sub-models use version 9 of the Océan Parallélisé System (NEMO-OPA9) as the ocean circulation component, and version 2 of the Louvain-la-Neuve Ice Model (NEMO-LIM2) as the sea-ice component. The two-way nesting technique is used for the interaction between the two sub-models. In this study the performance of the nested-grid modelling system is assessed and the results produced by the child sub-model are used to investigate the physical processes affecting the circulation, hydrography and ice conditions at different time-scales over the Gulf of St. Lawrence and the Scotian Shelf.

1C5.2 ID:6605 14:00
Low frequency variability of the surface waters of coastal British Columbia Diane Masson , Patrick Cummins Institute of Ocean Sciences Contact: [email protected]
Long terms records of monthly data collected at lighthouse stations are used to characterize climatic variability and secular trends in sea surface temperature (SST) and sea surface salinity (SSS) over coastal British Columbia. The leading modes in a principal component analysis of SST and SSS anomalies represent 68% and 59% of the variance, respectively. These modes show in-phase co-variability along the entire coast on interannual to decadal time scales. A red noise power spectrum provides a good fit to the leading principal components. While the de-correlation time scale for temperature is similar to that of Station P in the northeast Pacific, the de-correlation time scale for salinity is much shorter, suggesting that local processes drive SSS variability. The principal component for temperature, on the other hand, is closely related to the Pacific Decadal Oscillation (PDO), indicating that coastal SSTs are driven by large-scale atmosphere/oceanic processes that are associated with those that drive the PDO. Unusual changes are observed at certain individual stations, including a pronounced non-stationarity in the SSS record that may be associated with changes in the local hydrological cycle.
1C5.3 ID:6722 14:15
Application of a particle tracking model to simulate the release of therapeutants used by the aquaculture industry into waters in South-West New Brunswick Susan Haigh 1, Fred Page 1, David Greenberg 2, Randy Losier 1, Jiselle Bakker 1 1 Fisheries and Oceans Canada, St Andrews Biological Station 2 Fisheries and Oceans Canada, Bedford Institute of Oceanography Contact: [email protected]
Located in the Bay of Fundy, coastal waters of South-West New Brunswick are home to a large salmon aquaculture industry which is of significant economic importance to the province. The infestation of salmon by sea lice is one of the health issues faced by the industry. Therapeutants are used in the treatment of sea lice infestations and are subsequently released into the environment. Understanding the transport and dispersion of the therapeutants is a key component to understanding their potential impact on the environment. To this end, the Finite Volume Coastal Ocean Model (FVCOM) along with a Lagrangian particle tracking model have been implemented for South-West New Brunswick in order to simulate the release of therapeutants into the environment. The results of the model are compared to dye release field studies and include the evolution of the dye patch and horizontal and vertical diffusion of the dye.

FLOW (Canada) Workshop: Addressing Lake Winnipeg Eutrophication PART 1 (Sponsored by W&D Gordon Foundation) / Atelier: FLOW (Canada) : Attention sur l'eutrophication du lac Winnipeg PARTIE 1
Room / Endroit (TCUP Gall. A), Chair / Président (James P. Bruce ), Date (27/05/2013), Time / Heure (13:30 - 15:00)
1C6.1 ID:6938 INVITED/INVITÉ 13:30The History and Present Situation – Lake Winnipeg Pollution
Norm Branson Former D.M. Water, Manitoba, Chair of FLOW Contact: [email protected]
The present state of Lake Winnipeg resembles that of Lake Erie in the late 1960’s. Increasing nutrient inflows are causing massive algal blooms in ever increasing frequency and intensity. The major nutrient sources are in the Red River Valley in both Canada and the United States with significant potential for continued increase. The enormous extent of the lakes drainage basin – over 900,000 km.2 – poses the threat of further nutrient loading from the other major watersheds in the basin. Although the 10th largest lake in the world, serious scientific study of Lake Winnipeg has only been underway since the late 1990’s; resources devoted to research on the lake are a tiny fraction of that devoted to the study of any one of the eastern great lakes. Various short and long-term policy instruments have been discussed to address the source(s) of the problem, and some have been implemented, but as yet with no apparent effect on the nutrient loading to the lake.
1C6.2 ID:6940 INVITED/INVITÉ 14:00Lake Winnipeg Basin in a Changing Climate and Lessons from Lake Erie
James Bruce FLOW

Contact: [email protected]
Two North American lakes, Winnipeg and Erie, are often cited as poster children for eutrophication. The bi-national Erie basin has been very extensively studied over the years and like that of Lake Winnipeg, is experiencing the effects of a rapidly changing climate. On Erie, point sources of pollution, including nutrients, were effectively curtailed and lake conditions improved under the Canada-U.S. Great Lakes Water Quality Agreement of 1972. But currently, as ice cover declines, water temperatures rise, and nutrient loadings from diffuse sources increase, due to more runoff events with more frequent winter/spring snowmelt and heavy rain episodes, Erie is seriously back-sliding to eutrophic conditions again. In the Lake Winnipeg basin increased livestock and crop production have been shown to contribute to increased nutrient loading. Is anthropogenic climate change affecting Lake Winnipeg with similar stresses to those on Lake Erie and additionally on Red River floods? Some indications are provided and adaptation measures proposed.
1C6.3 ID:6939 INVITED/INVITÉ 14:30Identifying and Targeting Land Management Practice to maximize effectiveness and minimize nutrient runoff within the Lake Winnipeg Basin Ute E. Holweger 1, Jason Vanrobaeys 2 1 CSLA, Agriculture and Agri-Food Canada, Science and Technology Branch, Winnipeg, MB 2 Agriculture and Agri-Food Canada, Science and Technology Branch, Morden, MB Contact: [email protected]
Excessive nutrient loading has contributed significantly to the eutrophication and associated algae blooms in Lake Winnipeg, making it one of the most threatened water bodies in Canada. In recent years, emphasis has been placed on improving the understanding of the hydrology of agriculture dominated watersheds for tributaries like the Red and Assiniboine Rivers that make their way into Lake Winnipeg and are the source of the majority of its nutrients (Bourne, 2002). However, significant gaps remain, especially pertaining to our knowledge of agricultural practices in this basin and their effect on water chemistry in cold climates such as the Canadian prairies (Lake Winnipeg Research Consortium, 2011). As such, Agriculture and Agri-Food Canada has partnered with Environment Canada, Manitoba Conservation and Water Stewardship and local conservation districts to identify and evaluate different land use and management practices, as well as, develop scenarios that aim to improve surface water quality in the Lake Winnipeg Basin. Efforts are underway to extend plot, field, or small catchment scale research findings to larger watersheds and identify the potential implications of changing agricultural land management practices through watershed based modeling and scenario development. This work complements broader provincially led initiatives
that utilize integrated watershed resource management plans to target action in Manitoba watersheds. It also focuses on determining the efficacy and feasibility of certain practices (such as converting annual to perennial crops, riparian buffers, wetland restoration, nutrient management planning, etc.) based on local watershed characteristics and the development of accompanying toolsets to guide the implementation of scientifically proven practices. Web-based GIS applications and tools are used to convey knowledge and information to the agricultural sector and decision makers so that they are able to develop and implement defensible and cost effective strategies/approaches to reduce nutrient loading from agricultural watersheds.
Extreme Value Analysis and IDF Curves PART 1 / Analyse des valeurs extrêmes et courbes IDF PARTIE 1
Room / Endroit (TCUP Gall. B), Chair / Président (Philip Jarrett ), Date (27/05/2013), Time / Heure (13:30 - 15:00)
1C7.1 ID:6426 13:30Projecting future extreme, short-duration storms of central Alberta by regional climate modeling Chun-Chao Kuo , Nasreen Jahan , Thian Yew Gan University of Alberta Contact: [email protected]
Climate change may alter future precipitation regimes of central Alberta which means that municipal Intensity-Duration-Frequency (IDF) curves of Edmonton should be updated to reflect possible changes to intensities and return periods of future storms. A regional climate model (RCM), MM5, was set up in a one-way, three-domain nested framework to simulate future summer (May to August, MJJA) precipitation of central Alberta. MM5 was forced with climate data simulated by three GCMs (Global Climate Models), CGCM3, CCSM3 and ECHAM5, for the baseline, 1971-2000, and future periods, 2011-2100, under the A2 climate change scenarios of SRES (Special Report on Emissions Scenarios). MM5’s simulations are first biased corrected using a quantile-based method before grid-based IDF curves are estimated from MM5’s simulations for the baseline and future periods. So far, preliminary results show that future IDF curves derived from climate change projections of the aforementioned three GCMs dynamically downscaling by MM5 show a higher range of intensities

especially for storms of short durations (< 6 hr). To assess the uncertainties associated with predicting future IDF curves, more SRES climate change scenarios of GCMs, such as the A1B, and B2 scenarios should be used to project the future extreme storms of central Alberta using MM5.
1C7.2 ID:6487 13:45
An update of Intensity-Duration-Frequency (IDF) curves for Southern Quebec based on Regional Frequency Analysis Alain Mailhot , Guillaume Talbot INRS-Eau, Terre et Environnement Contact: [email protected]
Intensity-Duration-Intensity (IDF) curves are used for the design of water infrastructures and risk assessment. Historically, in Canada, IDF curves were estimated using rainfall annual maxima series (AMS). The Gumbel distribution is considered and fitted using the method of moments. Many authors have recognized that the Generalized Extreme Values (GEV) distribution may better represent rainfall extremes (for instance the Gumbel distribution is a special case of the GEV distribution with the shape parameter set to zero). Since available rainfall series are usually short (less than 40 years for most stations), uncertainties on the GEV shape parameter can be important. In that case it seems reasonable to use a two-parameter distribution. Regional Frequency Analysis (RFA) appears to be an interesting option in situation where we have a large number of stations with relatively short records. RFA assumes that AMS from the various stations within a region share some common statistical characteristics. A regional shape parameter can be defined and rainfall series from many stations can be combined to get more reliable estimates of this regional shape parameter. This paper presents an updated version of the IDF curves for southern Quebec based on RFA. Data from stations located in southern Quebec (south of 49° of latitude) were used. Hourly rainfall series and daily maxima (DM) rainfall series over various durations were used. Annual maxima series (AMS) were constructed by combining hourly and DM series. Statistically homogeneous regions were identified and distribution parameters estimated using the L-moment method. Resulting IDF estimated will be presented and compared with IDF estimates based on the local standard method (Gumbel distribution fitted with the method of moments).
1C7.3 ID:6352 14:00
A novel quantile-quantile downscaling approach to updating IDF curves in the City of Saskatoon
Elmira Hassanzadeh , Alireza Nazemi , Amin Elshorbagy Department of Civil & Geological Engineering, University of Saskatchewan Contact: [email protected]
Traditional Intensity Duration Frequency (IDF) curves are mainly derived based

on historical precipitation records. IDF curves represent the characteristics of extreme rainfall at a local scale and have wide range of applications for engineering design purposes. Warming climate intensifies the hydrological cycle and can change the extreme rainfall values; hence, results in alteration of the historical IDF curves. In order to update the IDF curves in the City of Saskatoon, Canada, in light of possible climate change, a quantile-based downscaling approach is developed and presented. Global scale daily Annual Maximum Precipitation (AMP) quantiles are generated from the precipitation of Coupled Global Circulation Model (CGCM). Using the Genetic Programming (GP) technique, 24 relationships are evolved to map daily AMP quantiles from the global scale to the daily and sub-daily AMP quantiles at the local scale for the baseline period (1961-1990). Comparison between the historical IDF curves and IDF curves derived using the quantile-based downscaling technique for the baseline period demonstrates the suitability of the proposed method. Assuming that the mapping of the AMP quantiles from global to local scales are stationary in time, the GP-evolved relationships are used to find the AMPs at the local scale using projections of the CGCM for the future period (2010-2100). The results show that projected IDF curves for the City of Saskatoon are subject to change, but the sign, magnitude, and variability of such change depend on the emission scenario, storm-duration, and return period. However, increases in the short duration AMPs (up to 6 hour) for small return periods (up to 10 years) are obvious for A2, A1B, and B1 emission scenario projections.
1C7.4 ID:6353 14:15
A stochastic rainfall disaggregation framework for simulating the sub-daily extreme rainfall values in the city of Saskatoon Alireza Nazemi , Amin Elshorbagy Department of Civil & Geological Engineering, University of Saskatchewan Contact: [email protected]
The warming climate intensifies the hydrological cycle. There are several evidences in Canada, and other parts of the globe, supporting that the climate change effects can alter the patterns and frequencies of extreme rainfall events. Quantifying the associated changes in the extreme rainfall due to climate change, however, exhibits a complicated modeling problem because of (1) major gaps in representing and reproducing the climate at the global and regional scales, especially with respect to extremes; (2) large uncertainties in the climate model projections and downscaling techniques; and (3) lack of reliable understanding of the rainfall distribution at finer time scales. To address these difficulties, a fully stochastic procedure to tackle the disaggregation of daily rainfall estimates into sub-daily values is proposed. By introducing the novel concept of Rainfall Distribution Function (RDF), the daily rainfall values are disaggregated using the empirical properties of the historical rainfall. The effects of seasonal characteristics and the rainfall intensity on the RDFs are evaluated and discussed. The method is validated using the historical hourly rainfall data in the city of Saskatoon. The performance of the proposed procedure, in

reproducing the extreme rainfall events at different durations and return periods, is analyzed. Based on the results of a daily weather generator and the future projections of Coupled General Circulation Model (CGCM3.1) configured with A2, B1, and A1B emission scenarios, the future daily rainfall realizations in the city of Saskatoon is disaggregated. Consequently, the chance of alteration in the extreme rainfall intensities at different durations and return periods is investigated. The results are further compared to the authors’ previous findings based on the quantile-quantile downscaling of extreme rainfall.
1C7.5 ID:6354 14:30
The vulnerability of Saskatoon’s storm collection system to the alteration in future rainfall characteristics Hossein Azianfar 1, Alireza Nazemi 2, Elmira Hassanzadeh 2, Amin Elshorbagy 2, Andrew Hildebrandt 1 1 Strategic Services Branch, City of Saskatoon 2 Department of Civil & Geological Engineering, University of Saskatchewan Contact: [email protected]
Saskatoon’s storm collection system consists of a complex network of pipes and ponds, which routes away the storm runoff, generated within the city, from private properties. The system eventually releases the storm flow with a regulated rate of outflow into the South Saskatchewan River. The system as a whole can be divided into two general categories including major and minor components. The minor component, including the underground pipe system, is designed to convey minor storm events, while the major component including the ponds, parks, and streets is designed to handle the major storm events. City of Saskatoon uses the sub-daily storm with 2-years return period for the design and analysis of the minor component. Alternatively, the major component is evaluated against both sub-daily and daily storms with 100-years return period. Recent data show that the stationarity assumption in the design storms is questionable. In fact, more intense summer and spring rainfall events are more likely to happen in Saskatoon, which can be considered as a signal for possible climate change in the region. At this juncture, it is necessary to evaluate how vulnerable the existing storm collection system would be with respect to the possible changes of the design storms. Using the Storm Water Management Model (SWMM), the quantile-quantile rainfall downscaling models developed for the city, and the future projections of Coupled General Circulation Model (CGCM3.1) with A2, A1B, and B1 emission scenarios, the vulnerability of the major and minor components of the storm system in one of the catchment areas of the city is evaluated. Accordingly, some short and long term strategies are outlined to reduce the chance of failure in the system, and to reinforce the system against the adverse effects of climate change.

Climate Change and the carbon cycle PART 2 / Changement climatique et cycle du carbone PARTIE 2
Room / Endroit (TCUP Gall. C), Chair / Président (Kirsten Zickfeld ), Date (27/05/2013), Time / Heure (13:30 - 15:00)
1C8.1 ID:6359 INVITED/INVITÉ 13:30The permafrost carbon feedback to climate change as simulated by the UVic Earth system climate model
Andrew Macdougall University of Victoria Contact: [email protected]
Permafrost soils contain an estimated 1700 Pg of carbon, almost twice the present atmospheric carbon pool. As permafrost soils thaw owing to climate warming, respiration of organic matter within these soils will transfer carbon to the atmosphere, potentially leading to a positive feedback. To quantify the magnitude of this permafrost carbon feedback the UVic Earth System Climate Model (ESCM) has been augmented to include a permafrost soil carbon pool. The model is run under four emissions pathways diagnosed from representative concentration pathways 2.6, 4.5, 6.0 and 8.5. An uncertainty envelope for the likely strength of the permafrost carbon feedback is established by varying permafrost carbon density between 16 and 26 kg m-3 and varying the equilibrium climate sensitivity (to a doubling of CO2) of the model between 2 and 4.5 oC. The additional surface warming created by the permafrost carbon feedback is independent of the emissions pathway followed in the 21st century and is estimated to be between 0.15 to 1.7 oC by 2300. The upper bound for the strength of the feedback is reached under the two less intensive emissions pathways. This counterintuitive characteristic is a consequence of the higher radiative efficiency of a unit of CO2 at lower background atmospheric CO2 concentrations. The model simulates a release of between 68 to 508 Pg C from permafrost soils by 2100. These results suggest that the climate system may already be committed to significant warming from the permafrost carbon feedback.
1C8.2 ID:6902 14:00
Feebacks to the climate system from increased shrubiness on the Arctic tundra Peter Lafleur 1, Elyn Humphreys 2 1 Trent University, Geography Department 2 Carleton University, Department of Geography & Environmental Studies

Contact: [email protected]
One of the most demonstrable effects of recent climate warming on Arctic tundra is the expansion of shrub cover, replacing herbaceous communities. This change has been widely documented in the circumpolar Arctic and is projected to increase in coming decades. It has been hypothesized that such large-scale vegetation shifts will result in important tundra-atmosphere feedbacks related to energy, water and greenhouse gas exchanges. We measured net ecosystem carbon dioxide exchange (NEE) and evapotranspiration (ET) via the eddy covariance technique at three low Arctic tundra sites in central NWT, Canada over a period of three years. The three sites represent a gradient in increasing shrub cover, with leaf area index varying almost 3-fold across the sites. NEE was negative at all sites indicating uptake of CO2. CO2 sequestration increased and ET decreased with increasing shrub cover. These patterns were strongest for mid-season fluxes and although seasonal totals followed a similar but weaker trend, inter-annual differences were confounded by variation in growing season moisture and temperature. In general, our results support the hypothesis that as shrub abundance continues to increase in tundra ecosystems the CO2 sink strength of Arctic tundra will likely increase and vapour transport to the atmosphere will decrease, both negative climate feedbacks.
1C8.3 ID:6838 14:15Estimating landscape net ecosystem exchange at high spatiotemporal resolutions based on remote sensing and eddy covariance flux measurements
Baozhang Chen University of British Columbia Contact: [email protected]
More accurate estimation of the carbon dioxide flux depends on the improved scientific understanding of the terrestrial carbon cycle. Remote-sensing based approaches for continental-scale estimation of net ecosystem exchange (NEE) may result in errors due to the coarse spatial resolution. Here we demonstrate a satellite-based method to predict NEE using Landsat TM/ ETM+ data. The up-scaling framework contains flux footprint climatology modeling, modified regression tree (MRT) analysis and image fusion. This method can improve NEE estimation at high spatiotemporal resolution. We applied it to sixteen flux sites belonging to the Canadian Carbon Program (CCP) and the US AmeriFlux program, covering forest, grass and cropland biomes. Compared to a similar method using MODIS data, our estimation is more effective for predicting landscape- and regional-scale NEE with the same temporal resolution and higher spatial resolution (30 m versus 1 km) (r^2= 0.7548 vs. 0.5868, RMSE= 1.3979 vs. 1.7497 g C m^-2 day^-1, average error = 0.8950 vs. 1.0178 g C m^-2 day^-1, relative error= 0.47 vs. 0.54 g C m-2 day^-1, fused Landsat imagery data vs. MODIS, respectively). This study demonstrates that the data-driven satellite-based NEE prediction method can be used to upscale eddy flux observations to

landscape and regional scales with high spatiotemporal resolutions.
1C8.4 ID:6735 14:30
EFFECTS OF EXPERIMENTAL DROUGHT ON CARBON DIOXIDE FLUXES AND PLANT BIOMASS OF A TREED PEATLAND IN ALBERTA Tariq Munir 1, Mendel Perkins 1, Bin Xu 2, Maria Strack 1 1 University of Calgary, 2500 University Dr. NW, Calgary, Alberta, Canada T2N 1N4 2 NAIT Boreal Research Institute, Peace River, Alberta, Canada Contact: [email protected]
The northern peatland ecosystems store large carbon (C) stocks that are susceptible to changes such as accelerated mineralization due to water table lowering expected under a climate change scenario. However, changes in vegetation growth could lead to increased biomass that may counteract soil carbon losses. We monitored vegetation communities along a microtopographic gradient (hummocks and hollows) in a natural bog (Control) and a bog that was drained (Drained) in 2001 near the town of Wandering River, Alberta (55.354646,-112.518302). The carbon dioxide (CO2) fluxes, including net ecosystem exchange (NEE), gross ecosystem productivity (GEP), ecosystem respiration (ER) and contribution of coarse root (> 1mm) respiration (Rr) to these fluxes were measured using the closed chamber method over the growing seasons (May-October) of 2011-2012. The ground-layer biomass was determined by harvesting. Overstory-biomass was estimated with allometric equations, while belowground-biomass was quantified from soil cores. The coverage of Sphagnum at the control site was significantly higher than the coverage at the drained site. Drained hummocks had significantly higher coverage of shrubs than drained hollows. Higher Sphagnum coverage at control hollows resulted in significantly higher GEP than that of drained hollows with drier vegetation, whereas the GEP between the microforms at either site remained statistically similar. Drainage increased the oxic zone in the upper peat profile and resulted in higher tree-biomass with significantly higher Rr in drained hollows than that in control hollows. There was no significant difference in Rr between control and drained hummocks. There was a significant interaction between microform type and drainage for NEE. Drained hollows became much larger sources of CO2 than control microforms while NEE from drained hummocks were similar to that of the control hummocks. These results suggest that spatial variability (microtopography) in boreal peatlands will affect how these ecosystems respond to lowered water table and subsequent changes in vegetation community induced by predicted climate change.
Groundwater's role in the hydrological cycle PART 2 / Rôle de l'eau souterraine dans le cycle hydrologique PARTIE 2
Room / Endroit (TCUP Gall. D), Chair / Président (Andrew Ireson ), Date (27/05/2013), Time / Heure (13:30 - 15:00)
1C9.1 ID:6532 13:30Influence of spatial variations of microtopography and groundwater dynamics on surface runoff and field scale hydrological connectivity in flat areas Willemijn Appels 1, Patrick Bogaart 2, Sjoerd Van Der Zee 3 1 Postdoctoral Fellow, GIWS, University of Saskatchewan 2 Utrecht University, The Netherlands 3 Wageningen University, The Netherlands Contact: [email protected]
Surface runoff generation at plot and field scales in otherwise flat areas is the result of interplay between rainfall intensity, infiltration capacity, and storage and routing characteristics of microrelief of the soil surface. Quantification and development of wetness patterns at this spatial scale is necessary to assess risk and impact of surface runoff. In this study, we compared ponding and surface runoff patterns that develop under hortonian and saturation excess conditions and quantify the effect that micro- and mesotopography have on surface runoff rates and connectivity development. We do this by applying a numerical model that couples redistribution of water over a heterogeneous soil surface with and 2D groundwater flow. Under conditions of infiltration excess, the connectivity behaviour is determined by the presence of depressions with a large area and spatial organization of microtopography in rills or channels. The presence of microdepressions suppresses the effect of the spatial variation of infiltration properties. Under saturation excess conditions, the amplitude of the microtopography is more important for the surface runoff behaviour than its spatial organization. Mesotopography affects surface runoff development under saturation excess conditions by actually rerouting ponding water over longer distances. The infiltration of water in mesotopographic depressions decreased the gradient of the groundwater table over a large part of each field, thereby decreasing groundwater flow. The storage and rerouting characteristics of the mesotopography increased the sensitivity of the fields to the effect of specific structure of rainfall series. It lead to differences in total volume of surface runoff generated per season of one order of magnitude for statistically identical rainfall timeseries, which is in agreement with the general variable occurrence of surface
runoff events in flat, well-drained, wet catchments.
1C9.2 ID:6672 13:45
Modelling subsurface stormflow and runoff generation with directed percolation theory Daryl Janzen , Jeffrey Mcdonnell Global Institute for Water Security Contact: [email protected]
Runoff generation at the hillslope scale is an important component of the hydrological cycle, and therefore needs to be accurately understood, yet recent research indicates a need to revisit traditional concepts of subsurface stormflow in certain contexts. Specifically, the picture that has emerged from studies at a number of hillslopes characterised by soil-mantled bedrock, suggests flow at the soil-bedrock interface is similar to an infiltration excess overland fill and spill scheme, though complicated by varying thickness in the soil layer. These observations indicate that as rainwater is delivered to the bedrock in a heterogeneous pattern controlled by variation in soil thickness, puddles of saturation accumulate in bedrock depressions, eventually connecting up to form spillways, and that the emergence of connectivity coincides with a characteristic threshold runoff response. Such threshold behaviour associated with connectivity is also characteristic of percolation theory, which has previously been tested in this context with some success. Here, we apply directed percolation theory to the problem of subsurface stormflow, with the aim of realistically capturing the fill and spill process of connected flowpath development and runoff generation from the soil-bedrock interface. Initial results suggest that the pattern and development of connectivity, along with the well-defined threshold response, are well predicted by the model.
1C9.3 ID:6634 14:00
Identifiability of the lateral groundwater flow regime from point scale observations of recharge and water table level at a dry sandy upland in the Boreal Forest Andrew Ireson 1, Garth Van Der Kamp 2 1 Global Institute for Water Security, University of Saskatchewan 2 Environment Canada Contact: [email protected]
The Canadian Boreal forest covers a vast area and plays an important role in the land surface-atmosphere exchanges of carbon, water and energy. Very detailed point scale observations of states and fluxes at the land-atmosphere interface have been collected over multiple decades. However, the areal coverage of monitoring is extremely sparse. Barr et al. (2012) used data from five point scale observation sites in the Boreal Plains ecozone of central Canada, each under different land cover, to calculate a water balance for the White Gull Creek basin.

Point scale outflow was calculated as the residual of a water balance, which included unsaturated zone and saturated zone storage components from measurements of soil moisture and water table elevation. Basin scale outflow was estimated by aggregating point scale estimates based on fractional land cover type over the basin. Whilst very simple, this approach was able to provide annual basin scale outflow estimates that were consistent with observations. Groundwater observations indicate that lateral groundwater flow processes are a major component of the water balance for the Pine and Fen sites, but again, areal coverage of piezometers is limited, and lateral gradients are unavailable. In this study we explore how identifiable the lateral groundwater flow regime for the Pine site is from water table records and high quality point scale estimates of net infiltration (precipitation minus evapotranspiration). The assumption is that the observations are located somewhere along a hillslope, with some (unknown) fixed depth of aquifer, with lateral flows draining to some (unknown) fixed discharge point (a lake, stream or fen). We also consider uncertainty in the controlling parameters for the saturated and unsaturated zones . The results provide insights into the hillslope scale groundwater storage and discharge processes, and can be compared with the simple estimates of Barr et al. (2012).
1C9.4 ID:6305 14:15
Capillary fringe simulation in naturally complex regional valley aquifers Ali Ameli 1, James R. Craig 2 1 PhD Candidate, Department of Civil and Environmental Eng., University of Waterloo 2 Ph.D., P.Eng, Department of Civil and Environmental Eng., University of Waterloo Contact: [email protected]
The capillary fringe zone is of great importance in discerning subsurface water exchange to streams and in the transport of contaminants. However, regional groundwater models pay little attention to the capillary fringe zone and ignore it or approximate it as a part of vadose zone. Experimental results demonstrate that flow in the capillary fringe zone can be complex in heterogeneous systems and is more similar to flow below the water table rather than in the vadose zone. A robust, accurate, mesh-less semi-analytical series solution method is used to simulate 2-D steady free boundary saturated-unsaturated subsurface flow induced by surface water bodies in naturally complex regional valley aquifers. Without mesh discretization artifacts of numerical methods for free boundary problems, the capillary fringe zone – with free boundaries at the top and bottom and a priori unknown thickness – is determined accurately, with its thickness and location obtained as a result of saturated-unsaturated flow simulation. Capillary fringe zone flow and thickness are here obtained for homogenous and heterogeneous test cases with naturally complex geometry and stratification. The series solutions satisfy the governing equation exactly over the vadose zone, capillary fringe zone, and groundwater zone, with errors within acceptable ranges across the boundaries and layer interfaces. Results show that capillary fringe properties can be complex in heterogeneous systems, particularly if the water table approaches or intersects interfaces between layers.

1C9.5 ID:6748 14:30
A groundwater and geochemical study of a saline spring-fen and adjacent freshwater bog, Northeastern Alberta Sarah Scarlett , Jonathan Price University of Waterloo Contact: [email protected]
Wetlands are the dominant landform in the Western Boreal Plains of Alberta. In the oil sands development, near Fort McMurray, wetlands cover 62% of the landscape, ~95% of which are peatlands. A saline spring-fen, containing groundwater with chemical characteristics similar to brine, was studied as a reference site for oil sand reclamation. Despite highly saline conditions, a freshwater treed bog was observed in the path of local saline groundwater flow. The purpose of this study was to identify the hydrological controls necessary to permit the development of a freshwater bog within this landscape. Groundwater trends and geochemistry were monitored across the abrupt fen-bog transition, where a hydrologic and topographic gradient from the north fen towards the bog was observed. However, bog vegetation and water chemistry suggests saline groundwater enters the bog infrequently; hydrological monitoring indicated this occurred transiently, only under flooded conditions. The average electrical conductivity and total salinity of the bog was 0.3 ms cm-1 and 0.1 ppt respectively, compared to 15.8 ms cm-1 and 9.3 ppt in the north fen. A locally elevated mineral layer was found at the interface between the fen and bog, creating a persistent groundwater mound. This phenomenon impedes the flow of saline water into the bog and instead redirects it around the bog margins, explaining the geochemical variability of the two peatlands. The existence of a freshwater bog adjacent to a saline fen can be attributed to subtle variations in substrate topography, which can greatly influence subsurface hydrology, water chemistry and ecological development.
1C9.6 ID:6357 14:45
The role of bedrock groundwater in rainfall-runoff response at hillslope and catchment scales
Chris Gabrielli University of Saskatchewan Contact: [email protected]
Bedrock groundwater dynamics in headwater catchments are poorly understood and poorly characterized. Direct hydrometric measurements have been limited due to the logistical challenges associated with drilling through hard rock in steep, remote and often roadless terrain. We used a new portable bedrock drilling system to explore bedrock groundwater dynamics aimed at quantifying bedrock groundwater contributions to hillslope flow and catchment runoff. We present results from the Maimai M8 research catchment in New Zealand and
Watershed 10 (WS10) at the H.J. Andrews Experimental Forest in Oregon, USA. Analysis of bedrock groundwater at Maimai, through a range of flow conditions, revealed that the bedrock water table remained below the soil-bedrock interface, indicating that the bedrock aquifer has minimal direct contributions to event- based hillslope runoff. However, the bedrock water table did respond significantly to storm events indicating that there is a direct connection between hillslope processes and the underlying bedrock aquifer. WS10 groundwater dynamics were dominated by fracture flow. A highly fractured and transmissive zone within the upper one meter of bedrock conducted rapid lateral subsurface stormflow and lateral discharge. The interaction of subsurface stormflow with bedrock storage directly influenced the measured hillslope response, solute transport and computed mean residence time. This research reveals bedrock groundwater to be an extremely dynamic component of the hillslope hydrological system and our comparative analysis illustrates the potential range of hydrological and geological controls on runoff generation in headwater catchments.
Prairie Lake and Reservoir Management PART2 / Gestion des lacs et réservoirs des Prairies PARTIE 2
Room / Endroit (TCUP Blair Nelson), Chair / Président (Rebecca North ), Date (27/05/2013), Time / Heure (13:30 - 15:00)
1C10.1 ID:6598 13:30
Factors Influencing Cryptophyte Abundance and Distribution in Lake Diefenbaker (Sk,Canada) Oghenemise Abirhire , Jeff Hudson University of Saskatchewan Contact: [email protected]
There were increased flows of water into Lake Diefenbaker in 2011. High abundances of Cryptophytes were present in the whole water phytoplankton samples we collected. Sampling was done on a monthly basis from June to October 2011 at 2 m depth and seasonal changes in various environmental parameters examined from nine sites along the main channel of the lake. In order to examine the spatial and temporal patterns and environmental factors affecting Cryptophyta distribution in a reservoir (Lake Diefenbaker) correlation and locally weighted smoothing analysis (LOWESS) was applied. Two genera of
Cryptophyta were identified: Crytomonas and Rhodomonas. Cryptophytes occur throughout the study and constitute 43% of the total biovolume. Cryptophyta biovolume increases steadily from the upper part of the reservoir down the middle of the reservoir where there was slight decrease in biovolume and increases from the middle portion of the reservoir down to the lower part of the reservoir. Temporally, Cryptophyte biovolume decreases gradually from the month of June to October. Cryptophyte biovolume was highly significantly correlated (p < 0.001) to water temperature and dissolved oxygen percentage and moderately significantly correlated (p< 0.05) length of the reservoir, mixing depth, total nitrogen, total phosphorus, total dissolve nitrogen and phosphorus, nitrate and ammonia. The increase in the abundance of Cryptophytes may be attributed their ability maintain their position in the water column and use up increased nutrients for rapid growth.
1C10.2 ID:6585 13:45
Temporal and spatial distribution of cyanobacteria and heterocysts in Lake Diefenbaker in relation to nutrient parameters Yakiv Ponomarenko , Oghenemise Abirhire , Kristine Hunter , David Vandergucht , Jessica Johansson , Rebecca North , Jeff Hudson University of Saskatchewan Contact: [email protected]
Lake Diefenbaker (LD) is a major reservoir on the South Saskatchewan River. Situated in an area of intensive agriculture and aquaculture, LD is at risk of eutrophication. Algal blooms have been observed in LD in 2011 and earlier. Two heterocyst-producing cyanobacterial genera, Anabaena and Aphanizomenon, have been identified in LD. Heterocysts are specialised N2-fixing cells that form in response to nitrogen (N) deficiency. Cyanobacterial N2-fixation is a significant N source in some lake systems, however its significance in LD is unknown. We have observed both N and phosphorus (P) limitation in LD. In this study, we investigated the distribution of heterocysts along the main channel of LD in June-October 2011. We also analysed the relationship between heterocyst biovolumes and nutrient (N and P) bioavailability in LD. We hypothesised that heterocyst biovolume would be higher under stronger N limitation (low N:P). Ten sites along LD were sampled monthly (June-October). Algal biovolumes (heterocysts, cyanobacteria, total algae) were calculated from cell dimensions. N (total, particulate, total dissolved, NH3, NO3
–) and P (total, particulate, total dissolved, soluble reactive) concentrations were measured. N-limitation (N-debt) and P-limitation (alkaline phosphatase activity) were assayed. Relationships between algal biovolumes and nutrient parameters were examined by calculating Pearson’s correlation. Cyanobacteria were found in 46 of 50 samples, where they constituted an average 5.4% of algal biovolume. Cyanobacterial biovolume tended to increase downstream (R=0.315, p=0.035, df=43). Heterocysts were present in 30 of 50 samples (none in June), where they constituted an average 5.6% of cyanobacterial biovolume. Heterocyst biovolume was weakly positively correlated with total N (R=0.482, p=0.007, df=28), as was total algal biovolume

(R=0.386, p=0.007, df=46). Relative heterocyst biovolume (RHB = heterocyst biovolume/cyanobacterial biovolume) had a weak but significant negative correlation with the total dissolved N:P ratio (TDN:TDP; R=–0.371, p=0.048, df=27). There was no relationship between RHB and N-debt.
1C10.3 ID:6287 14:00
Environmental factors controlling bacterial indicators in Lake Diefenbaker Rebecca North 1, Huda Khan 1, Mahbuda Asham 1, Chance Prestie 1, Darren Korber 1, John Lawrence 2, Jeff Hudson 1 1 University of Saskatchewan 2 Environment Canada Contact: [email protected]
The presence of fecal coliforms is used as an indicator of water quality as they have the potential to put human health at risk. Currently, there is no governmental monitoring of microbial pathogens in the most valuable source of freshwater in Saskatchewan, Lake Diefenbaker (LD), a large multi-purpose reservoir located along the South Saskatchewan River. The reservoir is used for agricultural irrigation, a source of drinking water, and recreation and is surrounded by agricultural land. Our objectives were to determine the potential presence of pathogens in embayments and the main channel of LD from upstream to downstream sites. We also examined the environmental factors controlling the distribution and abundance of bacteria. We measured total culturable bacteria as heterotrophic plate count (HPC), total coliforms (TC), fecal coliforms (FC), and a fecal indicator bacteria (Escherichia coli), along with a variety of physical and chemical water quality parameters. HPC were measured on standard agar plates, whereas the Colilert-18 tests were performed for the detection of TC, FC, and E. coli. From July to October of 2011, LD surface waters exceeded the TC provincial water quality objective for agricultural use 13% of the 160 times measured. These exceedances occurred in July (43%) and August (52%), primarily in embayments. Although there were no exceedances detected for FC, they were a small proportion (6%) of the TC, and the majority were E. coli. Hierarchical partitioning analyses revealed that water flow rates, temperature, and levels in the reservoir, as well as an indicator of microbial activity, had significantly greater independent explanatory power on variations in HPC and TC abundances than the other 14 water quality parameters tested. Based on these relationships, it appears that with lower flow rates, higher temperatures and water levels, as well as higher microbial activity, exceedances in bacteria levels may occur.
1C10.4 ID:6764 14:15
Investigating the use of Landsat Satellite Remote Sensing at a Large Prairie Reservoir: Developing a Model for the Present and the Past Hayden Yip , Jessica Johansson , Kristine Hunter , Chance Prestie , Jeff Hudson University of Saskatchewan

Contact: [email protected]
Lake and water resource eutrophication has become a global phenomenon. Accurate long-term monitoring data is rare or incomplete so unfortunately, determining the degree of eutrophication a water body has undergone is difficult. Starting a field-based monitoring program can be costly and time-consuming as well. The use of satellites in remote sensing applications offers a potential solution. Our research used Landsat 5 (TM instrument) and Landsat 7 (ETM+ instrument) satellites to collect imagery during the ice-off 2011 and 2012 season. Our area of interest was Lake Diefenbaker, a large reservoir in southern Saskatchewan, Canada. In-situ water quality information was acquired near-concurrently (+/- 3 hours from image collection). The water quality variables we examined were chlorophyll-a concentration (Chl-a) and Secchi Disk Depth (SDD), because changes in these variables often affect the optical properties of the water. Satellite imagery was acquired through the US Geological Survey, and radiometrically and atmospherically corrected using PCI Geomatica software. Using multiple linear regressions, we found significant correlations between reflectance and Chl-a (R2=0.40), and SDD and reflectance (R2=0.70). These correlations were then applied to the entire satellite images, so that the entire lake could be modeled for these two water quality variables for all of 2011 and 2012. Actual Chl-a values ranged from 0.98 µg/L and 16.54 µg/L, while SDDs 0.1m to 6.5m. Modeled values ranged from 1.81 µg/L to 15 µg/L for Chl-a, and 0.10m to 6.30m for SDD. A Landsat data archive that extends back three decades is being modeled as well. Preliminary analysis of the archive shows that the Chl-a model is effective at identifying past algal blooms. The completion of this archive will allow us to generate an estimated dataset that is otherwise incomplete or absent.
Connecting with the Water Economics, Policy and Governance Network / Contact avec l'économie, la politique et le réseau de gouvernance de l'eau
Room / Endroit (Hilton Commonwealth - N), Chair / Président (Diane Dupont ), Date (27/05/2013), Time / Heure (13:30 - 15:00)
1C11.1 ID:6288 13:30

The Water Economics, Policy and Governance Network
Steven Renzetti Brock University & WEPGN Contact: [email protected]
The Water Economics, Policy and Governance Network (WEPGN) partners and researchers will form a network to support and facilitate multidisciplinary research over two 3-year phases. In the first phase, research will be carried out by approximately 21 researchers, over 50 students and 30 partner organizations, organized around five research clusters: water and economy; information and decision-making; institutions and community; science and water policy and survey methodologies. The second phase will begin with a call for proposals to address emerging water issues from new perspectives. The network will contribute to knowledge mobilization through scholarly and industry publications, an annual conference, a website, webinars and other forms of media to communicate results and to maximize opportunities for real and lasting impacts. The purpose of this presentation is to introduce WEPGN to conference attendees and to open a dialogue regarding potential future collaborations between WEPGN and Members of Canada’s water industry and community. The presentation will highlight the current slate of research projects, the call for new research proposals that is underway and the ways in which partner organizations are participating in the network.
1C11.2 ID:6628 14:00
Water governance challenges and opportunities: Lake Windermere, British Columbia Natalya Melnychuk 1, Dan Murray 1, Rob De Loё 2 1 Water Policy and Governance Group 2 Department of Environment and Resource Studies Contact: [email protected]
During the past two decades in Canada a shift has been taking place in the way water resources are governed. Governments continue to have critical responsibilities for dealing with water problems, but other actors (e.g., community based organizations) increasingly are playing key roles relating to planning, monitoring, management and other functions. Additionally, collaborative approaches, where people and organizations come together to jointly define and solve problems, are becoming more common. These new approaches to water governance present both challenges and opportunities. Agreement in the literature is coalescing around ten key challenges: leadership and commitment, resources and capacity, legitimacy, accountability, actors, roles and relationships, learning, knowledge, adaptation, integrating institutions, and evaluation. How these challenges are experienced varies from place-to-place depending on local characteristics. Often discussion of these challenges in the literature tend to be both broad and theoretical, missing the importance that local

characteristics play in how they are experienced and the important question of how to address such challenges. Drawing on research conducted over two years, this paper explores how these challenges are experienced by a local community-based collaborative approach to water governance in the East Kootenay region of British Columbia. This paper examines how water governance challenges manifest practically and how to turn these challenges into opportunities for collaborative groups by combining local knowledge with insights from the environmental governance literature. It argues particularly, that in the specific context of the East Kootenay region, issues of accountability and legitimacy are especially important. Results from this project provide a practical example of how to explore, and identify opportunities to address, governance challenges in practice.
1C11.3 ID:6644 14:15
A tale of good governance: using stakeholder perceptions to evaluate water governance in the South Saskatchewan River Basin, Alberta Jenna Montgomery , Wei Xu , Henning Bjornlund University of Lethbridge Contact: [email protected]
In compliance with a global initiative utilizing participatory governance in water management, the Province of Alberta has developed a collaborative governance process involving public stakeholders and government. Introduced in 1999, the Water for Life strategy became the guide for collaborative water governance in Alberta. This strategy established three water governance partnerships to integrate public stakeholders into the decision making process: the Alberta Water Council, Water Planning and Advisory Councils, and Watershed Stewardship Groups. This strategy and partnerships are nearing integration with the Land- use Framework (LUF), which involves integrated environmental management on a regional scale. It is unsure how the integration will take place. The South Saskatchewan Regional Plan (SSRP) is nearing completion making the South Saskatchewan River Basin a relevant study area to evaluate the current process. For evaluations of water governance processes, the concept of “good governance” is commonly used. Although no widely accepted definition exists, good governance can be signified by participation, transparency, accountability, adaptability and the rule of law. The presence of these five criteria will be identified through stakeholder perceptions in southern Alberta using the Q- method. Data collected will undergo factor analysis by centroid method to extract dominant discourses found within the population surrounding the selected criteria for good governance. A qualitative analysis on participant interviews will also be used to understand the discourses. At the completion of this study it is anticipated that the current water governance process can be evaluated in terms of good governance. This information can then be used to better inform the government and water partnerships in their decision-making processes regarding water governance in Alberta as the LUF Regional Plans are adopted.
1C11.4 ID:6679 14:30
A Community Based Participatory Research Approach to the Assessment of Drinking Water Contamination in First Nations Communities Lalita Bharadwaj 1, Stanley Enebeli 1, David Sanscartier 2, Alfred Gamble 3, Celina Quewezance 4 1 University of Saskatchewan 2 Saskatchewan Research Council 3 Beardy's Okemasis First Nation 4 Yellow Quill First Nation Contact: [email protected]
The provision of safe drinking water is an issue for First Nations communities across Canada. Despite numerous initiates and targeted funding, accessibility of safe drinking water has been, and continues to be, a perennial problem. The goals of this project were to identify sources of surface and groundwater contamination in the Yellow Quill and Beardy’s and Okemasis First Nations and to assess challenges to the provision of safe drinking water. A community-based participatory research methodology was adopted for this project. Researchers and community members worked collaboratively to create knowledge on a topic practical and relevant to the community. Household surveys and sharing circles were conducted to gain an understanding of the regulatory, management and health issues surrounding the provision of safe drinking water in these communities. This was complemented by collection and analysis of key surface and ground water samples. Samples were analyzed for environmental contaminants (e.g., pesticides, dioxins, metals) and general water chemistry. Stable isotopic analysis was performed to assess the connectivity between surface water and groundwater sources. Capacity building activities included educational days and a photo-voice project conducted with Junior Ranger groups from both communities. To date, a total of 165 questionnaires have been collected. Preliminary analysis suggests community members are generally less satisfied with the quality of their drinking water than Saskatchewan residents of similar-size rural communities. Water sample analysis confirmed contamination (uranium, nitrates) in isolated private wells with consumption advisories in place for greater than 6 years. Pesticides, dioxins, and volatile organic compounds were not detected in public and private well water samples. The challenges to water regulation and management are unique to each First Nation community and extend beyond their physical boundaries. Challenges to the provision of safe drinking water for First Nations may be best addressed through collaborative consultative approaches between government and water users.
1C11.5 ID:6313 14:45
Lots of Work, Little Time: Can information sharing among organizations promote more efficient and effective policy-making?

Dan Murray 1, Rob De Loe 2 1 University of Waterloo - Water Policy and Governance Group, Waterloo, Ontario 2 University of Waterloo - Department of Environment and Resource Studies, Waterloo, Ontario Contact: [email protected]
Environmental change, health crisis and even changes in our political landscape can herald in new legislative and policy frameworks, often requiring rapid policy development. One example is the introduction of the Clean Water Act in Ontario, the Province’s response to the drinking water contamination crisis in Walkerton. Under this new policy framework 19 Source Water Protection (SWP) Regions and Areas in Ontario were tasked with developing source protection plans that identify risks to municipal sources of drinking water and developing policies to eliminate or reduce such risks. In a search for more effective policies and greater efficiencies in the policy development process all 19 SWP Regions and Areas endorsed information sharing. Formal processes were put in place to facilitate information sharing, including online tools to post and discuss draft policies. In theory, there is a great potential gain from information sharing. From previous examples and the literature it is well understood that context matters. Policies and ideas can be transferred more successfully if the political, economic, geographic and cultural contexts are similar. In this, SWP under the Clean Water Act would seem the perfect candidate for successful information sharing; all SWP Regions and Areas share the same policy framework and the regional (Southern Ontario) focus means that there are similar cultural, economic and geographical similarities. This presentation discusses the results of a project to evaluate the success of this approach to information sharing. The project, a partnership between the Water Policy and Governance Group and Conservation Ontario examines how information and policies were shared between SWP Regions and Areas, whether such processes were successful in increasing efficiency and effectiveness in the policy development process, and offers conclusions on whether this approach is a tool that can be applied to other contexts to aid policy-making in the water field.
Anthropogenically Disturbed Peatlands PART 1 / Dérangements antropologiques des tourbières PARTIE 1

Room / Endroit (Hilton Commonwealth- S), Chair / Président (Pete Whittington ), Date (27/05/2013), Time / Heure (13:30 - 15:00)
1C13.1 ID:6769 13:30Mercury biogeochemistry in the central Hudson Bay Lowland: Insights from five years of research at the DeBeers Victor Mine Brian Branfireun 1, Jonathan Price 2 1 Department of BIology, Western University 2 Department of Geography, Waterloo University Contact: [email protected]
The Hudson Bay Lowlands (HBL) is the second largest contiguous peatland in the world with a total area of approximately 320000 sq km. In light the importance of the carbon stock and predictions of significant climate change impacts, research effort has gone into studying the carbon dynamics of the HBL peatlands however there has been no research on the role of the HBL peatlands in governing the water quality or quantity of the important tributaries of Hudson Bay. The importance of mercury loading to the Hudson Bay/James Bay in terms of ecosystem and human impact also stands in stark contrast with the limited data available for major tributaries. Emerging concerns over land-use and/or climate changes in the HBL that affect peat hydrology and consequently water quality in the major rivers are receiving increased attention, but must be based solely on conjecture because of this knowledge gap. We have conducted extensive monitoring of the Attiwapiskat River and some of its tributaries draining the HBL as part of a five year research program focusing on the natural hydrology and biogeochemistry of the region, as well as the potential impacts of the development of the DeBeers Victor Diamond Mine approximately 100 km west of the James Bay coast on the Attiwapiskat River. Data on mercury, dissolved organic carbon and related water quality parameters collected as part of this research program will be presented. We have found that the fraction of groundwater contributing to total flows, degree of connectivity to peatlands related to stream order, and interannual variability in climatic factors dramatically influence the loading of mercury and methylmercury to surface waters in the HBL. There is no evidence of any systematic influence of the mining operations on surface water chemistry. Implications for other developments in the north will be discussed.
1C13.2 ID:6691 14:00
Effect of mine dewatering on the peatlands of the James Bay Lowland: the role of marine sediments on mitigating peatland drainage
Pete Whittington , Jonathan Price University of Waterloo Contact: [email protected]
The wetlands of the James Bay Lowland comprise one of largest wetland complexes in the world, in part due to the properties (thickness and hydraulic conductivity) of the marine sediment that underlay them. Dewatering of an open- pit diamond mine is depressurizing the surrounding Silurian bedrock below the marine sediments. Prior to mining it was assumed that these marine sediments would largely isolate the overlying peatlands from the depressurized regional bedrock aquifer. To assess this we instrumented a 1.5 km long transect of wells and piezometers located within the zone of the mine’s influence that crossed a sequence of bogs, fens and bedrock outcrops (bioherms). Results were differentiated between those areas with no marine sediment (near bioherms) and those with marine sediment (non-bioherm) along the transect. Between 2007 and 2010 at near-bioherm and non-bioherm locations, average peat water tables declined 71 and 31 cm, and hydraulic head declined 66 and 32 cm, in bioherm and non-bioherm locations, respectively. Gradients varied from near zero (-0.001) at the start of dewatering to -0.03 (after 5 years) in non-bioherm areas and from -0.20 to -0.45 in near-bioherm areas. These corresponded to fluxes (groundwater recharge) of approximately -0.26 mm/day and -2.1 mm/day, in non- and near-bioherm areas, respectively. Specific discharge (recharge) determined using the known mine dewatering rate and drawdown cone hydraulic head values and surface areas corresponded well with measured recharge determined in the non-bioherm transect locations. A simple rearrangement of Darcy’s Law used to calculate the specific discharge highlighted how the ratio of hydraulic conductivity to the thickness of the marine sediments can be used to assess vulnerable areas.
1C13.3 ID:6785 14:15Numerical simulation of peatland-dewatering around bedrock exposures near the De Beers Victor diamond mine, James Bay Lowlands Mazda Kompanizaire , Jonathan Price , Pete Whittington University of Waterloo Contact: [email protected]
In the James Bay lowlands, fine grained marine sediments and small vertical and horizontal hydraulic gradients ensure persistent saturation that has resulted in the development of extensive peatlands. Mine dewatering has resulted in the depressurization of the underlying bedrock in a drawdown cone that is ~5 km radius, in 2012. This has created a strong downward vertical hydraulic gradient, and caused increased recharge from the peat; in spatially distinct zones of desiccation. Enhanced recharge near bioherm exposures (ancient coral reef structures superimposed on the limestone bedrock) where the thickness of marine sediment layer is smaller or approaches zero, the dewatering rate of the peat layer is significantly higher than the surrounding areas. There are numerous bioherm exposures in depressurization zone around the Victor mine, and determining how they influence the rate, extent and nature of dewatering is an important issue in the assessment of the impact of mine.
In this study the vertical flow rate from the peat layer to the bedrock around the Northern Bioherm exposure, during May to July 2012, were simulated by using HYDRUS 3D. In this simulation the gradual decrease of hydraulic conductivity in the peat layer, presence of a weathered upper bedrock layer (with 2m thickness) , the development of a hydraulic gradient caused by mine dewatering and surface recharge due to precipitation and evapotranspiration were taken into account. In this simulation the hydraulic head in 20 observation bore holes and wells on and around the bioherm were considered. The simulation suggests a weathered layer at the top of the bedrock, with hydraulic conductivity of about 0.144mm/day much less than that of the main limestone aquifer. The recharge rate in annular ring radial distance of about 100 to 120 m is about 2.2mm/day and in farther distance is about 1.13mm/day. The simulations also suggest there is a solution cavity near the southern edge of the Northern bioherm with hydraulic conductivity much higher than that of the weathered bedrock. By reserving about 900m2 area for solution cavity the recharge rate through it is about 3mm/day.
1C13.4 ID:6516 14:30
Modelling Sphagnum Moisture Stress in Response to 21st Century Climate Change Paul Moore 1, Nicholas Kettridge 2, Paul Morris 3, James Waddington 1 1 McMaster University 2 University of Birmingham 3 University of Reading Contact: [email protected]
Sphagnum is associated with wet habitats such as northern peatlands, which may be vulnerable to enhanced 21st century drought due to climate change. We adapted a physically based, 1-dimensional (vertical) water-balance model to investigate the role of topographic position and depth-dependence of hydrophysical properties on Sphagnum moisture stress response to current and projected climate conditions in a southern boreal peatland. Water table (WT) level was shown to have a strong control on soil water pressure (ψ), and thus on Sphagnum moisture stress. As a result of the close correspondence between laboratory measured near-surface peat hydrophysical properties for hummocks and hollows used to parameterize our model, microtopographic position was shown to have a greater impact on Sphagnum moisture stress. Model behaviour suggests that, while ψ maintains equilibrium-profile values relative to the WT level for relatively shallow values, surface ψ becomes non-linearly related to WT level below a value of approximately -0.4 m, thus greatly increasing the likelihood of desiccation under future climate scenarios where growing season soil moisture deficits are projected to increase. The results from our simulations demonstrate the need for a better understanding of Sphagnum moisture-stress dynamics. The simulated range of instantaneous and cumulative moisture-stress for hollows under future climate conditions closely corresponds to the range exhibited by

hummocks contemporarily. Therefore, in order to assess the competitive advantage of various Sphagnum species to future climate conditions, more data is needed to better inform a physiological ψ-based moisture-stress threshold, the evolution of the stress response to increasing levels of desiccation and its subsequent recovery dynamics.
Radar Meteorology and Applications PART 2 / Météorologie radar et applications PARTIE 2
Room / Endroit (Hilton Prince Albert), Chair / Président (Frédéric Fabry ), Date (27/05/2013), Time / Heure (13:30 - 15:00)
1C14.1 ID:6707 INVITED/INVITÉ 13:30Using radar echo statistics to improve quality of radar data and its representation Norman Donaldson , Sudesh Boodoo , Robert Paterson Environment Canada Contact: [email protected]
Products from weather radars suffer systematic issues that can only be identified with long term spatial statistics. Identification of these issues leads both to potential amelioration of the underlying problems and to a better representation of quality to users. For Environment Canada radars statistics are used to recognize permanent issues like partial blockage, due to things like trees and buildings, or severe, irreparable clutter, such as caused by mountains or large buildings. Areas with moving clutter, such as water surfaces or wind turbines, can be given special data treatment that does not involve Doppler filters. Our analysis examines the distribution of radar measurements at the pixel level, from which parameters such as persistence, averages, and variability can be mapped. Distributions can be produced weekly from operational products and then rolled together into monthly or seasonal distributions. Additional restrictions can focus analysis on periods of either widespread precipitation or negligible precipitation, for specific applications such as blockage assessment or assessing contributions from permanent ground clutter
1C14.2 ID:6389 14:00Characterization of Weather Radar Specific Data User Requirements Qian Li , Alexander Zucconi , Kim Gravelle , Chris Hampel , Gilles Fournier ,

Marie Macphee , Jim M.c. Young Meteorological Service of Canada, Environment Canada Contact:
Weather radar is an essential tool for the detection and short-term prediction of impending severe and hazardous weather. The infrastructure of the current Canadian weather radar network is aging, and has encountered more frequent operational problems. In January 2012, the Minister of the Environment announced a $45.2 million renewal funding for improving performance and upgrading to next-generation technology. In support of the radar renewal activities, defining operational weather radar requirements has been recognized as the essential first step of the strategic network planning and design process. Beginning in 2011, the requirements gathering process was developed jointly by the Strategies, Planning and Performance (SPP) section of the Weather and Environmental Monitoring (WEM) Directorate, in cooperation with the National Radar Program (NRP) and radar experts from the Science and Technology (S&T) Directorate. It involves several steps including collection, analysis, documentation, validation, prioritization, and ongoing management. For the requirements gathering initiative, radar survey questionnaires were designed and distributed to various identified priority user groups within Environment Canada: Prediction, Services, Numerical Weather Predictions, Hydrological Modelling and Applications, Science Sections and National Labs, and relevant Signature Projects. The survey questionnaires asked each user group to describe their current radar data usage, and to define current requirements, perceived discrepancies, as well as their anticipated future needs. In addition, face-to-face meetings, webinars, and telephone interviews were conducted to elicit and validate information from users. In this talk we will provide an overview of the requirements documented to date, and present the analysis results from the following specifications: 1) radar characterization, including the needs for spatial coverage, spatial and temporal resolution, data quality, latency and consistency, system reliability; 2) radar data, products and training needs; 3) tools to process, disseminate and display radar data and products.
1C14.3 ID:6627 14:15
Environment Canada’s Operational Weather Radar Scanning Experiment
David Hudak , David Sills , Norman Donaldson , Glenn Robinson , Janti Reid Environment Canada Contact: [email protected]
The repeat scan cycle of Environment Canada’s (EC) operational C-band weather radar network and the corresponding time resolution on the resultant data products is currently 10 minutes. An experiment was carried out at the King

City radar located just north of Toronto during the summer of 2012 to alter this scanning pattern. The main change was the addition of an extra low level PPI scan to the 10 minute cycle with a compensating reduction in the number of angles in the standard volume scan. The EC national radar processing software (Unified Radar Processor) was modified to process and display the new data stream. The result was that low level reflectivity and Doppler wind and derived wind products such as the mesocyclone product were available every 5 minutes. The main advantage of the new strategy was more timely low level Doppler wind information for severe weather forecasting applications. The disadvantage was that integrated products derived from volume scan information such as vertically integrated liquid (VIL) and the bounded weak echo region (BWER) had coarser resolution. The relative merits of these factors will be discussed in the presentation. An overview will also be given on data acquisition and scanning strategies in an international context using the US, Germany and the UK radar networks as examples. Further potential enhancements to radar scanning and data acquisition at EC with the next generation of radar signal processors will be described.
1C14.4 ID:6522 14:30
A 2D-VAR data assimilation scheme for radar reflectivity with implicit diffusion operator as an anisotropic error correlation matrix Majid Fekri 1, Luc Fillion 2, Man. K. Yau 1 1 Department of Atmospheric and Oceanic Sciences, McGill University, Montréal 2 Meteorological Research Division, Environment Canada Contact: [email protected]
The assimilation of radar reflectivity data into NWP models requires careful considerations due to the intricate nature of the background error covariance. The univariate matrix of error correlations for precipitation is known to have anisotropic and heterogeneous correlations in space. In our previous study, the forecast error of hourly accumulated precipitation was investigated by comparing it with the mosaic of radar reflectivity observations over the eastern part of continental North America. It was found that the autocorrelation function of the background error can be parameterized by a 2D elliptical Gaussian distribution with calculable semi-major and minor axis, and directional orientation. This parameterization method allowed for the creation of a background error correlation matrix based on the forecast field itself. An incremental 2D variational data assimilation method is designed for incorporating the specific error correlation matrix of accumulated precipitation. Based on the Lorenc preconditioning, an operator and its adjoint can be used to substitute for the role of the B-matrix in the variational cost function and its gradient. An implicit 2D diffusion operator based on the Crank-Nicolson scheme is used to create the Gaussian elliptical correlations in space. The self-adjointness of the diffusion operator is first examined with the Lagrange test and the gradient test, to ensure

the convergence of the optimization algorithm. Second, a single observation data assimilation test is performed to identify the propagation of information according to the desired error correlations. The 2D data assimilation method is then applied with the NWP precipitation forecast as background, and the mosaic of radars as observations. The analysis obtained from the 2D-VAR with an anisotropic error covariance matrix will be compared with the analysis of another 2D-VAR with fixed variance and isotropic error correlations. The details of our method and the results will be presented.
1C14.5 ID:6937 14:45
Discussion on radar QPE Frédéric Fabry 1, Norman Donaldson 2 1 McGill University 2 Environment Canada Contact: [email protected]
This will be an open discussion led by Fréderic Fabry and Norman Donaldson.
Symposium on the Mathematics of Planet Earth PART 3 / Colloque sur les mathématiques de la planète Terre PARTIE 3
Room / Endroit (TCUP Salon A), Chair / Président (Adam Monahan ), Date (27/05/2013), Time / Heure (15:30 - 17:00)
1D1.1 ID:6791 INVITED/INVITÉ 15:30
Mathematical problems associated with atmospheric data assimilation and weather prediction
Pierre Gauthier Université du Québec à Montréal Contact: [email protected]
Several sectors of human activities rely on weather forecasts to plan in preparation of high impact weather events like snow storms, hurricanes or heat waves. Climate studies are needed to make decisions about the long-term development in agriculture, transport and land development. Observing and modeling the evolution of the atmosphere is needed to provide key reliable information for both weather prediction and climate scenarios. This paper gives

an overview of the scientific research underlying the development and validation of numerical models of the atmosphere and the monitoring of the quality of the observations collected from several types of instruments. A particular emphasis will be given to data assimilation which establishes a bridge between numerical models and observations. The mathematical problems arising in atmospheric research are diverse as the problem is one of stochastic prediction for which errors in both the model and the observations need to be considered and estimated. Atmospheric predictability is concerned with the chaotic nature of the nonlinear equations that govern the atmosphere. Ensemble prediction is one area that has expanded significantly in the last decade. The interest stems from the necessity to evaluate more than just a forecast: it aims at giving an estimate of its accuracy as well. This brings up more questions than answers.
1D1.2 ID:6443 16:00
Four-dimensional tensor equations for a classical fluid in an arbitrary gravitational field Martin Charron , Ayrton Zadra , Claude Girard Recherche en prévision numérique atmosphérique Contact: [email protected]
Tensor equations have the appealing property of keeping their form in all coordinate systems, a property known as covariance. If the equations of motion of a given system are available in tensor form, one may transform those equations from one coordinate system to another by systematically following a set of well-defined transformation rules. A four-dimensional tensor formalism suitable for the equations of motion of a classical fluid in the presence of a given external gravitational field is presented. The formalism allows for arbitrary time-dependent transformations of spatial coordinates. Some well-known conservation laws are derived in covariant form. The metric tensor and the associated Christofel symbols are calculated for coordinate systems useful in meteorology.
1D1.3 ID:6668 16:15
Comparison of hydrostatic and nonhydrostatic mesoscale processes.
Muhammad Awais University of Victoria Contact: [email protected]
This work gives a study of the nonhydrostatic mesoscale processes. Comparison is made between the results of both hydrostatic and nonhydrostatic mesoscale processes. To do so, a stably stratified, two-dimensional, Boussinesq, nonrotating, inviscid fluid experiencing a thermal forcing is considered under both hydrostatic and nonhydrostatic assumptions. Techniques of Fourier and Laplace transform are considered to solve the governing equations. Numerical computing via MATLAB is done to provide us with the numerical results. It has been noticed that the hydrostatic assumption significantly alters the results. For the case of
constant background, the propagation of the gravity wave, which doesn’t exit under hydrostatic assumption, is present for nonhydrostatic case.
1D1.4 ID:6855 16:30
Modelling sediment resuspension and the effect of topography Jason Olsthoorn , Marek Stastna University of Waterloo Contact: [email protected]
The study of lake bottom sediment pickup is an active area of study. Indeed, sediment transport within the bottom boundary layer has been shown to be highly complex. A thorough literature survey reveals that, to date, no model for sediment resuspension exists which captures all of the physical scales of interest. Following the approach of Blanchette et al. (2005), we model the macroscopic properties of particulate ejection into the water column assuming a continuum model for sediment concentration. Using a pseudospectral incompressible Navier-Stokes solver, we numerically model the shear induced pickup of lake bed particulate as a result of the motion of internal solitary waves in a continuously stratified domain. By varying the lake bottom topography, we are able to induce significant ejection into the water column. We observe that given a high enough shear, a separation bubble forms and bursts resulting in sediment resuspension. While previous work has studied shear induced pickup, we are the first to actively couple an internal solitary wave with an explicit model for sediment resuspension. This work has significant implications for the study of biogeochemical cycles and the deformation of small-scale bathymetric features of lakes and oceans. Blanchette, F., M. Strauss, E. Meiburg, B. Kneller, and M. E. Glinksy (2005), High-resolution numerical simulations of resuspending gravity currents: Conditions for self-sustainment, J. Geophys. Res., 110, C12022, doi:10.1029/2005JC002927.
1D1.5 ID:6349 16:45
Adding Newtonian cooling and Rayleigh friction to remove singularities in the katabatic-flow models
Ruping Mo National Lab for Coastal and Mountain Meteorology, Environment Canada, Vancouver, BC V6C 3S5 Contact: [email protected]
The classical Prandtl and layer-averaged models for katabatic winds are revisited in this study. It is shown that the radiative cooling effect in these models cannot be balanced by the vanishing adiabatic heating effect in the limit of zero slope angles or adiabatic lapse rates. Under such circumstances, a steady state of the katabatic flow is physically inadmissible. Mathematically, the unbalance in the

model gives rise to various singularities in the equilibrium solutions. It is demonstrated that these singularities can be avoided by including a Newtonian cooling and a Rayleigh friction in the models. The physical implications and justifications of including these thermodynamic damping mechanisms are further discussed.
General Hydrology PART 3 (Woo Speaker) / Hydrologie en général PARTIE 3 (Conférence Woo)
Room / Endroit (TCUP Salon B), Chair / Président (Sean Carey ), Date (27/05/2013), Time / Heure (15:30 - 17:00)
1D2.1 ID:6529 15:30Spatiotemporal variability of saturation excess surface runoff in flat fields due to interactions between meso- and microtopography Willemijn Appels 1, Gert-Jan Noij 2, Harry Massop 2 1 Postdoctoral Fellow, GIWS, University of Saskatchewan 2 Alterra, Wageningen UR, The Netherlands Contact: [email protected]
Surface runoff is a rare phenomenon in flat agricultural lowland fields in temperate climate regions. Infiltration excess surface runoff events occur seldomly because average precipitation intensities are low and the drainage design in these areas is aimed at the prevention of saturation excess conditions. In winter, however, wet conditions occur frequently. Spilling of puddles and depressions potentially provide large nutrient loads to ditches and streams, especially for phosphorus. The goals of this study were to explain differences in measured surface runoff volumes and nutrient loads of surface runoff between fields on the basis of characteristics of their meso- and microtopography, and to investigate the representativeness of plot scale measurements for the surface runoff behaviour of the whole field. The surface runoff measurements were performed at grassland, an arable field and a horticultural field. We combined these measurements with detailed topographic data at meso- and microscale. The nutrient concentrations measured in the surface runoff were high, especially on the grassland. The differences in nutrient loads were caused both by differences in surface runoff volume and in nutrient concentrations in the soils of the fields. However, the overall estimated yearly nutrient load from surface runoff was lower than expected from similar studies. We performed simulations with a model for coupled instantaneous redistribution of water over a heterogeneous
surface and infiltration and 2D groundwater flow. The simulations showed how ponding evolved unevenly throughout the fields, suggesting different times of activation of the flow routes within the fields. The effect that microtopography has on the activation of these flow routes was found to differ with the underlying mesotopography of the fields resulting in either enhanced routing or enhanced storage effects.
1D2.2 ID:6455 15:45
Winter flow testing of the Upper Qu’Appelle River Karl-Erich Lindenschmidt 1, Heather Wilson 1, John-Mark Davies 2, Jeff Sereda 2, Lyle Hosler 2 1 Univeristy of Saskatchewan 2 Saskatchewan Water Security Agency Contact: [email protected]
The Upper Qu’Appelle River conveys water from Lake Diefenbaker to Buffalo Pound Lake, which is a major source of water for domestic, industrial and recreational use in southern Saskatchewan, in particular the Regina - Moose Jaw region. The flow along the river is regulated by releases through the Qu’Appelle River Dam on the Gordon McKenzie Arm of Lake Diefenbaker. Water demand continues to increase with time and additional conveyance capacity may be required during the winter months. Flows in the Upper Qu’Appelle are usually below 2 m3/s from December to March; however, an increase in this flow rate will be needed to meet future water demands. A winter flow test was carried out during the 2012-13 winter to determine the Upper Qu’Appelle River’s conveyance capacity at higher flows under ice (up to 4 m3/s) and to monitor ice cover behaviour with increased and fluctuating flows. The ice cover was monitored from the ground at regular intervals throughout the winter with surveys of water level profiles and ice thickness measurements. RADARSAT satellite imagery complemented the monitoring to capture a larger spatial extent of the river. A deterministic modelling exercise is being carried out to simulate the degree of ice cover thickening and backwater staging during freeze-up at various discharge scenarios. An empirical model helped track and predict ice thickness and thickening rates during the course of the flow test. Erosion may also be a concern with increased flows under ice conditions. Channel erosion could contribute to siltation in Buffalo Pound Lake. Hence, water quality sampling accompanied river ice monitoring along the Upper Qu’Appelle River, which included analyses of suspended sediment and nutrients. Dissolved oxygen measurements served as a rough proxy for aquatic ecosystem health.
1D2.3 ID:6401 INVITED/INVITÉ 16:00
Arctic Hydrology: Complexities, Advances and Challenges
Philip Marsh Environment Canada - National Hydrology Research Centre

Contact: [email protected]
Although there is a new urgency to understand and predict the hydrology of arctic regions for both water resource needs and to assess the impact of climate change, our understanding of and ability to predict the hydrology of arctic regions is not sufficient to meet society’s needs for the following reasons. The hydrology of arctic regions is complicated by the influence of snow, ice and permafrost, and the resulting need to consider the close coupling of energy to the hydrological system. In addition, the arctic landscape is typically extremely heterogeneous, thus putting a significant demand on the need for high resolution data sets and models. Arctic hydrologists are also hindered by the remoteness, high cost of access, and extreme weather that make observations very difficult or impossible. Finally, data records are typically of short duration and with the rapidly changing climate, a stationary data record required to test models is often not available. This presentation will outline our past advances in the field of arctic hydrology and the challenges we face to make the required future advances.
Climate Change Modelling and Water Resources PART 1 / Modelisation du changement climatique et ressources hydriques PARTIE 1
Room / Endroit (TCUP Salon C), Chair / Président (Howard Wheater ), Date (27/05/2013), Time / Heure (15:30 - 17:00)
1D3.1 ID:6314 15:30
Temporal and spatial variations in hydroclimatic variables affecting streamflow across western Canada: a CROCWR component Hayley Linton 1, Terry Prowse 1, Yonas Dibike 1, Barrie Bonsal 2 1 University of Victoria/WCIRC, Victoria, BC 2 National Hydrology Research Centre, Saskatoon, SK Contact: [email protected]
This research is conducted as one portion of a larger hydroclimatic study titled Climatic Redistribution of Canada’s western Water Resources (CROCWR) which attempts to quantify redistribution of water resources across western Canada, including analysis of streamflow patterns in western Canadian and northern rivers, and study of the synoptic patterns associated with climatic variability. The CROCWR study area includes the majority of western Canada, from the Pacific
coast of British Columbia to the border between Saskatchewan and Manitoba, and from the Canada-United States border to the Mackenzie River delta. Changing climate will have considerable effects on the hydrological cycle, including changes in temperature and precipitation that modify the snow fall and snow melt patterns which contribute to streamflow in western Canada. Studying such changes in snow accumulation and snow melt can help to provide understanding of how changing climate may affect water availability. The research examined the spatial and temporal variations in climatic variables affecting streamflow across western Canada, including analysis of historical trends in temperature, precipitation, snow depth, and snow melt. Analysis included the use of gridded, observed data for watershed basins in the study region using various methods of spatiotemporal analysis, including the Mann-Kendall non-parametric test and tests for spatial autocorrelation. Large scale spatial patterns are also assessed through the use of pixel trajectory analysis, which provides a visual representation of data over the entire study area. The results from this research will be useful in determining implications of hydroclimatic variability and change on water resources within the study area.
1D3.2 ID:6315 15:45
Synoptic-scale circulation characteristics controlling water availability in western canada: A CROCWR component Brandi Newton 1, Terry Prowse 1, Barrie Bonsal 2 1 University of Victoria/WCIRC, Victoria BC 2 National Hydrology Research Centre, Saskatoon SK Contact: [email protected]
The CROCWR project integrates several hydroclimatic components to evaluate the climatic redistribution of Canada’s western water resources. This research evaluates the characteristics of dominant synoptic circulation patterns as they relate to the spatial and temporal distribution of water availability. The headwater source for the primary tributaries to the Mackenzie River, Canada’s largest freshwater contribution to the Arctic Ocean, and the Saskatchewan River, the primary water resource for the agricultural sector of the Prairie Provinces, is located on the eastern slopes of the Rocky Mountains. The majority of the discharge on these rivers originates as winter snowpack released from frozen storage during spring freshet. Summer streamflow is influenced by basin-wide hydroclimatic variables including precipitation and evapotranspiration. Interannual variability of hydroclimatic variables is influenced by large-scale atmospheric circulation patterns, and classifying these patterns facilitates analysis to determine dominant patterns that affect surface climate. Daily winter (Nov-Apr) and summer (May-Oct) synoptic circulation patterns are classified using Self-Organizing Maps (SOM), an iterative training process that uses competitive and cooperative learning to cluster and project data onto an organized array. Synoptic patterns are evaluated for relationships with high/low precipitation and temperature, as well as the Standardized Precipitation Evapotranspiration Index (SPEI), a multiscalar drought index. Synoptic circulation
patterns that occur with an increased/decreased frequency during various phases of El Nino-Southern Oscillation (ENSO), the Pacific Decadal Oscillation (PDO) and the Pacific North American (PNA), and North Pacific Index (NP) are also identified. Understanding and forecasting water availability are fundamental for the management of resources, flood mitigation, and an indicator of climate change.
1D3.3 ID:6340 16:00
Spatio-temporal changes in western Canadian water availability: A CROCWR component Allison Bawden 1, Donald Burn 1, Terry Prowse 2 1 Department of Civil & Environmental Engineering, University of Waterloo 2 Water and Climate Impacts Research Centre, Environment Canada and University of Victoria Contact: [email protected]
Climatic variability and change can have severe impacts on the hydrology of a watershed, affecting water security in certain locations. The CROCWR (Climatic Redistribution of Canada’s Western Water Resources) project is a hydro- climatic study concerned with developing methods and tools for quantifying changes in the availability of water resources in western Canada – an area of highly contrasting hydro-climatic regimes and overlapping water-use and jurisdictional borders – under past, current, and future climate scenarios. The CROCWR project involves spatio- temporal analyses of streamflow allocations, the climatic controls contributing to shifting snow melt patterns and hence affecting flow regimes, and the atmospheric circulation patterns associated with climatic variability in this region. The study area includes a collection of 24 watersheds and sub-basins located between the Canada-US border and the Arctic Ocean that are believed to adequately characterize the overall effects of climatic variability and change on western Canadian rivers over the past 50 years. This paper includes an analysis of hydrologic trends in monthly, seasonal, and annual streamflow by means of the Mann-Kendall non-parametric test. Hydrological regionalization and spatial patterns are identified using Principal Component Analysis (PCA), and contrasts between northern and southern latitudes are evaluated. In an attempt to quantify the effect of climate change on streamflow variability, relationships between hydrologic trends and meteorological drivers are investigated through correlation analysis. In addition, streamflow-teleconnection associations are examined using four Pacific-prominent climate indices. The development of hydro-climatic modelling, and the results of this analysis, will provide government and industry water resource managers and policy makers with new tools essential for the management of western Canadian watersheds.
1D3.4 ID:6650 16:15
On the decadal characteristics and bivariate dependency of the annual headwater volume and timing in the South Saskatchewan River Basin
Alireza Nazemi 1, Kwok Pan Chun 1, Muluneh Mekonnen 1, Howard Wheater 2 1 The Global Institute for Water Security, University of Saskatchewan 2 Canada Excellence Research Chair in Water Security, The Global Institute for Water Security Contact: [email protected]
Snowpack and snowmelt processes in the Rocky Mountains control the headwater inflows that are the dominant source of downstream flows in the South Saskatchewan River (SSR), which is the single most important water resource for the Prairie Provinces. However, significant variations have been recently observed in the properties of snowpack and snowmelt in the region. Understanding the consequent variations in the headwater inflows is of critical importance for regional water supply. From the water allocation perspective, two key properties of the annual hydrograph are the annual flow volume and the annual peak timing, given the intensive downstream agricultural water use, concentrated in a short growing season. By considering 74 years of weekly data for six natural and three regulated inflows to the SSR, we investigate changes in the empirical properties and the joint dependency of the annual flow volume and the peak timing at decadal and multi-decadal time scales. Our results show that large-scale climate characteristics can have an important influence on the headwater inflows. In particular, we propose that the Pacific Decadal Oscillation (PDO) is a driver of the trend in the annual inflow volume of the natural headwaters. The dependency between the annual flow volume and timing is insignificant in the case of natural inflow at the weekly time scale. In contrast, the dependency between annual inflow characteristics increases when upstream regulation is in place. Our findings are important from the perspective of regional water supply in the face of climate variability. The results also provide a framework for evaluating the performance of hydrological models in reproducing the characteristics of headwater inflows into the SSR.
1D3.5 ID:6411 16:30Recent hydrological changes of Lake Athabasca Kabir Rasouli 1, Marco Hernández–henríquez 2, Stephen Déry 2 1 University of Waterloo 2 UNBC Contact: [email protected]
The Lake Athabasca drainage area in northern Canada encompasses ecologically–rich and sensitive ecosystems, vast forests, glacier–clad mountains, and abundant oil reserves in the form of tar–sands. The basin includes the Peace–Athabasca Delta recognized internationally by UNESCO and the Ramsar Convention as a biologically–rich inland delta and wetland that are now under increasing pressure from multiple stressors. In this study, streamflow variability and trends for rivers feeding Lake Athabasca are investigated over the last half century. Hydrological regimes and trends are established using a robust regime shift detection method and the Mann–Kendall (MK) test, respectively. Results show that the Athabasca River, which is the main contributor to the total lake
inflow, experiences marked declines in recent decades impacting lake levels and its ecosystem. From 1960 to 2010 there has been a relatively significant reduction in lake inflow and a significant recession in the Lake Athabasca level. Our trend analysis corroborates a previous study using proxy data obtained from nearby sediment cores suggesting that the lake level may drop 2 m to 3 m by 2100. The lake recession may threaten the flora and fauna of the Athabasca Lake Basin and negatively impact the ecological cycle of an inland freshwater delta and wetland of global importance.
1D3.6 ID:6747 16:45
Impact assessment of streamflow in prairie rivers using drought indices Sunil Gurrapu 1, Aston Chipanshi 2, David Sauchyn 2, Allan Howard 1 1 Mr 2 Dr Contact: [email protected]
Growing demand for water resources on the Canadian prairies has increased the region's vulnerability to hydrological drought. Recent studies have linked the occurrence of droughts to the increasing temperatures across the prairies during the past few decades and future projections of climate suggest that severe droughts across the prairies are likely. In addition, proxy records suggest that droughts of greater severity and longer duration occurred in the past across the prairies. In spite of widespread nature of droughts in the past, present and future, it is extremely difficult to find a suitable index to define drought. Because droughts are associated with climate processes, the majority of the drought indices such as the Palmer Drought Severity Index (PDSI) and the Standardized Precipitation Index (SPI) are defined in terms of meteorological and hydrological variables. In spite of their widespread use, these indices have shortcomings and therefore newer indices such as the Standardized Precipitation-Evapotranspiration Index (SPEI) are becoming popular. The SPEI takes into account the effect of temperature on drought. In this study, we compared the SPEI with the SPI in different climate zones of Canada with a view to understanding which of the two indices best represents drought conditions and the associated impacts. Both indices were also assessed in terms of how they represent the monthly mean streamflow in selected prairie rivers. There was no significant difference between SPEI and SPI in assessing drought conditions across Canada; mean bias error for all the stations were in the range of 0.05 to -0.05, however drought severity was captured best by the SPEI than SPI probably because of the temperature effect on the index. Monthly mean streamflow in most of the Prairie rivers are significantly correlated with the SPEI at 6- and 9-month timescales and these were statistically significant.

Observation and modeling of soil moisture / Observation et modélisation de l'humidité du sol
Room / Endroit (TCUP Salon D), Chair / Président (Aston C. Chipanshi ), Date (27/05/2013), Time / Heure (15:30 - 17:00)
1D4.1 ID:6486 15:30A preliminary comparative analysis of the Versatile Soil Moisture Budget (VSMB) results with the in-situ measurements from the Kenaston experimental sites Aston Chipanshi 1, Jessika L’heuxeux 2, Howard Allan 2, Smith Craig 3, Champagne Catherine 2, Toth Brenda 3, Zhang Yinsuo 2, Waldner David 2, Ehram James 2 1 Agriculture and Agri-Food Canada, Agri-Environment Services Branch 2 Agriculture and Agri-Food Canada 3 Environment Canada Contact: [email protected]
A project was recently completed under the AAFC Sustainable Agriculture Environmental Systems (SAGES) initiative which in part integrated existing soil resource attribute information, soil moisture and crop measurement with modeling techniques to develop methods and best practices to deliver near real time soil moisture and agro-climatic monitoring information at the regional landscape. To meet this objective, in-situ soil moisture monitoring sties were established in Manitoba (9 sites), Ontario (5 sites) and Saskatchewan (4 sites). The in situ soil moisture measurements have several other applications including validation of the top layer moisture values using the space based platforms such as radar and microwave, providing baseline data for spring run-off simulation, source for initial soil moisture when simulating crop growth and development and source for validating the root zone soil moisture for drought analysis. In this presentation, we focus on the validation of the root zone soil moisture for drought analysis using the in situ soil moisture values collected from three sites in 2012 near Kenaston, Saskatchewan. Each of these three sites is located in grass pastures adjacent to crop land. The in situ soil moisture values were collected using Stevens Hydra Probes from 5, 20, 50, 100, and 150 cm depths. Each level had three replicates to capture the variability in sensor readings and account for soil heterogeneities. The dielectric output from sensors was converted to volumetric soil moisture measurements using both the factory and laboratory derived calibration constants. The modelled soil moisture down to 1m was obtained from the Versatile Soil Moisture Budget (VSMB). Climate variables (daily maximum and minimum temperature, total daily precipitation and solar radiation) at the sites or nearby locations were used to drive the VSMB. The

laboratory derived soil physical parameters (e.g. bulk density and moisture holding capacity of the layer) were used to describe the soil profile. Preliminary results showed that there was good agreement in trend between in situ observations and modelling results during the growing season. A plan is being developed to ensure the long-term viability of the sites and to integrate data collection from these site and others from interested agencies into a single access portal for all users. Research is underway to improve the calibration of the in situ sensors using field methods. As well, the VSMB inputs are being examined to ensure that specific crop coefficients are used in the simulations of the key processes such as evapotranspiration and soil moisture extraction by roots.
1D4.2 ID:6839 15:45
The Canadian Space Agency and Water Resources Management in Canada Robert Saint-Jean , Thomas Piekutowski , Paul Briand Canadian Space Agency Contact: [email protected]
Proper management of Canadian water resources is a responsibility of all levels of government, industry and individual citizens. The monitoring of soil moisture and freeze/thaw properties of the soil over a country as large as Canada is a challenging task. To provide quality information on these critical resources for Canadians, the Canadian Space Agency (CSA) is pursuing several agreements with international partners to allow Canadian scientists an access to the most accurate satellite data available. As a cooperating member of ESA, Canada is an active participant in the Soil Moisture and Ocean Salinity (SMOS) mission. SMOS was launched on November 2, 2009 and was designed to map sea surface salinity, monitor soil moisture on a global scale and provide observations over snow and ice-covered regions. The CSA has invested in this mission and provided support to the scientific exploitation of SMOS data through its Government Related Initiative Program (GRIP). Five Canadian teams have been approved by ESA to receive data for Calibration, Validation and Scientific Applications. For the Soil Moisture Active Passive (SMAP) mission, planned for launch in October 2014, the CSA is collaborating with Environment Canada (EC) and with Agriculture and Agri-Food Canada (AAFC) to support the Canadian Science and Applications Plan for NASA’s SMAP mission. Canadian scientists from EC, AAFC and five Canadian universities are participating in pre- and post-launch data calibration/validation, algorithms development activities as well as testing, demonstration, and implementation of SMAP data and algorithms for Canadian regional products. SMAP will also be used to monitor the Freeze/Thaw state of permafrost. This presentation will focus on these missions, highlighting their scientific interest and their benefits to Canadians and how the CSA is supporting Canadian scientists (from government agencies and universities).
1D4.3 ID:6646 16:00
Overview and preliminary analysis of the data sets collected over agricultural regions during the Soil Moisture Active Passive Validation Experiment in 2012 (SMAPVEx 2012) Aaron Berg 1, Justin Adams 1, Stephane Belair 2, Paul Bullock 3, Andreas Colliander 4, Michael Cosh 5, Thomas Jackson 5, Ramata Magagi 6, Heather Mcnairn 7, Rotimi Ojo 3, Tracy Rowlandson 1, Grant Wiseman 7 1 University of Guelph 2 Environment Canada 3 University of Manitoba 4 NASA Jet Propulsion Laboratory 5 US Department of Agriculture 6 University of Sherbrooke 7 Agriculture and Agri-Food Canada Contact: [email protected]
The Soil Moisture Active Passive Validation Experiment (SMAPVEx) was completed in Manitoba, Canada, during June 6 - July 19, 2012. The objective of this experiment was to provide pre-launch field campaign data for the Soil Moisture Active Passive (SMAP) mission, to be used for algorithm evaluation and applications development. Ground data were collected from test sites in agricultural fields and forested areas coincident with satellite and airborne data acquisitions, including the Passive Active L-band Sensor (PALS) and Uninhabited Aerial Vehicle Synthetic Aperture RADAR (UAVSAR). Near-surface volumetric soil moisture data were sampled along transects within 55 fields, 17 times during the experiment. Gravimetric samples were also acquired for data calibration. Vegetation was sampled weekly in each field to capture indicators of crop growth and canopy architecture, including; Leaf Area Index, height and plant water content. The vegetation consisted of spring/winter wheat, canola, soybean, as well as grassland and pasture. The sampled soil moisture and vegetation data satisfied the experiment objectives for the agricultural dataset as it provided significant spatial and temporal variance in the soil moisture data including wetting and drying cycles and a wide range of vegetation types, growth stages, and plant water content levels. This presentation provides an overview of the agricultural ground sampling dataset and a summary of spatial and temporal soil moisture and vegetation observations.
1D4.4 ID:6530 16:15
Calibration of SMAPVEX-12 Field Soil Moisture Measurements
Tracy Rowlandson 1, Aaron Berg 1, Paul Bullock 2, E. Rotimi Ojo 2, Heather Mcnairn 3, Grant Wiseman 3, Michael Cosh 4 1 Department of Geography, University of Guelph 2 Department of Soil Science, University of Manitoba 3 Agriculture and Agri-Food Canada 4 United States Department of Agriculture Contact: [email protected]
The Soil Moisture Active Passive Validation Experiment (SMAPVEX) field
campaign was held southwest of Winnipeg, Manitoba, during a 6-week period in June and July 2012. Soil moisture measurements were made on 17 days during the campaign on 55 fields, with a variety of soil textures. There were a total of 16 sampling points per field, along two transects. During the campaign, a gravimetric sample of known volume was taken at each of the sampling points. Co- located with each sample, three soil moisture measurements were taken using the Stevens Hydra probes. We performed a calibration of the sensors using the average of these three measurements and the volumetric water content determined from the gravimetric samples. Five different calibration techniques were investigated in an effort to obtain a root mean square error (RMSE) between the soil moisture estimated from the Hydra probe and the volumetric soil water content determined from the samples of < 0.04 m 3m-3 and a minimal bias (± 0.01 m3 m-3). These techniques included: development of a general calibration equation; inclusion of soil texture in the general calibration equation; calibration based on soil texture threshold (coarse vs. fine texture, with 40% clay content as the threshold); calibration based on soil texture classification; individual field calibration. The general equation resulted in high bias for some fields and an RMSE > 0.0475 m3m -3. Dominant soil texture information was available for each field. Inclusion of the percent of sand and/or clay in the general calibration equation had little impact on the bias or RMSE. The calibration based on the clay content threshold resulted in two calibration equations and an average RMSE of 0.046 m3 m-3. There were 8 soil texture classes in the study region, and a calibration equation was developed for each. This resulted in an overall RMSE of 0.044 m3m -3, and low bias. Individual calibration of each of the 55 fields yielded the best results, with low bias, and an average RMSE of 0.0374 m 3m-3.
1D4.5 ID:6863 16:30Disaggregation of SMOS Soil moisture estimates by using the improved multiplicative random cascade method Mehdi Hosseini , Ramata Magagi , Kalifa Goita Universite de Sherbrooke/FLSH/DGA Contact: [email protected]
With the launch of Soil Moisture and Ocean Salinity (SMOS) satellite on November 2009 and also the planned launched of Soil Moisture Active Passive (SMAP) satellite on October 2014, many efforts have been done to estimate global soil moisture by using passive microwave satellite data. However, due to the low spatial resolution of soil moisture products derived from passive microwave satellites (35-50 km and 40 km for SMOS and SMAP, respectively), it is necessary to disaggregate their spatial resolution to provide soil moisture at spatial resolution compatible with hydrological models or regional scale studies. Usually, the disaggregation methods are based on the use of higher spatial resolution optical or radar data. A recent study showed that it is possible to improve the spatial resolution of SMOS soil moisture estimates by using random cascade model which is based on a statistical theory (Hosseini et al., 2013; Shrestha et al., 2004). In this model, spatial fields are constructed from discrete
multiplicative cascades of independent and identically distributed random variables called generators (Over and Gupta, 1996). At each level of disaggregation, each SMOS soil moisture pixel or sub-pixel is divided into four higher spatial resolution pixels (sub-pixels) using four cascade generator weights. However, due to the random behavior of these generators, there is not an obvious link between a given generator and a sub-pixel. In the present study, the random behavior of the generators is corrected using an improved version of the model named the random cascade hierarchical and statistical adjustment (RCHSA) model (Shrestha et al., 2004). The approach takes into account the spatial correlation of soil moisture and the soil moisture values of the surrounding neighbor cells. References Hosseini M., Magagi R., Goïta K., and Djamai N., Disaggregation of low spatial resolution soil moisture using multiplicative random cascade theory, 2013. (To be submitted). Over, T. M., and Gupta V. K., A space-time theory of mesoscale rainfall using random cascades, J . Appl. Meteorol., Journal of Geophysical Research, Vol. 101, No. D21, p. 26319-26331, 1996. Shrestha, R. K., Tachikawa, Y., and Takara, K., Downscaling spatial rainfall field from global scale to local scale using improved multiplicative random cascade method, Annuals of Disas. Prev. Res. Inst., Kyoto Univ., p. 47, 2004.
Coastal Oceanography and Inland Waters PART 3 / Océanographie côtière et eaux intérieures PARTIE 3
Room / Endroit (TCUP Gall. Suite 1), Chair / Président (Jinyu Sheng ), Date (27/05/2013), Time / Heure (15:30 - 17:00)
1D5.1 ID:6688 15:30
Fast Transferring Global Atmospheric Model Solutions to Water Level Responses for Long Term Storm Surge Simulations
Zhigang Xu 1, Jean-Pierre Savard 2, Denis Lefaivre 1, Michel Beaulieu 1 1 IML, DFO-MPO 2 OURANOS Contact: [email protected]
A novel method is used to fast transfer a global atmospheric forcing field to water level responses at some points of interests (POIs) . The novel method is called the all-source Green’s function (ASGF; Xu, 2007; 2011). Derived from a global storm surge model, the ASGF, as the pre-calculated responses at a POI to all the
delta-forcings distributed globally, can very efficiently transfer an arbitrary atmospheric forcing field into water level time series at a POI without any time step restriction or compromise in accuracy. We have used this approach with a past atmospheric forcing field, the MERRA dataset, which is a global reanalysis atmospheric modelling solution covering 1979 to 2005, and have obtained long term water level time series over 14 POIs distributed in the Gulf of St. Lawrence, in the Hudson Bay and along eastern Canada coasts. Agreements of the simulated time series with the observations are satisfactory overall. This approach makes it feasible to simulate storm surges with multidecadal future climate model solutions.
1D5.2 ID:6327 16:15
Numerical study of the climate-induced effects on the physical conditions of Lake Winnipeg Jun Zhao , Ram Yerubandi Environment Canada Contact: [email protected]
Future climate change is potentially an enormous risk to Lake Winnipeg ecosystems by changing the physical conditions in the lake, most simply the dynamics of water temperature. A three-dimensional hydrodynamic modeling system (ELCOM, Hodges and Dallimore, 2006) is applied to estimate changed physical conditions of the lake under projections of climate change. To assess the model performance, we simulate the circulation and temperature distribution of the lake in 2007 and compare the model results with the observations made in the lake. The model showed considerable skill in reproducing the thermal structure, surface currents and water levels. The model was then applied to baseline condition in 1999 and future climate in 2069 based on climate forcing from CRCM. Modeled water levels, temperatures in the baseline and projection scenarios were presented to show the changes of physical properties in response to changed climate.
1D5.3 ID:6398 16:30
Application of Satellite Remote Sensing for Monitoring the Productivity and Acidification of Inland Lakes in Saskatchewan
Magfur Rahman 1, Samantha Kerr 2, Michelle Bowman 3 1 Saskatchewan Water Security Agency 2 University of Regina 3 University of Guelph Contact: [email protected]
The Boreal Region of northern Saskatchewan hosts approximately 100,000 lakes, which contains some of the highest quality freshwater resources in the world. This Region is also on the verge of rapid environmental and socioeconomic changes. Industry interest in potential heavy oil development,
metal mining, along with tourism and recreational activities has been increasing in this Region. Socioeconomic changes in the watersheds of southern Saskatchewan lakes are intensifying even in greater magnitude. Protection and monitoring of lake water quality has become a high priority for Saskatchewan government. However, environmental monitoring in Boreal Region remains challenging due to the remoteness and lack of road access. Comprehensive water quality monitoring in southern Saskatchewan lakes, where access is relatively easy, is becoming challenging due to the increasing number of lakes that need monitoring. Satellite remote sensing technique has the potential to overcome access and logistical challenges in water quality monitoring. Saskatchewan Government has undertaken research projects to assess the feasibility of developing a decision support tool based on satellite imagery for monitoring water quality. Worldview-2, Quick Bird, Landsat and MODIS images are currently being analyzed supported by extensive lake survey data. Spectral reflectance information from satellite imagery is being correlated with selected water quality parameters. A number of empirical models have been developed capturing these correlations. Preliminary results indicate that lake productivity indicators, such as Chlorophyll A and algae biomass, are highly correlated (R2 ~ 0.6 to 0.9) with Costal Blue and other spectral bands in high resolution imagery. Results also showed high correlation (R2 ~ 0.85 to 0.90) between spectral bands and parameters related to lake acidity and acid buffering capacity, e.g. pH, Dissolve Organic Carbon, Calcium, and Alkalinity. These findings have shown that the use of remote sensing techniques is a viable tool for monitoring water quality of inland lakes in Saskatchewan.
FLOW (Canada) Workshop: Addressing Lake Winnipeg Eutrophication PART 2 (Sponsored by W&D Gordon Foundation) / Atelier: FLOW (Canada) : Attention sur l'eutrophication du lac Winnipeg PARTIE 2
Room / Endroit (TCUP Gall. A), Chair / Président (James P. Bruce ), Date (27/05/2013), Time / Heure (15:30 - 17:00)

1D6.1 ID:6943 INVITED/INVITÉ 15:30Prerequisites to a Lake Winnipeg Solution Ralph Pentland 1, Bob Halliday 2 1 , previously Director, Water Planning and Management, E.C., Ottawa 2 CWRA Contact: [email protected]
Lake Winnipeg pollution has become a matter of “urgent national concern”. The main culprit is nutrient enrichment and the sources are diverse – agricultural, municipal and industrial – and are spread across a 900,000 km2 watershed containing parts of four Canadian provinces and four U.S. states. It is a unique problem which will require a unique solution. The prerequisites of that solution must necessarily include at least: 1) a basin wide approach – the paper will briefly explore, based on national and international experience some of the characteristics of successful basin-wide approaches 2) a better alignment of economic and environmental signals – the paper will explore some prospects in that regard, including nutrient trading schemes and pollution taxes, and 3) the Canadian federal government entering the fray in a much more serious way than it has to date – the paper will explore the roles that the senior government should be playing regarding this interjurisdictional issue which has become a matter of “urgent national concern”.
1D6.2 ID:6941 INVITED/INVITÉ 16:00The International Joint Commission’s Current Efforts to Reduce Nutrient Loading in the Red River Basin Ted R. Yuzyk 1, Mike Renouf 2 1 Senior Advisor and Manager IWI, International Joint Commission 2 Chair, IJC Red River Board Contact: [email protected]
The International Joint Commission (IJC), through its International Red River Board (IRRB), has had a long history of working in the Red River Basin to address binational water quantity and quality issues. The IJC is particularly concerned with the extensive nutrient loading to Lake Winnipeg that is resulting in eutrophication and massive harmful algae blooms in this important lake. This has led to a significant binational effort that has focussed on developing and applying a common nutrient loading model for the Red River Basin as part of the IJC’s International Watersheds Initiative. Canadian and U.S. scientists have taken the SPARROW model (Spatially Reference Regression on Watershed attributes) developed by the United States Geological Survey and is applying this regional model to the Red River Basin. The prototype is currently undergoing its final calibration and the outputs from the model are being reviewed by numerous experts. The model’s output is going to be used by the IRRB as an integral component of the Red River Basin Nutrient Reduction Strategy (Strategy), which is currently being implemented.

In September 2011, the IRRB adopted an approach jointly proposed by Manitoba, Minnesota and North Dakota as part of this comprehensive Strategy. The approach comprises six components that involve: inventorying nutrient regulatory frameworks in the basin; developing, implementing and monitoring nutrient load allocations or water quality targets; facilitating dialogue and information exchange; and, regular review and update of the Strategy. Significant overall progress has been made, and the IJC is very interested in vetting this work with the broader scientific community
1D6.3 ID:6942 INVITED/INVITÉ 16:30
Assuring Water & Climate Security on the Central Great Plains
Robert Sandford EPCOR Chair of Canadian Partnership Initiative for UN Water for Life Contact: [email protected]
The rapid eutrophication of Lake Winnipeg is seen as evidence of eco-hydro-climatic change, not just in the immediate Lake Winnipeg drainage, but over the entire Central Great Plains region of North America. The latest scientific research outcomes demonstrate that the combined effects of extensive changes in land-use and the resulting channelization of streams has altered the hydrology of the region making this part of North America more vulnerable to flooding caused by more frequent and intense multi-day frontal storm systems. This presentation will summarize the findings presented at the CMOS.CWRA?CGU Congress and, in conclusion, offer recommendations as to how those findings might most effectively be translated into practical public policy solutions.
Extreme Value Analysis and IDF Curves PART 2 / Analyse des valeurs extrêmes et courbes IDF PARTIE 2
Room / Endroit (TCUP Gall. B), Chair / Président (Philip Jarrett ), Date (27/05/2013), Time / Heure (15:30 - 17:00)
1D7.1 ID:6779 15:30The MTO IDF parameter lookup system, Version 2.0
Ric Soulis 1, Muhammad Naeem 2, Hani Farghaly 2, Daniel Princz 1 1 Civil and Environmental Engineering, University of Waterloo 2 Ministry of Transportation, Ontario

Contact: [email protected]
The Ministry of Transportation for Ontario released version 2.0 of their system for the regionalization of extreme rainfall statistics for Ontario. The system is designed to facilitate the calculation of design rainfall for MTO projects. The approach uses Environment Canada Intensity-Duration- Frequency station statistics. One of the motivations for the new release was to include the 2010 data set from EC. The system interpolates the A,B IDF station coefficients using a 1km by 1km physiographic data base derived from GTOPO-30. The method was originally developed to determine hydropower potential for remote areas. The main objective is to add uncertainty analysis. Confidence limits are included for all output parameters and all graphics. Links to nearby EC public stations are provided for comparison. Attempts to minimize the standard error are described. The system is publicly available for projects in Ontario with the usual caveats and can be adapted to other jurisdictions in Canada and North America.
1D7.2 ID:6784 15:45Mining the legacy: Exploring the EC/MTO IDF data base Ric Soulis , John Wong Civil and Environmental Engineering, University of Waterloo Contact: [email protected]
The MTO interpolator provides an unbiased picture of knowlegde of extreme rainfall patterns in Ontario. This presentation describes some new indications of what areas of the province are more vulnerable than others. There are also some interesting time trends evident that suggest that there is a climate change signal therein. The observed pattern is compared with downscaled RCM scenarios and IPCC hindcast results suggest that the bulk of the "error" in the station data disappears when time is included as an independent variable.
1D7.3 ID:6423 16:00
Development of a Framework for Regional Estimation of Intensity-Duration-Frequency (IDF) Curves
Donald Burn University of Waterloo Contact: [email protected]
While Intensity-Duration-Frequency (IDF) curves have traditionally been developed on an at-site basis, there are considerable potential benefits to the consideration of regional (pooled) analysis when developing IDF curves,

particularly when the at-site record length is short relative to the return period of interest. This research outlines the components that comprise a framework for a regional approach to developing IDF curves based on the index event approach. Approaches that should be followed to form regions for spatial information transfer are presented and include both traditional (fixed) regions as well as site-specific regions, which are also referred to as focussed pooling groups. The required characteristics for an effective region, or pooling group, are outlined and available techniques for evaluating the characteristics of a region are discussed. Methods to estimate regional quantiles for rainfall events of different durations are presented. Issues to consider in the estimation of regional rainfall quantiles are the probability distribution function to be used, the method of parameter estimation, and the method of combining information from individual sites to form the regional estimate. The use of L-Moments is advocated in several components of the proposed framework, including: i) as an aid in identifying effective regions for spatial information transfer; ii) for determining an appropriate regional probability distribution function; and iii) for estimating parameters for the regional probability distribution function. The framework outlined is applied to the estimation of IDF curves for several Canadian locations and comparisons between regional and at-site (local) IDF curve values are made.
1D7.4 ID:6777 16:15
Environment Canada Short-Duration Rainfall Intensity-Duration-Frequency (IDF) information
Philip Jarrett Environment Canada, MSC/WEM/WCS Contact: [email protected]
For the past several decades Environment Canada (EC) has made rainfall IDF information available to the public. Amongst its many applications, one of the most important is its use by engineers for the sizing and design of hydrological structures to accommodate and carry rain runoff from small catchments. This presentation will provide a description of the current EC IDF tables and graphs and the underlying data and analysis methods used in their preparation. IDF observational data sources ranging from the legacy MSC tipping-bucket rain gauge (TBRG) with strip chart recorder to the modern TB3 TBRG collocated with all-season weighing gauges at autostations will be reviewed. The use of the Gumbel (EV1) extreme value distribution at single stations compared to other approaches will be discussed. Finally, a brief overview of a number of related issues for which further research and development is needed will be discussed. Some of these include detecting trends in the observational rainfall extremes, selecting the most appropriate extreme value analysis method, spatial analysis methods to extend single-station IDF information to arbitrary locations, and the impacts of a changing climate on IDF data.

Time-lapse Monitoring of Geohazard & Geodynamics / Surveillance des géohasards et de géodynamique
Room / Endroit (TCUP Gall. D), Chair / Président (Jeong Woo Kim ), Date (27/05/2013), Time / Heure (15:30 - 17:00)
1D9.1 ID:6740 15:30Using absolute gravimetry to augment ETS studies of transient deformation in the northern Cascadia Subduction Zone – preliminary results Joseph Henton , Herb Dragert , Anthony Lambert , Nicholas Courtier (Presented by Joe Henton ) Natural Resources Canada Contact: [email protected]
The monitoring of subduction zone Episodic Tremor and Slip (ETS) has been carried out primarily using seismic data for tremor and continuous Global Positioning System (GPS) and borehole strain-meter observations for transient slip. In order to augment these other data sets and thereby help in understanding the physical processes involved in the generation of ETS, we also periodically monitor ETS events in the northern Cascadia Subduction Zone with multiple-epoch series of absolute gravity (AG) measurements. Properly operated and after careful processing, AG can provide the value of the Earth´s gravity at a point with resolution of approximately 1 μGal (10 nm•s-2; i.e., approximately one part-per-billion of gravitational acceleration at the Earth’s surface). On southern Vancouver Island (SVI), situated in the forearc of the northern Cascadia Subduction Zone, series of AG measurements coincident with ETS have been made at three sites: Ucluelet, Sidney, and Port Renfrew. Although preliminary, analyses of these series of AG observations during ETS events indicate gravity decreases larger than expected from the observed collocated GPS height change associated with thrust faulting. The residual gravity loss, after accounting for the gravity change predicted from the observed height change, may reflect a loss of fluids and/or a decrease in mean density. Future AG measurements are requisite and the monitoring of ETS events has also been recently augmented by continuous gravity measurements (i.e., with earth-tide and superconducting gravimeters).
1D9.2 ID:6805 15:45
Parallel observations of superconducting and absolute gravimeters in west Canada
Ricky Kao 1, Juergen Neumeyer 1, Hojjat Kabirzadeh 1, Jeong Woo Kim 1, Michael Sideris 1, Joe Henton 2, Herb Dragert 2 1 University of Calgary 2 Natural Resources Canada Contact: [email protected]
West Canada is the convergent boundary of the Pacific Plate and the North American Plate. University of Calgary (UofC) is located at the transition zone between the Rocky Mountains and the Canadian Prairies. Pacific Geoscience Centre (PGC) is in the Cascadia subduction zone and the convergent boundary stretches from northern Vancouver Island to northern California. The tectonic motions create vertical displacements and mass changes that have been detected by repeated absolute gravity and GPS measurements many years. Superconducting gravimeter (SG, iGrav #001) is portable with ultra-low drift of less than 0.5 µGal/month which has been recorded from November 1, 2011 to present, and moved from UofC to PGC in July, 2012. The calibration factors in UofC and PGC are -91.831 ±1.548 and -94.994 ±0.101 µGal/Voltage which were made by A10 and FG5. The M2 of Ocean loading effects are 2.34 and 3.59 µGal, phase lags are 156.35 and 154.22 degree at UofC and PGC. The aim of this study is to analyze the various effects from residual gravity of SG. These results improve the precision of absolute gravimeter in west Canada.
1D9.3 ID:6477 16:00
Inter-annual Variations in Prairie Water Storage from Combined Gravity and GPS Observations Anthony Lambert 1, Jianliang Huang 2, Garth Van Der Kamp 3, Joe Henton 2, Stephane Mazzotti 4, Thomas S. James 1, Nicholas Courtier 1 1 Geological Survey of Canada, Natural Resources Canada 2 Geodetic Survey Division, CCRS, Natural Resources Canada 3 National Hydrology Research Centre, Environment Canada 4 Geosciences Montpellier, Université Montpellier, France Contact: [email protected]
GPS, absolute gravity and GRACE satellite data have been combined to map postglacial rebound (glacial isostatic adjustment) and to identify large spatial-scale water storage variations in the Nelson River drainage basin. A vertical velocity map was derived for central North America based on data from both continuous GPS stations and regularly surveyed GPS monuments. The vertical velocity map, which is dominated by postglacial rebound, was converted into a ‘virtual’ gravity rate map using a transfer function derived from GPS and absolute-g data at co-located sites. The ‘virtual’ gravity rate map was used to remove the postglacial rebound signal from a gravity rate map derived from 110 months of GRACE satellite gravity data. The residual gravity rate map shows a major, long-term (2002-2011), gravity rate anomaly stretching from Lake Winnipeg to Saskatoon. The residual gravity rate anomaly was inverted for the water storage rate equivalent, taking elastic loading response into account. The

likely water-storage source of the residual gravity anomaly is confirmed by comparison with hydrological data from deep wells near Saskatoon and measured water storage variations in the White Gull Creek basin in central Saskatchewan.
1D9.4 ID:6309 16:15
An Alternative Method for Landslide Early Warning using the Volumetric Water Content Gradient in Unsaturated Soil Byung-Gon Chae , Jung-Hae Choi Korea Institute of Geoscience and Mineral Resources (KIGAM) Contact: [email protected]
Early detection of landslide triggering across a broad range of natural terrain types can be accomplished by monitoring rainfall and the physical property changes of soils in real time or near-real time. This study involved the installation of a real-time monitoring system to observe physical property changes in soils in a valley during rainfall events. This monitoring included the measurement of volumetric water content, which was compared with the results of laboratory flume tests to identify landslide indicators in the soils. The response of volumetric water content to rainfall events is more immediate than that of pore-water pressure, and volumetric water content retains its maximum value for some time before slope failure. Therefore, an alternative method for landslide monitoring can be based on the observation of volumetric water content and its changes over time at shallow soil depths. Although no landslide occurred, the field monitoring results showed a directly proportional relationship between the effective cumulative rainfall and the gradient of volumetric water content per unit time (t/tmax). This preliminary study thus related slope failure to the volumetric water content gradient as a function of rainfall. Laboratory results showed that a high amount of rainfall and a high gradient of volumetric water content could induce slope failure. Based on these results, it is possible to suggest a threshold value of the volumetric water content gradient demarcating the conditions for slope stability and slope failure. This threshold can thus serve as the basis of an early warning system for landslides considering both rainfall and soil properties.
1D9.5 ID:6800 16:30
Dynamic monitoring of CO2 storage using superconducting gravimeters Hojjat Kabirzadeh , Ricky Kao , Jeong Woo Kim , Juergen Neumeyer , Michael Sideris Department of Geomatics Engineering, University of Calgary, Calgary, AB, Canada Contact: [email protected]
Monitoring CO2 storage is critical for mapping the redistribution and leakage of the injected CO2. However gravimetric methods have been used to detect the mass balance changes in the past, the results are not satisfying for slighter amount of mass change due to the precision and drift problems of spring

gravimeters. Recently, superconducting gravimeter (SG) supported by absolute gravimeter (AG) has provided unique measurements with high precision. According to the high resolution (0.05 µGal in time domain) of portable iGravTM SG, we can move the instrument over the storage area and measure the gravity field during the time. In this case, we use long term residual gravity to analyze the 4D gravity measurements after reducing the gravity effect of environmental features such as tide, ocean loading, atmosphere, soil moisture etc. Estimations of the CO2 storage with different characteristics combining with lab experiments show the possibility of the method in CO2 monitoring.
Water Management Issues / Enjeux de la gestion de l'eau
Room / Endroit (Hilton Commonwealth - N), Chair / Président (Diane Dupont ), Date (27/05/2013), Time / Heure (15:30 - 17:00)
1D11.1 ID:6377 15:30Same Region, different policy preferences Henning Bjornlund , Wei Xu , Xinzheng Zhao University of Lethbridge Contact: [email protected]
Many watersheds in the semiarid part of the world has developed the use of their water resources to a level where available water resources are already fully or over allocated and environmental degradation is taking place as a consequence of the resulting level of water extraction. The South Saskatchewan River Basin is an example of such a region, in response, most of the Basin was closed to new applications for licensed water allocations in 2005. Given a continued increase in the demand for water from irrigation, industry and municipalities and a need to extract less water to improve environmental conditions, there is a growing need for mechanisms to share existing licensed water allocations. However, attempts to facilitate such water sharing or reallocation has been met with resistance from most stakeholder groups in the Basin. There is therefore a need to better understand this opposition and how the population in Alberta perceives that water sharing should take place Previous research has investigated the policy preferences for water sharing of people not involved in the irrigation industry but with different dependence on water use and different level of exposure to the environmental consequences of the current level of extraction [Bjornlund et al., in press; Bjornlund et al., 2012]. This paper will concentrate on how irrigators perceive that water sharing should take place, what influences such preferences, and how irrigators differ from those living in their communities but not directly

involved in irrigation as well as those living in larger cities
1D11.2 ID:6744 15:45
Analysis on Technology and Policy to enable Manitoba farmers to adapt an ethical, economical, and environmental friendly 'on-farm irrigation infrastructure technology'
Anandakumar Palanichamy CWRA Contact: [email protected]
Last two decades, floods have been occurring unprecedently in Red and Assiniboine River basins of Manitoba. Around 5 million acres of farmlands could not be seeded and thereby Manitoba farmers have lost $1.5 billion during 2011 Flood. Considering the damage to cattle industry, fisheries, oil industry, and infrastructures, the total loss was more than $ 3.0 billion. There was a drought in 2012 which lead to a loss of 30% on yield which approximately estimated as $1.0 billion. Due to excess runoff, Lake Winnipeg is facing excessive nutrient loading issues. 25% of wetlands are already lost in Canada (NRCan 2007). Manitoba is not exceptional. Currently, the provincial government in MB is spending money only for water diversion structures for managing only the floods. Due to inadequate policies, the government is creating dams only across major rivers and streams to mitigate the flood. There is only 0.39 % of total farm lands in Manitoba are doing irrigated farming with the water supply from conventional creeks and streams when 50% of lands are suitable. This paper will encourage Manitoba farmers adapt suitable ‘minimum excavation and maximum storage on-farm irrigation infrastructure technology’ which will not only harvest and store surface and subsurface water runoff but also will mitigate flood and drought as well as will stop nutrient loading to lake Winnipeg significantly. This 'more yield and higher quality produce' giving irrigated farming will also enable farmers earning double the income that of from their conventional rain fed farming. This policy attention seeking paper will narrate all the dynamics and the related economics to convince the farmers and governments to adapt this ethical, economical, and environmental friendly land use initiative otherwise they are currently afraid of losing lands for having such on-farm irrigation infrastructure.
1D11.3 ID:6275 16:15
An Empirical Analysis of Halifax Municipal Water Consumption
Adam Walke 1, Thomas Fullerton 1, Katherine White 2, William Smith 1 1 University of Texas at El Paso 2 Royal Bank of Canada Contact: [email protected]
Recent empirical research for municipal water consumption has uncovered a
variety of interesting growth patterns. This study examines municipal water usage over time for Halifax, Nova Scotia, the thirteenth largest metropolitan economy in the Canada. Results from a dynamic error correction modeling approach estimated using quarterly frequency data indicate that municipal water consumption reacts in statistically significant manners to changes in real price, per capita employment levels, and hot weather. Parameter estimates further indicate that any disequilibria in consumption tend to dissipate very quickly in Halifax. As in other regions, the number of utility customers is affected by demographic and labor market variables.
1D11.4 ID:6832 16:30
Development of 25 Year Saskatchewan Water Security Plan
Dale Hjertaas non member Contact: [email protected]
Water security refers to ensuring water services - such as water for drinking and sanitation, the food we grow with water, the fish we catch and the water used in industry, energy production, transportation and recreation – are sustained. Saskatchewan is experiencing rapid growth and that growth has created challenges. Saskatchewan developed a new water strategy to ensure the ability to address the challenges of growth and built the strategy on the concept of water security. The 25 Year Saskatchewan Water Security Plan and creation of a new agency, The Water Security Agency, were announced in October 2012. The Plan’s Vision, “Water supporting economic growth, quality of life, and environmental well being.” is supported by 7 goals and 89 actions.
1D11.5 ID:6833 16:45
Saskatchewan’s Emergency Flood Damage Reduction Program
Gordon Will non member Contact: [email protected]
Heavy rain in 2010 and an unusually large snowpack through winter 2010-2011 led the Water Security Agency (formerly the Saskatchewan Watershed Authority) to project that widespread flooding would occur across southern Saskatchewan in spring 2011. The Government of Saskatchewan announced the implementation of an Emergency Flood Damage Reduction Program which the Water Security Agency (Agency) immediately began to implement. The program provided engineering and financial assistance to prevent flooding damage from occurring. Typical measures included construction of berms and ditches and implementing temporary measures such as clearing water courses, opening culverts and pumping. When the program wrapped up in early 2012, 1237 individuals, communities,

rural municipalities, and First Nations had requested assistance. Participants were generally very satisfied with the process and outcomes of the program. A cost benefit analysis of the potential financial losses that were prevented by program activities suggests that the program was highly cost effective. For every dollar spent in flood prevention efforts on individual yard sites, $23 was saved in property replacement costs. For every dollar spent in flood prevention efforts in communities and RMs, $30 was saved in terms of the expected costs for rebuilding, cleaning costs and repairs. Lessons learned from the 2011 program include the importance of a rapid program roll-out, clear communication with clients, developed program guidelines, effective data storage, links with other related programs and regulatory processes, and, finally, an ability to adapt to the unexpected.
Anthropogenically Disturbed Peatlands PART 2 / Dérangements antropologiques des tourbières PARTIE 2
Room / Endroit (Hilton Commonwealth- S), Chair / Président (Pete Whittington ), Date (27/05/2013), Time / Heure (15:30 - 17:00)
1D13.1 ID:6739 15:30Creating a fen peatland: From concept to construction
Jonathan Price University of Waterloo Contact: [email protected]
The idea of recreating a fen peatland on a post-mined oil sands tailings lease (Suncor Energy) has progressed from a concept, through design to implementation. The concept includes a watershed/aquifer constructed from tailings material, draining into a peat deposit (scavenged from newly opened lease areas) emplaced at the tail end of the system. Hydrogeological modeling was used to test the concept, and recommend optimal system geometry and material properties. However, turning a concept into a design resulted in modifications to better manage water retention in the system (an artificial liner) and water quality challenges, such as placing a highly permeable sand underdrain intended to distribute water and solutes more evenly beneath the peatland. However, since access to material with suitable hydraulic properties

was not feasible, petroleum coke was used. This introduced other “unknowns” into the functioning of the system. Sodium and naphthenic acid derived from the tailings, will be directed through this coke underdrain, resulting in the uptake (sorption) of some cations, and the release of others such as vanadium. The peat is 2 m thick, and has the capacity to further adsorb cations, including vanadium and other metals that may pass through. The system is now complete, and monitoring has begun.
1D13.2 ID:6742 16:00
The hydrology of the Bois-des-Bel peatland restoration: Hydrophysical properties retarding restoration Colin Mccarter , Jonathan Price University of Waterloo Contact: [email protected]
The Bois-des-Bel peatland was restored in the winter of 1999; since then a ~ 15-20 cm Sphagnum moss carpet has regenerated over the site but it is currently unknown how the structure of the regenerated Sphagnum moss and cutover over peat influence the restoration of Bois-des-Bel. This study evaluates the hydrophysical properties of Bois-des-Bel, based on a combination of field and monolith experiments, at a Restored (RES), Natural (NAT) and Unrestored site (UNR). The lowest field soil moisture at RES was 0.09 in the Sphagnum moss, while 0.20 at NAT. These results were similar in both the monolith experiments and monolith parameterization. The low soil moisture and relatively large abundance of pores > 397 μm in the RES Sphagnum resulted in low unsaturated hydraulic conductivity (0.23 cm day-1 at ψ = -35 cm), which limits the connectivity between the cutover peat and regenerated Sphagnum moss, and high specific yield (0.45) compared to NAT Sphagnum (1.2 cm day-1 and 0.10, respectively). Lateral infilling of the leaves and branches and further basal decomposition is needed to create a larger abundance of small pores (< 397) to increase soil water retention and generate stronger capillary forces to better store and transmit water. To negate the difference in hydrophysical properties between the cutover peat and regenerated Sphagnum, the water table might need to fluctuate almost entirely within the Sphagnum and combined with a decrease in average pore size and growth of ericaceous shrubs would create conditions suitable for net carbon sequestration.
1D13.3 ID:6731 16:15
Understanding water and CO2 relations of Sphagnum and brown moss communities for establishment in created fen ecosystems
Jonathan Goetz , Jonathan Price University of Waterloo Contact: [email protected]
Water retention properties and microclimate controls of peatland mosses
influence rates of evaporation and available water, critical for photosynthetic processes. Mosses are a target community for establishment in a fen creation project, which is part of the reclamation of post-mined oil sands landscapes. Sphagnum and brown mosses, which dominate peatlands in the Athabasca oil sands region, have different CO2 exchange rates in response to water relations driven by atmospheric and ground-water exchanges. Volumetric water content (θ) and relative humidity (RH) of the photosynthesizing mosses were monitored in response to changes in water table (WT) and precipitation (P) in Tomenthypnum nitens and Sphagnum angustifolium hummock communities. T. nitens showed a wider range of θ (0.09-0.16) than S. angustifolium (0.11-0.15) in response to changes in WT and P. For each species, 30-cm peat monoliths (n=3 per moss) were monitored for θ, RH, evaporation (ET) and gross ecosystem photosynthesis (GEP) with changes in WT position. S. angustifolium θ was more closely related to WT than it was in T. nitens, because of its stronger capillary rise, and higher water retention capacity. In S. angustifolium, variations in GEP and ET were therefore responsive to changes in WT. For T. nitens, which had relatively low water retention capacity, had a poor relationship between θ and WT. Both ET and GEP were more closely related to RH in the moss canopy. For the reestablishment of moss communities on a peat surface, as required for reclamation, T. nitens will be less sensitive to water table position than S. angustifolium, but more reliant on amelioration of atmospheric conditions by the use of a mulch to reduce ET and increase RH.
1D13.4 ID:6770 16:30
Carbon exchange following restoration on fen peatland Maria Strack , Cameron Robinson , Golnoush Hassanpour Fard Geography, University of Calgary Contact: [email protected]
Peatlands are long term sinks for atmospheric carbon and important sources of atmospheric methane (CH4). Canada is one of the world’s largest producers of horticultural peat and this has resulted in 24 000 ha of disturbed peatland. Extraction of peat for horticulture requires drainage and removal of surface vegetation, converting these ecosystems from carbon sinks to sources. Following cessation of extraction activities these disturbed peatlands continue to act as large carbon sources. While several restoration projects have taken place on ombrotrophic bogs, richer fen peat may be exposed during peat extraction and fen restoration has not by tested at a large scale. This study investigates carbon exchange at the Bic-St Fabien (BSF) fen peatland in a section that was extracted and then restored in 2009 using the moss transfer technique. Carbon dioxide (CO2) and CH4 flux was measured at six replicate plots during the growing season 2010-2012 and compared to fluxes measured in a neighbouring undisturbed fen. Restoration resulted in a decrease in CO2 emission and by the third year post-restoration some restored plots were net sinks of CO2 with fluxes similar to the undisturbed site. Vegetation biomass within the restored plots was the best predictor of CO2 exchange. Although restoration led to an increase in

CH4 flux, it remains lower that the undisturbed site and much lower than average literature values for fens. These results suggest that moss-transfer can be an appropriate restoration technique for fens and may return their carbon sink function in the short-term.
2013-05-28
Plenary Day 2 / Plénière Jour 2
Room / Endroit (TCUP Theatre), Chair / Président (Geoff Strong and Paul Myers ), Date (28/05/2013), Time / Heure (08:30 - 10:00)
P2.1 ID:6915 INVITED/INVITÉ 08:30
The Thermohaline circulation of the oceans: Impacts on climate variability and change
W. Richard Peltier Department of Physics, University of Toronto Contact: [email protected]
Although the wind driven circulation of the oceans is reasonably well understood, the same cannot to claimed for the thermohaline circulation. In part this is a consequence of the fact that the timescales of the variability associated with it, both forced and internal, tend to be multi-decadal or longer. I will review what is known concerning THC variability and its role in long timescale climate change from both a transient forced perspective and from the perspective of its statistical equilibrium strength under fixed boundary conditions that differ radically from modern. Under modern climate conditions there exists clear evidence that the THC is deeply involved in the so-called Atlantic Multi-decadal Oscillation (AMO). Under Last Glacial Maximum boundary conditions there is also evidence, based upon the Pa/Th tracer of the overturning strength, that the North Atlantic Deep Water (NADW) cell was about 40 % weaker than modern. During the last glacial-interglacial transition, recent research has established that the famous-Younger Dryas (YD) hemispheric cooling event was forced by a massive flood of fresh water out onto the surface of the Arctic Ocean through the Mackenzie River outlet and to the subsequent slow down of the THC that this "water-hosing" event produced. Modern coupled atmosphere-ocean climate models are able to successfully explain the related observational constraints, a fact that should be construed to provide a useful test of the models that we employ to make global warming projections when these models are asked to perform under conditions to which they have not been tuned. A fundamental issue concerning the ocean

component of these models continues to be the representations they employ of diapycnal turbulent diffusivity. Recent results concerning this process that appear to be important to understanding how ventilated polar waters return to shallower depth, often in the opposite hemisphere, will be reviewed.
P2.2 ID:6913 INVITED/INVITÉ 09:15
Seasonal ice in the Arctic Ocean is vanishing – so, what else is new?
Robie Macdonald Institute of Ocean Sciences, Department of Fisheries and Oceans Contact: [email protected]
It has become clear in my lifetime that summer sea ice in the Arctic Ocean will become a thing of the past, probably within decades. The evidence for this, collected by satellite images and under-the-ice nuclear submarine missions, is stunningly clear: each year seems to hold another record low in ice cover, further still below the projections of the most pessimistic models. But when you seek evidence for other system changes, the data base thins very quickly with the result that biological and geochemical changes likely to manifest themselves in the new Arctic Ocean are mostly a matter for speculation based partly on paleo records and partly on incomplete understanding of how ice controls biogeochemical cycles. The void in coherent biogeochemical time series does not help. I will present my “geochemical” view from studying freshwater, organic carbon and contaminant tracers to propose how the cycles of these components will change in the Arctic Ocean as a consequence of the shift from multi-year permanent pack ice, to first-year seasonal ice.
Numerical Weather Prediction PART 1 / Prévision numérique du temps PARTIE 1
Room / Endroit (TCUP Salon A), Chair / Président (Mindy Brugman ), Date (28/05/2013), Time / Heure (10:30 - 12:00)
2B1.1 ID:6347 10:30A multi-model approach to operational NWP bias correction Rob Davis , Iain Russell The Weather Network / Pelmorex Media Inc. Contact: [email protected]
Systematic Numerical Weather Prediction model (NWP) bias errors are well

known, and it is common practice to calibrate the forecast outputs using observations as the baseline. There are numerous techniques for tuning the forecast outputs in order to automatically suppress bias errors; however, the skill of any given bias correction technique is dependent on the given NWP model, model run- time, forecast parameter, location, time of day, time of year & forecast lead-time. In our implementation, temperature and wind information from various NWP model outputs and their bias-corrected derivatives are automatically combined, using multiple bias correction methods and automatic model performance assessment, in order to derive an optimum blended solution. We will describe the method that we employ, as well as a flavour of the products that we provide to operational meteorologists engaged in the quality control of forecast data and general (public) weather forecast content. Potential future directions will be discussed, including the expansion of bias-corrected forecast parameters, the ability to attain forecast uncertainty information from the blending technique, and the application of GIS mapping techniques to support quality control of the overall system.
2B1.2 ID:6891 10:45
Improvements to the MSC Global Ensemble Prediction System Normand Gagnon 1, Xing-Xiu Deng 1, Pieter Houtekamer 2, Martin Charron 2, Amin Erfani 1 (Presented by Amin Erfani ) 1 Service météorologique du Canada 2 Meteorological Research Division, Environment Canada Contact: [email protected]
Modifications were made to the operational MSC Global Ensemble Prediction System (GEPS) to upgrade it to its version 3.0.0 in February 2013. This represents a major improvement for upper air analyses and forecasts. The Ensemble Kalman Filter is now run at higher resolution (horizontal, vertical and temporal) and it is assimilating more satellite data (2.7 times more). The new EnKF included in GEPS 3.0.0 results in overall significant positive impacts on the analysis and trial fields of winds, temperature and geopotential heights. The new GEPS 3.0.0 brings a major improvement in quality of upper air forecasts in the extra-tropics. We have found that there is less spread in the forecasts of the new system while the forecasts are better. The Regional Ensemble Prediction System upper air forecast has benefited significantly from having better initial and lateral boundary conditions from the GEPS 3.0.0. The North American Ensemble Forecast System (NAEFS) upper air forecast has also gained significantly from the implementation of GEPS 3.0.0 (for forecast lead times from day 1 to around day 10). A summary of the changes will be presented as well as recent verification against observations.
2B1.3 ID:6568 11:00
An Evaluation of the atmospheric component of the new Gulf of St. Lawrence Coupled model system (GEM-NEMO) Mark Pilon , Serge Desjardins National Lab for Marine and Coastal Meteorology, EC,Dartmouth Contact: [email protected]
In June 2011 an operational coupled atmosphere, ocean and ice forecasting system for the Gulf of St. Lawrence was implemented at the Canadian Meteorological Centre. This system has been shown to provide more accurate weather forecasts over the Gulf and adjacent coastal waters. The oceanic component is MoGSL while the atmospheric component is the Global Environmental Multiscale model. The coupling takes the form of an exchange of surface variables between these models at each time step. These are used to predict the evolution of the ice coverage and thus more accurately predict changes in surface heat and moisture fluxes. Assessment has begun this past winter on a new version of the coupled model. Changes include the use of a new ocean-ice model replacing MoGSL with NEMO in which coupling takes the form of an exchange solely between radiative fluxes. In addition the LIM2 sea-ice model used within NEMO has been replaced by a more sophisticated model CICE4. This presentation will present preliminary results of the new coupled model compared to the current one and future plans regarding testing, and operational implementation of the upgraded coupled model.
2B1.4 ID:6575 11:15
Update from the Canadian Meteorological Centre's (CMC) on its operational and experimental prediction systems and data offering. Nicole Bois , Benoit Archambault Environment Canada Contact: [email protected]
The Canadian Meteorological Centre (CMC) maintains a fully operational 24/7 production environment that includes data assimilation systems feeding data into various NWP weather and environmental forecast models. Along with the requirements of maintaining a 24/7 operational environment, CMC also ensures it can implement a steady stream of systems' improvements. These improvements require careful coordination between EC’s Atmospheric Research groups and CMC’s various development groups before being installed into CMC operations. A review will be made of the main implementation highlights of the past year, as for example: -Update to the regional deterministic wave prediction system (RDWPS v2); -
Major update to the Regional Deterministic Prediction System (RDPS v3)(10 km and 4D-Var assimilation); - Major updates to Global Deterministic Prediction system (GDPS v3) (25 km and staggered vertical levels); - Major update Global Ensemble Prediction System (GEPS v3) - Operational implementation of surface pollutants analysis - Experimental implementation of global sea-ice analysis - Experimental implementation of a new hydro-dynamical model for a portion of the Gulf of St-Lawrence - etc. Planned improvements for the coming year will also be presented, as for example: - Adding to the GEPS system a monthly forecast component; - Update to the REPS system - Coming updates to the SCRIBE now-cast and to the Canadian Precipitation Analysis (CaPA - RDPA) systems (incorporating radar data). - Implementing in parallel mode a new EnVar assimilation system - Implementing in parallel mode a new global prediction system Yin-Yang (at 15 km) - Implementing experimental land and surface forecast and assimilation systems (CaLDAS);
2B1.5 ID:6859 11:30
On the use of Numerical Weather Prediction models in Space Geodesy Marcelo Santos , Matthew Mcadam (Presented by Marcello Santos ) University of New Brunswick Contact: [email protected]
One of the error sources that plague satellite positioning is the refraction that electromagnetic signals suffer while crossing the neutral atmosphere. To account for that, space geodesy has relied on tropospheric models, that provide the zenith delay, and on mapping functions, that map the zenith delay onto the satellite's elevation angle. More recently, zenith and slant delay have been computed using information extracted from Numerical Weather Prediction models. In particular, to support the Global Geodetic Observing System, a service was developed to provide zenith delays and the "a" coefficient of the VMF1 mapping function on a global grid. This service, based at the University of New Brunswick, uses 2 data sources: NCEP Reanalysis 1 and CMC Global Deterministic Prediction System (GDPS). This service runs in parallel to a similar one based in Europe, using ECMWF. This presentation will introduce the problem of neutral atmosphere delay and how information from NWP can be used to address it. It will present the UNB-VMF1 service and discuss comparisons using NCEP and CMC NWPs, including effects on station heights, orography and land-mass interface issues, and validations at position domain. It is shown that results using CMC's are of overall better quality than NCEP's.
General Hydrology PART 4 / Hydrologie en général PARTIE 4
Room / Endroit (TCUP Salon B), Chair / Président (Sean Carey ), Date (28/05/2013), Time / Heure (10:30 - 12:00)
2B2.1 ID:6306 10:30
River evaporation and its corresponding heat flux in forested catchments Audrey Maheu 1, Daniel Caissie 2 1 Institut national de la recherche scientifique 2 Fisheries and Oceans Canada Contact: [email protected]
River water temperature is a very important variable for the management of fisheries and aquatic resources as it can impact fish distribution, growth, mortality and community dynamics. Evaporation is an important heat loss term in the heat budget of rivers, but it is a process still poorly understood due to the challenge of making direct measurements. This study aimed at 1) characterizing the evaporative heat flux at different scales (brook vs. river) using direct measurements of river evaporation and 2) developing a mass-transfer model to improve the estimation of the evaporative heat flux in a stream temperature model at the hourly time step. River evaporation was measured in a medium-sized river (Little Southwest Miramichi) and small brook (Catamaran Brook) in New Brunswick, Canada, using a mass-balance approach with floating minipans. Using these direct measurements of evaporation, we developed mass transfer equations to estimate hourly evaporation from microclimate conditions measured 2 m above the stream. River evaporation was more important in the large river with a daily evaporation rate of 3.0 mm day-1 in the Little Southwest Miramichi River and 1.0 mm day-1 in Catamaran Brook. Results suggest an inverse relationship between stream width and the slope of the wind function. Atmospheric stability also influenced the river evaporation process and the intercept of the wind function was smaller under unstable (nighttime) conditions than under stable (daytime) conditions. River evaporation was the main heat loss mechanism in the two studied streams. River evaporation was responsible for 42 % of heat losses in the Little Southwest Miramichi River and 32 % of heat losses in Catamaran Brook during the summer. The overall RMSE of the hourly water temperature model was 0.2 °C at the Little Southwest Miramichi River and 0.4 °C at the Catamaran Brook.
2B2.2 ID:6538 10:45
A Two-Dimensional numerical model of flow in the Lower Athabasca River: a Case Study Shalini Kashyap , Yonas Dibike , Terry Prowse

Environment Canada, Water and Climate Impacts Research Center (W-CIRC) @ University of Victoria Contact: [email protected]
The Athabasca River drains an area of more than 130,000 km2 and extends more than 1200 km from the Columbia Icefield in the Rocky Mountains, through the Peace-Athabasca delta, which is one of the largest freshwater deltas in the world, until it drains into Lake Athabasca. Hydraulic processes within the river may be considerably complex as it contains tortuous regions and sharp bends, discharges which vary considerably between the winter and summer months, and rapids where water velocities may increase substantially. The river flows through regions which support numerous developments such as forestry and pulp mills, mining operations, and agricultural lands, and therefore its hydraulic processes, and their potential effects on erosion and deposition are of interest. Such hydraulic analysis requires the use of numerical modeling to better understand flow characteristics and areas prone to erosion and deposition. Although 3-D numerical analysis is impractical due to computational cost, a 2-D numerical method could be very effective to apply to such a long river reach. This study employs a 2-D numerical software called Environmental Fluids Dynamics Code (EFDC) to analyze flow in a section within the mid to lower reach of the Athabasca River. EFDC solves the Reynolds Averaged Navier Stokes equation to predict flow with a preconditioned conjugate gradient procedure to predict water surface elevation. Acoustic Doppler Current Profiler data is used for bathymetry measurements input into the model. Validation of the model results is completed using water surface elevations collected with Global Positioning System (GPS) and water velocities collected using a Gurley current meter.
2B2.3 ID:6527 11:00Assessment of uncertainty in modelling the hydrologic responses of the Athabasca watershed using an ensemble approach Hyung-Il Eum , Yonas Dibike , Terry Prowse Environment Canada, Water and Climate Impacts Research Centre (W-CIRC) @ University of Victoria Contact: [email protected]
From its headwaters in the Rocky Mountains to its outlet at Lake Athabasca, the Athabasca watershed includes diverse hydro-climatic and physiographic regimes with different patterns of precipitation and temperature, land cover and soil type. Such complex hydro-climatic regimes increase the uncertainties in model simulations of hydrologic processes, such as evapotranspiration, streamflow generation, and snow accumulation, ablation and melt. This study assesses the full scope of these uncertainties using different hydrologic models and climate forcings dataset. Specifically, three physical-based and distributed hydrologic models are used, namely: the Variable Infiltration Capacity model (VIC), System Hydrologique European (MIKE SHE) and Modelisation Environmentale communautaire-Surface and Hydrology (MESH). The driving climate data were

obtained from the North American Regional Reanalysis (NARR), the Canadian Precipitation Analysis (CaPA), and the thin plate-smoothing splines (ANUSPLIN). Each hydrologic model is calibrated and validated based on the different climate forcings while the VIC model is also calibrated using different calibration windows to arrive at different sets of optimal model parameters. Finally, uncertainties with respect to hydrologic models, forcing data and model parameters are evaluated via statistical analysis of the measured and simulated hydrologic responses at representative gauging stations in the Athabasca watershed.
2B2.4 ID:6544 11:15
State variables updating of a distributed hydrological model by ensemble kalman filtering
Mabrouk Abaza Université Laval Contact: [email protected]
Data assimilation holds considerable potential for improving hydrologic predictions as demonstrated in numerous studies. Because hydrological models are imperfect, hydrologists need to continuously update the state variables of their model in order to adapt to day to day situations. This project examines the benefits of updating state variables of a distributed hydrological model in simulation. Soil moisture in the intermediate layer, soil moisture in the deep layer, and land flow are thus updated using sequential data assimilation technique (Ensemble Kalman filter) with 50 ensemble members based on observed runoff in a real-time mode. Such assimilation aims providing optimized initial states which can be used as initial conditions for flood forecasts. The case study is set on the 738 km2 Saumon catchment (Québec-Canada). To the authors knowledge, this is the first EnKF implementation for the operational distributed model Hydrotel, which is used for a variety of applications including real time flood forecasting, using meteorological forecasts, and the estimation of hydrological effects resulting from changes in the physical characteristics of a basin. Results of assimilation indicate that the updating procedure indeed improves the simulation substantially. The model performance is evaluated using the Nash-Sutcliffe Efficiency criterion and the RMSE.
2B2.5 ID:6725 11:30
A Multi-Scale Hydroclimatic Analysis of Runoff Generation in the Athabasca River, Western Canada Daniel Peters 1, David Atkinson 2, Wendy Monk 3, David Tenenbaum 4, Donald Baird 3 1 Environment Canada @ W-CIRC, Univeristy of Victoria 2 Dept. Geography, University of Victoria 3 Environment Canada @ CRI, University of New Brunswick 4 Physical Geography and Ecosystem Science, Lund University

Contact: [email protected]
A multi-scale hydroclimatic study of runoff generation in the Athabasca River watershed located in western Canada is presented. Mann-Kendall trend detection tests performed on hydrometric data for the lower Athabasca River (LAR) revealed predominantly significant (p<0.05) declines in annual and open-water season median/mean runoff indices over 1958-2009, with the ice-influenced season experiencing significant declines in the median and not the mean. The presence or absence of significant declines in the 25th and 75th runoff percentiles helped explain these results. The only noteworthy result from the mid-point of the watershed was a probable (p<0.10) decline in median open-water runoff, which was not seen over the 1913-2009 period. Divergent seasonal runoff trends from the headwater zone were seen since 1958 and back to 1913; increasing ice-influenced and declining open-water season runoff trends. Although precipitation was observed to decline over 1958-2009, only the LAR watershed scale annual index emerged as a probable decline. Multiple non-linear regression analysis indicated that variation in precipitation explained >67% of the annual median/mean LAR runoff variability since 1958. A first-order precipitation driven hindasting model suggested that LAR watershed scale runoff may have increased since 1913, warranting further study. A correlation analysis of climatic teleconnections with median/mean runoff indices revealed that the winter North Pacific American index showed a strong, positive association with open-water runoff. The results from our study demonstrated that potentially inconsistent and/or divergent trend results can be obtained when using different time periods and/or regions of the watershed, emphasizing that extreme caution should be exercised when extrapolating sub-watershed results to the watershed scale, or to adjacent watersheds. Our multi-scale study approach also identified the drainage area between Athabasca and Fort McMurray as a zone that influenced runoff declines observed at the LAR watershed scale since 1958, which warrants further investigation with competent hydrological models.
2B2.6 ID:6703 11:45Development of a national hydrokinetic resource assessment for Canadian rivers using regionalization techniques
Wayne Jenkinson 1, James Bomhof 2, Martin Serrer 1 1 National Research Council 2 University of Ottawa Contact: [email protected]
As a nation with extensive water resources, Canada has a substantial river current potential energy resource which remains largely untapped, but the size of this national resource is unknown. Natural Resources Canada has identified a need to assess the gross theoretical potential of river current power as a national renewable resource. This paper represents the conclusion of a 3-year study quantifying the national hydrokinetic resource potential in rivers reaches across Canada. This study evaluated and employed methods of assessment of the

hydrokinetic potential of river reaches at a regional or watershed scale using hydrometric and physiographic datasets currently available. The analysis implemented regionalization techniques nationally, including the estimation of flow duration curves (FDCs), mean monthly flow, channel geometry, and hydrokinetic potential at ungauged locations. The final flow and hydrokinetic power estimates were derived using a canonical correlation analysis with multiple linear regression and validated against flow and current velocity data collected at Environment Canada hydrometric stations. This assessment will assist with government policy and decision making and is essential for industry to identify focus areas and assess overall market potential.
Climate Change Modelling and Water Resources PART 2 / Modelisation du changement climatique et ressources hydriques PARTIE 2
Room / Endroit (TCUP Salon C), Chair / Président (Howard Wheater ), Date (28/05/2013), Time / Heure (10:30 - 12:00)
2B3.1 ID:6479 10:30Extreme Precipitation under Climate Change Conditions: Validation of a Regional Climate Model over a Small Watershed Using a Spatial Statistical Disaggregation Model Patrick Gagnon , Alain N. Rousseau Institut National de la Recherche Scientifique - Centre eau, terre et environnement Contact: [email protected]
Regional Climate Models (RCMs) are valuable tools to evaluate impacts of climate change (CC) at regional scale. However, as the size of the area of interest decreases, the ability of a RCM to simulate extreme precipitation events decreases due to the RCM spatial resolution. Thus, it is difficult to: (i) evaluate whether a RCM bias on localized extreme precipitation is caused by the spatial resolution or by a misrepresentation of the physical processes by the model and (ii) consequently assess projections of CC impacts for localized extreme precipitation. Spatial statistical disaggregation models can bring the RCM precipitation data at a finer scale and reduce the bias caused by the spatial resolution. In addition, disaggregation models can generate an ensemble of outputs, producing an estimate by interval instead of a unique punctual estimate.

The objective of this work is to illustrate how a spatial statistical disaggregation model applied on extreme daily precipitations can provide a framework to assess a RCM for a period of reference and help to evaluate the impacts of CC over a small area. Three simulations of the Canadian RCM (CRCM) covering the period 1961-2099 are used over a small watershed (130 sq km) located in southern Quebec, Canada. The disaggregation model applied is based on Gibbs sampling and accounts for physical properties of the events (wind speed, wind direction, and convective available potential energy (CAPE)), leading to realistic spatial distributions of precipitation. The use of the disaggregation model reduces significantly the impact of the RCM spatial resolution and enables the estimation of the level of significance for the difference between observed and simulated extremes for the reference period. The results indicate that the three simulations tend to overestimate precipitation, but with different levels of significance. When comparing to the RCM raw data, the disaggregation does not affect the CC signal, and does indicate that the impact is statistically significant for each simulation tested.
2B3.2 ID:6720 10:45
Quantifying uncertainty in regional climate model projections over British Columbia watersheds Charles Curry 1, Andrew Weaver 1, Daniel Caya 2, Michel Giguere 3, Edward Wiebe 1 1 School of Earth and Ocean Sciences, University of Victoria 2 ESCER, Université du Québec à Montréal and Ouranos Consortium 3 Ouranos Consortium Contact: [email protected]
Climate model projections are characterized by three principal sources of uncertainty: 1) model error, which results from incomplete parameterizations of real world processes; 2) scenario uncertainty, which reflects unknown climate forcings in the future; and 3) natural (unforced) variability, which results from the numerous non-linear interactions amongst different components of the real or modelled climate system. The range of results obtained from an ensemble of model simulations each with slightly perturbed initial conditions, known as model internal variability, can be used to estimate the magnitude of natural variability in the real climate system. In the global mean, and for a projection horizon longer than a few decades, the role of internal variability has been shown to be minor compared to the former two uncertainties. However, at the regional scale, model internal variability can be much more important, even dominating scenario uncertainty in specific sub-continental regions. In this study, the role of model internal variability is studied using an ensemble of 10 climate model simulations over Western Canada with a single regional climate model (RCM), the Canadian Regional Climate Model, CRCMv.4.3. Eight ensemble members are driven at the large (continental) scale by a different global climate model simulation over the period 1950-2060, while the remaining two members are driven by global reanalyses up to 2005 only. Of particular interest is the spread amongst model

projections of surface temperature and hydrological variables at sub-regions within the RCM domain corresponding to specific watersheds. We focus on three British Columbia watersheds, the Peace, Nechako and Upper Columbia basins and two comparison periods, 1979-2000 and 2039-2060. While the ensemble members agree reasonably well with respect to present-day climatology over these watersheds, projected changes of climate variables vary widely across the ensemble, especially with respect to fall and winter temperature and precipitation. Snowpack, especially, is particularly variable from one realization to the next, leading to considerable uncertainty in projected spring runoff. These results imply that relying on only one or even a few realizations of climate model response over watershed-scale regions is not sufficient to capture the uncertainty associated with climate variability, either real or modelled.
2B3.3 ID:6864 11:00
Towards a quantification of the different sources of uncertainty in hydro-climatic projections Blaise Gauvin-St. Denis 1, Marco Braun 1, Catherine Guay 2, Marie Minville 2, Frédéric Guay 2, Simon Ricard 3, Simon Lachance-Cloutier 3, Noël Évora 4 1 Ouranos 2 Institut de Recherche d'Hydro-Québec 3 Centre d'Expertise Hydrique du Québec 4 Rio Tinto Alcan Contact: [email protected]
The projection of river flow characteristics for the century to come requires the use of a complex modelling chain. Its components range from socioeconomic hypotheses to produce greenhouse gas emission scenarios, physical models of the ocean and atmosphere, post-treatment methods and hydrological models. Each of these components represent a source of uncertainty. As the number of models and methods available continue to increase, it becomes increasingly difficult to produce and analyze a complete projection ensemble. Facing this reality, it is essential to have a good understanding of each source of uncertainty and to quantify their importance. This exercise is presented here for various indicators representing mean, high and low flows within the context of the (cQ)2 project, which is a collaboration between Ouranos, Hydro-Québec, the Centre d'expertise hydrique du Québec and Rio-Tinto-Alcan with the goal of producing a consistent picture of the impact of climate change on surface waters over the entire Québec territory.
2B3.4 ID:6433 11:15
Multi-Model Climate Change Impact and Uncertainty Assessment on the Hydrology of a Northern, Data Sparse Catchment Steven Bohrn 1, Tricia Stadnyk 2, Kristina Koenig 1 1 Manitoba Hydro, Water Resource Engineering 2 University of Manitoba, Department of Civil Engineering
Contact: [email protected]
Climate and hydrological models are relied on to provide predictions of both current (in the case of sparse gauge networks), and future streamflow. Water regulators utilize these predictions to improve efficiencies and optimize operations, therefore uncertainty in these predictions is increasingly important to identify. The objective of this research was to quantify, with imposed limits of uncertainty, the impacts changes in climate over the next 70 years may have on the hydrological regime of a sub-basin of the Churchill River. Three hydrological models of varying complexity (WATFLOOD, HMETS, and HBV-EC) were forced for 2 time periods (2050s, 2080s) by 25 different GCMs and 3 different GHG emission scenarios (A2, B1 and A1b); culminating in over 139 different simulations of future streamflow. Envelope curves of predicted streamflow were generated, with imposed uncertainties due to (1) hydrologic model structure, (2) climate model selection, (3) choice of emission scenario, and (4) model parameterization. Climate change simulations indicated that the overall average was a predicted small increase in flow for the 2050s, and a slight decrease for the 2080s future time horizon. Each hydrological model predicted an advance in the timing of the freshet peak accompanied by a shift in the low flow events to either earlier in the year or to the end of the open water period for both future time periods. Uncertainty analyses performed on the results indicated that the chief contributor of uncertainty was the selection of GCM followed by hydrologic model structure with other less significant sources of uncertainty being the parameterization of the hydrological model and the selection of emissions scenario.
2B3.5 ID:6657 11:30Hydrologic-Land Surface modelling of future streamflows in Rocky Mountain Headwater Basins, Western Canada Muluneh Mekonnen , Howard Wheater , Kwok Chun , Ali Nazemi , Andrew Ireson School of Environment and Sustainability and the Global Institute for Water Security Contact: [email protected]
This paper investigates the feasibility of generating reliable streamflow predictions for the head waters of the South Saskatchewan River Basin (SSRB) using data from the North American Regional Climate Change Assessment Program (NARCCAP). NARCCAP data from multiple Regional Climate Models (RCMs) (both hindcast and future) are available for most of the Southern parts of Canada. Streamflow can be estimated in two ways: 1) by direct aggregation of the surface and sub-surface runoff fields from NARCCAP RCMs within the sub-basin of interest, and 2) by use of the NARCCAP primary fields of atmospheric variables to drive hydrologic-land surface schemes (HLSSs). Due to the coarse resolution of the NARCCAP fields and crude representation of the surface and sub-surface runoff process in the climate models, direct application of the data for streamflow prediction requires cautious investigation. However, finer scale gridded and long-term observation precipitation data (ANUSPLIN developed by
Agriculture and Agri-Food Canada (AAFC)) are available for Canada. These locally available and finer resolution data can be assimilated into the NARCCAP fields to improve the HLSS-based streamflow prediction. Environment Canada’s coupled hydrological-land surface model is used to test the proposed approaches in one of the head waters of the SSRB. Canadian Regional Climate Model output driven by NCEP (National Centers for Environmental Prediction) data for the period 1991 to 2003 is used to force the HLSS model. Monte Carlo based calibration and validation simulations indicated that assimilation of ANUSPLIN precipitation produced significant improvement in streamflow predictions when compared to: 1) the direct aggregation of the surface and sub-surface runoff NARCCAP fields, and 2) streamflow predictions using NARCCAP primary fields. The results of this study have implications for future streamflow prediction using NARCCAP data, which can be further used to analyze different water security concerns due to potential climate change and anthropogenic effects.
2B3.6 ID:6328 11:45
Databased Evaluation Of Direct Downscaling And Downscaling With Hydrological Model Using Sparse Bayesian Learning And Multiple Linear Regression Deepti Joshi 1, Andre St-Hilaire 1, Anik Daigle 1, Taha Ouarda 2, Nathalie Thiemonge 3 1 INRS-ETE, University of Quebec, 490 de la Couronne, Quebec G1K 9A9, Canada 2 Masdar Institute, Professor & Head - Water & Environmental Engineering, PO Box 54224, Abu Dhabi, Uni 3 Ingénieure en hydrologie– Équipement, Unité Conception des aménagements de production Hydrauliques e Contact: [email protected]
This work explores the potential advantages and disadvantages involved in using a hydrological model for downscaling hydrological indices (HIs) representing the low flow regime of three rivers in Eastern Canada: Moisie, Romaine and Ouelle. The selected HIs cover four aspects of low flow regime: amplitude, frequency, variability and timing. Two downscaling frameworks, respectively termed as direct downscaling and indirect downscaling are compared. The single-step direct downscaling framework establishes a direct link between large scale atmospheric variables (predictors) and low flow indices (the predictands). The two-step framework or indirect downscaling includes downscaling precipitation and air temperature that are subsequently used as inputs for the selected hydrological model. For the current work the Streamflow Synthesis and Reservoir Regulation (SSARR) model, a lumped conceptual hydrological model is used. The statistical models used for downscaling are: 1) a non-linear probabilistic Bayesian algorithm known as Sparse Bayesian Learning (SBL); and 2) Multiple Linear Regression (MLR). MLR approach comprises of selecting predictors using backward stepwise regression followed by using the selected predictors as independent variables in a multiple linear regression. The SBL approach constitutes of predictor selection using canonical correlation analysis followed by

introducing the canonical variable scores into relevance vector machine (RVM), which is an implementation of SBL algorithm. In conclusion, this work compares four frameworks- direct downscaling using SBL (DDSBL) and MLR (DDMLR) and indirect downscaling using SBL (IDSBL) and MLR (IDMLR). The results showed that direct downscaling using RVM surpassed the rest with respect to goodness of fit and generalization ability. For some indices, particularly the variability index, IDSBL and IDMLR performed better than DDMLR because predicted values corresponding to certain lower values of the index were found to be negative leading to higher values of goodness of fit. Keywords: Downwscaling, Sparse Bayesian Learning, Multiple Linear Regression, Low Flows
CANCID 2- Agricultural Water Conservation & Efficiency / Gestion efficace de l'eau en agriculture
Room / Endroit (TCUP Salon D), Chair / Président (Abdel-Zaher Kamal Abdel-Razek ), Date (28/05/2013), Time / Heure (10:30 - 12:00)
2B4.1 ID:6461 INVITED/INVITÉ 10:30Irrigation Water Use - Increasing Efficiency and Productivity
Brent Paterson Alberta Agriculture and Rural Development Contact: [email protected]
The world’s population is expected to grow to about 9 Billion by 2050. Population, combined with increased per capita caloric intake and per capita meat consumption, will require a significant increase in global food production. Irrigation is recognized as the cornerstone of world food security. It is practiced on about 17% of the world’s agricultural land base, while producing about 40% of the world’s food supply. Up to 80% of future food requirements may need to be met by irrigation. Many countries depend on irrigated agriculture to meet their food security requirements. Unfortunately, irrigation efficiency is very low for many developing countries, and competition for limited water supplies is increasing pressure to transfer irrigation water to other uses. It is critical that improvements be made to irrigation water use efficiency and productivity to ensure the effective use of finite water resources. Canada is seen as one of a relatively few countries that will have sufficient water in the future to help meet future world food requirements. But even Canada faces regional challenges for limited water supplies. In Alberta, which has almost 70% of Canada’s irrigated land, increasing competition for water requires the irrigation industry to

demonstrate the effective use of water applied to crops. Alberta Agriculture and Rural Development works closely with the irrigation industry to test and implement technologies that will increase conservation, efficiency and productivity of irrigation water. Producer adoption of more efficient sprinkler irrigation technologies has increased on-farm irrigation efficiency from 35% in 1965 to 74% in 2008. Ongoing research and incentives are expected to further improve overall on-farm irrigation efficiency to at least 85% by 2025.
2B4.2 ID:6549 11:00
The Future of Agriculture in the Canadian West, Opportunities to Address Global Food Security
David Hill University of Lethbridge Contact: [email protected]
It is possible that no other region in the world has as much potential opportunity to address global food security issues as western Canada. With a growing global population and the spectre of improving economic conditions in the developing world global food demands are likely to increase dramatically -- while at the same time creating new global food competitors for Canadian producers. Add to this the fact that the Canadian west is beginning to see increased competition for water from population growth, industrial development, and a growing recognition that improving environmental outcomes, even in the face of climate variability and change needs to be addressed. Against this backdrop, the Canadian west still has a significant opportunity to address global food security issues through dramatically increased food production, improvements and expansion of irrigated land, the fostering of new value-added agricultural processing opportunities, all in a manner that would increase economic value to Canada and producers, while ensuring the proper husbanding of natural resources. This will not, however, happen by accident. This paper will explore the range of opportunities and challenges that exist and posit a path forward to a sustainable economic and environmental future for the Canadian west.
2B4.3 ID:6419 11:15
Alberta’s Irrigation Database – What do we have and How do we use it?
Roger Hohm , Lloyd Healy Alberta Agriculture and Rural Development Contact: [email protected]
Alberta Agriculture and Rural Development along with the irrigation District have developed a comprehensive irrigation district database. This database continues to grow but was originally described as the District Data Information Tool (DDIT)

was originally designed to assist the irrigation districts of Alberta in collecting system and crop information. Much of the database has query enabled features and has a GIS interface which is updated annually and incorporates irrigation district reported crop, on-farm irrigation system, water deliveries, diversions, return flows, climate data and distribution infrastructure information. Information in the database is broken down to the individual irrigation turnout, quarter section and ditchrider block but can be rolled up to district, sub-basin or basin reporting. The current version of the database is capable of tracking, billing and analyzing; acreage assessments, water allocations, allocation trades/sharing, water deliveries, non-irrigation water demands and trends in climate change. Through a web based interface, irrigation district personnel are able update changes to on-farm and district owned infrastructure, crops and water delivery information over the Internet or through a web enabled cellular phone. The irrigation district database is not only good for annual reporting of changes to crop mix or irrigation systems but can be used to analyze water use within a district, identify areas needing improvement in water management and determining trend in cropping alternatives. This presentation will discuss the data gathered, how it is received and where the database resides and how queries are made within the systems operations. We will discuss in detail some of the many opportunities which exist because of having a web-based database which is assessable by districts, government and other authorized individuals.
2B4.4 ID:6422 11:30
Irrigation District Expansion in Alberta – limits, issues and opportunities. Roger Hohm , Lloyd Healy Alberta Agriculture and Rural Development Contact: [email protected]
Alberta is fortunate to have a world-class irrigated agricultural industry and is presently irrigating about 640,000 hectares which represents approximately 70 percent of Canada’s total irrigated area. The irrigation industry provides more than 20 percent of Alberta’s total agricultural production which includes over 30 percent of the provinces food processing returns associated with irrigation.Irrigation has been practiced for over 100 years in Alberta, and because of innovation and leadership the number of irrigated acres has expanded rapidly over the past two decades. Availability of irrigable land and producers wishing to irrigate is not the limiting factor in Alberta; water is the limitation in the irrigated region of the province. The expansion limit of irrigation districts was set in the 1991 SSRB Water Allocation Regulation. The limit was based on the total volume of water allocated to a district for; water required at the farm; canal losses; evaporation from reservoirs; and return flows. This regulation limited the volume of water a district could divert but not the number of acres that could be irrigated if improvements were made to efficiencies in water management and operations. If an irrigation district wishes to change their expansion limit the Irrigation Districts Act requires the holding of a public meeting and plebiscite of the

irrigators. The district must also make the following information available to the public: (a) volume of water allocated to the district; (b) volume of water lost from canals and reservoirs; (c) return flow volume; (d) water volume for other uses; (e) remaining volume available for crops; (f) gross volume required per acre; (g) total acres that could be irrigated based on the volumes; (h) present limit; (i) current assessment (j) proposed expansion limit. Since the setting of the regulation limits on irrigation acres in 1991, eight of Alberta’s 13 irrigation districts have voted in favour of increasing their expansion limit. These eight districts have voted to add close to 76,000 hectares to the expansion limits of Alberta’s irrigation districts. This presentation will highlight the motivation behind irrigation district expansion and show how the irrigation industry contributes to water savings through conservation and efficiencies. This presentation will also show producer costs, identify future opportunities and touch on issues that may arise as a result of an expanded irrigation industry.
Health Issues of Weather and Climate / Questions de santé reliées à la météo et le climat
Room / Endroit (TCUP Gall. Suite 1), Chair / Président (Denis A. Bourque ), Date (28/05/2013), Time / Heure (10:30 - 12:00)
2B5.1 ID:6408 10:30Potential Impacts of Climate Change on the Winter Road Season in the Western James Bay Region of Northern Ontario
Yukari Hori 1, Benita Tam 1, Leonard Tsuji 2, William Gough 1 1 Department of Physical and Environmental Sciences, University of Toronto at Scarborough 2 Department of Environment and Resource Studies, University of Waterloo Contact: [email protected]
In northern Canada, winter roads provide not only the transport of heavy equipment, fuel, and cargo at a low cost, but also facilitate social and cultural interactions between remote communities. The seasonal length of the roads depends on particular meteorological factors which play a significant role in determining the viable operating season of winter roads. However, an increase in mean air temperature has been observed at higher northern latitudes by instrumental records and indigenous observations. Projected increases in winter air temperatures by the end of the century will have a profound effect on winter roads and their seasonal life. Climate change is of particular importance to people of the western James Bay region of northern Ontario, particularly to the
remote-northern First Nations, because of the potential impacts on winter roads which are critical to sustain their way of life. The purpose of this study is to identify a temporal trend for the historical opening and closing dates of James Bay winter road, as well as to link there to meteorological conditions. In this study, we focused on examining the trends of freezing degree-days (FDDs) and landfast ice thickness across the western James Bay region. This study is part of a larger initiative in developing effective adaptation strategies for remote-northern indigenous communities in Ontario.
2B5.2 ID:6760 10:45
Probability Of Tornado Occurrence Across Canada Vincent Cheng 1, George Arhonditsis 1, David Sills 2, Heather Auld 2, Mark Shephard 2, William Gough 1, Joan Klaassen 2 1 University of Toronto 2 Environment Canada Contact: [email protected]
The number of tornado observations in Canada is believed to be significantly lower than the actual occurrences. To account for this bias, we propose a Bayesian modelling approach founded upon the explicit consideration of the population sampling bias in tornado observations, and the causal association between cloud-to-ground (CG) lightning flash climatology and tornado occurrence. The latter variable was used as an indicator for quantifying convective storm activity, which is generally a precursor to tornado occurrence. The CG lightning data were generated from an 11-yr lightning climatology survey (1999-2009) from the Canadian Lightning Detection Network. Our results suggest that the predictions of tornado occurrence in populated areas are fairly reliable with no profound underestimation bias. In sparsely populated areas, our analysis shows that probability of tornado occurrence is significantly higher than what is represented in the 30-yr data record. Areas with low population density but high lightning flash density demonstrate the greatest discrepancy between predicted and observed tornado occurrence. We also conducted a sensitivity analysis with various grid sizes. We found that the predictive statements supported by the model are fairly robust to the grid configuration, but the population density per grid-cell is more representative to the actual population density at smaller resolution, and therefore more accurately depicts the probability of tornado occurrence. Finally, a tornado probability map is calculated for Canada, based on the frequency of tornado occurrence derived from our model and the estimated damage area of individual tornado events.
2B5.3 ID:6694 11:00
Waterloo Park satellite image surface temperature heat analysis
Carol Moogk-Soulis Technical Aids Consulting Services

Contact: [email protected]
Urban parks are used for active and passive recreation and for cultural and festival venues. People attend regardless of the weather. However, recent studies have shown that urban parks can have surface temperatures, on a sunny day, of over 100 degrees Celcius. These temperatures affect activities and pose, a not widely known, health risk. This presentation will describe the results of an analysis of the entire park surface of a 123 year old, 45 hectare urban park using satellite images to measure surface temperatures. The results of the analysis will be used to ameliorate dangerously hot areas, relocate some events to cooler locations and warn the public of areas of risk.
2B5.4 ID:6550 11:15Decision support tool for heat warnings in urban areas Philippe Martin , Sylvain Labrecque , Didier Davignon Environment Canada Contact: [email protected]
As heat-waves are likely to increase in frequency because of global climate change, authorities of large cities like Montreal need to develop and evaluate warning systems to prevent and protect vulnerable populations. Because of its physical characteristics, a city is capable of storing more heat than the surrounding countryside. This phenomenon known as urban heat island can also be observed at the intra-urban scale where, for example, the air temperature recorded at the reference station (airport) may not necessarily reflect the air temperature in various sectors of the city where people live. Therefore, alert thresholds defined by health authorities can be reached locally before they are attained for the entire city. One of the actual challenges for Environment Canada is to issue High Heat and Humidity warnings in a timely manner. To do this, the weather forecasted by the models (for the reference station) and the heat island effect, where air temperatures can be exacerbated locally depending on the land cover and atmospheric conditions, must be taken into consideration. The use of thermal satellite images offers an insight into the surface temperatures of a city that act directly on the temperature in the canopy layer. In establishing a link between air and surface temperature through a statistical analysis of urban meteorological measurements from private and public weather stations networks and surface temperatures measured by different satellite sensors, the MSC-QC wants to develop a decision support tool based on a remote sensing approach. The objective is to enable the forecaster to issue a heat related warning or to expect different temperatures within the city with more

confidence.
2B5.5 ID:6448 11:30
Effects of precipitation on road collisions in Edmonton Phillipa Cookson-Hills , Gerhard Reuter , Clark Pennelly University of Alberta Contact: [email protected]
There have been 23,442 car accidents on Edmonton roads – an average of 64 a day. These collisions resulted in millions of dollars in property damage. 4446 people were injured in collisions, and 22 people paid the ultimate price, dying as a result of collisions on Edmonton streets. The objective of our investigation was to quantify the effects of weather conditions on the number of road accidents, particularly the additional risk of accidents due to the presence of rain and snow. We used the data of hourly road reports collected by the Office of Traffic Safety (OTS) of Edmonton for the three year period from 1 January 2007 to 31 December 2011. These accident reports were correlated with the weather data recorded by Environment Canada. We used the matched-pair method to calculate the risk of road accidents due to the presence of precipitation. Both snow and rain were found to be a major contributors to the daily number of road collisions in the City of Edmonton. Also, the likelihood of an injury was higher due to rain and snow. There was a monotonic increase in the risk ratio of car accidents with increasing amount of snow fall. Positive correlation was found between the number of accidents on high frequency accident days and the type of weather on that day.
Mining Geophysics PART 1 / Géophysique minière PARTIE 1
Room / Endroit (TCUP Gall. A), Chair / Président (Jim Merriam ), Date (28/05/2013), Time / Heure (10:30 - 12:00)
2B6.1 ID:6843 INVITED/INVITÉ 10:30Inversion of seismic data John Bancroft , Naser Yousefzadeh , Hassan Khaniani University of Calgary Contact: [email protected]
The processing of seismic data has progressed significantly in the last few years
from estimating the structure of the subsurface to seismic inversion for better characterizing the rock properties. Two seismic inversion processes that are of interest are Least Squares Migration (LSM) and Full Waveform Inversion (FWI). LSM defines a diffraction matrix, and then uses the prestack seismic data to invert for a reflectivity model. The estimated reflectivity model contains higher frequencies than a conventional migration but is a computationally expensive process and requires very large computer memory. FWI is a promising process that builds a velocity and density subsurface model, then computes synthetic data from the model and compares it to the real data. The difference between the synthetic and real data is used to update the velocity and density models. This method requires a smooth starting velocity and is somewhat sensitive to noise. The basic physics, some of the advantages and disadvantages of both methods will be presented along with examples of their application.
2B6.2 ID:6878 11:00
Developments in Adaptation of Seismic Methods in the Athabasca Basin. Zoltan Hajnal , Erno Takacs , Bhaskar Pandit Department of Geological Sciences, U of S Contact: [email protected]
The basement beneath the Proterozoic Athabasca Basin has a complex tectonic history, exhibited by the intricacy and diversity of its structural environment. The characteristically high grade uranium mineral deposits are also a unique signature of this geologic realm. Only the mainly shallow, eastern one third of the basin has been comprehensively explored. Seismic method was introduced, as an exploration tool in an attempt to map in detail the following: basement structural framework, establishment of direct association between the exceptional mineralization and the tectonic background, definition of characteristic seismic signatures indicative of mineralization. Also a very important aim was to establish the modifications required to make the technique a practical, effective tool for search of mineralization within the vast deeper portion of the basin. Seismic reflection, data acquisition and subsequent analyses have been successfully attempted now at eight locations. Connections between major mineral zones and prominent basement structural anomalies are documented at several sites. These exceptional subsurface settings appear to be primary indicators of all the known ore deposits. Tomographic analysis and modeling of the seismic data detected variable alteration zones within the sandstone infill above all the investigated prominent ore deposits. Full-wave sonic log analyses and subsequent reprocessing of some field data both revealed that recognizable shear waves can be generated within the highly altered crystalline geologic environment of the basin. Experimental investigations indicate that integrated analyses of the P and S waves can lead to highly relevant seismic indicators of mineralization.
2B6.3 ID:6504 11:15

Development of a fibre optic broadband strain sensor Patrick Kanopoulos 1, Kaiwen Xia 1, Xijia Gu 2 1 University of Toronto 2 Ryerson University Contact: [email protected]
Fibre optic technology has evolved greatly over the past decades in both capability and economy. In the field of earth sciences and rock mechanics, fibre optically based interferometers, Bragg gratings, and Brillouin scattering has been used to measure strain from the centimeter to kilometer scale. The technology has been adapted to produce point sensors, quasi-distributed, and fully distributed strain sensors for many applications. In this presentation, the use of fibre Bragg gratings for broadband strain measurement is discussed. When mechanically coupled to the host material, a change in the reflected wavelength within the fibre at the Bragg grating is measured and the corresponding change in the material strain can be determined from this signal. The use of this method allows for multiple sensors to be multiplexed on a single fiber thus producing a quasi-distributed sensing system. The applicability of this approach to measure steady-state and transient strains in rock mechanics will be discussed with preliminary laboratory findings.
2B6.4 ID:6453 11:30
Cross-plot analysis of P and S-wave velocity data and their attributes (Poisson’s ratio, Lambda, Mu) obtained from Full Wave Sonic logging – Keefe Lake area, Saskatchewan Erno Takacs , Zoltan Hajnal , Bhaskar Pandit Department of Geological Sciences, University of Saskatchewan Contact: [email protected]
Full Wave Sonic (FWS) data sets obtained from two boreholes within the Keefe Lake property of Athabasca Uranium Inc. provided a unique opportunity to study P and S-wave velocity data and the elastic rock properties derived from them (Poisson`s ratio, Lambda, and Mu). The thickness of the Athabasca sandstone formations is around 180 m in the boreholes and the FWS measurements (SEMM Logging) penetrated deep into the crystalline basement (552 and 357 m) intersecting several fracture and alteration zones. Such zones are considered as possible locations of uranium mineralization in the Athabasca Basin. Poisson`s ratio, Lambda, and Mu are related to the stiffness of the rock. We analyzed their characteristic values focused especially for the detection of fracture and alteration zones by cross-plotting the data and concluded that the computed elastic parameter values derived from the boreholes were consistent in the above mentioned zones. Upon insertion of the elastic parameter logs into the closest seismic section, we investigated the extent of the anomalous zones in the vicinity of the boreholes. Potential of Amplitude Versus Offset (AVO) analysis and inversion for uranium exploration will be discussed. AVO has been successfully

used in hydrocarbon exploration for decades in detecting and mapping anomalous rock properties from properly processed (amplitude-preserved) pre-stack seismic data.
2B6.5 ID:6425 11:45
In-seam seismic reflection acquisition, processing and interpretation over a Winnipegosis mound Randy Brehm , Craig Funk Potash Corporation of Saskatchewan Contact: [email protected]
Winnipegosis mounds are irregular and complex carbonate reef-like structures which form the base of the Devonian aged Prairie Evaporite Formation in western Canada. Within the Prairie Evaporite is found extensive potash deposits across southern Saskatchewan, Canada. The mounds underlying the Prairie Evaporite are typically 70 to 100 meters high and can be many kilometers across. It is well known in the potash industry that mine-level disruptions in the potash ore, which can pose significant hazards to mining operations, are associated with the underlying mounds. Saskatchewan potash mining companies routinely collect 3D seismic surveys to identify and map zones of geological disturbances including Winnipegosis mounds. Gross structures in mound complexes are readily visible in the seismic volumes. In July, 2012, high-resolution in-seam seismic reflection data was collected over a known Winnipegosis mound. The purpose was to attempt to map more elusive and subtle stratigraphic variations in the mounds, which are not visible on surface seismic, in order to better understand these features. The data was collected with a 48 channel portable seismograph using single 100Hz geophones over a profile of 792 meters. The energy source was an arrayed sledge hammer. Bandwidth of the data was 300 to 1000 Hz. The unexpected presence of strong coherent shear wave reflections is found to be coincident with subtle bedding separations in the floor (floor heaves). It is postulated that these shear waves are generated when the hammer impacts generate lateral elastic flexure within the floor heaves. The resulting high-resolution in-seam profile is compared with the surface 3D. The in-seam profile has remarkable resolution; however, noise contamination from floor heaves and the generated S-waves reflections obscured parts of the section. More subtle stratigraphic mound detail is readily visible on the in-seam profile.
Atmospheric Hazards and Extreme Weather PART 1 / Hasards
atmosphériques et météo extrème PARTIE 1
Room / Endroit (TCUP Gall. B), Chair / Président (Bob Kochtubajda ), Date (28/05/2013), Time / Heure (10:30 - 12:00)
2B7.1 ID:6492 INVITED/INVITÉ 10:30
On weather-climate extremes and natural hazards over Canada
Ronald Stewart (Presented by Ron Stewart ) University of Manitoba Contact: [email protected]
Canada is subjected to a variety of weather-related extreme events and these commonly lead to property and infrastructure damage as well as human fatalities and injuries. No region is spared. Phenomena such as snowstorms, freezing rain storms, thunderstorms, tornadoes, hurricanes, drought and heat waves lead to copious precipitation amounts, extreme rainfall rates, floods, icing, hail, destructive winds, devastating dryness, heat stress and forest fires. Such extremes are a fundamental aspect of the climate system; they furthermore play a critical role within the global and regional cycling of water. This presentation illustrates the occurrence of such extremes and discusses their varying forcing mechanisms including chains-of-events and the tendency for some, such as heavy precipitation and drought, to occur simultaneously in adjacent regions. Such events are also expected to be altered in occurrence, timing and location in our changing climate due to alterations in temperature, moisture, stability and surface conditions. Even the tendency for events to produce more rain and less snow will bring hardship over some regions. Already, Canadian insurance companies report mounting weather-related claims although there is considerable year-to-year variation. This issue may well be the most encompassing one that the country has to face in terms of climate change. It affects virtually all aspects of society and our environment. Canada should move forward to better collectively document, anticipate, and cope with such events in today’s and tomorrow’s climate.
2B7.2 ID:6858 11:00High resolution extreme temperature scenarios over North America
Xuebin Zhang 1, Guilong Li 2, Francis Zwiers 3 1 Climate Research Division, Environment Canada 2 Meteorological Service of Canada – Ontario Region, Environment Canada 3 Pacific Climate Impacts Consortium, Victoria, BC, Canada Contact: [email protected]

We propose a framework for the construction of probabilistic projections of extreme temperatures at high resolution over North America using available simulations conducted by CMIP3 GCMs and by multiple regional climate models (RCMs). In this approach, we first establish statistical relationships between RCM simulated extreme temperatures and seasonal mean temperatures from the corresponding driving GCM, using a non-stationary generalized extreme value (GEV) distribution. We then apply such relationships to seasonal mean temperatures simulated by CMIP3 models to obtain downscaled high resolution extreme temperatures. Those statistically downscaled projections are used to estimate empirical quantiles of extreme temperature at various return levels. Uncertainties in the projected extreme temperatures are partitioned corresponding to four sources: differences in the structure of GCMs, GCM simulated internal variability, differences in the structure of RCMs, and statistical downscaling including internal variability at finer spatial scale. We found large spatial variability in projected future extreme temperature changes, with increasingly larger changes towards cold air outbreaks path in winter and larger changes in southwest of the great lakes in summer. Large changes in extreme temperature have been projected, for example, the probability of the current 20-yr return extreme hot temperatures could be doubled for about every 30-yrs. The difference in the structure of RCMs is the most important source of uncertainties. Difference in the projected extreme temperatures due to emission scenarios increases with time, but it is comparable with that in the projected mean temperatures. Using regional frequency analysis that combines multiple grids and multiple model simulations yields more robust estimation of the statistical relationship, resulting in smaller uncertainty in the projection of extreme temperatures.
2B7.3 ID:6873 11:15The exceptionally wet weather of June 2012: in historical context and its impact on BC Hydro operations
Tim Ashman BC Hydro Contact: [email protected]
Late spring and early summer 2012 were exceptionally wet in the South Interior of British Columbia and the interior of the US Pacific Northwest. This talk will focus on the Columbia basin, a large snowmelt-driven basin utilised by both BC Hydro and US agencies for hydroelectric power generation. The record June 2012 rains, which coincided with maximum seasonal snowmelt, will be compared to other historical wet periods for the West Kootenay and Arrow Lakes regions of BC during the ‘closed low’ season that runs from May into early July. The ingredients for this record month will be considered, while taking into consideration Pacific climate variability. Most BC Hydro basins in the interior saw historically high or record streamflows during summer 2012. This talk will also describe the operational challenges faced by BC Hydro as well as impacts on people and property.

2B7.4 ID:6396 11:30
On the devastating natural hazards across the Canadian Prairies between 2009 and 2011 Julian Brimelow 1, Ronald Stewart 2, John Hanesiak 2, Bob Kochtubajda 3, Kit Szeto 3, Barrie Bonsal 3 1 University of Manitoba, Environment Canada, Meteorological Service of Canada 2 University of Manitoba 3 Environment Canada, Meteorological Service of Canada Contact: [email protected]
Between 2009 and 2011 much of the Canadian Prairies was subjected to exceptionally variable precipitation regimes, ranging between record drought and unprecedented flooding. For example, damages from floods in the Assiniboine River Basin (ARB) have exceeded $1 billion to date. Additionally, adjacent regions concurrently experienced droughts and floods, while other areas transitioned rapidly from pluvial to drought conditions. This study characterizes and assesses the devastating natural hazards experienced across the Canadian Prairies between 2009 and 2011, with particular focus given to the evolution of precipitation in the lead up to and during the unprecedented flooding over the ARB. Additionally, the physical processes (across multiple spatial and temporal scales) related to spatially contrasting precipitation states, those responsible for transitions between precipitation states, and those on the event scale are investigated. Results show that the variability and extremes arose from a myriad of compounding and interacting factors at different spatio-temporal scales. The flooding over the ARB was the result of an unusual sequence of events—the previous summer and fall were extremely wet, followed by a normal- to above- normal snowpack and heavy rainfall coinciding with peak runoff from the spring melt. Thus, although the individual precipitation events in the lead up to the floods were not remarkable, it was the cumulative impact of those events and the key timing of events that culminated in the unprecedented flooding. This study has added to our knowledge concerning characteristics, impacts and mechanisms associated with disparate precipitation states on the Canadian Prairies.
2B7.5 ID:6294 11:45Contribution of thunderstorm rainfall to warm season precipitation across the Canadian Prairies from 2009 to 2011
Bob Kochtubajda 1, Julian Brimelow 2, John Hanesiak 2, Ron Stewart 2, Bill Burrows 3 1 Environment Canada - Hydrometeorology and Arctic Laboratory 2 University of Manitoba 3 Environment Canada - Cloud Physics and Severe Weather Research Section Contact: [email protected]
A follow-on project to the Drought Research Initiative, referred to as DRI-2 and
Prairie Extremes, has been undertaken to better understand the processes associated with the precipitation extremes (both wet and dry) and impacts across the Canadian Prairies that occurred from 2009 to 2011. One aspect of this initiative considers the role of thunderstorms on the Prairies. Thunderstorms are an important element of the water cycle on the Canadian Prairies, because they represent one of the mechanisms responsible for cycling moisture in the warm season over this region. This work builds on previous exploratory studies that quantify the contribution of thunderstorm rainfall by using much higher temporal (6-hr) and spatial (0.2° x 0.2° grids) resolution datasets. Specifically, this study investigates how much of the warm season total precipitation between May and September across the Prairies is associated with thunderstorms. Gridded CaPA (Canadian Precipitation Analysis) rainfall and lightning data from the Canadian Lightning Detection Network were used to derive several parameters. Mean thunderstorm precipitation amounts and the fractional contribution of thunderstorm rainfall varied widely across the Prairies both spatially and temporally, for the period 2009-2011. For example, the mean contribution of thunderstorm rainfall to seasonal totals over the Prairie Provinces, the agricultural and boreal zones accounted for 15%, 23%, and less than 10%, respectively. By comparison, the contribution in July accounted for more than 80% of the monthly totals over various areas of the agricultural zone. The contribution of thunderstorm rainfall to heavy precipitation events (i.e. ≥ 10 mm; ≥ 25 mm) will also be discussed. Our study indicates that thunderstorm rainfall normally plays an important, but highly variable role, on regional, monthly and event scales.
Symposium on the Mathematics of Planet Earth PART 4 / Colloque sur les mathématiques de la planète Terre PARTIE 4
Room / Endroit (TCUP Gall. C), Chair / Président (Peter Bartello ), Date (28/05/2013), Time / Heure (10:30 - 12:00)
2B8.1 ID:6674 INVITED/INVITÉ 10:30
Spontaneous inertia-gravity-wave generation in balanced geophysical flows
Jacques Vanneste University of Edinburgh

Contact: [email protected]
The large-scale dynamics of the mid-latitude atmosphere and ocean is characterised by a time-scale separation between slow balanced motion and fast inertia-gravity waves. As a result of this separation, the two types of motion interact only weakly, and the dynamics can be approximated using balanced models which filter out the fast waves completely. The separation is not complete, however: the evolution of well-balanced flows inevitably leads to the excitation of inertia-gravity waves through the process of spontaneous generation. In the limit of small Rossby number relevant to the mid-latitude atmosphere and ocean, this generation can be shown to be exponentially small in the Rossby number in several idealised models. I will discuss some of these models and show how spontaneous generation can be captured using the techniques of exponential asymptotics.
2B8.2 ID:6472 11:00Potential enstrophy in stratified turbulence
Michael Waite University of Waterloo Contact: [email protected]
In geophysical flows with strong rotation and stratification, the Ertel potential vorticity is approximately linear in the flow variables. As a result, the integrated square potential vorticity, or potential enstrophy, is an approximately quadratic invariant, a fact that has important implications for energy transfers between scales. However, for flows with Rossby numbers O(1) or larger - as in the atmospheric mesoscale and oceanic sub-mesoscale - the assumption of quadratic potential enstrophy becomes questionable. In this talk, direct numerical simulations of stratified turbulence without rotation will be presented. The potential enstrophy will be shown to be approximately quadratic only when the buoyancy Reynolds number is small, i.e. when the vertical scale of the turbulence is set by viscosity. This regime is common in laboratory experiments, but not in geophysical turbulence. For larger buoyancy Reynolds numbers, the quadratic, cubic, and quartic contributions to the potential enstrophy are all of the same order. These results raise doubts about the applicability of cascade theories based on quadratic potential enstrophy to stratified turbulence in the atmosphere and ocean.
2B8.3 ID:6866 11:15
Asymmetries in mode-2 breaking waves Anton Baglaenko , Jason Olsthoorn , Marek Stastna University of Waterloo Contact: [email protected]
Using numerical simulations performed with a pseudospectral incompressible
Navier-Stokes solver, we describe the asymmetries that arise in the recirculating core of mode-2 internal, solitary-like waves. The waves are generated in a manner consistent with many laboratory studies, namely via the collapse of a region of mixed fluid. Analysis of the simulations reveals that asymmetries across both the wave crest and the pycnocline centre develop in the spatial distribution of density, kinetic energy and a passive tracer transported by the mode-2 waves. The simulations are extended to three-dimensions, to allow for the formation of spanwise instabilities. We find that three-dimensionalization modifies the structure and energetics of the core, but that the majority of the results obtained from two dimensional simulations remain valid. Taken together our simulations demonstrate that the cores of solitary-like mode-2 waves are different then their counterparts for mode-1 waves and that their accurate characterization on both lab and field scales should account for the core asymmetry across the pycnocline centre.
2B8.4 ID:6564 11:30
A numerical method for the Taylor-Goldstein equation Tim Rees , Adam Monahan University of Victoria Contact: [email protected]
The Taylor-Goldstein (TG) equation determines the linear stability of internal waves in stratified parallel shear flows. This simplified model plays an important role in geophysical fluid mechanics where it is used to identify unstable waves and estimate their initial growth rates. One property of the TG equation is that, for most shear flows and stratifications of practical interest, analytical solutions cannot be found. Numerical solutions of the TG equation are necessary, but made difficult by critical layers. I will describe a novel shooting method for finding unstable solutions of the TG equation. The treatment of critical layers will be described, and the method will be demonstrated using several simple examples.
2B8.5 ID:6712 11:45
A Stochastic Parameterization of Cloud Droplet Collision and Coalescence David Collins , Boualem Khouider University of Victoria Contact: [email protected]
Global climate models need accurate representations of cloud droplet radii to adequately model (i) the amount of solar and terrestrial radiation reflected by cloud droplets and (ii) the time until the onset of precipitation. The spectrum of cloud droplet radii can span five orders of magnitude: from less than 1 micron to several millimetres. After initial formation and growth by condensation, droplets increase in size by collision and coalescence before precipitating under the force of gravity. The evolution of the droplet spectrum by the collision and coalescence process can be modelled using the kinetic collection equation (KCE) or evolved
by a stochastic process. Since infinitely many sizes of radii cannot be modelled, the equations governing droplet evolution must be discretized, which introduces errors. We highlight the current techniques used to discretize the KCE. We apply mathematical rigour to these techniques and combine them with elements of the stochastic evolution process to gain the advantage of increased accuracy and reduced computational costs.
Perspectives of hydrometeorological extremes PART 1 / Perspectives des extrèmes hydrométéorologiques PARTIE 1
Room / Endroit (TCUP Gall. D), Chair / Président (M. Naveed Khaliq ), Date (28/05/2013), Time / Heure (10:30 - 12:00)
2B9.1 ID:6485 10:30Relationship between surface temperature and rainfall intensities – a multi-timescale and event-based analysis Alain Mailhot , Edward Laurence INRS-Eau, Terre et Environnement Contact: [email protected]
Recent studies have examined the relationship between intensity of extreme precipitation and temperature. These investigations are motivated by the argument that the atmosphere moisture holding capacity is governed by the Clausius-Clapeyron equation and that temperature dependence of extreme intensity precipitation should follow a similar relationship assuming relative humidity stays constant. This would imply, in a context of global warming due to increasing concentrations of greenhouse gases, that rainfall extreme would increase by 7% per degree Kelvin of warming. This relationship between extreme rainfall and temperature was tested using maximum daily rainfall series (summer) for durations ranging from 5 minutes to 12 hours and corresponding daily temperature series from stations across Canada. Results show that duration has a huge impact on the nature of the temperature – rainfall intensity relationship. Hourly rainfall series were also considered. Rainfall events were defined and classified according to event durations. Relationships between surface temperature and event characteristics (mean event intensity, duration and total depth) as well as fractions of events in each duration classes were investigated. Results suggest a strong dependence of temperature on event durations and
intensity and the crucial role of the temporal scales on the relationships between precipitations intensity and temperature.
2B9.2 ID:6467 10:45
The statistical transformation of precipitation to streamflow on the Canadian Prairies Kevin Shook , John Pomeroy , Garth Van Der Kamp CGU Contact: [email protected]
Hydrological processes alter the states and fluxes of water and so transform the statistical properties of the time series of input variable to those of output variables. An example of great interest is the transformation of precipitation to streamflow, which requires a method for estimating the probability density function (PDF) of streamflows from input variables. The Rational Method is widely used to transform rainfall to runoff for ungauged basins, but the method is generally both physically and statistically invalid in cold regions as the dominant cause of peak streamflow is runoff derived from the melt of the seasonal snowcover. It is demonstrated that the probability distributions of peak Prairie streamflows are controlled by three transformations. The first is the transformation of the snowfall over the winter, by wind redistribution, sublimation and melt, to the seasonal snowpack. The second is the transformation is the melt of the seasonal snowpack to produce runoff. The third is the transformation of runoff to streamflow by the filling of depressional storage and the release of runoff that exceeds depressional storage capacity through spilling. The three transformations fundamentally transform the statistical properties of the original precipitation. The effect of each transformation of the input variable PDF to the output variable PDF is demonstrated at a number of basins in the Canadian Prairies and is explained in terms of the hydrological processes causing the transformation. As the processes can be described by physically-based models of prairie hydrology, so can the transformations. The operational usefulness of this method for estimating the return periods of Prairie streamflows is discussed.
2B9.3 ID:6495 11:00
Evolution of precipitation fields over North America in a climate change context
Karine Guinard 1, Alain Mailhot 1, Daniel Caya 2 1 Institut national de la recherche scientifique, Centre Eau Terre Environnement (INRS-ETE) 2 Consortium Ouranos Contact: [email protected]
An increase in global temperatures increases the moisture holding capacity of the atmosphere, which may alter the global precipitation regime. At the source of

floods and droughts, precipitations also influence underground water recharge, agricultural irrigation and urban water drainage. Therefore, numerous studies have focused on changes in the precipitation regime due to climate change. Most of these studies use data with temporal resolution from daily to annual, but very few focus on spatial structures of precipitation fields. The current study explores these spatial structures at an hourly scale and defines them as contiguous areas of precipitations over an hour. Each spatial structure is analysed through various characteristics such as area, orientation, maximum intensity and precipitation volume. This study aims to characterize the evolution of precipitation fields between the periods 1961-1990 and 2071-2100 using outputs from the Canadian Regional Climate Model (CRCM). Two CRCM simulations driven by the third generation of the Canadian Global Climate Model (CGCM3) and one driven by the European Centre for Medium-Range Weather Forecast reanalysis (ERA-40) are analyzed. Comparison with Stage IV data is also achieved. Stage IV is a combination of radar and rain gauges data available over the continental United States from 2002 to 2012 (4 km x 4 km grid). The study area covers North America (45 km x 45 km grid) and is divided in climatic regions. The first part of the study compares ERA-40-driven CRCM simulation with Stage IV data to evaluate biases from the regional model. Next, ERA-40-driven CRCM simulation is compared with CGCM-driven simulations to identify biases from the global model. The second part of the study establishes future projections in terms of spatial structures of precipitation by comparing historic and future data from CGCM-driven CRCM.
2B9.4 ID:6552 11:15Analysis of Streamflow Characteristics over Northeastern Canada in a Changing Climate Oleksandr Huziy 1, Laxmi Sushama 1, Naveed Khaliq 2, René Laprise 1, Bernhard Lehner 3, René Roy 4 1 Centre ESCER (Étude et Simulation du Climat à l’Échelle Régionale), UQAM 2 Global Institute for Water Security, University of Saskatchewan 3 Department of Geography, McGill University 4 Centre ESCER (Étude et Simulation du Climat à l’Échelle Régionale), UQAM; Ouranos; Hydro-Quebec Contact: [email protected]
An analysis of streamflow characteristics (i.e. mean annual and seasonal flows and extreme high and low flows) in current and future climates for 21 watersheds of north-east Canada covering mainly the province of Quebec is presented in this article. For the analysis, streamflows are derived from a 10- member ensemble of Canadian Regional Climate Model (CRCM) simulations, driven by the Canadian Global Climate Model simulations, of which five correspond to current 1970–1999 period, while the other five correspond to future 2041–2070 period. For developing projected changes of streamflow characteristics from current to future periods, two different approaches are used: one based on the concept of

ensemble averaging while the other approach is based on merged samples of current and similarly future simulations following multiple comparison tests. Verification of the CRCM simulated streamflow characteristics for the 1970–1999 period suggests that the model simulated mean hydrographs and high flow characteristics compare well with those observed, while the model tends to underestimate low flow extremes. Results of projected changes to mean annual streamflow suggest statistically significant increases nearly all over the study domain, while those for seasonal streamflow show increases/decreases depending on the season. Two- and 5-year return levels of 15-day low flows are projected to increase significantly over most part of the study domain, though the changes are small in absolute terms. Based on the ensemble averaging approach, changes to 10- and 30-year return levels of high flows are not generally found significant. However, when a similar analysis is performed using longer samples, significant increases to high flow return levels are found mainly for northernmost watersheds. This study highlights the need for longer samples, particularly for extreme events in the development of robust projections.
2B9.5 ID:6323 11:30
Improving flood warning systems by combining multivariate statistical approaches with hydrologic modeling: Analysis of the 2011 Richelieu River spring flood Christian Saad 1, André St-Hilaire 1, Philippe Gachon 2, Salaheddine El-Adlouni 3 1 Centre Eau-Terre-Environnement, Institut National de la Recherche Scientifique, Québec, Canada 2 Environment Canada and Centre ESCER, Université du Québec à Montréal, Montréal, Canada3 Département de Mathématiques et Statistique, Université de Moncton, Moncton, Canada Contact: [email protected]
Flood events have devastating consequences to local populations, industries and environmental systems. The destruction of homes, businesses, agricultural fields as well as fish habitats are some of the consequences of the 2011 spring flood of the Richelieu River watershed (Quebec, Canada). By increasing our knowledge of this river’s behavior under various extreme atmospheric conditions, we will be able to improve flood warning systems. Although some work has already been conducted to determine certain causes of this record-breaking flood, the combination of hydrologic modeling with multivariate statistical analysis of hydrologic and atmospheric indices has not yet been conducted. Using frequency analysis as well as a multivariate Copula approach on hydrometeorological indices calculated from time series at observation stations, this study describes flood-causing factors in terms of their occurrences, frequency and intensity. Those scenarios can then be used to assess the consequences on flood peak and duration at various locations along the River via the semi- distributed hydrologic model CEQUEAU. Preliminary results show a positive dependence between the peak flow and the precipitation intensity per wet days and the 90th percentile of daily liquid precipitation in spring (MAM) as well as the cumulated winter snowfall (DJF). Furthermore, a more comprehensive estimation of the
return period for the 2011 flood is obtained with the consideration of the latter two indices via the use of bivariate Copulas. In addition, the hydrologic model CEQUEAU has been calibrated and validated (over the 1981-2000 and the 2001-2011 periods, respectively) for the Richelieu River watershed and has proven capable of representing the 2011 peak flow. Further work will consist of simulating various extreme scenarios and analysing their consequences on the flow of the river using the validated hydrologic model.
2B9.6 ID:6660 11:45
Projected changes in precipitation variability and extremes in the Saskatchewan River Basin under representative concentration pathways Zilefac Elvis Asong , M.naveed. Khaliq , Howard.s. Wheater Global Institute for Water Security, University of Saskatchewan Contact: [email protected]
Future projections of Global Climate Models (GCMs) under different pathways provide the bases for studying impacts of climate change and developing adaptation and mitigation strategies. However, current GCMs have limited skills to simulate local climate features and to provide high resolution precipitation sequences due to their coarse resolution. In this study, Generalized Linear Model framework is employed to downscale outputs of Canadian Earth System Model (CanESM2) from the IPCC Coupled Model Intercomparison Project (CMIP5) to simulate local scale daily precipitation sequences at Medicine Hat, a site in the Saskatchewan River Basin, under representative concentration pathways (RCPs) 2.6 and 4.5 in order to assess climate change impacts on precipitation characteristics. These characteristics are evaluated for the historical climate and for two future non-overlapping time periods spanning 2006– 2099. Results of the investigation suggest a tendency towards statistically insignificant increase in the long- term mean seasonal precipitation in summer for the two RCPs and future time periods and a tendency towards a decrease in winter, spring and autumn relative to the historical climate. Regarding precipitation extremes, in winter, greatest consecutive 5-day precipitation is projected to likely decrease in intensity and frequency for both RCPs and future time periods while the projections show an increase in intensity and frequency in summer. In terms of drought occurrences, severe and longer duration droughts may reoccur frequently under future climate conditions. Overall, longer duration droughts are projected to intensify by the end of 2099 relative to 2050 under RCP 2.6.
Science, Policy and Environmental Management PART 1 / Science,
politique et gestion de l'environnement PARTIE 1
Room / Endroit (TCUP Blair Nelson), Chair / Président (Mar Martinez de Saavedra Alvarez ), Date (28/05/2013), Time / Heure (10:30 - 12:00)
2B10.1 ID:6561 10:30
Water Security Priorities in the Saskatchewan River Basin: A collaborative multi-site case study using a web based survey. Graham Strickert 1, Patricia Gober 2, Kwok Chun 1, Diana Payton 2, Kristin Bruce 2 1 Global Institute for Water Security, University of Saskatchewan 2 Johnson-Shoyama School for Public Policy University of Saskatchewan Contact: [email protected]
The term ‘water security’ has emerged as a way to frame interconnected water management issues among water scientists and practitioners. This presentation highlights how some stakeholders in the Saskatchewan River Basin in Western Canada define and use ideas about water security to prioritize water problems (flooding, drought, water quality, water quantity, competing demands, land-use management, water governance, and long-term climate change). Results indicate that priorities about particular water problems stem from core environmental values, provincial context (Alberta versus Saskatchewan) and roles in the water sector (government, NGO, industry), and conceptions of water security. Concepts of water security range from a narrow focus on human needs, reliability to broader definitions that address balancing human environmental needs, sustainability, and governance. Stakeholders also rated the human dimensions of water management more highly than physical hazards such as drought, climate change, and flooding. Stakeholders may be more concerned about human’s adaptive capacity to manage environmental change than about the change itself. The perceptions identified from the analysis shed insight into how the term ‘water security’ is used to frame discussion of water-related risks in Western Canada.
2B10.2 ID:6737 10:45Viewpoints on water security s in the Saskatchewan River Basin: A multi-site case study using Q-methodology.
Graham Strickert , Kwok Chun Global Institute for Water Security Contact: [email protected]
A case study applied Q methodology to elicite the factors that summarise stakeholder’s perceptions about the meaning of water security in the South
Saskatchewan River Basin (SSRB). The results show that the stakeholders have different subjective positions about water security. In general, the participants in this study agreed with conceptions of water security that contained intergenerational and holistic references but disagreed with framings of water security that were self-centered and narrow. These perceptions of water security are similar to those conceptualized in academic literature; however the themes which undergird the substructure of participant’s preferences are found to be more diverse than previously thought. Rejecting self-centered and narrow framings of water security may have important implications for policy about water management, for example in the design of incentives to increase the uptake of sustainable water management practices.
2B10.3 ID:6766 11:00
Getting there from here: needs assessment for the establishment of a participatory water resources management: The case of Lake Diefenbaker, Saskatchewan, Canada. Jania Chilima , Lalita Bharadwaj CWRA Contact: [email protected]
A community-based participatory research (CBPR) approach is being applied to explore the health, social, economic, cultural, and environmental dimensions of water resource management of Lake Diefenbaker with the purpose of setting the premise for a participatory model for water resources management of a large Prairie reservoir. Lake Diefenbaker is a large, multi-operational and multi-use reservoir located in central Saskatchewan. The study region encompasses three basins: South Saskatchewan River, Swift Current Creek and Upper Qu’Appelle River, together with 35 rural municipalities and three cities of Moose Jaw, Swift Current and Saskatoon. It was selected to reflect spatial, temporal, historical and contemporary water resource management issues of the lake. Stages in CBPR process: forming partnerships with communities; identifying local concerns through consultation; taking action to address identified concerns; and evaluating effectiveness of actions to address the concerns; guide the research. The methodological research design incorporates multi-phases and mixed-methods procedures. For the first phase of the research, 19 focus groups and 2 interviews were carried out whereby 92 individuals from the diverse community of water users participated. Results from this phase categorically fell into three broad themes: management schemes of both the Gardiner dam and the lake; implications of the social economic arrangements of the communities of water users; and perceived implications of water resources management in Alberta for downstream users. This research phase will help highlight the existing need to understand the ever expanding and changing dynamics of water users and the lake’s ecosystem. Through identifying issues and understanding expectations of lake management from perspective of water users, this research may significantly contribute towards future management practices.

2B10.4 ID:6741 11:15
Co-Creating the Bow River Phosphorus Management Plan
Heather Sinton Alberta Environment and Sustainable Resource Development Contact: [email protected]
The province of Alberta is in the process of developing and implementing a cumulative effects management system for air, land, water and biodiversity. A primary aim of cumulative effects management is to permit a level of development that does not compromise the capacity or function of an ecosystem, whether related to resource use or ecosystem absorption of various development impacts (i.e., releases, wastes, etc). Science and technology are used to inform a performance management system. Calgary, Alberta currently has a population of 1.2 million. Growth of up to 1.6 million is expected in the next 50 years. Monitoring in the Bow River has indicated that phosphorus levels are causing nuisance plant growth and intermittent low oxygen levels downstream of the city. Alberta Environment and Sustainable Resource Development (ESRD) has initiated a multi- stakeholder collaborative Bow River Phosphorus Management Plan (BRPMP) project to address the issue. Interested and accountable stakeholders have been invited to understand the point and non-point sources of phosphorus entering the river. They are identifying opportunities to manage these sources, considering desired social, economic and environmental outcomes. There has been a gradual shift away from top-down government approaches in Alberta to planning, policy and regulation, toward a bottom-up approach that involves all the parties that affect a particular environmental problem. Because community environmental management is fundamentally a social process, scientists and technical experts need to be able to effectively communicate their knowledge and opinions in a manner that respects the diversity of local understanding and values. It also means that planning processes need to be designed to integrate science and technology with socio-economic values. The planning process and decision support tools that the Bow River Phosphorus Management Plan (BRPMP) is using to accomplish this will be described.
2B10.5 ID:6546 11:30
The Dimensions of Decision Making in the Okanagan Invitational Drought Tournament
Lori Bradford 1, Graham Strickert 2 1 School of Environment and Sustainability, University of Saskatchewan 2 Global Institute of Water Security, University of Saskatchewan Contact: [email protected]

Decision making is sometimes expressed as an ‘emergent behaviour’; one where an individual has a set of mechanisms ‘waiting’ for exposure to certain situations that then allow (decision) abilities to emerge. In this presentation we describe the emergence of decision making styles (from along a rational-intuitive continuum) among water managers and practitioners participating in a novel drought management game based on familiar contexts for the players. We describe how over time, decision styles for drought management can be improved with awareness of decision drivers. We found that decision makers begin by taking a rational-analytical approach to the decision processes in the early rounds of the tournament, then turn to more intuitive approaches in later rounds. Influences on decision making were uncovered from three different data sources collected simultaneously during the ‘game’ and affect the type of decision making used by individuals during progressive rounds in which complexity, competitive stakes, and familiarity grow. We discuss how values, knowledge and experience, situational factors and discursion, and contexts dictate how and why players made decisions in prescribed ways for drought management. We invoke an Aesop fable for analogy and use mixed methods and data triangulation to support our findings. The findings have applicability to planning for drought decisions, designing decision support tools, and offer descriptive support for decision making models more generally.
2B10.6 ID:6573 11:45
Desktop Tool for the Calculation of Water Quantity Indicators Erika Klyszejko 1, Martin Serrer 2, Wayne Jenkinson 2, Martha Guy 1 1 Environment Canada 2 National Research Council Contact: [email protected]
Environment Canada’s Canadian Environmental Sustainability Indicators (CESI) measure changes of key environmental sustainability issues as articulated in the Federal Sustainable Development Strategy, effectively allowing the federal government to report to Canadians on the state of the environment. The Water Survey of Canada is responsible for the yearly production of the Water Quantity Indicator, which reports on the streamflow and water level conditions at long-term hydrometric stations across Canada. Daily archived hydrometric information from Environment Canada’s HYDAT database is used to calculate 30-year normals and determine whether the Water Quantity for a given station and year is categorized as Low, Normal or High categories. High-level indicators are commonly used to present complex information in a simplified manner, thereby making the information more accessible to non-experts. However, from a scientific perspective, how do we reduce the level of detail and depth of information we provide, while ensuring that the public and decision-makers are accurately informed and adequately educated on the status of Water Quantity in Canada?

With this question in mind, Environment Canada and the National Research Council are developing an easy-to-use tool that will supplement the information currently published through the CESI Water Quantity Indicator. From their desktops, users will be able to visualize and manipulate the data used to produce the indicator. The calculation criteria can also be customized to show in the impacts a change in normal period, the filtering of data, etc. The tool will also include more advanced functionality suitable to water resource managers and scientists who wish to explore trends in other time series data in support long-term planning activities such as water systems design and water demand management policies and regulations.
Air Quality Forecasting and Supporting Science PART 1 / Prévision de la qualité de l'air et sa science PARTIE 1
Room / Endroit (Hilton Commonwealth- S), Chair / Président (Dave Henderson ), Date (28/05/2013), Time / Heure (10:30 - 12:00)
2B13.1 ID:6630 INVITED/INVITÉ 10:30Integrating the Air Quality Health Index into Asthma Action Plans Christopher Licskai 1, Todd Sands 2, Madonna Ferrone 3 1 Western University Canada 2 University of Windsor 3 Hotel-Dieu Grace Hospital Contact: [email protected]
Background: Air pollution is associated with increased asthma morbidity. Although guidelines advise exposure reduction, only a minority of asthmatics are adherent. The Air Quality Health Index (AQHI) combines a simple air quality and health risk scale, ranging from 1 (best air quality / lowest health risk) to 10, with integrated risk-reduction health messages. Objective: Design, develop, and pilot test a smartphone application that integrates the AQHI including risk-reduction messaging with an asthma action (treatment) plan. Methods: A web-browser based smartphone application (SPA) delivered hourly and forecast AQHI and transmitted subject symptoms, peak flow, healthcare utilization, and self-reported risk reduction behaviours to a central server that analyzed these data, determined the subjects’ level of asthma control, and returned treatment advice. Results: We enrolled 24 asthmatics who reported air pollution as a trigger, 22 completed the study, 82% women, 82% on controller therapy, mean age 47
years. The AQHI forecast was viewed by the subjects on 24%, and real-time AQHI on 61% of subject-days*. Clinical data was received from subjects on 84% of subject days. Subjects viewed their action plan on 54% of subject-days*, 86% followed self-management advice, and 50% acted to reduce pollution exposure. A high majority affirmed SPA ease of use, clarity, and timeliness, 95% wanted the SPA after the study. At baseline 91% had at least one symptom criterion for uncontrolled asthma and 64% had > 2, compared to 45% (p=0.006) and 27% (p=0.022) at study close. Mean Asthma Quality of Life Questionnaire score improved from 4.3 to 4.8 (p=0.047). Conclusions: The SPA is a feasible method to integrate the AQHI with an asthma action plan, actively deliver the AQHI, and provide continuous feedback on asthma control and self-management. (* Subject-day = 1 subject x 1 day. Example: 10 subjects x 20 days = 200 subject-days)
2B13.2 ID:6520 11:00
Rural air quality monitoring in the Richelieu valley, Southern Québec Frederic Chagnon , Sylvain Labrecque , Jacques Rousseau , Bruno Harvey , Didier Davignon Service Meteorologique Canada Contact: [email protected]
Since summer 2012, the Meteorological Service of Canada (MSC) - Quebec Region has benefitted from a mobile unit devoted entirely to air quality monitoring. This mobile unit is the result of a close collaboration between the Air Monitoring Section and the Integrated Approaches to Air Quality Unit. The Mobile Air Quality Research Unit (MAQRU) allows MSC to participate in measurement campaigns through partnerships and address scientific needs related to the mandate of Environment Canada. The air quality sampling material includes suspended particles, nitrogen oxides (NOx) and ozone (O3) analyzers. The MAQRU is also equipped with a meteorological mast to continuously measure air temperature and humidity, wind direction and wind speed. The first measurement campaign with the MAQRU began in September 2012 in Saint-Valentin (Haut-Richelieu). The primary objective is to sample certain air pollutants (NO2, PM2.5 and O3) in rural southern Quebec to assess their behavior and their relative contributions in the calculation of the Air Quality Health Index (AQHI). Additionally, the collected data will improve our understanding of the quality of the air that crosses the Canada-US border via the Richelieu Valley. The ongoing campaign has shown regular circulation pattern from South and South-East, over the October to December period. Calculations of AQHI based on observations have shown low risk level (value of 1 to 3) most of the time while moderate risk level (value of 4 only) were observed on a few occasions over the same period. This presentation will include an updated analysis of data collected last fall and winter.

2B13.3 ID:6465 11:15Predicting the AQHI without aid of observations: results from the northern New Brunswick study Doug Steeves 1, David Waugh 1, Alan Wilson 1, Stephen Beauchamp 1, Daniel Jubainville 1, Mark Gibson 2, Gavin King 2, James Kuchta 2 1 Environment Canada 2 Dalhousie University Contact: [email protected]
The Environment Canada air quality forecast program has focused on predicting the AQHI for urban centres but will expand to include regional forecasts in order to meet its long-range commitment of increasing the coverage of AQHI forecasts to more Canadians. To this end a pilot project was established in northern New Brunswick (Campbellton) in the fall of 2012 to determine the behaviour of the AQHI constituent pollutants and evaluate the performance of the GEM-MACH model and objective analyses in this remote rural environment. We present initial results of the monitoring and model evaluation by showing the frequency and magnitude of differences between observed versus modelled and human forecaster output. Cases where the variance was greatest will be discussed, all within the context of local, regional and long range transported emission sources and coincident meso-scale meteorology and topographic influences. The results will help to assess our ability to forecast the AQHI in remote locations by using model guidance with human intervention.
2B13.4 ID:6621 11:45Comprehensive modelling of particulate matter in support of air quality management in Prince George, British Columbia Peter Jackson 1, Bruce Ainslie 2, Christophe Corbel 1, Dennis Fudge 3, Andreas Veira 4 1 University of Northern British Columbia 2 Environment Canada 3 BC Ministry of Environment 4 Max Planck Institute for Meteorology Contact: [email protected]
Prince George has among the highest levels of ambient particulate matter (PM) in western Canada. In order to effectively lower ambient PM levels, management agencies need to be able to attribute ambient levels to specific sources which can then be targeted for reduction. Dispersion modelling is an effictive tool that can be used to attribute sources to ambient levels. The Calpuff dispersion modelling system was applied to all sources (rail, road, industrial, residential, mobile, fugitive dust, burning, commercial, etc.) of PM10, PM2.5, NOx and SOx affecting the Prince George airshed over the three year period 2003-2005. In addition, a web-based visualization and scenario tool was developed for air quality managers to enable them to make science-based decisions to improve air quality. The results of the modelling and source attribution will be discussed, and
the web-based scenario tool demonstrated.
The MSC Transformative Agenda: A Commitment to Continuous Improvement / l'Agenda transformative du SMC : Dédication à l'amélioration continuelle
Room / Endroit (Hilton Prince Albert), Chair / Président (Michel Villeneuve ), Date (28/05/2013), Time / Heure (10:30 - 12:00)
2B14.1 ID:6898 10:30Meteorological Service of Canada: Recent Accomplishments and Future Directions
David Grimes Environment Canada Contact: [email protected]
The MSC is Canada’s National meteorological and hydrological service. No other organization, public or private, has the mandate, knowledge or resources to provide the weather forecasts and warnings and other related environmental services to Canadians that the MSC provides 24 hours a day / seven days a week. These services contribute to the Government’s mandate to protect the lives and property of its citizens from hazardous environmental conditions and have been identified as “Government Mission Critical”. The demand by Canadians for weather and environmental information is increasing, particularly in terms of the accuracy and timeliness of forecasts of high-impact events on ever-increasing timescales from hours and days to seasons and decades. The Assistant Deputy Minister of the MSC David Grimes will provide an overview of recent advances in service delivery, recent investments in the MSC and future transformative directions planned to meet the needs of Canadians.
2B14.2 ID:6885 11:00Warning Re-engineering: Alerting Canadians
Joanne St. Coeur Environment Canada
Contact: [email protected]
The traditional weather warning bulletins have been a fixture in the daily lives of Canadians for many years. Technological advancements (science, communication protocols, etc) are now providing opportunities on how we can alert Canadians more efficiently, beyond a text warning bulletin. In 2012 Meteorological Service of Canada (MSC) introduces Common Alerting Protocol (CAP*) format for its public warnings. In 2013 MSC introduced a new tool in its forecast operation. New operational tools, new data management systems, new practices & procedures, etc. are needed to bring new alerting capabilities. These changes will allow MSC alerting program to grow and evolve over the upcoming years. In addition MSC will also need to develop its capabilities to understand user needs, from partners to stakeholders to the Canadians public. *CAP is an agreed upon international standard for exchanging public warning information and emergency messages between alerting technologies. CAP allows a message to be consistently disseminated simultaneously over many warning systems to many applications and end users. CAP is an XML based standard which creates an environment that is extremely flexible to both the needs of alert issuers and last mile distributors alike.
Numerical Weather Prediction PART 2 / Prévision numérique du temps PARTIE 2
Room / Endroit (TCUP Salon A), Chair / Président (Jason Milbrandt ), Date (28/05/2013), Time / Heure (14:00 - 15:30)
2C1.1 ID:6551 14:00
Recent development of the Canadian Regional Ensemble Prediction System Amin Erfani 1, Ronald Frenette 1, Normand Gagnon 1, Martin Charron 2 1 Meteorological Service of Canada 2 Recherche en prévision numérique atmospherique Contact: [email protected]
The current Regional Ensemble Prediction System (REPS), running operationally
at the Canadian Meteorological Centre (CMC), is composed of the limited-area version of GEM with 33 km horizontal grid spacing and 28 levels at the vertical. A 72 hour ensemble forecast, with 21 members, is produced using a single model configuration with stochastic perturbations of physical tendencies. Over the past year work has been under way to increase the horizontal and vertical resolution of the REPS. Experiments have been performed at 15 km horizontal grid spacing with 40 and 48 levels at the vertical. The physics of the model has been adapted to be identical to the new 25 km horizontal grid spacing Global Deterministic Prediction System (GDPS) model that has become operational in winter 2013. The REPS at higher resolution is promising to serve as a complimentary prediction system to the 10 km horizontal grid spacing Regional Deterministic Prediction System (RDPS) that has become operational in fall 2012. This presentation will provide information on this new system and some of the challenges that were faced in its development along the way. Some information on the future development of REPS will also be provided.
2C1.2 ID:6661 14:15
Handling of Supercooled Water in the HRDPS 2.5 km Model Melinda Brugman 1, Jim Goosen 2, Allan Coldwells 2, Jason Milbrandt 3, Ron Goodson 4, Karl Klassen 5 (Presented by Mindy Brugman ) 1 Coastal and Mountain Meteorology National Lab, MSC, Environment Canada, Vancouver, BC 2 Pacific Storm Prediction Center, MSC, Environment Canada, Vancouver, BC 3 Atmospheric Numerical Weather Prediction Research, CMC, Dorval, QC 4 MSC, Edmonton, AB 5 Canadian Avalanche Center, Revelstoke, BC Contact: [email protected]
Anomalous freezing rain forecasts have been indicated for higher terrain using the new CMC HRDPS LAM 2.5 model. The new model often forecasts freezing rain for over northwestern Vancouver Island in strong upslope flows of moist air and near the snow level, that is not supported by observations nor expected. Before October 2012, this was not the case with high resolution CMC models containing less realistic hydrometeor microphysics schemes and less advanced physics packages. In order to better understand the new HRDPS model, several cases brought forward by forecasters in weather and avalanche disciplines are examined. In this paper, validation of freezing rain forecasts is attempted for the operational (and pre-operational) CMC models to improve understanding of how super cooled water is handled. For example, if extra super cooled water exists within the model then this may not be riming hydrometeors correctly. If so, the precipitation rates and amounts at each location will be forecast differently, because hydrometeor fall speeds are now being predicted by the 2.5 km model. The freezing rain is now handled quite differently between the operational/pre-operational 10 km and the 2.5 km models. In one case this winter, opposite sides of Vancouver Island for the same storm were forecast to have freezing rain at the same time, depending on which model resolution was examined. Freezing rain
was not reported anywhere on Vancouver Island at the time, nor was it expected by forecasters. The ultimate aim of this study is to contribute to the excellence of the 2.5 km high resolution numerical model by CMC. When freezing rain actually occurs, the new models can detect it, but confidence is reduced. The new 2.5 km model has proven to be capable of forecasting freezing drizzle and super cooled water within clouds quite well. This skill can be valuable for forecasting icing on aircraft and on mountain snow surfaces, and hence has further potential in aviation and avalanche applications for improving public safety in mountainous regions.
2C1.3 ID:6335 14:30
The new Canadian Global Deterministic Prediction System (GDPS)
Ayrton Zadra RPN/MRD, Environment Canada Contact: [email protected]
The Canadian Meteorological Centre uses a Global Deterministic Prediction System (GDPS) to provide middle-range forecast guidance to national and regional prediction centres. The GDPS currently employs a 4D-Var data assimilation system and the Global Environmental Multiscale (GEM) forecasting model. On February 2013 the system underwent a major upgrade, including a new vertical coordinate/discretization, an increase in horizontal resolution, improvements to its subgrid-scale orographic parameterization and turbulent boundary layer scheme, use of additional remote sensing data and other changes to the data assimilation system. Objective scores in the development and parallel-run phases showed improvements in forecast skill for most metrics, at all lead times and throughout most of the atmosphere, in particular over North America in winter. These improvements are of a magnitude that is seen only once a decade in an operational centre. In this talk, we will describe the characteristics of the new GDPS, discuss how each of the changes have impacted global deterministic forecasts, and summarize the indirect improvements observed in other (e.g regional and ensemble) operational systems which depend on the GDPS output.
2C1.4 ID:6622 14:45
Finding the best variables for NWP analog forecasts Thomas Nipen , Roland Stull University of British Columbia Contact: [email protected]
An analog approach is often used to reduce biases in forecasts from NWP models. Today's NWP forecast is adjusted by finding days in the past where similar forecasts were issued. The corresponding observation on those past analog days are used as a replacement for today's forecast. This procedure leads to forecasts with less error, especially when bias is regime-dependent.

Analogs are found by comparing values for several forecast variables, such as temperature, humidity, and wind speed. Selecting which variables to use in the comparison requires a compromise: Using too few variables will prevent the scheme from discriminating between different weather regimes; Using too many will reduce the chance of finding past days with similar weather. Several methods for optimally selecting which variables to use are presented. The methods are used to create 180 hour forecasts evaluated at over 100 locations in British Columbia. Temperature and quantitative precipitation forecasts are made. A two-year archive of GFS (0.5 degree grid-spacing) forecasts are used in the search for analogs. This dataset contains over 50 variables including variables such as temperature, heat and moisture fluxes, cloud cover, and geo-potential heights.
2C1.5 ID:6883 15:00
Prediction of weather and chemistry using WRF-Chem/EnKF Jianyu Liang , Yongsheng Chen , Nan Miao York University Contact: [email protected]
Atmospheric chemistry and aerosols can affect not only weather and climate, but also human health. Accurate forecasts of both weather and air quality require a online-coupled meteorology and chemistry model, and better initial conditions for meteorological fields and chemical species. We are developing an ensemble- based data assimilation and prediction system for weather and chemistry using the Weather Research and Forecasting model coupled with Chemistry (WRF- Chem) and the Data Assimilation Research Testbed (DART) ensemble Kalman filter (EnKF). With the increasing number of chemistry observations being assimilated along with a huge amount of meteorological observations, it is expected that analyses of both meteorological and chemical fields will be improved, which also results in improved forecast accuracy. As an early application of this ensemble analysis and forecast system, we studied the impact of dust aerosols on tropical storm development. Results suggest that the distribution of dust aerosols and their associated chemical processes can change the simulated storm and its environment.
General Hydrology PART 5 / Hydrologie en général PARTIE 5

Room / Endroit (TCUP Salon B), Chair / Président (Sean Carey ), Date (28/05/2013), Time / Heure (14:00 - 15:30)
2C2.1 ID:6642 14:00The Impact of Climate Oscillations on Canadian Prairie Streamflows and their Emerging Trends Jeannine-Marie St. Jacques 1, Yuhui Huang 2, Yang Zhao 2, Suzan Lapp 1, David Sauchyn 1 1 Prairie Adaptation Research Collaborative 2 University of Regina Contact: [email protected]
Using composite analysis, this study detected the fingerprints of the Pacific Decadal Oscillation (PDO), the North Pacific Index (NPI), the El Niño-Southern Oscillation (ENSO) and the Pacific North American mode (PNA) on mean daily discharge in Canadian Prairie Provinces streams and rivers, with increased flows during the negative phases of the PDO and PNA, La Niña events and weak Aleutian lows, and decreased flows during the positive phases, El Niño and strong Aleutian lows. A much weaker fingerprint of the AO was detected. Because of the ~60-year cycle of the PDO, this has important implications for the recognition of emerging trends in streamflow in response to global climate change. A modified Mann-Kendal trend analysis of Prairie Provinces streamflows showed decreasing flows in Alberta and in southwestern Saskatchewan, no significant trends in the central Prairies and increased flows in Manitoba. Separation of emerging consistent trend from transient trend as an artifact of PDO phase was greatly facilitated by streamflow time series that span more than one PDO cycle.
2C2.2 ID:6614 14:15
Exploring the Statistical Consequences of Infilling Missing Observations in Environmental Data
Paul Whitfield Centre for Hydrology, University of Saskatchewan Contact: [email protected]
Frequently, available streamflow and climatological data may not be appropriate for specific needs in the form it is available. Frequently, users are faced with records that contains periods of missing or otherwise unreliable observations. Because missing data can create problems for analyzing data, imputation is seen as a way to avoid pitfalls involved with addressing missing values. Many ‘classical’ statistical approaches default to discarding cases that have missing values and such processes introduce bias. Since case deletion is not a practical option for time series of environmental observations, different techniques are needed. However, simple infilling of missing time series data has statistical consequences, and also introduces bias. Synthetic experiments are used to
demonstrate the impact of simple infilling techniques on statistical attributes of hydrological and climatological time series. Imputation seeks to preserve all attributes of the time series by replacing missing data with a probable value based on other available information and the time series properties of the series are preserved and not altered. When missing values have been imputed adequately, the time series can then be analyzed using standard techniques.
2C2.3 ID:6806 14:30
Multi-Index Drought Monitoring across Canadian Ecozones Amir Aghakouchak , Zengchao Hao University of California, Irvine Contact: [email protected]
Numerous indices have been developed for drought monitoring based on various indicator variables (e.g., precipitation, soil moisture, water storage). Defining droughts based on a single variable (e.g., precipitation, soil moisture or runoff) may not be sufficient for reliable risk assessment and decision making. In this presentation, a multivariate multi-index drought monitoring framework is suggested using the concept of joint empirical probability. The suggested Multivariate Standardized Drought Index (MSDI) combines Standardized Precipitation Index (SPI) and Standardized Soil Moisture Index (SSI) probabilistically for drought characterization. In other words, MSDI incorporates the meteorological and agricultural drought conditions for overall characterization of droughts. In this study, SPI, SSI and MSDI are used to investigate droughts over the Canadian ecological zones of prairie, boreal plains, boreal shields and taiga shields. These four ecozones have distinctive differences in climate, vegetation and hydrology. MSDI, derived based on the NASA MERRA-Land data, is compared with SPI and SSI for characterizing drought condition across these ecozones. MSDI has been previously applied and validated using ground observations in low latitudes and over the United States. This study extends validation and verification of MSDI over high latitudes using the North American Drought Monitor. The results revealed that MSDI indicated drought onsite and termination based on the combination of all two indices with onsite time being dominated by SPI and drought development being more similar to SSI behavior. Overall, MSDI seems to be a reasonable model for combining multiple indices probabilistically.
2C2.4 ID:6671 14:45
Assiniboine River Basin Hydrologic Model Considering Future Climate Change
David Morgan , Sitotaw Yirdaw Stantec Consulting Ltd. Contact: [email protected]
This study assessed the potential effects of climate change on surface-water

supply, flooding and soil moisture in the Assiniboine River Basin (ARB) to assist the Province of Manitoba to develop an adaptation strategy. The ARB, covering 162,000 km2 in Manitoba, Saskatchewan and North Dakota, is comprised of the Souris, Qu’Appelle and Assiniboine River Subbasins. The most common land use is agriculture, with annual cropland being the most common land cover. Stantec developed a hydrologic surface-water model for the ARB, using a physically based distributed hydrologic modeling tool (Danish Hydraulic Institute [MIKE SHE] model). The model was calibrated based on stream-flow data from several stations throughout the ARB. The model ran on a daily time step and was calibrated using average monthly flows versus measured data. Precipitation and temperature data from a network of meteorological stations were inputs to the model. After the model was calibrated using precipitation and temperature data from 1960-1990, the model was verified using precipitation and temperature data from 1991-2003. The calibrated model then simulated future soil-moisture and stream-flow for the entire ARB including Headingly, Brandon, Russell, Welby and Wawanesa. The forecast daily precipitation and temperature for these model runs were obtained from the Canadian Regional Climate Model (CRCM) for the periods of 2011-2040, 2041-2070 and 2071-2100. A global climate-model baseline obtained from running the ARB model, using CRCM precipitation and temperature output for the periods of 1960-1991, was also developed. This climate-model baseline was used to develop soil-moisture and stream-flow information to compare current and future scenarios to discern predicted climate-change effects. Monthly stream-flow and soil-moisture changes were compared between the historic and future conditions in the three future time periods.
2C2.5 ID:6321 15:00An analytical solution for assessing climate change impacts on groundwater temperature Barret Kurylyk , Kerry Macquarrie University of New Brunswick Contact: [email protected]
Groundwater temperature is an important water quality parameter that affects species richness and abundance in subsurface and surface environments. The sensitivity of groundwater temperature to future climate change has not been well-studied. To investigate the response of subsurface temperature to projected air temperature changes, an analytical solution was derived for a one-dimensional, transient heat conduction-advection equation. The initial conditions for temperature are represented using superimposed linear and exponential functions, and the boundary condition is given as an exponential function. This new solution expands on a classic solution in which the initial and boundary conditions are restricted to linear functions. The solution was verified with numerical methods using the finite element groundwater flow and energy transport code Sutra. The exponential functions allow more flexibility in matching climate model projections (boundary conditions) and measured temperature-depth profiles (initial conditions). For example, measured borehole data from the

Sendai Plain and Tokyo, Japan were used to demonstrate the flexibility and improved accuracy of the exponential function for replicating measured temperature-depth profiles. Also, the improved accuracy of the exponential boundary condition was demonstrated using globally-averaged air temperature anomaly data from the Intergovernmental Panel on Climate Change. These globally-averaged air temperatures were then used to drive simulations of the subsurface effect of surficial thermal perturbations. The simulation results indicate that the direction of groundwater flow (i.e., recharge or discharge) can significantly affect the subsurface thermal response to surficial climate change. Recharge can accelerate shallow subsurface warming, and discharge can enhance deeper subsurface warming. Additionally, the simulations suggest that the groundwater temperatures obtained from this analytical solution deviate significantly (~ 2°C) from those produced with the classic solution.
2C2.6 ID:6412 15:15
Spatiotemporal changes in climate extremes over Northern Thailand M. B. Masud 1, P. Soni 2 (Presented by Mohammad Badrul Masud ) 1 Global Institute for Water Security, School and Environment and Sustainability, U of S 2 Dept. of Agricultural Systems and Engineering, Asian Institute of Technology, Bangkok, Thailand Contact: [email protected]
An assessment of temporal and spatial changes in 27 different indices of temperature and rainfall extremes for Northern Thailand is studied. Observed data of daily maximum and minimum temperatures and rainfall amounts recorded at four different locations in Northern Thailand for the 1960–2010 period and HadCM3 Global Climate Model (GCM) and PRECIS Regional Climate Model (RCM) simulated data for the 1960–2100 are used in the assessment. Statistical downscaling approach is employed to downscale GCM outputs at the four selected sites. A significant positive trend is observed for consecutive dry days, while opposite is noted for consecutive wet days. Rainfall variability index indicates that rainfall is projected to increase at stations located in northern part of the study area, with the wettest period occurring during the last three decades of the 21st century. An analysis of both GCM and RCM simulated data suggests that the onset of monsoon during rainy season will shift around 20 days later in future with respect to historical period. A significant upward trend in daily temperature is noted for all four locations along with remarkable increases in summer days and tropical nights for the 21st century. Minimum temperature will increase more rapidly than the maximum temperature. As a result, diurnal temperature range will be shortened gradually and that may considerably impact social and environmental systems. A noteworthy fall in the frequency of cool days and nights is expected over the entire study area while warm days and nights are expected to experience opposite trend. The results of this research would be beneficial to the water resources and agricultural planners as well as for eco-environmental managers for policy making.

Key Words: climate extremes, rainfall, temperature, downscaling, variability index, Thailand
Climate Change Modelling and Water Resources PART 3 / Modelisation du changement climatique et ressources hydriques PARTIE 3
Room / Endroit (TCUP Salon C), Chair / Président (Howard Wheater ), Date (28/05/2013), Time / Heure (14:00 - 15:30)
2C3.1 ID:6498 14:00Statistical Emulation of Streamflow Projections: Application to CMIP3 and CMIP5 Climate Change Projections Markus Schnorbus , Alex Cannon Pacific Climate Impacts Consortium Contact: [email protected]
Global climate model (GCM) structure and emissions scenarios are sources of uncertainty for the evaluation of hydrologic impacts of climate change. Consequently, an ensemble of 23 climate change simulations (a combination of three emissions scenarios and the 8 GCMs) were used as the basis for a recent hydrological impacts study by Pacific Climate Impacts Consortium (PCIC). These climate change simulations, contributed by the World Climate Research Programme through its Coupled Model Intercomparison Project, phase 3 (CMIP3), were statistically downscaled and used to drive the Variable Infiltration Capacity (VIC) hydrology model over several watersheds in British Columbia. However, due to computational restrictions, the 23 member VIC ensemble is necessarily a subset of the full CMIP3 archive, from which a total of 136 simulations (1-3 SRES scenarios, 22 GCMs, and 1-7 ensemble members) are available. In addition to CMIP3 outputs, which contributed to the Intergovernmental Panel on Climate Change (IPCC) Assessment Report 4 (AR4), the latest generation of climate projections from CMIP5, which are based on the new Representative Concentration Pathways scenarios, are now also available and will contribute to IPCC AR5. PCIC currently holds outputs from over 100 CMIP5 climate change simulations. Given that GCM and emissions uncertainty are potentially large contributor to uncertainty in hydrological change
scenarios, are streamflow projections based on the 23 member VIC ensemble representative of the full range of uncertainty from the full 136 member CMIP3 ensemble? Further, do the more recent CMIP5 simulations, which are based on different emission scenarios, and, in many cases, new models, present a different picture of future streamflow changes? The most direct means of answering these questions would be to force VIC with the additional downscaled climate change simulations and then evaluate the spread of uncertainty in the resulting streamflow projections. Given the large number of scenarios, the computational burden of running the VIC model makes this impractical. As an alternative, a computationally-efficient statistical model is used to emulate streamflow projections made by VIC for the originally selected 23 CMIP3 scenarios. Regularized multiple linear regression is used to link projected changes in temperature and precipitation with projected changes in streamflow over the Fraser and Peace River watersheds. After verifying the ability of the statistical emulator to reproduce projected streamflow changes by VIC in a cross-validation context, it is then forced with the new climate change projections to predict streamflow changes in each basin (Fraser River at Hope and Peace River at Taylor) based on the full CMIP3 and CMIP5 ensembles. Additional results assess the sensitivity of the emulated streamflow projections to temperature and precipitation changes.
2C3.2 ID:6649 14:15
On the propagation of uncertainty from hydrological modelling to water resource system assessment Alireza Nazemi 1, Howard Wheater 2 1 The Global Institute for Water Security, University of Saskatchewan 2 Canada Excellence Research Chair in Water Security, The Global Institute for Water Security Contact: [email protected]
Alpine headwaters are a major water supply at global scale and for western Canada. There is an emerging need to characterize the effects of climate change on alpine water supply and the associated response of the downstream water resource systems. Characterizing the headwater inflows under climate change, however, has large uncertainty as major difficulties exist in representing the climatic and hydrological processes in alpine regions. It is therefore crucial to understand the mechanisms of propagation of uncertainties from headwater inflow estimates to water resource system simulations. To address this, we run a numerical experiment considering the Oldman River basin in Alberta, Canada. First different inflow regimes are synthesized based on the in-site/inter-site properties of the historical inflows upstream of the Oldman reservoir. The bias and uncertainty in the generated regional inflow regimes are quantified for different simulation horizons. The existing water resources system is then conditioned on the generated inflow regimes and bias and uncertainty in the system response are quantified. By observing the underlying patterns in input/response pairs, we identify the key features of the error propagation. Our results show that the extent of error propagation depends on the system state,
flow condition and the component of interest. The dependency between the inflow and outflow errors is rather complicated as (1) similar estimates of inflow characteristics may result in different simulated responses; and (2) lower uncertainty in estimating the regional inflow regime does not necessarily mean lower uncertainty in simulating the system response. Our results provide an improved understanding of uncertainty propagation through complex water resource systems, but in particular, portray the need for better climate and hydrological modeling in the Rocky Mountains to face water security concerns in the prairies, particularly in the presence of a warming climate.
2C3.3 ID:6648 14:30
Toward emulating complex water resource systems: Linking inflow characteristics and system response at the annual time scale Alireza Nazemi 1, Howard Wheater 2, Amin Elshorbagy 3 1 The Global Institute for Water Security, University of Saskatchewan 2 Canada Excellence Research Chair in Water Security, The Global Institute for Water Security 3 Department of Civil and Geological Engineering, University of Saskatchewan Contact: [email protected]
Human activities, such as regulation/redistribution of natural streamflow, can affect hydrological processes at the regional scale. Understanding anthropogenic effects on regional streamflow, evaporation and storage regimes is important for various practical and scientific concerns ranging from water resource planning and management to accurate representation of regional processes in grid-based climate and hydrological models. As a preliminary step toward emulating the behavior of complex water resource systems, here we look at the statistical linkage between the inflow characteristics and the system response at the annual time scale. We use a simple bivariate model to estimate the probability distribution of the system response given a specific inflow condition. Using the empirical properties of the inflow, we first reconstruct several realizations for the local inflow regime and simulate the associated response in the water resources system using the Water Resources Management Model (WRMM) of Alberta Environment. By considering the corresponding inflow/response pairs, we formulate the reconstructed dependence using the copula methodology. We apply the suggested approach to the water resource system developed around the Oldman River upstream the city of Lethbridge. We focus on three modeling cases, covering the estimation of the system response given different natural and regulated inflow conditions. In particular, we estimate (1) the water elevation of the major Willow Creek diversion pond given the annual characteristics of the natural inflow above Chain Lakes; (2) the outflow from Willow Creek to the Oldman river given the characteristics of the inflow into the Chain Lakes; and (3) the streamflow downstream the city of Lethbridge given the regulated trans-boundary inflow from the Belly River. The results are validated using the historical inflow/response pairs. Our findings portray considerable variation in the system response given specific inflow characteristics as the result of anthropogenic effects taking place in the river basin.

2C3.4 ID:6393 14:45
Value-based Water Resources Management Model: Application to the Saskatchewan River Basin Elmira Hassanzadeh 1, Amin Elshorbagy 1, Howard Wheater 2 1 Department of Civil & Geological Engineering, University of Saskatchewan 2 Global Institute for Water Security, University of Saskatchewan Contact: [email protected]
The Saskatchewan River Basin supports a complex water resources system in Saskatchewan, Canada that includes multiple water use sectors. Current population growth and proposals for future economic development indicate that water demands are increasing rapidly. The problem is exacerbated by the potential impacts of a warming climate on both water supply and demand. In order to deal with these issues, a holistic decision support tool is required. As a step towards developing such a capability, a Value-based Water Resources Management Model (VWRMM) is proposed as a negotiation as well as resource and infrastructure management tool. The VWRMM integrates water resource and socio-economical aspects of water in one modeling framework using the System Dynamics (SD) approach and enables investigation of water allocation priorities based on the economic value of water. To develop the VWRMM, the water resources system in Saskatchewan is modeled in the SD environment by emulating the Water Resources Management Model (WRMM) developed by Alberta Environment. Furthermore, the VWRMM estimates the productivity and economic value of water use for different sectors, such as irrigation, mining, and hydropower. Due to the importance of irrigation in the Saskatchewan system, a detailed irrigation demand model is included within the VWRMM to estimate irrigation demand and actual crop yield. By using the model, alternative water allocation scenarios can be simulated, and the availability and value of water for each sector can be assessed under varying conditions.. The results highlight various aspects of the water resources system in Saskatchewan and re-identify the sensitive parameters in the system.
2C3.5 ID:6665 15:00Water resources vulnerability assessment for designing integrated water monitoring networks
Kabir Rasouli , Mohammad R. Moazezi , Donald H. Burn Department of Civil and Environmental Engineering, University of Waterloo Contact: [email protected]
Efficient design of water monitoring networks, as a fundamental step for planning, operation, and management of water resources systems, is of particular interest. The main focus of this paper is to assess the socioeconomic and hydro-meteorological aspects of the water resources vulnerability in designing an integrated water monitoring network. Two dimensions of water

vulnerability are developed: the adaptive capacity in terms of network information content; and the exposure to the state change (e.g., climate variability and drought/flood). The most vulnerable regions are detected based on the information deficiency or redundancy and meteorology and hydrology of the study area. The index of adaptive capacity is defined through a conceptual framework based on evaluating information content of existing monitoring networks and socioeconomic data in the region. The integrated information content maps of the different environmental networks are developed in order to represent the layers of the water resources vulnerability in the St. Lawrence River basin, Canada as the case study. The variability of landscape pattern and expansion of urbanization/industrialization as a surrogate measure of exposure to the quality of surface and ground water are utilized. The results of this study should promote a better understanding of the issues and deficiencies in network development and better monitoring of the environment, while reflecting socio-economic needs.
2C3.6 ID:6645 15:15
A decision making tool the Water Security Agency will employ to meet its 25 Year Saskatchewan Water Security Plan Heather Davies , Terry Hanley Saskatchewan Water Security Agency Contact: [email protected]
Government operates in an environment characterized by reduced resources and increasing demands from stakeholders. To meet their mandate governments need to adopt efficient processes. The challenge is to leverage and exploit information, knowledge, and expertise while eliminating processes that are ineffective and inefficient. Government's current emphasize on the importance of information technology and data collection needs to transition towards greater capacity to create, manage and use external and internal knowledge. Saskatchewan's State of the Watershed Reporting is one such approach. It is designed to support decision making at all levels of Saskatchewan's Water Security Agency. The State of the Watershed Reporting (SOWR) summarizes data collected by numerous provincial and federal organizations and provides information designed to assist water management. To accomplish this the SOWR uses indictor-based assessments based on the Stress-Condition-Response model to rate environmental stressors, watershed health, and management responses. This presentation will discuss the decision making tools the Water Security Agency will employ to meet its 25 Year Saskatchewan Water Security Plan.

CANCID 3- Agricultural Water Quality / Qualité de l'eau en milieu agricole
Room / Endroit (TCUP Salon D), Chair / Président (Abdel-Razek & Dena McMartin ), Date (28/05/2013), Time / Heure (14:00 - 15:30)
2C4.1 ID:6512 INVITED/INVITÉ 14:00
Linking the farm to legislated water quality limits in rivers
Andrea Kalischuk Alberta Agriculture and Rural Development Contact: [email protected]
There is growing recognition that policy should be informed by science, in order to promote effective environmental change. Nationally, agricultural impacts on water quality are mitigated through a variety of policy approaches including incentives, regulations, and education programs that promote the implementation of beneficial management practises (BMPs). During the last decade, science has focused on evaluating BMPs. While BMPs may be environmentally effective, they are costly to implement and maintain. Hence, farmers often ask about an end goal, or how many BMPs need to be implemented on a per farm basis to obtain satisfactory water quality. In Alberta, the province is developing legislated water quality limits for all rivers through the Land Use Framework. Once the water quality limits are in place, industries like agriculture will be expected to contribute towards meeting them, even if growth and intensification occurs. This will require the ability to link land practices at the farm-scale to water quality in the rivers, which is a challenge. Added to this challenge is the complexity of cumulative effects and our ability to understand multiple sources of non-point pollution. Alberta Agriculture and Rural Development is leading several initiatives that will improve our ability to link implementation of BMPs on the farm to legislated water quality limits in the rivers. This information will guide the development of policy formation for environmental outcomes.
2C4.2 ID:6302 14:30
Evaluation of Nutrient BMPs in Agricultural Watersheds of Alberta Janna Casson , Jollin Charest , Wiebe Buruma , Barry Olson , Andrea Kalischuk Alberta Agriculture and Rural Development Contact: [email protected]
Beneficial management practices (BMPs) have been developed for Alberta producers to manage nutrients for crop and livestock production. Due to limited data showing the effectiveness of BMPs at field and watershed scales and the costs associated with implementing BMPs, a 6-yr watershed study was undertaken to evaluate a selection of BMPs in three areas of Alberta. Two

watersheds in Alberta were selected: Indianfarm Creek Watershed (IFC; 14,500 ha) and Whelp Creek Sub-watershed (WHC; 4685 ha). In addition, two irrigated field sites with a history of heavy cattle manure applications were selected in the Battersea Drain and Lower Little Bow watersheds. The project design included a 2- to 3-yr pre-BMP monitoring phase followed by a 3- to 4-yr post-BMP evaluation phase. Surface water quality samples collected during snowmelt, rainfall and irrigation runoff were analyzed for nitrogen, phosphorus, and bacteria concentrations. Soil nutrient status, riparian health, and rangeland health were also monitored at many of the BMP sites. Water quality data indicated high levels of nutrients and bacteria were often detected in edge-of-field runoff at the majority of the BMP sites. It was apparent that, while BMP implementation at field scale may affect water quality and associated range and riparian health at individual sites, the watershed outlet results often did not reflect these changes. The initial water and soil observations resulted in evaluating a wider range of BMPs than originally anticipated in IFC and WHC, with the focus of BMPs shifting from manure rate management to the modification of manure application methods and timing, modification of livestock grazing patterns, and expansion of the number of producers applying BMPs. A number of the sites showed positive water quality responses to the BMPs and results were used to develop a modeling technique to evaluate BMP scenarios in the study watersheds and other Alberta watersheds.
2C4.3 ID:6293 14:45
Prairie Hydrology and Agricultural BMPs: Does the Cropping System Make a Difference? Kangsheng Wu 1, Etienne Soulodre 1, Gordon Bell 2, Barbara Cade-Menun 3, Ymène Fouli 3 1 Water Security Agency 2 Agriculture & Agri-Food Canada 3 Agriculture & Agri-Food Canada, SPARC Contact: [email protected]
In the Canadian prairie region, managing water resources is a challenging task. Our water management is often difficult because of hydrologic complexity, limited hydrologic knowledge, and lack of data. Partnered with Water Security Agency and others, a watershed study was initiated by AAFC in Southeastern Saskatchewan at the Pipestone Creek Watershed to evaluate four beneficial management practices (BMPs) in agriculture landscapes. Climatic, soil, hydrologic, and water quality data were collected over the past three years (i.e., 2010, 2011, and 2012). Based on preliminary analysis of these data, we found: 1) Cropping systems (i.e. annual cropland and perennial pasture) significantly impact overland runoff contributions. While we did not find a significant difference in snowmelt runoff in 2010, 2011 and 2012 between these cropping systems, our

data and field observation illustrated that, in terms of rainfall runoff, perennial pasture has a very limited potential compared with annual cropland. 2) In an extremely wet year (i.e., 2011), perennial pasture land did generate rainfall runoff. Five of the events were caused by wetland spillage, and two of them were associated with intense thunderstorms (~20-100 mm/hr) along with wet antecedent soil moisture conditions. 3) Runoff was significantly reduced on a site that was recently converted from annual cropland (wheat/canola rotation) to perennial cover (grass-alfalfa). 4) While restored wetlands can hold more water, the most significant impact on overland flow quantity in this watershed might come from pasture lands, even newly converted from annual cropland land.. This field monitoring project provides important information to enhance our knowledge on Prairie hydrology. Our experience also suggests that further study is needed on role and mechanisms of perennial pasture and pasture species in managing overland.
2C4.4 ID:6681 15:00
The impact of agricultural beneficial management practices on sediment properties and bacteria-sediment associations in Southeastern Saskatchewan David Barrett 1, Kyle Hodder 1, Dena Mcmartin 1, Barbara Cade-Menun 2 1 University of Regina 2 Agriculture and Agri-food Canada Contact: [email protected]
Both sediment and bacteria, independently, can have significant impacts on water quality. Within heavily agricultural environments, both of these parameters are commonly found in higher than natural concentrations. Agricultural beneficial management practices (BMP’s) can be introduced for a variety of reasons, including to mitigate environmental impacts. In fluvial environments the formation of complex cohesive particles can be enhanced by the presence of microorganisms, however the interactions are poorly understood. Furthermore, prior research into impact of BMPs on sediment particle characteristics has not been done in this region. The impact of beneficial management practices on both sediment release and bacteria-sediment associations is being studied at the edge-of-field scale in Southeastern Saskatchewan with the majority of sampling occurring during snowmelt events in 2011 and 2012. Initial results have shown both temporal and spatial patterns in bacteria-sediment associations and sediment properties. Some correlations have been found between sediment properties, such as mean size, and bacteria-sediment associations. With results indicating that, in some cases, >50% of bacteria in agricultural field runoff are sediment-associated, it is imperative that we better understand this process.

Understanding spatial and temporal patterns in bacteria-sediment associations alongside measurement of sediment properties is being used to evaluate the performance of BMPs.
2C4.5 ID:6897 15:15
Metals Fluctuations in the Qu’Appelle River System (2008-2012) Enisa Zanacic 1, Dena W. Mcmartin 2 1 University of Regina/ WSA 2 University of Regina Contact: [email protected]
Heavy metals losses due to runoff from agricultural land have received little attention from agronomists and soil scientists, likely because of the complexity and challenge of studying non-point source contamination. In this evaluation of surface water quality monitoring information, water quality measurements were evaluated for in-stream fluctuations both temporally and spatially along upper reaches of the Qu’Appelle River, Saskatchewan, in an effort to identify potential point and non-point sources of metals in the aqueous phase. In this presentation, the temporal and spatial fluctuations in copper (Cu), zinc (Zn) and nickel (Ni) concentrations will be provided. For the purposes of this study, the results of analyses for samples collected from three locations are provided: (1) Buffalo Pound Lake, (2) Qu’Appelle River upstream of convergence with Wascana Creek, and (3) Qu’Appelle River downstream of convergence with Wascana Creek. Statistical analysis indicates association both spatially and temporally between metals and turbidity and TSS. It is possible that the high correlation of metals to turbidity and TSS in spring, in particular, is associated with surface runoff in areas of high agricultural operation and productivity. High alkalinity and pH of the Qu’Appelle River suggest that oxidation of the river bed sediments is less likely to be cause of temporal metals concentration increases. These temporal variations in trace elements suggest that metals concentrations present in the water are controlled by the land use and management practices. Further monitoring and study is necessary to fully determine the sources of metals in the upper reaches of the Qu’Appelle system.
Atmosphere, Ocean, and Climate Dynamics / Dynamique de l'atmosphère, de l'océan et du climat
Room / Endroit (TCUP Gall. Suite 1), Chair / Président (Michael Waite ), Date (28/05/2013), Time / Heure (14:00 - 15:30)
2C5.1 ID:6639 14:15Near-inertial forcing as a geostrophic kinetic energy sink Stephanne Taylor 1, David Straub 2 1 McGill 2 McGill University Contact: [email protected]
Interactions between near-inertial and geostrophic flow is considered in a zonally periodic primitive equation ocean channel with a meridionally oriented ridge. A steady wind forcing drives a nearly geostrophic base state, which exhibits quasi-zonal jets such as are typical in beta plane turbulence. An additional high frequency component to the wind stress is applied to excite near-inertial modes. Frequency spectra of kinetic energy are then examimed as a function of the high frequency forcing amplitude. It is found that the addition of near-inertial energy results in a reduction of low frequency energy. In other words, it appears that geostrophic-to-near-inertial energy transfers can provide a significant energy sink for the balanced flow when the inertial modes are maintained at a relatively high amplitude by external forcing.
2C5.2 ID:6388 14:30The CLASS Lake Module: Modelling Small Lakes in the Climate System Murray Mackay , Diana Verseghy Climate Research Division, Environment Canada Contact: [email protected]
Even though they comprise a relatively small fraction of the terrestrial landscape, there is growing awareness that lakes play a crucial role in the climate system. Not only do they alter local climates through the exchange of heat and moisture with the atmosphere, they also process large amounts of carbon and are thus players in the global greenhouse gas budget. Generally inland water bodies are ignored in climate modelling research as they are too small to be resolved in typical climate simulations, and any role they may have on the climate system currently, and in the future, cannot be evaluated using these tools. To begin to address this issue the Canadian Land Surface Scheme (CLASS) has been enhanced with a one – dimensional dynamic lake model tile for simulating unresolved lakes in Environment Canada’s global and regional climate models. This model is based largely on well established process algorithms with some exceptions. The complete nonlinear surface energy balance is computed in a skin layer of arbitrary thickness in order to ensure rapid response times with the atmosphere. Turbulent mixing in the epilimnion is achieved through surface stirring and buoyancy production as well as shear production along the diurnal thermocline. In this talk the model is presented and evaluated against extensive data collected at the Experimental Lakes Area in Northern Ontario and other regions.

2C5.3 ID:6351 14:45
Diurnal Variations of Near-Surface Wind Speed Distribution Under Clear and Low Cloudy-Sky: Observations and SCM Model Simulations Yanping He 1, Adam Monahan 1, Norman Mcfarlane 2 1 University of Victoria 2 CCCMA, Enviroment Canada Contact: [email protected]
Knowledge of the climatological near surface wind speed (SWS) probability distribution (PDF) is essential for climate model assessment and development, and for surface flux estimation and wind power management. Current state of art regional climate models fail to capture the observed diurnal variation of SWS PDF over the North America. General features of diurnal variations of the leading three moments of SWS and their fine vertical structures within 200 m observed at a tall tower at Cabauw, NL have been discussed in our earlier research, in which the effects of cloudiness on the diurnal cycle have been neglected. We will show in this study that, based on long-term 10-minute tower data and 30-second Ceilometers backscatter data the observed SWS PDF is significantly different between clear-sky and cloudy-sky conditions at Cabauw. Diurnal variations of the leading two moments (mean and std) of SWS are found to be consistent with the diurnal evolution of near surface thermal structures, which are greatly influenced by the existence of low level clouds in all seasons. The SWS skewness is also found to have distinct diurnal variations and unique vertical structures under the different sky conditions. In particularly, SWS skewness under low cloud conditions is always positive (a longer tail toward extreme large winds) in all vertical levels during all calendar seasons, which is closely associated with the observed higher frequency of large surface geostrophic winds from the ocean under the same sky conditions. The observed general features of SWS PDF under low cloudy-sky are used to identify current problems and to improve its representations of moist processes in the current CCCma Single Column Model.
2C5.4 ID:6355 15:00
Diurnal precipitation east of the Rockies
Yanping Li University of Saskatchewan Contact: [email protected]
Harmonic analysis of data from 1000 automated surface observation systems (ASOS) distributed over the continental United States finds the known eastward moving diurnal summer precipitation anomaly and a large sun-following continentally enhanced tide. Optimization using the “temperature based tide assumption” suppresses the tide and reveals a smaller pressure signature moving east along with the precipitation. This pressure “wave” is present on dry days also, and in winter, indicating that it is the cause of the precipitation

anomaly, not its result. A possible mechanism for the pressure wave is developed from the linear Bousinesq equations with heating and wind shear. In addition to the inhomogeneous continental tide, it shows eastward moving diurnal pulses of potential vorticity (PV) generated by imposed heating over the Rockies. Because of the background shear, they produce vertical motion in the lower troposphere, which may further lead to precipitation. The PV hypothesis is tested with the North American Regional Reanalysis (NARR) data. Diurnal drifting PV anomalies are found around 500 to 600 hPa level in both winter and summer. In winter the PV anomalies are weaker and seem to form further west, and they do not trigger convection, the eastward propagating signal only shows up in the surface pressure observation.
2C5.5 ID:6311 15:15
Progress on the development of a high resolution model for the North Atlantic Zeliang Wang , Blair Greenan , David Brickman Bedford Institute of Oceanography Contact: [email protected]
A 1/12 degree North Atlantic model has been developed based on NEMO model. The model domain ranges from 7°N to 75°N. The northern part of the domain includes Baffin Bay, Hudson Bay and GIN Sea, which regions connect with the Arctic Ocean. A 1990-2010 hindcast was run with CORE2 forcing for 1990-2007, and NCEP forcing for 2008-2010. The modelled sea surface height (SSH) results were compared with satellite altimeter data as well as tide gauge data from nearly 300 stations. The Labrador Current is observed in the model to pass around the tip of Grand Banks and a reasonable Gulf Stream Separation is achieved; these two oceanographic features typically represent a significant challenge for the prognostic modelling for the North Atlantic Ocean. The model results indicate that high resolution models are necessary in order to properly simulate the interaction of the subpolar and subtropical gyres in the area of the tip of Grand Banks, and this interaction plays a critical role in the Gulf Stream separation. The strength of subpolar gyre from this high resolution model is more than 40 Sv, which is higher than previous estimates and, therefore, the possible reasons for this will be discussed.
Mining Geophysics PART 2 / Géophysique minière PARTIE 2

Room / Endroit (TCUP Gall. A), Chair / Président (Jim Merriam ), Date (28/05/2013), Time / Heure (14:00 - 15:30)
2C6.1 ID:6799 14:00Monte Carlo Particle Tracking Applied to Uranium Calibration Test Pit Design
Tyler Mathieson Cameco Corporation, Exploration Division Contact: [email protected]
The use of Geometry and Tracking modeling software, called GEANT4, is employed to model gamma ray transport through calibration models to determine optimum pit construction and to explore alternative calibration schemes. The pits modeled are representative of the Saskatchewan Research Council (SRC) gamma probe test pits located in Saskatoon, Saskatchewan. The use of GEANT4 to derive correlative count-rate/Uranium-grade data was proposed by Dickson (2010) and was intended to be used in conjunction with the Kohman (1947) method for determining instrumental dead-time. The Kohman method helps characterize a gamma probes inherent counting efficiency in to increasingly higher count rates; this information is then used to calibrate a given detector to the idealized model count-rate generated by GEANT4. Once a relationship has been made between an observed count rate and a suitably accurate model, the model parameters may be systematically changed to determine the optimum dimensions for future calibration test pits. This also allows for the testing of other possible calibration schemes including the use of thin high grade zones, in conjunction with an appropriate deconvolution operator, a technique proposed by Dickson (2012). The creation of accurate calibration pit models also raises the possibility of using the Kohman method in conjunction with the GEANT4 modeling to forgo calibration pits altogether.
2C6.2 ID:6409 14:15Three dimensional numerical modeling of the VLF method and the effects of topography Samuel Butler 1, Michael Zhang 1, Tyler Mathieson 2 1 University of Saskatchewan 2 Cameco Corp. Contact: [email protected]
We present finite element simulations of the propagation of Very Low Frequency (VLF) electromagnetic waves over topography based on the commercial finite element modeling package Comsol. We show that the model reproduces analytical solutions for layered half spaces. When topography occurs over horizontal length scales that are comparable or greater than the electromagnetic skin depth, VLF anomalies are produced that may mask VLF anomalies caused by deeper structure. We model the three dimensional effects of topography in our
simulations and report on attempts to use the simulation results to remove the effects of topography from measured field data.
2C6.3 ID:6410 14:30
Another look at reciprocity in resistivity and induced polarization methods
Samuel Butler University of Saskatchewan Contact: [email protected]
The principle of reciprocity as applied to the resistivity method indicates that the current and potential electrodes can be exchanged and the same apparent resistivity will be measured for any array geometry and resistivity distribution in the ground. The derivation of the reciprocity relationship also shows that the sensitivity kernel for the resistivity method is the correlation of the current densities injected from both sets of electrodes. Although not emphasized in most textbooks, this gives a physical way to interpret the sensitivity of the method. When applied to the induced polarization technique, this gives us a relatively simple way to calculate the “apparent chargeability” of an object of finite size embedded in a material of different chargeability. Numerical simulations and experimental laboratory measurements will be used to illustrate the use of this principle.
2C6.4 ID:6548 14:45
Borehole imagery and full wave sonic measurements around Keefe Lake, Saskatchewan Bhaskar Pandit , Zoltan Hajnal , Erno Takacs Dept. of Geological Sciences, University of Saskatchewan Contact: [email protected]
As part of the uranium exploration project around Keefe lake, Saskatchewan conducted by Athabasca Uranium Inc., a set of borehole measurements were carried out at two locations separated by approximately 150m. Included besides the natural gamma and resistivity logs were the 'Full wave sonic' and 'Borehole televiewer' logs. The latter two allowed the determination of the P and S wave velocities and a continuous imagery of the two holes to a depth of 354m and 548m respectively. The unconformity between the Athabasca sandstones and the underlying basement lies around 180m in this area; the P and S wave velocities increase in a transitional manner across this geological boundary. The image logs were used to map four attributes; namely, stratification within the sandstone fill, open fractures, veins and schistosity. Within the common depth zone of the two boreholes, there is a broad correlation between these attributes. Since the deeper hole penetrates a seismically interpreted shear zone, this correlation provides a minimum estimate of its lateral extent. Significant increase in the gamma ray activity is generally found to accompany about 10% decrease in the P and S wave velocities and a reduction of the resistivity by a factor of 3-4.

Seismic modeling studies based on the sonic logs show that the seismic signature of the unconformity has a complex waveform; this observation has been recorded frequently on a number of seismic surveys carried out both in this area and elsewhere in the Athabasca basin.
2C6.5 ID:6704 15:00
Induced polarization effects in galvanic resistivity surveys
Jim Merriam CGU Contact: [email protected]
Resistivity surveys in polarizable terrain can present misleading results. Because resistivity surveys are performed with a dominant frequency that is in the middle of the induced polarization response band, there is a possibility that unrecognized polarization effects will bias the measured apparent resistivity. I will show that the grain size, surface impedance, host resistivity and intrinsic grain resistivity are the important parameters and explain how they can produce biased results. The effective resistivity of a polarizable grain is its intrinsic resistivity plus twice the surface impedance divided by the grain size. Therefore, large grains with small surface impedance will always appear as conductive anomalies, while small grains with large surface impedance will always appear as resistive anomalies. Since grain size and host resistivity in particular are extremely variable, there is considerable scope for any of the polarizable minerals to present as either a resistive or conductive anomaly in a resistivity survey. Furthermore, any polarizable mineral can present no anomaly at all if the grain size, surface impedance, and host resistivity are favourable. The sign of the effect is independent of the amount of mineralization, so it is possible to have no anomaly even in the presence of considerable mineralization.
Atmospheric Hazards and Extreme Weather PART 2 / Hasards atmosphériques et météo extrème PARTIE 2
Room / Endroit (TCUP Gall. B), Chair / Président (Bob Kochtubajda ), Date (28/05/2013), Time / Heure (14:00 - 15:30)
2C7.1 ID:6717 14:00
The Challenge of Land Breeze Snow Squalls: An In-Depth Look at the Jan 25th 2013 Lake Ontario Snow Squall
Arnold Ashton Environment Canada Contact: [email protected]
Great Lakes snow squall convection appears in a variety of modes, dependent on such factors as air-water temperature contrast, boundary layer wind shear, diurnal influences and the convergent effects of irregular shorelines. There is a small percentage of snow squalls which form in the vicinity of very cold high pressure centres initiated by strong diabatic heating over the water and enhanced by land breeze convergence. They are born over the water but often drift onto shoreline areas due to a light boundary layer steering flow. These meso-beta squalls present the greatest forecasting challenge due to their shallow depth, slow movement, irregular shape and poor depiction on most current numerical models. However, mesoscale models have improved somewhat in suggesting the formation and evolution of these squalls. Over the course of most winters the heavily-populated ‘Golden Horseshoe’, which wraps around the west end of Lake Ontario, experiences one or more land breeze snow squalls, often with significant accumulations. Given the region's large population base, the sudden arrival of one of these snow squalls usually has significant impacts. On the morning of January 25 2013, a retreating Arctic high pressure centre spawned a particularly intense snow squall over Lake Ontario which drifted into the heavily populated region just east of Toronto in the afternoon. It resulted in a sudden visibility reduction to 200 metres or less, snowfall rates up to 7 cm per hour and a roughly 70 multi-vehicle collision on Highway 401 which closed the highway for several hours. There were no fatalities but several serious injuries. This case will be examined in some detail, highlighting the squall's evolution, model predictions, and the Ontario Storm Prediction Centre's forecasts. Finally, forecast suggestions will be presented to improve their predictability.
2C7.2 ID:6285 14:15
Mesoscale Analysis and Simulation of Heavy Rainfall in Shanghai Urban Area By Using Non-conventional Data Linlin Qi , Wei Li , Hongfeng Zhang (Presented by Xiaodan Wang ) Institute of Beijing Aeronautical Meteorology Contact: [email protected]
In this paper, a local record severe rainfall since 1949 occurring in the Shanghai urban area on 5-6 August 2001 is investigated using non-conventional

observational data provided by the “973” basic research project of China, including automatic meteorological stations data, wind profiler data, Doppler radar echoes and GMS5 satellite data and NCEP data. By analyzing, it is revealed: 1) the heavy rainfall, caused by a serious of mesoscale βconvective cloud clusters developing inside the landing tropical depression (TD), occurred suddenly with the typical characteristics of urban heavy rainfall disaster; 2) The landing tropical depression, which moved eastward to Shanghai and re-intensified before entering into the sea, was very favorable for the occurrence of the heavy rainfall in Shanghai; 3) There may exists the interaction of different scale systems between the tropical depression and mesoscale convective cloud clusters; 4) The various advanced intensive data contribute importantly to detect earlier and predict successfully the urban meteorological disasters.
2C7.3 ID:6322 14:30
Self-Organizing Maps: Map-Typing by Neural Network to Increase Reliability of High-Impact Weather Forecasting Ryan Lagerquist 1, Alister Ling 2 1 Environment Canada, University of Alberta 2 Environment Canada Contact: [email protected]
Many types of high-impact weather (HIW) are short in duration and local in extent, which means that they are not always faithfully represented by deterministic atmospheric models. Our project uses self-organizing maps (SOM), a type of artificial neural network, to post-process historical data and detect patterns, or “map types,” conducive to high-impact weather. SOM is an unsupervised learning process, which means that the patterns it detects in atmospheric fields are not pre-specified. The SOMs used in our project are trained by one or more fields (collectively, the “predictor field”) from the NARR (North American Regional Reanalysis) over the years 1979-2011. Each map type is described completely by a single predictor field, whereas the predictand consists of one or more HIW fields. In our first experiment, the predictor consists of meridional and zonal MSLP gradients, while the predictand is 6-hour liquid-equivalent precipitation. To correlate a given map type with HIW, all historical cases of said map type are found, then the HIW at each matching time is found. Via an internal website, for each run of the GEM Regional model, forecasters can examine model predictions for lead times up to 54 hours, see the nearest map types, and their associated HIW. For instance, forecasters can see the maximum and average accumulated precipitation with each map type, as well as the frequencies of amounts exceeding different thresholds (e.g., warning criteria). Thus, based on large-scale patterns, which are well predicted by models, forecasters are flagged to potential HIW, whether or not HIW is captured by the deterministic model prediction. We are currently establishing correlations of SOM map types with snowfall, fog, and low cloud ceilings, as well as updating the internal website to increase ease of use and integrate SOM map-typing into daily forecaster workflow.

2C7.4 ID:6801 14:45
Comparison of statistically downscaled precipitation in terms of future climate indices and daily variability for southern Ontario and Quebec, Canada Carlos Gaitan 1, William Hsieh 1, Alex Cannon 2 1 University of British Columbia 2 Pacific Climate Impacts Consortium Contact: [email protected]
Given the coarse resolution of the global climate models (GCMs), downscaling techniques are often needed to generate finer scale projections of variables affected by local scale processes such as precipitation. However, classical statistical downscaling experiments for future climate rely on the time- invariance assumption as one cannot know the true change in the variable of interest, nor validate the models with data not yet observed. Our experimental setup involves using the Canadian regional climate model (CRCM) outputs as pseudo-observations to estimate model performance in the context of future climate projections by replacing historical and future observations with model simulations from the CRCM, nested within the domain of the Canadian GCM (CGCM). In particular, we validated statistically downscaled daily precipitation time series in terms of the Peirce skill score, mean absolute errors (MAE), and climate indices (including indices for extremes). Specifically, we used a variety of linear and nonlinear methods such as artificial neural networks (ANN), decision trees and ensembles, multiple linear regression, and k-nearest neighbours to generate present and future daily precipitation occurrences and amounts. For downscaling, the predictors were taken from the CGCM 3.1 20C3M (1971-2000) and A2 (2041-2070) simulations, while the predictands were the precipitation outputs from the CRCM 4.2. Overall, ANN models and tree ensembles outscored the linear models and simple nonlinear models in terms of precipitation occurrences, without performance deteriorating in future climate. In contrast, the future MAE of the downscaled daily precipitation amounts deteriorated; however for downscaled climate indices, the change in future performance can be either positive or negative.
2C7.5 ID:6372 15:00Lightning frequency prediction based re-analysis fields and assessment of potential changes under future climate scenarios in British Columbia, Canada
Derek Van Der Kamp 1, Dan Moore 2, Steve Taylor 3 1 Geography, University of British Columbia 2 Geography and Department of Forest Resources Management, University of British Columbia

3 Canadian Forest Service, Victoria Contact: [email protected]
We adapted an approach developed for operational forecasting of lightning to generate projections of lightning frequencies under future climate scenarios, with application to British Columbia, Canada. The approach involved the use of binary logistic regression (BLR) models using predictor variables extracted from NCEP re-analysis fields. The BLR models were trained using daily counts of lightning strikes within cells centred on the NCEP grid points, which were then reduced to a binary (lightning vs no lightning) response variable. Cross-validation showed that the BLR models were able to reproduce monthly mean lightning frequencies with reasonable accuracy. On a daily basis, the skill of the BLR models generally varied with overall lightning frequency within a grid cell, with low skill in cells with low frequency. The BLR models were run using predictor variables extracted from four General Circulation Models (GCMs). In a historical baseline run, all GCMs exhibited bias, although three reproduced the general seasonal pattern, with peak lightning frequency in July. Future projections were based on the A2 and B1 emissions scenarios, with output extracted for 2056-2065 and 2091- 2100. Changes were assessed relative to the historic baseline runs. While there was substantial variability in the projected changes in lightning frequencies among GCMs, emissions scenarios and months of the year, projections dominantly indicate an increase in lightning frequency, particularly in May. An increase in lightning frequency in May, in combination with earlier snow disappearance and onset of spring weather, could cause an earlier start to the fire season, with implications for deployment of resources for fire suppression.
2C7.6 ID:6811 15:15
Convective Storm and Lightning Alerts Based on Continuously Updated Stability Indices Randolph Ware 1, Ismail Gultepe 2, Isaac George 2, John Hanesiak 3, Stan Heckman 4, Steven Koch 5, Marta Nelson 6, Elena Novakovskaia 4, Brent Shaw 7, Chris Sloop 4 1 Radiometrics, NCAR EOL, CIRES (Boulder, CO) 2 Meteorological Research Division, Environment Canada (Toronto, ON) 3 University of Manitoba (Winnipeg, MB) 4 Earth Networks (Germantown, MD) 5 National Severe Storms Laboratory, NOAA (Norman, OK) 6 Radiometrics (Boulder, CO) 7 Weather Decision Technologies (Norman, OK) Contact: [email protected]
A microwave radiometer profiler is operated as part of the Canadian Airport Nowcasting (CAN-Now), Fog Remote Sensing and Modeling (FRAM), and Satellite and Arctic Applications for Weather and SAR (Search and Rescue) Observations (SAAWSO) projects. The profiler retrieves continuous temperature, humidity and liquid soundings in all weather conditions. Automated software ingests the thermodynamic soundings, calculates continuously updated Stability

Indices, and combines them to provide local convective storm and lightning alerts. We will discuss scientific journal reports of lightning and severe convective storm prediction more than 2 hours in advance based on continuously updated Stability Indices calculated from microwave profiler retrievals, and case studies of Tornado, Water Spout and Derecho events.
Supporting Climate Services in Canada and Internationally / Support aux services climatiques au Canada et au niveau international
Room / Endroit (TCUP Gall. C), Chair / Président (Harvey Hill ), Date (28/05/2013), Time / Heure (14:00 - 15:30)
2C8.1 ID:6899 14:00Canada and the International Environmental Agenda
David Grimes Environment Canada Contact: [email protected]
The Environment does not respect political boundaries, and the business of predicting environmental conditions is highly dependent on international cooperation. Without access to global data in real time, weather forecasts beyond two days would not be possible. Information on atmospheric and oceanic/hydrometric transport of pollutants is critical to understanding the constantly evolving state of the quality of our air and our water. Recent dramatic changes in the polar environments is now expected to have effects on environments and ecosystems around the planet. The international community comes together in many international fora such as the World Meteorological Organization, the Intergovernmental Oceanographic Commission, the international Group on Earth Observations and the fledgling Global Framework for Climate Services to understand these processes and how they affect regional and national conditions. David Grimes, Assistant Deputy Minister of the Meteorological Service of Canada and the President of the World Meteorological Organization, will provide an overview of these organizations and Canada’s contributions to them.
2C8.2 ID:6923 14:15

Increasing resilience to extreme climate events through decision support tools: AAFC’s Climate Adaptation for Resilience in Agriculture Toolkit (CARAT) Harvey Hill , Monica Hadarits , Richard Rieger , Cameron Kayter , Robert Armstrong , Kaitlin Strobbe Agriculture and Agri-Food Canada Contact: [email protected]
Extreme climate events pose significant economic, social and environmental challenges for the agriculture sector. Decision support tools that enhance the sector’s resilience to these events can help reduce future impacts and capitalize on potential opportunities. The Climate Decision Support and Adaptation Unit (CDSA) of Agriculture and Agri-Food Canada (AAFC) is currently working on the Climate Adaptation for Resilience in Agriculture Toolkit (CARAT), which will consist of a suite of tools that integrate climate and other information and support decision making at a range of spatial and temporal scales. They are targeted at a number of different stakeholders, and are currently in the research and development stage. Advanced prototypes of the tools are anticipated to be ready for the technology transfer phase beginning in 2014. This paper will provide an overview of the CARAT, the advanced prototypes, key lessons learned as well as future directions
2C8.3 ID:6849 14:30
Communicating climate information to vulnerability, impacts and adaptation users: Lessons and benefits of the atlas of climate scenarios for Quebec forests Travis Logan , Isabelle Charron Ouranos Contact: [email protected]
One of the important challenges of Ouranos’ Climate Scenarios and Services group is the adequate presentation and communication of understandable yet robust climatic information to collaborators in Vulnerability, Impacts and Adaptation (VI&A) projects. Over the course of this work, VI&A researchers become more comfortable with different types of climatic information and concepts and often leads to further more precise requests and better determination of user needs. In this presentation we examine how the Climate Scenarios and Services group has matured progressively in its capacity to communicate climate information across different types of projects. In particular the Atlas of Climate Scenarios for Quebec Forests is presented as an example of a launching point for a number of ongoing projects in the Forest Resources and Biodiversity programs at Ouranos that have resulted in a snowball effect in terms of both users’ understanding as well as in the evolving nature of the format and types of climate information and data being provided. We present the different types of climatic information included in the Atlas and show how progressive integration of elements from other Ouranos projects has produced a more and

more complete format while still remaining understandable to VI&A users.
2C8.4 ID:6541 14:45
Evaluation of an Integrated Canadian Crop Yield Forecaster (ICCYF) for In-season Prediction of Crop Yield Across the Canadian Agricultural Landscape Yinsuo Zhang 1, Aston Chipanshi 1, Nathaniel Newlands 1, Andrew Davidson 1, Harvey Hill 1, Frederic Bedard 2, Gordon Reichert 2 1 Agriculture and Agri-Food Canada 2 Statistics Canada Contact: [email protected]
The Integrated Canadian Crop Yield Forecaster (ICCYF) is a probabilistic crop yield modelling tool that has been developing at Agriculture and Agri-Food Canada in collaboration with Statistics Canada. This study provides scientific evaluations of the ICCYF in forecasting the yields of three major crops (spring wheat, barley, and canola) across the Canadian agricultural landscape. The current ICCYF model integrates historical and near-real time inputs into a Bayesian modelling framework. The spatial modeling unit is the Census Agriculture Region (CAR). Predictors for each CAR are selected by the robust least angle regression followed by the robust cross validation process. Spatial correlations of the models are accounted and the Markov Chain Monte Carlo scheme is used to estimate the probability distribution of variables that are not yet available at the time of forecast. Daily agroclimatic indices are generated by a soil moisture budget model and weekly composites of the Normalized Difference Vegetation Index (NDVI) are obtained from online distributors. Soil and cropland maps are used to aggregate the agroclimatic indices and NDVI images into ICCYF required CAR level inputs. Surveyed crop yield at the CAR level from STC are used in the model building and validation. Data from 1987-2011 were used to build forecasting models, a leave-one-out-cross-validation (LOOCV) was performed to test their forecast power, and the models were then used to make four in-season yield forecasts in 2012 to further understand the forecast credibility and its evolution with time. The average variance explained (R2) by the selected predictors for all the CARs across Canadian agricultural landscape were 0.7, 0.61 and 0.66, and the mean absolute percentage error during the LOOCV process were 11%, 10% and 15% for spring wheat, barley and canola respectively. The 2012 independent tests showed that skillful yield forecasts could be achieved by early August.
2C8.5 ID:6895 15:00Towards Mapping of National Climate Services in Canada: A perspective from EC Chantale Cote , Alain Pietroniro , Bertrand Denis , Jennifer Milton , Pierre Pellerin

, Sharon Ribero , Al Wallace , Russell White , Julie Lax Environnement Canada Contact: [email protected]
Billions of archived environmental observations, data from numerical weather and climate prediction models are used to produce hundreds of thousands of weather, water and climate predictions and related services to the public each year in Canada. This information is intended to help manage risk and encourage adaptive behaviour among the public and decision-makers in health, emergency management, agriculture, energy, forestry, transportation, construction, insurance, and many other sectors and institutions. The production of this information is dependent on a federal public monitoring, computer, telecommunication, and research laboratory infrastructure valued at over $330 million—and the efforts of about 2,000 meteorologists, climatologists, hydrologists, scientists, engineers, technicians and support staff. Unquantified yet significant contributions are also made by other federal, international, provincial, territorial, local, or non-government agencies, the private sector;, and academia. Understanding roles and responsibilities and developing an effective national service delivery model are essential to provide easily accessible, timely and accurate information about the past, current and future states of the atmosphere, hydrosphere, and cryosphere, and associated impacts to society. The preliminary results of a national water and climate services mapping exercice will be presented. This effort is aimed at better understanding respective national contributions to the provision of water availability and climate information including the successes, the challenges, and the critical gaps to address users needs for water availability and climate information. This project is part of a Meteorological Service of Canada 10 Year Strategy to modernize and revamp its water and climate services as part of a transformative agenda to create a seamless impact-based weather, water and climate service over varying time scales, to support enhanced resilience to a changing climate.
2C8.6 ID:6624 15:15
An overview of agroclimate monitoring and reporting services and products at AAFC.
Patrick Cherneski , Trevor Hadwen AAFC Contact: [email protected]
Extreme weather has a significant impact on agricultural production. The economic losses and impacts from droughts, floods and other extreme events can be in the billions of dollars. Keeping track of the conditions and getting a sense of the impacts and significance are necessary components of making decisions for response, support and planning. Within Agriculture & Agri-Food

Canada (AAFC), the majority of the monitoring and forecasting of weather and climate conditions and the impacts on agriculture across Canada are handled by a group called the National Agroclimate Information Service (NAIS). This presentation will highlight some key products within AAFC’s suite of products accessible via the Drought Watch web site, plus some new products under development. Currently, NAIS collects weather data from six networks of weather stations across Canada, and conducts quality assurance and control on a daily basis to ensure consistency of the data for the purposes of agricultural analysis. Value-added products are generated in a variety of time steps from daily to yearly. The primary temperature and precipitation variables are also used in agrometeorological risk indices such as the Palmer Drought Severity Index and soil moisture. The value-added products and simulated indices are presented as more than 500 maps daily on an external web link called Drought Watch. This link is consistently one of AAFC’s most popular, and the maps are utilized by a wide variety of users, including media. Once a month, the maps of agroclimatic indices are analyzed to assess the extent and intensity of drought across Canada to create a Canadian Drought Monitor map. The outcome of the Canadian analysis is joined with similar analyses from the United States and Mexico to produce a North American Drought Monitor map which is posted on a U.S. web site. The North American Drought Monitor is becoming a model for how partnership and collaboration can help address a complex extreme weather event such as drought. To complement the information received from weather stations and to help inform the interpretation of agroclimatic indices, NAIS has developed a network of on-the-ground volunteers in Western Canada who provide personal assessments on a monthly basis of the impact of weather on their agricultural operations. This information is also presented as maps on the Drought Watch web site. The plan for this volunteer monitoring network is for it to become a national network over the course of several years. In the spring of 2013, NAIS will launch a new external online reporting tool called the Agroclimate Impact Reporter that will allow a wide variety of new users to provide input on the impacts of weather. AAFC’s existing suite of products, with the addition of new products under development, will expand the nature of and access to agroclimate information for decision-makers.
Perspectives of hydrometeorological extremes PART 2 / Perspectives des extrèmes hydrométéorologiques PARTIE 2
Room / Endroit (TCUP Gall. D), Chair / Président (M. Naveed Khaliq ), Date (28/05/2013), Time / Heure (14:00 - 15:30)
2C9.1 ID:6280 14:00Analyzing the influence of large-scale climate circulations on streamflow activity in Ontario, Canada using wavelet analysis Deasy Nalley , Jan Adamowski , Bahaa Khalil McGill University Contact: [email protected]
This paper aims to investigate the effects of the variability in the El Niño/Southern Oscillation (ENSO), the Pacific Decadal Oscillation (PDO), and the North Atlantic Oscillation (NAO) activities on annual streamflow data (during the 1954 – 2008 period) which were obtained from a total of eight Reference Hydrometric Basin Network (RHBN) stations situated in Ontario, Canada. The Sea Surface Temperature (SST) data in Niño region 3.4 were used as an indication of ENSO activity. Due to the complexity of the relationships that may exist among these climate indices, in this paper we only looked at the influences of these indices, individually. Wavelet analysis was used to examine the linkages between either ENSO or PDO or NAO and streamflow. We incorporated the use of continuous wavelet transform (CWT), cross wavelet transform (XWT), and wavelet coherence (WTC). The CWT was used to analyze the temporal characteristics of both the climate index and streamflow data. The XWT and WTC were used to assess the linkages between two time series (i.e. one climate index and a streamflow time series). The effects of the climate indices on streamflow activity are mostly evident at up to 7-year period (for ENSO), 2-6-year and 8-18-year periods (for PDO), and up to 8-year and 8-16-year time periods (for NAO). This study has illustrated the usefulness of wavelet-based methods in examining the linkages among large-scale climatic circulations and streamflow activities in Ontario, Canada. The results also demonstrate the importance of incorporating climate variability in the decision making related to various aspects of water resources management, both at the watershed level and regionally.
2C9.2 ID:6724 14:15
Evaluation of NARCCAP multi-RCM simulations over the Canadian Prairie provinces M. Naveed Khaliq 1, Laxmi Sushama 2, Andre Monette 2, Howard Wheater 1 1 University of Saskatchewan 2 University of Quebec at Montreal Contact: [email protected]
This presentation focuses on the evaluation and assessment of projected changes to seasonal and extreme precipitation characteristics over the Canadian Prairies using the multi-Regional Climate Model (RCM) simulations available through North American Regional Climate Change Assessment Program. The
set of simulations considered includes those performed with the six participating RCMs for the 1980–2004 period driven by National Centre for Environmental Prediction reanalysis II and those driven by four Atmosphere-Ocean General Circulation Models for the current 1971–2000 and future 2041–2070 periods. The multi-RCM framework allowed quantification of various sources of uncertainties. Analyses of ensemble-averaged projected changes to mean seasonal precipitation and various return levels of rain and snow dominated precipitation extremes show an increase nearly all over the Prairies. The changes to seasonal precipitation are not generally found statistically significant but those for two types of precipitation extremes are found significant more often for return levels of smaller return period (e.g. 10-yr) compared to those of larger return period (e.g. 50-yr).
2C9.3 ID:6345 14:30
A Nonstationary Index-Flood Technique for Annual Maximum Streamflows Nicole O'Brien , Donald Burn University of Waterloo Contact: [email protected]
Extreme hydrological events can have profound effects on human health and safety, in the form of extensive property/environmental damage and loss of life. Several factors may contribute to temporal changes in flow records, including the anthropogenic release of greenhouse gases. It is widely accepted that an increased concentration of greenhouse gases in the Earth’s atmosphere is causing the mean global temperature to increase. In a warmer climate, the occurrence of flood events is projected to increase due to heavier precipitation amounts. In addition to climate change, land-use changes can have pronounced effects on the hydrological characteristics of a watershed. The addition of impervious surfaces can lead to increased flood amplitude and decreased time-to-peak of flooding events. Prior to the aforementioned anthropogenic forcings, hydroclimatological data were assumed to be independent and to have the same statistical probability distribution. This assumption is not valid when temporal trend is present in the flow record and standard statistical methods may no longer be applicable. Methods of incorporating nonstationarity into individual site records are well documented in the literature but there is limited research into the effects of nonstationarity in pooled (regional) flood frequency analysis. Nonstationarity in the pooling group members is addressed with a novel approach where regions are created on the basis of the form of trend present in the at-site streamflow records. Applying this technique to the annual maximum discharge of all unregulated sites in Canada, a nonstationary index-flood method is applied to the pooled growth curve. This allows for incorporation of a linear trend in both the location and scale parameters of the selected regional distribution and parameters estimates are then determined using maximum likelihood estimation. A comparison between the stationary and nonstationary pooled growth curves is carried out.

Nicole L. O’Brien and Donald H. Burn Department of Civil & Environmental Engineering, University of Waterloo, Waterloo, ON, Canada N2L 3G1
2C9.4 ID:6865 14:45
Multivariate analysis of Canadian RCM projected changes to flood characteristics for northeastern Canada Dae Il Jeong 1, Laxmi Sushama 1, Naveed Khaliq 2, René Roy 3 1 University of Quebec at Montreal 2 University of Saskatchewan 3 Ouranos Contact:
In the present work, climate change impacts on three spring (March-June) flood characteristics, i.e. peak, volume and duration, for 21 northeast Canadian basins are evaluated, based on Canadian Regional Climate Model (CRCM) simulations. Conventional univariate frequency analysis for each flood characteristic and copula based bivariate frequency analysis for mutually correlated pairs of flood characteristics (i.e. peak-volume, peak-duration and volume-duration) are carried out. While univariate analysis is focused on return levels of selected return periods (5-, 20- and 50-yr), the bivariate analysis is focused on the joint occurrence probability (JOP) of the three pairs of flood characteristics, where the JOP is the probability of both characteristics in a pair exceeding their respective thresholds at the same time. The performance of CRCM is assessed by comparing ERA40 (the European Centre for Medium-Range Weather Forecasts (ECMWF) 40-year re-analysis) driven CRCM simulated flood statistics and univariate and bivariate frequency analysis results for the current 1970–1999 period with those observed at selected 16 gauging stations for the same time period. The Generalized Extreme Value (GEV) distribution is selected as the marginal distribution for flood characteristics and Clayton copula for developing bivariate distribution functions. The CRCM performs well in simulating mean, standard deviation, and 5-, 20- and 50-year return levels of flood characteristics. The JOP is also simulated well by the CRCM. A five-member ensemble of the CRCM simulated streamflows for the current (1970–1999) and future (2041–2070) periods, driven by five different members of a Canadian Global Climate Model ensemble, are used in the assessment of projected changes, where future simulations correspond to A2 scenario. The results of projected changes, in general, indicate increases in the marginal values, i.e. return levels of flood characteristics, and the JOP. It is found that the future marginal values of flood characteristics and JOP corresponding to longer return levels will be affected more than those for shorter return levels but the former ones are subjected to higher uncertainties.
2C9.5 ID:6583 15:00
Uncertainty in Simulating Hydrologic Extremes using Statistically Downscaled Climate Data Arelia Werner , Markus Schnorbus , Rajesh Shrestha , Alex Cannon Pacific Climate Impacts Consortium Contact: [email protected]
Extremes such as floods and droughts have recently gained visibility in the climate impacts field due to their potential to cause significant impacts on society and natural systems. We test the contribution of choice of downscaling technique to uncertainty in projections of annual extremes in the Peace River Basin, British Columbia. We use four reanalysis products: ERA40; ERA-Interim; NCEP/NCAR Reanalysis 1 and the 20th Century Reanalysis for validation because they are similar in resolution to global climate models and represent the same weather events as the observed historical climate. A gridded observational product (1/16° daily resolution) developed for use with the Variable Infiltration Capacity (VIC) macro-scale hydrologic model is used as a target dataset for downscaling with six statistical methods: two versions of Bias Corrected Spatial Disaggregation (one using mean temperature and the other minimum and maximum temperature from the coarse-scale model); Bias Corrected Constructed Analogue; Double Bias Corrected Constructed Analogue; Climate Imprint and Bias Corrected Climate Imprint. These methods range in complexity and are based on either monthly or daily coarse-scale data. The resulting downscaled minimum and maximum temperature and precipitation fields are used to drive the VIC model to produce projected streamflow. These results will aid in characterizing the range of uncertainty in projected streamflow due to multiple reanalysis products and downscaling methods.
2C9.6 ID:6536 15:15
A new approach for modelling multisite precipitation extremes Kwok Chun , Howard Wheater , M. Naveed Khaliq , Zilefac Asong University of Saskatchewan Contact: [email protected]
Analysis of precipitation extremes at regional level allows information from multiple sites to be considered together and thus facilitates a reasonable alternative to single-site analysis. In this study, stations with similar extreme precipitation characteristics are clustered for most parts of Canada using extremes derived from two sets of observed data, namely the Canadian Daily Climate Data and the Adjusted and Homogenised Canadian Climate Data. From the various regions identified, a more detailed analysis is developed for the Canadian Prairies. A preliminary investigation suggests that precipitation extremes at most of the sites in the Prairies can be modelled using the Gumbel distribution. However, the Generalised Extreme Value distribution can be another possibly more general choice. It is postulated that the variance of extremes among various sites of a region can be represented by random effects and the influence of driving climate variables by fixed effects. This new framework is used
to simulate multisite extremes conditional on the states of the driving climate variables. The results of this approach are compared to those of the conventional ones at multiple time scales. The proposed approach appears to be quite reasonable for simultaneous modeling of extremes at multiple sites.
Science, Policy and Environmental Management PART 2 / Science, politique et gestion de l'environnement PARTIE 2
Room / Endroit (TCUP Blair Nelson), Chair / Président (Mar Martinez de Saavedra Alvarez ), Date (28/05/2013), Time / Heure (14:00 - 15:30)
2C10.1 ID:6291 14:15A comparative analysis of microbial water quality risk assessment and management practices in British Columbia and Ontario, Canada Gemma Dunn 1, Leila Harris 2, Natalie Prystajecky 3, Christina Cook 4 1 Program on Water Governance, University of British Columbia 2 Institute of Resources, Environment and Sustainability 3 BC Centre for Disease Control 4 Hebrew University of Jerusalem Contact: [email protected]
Microbial risk assessment in the water sector remains an important concern and as such is a focus of governmental regulation and scientific inquiry; however, stark gaps remain in terms of its application and interpretation. This paper evaluates how water managers practice microbial risk assessment and management in two Canadian provinces (BC and Ontario). We assess three types of entities engaged in water management (municipal, public health, and watershed agencies), along the source to tap gradient. We analyze and compare the approaches (including scope, frequency, and tools) used by these institutions with respect to how they assess and manage microbial risk. We evaluate key similarities and differences in microbial risk practices, and situate them with respect to international best practices as derived from literatures related to microbial risk management. We find that there is considerable variability in risk management tools and assessment frameworks. Notably, these management approaches 1) diverge from the literature on best practices, 2) vary between provinces and 3) vary between watersheds and between organizations (even of the same type). No single risk assessment tool has been adopted widely and we note that ecological risk assessment is largely absent within these entities. We

conclude with a discussion of the policy implications of these key divergences, including opportunities that might be the horizon with new microbial monitoring and testing capacities.
2C10.2 ID:6464 14:30
The advantages of integrating science, traditional knowledge, and social indicators to assess the effects of oil sands development on the environment: A case study in Fort Chipewyan, Alberta Kathryn Hearson 1, Carmen Marchiori 2 1 Global Institute for Water Security; London School of Economics and Political Science 2 London School of Economics and Political Science Contact: [email protected]
The ability for science to inform policy is often limited due to a disconnect between environmental and social sciences, and between scientists and policy makers. An integrated research approach using traditional knowledge and social indicators (e.g. employment, health, and education) to supplement scientific findings can assist in bridging this gap. Examples from a study conducted in Fort Chipweyan, Alberta will be used to show the value in an integrated research approach when assessing the environmental impacts of oil sands development. Similar to other mining operations, oil sands mining has numerous potential environmental impacts which may be augmented due to the scale of development. (The oil sands deposits cover approximately 140,000 square kilometres, almost one quarter of Alberta.) This study provides insight on the use of traditional knowledge and social indicators to address issues such as: limited baseline information or inconsistent datasets, conflicting scientific results, interdependent and indivisible variables, and uncertain external factors – common to scientific research on the environmental effects of oil sands development. The use of alternate points of view to complement existing scientific data will assist in conveying science in terms more accessible to politicians and regulators, increasing its potential to advance environmental policy.
2C10.3 ID:6686 14:45On thin(ning) ice: The case for a multidisciplinary transnational science regime for the Arctic environment
Jeffrey Smith McGill University Contact: [email protected]
The Arctic presents particular challenges for environmental protection and the related regulation of human activities. The polar north is a vast area comparatively understudied, with considerable exogenous influences, including climate change and pollution transport, as well as burgeoning resource development. Unlike Antarctica, Arctic states have agreed to maintain the status
quo of national territorial governance, sharing science information and occasionally consulting each other about policy-making without engaging in a distinct shared regime for environmental protection and conservation. There appears to be little prospect of an environmental protection treaty for activities in the polar north and less one in response to externally caused impacts. The approach to the Arctic environment is presently fragmented by distinctly national regulatory approaches by circumpolar states, and limited sharing and coordination of policy measures among them even in discrete matters such as commercial shipping, Aboriginal property and resource uses, extended continental shelf claims, and environmental impact assessment. This paper considers the case for a transnational regime among states for the consideration and adoption of common and sometimes shared environmental monitoring and protection measures in the Arctic basin area. A central consideration is how circumpolar states can assure the credible scientific assessment of matters ranging from habitat conservation, fisheries stocks, pollution transport, and commercial activities such as shipping and seabed petroleum development. The role of scientific advice in comparative cases, notably regional maritime environmental protection arrangements, the Antarctic Treaty System together with the success of specific joint regimes and multilateral treaties for the application of science in policy making is a further area of enquiry. The paper concludes with recommendations for the structuring and acceptance of certainty (and uncertainty) in science on commonly accepted norms for more ready and confident implementation in policy and regulation-making by Arctic states.
2C10.4 ID:6348 15:00Moving from models, projections and assessments to implementation: incorporating climate change adaptation into local plans Ian Picketts , Stephen Déry , John Curry university of northern bc Contact: [email protected]
We (an engineer, hydrometeorologist and environmental planner) have partnered with the Municipality of Prince George, British Columbia for several years to explore how climate change will affect the community’s natural and built environment. In previous research, past climate trends and future projection information was presented to City staff and community members to assess risks and determine the major local impacts in an adaptation strategy. The purpose of this presentation is to overview a second phase of research aimed toward implementing actions locally. Due to capacity limitations, and the fact that adaptation is not a major local priority, the researchers sought to integrate measures into existing policies and procedures whenever possible. Two initiatives undertaken in this second phase involved our participation (as adaptation experts) in the processes to create Prince George’s Integrated Community Sustainability Plan (ICSP) and update the Official Community Plan

(OCP). Both of the final plans include extensive adaptation content, and measures related to all 11 impacts outlined in the adaptation strategy. The ICSP features climate impacts as one of two principle sources of future uncertainty, and the OCP contains numerous objectives and policies explicitly related to adaptation. The large number of issues and ongoing projects in Prince George limited the extent to which adaptation was included in the ICSP, and a perceived lack of policy direction limited the adaptation policies and objectives in the OCP to general statements. Positive factors enabling the incorporation of adaptation into plans included the high level of local awareness, presence of local champions, existing adaptation strategy to draw upon, and flexible process used to create the plans. Challenges such as a lack of priority, limited policy direction, paucity of available examples, and perceptions of climate change as solely an environmental challenge persist as barriers to incorporating adaptation into local plans.
2C10.5 ID:6815 15:15
Cities as Green Leaders (Edmonton): A White Paper by A City’s Youth Terry Godwaldt 1, Kevin Myskiw 2 (Presented by Osama Javid (student Queen Elizabeth H. S.) And Amy Mallon (student Louis St. Laurent H. S.) ) 1 Teacher, Queen Elizabeth High School, Edmonton AB 2 Teacher, Holy Trinity High School, Edmonton AB Contact: [email protected]
Cities as Green Leaders (Edmonton): A White Paper by A City’s Youth, advises and informs the city of Edmonton on what practical steps the youth of Edmonton believe need to be taken to reduce its GHG emission and mitigate its carbon footprint. As the culminating work of the Cities as Green Leaders Virtual Town Hall series (April 10 to May 19th), this “archetype of grass roots democracy” (Sen. Grant Mitchell) will be the culmination of over a month of online team work, 2,000 hours of student collaboration, 200+ hours of teacher facilitation, and a passion by youth to engage in the climate change debate and have their voices be heard. This virtual town hall will engage youth in the complexity of Cities and Climate Change, while empowering them as citizen to examine the issues, come to a group consensus on how to put actions on municipal plans and policy, and work with their local government to see those plans implemented. The session will examine the process through which the youth developed their white paper and the observations and recommendations on policy and environmental management for the city of Edmonton contained therein. It will examine the effectiveness of youth education and empowerment in influencing policy and empowering young people as agents of change with their local governments.

Air Quality Forecasting and Supporting Science PART 2 / Prévision de la qualité de l'air et sa science PARTIE 2
Room / Endroit (Hilton Commonwealth- S), Chair / Président (Dave Henderson ), Date (28/05/2013), Time / Heure (14:00 - 15:30)
2C13.1 ID:6539 14:00The XM Tool Prototpes: New statistical guidance for AQHI Andrew Teakles 1, Sean Perry 1, Stavros Antonopoulos 1, Wu Aiming 1, Qian Li 1, Harry Yau 2, Ken Lau 2 1 Environment Canada 2 UBC Contact: [email protected]
The Air Quality Health Index (AQHI) forecasts provide guidance for Canadians to make decisions to reduce their personal risk posed by the air pollution in their communities. These products are issued by Environment Canada forecasters in the five regional Storm Prediction Centers and delivered via the Meteorological Service of Canada’s weather dissemination infrastructure. The statistical post-processing techniques used in the AQHI forecast program are largely based on linear methods (Multiple Linear Regression and Multiple Discriminate Analysis) which reduces both model bias and model error. Recently, these techniques have been successfully applied to the national air quality forecast program using the Updateable Model Output Statistics-Air Quality (UMOS-AQ) post processing model. Although the application of UMOS-AQ has significantly improved forecasting ability, issues still remain with forecasting air quality episodes. To address this issue, the XM Tool Project was launched by Environment Canada in the fall of 2009 to explore the use of non-linear statistical methods to extend the capabilities of UMOS-AQ and optimize the current AQHI forecast program with a particular focus on improving guidance for air quality episodes. To date, the project has tested a variety of statistical approaches including neural networks, regression trees, Support Vector Regression, and boosted regression. In addition, further improvements to the air quality forecast skill has been achieved by incorporating new predictors. This presentation will describe the relative value of these two development avenues, and the lessons learnt developing statistical models using real-time air quality data.
A prototype of the XM tool is being finalized and will be implemented for the upcoming summer season. It will provide hourly ozone, NO2, and PM2.5 forecasts via an internal AQHI web resources page.
2C13.2 ID:6927 14:15
Towards an Improved Ventilation Index Forecast for Pacific and Yukon Region Gregg Walters 1, Yimei Li 2 (Presented by Andrew Teakles ) 1 Environment Canada - Meteorological Service of Canada 2 Environment Canada - Co-op Student Contact: [email protected]
The Pacific and Yukon region of Environment Canada currently issues a Smoke Control forecast once a day that predicts the Ventilation Index(VI) values for 29 locations in BC and the Yukon. The Ventilation Index is a measure of the potential of the atmosphere to disperse airborne pollutants from a stationary source. It is a product of the mixing height and the mean wind speed. The Smoke Control Forecast issues the VI values along with their ventilation categories for the current and the following day. The categories provide guidelines to the users as to whether burning is to be allowed. To improve the Smoke Control forecast, two separate forecast methods to produce the VI were examined. Potential improvements will benefit the stakeholders who utilize the VI since better decisions can be made when to conduct prescribed burns. The Holzworth and Heffter techniques are two different ways of determining the mixing height of the atmosphere. The Holzworth technique is currently in use to issue the Smoke Control Forecast in the Pacific Storm Prediction Centre. The results show some promise that improvement of the ventilation index forecast is possible with the utilization of the Heffter method.
2C13.3 ID:6424 14:30An Updateable Statistical Model to Improve AQHI Forecast in Ontario Warm Season
Guilong Li (Presented by Qian Li ) Atmospheric Science and Application Unit — MSC Ontario Region, Environment Canada Contact: [email protected]
Air Quality Health Index (AQHI) is a composite index that measures the air quality with respect to health on a scale from 1 to 10+ using three pollutants. Ontario storm prediction center (OSPC) issues five-period AQHI forecast twice a day at 6:00am and 5:00pm local time for 14 communities. In this study, we proposed a framework to predict five period maximum AQHI values using available AQHI outputs from GEM-MACH15 and UMOS-AQ in
Ontario’s warm season (April – October). First, the observed AQHI outputs were separated into two groups – low risk group (AQHI<4) and moderate & high risk group (AQHI≥4) in each community. Then, a logistic regression model was applied using AQHI outputs from GEM-MACH15 and UMOS-AQ as predictors to predict the likelihood of AQHI occurrence for these 14 communities. Finally, two updateable robust regression models were developed for two risk groups in each community. These models were applied to real time data to predict five period maximum AQHI values. The results show that logistic regression model identifies two risk groups very well with concordant values ranging from 0.87- 0.94. A cross validation indicates that robust regression models improve moderate and high risk AQHI forecast with coefficient of determination between 0.32 and 0.48. A real time forecasting using Apr. 1, 2010 – Oct. 31, 2011 as development data and Apr. 1, 2012 – Oct. 31, 2012 as validation data has been tested. Statistical model performs better than UMOS-AQ with positive forecast value added at moderate and high risk AQHI values. By comparing UMOS-AQ, UMO-AQ-MIST, and statistical model, statistical model performs best for moderate risk AQHI forecast and UMOS-AQ-MIST performs best for high risk AQHI forecast. The combination of statistical model output and UMOS-AQ-MIST output has comparable forecast skills to the OSPC forecast.
2C13.4 ID:6524 14:45
Forecaster Intent for the AQHI: What are we really forecasting and for whom? Doug Steeves , Sharon Jeffers Environment Canada Contact: [email protected]
The percentage of the Canadian population for which Air Quality Health Index Forecasts are available is limited by the paucity of monitoring sites that measure all three pollutants in the index (PM2.5, O3, NO2). Where these sites exist, the question arises of how representative the readings are for the people who live in the surrounding communities. An exercise of forecaster intent was carried out by Environment Canada staff to try to answer that question. A detailed analysis of each AQHI monitoring site was done by taking into account where the population lies with respect to the monitors, the influence of local topography, as well as air shed issues such as the location of local emissions and the meso-scale meteorological effects (e,g. marine boundary layer), Results of the analysis will be presented to show how the knowledge gained can be linked to program performance measurement, training, and most important of all, a more concise definition of what the AQHI forecast is intended to represent in each community.
Snowfall Observations and Error Analyses for Cold Regions / Observations de neige et analyse d'erreurs pour les régions froides
Room / Endroit (Hilton Prince Albert), Chair / Président (Daqing Yang ), Date (28/05/2013), Time / Heure (14:00 - 15:30)
2C14.1 ID:6721 14:00Comparisons of solid precipitation measurements using a PARSIVEL distrometer and traditional snow gauges Faisal Boudala , George Isaac , Paul Joe , Rodica Nitu Environment Canada Contact: [email protected]
It is now well recognized that measurement of solid precipitation (SP) using traditional snow gauges is difficult. This is mainly because of wind induced loss and hence under catch. Normally this under catching is minimized by using a variety of wind shields, including the WMO Double Fence Intercomparison Reference (DFIR) shield system. There are, however, emerging technologies such as the PARSIVEL distrometers and other optical probes that can be used to measure SP. Particularly the PARSIVEL is widely used because of its portability, reasonable cost and simplicity of the measurement principles. However, studies have suggested that the PARSIVEL’s internal algorithm used for sizing, particularly for snow, is inadequate for capturing the true maximum dimensions and hence fall velocity of some types of snowflakes. In addition, the PARSIVEL does not directly measure the density of falling snow particles, and hence the effect of snow density (ρs) on calculated precipitation intensity and reflectivity has not been well studied. This presentation uses data collected during the winter of 2011-2012 at the Centre for Atmospheric Research Experiments (CARE) site during the Global Precipitation Mission Cold-season Precipitation Experiment (GCPEX) and also data collected as part of the World Meteorological Organization (WMO) Solid Precipitation Intercomparison Experiment (SPICE) project. The following results will be presented: a) the PARSIVEL measurements will be compared against the traditional gauges including an automatic Geonor gauge under the DFIR and manual measurements, and other optical probes, and b) the effect of ρs and associated precipitation type on the calculation of precipitation intensity and reflectivity will be examined and new algorithms will be presented.
2C14.2 ID:6708 14:15
Overview and performance of OTT Pluvio2 precipitation gauges during SPICE Kai Wong , Michael Earle , Jeffery Hoover , Rodica Nitu Observing Systems and Engineering, Meteorological Service of Canada, Environment Canada Contact: [email protected]
The OTT Pluvio2 automatic precipitation gauge is used in operational networks worldwide, including provincial networks in Canada. The Pluvio2 employs a load cell to determine the amount of accumulated precipitation and reports the raw bucket amount in real time. A number of processed parameters are also reported, including precipitation intensity and accumulation in both real time and/or non-real time. To gain a better understanding of these parameters and how they are generated, the raw and processed output parameters will be compared and assessed using data from Pluvio2 gauges installed at the Centre for Atmospheric Research Experiments (CARE) field site in Egbert, Ontario. The performance of the gauges and any artefacts (i.e., signals due to factors other than precipitation) will also be assessed using case studies from the Solid Precipitation Intercomparison Experiment (SPICE). This investigation will support users of Pluvio2 gauges and data, and inform the selection of automatic gauges for implementation in Environment Canada’s national operational network.
2C14.3 ID:6312 14:30
Advantages and disadvantages of precipitation gauge rim heating during the measurement of snowfall in a cold environment Craig Smith 1, Daqing Yang 2 1 Climate Research Division, Environment Canada 2 Watershed Hydrology and Ecology Research Division, Environment Canada Contact: [email protected]
Most manufacturers of accumulating precipitation gauges provide the user with an option to heat the rim or orifice of the gauge to prevent snow from sticking and collecting on the rim. During heavy, wet snowfall events in a low wind environment, snow will have the tendency to stick to the outside and inside of the collector, eventually causing the gauge to “cap”, interrupting the gauge’s ability to correctly measure the snowfall amount. Eventually, this “cap” will fall into the gauge as a “plop” resulting in a sudden measurement of precipitation that is usually inaccurate in both timing and amount. Prevention of “capping and plopping” is an obvious advantage from heating. However, during dry, light snowfall events that are prevalent and significant in colder environments such as the Canadian Prairies and Arctic, there could be disadvantages to gauge heating. During light snowfall events consisting of small and dry snow particles, two mechanisms, besides the bias due to wind, could cause the under-measurement of the snowfall event: 1) a “chimney” effect caused by the heating of the gauge rim in a cold environment could prevent light snow particles from entering the collector, and 2) a warm rim could cause light snow particles to melt and evaporate before reaching the collector.
One of the objectives of the WMO-SPICE project is to define and characterize an automated reference gauge for the measurement of solid precipitation. This includes characterizing the effects of gauge heating on precipitation catch efficiency and measurement accuracy. At the Bratt’s Lake SPICE intercomparison facility located on the Canadian Prairies, two Geonor T-200B gauges have been installed in two large octagonal double wind fences (referred to as DFIR fences). One Geonor is heated using the USCRN style heater and heating algorithm, while the other Geonor is unheated. Intercomparison results of different precipitation events during the winter of 2012/2013 will show the impacts of heating precipitation gauges in this cold, dry environment.
2C14.4 ID:6509 14:45
Comparison of DFIR and Bush Gauge Snowfall Measurements Daqing Yang , Craig Smith NHRC Contact: [email protected]
Large uncertainties and biases exist in gauge-measured precipitation (snowfall) datasets and products. These uncertainties affect important decision-making, water resources assessments, climate change analyses, and calibrations of remote sensing algorithms and land surface models. Efforts have been made at both the national and international levels to quantity the errors/biases in precipitation measurements, such as the WMO Solid Precipitation Intercomparison Experiment (WMO-SPICE). Both the DFIR (double fence intercomparison reference) and the bush shielded gauge have been used in the past as a reference measurement for solid precipitation and they both have been selected as the references for the current SPICE project. Previous analyses of the DFIR vs. the bush (manual Tretyakov) gauge data collected at the Valdai station in Russia suggest DFIR undercatch of snowfall by up to 10% for high wind conditions. A regression relationship between the 2 systems was derived and used for the last WMO gauge intercomparison. Given the importance of the DFIR as the reference for the WMO SPICE project (focusing on the automatic gauges), it is necessary to re-examine and update the DFIR and bush gauge relationship. As part of Canada’s contribution to the WMO SPICE project, a test site has been set up in the southern Canadian Boreal forest to compare the DFIR and bush gauges. This site, called the Caribou Creek, has been installed within a modified young Jack Pine forest stand - north of Prince Albert in Saskatchewan. This study compiles and analyzes recent DFIR and bush gauge data from both the Valdai and Caribou Creek sites. This presentation will summarize the results of data analyses, and evaluate the performance of both references for snowfall observations in the northern regions. The methods and results of this research will be useful for the WMO SPICE project and other gauge intercomparison experiments.
2C14.5 ID:6830 15:00Simulations of precipitation gauge collection efficiency Julie M. Thériault 1, Jean-Yves Trépanier 2, Eddy Petro 2, Jeffery Hoover 3, Roy Rasmussen 4, Rodica Nitu 3 1 Université du Québec à Montréal 2 École Polytechnique Montréal 3 Environment Canada 4 National Center for Atmospheric Research Contact: [email protected]
Winter storms may cause major disruption to the society and the type and amount of precipitation is often the key factor. Accurately measuring the precipitation amount at the ground during the winter season is critical for many fields of study such as hydrology, transportation and climate variability. Systematic errors in snowfall measurements are often observed due to the gauge geometry and the weather conditions. For example, the higher the wind speed during a snowfall event, the lower the collection efficiency of the gauge. The link between the wind speed and the collection varies from gauge-shield configuration. Moreover, it is common to observe up to 50% error in the measurement for a given wind speed. This error seems to be associated with the type of precipitation reaching the surface. To account for the wind-induced error, transfer functions have been developed based on a reference gauge-shield configuration, which is an automatic gauge placed in a Double Fence Inter Comparison Reference (DFIR). The precipitation measured by this gauge-shield configuration is assumed to be reliable. However, inconsistencies in the measurements are sometimes observed. The goal of this study is to better understand the interaction between the flow field, the gauge-shield configuration and the precipitation types. To address this issue a detailed analysis of the flow field in the vicinity of the DFIR is conducted using computational fluid dynamic software ANSYS FLUENT. Using a Lagrangian model, the trajectory of particles is obtained to compute the collection efficiency of the different precipitation types for varying wind speed. Overall, this study will improve our understanding of the flow field around a commonly used gauge-shield configuration and the coupled effects of precipitation types, wind speed and gauge configuration on the collection efficiency.
2C14.6 ID:6826 15:15Comparison of precipitation measurements with a conventional precipitation gauge and with a deep observation well acting as a geological weighing lysimeter Garth Van Der Kamp , Craig Smith , Alan Barr , Randy Schmidt Environment Canada, Saskatoon Contact: [email protected]
A novel technique for precipitation measurement is being evaluated, using water-level records from very deep groundwater observation wells. It has long been

recognized that changes of mechanical load acting on the ground surface, such as snow accumulation, lead to changes of groundwater pressure by transmission of the stress changes to underlying formations. Changes of total moisture near the ground surface (i.e. changes in the sum of canopy interception, snow on the ground, surface water, soil moisture and water table storage) represent changes of mechanical load and therefore are reflected in the water-level records of observation wells in deep confined aquifers. Such wells act as large-scale geological weighing lysimeters which can accurately track precipitation, evapotranspiration and runoff, averaged over an area of as much as 1 km2 centered on the location of the well. Identification and analysis of the groundwater level changes associated with precipitation events can provide a quantitative and reliable measurement of actual precipitation. At a site near Duck Lake, Saskatchewan, observation well records, together with precipitation recordings measurements using an Alter shielded Geonor gauge, plus snow surveys, allow inter-comparison of the different methods for measuring precipitation. The site is located in an abandoned school yard surrounded by a tree shelter-belt, so that wind effects on snowfall and on snow redistribution are small. Under-catch of snowfall due to wind can be identified by means of the observation well records. Over the long term the records from such sites could provide a primary bench-mark for the study of changes of precipitation regimes due to climate variability and change.
POSTER - Polar Applications / AFFICHE- Applications polaires
Room / Endroit (Regal Room), Chair / Président (James R. Drummond ), Date (28/05/2013), Time / Heure (15:45 - 17:00)
2D24.1 ID:6670 15:45
Numerical modeling of biogeochemical cycle and ecosystem in the Labrador Sea Hakase Hayashida , Entcho Demirov Memorial University of Newfoundland, Department of Physics and Physical Oceanography Contact: [email protected]
The Labrador Sea is a region of particular interest to climate scientists and oceanographers because of its significant contribution to formation of Labrador Sea Water, uptake and sequestration of atmospheric CO2, and dynamics of the Atlantic Canadian coastal ecosystem. Strong interannual variability in these processes has profound impacts on the strength of the Meridional Overturning Circulation, the rate of change in seawater pH (e.g. ocean acidification), the

mass distribution of marine organisms, and the timing of crucial biological activities (e.g. the spring bloom). Present-day high-resolution coupled physical- biogeochemical models are capable of simulating the three-dimensional structures of multidisciplinary oceanic processes and to provide the complete picture of ocean variability together with in-situ or satellite-based measurements.The primary goal of this work is to conduct a model study of the role of mesoscale physical process in the carbon cycle and ecosystem dynamics over the Labrador Sea deep convection area. We present the framework of eddy-resolving NEMO-PISCES ocean biogeochemical model which has been implemented for the Labrador Sea domain. The model simulates the ecosystem dynamics (NPZD) and the carbonate system. Results from the model integration are validated using available observations. The simulated processes of interaction between physical and biological processes are discussed.
2D24.2 ID:6326 15:45
Mechanism for potential strengthening of Atlantic overturning prior to collapse Ines Dana Ehlert 1, Anders Levermann 1, Kirsten Zickfeld 2 1 Potsdam Institute for Climate Impact Research and University Potsdam , Germany 2 Simon Fraser University, Department of Geography Contact: [email protected]
The Atlantic meridional overturning circulation (AMOC) carries large amounts of heat into the North Atlantic influencing climate regionally as well as globally. Paleorecords and simulations with comprehensive climate models suggest that the positive salt-advection feedback may yield a threshold behaviour of the system. That is to say that beyond a certain amount of freshwater flux into the North Atlantic, no meridional overturning circulation can be sustained. Concepts of monitoring the AMOC and identifying its vicinity to the threshold rely on the fact that the volume flux defining the AMOC will be reduced when approaching the threshold. Here we advance conceptual models that have been used in a paradigmatic way to understand the AMOC, by introducing a density-dependent parameterization for the Southern Ocean eddies. This additional degree of freedom uncovers a mechanism by which the AMOC can increase with additional freshwater flux into the North Atlantic, before it reaches the threshold and collapses: An AMOC that is mainly wind-driven will have a constant upwelling as long as the Southern Ocean winds do not change significantly. The downward transport of tracers occurs either in the northern sinking regions or through Southern Ocean eddies. If freshwater is transported, either atmospherically or via horizontal gyres, from the low- to high-latitudes, this would reduce the eddy transport and by continuity increase the northern sinking which defines the AMOC until a threshold is reached at which the AMOC cannot be sustained. If dominant in the real ocean this mechanism would have significant consequences for monitoring the AMOC.

POSTER - Monitoring - Operations and challenges / AFFICHE- Surveillance - Opérations et défis
Room / Endroit (Regal Room), Chair / Président (Qian Li ), Date (28/05/2013), Time / Heure (15:45 - 17:00)
2D21.1 ID:6390 15:45
Mesure de la neige au Québec Bernard Caron , François D'Auteuil-Potvin Ministère du développement durable, de l'environnement, de la faune et des parcs Contact: [email protected]
Le Programme de surveillance du climat du Service de l’information sur le milieu atmosphérique (SIMAT) du Ministère du Développement durable, de l’Environnement, de la Faune et des Parcs (MDDEFP) assure entre autres le suivi du couvert de neige. Cette surveillance se fait à l’aide de deux réseaux. Le premier est un réseau de plus de 100 stations nivométriques où des échantillons de neige sont prélevés afin d’en déterminer l’épaisseur, l’équivalent en eau et la densité. Ces données servent principalement à des fins de prévisions des crues printanières et au suivi de l’évolution du couvert de neige. Le second est un réseau de plus de 350 stations climatologiques, composé de stations avec observateur et de stations automatiques. Avec les années, les instruments de mesure de la neige évoluent. Le SIMAT procède actuellement à la modernisation de ses équipements. Afin d’évaluer l’impact de ces changements sur la mesure, une comparaison statistique a été réalisée. Le passage du pluviomètre totalisateur Fisher & Porter au nouveau OTT pluvio2 causera-t-il une augmentation ou une diminution de la neige mesurée? L’utilisation du chauffage sur le OTT pluvio2 aura-t-il un impact? Parallèlement, une étude est menée pour comparer les données des instruments manuels (table à neige, nivomètre à écran Nipher) aux données des pluviomètres automatiques. Les réseaux québécois seront présentés ainsi que les résultats des comparaisons d’instruments.

POSTER - Renewable Energy: Role of Atmospheric Science/ AFFICHE- Énergie renouvelable: rôle de science atmosphérique
Room / Endroit (Regal Room), Chair / Président (Joël Bédard and Peter Taylor ), Date (28/05/2013), Time / Heure (15:45 - 17:00)
2D26.1 ID:6343 15:45Generating five year wind time series over Canada using a high resolution mesoscale model: challenges and remedies Syed Zahid Husain , Wei Yu , Leo Separovic , Yosvany Martinez , Stéphane Gaudreault Environment Canada Contact: [email protected]
The vision of the Canadian Wind Energy Association (CanWEA) is to generate 20 percent of the national electricity demand from wind by 2025. Such a large scale integration of wind energy within the power grids need to address the intermittent nature of wind as a source of energy. In order to help the energy industry to balance the load and generation of electricity within the power grids, Government of Canada has commissioned a project to generate five year time series data of wind over the entire country. The project work is being carried out by the wind energy research group at Environment Canada using the limited area version of the Global Environmental Multiscale (GEM-LAM) model. The final results are required to have a horizontal grid spacing of 2 km with a frequency of 10 min. The work poses a number of challenges due to the unprecedented length of temporal integration and size of the simulation domain. In order to overcome the computational constraints, the problem can be divided into multiple GEM-LAM simulations over smaller domains each running for the entire time. It can also be separated into multiple periods of smaller time frames. Both approaches may possibly lead to discontinuities in the meteorological fields due to blending of outputs from multiple simulations in temporal or spatial dimensions. A continuous temporal integration over the entire spatial domain is therefore selected as the most appropriate approach. Strategies have also been devised to address other scientific concerns including the deviations of upper atmosphere large-scale features and surface fields from reality over long term temporal integrations. The various challenges for acceptable wind prediction including the optimization of computational resources as encountered in this work along with the proposed remedies, and their implications will be presented in this poster.
POSTER - General Atmospheric Science / AFFICHE- Science atmosphérique en général
Room / Endroit (Regal Room), Chair / Président (Congress Scientific Committee ), Date (28/05/2013), Time / Heure (15:45 - 17:00)
2D14.1 ID:6427 15:45The Mesoscale Microwave Radiometer: A quest for accurate three dimensional water vapour fields David Themens , Fredéric Fabry McGill University Contact: [email protected]
Initialization water vapour and temperature fields have long been a concern in mesoscale weather forecasting, where small errors in these fields often produce significant errors in the model’s characterization of Mesoscale processes, such as convective initiation. In order to address this issue, a “Mesoscale” Microwave Radiometer has been designed and built at McGill University with the exclusive goal of accurately providing, or at least constraining, three dimensional water vapour fields. In this study, we attempt to quantify the amount of information required in order to define water vapour and temperature to a sufficient accuracy for model assimilation. We then identify the amount of information that could theoretically be provided by the Mesoscale Radiometer and, in the future, will propose possible modifications to the system to further facilitate its ability to provide accurate water vapour information within a three dimensional domain.
2D14.2 ID:6618 15:45A Focus on Modelling Convective Triggering Justin Beaudry , Peter Yau McGill University Contact: [email protected]
In this study, we investigate the role of convective parametrization (CP) in simulations of thunderstorms over central Alberta at resolutions which depend on both resolved and sub-grid scales. Simulations range near 'grey zone resolutions' of 9km as well large scale parent domains of 27km. Results indicate that a parent domain of 27km coupled with a nested domain of 9km outperforms a single domain of 9km or 27km. This is likely due to the fact that CP schemes are
designed to perform best near 25km grid lengths. Hence, initializing the model at lower grid lengths when making use of a CP scheme may produce unfavorable results by neglecting a large scale parent domain. This issue is amplified when working with a two-way nested model. If the model struggles to trigger convection properly at low resolution, nesting into higher resolution will not alleviate the problem. The impacts of how CP schemes 'trigger' convection are then examined. Four different approaches to the trigger functions are tested using the WRF model along with the Kain-Fristch (KF) and Milbrandt-Yau 2X schemes. The different trigger functions are composed of the original KF trigger, a moisture advection trigger, a CAPE restriction trigger, and adding a Turbulent Kinetic Energy (TKE) 'kick' to improve sub-grid dynamics. Use of local radar imagery served as guidance in testing simulation plots. A major problem in current CP schemes is 'spatial triggering failure' (STF). This process takes place when the model misplaces the actual storm from reality. STF can lead to inaccurate simulations by producing poor storm tracks as well as triggering excessive spurious convection. Improvements have been obtained by using aforementioned modified trigger functions, which result in less erroneous convection.
2D14.3 ID:6609 15:45
Using LiDAR data to spatially scale and examine the accuracyof evapotranspiration estimates in the Western Boreal Plains,Canada George Sutherland 1, Laura Chasmer 1, Richard Petrone 1, Kevin Devito 2 1 Wilfrid Laurier University 2 University of Alberta Contact: [email protected]
In Canada a large portion of the boreal forest is comprised of the mosaic landscape of the Western Boreal Plains (WBP)—a region characterized by consistent water deficit conditions. Because potential evapotranspiration (PET) generally exceeds precipitation annually, evapotranspiration (ET) is the primary driver of the hydrologic balance in the WBP. Owing to this, the WBP is a hydrologically sensitive region, and future changes to the climate will significantly impact the region’s water balance. This region is also an economic hub for the country’s natural resource extraction creating significant disturbance on the landscape. However, this sensitive landscape is characterized by sparse measurement stations, making it challenging to gain information and drive models outside of the tower-footprint scale. This scenario makes remote sensing an ideal method of acquiring spatial information pertaining to the hydro-meteorology of this region—though further investigation is needed to determine the most appropriate resolution at which remote sensing data is best collected. At a study site representative of the WBP, this research uses high- resolution (1m x 1m) Light Detection and Ranging (LiDAR) data of the vegetation structure as an
input to the Penman- Monteith model to provide a spatially explicit estimate of ET. The accuracy of high-resolution spatially explicit and spatially static vegetation parameters are examined relative to eddy covariance (EC) validation data. Subsequently, high- resolution, spatially explicit vegetation parameters were resampled to lower resolutions, providing ET estimates from input data representative of the resolution of modern global satellite systems, i.e. SPOT (10m), Landsat (30m), and MODIS (250m, 500m, 1000m). The accuracy of these lower resolution estimates of ET are examined relative to high-resolution estimates and validation data. Understanding the relative accuracy of ET estimates with increasingly low-resolution input data will help determine the validity of using data acquired from low-resolution global satellite systems to drive regional-scale climate models.
2D14.4 ID:6794 15:45
Great Lakes aggregate wintertime lows and summertime highs: some effects on local weather and air quality conditions
Frank Dempsey CMOS member Contact: [email protected]
The well-known wintertime lake-aggregate mesoscale vortex or trough that forms over a large part of the Great Lakes region during cold-air outbreaks is a weak but pronounced region of low pressure in the lower troposphere enhanced by diabatic heat and moisture fluxes from the unfrozen lake surfaces. Resulting effects include enhanced and altered precipitation patterns, altered pressure and wind patterns, and cloudiness near the lakes that otherwise could be under clear skies and stronger, anticyclonic northwesterly winds. In late spring and summer, the lake-aggregate high develops over the cool lakes in advance of an approaching high pressure ridge and tends to cause widespread subsidence, clear skies, light or diminishing winds, and increased low-level stability of the atmosphere. Some effects that can be illustrated in several examples include light winds in the region of the lake-aggregate low or high, enhanced cloudiness and precipitation in winter and clear skies during summer, and stagnation effects resulting in increasing concentrations of air pollutants.
POSTER - Radar Meteorology and Applications / AFFICHE- Météorologie radar et applications
Room / Endroit (Regal Room), Chair / Président (David R. Hudak ), Date (28/05/2013), Time / Heure (15:45 - 17:00)
POSTER - Atmospheric Hazards and Extreme Weather / AFFICHE- Hasards atmosphériques et météo extrème
Room / Endroit (Regal Room), Chair / Président (Bob Kochtubajda ), Date (28/05/2013), Time / Heure (15:45 - 17:00)
2D04.1 ID:6295 15:45
Meteorological conditions associated with significant summer floods on the Canadian Prairies in 2010-2011 Bob Kochtubajda 1, Anthony Liu 1, Karmen Loyek 2, Bruce Davison 1, Julian Brimelow 3 1 Environment Canada - Hydrometeorology and Arctic Laboratory 2 University of Alberta 3 University of Manitoba Contact: [email protected]
Summertime heavy rainfall can trigger severe floods over the Canadian Prairies which can become life threatening and leave massive socio-economic impacts in their wake. In this study, the unique features of the 2010 and 2011 flooding events are described and compared to significant summer flood events from 2000 to 2010. A variety of datasets including, surface weather observations, upper air soundings, satellite, radar and lightning imagery were used to examine the meteorological conditions that led to the development of excessive rainfall. Both localized convective thunderstorms and large scale synoptic weather systems contributed to flooding events, however, embedded convection along the warm front was the dominant mechanism in most cases. Detailed synoptic system patterns and convective features are illustrated to help understand and improve future forecasts of summer floods over the Canadian Prairies.
2D04.2 ID:6595 15:45
On the spatial variability, trends and physical explanations of hydrometeorological extremes in the Vancouver, British Columbia region. Daniel Betancourt , Ronald Stewart University of Manitoba, Dept of Environment and Geography Contact: [email protected]

An analysis was carried out with respect to the occurrence and magnitude of extremes for several meteorological parameters in the Vancouver region, using observational data from stations with a long duration of records. Parameters included observed daily maximum wind gust, precipitation, and temperature. Considerable spatial variability in the occurrence of extremes exists across the area due to the highly complex and diverse physiological setting of the Vancouver region. Both extreme precipitation and wind events are dynamically driven, with maxima in occurrence during the cold season. However, extreme precipitation events were linked with warm advection and moisture transport ahead of a strong Aleutian Low; and were found to be increasing in occurrence for all stations. Extreme wind events on the other hand, were linked with cold advection along with a strong surface high over the North Pacific. Trends for the stations are cyclical in nature, likely modulated by fluctuations in ocean-atmosphere feedback mechanisms such as the North Pacific Oscillation. Analyses are now focusing on the manner in which large scale driving mechanisms have changed to produce such trends.
2D04.3 ID:6545 15:45
Forecasting and Preparing the Public for an F3 Tornado in Saskatchewan - July 2, 2010.
Mark Melsness Environment Canada Contact: [email protected]
On July 2, 2010, a hot humid day turned into a tornado day for the Kawacatoose First Nation just north of Regina, Saskatchewan. With all of the ingredients present for the development of tornadoes, Severe Weather Meteorologists at the Prairie and Arctic Storm Prediction Centre, in conjunction with the regional Warning Preparedness Meteorologist, prepared the public through timely tornado watches and warnings well in advance of the storm. An evaluation of the event, including a storm survey of the area was performed and provided further information about the forecasting and warning process in regards to the event. This poster will give insight to some of the forecasting techniques as well as anecdotal evidence as to the state of readiness of the general public - especially the people of the Kawacatoose First Nation who were directly affected by the tornado.
2D04.4 ID:6478 15:45
The Influence of Atlantic Hurricanes on Southern Ontario’s Precipitation Extremes
Jerry Jien , William Gough University of Toronto Scarborough Contact: [email protected]
Little is known about the influence of hurricanes on the occurrence of

precipitation extremes (PEs) in southern Ontario, Canada. Here, we examine PEs and their spatial-temporal linkage with the occurrences of hurricanes in southern Ontario from 1950-2000. On average, 5.4 PEs or 11% of the fifty wettest days in the selected five locations were observed to occur under the influence of hurricanes within the fifty-one year period. Our results indicate hurricane-induced PEs are most frequent in September, the peak month of hurricane formation, and derive from storms which had reached major hurricane status (>50 m/s) at some point in their lifetime. An absence of landfall hurricanes in southern Ontario during the 1960s-1980s suggests either that the direct impact of hurricanes occurs on a multi-decadal time scale or that recent years are experiencing unprecedented change.
2D04.5 ID:6559 15:45
Stochastic Modelling and Downscaling of Precipitation in the Southern Canadian Prairies Kwok Chun , Howard Wheater , M. Naveed Khaliq , I. Vashchyshyn University of Saskatchewan Contact: [email protected]
Two stochastic precipitation simulation models, namely LARS- WG and a Generalised Linear Model based weather generator (GLM-WG), are evaluated for downscaling daily precipitation at four selected locations (Banff, Calgary, Saskatoon and Winnipeg) in the Canadian Prairies. The structure of the GLM-WG is calibrated and verified on the basis of the information derived from the large-scale climate variables and observed precipitation records, while that of the LARS- WG is estimated and verified on the basis of observed precipitation records only. Analyses of calibration (1961– 1990) and verification (1991–2003) period stochastic simulations of precipitation series suggest that both weather generators are able to simulate various characteristics of the observed precipitation records in a reasonable manner. For developing projected changes to precipitation characteristics, a change factor approach based on Canadian Global Climate Model simulated current (1961–1990) and future (2071–2100) period precipitation is used for driving simulations of LARS-WG, while for driving GLM-WG simulations, large-scale predictor variables derived from Canadian Global Climate Model current and future period outputs are used. Using an extreme value analysis approach, probabilities of future precipitation extremes and drought events at different temporal scales are developed. Results of both weather generators suggest significant increases to the mean annual precipitation for the 2080s. Changes to selected return levels of annual daily precipitation extremes are found to be both location and weather generator dependent. A simple precipitation deficit-based drought severity index suggests decreases in drought severity for the 2080s.

POSTER - Agricultural land management and water / AFFICHE- Gestion des terres agricoles et eau
Room / Endroit (Regal Room), Chair / Président (Jane Elliott ), Date (28/05/2013), Time / Heure (15:45 - 17:00)
2D01.1 ID:6511 15:45Hydrological response to extreme weather and wetland drainage in a Canadian Prairie basin Stacey Dumanski , John W. Pomeroy , Cherie Westbrook Centre for Hydrology, University of Saskatchewan Contact: [email protected]
The Canadian Prairies are characterized by millions of wetlands, some of which have been subject to drainage to increase the availability of agriculturally productive land. Wetlands provide hydrologically important water storage, and may act to mitigate both drought and flood events. Smith Creek Research Basin (SCRB), a small agricultural catchment in south-eastern Saskatchewan has been extensively drained, with wetland extent decreasing from ~17% in 1958 to ~8% in 2007. Annual streamflow volumes and peak daily streamflow have risen over this time period. From 2010-2012, the eastern portion of the Canadian Prairies experienced one of the wettest periods on record, and precipitation measurements in 2010 and 2012 from SCRB exceeded the regions 30-year climate average by 115 mm and 106 mm, respectively. Streamflow from SCRB responded to this wet period with high and relatively continuous flows, unlike the intermittent, snowmelt dominated streamflow that has characterised the period of record. Peak daily streamflow in 2012 occurred in June and was caused by a large rainfall event – the first time a rainfall-derived peak flow was recorded in the basin. This change in hydrological regime was caused by a response in hydrological storage and processes to both high precipitation and wetland drainage. Soil moisture within SCRB increased substantially in 2010 which reduced the infiltration capacity of the soil and increased runoff. Extreme amounts of precipitation filled the storage capacity of the wetlands which allowed subsequent small rainfall volumes to cause wetlands to spill and contribute to streamflow. Additionally, wetland drainage within the basin reduced its depressional storage capacity, causing contributing areas to rise so that runoff more efficiently contributed to streamflow. The saturated conditions of SCRB were sustained from 2010-2012 which contributed to the release of large volumes of streamflow over many months – a hydrology that was previously considered uncharacteristic of the Canadian Prairies.

2D01.2 ID:6835 15:45Investigating streamflow response to land use change, wetland drainage and climate variability in the Canadian Prairies using long-term records of precipitation and streamflow Eghbal Ehsanzadeh 1, Garth Van Der Kamp 2, Christopher Spence 2 1 Ilam University, Ilam,Islamic Republic Of Iran 2 Environment Canada, Saskatoon Contact: [email protected]
Land use change for purposes such as agriculture and roads may change the flow regime of rivers. It is of key interest to know how the cumulative impact of these disturbances, along with regime change due to climate variability and climate change, affects runoff response behavior of a watershed. This study investigates changes in streamflow regimes of over 50 small to very large watersheds with drainage areas ranging from 35 to 160000 km2 in the interior glaciated plains of North American. These depression-dominated watersheds have been subjected to diverse human disturbances, including changing agricultural practices, wetland drainage and road building. Our statistical analysis of long-term streamflow records shows that in general the net response to all the changes of watershed characteristics and climate has resulted in relatively little change of streamflow regimes. It is of particular interest to note that the extensive drainage of wetlands which has taken place throughout the region (and commonly assumed to lead to increased streamflow), has had little easily identifiable effect on peak flows and total spring runoff. It may be that other changes in the watersheds (e.g. changes of tillage practices, reduced summer fallow, road construction, etc.) have had varying or even opposite impacts which cancel out the effects of wetland drainage. Unfortunately there appear to have been no long-term controlled field studies of the hydrologic effects of wetland drainage. This study suggests that runoff response to changes of land-use, wetland drainage and climate variations is nonlinear, complex, and diverse and that long-term and carefully planned observations of the hydrology of wetland drainage are needed to allow reliable assessment and management of the effects of wetland drainage or restoration.
POSTER - Biogeochemical response to climate & land-use change / AFFICHE- Réponse au changement clim. & usage du sol
Room / Endroit (Regal Room), Chair / Président (Timothy Duval ), Date (28/05/2013), Time / Heure (15:45 - 17:00)
2D05.1 ID:6689 15:45Inverse determination of subsurface CO2 production and temperature response from continuous soil CO2 surface efflux measurements Christian Hart , David Risk Earth Sciences, St. Francis Xavier University Contact: [email protected]
Accurate prediction of future global climate relies in part on good model prediction of soil carbon dynamics, and CO2 efflux feedbacks. Most field data and statistical relationships that underlie present techniques are, however, complicated by the diel phase lags between surface flux and soil temperature and are a result of heat and CO2 transport processes. The purpose of this study is to present a novel approach for inverse determination of soil profile distribution of CO2 production and Q10 values, using continuous measurements of CO2 efflux and a new inverse modelling procedure involving realistic soil physics and simple biological model response. We used a modified deterministic one-dimensional non-steady state soil CO2, heat, and moisture transport model similar to that described by Phillips et al. 2011, along with an inverse Grid Search (GS) procedure consisting of: parameter perturbation based on GS; forward running of the numerical model; and objective function evaluations. The simulations were run the Atlantic Computational Excellence supercomputer cluster. Inversions to solve for depth of production and Q10 were done for two field sites where soil CO2 efflux autochamber and subsurface CO2 concentration data was available. The approach yielded high correlations between measured and modelled data. The vertical distribution of CO2 production varied dynamically over time, generally with exponential decreases in production magnitude with increasing depth, but with seasonal shifts in surface vs. deep fractions. Deeper carbon had a higher Q10 most of the time, and deep Q10s were also more temporally variable. Continuous soil efflux measurements, in combination with inverse modelling techniques, show potential for aiding in profile partitioning, and depth-specific prediction of Q10 and other biologically- relevant parameters.
2D05.2 ID:6775 15:45Effect of forest harvesting on solute cycling in Western Boreal Plain watersheds
Timothy Duval 1, Kevin Devito 2, Ali Kiyani 2, Richard Petrone 3 1 Department of Geography, University of Toronto Mississauga 2 Department of Biological Sciences, University of Alberta 3 Cold Regions Research Centre, Wilfrid Laurier University Contact: [email protected]
Adaptive management of the Western Boreal Plain (WBP) and its resources

requires consideration of the varied hydrogeologic settings and landcover units of the region, as well as their hydrological connectedness, in order to understand the effects of landscape perturbations. The aspen dominated forests of the WBP are targets of harvesting for their pulp resource; however, the effect of this perturbation on catchment water and solute cycling in the WBP has not been studied as well as in other regions. Experimental watersheds were clear-cut over a three-year period and stream hydrochemistry was compared to neighbouring reference watersheds. Very few statistical differences were found in stream solute concentrations between the cut and uncut watersheds. Stream-borne nitrate and soluble reactive phosphorus levels decreased, while ammonium and total nitrogen levels increased, post-cut in both harvested and reference watersheds, suggesting a strong response to climate signals. There also appeared to be an effect of catchment size, reflected in larger variability in stream solute concentrations in the nested headwater catchments that were muted downstream. In contrast to the apparent limited effect of harvesting on stream chemistry in this study, nutrient availability did increase in the (de- )forested surface soils of the harvested watersheds. Forest landcover units are hydrologically disconnected from the catchment drainage network in most years, negating any transfer of this elevated nutrient availability to the catchment outlet. Best management practices of the WBP will need to consider the role of hydrological connectedness in relation to climate cycles in order to predict the effect of landscape disturbances on surface water quality.
2D05.3 ID:6684 15:45
Characterizing Spatio-temporal Patterns of Nitrogen Within and Across Peatlands of the Western Boreal Plains of Alberta Meagan Wood 1, Merrin Macrae 1, Richard Petrone 2 1 University of Waterloo 2 Wilfrid Laurier University Contact: [email protected]
Peatlands are important ecosystems for controlling the global carbon and nitrogen budget. Despite this role, they are currently subject to disturbances as a result of land-use change. This is particularly true in Northern Alberta where the energy sector is altering peatlands as a consequence of the oil extraction process. The effects of land-use change on nutrient exchange processes and carbon exchange is unclear and this is particularly true for nitrogen cycling within these peatlands. Nitrogen (N) is an important component in the process of peat accumulation and therefore carbon sequestration and is also a dominant factor in the development, growth and productivity of peatland vegetation. The overall goals of this study are to determine the effects of environmental controls on nutrient cycling and uptake processes, and, to examine relationships between nutrient dynamics and carbon dioxide exchange. The specific objectives of this poster are to characterize seasonal patterns of N by determining and comparing N concentrations in ground water, N mineralization rates and the uptake of N by vegetation from one study site. This data will be compared to N mineralization
rates and N uptake from three different peatland types to determine if spatio-temporal patterns of N exist within peatlands and across a range of different peatland types in the Western Boreal Plains of Alberta. Preliminary data suggests that plant uptake of nutrients, specifically N in WBP peatlands vary temporally and there is evidence for a peak growth period between the months of July and August at which time the uptake of N increases. There is evidence that this is related to soil moisture, as conditions are driest during this time. In addition to this, spatial variability within peatlands is evident over the growth period as microforms behave differently where the plant uptake of N increased in hollows and uptake remained relatively stable.
2D05.4 ID:6569 15:45
Capturing the Anthropogenic GHG Impacts of Land-use Change in Wetland and Arctic Ecosystems in Canada
Shari Hayne Environment Canada Contact: [email protected]
Environment Canada has requirements to report anthropogenic emissions and removals of greenhouse gases (GHG) associated with Land Use, Land-use Change and Forestry (LULUCF) within Canada’s national GHG inventory. These requirements stem from Canada’s commitments under the United Nations Framework Convention on Climate Change (UNFCCC). The LULUCF sector includes emissions and removals associated with management activities and land-use changes among five basic land categories: forest, cropland, grassland, wetlands and settlements. Main drivers affecting wetlands and arctic ecosystems in Canada include resource extraction, forestry, agriculture, hydroelectric development, urbanization and infrastructure development. However, currently GHG emissions resulting from many of these drivers have not been quantified with sufficient accuracy required for inclusion in Canada’s national GHG inventory. This poster will present the position of wetlands and arctic ecosystems in the LULUCF land categorization scheme, the current status of reporting associated anthropogenic GHG emisions and removals in Canada’s national GHG inventory, potential improvements, challenges and methodological developments.
2D05.5 ID:6555 15:45
Modeling of nitrogen dynamics in a Canadian Shield watershed: testing of SWAT-CS Congsheng Fu 1, April James 2, Huaxia Yao 3 1 Dept. of Civil and Environmental Engineering, University of Connecticut, Storrs, Connecticut, USA 2 Dept. of Geography, Nipissing University, North Bay, Ontario, Canada 3 Dorset Environmental Science Centre, Dorset, Ontario, Canada

Contact: [email protected]
Canadian Shield watersheds are under increasing pressure from development (e.g. mining, nearshore development) and climate change. Tools such as dynamic watershed models including representation of terrestrial, stream, and lake components are needed to advance the investigation of coupled hydrologic, nutrient and chemical processes in this region and how they change with geographic scale. On the Canadian Shield, forested headwater watersheds are generally characterized by shallow forested soils with high infiltration rates and low bedrock infiltration, generating little overland flow, and macropore and subsurface flow are important streamflow generation processes. Large numbers of wetlands and lakes are also key physiographic features, and snow-processes are critical to watershed modeling in this climate. A revised version of the publicly available and widely used Soil- Water-Assessment-Tool (SWAT) has been previously tested for hydrological process representation using the 30-year dataset from the Harp Lake Canadian Shield headwater catchment located near Huntsville, Ontario. SWAT- CS revisions to hydrologic process representation include introduction of macropore flow and new limitations on bedrock percolation. Additional testing is now focused on implementation and adjustment of the built-in nutrient modeling capabilities. In this poster we will examine results of nitrate modeling within the Harp Lake catchment. Daily nitrate concentration dynamics in the stream are roughly reproduced for 1995-2007, with seasonal patterns being refined. Further testing of SWAT-CS will help evaluate its potential use for simulation studies of multiple stressors (e.g. climate and landuse change) for Canadian Shield watersheds at a range of scales.
2D05.6 ID:6819 15:45Precipitation input and antecedent soil moisture effects on mercury mobility in soil Laboratory experiments with an enriched stable isotope tracer Kristine Haynes , Carl Mitchell University of Toronto Scarborough Contact: [email protected]
Upland environments act as important sources of mercury (Hg) to downstream aquatic ecosystems. Hydrological processes are instrumental in facilitating Hg transport within, and fluxes from watersheds. However, the relative influences of hydrologic factors such as antecedent soil moisture and precipitation in controlling the transport of Hg through upland soils is not well understood. The purpose of this research was to examine for mutually exclusive and/or cumulative influences of precipitation quantity and antecedent soil moisture on the mobilization of Hg in upland forest soils using a full factorial laboratory experimental design and the application of an enriched stable Hg isotope tracer to intact, foam-encased soil cores. Both antecedent soil moisture and the volume of precipitation input had significant, independent impacts on the mobility of newly-deposited, contemporary Hg mobility. However, these factors exhibited no

strongly significant influence on legacy Hg mobility. New Hg mobility was enhanced with precipitation events onto initially dry soils, although the majority (>99.5%) of the added Hg tracer was sorbed to and immobilized in the soil organic matter. Overall, these results suggest that large, infrequent precipitation events among otherwise drier conditions could affect the mobilization of new, atmospherically-deposited Hg from upland environments and its subsequent transport to downstream aquatic ecosystems.
POSTER - Anthropogenically Disturbed Peatlands / AFFICHE- Dérangements antropologiques des tourbières
Room / Endroit (Regal Room), Chair / Président (Pete Whittington ), Date (28/05/2013), Time / Heure (15:45 - 17:00)
2D03.1 ID:6572 15:45Forest plantation on cutover peatland in Alberta: Evaluating methods Tania Garcia Bravo 1, Maria Strack 1, Line Rochefort 2 1 University of Calgary 2 Université Laval Contact: [email protected]
Peatlands are the most extensive wetlands in the world providing ecosystem functions related to carbon storage, biodiversity support, water regulation and hydrological and geochemical cycling. In Canada, peatland cover approximately 17Mha. In many regions, these ecosystems support the economic activity of extracting peat as commercial horticultural product. Harvesting peat requires the land to be drained, which consequently threatens regional biodiversity by changing the entire ecosystem. The regeneration process in peatlands is slow unless human intervention improves the environmental condition for recolonization by the plant community. In eastern Canada, cutover bog restoration follows the moss layer transfer technique. However, forest plantation on harvested peatland may be an appropriate restoration option to recover disturbed peatlands in western Canada. More knowledge about peatland afforestation is needed in order to return ecological function in a forested peatland in Alberta. The goal of this study is to improve efficiency of afforestation measures and land-use management options

on cutover peatland. As residual peat is nutrient poor, fertilization is required to encourage the growth and survival of tree seedlings. This paper investigates the appropriate fertilization dose for forest plantation. Paxson Bog is located in the Athabasca Region in the east-central part of Alberta, Canada. Horticultural peat mining occurred there until 1995. In 2005, the restorations plan designed a black spruce (Picea mariana (Mill)) plantation where four levels of fertilizer (control, low, moderate and high doses) were applied. We investigated the effect of fertilizer dose for black spruce growth and colonization by birch (Betula papyrifera (March.)). This study demonstrated that high doses could have unfavorable effects for black spruce plantation. Furthermore, tree growth was also related to environmental conditions (e.g. water table, peat depth, ditch proximity) and peat depth can help to determine the appropriate fertilizer dose for restoration of forest habitat.
2D03.2 ID:6692 15:45
The role of permeable marine sediments in peatland-dewatering around a bioherm outcrop, James Bay Lowlands Kelly Ali 1, Pete Whittington 2, Victoria Remenda 1, Jonathan Price 2 1 Queen's University 2 University of Waterloo Contact: [email protected]
Peatlands in the Hudson-James Bay Lowlands (HJBL) exist, in part, due to minimal vertical seepage losses through the low hydraulic conductivity (K) Tyrrell Sea sediments and small vertical gradients between the surface and the bedrock aquifer. Recent development of an open-pit diamond mine within the HJBL requires the dewatering of the regional limestone aquifer in the area of the mine. This creates downward gradients near the surface, increasing the importance of low K sediments that help retain water in the peatlands. There are areas within the mine’s impacted area where exposed bedrock outcrops (bioherms) puncture the sediment layers and increase vertical drainage, which has resulted in partial desiccation of the overlying peatlands. This paper investigates the characteristics of the sediments and the flow regime surrounding three of these bioherms and proposes a conceptual model of flow. In general, the sediments in profiles near bioherms were either highly stratified showing 3-4 layers with distinct hydraulic properties; or poorly stratified with only a mix of silts and sands. In a suite of nested piezometers the vertical Darcy flux from the peat to the sediment and from the shallow to deep sediments indicated one of two patterns: either less water flowed downward in the sediment than was supplied from the peat layer above, or significantly (100 times) more water was flowing down in the sediment than was being received from the overlying peat. The conceptual model presented hypothesizes that in the first case flow in the sediment is primarily horizontal until proximal to flow channels in the bioherm rock at which point the second case is observed as both water from the peat above and water flowing laterally in the sediment drains downwards into the dewatered bedrock. The flow

regime around bioherms has relevance in predicting the impact of dewatering programs on the surface ecosystem as well as anticipating the recharge to the bedrock aquifer, which is an important factor in designing a dewatering program.
POSTER - Climate change and the carbon cycle / AFFICHE- Changement climatique et cycle du carbone
Room / Endroit (Regal Room), Chair / Président (Kirsten Zickfeld ), Date (28/05/2013), Time / Heure (15:45 - 17:00)
2D09.1 ID:6825 15:45Global carbon impacts of composite vs. mosaic representations of terrestrial vegetation in the Canadian Terrestrial Ecosystem Model (CTEM): Impact on historical carbon budget Joe Melton , Vivek Arora Canadian Centre for Climate Modelling and Analysis Contact: [email protected]
Land surface models commonly represent vegetation in terms of plant functional types (PFTs) and use their vegetation attributes in calculations of the energy and water balance. To accomplish this task two approaches are widely used: 'composite' and 'mosaic'. In a composite (single-tile) approach, the vegetation attributes of different PFTs present in a grid cell are aggregated and used in calculations to determine the resulting physical environmental conditions. As a result each PFT present in a grid cell experiences the same soil moisture, soil temperature, and net radiation. In the mosaic (multi-tile) approach each PFT’s energy and water balance calculations are performed separately for each tile and as a result physical environmental conditions evolve differently in each tile. The impact of these two approaches on the global carbon balance is investigated with the Canadian Terrestrial Ecosystem Model (CTEM v.1.2) coupled to the Canadian Land Surface Scheme (CLASS v.3.6). Pre-industrial equilibrium simulations corresponding to year 1860 result in the composite approach simulating slightly higher global primary productivity (ca. 4%) and vegetation biomass (ca. 5%), but similar soil carbon pools, to the mosaic approach. Differences between the composite and mosaic approaches are more pronounced spatially (> 30%), especially in areas of high PFT diversity, as expected. Simulations over the historical period (1861 - 2009) show different responses to evolving climate and carbon dioxide concentrations between the composite and mosaic simulations. Across the 1861 to 2009 period, total global

net ecosystem productivity differs by around 0.5 Pg C/yr over 1990s with the mosaic simulation taking up more carbon (15 Pg C cumulatively over the 1861- 2009 period) and much of the difference in the last 50 years of the simulation. The representation of vegetation in a land surface scheme thus has an important impact on the model response to changing climate and this will likely influence the behavior of the terrestrial sink to climate change in future simulations as well.
2D09.2 ID:6384 15:45
The role of net-negative CO2 emission scenarios in stabilizing Earth’s climate. Katarzyna Tokarska , Kirsten Zickfeld Simon Fraser University Contact: [email protected]
Recent research has shown that CO2-induced climate change is irreversible on century to millennium time scales after complete cessation of emissions. In case of overshoot scenarios, when the predetermined temperature targets are exceeded, net-negative emissions (i.e. net uptake of CO2 from the atmosphere) are required to revert to lower temperature levels in a few centuries. A range of net-negative CO2 emissions technologies are available, but it is unclear whether they will be applicable at the required scale. The purpose of this research is to examine how much CO2 needs to be removed from the atmosphere to stabilize global temperature at a safe level in the long term. Using the UVic Earth System Climate Model of intermediate complexity, we will explore the century-scale Earth system response to a range of CO2 emission scenarios which entail different levels of temperature overshoot. These emission scenarios will consider the implementation of net-negative CO2 emission technologies and are designed to stabilize global mean temperature at about 2C in the long term. We will quantify the amount of negative emissions required to return global mean temperature to 2C in the different scenarios and discuss the feasibility and the potential cost of implementing net-negative CO2 emissions technologies.
POSTER - Climate analysis, Modelling and Prediction / AFFICHE- Analyse, modélisation et prédiction du climat
Room / Endroit (Regal Room), Chair / Président (N. McFarlane ), Date (28/05/2013), Time / Heure (15:45 - 17:00)
2D08.1 ID:6276 15:45Propagation characteristic of atmospheric responses to abnormal warm SST in the Kuroshio Extension in winter Xiaodan Wang , Jianwen Liu , Linlin Qi Institute of Beijing Aeronautical Meteorology Contact: [email protected]
The propagation characteristic of atmospheric responses to the abnormal warm sea-surface temperature (SST) in the Kuroshio Extension in winter was investigated using NCAR CAM3.0. The results show that geopotential height perturbations at 500 hPa occupy much of the mid- and high-latitude areas north of 20ºN, and are stronger in winter and spring than in summer. Power spectrum analysis reveals that the perturbations contain both quasi-biweekly and synoptic-scale oscillations. In the latitude band with maximum perturbation amplitude, the oscillations propagate mainly eastward. The centers of dominant oscillations are situated in the mid- and higher-latitude areas north to 40ºN. The perturbations in the Arctic mainly propagate meridionally, whereas those south of the Arctic propagate zonally, at a steady phase velocity basically. The propagation characteristics of wind perturbations and temperature perturbations are similar to those of geopotential height perturbations.
2D08.2 ID:6499 15:45The GloSea5 Ocean and Sea Ice Analysis: A re-analysis for 1989-2012 Kk Andrew Peterson , Matthew Martin , Jennifer Waters , Matthew Palmer , Chris Roberts , Daniel Lea , James While (Presented by Drew Peterson ) UK Met Office, Exeter, UK Contact: [email protected]
As a requirement for the initialization of the historical forecast component of the GloSea5 high resolution (~50km atmos/~25km ocean) seasonal forecast system, an ocean and sea ice analysis for 1989-present has been undertaken at the UK Met Office (UKMO). Except for ocean surface boundary conditions, this analysis is identical to the latest UKMO Forecast Ocean Assimilation Model (FOAM-V12) also recently implemented at UKMO, using the NEMO V3.2 ocean model, the CICE VN4.1 sea ice model, and NEMOVAR (3DVAR) data assimilation. This analysis has been put forward as the UKMO contribution to the GSOP/GODAE ocean synthesis project. Initial findings of the system indicate the analysis shows a good representation of the ocean and sea ice mean state and temporal variability, including that of the Atlantic meridional overturning circulation (AMOC) and northward heat transport. This presentation will describe the system used to generate the reanalysis and show a sample of the results, including comparisons to independent data from

the RAPID AMOC array at 26N.
2D08.3 ID:6632 15:45
The spatial and temporal distribution of oceanic dimethylsulfide and its effects on marine aerosols Jan-Erik Tesdal 1, Jim Christian 2, Adam Monahan 1, Knut Von Salzen 2 1 School of Earth and Ocean Sciences, University of Victoria, Victoria, British Columbia, Canada 2 Canadian Centre for Climate Modelling and Analysis, Victoria, British Columbia, Canada Contact: [email protected]
The oceanic emission and subsequent oxidation of dimethylsulfide (DMS) provides a source of sulfate in the atmosphere, which potentially affects the amount of incoming solar radiation reaching the Earth’s surface through both direct and indirect radiative effects of sulfate aerosols. We tested currently available observational and empirically-based climatologies of DMS concentration in the surface ocean. The exploration of the existing parameterizations mainly reveals the shortcomings of estimating DMS with an empirical model based on variables such as chlorophyll and mixed layer depth. The different algorithms show significant differences in spatial pattern, and none correlate strongly with observations. In the present research, we investigated the influence of DMS on marine aerosols and radiative fluxes mainly by working with different versions of the observational-based climatology in the fourth generation of the Canadian Global Atmospheric Climate Model (CanAM4).
POSTER - Time-lapse Monitoring of Geohazard & Geodynamics / AFFICHE- Surveillance des géohasards et de géodynamique
Room / Endroit (Regal Room), Chair / Président (Jeong Woo Kim ), Date (28/05/2013), Time / Heure (15:45 - 17:00)
2D31.1 ID:6310 15:45
Construction of a Real-time Monitoring System for Debris Flow on Natural Terrain in Korea Jung-Hae Choi , Byung-Gon Byung-Gon Korea Institute of Geoscience and Mineral Resources (KIGAM) Contact: [email protected]
As one of damage mitigation technologies of landslides on natural terrain, this study developed a real-time monitoring system for debris flows. The developed monitoring sensors are a debris flow detection sensor, a slope displacement measurement sensor, and a water content measurement sensor. Because the monitoring system should be installed in mountainous areas, it was designed with an independent power supply system and ubiquitous wireless communication network. Each sensor was connected to a RF logger which was developed for wireless communication with the master logger in this study. The transmitted measurement data to the master logger are sent to a remote monitoring center by the CDMA communication method in real time. It is possible to measure rainfall data of the site with a rain gauge attached to the master logger. Based on the developed system, this study constructed a pilot monitoring system for debris flows at a site in the northeastern part of South Korea. The system is composed of one master logger, three sets of debris flow detection sensors, two sets of slope displacement sensors, four sets of water content sensors, one geophone, and one web camera. The pilot system is the first trial to construct a real-time monitoring system for debris flows on natural terrain in Korea, although there have been many repetitive debris flows. Based on this study, it is expected to develop more effective monitoring systems for debris flows in the near future.
POSTER - General Hydrology 1 / AFFICHE- Hydrologie en général 1
Room / Endroit (Regal Room), Chair / Président (Sean Carey ), Date (28/05/2013), Time / Heure (15:45 - 17:00)
2D15.1 ID:6418 15:45
Assessment of filtering and frequency rates necessary to correct eddy flux measurements collected from a floating platform Newell Hedstrom 1, Chris Spence 1, Raoul Granger 2, Scott Miller 3, Megan Marsh 4, Chris Marsh 5 1 Environment Canada 2 Formerly with Environment Canada 3 University of New York at Albany 4 Solido Design Automation 5 University of Saskatchewan Contact: [email protected]
Evaporation from open water bodies is an important component of the hydrologic cycle for many watersheds. This is particularly true for boreal and northern regions where open water is up to 20% of a watershed’s surface area. Despite

this importance, evaporation from open water bodies remains largely unmeasured, increasing uncertainty in the mass and energy balance of a watershed and impacting operational decision making. The required meteorological variables for calculating evaporation are rarely measured directly over water surfaces, and the thermal lag between the lake and land surfaces renders the use of land-based measurements alone ineffective in the parameterization of open water evaporation. Direct measurements of evaporation over open water bodies used to calculate monthly or annual rates, or as a means of validating modelled evaporation results, are even less common. Increasingly, buoy deployment is allowing for these measurements. Although widespread buoy deployment is still prohibitively expensive, understanding the corrections required in such an operational platform is an important first step in their widespread use. The focus of this experiment was to determine the optimal frequency of measurements and data filtering ranges for an eddy-covariance system mounted on a floating buoy platform. By performing coordinate system rotations using high-frequency accelerometer vectors of buoy movement, wind components were corrected for platform movement. These corrected wind speeds were used to calculate sensible and latent heat fluxes over the buoy. The corrected and uncorrected fluxes were averaged over a variety of temporal periods to determine if there was a temporal scale where the platform corrections were not required. These buoy-based fluxes were compared to fixed-platform fluxes made with the same suite of eddy-covariance instrumentation situated in close proximity to the floating system.
2D15.2 ID:6772 15:45
A rigorous comparison of numerical modelling structures and approaches for prediction in ungauged peatland basins using k-fold cross-validation and parameter uncertainty assessment
Jean-Sebastien Bouffard Carleton University Contact: [email protected]
Northern peatlands are environments with unique hydrologic characteristics that challenge some basic assumptions embedded within many numerical hydrology models, including topographically-driven lateral flows and direct hydrologic connectivity of all terrestrial landscape elements with the stream network. With increasing resource development in northern lowland regions of Canada, more rigorous and honest appraisal of modelling capabilities and deficiencies are warranted. This study was initiated with the following three objectives; (1) to compare the performance of two commonly used conceptual rainfall-runoff models for water- balance simulation in a northern peatland complex in the James Bay Lowlands; (2) to apply landscape analysis in the parameterization of these models to assist in model calibration and improve predictive ability; and (3) examine whether or not either of the two modelling approaches can adequately capture the distinct hydrologic characteristics of fens and bogs in this landscape.

Both HBV-Light and TOPMODEL were conditioned at six catchments spanning a range of gross drainage areas (from 9 km^2 to 204 km^2 ) at the De Beers Victor Diamond Mine site, 90 km west of Attawapiskat, Ontario, Canada, in the James Bay lowlands. Model calibration was conducted during 2009 and validated against 2008 and 2010 data. Additionally, model performance was assessed by 6-fold cross-validation between catchments. From the preliminary results, HBV-Light had a mid to high-level model performance, while TOPMODEL had a low to mid-level model performance. Cross-validation results imply that the areal extent of catchments did not have an impact on model performance. However, the proportion and type of bogs and fens in the landscape did affect model performance. The results underscore the critical role of both model structure and landscape analysis using air- or statellite born remote sensing imagery to effectively parameterize numerical hydrology models for application in ungauged peatland basins.
2D15.3 ID:6578 15:45
The UBC Watershed Model revitalized: The use of a flexible hydrological modelling framework to emulate and enhance model capability James Craig 1, Wayne Jenkinson 2, Martin Serrer 2, Georg Jost 3 1 University of Waterloo 2 National Research Council-Oceans, Coastal, and River Engineering 3 BC Hydro Contact: [email protected]
The UBC watershed model (UBCWM) is well-established model for simulating mountain hydrology and forecasting snow and glacial melt runoff. Originally developed in the mid-1970s, it has been used in a large number of hydrologic studies, primarily with application to reservoir simulation in British Columbia. It has a strong track record of success, and has been used for operational flow forecasting by BC Hydro for nearly 40 years. In order to ensure that the model may continue to meet the changing needs of its user base, the National Research Council-Ocean, Coastal, and River Engineering division, in conjunction with BC Hydro, has developed a stewardship model for the UBCWM. As part of this process, UBCWM functionality has been ported over to the flexible hydrological modelling framework, Raven, linking it to a wide array of architectural enhancements and support for critical capabilities, such as the simulation of non-stationary land use. Here, the emulation skills of Raven (which can also fully emulate the HBV-EC model) are demonstrated on a number of test watersheds in British Columbia. Results of benchmarking and computational profiling tests are reported. It is shown that the flexible and modular structure of the Raven model enables testing of hypotheses about system functioning and the quick evaluation of the impact of model structural changes.
2D15.4 ID:6462 15:45
Spatiotemporal patterns of stream baseflow for basins draining the Oak
Ridges Moraine, southern Ontario: implications for groundwater recharge estimation James Buttle , Wesley Greenwood Trent University Contact: [email protected]
The Oak Ridges Moraine (ORM) is a critical hydrogeologic feature in southern Ontario, supplying potable water to some of the more than 6 million Canadians living in the region as well as important aquatic ecosystem services via groundwater discharge to the numerous streams draining the moraine. Previous studies have highlighted the value of groundwater recharge estimates in the incorporation of groundwater protection into land use planning on the ORM, and have often used stream baseflow (BF) as a means of estimating recharge directly or validating model-derived recharge estimates. We extend this work by determining BF via hydrograph separation for more than 60 basins gauged by the Water Survey of Canada that drain portions of the ORM for the 1953 – 2011 water years. Spatiotemporal patterns in BF were analyzed using hydrogeological data as well as precipitation (P) and potential evapotranspiration (PET) spatial fields constructed using data from climate stations in the ORM region. Results are used to identify portions of the ORM that experience significant inter-basin groundwater transfers, and areas of above- and below-average groundwater recharge and discharge. Temporal trends in BF from the ORM are examined in the context of P and PET time series, and cross-correlations between BF and P time series are used to assess inter-basin differences in groundwater storage properties. The key groundwater recharge areas identified in this study should be the focus of source-water protection measures on the ORM, while knowledge of critical groundwater discharge areas can guide the identification and study of critical aquatic ecosystems on and adjacent to the ORM.
2D15.5 ID:6466 15:45
Growing season stemflow and soil water recharge in a red pine chronosequence on the Oak Ridges Moraine, southern Ontario Haley Toye , James Buttle Trent University Contact: [email protected]
Previous work has highlighted the role of stemflow (SF) in soil water and groundwater recharge in forest landscapes. An earlier study of rainfall partitioning in red pine on the Oak Ridges Moraine (ORM) in southern Ontario hypothesized SF would decrease in importance as stands age, and this was tested during the 2012 growing season for a chronosequence of red pine stands. Stemflow contributions to soil water recharge were assessed from soil water content (SWC) profiles adjacent to the tree bole and 1.5 m from the tree in each stand. Stemflow volumes and depths did not support the hypothesized change with tree age; instead, SF increased with canopy cover. Wetting front propagation during rainfall occurred at most sites 1.5 m away from bole while near-surface SWCs

showed little response to SF inputs near the bole. Rather, wetting occurred at depth at all stands, implying vertical and lateral transfer of SF along tree roots and storage in surrounding soil. Soil water storage (SWS) in the upper 1 m near the bole was similar to and occasionally exceeded that at 1.5 m distance for the two youngest stands. However, SWS was consistently greater at 1.5 m distance for older stands, which suggests that SF contributions to SWS near the bole did not compensate for greater rainfall interception with proximity to the boles. Nevertheless, SF contributed to SWCs at depth 1.5 m from a 62 year old stand with SF volumes at least twice those of other stands. Stemflow makes significant contributions to soil water recharge in red pine stands of varying age, and the soil volume around the bole influenced by SF contributions expands with increasing SF fluxes. This has implications for water availability to trees, for root zone biogeochemical processes, and for groundwater recharge in red pine stands on the ORM.
2D15.6 ID:6727 15:45
Exploring the Potential of Developing Ecological Flow Needs Recommendations for a Large River-Delta System Regulated for Hydroelectric Power Production Daniel Peters 1, Donald Baird 2 1 Environment Canada @ W-CIRC, Univeristy of Victoria 2 Environment Canada @ CRI, University of New Brunswick Contact: [email protected]
The Peace River in Western Canada has been regulated since 1968 with a large dam and storage reservoir for the production of hydroelectricity and the reservoir releases feeds a run of the river facility, and there are plans to add two more run-of the river dams downstream. Prior studies have found that flow emanating form the mountain headwaters have increased by about 250% during the winter low flow period and peak summer flows have decreased by about 35% with the introduction of hydroelectric operation, and although reduced with tributary inflow, this change in flow regime was transferred downstream to the delta. More than a thousand kilometers downstream is the Peace-Athabasca Delta, a lake/wetland ecosystem of international importance recognized as a RAMSAR Convention site. The PAD aquatic ecosystem is influenced by occasional ice-jam and open-water flood events that recharge lake and wetlands that have varying degrees of connection to the main flow system. Following a recommendation form the Northern River Basin Study, additional reservoir flow was released in the spring of 1996 to enhance natural hydro-climatological conditions in the lower watershed that were conducive to generating an ice-jam flood in the Peace Delta. In the months subsequent to this event, the Williston reservoir was lowered by 3m in response to finding of a sink-hole in the earth dam, generating near natural summer flows on the lower Peace River that helped raise the connected lake system into contiguous wetlands. Reservoir spillage is a rare occurrence on this river system, but additional flow was released over the summer of 2011 in response to above average snowpack/rainfall and runoff in mountain

headwaters. The objective of this paper is to capitalize on the occurrence of these atypical climatic, hydrological and water management driven events to explore the potential of developing ecological flow needs recommendations on a regulated river system that will contribute to the maintenance and sustainability of the downstream deltaic ecosystem. This will be accomplished via examination of pre and post-development climate and hydrology, and a suite of hydrological indicators of change relevant to a cold regions river-delta environment.
2D15.7 ID:6597 15:45
Physically-based transfer function modelling of runoff generation in lowland and Precambrian Shield landscapes
Murray Richardson Carleton University, Department of Geography and Environmental Studies Contact: [email protected]
In this poster I will highlight recent progress in the development and implementation of a physically-based landscape unit transfer function modelling approach for application in depression-storage dominated landscapes. This method explicitly links landscape element storage-runoff responses along topological flow networks using topographically-derived drainage transfer functions, to efficiently propagate precipitation inputs into streamflow output signals. Simulation results from headwater catchments in a central Ontario Precambrian Shield region, and a northern peatland complex in the James Bay lowlands of northern Ontario, will be highlighted.
2D15.8 ID:6752 15:45
Base and event-flow hydrologic connectivity in a fen-stream transition in the central Hudson Bay Lowland Meghan Kline , Brian Branfireun University of Western Ontario Contact: [email protected]
In the Hudson Bay Lowlands (HBL), the second largest peatland complex on the planet, the hydrological and biogeochemical role of riparian areas is unknown. This landscape is dominated by peatlands (bogs and fens) with riparian areas adjacent to streams of second-order and above that are drier, have taller trees, and less soil organic matter, than the surrounding peatland. This study seeks to clarify how the riparian forests adjacent to these incised streams influence the connectivity of the peatland-dominated catchment to the stream. This research has identified three important modes of transport for water in these riparian zones, groundwater flow, surface flow in rivulets, and pipeflow. The groundwater flow is predominantly in low permeability marine sediments, and is a small contribution relative to the other two modes. Based on isotopic and geochemical data, the rivulets convey runoff directly from the fen to the stream without significant mixing. By contrast the pipes are fed by water that has mixed with

another hydrological end-member in the riparian zone. Pipe and rivulet storm discharge hydrographs are hydrologically more responsive than changes in fen water table position, indicating that the event response of the stream may be somewhat de-coupled from that of the fen. Further, relatively invariant ion chemistry, dissolved organic carbon, and oxygen and hydrogen isotope ratios during storms and baseflow over a season where conditions went from dry to wet so far suggest that end-member composition and mixing is not highly variant, with only broad seasonal trends apparent. Differences in pipe connectivity deriving from heterogeneity in riparian zone geomorphology and geology appear to be more important than temporal changes in water quality.
POSTER - Snow, Ice, Permafrost and Cold Regions Processes / AFFICHE- Neige, glace, permafrost et régoins froides
Room / Endroit (Regal Room), Chair / Président (John Pomeroy and Phillip Marsh ), Date (28/05/2013), Time / Heure (15:45 - 17:00)
2D28.1 ID:6468 15:45Characterizing soil moisture spatial and temporal variability in the wetland dominated boreal region of Scotty Creek, Northwest Territories Michael Merchant 1, Rebecca Warren 1, Aaron Berg 1, Jennifer Baltzer 2, Rajit Patankar 2 1 University of Guelph 2 Wilfred Laurier University Contact: [email protected]
Extensive permafrost thaw in subarctic northern environments is yielding considerable alterations to local vegetation cover, hydrological processes, and carbon and methane storage. Soil moisture plays a vital role in influencing these changes due to its controls on evaporation, thermal conductivity, and surface and subsurface lateral runoff. In an aim to study these water-energy feedback processes, this research evaluated soil moisture and landscape characteristics from data collected over three separate sampling days at Scotty Creek, Northwest Territories (61°18'N: 121°18'W) over a grid of 12 rows (south-north) by 26 columns (west-east) with sampling points separated by 20 ms. Data collection included measurements of frost table depth, volumetric soil moisture content (m 3

m-3), and observations of vegetation and land cover. The Delta-T Theta Probe and Stevens Hydra Probe soil moisture sensors were manually calibrated for this environment by distinguishing the linear relationship between the water content of sample cores and the real dielectric. The development of calibration equations yielded a root mean square error (RMSE) of 0.0488 m3 m -3 for the Hydra probe and an RMSE of 0.0436 m3 m-3 for the Theta probe. Calibrated soil moisture data were correlated between the three sampling days at the landscape and plateau scales. At both scales, the standard deviation, coefficient of variance, and skew were plotted against mean soil moisture to characterize variance for determining spatial scaling parameters and to provide information for optimal monitoring of soil moisture in this environment. The controls on soil moisture spatial and temporal variability are related to land characteristics that are dominated by topographic controls. Soil moisture variability monitored on permafrost plateaus did not exhibit clear spatial patterns and is the focus of ongoing investigation. This study will assist in the understanding and characterization of soil moisture variability in peat dominated wetlands and permafrost plateau environments.
2D28.2 ID:6317 15:45
Inventory of beaver dammed peatlands in the Canadian Rockies Alasdair Morrison , Cherie Westbrook University of Saskatchewan Contact: [email protected]
Beaver are known ecological engineers and their impact on alluvial systems has been well documented (damming streamflow, increasing the riparian area, increasing surface water area, raising local water tables and impacting vegetation on and beyond the floodplain). Less understood are beaver impacts on pre-existing wetlands, especially peatlands. We inventoried beaver-impounded wetlands in an 8000 km2 area of the Canadian Rocky Mountain Front Range and foothill regions using both GIS and ground-truthing methods. There were 512 wetlands identified using GIS, and as expected, wetland density was higher in the foothill (0.14/km2) than mountain (0.03/km2) region. One-third of the wetlands were impounded by beaver. More of the mountain (43%) than foothill (26%) wetlands had beaver ponds (average 7.4 ponds per wetland) despite the greater availability of habitat in the foothills. Of the 82 wetlands ground-truthed, 77% were peatlands (>40 cm peat) or peat-forming (<40 cm peat) wetlands. Beaver ponds occurred as often in peatlands as non-peat wetlands (~80%). Although peatland density is higher in the foothills region, a higher proportion of peatlands surveyed in the mountain than foothill region (100 vs. 61%) were impacted by beaver. Also, jurisdiction affected the frequency of peatlands with beaver ponds, with the greatest proportion occurring in the most protected areas. Further, the area of open water was factor of 10 higher in peatlands with beaver than without. This work has implications for mountain runoff generation, beaver management, peatland formation and carbon cycling.

2D28.3 ID:6290 15:45Net snowpack accumulation and ablation characteristics for the Inland Temperate Rainforest of the Upper Fraser River Basin Stephen Déry , Heidi Knudsvig , Darwyn Coxson UNBC Contact: [email protected]
This presentation will examine the net snow accumulation and ablation characteristics and trends in the Inland Temperate Rainforest (ITR) of the Upper Fraser River Basin, British Columbia (BC), Canada. The ITR is a unique ecosystem found in the Upper Fraser River Basin that shelters old-growth cedars and hemlocks at toe slopes as well as old-growth Engelmann spruce and subalpine fir at higher elevations. The ITR, situated approximately 700 km from the coast of the Pacific Ocean, differs from BC coastal rainforests in that a large proportion of its annual precipitation falls as snow (especially at high elevations) and the extended snowmelt period is thought to gradually replenish soil moisture in toe slopes where ancient western redcedar stands are found. In this study, snow water equivalent (SWE) and air temperature data from seven snow pillow sites in the Upper Fraser River Basin at elevations between 1118 m a.s.l. and 1847 m a.s.l. will be analyzed to infer snowpack characteristics and trends for hydrological years 1969-2012. Specifically, the SWE and air temperature data will be used to explore snowpack characteristics such as annual peak accumulation and its timing, net accumulation and ablation rates, and duration with emphasis on their interannual variability. We will also investigate the sensitivity of peak SWE accumulation and its timing to air temperatures and then place this in the context of projected long term regional warming and implications to old growth trees in the ITR.
2D28.4 ID:6803 15:45Estimation of incoming solar radiation for net radiation calculations in high mountain glacier environments Dhiraj Pradhananga 1, John W. Pomeroy 1, D. Scott Munro 2 1 Centre for Hydrology, Department of Geography and Planning, University of Saskatchewan 2 Department of Geography, University of Toronto Mississauga Contact: [email protected]
Melt of glacier snow and ice has a large influence on mountain streamflows. Mountain streamflow has an extremely important influence on the quantity and seasonal variation of downstream water availability. Many hydrological models have been developed, but, very few explicitly calculate the snow and ice energy-budget to estimate melt rates and volumes. A major reason cited for not applying the energy balance to glacier melt is the lack of high altitude observations of incoming solar radiation and the uncertainty in estimating radiation on glaciated terrain. However, empirical methods based on air temperature have been successfully applied in lowland environments to estimate solar radiation for

calculation of snowmelt energy balance and evapotranspiration. This study evaluates existing empirical methods for estimating atmospheric transmittance and then proposes a modified method that can be applied with greater confidence in a glaciated basin. The transmittance calculation is used with the existing Garnier-Ohmura slope shortwave radiation module and in modules developed from algorithms by Sicart and Pomeroy to estimate net radiation in the modular Cold Region Hydrological Modelling Platform (CRHM). Components of net radiation estimated from these methods are compared to observations at Peyto Glacier in the Canadian Rockies for algorithm development and evaluation. This evaluation will help develop a more robust approach for physically based glacier melt modeling.
2D28.5 ID:6350 15:45
Dynamics of snow density during snow accumulation and melting processes
Rimma Vedom researcher Contact: [email protected]
In order to characterize daily dynamics of snow cover accumulation and melting in different climates, the Canadian data for 1990-2010 are analyzed and modeled. Two continental (Estevan and Toronto) and three coastal (Vancouver, Eureka and Sydney) stations are studied. Both precipitation and snow cover are considered with their traces, which values are estimated using the Harmonized Frequency Analysis (HFA). Dynamics of daily new and aging snow density along with the snow depth are considered as controlling factors of entire process of snow cover formation and melting. Both the new and aging snow density rates as well as the sublimation rate in dependence of temperature, precipitation, wind and humidity are accepted to be the same for the entire cold period. Melting process has different parameters for spring and fall time, within and outside positive and negative intervals of the average daily amplitude of temperature. We find that the models for Estevan and Eureka demonstrate good approximation (R = 0.93 and 0.89, respectively) and very similar sets of parameters: average sublimation approximately equals to traces of precipitation; very slow dynamics of the aging snow density also depends on the rate of sublimation. For Toronto (R = 0.87) the dynamics of density are much faster and depends significantly on precipitation. Vancouver and Sydney are the most complicated cases, where humidity affects density of both types of snow (newly fallen and aging one) in both accumulation and melting processes. In these coastal areas it is necessary to consider different parameters for the beginning and the end of snow pack formation following the seasonal changes of humidity. The speed of the processes suggests the hourly consideration of them in order to get significantly good result.
POSTER - Groundwater's role in the hydrological cycle / AFFICHE- Rôle de l'eau souterraine dans le cycle hydrologique
Room / Endroit (Regal Room), Chair / Président (Andrew Ireson ), Date (28/05/2013), Time / Heure (15:45 - 17:00)
2D18.1 ID:6534 15:45A comparison of stochastic and deterministic approaches to subsurface stormflow characterisation Daryl Janzen 1, Willemijn Appels 2, Jeffrey Mcdonnell 2 1 Postdoctoral Fellow, GIWS, University of Saskatchewan 2 GIWS, University of Saskatchewan Contact: [email protected]
Subsurface stormflow generation on hillslopes characterised by soil-mantled bedrock is partitioned into a vertical component, where the delivery of rainwater to the soil-bedrock interface is heterogeneously dampened, and a lateral component, in which perched water is transmitted along a well-defined aquitard. Varying soil depths below relatively flat terrain lead to inhomogeneous delivery of water to the flow layer, where highly undulated spillways exist. The result is much like an overland fill and spill scheme, but with complexities exaggerated relative to the surface, and further complicated by observational difficulty, thus amplifying the importance of developing accurate modelling tools. These may be based on fully coupled solutions to the flow equations, or be approached from a more parsimonious conceptual point of view. The advantage of the latter is usually decreased computation time, thereby allowing more detailed incorporation of spatial heterogeneities in topography, soil, and forcing characteristics of the hillslope. Here, we compare the results of two modelling strategies, one based on percolation theory, the other a simplified mechanistic approach, for subsurface flow generation on the well-studied Panola hillslope. We show how these models simulate flow at the base of the hillslope and the development of soil moisture patterns on the slope for several combinations of slope angle, infiltration characteristics, and soil depth and compare advantages and disadvantages of the models.
2D18.2 ID:6612 15:45
Impacts of Single and Dual Porosity on Groundwater Recharge Modelling Under Changing Climate Kibreab Assefa , Hartmut Hollaender , Allan Woodbury

University of Manitoba Contact: [email protected]
Assefa, K.A1, Holländer, H.M. 1, Woodbury, A. 1 1 Department of Civil Engineering, University of Manitoba, Winnipeg, MB Recharge is a major factor in water budget analysis and therefore in the evaluation of available water resources under changing climate. The recharge estimation depends strongly on the soil type. While sandy soils are generally underlying matrix flow, cohesive soils tend to build preferential flow paths. These cohesive soils have to be simulated often using dual porosity models. We aim in this study for the evaluation of the impact of single versus dual porosity on groundwater recharge modeling procedures under climate change. We chose two sites within the Deep Creek watershed in Northern Okanagan, BC. While the experimental site located at the valley bottom is dominantly characterised by silt soil texture, the second one at the Silver Star Mountain is primarily sandy in texture. The sites were equipped with a weather station including all major sensors for the atmospheric drivers as well as soil moisture and temperature sensors in different depths. We used the one-dimensional version of Hydrus to simulate the soil moisture movement and the heat transport in the vadose zone and compared the results of single porosity modelling with dual porosity modelling for both soil types. The heat transport was used only as second calibration objective to evaluate the general model performance. Next, the calibrated Hydrus-models were forced with downscaled climate data. The future climate time series was constructed by making use of Statistical Downscaling Model (SDSM) using predictor variables derived from the HadCM3 A2 experiment, normalized over the 1961-1990 period. We found as expected minor differences between the single and dual-porosity attempts at the sand-dominated experimental site while we received a better calibration using the dual porosity attempt at the silt-dominated site. However, using both porosity attempts with climate change studies did not reveal significant differences in groundwater recharge prediction. Although, dual porosity is often an important concept to consider in simulating soil moisture in cohesive soils, it may not necessarily have a significant impact on recharge estimation in climate change studies.
2D18.3 ID:6696 15:45
Controls on connectivity and streamflow generation in a Canadian Prairie landscape Rosa Brannen 1, Andrew Ireson 1, Chris Spence 2 1 Global Institute for Water Security, University of Saskatchewan 2 Environment Canada Contact: [email protected]

In the Prairie Pothole Region (PPR) of North America, the large volume of surface storage in depressional wetlands is a major factor in determining the extent and distribution of surface connections between wetlands. Streamflow generation and active contributing area are controlled by the connectivity of landscape components, which is dependent on storage thresholds at multiple scales. At catchment and sub-catchment scales, storage thresholds of different wetlands have been observed to control the timing and degree of streamflow. Missing is an understanding and quantification of how the relative roles of surface and subsurface storage control wetland water balance under different land uses, climatic conditions, and landscape position, and how this controls the connectivity of stream networks and streamflow generation. Although current models are capable of predicting many hydrological processes in this region, they do not integrate surface and subsurface processes to simulate wetland water balance and storage-discharge relationships that control basin streamflow. A wide range of field observations at the St. Denis National Wildlife Area in central Saskatchewan will be used to gain insight into these processes and to calibrate and validate a quantitative model. Preliminary water budget for a small sub-catchment and model results will be discussed.
POSTER - Perspectives of hydrometeorological extremes / AFFICHE- Perspectives des extrèmes hydrométéorologiques
Room / Endroit (Regal Room), Chair / Président (M. Naveed Khaliq ), Date (28/05/2013), Time / Heure (15:45 - 17:00)
2D23.1 ID:6662 15:45
Regionalization of Canadian Prairies using precipitation sensitive large-scale atmospheric covariates
Zilefac Elvis Asong , M.naveed. Khaliq , Howard.s. Wheater Global Institute for Water Security, University of Saskatchewan Contact: [email protected]
It has been widely documented that large-scale atmospheric circulation patterns play a significant role in modulating regional climate patterns at various temporal and spatial scales. Their impacts are felt through incidences of extreme events like floods, droughts, precipitation extremes, etc. Effective estimates of their rate of occurrence and magnitude are important for many planning and management

related activities in water resources. However, observed data at point scale are often inadequate to obtain reliable estimates of the magnitude and frequency of extreme events. To overcome this, extremes from neighboring sites with like precipitation characteristics are pooled together. The pooling process is based on the partitioning of a larger region into smaller sub-regions with homogeneous precipitation features. The established approaches rely heavily on statistics computed from observed precipitation rather than the precipitation-related atmospheric variables. In this study, a new approach for identification of homogeneous regions for regional frequency analysis of precipitation extremes in the Canadian Prairies is proposed. This approach incorporates information about large scale atmospheric covariates, teleconnection indices and geographical attributes (i.e. latitude, longitude and elevation) that modulate spatial precipitation patterns. Gridded reanalysis products from the National Center for Environmental Protection and indices of Pacific Decadal Oscillation are used to delineate homogeneous precipitation regions through a Fuzzy C-means clustering algorithm. Results of the study suggest that the entire Prairies region can be partitioned into four acceptably to possibly homogeneous precipitation regions. These partitions are independently validated for homogeneity using statistics derived from annual precipitation data at 119 point scale stations.
2D23.2 ID:6730 15:45
Pre-instrumental reconstruction of three Canadian Prairie streams using tree-ring chronologies from the Bears Paw Mountains (Montana, USA), Sweet Grass Hills (Montana, USA) and Cypress Hills (Saskatchewan, Canada) Samantha Kerr 1, David Sauchyn 2 1 Student - Prairie Adaptation Research Collaborative, University of Regina 2 Prairie Adaptation Research Collaborative, University of Regina Contact: [email protected]
Water resources of the southwestern Canadian Prairies are limited and sensitive to changes in climate and land cover. An increasing demand for water resources has increased vulnerability to hydrological drought. Because few instrumental records exceed 100 years, climate proxies are used to extend the historical record of natural variability. Fifteen moisture sensitive tree-ring chronologies (Pinus albicaulis, Pinus ponderosa, Pinus contorta, Picea glauca, and Pseudotsuga menziesii) from Montana and Saskatchewan are used to extend mean spring and summer streamflow records of the Frenchman River, Battle Creek, and Swift Current Creek in southwestern Saskatchewan, Canada, back to the mid 1600s. Spectral analyses (Multi-taper and Wavelet) of the reconstructed streamflow reveal common cycles of variability at interannual and multidecadal scales. Results show the large natural variability of prairie water levels, with cycles of decades with high flow followed by decades of low flow, and more extreme flows than in the instrumental records.
2D23.3 ID:6431 15:45Grid based Intensity-Duration-Frequency curves of Central Alberta estimated from Storms simulated by a Regional Climate Model Chun-Chao Kuo , Thian Yew Gan University of Alberta Contact: [email protected]
A regional climate model (RCM), MM5, was used to simulate summer precipitation in central Alberta, such that MM5 was set up in a one-way, three-domain nested framework, with domain resolutions of 27, 9, and 3 km, respectively, and forced with ERA-Interim reanalysis data of ECMWF (European Centre for Medium-Range Weather Forecasts). The objective is to develop high resolution, grid based Intensity-Duration-Frequency (IDF) curves based on the simulated annual maximums of precipitation (AMP) data for durations ranging from 15-min to 24-hr. The precipitable water and 2-m air temperature simulated by MM5 was first assessed with ERA-Interim reanalysis data, and then grid-based IDF curves derived from MM5’s simulations were compared to IDF curves derived from climate data simulated by RCMs of the North American Regional Climate Change Assessment Program (NARCCAP) and regional IDF curves derived from rain gauge data. The results indicate that 6-hr simulated precipitable water and 2-m temperature agree well with the ERA-Interim reanalysis data. However, IDF curves derived from MM5’s simulated precipitation data are overestimated especially for IDF curves of 2-year return period. In contrast, IDF curves derived from NARCCAP’s data suffer from under-estimation problem. Apparently by dynamically downscale the ERA-Interim or other reanalysis data using MM5 for central Alberta, and after bias correction, it is possible to develop IDF curves useful for regions with limited or no rain gauge data.
2D23.4 ID:6376 15:45Drought Risk Analysis for the Saskatchewan River Basin M. B. Masud , M. Naveed Khaliq , H. Wheater Global Institute for Water Security, School and Environment and Sustainability, U of S Contact: [email protected]
Drought is a complex and recurrent phenomenon in the Canadian Prairies due to its geographical location and it has considerably impacted agriculture, water resources, energy and socio-economic sectors of the region in the past. So, proper understanding of the spatial and temporal structures of historical droughts is important for many planning and management related issues. This research is focused mainly on the Saskatchewan River Basin (SRB) that spans southern parts of Alberta, Saskatchewan and Manitoba, the three Prairie provinces of Canada, where most of the agricultural activities are concentrated. For the analysis, a multivariate framework is adopted and 10 km × 10 km gridded daily precipitation and temperature data set from Agriculture and Agri-Food Canada is used to characterize drought events in terms of drought severity, duration and

maximum severity on the basis of Standardized Precipitation Index and Standardized Precipitation and Evapotranspiration Index. Both univariate and multivariate drought risk indicators are developed and mapped across the entire SRB to identify most vulnerable regions. Keywords: Droughts, precipitation deficit, multivariate analysis, Saskatchewan River Basin, risk analysis
2D23.5 ID:6729 15:45
Investigation and reconstructions of the hydroclimatic variability of the Souris River Basin, Saskatchewan, Manitoba, and North Dakota Jessica Vanstone , Dave Sauchyn Prairie Adaptation Research Collaborative, University of Regina Contact: [email protected]
Fourteen moisture sensitive tree-ring sites, (37 chronologies; annual, earlywood, and latewood) were developed to create robust multi-proxy reconstructions of annual water year and summer streamflow for four gauges within the Souris River Basin. Multiple linear regressions were able to account for ~76% and ~67% of the instrumental variance for water-year and summer flows, respectively. Spectral analyses provide evidence that streamflow variability in the Souris River Basin is driven by a combination of interannual, interdecadal, and multidecadal ocean-atmosphere oscillations. Correlation analyses, cross-wavelet transforms and wavelet transform coherence identify significant periods of high common power and coherence of streamflow with ENSO, solar sunspot cycles, and PDO indices. When these sea-surface temperatures and atmospheric oscillations are coupled, and in-phase with each other, it may lead to more prolonged and possibly greater in magnitude extremes than when climate anomalies are out of phase, resulting in a relatively modest influence of streamflow variability.
POSTER - Watershed assessment for the 21st century / AFFICHE- Evaluation des bassins versants pour le 21e siècle
Room / Endroit (Regal Room), Chair / Président (R.D. (Dan) Moore ), Date (28/05/2013), Time / Heure (15:45 - 17:00)
2D32.1 ID:6570 15:45Evaluating the impact of BMP’s on sedimentological connectivity on a small watershed in a temperate climate using MHYDAS-Erosion
Gabriel Hould Gosselin INRS Directed by ALAIN N ROUSSEAU and co-directed by SILVIO J. GUMIERE Contact: [email protected]
From a hydrological modeling point of view, watershed discretization must be applied at spatial and temporal scales closely reflecting the characteristic hydrological scales. The sedimentological connectivity, (i.e., the hydrological pathways of agricultural contaminants and sediments) takes place at scales too small to be adequately simulated by commonly used hydrological models based on computational scales larger than field and daily scales. A hydrological model that dynamically simulates the spatiotemporal dynamics of sediment sources and sinks must thus be used. MHYDAS-Erosion is an event-based distributed model for small watersheds that is specifically adapted to simulate the impact of various spatially- distributed BMPs (Best Management Practices) on sedimentological connectivity (Gumiere et al., 2010) . The objective of this project is to simulate the impact of a few high-intensity rainfall events on sediment transport in an intensively-farmed, 2.5-km2, watershed. It is located in the Bras d’Henri watershed, Quebec (Canada), as part of a Canadian-wide research program called Watershed Evaluation of Beneficial management practices ,WEBs (Yang et al., 2007) , launched in 2004 and led by Agriculture and Agri-food Canada (AAC). Once calibrated, the model will be used to assess the efficiency of buffer strips and alley cropping. The expected outcomes of this study will lead to: (i) the delineation of the sedimentological connectivity that characterized the 2012 summer and fall seasons; and (ii) the identification of the most effective locations to implement buffer strips and alley cropping in the study watershed.
2D32.2 ID:6781 15:45Seeking metrics for catchment characterisation in highly-dimensional dataspace through data-mining using Self-Organising Maps Michael Allchin 1, Axel Anderson 2, Alison Heppenstall 3 1 Foothills Research Institute / University of Southampton 2 Foothills Research Institute / Alberta ESRD 3 University of Leeds Contact: [email protected]
Hydrological catchments have been described as complex systems with a degree of organisation, which modulate meteorological inputs through the action of a wide range of physical processes. These processes are strongly influenced by context - principally, attributes of topography, geology, soils and land-cover, which may be highly spatially and temporally heterogeneous. These properties
together govern patterns of catchment hydrological response, as manifested by variations in streamflow at the basin’s outlet. There have been repeated calls for research into more objective methods for identifying landscape units with distinct physical properties, both to enable segmentation into hydrological response units, and to support rigorous characterisation of catchments with a view to establishing a formal classification framework. Because there are evolutionary inter-dependencies between the various physical properties listed above, there should in principle be a degree of self-organisation to be found among them. This study has thus sought to identify clusters within highly multi-dimensional dataspace using a variant of the Kohonen Network or Self-Organising Map, an unsupervised competitive machine learning or 'data-mining' technique. Initial results are promising, suggesting that proportional coverages of these clusters provide distinct signatures for the Alberta natural environmental regions. The intention is to continue the investigation, to explore whether it is possible to merge descriptions of catchment 'form' based on these clusters with corresponding metrics of meteorological 'forcing' using a Multi-Layer Perceptron. This is another type of Artificial Neural Network, in which training is supervised, and which has been shown to approximate the kind of non-linear and discontinuous processes at work in drainage basins. The eventual aim is to develop a model which is able to associate this amalgam with outlet streamflow, and thus 'function'.
2D32.3 ID:6792 15:45Remote sensing applications for variable scales of hydrologic and hydraulic studies
Guillermo Guglietti E.I.T., B.A., Dillon Consulting Contact: [email protected]
Conventional hydrologic and hydraulic models require various data inputs: climatic and streamflow data, topographic data, soils characteristics, and land cover data. Traditionally, data is collected from various environmental agencies and through field observations. This data often faces issues of integrity, resolution, and remoteness with respect to the study area. In turn, hydrologic and hydraulic models face challenges when using data collected as noted above. This results in high degrees of uncertainty and inadequate depth for the models’ application. The increasing number of environmental satellites and topographic survey platforms, along with higher spectral and spatial resolutions, offer the availability of cost- effective alternative data sources to enhance the granularity and validity

of hydrologic and hydraulic models. In addition, remote sensing techniques, in particular multispectral image classification, offer agencies and consultants complementary information in the form of high resolution water turbidity, soil saturation indicators, detailed land cover classification, high resolution topographic data, and real-time inundation extents. Different remote sensing platforms are suitable for various scales of analysis. Large extents can be studied through the use of satellite imagery, in particular multi-spectral analysis and stereo photogrammetry. Airborne platforms also offer cost-effective and customized platforms for smaller areas in need of detailed data. The development of commercial unmanned aerial vehicles (UAVs) introduces a cost-effective remote sensing platform for small study areas (below 20 sqkm) collecting high resolution multi-spectral and topographic data. The diversity and increasing affordability of remote sensing platforms offer viable ways to enhance conventional hydrologic and hydraulic models at various scales and resolutions. These techniques have been used in studies across the country and internationally. Forensic hydrologic investigations in Newfoundland and Labrador, fluvial hydraulic studies in St. Lucia, and various stormwater studies across Ontario and Alberta have benefited from the use of airborne and satellite-based remote sensing techniques.
2D32.4 ID:6847 15:45
Watershed assessment procedure to address cumulative effects in the eastern slopes of Alberta. Axel Anderson 1, Richard Mccleary 2, Sheena Spencer 3, Michael Wagner 4 1 foothills research institute 2 McCleary Aquatic Systems Consulting 3 foothills Research Institute 4 Alberta Environment and Sustainable Resource Development Contact: [email protected]
Alberta’s eastern slopes can supply up to 70% of the water for some regions where watershed supply exceeds demand and allocation in dry years. This region is also important range, forest and recreation. This area’s forests are at threat from insect and disease, wildfire and climate change. For a century, Alberta has relied on higher level planning and zoning to address multiple resource objectives in this region. Recently, the Water for Life Policy has initiated state of the watershed reporting and watershed management through a shared governance model with the stakeholder groups informing setting priorities and developing policy plans. Water quality and quantity measurements at a larger scale indicate relatively good watershed health; however smaller scale cumulative effect problems such fish species at risk are becoming obvious. Investment in research have highlighted uniqueness of some watershed processes and informed how changing hydrology and erosion processes will
affect watershed values. Alberta resource industry has provided data not available to the same extend in other areas (e.g. LiDAR for most of province). However, there is no formal platform to implement new knowledge into practice. In response, we are developing an assessment procedure building on ideas from well-established procedures in neighboring jurisdictions (e.g. BC, WA, OR). This procedure is developed on concepts of Risk, two levels of assessment, and watershed process knowledge, which leads to regionally specific assessment procedures based on regions defined by dominant watershed processes. The intent of the two levels is to provide a first level reconnaissance and office based screening to better direct resources for more detailed assessments (e.g. field assessments or modelling) to make informed recommendations for risk mitigation. We are finding that we are able to improve efficiencies and make more informed higher-level assessment when we capitalize on the good terrain, vegetation, and photography data.
2D32.5 ID:6386 15:45
The Nova Scotia Watershed Assessment Program (NSWAP) Kevin Garroway 1, Shannon Sterling 2, Yue Guan 2 1 Nova Scotia Environment 2 Dalhousie University Contact: [email protected]
The Nova Scotia Watershed Assessment Program was initiated to increase our knowledge on the current state of watersheds in Nova Scotia. At the provincial scale our knowledge of watershed characteristics and status is limited. In the Water For Life Water Resource Management Strategy (2010), a knowledge gap on the pattern of watershed issues faced in the Province was formally recognized. To improve our understanding and fill in the knowledge gap of the impacts of human activity on our watersheds, the Nova Scotia Watershed Assessment Program (NSWAP) was launched in 2011 by the Hydrologic Systems Research Group at Dalhousie University, in collaboration with Nova Scotia Environment. The key research questions studied are which of our province’s watersheds are most at risk; and what are the drivers of the impacts to our watersheds? The NSWAP project identifies the priority watersheds that are at the highest potential risk from activities such as land use, roads and water withdrawal. NSWAP is a two stage study of watersheds in Nova Scotia. Part A (2011 – 2013) was developed as a rapid, desktop, GIS assessment of Nova Scotia’s watersheds with the goal of assessing potential threats to water quality and quantity to identify priority watersheds that require more resources for management. Whereas Part B (2014 - ?) will leverage the results of Part A to study the localized issues identified in the priority watersheds. Nova Scotia’s watersheds have been sub-divided into 4 geographical regions based on the current jurisdictional resource distribution at Nova Scotia

Environment. Within the 4 regions a total of 341 watersheds were studied. NSWAP Part A studied the impacts of 13 indicators (eg. road/stream crossing density, human land use, dam density) in the 341 watersheds. These indicators represent potential impacts to watersheds and were selected based on importance to watershed health and available data. The 13 indicators will be modeled into four categories of Watershed Values -Hydrologic Change, Instream Habitat, Water Quality, and Surface Erosion - to better understand the impacts to the values of watersheds and to efficiently communicate the results to a broader audience. In addition to the indicator impact analysis resource management activities that are carried out by the government and various stakeholders were also included in this study. The comparison of the Watershed Values and the ongoing resource management practices identifies the priority watersheds in our regions and identifies where to focus resource management efforts in the future.
2D32.6 ID:6553 15:45
Source Water Contributions to Stream Flow in the Wasi Watershed Using Stable Isotope and Geochemical Tracers Nathan Mountain , April James , Krys Chutko Dept. of Geography, Nipissing University, North Bay, Ontario, Canada Contact: [email protected]
The Wasi watershed (235 km2 ) is a major source of nutrients to Callander Bay, Lake Nipissing, Ontario. Within the watershed, stream phosphorus concentrations have been found to regularly exceed provincial water quality objectives. As a result, a tracer-based study using water isotopes and geochemistry is now underway to better understand source water contributions and ultimately nutrient loading. This research presents stable isotope and in-situ water quality results from bi-weekly sampling across the watershed between May-Sept 2012. Groundwater was sampled from 18 volunteer residential wells, using an approach similar to ongoing Ontario Geologic Survey groundwater mapping. Surface water (streams, wetlands, lakes) was sampled from 23 sites established by the North Bay-Mattawa Conservation Authority. A total of 332 water samples were collected from forested Canadian Shield headwater sources and downstream locations with potential influences from agricultural and nearshore cottage development. In-situ measurements of alkalinity, EC, CO2, pH, and temperature were also recorded at each sample location. Samples were analyzed for δ2 H and δ 18 O using a Picarro L2120-i at Nipissing University. Laboratory precision for δ18 O and δ2 H was ±0.13 ‰ and ±0.38 ‰, respectively. Results indicate that average isotopic signature for precipitation (δ18 O = -7.48 ‰), surface water (δ 18 O = -10.49 ‰) and groundwater (δ 18 O = -12.36 ‰) were statistically distinct (p < 0.001). Surface waters were significantly (p < 0.001) lighter in δ 18 O during late spring higher flows (δ 18 O = -11.16 ‰) than during summer lower flows (δ18 O = -9.94 ‰), consistent with seasonality of precipitation inputs. While spring surface water signatures tend to fall along a local meteoric

water line overlapping with groundwater, some surface waters show an increasing departure along a pronounced evaporative line later in the summer. The three sub-watersheds demonstrate distinct variation of surface water δ18 O signatures, revealing an important spatial heterogeneity of hydrological processes.
2D32.7 ID:6387 15:45
Qu'Appelle River Basin Water Management Model
Curtis Hallborg Water Security Agency Contact: [email protected]
The Qu'Appelle River, with its headwaters at the Qu'Appelle Dam on Lake Diefenbaker, flows 430 km across southeast Saskatchewan to its confluence with the Assiniboine River just across the Manitoba Border. Secure and large continuous withdrawals from the River are not possible under natural conditions due to limited natural inflows as a result of large annual fluctuations in precipitation, high potential evapotranspiration, and that only about 27% of the 58,900 km2 gross drainage area is effective. With the creation of Lake Diefenbaker in the late 1960's, diversions from the South Saskatchewan River into the Qu'Appelle were made possible. These diversions provide a secure water supply for municipal, industry, and irrigation, while supplementing lake levels and instream flow needs. While the system is able to meet current demands, requests for allocations within the basin are on the rise and it may become stressed in the near future. This highlighted the need for a tool to analyze the system's ability to meet future demands. Golder Associates, utilizing Optimal Solutions as a sub consultant, were commissioned to develop this model. Alberta Environment and Sustainable Development's Water Resource Management Decision Support System (WRM-DSS) was selected for the project. WRM-DSS is a steady state water balance model that utilizes a linear programming algorithm to minimize the overall system penalty for each time step. The penalty scheme within the model is user defined and set to represent the overall system priority of each objective, including flow and lake level targets, and allocations. The model covers a 98 year period using a monthly time step and is run with existing or projected demands along with current or proposed operating scenarios to assess the impacts on lake levels and flows. The model has been used to determine the impacts of various demand scenarios, the available draft from Buffalo Pound Lake, and to identify system conveyance limitations. Output from the model is also being used as input data for a habitat assessment tool. Future applications may include the analysis of climate change scenarios, longer term demand outlooks, and additional conveyance improvement options.
2D32.8 ID:6406 15:45

Impact of forest harvesting disturbance on sediment-phosphorus dynamics and stream ecology in mountainous headwater streams Kirk Hawthorn 1, Uldis Silins 1, Mike Stone 2 1 University of Alberta 2 University of Waterloo Contact: [email protected]
While the impact of sediment loading to streams after forest harvesting has been extensively studied, the role of sediment associated nutrient transport and its effects on stream ecology has received comparatively less research attention. However, sediment associated phosphorus (P) transport and its impact on stream productivity may represent a key impact of disturbance in oligotrophic mountain streams. I am using a case-study approach to explore these issues in two headwater catchments in southern Alberta where one watershed has undergone extensive historic forest harvesting, while the other (reference watershed) is undisturbed. A process-based approach is being used to explore sediment-P storage and transport dynamics to shed light on potential long-term changes in stream productivity of headwater streams after forest harvesting. Measurements of streamflow, sediment and phosphorus production in the streams, along with measurements of phosphorus accumulation in bed sediments are being used to explore differences in phosphorus storage and exchange between streambeds and the water column and relate these to differences in algal productivity among the disturbed/undisturbed catchments. Results suggest elevated levels of total P in the bed and suspended sediments of the disturbed system, along with strong evidence of enhanced primary productivity. Sediment P speciation reveals both streams have similar proportions of P available to primary producers in their fine sediments, yet the disturbed system has a significantly higher percentage of fines in its bed. Subsequent research on the exchange of P across the bed/water interface is needed to determine whether these fines can provide the necessary P to drive the observed enhanced primary productivity.
POSTER - Stable Isotope Tracers and Climate-Driven Change / AFFICHE- Traceurs isotopiques stables et influence du cli
Room / Endroit (Regal Room), Chair / Président (Tricia Stadnyk ), Date (28/05/2013), Time / Heure (15:45 - 17:00)
2D29.1 ID:6373 15:45Quantifying stream water source components by meteoric water lines of water cycle components Julian Klaus 1, Jeffrey Mcdonnell 1, Enhao Du 2, Rhett Jackson 2 1 Global Institute for Water Security, University of Saskatchewan 2 Warnell School of Forestry and Natural Resources, University of Georgia, Athens, GA Contact: [email protected]
Surface water – groundwater connections are a key element of the catchment water cycle. Such connections, particularly in low relief terrain, are often nonlinear and poorly quantified. The traditional approach using isotopes is to use time series of rainfall, groundwater and streamflow to calculate connections and disconnections at the catchment scale. Here we present the results of a new isotope sampling campaign covering a 2+ year period at three first order low relief catchments in the Upper Coastal Plain of South Carolina. Here we examine some >1000 samples representing groundwater, streamflow, rainfall and throughfall, and shallow lateral subsurface storm flow. Results showed that temporal variations in each of the measured signals showed little variation or usefulness in quantifying groundwater-surface water connections. However, examination of the water cycle components in dual isotope space showed different local meteoric/evaporation water lines for each water cycle component. The different water cycle components showed stepwise enrichment in heavy isotopes from precipitation, to subsurface stormflow, groundwater, riparian groundwater, and streamflow. Hydrometric analysis showed very rare connectivity between subsurface stormflow generated within upland hillslopes and the stream. The dual isotope composition of streamflow showed a close link to riparian zone groundwater. Overall, our results suggest that examination of the catchment water cycle via unique water cycle component local/evaporative meteoric water lines may be a useful approach for quantifying connectivity of surface water and groundwater at the catchment scale.
2D29.2 ID:6371 15:45
High-frequency observations of δ2H and δ18O in storm rainfall
Julian Klaus 1, Falko Stoecker 2, Luke Pangle 3, Jeffrey Mcdonnell 1 1 Global Institute for Water Security, University of Saskatchewan 2 University of Stuttgart 3 Oregon State University Contact: [email protected]
Stable isotopes ratios of hydrogen (2H/1H) and oxygen (18O/16O) are indispensable tools for investigation of the hydrologic cycle. Recent technological advances with laser spectroscopy now enable high-frequency measurement of key water cycle components. While the controls on rainfall isotope composition have been known generally for some time, our understanding of the effect of inter- and intra-storm processes on fine scale rainfall isotope composition is poorly understood. Here we present a new approach to observe inter- and intra-

storm isotope variability in precipitation in high-frequency. We investigate the temporal development of δ2H and δ18O within and between discrete rainstorms. Isotopes in precipitation were measured using a flow-cell combined with a Liquid Water Isotope Analyzer. The average sample frequency was 15 samples per hour, resulting in more than 3100 samples during the observation period; 27 separate rainstorms were identified in the dataset. Event meteoric water lines were developed for each event. We observed short-term isotopic patterns (e.g., V-shaped trends), high-rate changes (5.3‰/h), and large absolute changes in isotopic composition (20‰) on intra-event scale. V-shaped trends appeared to be related to individual storm fronts detected by air temperature, cloud heights, and cloud trajectories. Despite this, we could detect no linear correlation between event-based isotopic variables (slope, Intercept, δ2H, δ18O) and the event meteoric water line. Furthermore, the composite event meteoric water line showed a wider spread for heavy isotopes than for light isotopes, caused by different cloud trajectories at various altitudes. Our high-frequency dual isotope measurements allowed observation of extreme values and ranges that would have been missed using traditional composite and time-integrated sampling and measurement techniques. These extreme values observed are of particular importance since they influence the overall isotopic composition and provide rich information about the processes taking place in the hydrologic cycle.
2D29.3 ID:6776 15:45
Chemical and isotopic considerations on the aquifers of the Densu River Basin, Ghana Edward Bam 1, Andrew Ireson 2 1 Global Institute for Water Security & School of Environment and Sustainability, University of Saskat 2 1Global Institute for Water Security & School of Environment and Sustainability, University of Saska Contact: [email protected]
Additional affiliation: Edward Bam: Isotope Hydrology Laboratory, NCERC, Ghana Atomic Energy Commission, P.O.Box LG 80, Legon Accra Groundwater studies that combine water chemistry and environmental isotopes have been used successfully at various scales and in various catchments. This approach was applied in the Densu River Basin, a data scarce but important agricultural and high population density area in South-eastern Ghana. The aim was to provide an understanding of the hydrogeology of the basin for water resources management. The study shows that major hydrochemical processes in the aquifers in the area include weathering of silicate minerals, dissolution, ion exchange, and evaporation. Groundwater chemistry is distinct between the areas of high topography where recharge dominates and low topography areas where discharge dominates. Stable isotopes (18O ,2H) and tritium (3H) analysis revealed groundwater in the catchment is recharged by modern rainfall.
POSTER - Observation and modeling of soil moisture / AFFICHE- Observation et modelage de l'humidité du sol
Room / Endroit (Regal Room), Chair / Président (Stéphane Bélair ), Date (28/05/2013), Time / Heure (15:45 - 17:00)
2D22.1 ID:6439 15:45
Monitoring Field Scale Soil Moisture: Results from a Cosmic-ray Neutron Probe and a Neutron Probe Array Amber Peterson , Warren Helgason , Andrew Ireson University of Saskatchewan Contact: [email protected]
Estimates of field scale soil moisture are important for agriculture management, as well as watershed modeling. Typically, estimates of field-average moisture content are obtained either by up-scaling point measurements or downscaling from remotely sensed data. Problems associated with these methods relate to the fact that soil moisture is both spatially and temporally variable. One such instrument that can be used to measure average field scale soil moisture is the cosmic-ray neutron probe (COSMOS), which has an areal footprint of hectometers and measures to a depth of decimeters. The COSMOS probe operates by detecting natural background radiation (cosmic-ray neutrons) near the land surface, which in turn can be related to soil water content. This instrument was deployed in August 2012 at a pasture site within the Brightwater Creek watershed (southern Saskatchewan). A neutron probe array was also installed at the same time, within the footprint of the COSMOS, to monitor the spatial variability of soil moisture. Initial results from the field site will be presented, along with the challenges associated with using this type of instrumentation.
2D22.2 ID:6463 15:45
Characterization of Surface Moisture in SMAPVEX12 Agricultural Fields Emmanuel R. Ojo , Brian Miller , Paul Bullock (Presented by Emmanuel Ojo ) Department of Soil Science, University of Manitoba Contact: [email protected]

The Soil Moisture Active Passive (SMAP) satellite is expected to provide global soil moisture information at a spatial resolution of 9 km every 2 to 3 days. A six-week campaign tagged SMAPVEX12 was conducted in Manitoba in 2012 and was aimed at providing calibration and validation data for the SMAP satellite. Surface soil moisture and temperature measurements were collected every 2 to 5 days in the 55 agricultural fields sampled during the campaign. Soil moisture content at depths was determined using permanent in-situ network stations of hydra probes installed at various locations within the SMAPVEX12 footprint. Plant water content was determined using multiple plant biomass samples in each field every 7 to 10 days. Weather elements including rainfall and air temperatures were measured at several weather stations in and adjacent to the sampling footprint. Daily rainfall, maximum and minimum temperature was estimated for each field on each sampling day using spatial interpolation. The collection, processing and analysis of these data, which can be used as input in models to generate field-specific results, is a critical piece in determining the accuracy of the SMAP remote sensing output. Keywords: SMAPVEX12, Moisture, Weather and Biomass
2D22.3 ID:6489 15:45
Validation of Simulated Soil Water Regimes Using SHAW in Manitoba Agricultural Fields Swapan Roy 1, Aaron Berg 1, Catherine Champagne 2, Tracy Rowlandson 1, Justin Adams 1 1 University of Guelph 2 Agriculture and Agri-Food Canada Contact: [email protected]
Due to limitation of in-situ measurements, model driven estimates of the soil water state is useful in irrigation scheduling, site-specific management of diseases and pests, monitoring of crop yields and indication of plant health. The objective of this study is to investigate soil water dynamics with the one dimensional SHAW (Simultaneous Heat and Water) model in soybean, corn, canola, spring and winter wheat fields for the 2012 growing season in Manitoba. The SHAW model is driven by weather data, site characteristics, plant growth, and initial soil water and soil temperature conditions. In model validation, predicted soil water and soil temperature of surface and root zone depths are compared with observations from AAFC (Agriculture and Agri- Food Canada) established in-situ soil moisture networks over 9 agricultural fields. We used site characteristics (elevation above sea level, slope, aspect, soil texture, bulk density, etc.) and plant characteristics (height, dry biomass, leaf area index, etc.) from the SMAPVEX12 (Soil Moisture Active Passive Validation Experiment 2012) experiment which lasted from crop emergence (early June) to crop maturation (mid-July). SHAW simulated soil water and soil temperature at different soil depths followed the general trends of the in-situ observations (r > 0.65). The root mean square error (RMSE) of soil water for a 1m profile was found to be

approximately 0.05 m3 m-3 after calibration. It is expected that the SHAW model can be implemented for simulation of Manitoba agricultural fields which can enhance soil water prediction.
2D22.4 ID:6647 15:45
Distinguishing soil organic carbon controls on soil water content variability in Manitoba grain fields Hida Manns , Rebecca Warren , Aaron Berg University of Guelph Contact: [email protected]
Soil moisture is currently understood in many hydrological models to be determined primarily from soil factors of texture and bulk density. The SMAPVEX-12 field campaign provided soil moisture and physical properties in 51 grain fields over 6 weeks to assess the influence of soil organic carbon on soil moisture. Each field was sampled 16 times at 100 m intervals, in 2 transects and at 3 sampling locations; between the plants in the row, ¼ way between rows and mid-row. Soil samples were also taken on each field at each sampling date to determine bulk density, soil texture and soil organic carbon. The field mean soil moisture and coefficient of variation (CV) from the midrow sampling location was tested for correlation and linear regression to bulk density, sand and clay percentages and organic carbon across all sampling dates. Organic carbon had the highest correlation to field mean soil moisture, (r = 0.93) followed closely by sand, clay and bulk density at most individual sampling dates. Soil organic carbon also explained the greatest proportion of between field variability in the regression of the 5 variables. The R^2 decreased from 0.80 to 0.74 when soil organic carbon was removed from the regression. The correlation of the soil moisture field CV to soil OC was greatest in very dry conditions and on loam soils indicating the greatest affect of soil OC on soil moisture variability in certain conditions. Soil organic carbon, along with soil texture, may help improve the characterization of soil variability between fields.
2D22.5 ID:6636 15:45
Assessing the contributions of high-resolution vegetation data to soil moisture scaling during SMAPVEX 2012
Justin Adams 1, Aaron Berg 1, Heather Mcnairn 2 1 Department of Geography, University of Guelph 2 Science and Technology Branch, Agriculture and Agri-food Canada Contact: [email protected]
The Soil Moisture Active Passive Validation Experiment (SMAPVEX) was completed in southern Manitoba during June 6 - July 19, 2012. The objective of this experiment was to provide pre-launch field campaign data for calibration/validation of the Soil Moisture Active Passive (SMAP) mission. An extensive ground dataset was collected over agricultural fields: a dense network

of in-situ soil moisture stations collected continuous data during the 6.5 week period; near-surface soil moisture data were manually sampled along transects within 55 fields, 17 times during the experiment; soil samples were acquired for bulk density and soil textural analysis. Vegetation was mapped over the entire study area and sampled weekly within the 55 fields to capture metrics of crop growth and canopy architecture, including: Leaf Area Index, height, stem diameter, and plant water content. The vegetation types consisted of spring/winter wheat, canola, soybean, as well as grassland and pasture. Remote sensing research is increasingly demonstrating that vegetation type and biophysical parameters can be extracted at relatively high spatial resolutions (10s of m) from optical and polarimetric SAR image data. This research provides preliminary results of an analysis that determines how these vegetation parameters act as a control on the spatial organization and scaling of soil moisture over an agricultural landscape. Results of this study indicate that the continued development of operational crop mapping products for the Canadian agricultural sector can be exploited to provide sub-footprint disaggregation of coarse resolution soil moisture estimates from current and planned passive microwave sensors, such as SMOS and SMAP.
POSTER - Heavy Precipitation over Mountains / AFFICHE- Fortes précipitations dans les montagnes
Room / Endroit (Regal Room), Chair / Président (Mindy Brugman ), Date (28/05/2013), Time / Heure (15:45 - 17:00)
2D19.1 ID:6556 INVITED/INVITÉ 15:45
Case study of missed summer severe precipitation events over Ontario
Zuohao Cao Environment Canada Contact: [email protected]
Summer severe rainfall has high impacts on Canadian society and economy especially in highly populated areas such as the Great Lakes regions, but it has low predictability. Since summer severe rainfall often involves convective and/or small-scale phenomena, it is difficult to detect and predict in terms of precipitation amount, location, and timing. Through diagnosing a series of missed summer severe rainfall events in this project, our objective is to identify the causes of missed forecasts, improve our understanding of physical processes leading to severe precipitation, and provide information for operational meteorologists to
make accurate and timely forecasts/nowcasts and warnings and for modelers to improve the operational numerical weather prediction models. The analyses on instability, moisture availability, and trigger mechanism have shown that (1) the GEM regional model (15 km resolution) forecasted central mean-sea-level pressure of the low pressure system is over-deepened by 1-5 hPa, mainly associated with shifting the heating maximum to lower levels; (2) the model predicted CAPE is smaller than the NARR analyzed, indicating that deep convection and severe precipitation induced by the parameterized convection appears to be weak and small in magnitude; (3) the GEM regional model underforecasts the conversion of water vapor into clouds; (4) the predicted low-level jet exit region is misplaced by the GEM regional model, resulting in a weaker convergence and less precipitation in the area of interest. In the situation involved with three-cyclone interactions, the GEM regional model predicted cyclones are over-deepened, leading to over rotation of the binary cyclones which further results in one of the binary cyclones moving away from the area of interest. In addition, the model forecasted merged cyclone has a slower translational speed toward the area of interest. Because of these, the model predicted precipitation is shifted in location and reduced in amount, and the model predicted vertical differences of moisture and temperature are smaller, reducing the atmospheric instability. Suggestions are made for operational forecasters and modelers to improve the predictions of summer severe rainfall.
POSTER - CSHS- Water Cycle in Integrated Modelling Framework / AFFICHE- Cycle de l'eau dans système de modèles intégrés
Room / Endroit (Regal Room), Chair / Président (Bruce Davison ), Date (28/05/2013), Time / Heure (15:45 - 17:00)
2D12.1 ID:6582 15:45
Prediction of runoff into Lake Michigan using the MESH model: a comparison with the area ratio method Dorothy Durnford 1, Milena Dimitrijevic 2, Frank Seglenieks 1, Lauren Fry 3, Christopher Subich 2, Erika Klyszejko 4, Vincent Fortin 2, Andrew D. Gronewold 5 1 Meteorological Service of Canada, Environment Canada 2 Meteorological Research Division, Environment Canada 3 Cooperative Institute for Limnology and Ecosystems Research, University of Michigan 4 Water Survey of Canada, Environment Canada 5 NOAA Great Lakes Environmental Research Laboratory
Contact: [email protected]
Estimating runoff into the Great Lakes is critical for understanding the water balance of the Great Lakes. Historically, data-based method such as the area ratio method (ARM) have been used for estimating past runoff based on streamflow observations, whereas hydrological models such as MESH have been used to predict future runoff. As part of the Great Lakes Runoff Intercomparison Project (GRIP), the accuracy of different configurations of MESH have been assessed at the monthly time scale and compared to that of ARM for 20 tributaries of Lake Michigan: (1) a configuration relying on the land-surface model used by the GEM numerical weather prediction model, ISBA, not specifically calibrated to predict streamflow; (2) a configuration identical to (1), but with assimilation of streamflow observations; (3) a configuration relying on the Canadian Land Surface Scheme (CLASS), calibrated to streamflow observations. The same routing scheme is used for all MESH model runs. Results show that while configuration (1) provides very good results at annual and longer time scales, better estimates of monthly runoff are obtained using configuration (3). This suggests that while the balance between precipitation and evaporation is adequate with ISBA, storage and release of water to the river network within the year is better handled by CLASS. An analysis of sensitivity to the partition of surface runoff and infiltration by ISBA is performed, in order to identify strategies for improving ISBA.
2D12.2 ID:6364 15:45Basin-scale evapotranspiration estimation based on physically-based Hydrologic-Land Surface Schemes Moges Mamo 1, Bruce Davison 2, Andrew Ireson 3, Muluneh Mekonnen 3, Alan Barr 4, Garth V. D. Kamp 4, Brenda Toth 4 1 GIWS, University of Saskatchewan, HAL, Environment Canada, 11 Innovation Blvd., Saskatoon, SK, Canad 2 HAL, Environment Canada, 11 Innovation Blvd., Saskatoon, SK, Canada, S7N 3H5 3 GIWS, University of Saskatchewan, 11 Innovation Blvd. Saskatoon, SK, Canada, S7N 3H5 4 NHRC, Environment Canada, 11 Innovation Blvd., Saskatoon, SK, Canada, S7N 3H5 Contact: [email protected]
Serving as a link between the land surface and the planetary boundary layer, evapotranspiration constitutes a key component of the water cycle and of atmospheric energy and moisture processes. Hence, accurate estimation of basin-scale evapotranspiration is crucial for hydrological models and for weather and climate models. An extensive set of meteorological, surface flux and hydrological data is available for the BERMS flux tower sites located within or near the White Gull Creek research basin in the southern boreal forest of Saskatchewan. The purpose of this work is to use the data collected at the BERMS sites to explore: 1) the performance and limitations of the MESH model (Environment Canada’s community hydrology-land surface modeling system) in simulating the surface and sub-surface processes in the White Gull Creek basin,

and 2) the model simulations of basin-scale evapotranspiration. The BERMS data were used to drive the MESH model and to estimate basin-scale evapotranspiration on two contrasting ecodistricts of the White Gull sub-basin. Streamflow records at the basin outlet are used to calibrate and validate the ecodistrict-based hydrologic and land surface parameters. Evapotranspiration simulated with the model agreed well with the evapotranspiration measured at the flux towers. The modeled evapotranspiration agreed well with the observed value. The minor deviation observed may be attributed to crude representation of baseflow within the current MESH model. This study shows that the MESH model, with ecodistrict based parameterization, is capable of producing acceptable basin-scale evapotranspiration estimates. The study also highlights the need for improved baseflow or groundwater model integration into the MESH modeling system.
2D12.3 ID:6778 15:45
Interflow - not again? Ric Soulis , James Craig , Bryan Tolson , Amin Haghnegahdar Civil and Environmental Engineering, University of Waterloo Contact: [email protected]
Lateral near-surface flow through weathered layers in the south and active layers in permafrost regions, requires that, to be complete a hydrologic model or a land surface scheme must have an interflow algorithm. Interflow is generally poorly parameterised in most models by a conceptual extension of a vertical drainage equation such as Campbell or Brooks-Corey. The equations are difficult to calibrate. It is possible to provide a consistent treatment of the problem with an analytic solution to Richards Equation but the implementation is cumbersome. This presentation will demonstrate a cleaner, easier approach: the modeled outflow from a sloping confined aquifer is shown to be well approximated by a power law expression of effective saturation. Four parameters are required that can all be predicted from SCS fractions and valley slope and length. These parameters are generally available in most models. An example using MESH code for the implementation will be presented.
POSTER - Air Quality Forecasting and Supporting Science / AFFICHE-

Prévision de la qualité de l'air et sa science
Room / Endroit (Regal Room), Chair / Président (Dave Henderson ), Date (28/05/2013), Time / Heure (15:45 - 17:00)
2D02.1 ID:6567 15:45
The Influence of Synoptic Weather Conditions on Extreme Ground-level Ozone Events in the Downtown Area of Two Ontario Cities: Toronto and Windsor Kinson Leung , William Gough University of Toronto: Department of Physical and Environmental Sciences Contact: [email protected]
In the Province of Ontario, the number of smog advisories has been slowly increasing since 2000. Ground-level ozone (O3) is perhaps the most familiar pollutant because it is associated with most smog alerts. Ozone data from 2000 to 2010 were examined in relation to the concurrent weather conditions/air masses of the Toronto and Windsor areas in order to determine whether the extreme ground-level ozone events were associated with specific weather conditions/air masses and to compare the results of the two cities. These results show that during the study period, for both cities, there was a total of more than 150 days (about 2 % of the total days) listed as days having an extreme ground-level ozone event with the O3 concentration ≥ 80 ppb, the current Ontario 1-hour Ambient Air Quality criterion for extreme ozone concentration. In addition, the weather condition/air mass mainly associated with these extreme ground-level ozone events was found to be Dry Tropical. As well, when the ozone-concentration thresholds were changed incrementally from ≥ 80 ppb to ≥ 20 ppb, the dominant weather condition/air mass for each threshold changes as well. For the two sites however, the Dry Moderate and the Dry Tropical were the two most dominant weather conditions among all the thresholds of O3 concentrations in the ten-year study period.
POSTER - Symposium on the Mathematics of Planet Earth / AFFICHE- Colloque sur les mathématiques de la planète Terre
Room / Endroit (Regal Room), Chair / Président (N. McFarlane ), Date (28/05/2013), Time / Heure (15:45 - 17:00)
2D30.1 ID:6834 15:45Randomness Characterization in Computing and Stochastic Simulations
Rod Blais Geomatics Engineering, University of Calgary Contact: [email protected]
Mathematical randomness has long been studied and in computing, various simulation approaches have been investigated and implemented in all kinds of stochastic computations. Following a brief overview of pseudo, chaotic and quasi-random number generation, some equi-distributed and low discrepancy sequences will be discussed in view of their well-known applications in Monte Carlo simulations of volume integrals. In particular, the numerical representation of irrationals such as π and e will be discussed along with some of their spectral and other characteristics used in stochastic simulations. Some sample planar, spherical and spatial computations will illustrate the potential for applications in practice with indications of the computational efforts required.
2D30.2 ID:6610 15:45Stochastic averaging of heavy tailed processes. William Thompson , Rachel Kuske University of British Columbia Contact: [email protected]
Gaussian noise has long been the favoured choice for modelling stochastic effects in almost every every of science, including climate dynamics due to analytic tractability and the attractor property of the Gaussian distribution. There are many reasons however to consider that Gaussian noise is not appropriate for modelling several climate phenomena as many processes are subject to extreme events or may have otherwise heavy tailed forcing. This is particularly evident on paleoclimatic time scales, such as the Greenland ice cores. Stochastic averaging offers a way to derive relatively simple phenomenological models for complicated climate processes by reducing dimensionality. I will present some work on stochastic averaging for heavy-tailed processes that may be useful to climate researchers wishing to derive simplier dynamical models for systems displaying heavy tailed forcing.
POSTER - Coastal Oceanography and Inland Waters / AFFICHE-
Océanographie côtière et eaux intérieures
Room / Endroit (Regal Room), Chair / Président (Guoqi Han ), Date (28/05/2013), Time / Heure (15:45 - 17:00)
2D11.1 ID:6718 15:45
Retrieval of the spectral diffuse attenuation coefficient Kd(λ) in optically complex coastal ocean waters using a neural network inversion Cédric Jamet Laboratoire d'Océanologie et de Géosciences Contact: [email protected]
The fine-scale study of the diffuse attenuation coefficient, Kd(lambda), of the spectral solar downward irradiance is only feasible by ocean color remote sensing. Several empirical and semi-analytical methods were developed for the past three decennies. However, most of these models are generally applicable for clear open ocean waters. They show limitations when applied to coastal waters. A new empirical method based on neural networks (NN) was developed using a relationship between the remote-sensing reflectances between 412 and 670 nm and Kd. The calibration of the new NN inversion was done using synthetical and in-situ datasets. An NN method was developed for the SeaWiFS, MODIS and MERIS sensors. Validation using independant in-situ datasets in European, Western Canada and Amazon coastal waters show similar retrievals accuracies for low values of Kd(λ) (i.e. <0.20 m-1) and better estimates for greater values of Kd(λ). The new model is suitable for open water but also for turbid waters and does not show the limitations of the empirical and semi-analytical method. Applications to the Straight of Georgia, BC and the Amazon will be presented.
2D11.2 ID:6397 15:45
Freshwater forcing and oceanographic dynamics of Lake Melville, LabradorZhaoshi Lu 1, Brad Deyoung 1, Entcho Demirov 1, Trevor Bel 2, Tom Sheldon 3, Elsie Sunderland 4 1 Department of Physics and Physical Oceanography, Memorial University 2 Department of Geography, Memorial University 3 Nunatsiavut Government, Nain, NL, Canada 4 Department of Environmental Health, Harvard School of Public Health Contact: [email protected]
Lake Melville is large and complex sub-Arctic fjord which serves as a major outlet for freshwater on the Labrador coast. Lake Melville has a depth of over 200 m and extends 126 km to the Narrows; a 22 km shallow ( 30m) channel connecting
the fjord to Groswater Bay. Circulation of the fjord depends on topography, fresh water discharge, wind, tide and exchange with the Labrador Sea. The freshwater discharge has been strongly modified by massive hydroelectric power development in the past fifty years. The goal of the study project is to study (assess) the anthropogenically driven changes in the lake dynamics, their interaction with the effects of the climate change on the circulation and possible impacts on community health. We are seeking to understand the role of tidally driven currents and estuarine circulation on water dynamics, sea-ice, mixing and tracers transport in the lake and to determine how they were influenced by the changing climatic and freshwater conditions. We review both historical and more recent measurements that have been made in the fjord. A high resolution ocean model is used to interpret observed distribution of lake characteristics and to assess the impact of fresh water discharge variability on the lake dynamics. We plan to extend these results and to apply them in a broader study on mercury cycling in the lake. The poster will present preliminary results from observations and model simulations in the lake. The estuarine circulation is strong, with mean surface flows of almost one knot. The presence of a sill prevents free exchange between the waters in the deep part of the fjord and the region outside, and flushing time of Lake Melville is very long, ranging from 3.6 to 5.8 months. Characterization of the deep-water exchange dynamics indicates that regular exchange is quite regular, at least annual.
POSTER - Lithospheric structure of North America / AFFICHE- Structure lithosphérique de l'Amérique du nord
Room / Endroit (Regal Room), Chair / Président (Fiona Darbyshire ), Date (28/05/2013), Time / Heure (15:45 - 17:00)
2D20.1 ID:6379 15:45
Seismic anisotropy beneath southeastern Canada
Fiona Darbyshire , Alexia Calvel GEOTOP UQÀM-McGill Contact: [email protected]
In 2013 the EarthScope Transportable Array (TA) will arrive in the eastern US and southeastern Canada, paving the way for detailed studies of crust and upper mantle structure, including mantle anisotropy. In anticipation of the wealth of information afforded by the presence of the TA, we are measuring mantle anisotropy at a number of existing broadband seismograph stations in eastern

Canada. The study region spans an area from easternmost Ontario to northern Nova Scotia, sampling both Precambrian (Grenville Province) and Phanerozoic (Appalachian) terranes. Some of these regions will be sampled in more detail by the TA, others such as New Brunswick and Nova Scotia are outside the geographical limits of the array and thus represent important constraints on mantle dynamics at the edge of the continent. We use SKS splitting analysis to infer the fast-polarisation direction of mantle anisotropy and amount of anisotropy (via splitting times), and compare the results to those already published in eastern North America. For stations with a sufficiently long recording time, variations in splitting parameters with back-azimuth are used to infer whether multiple layers of anisotropy are present beneath the region.
2D20.2 ID:6521 15:45
Project NA13: towards an updated tomographic model of the Canadian lithosphere Alexey Bryksin 1, Andrew Frederiksen 1, Taras Zaporozan 1, Fiona Darbyshire 2, David Snyder 3, Suzan Van Der Lee 4 1 University of Manitoba 2 Université du Québec à Montréal 3 Geological Survey of Canada 4 Northwestern University Contact: [email protected]
Large-scale lithospheric structure in continental regions is dominated by the deep roots of Precambrian terranes, and records evidence of past tectonic activity; an understanding of the lithosphere is thus helpful in tectonic reconstructions that assist in targeting mineral exploration. More directly, Precambrian continental roots contain the conditions necessary for diamond formation. We are in the progress of developing an improved continental-scale image of the lithosphere using surface waves from distant earthquakes. Existing continental-scale models are primarily based on single-station analyses, which provide constraints on individual event-station paths and so are limited by the available seismicity in the study area; as much of Canada is essentially aseismic, such models have had limited resolution. Instead, we employ two-station measurement, in which seismograms from global earthquakes are compared between pairs of instruments; phase changes in the seismogram record structure along the path between the two stations and cancel out the contribution of the earthquake itself. We have developed a software suite that allows for efficient two-station phase velocity analysis, and will present preliminary results showing differing surface-wave dispersion responses between tectonic environments. These measurements will ultimately be incorporated into continental-scale dispersion maps and three-dimensional models of mantle structure.

POSTER - Emerging technologies and concepts in rock physics / AFFICHE- Concepts et technologies émergentes en physique
Room / Endroit (Regal Room), Chair / Président (Claire Samson ), Date (28/05/2013), Time / Heure (15:45 - 17:00)
2D13.1 ID:6886 15:45Velocity Dispersion Measurements in Quartzites with Low-Aspect Ratio Cracks Heather Schijns 1, Ian Jackson 2, Douglas Schmitt 1 1 University of Alberta 2 Australian National University Contact: [email protected]
Oscillating stress induced by seismic waves is expected to cause reversible fluid flow within low aspect ratio cracks, resulting in strongly frequency dependent seismic wave velocities. At high frequencies fluids do not have sufficient time to flow out of the cracks and therefore contribute additional stiffness to the frame of the rock, resulting in higher seismic velocities. At lower frequencies the pore pressure in the cracks will equilibrate or flow out of the cracks altogether, causing crack closure and lower seismic velocities. Laboratory measurements of seismic velocities typically made at MHz frequencies, well logging undertaken at kHz frequencies, in-situ exploration seismic (10-300 Hz) and teleseismic (<1 Hz) measurements are unlikely to be directly comparable as a result of this fluid flow effect, with high frequency laboratory measurements systematically overestimating in-situ seismic velocities. Numerous theoretical models exist; however, the experimental measurements necessary to constrain these are sparse due to the difficulty of making low frequency measurements in the laboratory. Here, low frequency measurements are made using torsional and flexural forced oscillation. A preliminary comparison of ultrasonic (MHz) measurements with measurements made from 0.01-1 Hz is made on two cracked quartzite samples to experimentally quantify their dispersion. The quartzite samples are measured dry, argon saturated and water saturated over effective pressures of 10-150 MPa. Progressive crack closure is observed from ~10-100 MPa and significant dispersion is observed in the shear and Young’s moduli of the water saturated samples.
2D13.2 ID:6754 15:45
Seismic modeling of massive sulphide deposits using a comprehensive

rock physics database
Laura Quigley University of Toronto Contact: [email protected]
In this study we investigated the feasibility of high resolution seismic methods to accurately image shallow Zn-Pb massive sulphide deposits using a petrophysical database and a finite difference (FD) elastic wave field code. Accurate seismic modeling is largely dependent on using realistic rock physics parameters, such as compressional wave velocity (Vp), shear wave velocity (Vs) and density (ρ). We simulated seismic data for two different geological models, a shale-hosted deposit overlain by barite, and a carbonate hosted deposit, using 2D geological rock physics models. Using logged borehole data from locations that host this type of mineralization, we were able to build a rock physics database including elastic parameters for the various lithologies in our models. An elastic finite difference code was used to generate synthetic seismic data through our geologic models. This code required each rock unit in our models had a single value for ρ, Vp and Vs. We calculated an average value for each lithology from our rock physics database, obtained through statistical analysis of logged borehole data. To get a complete picture of the wavefield response from the massive sulphides, the elastic finite difference code was essential. The synthetic seismic data was used to test processing and acquisition parameters for imaging shallow targets. Our synthetic seismic data showed that the source generated noise (surface and direct wave) interfere with the shallow reflected energy from the target and is the primary challenge in seismic processing.
2D13.3 ID:6375 15:45
Targeting VMS Ore Lenses using Vertical Seismic Profiling, Flin Flon Manitoba Dave Melanson 1, Don White 2, Claire Samson 1, Gilles Bellefleur 2 1 Carleton University 2 Natural Resources Canada Contact: [email protected]
Between October 12th and 18th, 2006, VSP data were acquired from 3 boreholes in Flin Flon, Manitoba: 4Q66W3, FFM001 and FFS039, as part of the Targeted Geoscience Initiative (TGI-3). The Flin Flon belt is richly endowed with VMS deposits including the 85.5 Mt Flin Flon-Callinan-777 pyrrhotite and sphalerite-rich ore system. Surface 2D and 3D seismic data were also acquired as part of this project. VSP is a downhole seismic technique, whereby a string of geophones is clamped in a borehole to record seismic energy originating from various locations at the surface. For this survey, a Vibrometric 8-level geophone tool was deployed in three deviated boreholes in multiple survey configurations using dynamite and Vibroseis sources. This comprised near and far source offsets as well as a Vibroseis walkaway (4Q66W3 only). Downhole receivers were spaced every 5 m and measured seismic waves on three orthogonal

geophones. Preliminary processing of the zero-offset dynamite VSP data from 4Q66W3 included bandpass and notch filtering to remove electrical and background noise. This step has revealed reflections potentially resulting from the lithology, shallow-dipping faults or contacts with nearby ore lenses. Some ore lenses of the Callinan and 777 mines near 4Q66W3 have been completely removed. However, the morphology of the lens is preserved and the backfilled low-density material provides a contrast in seismic impedance strong enough to produce a reflection. Further processing will refine the previously-mentioned filters, rotate each component and remove the down-going waves, enhancing the reflections. Comparisons of all data for each borehole will aid interpretation, since multiple sources and offsets were used. Finite difference synthetic shot gathers, generated using a borehole-based 3D geological model, will be compared with the field VSP data sets to determine the origins of the reflections.
POSTER - Seismic Hazard Maps for Building Code Use / AFFICHE- Cartes des hasards sismiques pour code du batiment
Room / Endroit (Regal Room), Chair / Président (Samuel Butler and Garry Rogers ), Date (28/05/2013), Time / Heure (15:45 - 17:00)
2D27.1 ID:6757 15:45The October 27, 2012 magnitude 7.7 Haida Gwaii earthquake and tsunami
Garry Rogers , Jan Bednarski , Alison Bird , Camille Brillon , John Cassidy , Herb Dragert, , Roy Hyndman , Tom James , Honn Kao Lucinda Leonard , Taimi Mulder Lisa Nykolaishen , Michael Riedel Andreas Rosenberger , Michael Schmidt Kelin Wang Geological Survey of Canada Contact: [email protected]
Additional authors: Michael Riedel, Andreas Rosenberger, Michael Schmidt and Kelin Wang At 20:04 on the evening of October 27, 2012, (3:04 UT October 28) the second largest instrumentally recorded earthquake in Canada rocked Haida Gwaii and the north central coast of British Columbia. The magnitude 7.7 event occurred off the west coast of Moresby Island in Haida Gwaii in a region where the Pacific and North American plates converge at an extremely oblique angle with a history

of producing both strike-slip and thrust earthquakes. Here the relative plate motion is partitioned on a shallowly dipping thrust fault and steeply dipping strike-slip fault. The earthquake appears to have ruptured the shallow part of the thrust fault underlying the small tectonic sliver called the Queen Charlotte Terrace bounded by these two faults. There is no evidence that the strike-slip fault was involved in the rupture. The Haida Gwaii earthquake was felt up to a distance of 1500 km. Almost no damage was caused as the region adjacent to the earthquake is a national park reserve and uninhabited. The closest strong motion seismograph, about 50 km from the rupture zone, recorded a peak acceleration of 0.2 g, about 30 s of strong shaking, and about 90 s of perceptible shaking. The earthquake generated a tsunami with local run-up of over 5 m in some inlets, documented by a post event survey along the west coast of Haida Gwaii, and up to 0.8 m recorded on tide gauges 4000 km away in Hawaii. Seven temporary land based seismographs deployed to augment the permanent Canadian National Seismograph Network and 14 ocean bottom seismographs deployed on top of the offshore rupture define a zone of aftershocks that is about 50 km wide and stretches about 100 km along the margin. GPS campaign sites document co-seismic displacements of up to 1.2 m, largely perpendicular to the margin.
2D27.2 ID:6881 15:45
Correlation between static stress changes imparted by 1663 earthquake and current seismicity in Charlevoix Seismic Zone Azadeh Fereidoni , Gail Atkinson Western University Contact: [email protected]
In low to moderate seismicity regions, such as eastern Canada, characterization of seismicity plays a crucial role in evaluation of seismic hazard. The Charlevoix Seismic Zone (CSZ) is the most seismically active region in eastern Canada and has experienced several large historic events (1663 Mw7.0, 1791 Mw5.5, 1860 Mw6.1, 1870 Mw6.6, 1925 Mw6.4) as well as continuous low-level of activity. It is widely discussed that the seismic activity in the CSZ represents the long aftershock sequence of the 1663 earthquake, which may persist for hundreds of years. To determine whether the current seismicity continues to be affected by the 1663 event, we investigated the correlation between active zones in the region and the static stress changes imparted by the 1663 earthquake. We calculated the Coulomb stress changes for two types of receiver faults: the mainshock and the focal mechanism of recent moderate earthquakes. The results show that the localization of low-level seismicity in the region correlates with the positive stress change regions, suggesting that the current microseismicity in the CSZ may be affected by 1663 earthquake. However, no clear correlation is recognizable for large earthquakes that localize at the perimeter of the microseismicity zone. The static stress changes calculated for the recent focal mechanisms also supports the results from the mainshock type receiver fault. Additionally, the stress changes produced by the 1663 earthquake is consistent with other features of seismicity in the region and may provide a
way to explain the complex seismicity patterns observed in the Charlevoix Seismic Zone.
POSTER - Climate change and water resources / AFFICHE- Changement climatique et ressources hydrauliques
Room / Endroit (Regal Room), Chair / Président (Howard Wheater ), Date (28/05/2013), Time / Heure (15:45 - 17:00)
2D10.1 ID:6503 15:45The Impact of Climate Change and Forest Management on the Hydrometeorology of Marmot Creek Research Basin Phillip Harder , John Pomeroy , Cherie Westbrook University of Saskatchewan Contact: [email protected]
The unique streamflow, groundwater level, snow accumulation, precipitation and temperature dataset spanning 1963-2012 from multiple elevations in the Marmot Creek Research Basin (MCRB), Alberta, Canada was examined for trends. Significant trends over time were identified for air temperature (annual minimum has increased 0.6°C to 1.8°C), low elevation peak snow accumulation (-55%), water table levels annual minimum -1.84 m to +2.14 m) and seasonal streamflow (-24%). No significant trends were identified in precipitation. These observations can be distinguished by elevation, which is unique in Canada and exceedingly rare in North America. The hydrometeorology at lower elevations (<1900m) is changing more rapidly than the upper elevations (>1900m) where few trends are observed or, in the case of water table trends, reverse direction. MCRB land cover was significantly altered through forest harvesting experiments (1962-1986) to increase water yield. Reanalysis of the streamflow response to forest management for this period shows that there were no significant changes to runoff though the land cover change may explain increased high elevation water table trends. The changes observed in MCRB hydrometeorology are primarily due to climate trends as the influences of land use change, and teleconnection forcings are not significant.
2D10.2 ID:6594 15:45
Lake water level and area changes in the Qinghai-Tibet Plateau in recent years Xiaodong Li 1, Daqing Yang 1, Xulin Guo 2 1 National Hydrology Research Center, Environment Canada 2 Department of Geography & Planning, University of Saskatchewan Contact: [email protected]
Lakes play an important role in regional climate, hydrology, ecology, and environment, especially in the arid/semi-arid Qinghai-Tibet Plateau. In recent years, many lakes over the plateau regions are undergoing rapid changes due to impact of climatic change and human activities. These changes greatly affect water resources and lead to the consequential impact on regional ecological environment. Examination and determination of the causes and consequences of the Qinghai Lake changes is the precondition of solutions for protection and restoration, which is one of the main challenges in present situation. The objectives of this study are to investigate 1) regional climatic change, 2) lake water level change, and 3) lake area variation via remote sensing approaches for the dry season (April) and wet season (September). The data used in the study include the MODIS satellite imagery between April and September from 2001 to 2011, and hydrological data and meteorological data collected from 1961 to 2011. Results of data analyses indicate that air temperature has a significantly warming trend over the past 51 years, with an increase rate of 0.036 ℃ per year, and annual precipitation showed an increasing tendency in fluctuation. However, it increased sharply from 2000 to 2011. The water level of the Qinghai Lake showed a continued declining trend over the past 51 years, but the change is dramatic in the last 11 years (2001-2011). Lake area clearly increases along with the rising of water level in the Qinghai Lake. Lake areas were maximum in 2011 and the minimum in 2002. Lake area was significantly correlated with water level; the correlation coefficients are 0.746 (P<0.01) and 0.885 (P<0.01) in April and September. As a conclusion, the water level has a rising trend and the lake area is expanding especially for the last 11 years because of the warmer-wetter climate/weather conditions.
2D10.3 ID:6270 15:45
Impact of Climate Change on Stream Water Temperature Nassir El-Jabi 1, Daniel Caissie 2, Noyan Turkkan 1 1 Professor 2 Hydrologist Contact: [email protected]
Stream water temperature is a very important parameter when assessing aquatic ecosystem dynamics. For instance, cold-water fishes such as salmon can be adversely affected by maximum summer temperatures or by those exaggerated by land-use activities such as deforestation. The present study deals with the modelling of stream water temperatures under climate change scenarios by means of polynomial neural networks (PNN) to relate air and water temperatures

in Little SW Miramichi (LSWM), a river in New Brunswick. Future climate data were extracted from the Canadian Coupled General Climate Model (CGCM 3.1/T63) under the greenhouse emission scenarios B1 and A2 defined by the Intergovernmental Panel on Climate Change (IPCC). The climate air temperatures were downscaled using delta change approach. The study predicts an increase in stream water temperature of between 2.1 ºC to 3.7 ºC, at the end of this century.
POSTER - Geophysical High Pressure Research with Synchrotron Radiation / AFFICHE- Haute pression et synchrotron
Room / Endroit (Regal Room), Chair / Président (Hans J. Mueller ), Date (28/05/2013), Time / Heure (15:45 - 17:00)
2D17.1 ID:6506 15:45Large Volume High Pressure Facilities at Western Rick Secco , Wenjun Yong , Soushyant Kiarasi , Innocent Ezenwa (Presented by Dr. Rick Secco ) Univ. Western Ontario Contact: [email protected]
High pressure geophysical research began at Western more than four decades ago. Two large volume cubic anvil presses of H.T. Hall design, 1000 ton and 200 ton, were the mainstay for high pressure and temperature mineral physics studies at P,T conditions up to 7GPa and 2000C until 1995. Major repairs of the 1000 ton press in 1995 and the 200 ton press in 2012 have revitalized them. Two additional presses of the “multi-anvil” design have been added. A 500 ton re-purposed piston-cylinder press was added in the mid 1990’s and employs a Walker–module with limits of pressure of 18GPa and temperatures of 2300C. Last year, a 3000 ton large volume press using a module with 32mm tungsten carbide cubes was installed and commissioned at Western. Calibration of the press is on-going and two octahedral cell sizes of 11mm and 8mm are currently in use. The 11 mm cell is capable of simultaneous P and T of 10 GPa and at least 2000C. An overview of the capabilities of these presses, via examples of studies carried out using them, will be presented.
2D17.2 ID:6920 15:45

Gahnite under high pressure: A combined XRD and Brillouin study Michael Wehber 1, Frank R. Schilling 1, Christian Lathe 2, Hans J. Reichmann 2, Sergio Speziale 2, Hans J. Mueller 2 1 KIT 2 GFZ Contact: [email protected]
We have investigated a natural gahnite of formula by X-ray diffraction (XRD) in the large volume press up to 16 GPa and by Brillouin scattering up to 21.4 GPa in the diamond anvil cell. The parameters of the isothermal P – V equation, determined by fitting a third-order Birch-Murnaghan equation of state (B-M EoS) to the XRD experimental results, are KT0 = 204(2) GPa and (K/P)T0 = 4.9(2), where the numbers in parentheses are 1 uncertainties on the last digit. The single-crystal elastic constants, the aggregate moduli and their isothermal pressure dependences, determined by Brillouin scattering are: C11 = 286(1) GPa, C12 = 172(1) GPa, C44 = 140(1) GPa, KS0 = 208(1) GPa, G0 = 95(1), (C11/P)T0 = 5.2(2), (C12/P)T0 = 3.9(1), (C44/P)T0 = 0.5(1), (K/P)S0 = 4.5(1), (G/P)0 = 0.9(1). The results obtained with the two techniques are excellent agreement with each other. Our high pressure results do not confirm the large pressure derivative of the bulk modulus reported by a previous high-pressure x-ray diffraction study of synthetic ZnAl2O4. In disagreement with previous high-pressure results from GHz ultrasonic interferometry, we predict a softening of C44 starting above 30(4) GPa and mechanical instability above 100(10) GPa. The instability is probably not connected to a first order phase transition to CaFe2O4 type structure predicted at 38.5 GPa by previous computational studies.
POSTER - CANCID- Agricultural Drought and Flooding / AFFICHE- Sècheresses et inondations en milieu agricole
Room / Endroit (Regal Room), Chair / Président (Abdel-Zaher Kamal Abdel-Razek ), Date (28/05/2013), Time / Heure (15:45 - 17:00)
2D06.1 ID:6837 15:45
Feasibility of integrated surface water management on agricultural land in Manitoba Kyle Swystun , Xi Chen , Hank Venema

International Institute for Sustainable Development Contact: [email protected]
The potential to store seasonal water surplus and harvest macrophytes (eg. Typha) on agricultural land in Manitoba was examined. A simple cattail growth model and a two- dimensional hydrologic model were developed in MATLAB and used to simulate cattail growth and water balance during a 90 day period for three physiographically distinct sites. Input data included widely available meteorological data that can be obtained online for most locations. Model simulations were performed under four different climatological scenarios (dry-hot, dry-cold, wet-hot, and wet-cold) for hypothetically constructed storage reservoirs identified from topographical analyses of LiDAR data. Private and public benefits from stored water, harvested cattail biomass, and phosphorus removal were calculated for each site. Results indicate private benefits from harvested cattail biomass ranging from $50 to $600 ha-1 and public benefits from seasonal water surplus storage and phosphorus removal ranging from $250 to $3000 ha-1. The paucity of LiDAR data eliminates the possibility of performing similar simulations throughout much of Manitoba. However, the storage simulation model can be modified to explore three scenarios of interest: 1) backflooding, 2) using modified ditches, and 3) creating small reservoirs. The biomass production model can also be modified to simulate growth of other macrophytes.
POSTER - CANCID- Irrigation and Drainage / AFFICHE- Irrigation et drainage
Room / Endroit (Regal Room), Chair / Président (Abdel-Zaher Kamal Abdel-Razek ), Date (28/05/2013), Time / Heure (15:45 - 17:00)
2D07.1 ID:6697 15:45Modeling Actual Evapotranspiration from an Irrigated Wheat Field J. Ferdous , W. Helgason (Presented by Jannatul Ferdous ) Department of Chemical and Biological Engineering, University of Saskatchewan Contact: [email protected]
Accurate assessment of crop evapotranspiration (ET) is critical for agricultural water management. The reference ET method is used for irrigated conditions, in which the Penman-Monteith equation is applied to a hypothetical grass reference surface with fixed resistance parameters, and a crop coefficient is used to relate the actual crop evapotranspiration to the reference evapotranspiration. However,

this approach does not offer sufficient detail for investigating local crop water use efficiencies. A study was conducted to examine the evaporative fluxes from two adjacent hard red spring wheat fields located south of Saskatoon, Saskatchewan; one of which was irrigated while the other was not. The eddy covariance technique was employed in each field to measure the latent heat flux which was used to parameterize the local aerodynamic and surface resistances for use in the Penman-Monteith equation. Using the locally parameterized models, the effect of irrigation-related microclimate modification was investigated and compared to non-modified climate in the dryland field. Due to this modification, a small suppression in the transpiration rate of the irrigated crop was observed during and following an irrigation event. This study is an initial step towards understanding how irrigation management practices can affect the overall water use efficiency. Key Words: Evapotranspiration, Penman-Monteith, eddy covariance, irrigation, microclimatic modification
POSTER - General Hydrology 2 / AFFICHE- Hydrologie en général 2
Room / Endroit (Regal Room), Chair / Président (Sean Carey ), Date (28/05/2013), Time / Heure (15:45 - 17:00)
2D16.1 ID:6714 15:45Terrestrial diatoms as tracers of hydrological connectivity: implications of their resilience to rainfall disturbance
Anna Coles 1, Carlos Wetzel 2, Núria Martínez-Carreras 2, Luc Ector 2, Jay Frentress 3, Lucien Hoffmann 2, Jeff Mcdonnell 4, Laurent Pfister 2 1 Centre de Recherche Public – Gabriel Lippmann / Global Institute for Water Security 2 Centre de Recherche Public – Gabriel Lippmann 3 Centre de Recherche Public – Gabriel Lippmann / Oregon State University 4 Global Institute for Water Security Contact: [email protected]
In catchment hydrology, the further progress of established tracers (geochemical and isotopic) of water flow pathways in the hillslope-riparian-stream (HRS) system is impeded by various limitations such as unstable end-member solutions and temporally varying input concentrations. In response to this, a novel approach using terrestrial diatoms (unicellular, eukaryotic algae that are ubiquitous in aquatic ecosystems) as biological tracers of hydrological connectivity has improved our understanding of catchment processes. At the same time, the approach has shed light on terrestrial diatom ecology – an under-
researched area – including their taxonomy, assemblage, distribution and resilience to disturbance. The latter is particularly critical to their advancement as a hydrological tracer method, since population depletion during rainfall events might decrease their utility as connectivity tracers. To assess terrestrial diatom resilience to disturbance, we simulated a heavy rainfall event (with a 10 year return period) on hillslope and riparian soil plots in a small, forested catchment in Luxembourg. We periodically extracted soil surface samples and overland flow samples for diatom population size and species assemblage analyses. Using new methods that we developed for quantifying population size, we found a pre-disturbance population size of c. 96,000 diatoms per cm2 in the riparian zone, which depleted by 72% following the simulated rainfall event. The diatom assemblage was characteristic of a frequently-disturbed environment. Overall, we showed that although diatoms are not conservative tracers of flow pathways, the riparian zone diatom population is unlikely to be exhausted as a result of rainfall with return periods equal to or less than 10 years. Diatoms remain a valuable tool for indicating the onset/cessation of surface runoff connectivity within the HRS system. We suggest that this biological tracer would be transferrable to and valuable in a Canadian prairie and mountain hydrological setting.
2D16.2 ID:6790 15:45
Water Survey of Canada’s experiences to date using acoustic Doppler current profilers for determination of discharge under ice cover. Paul Campbell , Elizabeth Jamieson Environment Canada Contact: [email protected]
Acoustic Doppler current profilers (ADCPs) have been routinely used by the Water Survey of Canada to determine river discharge in open water conditions but they have not been used operationally for discharge measurements under ice cover. Advances in mid-section method software for hydro-acoustics along with decreasing ADCP physical dimensions and auto-adapting water tracking modes have made ADCPs a viable alternative to mechanical Price AA current meters for winter discharge measurements. Some advantages in the use of ADCPs for conducting winter discharge measurements include accounting for oblique flow angles under ice and sampling of water velocities at multiple depths thereby reducing dependency on assumptions about the velocity profile. These advantages of using hydroacoustics under ice conditions are only realized when proper instrument orientation or compass calibration is achieved and a suitable portion of the velocity profile is captured requiring suitable mounting hardware and proper selection of ADCP model for the effective depths expected. Results of Water Survey of Canada inter-instrument comparison measurements to date have been encouraging and with developments in improved mounting hardware, standard operating procedures and operator training, it is expected that use of ADCPs for under ice cover measurements will soon become a viable tool for operational use. Points of improvement for the mid-section software and

remaining gaps in comparison measurements are identified.
2D16.3 ID:6726 15:45
Automated Hydrological Response Unit creation for use with the Cold Regions Hydrological Model Christopher Marsh , John Pomeroy Centre for Hydrology, University of Saskatchewan Contact: [email protected]
The Cold Regions Hydrological Modelling Platform (CRHM) provides a modular framework to assemble hydrological models. Within this framework, modules conceptualize hydrological processes to varying degrees of physical complexity. A selection of these modules can be linked together, as appropriate, to create a hydrological model tailored to a basin or hydrological phenomenon in question. The spatial structure of CRHM is conceptualized by Hydrological Response Units (HRU). This semi-distributed approach assumes that a basin can be subdivided into spatial units that can each be characterised by a unique set of parameters describing topography, vegetation, soils, micrometeorology, hydraulic, drainage, and aerodynamic conditions. HRUs can therefore be delineated based on a combination of elevation, vegetation type, slope, aspect, soil type, fetch, and precipitation. The number and complexity of a HRU depends on the complexity of the model created with CRHM, the reliability and availability of information and the understanding of the spatial variability of parameters within the basin. Previously, CRHM HRUs were created using a variety of programs with many manual and subjective steps. There were no rigorous and repeatable scripts or programs that could reproduce the HRU classification limiting reproducibility. As well, as information about a basin changes, recreating these HRUs to account for new knowledge becomes time- consuming and potentially error prone. To address these issues an open source Python application, CRHM-tools, was developed to allow for the automated and systematic creation of basin relationships for input to CRHM. A modular tool system was implemented allowing for terrain-based calculations, such as slope, aspect, and fetch, or statistical classification such as histogram binning. Manual classification is also possible, allowing for a user to fine-tune the results. HRUs are thus parameterized in a systematic fashion decreasing subjectivity and errors, as well as facilitating faster model creation.
2D16.4 ID:6812 15:45
Standardized methodology for flood risk assessment
Miroslav Nastev Commission géologique du Canada Contact: [email protected]
While Canada is exposed to a variety of natural hazards, most risk and

emergency managers presently lack the necessary tools and guidance to adequately undertake rigorous risk assessments. Recently, Natural Resources Canada - NRCan has adopted Hazus, a standardized methodology for estimating potential losses from natural hazards developed by the U.S. Federal Emergency Management Agency – FEMA, as one of the best practice methods for risk assessment. Hazus estimates losses from earthquakes, floods, and hurricanes, and includes an essential hazard and inventory database needed to conduct baseline risk assessment studies. An agreement has been signed with FEMA to adapt and co-develop a harmonized North American version of the Hazus methodology. At the same time, collaboration has been initiated within the federal government between the departments of Natural Resources, Environment, Defence and Public Safety to promote widespread usage of Hazus among the full range of Canadian decision makers. This technical note reports the typical features of the Canadian version of the Hazus Flood model and resumes ongoing activities and potential challenges in implementing this model in Canada.
2D16.5 ID:6369 15:45
The impact of surface mining on runoff timing and flow pathways, Elk Valley, British Columbia Nadine Shatilla , Sean Carey McMaster University Contact: [email protected]
Surface mining is a common method of accessing coal. In high-elevation environments, vegetation and soils are typically removed prior to the blasting of overburden rock thereby allowing access to mineable ore. The removed waste rock is deposited in adjacent valleys where it may bury existing streams. Previous research, predominantly in Appalachia, has focused on downstream water quality impacts with less focus on how streamflow response and flow pathways are altered by surface mining. This study reports on how surface mining affects streamflow hydrological and chemical responses at the headwater catchment scale in the Elk Valley, British Columbia. A paired catchment approach was utilized between May and October 2012, where a reference catchment (Dry Creek – DC) was compared to an impacted catchment (West Line Creek – WLC), whose area is ~30% covered by deposited waste rock. Hydrometrically, WLC had considerably lower flows and exhibited a damped, slower response to precipitation events than DC. Dissolved ions were an order of magnitude greater in WLC, with conductivity (SpC) ranging from 400 μS/cm at high flow to 1300 μS/cm at low flow. A strong hysteretic pattern was observed between SpC and flow and with specific ions at WLC, suggesting dilution or changing flowpaths as the season progressed. In contrast, patterns of SpC and flow at DC did not exhibit hysteresis. Major ion hydrochemistry at WLC shows dilution affecting ion concentrations whereas results at DC are consistent with chemostatic behavior. Stable isotopes were more depleted at DC compared with WLC, suggesting different sources and timing of water contributing to streamflow. Future research will work towards a conceptual model of surface mining impacts
on catchment scale processes in montane environments through increased understanding of residence time and flowpath distributions at a number of impacted and reference catchments.
2D16.6 ID:6676 15:45
Assessing the ability of surface infrared imagery to indicate subsurface processes, an investigation of mixing and connectivity in a small, forested catchment (Luxembourg). Jay Frentress 1, Núria Martínez-Carreras 2, Laurent Pfister 2, Jeff Mcdonnell 3 1 Centre de Recherche Public - Gabriel Lippmann / Oregon State University 2 Centre de Recherche Public - Gabriel Lippmann 3 Global Institute for Water Security, University of Saskatchewan Contact: [email protected]
Simple mixing models are often used to divide the storm hydrograph into hydrologic source components by differentiating stored and event water in stream discharge. However, such models suffer from invalid assumptions regarding mixing and endmember stability, resulting in greater model uncertainty. In particular, the extent of mixing between surface and sub-surface sources remains unknown. We combined infrared thermography, isotopic geochemistry and hydrometric observations in the near-stream, saturated zone to investigate mixing between rainfall, hillslope and groundwater. Infrared imagery was captured in a near-stream, saturated zone of the 50 ha Weierbach catchment (Luxembourg), while multi-level piezometers were used to determine hydraulic head throughout rainfall events. The saturated area, piezometers, and stream channel were sampled at regular intervals for isotopic and geochemical analyses. Previous work has indicated that infrared imagery can quickly quantify saturation extent as well as infer water source - groundwater seeps were readily identifiable using IR and differed from stream channel temperatures by 3-5 ˚C. This current work extends those observations and investigates the dominant controls on mixing in the saturated zone by directly correlating spatial temperature patterns to hydraulic head gradients and geochemistry within the surface and subsurface constituents of the near-stream saturated zone. Preliminary results suggest that the surface saturation reflects a shifting combination of exfiltrating groundwater, intermittently connected hillslope water and rainfall components whose mixing are mediated by microtopography and hydraulic head gradients within the saturated area itself.
2013-05-29
Plenary Day 3 / Plénière Jour 3

Room / Endroit (TCUP Theatre), Chair / Président (Gail Atkinson and Bob Halliday ), Date (29/05/2013), Time / Heure (08:30 - 10:00)
P3.1 ID:6909 INVITED/INVITÉ 08:30Earthquake and tsunami hazards on Canada’s west coast
Garry Rogers Geological Service of Canada Contact: [email protected]
The west coast of Canada is defined by active plate boundaries and has a significant seismic and tsunami hazard. A reminder of this was the M 7.7 October 27, 2012 earthquake off Haida Gwaii that caused very strong shaking over 150 km of coastline and a tsunami of up to 4 m at some locations. Fortunately that coast is a national park reserve and uninhabited. There is very oblique convergence of the Pacific and North American plates in the region of Haida Gwaii resulting in large strike-slip and large thrust earthquakes. The subduction of oceanic plates beneath Vancouver Island has caused major earthquakes within the Earth’s crust, deeper earthquakes within the subducting plates and huge thrust earthquakes offshore on the subduction boundary. The last great subduction earthquake, a M 9.0 event, happened over 300 years ago on January 26, 1700 and left geological deposits documenting its strong shaking and the large tsunami it produced. Paleoseismic investigations suggest at least 19 similar events in the past 10,000 years. The use of techniques such as GPS, broadband seismic analysis, high resolution swath bathymetry, freeze coring of soft sediments have lead to new knowledge that helps to define this dynamic environment and to quantify the hazard that it represents.
P3.2 ID:6908 INVITED/INVITÉ 09:15The Aquistore Project: Commercial-scale CO2 storage in a saline aquifer in Saskatchewan, Canada
Don White Geological Service of Canada Contact: [email protected]
Carbon capture and storage (CCS) represents a likely component in international strategies to reduce greenhouse gas emissions. Coal-burning power plants are a primary target for this technology. The Aquistore Project, located near Estevan, Saskatchewan, is one of the first integrated commercial- scale CO2 storage projects in the world that is designed to demonstrate CO2 storage in a deep saline aquifer. Starting in 2013/2014, up to 500 ktonnes/year of CO2 captured from the nearby Boundary Dam coal-fired power plant will be transported via pipeline to the storage site. The CO2 will be injected into a brine-filled sandstone formation at ~3300 m depth using the deepest well in Saskatchewan. The suitability of the geological formations that will host the injected CO2 has been predetermined through 3D characterization using high-resolution 3D seismic
images and deep well information. These data show that 1) there are no significant faults in the immediate area of the storage site, 2) the regional sealing formation is continuous in the area, and 3) the reservoir is not adversely affected by knolls on the surface of the underlying Precambrian basement. A key element of the Aquistore research program is the further development of methods to monitor the security and subsurface distribution of the injected CO2. A permanent areal seismic monitoring array has been deployed which comprises 630 geophones installed at 20 m depth on a 2.5x2.5 km regular grid. The objective of this array is to test “sparse array” seismic imaging and to provide continuous passive monitoring for injection-related microseismicity. A network of surface tiltmeters and GPS stations has been deployed which in conjunction with InSAR analysis will be used to monitor injection-related surface deformation. Other methods that are being tested include downhole electromagnetic methods and time-lapse gravity monitoring. Deployment of a fibre-optic DAS (distributed acoustic sensor) system is being tested as an alternative to the costly downhole deployment of conventional geophones.
Climate Analysis, Modelling and Prediction PART 1 / Analyse, modélisation et prédiction du climat PARTIE 1
Room / Endroit (TCUP Salon A), Chair / Président (N. McFarlane ), Date (29/05/2013), Time / Heure (10:30 - 12:00)
3B1.1 ID:6841 INVITED/INVITÉ 10:30
The impact of model fidelity on climate projections and climate predictions
John Scinocca CCCma, University of Victoria, Victoria, BC Contact: [email protected]
The quality of a climate model is primarily determined against the observed historical record. In the past several years, there has been a call for increased rigour in this exercise resulting in a heightened interest in "model metrics", which are designed to provide quantitative measures of a model's fidelity with respect to the observations. One of the criticisms of model metrics is that, while they do address a model's ability to represent the observed climate, they do not directly address the accuracy of a model's projections and predictions of future climate. This is arguably more important as these applications represent the primary

reason such models are developed. Evidence of a connection between a model's fidelity and the accuracy of its future climate projections or climate predictions has been very elusive in the literature. In this talk we will consider two recent studies that address this specific issue through carefully constructed climate-model experiments. In the first study, Kharin and Scinocca (2012) demonstrate a direct connection between improved model fidelity and improved seasonal forecast skill. In the second study (Sigmond and Scinocca 2010), future projections of the response of the Northern Annular Mode to greenhouse gas forcing are shown to be very sensitive to a model's present-day climatological wind biases in the lower stratosphere. These studies provide two examples of the potential benefit associated with improved model fidelity.
3B1.2 ID:6682 11:00
Attributing the observed total ozone record using nudged CMAM simulations Theodore Shepherd 1, David Plummer 2, John Scinocca 2, Michaela Hegglin 1, Vitali Fioletov 2, Cathy Reader 3 1 University of Reading 2 Environment Canada 3 University of Victoria Contact: [email protected]
Outside the tropics, the observed record of total column ozone changes roughly follows the chlorine loading of the stratosphere, but there are significant discrepancies on decadal timescales. Since the chlorine loading is itself changing on decadal timescales, decadal timescale atmospheric variability complicates the detection and attribution of observed ozone changes. For example, near-global total ozone was only observed to decline after about 1980, while the chlorine loading was ramping up continuously through the 1970s, and chemistry-climate models consistently show significant near-global total ozone depletion by 1980. Also, there was no apparent decrease in Southern Hemisphere ozone after the eruption of Mount Pinatubo, despite the expectation of increased chemical ozone loss. The role of decadal timescale atmospheric variability in explaining these discrepancies is investigated using a new version of the Canadian Middle Atmosphere Model (CMAM) that is nudged to meteorological reanalyses over the historical period. The results provide a detailed quantification of the anthropogenic halogen contribution to the observed ozone record and resolve a number of outstanding scientific puzzles.
3B1.3 ID:6677 11:15
Resolving stratospheric water vapour entry puzzle using a combined model- measurement approach Michaela Hegglin 1, David Plummer 2, John Scinocca 2, Theodore Shepherd 1, Cathy Reader 2, John Anderson 3, Lucien Froidevaux 4, Ray Wang 5, Alexei Rozanov 6, Joachim Urban 7, Thomas Von Clarmann 8, Kaley Walker 9

1 University of Reading 2 Environment Canada 3 Hampton University 4 Jet Propulsion Laboratory, California Institute of Technology 5 Georgia Institute of Technology 6 University of Bremen 7 Chalmers University 8 Karlsruhe Institute of Technology 9 University of Toronto Contact: [email protected]
Water vapour is the most important natural greenhouse gas in the atmosphere and provides a positive feedback to the climate forcing from CO2. The greenhouse effect from water vapour is strongest in the upper troposphere and lower stratosphere (UTLS), where the lowest temperatures are found and where strong gradients in concentration across the tropopause exist. Water vapour is also a key constituent in atmospheric chemistry. It is the source of the cleaning agent of the atmosphere, hydroxyl (OH), which controls the lifetime of shorter- lived pollutants, stratospheric and tropospheric ozone, and other long-lived greenhouse gases such as methane. Despite the importance of water vapour to chemistry and the radiative balance of the atmosphere, its observed long-term changes are not well understood mostly due to inadequacy of the current observational coverage. Comparisons with long-term changes in tropical temperatures that are known to largely control stratospheric water vapour entry values furthermore are inconsistent leading to an unresolved puzzle. We here use a new approach combining water vapour observations from different limb- viewing satellite instruments and the information on modelled water vapour fields from a nudged chemistry-climate model - CMAM - in order to produce a long-term time series (or essential climate variable). This time-series then is evaluated in order to infer and explain observed trends in stratospheric water vapour. We discuss the results focussing on relevant atmospheric processes that control water vapour entry values into the stratosphere, but also in the light of recent findings on measurement accuracy from the SPARC Data Initiative, the first comprehensive multi-instrument comparison of constituent measurements of limb-viewing satellite sounders.
3B1.4 ID:6699 11:30Will the thermosphere cool the lower atmosphere in a Maunder Minimum-like event?
Patrick Sheese 1, Ted Llewellyn 2, Dick Gattinger 2, Wayne Evans 3, Kim Strong 1 1 University of Toronto 2 University of Saskatchewan 3 York University Contact: [email protected]
During the Maunder Minimum in the mid-17th to early 18th century, a period of extremely low sunspot occurrence, surface temperatures were at their lowest

within the Little Ice Age. It is currently being debated within the solar community whether there will be another Maunder Minimum-like event, beginning within the next decade. Will this potential period of low solar activity lead to a similar cooling of surface temperatures? We will explore this possibility, with a prolonged decrease in thermospheric nitric oxide concentrations as a potential contributing mechanism in cooling the lower atmosphere. Nitric oxide plays a major role in the lower thermospheric energy budget. Vibrationally excited NO radiates energy out of the thermosphere, greatly cooling the region; and measurements from the OSIRIS (Optical Spectrograph and InfraRed Imaging System) instrument on the Odin satellite have shown that NO concentrations in the upper mesosphere-lower thermosphere are strongly dependent on solar activity. In an epoch of low solar activity, thermospheric NO concentrations will be at a minimum, effectively abating the region’s dominant energy sink. We will investigate the effect of a prolonged heated thermosphere, along with a prolonged decrease in thermospheric NO emission, on the lower atmosphere.
3B1.5 ID:6789 11:45
Impacts of climate change on fresh water content and sea surface height in the Beaufort Sea Zhenxia Long , William Perrie Bedford Institute of Oceanography Contact: [email protected]
The present study explores how fresh water content and sea surface height in the Beaufort Sea might be modified under warming-induced conditions due to climate change. We performed simulations from 1970 to 2069 with a coupled ice-ocean model (CIOM) implemented for the Arctic Ocean. The surface fields to drive CIOM were provided by the Canadian Regional Climate Model (CRCM), in turn driven by the third-generation Canadian global climate model (CGCM3) outputs following the A1B climate change scenario. The simulated sea ice concentration in the entire Arctic and the fresh water content in the Beaufort Sea are shown to have consistent patterns as those seen in observations and reanalysis data. In terms of the possible future climate, the CIOM simulations suggest an 11% decrease per decade in ice volume, when the Arctic Ocean would become largely ice free in the summers by about ~ 2069. Moreover, due to increases in melting of sea ice and Ekman transport, there is an increasing trend in fresh water content (FWC) and sea surface height (SSH) in the Beaufort Sea. The increase would be about 2.5 m for FWC and 6 cm for SSH from 1979 to 2069. Finally, the simulations also suggest that maximum increases in the FWC and SSH would occur near the center of the Beaufort Gyre, where the maximum FWC and SSH are located.

General Hydrology PART 6 / Hydrologie en général PARTIE 6
Room / Endroit (TCUP Salon B), Chair / Président (Sean Carey ), Date (29/05/2013), Time / Heure (10:30 - 12:00)
3B2.1 ID:6301 10:30
From Rocky Mountain National Park to Denver: Pesticides, Hormones and Endocrine Disrupters in Remote and not so Remote Colorado Locations William Battaglin , Kelly Smalling , Paul Bradley , Timothy Reilly U.S. Geological Survey Contact: [email protected]
Due to the proximity of their use and/or their association with wastewater discharges, pesticides, hormones, and other synthetic endocrine disrupting compounds (EDCs) are commonly detected in surface water in urban and agricultural areas. Recent studies indicate that these chemicals also can occur in more remote locations and that hormonally caused malformations in fish and amphibians have been detected at some of these locations. We present a brief history of the occurrence of EDCs in remote locations and a summary of recently collected occurrence data from locations such as Rocky Mountain National Park and compare them to concentrations and detection frequencies from more developed locations in Colorado. In 2009-2012 we sampled for EDCs and pesticides in remote and more developed locations in Colorado. A wide range of pesticides, pharmaceuticals, waste-water indicator compounds, and hormones were detected in water, sediment, and frog tissues from both remote and more developed locations. The results show that even in remote locations amphibians and other aquatic wildlife are exposed to pesticides, hormones, EDCs, and other contaminants from water and sediment, some of which are known to cause malformations.
3B2.2 ID:6889 10:45Life cycle water consumption from gas-fired power generation Amit Kumar , Babkir Ali University of Alberta Contact: [email protected]
The key objective of this study is to develop forecasting model for water demand of natural gas sector. Water demand includes total water consumption and withdrawals over complete life cycle of primary fuel production and power generation from natural gas. Pathways are structured according to the type of natural gas source, power generation technology, and cooling systems used. Water demand coefficients for each pathway determined based on extensive

modeling and literature review for each unit operation. Life cycle water consumptions for 50 different pathways of power generation from natural gas have been determined in this study. These developed coefficients could be used to forecast the water demand for the Province of Alberta in a range of scenario of utilization of natural gas production and utilization for power generation. Preliminary estimate shows that 1% shift from combined cycle power generation to cogeneration power plants in Alberta could reduce a significant level of water withdraw.
3B2.3 ID:6403 11:00
Combining population dynamics, hydrology habitat choice to better understand a species at risk Michael Pollock , Corie White , Kangsheng Wu , Glen Mcmaster Water Security Agency Contact: [email protected]
Similar to many North American sturgeon populations, Lake Sturgeon within the Saskatchewan River system are believed to be at historically low levels. To ensure future survival Fisheries and Oceans Canada is reviewing the population’s status country wide with the option of listing Lake Sturgeon under the Species At Risk Act. Preliminary examination has identified the presence and operation of hydro dams as the most likely impendence to population recovery. As owners of the one of the largest dams on the Saskatchewan River system the Water Security Agency is dedicated to mediating environmental impacts caused by the operation of its dams whenever possible. The Water Security Agency is nearing the end of a three year study that has included telemetry, hydraulic modeling and population health and abundance. These results are being combined to link current water management with impacts on the quantity and quality of available habitat. By combining these datasets we will create a comprehensive picture of the relationship between water management and Lake Sturgeon to help ensure the success of this unique species.
3B2.4 ID:6664 11:15
Modeling the Impact of Climate Change on River Discharge and Snow Cover in Shubuto River Basin, Hokkaido, Japan
Asif Mumtaz Bhatti , Maheswor Shrestha , Toshio Koike , Cho Thanda Nyunt , Patricia Ann Jaranilla Sanchez , Katsunori Tamagawa The University of Tokyo, Japan Contact: [email protected]
Water resources estimation is vital for sustainable water resources planning and management. The distributed biosphere hydrological model (WEB-DHM-S) with the 3-layer energy balance based snow module of the Simplified Simple Biosphere 3 (SSiB3) model and albedo module of the Biosphere Atmosphere Transfer Scheme (BATS) was applied to the Shubuto River basin, Hokkaido,

Japan. The prime objective of present research study is to elucidate the impact of climate change on river discharge and snow in the basin. The results of the study revealed that model is successfully applicable to the basin to simulate river discharge and snow processes. The observed and simulated discharge was found to be in well agreement. Moreover, the snow cover area (SCA) can be predicted with the high accuracy. The simulated spatial distribution of snow cover is evaluated with the Moderate Resolution Imaging Spectroradiometer (MODIS) 8-day maximum snow-cover extent (MOD10A2), demonstrating the model’s capability to accurately capture the spatiotemporal variations in snow cover in the study area. The quantitative pixel-to-pixel and qualitative comparisons for the snow-free and snow-covered grids showed that the simulated SCA and the MODIS SCA were in good agreement with an accuracy of 90%. SRES-A1B scenario from five selected general circulation model (GCM) were used to examine climate predictions. The comparison was made between the past and future snow water equivalent (SWE) in the basin and it was found that all GCMs have shown change in SWE pattern in the future. The research study contributes to the better understanding of the links between climate trends and variability, snow melt and river runoff.
3B2.5 ID:6334 11:30
Multivariate Analysis of Suspended Sediment Concentration in the Lower Reach of the Saint-John River Sébastien Ouellet-Proulx 1, André St-Hilaire 1, Simon Courtenay 2, Katy Haralampides 3 1 Institut Nationale de la Recherche Scientifique 2 Research Scientist, Gulf Region DFO, University of New Brunswick, Dept. Biology 3 University of New Brunswick, Dept. Civil Engineering Contact: [email protected]
The Saint-John Port Authority has to dredge sediments in the Saint-John harbour every year to maintain a deep enough channel for navigation. Although dredging has to be done annually, the amount of sediment removed from the harbour bed varies from year to year. One potential source of variability is the annual sediment load of the Saint-John River. The main objective of the project is to use some of the regularly monitored hydro-meteorological variables to predict hourly suspended sediment concentration (SSC) upstream of head-of-tide. Hence, by knowing hourly variation in SSC and flow, sediment load estimation can be made. Turbidity has been monitored as a surrogate of suspended sediment concentration (SSC) in the Saint-John River during summer 2011 and 2012. The data were noise-filtered, using only periods where SSC was above 30 mg/L. Three multivariate statistical methods were used to predict hourly SSC: stepwise regressions (SWR), canonical correlation analysis (CCA) and model trees (MT). The analyses were first performed using all significantly correlated variables as potential predictors, and secondly, using water level variates including different lagged water levels. The bests R2 on significantly correlated variables were obtained using CCA (0.47) and SWR (0.44) while it was lower for MT (0.30).

When using only water level variables, R2 decreased, obtaining 0.41 for the CCA and 0.40 when using the SWR. With both sets of variables, the SSC prediction was negatively biased when SWR was used (relative bias was respectively -1.01 and -0.41) while it was better when using CCA (-0.56 and -0.16). Giving the availability of the data used in the analyses and the better model performances, CCA performed on significant variables is preferred. When multiplied by discharge over the training period, total load is overestimated by 2.7% when CCA is used while it is overestimated by 6.4% with SWR.
3B2.6 ID:6716 11:45
Hydrogeologists Without Borders: Connecting Groundwater Professionals with International Development Michael Campana 1, David Bethune 2, Cathryn Ryan 2 1 Oregon State University; Hydrogeologists Without Borders; and AWRA 2 University of Calgary and Hydrogeologists Without Borders Contact: [email protected]
A new non-profit organization, Hydrogeologists Without Borders (HWB; http://www.hwbwater.org), seeks to connect hydrogeology and its practitioners to the international development community. It will assist the world’s marginalized people as they seek access to water, sanitation, and sound water resources development and management. Hydrogeology is a key development component as groundwater has become an important source of water in much of the developing world, a trend expected to continue due to population pressures, limitations of surface water supplies, and climate change impacts. HWB was incorporated in Canada in 2008, registered as a Canadian Charity in 2010, and formed a Board of Directors in 2011. HWB’s mandate is to strengthen developing countries’ capacity in hydrogeology, as well as that of the many water organizations involved in water projects. The primary type of water projects undertaken by such agencies - water supply and sanitation (WatSan) - have suffered as they frequently have not employed sound hydrogeologic principles in the construction of water wells and latrines, climate change impact assessments, and watershed management. Initial HWB efforts employ a two-pronged approach: 1) supporting longer-term capacity development; and 2) addressing more immediate needs for hydrogeologic assistance. As opposed to a project management lead, HWB’s niche will be that of a technical support organization to ensure sound hydrogeology is incorporated into projects so that organizations will be strengthened in their ability to plan and implement water projects more effectively and with greater benefit. HWB will support development of new appropriate hydrogeologic technologies for developing countries and help build hydrogeologic capacity in developing countries by supporting graduate programs, students, faculty and staff in developing countries. Our presentation will include HWB’s newly developed mandate and mission statement, and serve to introduce HWB to the Canadian water resources, earth, atmospheric, and ocean sciences communities and seek partnerships with same.

Climate Change Modelling and Water Resources PART 4 / Modelisation du changement climatique et ressources hydriques PARTIE 4
Room / Endroit (TCUP Salon C), Chair / Président (Howard Wheater ), Date (29/05/2013), Time / Heure (10:30 - 12:00)
3B3.1 ID:6437 INVITED/INVITÉ 10:30Assuring Water & Climate Security on the Central Great Plains Robert Sandford 1, Jim Bruce 2 1 Forum for Leadership on Water, UN Water for Life Decade 2 Forum for Leadership on Water Contact: [email protected]
The rapid eutrophication of Lake Winnipeg is seen as evidence of eco-hydro- climatic change, not just in the immediate Lake Winnipeg drainage, but over the entire Central Great Plains region of North America. The latest scientific research outcomes demonstrate that the combined effects of extensive changes in land- use and the resulting channelization of streams has altered the hydrology of the region making this part of North America more vulnerable to flooding caused by more frequent and intense multi-day frontal storm systems. This presentation will summarize the findings developed in the Forum for Leadership on Water’s associated Sunday workshop, “Lake Winnipeg Eutrophication”. It will offer recommendations as to how those findings can most effectively be translated into practical public policy solutions.
3B3.2 ID:6690 11:00
The International Joint Commission’s Current Efforts to Reduce Nutrient Loading in the Red River Basin. Ted Yuzyk 1, Mike Renouf 2 1 International Joint Commission 2 International Red River Board Contact: [email protected]
The International Joint Commission (IJC), through its International Red River Board (IRRB), has had a long history of working in the Red River Basin to address binational water quantity and quality issues. The IJC is particularly
concerned with the extensive nutrient loading to Lake Winnipeg that is resulting in eutrophication and massive harmful algae blooms in this important lake. This has led to a significant binational effort that has focussed on developing and applying a common nutrient loading model for the Red River Basin as part of the IJC’s International Watersheds Initiative. Canadian and U.S. scientists have taken the SPARROW model (Spatially Reference Regression on Watershed attributes) developed by the United States Geological Survey and is applying this regional model to the Red River Basin. The prototype is currently undergoing its final calibration and the outputs from the model are being reviewed by numerous experts. The model’s output is going to be used by the IRRB as an integral component of the Red River Basin Nutrient Reduction Strategy (Strategy), which is currently being implemented. In September 2011, the IRRB adopted an approach jointly proposed by Manitoba, Minnesota and North Dakota as part of this comprehensive Strategy. The approach comprises six components that involve: inventorying nutrient regulatory frameworks in the basin; developing, implementing and monitoring nutrient load allocations or water quality targets; facilitating dialogue and information exchange; and, regular review and update of the Strategy. Significant overall progress has been made, and the IJC is very interested in vetting this work with the broader scientific community.
3B3.3 ID:6523 11:15
Climate change risk assessment of two of the largest inland watersheds in Canada Paul Lyon Fisheries and Oceans Canada Contact: [email protected]
The objective of the Aquatic Climate Change Adaptation Services Program is to assess the risks that climate change poses to the delivery of the Department of Fisheries and Oceans’ mandate across diverse aquatic ecosystems and assist mangers in making evidence-based decisions that enable adaptation. Climate Change poses a risk to aquatic ecosystems, coastal infrastructure, and the navigability of and safety on Canada’s waterways, areas for which Fisheries and Oceans Canada has mandated responsibilities. The Department conducted four large basin assessments: the Arctic, Pacific, Atlantic and Freshwater. For the purpose of this initiative, the Freshwater Large Aquatic Basin includes freshwater ecosystems from two of the largest inland regions in Canada; the Lake Winnipeg watershed, including drainage from prairie and boreal eco-zones, and the Great Lakes St. Lawrence drainage. Six risks were examined, three ecosystem risks and the remaining focused on emergency response, infrastructure and navigability of waterways. This presentation will review the results of this assessment.

3B3.4 ID:6394 11:30
Future Great Lakes water levels and streamflows simulated using Regional Climate Models
Frank Seglenieks Environment Canada Contact: [email protected]
As part of the International Upper Great Lakes Study (IUGLS), Environment Canada developed a Climate Modelling System based on the Canadian Regional Climate Model (CRCM) coupled with the latest version of the Canadian Land Surface Scheme and a lake level-river routing scheme. Eight simulations using three GCMs were downscaled using the CRCM. The actual and simulated current climates were compared for precipitation, evaporation, runoff into the lakes, net basin supply (NBS) for the lakes, and lake levels. Data for the 2050 time slice was used to examine the expected differences in these factors for each of the simulations. The work done during the IUGLS has been expanded to include Lake Ontario and the Ottawa River basin. As well, new combinations of GCM and RCMs have been used from the North American Regional Climate Change program (NARCCAP) along with examinations of the changes of the flow characteristics at various streamflow locations. On an annual basis the future time slices show an increase in precipitation and evaporation with a smaller increase in runoff. The annual NBS showed a decrease that was relatively small. Unlike previous lake level predictions with dramatic drops in lake levels in the order of metres, the change in lake levels from this study was much lower. When examining the differences on a seasonal basis, the future time slices were wetter during the winter and early spring and drier during the summer. This was also seen in the lake levels where there was a shift to higher spring levels and lower winter levels. These seasonal shifts may have an impact on many aspects on the future of the great lakes.
3B3.5 ID:6342 11:45
Potential for climate change to impact flow dependent fish habitat in the South Saskatchewan River Kerry Head 1, Jeff Sereda 2, Micheal Pollock 2, Jeff Hudson 1 1 University of Saskatchewan 2 Water Security Agency Contact: [email protected]
Climate change effects have been documented in the Canadian Prairie Provinces. Temperature is predicted to continue to increase, and precipitation decrease. As a result, river flow is anticipated to diminish. The South Saskatchewan River (SSR) provides vital habitat to lake sturgeon. Lake sturgeon
are currently endangered or threatened across most of their native range, prompting provincial governments to develop management strategies. As lake sturgeon habitat is dependent on flow, understanding climate change impacts on flow conditions in the SSR will be an important component of the long-term management strategy for lake sturgeon. We have developed empirical models based on regional climate variables (temperature and precipitation) to predict in-stream flow. These models were developed using general linear modeling and Akaikes Information Criterion (AIC). These models were then applied to several predictive climate scenarios to test their applicability under changes in the regional climate. In-stream flow was predicted by extracting key variables from 5 different GCM’s representing different future climate scenarios. These future flow scenarios will be coupled with habitat suitability indices to assess changes in sturgeon habitat. Habitat suitability indices have been developed by the Water Security Agency and Department of Fisheries and Oceans Canada. These models will represent a novel advancement for sturgeon management in Western Canada
CANCID 4- Irrigation and Drainage / Irrigation et drainage
Room / Endroit (TCUP Salon D), Chair / Président (Abdel-Zaher Kamal Abdel-Razek ), Date (29/05/2013), Time / Heure (10:30 - 12:00)
3B4.1 ID:6603 INVITED/INVITÉ 10:30Water use efficiency in agriculture
Chandra Madramootoo McGill University Contact: [email protected]
There is a growing interest in the deign and development of advanced technologies which can be used to increase water use efficiency in agriculture. This paper will discuss a series of innovative technologies ranging from wirless soil moisture sensors coupled to irrigation demand models, in order to better schedule irrigation, to variable rate irrigation (VRI)technologies which take into account cropping practices and soil charcateristics to minimize over irrigation. The goal with VRI is how to include digital elevation models and other soil properties which have been digitally measured, into an irrigation water delivery package, that can vary water applications based on soil infiltrability, field elevation, EC, and crop type. The presentation will focus on such innovations in irrigation and drainage.

3B4.2 ID:6344 11:00Irrigation Certification in Saskatchewan Kelly Farden , Garth Weiterman Saskatchewan Ministry of Agriculture Contact: [email protected]
The Irrigation Act, 1996, administered by the Saskatchewan Ministry of Agriculture, requires all individuals wishing to develop new irrigation projects to first obtain an Irrigation Certificate. The Irrigation Certificate confirms that the land to be developed is suitable for sustainable irrigation from a specified water source and that no damage to other lands will be caused. The Ministry follows the “Irrigation Suitability Classification System for the Canadian Prairies” when assessing land for Irrigation Certification. In order for a parcel of land to be considered suitable for irrigation development it must meet several soil and landscape criteria. Factors measured include soil texture, soil structure, moisture holding capacity, infiltration rates, salinity, sodicity, geologic conformity, topography, depth to water table, drainage, among others. As part of the assessment process the Ministry performs an on-site soil investigation. This includes a detailed salinity survey of the field with an automated, geo-referenced dual dipole EM38 (EM38-DD) unit. The data collected with the EM38-DD is used to generate two salinity maps; one depicting the salinity profile for the 0-0.75m depth increment and another depicting the salinity profile for the 0-1.5m depth increment. Comparing the two profiles can provide valuable information with regards to water table depth and also the internal drainage of the soil. An overview of this process will be presented.
3B4.3 ID:6440 11:15Reliability of solar-powered center pivot irrigation systems Hafiz Faizan Ahmed , Warren Helgason University of Saskatchewan Contact: [email protected]
The use of photovoltaic (PV) technology for generating power for use in sprinkler-irrigated agriculture has significant potential in areas where conventional power supplies are either unavailable or prohibitively expensive. However, the economic feasibility of this approach depends on the appropriate selection of system components (PV panels, batteries, etc.) that will provide a reliable power supply while minimizing capital costs. A model for assessing the reliability of a PV-powered center pivot irrigation system has been developed by combining sub-models for the power production, energy storage, and the required irrigation- related load, while considering variable operating and meteorological conditions. The objective of this study was to demonstrate the application of the reliability model while assessing the feasibility of solar powered irrigation systems under variable climate and water management schemes. For this purpose, the reliability of a small (1.4 ha) center pivot irrigation system, installed in Outlook,

Saskatchewan, Canada was evaluated for a variety of cropping choices under variable climate conditions. An economic analysis was completed to identify the design parameters that resulted in the most feasible solution for a given location and crop choice. Application of this modeling approach will allow the feasibility of a PV irrigation system to be determined for any location where climate information is available.
3B4.4 ID:6683 11:30
Greenhouse gas intensity of an irrigated and dryland cropping system in Saskatchewan Cody David , Warren Helgason , Richard Farrell University of Saskatchewan Contact: [email protected]
In response to increasing global food demands, the proportion of irrigated agricultural land within the Canadian Prairies is likely to increase. However, the implications of this with respect to the agricultural greenhouse gas (GHG) balance are not well understood. This study investigates and compares the GHG intensity of a typical irrigated and dryland cropping system in Saskatchewan, a semi-arid region of the Canadian Prairies. Compared to their dryland counterpart, irrigated cropping systems have higher GHG emissions which are a result of the energy used for pumping and larger nitrous oxide (N2O) production rates associated with higher N-fertilizer application and moist soil conditions. These emissions may be partially offset by increased carbon sequestration from the greater productivity realized through irrigation. This investigation focuses on the quantification of soil GHG emissions through chamber-based flux measurements. Factors driving these emissions have been determined through in-situ soil temperature, matric potential, and moisture measurements. The emissions associated with pumping and other crop management activities are accounted for using the Intergovernmental Panel on Climate Change (IPCC) literature and methodology. The information derived from this study will aid in the development of regional specific soil emission factors, improved management strategies, and will identify new approaches for mitigating emissions.
3B4.5 ID:6663 11:45
Alberta’s Irrigation Systems and the Risk of an Economic Disaster: Monitoring for Aquatic Invasive Species
Nicole Seitz 1, Cindy Sawchuk 2, Bill Dolan 3, Ian Dyson 2 1 Water Quality Branch, Alberta Agriculture and Rural Development 2 Alberta Environment and Sustainable Resource Development 3 Alberta Tourism, Parks and Recreation Contact: [email protected]
The accidental introduction of Aquatic Invasive Species (AIS) to several North American water bodies and waterways has proven to be economically damaging.

Zebra mussels (Dreissena polymorpha), in particular, are prolific breeders, highly adaptable, and capable of colonizing on docks, boats, and other hard submerged substrates, making control and treatment often futile after establishment. They are damaging to water infrastructure, having been known to clog pipelines and intakes of drinking water treatment and hydroelectric facilities. Although zebra mussels are considered not present in Alberta, there is increasing concern for their transport from infected eastern regions to the western provinces, and subsequent colonization. Should this scenario play out, the infestation of Alberta’s irrigation systems would be particularly devastating. More than 8000 km of canals and pipelines and more than 50 water- storage reservoirs would be at risk, as well as other diversion and intake infrastructure. A major infestation would result in severely impeded water flow and subsequent lost productivity from irrigated cropland, as well as costly repairs to infrastructure. One of the key recommendations of the Alberta AIS program is monitoring, including monitoring for Alberta’s irrigation infrastructure, and a monitoring strategy is currently being developed. The objective is to develop an effective, science-based, AIS monitoring strategy that is Alberta and irrigation-specific. Lessons learned from other AIS monitoring programs will be considered, such as education and awareness, settlement substrate monitoring, physical barriers, and chemical treatment. Understanding the lifecycle, biology, and settling habits of AIS, as well as irrigation source water quality, will aid in prevention, predicting colonization susceptibility, and developing response protocols. The intent is for the monitoring strategy to be near-finalized by spring 2013. One of the monitoring goals for the 2013 irrigation season is for dam and reservoir operators and managers to begin performing preliminary monitoring at selected sites.
Biogeochemical response to climate & land-use change / Réponse au changement clim. & usage du sol
Room / Endroit (TCUP Gall. Suite 1), Chair / Président (Timothy Duval ), Date (29/05/2013), Time / Heure (10:30 - 12:00)
3B5.1 ID:6773 10:30
Fertilizer legacy effects on wetland restoration: enhanced phosphorus release across scales. Timothy Duval , Hannah Ormshaw , Danielle Radu Department of Geography, University of Toronto Mississauga Contact: [email protected]
Wetland restoration/creation strategies are frequently employed to increase the ecosystem services of the landscape. Central to these strategies is the (re)- establishment of a hydrologic connection to maintain hydroperiods sufficient for development of hydric soils and habitat for hydrophytic vegetation. However, depending on the landscape context these activities can produce unintended deleterious effects. It has recently been observed that re-flooding degraded peatlands has led to eutrophication of surface water due to mobilization of phosphorus. The biogeochemical consequences of human modification of the landscape through wetland rehabilitation at sites with fertilizer legacy effects have not previously been evaluated in the southern Ontario context. This study investigates the effects of rewetting an agricultural field to re-establish a wetland for increasing species diversity, flood mitigation, and water quality in a new suburban environment on the biogeochemical cycling at the sediment- water interface. The presentation will document the initial effects (first few months) on pore-water nutrient cycling and export to the downstream water course, as well as results of controlled soil incubations and column experiments produced significant release of phosphorus due to fine-scale redox changes under varying lengths of saturation. The implications of this stored, redox-sensitive phosphorus in agricultural landscapes need to be better conceptualized by land managers for holistic planning of wetland creation / restoration projects.
3B5.2 ID:6872 10:45
An analysis of the simulated historical terrestrial carbon budget for the province of British Columbia, Canada Yiran Peng 1, Vivek Arora 1, Robbie Hember 2, Werner Kurz 2, Barbara Hawkins 3, John Fyfe 1, Arelia Werner 4 1 Canadian Centre for Climate Modelling and Analysis, Environment Canada 2 Pacific Forestry Centre, Canadian Forest Service 3 Centre for Forest Biology, University of Victoria 4 Pacific Climate Impacts Consortium Contact: [email protected]
The historical 1860-2009 terrestrial carbon budget is simulated for the province of British Columbia (BC) in Canada using the process-based Canadian Terrestrial Ecosystem Model (CTEM). Simulations are performed to investigate the effects of increasing CO2 as well as changing climate. Model simulations indicate that the province has been a carbon sink of around 44 g C/m2.year during 1980s and 1990s, and continuing into 2000s. A large fraction of this simulated sink is caused by warming climate and increasing CO2 plays a smaller role. Since 2001, the province of BC has been affected by the wide spread mountain pine beetle insect disturbance which has killed a large fraction of forests. Our simulations do not include this disturbance so the estimate of simulated sink after 2001 is most likely overestimated. The magnitude of the simulated sink compares well with inversion-based estimate of 38±66 g C/m2.year from Deng et al. (2007) for 2003. The per unit area sink estimate of 44 g C/m2.year translates to an amount of 41 Tg C/year, when multiplied with the 944,700 km2 area of the province, indicating

that the terrestrial ecosystems of the province are more than compensating the province’s fossil fuel emissions of around 17 Tg C/year, although uncertainty remains in regards to the response to the mountain pine beetle outbreak and our estimate does not take into account the effect of wood harvest.
3B5.3 ID:6818 11:00
Hydrological controls on mercury mobility and transport from a forested hillslope during spring snowmelt Kristine Haynes , Carl Mitchell University of Toronto Scarborough Contact: [email protected]
Upland systems play an important role in conveying atmospherically-deposited mercury (Hg) to downstream wetlands and water bodies. Understanding the influence of different and/or changing hydrological conditions on Hg mobility is critical because of poorly understood potential effects due to climate change and because of the toxicological threats of Hg to human and wildlife populations. Two complementary studies were conducted to assess the role of hydrological processes in controlling Hg mobility and transport in forested upland environments. First, a field study compared runoff and Hg fluxes from three replicate hillslope plots throughout two contrasting spring snowmelt periods. Second, a microcosm laboratory study involved the application of an enriched stable Hg isotope tracer to intact, foam-encased soil cores in order to investigate the relative influences of soil moisture and precipitation on Hg mobility. Collectively, these studies suggest that inter-annual variability in hydrology including winter snowpack depth, volume of runoff and antecedent soil moisture during the spring snowmelt period significantly influenced the magnitude and timing of hillslope Hg fluxes. Given the likelihood of decreasing snow accumulation in the study region of north-central Minnesota due to climate change, greater fluxes of contemporarily deposited (new) Hg may be flushed from upland environments via preferential flowpaths in dry soils during storm events. Enhanced fluxes of new Hg, which is likely more bioavailable for methylation, may lead to increased methylmercury production in downstream aquatic ecosystems and potentially enhance Hg availability for biotic uptake.
3B5.4 ID:6441 11:15
Influence of glacial landform and landscape position on groundwater and phosphorus dynamics of shallow lakes on the Boreal Plains.
A.r. Adhikari 1, K.j. Devito [email protected] 1, J.m. Ferone 1, Z. Gibbons 1, C.a. Mendoza [email protected] 2, B.d. Smerdon [email protected] 3 (Presented by Achyut Adhikari ) 1 Department of Biological Sciences,University of Alberta, Edmonton , Alberta, Canada T6G 2E92 Department of Earth and Atmospheric Sciences, University of Alberta, Edmonton, Alberta,

Canada 3 CSIRO Land and Water, Glen Osmond, SA, Australia Contact: [email protected]
The Boreal Plains is experiencing extensive land use changes and possess challenges for managing water resources due to large heterogeneity in surficial geology and landforms. The direct measurement of the hydrologic process and phosphorus (P) source dynamics are necessary for predicting the impacts of land use changes in aquatic ecosystem. Comparative studies of three shallow lakes in contrasting glacial landforms types (coarse textured outwash, fine textured till moraines and lacustrine plains) were used to examine how: 1) P concentration of groundwater, surface and peatland sources vary across landform, 2) landform and lake position influence the proportion of surface and groundwater P sources, flowpath, groundwater lake sediment interactions and ultimately lake P balance. P concentrations in shallow groundwater from peatlands were consistently higher than mineral groundwater across landforms. In lakes located on fine texture landforms, shallow groundwater from peatlands had higher flow contribution and higher P concentration, whereas on coarse texture landforms mineral groundwater contribution with low P concentration contributed much greater proportion to the lake. The net result is low P concentration in coarse texture. In fine textured landscapes, flow reversals were common, but more prevalent in isolated moraine systems resulting in lower P concentration relative to lacustrine plains. The P concentration and budget for lakes relative to P distribution among different landscape sources will be discussed further. Understanding the mechanisms influencing P concentration and retention in different landscape positions will aid in conceptualizing specific sources of P and the scale of lake to landscape connections required in developing tools for land use management.
3B5.5 ID:6611 11:30Tree-ring analysis of ecosystem productivity across hydrological gradients in the southern boreal forest of Saskatchewan Steven Mamet , Jill Johnstone University of Saskatchewan Contact: [email protected]
Rapid increases in global air temperatures have occurred during the last 30 years, and are predicted to continue to warm during the next century. Recent drought-related declines in forest productivity and tree survival have been documented in both arid and wet regions, and appear to be related to increasing evaporative demand—independent of mean annual precipitation. Yet it is still unclear how subsurface moisture availability can mitigate these temperature- induced decreases in forest health. Numerous studies have investigated the effects of drought on forest carbon balance, biomass decline, and mortality. However few, if any, studies have used tree rings from multiple species to investigate climate-related changes in multi-decadal ecosystem production along sub-surface moisture gradients. During September and October of 2012, we

sampled tree rings from 449 trees from 21 plots across three forest types (jack pine, black spruce, and aspen) and three relative ground moisture regimes (dry, mesic, wet) within central Saskatchewan. Annual ring width will be used to estimate net ecosystem production (NEP) using the Carbon Budget Model of the Canadian Forest Sector (CBM-CFS3) and potential for changes in ecosystem state will be assessed by examining variability and persistence present in the detrended time series of NEP. This presentation will focus on preliminary results of tree ring analyses and discussed in the context of the 2001-2003 drought that was prominent across the southern region of Saskatchewan.
3B5.6 ID:6808 11:45
Forestry impacts on hillslope hydrology, mercury cycling, and bioaccumulation – a field experiment Carl Mitchell 1, Kristine Haynes 1, Maxwell Mazur 1, Nathan Fidler 1, Chris Eckley 2, Randy Kolka 3, Susan Eggert 3, Stephen Sebestyen 3 1 University of Toronto Scarborough 2 US Environmental Protection Agency 3 US Forest Service Contact: [email protected]
Forest harvesting has clear impacts on terrestrial hydrology at least over the short term. Similar biogeochemical impacts, such as augmented mercury fluxes or downstream impacts on ecosystems are not as clear, and recent studies have not demonstrated consistent or predictable impacts across systems. To gain a better process understanding of mercury cycling in upland forest-lowland peatland ecosystems, we undertook a field-scale experiment at a study site in northern Minnesota (USA) where shallow subsurface hillslope runoff flows into an adjacent peatland ecosystem. Starting in 2009, three upland forest plots (< 1 hectare each) were delineated and hydrometric infrastructure such as runoff trenches, snow lysimeters, soil moisture probes, shallow piezometers, and throughfall gauges were installed in each plot. During the late winter of 2012, one of the study plots was clearcut and approximately 80% of slash was removed. We clearcut a second plot without slash removal, and left the third plot as a control. In addition to continuously monitoring several hydrological variables, including stable water isotopes, we have also monitored: mercury in runoff, soil-air gaseous Hg fluxes, methylation potentials in the adjacent peatland, and bioaccumulation into invertebrates inhabiting the adjacent peatland. Early results mostly indicate that slash removal actually lessens the impacts of clearcutting on mercury mobility (although forest harvesting in general does have a significant impact) and that forestry operations at this scale have little to no impact on methylation or bioaccumulation in downstream peatlands. Thus far, the greatest impact of slash removal on mercury cycling in forest harvested systems is an increase in mercury evasion, likely as a result of more complete removal of surface shading.
Geophysical applications in CO2 storage revisited / Revisite des applications géophysiques en storage du CO2
Room / Endroit (TCUP Gall. A), Chair / Président (Claire Samson and Don White ), Date (29/05/2013), Time / Heure (10:30 - 12:00)
3B6.1 ID:6557 10:30Seismic monitoring of CO2 injection in Weyburn reservoir using 3-C surface seismic data Le Gao , Igor Morozov University of Saskatchewan Contact: [email protected]
Carbon dioxide (CO2) is one of the principal greenhouse gases, and its concentrations in the atmosphere are increasing annually. Carbon Capture and Sequestration/Storage (CCS) is among the most efficient ways to avoid the damaging consequences of climate change. The Weyburn-Midale field in southeast Saskatchewan is the site of one of the most advanced CCS projects conducted as part of Enhanced Oil Recovery. In order to monitor and verify the distribution of CO2, three- dimensional (3-D) seismic datasets were acquired annually, starting from a baseline survey in December 1999. In this study, we use three-component (3-C) surface datasets of the baseline and two monitor surveys (2001 and 2002). The key to successful CO2 sequestration is to differentiate effectively between the pore-pressure and CO2 saturation effect. Among the various seismic techniques for CO2 detection and monitoring, we applied the variations of reflection-time intervals between reflectors and time-lapse AVO (amplitude variation with offset). The two-way travel time variation is ~1 ms between the caprock and Bakken (~150 ms below caprock), and positive time anomalies are correlated with the injection wells. Multiple AVO attributes including the intercept (I), gradient (G), and several secondary attributes were derived in the vicinity of the reservoir. Attribute I+G is more sensitive to saturation variations whereas I-G is an indicator of pore pressure. An increase in pore pressure generally decreases I and increases G and an increase in CO2 saturation decreases both I and G. From these time- lapse attributes derived from the different vintages of seismic data, we recognize the pore-pressure and CO 2 saturation variations. The results show good correlation with several injection wells and indicate that the AVO method can help estimating the in situ reservoir pressure and fluid saturation variations from time-lapse seismic data.

3B6.2 ID:6633 10:45Time-lapse amplitude variations with Angle (AVA) in vertical seismic profiles during CO2 flooding of Weyburn reservoir Amin Baharvand Ahmadi , Igor Morozov University of Saskatchewan Contact: [email protected]
Two three-dimensional, three-component, time-lapse vertical seismic profiles (VSP) were acquired as part of a CO 2-flood monitoring project at the Weyburn oilfield in southeast Saskatchewan. The objective, and also the principal challenge of the analysis consists in separating the pressure and CO2 saturation effects in a thin reservoir. Amplitude Variation with Angle technique (AVA) was selected as the primary approach. AVA analysis requires accurate accounting for the geometric spreading, intrinsic attenuation and scattering (transmission losses, reflectivity) of seismic waves, which appear to be remarkably strong in the study area. Unlike in the traditional approaches, we invert for all of these effects together, by using a combined model for frequency-dependent amplitude decay. The model is formulated in terms of frequency-dependent attenuation coefficients attributed to six layers, which are based on interpreted well-log data and geologic model of the study area. The attenuation coefficients are parameterized by the frequency-independent “geometric attenuation” (denoted γ) and the frequency- dependent parts interpreted as effective attenuation (Qe). These parameters are derived by fitting the amplitudes of the first arrivals from 35 shots at frequencies 10 to 150 Hz. Fitting the multi-offset first-arrival amplitudes also requires that these attenuation parameters are VTI-anisotropic. The resulting model accurately predicts the amplitudes of direct (body) waves at all frequencies and consequently is viewed as also applicable to AVA analysis. Accurate AVA intercepts and gradients, and also several secondary attributes are derived, and correlated with injection patterns. AVA modeling shows that different combinations of the intercept and gradient are sensitive to the variations of pore pressure and CO2 saturation within the reservoir. The results show promising correlations of the observed variation with injection wells and suggest areas affected by CO2 injection. Overall, this study shows that although requiring careful analysis of the spreading and attenuation effects, VSP records reveal unique and detailed information about wave propagation and AVA effects, which are useful for characterizing the lithology and fluid content within the subsurface.
3B6.3 ID:6767 11:15Ultrasonic wave speeds in CO2 saturated Fontainebleau sandstone under in situ conditions Md Mizanul Huq Chowdhury , Douglas Rr Schmitt , Randolf Kofman University of Alberta Contact: [email protected]
In a CO2 geological sequestration project, potential CO2 leakage is one of the

vital concerns. Monitoring the subsurface movements and the phase state of the injected CO2 is therefore very important. Understanding the seismic response of the subsurface rock in the sequestration is also crucial for the societal acceptance of this process. Additionally, the study of the effect of CO2 on seismic wave propagation is scientifically interesting because CO2 can exist in gas, liquid, and supercritical fluid phases over the modest temperature and pressure ranges typically accessible in the upper 2 km of the earth’s crust, CO2’s critical point lies near 31˚C and 7.4 MPa. We have carried out a series of ultrasonic pulse transmission experiments on several samples of fully CO2 saturated Fontainebleau sandstone over pore fluid pressure ranges of 1 MPa to 20 MPa and at two constant temperatures below (21˚C) and above (50˚C) the critical temperature, these ranges were chosen to cross the gas-liquid and gas- supercritical transitions, respectively. The porosity of the Fontainebleau samples is found to be in the range of 10-13% based on He pyncnometry and Hg intrusion porosimetry. Across the liquid to gas transition we observed a 1.9- 3.9% and a 3.14-3.5% velocity drop in P- and S-waves, respectively. A more subtle (<1.2%) drop in the P-wave velocity occurs across the gas-supercritical transition, but no discontinuity appears in the S-wave. The velocities change gradually across the gas-supercritical and liquid supercritical transitions in agreement with the nature of these second order phase transitions. The gas- liquid transition is, conversely, a first order transition discontinuous in CO2 density and bulk modulus and explains the abrupt changes in a wave speeds across the phase boundary. The comparison between the observed data and Gassmann’s model predictions shows a similar trend for the all three cases for CO2 saturation measurements.
3B6.4 ID:6762 11:30Influence of rate of temperature variation on CO2 phase change in saturated synthetic rock observed with ultrasonic measurements. Arif Rabbani , Randolf Kofman , Douglas R. Schmitt Institute for Geophysical Research, Department of Physics, University of Alberta, Edmonton, Alberta Contact: [email protected]
Ultrasonic measurements using a fully CO2 saturated synthetic sample have been conducted over a variety of temperatures and pressures representative of subsurface conditions aimed to monitor the evolution of seismic responses resulting from changes in the gas, liquid, or supercritical phase state of CO2. We have observed that during isobaric (31 MPa of confining pressure and 6 MPa of pore pressure) heating and cooling experiments the rate of temperature change has a strong effect on the specific temperature at which the expected phase change would occur. It is also noticed that the gas-to-liquid phase change (cooling) is not as strongly influenced by the cooling rate as the liquid-to-gas phase change (heating). The high rate runs of heating and cooling have significant effects on both slope and hysteresis in velocity versus temperature plots. The phase transition of pure, isolated CO2 under 6 MPa of pore pressure is expected at ~22 °C of temperature (NIST website) but in our experiments

faster rate of heating of ~2.5 min/°C shifts the phase change to ~34°C from ~24°C at slower rate of ~20 min/°C. The time-dependent heat transfer out of and into the sample during condensation and evaporation respectively may be the possible explanations for this disparity. In particular, the temperature is measured in the confining fluid within ~5 cm of the top of the sample assembly which will not necessarily represent the temperature throughout the sample; unless it is given time to equilibrate. The time to achieve equilibrium suggested that thermal responses could in part be responsible for the delays. To further investigate this observation a simplified model, the ‘lumped capacity model’, was implemented which estimated the time more than hour to reach the equilibrium invariant with the temperature difference.
3B6.5 ID:6407 11:45
Numerical simulation of fluid and electrical current through X-ray tomography derived images of oil reservoir rocks before and after CO2 exposure Michael Bird 1, Samuel Butler 1, Chris Hawkes 2, Tom Kotzer 3 1 University of Saskatchewan, Dept. of Geological Sciences 2 University of Saskatchewan, Dept. of Geological Engineering 3 Cameco Corp. Contact: [email protected]
Synchrotron X-ray tomography has been used to create 3 dimensional images of rocks from the oil bearing units of the Weyburn oil field in south-eastern Saskatchewan. Sections of these images have been used to create meshes that can be used for finite element simulations of the flow of fluid and electricity through the pore spaces. These simulations allow us to determine the transport properties of the rocks and the calculated permeabilities and formation factors agree well with laboratory derived values. The images also allow us to image and analyze the flow at the pore scale. Simulations were also carried out on a sample before and after it had been exposed in the laboratory to CO2 with a large corresponding increase in porosity and permeability.
Snow, Ice, Permafrost and Cold Regions Processes PART 1 / Neige, glace, pergélisol et processus reliés PARTIE 1
Room / Endroit (TCUP Gall. B), Chair / Président (John Pomeroy ), Date (29/05/2013), Time / Heure (10:30 - 12:00)
3B7.1 ID:6496 10:30Interactions between radiation, snow and hydrology in the Mackenzie DeltaXiaogang Shi 1, Stefano Endrizzi 2, Philip Marsh 1, Daqing Yang 1 1 National Hydrology Research Centre, Environment Canada 2 University of Zurich Contact: [email protected]
Over northern Canada, snow is present during much of the year. As an important land surface variable, snow serves as both an indicator of and a control on climate change and plays an important role in both the radiation balance and the water cycle. This presentation will report on an application of the GEOtop hydrological model to the two Environment Canada research basins (Trail Valley Creek (TVC) and Havikpak Creek (HPC)) in the Mackenzie Delta. The data sets at TVC and HPC have the longest duration and highest quality of any sites in northern Canada, including a collection of meteorological data, sensible and latent heat flux data, snow survey information from ground and aircraft, and streamflow, which make TVC and HPC to be excellent locations for testing hydrologic models in northern Canada. Previous modeling and observational studies have demonstrated that GEOtop is able to reproduce surface turbulent fluxes and snow accumulation process in the study domain. The ultimate goal of this study is to evaluate the interactions between radiation, snow, and hydrology of the basin and how these processes are responding to a changing climate. To this end, a new version of the GEOtop model is driven with a grid size of 25m at an hourly time step over the entire TVC and HPC. A model evaluation is firstly conducted over some sub-basins of TVC to quantitatively assess the temporal variations of snow water equivalent and streamflow. This modeling study will thus provide a set of quantitative evidences for the changing hydrological cycle in the Mackenzie Delta during the late twentieth century.
3B7.2 ID:6438 10:45
Landcover and topographic filtering methods for infilling cloud-obscured pixels in MODIS snowcover imagery.
Joel Trubilowicz 1, J.m. Shea 2, R.d. Moore 1 1 UBC Department of Geography 2 Integrated Center for International Mountain Development Contact: [email protected]
The twice-daily temporal resolution and 500-m spatial resolution of the Moderate Resolution Imaging Spectroradiometer (MODIS) satellite snow-covered area (SCA) products offer great promise in the field of operational hydrologic forecasting. However, cloud obscuration of MODIS snowcover imagery is a

common problem during winter and spring, particularly in mountainous coastal regions such as British Columbia. Rapid snow melt due to rain-on-snow events can cause large fluctuations in SCA during winter and spring. Cloud obscuration during these events can impact operational hydrology and flood forecasting efforts, which are important for the dynamic mountain watersheds of the Coast Mountains of British Columbia. Proximity-based spatial and temporal filters have commonly been used to infill imagery that has been obscured by cloud cover. However, these filters act to dampen any dynamic changes in SCA. Algorithms that infill cloud-obscured pixels based on the dominant snowcover of nearby pixels at similar elevations have also been used. These algorithms can yield accurate infilling of obscured pixels, and may be able to maintain the signal of rapid SCA change. We test extended versions of the elevation-based infilling algorithms by infilling obscured pixels based on their similarity to non-obscured pixels. In addition to the elevation of neighbouring pixels, our algorithm incorporates aspect and land cover to reclassify cloud-obscured pixels. This method shows promise for increasing the ability to infill cloud-obscured MODIS imagery without dampening the signal of rapid SCA change that is common in the transient rain-on-snow zones such as coastal British Columbia.
3B7.3 ID:6296 11:00
A modeling study of the changing contribution of snow to the hydrology of the Fraser River Basin Do Hyuk Kang 1, Xiaogang Shi 2, Huilin Gao 3, Stephen Dery 4 1 University of Northern BC 2 Environment Canada 3 Texas A&M 4 University of Northern BC Contact: [email protected]
This presentation will report on an application of the Variable Infiltration Capacity (VIC) model to the Fraser River Basin (FRB) of British Columbia (BC), Canada over the past half-century. The Fraser River is the longest waterway in BC and supports the world’s most abundant Pacific Ocean salmon populations. Previous modeling and observational studies have demonstrated that the FRB is a snow-dominated system but with climate change it may evolve to a pluvial regime. The ultimate goal of this study is thus to evaluate the changing contribution of snowmelt to the hydrology of the watershed over the last half of the 20th century. To this end, 0.25 degree forcing datasets are used to drive the VIC model from 1948 to 2006 at a daily time step over a domain covering the entire FRB. A model evaluation is first conducted over 11 major sub-watersheds of the FRB to quantitatively assess the spatial variations of snow water equivalent (SWE) and runoff. The simulated peak SWE averaged spatially across the watershed during a water year, termed a maxSWE, is then divided by the corresponding simulated

runoff integrated during the hydrological year at each sub-watershed’s outlet. This ratio between maxSWE over runoff is used to quantify the changing contribution of snowmelt to the hydrology of the FRB over the study period. To determine the sensitivity of the ratio of maxSWE to runoff, the forcing dataset of air temperature is perturbed by ±2°C while the precipitation is multiplied by 0.9 and 1.1. These preliminary sensitivity simulations demonstrate that the increasing air temperature is the primary factor to decreasing snowmelt contributions to the runoff across the FRB. For example, the increase of air temperature by 2°C results in a 36% increase of maxSWE over runoff in the 2000’s. This comprehensive modeling study will thus provide a set of quantitative evidences for the changing hydrology and ecology of the Fraser River in BC during the late 20th century and scenarios for its future climate regime.
3B7.4 ID:6713 11:30
Sensitivity of Yukon hydrologic response to climate warming: a case study for community and sectoral climate change adaptation Richard Janowicz 1, John Pomeroy 2, Sean Carey 3 1 Yukon Water Resources 2 University of Saskatchewan 3 McMaster University Contact: [email protected]
The climate of Yukon Territory has fluctuated considerably over the last century with increasing temperatures and precipitation resulting in permafrost degradation. Studies have shown that climate change has produced alterations to the Yukon hydrological cycle. Annual peak streamflows within the last three decades have decreased within regions of significant permafrost, while winter low flows have increased. Break-up timing on major rivers has advanced by one week over the last century, while break-up severity has generally increased. There is also an apparent trend of increasing peak flows and water levels within Yukon’s glacial regime. This study includes a detailed sensitivity assessment of hydrological response to climate warming and associated permafrost thawing using the Cold Regions Hydrological Model (CRHM) at the Wolf Creek Research Basin, followed by the application of CRHM to other Yukon regions and communities to provide the necessary climate warming sensitivity information to develop sectoral adaptation strategies. The sectors included in the study are mining, hydroelectric, transportation, oil and gas, agriculture, forestry, tourism and recreation and municipal. Using a range of climate change scenarios, assessments have been carried out in Yukon’s four hydrological regions. Model outputs include projected changes to magnitude, timing and interaction of water balance components (precipitation, evapotranspiration, runoff and storage). Projected changes to hydrological response (extreme and drought events, annual and seasonal flows) are summarized allowing for the development of adaptation strategies and options which may include improving flood forecasting and warning systems,

infrastructure design modification, land zoning changes and changes to policy, regulation and legislation.
Watershed assessment for the 21st century PART 1 / Evaluation des bassins versants pour le 21e siècle PARTIE 1
Room / Endroit (TCUP Gall. D), Chair / Président (R.D. (Dan) Moore ), Date (29/05/2013), Time / Heure (10:30 - 12:00)
3B9.1 ID:6417 INVITED/INVITÉ 10:30Watershed assessment: Moving from indicators to better process understanding and models
Roy Sidle US Environmental Protection Agency, NERL, Ecosystems Research Division Contact: [email protected]
Watershed assessment is a critical approach to evaluate the effects of anthropogenic activities on ecosystem components and humans. Cumulative effects of these stressors in both time and space represent an important challenge in watershed assessment. Many of the indicator approaches that have been used in hydrological and sediment models, like equivalent clearcut area and road density, are inadequate, as are some of the bioindicators. These simply do not effectively link indicator response or change to ecosystem processes. As such, there is a need to move towards a more process-based approach in water assessment with respect to transport of materials (water, sediment, nutrients, and contaminants) and the biota they interact with along their pathways. Distributed, physically-based watershed models are powerful tools that can capture water, sediment and chemical transport and transformations at multiple scales; however, these may be too complicated and time-consuming for site specific assessments. Progress has been made in capturing important watershed processes in simpler hydrology and sediment models, but more research is needed to incorporate cumulative effects of land use. An approach that utilizes complex, spatially-distributed watershed models to inform and develop reduced-form models may be a useful paradigm for regional watershed assessment. For similar biogeographic regions, reduced form models (based on system processes) may be powerful management tools that can inform rural land management, residential planning, and regulation. An example is presented
showing how such an approach could be applied to sediment sources, transport, and ecosystem impacts in watersheds of varying sizes, including the temporal and spatial effects of land management activities – e.g., roads, trails, agriculture and forest management disturbances. Furthermore, implications for moving towards improved sustainable watershed management and regulation are addressed.
3B9.2 ID:6502 11:00
Change In Event-scale Hydrologic Response To Increased Impervious Cover
Mary Trudeau Carleton University Contact: [email protected]
To develop cumulative effects assessment tools to protect aquatic biota from impacts of increasing impervious cover, it is important to understand hydrologic changes occurring at the event-scale. Negative effects on aquatic biodiversity are associated with impervious land cover as low as 2-15%, although the causal mechanisms underlying biotic responses to land cover change are not well understood. This negative biotic response at low impervious levels (around 10%) has been identified in very different locations globally, supporting the hypothesis that mechanistic causal factor(s) related to flow regime play a role in aquatic biodiversity decline. Current indices used in predicting impacts of hydrologic regime change on riverine ecosystems include annual coefficient of variation, daily and mean annual flows. However, due to their coarse-resolution time scales (monthly to annual), these indices do not capture peak flow conditions occurring at the event-scale (hours to days). As a result, they under-estimates the degree of hydrologic disturbance that occurs repeatedly as a result of rainfall events within impervious catchments. Using the Great Lakes St. Lawrence Basin sub-watersheds as a case study area, this study examines the cumulative effects of changes in impervious cover on hydrologic response to rain events, at an event timescale. The Great Lakes St Lawrence Basin was identified for the study, in part, because of its potential for a comprehensive long-term Canadian hydrologic and rainfall record. This paper will provide results of flow-regime analyses for three Ontario sub-watersheds in the Basin and outline some of the analytical approaches, statistical methods and data management issues, associated with very large datasets.
3B9.3 ID:6887 11:15
Snowmelt energy flux recovery during rain-on-snow in regenerating forests
William Floyd 1, Younes Alila 2, Markus Weiler 3, Robert Hudson 2 1 BC Forest Service 2 University of British Columbia 3 University of Freiburg

Contact: [email protected]
Rain-on-snow (ROS) contributes to flooding and landslides in many temperate coastal watersheds around the world. Research has shown that forest harvesting can increase melt rates during ROS at both the stand and watershed scale. Because of this, post disturbance hydrological recovery is of interest in watersheds where forest management is prevalent. Recent research that pairs events by frequency has indicated that forest cover removal can have a significant effect on the magnitude and frequency of extreme events in snow dominated watersheds. Hydrological modelling provides a means to apply frequency based analysis in watersheds with short data records, but models must be tested and validated in coastal watersheds before they can be applied extensively. A key challenge to testing models is the inherent difficulty with collecting data in ROS environments. Therefore, the objectives of this research were to design a methodology that recorded previously unobserved processes, use these data to validate model simulations and assess stand level energy balance recovery during ROS. Data were collected at a range of elevations within recently harvested, regenerating and old growth forests. The Cold Regions Hydrological Model generally performed well at capturing the dynamics of snow accumulation and melt, however, snow-water-equivalent was over-predicted in most instances. Clear-cut forests had higher mean and variability of energy inputs resulting in large events occurring more frequently than in old or second growth forests. Energy flux recovery was evident within regenerating forests; however, both the level of recovery and differences among stands depended on location and variables compared. When either the mean or standard deviation of energy inputs differed from that of old growth forests, levels of energy flux recovery were reduced as events became larger and less frequent. It is probable that results from this study will translate to stream flow in watersheds with high run-off coefficients.
3B9.4 ID:6795 11:30Precision conservation of Riparian Zones containing preferential flow-paths from harvested landscapes
Toomas Parratt Dept of Civil and Geological Engineering, University of Saskatchewan Contact: [email protected]
Selective harvesting of riparian zones is becoming a common practice in forested landscapes adjacent to first order streams. Hydrological impacts of selective harvesting within different areas of the riparian zone may however not be uniform due to the presence of preferential flow-paths. High-resolution terrain data are required to accurately delineate preferential flow-paths. With the recent availability of LiDAR data, terrain analysis can be performed to determine detailed flow-paths. The influence of preferential flow-paths on harvesting within riparian zones was investigated to (1) evaluate the impact of preferential flow-paths from harvested areas on selective harvest within a fixed-width adjacent to
1st order streams; (2) examine the relationship between buffer characteristics based on flow-path and increasing the intensity of selective harvest within the riparian zone; and (3) explore the effect of selective harvesting of riparian zones on the percentage of non-riparian harvested area. The results of the study show that including preferential flow-paths in the evaluation of selective harvest within riparian zones increased: estimates of their importance in tree selection, the sensitivity of selective harvesting intensity on buffer characteristics, and the effect on percentage of harvested land that was buffered. Application of preferential flow-paths analysis: (i) increased the harvestable area of riparian zones by identifying areas in which flow-paths from cut-blocks were non-existent and (ii) identified areas within the riparian zone where the majority of flow-paths from harvested lands occurred and should be conserved. Finally flow-path analysis considering different harvest intensities of the riparian zone, led to reduced estimates of hydrologic sensitivity for the majority of the area adjacent to the stream. A case study of four watersheds on the Boreal Plain is presented to illustrate how preferential flow-path analysis can delineate the areas within fixed-width riparian zones that are most responsible for the isolation of aquatic eco-systems from harvested landscapes.
3B9.5 ID:6723 11:45
Modelling Habitat Availability Under a Range of Forest Disturbance Scenarios in an Intermediate Sized Stream Sarah Davidson , Brett Eaton University of British Columbia Contact: [email protected]
The dominant approach to defining fish habitat availability is based on habitat association models, which rely on abundance-environment relationships. Habitat can also be related, however, to broadly defined channel types; the highest fish densities are often associated with riffle-pool and forced riffle-pool morphologies. Furthermore, fish density has been shown to relate positively to both pool frequency and wood load. The objective of this research is to extend the previously developed Reach-Scale Channel Simulator (RSCS), which models wood input, advection, and associated sediment storage, to produce estimates of fish habitat availability. For this research, we defined habitat availability based on the area of stored, spawning-sized sediment, cover availability, and pool area in the reach. We conducted model runs using a simulated intermediate-sized, plane bed reach, as this channel type is highly sensitive to the geomorphic effects of large wood and may experience dramatic fluctuations in habitat availability in response to variations in wood input. Channel response to a series of scenarios, including forest disturbance and stream rehabilitation through wood addition, was then assessed using Monte Carlo simulations. The results suggest that the RSCS is able to realistically simulate the morphologic changes associated with wood forcing in a plane-bed channel, and provides a useful tool for assessing the potential effects of forest disturbance or stream rehabilitation efforts on the most commonly used habitat metrics. Furthermore, the relative ease with which

scenarios can be assessed lends the model to use at an intermediate scale; unlike the habitat-association models typically employed to predict channel response to geomorphic change, future simulations can potentially be used to assess segment or watershed-scale response to forest change.
Northern ecosystem response to stressors PART 1 / Réponse de l'écosystème aux streseurs PARTIE 1
Room / Endroit (TCUP Blair Nelson), Chair / Président (Colin Whitfield and Rich Petrone ), Date (29/05/2013), Time / Heure (10:30 - 12:00)
3B10.1 ID:6584 10:30Impacts of climate variability on seasonal water and carbon fluxes in a temperate pine forest Robin Thorne , Altaf Arain , Jason Brodeur , Janelle Trant , Michelle Kula McMaster University Contact: [email protected]
Forests are considered an important sink for atmospheric carbon dioxide (CO2) and have potential for temporarily storing atmospheric CO2 in terrestrial ecosystems. Exchanges of carbon, water and energy between the ecosystems and atmosphere depend upon seasonal dynamics of both temperature and precipitation, which are known to be influenced by low frequency climate oscillations. The timescales of these oscillations range from interannual to interdecadal and while their effects are mainly felt during the winter months, they can persist into the spring and summer months. The goal of this study is to analyze the year-to-year variability of water and carbon fluxes over a period of ten years, and to examine the impact of climate variability and seasonal weather patterns on these fluxes. This study took place at the Turkey Point Flux Station, located on the north shore of Lake Erie in Southern Ontario, Canada. In this particular region, low frequency climate oscillations, such as El Niño-Southern Oscillation (ENSO) and the North Atlantic Oscillation (NAO), are both known to be influential. The interference of these two forcings can complicate the relationship between atmosphere and water and carbon fluxes. This study is unique for several reasons: (1) it will examine the impact of climate variability on water and carbon fluxes for a location influenced by several climate oscillations and (2) a considerably longer (10 years) time series of fluxes is available at these sites. The knowledge gained from this research can assist forest and water

management practices and also contribute towards the development of realistic parameterizations for land surface schemes used in climate models.
3B10.2 ID:6862 10:45
Carbon exchanges in a temperate deciduous forest in southern Ontario Ananta Parsaud , Altaf Arain , Jason Brodeur , Robin Thorne , Janelle Trant , Michelle Kula , Reham Khader McMaster University Contact: [email protected]
Flux tower sites have been established across Canada to address the increasing demand for greater understanding of carbon cycling patterns and to quantify carbon storage within a variety of vegetated ecosystems. This study presents the first year of carbon fluxes and associated climatic variables in an 80 year old managed temperate deciduous (Carolinian) forest located near Long Point, in southern Ontario. This site is part of the Turkey Point Flux Station and global Fluxnet. The study area is 730 ha and is known as the South Walsingham Forest. Continuous eddy covariance (EC) and meteorological measurements commenced in January 2012. The EC system consists of a CSAT3 sonic anemometer and Li-7200 gas analyzer installed atop a 35m scaffolding tower. Tree height is approximately 25m. Annual values of net ecosystem productivity (NEP), gross ecosystem productivity (GEP) and ecosystem respiration (ER) for 2012 are 286, 1188 and 896 g C m-2, respectively. In this presentation, we will report the investigation of diurnal and seasonal patterns of carbon fluxes and will examine the sensitivity of this forest to seasonal and annual climate variability. This research will advance our understanding of the potential carbon sink and source strengths of managed forest ecosystems in eastern Canada and would help to assess their vulnerability to future climate change and extreme weather events.
3B10.3 ID:6470 11:00
Satellite-based change detection over Boreal Forests in southern parts of the Taiga Plains, Northwest Territories Parinaz Rahimzadeh-Bajgiran 1, Aaron Berg 1, Laura Chasmer 2 1 University of Guelph 2 Wilfrid Laurier University Contact: [email protected]
Northwestern regions of Canada have gone through considerable changes over the last few decades mainly due to climatic variations. In particular, in the southern parts of the Taiga Plains, discontinuous permafrost has been subjected to increasing air temperature leading to permafrost thaw. This has subsequently affected hydrological patterns, vegetation productivity and land cover. Limited available literature on changes in the area indicates different responses to permafrost thaw and increased temperature. Ecosystems of the region have
been studied individually but no comprehensive study on detecting changes over the time covering different ecosystems has been conducted. Understanding the response of the various ecosystems to climate variations is important to find vulnerable regions and trends of the changes. Remotely sensed satellite imagery seems to be the only tool to provide long term information with adequate spatial coverage to monitor temporal and spatial changes in this important region. Here we employed MODerate resolution Imaging Spectroradiometer (MODIS) time series data covering 12 years (2001-2012) for change detection in the Taiga Plains Mid and High Boreal Ecoregions. We applied different remotely sensed indices to detect changes in the area. We proposed the use of diurnal land surface temperature (∆TS) as it is found to be influenced by land cover changes. Vegetation indices such as Normalized Difference Vegetation Index (NDVI) and Enhanced Vegetation Index (EVI) were also used to evaluate changes in forest conditions. Preliminary results of the research indicate variations in vegetation amount and water bodies from 2001 to 2012 in the region. Changes in land cover characteristics based on variations observed in the indices are determined and trends are evaluated using statistical trend analysis. The results of this research are significant to provide basic understanding of the trends in land cover changes and characteristics to determine vulnerable areas in the study area.
3B10.4 ID:6615 11:15
Challenges in detecting environmental change in the Athabasca oil sands area Dirk De Boer 1, Marlene Evans 2, Kimberely Janzen 2 1 University of Saskatchewan 2 Environment Canada Contact: [email protected]
Oil sands development in the Athabasca River basin has led to substantial changes in land use and concerns for water and sediment quality. Although the physical impact of oil sands operations is visually striking in the surface mined areas, detecting the impact of this activity on aquatic ecosystems downstream is not straightforward. This has led to contradictory reports about the presence or absence of effects resulting from oil sands activities. The challenges to detecting effects arise from various factors, including the small area of the oil sands area operations relative to the entire Athabasca River basin; the difference in the magnitude of the discharge from the tributaries and the main stem of the Athabasca River, resulting in substantial dilution of substances associated with oil sands development originating from the tributaries or emitted into the atmosphere; and the occurrence of natural sources of bitumen in the basin with similar characteristics as the anthropogenic sources. In addition, problems arise from the frequency, timing and location of sampling in the tributaries, the Athabasca River and the delta as part of monitoring programs. In an environment where the freshet is the main hydrological event, spring sampling is a crucial component of a sampling program but dilution and strong pulses in flow present challenges in quantifying releases and effects. In addition, the binding of
chemicals to sediments is affected by particle size distribution, %TOC, and other sediment characteristics which requires that PAH and metals data be normalized to minimize the effect of sediment characteristics on contaminant concentrations. Similar concerns apply to water quality. Finally, detection of time trends in water and sediment quality requires that the same variables, using the same or better methods, be analyzed throughout the years. Data gaps because of changes in the analytical package and sampling frequency confound the interpretation of the temporal record. With high quality data collected prior to the early 2000s limited, this potentially leads to erroneous conclusions regarding trends in water and sediment quality. Improved records of long-term change are being found in sediment core studies conducted in Athabasca River watershed including the delta, Lake Athabasca, and the many small lakes closer to the oil sands development area. The studies in small lakes studies emphasize atmospheric pathways. Cores from small lakes, however, do not provide information on the effects of water releases and do not provide high resolution annual data for more recent times because of the low sedimentation rates. Given the expansion of oil sands operations and the potential for changes in water releases, quantification of the current impact of oil sands development of the Athabasca River ecosystem becomes all the more urgent.
3B10.5 ID:6303 11:30
Application of a Baysesian belief network for assessing the vulnerability of permafrost to thaw and implications for greenhouse gas production and climate feedbacks Kara Webster 1, James Mc Laughlin 2 1 Canadian Forest Service 2 Ontario Ministry of Natural Resources Contact: [email protected]
Permafrost affected soils are an important component of the Boreal, Subarctic and Arctic ecosystems of Canada. These areas are experiencing accelerated rates of climate change and have been identified as being at high risk for thaw. Thaw will expose carbon, previously protected from decomposition, to warmer conditions that support microbial growth. Thaw will also alter the local hydrological regime, influencing both the pathway of microbial respiration (i.e., aerobic versus anaerobic) and vegetation composition, which in combination determine greenhouse gas (GHG) production and consumption rates. Therefore, vulnerability of permafrost to thaw will have important implications for short and long term carbon storage capacity within northern regions and feedbacks to global climate. We present a tool in the form of a Bayesian Belief Network influence diagram that will allow policy-makers and managers to understand how interacting factors contribute to permafrost thaw, its impact on GHG production and climate feedbacks. We provide a theoretical example of expected responses from an organic soil typical to the Hudson Plain region and contrast it to a mineral soil typical of the Arctic region to demonstrate variability of response across different regions of Canada. We propose that this flexible framework will be
useful for not only understanding the complexities of permafrost thaw, but also for identifying future research priorities, projecting impacts and assessing mitigation options.
3B10.6 ID:6361 11:45
Paleolimnological assessment of limnological change in ten lakes from northwest Saskatchewan downwind of the Athabasca Oil Sands Biplob Das 1, Kathleen Laird 2, Melanie Kingsbury 2, Melissa Moos 3, Sergi Pla-Rabes 4, Jason Ahad 5, Brendan Wiltse 2, Brian Cumming 2 1 Saskatchewan Water Security Agency, Regina, SK 2 PEARL, Department of Biology, Queen’s University 3 Lake Simcoe Region Conservation Authority, 120 Bayview Pkwy Newmarket, Ontario 4 CEAB-CSIC, Ctr Adv Studies Blanes, Limnol Grp, Blanes 17300, Girona, Spain 5 Geological Survey of Canada, Natural Resources Canada, 490 rue de la Couronne, Québec Contact: [email protected]
The extraction of bitumen from the Athabasca Oil sands is rapidly expanding, and emission of sulphur and nitrogen oxides has substantially increased. To determine whether lakes downwind of this development in northwest Saskatchewan have been impacted since development of the oil sands, a paleolimnological assessment of ten lakes was carried out. Analysis of fossil diatom remains and inferences of pH indicated that emissions have not to date resulted in widespread acidification in acid-sensitive lakes ~80-250 km east and northeast of the oil sands development around Fort McMurray and Fort Mackay. However, one of the closest sites to the development indicated a slight decline in diatom- inferred pH. Whereas, the two other closest sites with higher alkalinity and higher buffering capacity did not. There were no consistent trends in the concentration or flux of total or individual priority pollutants including lead, mercury, copper, zinc and vanadium. The sedimentation rates in most lakes increased since the mid- 1900s, along with increased flux of both diatoms and chrysophytes. Subtle changes in the species assemblages of diatoms and increased flux of diatoms and chrysophyte scales are consistent with recent climate change in this region.
Stable Isotope Tracers and Climate-Driven Change / Traceurs isotopiques stables et influence du cli
Room / Endroit (Hilton Commonwealth- S), Chair / Président (Tricia Stadnyk ), Date (29/05/2013), Time / Heure (10:30 - 12:00)
3B13.1 ID:6281 INVITED/INVITÉ 10:30Climate-driven changes in the water balance of the North American Great Lakes based on a new isotope dataset John Gibson 1, Scott Jasechko 2, Tom Edwards 3 1 Alberta Innovates Technology Futures 2 [email protected] 3 [email protected] Contact: [email protected]
Climate-driven processes can be important factors to consider when examining the water budget of large lakes having long residence times. Here we present stable-isotope-based water budgets for the Laurentian Great Lakes of North America utilizing a new dataset of δ18O and δ2H values for 514 water samples collected during spring and summer 2007 from multiple depths at 75 offshore stations. The dataset establishes that each lake has a characteristic isotopic composition with minimal isotopic stratification, attributed to vertical mixing during fall and spring. Waters from each lake plot in distinct clusters along a trend parallel to, but offset from, the Global Meteoric Water Line in δ18O-δ2H space. This trend, which we term the Great Lakes Water Line, reflects the combined effects of evaporative isotopic enrichment and the progressive addition of precipitation, catchment runoff, and inflow from upstream lakes along the chain-of-lakes system. Stable isotope mass balance is applied using an evaporation model that accounts for downwind lake effects, including humidity build-up and changes to the isotopic composition of atmospheric moisture, as well as seasonality of evaporation, which is biased to fall and winter. Calculated evaporation rates are consistent with previous energy balance and mass transfer studies for lakes Michigan, Huron, Ontario and Erie, but are lower for Lake Superior, which has a much longer residence time. Calculated evaporation from Lake Superior is 306±76 millimeters per year, significantly less than previous estimates of ~500 millimeters per year, reflecting the 'isotopic memory' of lower evaporation rates under cooler climatic conditions with greater ice cover during the past 170+ years. Uncertainties in stable-isotope-based estimates are comparable to those of conventional evaporation models, without the need for over-lake climate monitoring. We conclude that current water budget shifts observed in Lake Superior are imminent given the climate-driven changes to evaporation rates that have already occurred.
3B13.2 ID:6508 11:00
Identifying Primary Stream flow Components in the Lower Nelson River Basin Aaron Smith 1, Carly Delavau 1, Tricia Stadnyk 1, Kristina Koenig 2 1 Dept. of Civil Engineering, University of Manitoba

2 Water Resources Engineering Department, Manitoba Hydro Contact: [email protected]
The Lower Nelson River Basin (LNRB) is the primary location for Manitoba Hydro power generation, utilizing flow from Lake Winnipeg on the lower Nelson River, and from the Burntwood River via the Churchill River diversion. An extensive iso-hydrological sampling network was set-up in the LNRB during 2010, collecting samples at over 60 locations, most of which are either quarterly or bimonthly during routine hydrometric visits. The goal of this isotope sampling program is to assist in the identification of main source water components, and to understand regional hydrological control of, and changes to flow components. The coupled isotopic-hydrologic-meteorologic data indicate distinct isotopic signatures and end-member relationships in the Nelson and Burntwood systems. In both basins, significant evaporative enrichment of the headwaters and tributaries occurs during the ice-off periods due to the abundance of surface water and wetlands, whereas during ice-on, each river has a noticeably different signal influenced by upstream sources. The changes in the flow regime are noticeable on the isotopic fingerprint and seasonality within the basins. This research will present regionalized isotopic frameworks, flow anomaly analyses versus isotopic variation for component separation, and developed annual isotope mixing envelopes describing seasonal trends in signatures. The effect of Lake Winnipeg on Nelson River composition is evident, inducing ice-on enrichment which is likely from late fall lake turn-over. In contrast, the Burntwood system suggests a larger impact from groundwater and ice-formation at and during the ice-on period. Knowledge of regional and temporal trends in end-member components and mixing regimes of each river system will facilitate more accurate hydrological model calibration for short- and long-term water supply studies on-going in the Nelson River Basin.
3B13.3 ID:6392 11:15
Opposing natural and artificial isoscapes: a key towards a better identification of runoff sources in flat Prairie watersheds?
Genevieve Ali 1, Greg Mccullough 2, Michael Stainton 3, Len Wassenaar 4 1 Department of Geological Sciences, University of Manitoba 2 Center for Earth Observation Science, University of Manitoba 3 Freshwater Institute, Department of Fisheries and Oceans 4 lnternational Atomic Energy Agency Contact: [email protected]
Many Prairie rivers drain flat landscapes where extensive flooding and overland flow on frozen ground are known to occur. Delivery of snowmelt or storm runoff to rivers is often expedited by artificial (agricultural) drains which have greater water conveying capacities than natural rivers of the same order. Nutrient loading is also at its maximum during the freshet, although nutrient sources are difficult to identify due to primary and secondary flooding processes. Here we test the hypothesis that water isotopes can help differentiate spring runoff sources,

namely: 1) river water from local meltwater, 2) drain water from local meltwater, 3) overland flow produced by snow melting on frozen ground in agricultural fields, and 4) surface water present in agricultural fields as a result of secondary flooding. Focus is on the 2,400 km² Lasalle River Watershed located in the flat Red River Valley where water samples were collected in the river main stem, in tributary drains, and in direct runoff at the edges of agricultural fields in spring 2009. All water samples were analyzed for δ18O, δ2H and nutrient concentrations. Results show that all samples became more enriched with time, likely as a result of evaporation. In late spring, negative correlations were found between deuterium excess and the distance from the watershed outlet, an observation which points towards evapoconcentration or the shallow interflow of heavier, perched groundwater in newly thawed soils in the lowlands. The usefulness of δ18O as a tracer of geographic sources was verified on selected dates when drain and field water were isotopically distinct. For the majority of sampling dates, however, no significant isotopic difference could be found between field, drain and river water, thus making it challenging to understand runoff sources and mixing processes in the studied watershed.
3B13.4 ID:6475 11:30
Using isotopes to examine the mechanisms of water storage, transmission and release in a northern headwater catchment Josie Geris 1, Chris Soulsby 1, Doerthe Tetzlaff 1, Jeffrey Mcdonnell 2 1 Northern Rivers Institute, School of Geosciences, University of Aberdeen, Scotland, UK 2 Global Institute for Water Security, University of Saskatchewan, Saskatoon, SK, Canada Contact: [email protected]
An understanding of water partitioning and how inputs of water are evaporated, stored and reach the streams is essential for a broad range of water quantity and water quality issues. It is the way in which water is stored in the soils and underlying weathered bedrock that influences how much water might be transpired and evaporated into the atmosphere, and what is available to sustain river flows. Recent work (Brooks et al., 2010; Goldsmith et al. 2011) has challenged traditional assumptions of translatory flows and well mixed subsurface reservoirs where plants use the same water that ultimately emerges in streams. For areas with high seasonality and relatively freely draining forest soils, isotope analyses have demonstrated the existence of two separate water pools; a highly mobile soil water pool that supplies streams, and a tightly bound pool of water that supplies plant fluxes. The former typically has isotope values consistent with that of precipitation, while the latter water pool has isotope values consistent with evaporated soil water from precipitation early in the wet season. This indicates that the composition of stream water alone is insufficient to understand routing and transit times of water in catchments. It is still unclear what the role of soil properties is on such separation of water pools and whether similar partitioning exists in climates with different water-energy regimes. Here, we investigate the ecohydrology of soil-vegetation assemblages

(hydrotopes) for a range of representative soil-vegetation combinations along the hillslope in a northern headwater catchment, the Bruntland Burn in NE Scotland. The catchment is characterised by high precipitation amounts (~1000mm) evenly distributed throughout the year and soils remain wet for most of the year. Isotopes in different waters were used to identify plant water use and the mechanisms of water storage, transmission and release in environments with different water-energy regimes and lower seasonality as sites studied previously. Preliminary data have shown a strong differentiation in mobile soil water isotopic signatures between up- and foot slope locations. The study compares the isotopic signals of this mobile water with that of vegetation water and bulk soil water for the different soil-vegetation combinations during various points throughout the year. Three types of vegetation typical for Scottish uplands are considered, including Scots Pine (Pinus sylvestris), Heather (Calluna vulgaris), and Bog Myrtle (Myrica gale). Preliminary results are presented and discussed in the context of previous studies with different geographic and climatic conditions. The insights from and comparisons between different catchments will contribute to a better understanding of the underlying controls on the formation of separate water pools.
3B13.5 ID:6307 11:45
Runoff sources and pathways of enhanced winter streamflow on the subarctic Canadian Shield Christopher Spence 1, Steve Kokelj 2, Shawne Kokelj 2, Newell Hedstrom 1 1 Environment Canada 2 Aboriginal Affairs and Northern Development Canada Contact: [email protected]
Increases in winter streamflow observed across the circumpolar north have been attributed to a variety of forcings. The Precambrian Shield landscape is common across Canada, Scandinavia and Russia and all have been experiencing changes to winter flows. In the northwestern subarctic Canadian Shield, autumn rains that can produce winter runoff events that rival the magnitude of the spring freshet have become more common since the mid-1990’s. However, the runoff generation processes and pathways predominant during these events remain unclear. Much of the streamflow occurs when lakes and soils are freezing, making traditional hydrometric methods difficult to implement. Chemical tracers, such as stable isotopes, were used to provide a first estimate of the ratios of pre-event and event water and runoff pathways during these winter events. Results suggest event water comprises by far the largest portion of the flood hydrograph, but pre-event water becomes important during recession. The proportion of water that travels along groundwater pathways is initially ~40% of streamflow, but decreases steadily into and through winter. This research demonstrates the usefulness of stable isotopes in conjunction with other chemical analysis and hydrometric approaches to resolve how predominant hydrological processes are affected by climate driven hydrologic change. Furthermore, the results assist in interpreting changes in the aquatic chemistry regime in the region that influence

aquatic ecosystems and human health.
Operational Oceanography in Canada / Océanographie opérationnelle au Canada
Room / Endroit (Hilton Prince Albert), Chair / Président (Michael Ott ), Date (29/05/2013), Time / Heure (10:30 - 12:00)
3B14.1 ID:6510 10:30An integrated marine Arctic prediction system for METAREAs Harold Ritchie 1, Mark Buehner 2, Tom Carrieres 3, Serge Desjardins 4, Luc Fillion 2, Edwina Lopes 5, Pierre Pellerin 2, Gregory Smith 2, Gilles Garric 6 (Presented by C. Harold Ritchie ) 1 Meteorological Research Division, EC, Dartmouth NS 2 Meteorological Research Division, EC, Dorval QC 3 Canadian Ice Service, EC, Ottawa ON 4 Meteorological Service of Canada - Atlantic, EC, Dartmouth NS 5 Meteorological Service of Canada - Ontario, EC, Downsview ON 6 Mercator-Océan, Toulouse, France Contact: [email protected]
In December 2007 Canada accepted official designation as the Issuing Service for meteorological Marine Safety Information (MSI) in the form of forecasts / warnings and ice bulletins for METAREAs XVII and XVIII as part of the Global Maritime Distress and Safety System (GMDSS). These areas are in the Arctic bordering on Canada. An important part of Environment Canada’s involvement is the development of an integrated marine Arctic prediction system and satellite products in support of monitoring and warnings. The integrated marine Arctic prediction system will feed into a highly automated information dissemination system. In particular, our group is working on the development, validation and implementation of marine forecasts with lead times of 1 to 3 days using a regional high resolution coupled multi-component (atmosphere, land, snow, ice, ocean and wave) modelling and data assimilation system to predict near surface atmospheric conditions, sea ice (concentration, thickness, pressure, drift, ice edge), freezing spray, waves and ocean conditions (temperature and currents). The core of the system is an Arctic extension of the highly successful Gulf of St. Lawrence coupled modelling system, with the GEM (Global Environmental Multi-scale) model as the atmospheric component coupled to the NEMO (Nucleus for European Modelling of the Ocean) ocean model and the CICE ice model. An ice-ocean data assimilation system is being developed in collaboration with

Mercator-Océan using their SAM2 system for ocean data assimilation together with the 3DVAR ice analysis system developed at EC. The METAREAs research and development is a cornerstone activity within the Canadian Operational Network of Coupled Environmental PredicTion Systems (CONCEPTS). This talk will provide an overview of these activities, illustrate some results to date, discuss plans for future operational systems, and link with other complementary presentations at this Congress.
3B14.2 ID:6414 10:45
Expanding the regional coupled atmosphere-ice-ocean forecast system to include the Great Lakes Sarah Dyck 1, Frederic Dupont 1, Francois Roy 1, Gregory Smith 1, Vincent Fortin 1, Simon Senneville 2, Jerome Chanut 3, Serge Desjardins 1 1 Environment Canada 2 Institut des Sciences de la Mer 3 Mercator Ocean Contact: [email protected]
Within CONCEPTS (Canadian Operational Network of Coupled Environmental Prediction Systems) a short-range regional coupled prediction system is being developed by Environment Canada in order to replace the operational Gulf of St. Lawrence (GSL) system. We use the GEM atmospheric model, the NEMO/OPA ocean model and the CICE ice model. In addition to the GSL, the domain has been extended to include the Great Lakes region. In order to initialize a coupled model a pseudo-analysis including realistic ice and a 3D ocean state must first be generated. We will show an evaluation of the pseudo-analysis we use for the GSL and the Great Lakes regions, including water surface temperatures and ice conditions. We will then present some winter time case studies highlighting the impact of coupled vs uncoupled forecasting systems.
3B14.3 ID:6753 11:00Towards an Ocean Services Model at Fisheries and Oceans Canada
Michael Ott Fisheries and Oceans Canada Contact: [email protected]
In order to satisfy government, industry, and public demand for faster access to more integrated ocean information, Fisheries and Oceans Canada (DFO) is defining and developing an operational oceanography program. DFO has already laid the groundwork for a coordinated national approach to Ocean Services by examining its mandate and current activities in light of new technologies, opportunities, and commitments, including in the Arctic. At the same time, DFO has worked with other Government Departments and international collaborators

to realize important initial gains, particularly in the areas of observation systems and model development. DFO continues to work with these partners and with clients to establish a framework for an effective and efficient Ocean Services program in Canada that will provide scientific information and advice.
3B14.4 ID:6892 11:15
Development of an ice prediction system at Environment Canada: the analysis component. Alain Caya 1, Mark Buehner 1, Tom Carrieres 2, Manon Lajoie 3, Yi Luo 2, Lynn Pogson 2, Michael Ross 1 1 Meteorological Research Division, Environment Canada 2 Canadian Ice Service, Environment Canada 3 Meteorological Service of Canada Contact: [email protected]
An ice prediction system is being developed at Environment Canada. The analysis component is based on variational data assimilation. A regional configuration of the analysis has been running operationally in experimental mode at the Canadian Meteorological Center since March 2011. This first version of the system assimilates sea ice concentration data derived from passive microwave observations (SSM/I), image analysis and daily ice charts from the Canadian Ice Service. This presentation will describe the results from testing of several major improvements to the system. The improvements include the assimilation of SSM/IS and ASCAT satellite observations. The addition of sea ice concentration retrievals from SSM/IS data from 3 satellites gives more robustness to the system and improves the quality of the sea ice concentration analysis. Since ASCAT data do not suffer from the same limitations as passive microwave data, especially during the summer season, the 2 data-sets complement each other leading to additional improvements. Moreover, an estimation of the analysis-error standard deviation is generated to assist in the identification of potentially large analysis error and to replace the analyzed ice concentration at these locations with surrounding information using a smoothness constraint. Verification scores against different data-sets are shown to measure the improvements relative to the current experimental system.
3B14.5 ID:6525 11:30Medium-Range Forecasts with the CONCEPTS Global Coupled Atmosphere-Ice-Ocean Prediction System
Jean-Marc Bélanger 1, Harold Ritchie 2, Gregory Smith 1, Jean-François Lemieux 1, Christiane Beaudoin 1, Zhongjie He 1, François Roy 3, Mateusz Reszka 3, Gilles Garric 4, Charles-Emmanuel Testut 4 1 Meteorological Research Division, EC, Dorval QC 2 Meteorological Research Division, EC, Dartmouth NS 3 Canadian Meteorological Centre, EC, Dorval QC 4 Mercator-Océan, Toulouse, France

Contact: [email protected]
The Canadian Operational Network of Coupled Environmental PredicTion Systems (CONCEPTS) including Mercator-Océan participation (France) is providing a framework for research and operations on coupled atmosphere-ice-ocean (AIO) prediction. Operational activity is based on coupling the Canadian atmospheric Global Environmental Multi-scale (GEM) model with the Mercator system based on the Nucleus for European Modelling of the Ocean (NEMO), together with the CICE sea ice model. A fully coupled AIO forecasting system for the Gulf of St. Lawrence (GSL) has been developed and has been running operationally at the Canadian Meteorological Centre (CMC) since June 2011. More recently a global coupled prediction system for medium-to-monthly range applications is under development. The first step was the development of an ice-ocean analysis and forecasting system based on the NEMO ocean model and LIM2 sea-ice model on a ¼ degree resolution grid, with atmospheric forcing from the 33 km resolution GEM global model, initiated from ice and ocean analyses provided by the Mercator SAM2 ocean assimilation system which is installed at CMC. The new 0.2° resolution CMC SST analyses are assimilated with reduced observation error providing a more tightly constrained SST. The SAM2 ocean analyses are blended with CMC 3DVAR ice analyses to provide a complete ice-ocean analysis suitable for initializing coupled forecasts. Five-day forecasts of sea ice have been evaluated for January to October 2011 and show a significant improvement of the forecasting skill when compared to persistence. The GEM model has been interactively coupled with this global ice-ocean forecasting system. Coupled and uncoupled medium-range (16-day) forecasts have been made over the period Jan.-Mar. 2011. In this presentation we investigate the impact of coupling focussing on SST, sea ice concentration, precipitation and surface and upper air temperatures. Specific verifications are presented and we also provide a discussion of key challenges and future directions.
3B14.6 ID:6798 11:45The Operational Oceanography Cycle
Martin Taillefer Maritime Way Scientific Ltd. Contact:
The Operational Oceanographic system is described in numerous forms and ways, depending on the organisation. Whether it is Environment Canada’s Science and Weather Review & Determination Committee, GODAE’s Product Management, DFO’s CONCEPTs or any other agency that promotes operational science products, the processes remain the same. Most often organisations will create components of the operational cycle and boldly state that their systems are now operational – where in fact the cycle is incomplete and the true operational system does not really exist. In operational oceanography, there exists a well defined logic cycle that allows the activity of a task to be conceived, developed, and analysed with the goal to understand and predict local, regional

and global oceanic events. This direct application of ocean data analysis should allow decision makers to be influenced by the direct and immediate application of science data – whether one progresses through the cycle once, on numerous occasions or perpetually. Most importantly, as the activity of systematic and long-term routine measurements of the science data is applied in an operational cycle – the accuracy of the decisions are enhanced and understood more clearly.
Climate analysis, Modelling and Prediction PART 2 / Analyse, modélisation et prédiction du climat PARTIE 2
Room / Endroit (TCUP Salon A), Chair / Président (N. McFarlane ), Date (29/05/2013), Time / Heure (13:30 - 15:00)
3C1.1 ID:6381 13:30Joint occurrence of daily temperature and precipitation extreme events over Canada Bárbara Tencer 1, Andrew Weaver 1, Francis Zwiers 2 1 School of Earth and Ocean Sciences, University of Victoria 2 Pacific Climate Impacts Consortium, University of Victoria Contact: [email protected]
Temperature and precipitation extreme events have been separately studied around the globe since their occurrence severely impacts built and natural systems. Agriculture, energy demands, and human health, among other activities, can be affected by extremely high or low temperatures and by extremely dry or wet conditions. However, the simultaneous or proximate occurrence of both types of extremes could lead to more profound consequences. For example, a dry period can have more negative consequences on agriculture if it is concomitant with or followed by a period of extremely high temperatures. In this study the joint occurrence of dry/wet conditions and high/low temperature events in Canada is analysed during the period 1971-2000 based on an observational dataset and regional climate simulations from the NARCCAP project. More than 70% of the stations showed a significant relation between daily temperature extremes and heavy precipitation. Observations show that heavy precipitation events (defined as daily precipitation greater that the 75th percentile) are more likely to occur together with a minimum temperature warm extreme (warm night, minimum temperature exceeding the
90th percentile) or a maximum temperature cold extreme (cold day, maximum temperature below the 10th percentile). The greater signal in the simultaneous occurrence of heavy precipitation events and warm nights (cold days) is seen in winter (summer) with an average of 21.4% (28.7%) of the days with extreme temperature events also registering heavy precipitation. Regional climate simulations are in good agreement with observations, showing that the region that experiences the greatest amount of heavy precipitation events on days with extreme temperatures is the Pacific coast. Given that projected changes in precipitation under a climate change scenario are more uncertain than projections in temperature changes, a thorough understanding of this relation may allow for a reduction in the uncertainties associated with projected changes in precipitation.
3C1.2 ID:6518 13:45
Using climate change projections to assess risk and facilitate adaptation
Paul Lyon Fisheries and Oceans Canada Contact: [email protected]
Risk is the combination of the probability of an event occurring, and the impact or consequence of that event. Climate Change poses a risk to aquatic ecosystems, coastal infrastructure, and the navigability and safety of Canada’s waterways, areas for which Fisheries and Oceans Canada (DFO) has mandated responsibilities. In order to build institutional resilience to climate change, risks need to be assessed against climate sensitive decisions which relate to the management of DFO’s services and programs. The Department’s Aquatic Climate Change Adaptation Services Program’s risk methodology assesses impacts and vulnerabilities based on projected future states of Canada’s aquatic resources and sea state. The assessment includes socio-economic, policy and program considerations. Four large basins assessments of Canada’s three oceans and its inland waters were completed in the spring of 2013. This presentation will review the risk process, highlight results, and examine how this work may be applied to influence decisions and facilitate adaptation.
3C1.3 ID:6514 14:00
Spatial and temporal inter-comparison of three high-resolution gridded climate data sets for the Athabasca watershed
Yonas Dibike 1, Hyung-Il Eum 1, Terry Prowse 1, Barrie Bonsal 2 1 Environment Canada, Water and Climate Impacts Research Centre (W-CIRC) @ University of Victoria 2 Environment Canada, National Hydrology Research Centre (NHRC), Saskatoon, SK, Canada Contact: [email protected]
The accuracy of climate forcing data applied to the alpine headwaters of large watersheds can significantly affect modelled hydrologic responses over lower,

downstream portions of the river basin. As a precursor to undertaking modelling of the Athabasca River watershed, which has distinct alpine headwaters, this study evaluates the spatial and temporal differences in precipitation and temperature fields among three high-resolution climate data sets available in Canada for application to the Athabasca. They include: the North America Regional Reanalysis (NARR), the Canadian Precipitation Analysis (CaPA), and the thin plate-smoothing splines (ANUSPLIN). The NARR is a long-term set of climate reanalysis data at regional scale of 32 km for the North American domain. At a higher resolution of 15km, CaPA includes precipitation data for the North American domain that were derived from multiple sources including radar, satellite images, surface network, and atmospheric outputs from the Global Environmental Multiscale (GEM) model. At an even higher resolution of 10 km, ANUSPLIN consists of daily maximum and minimum temperature and precipitation data developed using a thin-plate smoothing spline-based interpolation algorithm applied to observed climate-station data from across Canada. Results of this interecomparison, confirm earlier suspicions that, for large alpine-fed watersheds like the Athabasca, some data sets have systematic differences that vary with regional climate characteristics and specifically, relatively higher variations in mountainous regions where the density of climate observing network is sparse, although the spatial variability in climate is very high.
3C1.4 ID:6641 14:15
An analysis of climate extremes in Canada using gridded downscaling of regional climate model simulations Stephen Sobie , Alex Cannon , Trevor Murdock Pacific Climate Impacts Consortium Contact: [email protected]
Demand for projections of climate extremes has arisen out of local infrastructure vulnerability assessments and adaptation planning. An important component of this future planning requires detailed knowledge of how extreme climate events are likely to change in the future. To address this need, we have produced projections of climate extremes at high spatial resolution by statistically downscaling regional climate model output from the North American Regional Climate Change Assessment Program (NARCCAP). Simulations from both past (1971-2000) and future (2041-2070) intervals are downscaled from the regional models' standard 50km resolution to a 10km resolution defined by the Daily 10km Gridded Climate Dataset for Canada (ANUSPLIN Point Grid). Two different methods are applied to downscale the output: Bias Correction/Spatial Disaggregation (BCSD) and Bias Correction/Climate Imprint (BCCI). Both methods employ quantile mapping to adjust bias between model and observations, but differ in how daily realizations of temperature and precipitation are simulated. The increased resolution

provided by both techniques improves the representation of topographic features, particularly valley temperature and precipitation effects. A range of extreme values, from simple daily maxima and minima to complex multi-day and threshold-based climate indices have been computed and analyzed from the downscaled output. Selected results will be shown for the CLIMDEX set of indices of extremes and an application of this work studying precipitation extremes in the context of highway construction and maintenance in British Columbia will also be discussed.
3C1.5 ID:6701 14:30
Past climate and future climate change predictions at Norman Wells, Northwest Territories and possible implications for industry
Martin Lacroix MWH Canada Inc. Contact: [email protected]
Past and future climate are important to note as there are many implications that could not only impact oil and gas endeavours in the north, but that will also have notable connections regionally on such factors as permafrost, vegetation and wildlife. The Climate Normals for Norman Wells will be highlighted and discussed in order to portrait the general recent climate in the region. Cumulative departures for temperature and precipitation will be highlighted. In addition, projected future climate scenarios will be discussed by evaluating the existing literature, such as that from the Intergovernmental Panel on Climate Change (IPCC) and the Arctic Climate Impact Assessment (ACIA). Future modelling scenarios will be derived from an ensemble of models using outputs from tools readily available, and predictions will be based on the A2 greenhouse gas emission scenario. The climate change assumptions/predictions will centre on the 2020s, 2050s and 2080s. This information will not only be useful to industry, but will better prepare government and local interest groups and stakeholders with some of the potential anticipated changes expected in the North.
3C1.6 ID:6687 14:45
Dynamically downscaled climate change projections for Southern Ontario and the Great Lakes Basin
Marc d'Orgeville 1, W. Richard Peltier 2, Jonathan Gula 3 1 IBM / University of Toronto 2 Univesity of Toronto 3 University of California, Los Angele Contact: [email protected]
The influence of large masses of fresh water such as the Great Lakes on the global warming process has only recently come to be amenable to direct

numerical analysis. In Gula and Peltier (2012), a 1-D lake evolution model FLake has been coupled to the regional climate model WRF and employed to dynamically downscale climate change projections obtained using the CCSM3 global coupled climate model. In this work downscaled projections are produced in a two step nesting procedure. WRF is first forced from CCSM3 output over a domain that includes the entire North American continent at 30 km resolution, which itself forces the innermost domain that covers Ontario and the Great Lakes at the target 10 km resolution. In the further development of this work, we will present initial results obtained from multiple lake resolving WRF simulations forced by an ensemble of climate change projection obtained with the further improved global model CESM1.
Monitoring - Operations and challenges PART 1 / Surveillance - Opérations et défis PARTIE 1
Room / Endroit (TCUP Salon B), Chair / Président (Qian Li ), Date (29/05/2013), Time / Heure (13:30 - 15:00)
3C2.1 ID:6907 13:45Pan Parapan American Games 2015 – Atmospheric Monitoring John Macphee 1, David Sills [email protected] 2, Paul Joe [email protected] 2, Rob Simpson [email protected] 3 1 Pan Parapan Games Projects Office 2 Cloud Physics and Severe Weather Research 3 Weather & Enviromental Operations Contact: [email protected]
In the summer of 2015, Canada will welcome the 41 other countries/nations of the Americas as Toronto and the municipalities of the Greater Golden Horseshoe area in Ontario host the 2015 Pan American and Parapan American Games. The Games will attract approximately 10,000 athletes and support staff as well as 250,000 visitors, numbers which match those of the Vancouver Olympic Games. Environment Canada will establish, upgrade and enhance atmospheric monitoring stations and platforms to provide critical weather information to ensure the weather-related health and safety of the participants and Canadians. The gaps in the existing synoptic observational network will be enhanced by the addition of all season weather stations, quality monitoring stations; a Watchkeeper buoy, a wave rider buoy and a dozen or so compact weather

stations. This mandated Pan Am monitoring network will be integrated with a multi-scale, multi-parameter, Science driven, showcase network. It is envisioned that this meso-scale to urban scale network will provide valuable data-set and opportunities to: • validate fine scale numerical environmental prediction models • demonstrate enhanced warning capability in a research environment • test, evaluate and demonstrate new monitoring technology, • test, evaluate and demonstrate the use of high density observations • integrate various new observing technologies to monitor the atmospheric environment,
3C2.2 ID:6745 14:00
The Emergence of Private Mesonets in Canada Andrew Nadler , Ian Nichols Weather INnovations Contact: [email protected]
Surface weather monitoring has typically and officially been the responsibility of government entities, offered as a public service for the protection of lives, property, and economic prosperity. Within Canada, Environment Canada has a long history of providing quality data from its core network of surface weather and climate stations and volunteer observers. More recently, with continuing resource limitations, governments are less able to adequately maintain comprehensive monitoring networks. The number of volunteer observers has also been reduced. As a result, data users, both within and external to the meteorological services are not able to access the information that they need. Some of these data users include weather forecasters, emergency managers, flood forecasters, agricultural producers, insurance companies, power utilities, transportation authorities, researchers, educators, and hobbyists. Over the years, there has been a substantial increase in the number of ‘unofficial’ weather observing stations and networks. This has been the result of; 1) the need for, or interest in site-specific weather observations, and 2) the availability and affordability of consumer-grade weather systems. To fill the gaps, various organizations, both public and private, have invested in weather monitoring systems. Given the diverse data needs, the types and quality of equipment varies substantially. Quite obviously, all types of data are not suitable for all uses. For example, a farmer wanting to know approximate rainfall amounts or wind speed will not require the same calibre of equipment as a climate researcher. While most of these observing systems could never be considered ‘climate stations’, their weather data can still be of considerable value for certain applications, particularly if the user has knowledge of the data source and the limitations associated with its use. Weather INnovations, a private Canadian weather services provider with monitoring networks in several provinces, has recently partnered to acquire WeatherFarm, resulting in a total monitoring network of approximately 1500 stations. Going forward, the challenges will be to ensure that adequate resources are available for station maintenance, equipment upgrades, and data quality assurance, all

necessary for long-term network sustainability. Moving towards the concept of ‘Network of Networks’, both public and private networks, the interactions and partnerships between data providers and data users will continue to evolve.
3C2.3 ID:6749 14:15
CoCoRaHS Canada: Volunteer Precipitation Monitoring Network Alison Sass , Andrew Nadler , Spencer Smit Weather INnovations Contact: [email protected]
Community Collaborative Rain, Hail, and Snow (CoCoRaHS) is a non-profit, grass-roots network of volunteers who manually measure and report rain, hail, and snow on a daily basis. With an emphasis on training and education, observers use inexpensive standardized equipment to provide a valuable and accurate precipitation dataset that is publically available. Launched in Fort Collins, Colorado in 1998, CoCoRaHS now has more than 16,000 volunteers across the United States. Following serious flooding in Manitoba in 2010, the Province recognized the need for more rain and snow information to improve flood prediction. Based on the success of CoCoRaHS USA, the Province of Manitoba and WeatherFarm (now operated by Weather INnovations) partnered to initiate CoCoRaHS Canada in late 2011. A pilot was launched in Manitoba, where there are now over 100 registered volunteers. Saskatchewan is slated to come on board in early spring of 2013 with support from the Water Security Agency, Agriculture and Agri-Food Canada, and Environment Canada. The goal of the program is to expand nation-wide over the coming years. Volunteer observers use four inch cylindrical rain gauges to measure rain and snowfall on a daily basis. They then submit their observations to the CoCoRaHS website where their data is instantly accessible to the public. In the winter, volunteers also measure snow depth and snow water equivalent of new and total snow. Observers are trained using web-based videos, slideshows, documents, and in-person sessions to ensure that the observations are accurate and consistent. Data from CoCoRaHS is used by a variety of organizations, including the National Weather Service, universities, government, and watershed authorities. Flood forecasters make extensive use of the data to assist with flood monitoring and prediction. CoCoRaHS compliments existing automated weather networks by filling gaps and validating surrounding observations.
3C2.4 ID:6860 14:30
Performance Characteristic Improvements of the U.S. National Lightning Detection Network
Amitabh Nag , Herb Winston Vaisala Incorporated Contact: [email protected]
Updates are planned in 2013 to the U.S. National Lightning Detection Network®

(NLDN®) that will lead to performance characteristics improvements. Vaisala’s LS7002 sensors will be deployed, replacing the older generation LS7001 and IMPACT sensors. The LS7002 employs the latest digital sensor technology along with improved embedded software with enhanced features. Digital processing improves the sensitivity of the sensor to low amplitude lightning-generated signals. Digital filtering of local noise sources improves the signal-to-noise ratio along with flexibility in site-selection. These have led to enhanced detection of cloud and cloud-to-ground lightning. The LS7002 sensors use onset corrections, which accurately determine the arrival time of electromagnetic waveforms from lightning events at a sensor. This reduces the timing error and improves the accuracy with which lightning events can be geolocated. Additional factors such as propagation across uneven terrain, varying ground conductivity, and the accurate speed of electromagnetic waves propagating over ground are also being accounted for. This has led to an improvement in the median location accuracy (given by the length of the semi-major axis of the 50% error ellipse) of the NLDN from about 300 m to about 150 m in the interior of the network. These performance characteristics continue to be validated by triggered lightning, tower, and camera studies.
3C2.5 ID:6921 14:45
Meteorological Service of Canada Geospatial Strategy
Tom Kralidis MSC, Environment Canada Contact: [email protected]
Geospatial is vital to the delivery of the Meteorological Service of Canada's (MSC) mandate. The MSC mandate is key to Environment Canada (forecasting daily weather conditions and warnings, and providing detailed meteorological information to all of Canada), and to the Government of Canada's Strategic Outcomes (Canadians are equipped to make informed decisions on changing weather, water and climate conditions). The MSC has developed a geospatial strategy to leverage geospatial standards and technology in delivering the organizational mandate. This presentation will focus on the implementation of the strategy, including highlighting geospatial related projects: Canadian Atmospheric Data Discovery Portal (CADD) and the OGC Hydrology Climatology-Hydrology Information Sharing Pilot (CHISP-1). This presentation will be of interest to CMOS participants given the growing requirement to discover, visualize and access Canadian sources of atmospheric data using international standards for sharing data.

Polar Applications PART 1 / Applications polaires PARTIE 1
Room / Endroit (TCUP Salon C), Chair / Président (James R. Drummond ), Date (29/05/2013), Time / Heure (13:30 - 15:00)
3C3.1 ID:6852 INVITED/INVITÉ 13:30
Pan-Arctic, CALIOP-based analysis of PSC optical dynamics Norman T. O'Neill 1, Auromeet Saha 1, Glen Lesins 2, Christopher Perro 2, Thomas J. Duck 2, Konstantin Baibakov 1, Andreas Herber 3, Christoph Ritter 4, Liviu Ivanescu 1, Sareh Hesaraki 1 1 Université de Sherbrooke 2 Dalhousie University 3 Alfred Wegener Institute, Bremerhaven 4 Alfred Wegener Institute, Postdam Contact: [email protected]
An investigation of stratospheric optical depths (SODs) over a multi-year year period (Sept. 1, 1 2007 to June 30, 2011) was carried out with the objective of better understanding the optics and dynamics of Polar stratospheric clouds (PSCs). Pan- Arctic averages of stratospheric CALIOP SODs in the presence of known PSCs were analyzed as a function of their associated temperature, depolarization ratio and SOD averaging scheme: we were particularly interested in the optical dynamics of PSCs in evolving from sub-micron sulphate aerosols to super-micron crystals or super-cooled droplets. The Arctic “ozone hole” event during the winter of 2010 / 2011 is included in the multi-year period: this provided further motivation for our study given the link between the chemical reactions that destroy ozone, the role of PSCs in facilitating these reactions and the links between PSCs and sub-micron stratospheric sulfates. The analysis also includes case studies of backscatter lidar and starphotometer measurements acquired at the Polar Environment Atmospheric Research Laboratory (PEARL) at Eureka [Nunavut, Canada] and the Koldewey station at Ny- Alesund [Spitsbergen, Norway] as a means of confirming / validating the CALIOP measurements.
3C3.2 ID:6460 14:00The High Arctic: A Different Planet without the Inconvenience of Space Travel
James Drummond Dalhousie University Contact: [email protected]
The Canadian High Arctic is a vast area of the planet that is very different from lower latitudes. This is true for all regions of the atmosphere as well as many

other Earth Systems. The lower atmosphere has no surface solar heating term for a large portion of the year; the winter Arctic vortex and lack of sunlight produces a different and variable chemistry for the middle atmosphere and in the upper reaches of the atmosphere the interaction of the magnetic pole, charged particles and the solar wind produces unique effects. In addition, this new planet is changing rapidly. If the High Arctic is a different planet, then the Polar Environment Atmospheric Research Laboratory (PEARL) at Eureka, Nunavut (80N, 86W) is our spaceship to this planet. Since 2005 atmospheric measurements at PEARL have been conducted by an international team on a year-round basis using a wide variety of instruments to help us understand this environment and how it interacts with the rest of the planet. This talk will outline some of the unique advantages of PEARL and some of the most significant things that we have learned as a result of those measurements such as the influence of the persistent near-surface winter inversion, the intrusion of aerosols from lower latitudes and the largest ozone depletion ever recorded in the Arctic. We will also look at what needs to be done in the future to expand our knowledge. PEARL funding has been provided by: Aboriginal Affairs and Northern Development Canada, Arctic Research Infrastructure Fund, Atlantic Innovation Fund/Nova Scotia Research Innovation Trust, Canadian Foundation for Climate and Atmospheric Science, Canadian Foundation for Innovation, Canadian Space Agency, Environment Canada, Government of Canada International Polar Year, Natural Sciences and Engineering Research Council, Ontario Innovation Trust, Ontario Research Fund, and the Polar Continental Shelf Program.
3C3.3 ID:6879 14:15Atmospheric Composition Measurements in the High Arctic 1994- 2008 Pierre Fogal 1, James Drummond 2, Richard Mittermeier 3, Hans Fast 4 1 University of Toronto, Department of Physics 2 Dalhousie University, Department of Physics & Atmospheric Science 3 Environment Canada 4 Environment Canada, Retired Contact: [email protected]
One of the attractions of a comprehensive data archive, is the ability to re-analyze a data-set with new and improved techniques. From 1994 to 2008, a Bomem DA-8 high resolution Fourier Transform Spectrometer (FTS) recorded high- resolution absorption spectra of the atmosphere at one of the sites of what is today called the Polar Environment Atmospheric Research Laboratory (PEARL) located at approximately 80N, 86W near the Environment Canada (EC)Eureka Weather station on Ellesmere Island. Through out that period, the DA-8 was operated by EC and later the Canadian Network for Detection of Atmospheric Change (CANDAC) on an episodic basis. Initially, the data was analyzed for column amounts only [Fast, et al., 2011]. Since those initial

analyses there have been significant improvements in computer power in the knowledge of basic spectroscopic parameters and the advent of improved retrieval techniques such as optimal estimation . Applying these techniques to the original data provides a way of accessing and improving this unique long-term record. However there are problems due to the challenges of accessing data files recorded in older formats and getting all the data into a consistent format for processing. This talk will discuss some of the issues raised by this trip into the archives, present some comparisons to the state of the art Bruker IFS125HR that replaced the DA8, and discuss the improvements obtained over the initial analyses. This research is supported by the Canadian Foundation for Climate and Atmospheric Sciences (now the Canadian Climate Forum) and the Canadian Space agency. H. Fast et al., A Ten-Year Record of Arctic Trace Gas Total Column Measurements at Eureka, Canada, from 1997 to 2006, Atmos. Ocean, doi:10.1080/07055900.2011.562470
3C3.4 ID:6876 14:30
Seasonal and inter-annual variations in Aerosol optical properties over the High Arctic Auromeet Saha 1, Norman T. O'Neill 1, Robert S. Stone 2, Kimberly Strong 3, Camille Viatte 3, Edwin Eloranta 4, Ihab Abboud 5, Vitali Fioletov 5, Andreas Herber 6 1 Université de Sherbrooke 2 CIRES/NOAA ESRL 3 University of Toronto 4 University of Wisconsin 5 Environment Canada 6 Alfred Wegener Institute Contact: [email protected]
Sunphotometer/sky radiometer measurements have been acquired at Polar Environment Atmospheric Research Laboratory (PEARL) in Eureka [Nunavut, Canada] since the spring of 2007. Based on six years (2007-2012) of continuous spring/summer observations, we report results on the seasonal and inter-annual variations of aerosol optical depth (AOD). The spectral AOD data were resolved into fine (sub-micron) and coarse (super-micron) components using the Spectral Deconvolution Algorithm (SDA) and are examined in conjunction with the profiles of aerosol backscatter coefficient and depolarization ratio obtained from Arctic High Spectral Resolution Lidar (AHSRL), columns concentrations of CO measured using a Bruker Fourier transform spectrometer and SO2 from Brewer spectrometers. The results are analyzed in the context of fine-mode biomass burning and

anthropogenic pollution events that occur typically during spring, volcanic events (e.g., the Kasatochi eruption of August 2008 and the Sarychev eruption of June 2009), and coarse mode events (thin clouds, ice crystals and mineral dust). The monthly average fine mode AOD climatology showed a spring to summer decrease, attributable to biomass burning and/or anthropogenic pollution. The AOD variations over Eureka are compared with sunphotometer measurements made at other high- Arctic sites, including Alert, Resolute Bay, Barrow, Thule, Kangerlussuaq, Ittoqqortoormiit, Ny-Alesund, Hornsund, and Tiksi, and sub-Arctic sites such as Bonanza Creek, Iqaluit Yellowknife, and Yakutsk.
3C3.5 ID:6395 14:45
Arctic warming amplification in the stable winter boundary layer Glen Lesins , James Drummond , Thomas Duck Dalhousie University Contact: [email protected]
The very stable boundary layer in the Arctic winter suppresses turbulent fluxes and dynamically isolates the surface from the free troposphere. As a result surface forcing anomalies are prevented from easily mixing in the vertical resulting in an enhancement of the surface air temperature response. The enhanced surface response increases the magnitude of the Arctic amplification from forcings such as enhanced meridional transport and sea ice loss. Evidence is presented to demonstrate the role of the stable winter Arctic boundary layer in magnifying Arctic amplification by analyzing radiosonde profiles from 22 Canadian stations extending from 1971 to 2010. The Amplification factor varies from 1.4 to 5.2 depending primarily on the station’s latitude. The surface energy balance equation is used to relate the response of the surface temperature to changes in the surface energy fluxes. Based on this analysis, there are four factors that contribute to Arctic amplification: 1) a larger change in net downward radiation at the Arctic surface compared to the global average, 2) a larger below surface conductive heat flux change than the global average, 3) weaker sensible and latent heat flux responses and 4) a colder skin temperature compared to the global average, which forces a larger surface warming to achieve the same increase in upward longwave radiation. The observed correlations between the warming trends and both the inversion strength and the surface air temperature are shown to be consistent with the surface energy budget analysis.

Management of ground and surface water PART 1 / Gestion des eaux souterraines et de surface - PARTIE 1
Room / Endroit (TCUP Gall. A), Chair / Président (Garth van der Kamp ), Date (29/05/2013), Time / Heure (13:30 - 15:00)
3C6.1 ID:6821 13:30An aquatic ecosystem health monitoring tool for the Northern Great Plains Iain Phillips 1, Glen Mcmaster 2, Michelle Bowman 3, Doug Chivers 4 1 Water Security Agency of Saskatchewan, Saskatoon, Saskatchewan 2 Water Security Agency of Saskatchewan, Regina, Saskatchewan 3 Forensecology, Guelph, Ontario 4 Department of Biology, University of Saskatchewan, Saskatoon, Saskatchewan Contact: [email protected]
The availability and quality of surface water in southern Saskatchewan is a key prerequisite for continued economic and population growth. To facilitate this expansion and development, tools for assessment of surface water quality are needed that go beyond classic water chemistry to provide a longer-term, more cumulative assessment of whole ecosystem health which are currently lacking. Here we present the ecosystem health measurement tool developed at the Water Security Agency for surface waters. This ecosystem health tool is based on aquatic macroinvertebrate community composition, and sets site specific objectives using reference sites which are least-impacted by human activity. Further, the calculation of site health is based on multiple metrics of ecosystem health each forensic of particular stressors and evaluated using a multivariate Test Site Analysis tool that provides a magnitude of impairment and significance of impairment. This multivariate ecosystem health tool is flexible in its construction, allowing continuing development to adapt to the stressors and requirements of the province as it grows.
3C6.2 ID:6751 13:45
Investigating links between lake sturgeon (Acipenser fulvescens) habitat and geomorphology in the Saskatchewan River system using geomorphic response units (GRU)
Meghan Carr 1, Christine Lacho 2, Michael Pollock 3, Doug Watkinson 4, Karl-Erich Lindenschmidt 1 1 Global Institue for Water Security, University of Saskatchewan, Saskatoon, SK 2 Department of Biology, University of Lethbridge, Lethbridge, AB 3 Saskatchewan’s Water Security Agency, Saskatoon, SK 4 Fisheries and Oceans Canada, Winnipeg, MB
Contact: [email protected]
Lake sturgeon (Acipenser fulvescens) are a large migratory fish species native to the Saskatchewan River system. This species is currently challenged by habitat fragmentation and degradation due to river impoundment. Lake sturgeon are listed as endangered by COSEWIC (Committee on the Status of Endangered Wildlife in Canada) and are being considered for listing under SARA (Species at Risk Act). Lack of habitat data for the Saskatchewan River system hinders effective management practices for this species and the rivers in which they live. Given this lack of knowledge it is crucial that these data gaps be filled as soon as possible to ensure the recovery of the species. One such method has recently been developed combining techniques from various disciplines. GIS (Geographic Information System) and multivariate derived geomorphic response units (GRU) define reaches along river systems which exhibit similar geomorphic structure and provide a link between the hydrological regime and species habitat preference. Telemetry data collected in ongoing lake sturgeon studies in the Saskatchewan River system provide location and migration data allowing for the characterization of known spawning and over-wintering sites. Ultimately, by combining GRUs and telemetry data sets we can characterize areas of known use to locate previously unknown areas. Identification of these links has the potential to greatly increase efficiency of managing this endangered species by allowing a priori selection of sampling sites and prediction of how the effects of anthropogenic changes in river morphology may impact sturgeon habitat. Methodology and preliminary results, which show a correlation between GRUs and lake sturgeon overwintering areas, will be discussed.
3C6.3 ID:6829 14:00A Balancing Act: Mulit-purpose Water Management and Species at Risk.
Corie White Water Security Agency Contact: [email protected]
Multi-purpose water management of the South Saskatchewan River, particularly the Lake Diefenbaker Reservoir, not only integrates the desires of multiple stakeholders; but, also needs to incorporate the regulatory and conservation requirements of a Species at Risk. The Piping Plover (Charadrius meleodus circumcintus) is listed as Endangered under the Species at Risk Act and low reproductive success as a result of spring water levels increases the primary threat to the significant breeding population that uses this reservoir. The goal is to find a balance between the legal and conservation requirements of the species while providing water managers with operational flexibility. We achieve this through a risk assessment process that integrates water management and biological data to estimate the anticipated risk to piping plover productivity. This risk is considered when developing the best operating plans for the upcoming season. Furthermore, during breeding season we employ a flexible adaptive framework rather than firm targets that synthesizes current nest elevation and

water level forecasts to assess real time risk and inform decisions regarding optimal risk reduction activities (eg. nest translocation). The application of risk reduction activities has been found to effectively reduce the risk associated with the water management activities while providing water managers with flexibility.
3C6.4 ID:6363 14:15
Establishment of Environmental Instream Flow Needs for the Qu’Appelle River System Jeff Sereda , Glen Mcmaster , Mike Pollock , John-Mark Davies Water Security Agency Contact: [email protected]
Water demand and allocation are increasing in the Qu’Appelle River systems, but little information on environmental instream flow needs (EIFN) has been collected or interpreted to support sustainable management of water supplies. Fish habitat quality and availability varies with lake levels and channel flows. During low flow fish retreat to lakes, but to varying degrees are reliant on large flood events in the river sections for spawning, migration etc. A fisheries habitat decision support tool has been developed to help guide the establishment of flow/elevation objectives for fisheries habitat throughout the Qu’Appelle system. Changes in flow and lake elevation (as predicted by the Water Security Agency’s flow and lake elevation hydrologic model) can be translated into spatially explicit fisheries habitat outcomes (e.g., percent change in wetted area). The study area encompasses the fish habitats impacted directly or indirectly by alterations in hydraulic regimes within the Qu’Appelle River and the Qu’Appelle chain of lakes (Buffalo Pound, Last Mountain, Pasqua, Echo, Mission, Katepwa, Crooked and Round). Simulations are being conducted to establish water elevation/discharge objectives for minimal flow and the conservation of fish habitat during critical periods (i.e., spawning season).
3C6.5 ID:6292 14:30
Nutrient management in the lower Qu’Appelle Valley lakes
John-Mark Davies Water Security Agency of Saskatchewan Contact: [email protected]
Preventing and reversing eutrophication remains a top priority of lake management. While the central role of nutrients is generally well understood, experience with nutrient abatement programs has demonstrated the challenge in predicting individual lake responses. Naturally eutrophic lakes can be particularly challenging because, even after substantial decreases in nutrient concentration, reduction in algal growth and blooms may be modest or not perceptible to the public. The prairies have nutrient rich soils that contribute to the naturally high background nutrient concentrations found in lakes and rivers. This condition has been confirmed by paleolimnological and historic accounts. Despite high

background concentrations the addition of nutrients from human activity has been associated with degraded water quality. This study examines water quality changes associated with the decrease in total nutrient concentrations found in the Qu’Appelle Valley lakes downstream of Regina, Saskatchewan. Previous management initiatives have resulted in decreased total phosphorus and nitrogen concentrations. Further nutrient reductions are being targeted through improved wastewater treatment and beneficial management practices in the watershed. This presentation will present an overview of the recent history, successes and challenges to nutrient management of these lakes.
3C6.6 ID:6500 14:45
Ground Water Quality in Saskatchewan: Using the Rural Water Quality Database
Lorelei Ford Saskatchewan Water Security Agency Contact: [email protected]
The Water Security Agency currently maintains one of the largest ground water quality databases in Canada. From 1997-2011, the Water Security Agency delivered the Rural Water Quality Advisory Program (RWQAP) which resulted in the collection of water quality data from private wells throughout Saskatchewan. Containing over 4,200 records, the database has been used to identify ground water quality issues that may impact human health through consumption of water from private wells. Identifying areas of the province where ground water quality poses a risk to human health due to natural or anthropogenic causes can support or inform future risk assessments, focus government programming, and direct efforts to educate communities or individuals dependent on ground water. Examples of how the database has been used in the past will be case studied and future prospects for the data will be explored.
Snow, Ice, Permafrost and Cold Regions Processes PART 2 / Neige, glace, pergélisol et processus reliés PARTIE 2
Room / Endroit (TCUP Gall. B), Chair / Président (Stephen J. Dery ), Date (29/05/2013), Time / Heure (13:30 - 15:00)
3C7.1 ID:6300 13:30

Characterizing the uncertainty in snow cover variability and change over northeastern North America Ross Brown , Richard Harvey Environment Canada Contact: [email protected]
Snow cover plays an important role in the economy, ecology and climate of northeastern North America. Documenting the current state of snow cover (variability and trends) and how it will change under a warming climate is a challenge as there are several key areas of uncertainty involved. First, the available observations have various constraints such as limited spatial and temporal coverage, biases and inhomogeneities that contribute to observational uncertainties. Second, differences in GCM representations of the global climate system combined with differences in RCM families and snowpack physics generate model-related uncertainties in projections of future snow cover changes. This presentation will attempt to characterize some of these sources of uncertainty in snow cover from analysis of multiple observational datasets, CRCM perturbed physics simulations, and a multi-model ensemble of CMIP5 simulations and projections.
3C7.2 ID:6333 13:45
Arctic lake ice cover under contemporary and future climate conditions Laura Brown 1, Claude Duguay 2, Patrick Samuelsson 3, Chris Derksen 1 1 Environment Canada 2 University of Waterloo 3 Swedish Meteorological and Hydrological Institute Contact: [email protected]
Lake ice cover is a robust indicator of climate variability and change. Recent studies have demonstrated that ice break-up dates, in particular, have been occurring earlier in many parts of the Northern Hemisphere over the last 50 years in response to warmer climatic conditions in the winter and spring seasons. It is important to compare the observed impacts of variability and trends in air temperature and precipitation over the last five decades, with projected trends from global climate models in order to quantify future changes in the timing and duration of ice cover (and ice thickness) on Arctic lakes. This will likely, in turn, have an important feedback effect on energy, water, and biogeochemical cycling in various regions of the Arctic. The Canadian Lake Ice Model (CLIMo) was used to simulate both the contemporary and future lake ice conditions for the Arctic regions, forced with new downscaled data specific for the Arctic domain (at a resolution of 0.44 degrees). The forcing climate scenario data was produced by the Rossby Centre regional atmospheric model (RCA4) using reanalysis data or GCMs as boundary conditions (Era-Interim, CanESM2, EC-Earth, NorESM1-M, and MPI-ESM-LR) with the RCP8.5 emission scenario for the future climate conditions. The simulations were run for multiple lake depths to represent both shallow and deep lakes, and with and without snow cover to represent the effects

of snow redistribution over the ice surface. The 30-year mean ice break-up, freeze-up, thickness and composition (snow ice versus clear ice) was simulated and compared between the scenarios for the entire Arctic region for 1981 - 2010, 2021 - 2050, and 2071 – 2100 to examine the possible changes to the ice cover regimes. Additionally, comparisons between the simulations and available in situ data for the contemporary climate were explored at selected locations. Future alterations to the present day regimes could result in major ecosystem changes as well as the potential disappearance of perennial ice cover at high latitudes.
3C7.3 ID:6505 14:00
Sensitivity of hydrological process simulations to precipitation phase differentiation Phillip Harder , John Pomeroy University of Saskatchewan Contact: [email protected]
Precipitation phase differentiation algorithms used to simulate cold region hydrological processes can vary significantly. Typically, these algorithms are based upon empirical relationships with near surface meteorological conditions. As many lack a physical basis, there is uncertainty in their spatial and temporal transferability. In order to quantify the sensitivities and uncertainty these methods introduce into hydrological simulations, a flexible, modular, hydrological modelling platform was employed to calculate a set of hydrological indices with various phase differentiation algorithms. The phase differentiation algorithms compared included the UBC model double temperature threshold, a physically based psychrometric energy balance method and various commonly utilized, single and double, air temperature thresholds. Hydrological indices assessed with these various algorithms include peak snow water equivalent, snow free date, duration of snowcover, seasonal actual evapotranspiration, seasonal discharge and peak discharge. The variability and sensitivity of hydrological indices to phase estimation algorithms is compared amongst subarctic, subalpine and prairie headwater basins under a range of weather conditions.
3C7.4 ID:6728 14:15
Impacts of spatial scaling of unstructured meshes on calculating surface irradiance Christopher Marsh 1, John Pomeroy 1, Raymond Spiteri 2, Danny Marks 3, Masaki Hayashi 4, Scott Munro 5, Michael Demuth 6, Howard Wheater 7 1 Centre for Hydrology, University of Saskatchewan 2 Numerical Simulation Lab, Dept. Computer Science, University of Saskatchewan 3 USDA-ARS Northwest Watershed Research Center, Boise, ID 4 Department of Geoscience, University of Calgary 5 Department of Geography, University of Toronto 6 Cryosphere Geoscience Section, Geological Survey of Canada 7 Global Institute for Water Security, University of Saskatchewan
Contact: [email protected]
The use of unstructured triangular meshes in hydrological models is becoming increasingly common. This is due to an increased flexibility and precision in representing important characteristics of the model domain such as streams, rivers, and basin delineations as compared to traditional raster-based approaches. When producing an unstructured mesh from a raster, triangles are created such that the maximum difference between the triangle’s elevation and the raster’s elevation at any given point is no more than a given tolerance. Stringent tolerances produce a greater number of triangles, and thus the time required for simulation of the model increases. Raster resolution also affects creation of unstructured meshes because low- resolution rasters degrade the ability of the triangles to represent true terrain variation. Generally, an unstructured mesh can be shown to represent landscape details using far fewer cells than a raster. Previous analysis showed that terrain shading in the Marmot Creek basin could be effectively calculated using an unstructured mesh containing roughly 3% of the cells required by the corresponding high- resolution raster (i.e., 550,000 vs. 20,000,000). The use of unstructured meshes in hydrological modeling has large potential advantages. The analysis presented illustrates how the model performance is affected by different tolerances and raster resolutions. An unstructured triangular mesh horizon-shading model was applied to mountainous research basins in Marmot Creek (AB), Peyto Glacier (AB), Lake O’Hara (BC), and Reynolds Creek (ID, USA). Combinations of raster resolution and tolerance were tested over each basin. Predictive capability was assessed by comparing unstructured triangular mesh results to those from the raster with the highest resolution. Results show that the predictive capability of unstructured meshes was higher if they were created using smaller tolerances. Larger tolerances are vulnerable to sharp-featured terrain elements, and so care should be taken to use sufficiently small tolerances when generating unstructured meshes.
3C7.5 ID:6758 14:30Application of a large aperture scintillometer to measure fluxes of sensible heat over snow
Warren Helgason , Bruce Johnson University of Saskatchewan Contact: [email protected]
Practical hydrological applications often require estimates of snowmelt rates over scales that are much larger than those at which we can measure the governing fluxes of energy. New measurement techniques, capable of measuring energy balance components over large areas, are warranted for improving the scaling relationships of hydrological processes and for validation of models. An example approach that is increasingly being used in hydrological studies is the scintillometer technique, where fluctuations in the refractive index of infrared energy transmitted over multi- km pathlengths can be related to the path-
averaged sensible heat flux. This technique may provide valuable insight into the role of the sensible heat flux upon snowmelt at large scales, but few studies have been conducted over snow surfaces. A large aperture scintillometer has been set up over a snow covered field near Saskatoon, Saskatchewan to measure the sensible heat flux over a path length of 1300 m. Based on this preliminary investigation, it was found that the 30-minute sensible heat fluxes compare very well to those measured using the eddy covariance technique in the same field. The results from the 2012 winter season will be presented along with a discussion of data processing procedures and practical considerations for winter use.
3C7.6 ID:6474 14:45
Characteristics of the turbulent flow in the surface layer of a Tropical Glacier.
Maxime Litt Université Joseph Fourier, INP Grenoble 1, Laboratoire des Transferts en Hydrologie et Environnement Contact: [email protected]
Energy balance studies on glaciers mostly use aerodynamic profile methods, assuming hypotheses of Monin- Obukhov similarity theory are valid, in order to compute sensible and latent turbulent heat fluxes. Nevertheless, various turbulence measurements have shown that the turbulent flow in the surface layer is not in equilibrium and stationnary within mountainous rough topography. Few of these studies focus on tropical glaciers, and little is known about the dynamics of the surface layer in these environnments. We thus have deployed an extensive micro-meteorological experiment within the atmospheric surface layer over the ablation zone of the tropical Zongo glacier, Bolivia, during the dry season from July to August, 2007. Stations were installed around 5050 m a.s.l. They included two complete eddy covariance systems at a 2-m mean level and a 6-m mast measuring the mean profiles of air temperature and of wind speed. Data is used to characterize the conditions in the surface layer.Weakly stable conditions prevailed in the first meters above the ice or snow surface. With weak large scale forcing, a katabatic downslope flow with a wind maximum at about 2-m height usually appeared in the middle of the afternoon and maintained itself during most of the night. Profile data is fitted to derive roughness lenghts and characterize their evolution. The study of statistical moments of high frequency wind speed and temperature data shows that the wind regime was highly gusty and irregular. Stationary conditions were rarely encountered. Characteristics and structure of the turbulent flow were studied using spectral analysis. It shows that the observed turbulence cannot be generated only by local shear and that low frequency perturbations interact with the surface layer turbulence and lead to divergence from the classical Kansas surface layer curves. We compare the spectra for different typical meteorological conditions and katabatic wind maximum heights. It gives us insights on the extent of these perturbations regarding to the conditions.We test the influence of the nearness of the wind

maximum on eddy covariance measurements and flux divergence in the few meters above the surface.
Lithospheric structure of North America / Structure lithosphérique de l'Amérique du nord
Room / Endroit (TCUP Gall. C), Chair / Président (Fiona Darbyshire ), Date (29/05/2013), Time / Heure (13:30 - 15:00)
3C8.1 ID:6519 13:30A seismic image of the lithosphere beneath the western Superior Province and the Mid-Continent Rift Andrew Frederiksen 1, Trevor Bollmann 2, Fiona Darbyshire 3, Suzan Van Der Lee 2 1 University of Manitoba 2 Northwestern University 3 Université du Québec à Montréal Contact: [email protected]
The assembly of Laurentia by Precambrian accretion is also believed to have formed the underlying lithosphere. Accretionary signatures are detectable by seismic observations, but subject to modification by later processes, e.g. orogeny, rifting, and plumes. We examine the lithosphere of the Archean Superior Province (SP) and environs using a set of teleseismic P-wave arrivals from Canadian and American instruments, including instruments from the Earthscope Transportable Array, the Manitoba Teleseismic Array, and the Canadian National Seismograph Network, as well as past temporary experiments. The resulting 3-D tomographic model has high resolution beneath the Dakotas and Minnesota, provides a first look at the lithosphere beneath Manitoba, and sharpens previously-documented features in Ontario. From the model and previous anisotropy observations, we detect: (i) a large high-velocity feature beneath the western SP, associated with elevated lithospheric anisotropy. The high-velocity feature does not match crustal boundaries; notably, its western edge lies ca. 200 km east of the contact with the Proterozoic Trans-Hudson Orogen (THO). (ii) A low-velocity channel- shaped feature strikes northwest through Minnesota and the Dakotas, associated with weakening anisotropy. (iii) High velocities southwest of (ii), beneath the Minnesota River Valley terrane (MRVT), associated with low anisotropy. We interpret (i) to be accretionary, and contemporaneous with Superior assembly; similar velocity but weaker anisotropy of the MRVT is consistent with vertical-tectonic mechanisms.
The inboard location of the THO contact may indicate modification of the Superior root. The low-velocity channel has no obvious crustal expression, but connects to an offset in the Proterozoic Mid-Continent Rift (MCR) and may be rift-related. The main axis of the MCR is not well-imaged by this data set, but will be examined via the temporary Superior Province Rifting Earthscope Experiment, currently in progress.
3C8.2 ID:6380 13:45
Lithospheric exploration in northeastern North America: the QM-III EarthScope project Fiona Darbyshire 1, Vadim Levin 2, William Menke 3, Alessandro Forte 1, Andrew Hynes 4 1 GEOTOP UQÀM-McGill 2 Rutgers University, USA 3 Lamont-Doherty Earth Observatory, USA 4 McGill University Contact: [email protected]
During the 1990s, the LITHOPROBE Abitibi-Grenville transect collected a vast seismic reflection data set in eastern Canada, illuminating details of crust and uppermost mantle structure. In conjunction with this initiative, a north-south profile of closely-spaced broadband seismographs sought to constrain upper-mantle heterogeneities and seismic anisotropy. One of the most intriguing features of the resulting tomographic models was a low-velocity corridor, interpreted as the signature of hotspot-lithosphere interaction. More recently, a wider region has been studied via P-wave tomography, further constraining the low-velocity corridor and suggesting some intriguing features in the lithosphere further north and east. The QM-III (Québec-Maine Across Three Sutures) EarthScope project seeks to constrain the properties of the lithosphere in eastern Canada and the northeast US, in a region further east where the lithosphere has not been modified by hotspot interaction. A backbone array has been installed along a profile from Maine to James Bay, spanning Archean, Proterozoic and Phanerozoic domains. Three denser subarrays will be deployed to study in more detail the major tectonic boundaries between these domains. The broadband seismic data will be used to test important hypotheses related to continental lithospheric evolution and the interaction of the eastern North American plate with the convecting mantle beneath. In particular we consider lithospheric thickness, the question of whether surface tectonic boundaries have a persistent signature at depth, and the source of seismic anisotropy in the upper mantle.
3C8.3 ID:6565 14:00
Variations in shear-wave splitting across the Mid-Continent Rift Oyekunle Ola , Andrew Frederiksen , Ian Deniset , David Toni
University of Manitoba Contact: [email protected]
The Mid-Continent Rift (MCR) is a major feature of the North American continent: a 1.1 Ga rift that failed to develop into an ocean basin. Though the crustal expression of the rift is preserved, it is impossible to determine from crustal evidence the nature of the lithospheric contribution to the rifting process. The installation of teleseismic instrumentation through the Superior Province Rifting Earthscope Experiment (SPREE) is allowing investigation of the lithosphere beneath the MCR, which will help in addressing questions about the initiation, propagation, and failure of the rift structure. We focus on observing the strength and orientation of lithospheric fabric through measurements of the splitting of teleseismic SK(K)S waves at instruments in and near the rift axis, using the method of Silver and Chan (1991) to find the set of parameters that optimally restores linear particle motion. Preliminary results show that the strong fabric observed in the Superior Province is interrupted by the MCR, suggesting that the rifting process affected the full thickness of the lithosphere. The direction of fabric is close to that of absolute plate motion, implying that an asthenospheric contribution is also present.
3C8.4 ID:6599 14:15
Seismic velocity and attenuation structure beneath the Vancouver Island continental shelf using frequency domain visco-acoustic fullwaveform inversion of multichannel seismic data Subbarao Yelisetti , George Spence University of Victoria Contact: [email protected]
In structures with steep dips and high degree of lateral variation, conventional seismic data processing and tomography are inadequate to obtain high-resolution velocity and attenuation models. Hence we apply frequency domain visco-acoustic fullwaveform inversion – a first application to marine multichannel seismic reflection data on the continental shelf off Vancouver Island. The primary objectives are (i) to obtain detailed seismic velocity and attenuation structure of sediments within the Tofino fore- arc basin, and (ii) to understand the relationship with underlying accreted terranes such as the Crescent terrane and the Pacific Rim terrane. The waveform inversion velocities match well with the sonic velocities from three exploration wells on the shelf. A prominent low velocity zone at a depth of 800-900 m was observed over a lateral distance of ~10 km. Possible interpretations include: (a) lithology changes associated with a high porosity layer; (b) fluid overpressure, and (c) over pressured gas in this potential hydrocarbon environment. This low velocity zone, and other localized low velocity zones are associated with high values of attenuation, defined as the inverse of quality factor (Q). Attenuation values as high as 0.03-0.06 are observed at depths below 1 km, which probably indicates increased clay content and the presence of mineralized fluids. In the mid-shelf region where an anticlinal
structure was observed, shallow high velocities (3-5 km/s) coupled with low attenuation values (< 0.03) were observed at depths below ~ 1km. This is interpreted as the shallowest occurrence of the volcanic Crescent terrane. Seismic velocities are observed to increase landward within the Tofino basin sediments. This indicates the over- consolidation of sediments, associated with the compressional environment at the time of emplacement of Crescent and Pacific Rim terranes. We interpret the sharp increase in sediment velocity about 10 km west of Vancouver Island as possible transition to the underlying Pacific Rim terrane.
3C8.5 ID:6273 14:30
Predicting Mean Temperatures of Planetary Mantles Elliott De Andrade 1, Gary Jarvis 2, Julian Lowman 1 1 University of Toronto 2 York University Contact: [email protected]
Two-dimensional numerical models of mantle convection in plane-layer and cylindrical-shell geometries were used to compute the mean temperatures of planetary mantles for varying Rayleigh numbers, rates of internal heating and different degrees and styles of depth-dependent viscosity. Mean temperatures obtained from a large number of these numerical models were inverted to estimate the values of three parameters in a simple scaling formula which was designed to predict the mean temperature of a planetary mantle for a given Rayleigh number, viscosity stratification and rate of internal heating. Successful parameterization of the model temperatures depends on how the Rayleigh number is defined for mantles with variable viscosity. Our parameterizations are most successful when the overall Rayleigh number is computed as the volume average of the local Rayleigh number (defined in terms of the local value of viscosity). They are less successful when the overall Rayleigh number is defined in terms of the volume average of viscosity. Our parameterizations allow us to estimate planetary temperatures for cases of interest beyond the range of current convection models such as the large exoplanets orbiting other stars.
Watershed assessment for the 21st century PART 2 / Evaluation des bassins versants pour le 21e siècle PARTIE 2

Room / Endroit (TCUP Gall. D), Chair / Président (R.D. (Dan) Moore ), Date (29/05/2013), Time / Heure (13:30 - 15:00)
3C9.1 ID:6706 INVITED/INVITÉ 13:30Road sediment models: strengths and necessary improvements Robert Danehy 1, Kathy Dube 2, Charlie Luce 3, Tom Black 3 1 NCASI 2 Watershed Geodynamics 3 USDA Forest Service Contact: [email protected]
Managed forests require a road network engineered for heavy loads of equipment and products. Many road networks are legacies of earlier timber practices and were constructed using less stringent standards than today. The intersections of roads with streams and their proximity to flowing waters are a stewardship challenge for forest landowners. Excessive in-sediment can negatively affect in-stream biota and water quality. Best management practices (BMPs) reduce sediment from erosion of cut slopes, ditches, and road surfaces delivered to streams. Due to the extent of forest roads, directly measuring road surface erosion is impractical, leading to development of models to assess sediment delivery potential and provide tools for evaluating road BMPs. We test three models (WEPP, GRAIP and SEDMODL2) in watersheds across the US by comparing measured sediment production from road segments to model predictions. Empirical models estimate erosion using relationships between erosion and erodibility and infiltration of underlying geology/soil, precipitation, road prism components, tread surfacing, cut/fill slope cover, ditch conditions, disturbance history, road drainage patterns and area, and interception of groundwater by cut slopes. Physically based models (e.g. WEPP) use equations governing the physics of surface erosion to calculate runoff, surface erosion, and transport. While all models we tested are appropriate for relative comparisons of road surface erosion between segments and between management conditions, calibration to local measurements is necessary where accuracy and precision are needed. These results suggest the models can predict percentages of improvement after BMPs are applied, but are likely fair to poor predictors of actual amounts of sediment generated on road surfaces unless calibrated. Better predictive capabilities of erosion variations due to climate and soil differences and better estimates of fractional sediment delivery from road segments would improve model utility for broad spatial scales and wider applications to road related water quality and biological concerns.
3C9.2 ID:6623 14:00Location, location, location: The importance of sampling site in sediment

source fingerprinting Alexander Koiter 1, Philip Owens 1, Ellen Petticrew 1, David Lobb 2 1 University of Northern British Columbia 2 University of Manitoba Contact: [email protected]
Sediment adversely impacts the quality of surface water and is a significant source of contaminants such as nutrients and pesticides. Correctly identifying the contributions of different sediment sources is an important part of designing and targeting conservation efforts. Effective river basin management strategies to address these issues increasingly rely on sediment fingerprinting to identify sediment sources. Basin geomorphology, topography and hydrology are factors that strongly influence sediment dynamics, and as such, they need to be taken into consideration when selecting sampling locations and when interpreting the data. However, in sediment fingerprinting the importance of sampling location is often overlooked. For example, sediment transport in low-order streams in the headwaters is controlled by hillslope processes, whereas in high-order streams, closer to the outlet, transport is controlled by channel processes. Therefore, sediment collected at the river basin outlet may not accurately represent processes affecting sediment dynamics elsewhere in the river basin, but in many studies, samples are collected at outlets alone. This can lead to poor management decisions based on the incorrect assessment of the relative contributions of different sediment sources. The present study is located in the predominately agricultural South Tobacco Creek watershed in south-central Manitoba. The objective of this study is to identify the sources of sediment within the watershed using sediment fingerprinting. Samples were collected over the course of three years at several locations along the main stem of the creek, ranging from 3rd order (42 ha) to seventh order (7441 ha). Our analysis concluded that there is a switch in the sediment sources between the headwaters and the outlet of the watershed. The results from this study highlight the importance of sampling site location in assessing the sources of sediment.
3C9.3 ID:6625 14:15Sediment Storage Following the Addition of Large Wood: A Flume Experiment
Lucy Mackenzie , Brett Eaton , Michele Koppes CGU Contact: [email protected]
At the reach scale, the quantity of large woody debris (LWD) present in a stream impacts channel pattern and the quality of aquatic habitat by acting as a key control on channel morphodynamics, Forest fires cause episodic increases in wood input, and hence can also profoundly influence channel function. This study examines the changes to sediment storage dynamics that occur due to the addition of LWD into a stream channel following a forest fire. Using a Froude-scaled physical model of Fishtrap Creek, British Columbia, which flows through

the McLure Fire of 2003, experiments were conducted by running the fixed-bank, mobile bed stream table to equilibrium and then adding wood pieces of various forms to the channel at random cross sections. Laser profiles of the channel bed were taken throughout the experiments at five-hour intervals and interpolated to create digital elevation models (DEMs) and DEM of difference (DoD) maps of the channel morphology. DEM and DoDs maps allow for the baseline morphodynamics associated with a wood-free channel to be compared to the more complex morphodynamics that arise following the addition of wood. Data analysis involves quantifying the rate at which sediments are deposited behind newly introduced wood and determining if there exists a relationship between log jam size and maximum sediment trapping capability in order to provide insight as to how riparian areas evolve through time. These experiments, run with high wood loads analogous to those found in forest fire-influenced catchments, demonstrate the dominant role that large wood plays in diversifying channel morphology by changing patterns, rates and quantities of sediment deposition and erosion.
3C9.4 ID:6278 14:30
The consideration of equity in Payments for Watershed Services (PWS): An empirical analysis of designing PWS for enhancing human capabilities Vijay Kolinjivadi 1, Jan Adamowski 2, Jason Wong 3 1 PhD Candidate, McGill University Department of Bioresource Engineering / Natural Resource Sciences 2 Associate Director, Brace Centre for Water Resource Management, McGill University 3 McGill University Contact: [email protected]
The protection and enhancement of watershed services in tandem with human development objectives is a priority for many governments. As a result of the failure of society in recognizing the role of land managers in protecting flows of critical ecological functions in a watershed setting and the suite of ecological services that derive from them, new environmental policy instruments such as ‘payments for watershed services’ (PWS) have gained increased enthusiasm. PWS is based on the premise that incentives can motivate land managers to engage in predefined actions to better ensure the delivery of critical ecosystem services. In this paper, we adopt the social equity perspective of human capabilities in promoting the sustainability of incentive-based negotiations for achieving both ecological and human well-being objectives. Specifically, we examine PWS using social multi-criteria evaluation for designing incentives to reflect the objectives of diverse stakeholders and the likelihood of choosing a payment that best alleviates existing deprivations in the capability sets of potential service providers to a PWS arrangement for achieving what is of value. We compare this to a cost-effectiveness targeting protocol for designing the payments that reflect opportunity cost and greatest impact on water quality downstream. We illustrate how the linkage between the flow of ecosystem services and well-being freedom can reveal trade-offs and synergies for PWS

design between a cost-effectiveness and an equity position. The empirical analysis comes from a proposed PWS for urban water users in Kathmandu, Nepal in which city water suppliers would provide incentives to private landowners to protect forest and soil resources to improve water quality. We argue that contextually inspired institutions built upon a common bargaining space for the deliberation of needs and goals as well as adaptive management of the conditionality for payments are necessary to achieve the objectives of integrated water resources management.
3C9.5 ID:6743 14:45
A watershed scale approach to quantifying wetland ecosystem services Jacqueline Serran , Irena Creed Western University Contact: [email protected]
Wetlands from the prairie pothole region of North America have been lost at alarming rates over the last century. Policies are urgently needed to protect further loss. One of the strategies to prevent further loss is to estimate wetland function. We present an approach founded on hydrological principles for estimating wetland function associated with flood and pollution control. The approach identifies process-based indicators of flood and pollution control potential for each wetland and quantifies them using a fusion of GIS and remote sensing technologies for application at regional watershed scales. Flood control indicators include a wetland’s ability to store water, connect to surface drainage network, and synchronize flood waves throughout the landscape. Pollution control indicators include a wetland’s contributing source area of nutrients, mechanisms that transport nutrients to the wetland, and mechanisms that retain nutrients once in the wetland. The process-based indicators are then aggregated to provide an overall flood and pollution control value for each wetland by calculating the simple average of the metrics associated with each function and then average the functions. Quantitative scenarios were developed to determine watershed areas that have the highest flood and pollution control benefits. These scenarios reflect the cumulative effectiveness of a wetland’s ability to provide ecosystem services within a watershed and define areas that should be targeted for conservation analysis. We showcase this approach on the Beaverhill watershed in Alberta. This work is being co-developed with the Beaver Hills Initiative (a coalition of stakeholders) and will be used by them to prioritize wetland conservation priorities for the region.
Northern ecosystem response to stressors PART 2 / Réponse de l'écosystème aux streseurs PARTIE 2
Room / Endroit (TCUP Blair Nelson), Chair / Président (Richard M. Petrone ), Date (29/05/2013), Time / Heure (13:30 - 15:00)
3C10.1 ID:6337 13:30Characterizing vegetation structural influences on forest fire burn severity using LiDAR, spectral and thermal remote sensing methods Laura Chasmer 1, Chris Hopkinson 2, Richard Petrone 1 1 Wilfrid Laurier University 2 University of Lethbridge Contact: [email protected]
Wildfire events play an important role within forest and peatland ecosystems. At small scales, forest fires alter forest succession and plant reproduction rates, and vary soil nutrient cycling, while at larger scales, wildfires affect carbon cycling and forest climatology. Increased warming within the northern boreal forest, as a result of climate change, is also expected to extend the fire season while also increasing the likelihood and severity of forest fires. The arid Western Boreal Plains ecozone of central Alberta is highly sensitive to inter-annual climate changes. Dry years can often result in evapotranspiration exceeding precipitation, making this region prone to severe, complex wildfires. The objective of this study is to compare pre- and post-fire horizontal and vertical vegetation structural characteristics using very high resolution multi-spectral remote sensing data from GeoEye and WorldView2, and airborne LiDAR data. Pre-fire vegetation characteristics and burn depth into peatlands and surrounding riparian areas will be compared with “hot spots” of burn severity observed using post-fire airborne thermal infrared imagery and in situ measurement transects. Canopy characteristics, vegetation type, and moisture/topographic characteristics associated with burn severity (biomass change), and horizontal fire scars are compared.
3C10.2 ID:6445 13:45
Soil acidification modelling and acid precursor emissions management policy in boreal Alberta Colin Whitfield 1, Shaun Watmough 2 1 Department of Geography and Planning, University of Saskatchewan 2 Environmental and Resource Science, Trent University Contact: [email protected]
In northeastern Alberta, emissions of sulphur and nitrogen to the atmosphere are strongly associated with the oil sands industry. Atmospheric deposition of these elements in the region is currently elevated above background levels and is expected to remain so for the foreseeable future, prompting concerns over the potential for eutrophication and acidification effects on surrounding ecosystems. Acidification risk for upland forest soils in the region has been assessed using widely used steady-state (SMB) and dynamic (MAGIC, VSD) biogeochemical models. Both approaches suggest acidification related impacts driven by sulphur deposition. In light of the steadily evolving nature and widespread landscape disturbance of the oil sands industry, novel approaches are required to evaluate and manage acidification risk in the region. The Acid Deposition Management Framework for the region has prescribed unique emissions management guidelines and model forecast simulations of soil chemistry will be used to identify the need for emission controls. A new uncertainty-based regional dynamic modelling approach designed for use in support of this management framework has been tested. Results from the initial application suggest future changes in soil chemistry may be sufficient to invoke actions to reduce emissions. Nonetheless, there remain significant challenges for robust assessment of acidification risk in the region.
3C10.3 ID:6528 14:00
Ten Years of Growing Season Water, Energy and Carbon Exchange From an Oil sands Reclamation Site, Fort McMurray, Alberta Sean Carey , Gordon Drewitt McMaster University Contact: [email protected]
The oilsands mining industry in Canada has made a commitment to restore disturbed areas to an equivalent capability to that which existed prior to mining. Certification requires successful reclamation, which can in part be evaluated through long-term ecosystem studies. A reclamation site, informally named South Bison Hill (SBH) has had growing season water, energy and carbon fluxes measured via the eddy covariance method for 10 years since establishment. SBH was capped with a 0.2 m peat-glacial till mixture overlying 0.8 m of reworked glacial till soil. The site was seeded to barley cultivar (Hordeum spp.) in the summer of 2002 and later planted to white spruce (Picea glauca) and aspen (Populus spp.) in the summer/fall of 2004. Since 2007, the major species atop SBH has been aspen, and by 2012 was on average ~ 4 m in height. Climatically, mean growing temperature did not very greatly, yet there was considerable difference in rainfall among years, with 2012 having the greatest rainfall at 321 mm, whereas 2011 and 2007 were notably dry at 180 and 178 mm, respectively. The partitioning of energy varied among years, but the fraction of latent heat as a portion of net radiation increased with the establishment of aspen, along with concomitant increases in LAI and growing season net ecosystem exchange (NEE). Peat growing season ET was smallest in 2004 at 2.3 mm/d and greatest in 2010 at ~3.9 mm/d. ET rates showed a marked increase in 2008

corresponding with the increase in LAI attributed to the aspen cover. Since the establishment of a surface cover and vegetation in 2003, SBH has been a growing season sink for carbon dioxide. Values of NEE follow similar patterns to those of ET, with values gradually becoming more negative (greater carbon uptake) as the aspen forest established. Comparison with other disturbed and undisturbed boreal aspen stands show that SBH exhibits similar water, energy and carbon flux patterns during the growing season.
3C10.4 ID:6284 14:15
Rapid Recovery of the Carbon Sink Following Harvesting in Boreal Jack Pine Forests Alan Barr 1, Andy Black 2, Harry Mccaughey 3, Tianshan Zha 4, Nick Grant 2, Zoran Nesic 2 1 Climate Research Division, Environment Canada; Global Institute for Water Security, U. of S. 2 Faculty of Land and Food Systems, U.B.C. 3 Department of Geography, Queen’s U. 4 Beijing Forestry University Contact: [email protected]
The Canadian boreal forest is characterized by frequent disturbances, primarily by forest fires but also by insects and harvesting. As a forest stand recovers from disturbance, its carbon balance undergoes changes from a carbon source to a carbon sink to a diminishing carbon sink. We report multi-year eddy-covariance measurements of net ecosystem exchange from four jack pine stands following harvesting, spanning stand ages of 1 to 100 years. The research sites are located in the southern boreal forests of central Saskatchewan and were established as part of the Boreal Ecosystem Research and Monitoring Sites and the Fluxnet-Canada Research Network, and continued as part of the Canadian Carbon Program. The most striking features of the data set are: the sharpness and early timing of the peak in the carbon sink, which occurs at ~ 20 years after harvesting; and the high degree of conformity between two independent measures of the carbon balance: stock changes and flux. The cumulative eddy-covariance measurements of net ecosystem exchange correspond closely to the changing biomass and necromass carbon stocks. Both fluxes and stocks indicate a rapid recovery of the carbon sink, peaking at ~ 20 years then declining but remaining a carbon sink through stand ages of 30 to 100 years. The early peak in carbon uptake is associated with the rapid recovery of the leaf area index and the associated rise in gross ecosystem photosynthesis, coupled with a concurrent delayed rise in total ecosystem respiration.
3C10.5 ID:6678 14:30
Impact of climate variability and forest thinning on biometric based carbon estimates within an age-sequence of temperate pine forests
Michelle Kula 1, M. Altaf Arain 2, Matthias Peichl 3, Janelle Trant 2, Samantha Mackay 2, Robin Thorne 2
1 McMaster University, MSC Candidate 2 McMaster University 3 Swedish University of Agricultural Sciences Contact: [email protected]
Understanding the response of carbon uptake and growth is important for forest management practices given the large quantity of carbon stored in forests, and their significant role in the global carbon cycle. Since 2003, biometric measurements were taken in an age-sequence (11-, 39- and 74- years-old as of 2013) of white pine (Pinus strobes L.) plantation forests in southern Ontario, Canada. Following Canada’s National Forest Inventory Ground Sampling Guidelines, tree diameter at breast height, tree height, coarse woody debris and litter-fall measurements were conducted at each site. In early 2012, 30% of trees were harvested at the 74-year old plantation, with approximately 1958 m3 of sawlogs removed from the site. In this study, we compare these biometric estimates to mean growing season temperatures, and annual and seasonal precipitation, in order to investigate local climate effects on tree growth. Tree mortality, due to heat and drought stress, will also be assessed. In addition, effects of thinning on aboveground biomass and stem growth at the 74-year-old site will be evaluated. Results from this study will be helpful for future forest management practices, which have significant effects on the future of lumber resources, forest conservation and carbon sequestration.
3C10.6 ID:6658 14:45Evaluating effects of thinning on carbon sequestration in an afforested pine forest using eddy covariance fluxes Janelle Trant 1, Altaf Arain 2, Jason Brodeur 2, Robin Thorne 2, Michelle Kula 2 1 McMaster University, M.Sc. Candidate 2 McMaster University Contact: [email protected]
Forest ecosystems are a significant component of the global carbon cycle. Afforestation, considered a cost-effective and ecologically viable means to sequester atmospheric carbon, requires intensive management practices, including thinning. This study examines thinning effects on forest carbon dynamics using eddy covariance techniques. In January 2012, a 74-year-old white pine (Pinus strobus) plantation located in southern Ontario, part of the Turkey Point Flux Station, was selectively thinned. Approximately 30% of trees, or 1958 m3 of sawlogs, were removed to improve light, water and nutrient availability for remaining individuals. Fluxes of energy, water, CO2 and meteorological variables were measured throughout the year following thinning and compared to data from the three years prior to thinning to evaluate thinning effects on forest carbon dynamics. Mean estimates of annual net ecosystem production (NEP), gross ecosystem production (GEP) and respiration (R) from the three years prior to thinning are 260.8, 1449.1 and 1177.6 g C m-2, respectively. Post-thinning estimates of annual NEP, GEP and R are 81.7,
1439.8 and 1345.3 g C m-2, respectively. Our findings suggest that lower post-thinning estimates of NEP were driven more by increased R than changes in GEP. This study will evaluate whether these dynamics are caused by climate effects or the thinning treatment. Results will provide insight into how the efficiency of thinning treatments may be altered to maximize carbon sequestration. Further, results will provide policy makers and resource managers information needed to evaluate the carbon sink and source potential of managed plantations in southern Ontario.
Combatting Aquatic Invasive Species / Lutte contre les espèces envasives
Room / Endroit (Hilton Commonwealth- S), Chair / Président (Tanya Melnyk ), Date (29/05/2013), Time / Heure (13:30 - 15:00)
3C13.1 ID:6640 13:30The Near-miss of a Quagga Mussel Invasion in Western Canada
Val Miller (Presented by Gail Wallin ) Ministry of Forests, Lands and Natural Resource Operations Contact:
This presentation will focus on the coordinated response to the threat of quagga mussels in Shuswap Lake, BC in the summer of 2012. Many groups came together; acting fast and learning as they went. This case study is a learning tool that can help prepare other provinces for potential aquatic invaders. In July, a boat entered Shuswap Lake that had been stopped at an inspection station in Nevada and had a mussel infestation confirmed. The decontamination wash at the inspection station was not deemed to be adequately thorough, and officials in BC were alerted. On July 5th, Invasive Species Council of BC staff confirmed the presence of mussels on the boat. On July 7th, Ministry officials traveled to the site to take samples from all areas of the boat, from the hull to the anchor storage box. Dead veligers were found, and all tests continue to come back negative. On Monday, July 9th the boat underwent a full decontamination. On July 11th, staff from the Ministry of Environment, the Invasive Species Council of BC, the Department of Fisheries and Oceans and the Ministry of Forests, Lands, and Natural Resource Operations received a Level 1 Boat Inspection Training Course. That day a team of divers checked the area where the boat was moored, and were unable to find any mussels or veligers. Monitoring continues to ensure that nothing was missed. This near-miss could have had devastating repercussions for Western Canada. It is critical that communication between

jurisdictions is clear and rapid, to ensure a quick response when such a threat occurs. The collaboration between all levels of government, paired with non-profit expertise and coordination with the U.S. demonstrated the success that can be achieved if all stakeholders work together.
3C13.2 ID:6652 13:45
Aquatic Invasive Species: Planning and Implementing a Program in Alberta
Cindy Sawchuk Alberta Environment and Sustainable Resource Development Contact: [email protected]
Aquatic Invasive Species (AIS) have devastating economic, social and environmental impacts, representing a significant threat to Alberta’s watersheds/ecosystems. Given the complexity surrounding the introduction of invasive species, such threats cannot be managed by one agency, stakeholder group or department alone. Thus, Alberta Environment and Sustainable Resource Development, Alberta Agriculture and Rural Development, and Alberta Tourism, Parks and Recreation have recently instituted a novel, collaborative and integrated approach to addressing these threats. Initially, this program will focus on three highly invasive species, Zebra mussels, Quagga mussels, and Eurasian Water Milfoil, by using a ground–up, grass roots approach. This initial small-scale approach , based on the recommendations from a multi-stakeholder risk analysis, will be piloted in southern Alberta in the spring of 2013. This pilot will be used to further inform additional programs for a broader strategy to contain AIS in Alberta over the next few years, and ultimately the Crown of the Continent (comprising portions of BC, Montana and Alberta) as part of the Ecological Health Project.
3C13.3 ID:6635 14:00
Clean, Drain, Dry: Using a social science approach to combat invasive species
Jennifer Mccaffrey (Presented by Gail Wallin ) Invasive Species Council of BC Contact:
The Invasive Species Council of BC (ISCBC) has a new Take Action initiative that aims to put social science to work, bridging the gap between awareness of Aquatic Invasive Species and the behaviour change that is necessary for the prevention and spread of such invaders. This collaborative program applies social behaviour change science to move beyond awareness and into action. The case study presented here demonstrates the use of Community Based Social Marketing (CBSM) to develop, pilot and test the Take Action program Clean, Drain, Dry (CDD) with boaters across British Columbia. The foundation of

CBSM is based on changing the behaviour of people to a desired behaviour. Traditionally the ISCBC’s program and project deliverables have been based on the number of brochures created, the number of people in attendance, the number of calendars delivered, etc. However, there was no way to measure what impact the brochures had on the public. We may have raised awareness, but did we change anyone’s behaviour? By applying CBSM principles we are able to quantitatively measure the change that has occurred as a result of the CDD program. The ISCBC is working in partnership with nine regional invasive species committees and one regional district to deliver this two-year initiative that is designed to help stop the introduction and spread of invasive species in BC. We hope to reduce the spread of aquatic invasive species by changing boater behaviour so that they clean, drain and dry their motorized boats and boat trailers before launching into another water body. The goal of the program is to change the behaviour of BC citizens to reduce the introduction and spread of invasive species by employing the principals of community based social marketing. At the end of the two year initiative, the ISCBC hopes to have created a self-sustaining CDD program that can be shared and maintained by local stewardship groups, regional committees, and other interested parties. To that end, developing partnerships and sharing information is promoted and encouraged in this program.
3C13.4 ID:6638 14:15
Awareness as a non-regulatory approach to address aquatic invasive species Tanya Melnyk 1, Bill Dolan 2, Sarah Parker 1 1 Government of Alberta, Environment & Sustainable Resource Development 2 Government of Alberta, Tourism, Parks & Recreation Contact: [email protected]
The spaciousness of our Alberta landscape creates challenges in detecting and preventing the spread of aquatic invasive species. Further complicating the issue are the multiple agencies, jurisdictions, provincial and international borders, laws and by-laws, and the result can be overwhelming for one agency to tackle on its own. Often agencies lack adequate human resources and funding to develop and maintain strategies to address the issue. With this in mind, there is momentum building in Alberta to develop comprehensive strategies to share resources and work across jurisdictions to address aquatic invasive species. Currently the work is a multi-stakeholder effort that focuses on three specific species: zebra mussels (Dreissena polymorpha), quagga mussels (Dreissena rostriformis bugensis) and eurasian water milfoil (Myriophyllum spicatum). This work is further divided into four components: policy and legislation; monitoring and reporting; inspections; and awareness. Awareness is the key non-regulatory approach being developed as part of this work and the subject of this discussion. The presentation will discuss the strategy and methodology in creating a comprehensive awareness plan, will demonstrate how limited resources are being leveraged through collaboration, and discuss the benefits of maximizing expertise. It will also
discuss the decisions to build awareness amongst specific audiences and target specific behaviours in a phased, scalable plan. The Awareness component is being driven by a multi-agency stakeholder working group. Every member faces the common challenges seen across the country – limited time, people and financial resources. This team is working collaboratively to overcome these limitations, build on specific competencies and consequently raise the profile of this issue within their respective jurisdictions.
3C13.5 ID:6637 14:30
From Northern Snakehead Fish to New Legislation
Jodi Romyn (Presented by Gail Wallin ) Invasive Species Council of BC Contact:
In the spring of 2012, a Northern Snakehead Fish was discovered in a pond by park-goers in Burnaby, BC. Multi- jurisdictional collaboration resulted in a rapid response to contain and remove this fish from the pond, and follow up with studies to ensure it was the only one, and had not reproduced. This event, paired with other near –misses in 2012 such as the potential quagga mussel invasion in Shuswap Lake, prompted legislation to change more rapidly than ever before. By December 2012, the Controlled Alien Species regulations under the provincial Wildlife Act were amended to include prohibitions against invasive mussels and other aquatic invasive species. This presentation offers a summary of the new provincial regulations that now prohibit the possession, transportation, sale, breeding or release of a number of high risk aquatic species including invasive mussel species. The Controlled Alien Species regulation has been historically used to control exotic animals that are not native to B.C. that pose a serious risk to the health or safety of people. The amended regulation addresses risks to the province’s fish, wildlife, aquatic ecosystems and infrastructure (in the case of invasive mussels). The new rules target specific invasion pathways for aquatic species including the live fish trades and aquatic hitchhikers. The revised provincial regulation is expected to be complimentary to the proposed new federal Aquatic Invasive Species regulations.
3C13.6 ID:6329 14:45
Prevention of Aquatic Invasive Species in Saskatchewan
Tanya Johnston Water Security Agency Contact: [email protected]
Saskatchewan’s geography and legislation banning the use of live bait and live food fish trade have helped prevent aquatic invasive fauna species from colonizing in the province. The overland transport of watercrafts and the aquarium trade have created some ‘close call’ situations in recent years. This

has fueled resurgence in public awareness campaigns and a review of policy and legislation. This presentation will discuss these recent situations and the role public awareness and working collaboratively had in the success at preventing or eradicating the aquatic invasive species threat. Current challenges and areas of future focus that require partnerships will also be discussed.
An Open Forum on the Intergovernmental Oceanographic Commission (IOC) / Forum ouvert sur la Commission océanographique intergouvernementale
Room / Endroit (Hilton Prince Albert), Chair / Président (Helen Joseph ), Date (29/05/2013), Time / Heure (13:30 - 15:00)
3C14.1 ID:6933 13:30An Open Forum on the Intergovernmental Oceanographic Commission (IOC) Helen Joseph Fisheries and Oceans Canada Contact: [email protected]
Helen Joseph Fisheries and Oceans Canada Contact: [email protected]
The session will provide an overview of the UNESCO’s Intergovernmental Oceanographic Commission (IOC) and will seek an engaging discussion of how the oceanographic community might be further engaged in the IOC program activities. The IOC will be introduced, presenting such features as its origins, structure, governance, and mission. Furthermore, the capacity development, networks, management, strategies, and high-level objectives of the IOC will be presented. The initiatives of the IOC are wide ranging and include the Tsunami and Early Warning System, the Harmful Algal Bloom Programme, Global Ocean Observing System (GOOS), and the International Oceanographic Data and Information Exchange (IODE). It will be an opportunity to learn more about the IOC, its programs and future.

High Resolution Atmospheric Modeling / Modélisation à haute résolution
Room / Endroit (TCUP Salon A), Chair / Président (Julie Theriault ), Date (29/05/2013), Time / Heure (15:30 - 17:00)
3D1.1 ID:6810 15:30Environment Canada's High Resolution Deterministic Prediction System -- The Pan-Canadian 2.5-km Configuration Jason Milbrandt 1, Stephane Belair 1, Manon Faucher 2, Anna Glazer 1, Marcel Valle 1 1 Environment Canada (RPN) 2 Environment Canada (CMC) Contact: [email protected]
For several years the Canadian Meteorological Centre has been running a real-time experimental system of 2.5-km limited-area model domains in various regions of Canada using the Global Environmental Multiscale (GEM) model, formally referred to as the High Resolution Deterministic Prediction System (HRDPS). As of 2013 the western domain will be officially operational. Currently development is underway to replace the multigrid HRDPS with a singe, pan-Canadian 2.5-km operational domain by 2014. The second phase of this system will have its own upper-air data assimilation system. At this time (2015-16), it will become the new regional model, the primary source of short-term (48-h) numerical guidance from Environment Canada prediction systems. An overview will presented of the upcoming phase 1 of the pan-Canadian 2.5-km system.
3D1.2 ID:6339 15:45Challenging aspects of long range high resolution mesoscale simulations over large spatial domains Syed Zahid Husain , Wei Yu , Leo Separovic , Yosvany Martinez , Stéphane Gaudreault Environment Canada Contact: [email protected]
Application of high resolution mesoscale models for long range simulations over large spatial domains is an area of growing interest particularly in studies related to wind energy integration and climatology. In addition to the computational constraints posed by such problems, a number of scientific challenges need to
be addressed for acceptable prediction of the meteorological fields. Long term temporal integrations generally lead to drifting of the upper air predicted by the high resolution model from the large-scale structures of the low resolution driving fields. Spectral nudging of the high resolution meteorological fields towards the large scale features of the driving fields is selected as a potential remedy. As nudging increases computational costs, it is essential to select the list of prognostic fields to be nudged and adjust the associated parameters for its most optimum implementation. Inconsistencies can also appear in the prognostically evolving surface fields including temperature, moisture and snow-depth due to any inherent model bias that may be compounded by temporal integration over an extended period, and can lead to inaccurate predictions of surface-layer atmospheric characteristics. A forcing strategy based on grid nudging of the relevant fields towards their observed values is devised to limit any considerable deviation from reality. The presentation will highlight the challenging aspects associated with long range high resolution mesoscale simulations along with proposed solutions, and their implications on the accuracy and computational overhead. A separate poster on this research from the perspective of wind energy integration will also be presented at the conference.
3D1.3 ID:6820 16:00
High-Resolution GEM-MACH Simulations of Feedbacks Between Meteorology and Chemistry Paul Makar 1, Wanmin Gong 1, Balbir Pabla 1, Philip Cheung 1, Jason Milbrandt 2, Sylvie Gravel 1, Michael Moran 1, Samuel Gilbert 3, Junhua Zhang 1, Qiong Zheng 1 1 Air Quality Research Division, Environment Canada 2 Meteoroloigcal Research DIvision, Environment Canada 3 Air Quality Model Applications Section, Environment Canada Contact: [email protected]
A 2.5km nested forecasting system for the Global Environmental Multiscale – Modelling Air-quality and CHemistry (GEM-MACH) was used to evaluate the impact of feedbacks between weather and chemistry on the resulting high-resolution forecasts. Changes to GEM’s cloud microphysics and radiative transfer packages were carried out to allow two-way coupling with the chemistry portion of GEM-MACH. The cloud microphysics package used here is the Milbrandt-Yau 2-moment (MY2) bulk microphysics scheme, which solves prognostic equations for the total droplet number concentration and the mass mixing ratios of six hydrometeor categories. The original cloud condensation nucleation parameterization of MY2 (empirically relating supersaturation and CCN number) was replaced with the aerosol activation scheme of Abdul-Razzak and Ghan (2002), driven by GEM-MACH’s internally generated aerosols. The default aerosol optical properties and climatological ozone used in GEM’s radiative transfer routines were replaced with calculations from a Mie scattering

algorithm utilizing the model-predicted aerosols, and chemistry-generated ozone profiles, respectively. These changes were found to have a significant local impact on both weather and air-quality predictions for short-term 2.5km resolution test runs of 24 hours duration. In that particular case, the maximum number concentration of cloud droplets decreased by an order of magnitude, while the number of raindrops increased by an order of magnitude and changed in spatial distribution, but surface rainfall was found to decrease. The differences in meteorology had a profound effect on local pollutant plume concentrations at specific locations and times. We compare results over a longer time period, using two parallel experimental forecast systems, one with feedbacks between meteorology and chemistry, one without. Both nest GEM-MACH from a North American domain (10 km horizontal grid spacing) to a 1535 x 1360 km, 2.5 km domain. These systems will be evaluated against monitoring networks within the high resolution domain.
3D1.4 ID:6365 16:15
The influence of the Athabasca oil sands development on summer thunderstorms Daniel Brown , Gerhard Reuter University of Alberta Contact: [email protected]
The Athabasca oil sands development, consisting mainly of surface mines and tailings ponds, has created a massive 500 km2 disturbance to the pre-existing boreal forest. Previous researchers have shown that the oil sands development does not influence lightning climatology; however, they have speculated that given favourable conditions, the oil sands development could affect individual thunderstorm events. We used the Weather Research and Forecasting (WRF) numerical weather model to simulate thunderstorms during one case study day. In four model simulations, we modified the surface sensible heat flux and the surface roughness to simulate and compare model output from simulations that include modifications caused by the oil sands development with simulations containing the original boreal forest. We compared integrated values of precipitation, wind, cloud mixing ratio, and precipitation mixing ratio. Preliminary results suggest that waste heat emissions and surface roughness modifications can affect individual thunderstorms. Modifying waste heat and surface roughness individually have effects of similar magnitude, and if the two are modified together, the combined effect of the two is substantial and different from the previous results.
3D1.5 ID:6444 16:30
Verification of the Weather Research and Forecasting Model for simulating
heavy precipitation in Alberta Clark Pennelly , Gerhard Reuter , Tom Flesch University of Alberta Contact: [email protected]
The Weather Research and Forecasting (WRF) model was used to simulate precipitation for three flooding events in Alberta, Canada. A detailed comparison was made between the 48 hour spatial distribution of model rainfall and observations obtained from rainfall gauges. Verification was evaluated from Probability of Detection, False Alarm Ratio, BIAS, and Equitable Threat scores from over 120 observation stations. Evaluation was also performed using the Root-Mean-Square-Error at each model grid box as well as integration over the major river basins of Alberta. Simulations were performed with spatial resolutions of 6 km, 15 km and 30 km using five different cumulus parameterization schemes: Explicit, Kain-Fritsch, Betts-Miller-Janjić, Grell-Dévényi, and Grell 3D ensemble. The Kain-Fritsch and Explicit cumulus parameterization scheme performed with the highest accuracy for the three summer events. The model simulations using the Kain-Fritsch scheme often overestimated precipitation, resulting in higher Probability of Detection values. Combined with low False Alarm Ratio values, this typically yielded the highest Equitable Threat scores. Simulations using finer grid resolution resulted with higher accuracy of precipitation. Model simulations performed without using a cumulus parameterization scheme (i.e. explicit precipitation only) showed the largest gain in accuracy when grid resolution was increased from 15 km to 6 km.
3D1.6 ID:6586 16:45
Generating surface forcing for long-term high-resolution mesoscale simulations over a large spatial domain Leo Separovic , Wei Yu , Syed Zahid Husain , Yosvany Martinez , Stéphane Gaudreault Environment Canada Contact: [email protected]
In order to help the electricity industry to assess the spatio-temporal variability of near-surface winds over Canada, the Wind Energy Research Group at Environment Canada (EC) is working on a project funded by the Government of Canada to generate very high resolution wind time series over the entire country. The time series will be generated with the limited-area Global Environmental Multiscale (GEM-LAM) model by performing a continuous 5-year analysis-driven simulation over a continental-scale mesh with a horizontal grid spacing of 2 km and a time frequency of 10 min. Potential biases in the modeling of the evolution of fine-scale surface variables can be detrimental to the quality of the simulated near-surface winds, particularly when model simulation is extended to several weeks or even longer period. A forcing mechanism of relevant surface variables through grid nudging to some

realistic values is therefore devised. In order to generate a set of values for surface nudging a high-resolution external surface modeling system known as GEM-Surf is employed. It has been developed at EC in order to refine the numerical prediction of surface and near-surface variables. GEM-Surf simulates only land and near-surface physical processes and requires atmospheric forcing, usually taken from the analysis and short-term forecasts. This presentation will focus on the validation of the high-resolution surface analysis, obtained from GEM-Surf simulations conducted over Canada using different experiment configurations. Beyond the primary goal to improve the simulated wind profiles, the high-resolution analysis of surface variables, such as surface temperature, soil moisture and snow conditions can be also used for improving the initialization of numerical weather prediction models, climate model validation or agricultural systems modeling.
Monitoring - Operations and challenges PART 2 / Surveillance - Opérations et défis PARTIE 2
Room / Endroit (TCUP Salon B), Chair / Président (Qian Li ), Date (29/05/2013), Time / Heure (15:30 - 17:00)
3D2.1 ID:6813 15:30Boundary layer wind profilers from DeTect, Inc. Timothy L. Wilfong , Scott Mclaughlin , Bob Weber , Elias Lau DeTect, Inc. Contact: [email protected]
Radar wind profilers (RWPs) are all-weather systems designed to obtain profiles of the wind from near the ground to as high as 20 km. The transmit frequency is usually dependent on the desired height, with lower frequencies (50 to 500 MHz) used to obtain wind data to high altitudes and higher frequencies (around 1 GHz) used for the lower atmosphere. It is often desired that boundary layer (BL) systems have a small antenna footprint, be economical, and are portable—thus most commonly BL systems are designed for a fixed frequency between 900 and 1000 MHz (depending on the country). DeTect, Inc. has designed radar wind profilers between 50 and 1300 MHz, including BL and lower tropospheric systems. In particular, the BL systems have been tailored for specific applications. The features and benefits of these systems will be discussed, as well as the pros and cons of high frequency and lower frequency radar wind
profilers. Performance and cost trade-offs will also be reviewed.
3D2.2 ID:6702 15:45
Quantifying temperature effects on Geonor precipitation gauges Michael Earle , Jeffery Hoover , Kai Wong , Rodica Nitu (Presented by Kai Wong ) Observing Systems and Engineering, Meteorological Service of Canada, Environment Canada Contact: [email protected]
The Geonor T-200B automatic precipitation gauge is employed in Environment Canada’s Reference Climate Station (RCS) Network and broadly across the Surface Weather Network. This gauge uses a vibrating wire transducer to determine the accumulated precipitation amount from the applied load of the precipitation and bucket assembly. The accumulated precipitation measured by Geonor gauges has been shown to vary with ambient temperature, likely in response to changes in the temperature of the transducer wires and/or the gauge housing during the daily solar cycle. Duchon (Bulletin of the American Meteorological Society, 2004) used field data to quantify these temperature effects, deriving temperature coefficients from daily accumulation and temperature measurements. In the present work, a similar approach is applied to precipitation measurements from Geonor gauges at the Centre for Atmospheric Research Experiments (CARE) in Egbert, Ontario. Temperature coefficients are compared among gauges over a range of environmental conditions in order to establish their variability and to inform procedures for their implementation in Environment Canada’s operational network.
3D2.3 ID:6705 16:00
Assessment of double-ring wind shields for automatic precipitation gaugesJeffery Hoover , Michael Earle , Kai Wong , Rodica Nitu (Presented by Kai Wong ) Observing Systems and Engineering, Meteorological Service of Canada, Environment Canada Contact: [email protected]
Automatic precipitation gauges employ wind shields to mitigate the effect of wind on gauge catchment. Wind shields are particularly important for the measurement of solid precipitation, as the lower density of snow and ice makes these particles more susceptible to the flow field around the gauge inlet. The standard wind shield for automatic precipitation gauges in Environment Canada’s operational network is the single-Alter shield, comprising a series of tapered metal slats at regularly-spaced intervals along a metal ring, positioned equidistant from the gauge orifice. Double-ring shields have been developed to further reduce the wind effect by adding a second ring of slats at a greater radial distance from the gauge orifice. Belfort and Alter-type double-ring shields have been installed at the Centre for Atmospheric Research Experiments (CARE) field site in Egbert, Ontario. These shields differ in their porosity, slat dimensions, and
slat travel, which are expected to influence overall gauge catch efficiency. In this study, the Belfort and Alter-type double-ring shields are assessed in terms of their performance and operability using both computer simulation (fluid dynamics) and field testing results. The findings from this assessment are used to make recommendations for the configuration of the double- ring wind shield for automatic precipitation gauges within Environment Canada’s operational network
3D2.4 ID:6755 16:15
Assessing the value of climate station data in the Canadian Precipitation Analysis system Kian Abbasnezhadi 1, Vincent Fortin 2, Peter Rasmussen 1, Kristina Koenig 3 1 University of Manitoba 2 Canadian Meteorological Centre 3 Manitoba Hydro Contact: [email protected]
The Canadian Precipitation Analysis (CaPA) system developed by Environment Canada provides near real-time precipitation estimates on a 10 km by 10 km grid over Canada at a temporal resolution of 6 hours. The spatial fields are generated by combining forecasts from the Global Environmental Multiscale (GEM) model with precipitation observations from the network of synoptic weather stations. In many parts of Canada, including most of Manitoba, the weather station network is sparse. It has been suggested that CaPA estimates can be significantly improved by adding more stations to the network in areas where the network is sparse. Before investing in new stations in remote locations, it seems reasonable to try to assess the improvement in CaPA estimates that might result from adding stations to the network. A closely related question is where one should place any new stations. This is a complicated question that involves a range of consideration. We are focusing on statistical aspects of the network design problem. More specifically, we are proposing a simulation methodology that involves synthetic GEM fields and synthetic station data that are combined into synthetic CaPA fields. These fields are then employed as input to a hydrologic model. The advantage of using a controlled simulation experiment is that one can define reference precipitation fields assumed to represent the true precipitation. Hypothetical CaPA fields can be generated using different configurations of stations in the meteorological network and can be compared with the reference fields. This approach is generally known as an Observation System Simulation Experiment (OSSE). Our approach involves the use of a gridded precipitation generator. At this point, the research is in its initial phase and the presentation will describe the general methodology rather than specific results.
3D2.5 ID:6507 16:30
Deriving “Current Weather” from multiple information sources
Iain Russell Pelmorex Inc.

Contact: [email protected]
A comprehensive picture of ambient weather conditions at any location is highly desirable in today’s society where immediacy of information is highly valued. This “current weather” picture should accommodate variations in end user needs – in both the spatial sense (localization) and in the temporal sense (recent past to near future). Our approach to the provision of such “Current Weather” information involves the aggregation of a broad range of meteorological datasets including in-situ observations from physical monitoring networks, remotely-sensed observations, as well as near-term Nowcasts and predictive fields from NWP models. The information that we generate conveys a comprehensive view of the “Current Weather” not only in terms of clouds, precipitation events, wind and temperature conditions, but also incorporating information on its temporal properties. Temporal attributes range from the weather in the past hour to the weather that we estimate as imminent over the next few hours. In this approach, we are engineering a solution which focusses on the meteorological “sweet spot” - the intersection of observational measurements of the very recent past and the prediction of events in the very near future – observations and predictions are combined into one dataset which has potential to provide a more complete description of “Current Weather” than is available from individual observation networks.
3D2.6 ID:6922 16:45Real-Time Quality Assessment Approaches used in Implementing of a Renewed Data Quality Policy for Meteorological Service of Canada Dale Boudreau , Chris Kocot , Hannah Fong MSC, Environment Canada Contact: [email protected]
Data of known quality is a central premise of a renewed Data Management System and the Quality principles currently being implemented within the Meteorological Service of Canada’s monitoring program. Data quality directly impacts the programs’ principle strategic outcome to ensure Canadians are equipped with the information to make the best informed decisions on changing climate and climate conditions to ensure their safety and that of their economic activities. Through the implementation of the new Data Management System, Meteorological Service of Canada is renewing its data quality assessment (Qa) to augment traditional assessment techniques. Real-time Qa tests can be targeted to particular season, network, zone, station, as well as to the instrument. Additional techniques being evaluated include more complex temporal and spatial tests. One such technique being considered involves comparison of observations to forecast model estimates which will assist in the verification of surface weather station observations. These approaches will enhance our ability to assess and identify the quality of data being managed.

This presentation will be of interest to CMOS participants with a concern for quality surface weather data and an interest in the assessment techniques used to realise some of our quality principles.
Polar Applications PART 2 / Applications polaires PARTIE 2
Room / Endroit (TCUP Salon C), Chair / Président (Ann McMillan ), Date (29/05/2013), Time / Heure (15:30 - 17:00)
3D3.1 ID:6391 15:30Fisheries and Oceans Arctic Science Strategy
Helen Joseph Fisheries and Oceans Canada Contact: [email protected]
The Arctic region is the subject of increasing focus for the Government of Canada and the global community. Strategic interest in the Arctic is being driven by the resources being discovered there, driving increasing development in the context of environmental changes. In 2009, the Government of Canada released its Northern Strategy outlining the government’s ongoing work and future plans for Canada's North, with Northern science as a foundation piece. This presentation will summarize the Fisheries and Oceans Canada Arctic Science Strategy which focuses on the next three years while looking ahead to longer term demands. The Arctic Science Strategy complements other ongoing Fisheries and Oceans activities in the Arctic and details priorities, activities and resources with respect to science and technology.
3D3.2 ID:6824 15:45Fisheries and Oceans Arctic Ocean Science Programs – An Overview
Helen Joseph Fisheries and Oceans Canada Contact: [email protected]
In 2012 Fisheries and Oceans Canada led numerous Arctic Marine Science Initiatives, which are often extensions of what was learned from International Polar Year (IPY). These initiatives focused on the rapidly changing Arctic environment and the emerging findings and implications related to

oceanographic and hydrological patterns, overall ecosystem health, commercial activities, resource management and marine safety. This presentation will provide an overview of the activities and results of some of these initiatives. Initiatives examined include; C3O, Arctic Observing Network, Canadian Arctic Through-flow Study, Vulnerable Marine Environments, Beaufort Marine Observations, Real Time Ocean Observatory, BREA, CROW and Drift Bottles.
3D3.3 ID:6700 16:00
Sea Ice Climatology in the Canadian Western Arctic: Thermodynamic versus Dynamic Controls. Lauren Candlish , John Iacozza , Jennifer Lukovich , Brian Horton , David Barber CEOS, University of Manitoba Contact: [email protected]
Based on the regions in the western Canadian Arctic as outlined by the Canadian Ice Service, the normals and trends from 1981-2010 were analysed for the monthly surface air temperature, monthly wind speed and direction. For the month of September, the temperatures from 1981-2010, for all of the defined regions, increased by 2-4 °C. The monthly concentrations of sea ice and multiyear ice were analysed for normals and trends from 1981-2010. Although the Arctic has seen a large reduction in summertime sea ice extent, for this region of study, there is only a statistically significant decrease in the Beaufort Sea during September. Previous studies have shown that the increase in surface air temperature is responsible for an increase in oceanic heat content and latent heat in Arctic waters and associated with a decline in sea ice extent. Correlations between the climatological state variables and sea ice were investigated in the present study to determine relative thermodynamic and dynamic contributions to a decline in sea ice extent in the western Arctic. As expected, the regions of interest all showed a statistically significant correlation between the surface air temperatures and the total sea ice concentrations. However, neither the wind speed nor direction had a strong correlation on the sea ice concentration trends.
3D3.4 ID:6428 16:15
Cambridge Bay Observatory: A miniature cabled ocean observatory for science and outreach .
S. Kim Juniper 1, Benoït Pirenne 1, Scott Mclean 1, Kate Moran 1, David Fissel 2 1 Ocean Networks Canada, University of Victoria, Victoria, BC 2 ASL Environmental Sciences, Saanichton, BC Contact: [email protected]
In September 2012, Ocean Networks Canada, based at the University of Victoria, completed installation of a cabled undersea observatory in Cambridge Bay. This represents the first location in Canada’s Arctic for year-round monitoring of the marine environment. The observatory consists of two underwater instrument platforms (6.3 m water depth) connected by power and communications cables
to a shore station on the wharf in the hamlet of Cambridge Bay. The seafloor instrument platforms host a Wetlabs Water Quality Monitor (CTD, O2, fluorescence, turbidity), an Ocean Presence HD video camera and hydrophone, and an ASL Shallow Water Ice Profiler. On the wharf, a Davis Vantage Pro weather station and seaward-looking Axis video camera provide further environmental information. A wireless connection transmits all data and imagery from the shore station to a Nunavut government building in Cambridge Bay, where a commercial satellite link is established to the NEPTUNE Canada data centre at the University of Victoria, allowing quasi-real-time monitoring and archiving of data. Data have been flowing over this link since early October 2012. We plan to operate this mini-observatory in Cambridge Bay for a period of 5 years. All imagery and data will be archived for long-term study of the changing ocean environment in the arctic. Data and imagery are currently being used in studies of sea-ice growth and seafloor faunal dynamics. Future shore-based scientific programs will take advantage of the continuous, year-round data stream from the undersea platform. An equally important goal of this project involves working with the local secondary school to enable students to discover marine science through access to live video, underwater sounds and data from the observatory.
3D3.5 ID:6449 16:30
Climatologically Important Process Modelling Studies in the Antarctic Circumpolar Current and Polynya David Dietrich 1, Malcolm Bowman 2, Hamish Bowman 3, Yu-heng Tseng 4 1 San Diego State University 2 State University of New York at Stony Brook 3 Otago University, New Zealand 4 National Center for Atmospheric Research Contact: [email protected]
The southern hemisphere ocean thermohaline circulation (THC) is a main part of the climatologically important global poleward heat transport. Its coldest and deepest water forms in the Antarctic Circumpolar Current (ACC) and polynya. The ACC is the biggest current in the world ocean. Its climatologically important vigorous interaction with polynya and bathymetry are not understood in detail, due to the difficult and remote environment for subsurface measurements. Neither is the role of observed roll vortices (ACC striations). This motivated application of the TIMCOM/DieCAST ocean model to southern hemisphere simulations, to study the important processes involved. The model is boundary fit to an idealized representation of the Antarctic polynya. The striations are seen in satellite observations of surface height and temperature and in model results. The model is validated by observed major currents near Australia and New Zealand. It sheds light on the dynamics involved, including directly simulated processes in the Antarctic polynya.

3D3.6 ID:6756 16:45Salinity changes in intermediate water masses around the world.
Howard Freeland Fisheries and Oceans Canada, Institute of Ocean Sciences, Sidney, B.C., Canada, V8L 4A2 Contact: [email protected]
A prominent feature of the subtropical North Pacific Ocean is the salinity minimum lying in a narrow density range of 26.7 to 26.9 (sigma-theta),this is known as the North Pacific Intermediate Water (NPIW). NPIW is formed by deep convection originating in the Sea of Okhotsk, but substantially modified in the Oyashio/Kuroshio mixing region. A similar water mass is formed off the southern coast of Chile, this is the Antarctic Intermediate Water mass (AAIW) which spreads through the Drake Passage occupying the Atlantic Ocean at least as far north as the equator, the Indian Ocean and finally back into the Pacific. For both the NPIW and AAIW bulk properties of the water mass are determined by its near surface origin and this was used by Wong in 1999 (Nature). Wong showed that over a period of about 20 years, ending with the observations of the World Ocean Circulation Experiment, that the intermediate waters of the North and South Pacific, and the south Indian Ocean had freshened. A change she attributed to an increase in precipitation minus evaporation at high latitudes. In this paper I reconstruct the WOCE Hydrographic Program stations usingl realisations from the Argo array. It will be shown that in the 20 years since WOCE the changes have become considerably less clear than were described by Wong. It will be shown that the NPIW has become significantly saltier since WOCE. The AAIW in the south Atlantic has become saltier, but this was an example not explored by Wong. The AAIW in the Pacific remains essentially unchanged but may have become slightly saltier in the south Indian Ocean. These results are very different from those reported by Wong and suggest a much more complex relationship between P-E changes at high latitudes and changes in intermediate water masses.
Seismic Hazard Maps for Building Code Use / Cartes des hasards sismiques pour code du batiment
Room / Endroit (TCUP Salon D), Chair / Président (Samuel Butler and Garry Rogers ), Date (29/05/2013), Time / Heure (15:30 - 17:00)

3D4.1 ID:6750 15:30Fifth generation seismic hazard maps for the 2015 National Building Code of Canada Garry Rogers , John Adams , Stephen Halchuk Geological Survey of Canada Contact: [email protected]
The Geological Survey of Canada's new seismic hazard model for Canada will form the basis for the seismic design provisions of the 2015 National Building Code of Canada (NBCC). As such it represents Canada's fifth generation of seismic hazard maps (previous ones were in 1953, 1970, 1985 and 2005). The Cornell-McGuire method is used with fault and areal earthquake source models, including alternative models to represent the uncertainty in where earthquakes will happen in the future. Probabilistic models for subduction earthquakes on the Juan de Fuca and Explorer segments of the Cascadia subduction zone, and for the nearly aseismic central part of Canada (assessed based on partly on global rates), are included. The probabilistic combination of models replaces the 'robust' method of the 2005 maps. New ground motion prediction equations will be used. Products will include seismic hazard maps (at a probability of 2%/50 years or 0.000404 p.a.), tabulated values, uniform hazard spectra (UHS), plots of deaggregated hazard and documentation. For the seismic provisions of NBCC2015 the mean ground motion on firm soil sites (Vs30~450 m/s) for spectral acceleration at periods of 0.1, 0.2, 0.5, 1, 2, 5 and 10 seconds together with peak acceleration and peak velocity will be provided. The seven spectral parameters will allow the construction of approximate UHS for each locality, and hence improve earthquake-resistant design.
3D4.2 ID:6823 15:45Ground motion prediction equations for application to the 2015 Canadian national seismic hazard maps Gail Atkinson 1, John Adams 2 1 University of Western Ontario 2 Geological Survey of Canada Contact: [email protected]
Ground-motion prediction equations (GMPEs) and their epistemic uncertainty are a key input to seismic hazard assessments, because the GMPEs specify the expected ground-shaking amplitudes as a function of magnitude and distance. We describe a simple and efficient approach to the definition of GMPEs and their epistemic uncertainty for use in seismic hazard mapping in Canada. The approach defines a lower, central, and upper GMPE for each type of event (eastern crustal, western crustal, interface, inslab, offshore) that contributes to the hazard, by considering alternative published GMPEs and data that may be used to constrain these model choices. The proposed model is being applied in trial seismic hazard maps for Canada, for consideration in the 2015 edition of the

National Building Code of Canada (NBCC2015).
3D4.3 ID:6606 16:00
Coulomb Stress Changes Following the Mw 7.7 2012 Haida Gwaii Earthquake Tiegan Hobbs 1, Camille Brillon 2, John Cassidy 2, Stan Dosso 1, Herb Dragert 2 1 University of Victoria 2 Geological Survey of Canada Contact: [email protected]
This study examines spatial changes to the Coloumb stress field resulting from the Oct. 27, 2012 Mw 7.7 Haida Gwaii earthquake off coastal British Columbia, the relationship with well-located aftershocks, and the potential changes to shear and/or normal stresses along the Queen Charlotte Fault. The Queen Charlotte-Fairweather Fault extends from northern Vancouver Island to the Gulf of Alaska and is Canada’s most seismically active plate boundary. Focal mechanisms in this region are predominantly right-lateral strike-slip but with an element of oblique convergence between the Pacific and North American Plates off Moresby Island. The October 27, 2012 Mw 7.7 earthquake to the west of Moresby Island was the largest earthquake along the Canadian portion of this plate boundary since the Ms 8.1 earthquake of 1949. The 2012 event was a thrust earthquake with an along-margin rupture of ~120 km along the west coast of Haida Gwaii. This earthquake likely occurred on a previously unknown blind fault dipping gently to the NE rather than on the main, sub-vertical Queen Charlotte Fault. Nonetheless, the 2012 event potentially altered stresses on the primary Queen Charlotte Fault and it is possible that unclamping from this earthquake could promote future strike-slip events on the Queen Charlotte Fault. We use two mainshock finite fault models, of Shao and Ji and of Hayes, along with the Coulomb v3.3 stress model to compute stress-field changes and compare with accurate aftershocks locations (determined using a consistent set of stations and phases). Preliminary results indicate an apparent clustering of deep aftershocks just seaward of the main thrust, which are likely related to extension in the footwall. This work is part of a larger effort to characterize stress along the Queen Charlotte-Fairweather Fault system and its relation to a sequence of possibly inter-related earthquakes dating back to the late 19th century.
3D4.4 ID:6857 16:15Application of H/V Spectral Ratios of Earthquakes as a Proxy of Site Amplification in Seismic Hazard Maps for Building Code Use
Hadi Ghofrani , Gail M. Atkinson , Jon Crawford University of western Ontario Contact: [email protected]
We examine the correlation between VS30, the time-averaged shear-wave velocity over the top 30 m, and the horizontal to vertical component ratio (H/V) of
earthquake ground motions using the NGA-West 2 database. This is useful because these parameters are alternative simple measures of site response that carry complementary information. Furthermore, such a relationship can be used to predict one of these metrics, if the other is known. Based on the peak log(H/V) and its peak frequency in different regions (Northern and Southern California, Italy, China, Japan, and Taiwan), two model classes were distinguished; each of the regions falls within one of these classes. Class 1 regions include Japan and China, while the other regions are Class 2. Class 1 (“high frequency”) regions have sites with peak frequencies greater than 5 Hz, and Class 2 (“typical”) regions have much lower peak frequencies. The results can be summarized by the following equations: (1) VS30 = (538±223) – (806±404)∗log(H/V)peak + (58±10)∗fpeak with a standard deviation of 84 m/s on VS30 (Class 1); and (2) VS30 = (542±167) – (723±254)∗log(H/V)peak + (107±27)∗fpeak with a standard deviation of 106 m/s on VS30 (Class 2). Using these models it is possible to estimate VS30 for seismographic recording sites with unknown site conditions.
3D4.5 ID:6814 16:30
Towards scenario ShakeMaps for the St. Lawrence Lowlands Danielle Howlett 1, Hadi Ghofrani 2, Jean Rene Rivard 3, Michel Parent 3, Martin Ross 1, Jim Hunter 4, Gail Atkinson 2, Miroslav Nastev 3 1 University of Waterloo, Waterloo 2 University of Western Ontario, London 3 Geological Survey of Canada, Quebec 4 Geological Survey of Canada, Ottawa Contact: [email protected]
The nature and thickness of the sutficial sediments can considerably modify ground motion characteristics, such as amplitude, frequency content and duration. In regions where strong earthquakes are relatively rare, there is a lack of suitable instrumental data to help understand the effects of local site conditions during future earthquakes. The objective of the present study is to develop a procedure for regional assessment of the local site effects and to generate ShakeMaps for scenario earthquakes in the St. Lawrence Lowlands. Surficial geology overlying uneven bedrock topography was used as a proxy for seismic site conditions. The amount of ground-shaking amplification due to the surficial geologic layers is assumed as a function of the thickness and correlated shear-wave velocities. The complex geologic stratigraphy was simplified and grouped into three main units: surface sand, clay, and basal till. A variety of data including a digital elevation model, borehole data from public databases, existing geological models, and the updated seamless surficial geology map were edited in ArcGIS, and then imported into gOcad. A 3-D grid was built to determine the thickness values of each unit throughout the study area. Approximately 150 km of high resolution shear wave reflection seismic sections, 40 downhole seismic measurements, and 700 seismic refraction and reflection site evaluations were examined to determine horizontal and vertical shear wave velocity profiles of unconsolidated sediments. Both average shear wave velocity-depth and interval
velocity-depth functions were developed and correlated to the main surficial units. Ground motion prediction equations are currently being combined with shake type analyses to identify areas of potentially intensive ground shaking. The generated ShakeMaps will be used at a later stage to assess potential damage and losses with the recently adapted Hazus software.
Management of ground and surface water PART 2 / Gestion des eaux souterraines et de surface - PARTIE 2
Room / Endroit (TCUP Gall. A), Chair / Président (Garth van der Kamp ), Date (29/05/2013), Time / Heure (15:30 - 17:00)
3D6.1 ID:6931 15:30Deposited sediment as a driver of aquatic invertebrate community composition in Northern Great Plains rivers and streams Brittney M. Hoemsen 1, Iain D. Phillips 2, Douglas P. Chivers 1 1 University of Saskatchewan 2 Water Security Agency of Saskatchewan Contact: [email protected]
With surface water demands increasing, the monitoring, assessment, and protection of freshwater resources are becoming increasingly important. However, the scientific tools used to measure and ensure sustainable water use urban and industrial developments are lagging. Alteration of flow patterns in aquatic systems produce a combination of interacting stressors including erosion and excessive sedimentation. The increase of sediment deposition due to anthropogenic stressors can have dramatic consequences for downstream benthic communities, but this change has not been quantified to inform flow management in western Canadian rivers. This major ecological risk is the most widespread of all pollution problems affecting freshwaters globally and therefore warrants specialized attention. I will discuss the use of both experimental and observational approaches in order to study this impact. My aim is to determine the impacts of sediment pollution on benthic communities and secondary productivity in Northern Great Plains aquatic ecosystems, and ultimately produce a measure of ecosystem health to be used in reporting for sustainable development in Canada.
3D6.2 ID:6279 15:45
Retrofitting stormwater quality improvements in the city of calgary

Rick Carnduff Stantec Consulting Ltd. Contact: [email protected]
As part of the City of Calgary’s Operating Approval with the Province of Alberta, the City is required to limit the pollutants that are discharged to the Bow River from its wastewater treatment plant effluent and stormwater outfalls. Since 2000, all new developments have been required to incorporate stormwater management facilities that are specifically designed to capture and retain the majority of sediments from stormwater prior to discharges being made to any of the natural watercourses. In response to address the sediment loadings from pre-existing communities constructed before 2000, where there are little or no stormwater management facilities, the City embarked on the Stormwater Quality Retrofit Program in 2007 which initially identified ten high priority projects to reduce sediment loadings to the Bow River and its tributaries. This presentation will describe three of these projects for which Stantec Consulting Ltd. provided detailed designs, environmental assessments and coordination of construction. The presentation will briefly discuss the design criterion used in terms of sediment removal, including computer modelling applications. The majority of the presentation will focus on describing the improvements that were incorporated at each location, the different stakeholder interests and conflicts with existing utilities.
3D6.3 ID:6840 16:00
The Canadian Space Agency’s SWOT-C project Robert Saint-Jean , Thomas Piekutowski , Marko Adamovic Canadian Space Agency Contact: [email protected]
Proper management of Canadian water resources is a responsibility of all levels of government, industry and individual citizens. The precise measurement of the elevation of water bodies (large rivers, lakes, oceans) over a country as large as Canada is a challenging task. To provide quality information on these critical resources for Canadians, the Canadian Space Agency (CSA) is pursuing several agreements with international partners to allow Canadian scientists an access to the most accurate satellite data available. Currently planned for launch in 2020, the Surface Water and Ocean Topography (SWOT) mission is a NASA/JPL – CNES mission (estimated at more than $1.1B) to which CSA was invited to contribute. In exchange for CSA’s investment, Canadian scientists will be entitled to participate in the Science Definition Team and in the pre- and post-launch calibration and validation campaigns of the mission. Canadian participation in the SWOT mission covering the provision of equipment and the science is known as SWOT-Canada (SWOT-C). Programmatic aspects of the project are the responsibility of the CSA while the science and research aspects are supervised by Environment Canada (EC) and the Department of Fisheries and Oceans (DFO). The Canadian SWOT-C Science Plan is being drafted with the main
topics of interest for Canadian scientists being hydrology (Northern deltas, monitoring the levels of lakes, boundaries waters, discharges); oceanography (sea-level variability, ocean currents, eddies, productivity) and; topography (precise mapping of lake areas). This presentation will focus on the SWOT mission and on the SWOT-C project, highlighting its scientific interest and the benefits to Canadians and how the CSA is supporting Canadian scientists (other government agencies and universities).
3D6.4 ID:6893 16:15
Development of a 1-dimensional HEC-RAS model of four pinch point channels in the Namakan chain of lakes Aaron Thompson , David Stevenson Environment Canada Contact: [email protected]
Water levels on Rainy and Namakan lakes are regulated according to the rule curve specified in the 2000 Orders of Approval from the International Joint Commission (IJC). The IJC provided funding through their International Watershed Initiative program to develop a one-dimensional model which would improve the understanding of the relationship between water levels and hydraulics in the Namakan Reservoir system to aid managers implementing the rule curve. The system, which includes Namakan, Kabetogama, Sand Point, Crane, and Little Vermillion lakes, is connected by a series of four narrow channels. Established gauges at Gold Portage (Kabetogama Lake), Kettle Falls (Namakan Lake), and Crane Lake monitor water levels and their relationship to the current IJC rule curve band. Lake level readings from these gauges are generally in close agreement. However, water elevations at the lower end of the Namakan chain of lakes at Kettle Falls and Gold Portage may differ by as much as one foot from water levels at the head of the chain at Crane Lake during periods of high inflow to the lakes. A HEC-RAS model was developed incorporating multi-beam echosounder bathymetry collected during summer 2011 with previously available GIS data. The HEC-RAS model includes the four narrows as well as the interconnecting lakes. Temporary water level gauges installed throughout the system during the ice-free seasons of 2011 and 2012 provided calibration and validation data for the model. Discharge data for the four narrows collected by USGS using an Acoustic Doppler Current Profiler (ADCP) has also been used to verify model results. This presentation will provide an overview of model development and will analyze model simulation results with respect to observed data. It will also discuss potential sources of error related to vertical datums and the harmonization of collected bathymetry data with temporary and permanent water level gauge data.
3D6.5 ID:6695 16:30
International Joint Commission of Canada and the U.S.: Hydrographic Data

Harmonization – Status and Applications Michael Laitta 1, Conrad Wyrzykowski 2, Ted Yuzyk 3 1 International Joint Commission Canada and the US 2 Agriculture and Agri-Food Canada: [email protected] 3 International Joint Commission of Canada and the U.S. : [email protected] Contact: [email protected]
The International Joint Commission, in coordination with Environment Canada, Natural Resources Canada, U.S. Geological Survey, Agriculture and Agri-Foods Canada has made substantial progress with the harmonization of the shared fundamental hydrographic datasets along the Canadian-U.S. interface. Alignment and editing of sub drainage areas within the major Trans-boundary Basins and the first pass connection of the fundamental hydrographic layers is complete. In 2013, this effort will focus on the delineation and refinement of smaller drainage units within these now harmonized sub drainage areas as well as the development of bi national water quality and quantity applications. This presentation will touch upon the basic technical methods employed to facilitate the negotiation of bi national delineations, impacts to the federal stewarding agencies, and potential opportunities for sustainable regional based hydrologic applications.
Snow, Ice, Permafrost and Cold Regions Processes PART 3 / Neige, glace, pergélisol et processus reliés PARTIE 3
Room / Endroit (TCUP Gall. B), Chair / Président (Sean Carey ), Date (29/05/2013), Time / Heure (15:30 - 17:00)
3D7.1 ID:6338 15:45
Quantifying land cover classification sensitivity to shape, structure, and form within the discontinuous permafrost zone, NWT: Importance to hydrological model parameterization Laura Chasmer 1, William Quinton 1, Chris Hopkinson 2, Tyler Veness 1, Jennifer Baltzer 3, Aaron Berg 4 (Presented by Aaron Berg ) 1 Cold Regions Research Centre, Wilfrid Laurier University 2 Dept. of Geography, University of Lethbridge 3 Dept. of Biology, Wilfrid Laurier University 4 University of Guelph
Contact: [email protected]
The zone of discontinuous permafrost has undergone significant climatic warming and change over the past few decades. Horizontal and vertical changes to permafrost plateaus have resulted in an influx of water to peatlands, vegetation succession and change, and the conversion of permafrost plateaus into fen and bog land cover types. This has significant but largely unknown influences on the movement of mass and energy exchanges between the terrestrial biosphere and the atmosphere. Land surface models (including, but not limited to hydrological and ecosystem models) provide a means for better understanding processes and linking between spatial and temporal scales associated with land cover types. Therefore, accurate classification of land cover types and land cover boundaries is exceedingly important for model accuracy. The following study uses a decision-tree approach to classify permafrost peatlands, bogs, fens, lakes, and rocky uplands within the zone of discontinuous permafrost using airborne LiDAR and WorldView2 optical data. This is compared with a more typically applied supervised classification approach. To demonstrate the importance of classification accuracy to plateau runoff, a simple hydrological model is applied to permafrost area.
3D7.2 ID:6490 16:00Roles of groundwater processes in the evolution of complex landscape of discontinuous permafrost Agnès Rivière 1, Masaki Hayashi 1, William Quinton 2 1 University of Calgary 2 Wlifrid Laurier University Contact: [email protected]
The Hay River Lowland in the Northwest Territories is a 140,000 km2 region of discontinuous and sporadic permafrost with a high density of peatlands. The landcover consists of permafrost plateaus, channel fens, and ombrotrophic flat bogs, occurring as a complex mosaic of patches. The permafrost is contained within peat-covered permafrost plateaus that rise 1-2 m above the surrounding fens and bogs. The region is experiencing a rapid warming over the past several decades, and large-scale (e.g. 50 km grids), vertical energy transfer models suggest a pole-ward shift of the discontinuous permafrost zone in the future. At the Scotty Creek research basin in the Hay River Lowland, recent field-based and remote sensing observations indicate a rapid lateral thawing of permafrost and deepening of the active layer. It is expected that the lateral transfer of subsurface energy is at least partially responsible for thawing, but the relative roles of conductive transfer and advective transfer mediated by groundwater processes is not well understood. Field observation of differential thawing of the active layer also indicates the presence of strong feedback mechanism mediated by groundwater. We will use two- and three-dimensional numerical models of subsurface water and heat transfer to examine the magnitude of subsurface heat

fluxes and test the feasibility of various hypotheses regarding the lateral thawing of permafrost including: 1) the circulation of warm water around permafrost plateau "island" has a significant effect on lateral thawing, 2) variable saturation of peat affects the spatial distribution of permafrost thaw rates, 3) a small depression in permafrost plateau grows into a wetland as a result of groundwater-feedback process and eventually merge into larger, interconnected wetlands and 4) the amplitude of seasonal air temperature fluctuation affects the permafrost geometry and the pathway of groundwater flow.
3D7.3 ID:6590 16:15
Thawing permafrost in a nested groundwater flow system Jeffrey Mckenzie 1, Clifford Voss 2 1 McGill University 2 US Geological Survey Contact: [email protected]
Arctic hydrology is undergoing rapid changes due to climate change, such as increases in arctic river discharge and the disappearance of arctic lakes. As permafrost thaws from above, a deeper seasonal active zone develops, and more through-going thawed zones (i.e. taliks) develop that connect the supra- and sub-permafrost zones. Despite this potential for increasing groundwater movement in warming arctic environments, predictive models of permafrost thaw and distribution generally consider only the conduction of heat through the subsurface, and do not incorporate advective heat transport (movement of heat due to flow). To understand these systems and potential feedbacks, the SUTRA numerical groundwater model, which couples groundwater flow and heat transport, was modified to include freezing processes. When temperatures are below freezing, the model simulates variable saturation, permeability, and thermal properties as a function of ice saturation, and includes the latent heat of formation of ice. We simulate groundwater flow and permafrost thawing across a hillslope which has an initially continuous permafrost layer. Simulation results compare changes in permafrost distribution over a few thousand years of climate change due to (1) purely conductive heat transport (equivalent to essentially no groundwater flow) and (2) advective- conductive heat transport (equivalent to regions with significant groundwater flow). The effect of hydrogeologic parameters (e.g. permeability, anisotropy, topography, and surface water bodies) are also compared. The results indicate that where groundwater flows, the advective transport of heat enhances the rate at which permafrost thaws, increasing transmissivity and the movement of warmer recharge water and deep water, further increasing the rate at which the edges of the permafrost warm and thaw, in a positive feedback. Where groundwater flows, it is a significant control on the rate of thaw and pattern of residual permafrost in the landscape.
3D7.4 ID:6476 16:45Rising stream flows in the lower Liard River valley, NWT, Canada: examining potential causes Ryan Connon 1, Jennifer Baltzer 1, James Craig 2, Masaki Hayashi 3, William Quinton 1 (Presented by William Quinton ) 1 Wilfrid Laurier University 2 University of Waterloo 3 University of Calgary Contact: [email protected]
Runoff is rising in streams and rivers throughout much of northwestern Canada. The reasons for this rise are not well understood, and as a result our present capacity to predict flow variations is limited. The demand for improved predictive capacity in this region has steadily increased in the last decade due to unprecedented industrial expansion and the uncertain effects of climate warming on the region’s water resources. This study draws on field observations, remote sensing and model simulations in the lower Liard River valley to address the following possible reasons for increasing runoff from streams and rivers: 1) with the thawing of permafrost, runoff contributing areas are expanding and becoming increasingly integrated; 2) thawing of permafrost contributes water previously kept in frozen storage; 3) the pattern of precipitation is changing, even though the total annual precipitation is not systematically increasing; 4) thawing of permafrost enables increased interaction between surface and groundwater systems, allowing for the possibility of increased groundwater contribution to streams and rivers; and 5) permafrost thaw-induced conversion of forests to wetlands has altered patterns and rates of evapotranspiration.
Watershed assessment for the 21st century PART 3 / Evaluation des bassins versants pour le 21e siècle PARTIE 3
Room / Endroit (TCUP Gall. D), Chair / Président (R.D. (Dan) Moore ), Date (29/05/2013), Time / Heure (15:30 - 17:00)
3D9.1 ID:6442 15:30
Incorporation of Non-Stationary Landcover into Hydrological Climate Change Simulations in the Winnipeg River Basin

Shane Wruth 1, Tricia Stadnyk 1, Kristina Koenig 2 1 Dept. of Civil Engineering, University of Manitoba 2 Manitoba Hydro, Water Resource Engineering Contact: [email protected]
In most hydrological models, river- and landcover-specific parameters are calibrated based on a comparison of simulated to observed historical streamflow, using present-day Digital Elevation Models and landSAT landcover imagery data. However historical or current hydrological conditions are not necessarily representative of future conditions or hydrology. In long-term climate change simulations it likewise should not be assumed that landcover remains unchanged, as landcover effects hydrological predictions due to changes in soil moisture capacity, evaporation, infiltration, and runoff. A utility will be presented to alter landcover in response to climatic changes from Global Climate Models (GCMs) that is to be used as input for the WATFLOOD hydrological model for hydrological simulation of future streamflow with non-stationary landcover. Analysis of historical landcover imagery in two sub-basins of the Winnipeg River basin was used to form the justification and basis of this utility, quantifying the percent alteration of landcover due to natural, gradual change, and regenerative growth from forest fires using first order Markov processes. Logistic regression is used to model forest fire occurrence in both time and space, while forest fire extents are modelled through a generalized extreme value distribution. Regression coefficients and transition probabilities are defined by historical forest fire data and landSAT imagery analyses respectively, and can be customized for any meso- to large-scale watershed as needed. Climate change simulations with non-stationary versus stationary landcover will be presented and discussed for the Winnipeg River basin, as well as their respective uncertainties inherent in forcing such projections. The goal of this study is not for any one future estimate to be correct, but for the envelope curve generated by hundreds of future hydrological simulations to more accurately represent the uncertainty introduced by landcover non-stationarity, and for that uncertainty to be more accurately quantified.
3D9.2 ID:6304 15:45Digital elevation model modification for flat area watersheds Jay Sagin 1, Karl-Erich Lindenschmidt 2, Tim D. Jardine 3, Howard Wheater 4 1 Postdoctoral Fellow, Global Institute for Water Security, University of Saskatchewan 2 Associate Professor, Global Institute for Water Security, University of Saskatchewan 3 Assistant Professor, Global Institute for Water Security, University of Saskatchewan 4 Professor, Global Institute for Water Security, University of Saskatchewan Contact: [email protected]
Given the difficulties of ground-based observation in the north of Canada, many researchers rely heavily on satellite-based, remotely-sensed data sources. The Saskatchewan River Delta (SRD), located on the border of Saskatchewan and Manitoba, is a flat area of low elevation with a complex series of abandoned and
active river channels, lakes and wetlands, including the Cumberland Marshes, a bird breeding area of world importance. Tracking hydrological changes over the previous fifty years in this delta and modeling and predicting future change requires data which is currently lacking from conventional ground-based sources. Additionally, existing Digital Elevation Model (DEM) data, which was derived from Radar and extracted from aerial stereo photo images, does not properly represent the water coverage of the area. Radar, including Light Detection and Ranging (LIDAR), does not penetrate water, and also produces “noise” from ground vegetation and trees. Aerial photos show only the water, vegetation and trees upper surface area. Watershed delineation from the raw DEM therefore represents the hydrology improperly. Methodology was applied to modify the DEM using estimated water body depths based on previous field studies (Smith et al 2005, 2008) for the region (river channels: 2m; large lakes: 3m; smaller lakes: 2.5m; ponds: 1m: smaller water bodies: 0.5m, and small puddles: 10-30cm). Also, the raw DEM was modified to create a distinct profile that accounts for trees and vegetation within and along the streams. These quality improvements have resulted in a highly functional DEM that delineates the flat area watershed and can be used to examine future hydrological scenarios for the SRD.
3D9.3 ID:6613 16:00
Estimation of river thermal indices and optimization of a river water temperature measurement network Anik Daigle 1, Arnaud Caudron 2, Laure Vigier 2, Hervé Pella 3, Hervé Capra 3 1 INRS-ETE 2 Fédération de pêche de Haute-Savoie 3 Irstea Lyon Contact: [email protected]
River water temperature is now recognized as a key variable in assessing instream habitat. With the rapid development of new territories and in the context of a changing climate, it is expected that the thermal regime of rivers will be affected in a near future - a change in the number, the density and distribution of cold water species populations has already been observed in Canada and elsewhere in North America. The adaptation of aquatic species to changes in river thermal regimes will depend on the magnitude of these changes, but also on the rate at which they occur and on the eventual mitigation measures to be undertaken. To measure and anticipate the amplitude and the rate of expected changes, the natural thermal regime of rivers must be monitored and critical thermal indices must be quantified. Such a characterization of the natural thermal conditions prevailing in a given basin or territory requires the regular monitoring of the water temperature. At present, long-term and/or spatially dense systematic river water temperature monitoring programs are rare and often linked to specific and short-term impact studies. The optimal planning of a monitoring network should aim at a minimum number of monitoring sites for a maximum level of information, taking the basin/territory physiography into account. The work

presented here focuses on the spatio-temporal interpolation of thermal indices on a network grouping > 300 sites in brown trout rivers, on a 3500 km2 territory in Haute-Savoie, France. The analysis of the physiographical characteristics and water temperature data of the 300 sites allowed to evaluate that an optimized network combining less than 80 sites could be used to estimate several thermal indices of interest to quantify trout habitat with an accuracy comparable to that obtained with a more dense network comprising all original stations.
Northern ecosystem response to stressors PART 3 / Réponse de l'écosystème aux streseurs PARTIE 3
Room / Endroit (TCUP Blair Nelson), Chair / Président (Colin Whitfield ), Date (29/05/2013), Time / Heure (15:30 - 17:00)
3D10.1 ID:6673 15:30Temporal and spatial controls on winter nitrate export from forested catchments in south-central Ontario Nora Casson , Catherine Eimers , Shaun Watmough Trent University Contact: [email protected]
There is a great deal of variability in the timing and magnitude of stream nitrate export from forested catchments in south-central Ontario, both temporally (from year to year) and spatially (from catchment to catchment). This variability may be explained by the interactive controls of climate and topography. Understanding these controls is particularly important in light of climate projections for this area, which suggest that average winter temperatures will increase by 4-5oC over the next hundred years. This study synthesizes work on winter stream chemistry from four separate studies conducted on a series of headwater catchments on the Precambrian shield of south-central Ontario using a combination of long-term data analysis, digital terrain analysis and intensive field sampling. The results of these studies suggest that warmer winters with more rain events will shift the export of nitrate (NO3) earlier in the season relative to other nutrients, potentially affecting the biology and chemistry of lakes and streams. Isotopic techniques show that the majority of NO3 exported during rain events originates from precipitation and melting snow leading to a decline in stream pH. The magnitude of NO3 exported during rain events varies across catchments by up to an order of magnitude, largely due to differences in baseflow NO3 concentrations. Laboratory and field investigations of rates of NO3 production within catchments
showed a significant difference in nitrification between upland and wetland soils. Digital terrain analysis demonstrated that the location of these wetland areas relative to the stream determines the extent of ‘wetland influence’ on baseflow NO3 concentrations. Overall, these studies suggest that winter NO3 stream export will be affected by changes in climate, but the effect will vary depending on catchment topography.
3D10.2 ID:6308 15:45
The Implications for Subarctic Canadian Shield Aquatic Chemistry Regimes with Enhanced Winter Streamflow Christopher Spence 1, Steve Kokelj 2, Shawne Kokelj 2, Newell Hedstrom 1 1 Environment Canada 2 Aboriginal Affairs and Northern Development Canada Contact: [email protected]
Enhanced winter streamflow is a recent phenomenon observed across the circumpolar north. In the northwestern subarctic Canadian Shield, autumn rains that can produce winter runoff events that rival the magnitude of the spring freshet have become more common since the mid-1990’s. Although this hydrological process manifests differently across scales, it is apparent that the phenomenon is impacting the nature of regional aquatic chemistry regimes. A year with enhanced winter streamflow in the 155 km2 Baker Creek catchment was associated with lower average annual chemical concentrations, but higher annual fluxes because of higher winter concentrations. Winter chemical fluxes were several orders of magnitude larger during enhanced flow than typical winter low flow. This was most pronounced with metals and nutrients. The larger Cameron River, with a 3630 km2 catchment that contains several large lakes, also experienced much larger winter fluxes during enhanced winter flow, but annual fluxes were similar independent of winter flow conditions. The larger Cameron was consistently less efficient in producing chemical flux than Baker Creek. It is expected that the large lakes in systems like the Cameron act as a buffer, and a solute sink. This suggests that aquatic chemistry regimes of smaller streams may be less resilient and more vulnerable to the cumulative impacts of both development and environmental change. Thirty year trends imply this is the case. These results improve understanding of baseline conditions at a variety of watershed scales in this landscape and could be used to inform regulatory decision making, including effluent concentration limits.
3D10.3 ID:6732 16:00Acid sensitivity in northern Saskatchewan: Assessment of lakes at risk from Athabasca Oil Sands emissions Hazel Cathcart 1, Julian Aherne 1, Dean Jeffries 2, Ken Scott 3 1 Trent University 2 Environment Canada, National Water Research Institute, Burlington, ON, Canada 3 Saskatchewan Ministry of Environment, Regina, SK, Canada

Contact: [email protected]
Northern Saskatchewan is home to some of the most acid sensitive lake catchments in Canada1,2, which are situated downwind of the Athabasca Oil Sands Region in Alberta (AOSR) — the largest source of sulphur dioxide emissions in Canada3. Recent Federal monitoring programmes have highlighted the potential impacts of AOSR emissions to northern Saskatchewan, outlining the need to assess acid sensitive lake catchments. This study aims to assess regional acid sensitivity across northern Saskatchewan using extensive historic and current quantitative soil, rock and water chemistry data from >10,000 regional observations. There have been significant efforts in recent years to assess acid sensitivity in northern Saskatchewan through focused water chemistry surveys1,2. In addition, there are thousands of historic water pH and lithochemistry analyses across northern Saskatchewan associated with mine surveys dating from 1970–2005. Water chemistry data (calcium, pH, dissolved organic carbon and Acid Neutralising Capacity ) were related to catchment attributes including climate, soils, geology, modelled deposition and landcover to evaluate acid sensitivity. Owing to the low relief of the region and spatial density of lakes, Thiessen polygons were used to delineate single-lake catchments and a 50 km2 buffer was used to establish a broader locality for analysis. Multiple linear regression models were then used to predict water chemistry for all lakes across northern Saskatchewan (n = 187,307), with results showing lakes below pH and ANC threshold values for acidity. The results of the study highlight regions at risk from acidic deposition, and help to refine current critical loads and exceedances estimates in northern Saskatchewan. In addition the results support the Canada-Wide Acid Rain Strategy for Post-2000 which aims to prevent an acid rain problem in northern Canada. 1. Jeffries, D.S., Semkin, R.G., Gibson, J.J., Wong, I. 2010. Recently surveyed lakes in northern Manitoba and Saskatchewan, Canada: characteristics and critical loads of acidity. J. Limnol. 69(Suppl. 1) 45-55. 2. Scott, K.A., Wissel, B., Gibson, J.J., Birks, J.S. 2010. Chemical characteristics and acid sensitivity of boreal headwater lakes in northwest Saskatchewan. J. Limnol. 33(Suppl. 1) 33-44. 3. Environment Canada (2004). 2004 Canadian Acid Deposition Science Assessment: Summary of Key Results (Meteorological Service of Canada). 4. CCME (2008). 2006-2007 Progress Report on The Canada-Wide Acid Rain Strategy for Post-2000. Canadian Council of Ministers of the Environment.
3D10.4 ID:6875 16:15
Investigations of contaminant concentrations in fish and sediments in lakes and rivers along the Mackenzie and Athabasca Rivers: trends and

drivers Marlene Evans 1, Dirk De Boer 2, Kimberely Janzen 2, Alyssa Scott 1 1 Environment Canada 2 University of Saskatchewan Contact: [email protected]
Despite concerns about the safety of consuming fish from northern waters, fish contaminant monitoring studies in northern ecosystem systems are limited in number. Furthermore, most studies have focussed on mercury. New analytical techniques with lower detection limits are providing high quality data for a broader range of contaminants. Moreover, the determination of chemical concentrations in sediments is a major component of environmental assessment studies with results generally reported in terms of Interim Sediment Quality Guidelines (ISQG). Here we provide highlights of studies investigating contaminant concentrations in fish and the challenges of linking sediment concentrations with concentrations in fish. Mercury seldom exceeds ISQG with gold mining areas the notable exception. Nevertheless, because inorganic mercury is readily transformed to methyl mercury and biomagnifies in food webs, concentrations commonly exceed consumption guidelines in predatory fish. Mercury concentrations are increasing in fish along the Mackenzie River, with trends variously related to increases in annual air temperature and changes in mercury emissions rates from Asian sources; fishing pressures generally have been constant, exotics have not invaded these systems, and local sources are limited so that localized anthropogenic effects generally are not important drivers of temporal change. There is less evidence of trends in mercury concentrations in fish along the Athabasca River in large measure due to the paucity of high quality long-term data although sediment core data indicate increases in flux rates. Even less is known about other trends in other chemicals. Arsenic commonly exceeds ISQG in the sediments of Mackenzie River Basin; the limited fish data show that concentrations vary between species, tissues and location and may approach or exceed subsistence guidelines. Cadmium, chromium and copper less commonly exceed ISQGs and chemical data in fish are more limited. PAHs commonly exceed ISQGs in depositional areas and sites near sources such as bitumen beds: while data are limited, our recent studies suggest that PAHs, primarily alkylated, can occur in significant concentrations in some fish.
3D10.5 ID:6537 16:30The interactive impacts of climate and metal contamination on Boreal peatland biogeochemistry
Shaun Watmough 1, Erik Szkokan-Emilson 2, Paul Pennington 1, Sophie Barrett 1, Myra Juckers 1, Paul Preston 3, Samantha Luke 1 1 Trent University 2 Laurentian University 3 University of Toronto Contact: [email protected]

Peatlands are dominant features of the Boreal landscape and are under increasing pressures from anthropogenic pollutants and climate change. This presentation will synthesize ongoing work conducted in peatlands (poor-fens) extending along a metal deposition gradient in the Sudbury region of Ontario, which located at the southern extent of the Boreal ecozone. Surface peat in peatlands located closest to the smelters are enriched in metals such as Co, Cu and Ni, although porewater chemistry is greatly influenced by the acidity of water, which in turn is influenced by varying groundwater inputs. Soil-surface partitioning of many metals can be explained by peat chemistry and porewater pH. The degree of humification of surface peat is greater at sites closest to the smelters, and these sites have lower basal microbial respiration rates. Experimental studies however indicate that microbial function is not impacted at sites closest to the smelter and differences are due to the quality of the substrate. Vascular plant species richness increases with increasing porewater pH and metal concentrations in foliage increase with increasing porewater metal concentrations. The quantity and quality of dissolved organic carbon draining the peatlands is governed primarily by carbon content and quality in peat. Porewater chemistry demonstrates tremendous temporal variability and following summer droughts the acidity of water draining the streams can fall by 1 pH unit and metal concentrations may increase 100 fold. Initially this change is brought about by the oxidation of sulphur into sulphuric acid but as droughts persist, nitrification and nitric acid production becomes increasingly important. This study demonstrates natural variability in peatlands modify the negative impact of metal contamination but that climate change, and droughts in particular, can greatly enhance this stress
3D10.6 ID:6588 16:45A conceptual and statistical modelling framework for mapping aquatic ecosystem sensitivity to atmospheric mercury pollution: implications for northern Canadian landscapes Murray Richardson 1, Rachel Plewes [email protected] 1, David Depew [email protected] 2, Chris Eckley [email protected] 3, Ashu Dastoor [email protected] 2 1 Carleton University, Department of Geography and Environmental Studies 2 Environment Canada 3 United States Environmental Protection Agency Contact: [email protected]
A new approach to model and map national scale aquatic ecosystem mercury (Hg) sensitivity is presented. Using a national database of standardized fish mercury concentrations in approximately 2450 water-bodies, and a national scale Hg deposition layer, a Bayesian Tree learning algorithm is used to model the bivariate relationship between Hg concentration in fish and annual Hg deposition rates (the “Hg load-to-uptake response”). In this approach, the Bayesian Tree algorithm identifies natural clusters of Canadian National Ecological Framework (NEF) ecodistricts comprising distinct Hg load-to-uptake response, based on

mean fish Hg concentrations for those ecodistricts with n > 1 sampled lakes). In addition to Hg deposition and fish Hg concentrations, the model requires as input a readily available multivariate predictor dataset including NEF ecodistrict–level climate and ecosystem variables such as temperature, precipitation, vegetation type/coverage and wetland extents. Conceptually, the slope of the load-to-uptake response relationship of a set of ecodistricts is related to their average sensitivity to a unit input of Hg, with steeper slopes indicating greater sensitivity. Results show a modest but statistically significant (R2=0.41, p<0.001) load-to-uptake response in Arctic ecosystems with a slope value that exceeds all other regions extracted by the model. The next most sensitive and predictable (R2=0.19) set of ecodistricts fall primarily within the Boreal Shield ecozone. Relationships for all other clusters show weak (0.04 <= R2 <= 0.09) but statistically significant relationships and lower slope terms. Overall, this modeling exercise demonstrates: (1) highest sensitivity of Arctic aquatic ecosystems to atmospheric Hg loading relative to other parts of the country, followed by Boreal Shield regions; (2) strong influence of temperature and annual precipitation on Hg load-to-uptake response in Canadian lakes; and (3) the critical need for lake-level watershed characterization to properly consider geomorphic and ecosystemic influences on aquatic Hg sensitivity and to improve overall predictive power.
Geophysical High Pressure Research with Synchrotron Radiation / Haute pression et synchrotron
Room / Endroit (Hilton Prince Albert), Chair / Président (Hans J. Mueller ), Date (29/05/2013), Time / Heure (15:30 - 17:00)
3D14.1 ID:6918 INVITED/INVITÉ 15:30
1+1>2: Case of Simultaneous Ultrasonic Interferometry and Synchrotron X-radiation Measurements in Multianvil Apparatus
Baosheng Li Stony Brook University Contact: [email protected]
Elastic properties of materials under extreme conditions of pressure and temperature are of great interests to researchers in many scientific disciplines. In the last decade, acoustic velocity measurements using an improved ultrasonic interferometry method have been developed in both MA-6 and MA-8 types of multi-anvil high pressure apparatus. By placing the piezoelectric transducer in a stress-free location and using extended delay line, high S/N acoustic signals is
maintained while sample is under high pressure and temperature. By combining with synchrotron X-radiation, measurements of sound velocities using ultrasonic interferometry, crystal structure and unit cell parameters using X-ray diffraction, and sample strain (length) using X-radiographic imaging, can be made simultaneously and all in-situ at high pressure and temperature, enabling a pressure-standard-free characterization of solid and liquid materials to 25 GPa and 1800K. Results on ceramic and metallic materials from recent experiments will be presented to show velocities as a function of pressure and temperature, absolute pressure determination, equation of state for glass, and the application to liquids. Other new developments, such as controlling sample stress state at high P and T, the study of composites, and materials undergoing phase transformations will also be reviewed.
3D14.2 ID:6928 INVITED/INVITÉ 16:00
Phase Transitions, Kinetics, and Effects on Seismic Velocity: a Synchrotron High Pressure Study Donald Weidner , Li Li Stony Brook University Contact:
Phase transitions often involve significant volume changes for small pressure changes. This results in an effective bulk modulus that is much reduced from the elastic bulk modulus. Through modeling with non-hydrostatic thermodynamics, a similar affect is required for the shear modulus. An acoustic wave, whose velocity depends on the elastic moduli, will reflect the effective moduli if the time scale (or period) of the acoustic wave is longer than the time scale (kinetics) of the phase transformation or the elastic moduli if the time scales of the acoustic wave are shorter than that of the transformation. We have designed an experimental program to study the time scale of significant mantle phase transitions. Using a DDIA apparatus, we elevate the pressure and temperature to the conditions of the phase transition and then oscillate a uniaxial stress at a controlled period. Observations of sample strain and stress are afforded by the synchrotron x-ray diffraction and image. By varying the period of oscillation, kinetic times can be deduced. Our studies of the olivine to spinel transition at mantle conditions indicate a kinetic time of about 1000 seconds. On correcting the magnitude of the stress wave to that of a seismic wave significantly reduces this time constant implying a very slow seismic wave in the region where the high and low pressure phases coexist. Our studies on partial melting suggest a much shorter kinetic time suggesting that the melting process is responsible for the Earth’s low velocity zone.
3D14.3 ID:6919 16:30
Fe L- and L- edges inelastic scattering study on the spin states and spin transition in iron bearing minerals John Tse 1, Alexander Nyrow 2, Christian Sternemann 2, Max Wilke 2, Kolja
Mende 2 1 University of Saskatchewan 2 TU Dortmund Contact: [email protected]
Recent results on the study of the spin and electronic state of Fe(II) and Fe(III) bearing minerals with q-dependent inelastic scattering (X-ray Raman, XRS) using synchrotron radiation under ambient conditions and at high pressure will be presented. It is shown that the M-edge XRS is particularly sensitive to the spin state of the Fe site. Apart from the characterization of pressure induced spin transition, q-dependent theoretical calculations reveal that the rich spectral features observed at the M-edge may be useful to extract bonding information, such as the crystal field strength from the direct simulation of the q-dependent XRS spectra.
3D14.4 ID:6581 16:45
Elastic and inelastic properties under simulated Earth’s mantle conditions in large volume apparatus in conjunction with synchrotron radiation
Hans J. Mueller GFZ German Research Centre for Geosciences Contact: [email protected]
The interpretation of highly resolved seismic data from Earth=s deep interior require measurements of the physical properties of Earth’s materials under experimental simulated Earth’s mantle conditions. More than a decade ago seismic tomography clearly showed subduction of crustal material can reach the core mantle boundary under specific circumstances. That means there is no longer space for the assumption deep mantle rocks might be much less complex than deep crustal rocks known from exhumation processes. Considering this geophysical high pressure research is faced the challenge to increase pressure and sample volume at the same time to be able to perform in situ experiments with representative complex samples. High performance multi anvil devices using novel materials are the most promising technique for this exciting task. Recent large volume presses provide sample volumes 3 to 7 orders of magnitude bigger than in diamond anvil cells far beyond transition zone conditions. The sample size of several cubic millimeters allows elastic wave frequencies in the low to medium MHz range. Together with the small and even adjustable temperature gradients over the whole sample this technique makes anisotropy and grain boundary effects in complex systems accessible for elastic and inelastic properties measurements in principle. The measurements of both elastic wave velocities have also no limits for opaque and encapsulated samples. The application of triple-mode transducers and the data transfer function technique for the ultrasonic interferometry reduces the time for saving the data during the experiment to about a minute or less. That makes real transient measurements under non-equilibrium conditions possible. A further benefit is, both elastic wave velocities are measured exactly simultaneously. Ultrasonic interferometry
necessarily requires in situ sample deformation measurement by X-radiography. Time-resolved X-radiography makes in situ falling sphere viscosimetry and even the measurement of elastic and inelastic properties in the seismic frequency range achievable. This way current geophysical high pressure research is more and more bridging the gap between indoor and outdoor seismology.
2013-05-30
Plenary Day 4 / Plénière Jour 4
Room / Endroit (TCUP Theatre), Chair / Président (Geoff Strong and Brian Branfireun ), Date (30/05/2013), Time / Heure (08:30 - 10:00)
P4.1 ID:6912 INVITED/INVITÉ 08:30
Freshwater processes, transport and feedbacks between the Arctic and sub-polar North Atlantic Oceans
Paul Myers Earth & Atmospheric Science, University of Alberta Contact: [email protected]
Canada is surrounded by three oceans, including the Arctic Ocean to the north and the Atlantic Ocean to the east. As high latitude climate evolves, changes in sea ice, river runoff, glacial melt and ocean circulation are expected to impact oceanic salinities at high latitudes. Some of this freshwater is presently being stored in the Arctic Ocean, while some of it is exported to the Atlantic Ocean where it is expected to have impacts on stratification, water formation, take-up of gases such as carbon dioxide, as well as circulation. This presentation will start by looking at how the impact of changes in the Arctic may be transferred through the Canadian Arctic Archipelago and Baffin Bay into the North Atlantic Ocean. Feedbacks from the Atlantic into the West Greenland Current and Baffin Bay will also be examined, including potential impacts on Greenland’s coastal tide water glaciers, as well as possible ramifications for the circulation passing through the Canadian Arctic Archipelago (and thus feeding back on the Arctic Ocean).
P4.2 ID:6911 INVITED/INVITÉ 09:15
Regime change in Canada: Hydrology’s response to climate change in cold regions John Pomeroy Centre for Hydrology, University of Saskatchewan Contact: [email protected]

A changing climate has profound implications for hydrology and water resources from small to continental scales, and is manifested quite distinctively in the cold regions where the solid phase of water plays an important role in the hydrological cycle. Cold regions are already experiencing a variety of changes to precipitation regimes, with some regions wetting substantially, but also with some experiencing periods of diminished precipitation. These variations in precipitation have resulted in severe floods and droughts and long term changes to lake and wetland storage. However, most cold regions have experienced notable warming over the last 50 years and this is affecting the phase of precipitation, melt energy and evaporative energy, resulting in declines in the extent of seasonal snowpacks, glaciers and permafrost in many parts of Canada. The hydrology resulting from these changes is less predictable because it is driven by hydrological processes that are now operating in fundamentally different ways from the past. For instance, small ephemeral prairie streams whose flows have been dominated by snowmelt since records began have recently peaked from rainfall and begun to flow throughout the year. Rain on melting snow events are normally associated with flooding in British Columbia, but last year contributed to high flows from mountain streams in the Canadian Rockies and Yukon. Late summer flows from western mountains are reduced as glacier coverage and late summer ice melt decline and alpine evapotranspiration increases. This loss of predictability has important consequences for water resources management techniques that have relied on stationarity. This talk will review some of the key changes occurring in cold regions hydrology due to changing atmospheric inputs. It will then examine the sensitivity of various cold regions hydrological regimes to further climate perturbations that are anticipated this century. Snow processes can respond in a very non-linear manner to climate warming; this can results in dramatic hydrological regime change. The fragility of certain water resource systems will then be considered in light of these hydrological changes.
Low-frequency Variability and Predictability / Variabilité lente et prévisibilité
Room / Endroit (TCUP Salon A), Chair / Président (Hai Lin ), Date (30/05/2013), Time / Heure (10:30 - 12:00)
4B1.1 ID:6368 10:30
An analogue ensemble approach to predict monthly anomalies associated with El Niño-Southern Oscillation Ruping Mo 1, Chris Doyle 1, Paul Whitfield 2, Paul Joe 3 1 National Lab for Coastal and Mountain Meteorology, Environment Canada, Vancouver, BC V6C

3S5 2 Centre for Hydrology, University of Saskatchewan, Saskatoon, SK 3 Cloud Physics and Severe Weather Research Section, Environment Canada, Toronto, ON Contact: [email protected]
An analogue ensemble forecast scheme is described. The method is used to forecast monthly climate anomalies associated with the El Niño-Southern Oscillation (ENSO). This statistical model uses Euclidean distances to locate a few of the “best” ENSO analogues from amongst the most-recently available monthly sea surface temperature anomalies over the tropical Pacific and their historical counterparts. The monthly anomalies in the oceans and the atmosphere from these analogues in the following 12 months are used to form an ensemble for long-term operational forecast of the ENSO impact. The inverse square of the Euclidean distance can be used to compute a weighted average of the ensemble, or to estimate the likelihood of the associated analogue for a probability prediction system. It is shown that a model based on the single best analogue identified in the months from January to May has forecast skill that is better than climate expectation or persistence for the ENSO anomalies in the following fall and winter seasons. However, the single-analogue approach is very sensitive to the natural variability, especially in the extra-tropical oceans and in the atmosphere. When an ensemble forecast approach is taken, the forecast skill improves significantly. In particular, both of the weighted average of ensemble and the ensemble probabilistic forecast scheme based on the ENSO signals in the summer months achieve significantly better skill for the atmospheric anomalies over the North Pacific and North America in the following winter and early spring. Implications of some signal patterns for ENSO-related oceanic wave dynamics are also discussed.
4B1.2 ID:6874 10:45Metrics of estimating seasonal climate predictability
Youmin Tang (Presented by Waqar Younas ) University of Northern British Columbia Contact: [email protected]
The uncertainty of prediction or predictability study is usually conducted using the strategy of ensemble prediction, from which there are a couple of metrics to quantify the potential predictability. Among them are variance-based measure and information-based measure, both quantifying the predictability or prediction uncertainty from different perspectives. In this talk, I will review two kinds of metrics of predictability. Emphasis will be placed on the similarity and disparity of these measures, and the realistic applications of the measures in studying the uncertainty of seasonal climate prediction.
4B1.3 ID:6547 11:00

Indian summer monsoon influence on the climate in the North Atlantic–European region
Hai Lin RPN-A, Environment Canada Contact: [email protected]
Previous studies have shown that climate anomalies over the North Atlantic–Europe (NAE) can influence the Indian summer monsoon (ISM) variability. It is, however, still an outstanding question whether the latter has a significant impact on the former. In this study, observational evidences indicate that the interannual variability of ISM is closely linked to the climate anomalies over NAE. A strong ISM is often associated with significant above normal precipitation over most of western Europe. Meanwhile, positive surface air temperature (SAT) anomalies are usually observed over the Mediterranean, accompanied by below normal SAT in Western Europe during a strong ISM summer. The situation is just opposite during a weak ISM summer. A global primitive equation model is utilized to assess the mechanism of the above observed connection.
4B1.4 ID:6484 11:15GloSea5: The new Met Office high resolution seasonal prediction system. Kk Andrew Peterson , Craig Maclachlan , Alberto Arribas , Anna Maidens , Andrew Williams , Michael Vellinga , Margaret Gordon (Presented by Drew Peterson ) UK Met Office Contact: [email protected]
We describe the skill of the Met Office Global Seasonal forecast system 5 (GloSea5). GloSea5 has high horizontal resolution with an atmospheric resolution of approximately 40km in mid latitudes and 1/4 degree in the global ocean. This new system shows unprecedented winter forecast skill for Europe and Canada and is able to forecast the winter North Atlantic Oscillation skillfully, with an anomaly correlation of 0.6 for the hindcast period; much higher than has been reported elsewhere. GloSea5 also shows large reductions in the North Atlantic sea surface temperature bias. The new system improves the representation of the El Nino-Southern Oscillation (ENSO) by reducing the spurious westward extension of the SST patterns in the tropical Pacific seen, giving increased correlations and reduced mean errors, while maintaining ENSO teleconnection patterns seen in observations. There are still areas where further work is needed, particularly in removing a cold SST bias in the summer hemisphere and these will also be reviewed.
4B1.5 ID:6491 11:30
The Effects of Sea Ice Initialization on Seasonal Forecasts -- the WGSIP Ice Historical Forecast Project
Kk Andrew Peterson 1, William Merryfield 2, W-S Lee 2, Dirk Notz 3, Steffen

Tietsche 4, Matthieu Chevallier 5, Adam Scaife 1 (Presented by Drew Peterson ) 1 UK Met Office, Exeter, UK 2 CCCma, Environment Canada, Victoria, BC 3 Max Planck Institute for Meteorology, Hamburg, Germany 4 University of Reading, Reading, UK 5 CNRM-GAME, Météo-France/CNRS, Toulouse, France Contact: [email protected]
The Sea Ice Historical Forecast Project (IceHFP; \url{http://www.wcrp-climate.org/wgsip/chfp/iceHFP.shtml}) has been undertaken under the auspices of the World Climate Research Program (WCRP) Working Ground on Seasonal to Interannual Prediction (WGSIP). Its aim is to determine whether initialization of sea ice in seasonal prediction systems leads to increased predictive capacity for the atmosphere. This question is examined by initializing a series of seasonal forecasts for the winter (DJF), summer (JJA) and fall (SON) for a seminal year in Arctic sea ice extent, 2007. Two sets of forecast were performed: One with sea ice initialized to observations and a second where sea ice has been initialized with climatology. Thus the difference between the 2007 case initialized to observations and the case initialized to climatology will demonstrate the effects of diminished sea ice on the atmospheric circulation. Initializing with the low sea ice extent of November 2007 leads to a multi-model tendency towards anti-cyclonic winter circulation in the Arctic, particularly in the region of ice deficit. This may lead to a tendency towards negative NAO-like behaviour in winters with low sea ice extent, and could help to increase NAO predictibility. Similar behaviour is found for the fall circulation, although in that case it seems to be more sensitive to the location of the sea ice anomalies.
Renewable Energy: Role of Atmospheric Science PART 1 / Énergie renouvelable: rôle de science atmosphérique PARTIE 1
Room / Endroit (TCUP Salon B), Chair / Président (Joël Bédard and Peter Taylor ), Date (30/05/2013), Time / Heure (10:30 - 12:00)
4B2.1 ID:6871 10:30Wind power forecasting at BC Hydro Tim Ashman 1, Doug Mccollor 1, Greg West 2 1 BC Hydro
2 BC Hydro/UBC Contact: [email protected]
Wind power generation by independent power producers (IPPs) is increasing in British Columbia. BC Hydro, the province’s largest electric utility, purchases power on contract from these wind IPPs. Relative to the power generated by large hydroelectric dams, the amount of wind power currently in the BC Hydro system is relatively small. However, with additional wind farms being constructed each year, the importance of wind power forecasting is continuing to grow. This talk will detail the current state of BC Hydro’s wind forecasting system as well as future plans. Topics will include wind climatology, weather ensemble forecasts, the role of the meteorologist, and forecasting challenges. It will also discuss how wind generation affects BC Hydro’s system flexibility and how the wind forecasts are used by system planners, operators, and marketers.
4B2.2 ID:6685 10:45Performance of Advanced Short-Term Wind Ramp Forecast Methods in Texas During the Wind Forecasting Improvement Project John Zack , John Manobianco , Edward Natenberg , Steve Young , Matt Cote AWS Truepower, LLC Contact: [email protected]
The Wind Forecasting Improvement Project (WFIP, http://www.esrl.noaa.gov/psd/psd3/wfip/) is a multi-year study sponsored by the United States Department of Energy (DOE) and the National Oceanographic and Atmospheric Administration (NOAA) whose main purpose is to demonstrate the scientific and economic benefits of additional atmospheric observations and advanced atmospheric physics-based and statistical prediction models and data assimilation systems on wind energy production forecasts. WFIP covers two geographical regions of the U.S.: 1) the upper Great Plains, or Northern Study Area, and 2) most of Texas--the Southern Study Area. The Southern campaign was led by AWS Truepower LLC and is the focus of this presentation. The project in Southern Study Area consisted of a 6-month staging period, a one-year experimental forecast period and a 6-month analysis period. The experimental forecasting period extended from August 2011 to September 2012. During the one-year forecasting experiment, an array of additional sensors was deployed at targeted locations in the project area. Data from these sensors were assimilated into an ensemble of ten frequent update (i.e. initialized every 1 or 2 hours) high-resolution ( 5 km or smaller grid cells) deterministic NWP systems to generate 0- to 6-hour ahead wind power forecasts for wind farms within the project area. The presentation will consist of (1) an overview of the southern component of the WFIP project; (2) a summary of the forecast systems and methods used to generate the experimental forecasts; and (3) a summary of the forecast

performance results that provide insight on the relative performance of the methods used in the project, the factors that significantly impact forecast performance and the link between the predictability of wind ramp events and the meteorological or engineering cause of the event
4B2.3 ID:6299 11:00
Evaluation of background error covariance estimation methods for the assimilation of near-surface winds Joël Bédard 1, Stéphane Laroche 2, Pierre Gauthier 1 1 Department of Earth and Atmospheric Sciences, UQAM, Montréal (Québec), Canada 2 Data Assimilation and Satellite Meteorology Section, Environment Canada, Dorval (Québec), Canada Contact: [email protected]
Hourly wind power prediction plays a key role in the integration of wind power in an energy production network comprising different energy sources. The ability to predict hourly wind power up to 48h lead time is essential and relies on accurate numerical weather prediction of winds near the surface. High-resolution numerical weather prediction model forecast verifications (2.5km horizontal resolution) indicate large phase and amplitude errors that appear to grow from large-scale error in the analysis used by the model as initial conditions. The main objective of this project is to assess the impact of improved numerical model analyses on the reduction of wind power forecast errors, obtained by enhancing the observing network with near-surface observations (wind speed and temperature profiles) from tall anemometric wind farm towers. To achieve this, it is necessary to complete: 1) an evaluation of near-surface flow correlation with the atmosphere above; and 2) the estimation of the background error covariances prescribed for use in the assimilation system. Different approaches to represent, estimate and use background error covariances are examined using single observation experiments with the Canadian hybrid variational data assimilation system (EnVar) in order to set up a proper environment to assimilate near-surface observations from wind farms located in Québec (Canada).
4B2.4 ID:6619 11:15
Comparing idealized Ekman models to log-linear models in estimating hub-height wind speeds under stable stratification
Mike Optis University of Victoria Contact: [email protected]
The use of log-linear wind speed profiles to extrapolate near-surface winds to wind turbine hub-heights under stable stratification is still common practice. This approach is highly inaccurate due to the invalid assumptions of constant turbulent fluxes and constant wind direction above the surface layer. The inaccuracy of log-linear profiles is analysed in detail using turbulent flux profile
and wind speed profile data from the Cabauw meteorological tower. In particular, it is found that using only surface flux data significantly overestimates stability and thus wind speeds at hub-height. Accuracy is improved by using the mean turbulent flux across the vertical profile, and even more improved when local similarity (rather than Monin-Obukhov similarity) is used to construct the wind speed profile at successive altitudes using local fluxes. However, the need for flux profile data makes these latter approaches somewhat impractical. In increasingly stable conditions, winds at hub-height become increasingly decoupled from surface winds and more correlated with geostrophic winds. In fact, it is found that using a highly idealized Ekman model, in which the constant turbulent diffusivity coefficient is prescribed based on climatological nighttime averages, provides more accurate estimates of hub-height winds than the log-linear profile models. In particular, the modelling of wind vector components can account for low-level jets, which is not possible in a log-linear model. Accuracy of the Ekman approach is significantly improved when an Ekman layer is coupled to a surface layer scheme in which climatological nighttime averages of surface layer heights are prescribed. An idealized Ekman model requires only the geostrophic wind vector components as inputs, and is thus more simplified than log-linear models which require both near-surface stability and wind speed inputs. Given this simplicity and improved accuracy, Ekman models should be used in place of log-linear models when estimating hub-height winds under stable conditions.
4B2.5 ID:6542 11:30An NWP forecast information matrix in support of renewable energy applications
Lewis Poulin Environment Canada MSC-CMC Contact: [email protected]
This presentation offers practical information on where to find various freely available MSC NWP datasets on the internet and how one could go about packaging variables from those datasets into an ASCII weather forecast information matrix. Datasets available include: the Regional Scribe and Global Scribe matrices, the HRDPS, RDPS, GDPS and GEPS grib2 datasets and the MSC xml data of the super ensemble dataset generated as part of the NAEFS data exchange. This presentation is likely of interest to those who strive to automate their collection and packaging of of NWP weather forecast data so that it can be more easily fed into renewable energy decision-making and modeling systems.
Polar Applications PART 3 / Applications polaires PARTIE 3
Room / Endroit (TCUP Salon C), Chair / Président (David Fissel ), Date (30/05/2013), Time / Heure (10:30 - 12:00)
4B3.1 ID:6497 10:30
Skill of September Sea Ice Extent in the GloSea5 Seasonal Prediction System Kk Andrew Peterson , Ann Keen , Helene Hewitt , Alberto Arribas (Presented by Drew Peterson ) UK Met Office, Exeter, UK Contact: [email protected]
Over the past three years, the UKMO has participated in the Study of Environmental Arctic Change (SEARCH) sea ice outlook which attempts to coalesce and compare various outlooks for September sea ice extent made from observations available at the start of May. This year will represent the first opportunity to evaluate our contribution to the outlook in the GloSea5 high resolution (~50km Atmosphere, ~25km Ocean) seasonal prediction system. Using the GloSea4 system with initialization to observed ice concentrations over the past two outlooks we have demonstrated fairly high skill in our ability to produce historical forecasts of September Sea Ice extent for the period 1996-2009, with typical correlations with the observed ice extents of 0.6 when initializing the system around the end of March and beginning of April. The forecast potential of the system has also been encouraging, with the observed sea ice extent in both 2011 and 2012 falling within the range of possibilities predicted through the ensemble prediction system.
4B3.2 ID:6807 10:45
A case study analysis of the interconnections between the 2012 sea ice minimum, a sudden stratospheric warming in January 2013, and subsequent snowfall in Eastern North America. Brian Horton , Jennifer Lukovich , David Barber Centre of Earth Observation Sciences, University of Manitoba Contact: [email protected]
In September 2012, a record minimum sea ice extent of 3.41 x10^6 km2 was widely reported. Then, in January 2013, a sudden stratospheric warming event took place which subsequently influenced weather on the East coast of North America. Both record minima in sea ice extent, and sudden stratospheric
warming (SSW) events have been occurring more frequently in the last decade and a half (Cohen et al. 2009). While many factors influence the occurrence of SSWs, the stratospheric polar vortex has increased its displacement towards Siberia during the same period that open water extents have substantially increased over the Beaufort and Chuckchi Seas (Horton et al. submitted), potentially preconditioning it for SSW. The current paper evaluates the link between this 2012 record low in sea ice extent and atmospheric circulation in the months following. It is hypothesized that the late fall release of heat from anomalously open ocean influenced lower and mid tropospheric geopotential heights, which in turn modified lower stratospheric conditions in early winter; the modification of the lower stratospheric circulation precipitated a SSW, which in turn led to extreme cold and snow events in mid latitudes. Daily ERA-Interim reanalysis and NSIDC sea ice extent data are used as they provide a spatially and temporally continuous dataset for the northern hemisphere. Geopotential height, zonal winds, potential vorticity and EP Flux (a measure of vertical wave energy) are evaluated in the lower, middle and upper troposphere, and lower stratosphere beginning in August and extending to February. A lagged correlation analysis between open water extent, surface snow and temperature and the formation, and subsequent collapse of the stratospheric polar vortex is presented. This study contributes to the understanding of how dramatic changes in Arctic sea ice are relevant well beyond the Arctic.
4B3.3 ID:6861 11:00
Cyclone Forcing of Coupled Dynamic and Thermodynamic Processes In Arctic Sea Ice, and Across the Ocean-Sea Ice-Atmosphere Interface Matthew Asplin , David Barber University of Manitoba Contact: [email protected]
The Arctic summer minimum sea ice extent of 3.41 x10⁶ km2 observed on 16 September 2012 is the lowest ice extent in the satellite record and strongly reinforces a non-linear trend of sea ice decline over the past 30 years. A seasonally ice-free Arctic Ocean may become a reality sooner than originally thought, and this possibility therefore emphasizes the need for better understanding of storm interactions with Arctic sea ice and ocean. During the winter, storms can force areas of relatively thin sea ice to fracture, forming open water features known as sea ice leads. Winter sea ice leads typically rapidly refreeze, releasing heat and water vapour to the atmosphere in the process. Temperatures, local cloud formation, and rates of precipitation can be influenced by sea ice leads over a wide region, thus warming of coastal climates and affecting local communities. The timing of snowfalls from storms can significantly influence sea ice formation, as snow acts as an insulator that slows the growth of new ice. Storm interactions with large, expanses of open water, emerging during summer over the past six years in the Chukchi, Beaufort, Laptev, Kara and Siberian seas are also investigated. These areas represent fetch that permits the generation of large storm swells within the Arctic Basin that can reach the thick

multi-year (MY) ice that builds against the Canadian Arctic Archipelago. Long waves can propagate deep into the pack causing flexural swell and mechanical breaking of floes within the sea ice cover, thereby shifting ice floe distributions towards smaller diameter floes. This can affect dynamic processes like ridging and rafting and thermodynamic processes such as area-averaged albedo and lateral melting. Furthermore this process can increase mobility of large ice hazards that may be embedded in the ice pack.
4B3.4 ID:6816 11:15
The anomalous export of Multiyear sea ice through the Bering Strait during winter 2011/12 David Babb , Matthew Asplin , Ryan Galley , David Barber CEOS - University of Manitoba Contact: [email protected]
Ice drift data from six ice beacons deployed in the southern Beaufort Sea during August 2011 tracked the anomalous export of multiyear sea ice through the Bering Strait between December 2011 and March 2012. Historically ice from our study region will drift west through the Chukchi Sea into the Eastern Arctic as part of the anticyclonic Beaufort Gyre. However our ice beacons show a persistent southward drift of sea ice within the Chukchi Sea toward the Bering Strait for several months resulting in the eventual export of this ice into the Bering Sea. The Bering Strait is considered to import sea ice into the Arctic Ocean with only occasional export events that persist for several days, and are comprised of first year sea ice. Using satellite derived ice motion fields we see that this was a large scale event in which ice from the Beaufort, Chukchi and East Siberian Seas drifted south towards the Bering Strait. We also note that this event occurred under what has been described as ‘typical’ synoptic scale atmospheric conditions for this region, with a strong Siberian High and Aleutian Low persisting through the winter. Given that this event occurred under ‘typical’ atmospheric conditions we attribute it to an increasingly mobile ice pack which due to large scale declines in sea ice extent, thickness and age is responding to forcing mechanisms in different ways. To finish, we use historic ice beacon data from the International Arctic Buoy Program and historic fields of satellite derived ice motion to determine just how rare this event was and provide context on the effect that a changing icescape is having on the ice motion regime of this region.
4B3.5 ID:6297 11:30
Long Term Trends in Ice, Meteorology and Ocean Wave Conditions in the Canadian Beaufort Sea
David Fissel 1, Mar Martínez De Saavedra Álvarez 2, Ed Ross 2, John Marko 2, Alex Slonimer 2 1 ASL Environmental Sciences Inc 2 ASL Environmental Sciences Inc.

Contact: [email protected]
Existing long-term meteorological, sea ice and ocean wave data sets are reviewed and analyzed for estimation of trends and changes in the Canadian Beaufort Sea. An analysis of 45 years (1968-2012) of sea ice properties from digital Canadian Ice Service sea ice charts indicates that the summer and early fall concentrations of sea ice are decreasing by up to 7.4% per decade (September to mid-October). Old ice concentrations are decreasing at a higher rate along the slope and deeper offshore waters of the Beaufort Sea at rates of 10.5% per decade. There is also evidence of an increasing presence of glacial ice features passing through the Canadian Beaufort Sea. In contrast to the deeper offshore waters, the reductions in ice concentrations over the continental slope are smaller but still statistically significant in some subregions. The mid-outer shelf region also exhibits substantial reductions in mid-October with the loss of old ice and young ice being a large part of the total ice reduction. However, there have been no significant changes observed in ice thickness in continental shelf region. An analysis of long term air temperatures reveals that the largest greatest warming occurs in the fall and winter corresponding to a temperature elevation of about 4°C over the past five decades or an equivalent rate of decadal change of, approximately, 0.8°C. The regional wind patterns in the region exhibit little evidence of long-term trends in coastal zones, while cyclonic activity appears to be increasing in offshore areas. The combination of the reduced areal extent of sea ice in summer and especially in the fall, and continuing and perhaps increased cyclonic activity in offshore areas, is leading to increasing occurrences of large ocean waves, as seen through analyses of moored upward looking sonar data obtained over the past decade.
4B3.6 ID:6607 11:45A Synthetic Climatology of Dense Fog and Low Stratus Ceilings for Canadian Arctic Marine Areas
William Burrows Environment Canada, Sci. & Tech. Branch, ARMP & HAL Contact: [email protected]
During the Arctic warm season extensive areas of dense fog and low stratus develop, particularly over marine areas. This poses a hazard for aviation and shipping activities. As industrial activity in the Arctic increases the potential impact of this will grow. Observations are sparse and only available over land areas. The climatology of dense fog and low stratus ceilings is not well known over Canadian Arctic marine regions. Since few regular observations are available, a synthetic climatology based on forecasts derived from NWP models is the next best option for estimating a fog and stratus climatology. Hourly forecasts of dense fog and low stratus ceiling at 15 km resolution by a
comprehensive rule-based diagnostic model developed by Burrows and Toth (2010) were analyzed for 2010-2012. The model is driven by the Regional Deterministic Prediction System model run daily at the Canadian Meteorological Center, and provides hourly forecasts over the entire Canadian domain. Verification over the 3 years with a set of 7 observing stations located in marine environments outside of the Arctic shows the model correctly predicts more than 80% of occurrences of observed visibility ≤ 0.5 mile and more than 85% of occurrences of ceiling ≤ 500 ft. Monthly and seasonal averages of the forecasts reveal large areas of dense fog and low stratus persisting over certain marine areas of the Arctic Archipelago and Beaufort Sea, many of which coincide with possible future shipping routes and oil drilling activity there.
CSHS- Water Cycle in Integrated Modelling Framework PART 1 / Cycle de l'eau dans système de modèles intégrés PARTIE 1
Room / Endroit (TCUP Salon D), Chair / Président (Bruce Davison ), Date (30/05/2013), Time / Heure (10:30 - 12:00)
4B4.1 ID:6761 10:30Evaluation of weather model outputs, re-analysis products and gridded observations over mountainous areas in Alberta and the boreal forest in Saskatchewan Franck Lespinas 1, Bruce Davison 2, Muluneh A. Mekonnen 3, Vincent Fortin 1, Alain Pietroniro 4 1 Meteorological Research Division, Environment Canada 2 Hydrometeorology and Arctic Laboratory, Environment Canada 3 Global Institute for Water Security, University of Saskatchewan 4 Water Survey of Canada, Environment Canada Contact: [email protected]
Increased availability of archived weather model outputs, re-analysis products and gridded observations is bringing a new era in the hydrologic-land surface modelling community. These datasets indeed can be very useful for streamflow hind casting as well as near-real time river flow and flood forecasting. However, the quality of the datasets, particularly the precipitation field, varies from place to place and also varies depending on the type of rain events. Hence, evaluation of the datasets in different places and for different applications is extremely useful, particularly in mountainous areas where atmospheric circulation coupled with
complex topography is responsible for large spatio-temporal variability in precipitation field, and therefore on streamflow variability. This paper investigates the reliability of the precipitation fields from four North American data products (ANUSPLIN: 10 km by 10 km gridded precipitation data developed by Agriculture and Agri-Food Canada (AAFC); CaPA: 15 km by 15 km Canadian Precipitation Analysis; GEM: 15 km by 15 km precipitation field from Global Environmental Multiscale model output; NARR: 30 km by 30 km precipitation field from North American Regional Reanalysis) for hydrologic-land surface scheme (HLSS) model applications in mountainous areas of mountainous areas in Alberta and the boreal forest in Saskatchewan. The evaluation of the datasets is made from two different directions: 1) use of independent precipitation datasets to evaluate the forecast skill of the precipitation field from the above mentioned four datasets, and 2) comparing the HLSS-based streamflow predictions produced by the following combinations of the datasets: a) all HLSS forcing data from the GEM model output, b) all HLSS forcing data from the GEM model output with precipitation field replaced by CaPA, c) all HLSS forcing data from the GEM model output with precipitation field replaced by ANUSPLIN, d) all HLSS forcing data from NARR, e) all HLSS forcing data from the NARR with precipitation field replaced by CaPA, and f) all HLSS forcing data from the NARR with precipitation field replaced by ANUSPLIN. The combination that produces the best streamflow prediction provides an insight on how to refine future production of datasets. On the other hand, the relative performance of NARR combined with ANUSPLIN (case f) versus GEM combined with CaPA (case b) or GEM combined with ANUSPLIN (case c) is extremely interesting as this will indicate the merit of using the available long periods of NARR data together with a similarly long period available ANUSPLIN data for production of hindcast streamflow simulations.
4B4.2 ID:6488 10:45Validation of the Canadian Precipitation Analysis as Forcing for Distributed Hydrological Modelling in Canadian Basins Kuangyin Zhao 1, Tricia Stadnyk 2, Gregory Schellenberg 2, Franck Lespinas 3, Kristina Koenig 4 1 University of Manitoba, 2 University of Manitoba 3 Environnement Canada 4 Manitoba Hydro Contact: [email protected]
Traditionally, hydrological models use either (distributed) station data or climate model output as precipitation forcing. These traditional methods often either fail in areas where stations are sparse and geographically far apart, or let use numerical products that don’t consider available station data. The Canadian Precipitation Analysis (CaPA) uses GEM (Global Environmental Multi-scale model) data as its background field and adjusts the background value with quality-controlled station data to improve precipitation estimates. This study evaluates the effectiveness of the current operational version of CaPA (2.3), and
an experimental version (2.3a) that was constructed over the Canadian Prairie region by assimilating stations only within the prairie region. A three step rigorous validation methodology was applied to assess CaPA’s capability as hydrological model forcing: (1) validation of CaPA against Environment Canada CDCD observation at points within the domain (P2P); (2) validation of CaPA mapped over the domain against distributed CDCD data (using Inverse Distance Weighting method)(M2M); and (3) validation of streamflow simulations forced by CaPA in hydrological model WATFLOODTM relative to observed flow (proxy). This presentation will show the results of the first two validations on most of the Nelson-Churchill Basin, and proxy validations of the Winnipeg River, and Lake Winnipeg Basins. Differences between version 2.3 and 2.3a will be examined and discussed.
4B4.3 ID:6483 11:00
Proxy Validation of the Canadian Precipitation Analysis (CaPA) over the Churchill River Basin Gregory Schellenberg 1, Kuangyin Zhao 1, Tricia Stadnyk 1, Franck Lespinas 2, Kristina Koenig 3 1 Dept. of Civil Engineering, University of Manitoba 2 Environment Canada 3 Manitoba Hydro Contact: [email protected]
The Canadian Precipitation Analysis (CaPA) provides North American hydrological modellers with finer resolution (15km) forcing data than can be used in sparsely-gauged watersheds like the Churchill River Basin (CRB) for hydrologic analyses. CaPA combines the background field from the Global Environmental Multiscale (GEM) numerical weather prediction model with quality-controlled observation data to produce an operational precipitation product. The product is relatively new and is of interest to hydroelectric utility Manitoba Hydro for its potential to improve hydrological simulation in northern prairie watersheds. Evaluation of CaPA over the entire Nelson-Churchill domain is currently underway, with the goal of providing Manitoba Hydro with improved hydrological modelling capabilities. In this study, CaPA has been applied to the CRB and validated by comparison to observed station data (Environment Canada’s Canadian Daily Climate Data, CDCD) at various points within the watershed (Point-to-Point, or P2P). Spatial differences between the two data sets were evaluated by comparing CaPA to distributed station data over the watershed area (Map-to-Map, or M2M). Lastly, CaPA was used as forcing data for the hydrological model WATFLOOD for proxy validation relative to distributed (inverse-distance weighted) CDCD, and GEM forcing. Comparison of CaPA and GEM hydrological simulations indirectly quantifies the effect of assimilating station data with the background model. Along with P2P and M2M analyses, the comparison of simulated to observed hydrographs in the CRB provides additional insight into the potential application CaPA data has for regional scale hydrological modelling in sparsely gauged watersheds. Early results show

significant improvement in simulation output for the CRB when CaPA forcing is used in WATFLOOD over distributed CDCD data.
4B4.4 ID:6867 11:15
Assessing the Performance of a Distributed Land-Surface Hydrological Model (MESH) under various Watershed Discretization Schemes Amin Haghnegahdar , Bryan A. Tolson , James R. Craig , Karol T. Paya University of Waterloo Contact: [email protected]
4B4.5 ID:6540 11:30Streamflow Forecasting Experiments in the Humber River Basin Faten Jasim , Ken Snelgrove Faculty of Engineering and Applied Sciences, Memorial University of Newfoundland, Canada Contact: [email protected]
The Humber River basin (7860 km2) in Newfoundland is the 2nd largest watershed on the island portion of the province. Efforts are underway to establish a flow forecasting system within the basin for flood damage mitigation and hydroelectric power optimization. In the past, these efforts have relied on stochastic approaches to extract relations between inputs (meteorology and streamflow history) and outputs (streamflow forecasts). Physically based models such as SSARR (Streamflow Synthesis and Reservoir Regulation) have also been used with mixed results. In all cases, difficulty has been encountered due to a lack observed data and the complexity of the hydrologic system, especially during the snowmelt period. Strong topographic influences within the basin limit the representativeness of observations. Given the strong topographic influences on orographic precipitation and temperature, a gridded hydrologic model able to capture these influences was selected. The WATFLOOD hydrologic model permits the use of topographically adjusted gridded meteorological inputs. Adjusted station data from APC2 (second generation Adjusted Precipitation for Canada) data was used for model calibration and validatation. Here, distance-weighted gridded precipitation and temperature inputs are created based on simple lapse rate adjustment. Based on 30-year run sequences, a base model able to translate weather and antecedent moisture to streamflow has been developed. Using this rainfall-runoff translator, a number of forecasting experiments are underway. Generation of initial conditions for the model cannot rely on APC2 data because of its production lag. Instead, the CaPA (Canadian Precipitation Analysis) product will be evaluated against gridded station observations alone. It is expected that CaPA results, which combine weather prediction model results

with station observations will yield superior results over simple non-directional lapse rate adjustment. Once initial condition adjustment procedures are confirmed, use of weather model forecast precipitation and temperature will be used to provide flow forecasts within the basin.
Future Earth: Research for Global Sustainability / La terre future: Recherche pour la durabilité globale
Room / Endroit (TCUP Gall. Suite 1), Chair / Président (Gordon McBean ), Date (30/05/2013), Time / Heure (10:30 - 12:00)
4B13.1 ID:6935 INVITED/INVITÉ 10:30Future Earth: Research for Global Sustainability - Interactive Webinar
Gordon Mcbean University of Western Ontario Contact: [email protected]
Future Earth: Research for Global Sustainability is a new 10-year global research program co-sponsored by a global alliance of ICSU, ISSC, UNESCO, UNEP and others to bring together the major international programs, IGBP, Diversitas, IHDP and WCRP in a research partnership to address global sustainability challenges. This session will describe Future Earth and invites the input of all on how it should further evolve. The session will consist of a Canada-US webinar and Canadian participants. It will be chaired on site by Gordon McBean.
Heavy Precipitation over Mountains PART 1 / Fortes précipitations dans les montagnes PARTIE 1
Room / Endroit (TCUP Gall. A), Chair / Président (Mindy Brugman ), Date (30/05/2013), Time / Heure (10:30 - 12:00)
4B6.1 ID:6929 10:30

Introduction to Impacts of Heavy Precipitation over Mountains John Clague 1, Melinda Brugman 2 1 Department of Earth Sciences, Simon Fraser University 2 Coastal and Mountain Meteorology National Lab, Meteorological Services of Canada, Environment Canada Contact: [email protected]
An overview of natural hazards that are impacted by heavy precipitation falling over mountainous areas will be given to introduce the session. Special focus will be placed on ways we can improve regional warnings of natural hazards in western North America, but examples from around the world in mountainous areas will be identified to improve analysis. This introduction will include an overview of topics to be discussed in this session, and will provide information needed to place the information in context of natural hazard impacts. The goal here is to introduce the talks, and provide the contextual framework for this session.
4B6.2 ID:6759 10:45Independent verification of Canadian Precipitation Analysis over the Rocky Mountains Muluneh Mekonnen 1, Franck Lespinas 2, Bruce Davison 3, Vincent Fortin 2, Mindy Brugman 4, Alain Pietroniro 3 1 School of Environment and Sustainability and the Global Institute for Water Security 2 Canadian Meteorological Centre, Environment Canada, 2121 Transcanada Highway, Dorval, QC H9P 1J3 3 Hydrometeorology and Arctic Lab, Environment Canada, 11 Innovation Boulevard, Saskatoon, SK, S7N 3H5 4 Coastal and Mountain Meteorology National Lab, Meteorological Service of Canada, Environment Canada Contact: [email protected]
This paper presents an independent verification of the Canadian Precipitation Analysis (CaPA) in the Rocky Mountains during heavy precipitation events. Independent precipitation datasets from Alberta Agriculture and Rural Development (AARD) and observations from Radar are used to evaluate the 10 km and 15 km versions of CaPA. The 10 km and 15 km versions of CaPA are based on the then-operational 15 km configuration and the now-operational 10 km configuration of the Global Environmental Multiscale (GEM) Model respectively. The recent heavy precipitation time period with a number of significant events, June 2012 to July 2012, is selected to evaluate both versions of CaPA. Hydrologic-Land Surface Scheme (HLSS) based streamflow predictions are performed using three combinations of the datasets (all forcing data from GEM; all forcing data from GEM with precipitation field replaced by CaPA; all forcing data from GEM with precipitation field replaced by AARD precipitation data) to investigate how uncertainities in the precipitation field impact river flows in the head waters of the Saskatchewan River Basin.

4B6.3 ID:6631 11:00Climatology of extreme precipitation events in british columbia using a new comprehensive climate dataset Faron Anslow , Basil Veerman Pacific Climate Impacts Consortium Contact: [email protected]
British Columbia is subject to single and multiday extremes of precipitation arising from the interaction of frontal or convective systems and the province's orography. The coastal mountains of British Columbia frequently intercept advected tropical moisture plumes associated with frontal systems while the interior of the province receives extreme precipitation from convective systems as well as frontal systems. Our aim is to catalogue the occurrence of extreme precipitation across the province using a new comprehensive data set that combines precipitation observations from Environment Canada and those made by the provincial ministries to support transportation, agriculture, forestry, hydrologic monitoring and other activities. This analysis will depict the seasonality of the occurrence of extreme precipitation events as well as the regional distribution of threshold amounts for events with a variety of return periods. Although it is uncertain whether British Columbia will experience wetter or drier conditions in the future, the climatalogical baseline that this study establishes will provide useful metrics for understanding the changes of precipitation extremes in coming decades.
4B6.4 ID:6655 11:15Enhancement of Heavy Precipitation When Occluded Cyclones Interact with Mountains Melinda Brugman 1, Paul Joe 2, Edwin Campos 3, Anne Marie Macdonald 4, Jim Goosen 5, Trevor Smith 5, Jason Milbrandt 6, George Isaac 7 (Presented by Mindy Brugman ) 1 Coastal and Mountain Meteorology National Lab, MSC, Environment Canada, Vancouver, BC 2 Cloud Physics and Severe Weather Section, Environment Canada, Toronto, ON 3 Argonne Labs, Chicago, IL, USA 4 Air Quality Section, Environment Canada, Toronto, ON 5 Pacific Storm Prediction Center, MSC, Environment Canada, Vancouver, BC 6 Atmospheric Numerical Weather Prediction Research, CMC, Dorval, QC 7 Cloud Physics, MRB, Environment Canada, Toronto, ON Contact: [email protected]
An occluded cyclone is an extra tropical cyclone which typically produces very heavy precipitation and strong winds across western North America. The axis of the occluded storm is identified using the warm thickness ridge and/or the isentropic trough occupied by the warm moist conveyor belt. Canadian forecasters often track this axis as a Trowal (TRough of Warm air Aloft) for analyzing weather, while in the United States forecasters prefer to use the Occluded front or Upper Cold front for the same feature. In this study occluded

cyclones are examined which produced a dizzying array of severe weather impacts as they swept across British Columbia and closely interacted with the mountains. Emphasis is placed on the Valentines Eve storm of 2010 using the SNOWV10 data set for testing conceptual models of occluded cyclones. Additional data was used to track air trajectories with ozone and carbon monoxide measured at MSC air quality stations, especially at Whistler Mountain Peak (2,200 m asl). Results indicate that the Trowal is not produced by a cold front catching up with a warm front, but rather is a weather feature best represented by a forward tilted Cold Front Aloft (CFA) over an intense warm moist conveyor belt (WCB). The convective feedback that results from upper tropospheric/lower stratospheric intrusions causing the entrainment of dry air downwards enhances the Trowal airstream and intensifies the WCB (i.e. hotter and faster). The conveyor belt model of an occluded cyclone is useful for understanding severe weather impacts that this study shows are modified by multi-scale interactions with mountainous terrain. Seasonal patterns of precipitation, wind and pressure along the BC coastline are consistent with occluded cyclones driving the stormiest weather. If the future climate includes more intense occluded cyclones, then precipitation could be further enhanced over Western Canada due to the strong airflow interactions with terrain, especially near Pacific Ocean coastal upslope regions.
4B6.5 ID:6656 11:30
Heavy precipitation Analysis over the BC Mountains Using CaPA
Melinda Brugman (Presented by Mindy Brugman ) Coastal and Mountain Meteorology Lab, Meteorological Services of Canada, Environment Canada Contact: [email protected]
The mountains of British Columbia experience some of the heaviest precipitation amounts in the world. In this paper the new Canadian precipitation analysis (CaPA) is examined using surface precipitation data, ground-based radars, vertical profilers, and data sets on snowpack, runoff, avalanches and landslide impacts. This study compares the CaPA analysis to observational data for several major winter and summer season precipitation events during 2012-2013. Initial validation of CaPA over BC mountains indicates that much of the measured information was eliminated from the more remote regions during major storms. This is because the observational data coverage is generally only available in valley locations and even there is it quite sparse. Even with the best precipitation sensors, such as those available during SNOWV10, often it is very difficult to determine the actual precipitation falling, especially during winter or in strong winds. Snow is a particular problem, as well as icing, wind drift, and wave splash. Results show that CaPA is clearly valuable for mountainous regions in Canada to address infill in areas where data is sparse, but the reliability is questionable without more field data. As model resolutions improve and precipitation physics become more complicated, the CaPA analyses will depend

more and more on model data unless a better source of reliable observational data is created. Remote sensing from satellites will not be the only answer, because they are also unreliable and affected by attenuation for the most severe storms. Additional independent observations obtained during heavy precipitation, and during cold, windy and heavy wet snow conditions are investigated and compared to analyses. An independent examination of the observational data is essential because without reliable input data the CaPA analysis over BC and the Yukon will be mainly driven by model data, especially over mountainous regions and during major storms.
4B6.6 ID:6831 11:45
Link between the direction of the valley flow and melting snow Julie M. Thériault 1, Jonathan Doyle 1, Jason A. Milbrandt 2, Greg Thompson 3, Justin R. Minder 4 1 Université du Québec à Montréal 2 Environnement Canada 3 National Center for Atmospheric Research 4 University at Albany Contact: [email protected]
The accurate prediction of precipitation phase and intensity is very challenging in the winter season. The occurrence of many types of precipitation interacts with the environmental conditions to alter wind direction in valleys. In still weather conditions, melting snow may produce a very deep 0°C-isothermal layer, which will be associated with a transition from rain to snow at the surface. However, in complex terrain, the cool dense air produced by the phase change of snow melting into rain can move downslope and alter the dynamics of the storm. Given the correlation between the valley flow and the phase precipitation transition in complex terrain, the goal is to study the impact of melting snow on the valley flow direction. To address this, a case based on a mixed precipitation event during the Vancouver 2010 Winter Olympic Games in the Whistler Area, British Columbia, Canada, is used to initialize the 2-D dynamical model. The results show that the cooling due to melting snow generates a change in the valley flow direction. Moreover, when no cooling from melting of snow is considered the direction of the valley flow remains constant. The control experiment is compared with different microphysics schemes, which parameterize melting snow differently. Based on the control experiment, the impact of snowfall rate aloft and steepness of the mountain slope on the timing of the flow reversal is investigated. Overall, this study highlights the challenge of accurately predicting the precipitation phase and intensity in complex terrain when the temperature is around 0°C and the impacts of the valley flow direction.
Snow, Ice, Permafrost and Cold Regions Processes PART 4 / Neige, glace, pergélisol et processus reliés PARTIE 4
Room / Endroit (TCUP Gall. B), Chair / Président (Ross D. Brown ), Date (30/05/2013), Time / Heure (10:30 - 12:00)
4B7.1 ID:6272 10:30Online measurement system for measuring snow water equivalent and liquid water content in the snow pack to improve snowmelt runoff prediction
Wolfram Sommer Sommer GmbH Contact: [email protected]
SPA – Snow Pack Analyser The Snow Pack Analysing System (SPA) constitutes a revolutionary innovation in snow measurement. It is a world unique system for automatic and continuous measurement of all the relevant snow parameters like snow depth, snow density, snow water equivalent and contents of liquid water and ice. The SPA offers a modern and highly time delayed data gathering and helps to reduce dangerous and expensive adoption of human resources in the wintry area. Snow consists out of the three components ice, water and air. Referring to different measurement frequencies, these components show different dielectric constants. Measuring the complex impedance along flat ribbon sensors (SPA- sensors) at different frequencies allows to estimate the volume contents of the individual components. These equate the liquid water, ice and air content in the snow pack, which consequently results in the snow density. The SPA system can operate with up to four SPA-sensors with a standard length of 5 m. The sensors are installed on a framework with suspensions to ensure a tight and upright position. The sensors are either spanned sloping through the complete expected snow cover to determine the integral snow parameters. Or they are installed horizontally to determine the parameters in specific snow layers. An ultrasonic snow depth sensor supplies the information to calculate the SWE. The measurements and the calculations of the snow parameters are performed in a single control unit. The resulting data is transferred via a RS-232 interface.

The precise monitoring of water resources on catchment scales is indispensable for the prognosis of snowmelt run- off, which in return is relevant for flood prevention and hydropower reservoir management. In agriculture and mining estimations of the infiltration of melting water into the soil or underground are of basic interest. The continuous determination of the liquid water content is unique. It enables the estimation and even the forecast of the point in time of saturation and snowmelt run-off. Thereby the system can offer an important upgrading information for hydrological and snowmelt models.
4B7.2 ID:6845 10:45
Continuous monitoring of the impact of topography and vegetation on the spatial-temporal variability of snow cover properties Stefan Pohl , Jakob Garvelmann , Markus Weiler Institute for Hydrology, University of Freiburg, Germany Contact: [email protected]
Accurate knowledge of the small scale spatial and temporal variability of a mountain snow cover along and the associated meteorological forcing data is crucial for any high-resolution modelling of the spatio-temporal snow cover evolution. While many remote sensing techniques provide excellent data on the spatial variability of a snow cover, their temporal resolution is sometimes lacking. This study used a network of numerous standalone snow monitoring stations that continuously monitor snow depth and the most important climate variables needed to calculate a full (snow) surface energy balance. Over 100 of these stations were deployed over three winters in three small (<150 km²) research basins in the Black Forest, a foothills type mountain region in Southern Germany. Deployment locations were chosen to cover all important topographic situations and all major land cover types (open fields, deciduous forests, coniferous forests) typical for the study area. Data showed that elevation and vegetation cover accounted for over 70% of the spatial snow depth variability. The rest could be attributed mainly to exposure, especially relevant for open locations, and the influence of the surrounding topography. The simultaneously recorded climate variables gave an insight into the modifying effects of topography and vegetation on the individual snowmelt energy balance terms under a variety of melt conditions including solar radiation dominated melt and rain on snow events. Additionally, 45 time-lapse cameras were set up and provided continuous spatially variable information on canopy snow interception, the state of precipitation, snowdepth, and snow albedo. Snow albedo was also measured manually in areas around the cameras to further analyze its small scale variability and its differences under a variety of vegetation covers. The results of this study should be very helpful for improving model algorithms aimed at modeling the temporal and spatial variability in the evolution of a mountain snow cover.
4B7.3 ID:6592 11:00
Evaluation of alpine snow processes simulated by snow and wind flow

models Keith Musselman , John Pomeroy Centre for Hydrology; University of Saskatchewan Contact: [email protected]
Three physically based snow redistribution, accumulation and melt models were evaluated in mountainous terrain. The models were applied at high-resolution to a well- instrumented alpine ridge within the Marmot Creek Research Basin, Alberta, where wind redistribution plays a dominant role in the seasonal snowpack evolution. When tested at wind-sheltered lower elevations, all three models simulated accumulation and melt dynamics with reasonable accuracy. In the alpine, however, the model systems are unable to represent the dominant snow distribution features without an accurate windflow simulation. In sharp mountain topography, Computational Fluid Dynamics (CFD) models are often considered necessary to simulate wind fields under a range of wind speed and direction. A CFD was applied to the greater Marmot Creek basin and the results were used to compute direction-specific wind speed ratios between model grid elements and measurement locations and the observed wind speeds for each time step were interpolated accordingly. When forced with CFD-derived wind speed fields, the three models were able to redistribute and sublimate snow according to realistic flow directions and speeds. The results highlight the utility of a CFD model to capture the general turbulence characteristics that determine snow transport and govern seasonal snowcover patterns. The importance of using realistic wind fields to drive distributed snow models in alpine terrain is emphasized.
4B7.4 ID:6596 11:15
Simulating Snowmelt Runoff from a Small Alpine Basin within the Canadian Rocky Mountains Chris Debeer , John Pomeroy University of Saskatchewan Contact: [email protected]
In the Canadian Rocky Mountains snowmelt runoff represents the greatest single contribution to the flow of streams and rivers. Concerns over future water resource stresses here require better understanding and prediction in some areas of alpine snow hydrology, such as representing spatial heterogeneity of snowcover distribution and melt, and scaling of processes within hydrological models over complex terrain. This work was aimed at improving this representation through the development and testing of a new framework for meltwater generation and runoff in alpine environments, using observations from the Marmot Creek Research Basin in the Front Ranges of the Rockies. The framework is based on the lognormal distribution of snow water equivalent (SWE) values on different landscape-based slope units, which allows estimation of the areal extent of various SWE depth classes over the terrain from the mean SWE and coefficient of variation (CV). Melt computations applied to the different
SWE classes allow the variability in timing and rate of snowmelt to be realistically simulated by explicitly accounting for spatial variations in energy receipt, as well as the differential warming, ripening, and melt due to differences in snowpack mass and internal energy. The framework was incorporated into the Cold Regions Hydrological Model (CRHM) platform and various other process modules (e.g. vegetation canopy processes, soil infiltration, groundwater recharge, and runoff routing) were added to simulate the hydrograph at the outlet of a small (~1.2 km2) headwater basin in the alpine zone of Marmot Creek. The model was initialized using spatially distributed end-of-winter SWE measurements and was forced using local meteorological observations over several seasons. Testing involved comparison of results with observed point scale melt timing and rates, areal snowcover depletion over individual slopes and the headwater basin as a whole, and snowmelt runoff at the basin outlet. The study provided insight on how the variability in both pre-melt snowcover and meltwater inputs over the basin influence the snowmelt hydrograph at the basin outlet. Through a comparison of different approaches for representing snowcover, snowmelt, and lower basin forest canopy effects, it was shown that the best correspondence with observed hydrographs was achieved when explicitly accounting for the differential timing, location, and extent of source areas for snowmelt runoff. However, in many other cases realistic appearing hydrographs were obtained, but for the wrong reasons due to cancellation of model errors. The approach here maintains internal “correctness” of the alpine snow components, which is beneficial towards development and parameterization of other process components in hydrological models applied elsewhere in alpine landscapes. The results also showed that the effects of differential melt timing and rate over different SWE classes within a single landscape unit did not become manifested in the overall hydrograph response, despite having an important influence on areal SCD. Thus, if the primary goal of model application is to predict the hydrograph only, then this effect can likely be neglected without serious errors.
4B7.5 ID:6277 11:30Contribution of snow to Hudson Bay streamflow Stephen Déry 1, Audrey Simon 2, Ross Brown 3 (Presented by Stephen Dery ) 1 UNBC 2 Université de Montréal 3 Environment Canada at Ouranos Contact: [email protected]
This presentation will investigate the variability in annual peak snow water equivalent (SWE) and its contribution to Hudson Bay streamflow over hydrological years 1999-2010. A total of 18 river basins (including the ungauged Hudson Bay seaboard) are chosen for this study. The Hudson Bay drainage delivers ~760 cubic km per year of freshwater to Hudson Bay with annual

variations of ±9%, providing the largest contribution to its freshwater budget. The spatial distribution of peak snow accumulation across the Hudson Bay drainage and its interannual variability will first be assessed using the Canadian Meteorological Centre (CMC) monthly SWE dataset at a horizontal resolution of 24 km. Then the relative contribution of SWE to Hudson Bay streamflow generation will be established using Water Survey of Canada (WSC) observational records of river runoff across the 18 basins of interest. Preliminary results indicate that basin-averaged monthly peak SWE values range from 56 mm in the Nelson-Churchill watershed to 150 mm in the Rupert River Basin. For the Hudson Bay drainage as a whole, 37% of the annual runoff of 211 mm is estimated to derive from snowmelt. The talk will end with a brief discussion of the potential implications of changing snowmelt contributions to streamflow input into Hudson Bay with a focus on its marine environment.
Atmospheric Composition and Processes / Composition et processus atmosphériques
Room / Endroit (TCUP Gall. C), Chair / Président (Congress Scientific Committee ), Date (30/05/2013), Time / Heure (10:30 - 12:00)
4B8.1 ID:6459 10:30Trends in Global Carbon Monoxide as Measured by the MOPITT Instrument James Drummond 1, Florian Nichitiu 2, Merritt Deeter 3, Helen Worden 3, David Edwards 3, Jason Zou 2, John Gille 3 1 Dalhousie University 2 University of Toronto 3 National Center for Atmospheric Research Contact: [email protected]
On 18th December 1999 the Terra platform was launched carrying the Measurements Of Pollution In The Troposphere (MOPITT) instrument. MOPITT has now completed over thirteen years of operation measuring carbon monoxide (CO) over the planet. MOPITT was designed with a 5-year mission in mind and with delays in the launch, the instrument was already several years old when it went into space. However, like the Energizer Bunny [TM], it has just kept going and going and the instrument performance and stability have been exceptional. A recent review suggested that at current rates of deterioration the instrument could last another decade at least.

MOPITT was designed to examine the global distribution of carbon monoxide which has spatial variations of factors of 2x or more. Looking for long-term trends is much more complex as slow instrumental effects have to be untangled from slow changes in the atmosphere. However, recently we have made progress in this area and long-term variations in global CO have been identified in the MOPITT data that are not attributable to the instrument, appear to be atmospheric in origin and are also seen in other global CO time series (Worden et al., ACP, 13, 837-850, 2013). Given the over 13-year near-continuous record of the data, we can examine issues on a range of timescales from days to decades. This talk will concentrate on the longer-term changes and what they tell us about the longer-term evolution of the atmosphere. MOPITT was provided to the Terra spacecraft by the Canadian Space Agency and was built by COMDEV of Cambridge, Ontario. Data processing is performed by the MOPITT team at the National Center for Atmospheric Research, Boulder, CO. Instrument control is by the team at the University of Toronto.
4B8.2 ID:6926 10:45
A New Calibration Procedure which Accounts for Non-linearity in Single-monochromator Brewer Ozone Spectrophotometers Zahra Vaziri 1, Omid Moeini 1, Vladimir Savastiouk 2, David Barton 1, Tom Mcelroy 1 1 York University 2 Full Spectrum Science Inc. Contact: [email protected]
It is now known that single-monochromator Brewer Spectrophotometer ozone and sulphur dioxide measurements suffer from a non-linearity due to the presence of instrumental stray light. Because of the large gradient of the ozone absorption spectrum in the ultraviolet, the atmospheric spectra measured by the instrument possess a very large gradient in intensity in the 300 to 325 nm wavelength region. This results in a significant sensitivity to stray light when there is more than 1000 Dobson Units (D.U.) of ozone in the light path. The measurements can be on the order of 8% low for an ozone column of 600 D.U and an airmass factor of 3 (1800 D.U.). Primary calibrations for the Brewer instrument are carried out at Mauna Loa Observatory in Hawaii. They are done using the Langley plot method to extrapolate a set of measurements made under a constant ozone value to an extraterrestrial measurement. Since a small non-linearity at lower ozone paths may still be affected, a better calibration procedure should account for the non-linearity of the instrument response. This paper will present a mathematical model of the instrument response and a non-linear retrieval approach that calculates the best values for the model parameters. The model can then be used in reverse to provide correct ozone values even at large ozone slant paths.

4B8.3 ID:6358 11:00
Environmental Controls on Methane Fluxes from a Boreal Bog in Northern Quebec, Canada, Using an Open-Path Eddy Covariance System Daniel Nadeau 1, Alain Rousseau 1, Carole Coursolle 2, Hank Margolis 2, Marc Parlange 3 1 INRS - Eau, Terre et Environnement 2 Université Laval 3 EPFL Contact: [email protected]
Wetlands are the largest natural source of atmospheric methane, a powerful greenhouse gas. Over such environments, methane fluxes are typically quantified with static or dynamic chambers and gas chromatography. Although inexpensive and portable, this method does not allow for continuous measurements besides not capturing the effect of atmospheric turbulence on methane emissions. An alternative is closed-path eddy covariance systems, but these usually require high power consumption and regular maintenance, both of which are difficult to supply in highly remote areas where most Canadian wetlands are found. In this study we deployed the new open-path methane analyzer (model Li-7700) from Li-Cor inc. along with surface energy budget sensors over a 60-ha boreal ombrotrophic bog from June to September 2012. The field site (53.7°N, 78.2°W) is located near James Bay within the La Grande Rivière watershed. This work discusses the presence of diurnal patterns in turbulent methane fluxes, and analyzes the effect of atmospheric stability, pressure changes and other atmospheric controls on fluxes magnitude and timing. The impact of other environmental controls such as water table depth and peat temperature is assessed using regression tree analysis. Methane emissions are also quantified at the daily scale and compared to previously reported values over similar sites with other methods.
4B8.4 ID:6654 11:15Changes in Air Mass Types in the Hudson Bay Region Andrew Leung , William Gough University of Toronto Scarborough Contact: [email protected]
The warming of the Hudson Bay region is described in many literatures through air and sea surface temperature data. Such warming leads to a longer ice-free season. This study provides a new perspective to this issue by examining the role of air mass in the warming. The goal is to identify the dominant air masses and their temporal trends from 1971 to 2010 at seven locations around Hudson Bay. Daily air mass types are determined using the Spatial Synoptic Classification. Results showed that Dry Polar (DP) and Maritime Polar (MP) were the two most dominant air masses. DP and MP accounted for a total of over 50%
of air mass at all seven locations in the study period. A warming trend was observed consistently throughout the region as DP was slowly being replaced by MP. The warming had altered the air mass frequency of DP and MP to the point where the most dominant air mass (DP) switched place with the second most dominant air mass (MP) in two locations in the southern part of Hudson Bay region. This phenomenon was predicted to take place at another two locations further north under the current rate of change within the next 10 years.
4B8.5 ID:6481 11:30
An Examination of Winter Precipitation on Cypress Mountain during SNOW-V10 Stephen Berg 1, Ronald Stewart 1, Paul Joe 2 1 University of Manitoba 2 Environment Canada Contact: [email protected]
Cypress Mountain, just north of Vancouver, is a typical coastal barrier for moisture-laden onshore airflow and, therefore, is subjected to large amounts of precipitation. The athletic events at this site during the 2010 Vancouver Olympic Winter Games (snowboarding and freestyle skiing) were frequently delayed due to the occurrence of rain rather than snow. Unprecedented data on precipitating systems affecting this mountain were obtained between January and April 2010 during the SNOW-V10 (Science and Nowcasting Olympic Weather for Vancouver 2010) field campaign. This included information collected from specialized radar and precipitation sensors, enhanced surface weather stations, as well as from operational radar and satellite data. Some precipitation events lasted over 24 h, although moderate to heavy precipitation rates lasted to a maximum of approximately 6 h. Vertical radar profiles consistently showed reflectivities increasing towards the surface, as much as 10 dBZ over 200 m. Inferred heights of the melting layer upwind of the barrier differed by as much as a few hundred metres from what was observed over the mountain. The mechanisms of precipitation production were examined, which may contribute to improvements in nowcasting and forecasting, as well as better understanding of the role of coastal mountains on the regional climate.
4B8.6 ID:6366 11:45
The effect of the Canadian Shield on cloud-to-ground lightning density in Saskatchewan
Daniel Brown Saskatchewan Environment – Wildfire Management Contact: [email protected]
It is important to further understand the spatial distribution of lightning strikes because lightning can cause personal injury, destructive forest fires, and damage to infrastructure. The spatial density of cloud-to-ground lightning strikes from the
Canadian Lightning Detection Network was examined between 1999 and 2011 in Saskatchewan, and a strong lightning density gradient seemed to be related spatially to the Canadian Shield boundary. Comparing the regions 100 km north and south of the Canadian Shield boundary, the lightning density jumped from 4.66 strikes km-2 in the north region to 6.96 strikes km-2 in the south region. There is a discrete boundary between the two lightning regimes, which is closely aligned with the Canadian Shield boundary. The lightning density gradient does not occur every year; it is only apparent after the summation of many years of lightning data. The lightning density versus distance from the Canadian Shield was calculated in 10 km increments, reaching a maximum gradient of 0.054 strikes km-2 km-1 in the zone 10 km north of the Canadian Shield. Three possible explanations are proposed: 1) A discontinuity in surface properties may cause fewer thunderstorms in the Canadian Shield. 2) The same number of thunderstorms may exist, but fewer cloud-to-ground lightning strikes occur because high ground resistivities suppress the redistribution of charge in the ground. 3) The same number of cloud-to-ground lightning strikes occurs, but fewer are detected because the surface properties of the Canadian Shield interfere with the detection procedure. Further research on this topic is required to reach more concrete conclusions about the effect of surficial geology on cloud-to-ground lightning strikes.
Emerging technologies and concepts in rock physics / Concepts et technologies émergentes en physique
Room / Endroit (TCUP Gall. D), Chair / Président (Claire Samson ), Date (30/05/2013), Time / Heure (10:30 - 12:00)
4B9.1 ID:6746 10:30
Rock Properties of Basalts in a Potential Geothermal Field: Results of Unconfined Uniaxial Compression Experiments on Core from the MH-2 Borehole, Mountain Home, Idaho

James Kessler 1, Douglas Schmitt 2, John Shervais 1, James Evans 1, Duane Champion 3, Randolf Kofman 2, Xiwei Chen 2, Michael Strange 1 1 Utah State University 2 University of Alberta 3 U.S.G.S. Menlo Park Contact: [email protected]
The Mountain Home 2 (MH-2) borehole is one of three drilled for the International Continental Drilling Program Project Hotspot: The Snake River Geothermal Drilling Project on the Snake River Plain, Idaho to assess the potential for geothermal energy development. Core recovery was >90% and a high-fluid-temperature (140°C) artesian zone was encountered at 1,608 m (5,276 ft) depth. The core consists of massive basalt, vesiculated basalt, hyaloclastite, and highly altered and/or reworked basalt. Core samples contain secondary minerals of quartz, calcite, clays (chlorite and smectite), zeolite (laumontite), pyrite, and chalcopyrite that indicate that high temperature fluids permeate the rocks in those intervals. Here we conduct unconfined uniaxial compression experiments on core samples collected every 6 – 15 m (20-50 ft) over the interval 1,289 m (4,229 ft) to 1,819 m (5,968 ft). During each compressive experiment, a load is applied to the sample until it reaches failure. Strain is measured parallel and perpendicular to the axis of compression at high intervals throughout the experiment. Strain and stress data are used to calculate Young’s modulus (E), Poisson’s ratio (ν), and uniaxial compressive strength (UCS). Bulk Density, grain density, and air permeability are measured on each sample prior to destruction. Bulk density ranges from 1.78 to 3.05 g/cm3 and grain density ranges from 2.39 to 3.05 g/cm3. Preliminary matrix permeability values range from <0.25 to ~3.0 mD. We expect the calculated E values will be in the range of 60 - 80 GPa, ν will be ~ 0.25, and UCS will be in the range of 100 – 250 MPa for virgin, unaltered, massive basalt and that the values for the altered samples will vary significantly. Many of the initial experiments have produced conjugate fracture sets that can be used to calculate the angle of internal friction (µ).
4B9.2 ID:6804 10:45Elastic and magnetic anisotropy of basalts and rhyolites: Measurements on cores from the ICDP Project Hotspot
Ross Bishop , Douglas Schmitt , David Potter University of Alberta Contact: [email protected]
The International Continental Drilling Program ‘Project Hotspot’ was carried out to test hypotheses regarding the evolution of the Yellowstone Hotspot as it moved across southern Idaho over the last 7 My. This project included three boreholes at strategic locations in the Snake River Plain all drilled to depths of nearly 2 km. Nearly complete sets of core, supplemented with an extensive logging campaign, were obtained. Together these allow for determining the variability between novel downhole measurements and their more

comprehensive and controlled laboratory counterparts. 3-D laboratory seismic arrays of millimeter scale are being developed to demonstrate the expression of mineral and stress induced anisotropy in core. azimuthal anisotropy a consequence of mineral orientation and stress concentration can be determined. Conventional sonic tools are 1-D and blind to, but nonetheless affected by, anisotropy. More sophisticated acoustic imaging tools providing continuous travel time and amplitude images allow for geographic orientation of core in the laboratory however like all downhole measurements these are made in a transient environment and anisotropic conditions. Similarly laboratory 3-D magnetic susceptibility (magsus) will shed light on downhole 3-D vector-magnetic and magsus measurements. The coincidence of seismic and magsus anisotropy provides a complimentary means of viewing rock fabric; Research demonstrates their linear relation in magnitude and normal or most commonly parallel occurrence geometrically. This work will allow for further understanding of petrophysical predictions based on magsus measurements which remain in a promising yet infant state. together these will provide greater insight into the effects of anisotropy on downhole readings as well as states of stress in the Snake River Plain.
4B9.3 ID:6480 11:00
Fracture detection with profiles and range-based images from 3-D laser digitizer data
Laura Olson (Presented by Claire Samson ) Carleton University Contact: [email protected]
The Rock Quality Designation (RQD) index – the percentage of unbroken core sample fragments longer than 10 cm over the total length of a core run – is a widely used indicator of rock mass strength. A step toward the semi-automatic computation of the RQD is to develop 3-D imaging procedures and algorithms to locate, measure and count intact core lengths and fractures. In this study, the 3-D data were obtained using a non-contact laser digitizer. Each image file is a point cloud of spatially referenced measurements in Cartesian space – x is parallel to the long axis of the core and y is perpendicular. The z coordinate is the range - the distance from the digitizer to the core. The value of z was used to detect changes to the range of the core surface in profile. Changes to the range were identified by taking the difference in z-values between the core profile and a model of unbroken core, identifying changes in slope with the first derivative and using the mean as a threshold. The advantage of 3-D data is that changes in range are a true physical property of the core – unlike variations in intensity used to analyze 2-D images. Established edge and object detection methods were also used to detect fractures; the 3-D point cloud was converted to a 2-D grey-scale image - the value of each pixel is a range measurement instead of light-based intensity value. Lighting and contrast issues and interference from rock texture, mineral veins and sedimentary bedding were essentially eliminated.

Once the fractures were located and the intact core lengths measured, a preliminary RQD was computed. It was assumed that all fractures detected were natural. The next step is to develop an algorithm which can distinguish natural breaks from mechanical ones.
4B9.4 ID:6793 11:15
Dielectric permittivity measurements on evaporite mineral mixtures for GPR data interpretation Sohely Pervin , Douglas Schmitt University of Alberta Contact: [email protected]
The complex dielectric permittivity, often called the dielectric constant, is an important parameter for GPR data interpretation as it controls the propagation of EM waves through materials. Dielectric permittivity contrasts between different lithologies create various reflection events in GPR profiles and eventually provides important information about the buried objects. Moreover, the knowledge of dielectric permittivity of the evaporites and their contaminants is necessary to interpret GPR data more efficiently as well as Potash mine safety. Laboratory measurements were performed over a frequency range of 10 MHz to 3 GHz using a commercially available material analyzer (Agilent 4991A) with an open-ended co-axial sensor (Agilent 85070A). Permittivity was measured by placing the samples directly in the sensor. Cold compression technique was used to prepare the synthetic samples from various mineral powders up to 250 MPa pressure. Furthermore, the powder mixtures were grinded in a grinding machine and kept in an oven for 3 hours before pressurization. The porosity of the samples is reduced significantly due to the grinding, heating and high pressure. The permittivity measured from these synthetic samples was compared to single crystals for accuracy. The changes of dielectric permittivity with the addition of additives according to their weight percentage were obtained. For example, glass bead powder was mixed with NaCl and KCl according to weight like 5% glass beads with 95% KCl and so on. With the increase in the proportion of glass beads the permittivity of the mixtures were decreased. The observations were compared to a variety of existing effective media mixing models. The main purpose to use this model is to determine which model provides best fit for the permittivity of various mixtures according to the volume percentage.
4B9.5 ID:6554 11:30
Models of creep in rock samples using nonlinear solid viscosity
Wubing Deng 1, Trevor Coulman 2, Igor Morozov 1 1 University of Saskatchewan 2 CGG Veritas,Calgary Contact: [email protected]
Measurement of mechanical relaxation in rock samples in the lab is an important
technique for calibrating seismic observations and characterizing the in situ physical properties of rocks within the Earth. The current approach to modeling such relaxation processes relies on empirical compliance functions (Andrade, Burgers, Zener, or other) or equivalent mechanical models. We propose a different, strictly mechanical approach to model rock-creep measurements, which is conceptually very close to Biot’s poroelasticity. First, the mechanical behaviour of a system with dissipation is described by giving a pair of (L, D) functions, where L is the Lagrangian describing the conservative dynamic system and D is the pseudo- potential describing the internal friction. The functional forms of L and D completely describe the relations of the elastic and viscous stresses to the strains and strain rates, even for motions not realizable in experiments. The conventional spring-dashpot models of the medium can be viewed as diagrammatic illustrations for these (L, D) pairs. In order to reproduce the realistic behaviour of rock specimens (i.e., near-elastic initial responses followed by anelastic creep), we suggest a nonlinear internal friction approximated by D being a power-law function of the strain rate. The “rheologic exponent” of the power law, ν, corresponds to a transition between the Newtonian-fluid viscosity (ν = 1) to Coulomb friction (ν= 0.5). In addition, two forms of this power-law dependence are examined: one maintaining linearity with respect to the strain magnitude (DL), and another completely nonlinear (DN). Comparisons of these modeling results with literature data show that creep in olivine-rich samples (dunites) can be explained by power-law solid viscosity with ν = 0.79 for both rheologies DN and/or DL. Although many details of these solid-viscosity laws still remain to be established, this modeling shows that physical mechanisms can be used to quantitatively predict the observed inelastic effects directly and without invoking empirical laws, the Q, or other phenomenological approximations of the conventional viscoelastic approach.
4B9.6 ID:6589 11:45Towards a unified viscous-elastic rheologic law for Earth’s materials
Igor Morozov University of Saskatchewan Contact: [email protected]
Rheologic relations for Earth’s materials are usually understood differently for the plastic-flow and near-elastic deformations. For mantle flows or creep in lab samples, these relations are written as a nonlinear (often power-law) viscous-flow law, whereas for weak, near-elastic deformations, they are usually described by time-dependent “material memory”, which represents an extension of the elastic Hooke’s law. However, we show that nonlinear viscosity can also be successfully applied in the near- elastic domain, which leads to a (potentially) uniform description of rock deformation at all scales. This description is strictly mechanical and free from empirical concepts, such as material memory, compliance, or Q. Because of its base in mechanics, the model is readily applicable to fluids and solid-fluid mixtures. Similarly to the well-known model of saturated porous rock by Biot, the approach is based on the Lagrangian

continuum mechanics and extends the Jeffreys-Ricker model of “solid friction” to nonlinear viscosity. The most general form of the “rheologic law” is defined as the combination of the Lagrangian and the dissipation function, both of which are functions of strains and strain rates. In particular, we explore the power-law forms of the dissipation function, which is responsible for internal friction. Notably, for mantle-scale deformations, a single power law with exponents ν0 = 0.47 (for strain) and ν 1 = 0.6-0.65 (for strain rate) covers an extremely broad range of observations from free oscillations, tides and Chandler wobble to mantle flows during postglacial rebound. For creep measured in rock samples in the lab, the power-law solid viscosity is also confirmed, although the above exponents may vary for different materials; for example, ν1 = 0.79 for dunites. Thus, with a common mechanical approach to rheological laws, a unified picture of elastic and inelastic processes within the Earth appears to be possible at all scales.
Forecast Improvement with Stratospheric Data PART 1 / Amélioration des prévisions grâce aux données stratos PARTIE 1
Room / Endroit (TCUP Blair Nelson), Chair / Président (Wayne Evans ), Date (30/05/2013), Time / Heure (10:30 - 12:00)
4B10.1 ID:6680 INVITED/INVITÉ 10:30Impact of Stratospheric Sudden Warmings on surface climate variability
Theodore Shepherd University of Reading Contact: [email protected]
It has been known for over a decade that wintertime variability of the Arctic stratosphere is followed by subseasonal anomalies in surface climate. The most dramatic form of this variability occurs via Stratospheric Sudden Warmings (SSWs), about half of which lead to long-lived (up to two months) perturbations of the lower stratosphere. The surface impact of SSWs will be discussed, including recent results from a seasonal prediction system based on the Canadian Middle Atmosphere Model (CMAM). Implications for the recent winter will also be discussed. Mechanisms for the downward influence will be considered, as well as the role of gravity-wave drag and radiative cooling in driving the combined stratosphere-mesosphere response.

4B10.2 ID:6580 INVITED/INVITÉ 11:00The stratospheric extension of the Canadian global deterministic medium range weather forecasting system and its impact on tropospheric forecastsMartin Charron 1, Saroja Polavarapu 2, Mark Buehner 2, Paul Vaillancourt 1, Cécilien Charette 2, Michel Roch 1, Josée Morneau 3, Garand Garand 2, Josep Aparicio 2, Stephen Macpherson 2, Simon Pellerin 2, Judy St-James 3 1 Recherche en prévision numérique atmosphérique 2 Recherche en assimilation de données et météorologie satellitaire 3 Centre météorologique canadien Contact: [email protected]
A system which resolves the stratosphere was implemented in 2009 for operational medium range weather forecasts at the Canadian Meteorological Centre. The model lid was raised from 10 to 0.1 hPa, parameterization schemes relevant to the stratosphere were introduced and a new radiation scheme was implemented. Because of the higher lid height of 0.1 hPa, new measurements between 10 and 0.1 hPa were also added. This new High Top system resulted not only in hugely improved forecasts of the stratosphere, but also in large improvements in medium range tropospheric forecast skill. Most of the stratospheric and tropospheric forecast improvement is obtained without the extra observations in the upper stratosphere. However, these observations further improve forecasts in the winter hemisphere. The large improvements in stratospheric forecast skill are found to be due to the higher lid height of the new model. The new radiation scheme helps to improve tropospheric forecasts. However, the degree of improvement seen in tropospheric forecast skill could not be entirely explained with these purely forecast experiments. It is hypothesized that the cycling of a better model within the data assimilation procedure provides improved initial conditions which result in improved forecasts.
4B10.3 ID:6450 INVITED/INVITÉ 11:30
A Gas Cell Satellite Instrument to Monitor Stratospheric Winds Wayne Evans 1, Larry Gordley 2, Martin Mchugh 2, Fritts Dave 2 1 CRESS, York University 2 GATS Inc Contact: [email protected]
A new concept has been developed to measure winds in the stratosphere and mesosphere. A gas cell filled with atmospheric gases such as N2O, CO2 and NO is used in combination with a CCD camera to measure Doppler shifts of atmospheric emission lines from on orbit. By using these spectral shifts, winds in the atmosphere can be measured from 15 to 200 km. The analysis of the observed signals will be described. The new instrument is called DWTS for Doppler Wind and Temperature Sounder. The proposed CASS satellite is designed to measure atmospheric gas profiles using advanced ACE2 and OSIRIS2 instruments. The combination of atmospheric gases with wind measurements would enable extensive new science to be conducted which
would not be possible without the DWTS instrument. The new stratospheric measurements of winds combined with ozone could produce significant improvements in the Canadian long range weather forecast. The mesospheric winds will enhance the modelling of gravity wave effects on the mesosphere. The thermospheric winds would enhance space weather forecasting in the near space region. The instrument is small (shoe box size), light (10 kg), low data rate (40 KBS) and inexpensive. The profiles from one instrument would produce 100 X the profiles of current radiosonde systems. 6 instruments in orbit would provide dense global coverage of stratospheric winds.
Polar Applications PART 4 / Applications polaires PARTIE 4
Room / Endroit (TCUP Salon C), Chair / Président (Paul G. Myers ), Date (30/05/2013), Time / Heure (13:30 - 15:00)
4C3.1 ID:6709 13:45The barotropic response of the Arctic Archipelago to sea level differences between the Arctic Ocean and the Northwest Atlantic David Greenberg 1, Charles Hannah 2 1 Dalhousie University 2 Fisheries and Oceans Canada Contact: [email protected]
We use FVCOM and other triangular unstructured grid models to look at sea level and current response to differences in sea surface elevation between the Canada Basin and The Northwest Atlantic. We drive the model by specifying open boundaries with zero sea level across Southern Baffin Bay and the eastern end of Fury and Hecla Strait and different non zero elevations in the Arctic Ocean. We want to examine the the barotropic spin-up time for Archipelago flow and the circulation patterns that result from different patterns of inflow on the Arctic side. Preliminary experiments show that flow through Fury and Hecla Strait has little influence on the overall circulation and that it is difficult to force Arctic flow along the continental mainland. The eventual aim is to compare results with those from high resolution studies using the NEMO finite difference model.
4C3.2 ID:6501 14:00
Links between water properties, ice events and zooplankton dynamics in the eastern Northwest Passage
Jim Hamilton , Kate Collins , Simon Prinsenberg
Fisheries and Oceans Canada Contact: [email protected]
Thirteen years of moored measurements in eastern Barrow Strait have allowed us to establish that inter-annual variability in ice conditions and in zooplankton seasonal timing and abundance are linked to water column temperature and salinity. Break-up is strongly correlated with mid-spring water temperature and with freeze-up the previous year, suggesting that variability in seasonal ice cover impacts ocean heat loss in the autumn, with consequences in the following spring. Freeze-up is highly correlated with late summer water temperature. This relationship allows us to predict freeze-up, using real time data being provided by a prototype ocean observatory along the south coast of Devon Island. Backscatter data from the moored acoustic Doppler current profilers used in the study are interpreted to provide time series of a “zooplankton biomass index”. This index is used to demonstrate that the timing, length and productivity of the zooplankton growing season are strongly correlated with early summer water temperature. The opportunity to define these fundamental connections at inter-annual time scales is only possible with long time series data, and points to the importance of long term monitoring programs.
4C3.3 ID:6916 14:15
Major change in primary productivity of the North Water, Canadian Arctic
Simon Bélanger UQAR / Arcticnet / Québec-Océan / BORÉAS Contact: [email protected]
The North Water (NOW), located in the northern Baffin Bay, is the most productive recurrent polynya north of 77°N, where a long and intense diatom blooms starting in May fuel a rich marine ecosystem from the zooplankton, polar cods, large aggregation of marine mammals, sea birds and polar bears. Recent sea ice and oceanic observations reveal that major changes are happening in the NOW. The impact of those changes on the marine productivity is still not well understood, but recent evidences provided by benthic species suggested that increasing freshly produced organic matter at the surface is exported in the deep water and favors benthos communities. Here used a satellite-based primary production (PP) model to assess the trend in PP of the NOW for the 1998-2010 period. Surprisingly, the PP time series of the NOW revealed that the annual productivity dropped dramatically after 2002. The negative trend in PP rates reached as much as -5.6 gC m-2 y-1 just south of Smith Sound (78°N; 74°W), where an “ice bridge” usually forms in winter and stops the ice from the Arctic to flow in the polynya. We found, however, an increasing trend in PP in May followed by a decreasing trend in June and July. These results suggest that the phytoplankton bloom in the NOW is happening earlier in summer, which may be favoring the export of fresh organic matter to the bottom of the sea. Based on these results, we expect that the pelagic species (e.g. zooplankton) may be missing the spring bloom in the NOW during the resent years.

4C3.4 ID:6643 14:30
Pathways of freshwater from the Greenland Ice Sheet into the Atlantic Ocean Laura Gillard , Paul Myers University of Alberta Contact: [email protected]
As melting and freshwater discharge from the Greenland Ice Sheet has been increasing with time, one question is where this low salinity melt water will go and thus how and where it will be taken up in the Atlantic Ocean. We will examine this question using the output from a series of ocean general circulation models ranging in resolution from 1/4 degree to 1/12 degree. Freshwater pathways will be tracked using the Ariane lagrangian float package to look at probabilities of freshwater from given glaciers reaching given parts of the Atlantic Ocean. We also hope to present results from the same models using a reverse trajectory analysis to examine the sources of the warm Irminger Water that reaches the fjords of Greenland.
CSHS- Water Cycle in Integrated Modelling Framework PART 2 / Cycle de l'eau dans système de modèles intégrés PARTIE 2
Room / Endroit (TCUP Salon D), Chair / Président (Bruce Davison ), Date (30/05/2013), Time / Heure (13:30 - 15:00)
4C4.1 ID:6851 13:30Challenges in modelling the tidal hydrodynamics of the St. Lawrence fluvial estuary Pascal Matte 1, Yves Secretan 1, Jean Morin 2 1 INRS-ETE 2 Environment Canada Contact: [email protected]
Water levels and currents in the St. Lawrence River are subject to both spatial and temporal variations. They can be severely affected by natural and human-induced alterations of the physical environment, and by sub-daily to decadal variations associated to the tides, meteorological, hydrological and climatic

variability. The St. Lawrence fluvial estuary stretches over a distance of ~180km from the eastern end of Lake St. Pierre to the eastern tip of Orleans Island (OI). The flow is composed of vertically well-mixed freshwater and is subjected to the growing influence of a semi-diurnal tide culminating with tidal ranges of 6.6m at St. François (OI) during the largest spring tides. Increases in water levels of more than 1m/h can be observed at downstream locations during the rising tide, leading to rapid changes in flow conditions as well as in the superficies of wetted areas. The flow properties (e.g., tidal range, timing and duration of current reversals, timing of high and low tides, ebb/flood asymmetry) exhibit both lateral and longitudinal variations that were confirmed by field measurements. A 2D non-stationary, high precision hydrodynamic model of the St. Lawrence fluvial estuary has been developed with the aim of providing detailed spatial description of the hydrodynamics in response to tidal and fluvial forcings. The model includes a drying-wetting component allowing water in intertidal areas to be cyclically stored and evacuated. The finite-element grid resolution averages to 50m, with refinements down to 1m. At the present stage of the calibration, the model achieves a precision better than 10cm in water levels. In this paper, we discuss the various challenges associated with model calibration and validation, the description of topography in shallow areas, the inclusion of main tributaries with limited terrain data, and the added complexity of non-stationary simulations regarding the resolution strategies and analysis procedures.
4C4.2 ID:6854 14:00Two-Dimensional Advection-Diffusion Model of the St. Lawrence Fluvial Estuary near Quebec City Yves Secretan 1, Selim Ahmed 1, Pascal Matte 1, Jean Morin 2 1 INRS-ETE 2 Environment Canada, Meteorological Service of Canada, Hydrology and Ecohydraulic Section Contact: [email protected]
Water quality in the St. Lawrence River is subject to both spatial and temporal variations. Contaminant concentrations are not only influenced by the quantities released in the environment at punctual sources or carried by the tributaries and Great Lakes water masses, but also by the local hydrodynamics. The latter controls how the pollutants will diffuse and be advected throughout the system. Water levels and currents can be severely affected by natural and human-induced alterations of the physical environment, by daily changes associated to the tides, by meteorological events and forcings, and changes in the streamflow regime. Consequently, significant fluctuations in water quality can occur over the various timescales dictated by these processes.
The objective of this paper is to present a two-dimensional finite element advection-diffusion model of the St. Lawrence fluvial estuary near Quebec City. This hydrographic region is uniquely characterized by high spatial and temporal heterogeneity in terms of physical, biological, and chemical variables, with vertically well-mixed freshwater. This tidal influence generates considerable current reversals and increases mixing of the water masses. The model extends over a distance of 120 km from Grondines to Île-aux-Grues, with an average spatial resolution of 50m. Results illustrate the potential of numerical models to quantitatively reproduce the diffusion and advection of pollutants in the St. Lawrence River, provided that the terrain, hydrodynamic and advection-diffusion models are properly calibrated and validated.
4C4.3 ID:6850 14:15
Operationalization of Hydrodynamic Models of the St. Lawrence River at the Canadian Meteorological Center André Bouchard 1, Jean Morin 1, Olivier Champoux 1, Yves Secretan 2, Jean-François Cantin 1 (Presented by Yves Secretan ) 1 Environment Canada 2 Institut national de la recherche scientifique, Centre - Eau Terre Environnement Contact: [email protected]
The Hydrology and Ecohydraulic section of the Meteorological Service of Canada, Québec region, has been developing hydrodynamic and ecohydraulic models of the St. Lawrence River for the past 15 years. Over the years, these models have served to conduct numerous analyses of the impacts of changes in inflows to the river using integrated modeling of physics and biology of the system to assess issues such as the implementation of a new regulation plan for the Lake Ontario/St. Lawrence River system, the impacts of climate change on the ecosystem within the St. Lawrence Action Plan (biodiversity, sustainable uses, water quality) and the distribution and fate of contaminants from various sources (municipal, agriculture, industrial) to name a few. Early uses of these tools were mainly in analysis or scenario mode. Over the years however, advances in computer performance and the growing maturity of the numerical tools have made it possible to consider their eventual migration to operations at the Canadian Meteorological Centre (CMC) where they could be run automatically on a regular schedule to produce a variety of products for different uses. The first step in this process has already occurred with CMC’s acceptance of the proposal to implement the basic hydrodynamic model in experimental mode. This presentation will therefore cover the modeling tools, the system to be implemented at CMC, near-term developments as well as longer term goals including considerations on the coupling of these models with hydrological (inputs) and ecohydraulic models (physical and biological coupling). Examples of outputs will be discussed as well as challenges encountered in the development

process to ensure a smooth migration to CMC’s operational environment.
4C4.4 ID:6457 14:30
St. Lawrence River 2D water temperature model and its application to fish habitat study Valérie Ouellet 1, Yves Secretan [email protected] 1, André St-Hilaire [email protected] 1, Jean Morin [email protected] 2, Marc Mingelbier [email protected] 3 1 INRS Eau Terre Environnement 2 Environnement Canada 3 Min. des Ressources Naturelles, Québec Contact: [email protected]
In 2001, more than 25 000 carps (Cyprinus carpio) were found dead in the St. Lawrence River between the Lac-des-deux-Montagnes and Quebec City. Monette et al (2006) found that mortality was ultimately caused by freshwater ubiquitous bacteria which would normally not affect healthy fish. The results support the hypothesis that high water temperature caused the death of carp, but the exact distribution of water temperatures was still unknown. Thus, it was difficult to assess if water temperature could have restraint the spawning habitat of carp at that particular moment of the year. Therefore, a 2D water temperature model and a spawning habitat model for carp were developed to simulate the conditions of summer 2001. Water heat budgets are the basis for deterministic river temperature models. Thus, a modeling experiment was completed in a controlled environment to improve the knowledge about water heat budget and the reliability of the different equations. Then, a daily averaged two-dimensional (2D) water temperature model has been developed for the freshwater part of the St. Lawrence River. Forecasts from the Global Environmental Multiscale model (GEM) were used in preference to observations from meteorological stations for model inputs, both to increase the spatial resolution and ultimately to allow the water temperature model to be used in predictive mode. The resulting model provided daily water temperature estimates with an overall root mean square error (RMSE) of 1.18oC. Then, the water temperature was included into the habitat model, not as a threshold for spawning beginning but rather as an explicit habitat variable. The Habitat Suitability Index (HSI) has been defined using fuzzy logic. This model not only simulates the spatial distribution of the spawning habitat but also allows to evaluate the merit of including the temperature as a habitat variable and its impact on habitat distribution. Results showed that the spawning habitat has been greatly reduced during 2001 in consequences of elevated water temperature.
4C4.5 ID:6458 14:45

St. Lawrence River 2D water temperature model and its application to fish habitat study (continued) Valérie Ouellet 1, Yves Secretan [email protected] 1, André St-Hilaire [email protected] 1, Jean Morin [email protected] 2, Marc Mingelbier [email protected] 3 1 INRS Eau Terre Environnement 2 Environnement Canada 3 Min. des Ressources Naturelles, Québec Contact: [email protected]
In 2001, more than 25 000 carps (Cyprinus carpio) were found dead in the St. Lawrence River between the Lac-des-deux-Montagnes and Quebec City. Monette et al (2006) found that mortality was ultimately caused by freshwater ubiquitous bacteria which would normally not affect healthy fish. The results support the hypothesis that high water temperature caused the death of carp, but the exact distribution of water temperatures was still unknown. Thus, it was difficult to assess if water temperature could have restraint the spawning habitat of carp at that particular moment of the year. Therefore, a 2D water temperature model and a spawning habitat model for carp were developed to simulate the conditions of summer 2001. Water heat budgets are the basis for deterministic river temperature models. Thus, a modeling experiment was completed in a controlled environment to improve the knowledge about water heat budget and the reliability of the different equations. Then, a daily averaged two-dimensional (2D) water temperature model has been developed for the freshwater part of the St. Lawrence River. Forecasts from the Global Environmental Multiscale model (GEM) were used in preference to observations from meteorological stations for model inputs, both to increase the spatial resolution and ultimately to allow the water temperature model to be used in predictive mode. The resulting model provided daily water temperature estimates with an overall root mean square error (RMSE) of 1.18oC. Then, the water temperature was included into the habitat model, not as a threshold for spawning beginning but rather as an explicit habitat variable. The Habitat Suitability Index (HSI) has been defined using fuzzy logic. This model not only simulates the spatial distribution of the spawning habitat but also allows to evaluate the merit of including the temperature as a habitat variable and its impact on habitat distribution. Results showed that the spawning habitat has been greatly reduced during 2001 in consequences of elevated water temperature.
Future Earth: Research for Global Sustainability / La terre future: Recherche pour la durabilité globale
Room / Endroit (TCUP Gall. Suite 1), Chair / Président (Gordon McBean ), Date (30/05/2013), Time / Heure (13:30 - 15:00)
Heavy Precipitation over Mountains PART 2 / Fortes précipitations dans les montagnes PARTIE 2
Room / Endroit (TCUP Gall. A), Chair / Président (Mindy Brugman ), Date (30/05/2013), Time / Heure (13:30 - 15:00)
4C6.1 ID:6600 13:30
A comparison of manual and objective classification techniques for heavy snow weather patterns over East Vancouver Island Rodger Wu 1, Brad Snyder 1, Ruping Mo 1, Paul Joe 2, Alex Cannon 3 1 Meteorological Service of Canada 2 Environment Canada 3 Pacific Climate Impacts Consortium Contact: [email protected]
In a recent study of heavy snowfalls in East Vancouver Island, events from a 10-year period (2000 to 2009) were examined and manually classified into four synoptic weather patterns conducive to heavy snow. The results of this analysis have been used to develop conceptual models to assist operational forecasting. To avoid the subjectiveness inherent in the manual classification, this study employs the k-means clustering scheme to objectively reclassify the snow events into synoptic map-types. This non-hierarchical algorithm uses the degree of similarity and difference in the 1000–500-hPa thickness between individual snow events to define the groups and to assign group membership. Based on the North American Regional Reanalysis data, the k-means scheme is configured to classify the snow events into four map-types. Composite maps for each group are then examined and compared with the manually-derived synoptic weather patterns. A cross comparison among events and patterns identified by the manual and objective techniques is performed and the advantages and disadvantages of each technique are discussed. The results suggest that a

combination of the two classification techniques would make pattern identification more reasonable and reliable.
4C6.2 ID:6917 INVITED/INVITÉ 13:45
Heavy precipitation, snowmelt and landslides - some challenges with correlation
Marten Geertsema BC Forest Service Contact: [email protected]
Landslide is a generic term for a variety of mass movements, that occur over a wide range of velocities, at different scales, and in a variety of materials. Heavy rainfall, rain on snow, and rapid snowmelt, individually or together can conspire to trigger a variety of landslide types. Correlating specific landslides to specific storms or conspiring meteorological conditions, however, is fraught with challenges. The first category of challenges relates to meteorological / climate characterization and quantification, specifically over remote areas where station and radar data is sparse or non-existent. The second category of challenges relate to landslide inventories. Challenges to correlative inventories include the following landslide attributes: type, state of activity, age, size, detectability, geometry and complexity.
4C6.3 ID:6367 14:15
A case study on spillover of precipitation in complex terrain: observations and model predictions Ruping Mo 1, James Goosen 2, Melinda Brugman 1, Quanzhen Geng 2, Jason Milbrandt 3 1 National Lab for Coastal and Mountain Meteorology, Environment Canada, Vancouver, BC V6C 3S5 2 Pacific Storm Prediction Centre, Environment Canada, Vancouver, BC V6C 3S5 3 Atmospheric Numerical Weather Prediction Research, Environment Canada, Dorval, Quebec, Canada Contact: [email protected]
A post-frontal orographic precipitation event on 4 December 2012 over southern British Columbia is examined using observational and numerical weather prediction model data. Our analysis suggests that the combination of strong low-level cross-mountain winds and an upper-level jet is the major factor in producing a convective band in the Lower Fraser Valley with noticeable precipitation advecting, or spilling over, to the mountainous terrain of the Canadian Cascades. Ascent induced by the upper-level jet streak was further enhanced by the orographic lift, resulting in persistent elevated convection. The associated plumes of midlevel hydrometeors were advected by the low-level flow beyond the Coquihalla Summit onto the Thompson Plateau, where the spillover of

precipitation was detected in the weather reports and radar data. The upstream convective precipitation was well predicted by the GEM Regional System (RDPS-10km) and the High-resolution model (HRDPS-2.5km) of Environment Canada. Over the mountainous terrain, the observed spillover of precipitation was not predicted by RDPS-10km, but over-forecasted by HRDPS-2.5km. The differences in these model predictions of spillover effect are consistent with the model cloud physics configurations. The over-forecast by HRDPS-2.5km could be related to a systematic bias originating in the model microphysics, which will be further investigated in this study.
4C6.4 ID:6930 INVITED/INVITÉ 14:30
Discussion of Heavy Precipitation over Mountains and Impacts John Clague 1, Melinda Brugman 2 1 Department of Earth Sciences, Simon Fraser University 2 Coastal and Mountain Meteorology National Lab, Meteorological Services of Canada, Environment Canada Contact: [email protected]
A summary of main results of the session papers will be provided with applications to natural hazards. Major areas of controversy will be discussed, and new knowledge to help resolve these problems will be highlighted. Directions will be identified for future research priorities to help improve analysis and prognosis, public safety and regional warnings. The impact of climate change on heavy precipitation in the mountains and resulting natural hazards past, present and future will be discussed.
Snow, Ice, Permafrost and Cold Regions Processes PART 5 / Neige, glace, pergélisol et processus reliés PARTIE 5
Room / Endroit (TCUP Gall. B), Chair / Président (Laura Brown ), Date (30/05/2013), Time / Heure (13:30 - 15:00)
4C7.1 ID:6515 13:30Heat Flux Calculation and Analysis for the Mackenzie and Yukon Rivers Daqing Yang 1, Phil Marsh 2 1 NHRC
2 HNRC Contact: [email protected]
This study analyzes long-term (40-60 years) discharge and water temperature records collected near the basin outlets of the Yukon and Mackenzie rivers. It defines seasonal cycles of discharge, water temperature (WT), and heat flux (HF) for the basins, and compares their main features, so as to understand their similarity and difference. Both rivers have similar hydrographs, i.e. low flows in winter and high discharge in summer, with the peak flood in June due to snowmelt runoff. Mackenzie River has many large lakes and they sustain the higher base flows over the fall/winter season. Mackenzie basin is large with high precipitation, thus producing 50% more discharge to the Arctic Ocean. The WT regimes are also similar between the 2 rivers. Yukon River WT is about 2-3C warmer than the Mackenzie over the open water months. Both rivers have the highest WT in the mid summer and they transport large amount of heat to the ocean system. Yukon River monthly HF is lower by 10-60% than the Mackenzie mainly due to small discharge. Mackenzie River heat transport peaks in July, while the Yukon HF reaches the maximum in June and July. These results provide critical new knowledge of river thermal condition and energy transport to the northern seas. They are useful for large-scale climate/ocean model development and validation, and climate/hydrology change research in the northern regions.
4C7.2 ID:6587 13:45
Observations and Modeling of Soil Hydraulic and Thermal Dynamics on the Canadian Prairies Xicai Pan , Andrew Ireson , Warren Helgason Global Intitute for Water Security, University of Saskatchewan Contact: [email protected]
Soil freeze-thaw processes and snow processes in seasonally frozen regions strongly influence surface/subsurface energy and water exchanges. Representing these processes properly can be important for hydrological models and land surface schemes. In this study, surface energy exchange and subsurface hydraulic and thermal dynamics were monitored with a soil-weather monitoring system including an eddy-covariance flux tower in a perennial pasture located on the prairies south of Saskatoon, Saskatchewan. Based on these field observations, we use a physically based hydrological model coupled with water and energy balance (GEOtop) to simulate 1-D soil hydraulic and thermal dynamics. Soil hydraulic parameters in the model at specific positions were quantified with in-situ data. In this study we assess capability of the model to represent snow melt and soil freeze-thaw process by comparing model outputs with field observations.
4C7.3 ID:6316 14:00
Ecohydrological changes to sub-Antarctic river valleys invaded by beaver Cherie Westbrook 1, David Cooper 2, Christopher Anderson 3, Colin Whitfield 1 1 University of Saskatchewan 2 Colorado State University 3 Universidad Nacional de Tierra del Fuego & Centro Austral de Investigaciones Científicas Contact: [email protected]
Canadian beavers (Castor canadensis) were introduced in 1946 into southern Patagonia (Tierra del Fuego). Their population has exploded from 25 mating pairs to almost 200,000 because of the lack of natural predators. As a consequence, beaver have dammed nearly every stream in the region, and the riparian Nothofagus forests, which are not adapted to herbivory, have been decimated. In response to the widespread ecological damage caused by beaver and threat of population expansion on the mainland, the Argentinian and Chilean governments are planning to eradicate the beaver in the hopes that the native riparian forests can be restored. Decisions have been so far made solely on results from ecological studies. However, beaver also have considerable impact on hydrological processes important in controlling riparian form (aggradation) and ecological function. In North America, beaver dams can enhance the hydrological connection between rivers and riparian areas, which results in landscape changes that are and are not reversible. We question whether beaver have been in the Tierra del Fuego riparian ecosystems long enough that they have caused changes that are unlikely to be reversed once eradicated. Results of our 2013 austral summer field study will be presented.
4C7.4 ID:6533 14:15Understanding Cold Region Processes in an Agricultural Prairie Basin for Evaluation of Beneficial Management Practices: Results from a Field-tested Physically Based Model Taufique H. Mahmood 1, John W. Pomeroy 1, Howard S. Wheater 1, Helen M. Baulch 2 (Presented by Taufique Mahmood ) 1 Centre for Hydrology and Global Institute of Water Security, University of Saskatchewan 2 Global Institute of Water Security, University of Saskatchewan Contact: [email protected]
Cold region processes, depressional storage, variable contributing areas and strong seasonality in evapotranspiration are significant factors for Canadian Prairie hydrology. Spring melt of the seasonal snow cover generally contributes the major annual runoff and nutrient transport event and over-winter snow redistribution influences the volume and timing of snowmelt. Beneficial management practices (BMPs) are intended to reduce agricultural runoff and nutrients carried in runoff. There is a need to evaluate the sensitivity of runoff generating processes in an agricultural setting under dry and wet climatic conditions to BMPs in order to determine their effectiveness in restricting runoff. A physically-based, semi-distributed cold regions hydrological model was used to

reproduce the hydrology of South Tobacco Creek Basin (STC) draining the Manitoba Escarpment over a series of wet and dry years. The intent of this study is to improve our understanding of how prairie hydrological processes interact with BMPs to influence streamflow generation; this will provide useful insights for designing long term monitoring networks to evaluate BMPs. We, first, have built confidence on the model by simultaneously comparing the snow and runoff observations to simulations and further utilized the model to understand the processes and investigate BMP performance during wet and dry years. The model is capable of correctly simulating spatiotemporal patterns of snow accumulation and streamflow discharge. Both snowmelt and summer rainfall runoff are contributors to streamflow. Saturation excess runoff is found as a major runoff generation mechanism in the STC. Evapotranspiration during inter-storm periods plays a significant role in setting antecedent soil wetness which controls infiltration and runoff generation. Some BMPs such as small headwater reservoirs were found to significantly influence the timing, duration and volume of runoff delivery to streamflow and runoff generation processes, but their impact varied with wet and dry climatic conditions.
4C7.5 ID:6666 14:30
Sensitivity of hydrology in a Yukon headwater basin to climate change Kabir Rasouli 1, John Pomeroy 1, J. Richard Janowicz 2, Xing Fang 1, Sean K. Carey 3, Tyler Williams 1 1 Centre for Hydrology, University of Saskatchewan 2 Yukon Environment 3 School of Geography and Earth Sciences, McMaster University Contact: [email protected]
The aim of this study is to examine the sensitivity of cold regions hydrological processes and streamflow to changes in temperature and precipitation in a Yukon headwaters basin. Wolf Creek Research Basin, near Whitehorse, Yukon has been studied extensively since 1992 and its hydrological processes and response have been characterized using the Cold Regions Hydrological Modelling Platform (CRHM). CRHM was used to create a model of the basin that includes physically based descriptions of snow redistribution, sublimation, melt, infiltration to frozen soils, evapotranspiration, hillslope hydrology, soil freeze-thaw and streamflow routing. The model is driven by observed meteorology at three elevations representing boreal forest, taiga and alpine tundra ecozones and parameterized using the results from two decades of process studies and using remotely-sensed observations of vegetation cover and topography. The sensitivity experiments included: i) changing the air temperature holding either vapour pressure or relative humidity constant, ii) changing precipitation, and iii) changing air temperature and precipitation simultaneously. The results show that mid-winter hydrological processes are relatively insensitive to warming, but very sensitive to changes in precipitation. In contrast, spring and summer processes are very sensitive to changes in temperature. The hydrograph responded in a complex manner to the suite of changing hydrological processes with warmer

temperatures causing an earlier and smaller peak in the hydrograph, that could be compensated for with increased precipitation.
Forecast Improvement with Stratospheric Data PART 2 / Amélioration des prévisions grâce aux données stratos PARTIE 2
Room / Endroit (TCUP Blair Nelson), Chair / Président (Wayne Evans ), Date (30/05/2013), Time / Heure (13:30 - 15:00)
4C10.1 ID:6298 INVITED/INVITÉ 13:30Canadian Satellite Based Endeavours Designed to Measure Arctic Ozone Doug Degenstein 1, Adam Bourassa 1, Chris Mclinden 2, Kaley Walker 3 1 University of Saskatchewan 2 Environment Canada 3 University of Toronto Contact: [email protected]
The Canadian built Optical Spectrograph and InfraRed Imaging System (OSIRIS) has been in full operation onboard the Swedish satellite Odin since the autumn of 2001. OSIRIS measures spectrally dispersed limb-scattered sunlight over the wavelength range from 280 nm to 810 nm with approximately 1 nm spectral resolution for the primary purpose of inferring vertical profiles of the ozone number density. The Canadian Atmospheric Tomography System (CATS), a follow-on instrument concept that builds upon OSIRIS heritage, is currently under study by the Canadian Space Agency (CSA) with the intent that it be part of the Chemical and Aerosol Sounding Satellite (CASS) suite of instruments. CASS is a uniquely Canadian idea that is also under investigation by the CSA and has been speculated to be ready for launch sometime around 2019. This paper discuss the spatial and temporal resolution of the OSIRIS ozone measurements and will highlight the achievements of the OSIRIS Team with respect to the measurement of stratospheric ozone and in particular the measurement of ozone at mid- latitudes above the Canadian Arctic. This paper will also detail design changes to OSIRIS that will be implemented within CATS in order to improve the spatial and temporal resolution of the measured ozone amounts and therefore make these measurements more useful for weather forecasts.
4C10.2 ID:6888 14:00

Atmospheric Composition and Optical Depth Measurements from MAESTRO on the ACE Satellite C. Thomas Mcelroy 1, Jason Zou 2, James Drummond 3 1 York University 2 University of Toronto 3 Dalhousie University Contact: [email protected]
The Canadian Atmospheric Chemistry Experiment (ACE) has now been operating on orbit since August, 2003. The satellite, called Scisat by the Canadian Space Agency which funded its development, was launched under a cooperative agreement with NASA which provided the Pegasus launch. The primary instrument on ACE is the ABB infrared, Fourier transform spectrometer. MAESTRO (Measurements of Aerosol Extinction in the Stratosphere and Troposphere Retrieved by Occultation) is a UV-Visible-Near-IR dual spectrophotometer included primarily to extend the wavelength range (280 to 1000 nm) over which aerosol extinction information could be obtained. Occultation measurements are very important because of their high vertical resolution, large altitude range and the long-term stability of the measurements which can be achieved. The instrument performance, data analysis methodology and some measurement results will be presented.
4C10.3 ID:6846 INVITED/INVITÉ 14:15Toward a useful subseasonal forecast
Hai Lin RPN-A, Environment Canada Contact: [email protected]
Making a skillful prediction beyond one week remains a great challenge. In contrast to short range weather forecasting and seasonal prediction, the study and development of prediction methods on a subseasonal time scale have been lacking. There are several recent international programs aimed at developing a "seamless" prediction capability for the coupled ocean-atmosphere system covering time scales of days to decades. Subseasonal variability is one of the most important components. This talk explores several aspects that are relevant to improving predictions from a week to a season in advance. Specifically, the role of the stratosphere is discussed. The new Canadian monthly forecast system is introduced.
4C10.4 ID:6331 14:30
The Arctic Winter Polar Vortex: Where is the Top and is there a Bottom? Alan Manson 1, Chris Meek 2, Tatyana Chshyolkova 3, Xiaoyong Xu 4 1 Institute of Space and Atmospheric Studies, USask 2 ISAS, USask 3 Whiteshell-AECL, Manitoba 4 UWaterloo, Ontario

Contact: [email protected]
Even before CANDAC-PEARL began operating, some of our colleagues had begun to explore the Vortex: its complexity and influence upon middle atmosphere dynamics [Thomas Duck, 2000], chemical equilibrium of the Arctic atmosphere [Kim Strong, 2004] and Geomagnetic-Ionospheric-STRATWARM linkages [Alan Manson, 1968]. The Atmospheric Dynamics Group [ISAS] began focusing on this monstrous dynamical feature in ~2004 and it became a major part of Tatyana Chshyolkova’s PhD thesis. Edge to edge the vortex is ~6000km is diameter, 2-3 times the size of the ’Atlantic Hurricane’ of Nov 2012; with a vertical span of over 90km. Our movies [www.CANDAC.ca] of the winter vortices from 2004/5 to 2011/12 are provided for PEARL researchers and us [CMOS-EC]. Here we discuss some of the highlights of these years: major Sudden Stratospheric Warmings [SSW]; their effects upon ozone distributions and losses; the frequent zonal asymmetry of the Vortex and its liking for Scandinavia, as well as its travels back and forth across Eureka. We look at the effects of the Vortex above the mesopause ~90km, and resultant meridional flows from Arctic to Antarctica…or is it the reverse? Finally, we note that 4 of the last 5 winters have seen outflows of ‘Frigid Arctic Air’ across Russia and into Western Europe: where Parisians and London Cockneys have had 2-3 ‘White Xmas’ years; and when ~1000 froze to death, mainly in Russia, Romania and the Ukraine, during the ‘Deep Mid-Winter’ of 2012. There are rumours of extremely chilling early winter snow storms along the US East Coast e.g. Washington DC. Thus, there are indeed also ‘Tropospheric Vortex Warmings’ and circulation-breakdowns: these are discussed and their occurrences linked to Changes of Arctic Climate.
4C10.5 ID:6896 14:45Assimilation of stratospheric ozone measurements in a Coupled Chemistry-Dynamics Data Assimilation System. Jean De Grandpre , Yves Rochon , Chris Mclinden , Richard Menard Environnement Canada Contact: [email protected]
This study presents an evaluation of a dynamically-chemically coupled 3D-var data assimilation system. The modeling system used a simplified online chemical modeling scheme and assimilates conventional meteorological observations and ozone measurements from AURA MLS, GOME-2 and SBUV/2 instruments. Ozone analyses have been compared against independent ozonesonde measurements in various latitude bands throughout the Upper Troposphere Lower Stratosphere (UTLS). Results show that ozone assimilation contribute to maintain the steep ozone gradient in the lower stratosphere region which is miss-represented in absence of ozone assimilation. The impact of the ozone radiative feedback on medium range temperature forecasting is significant and generally contribute to the cooling of the lower stratosphere region. The study show the sensitivity of the NWP forecasting system to ozone heating and the importance of

chemical assimilation for improving the representation of the model radiative budget and for caracterizing dynamical processes in the UTLS region.