
Profiles of major suppliers to the automotive industry - ROSA P
130
HE 1 8.5 . A3 4 no DOT- TSC- NHTSA- 82-1 .V c . 2 MHTSA-82-1. VII Profiles of Major Suppliers to the Automotive Industry Volume 7: Machine Tool Suppliers to the Auto motive Industry J.A. Mateyka W.R. Magro D.M. Wasserman D.J. Yee DEPARTMENT OF TRANSPORTATION DEC 0 8 iyt5<i u r library Booz, Allen and Hamilton, Inc. Transportation Consulting Division Bethesda MD 20014 August 1982 Final Report This document is available to the public through the National Technical Information Service, Springfield, Virginia 22161. U.S. Department of Transportation National Highway Traffic Safety Administration Office of Research and Development Washington DC 20590
-
Upload
khangminh22 -
Category
Documents
-
view
1 -
download
0
Transcript of Profiles of major suppliers to the automotive industry - ROSA P
HE1 8.5
. A3 4
no
.
DOT-TSC-NHTSA-82-1 .V
c . 2
MHTSA-82-1. VII Profiles of Major Suppliers
to the Automotive Industry
Volume 7: Machine Tool
Suppliers
to the Automotive Industry
J.A. MateykaW.R. MagroD.M. WassermanD.J. Yee
DEPARTMENT OFTRANSPORTATION
DEC 0 8 iyt5<i
ur
library
Booz, Allen and Hamilton, Inc.
Transportation Consulting Division
Bethesda MD 20014
August 1982
Final Report
This document is available to the public
through the National Technical Information
Service, Springfield, Virginia 22161.
U.S. Department of Transportation
National Highway Traffic SafetyAdministration
Office of Research and DevelopmentWashington DC 20590

NOTICE
This document is disseminated under the sponsorshipof the Department of Transportation in the interestof information exchange. The United States Govern-ment assumes no liability for its contents or usethereof.
NOTICE
The United States Government does not endorse pro-ducts or manufacturers. Trade or manufacturers'names appear herein solely because they are con-sidered essential to the object of this report.

/g-.r
/43V
, tfT-TSt -aJ T
&z-i .~vjiz
&
\fir
department ofTRANSPORTATION
DEC 0«
LIBRARYTechnical Report Documentation Page
1 . Report No.
DOT-HS - 806 222
2. Government Accession No. 3. Recipient's Catalog No.
4. Title and Subtitle
PROFILES OF MAJOR SUPPLIERS TO THE AUTOMOTIVEINDUSTRY: VOL. 7 MACHINE TOOL SUPPLIERS TOTHE AUTOMOTIVE INDUSTRY
5. Report Dote
August 19826. Performing Organization Code
DTS-322
7. Author',)J>A> Mateyka> W . R . Magro,
D.M. Wasserman. D.J. Yee
8. Performing Orgamzotion Report No.
DOT-TS C-NHTSA- 8 2 - 1 , VI
I
9. Performing Organization Name and Address
Booz , Allen and Hamilton, Inc.*Transportation Consulting DivisionBethesda, Maryland 20014
10. Work Unit No. (TRAIS)
HS275/R241211. Controct or Grant No.
12. Sponsoring Agency Name and Address
U.S. Department of TransportationNational Highway Traffic Safety AdministrationOffice of Research and DevelopmentWashington DC 205 90
13. Type of Report ond Period Covered
October 1978-October 1980Final Report
Id. Sponsoring Agency Code
NRD-13U.S. Department of TransportationResearch and Special Programs AdministrationTransportation Systems CenterCambridge, Massachusetts 02142
15. Supplementary Notes
*Under contract to:
16. Abstract
This study summarizes extensive information collected over a two-year period(October 1978 to October 1980) on suppliers of parts and components, materials,and machine tools to the automotive industry in the United States. The objectiveof the study was to provide data and information in support of analyses of the U.S.
automotive industry. The results of this effort are published in seven volumesVolume I: Overview; Volume II: Iron, Steel, and Aluminum Suppliers to the
Automotive Industry; Volume III: Plastics, Glass, and Fiberglass Suppliers to theAutomotive Industry; Volume IV: North American Parts and Component Suppliers to
the Automotive Industry; Volume V: Multinational Automotive Parts and ComponentsSuppliers; Volume VI: Foreign Automotive Parts and Components Suppliers; andVolume VII: Machine Tool Suppliers to the Automotive Industry.
17, Key Words 18. Distribution Statement
Automotive Parts, Components,Materials, Plastics, Glass,Fiberglass, Machine Tools
Document is available to the publicThrough the National TechnicalInformation Service, Springfield,Virginia 22161
19. Security Clossif. (of this report) 20. Security Clos li f. (of thi s page) 21* No. of P ages 22. Price
UNCLASSIFIED UNCLASSIFIED 126
Form DOT F 1700.7 (8-72) Reproduction of completed page authorized


PREFACE
Automobile manufacturers, in general, produce only selected,
key elements and subassemblies for their final product, and rely
on a widespread and complex logistics network including material
suppliers, foundries and fabricators for wide variety of other
necessary components going into the finished automobile.
Because of the importance of the automobile industry to the
United States and to the world economy, it is important to under-
stand the makeup of the logistics infrastructure and to understand
its internal interrelationships and workings with the industry
it supports.
The purpose of this study was to gather all possible and
pertinent information on suppliers to the automotive industry,
and to present it in a form for ease of reference and further
analysis
.
i i i

METRIC
CONVERSION
f
ACTORS
|
I
rt
femliHi
II u
iiiliiamL:
*i «i
|
i
(iitt •i
;!Iii!l!l!ilii„3!mil!
!t
1
aSUliHSl
T|T T|T T|T T|TT ,T , rp' rp' rp-T •‘Tr T
|
T T|T Tp' IT ,,.jT in; mi
'i!
. 1 T • t 3 3 I
am
ma
f8uSI
11 SE.s V.Vij .i- in “i".
?
i i ;
If siSi H
«• • *-a • •
fill
i-.iiiil.
iiiii
> * * •• • M •
lit!
mil
ii
* * as - - 5
.i..if
iiis
... i *
III f 1
iiiilliii
:t.:r ~•j*
ill .«
li J ! nili\
i
it
?!Z ia
if
i i*n i * 1 1 3 •. t 3 -
IV

TABLE OF CONTENTS
PageSection Number
SUMMARY 1
1. THE MACHINE TOOL INDUSTRY 1-1
1.1 Size and Structure of the U.S. MachineTool Industry 1-2
1.2 Major Markets for Machine Tools 1-31.3 Machine Tool Technology 1-41.4 Trends Affecting the Machine Tool Industry 1-9
2. ACME-CLEVELAND 2-1
2.1 Corporate Size and Structure 2-12.2 Major Markets and Products 2-42.3 Corporate Strategy 2-62.4 Production and Operations 2-82.5 Financial Status 2-222.6 Research and Development 2-25
3. CINCINNATI MILACRON 3-1
3.1 Corporate Size and Structure 3-13.2 Major Markets and Products 3-43.3 Corporate Strategy 3-83.4 Production and Operations 3-93.5 Financial Status.... 3-93.6 Research and Development 3-20
4. CROSS & TRECKER 4-1
4.1 Corporate Size and Structure 4-14.2 Major Markets and Products 4-24.3 Corporate Strategy 4-74.4 Production and Operations 4-84.5 Financial Status 4-144.6 Government Relations 4-17
5. GIDDINGS & LEWIS 5-1
5.1 Corporate Size and Structure 5-15.2 Major Markets and Products 5-45.3 Corporate Strategy 5-65.4 Production and Operations 5-75.5 Financial Status 5-85.6 Research and Development 5-9
v

TABLE OF CONTENTS (Continued)
Sectio^ Number
6. F. JOS. LAMB 6-1
6.1 Corporate Size and Structure 6-16.2 Major Markets and Products 6-36.3 Production and Operations 6-5
7. MOTCH & MERRYWEATHER 7-1
7.1 Corporate Size and Structure 7-17.2 Major Markets and Products 7-27.3 Corporate Strategy 7-57.4 Production and Operations 7-67.5 Financial Status 7-6
vi

LIST OF ILLUSTRATIONS
PageFigure Number
1-1 Comparison of Value of Shipments of SelectedManufacturing Industries 1-2
1-2 Schematic Diagram of Automobile Showing Partsand Components Which Are Machined 1-4
1-
3 Basic Matelcutting Tools 1-5
2-
1 Acme-Cleveland Corporate Organization... 2-3
2-2 Market Data for Acme-Cleveland 2-4
2-3 Warren Plant Data 2-10
2-4 Fenton Plant Data 2-11
2-5 Cadillac Plant Data 2-12
2-6 Ontario Plant Data 2-13
2.7 Detroit Plant Data 2-14
2.8 Homberg/Ohm (Foundry) Plant Data 2-15
2.9 Mansfield Plant Data 2-16
2-10 Cleveland Plant Data 2-17
2-11 Cleveland (Shalco) Plant Data 2-18
2-12 Homberg/Ohm Plant Data 2-19
2-13 Kewanee Plant Data 2-20
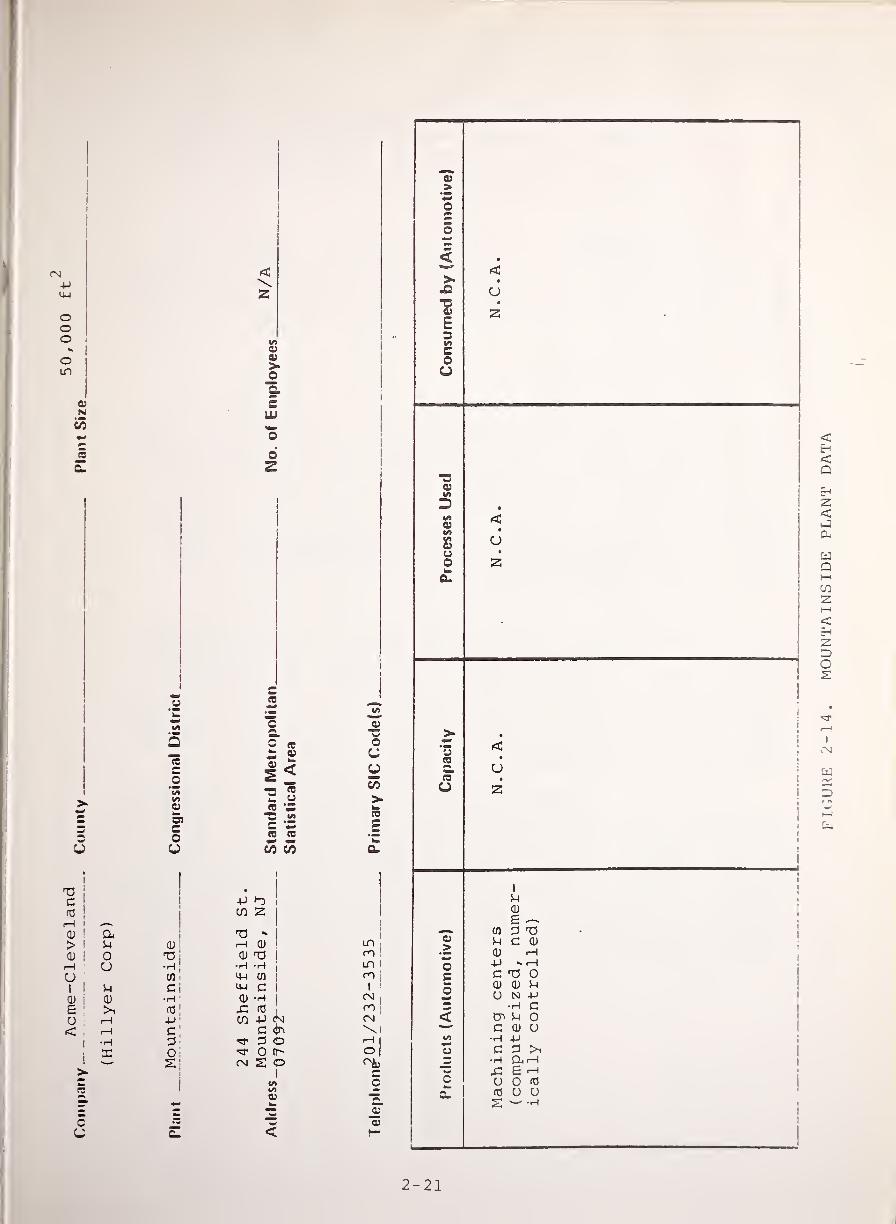
2-14 Mountainside Plant Data 2-21
2-15 Operating Analysis of Acme-Cleveland 2-23
2-
16 Capital Analysis of Acme-Cleveland 2-24
3-
1 Cincinnati Milacron Corporate Organization 3-3
3-2 1979 Sales and Pre-Tax Profits by OperatingGroup 3-4
3-3 Cincinnati Milacron Market Data 3-4

LIST OF ILLUSTRATIONS (Continued)
PageFigure Number
3-4 Source of Cincinnati Milacron’ s 1979 U.S.Machine Tool Orders . 3-5
3-5 Source of Cincinnati Milacron’ s 1979 U.S.Plastics Machinery Orders 3-5
3-6 Cincinnati Plant Data 3-10
3-7 Worcester Plant Data 3-11
3-8 Lebanon Plant Data 3-12
3-9 Wilmington Plant Data 3-13
3-10 Batavia Plant Data 3-14
3-11 Mt. Orab Plant Data 3-15
3-12 Greenwood Plant Data 3-16
3-13 Cincinnati Milacron Operating Analysis 3-17
3-
14 Cincinnati Milacron Capital Analysis 3-18
4-
1 Cross & Trecker Corporate Organization 4-3
4-2 Market Data for Cross & Trecker 4-4
4-3 Sales by Market, Five Year Average 4-4
4-4 Fraser Plant Data 4-9
4-5 Covington Plant Data 4-10
4-6 Knowsley Plant Data 4-11
4-7 Wendingen Plant Data 4-12
4-8 Port Huron Plant Data 4-13
4-9 Cross & Trecker Operating Analysis 4-15
4-
10 Cross & Trecker Capital Analysis 4-16
5-
1 Giddings & Lewis Corporate Organization 5-3
5-2 Giddings & Lewis Market Data 5-4
viii

LIST OF ILLUSTRATIONS (Continued)
PageFigure Number
5-3 Fond du Lac Plant Data 5-10
5-4 Kaukauna Plant Data 5-11
5-5 Janesville Plant Data 5-12
5-6 Giddings & Lewis Operational Analysis 5-13
5-
7 Giddings & Lewis Capital Analysis 5-14
6-
1 F. Jos. Lamb Corporate Organization 6-2
6-2 F. Jos. Lamb Market Data 6-3
6-3 Warren Plant Data 6-6
6-4 Windsor Plant Data 6-7
6-5 Indianapolis Plant Data 6-8
6-6 Warren (FAB-TEK) Plant Data 6-9
6-
7 Hamilton Plant Data 6-10
7-
1 Motch & Merryweather Corporate Organization 7-3
7-2 Market Data for Motch & Merryweather 7-3
7-3 Euclid Plant Data 7-7
7-4 Windsor Plant Data 7-8
7-5 Cambridge Plant Data 7-9
7-6 Motch & Merryweather Operating Analysis 7-10
7-7 Motch & Merryweather Capital Analysis 7-11

LIST OF TABLES
PageTable Number
1-1 STRUCTURE OF THE MACHINE TOOL INDUSTRY BROKENDOWN BY NUMBER OF EMPLOYEES 1-3
1-
2 MACHINE TOOL SUPPLIERS' FINANCIAL ANALYSIS 1-9
2-
1 ACEM-CLEVELAND AND REVENUE, PROFIT ANDEMPLOYMENT STATISTICS 2-1
2-
2 PERCENTAGE OF SALES TO AUTO INDUSTRY BYDIVISION 2-5
3-
1 CINCINNATI MILACRON REVENUES, PROFIT ANDEMPLOYMENT 3-2
4-
1 CROSS & TRECKER REVENUE, PROFIT AND EMPLOYMENTSTATISTICS 4-2
5-
1 GIDDINGS & LEWIS 5-1
5-2 1979 NET NEW ORDERS BY INDUSTRY DOMESTICMACHINE TOOLS ONLY 5-5
5-3 FIVE-YEAR BREAKDOWN OF SALES OF MAJOR PRODUCTLINES 5-5
7-1 MOTCH & MERRYWEATHER REVENUE, PROFIT ANDEMPLOYMENT STATISTICS 7-1
x

SUMMARY
suppliers to theof reports on
andof a
This report on North American machine toolautomotive industry is the seventh of a series __companies that supply materials, parts and components,machine tools to automotive manufacturers. It is partmajor study being sponsored by the U.S. Department ofTransportation, Transportation Systems Center (DOT/TSC) , togather and assess publicly available information on thebehavior and response of major materials, parts and components,and machine tool suppliers to changing conditions in theautomotive industry
STUDY BACKGROUND AND OBJECTIVES
This study is being undertaken to help government decisionmakers increase their understanding of transportation-relatedindustries and to provide them with basic industry informa-tion. The information should prove useful in the evaluation ofeconomic impacts caused or encouraged by governmentregulations. It can also help determine the economic effectsof future regulations.
Recent fuel shortages and government mileage regulationsare causing the major automobile manufacturers to redesigntheir cars and produce smaller and lighter vehicles. Thesechanges in automotive design are leading to a change in therequirements for machine tools purchased from automotivesuppliers
.
New processes, for instance, are being developed to machinethe light-weight materials, particularly aluminum alloys, usedin the transmissions and engine components of downsizedvehicles. Another example is Detroit's changing need forautomated transfer lines. Frequent design changes requiremachining systems with the flexibility to machine manydifferent parts as market conditions or production schedulesvary. In almost every part of the car, new technology and newdesigns are affecting machine tooling. As machine toolsuppliers respond to and adjust to these changes, deci-sions are made that can have significant economic impacts,especially on local employment trends and economic activity.
1

SCOPE OF THIS REPORT
This report provides a detailed view of the response ofNorth American machine tool suppliers to new car needs bylooking at specific companies that are important in theindustry. In addition, it provides a baseline of data that canbe used to track industry changes or predict industry responseto future regulations.
Six important machine tool suppliers to the auto industryare covered in this report. For each company, information isprovided on:
• Company size and structure, including revenues, profitand employment statistics and corporate organization
• Major markets and products, including percent of salesto the auto industry, major automotive products, salesstrategy, new product plans and market strategy
• Production and operations, including location,products and employment of major automotive facilitiesand plans for plant expansions
• Financial status including profitability andinvestment return, capital spending, capital structureand working capital management
« Research and development plans, including budgets andnature of work >
• Labor and government relations, includinggovernment-industry interaction and company-unioninteraction
.
The report places special emphasis on company plants andoperations, focusing heavily on the location of the plants,plant capacity, major automotive products and plannedexpansions to the plants. This information is of particularsignificance since major decisions are continually being made(e.g., decisions regarding plant shutdowns, new plantdevelopment and plant expansion) which are likely to havefar-reaching impacts.
2

METHODOLOGY
Information for this report was obtained, whereverpossible, from published sources. These include:
• Magazine and trade journal articles
• Annual reports and lOKs
• Security analysts' reports on companies
• Company marketing literature and advertisements
• Annual meeting speeches
• Speeches before the New York Society of SecurityAnalysts
• Plant guidebooks.
In addition, plant-specific information generally requiredcontacts with the companies. Some information, such asspecific customers supplied by particular plants and plantcapacity, was generally found to be proprietary and thus couldnot be included in this report. Other information, such as thelocation of plants that do supply a significant amount of theiroutput to the auto industry, could usually be obtained.
ORGANIZATION
This report begins with an overview that presents the sizeand structure of the machine tool industry, its relevance tothe auto market and the key issues currently confronting theindustry. Following the overview, company analyses are givenfor six major corporations in the industry.
3/4

!

1 THE MACHINE TOOL INDUSTRY
The U.S. machine tool industry is a relatively small butcritical component of the national economy, and it hashistorically been basic to the development of the American autoindustry. The close relationship between the two industries isparticularly important now, when the automakers are in themidst of a major retooling effort to meet Federal fuelefficiency mandates.
Automobile design changes and similar programs in theaerospace industry have been major factors in the ongoing,three-year order boom for machine tool suppliers. Spending formachine tools in the U.S. may reach $6 billion in 1980, up from$4.5 billion in 1979.
The surge in orders is not without its problems, however.Because of the traditional cyclicality of machine tooldemand, suppliers have been reluctant to expand theiroperations to meet order levels that may be only temporary.That reluctance has left the major machine tool manufacturerswithout the necessary capacity to meet the current high levelof demand. Order backlogs for the industry as a whole arerunning more than $5.6 billion, and delivery times for manymachines have stretched out to over two years.
Huge backlogs and long lead times have aggravated theproblem of foreign competition. The automakers and othermanufacturers are shopping around in foreign markets in effortsto speed up the installation of new equipment. The U.S.machine tool manufacturers are acutely aware of the problem andhave recently stepped up their capital expansion programs andaccelerated development of more sophisticated machining systemstailored to the new requirements of the auto and aircraftindustries. The suppliers are paying particular attention tothe design of more flexible manufacturing systems and to thedevelopment of more powerful computer controls for theirmachines. In the short run, at least, the level of orders forthese new systems will depend heavily on the automanufacturers' confidence that the equipment will be ready whenthey need it.
1-1

Because of continuing demand for machine tools in theauto and aircraft industries , the general recession has notseriously affected the machine tool suppliers. This situa-tion is likely to continue through 1980. Some analystspredict a slowing of sales beginning in early 1981. Themachine tool industry, however, is confident that its recentgrowth will continue into the mid-' 80s. In making thatforecast, the industry points to the country's widespreadconcern with raising manufacturing productivity and withcompensating for the shortage of skilled labor through theuse of more sophisticated and automated machinery.
1.1 SIZE AND STRUCTURE OF THE U.S. MACHINE TOOL INDUSTRY
The machine tool industry is relatively small compared toother U.S. industries. Many giant industrial corporationsreport more shipments and more employees than the entiremachine tool industry. Figure 1-1 compares the value ofshipments of the machine tool industry with three other durablegoods manufacturing industries. As shown, machine toolshipments of $3.6 billion in 1976 were relatively smallcompared to such industries as the motor vehicle industry andthe construction machinery industry. The value of machine toolindustry shipments, however, was roughly equivalent to that ofthe special tool and die industry. In 1976 the machine toolindustry employed approximately 81,000 workers, about one-tenth of the number of people employed in the motor vehicleindustry
.
60
50 -
UJ
OUJDUJ c-
3 5 30 -—i v>< —>
20 -
10
FIGURE 1-1. COMPARISON OF VALUE OFSHIPMENTS OF SELECTED MANUFACTURING INDUSTRIES
MACHINE MOTOR CON SPECIALTOOLS VEHICLES STRUCTION TOOLS &
MACHINERY DIES
1-2

The machine tool industry has shown considerable growthover the last ten years. Machine tool purchases of $1.4billion in 1970 had reached $4.5 billion in 1979. Someindustry observers have predicted $6 billion in sales in 1980.
The machine tool industry is often referred to as a smallshop industry. As shown in Table 1-1, almost 50 percent of theestablishments have less than 10 employees and only 7 percentof the establishments have more than 250 employees. The largeshops, 250 employees or greater, however, do produce themajority (approximately 58 percent) of the machine toolshipments
.
TABLE 1-1. STRUCTURE OF THE MACHINE TOOLINDUSTRY BROKEN DOWN BY NUMBER OF EMPLOYEES
Employment SizeNumber ofEstablishments
Value ofShipments( Millions
)
MarketShare
All Establishments 1,277 $2,111.7
|1 to 4 Employees 380 (30%) 25.2 1%
|5 to 9 Employees 212 (17%) 38.0 2
10 to 19 Employees 246 (19%) 86.3 4
20 to 49 Employees 194 (15%) 166.0 8
50 to 99 Employees 89 ( 7%) 183.8 9
100 to 249 Employees 83 ( 6%) 376.0 18250 to 499 Employees 37 ( 3%) 383.7 18500 or More Employees 47 ( 4%) 855.5 40
Source: 1972 Census of Manufacturers.
1.2 MAJOR MARKETS FOR MACHINE TOOLS
Machine tool products can be divided into two major marketcategories
:
• Production machine tools, such as lathes, drillpresses and so forth sold to a wide variety ofindustries
• Specialized machine tools, including completelyautomated manufacturing systems, sold to largemanufacturers such as the automobile and the aircraftindustries. The automobile has its greatest impact onthis market segment.
1-3

The recent surge of orders for machine tools by theautomotive and aircraft industries has been due to theintroduction and planned introduction of new products by bothindustries. Tiie National Machine Tool Builders Associationestimates that the auto industry currently accounts for 20 to25 percent of all new orders for machine tools in the U.S.
The automakers use machine tools for a wide variety ofoperations, including stamping bumpers, drilling engine blocks,turning brake drums, cutting gears and forming vehicle bodies.Figure 1-2 illustrates some of the parts and componentscommonly manufactured with the use of machine tools.
FIGURE 1-2. SCHEMATIC DIAGRAM OF AUTOMOBILESHOWING PARTS AND COMPONENTS WHICH
ARE MACHINED
1.3 MACHINE TOOL TECHNOLOGY
Machine tools can be categorized by their machiningoperations and by their configurations. There are two broadgroups of machining operations: metalcutting andmetal-forming. This report concentrates on metalcuttingmachine tools, which account for 75 percent of total U.S.machine tool sales. Configurations of machine tools arevaried, and the number of designs is increasing as machine toolusers demand machines that are capable of performing multipleoperations with increasing levels of efficiency and versatility.
1.3.1 Basic Metalcutting Tools
Basic metal-cutting operations are illustrated in Figure1-3. Five basic types of machine tools which are commonlycategorized by their operation are described below.
1-4

Turning Machines
Turning machines are based on the principle of thela the--cu tt ing excess metal, in the form of chips, from theexternal or internal diameter of a rotating workpiece.Internal cylindrical operations that are performed on turningmachines include derilling, reaming, threading and boring.Boring involves enlarging and finishing a hole that has beencored or drilled.
FIGURE 1-3. BASIC METALCUTTING TOOLS
Modern turret lathes are equipped with a turret containingmultiple tools and are frequently classified as either chuckingmachines or bar machines. Bar machines, sometimes called screwmachines, are designed for machining small threaded- type parts,bushings and other small parts from bar stock fed into themachine spindle. Chucking machines are used for machininglarger parts, such as castings, forgings or blanks of stockthat must be mounted in workpiece holders (chucks) manually.
Drilling Machines
Drilling machines, also called drill presses, cut holes inmetal with twist drills. They also use a variety of other
1-5

cutting tools to perform basic hole-machining operations, suchas reaming, boring, countersinking and tapping internal threads
Milling Machines
Milling machines cut metal as the workpiece is fed againsta rotating cutting tool called a milling cutter. Variouscutters are used for cutting concave forms, convex grooves,rounding corners and cutting gear teeth.
Grinding Machines
Grinding machines remove small chips from metal parts thatare brought into contact with a rotating abrasive wheel, calleda grinding wheel, or with an abrasive belt. Grinding is themost accurate of all the basic machining processes and is oftenthe last operation performed on automotive parts and componentsprior to final assembly.
Broaching Machines
Broaching machines are special-purpose machines used forcutting keyways in the hubs of gears or pulleys, cutting squareor hexagonal holes and cutting gear teeth. The teeth onbroaching tools are equally spaced but increase in size fromthe tip of the tool upward. Each tooth cuts more deeply intothe workpiece, and the broaching operation is completed in asingle stroke.
1.3.2 Machine Tool Configurations
Machine tool products are often combinations of basictools. Many are systems that consist of several machinesconnected by conveyor systems. Others are multiple-functionsystems that are numerically controlled, often by computers.The ma]or categories of machine tool configurations that areimportant to the auto industry are described below.
Transfer Lines
The largest and most expensive machines sold to the autoindustry are transfer lines. They are combinations ofconventional machine tools arranged in the required sequence,connected by work- transfer devices and integrated withinterlocking controls. Maximum production economy on transferlines is often achieved by assembling parts to the workpiecesduring their movement. The systems often reach several hundredfeet in length, and loading and unloading operations take placeat each end of the line. While the largest lines are usuallylaid out in a straight line, smaller pieces are often machinedon lines with circular pathways, called dial machines.
1-6

Transfer lines fall into the more general category ofspecial-purpose machines. They are dedicated equipment
—
designed and built for the production of a specific set ofparts or components. This custom construction provides highproduction rates and maximum machining efficiency, but itrenders the equipment largely inflexible. Given the rapidchanges taking place in the auto industry and frequency ofdesign and tooling innovations, machine tool suppliers andautomakers are experimenting with more flexible alternatives tothe traditional Detroit transfer line.
Machining Centers
Machining centers are numerically controlled machine toolsthat can perform a multiplicity of operations in only onesetup. They constitute a relatively new class of machinetools, made possible by the advent of numerical controls andexpanded in their capabilities by the introduction of computernumerical controls.
The controller on a machining center can adjust three, fouror five axes, setting the positions of the column, spindle headtable location, table rotation and table tilt. By changingthese variables and utilizing a tool magazine, a center iscapable of performing a wide variety of operations, includingmilling, drilling, reaming, contouring, tapping, and boring.Machining centers replace an average of three conventionalmachine tools. They are used more frequently in job shops thatsupply the auto companies than in the auto plants because theyare not high-volume machines.
Flexible Machining Systems
For the most part, flexible machining systems are stilldrawing board designs rather than production realities.However, discussions of their potential applications,particularly for the auto and aircraft industries, dominate themedium-term marketing deliberations of the major machine toolsuppliers. The basic concept of the flexible machining systemis the wedding of transfer line automation with the adjustmentcapabilities of machining centers. Computer numericallycontrolled machining centers would be linked together by work-transfer devices to provide a continuous machining line capableof machining over 100 different parts. The systems would,therefore, differ from transfer lines in two respects: theywould be slower, and they would be much more versatile.
A primary motivation for designing and building flexiblemachining systems is the increasing frequency of design andtooling changes in automobiles and aircraft. Until recently,major manufacturing industries, such as auto, used a machine
1-7

tool to make a product with a life nearly equal to that of theequipment. That is no longer the case. Continuous and radicalproduct changes have placed a four or five year limit on thelifespan of most machined products. At General Motors, forexample, not one engine in production for its 1978 car modelswill still be in production for its 1985 models.
Although transfer lines allow for some limited productionchanges, any significant design alterations make themobsolete. Flexible machining equipment would allowmanufacturers to alter parts and components without requiringthe enormous capital costs of entirely new machining lines.
There are over 1,200 companies at present in the U.S. whichmanufacture machine tools. Approximately 67 percent, however,are small, closely held companies. Major domestic suppliers ofmachine tools include:
• Acme Cleveland• Cincinnati Milacron• Bendix/Warner and Swasey• Cross and Trecker• Ex-Cell-0 Corporation (Kingsbury)• Ingersoll-Rand Company• Motch & Merryweather• F. Jos. Lamb Company• Place (Budel)• Snyder• Giddings and Lewis• Colt Industries.
Table 1-2 lists the key financial indicators of the majorsuppliers listed above.
Tiie companies covered in this report were chosen from among thelargest machine tool suppliers in the U.S. The list wasnarrowed down by concentrating on those companies that are mostimportant to the auto industry. Companies that aresubsidiaries of firms that have already been covered inprevious reports under this contract, such as Budd and Bendix,were eliminated. The final selection process was made on thebasis of the availability of information about the companies.The selected companies were:
• Acme Cleveland• Cincinnati Milacron• Cross and Trecker• Giddings and Lewis• Lamb• Motch and Merryweather.
1-8

TABLE 1-2. MACHINE TOOL SUPPLIERS'FINANCIAL ANALYSIS
•— ——
Company
1979Net Sales(Millions
)
1979 NetEarnings(Millions
)
PercentChangeOver 78
PercentReturnOn Sales
Acme-Cleveland $ 344.4 $ 19.6 + 49 5.7Cincinnati
Milacron 747.9 55.4 + 67 7.4Bend lx 3,356.4 162.6 + 25 4.2Warner and
Swasey 305.0 21.5 + 84 7.0Cross and
Trecker 298.0 26.4 + 54 7.2Ex-Cell-0 Corp. 961.9 54.2 38 5.6Snyder 38.0 1.5 NA 4.0Giddings and
Lewis 257.7 28.9 + 59 11.2Colt 2,140.5 114.4 + 28 5.2Jos. F. Lamb Co 200 + ( Privately held
)
Motch & Merry-Weather NA* NA NA NA
Place NA* * NA NA NA
Jos. F. Lamb Co. 200.0 + 85 (privately held—data not available
)
N . A . = Not Available* Aquired 1979 by Oeirl ikon-Buhrle
** Acquired 1980 by Budd
1.4 TRENDS AFFECTING THE MACHINE TOOL INDUSTRY
The U.S. machine tool industry is at an importantjuncture. Accustomed to an historical boom/bust cycle, theindustry is now experiencing a sustained, high level of demand,and it is not capable of meeting the incoming orders. At thesame time, it is faced with tough competition from overseasmachine tool suppliers and demands from its customers fortechnologically advanced products. In the coming period, fourtrends can be isolated that will significantly shape the futureof the industry:
Demand for machine tools that are more technologicallyadvanced
1-9

• Attempts to alleviate the severe capacity constraintsof domestic machine tool builders
• Encroachment of foreign companies into U.S. markets
• Increasing consolidation of the industry throughmergers and acquisitions.
1.4.1 Technical Advances
Advances in electronics are leading the way toward a newgeneration of more highly automated and more dependable machinetools. Although less than 5 percent of machine tools in useare equipped with numerical control, the latest generation ofmachine tools is making increasing use of this powerfulfeature. Tape-controlled systems of earlier models are givingway to programmable control systems governed by software.Programmable controllers have opened up the possibility offlexible machining systems (described above) and of integratedmanufacturing systems that combine numerically controlledmachines, automated handling systems, industrial robots andcomputer-centered management information systems. Programmablesystems will offer manufacturers the following advantages:
• Provide random and flexible manufacturing for a familyof workpieces, i.e., the capability to introduce anyworkpiece into the system at any time without anysystem downtime
• Provide management control through jointimplementation of computers, numerical control machinetools and automated material handling
• Increase utilization of facilities through theinherent flexibility of programmable systems.
Although electronic system controls may have the mostfar-reaching impact on machine tool applications, otherimportant areas of research are also being explored andapplied. They include:
• In-line gauging to make automatic incrementaladjustments to compensate for tool wear
• In-process inspection and testing stations to improvequality control
• Reductions in the use of coolants, a consistent sourceof environmental and maintenance problems
1-10
• Development of coated carbide cutting tools that havelonger tool lives and that allow higher machiningspeeds
.
1.4.2 Capacity Constraints
Since finding itself with excess capacity in the economicslowdown of the late '50s and early '60s, the U.S. machine toolindustry has been wary of significantly expanding itsproduction capacity. This long-held attitude has recentlybegun to change in the face of strong, sustained demand, hugeorder backlogs and the spectre of foreign incursion into U.S.markets
.
New capital expenditures by machine tool builders declinedfrom $104.9 million in 1967 to $91.7 million in 1978. In 1979,the level of investment jumped 57 percent to $144 million, andanother sizeable increase in expenditures is predicted for1980. The suppliers are playing catch-up, however. Backlogsare running over $5.6 billion, lead times are stretching toover 24 months and foreign competitors are winning over U.S.customers with considerably shorter delivery schedules. Thetransfer line requirements of General Motors alone could absorbthe entire capacity of the transfer line segment of theindustry for the next four years.
Compounding the suppliers' problems is a serious shortageof skilled machinists. Total employment in the industrydropped by 34 percent between 1967 and 1972, from 116,400 to76,600, only rising back to 110,000 in 1979. Industryrepresentatives point to the skilled labor shortage as a
critical constraint on expansion, and several of the largercompanies have initiated special training or apprenticeshipprograms to help fill the gap.
1.4.3 Foreign Competition
The mounting backlogs of U.S. machine tool suppliers hasaggravated the industry's problems with foreign competitors.Foreign producers have captured 25 percent of the U.S. market,and observers are predicting that the percentage will continueto rise as domestic delivery times lengthen. Japanese firms,which account for 34 percent of U.S. machine tool imports,increased their U.S. sales 70 percent in 1979 over the previousyear, to $386 million. West German exports rose 27 percentduring the same period.
In addition to stepping up their exports, the foreignproducers are setting up production and assembly facilities inthe U.S. Fifteen foreign machine tool manufacturers have builtplants in the U.S. since the mid-'70s, and several others have
1-11

purchased important domestic tool companies. Recenttransactions include the purchase of Motch & Merryweather byOer likon-Buhrle Holding of Switzerland and the acquisition ofPlace Machine Sales by the West German steel company Thyssen.
Steady technological advances by the Japanese competitorshave also caused concern in the U.S. industry. The Japaneseexported 2,300 numerically controlled lathes to the U.S. in1979— 40 percent more than were produced by U.S. companies.Exports of Japanese-built machining centers have also jumpeddramatically in the last five years. Most analysts think thatthe U.S. will continue to hold its lead in computer technology,particularly software, but the technological gap between thedomestic and foreign suppliers is definitely narrowing.
1.4.4 Industry Consolidation
The demand for rapid technical progress, capacitylimitations and the strength of foreign competition are allhaving major effects on the structure of the U.S. machine toolindustry. Smaller companies are encountering difficulties infinancing the necessary expansion and research work required toremain competitive, and larger firms are merging theiroperations to pool technical talent and capital resources.
Two of the largest mergers ever in the industry occurred in1979. Most recently, the Bendix Corporation purchased theWarner & Swasey Company of Cleveland. Earlier in the year, theCross Company of Detroit and the Kearney & Trecker Corporationof Milwaukee combined to form Cross & Trecker. The JusticeDepartment has brought suit against the second merger foranti-trust violations, but other mergers are being announcedor negotiated. Giddings & Lewis has announced that it wasdiscussing a merger with Motch & Merryweather before the latterwas bought up by Oerlikon of Switzerland.
1-12

2. ACME-CLEVELAND
Acme-Cleveland is a major producer of machine tools,foundry equipment, total manufacturing systems, electricalcontrols, and expendable metalcutting and foundry tools.Approximately half of the company's sales are to the automanufacturers, and several of its six divisions produce almostexclusively for. that market. Although the recession is likelyto slow sales of the firm's expendable tool products, sales ofcapital equipment are likely to remain high as automakerscontinue to make major changes in the designs of theirvehicles. The firm's facilities are currently working at fullcapacity, and its order backlog for capital equipment remainshigh
.
2.1 CORPORATE SIZE AND STRUCTURE
The Acme-Cleveland Corporation was formed in 1968 by themerger of National Acme and Cleveland Twist Drill. The LaSalleMachine Tool Company was acquired in 1974, and two smallerfirms, Nobur Manufacturing and Hillyer Corporation, have beenpurchased in the last two years. Acme-Cleveland ranks secondin both revenues and income among North American manufacturersof machine tools.
2.1.1 Revenue, Profit and Employment Statistics
In 1979, Acme-Cleveland had sales of $344 million, up from$290 million in 1978. Profits rose from $13.2 million in 1978to $19.6 million in 1979. Operations outside the U.S.accounted for 8 percent of total sales and 14 percent of netincome in 1979. The firm employs 6,100 people. (See Table2- 1 .)
TADLE 2-1 . ACME-CLEVELANDREVENUE, PROFIT AND EMPLOYMENT STATISTICS
Revenues(mill ions
)
Prof i ts(millions)
1979 $344 1979 $19.61978 290 1978 13.2
Total Number of Employees: 6 ,100
2-1

2.1.2 Corporate Organization
Acme-Cleveland is organized intoorganized by type of product. The d
segments, by market, with three diviequipment market and three divisionstools. A separate support servicesresearch and distribution capabiliti( See F igure 2-1 .
)
six operating divisions,ivisions are grouped in twosions serving the capitalproducing expendablegroup complements thees of all six divisions.
The divisions serving the capital equipment market are asfollows
:
• LaSalle Machine Tool, Inc. LaSalle Machine Toolsupplies transfer lines and dial-type machines to theauto manufacturers and other industries forhigh-volume automated machine-processing of a widerange of complex parts. The start-to-f inishproduction systems are custom-designed to the user'sspecifications and incorporate equipment manufacturedby LaSalle, by other Acme-Cleveland divisions and byoutside suppliers.
• National Acme Division . National Acme manufacturesmultiple spindle bar and chucking machines formachining metal parts from bar stock, tubing, extrudedmaterials, castings and forgings. The equipment issold to screw machine job shops, auto manufacturersand other industrial products manufacturers.
• Shalco Systems Division . Shalco Systems suppliesfoundries with machines for making cores and molds forcasting. The division's product line includesmachinery for making cores and molds with both the"cold box" and "hot box" methods.
Acme-Cleveland divisions that produce expendable tools arethe following:
• Namco Controls Division . Namco Controls manufacturesand markets electrical and electronic controls forproduction line manufacturing. Products include limitswitches, proximity switches and solenoids.
• Foundry Tooling Division . Foundry Tooling is one ofthe country's largest pattern and mold makingoperations serving the metal casting industry. Thedivision's service includes tooling design,pre-production wood and plastic tooling and finalproduction tools.
2-2

2-3
FIGURE
2-1.
ACME-CLEVELAND
CORPORATE
ORGANIZATION

• Cleveland Twist Drill Company . Cleveland Twist Drill,founded in 1876, is a world leader in the productionof cutting and threading tools. The division offersover 40,000 stock tools in its product line as well asoffering customized tool manufacturing services.
Acme-Cleveland ' s two major support service operations arethe Acme-Cleveland Transportation Company, which handles a widerange of product distribution functions, and the Acme-ClevelandDevelopment Company which is the firm's centralized researchand development facility.
2.2 MAJOR MARKETS AND PRODUCTS
Figure 2-2 presents the major market information forAcme-Cleveland
.
Market Data
Major Markets: Automotive, truck, farm and constructionequipment, screw machine products, bearings,valves and fittings industries.
Percent of Sales to the Automotive Industry: 50
Major Automotive Customers: Ford and General Motors
Major Automotive Products: Machine tools and transfer linesfor the production of pistons, connectingrods, rear axle housings, cylinder heads,disc brakes and other vehicle components.
Figure 2-2. MARKET DATA FOR ACME-CLEVELAND
2.2.1 Major Markets
Acme-Cleveland 1 s major markets include the manufacturers ofautomobiles, trucks, farm and construction equipment, screwmachine products, bearings, valves and a variety of fittings.Foundry equipment is sold to foundries producing iron, steeland aluminum castings for a number of different industries.
The automotive industry is the company's most importantmarket, accounting for approximately 50 percent of total annualsales. Within the industry, Ford and General Motors areAcme-Cleveland 1 s largest customers. In 1979, sales to Ford andGM were approximately $96.6 million, representing 28 percent ofall revenues for the year. Table 2-2 shows the approximate
2-4

percentage of sales to the auto industry for each ofAcme-Cleveland ' s divisions.
TABLE 2-2. PERCENTAGE OF SALES TOAUTO INDUSTRY BY DIVISION
Division Percent Auto Sales
LaSalle Machine Tool 75%National Acme 20Shalco Systems 30Namco Controls 10Foundry Tooling 100Cleveland Twist Drill 20
In the more heavily industrialized sections of the U.S. andEurope, capital equipment is sold directly to customers through39 full-time field representatives. In other areas, 16domestic and 44 foreign distributors and agents are used.Agents and distributors are also used for the company'sexpendable tool products.
2.2.2 Products
The following are descriptions of Acme-Cleveland ' s primarycapital equipment and expendable tool products and of recentlycontracted sales to the automotive industry.
Capital Equipment Products
The capital equipment segment of Acme-Cleveland ' s businessproduces machine tools and systems and foundry equipment. Themachine tools are primarily transfer machines and multiplespindle bar and chucking machines. Replacement parts formultiple spindle machines provide an important part of thesegment's revenues. The machine tools are major components ofproduction systems, used primarily in the production ofautomotive parts such as pistons, connecting rods, rear axlehousings, cylinder heads and disc brakes. Major foundryequipment consists of machines for making sand cores and moldsby the shell molding process.
Expendable Products
Acme-Cleveland ' s major expendable products are cutting andthreading tools, such as high-speed drills, reamers and mills,taps and thread rolling heads. Other products in this groupinclude foundry tooling and electrical and electroniccontrols. Foundry tooling consists primarily of patterns for
2-5

iron, steel and aluminum castings. Controls manufactured arelimit switches, solenoids and proximity switches for use invarious applications.
P.eoent Automotive Sales
The major redesign and retooling efforts of the U.S. automanufacturers have resulted in a significant increase in ordersfor Acme-Cleveland ' s subsidiary, the LaSalle Machine Tool Inc.,during the latter half of 1979 and the first half of 1980. Thefollowing are some of the larger contracts that the firm hasbeen awarded:
o GM's Cadillac Motor division ordered 12 LaSalletransfer machines to be used in the production of anew 4.1-liter aluminum-block V-8 engine due to beintroduced in 1982. The machines include metalcuttingunits for use in the production of the bearing caps,intake manifolds, connecting rods and pistons.
# Ford placed an order with LaSalle for transfermachines to be used in the production of a new line ofV-6 engines with aluminum heads and cast iron blocks.The equipment, to be installed in Ford's Windsor,Ontario, plant, will include metalcutting machineryfor pistons, intake manifolds and other parts.LaSalle will also supply Ford with transfer machinesfor qualifying the cylinder head castings. During1979, LaSalle began work on an earlier Ford order forthe case machining line for Ford's forthcomingthree-speed automatic transaxles.
0 The Chevrolet division of GM recently awarded LaSallea $15 to 20 million contract for special machine toolsto be used in the production of front-end brake discrotors and calipers and steering knuckles at Chevy'sSaginaw, Michigan, manufacturing plant.
0 LaSalle's latest large automotive order came from GM'sHydra-Matic division and is worth between $21 and 23million. The order calls for four machining lines toproduce valve bodies for GM's next generation offront-wheel-drive transmissions, known as the THM440s. Each of the four lines will include two in-linetransfer machines capable of performing variousboring, drilling and milling operations.
2 . 3 CORPORATE STRATEGY
In 1975, the directors of Acme-Cleveland outlined sixcorporate objectives for the company's future. They were:
2-6

• Improve the return on net assets employed in each ofthe company's operations, making an orderlydisinvestment of any plant or product that does nothold the prospect for satisfactory earnings
• Improve the financial strength of the corporationthrough increased earnings, prudent management ofworking capital and reduction of debt
• Develop and efficiently employ all of the firm's humanresources
• Establish and maintain efficient, highly productivefacilities for all operations
• Market world-wide at an appropriate profit thoseproducts and services that best fulfill the needs ofthe company's customers
• Exploit all advantages inherent in the complementarynature of the corporation's various products andtechnological abilities.
In the following year, the directors set specific performancegoals for earnings of at least 5 percent on sales and at least15 percent on shareholder equity.
In evaluating the progress toward their goals in 1979, thedirectors pointed to a number of accomplishments. Theyreported after-tax earnings of 5.7 percent of sales and 20.9percent on shareholder equity for 1979. They also highlightedthe following projects that were aimed at furthering the sixcorporate objectives established in 1975:
>
#
Widespread introduction of computer systems tofacilitate inventory management, production planningand control, cost estimating, telecommunications,parts and products classification, engineering andmaterials analysis and the company's designcapabilities
Establishment of more formal and comprehensivelong-range planning procedures
Expansion of market research and market trendprojection for products and services and for newproducts being developed or due to be acquired
Opening a new manufacturing facility that will employthe best existing technology for variablemanufacturing of families of parts with the objectives
2-7

of achieving shorter lead times, reducing in-processinventories and lowering unit costs.
Many of the above projects have as a central aim increasingproduction capacity and maintaining the company's order backlogat reasonable levels. While the directors feel the firm ismaking progress toward these goals, a shortage of skilledpersonnel remains a persistent problem for the firm.
In assessing the company's prospects during the 198Q's thedirectors remain highly optimistic about continued orders fromthe U.S. automakers. W. Paul Cooper, company president, told atrade publication in early 1980, "Whatever Detroit does to gainmileage, be it aluminum cylinder heads, front-wheel-drivetransmissions or four-cylinder engines, Acme-Cleveland willbenef i t .
"
2.4 PRODUCTION AND OPERATIONS
Acme-Cleveland operates 20 domestic and 8 foreignmanufacturing facilities. The plants with significant shipmentto the automotive industry and three plants that were recentlyopened or acquired are described below.
2.4.1 Automotive Plants
The following 12 plants, grouped by division, ship a
significant portion of their output to the automobilemanufacturers
:
• LaSalle Machine ToolWarren, Michigan
- Fenton, MichiganCadillac, MichiganOntario, Canada
9 Foundry ToolingDetroit, MichiganHomberg/Ohm, Germany
9 Cleveland Twist DrillMansfield, MassachusettsCleveland, Ohio
® Shalco SystemsCleveland, OhioHomberg/Ohm, Germany
® National AcmeKewanee, Illinois
2-8

• Hillyer CorporationMountainside, New Jersey
Details on these plants are given in Figures 2-3 through 2-14.
2.4.2 New Plants
Acme-Cleveland has recently opened or acquired thefollowing facilities:
• LaSalle Machine Tool opened a fourth plant inCadillac, Michigan in December, 1979. The newfacility, occupying 32,500 square feet, was builtprimarily to increase LaSalle's capacity to meet themachine tool requirements of the auto manufacturers'retooling programs. The plant has already receivedorders from GM for transfer lines to producealuminum-block V-8 engines and from Ford for transfermachines to be used in the production of V-6 engineswith aluminum heads and cast iron blocks. The plantwas built at a cost of $2.5 million and will employ 60people during its first year of operation.
• An Acme-Cleveland Manufacturing Center is due to beginoperation in 1980 in Shelby, North Carolina. The38,400 square-foot plant was constructed to produceparts and product components for several Acme-Cleveland divisions. The Shelby facility will beorganized around two manufacturing cells, incor-porating 17 production machine tools, including sevenCNC machines and one computer-assisted measuringmachine. The modern manufacturing cells will becomplemented by computer-aided design and a
computerized classification system that the companypredicts will reduce production costs by 40 percentcompared with conventional manufacturing methods.
• In May, 1980, Acme-Cleveland acquired the HillyerCorporation of Mountainside, New Jersey, a
manufacturer of computer numerically controlledbridge-type vertical machining centers. Hillyerpresently employs 75 people with current sales ofapproximately $6 million. Hillyer's products utilize
2-9

Company—
_
ne
Cleveland
County
PhntSi/p
154,000
ft.
(LaSalle
Machine
Tool
Inc.)
cm
(0
co’w»</>
0}wmcoo
c<L
5-
yre
S
c
Q-
<2
s©>2"a.
EHi
oZ
c<0
oa2~ £
2 2co ^"O .2C 5co co
55 55
<Ti
. 00
T3 °OS 00
UQ)
> HosO2 "
cinco ^un ^
cm £
cuwoo<
2-10
FIGURE
2-3.
WARREN
PLANT
DATA

CN
4->
4-1
OOin
CNV£>
9)N
c/5
<—
ca
c •
3 OO CCJ M
T3cnj'
i—H
<1)
>d)
0oE-*
a)
c•H£ofC
I <ua) i ,hE i i—l
u to
<F. co> ro
% da£5o
<\2
$®>oaEUJ
o2
coco'35
(/>
ok.O)coo
cCO
0a2 ra
1 <2 8COa 2c sco co«-> ««C/3 CO
co+J
cdJ
«-<
c«a.
oro
<D
> oo•H n*Pc
QH
>i2o
I—I**
'—I c<c o
-po Co (L)
CN Cn
(/>(/i
Vwao<
2-11
FIGURE
2-4.
FENTON
PLANT
DATA

fNJ
4->
M-l
OOLf>
*.
(N00
0N
c/5
*>
cJOa.
5 o0 cO M
13CrtJ
I—
I
<D
>CD
r—
I
ui
CD
eo<
ooEh
CD
C•H.co03
S(D
03
CO
> rd
C ^rea£oo
oCO
$0>o"5.
ELU
M5“re
co
OJs©o
t:o;
U4-*
cre
e.
ere
oaO re
~ «re is
s <S sreo J2c sre re«* «=»
C/3 COi—
I
oCOCT>
CD £XI '
CO o•H 03
3-4 rHClJ r-H
•HLD 03O 03
CT\ (J
Irt
5»0to
*oa<
2-12
FIGURE
2-5.
CADILLAC
PLANT
DATA

<\203NCOwcCO
cj£
T3Cfd
rHCD
>CD
I—I
CJI
CD
eo<
ooE-i
CD
C•H
ofd
SCD
td
CO>fd
idaEoa
re
co’v»
rew.racoo
£CD
cn
£aocd
Eh
2
re>aiUJ
oZ
a)
DCa)
>c
oPS
cre
Oa2 re
re J?5 f*5 8rea .2c 5re re** **CO CO
+J
co
CN
uwo •
in PSco •
in PS
cre
x:CD
wEDOa)
Eh
v>VIVwT3T3<
fd
Tdfd
cfd
u
2-13
i
FIGURE
2-6.
ONTARIO
PLANT
DATA

<N
-P
ooo
kO
0)Nco
cre
C33o
T3C
uI
<u
ea
CPC
ooEh
>iPTJCa
>oOnac5a
<0
cQM(A0)6=03coo
op-p
aj
a
cJEa.
<\2
1©>aELU
oZ
-p
a)
d) mp o4-> 04co oo
oiM
C so -
p> -p-H
o o^ p00 4-1
oo ai
rH Q
cre
oaO eu
Z 2|<S3(0 ^o .2c sre re** +*CO CO
©t=aT3<
2-14
FIGURE
2-7.
DETROIT
PLANT
DATA

2-15
FIGURE
2-8.
HOMBERG/OHM
(FOUNDRY)
PLANT
DATA

CM
-P14-1
Co'O'
LDy£>
03NCO
re
Q.
= 03°Uh
e—
I
•H5-1
QTSC |-P
re!!in
i—I i'H
a>; 5
>!
E—
'
(D I
-H ,T3
CJ|c
i:
fC
d) 'i—
I
£' <U
O >< I 0)
>>
5
ccj
.CJ
2VI0303>o
LU
'o
6Z
w
re
sin(/>
03wO)
5c
re
£ *~ £03 J5
2 f£ 8re ^"C 2C —re re
VJ CO
00'O*
oCMo
-p
(D
<U <U s
,
CO -
(U
-pITS
-p
CO
^>1
n3
m
re
C-
di>i >—
l
<U (U
O -Hc ^P U3
P cx: (0
o in<n03
2-16
FIGURE
2-9.
MANSFIELD
PLANT
DATA

CM
+jM-l
O I
oCM I
>=r
co
vN
C/5
£_
> —— •
= o3 UsO r—
I
?!5 :
03 i
>03 !
r“H I
U :
I1
03'
£O !
< I
!
>•
re
Ua-p03
•H
Eh
T3C03
r—
1
a)
><u
r—l
u
5
i/>
v>a;
0o
I
I
I
rd I
c i
03 !
rH I
a; i
>cu
:
i—
i
CJ
ccc
2 rc
^ 0}
l<3 ra
Z. .oCO
~Cc —
___ to co
rHC/3 C/3
-P >sr
CO
JC-P X<xt Orj*
-P T30) C03 03
W i—
l
03
>Q3
I 1
U
CN
CN
tsii/i
V
oC
co
a.
2-17
FIGURE
2-10.
CLEVELAND
PLANT
DATA

CM
P>4-1
oloooCD
aswco
JZQ.
>C
WO •
( Qna cn
re; ei—|! 0)
<UI c/i
>> >10) COr—li
u oI
: u(D i—
I
B 03
o x:<t} CO
>re
Ca
2"re
.2t/i
inS3
5)cco
1!
.2!<u
;
>
;
a;
i—I ;
U i
<\2
ina>0)>O
LU
0
6Z
re
5 «w 04*' £|<<B «w Ore «c £C 5re re
gcn cn
•re-
T3 X I
X O !
4-> '|
-H 03|
0 CIO 03
i—I i
cn d) i
•—I !> i
oo a)1
CM i—I1
rH O I
1/1
IX.
05
i
2-18
!
FIGURE
2-11.
CLEVELAND
(SHALCO)
PLANT
DATA

03N
c/5
cre
T3 pC
i
fd ico
H 16d) (U
> *4J
<D iCO
'
—
I '^1
U Pi ;
<u oE :uO rH< fd
|§
U
IA
r>
C1/1
t/>
03w3COu
e£o\tx>
5-1
<U
-QE0X
<\2
tnV03>_©aS
oZ
cre
03
2
re03
reu
oi-H lD
e <d
-C CO
O co\ td
O' j_|
5-i +)a) c/j
X5E UO 0)
K CHm r—
I
i—I 5-1
m qj
VO CQ
re Z."Z <£>
C ~re re
w tn
VM
O
oHi—
I
— ,Qoo 0vo iQu
j(U
ofd
4-1
p|fd
|54
CO id)
o ^Cu 'CD
1/1
I/I
03
>-l
cfd
ES-t
a)
o
jz
a.
2-19
FIGURE
2-12.
HOMBERG/OHM
PLANT
DATA

CN
-PM-t
OOCM
inID
03N)
CO
o
;>T3 j-H
C QCO
I 1Id)
<d ;g> jO<u !<
U rHi
!co
a)
o<c
co
'*H
i-p
l<c
|2
cc
c
m03
O)coC
CD
0)
Crtf
5CD
re
c.
2
w«03>oc.
£LU
OZ
2 re
i a;
— re2 ore \SX ««
C Sre re
C/3 C/5CO*3!
3+j
CO
a:wX
«A
03
CcoC/5
re
£
in H CD,
CD o f miCn ^ K 1
cd aj CN,
a- X CD mi0 a 00
H CQ (0 \|CN ovCN O <5 O'r—l 0-1 % col
03
cc
—re
03>
cc5
>•»S
8e3mCOo
03tn
3rev>mreaO
ore
re
O
re>
c
3
<
2-20
<u2
<U2
<U2
tnc
o
o
cn
oO-p
TO CD
C Crd 'H
jcp ora rd
PQ E
FIGURE
2-13.
KEWANEE
PLANT
DATA
I
CN+J4-J
OOOom
0)N
c/5
J5c.
u
I
5c
V)03
Coo
I
CO
~ re
£ 03
i f*o ra
w Ore
T3 <f>
c —<o re
w w5
1
1
TDj
1
i
cl
3|
i
rH 1
|
d> ! ai
> l p CD 1
0) 1 0 ts;rH uu
;
ini i u cid)
id) •H '
E !>1 <d|
o 1—
1
-p
c 1—
1
c;I
•H 3X 0—
'
S:
i
•1
-P •31
1
Ud|
T3I
1r~H dJ
CU T3 i
•H *Hi
4-1 cni
4-1 ci
d) •H!
x: cdi
1
cn -p <Nc <Jn
^r 3 o«=r 0 fr-
CN £ oi
to03
C w<
2-21
i
FIGURE
2-14.
MOUNTAINSIDE
PLANT
DATA

computer-directed controls and a high-speed toolchanger and are capable of performing a variety ofmachining functions, such as drilling, milling,tapping, boring and reaming. The company's majorcustomers are patternmakers, production machinecompanies and other job shops.
2.5 FINANCIAL STATUS
Acme-Cleveland has steadily improved its sales and earningsperformance since 1976. It has undertaken expansion programsthat should help it to capitalize on the machine toolrequirements of the automakers' redesign efforts. See Figures2-15 and 2-16.
2.5.1 Operating Analysis
In 1976 Acme-Cleveland felt the effects of a seriousrecession in the capital equipment market. Earnings and salesfell, and the company sold off several European subsidiaries.Since 1976, return on equity has risen steadily, reaching 19.3percent in 1979. The earnings- to-sales percentage has alsoincreased although Acme-Cleveland ' s directors are hoping toimprove on the 5.7 percent achieved in 1979. They point towage-price guidelines and a high level of capital investment astwo factors that depressed margins in the last year. Thefirm's operating ratio has followed the sales and earningsfigures in a steady climb upward.
Acme-Cleveland ' s sales in 1979 increased 19 percent over1978 to $344 million, and earnings rose 48 percent to $19.6million. The company's order backlog jumped 80 percent, yearto year, and the firm is expected to improve on its 1979performance in 1980. For the first six months of fiscal 1980,income rose 7 percent on a 21 percent rise in sales. In March1980, the order backlog stood at $290 million, down slightlyfrom the $300 million level at the end of 1979 but well abovethe $208 million figure at the close of 1978.
Despite the recession, prospects for the firm in 1980 lookpromising, according to industry and investment analysts. Somesoftening of demand for expendable tool products is expected,but the capital equipment markets, particularly auto, arelikely to remain strong. The consensus of the analysts is thatthe auto industry is firmly committed to its redesign programand that this effort will require continuing high levels ofmachine tool orders. In other industries, equipment capable ofraising productivity is also expected to be in demand.
2-22

**Year
Sales
($Millions)
Earnings
($Millions)
Return on
Equity, Percent
Operating Income*
SalesPercent
79 344 19.6 19.3 12.6
78 290 13.2 14.8 11.5
77 218 4.8 5.8 9.2
76 194 2.9 3.5 6.3
75 231 7.0 8.8 9.6
**Ended Sept. 30
* *Year
Earnings
T otal AssetsPercent
Sales
Assets
Earnings
SalesPercent
79 9.6 1.68 5.7
78 7.4 1.64 4.5
77 3.0 1.36 2.2
76 1.8 1.20 1.5
75 3.9 1.30 3.0
**Ended Sept. 30
‘Operating Income = Sales - Cost of Goods Sold — Selling, General and
Administrative Expenses, Before Depreciation, Interest, and Income Taxes.
FIGURE 2-15. OPERATING ANALYSIS OF ACME-CLEVELAND
2-23

CO
C
C
03
COoo
**K
coa>
>
r—
1
rH rH• • • o oo o c
r- 00 •O’ 00
CN or CO CD m
CO o 00 CTC 00
LO in 'O' zr •O'
CD CN co CC oOC co 'O' CN r-pH rH
CN o o CN CD• • • • •
in CD rH •O' inrH rH
'O’ O 00 i—
1
o' <y\ 1—
1
cn coco CN CN rH CN
CTC oc r» CD mt-~ r- r~
Ocn
4J
ad)
cn
T5
0T3CW
c03u.
©r-~ •o' o 00 00
3CO
00o CN co co CO CN
Q.COCJ
03CT>COw03>oo
CNI
-O03
QEw03
03co
CO CO CD 00 rHfNJ • • • • •
“co o CN CN rH ID4»«
’5.COo
co CO CO CO m
a.COO
c
CO
’E.•• CO03 OC7)
o>co _C-Co i—
o§
-K
*co03
>
<Ti CN CDQ
CN LO •O' Z
o r-» in O' CN• • • • •
ac CO O' CN CO
“Oe CN CD O' CO 0003
*>
aID CO CN CN CN
*or~ o CD m CN
c03 <Ti 'O' 00 00
1—
1
o co o in
CD 1—
1
00 00 CD1—
1
'— •—
'
-aco
CO
o
co
CO03
>
CO «/5
—- 03^ w03 03C ts
oc cd i"- co inr- t-~ r- r~ r-~
O 03
co S
QJ _cn JO
'O aa)
TDcw**
03 -~-
o ~•— c "o
n >-
03a>co
03
co cn— .£
2 rowQ. ®co °-O O
CM CO
2-24
<Jhi>Wu
I
wsuc&Jocnt—i
cn>H
<z<
<E-*H03<o
MOi—
I
I
CN
wos
DUMEli
2.5.2 Capital Analysis
Acme-Cleveland ' s capital expenditures of $14.7 million in1979 were 64 percent higher than the capital expenditures of1978. Expenditure plans for 1980 call for a further increaseto $18 million. Recent capital investments have been financedlargely through internally generated funds with some outsideborrowing. Owners' equity, other than retained earnings, haschanged little over the last five years and debt has beenassumed largely in the form of long-term notes held byinsurance companies and industrial revenue bonds. Theincreased long-term debt has not been high, however, and thepercentage of long-term debt to capitalization has remained inthe 30 to 32 percent range for the last four years. Thecompany is currently in a strong cash flow position, asreflected in its purchase in late 1979 of a sizable portion ofits own common stock.
2.6 RESEARCH AND DEVELOPMENT
Acme-Cleveland ' s research and development activities arecentered in the Acme-Cleveland Development Company (ACDC),established in 1973. The facility serves all of the divisionsof the company and conducts research in six areas: computerapplications, design, electronics, materials, new products andmanufacturing development. In 1979, Acme-Cleveland spent $2.9million on research and development activities, up from $2.4million in 1978.
One of ACDC's major areas of concentration is materialsresearch. Specifically, the materials group is concentratingon methods for machining non-ferrous materials that are beingintroduced to reduce the size and weight of automobiles. OneLarge effort has involved collaboration with Ford Motor CompanyEngine Division and the Reynolds Metal Company to determine thebest techniques for machining new types of aluminum castingalloys. The alloys, containing varying amounts of silicon,provide many of the properties needed for satisfactory engineand transmission components.
ACDC is also involved in developing computer applicationsuseful in automating machining centers and in improving theproductivity of Acme-Cleveland divisions. The researchfacility played an important role in the design andimplementation of the company's new Manufacturing Center inShelby, North Carolina.
2-25/2-26

i.
I
i
i

3. CINCINNATI MILACRON
Cincinnati Milacron is the largest manufacturer of machinetools in the U.S. and an industry leader in the production ofcomputer-numer ically controlled machines. The corporation isalso a major producer of plastics processing equipment, as wellas chemical products, cutting fluids, precision grinding wheelsand semiconductor materials. The aerospace and automotiveindustries are the largest markets for the firm's machine tooland plastics processing equipment, and the company expects therecent strong demand from these industries to continue into the1980s.
The company has experienced rapid growth over the lastseveral years, in sales, earnings and the diversity of itsproduct line. Forty percent of its 1979 sales were of productsthat the firm did not manufacture five years earlier. Abuilding program is under way to help meet the large backlog ofmachine tool orders and to expand the company's capacity toserve the growing industrial robot market.
3.1 CORPORATE SIZE AND STRUCTURE
Cincinnati Milacron is a 96-year-old company with 17 plantsin the U.S. and 11 in Europe. Among domestic machine toolmanufacturers, it ranks first in both revenues and net income.Foreign operations account for approximately 20 percent ofsales and 10 percent of profits. The corporation is structuredaccording to product, and the operating groups often serveoverlapping markets.
3.1.1 Revenue, Profit and Employment Statistics
In 1979, Cincinnati Milacron achieved record sales andprofits. Its revenues increased 18 percent, from $634 millionin 1978 to $748 million in 1979. Profits jumped 67 percent to$55.4 million, up from $33.2 million a year earlier. The firmcurrently employs approximately 13,700 people, 3,700 of them atfacilities overseas. Table 3-1 summarizes revenue profit andemployment information for the company.
3-1

TABLE 3-1. CINCINNATI MILACRONREVENUES, PROFIT AND EMPLOYMENT
Revenues( millions
)
Profits(millions)
1979 $748 1979 $55.41978 634 1978 33.2
Total Employees: 13,700
3.1.2 Corporate Organization
The company is divided into three operating groups, byproduct line as shown in Figure 3-1. Figure 3-2 shows thecompany's 1979 sales and pre-tax profits by group. The groupsare described below.
• The Machine Tools and Electronic Systems Groupdesigns, manufactures and sells a broad line ofstandard and special purpose machine tools. Over two-thirds of the products are equipped with computernumerical control or advanced electronic controls. In1979, the group accounted for 60 percent of totalsales and 54 percent of total operating earnings.
• The Plastics Processing Machinery Group designs,manufactures and sells plastic injection moldingmachines, reaction injection molding machines,extrusion molding machines and several other types ofplastics processing equipment. In 1979, the groupaccounted for 23 percent of total sales and 34 percentof total operating earnings.
• The Industrial Products Group produces and sells avariety of products, including chemical additives forplastics processing, grinding wheels, cutting fluidsfor metalworking, semiconductor epitaxial substratesand material for printed circuit boards. In 1979, thegroup accounted for 17 percent of total sales and 12percent of operating earnings.
3-2

FIGURE
3-1.
CINCINNATI
MILACRON
CORPORATE
ORGANIZATION

%OF
TOTAL
70 r
MACHINE TOOLS PLASTICS INDUSTRIALAND ELECTRONIC MACHINERY PRODUCTS
SYSTEMS
Source: Cincinnati Milacron
FIGURE 3-2. 1979 SALES AND PRE-TAXPROFITS BY OPERATING GROUP
3.2 MAJOR MARKETS AND PRODUCTSf
Cincinnati Milacron estimates that its machine tools andmachining systems cover about 70 percent of the metalcuttingmarket. It serves all of the "Fortune 500" companies that usemachine tools as well as many smaller companies. It believesthat it has built more machine tools than any other company inthe world. Figure 3-3 summarizes the major market informationfor the corporation.
Market Data
Major Markets: Automotive, aerospace, bearing, construction,packaging, mining and diesel engine industries
Percent of Sales to Automotive Industry: 13 percent
Automotive Customers: General Motors, Ford, Chrysler, Volvo
Major Automotive Products: Standard and special purposemachine tools, machining centers,industrial robots and plasticsprocessing equipment.
FIGURE 3-3. CINCINNATI MILACRON MARKET DATA
3-4

3.2.1 Major Markets
Cincinnati Milacron's major markets are the aerospace,automotive, packaging, bearings and construction industries.Figures 3-4 and 3-5 show a breakdown by market of the company's1979 orders for machine tools and plastics machinery. Theautomotive industry accounted for 14 percent of 1979 machinetool orders and about the same percentage of plastics machinerysales. An unspecified percentage of industrial products,including chemical additives, grinding wheels and cuttingfluids, were sold to auto manufacturers.
%
Aircraft 27%Automotive 14Anti-Friction Bearings 12Construction and Farm Machinery 10Contract Machine Shops 7
Mining & Oil Field Equipment 4
Diesel Engines & Turbines 4
Machine Tools 3
Valves
,
Fittings & Pumps 3
Primary Metals 2
Other 14TOTAL 100%
Source
:
Cincinnati Milacron
FIGURE 3-4. SOURCE OF CINCINNATI MILACRON'S1979 U.S. MACHINE TOOL ORDERS
%
Packaging 27%Transportation 17Construction 16
Household 7
Recreation 7
Medical 6
Personal Care 6
Communications 5
Appl iances 4
Other 5
Total 100%
Source: Cincinnati Milacron
FIGURE 3-5. SOURCE OF CINCINNATI MILACRON'S1979 U.S. PLASTICS MACHINERY ORDERS
3-5

3.2.2 Products
The ma]or products that Cincinnati Milacron sells to theauto industry are machine tools and plastics processingequipment. Machine tool sales to the auto companies includegrowing numbers of industrial robots—-a product line that isexpected to increase in importance for the firm in the nextseveral years.
Machine Tools
Cincinnati Milacron machine tools sold to the automakersfall into the following categories:
• Numerically controlled machining centers , whichreplace three or four conventional manually controlledmachines and range in price from $50,000 to $700,000.Cincinnati Milacron is the world leader in machiningcenter sales.
• Numerically controlled turning centers , used formachining round parts such as gears, shafts and axles,and ranging in price from $140,000 to $600,000. Aturning center replaces four or five conventionalengine lathes. Cincinnati Milacron is the world'snumber two producer of these machines.
• Precision grinding machines , used for grinding theinside and outside diameters of parts in rotation, andranging in price from $35,000 to over $800,000. Salesof this equipment are expected to increase as smallerautomobiles require more precise tolerances indownsized and redesigned transmissions, engines, drivetrains and suspension systems.
• Industrial robots , used for spot welding, parttransfer, drilling, assembly, glass handling andmachine tool loading, and costing an average of$65,000. Cincinnati Milacron is currently the secondlargest U.S. supplier of industrial robots.
• Manufacturing systems , typically including machinetools, part handling and other special equipment andelectronic controls incorporating Cincinnati Milacroncomputers. Two types of systems are produced:dedicated systems for very specific requirements,usually handling larger parts at low to mediumproduction rates, and "variable mission" systems thatusually handle smaller parts at faster rates andprovide greater production flexibility. The systemsrange in price from one-half to several milliondollars.
3-6

Plastics Machinery
The following are the categories of plastics processingequipment that Cincinnati Milacron sells to the auto industry:
• Injection molding equipment, costing between $40,000
and $1 million. Sales of these machines to theautomakers are increasing with continued efforts toreduce vehicle weight and with the advent ofreinforced plastics.
• Reaction injection molding equipment , used by the autocompanies for the manufacture of grills, fascia andbumpers. Research work is underway on mixing liquidmonomers with reinforcing fillers to produceautomobile outer body panels.
• Extrusion machines , with prices ranging from $57,500to $5 million. Cincinnati Milacron is the worldleader in sales of twin screw extruders.
New Orders
Cincinnati Milacron recently received two new orders thatare indicative of the company's relationship with the rapidlychanging automobile industry:
• Volvo recently ordered 100 industrial robots, costing$8 million, the largest sale to date of industrialrobots, according to Cincinnati Milacron. Volvo willuse the robots for spot welding operations in its
automobile production lines. The units ordered arethe "T-3" model, a six-axis, computer-controlled robotcurrently in use in auto assembly plants in the U.S.and Europe. European and Japanese orders for robots
have significantly outpaced orders from U.S. firms,but Cincinnati Milacron and other industry analystspredict that Detroit's demand for robots will increasesharply in the next several years.
• General Motors, at the end of 1979, ordered threeengine block broaching machines for use in its
forthcoming V-6 gasoline and V-8 diesel enginemanufacturing programs. The order represents an
important victory for Cincinnati Milacron because the
automakers in recent years have been changing frombroaching to milling operations on many of theirengines. The switch was brought about by the
increased use of thin wall castings and aluminum
3-7

components to reduce vehicle weight. The heavypressures exerted by traditional broaching methodsoften damage lighter components. Cincinnati Milacronundertook a large research effort several years ago inresponse to this potential loss of business and hascome up with several new approaches to the processthat will allow broaching equipment to remaincompetitive with milling machines.
3 . 3 CORPORATE STRATEGY
In 1977, Cincinnati Milacron's president, Jim Geier,outlined the company's major goals as increasing the potentialfor sales growth and profitability and reducing the firm'scyclicality. The approach to achieving these goals is anemphasis on maintaining a leading position in the U.S. machinetool and plastics equipment markets and divesting the companyof unprofitable facilities and products.
To improve margins, in the past four years the company hasclosed six marginally profitable product lines in the U.S. Inearly 1980, the company sold its subsidiary, CincinnatiMilacron Chemicals, to Thiokol Corporation for $52 million.
The firm's broad marketing strategy for machine tools hasfocused on boosting the manufacturing productivity of itscustomers. By company estimates, the average metal part in amachine shop is only being worked on 5 percent of the time itis in the shop. The company's sales approach, therefore,stresses the reduction of the "95 percent non-productivetime." It is aimed toward the sale of manufacturing systemseven if the customer is only purchasing a stand-alone machinetool. The stand-alone units are designed to be building blocksin larger systems.
A major factor in the firm's machine tool preeminence isits electronics capabilities. Almost every machine produced bythe company includes Cincinnati Milacron electronic controls.Over the last several years, as numerical controls have becomemore sophisticated, minicomputer software has been replacinghardware features on the company's products. The company isdirecting efforts toward extending the flexibility that can beachieved with programmable production systems.
Closely tied to the company's work in electronic controlshas been its strong entry into the industrial robot market.Cincinnati Milacron currently ranks second only to Unimation inU.S. robot sales, and industry observers are predicting that itmay surpass all its competitors by 1981. The company hasalready reported $14 million in robot sales to two auto
3
3-8

companies in the first months of 1980 and expects total robotsales for the year to triple those of 1979. In response towidespread expectations of an industrial robot boom in the U.S.over the next several years, the company is taking steps tobroaden its market share. Business Week recently reported thatthe firm is transferring robot production and sales out of themachine tools group and into the industrial products group,where robots will be overseen by a vice-president with a
background in the computer industry and in aggressive marketingcampaigns
.
3.4 PRODUCTION AND OPERATIONS
Cincinnati Milacron manufactures equipment for the autoindustry at seven locations. Machine tools are produced at:
• Cincinnati, Ohio• Worcester, Massachusetts• South Lebanon, Ohio• Wilmington, Ohio.
Plastics processing equipment is produced at:
• Batavia, Ohio• Mt. Orab, Ohio.
A plant in Greenwood, South Carolina builds industrial robots.Details on the facilities are shown in Figures 3-6 through 3-12.
The company announced in early 1980 that it is constructinga second South Carolina plant to expand its capacity formanufacturing machine tools. The initial investment will be$11.2 million for a 66,000-square-foot plant scheduled to be
completed in the spring of 1981. The facility, located inFountain Inn, will employ 130 people in its initial phase. Theworkforce will grow to 350 within three years as continuedconstruction doubles the size of the plant. Total capitalinvestment will be $15.9 million upon completion.
3.5 FINANCIAL STATUS
Cincinnati Milacron has had record earnings and orderbacklogs for several years, and it appears that the 1980performance will continue the trend. The company should haveno difficulty in financing its planned capital expenditures for
the year with internal funds. See Figures 3-13 and 3-14.
3-9

3 - 33p 30 3
P 0 03 p a,3 633 3 0P p 0> 3-H P rp33 3 r—
1
3 a 3•H 3 p
3 ai
00 >p 0
«3
wc
_re
a=
>c
oo
•3r>
c
u
(0
co
occo
<3
Q.
ooo
«
IX
in4)tt>o*5.
£in
cCD
Oa2 «- 2M Zrm <2 8(0 .3. :o 2c sre to
53 53(Ti
v></>
3}
*3ouo53>•w.0
3 00 CMp • uo0 3 p3 >
1
—1 <C 2
•H Os Cn 0
1 P - 0-H •H 3 -H 1—
1
P P P P CO3 3 P 3 l 1
3 3 3 3 p1
3 3 S 3 !
*H •P •H 00 l
O a p 0 \3 3 0 3 cnP -H r- -P 1—
1
<-> p CJ in re
are
o£a**3<>=3
8£2coo
"39Jv»
Dre(AUt«uO
re
are
O
re
_>
Ocka
O3<i/t
<c
u2
<U2
<O2
- 3
3•HPapo
33a)
p-p•HMH
Cn 3 3 3 0 33 3 P 3 3 p P P3 H 3 •H 3 3 P O 33 33 P x: 3 3 3 XI 3 1
—
1
*H 3 3 u *rH 3 P 3 0 33 3x: •H 3 3 x: E 1
—
1 p P 30 P O E 0 33 0 3 x:3 cn 3 33 3 0 1
—1 rH 3
e Cn Cn E 3 3 p 3 p1—
1
3 3 3 P P CnCn 3 3 •H •H 1—
1
3 3 P 3 P Cn 33 3 3 3 x: 3 P E 1 1 3 P 3 •H
•rH P •H P 0 P Cn 3 *H P 3 •P 331—
1
3 x: x: 3 O 3 P 3 x: 3 P 3rH P 0 0 0 3 P 3 X u 33 P •rH
•H X 3 3 p a, 3 ^1 3 3 3 3 P*CP K E s CQ cn M 3 CC E M O O
3-10
FIGURE
3-6.
CINCINNATI
PLANT
DATA

4
I
i
CM•
4->
M-l
O I
OOoLT>
ro
49N
c/5
c
z
>cma)
0U
re
*w(/» o
c.5 0 (8
15c0
49 i2 f
’5 o «n k_ C949 re ’£
9 •a .£2 C w0 re re
CJ C/3 CO
i
MQJ
-P|cn
cu
o 1
£!
-p
cn
'Vc <c
0 sCQ
<u <u
2: +j
co
O 0)
CM U1 Mo 0i-H ^
'DO'©
JHQ_
w>49te
<
3-11
FIGURE
3-7.
WORCESTER
PLANT
DATA

Company
Cinc
inna
t
i-Milac
ron
Co
unt
y
Plant
Size
50,000
ft.
CN
w)
Q
e>coo
coc(0
XJcu
XI
oLDOJ
1/1
a>®>o&£LU
OZ
cCO
2 «j
- 2
2 fw ore ‘5O J2c sco co
V) U3
T3Pi
2OS-J
5-1
0S
1
cocn
co
£
xo
coecd
XI(D
XI
x:+j
aoCO
COC"l
CDLfh
</»VI
CO
cu
3-12
FIGURE
3-8.
LEBANON
PLANT
DATA

Cincinnati-Milacron
VI z .«
c®wo> "3 .2
33
c0
c(T3 CQ
o o CO CO
L
FIGURE
3-9.
WILMINGTON
PLANT
DATA
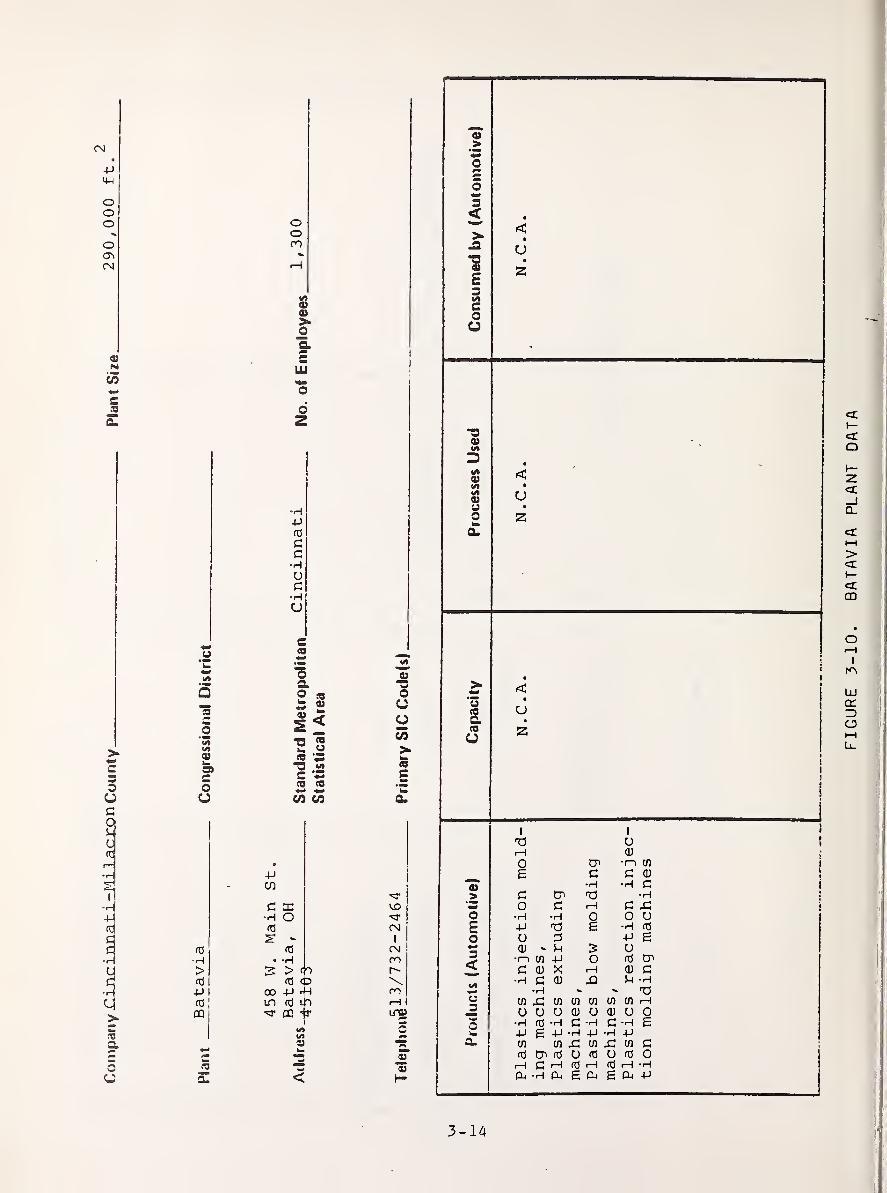
Company
-Cincinnat
i-
Mi
lacro
n
County
pj
ant
size
290,000
ft.
CM
-Ptd
GC•HuG•Hu
e<0
s/>
5to
OUlW>93wCO
OO
oa2 88
- 2
5 fS 3to 'Ga ^c sto to
CO <J3
-p
cn
td
•H><d
-p I
fd
;
CQ
jo
£P
c ac•h o<d2* -
td
coLD*0*
>td
-Ptd UnCQ >r
(Mor H
«/0
W0
*3
<
3-14
f
.
I
FIGURE
3-10.
BATAVIA
PLANT
DATA

I
I
I
CN
4J<4-1
OOOoin
39Nw—cas
i
&O9-1
O03
i|
-H-P05
cc•H i
oC*Hu
re
OCJ
ooCN
s«>o*5.
EUJ
oZ
re
co3*</>
3)k»3)Coo
cre
oa2- 239
5f13 !0
1.0
*0 £C Sre re
£ 09
XI03
uo
+J
s
_re
a.
CNm4t-
<U
-P3001
CD
+J
03
PC/3
Xo
X!(0
3-1
O
-P
£
•min*r
toI/I
39
3-15
FIGURE
3-11.
MT.
ORAB
PLANT
DATA

CN
OOO*
o
©N
C/5
cCB
Oaco
ard
i
•rH
-PfC
CGrH i
ci•HCJ!>ra
ct >
<8
\S>wa>wOJCoa
raoo£cQJ
0)
Pu
oo<N
s©>oc.
eIU
OZ
c©
oc.
2 ^- 2
2 aco «O ^c sco to
oo Si
ocn
r-(N -
m TDC-
1 0o5X
oCQ
O(X
c0)
a)
S-l
O til
oO
JOa.
</»WVw2<
3-16
FIGURE
3-12.
GREENWOOD
PLANT
DATA

Sales Earnings
Year ($Millions) (SMillions)
Return on
Equity, Percent
Operating Income*
SalesPercent
79 748 55.4 24.5 15.5
78 634 33.2 17.5 12.5
77 532 20.9 12.5 10.7
76 448 10.0 6.3 8.3
75 .450 9.9 6.5 8.0
Year
Earnings
Total AssetsPercent
Sales
Assets
Earnings
SalesPercent
79 10.5 1.42 7.4
78 7 .
3
1.40 5.2
77 5.1 1.31 3.9
76 2.6 1.18 2.2
75 2.5 1.14 2.2
‘Operating Income = Sales — Cost of Goods Sold — Selling, General and
Administrative Expenses, Before Depreciation, Interest, and Income Taxes.
FIGURE 3-13. CINCINNATI MILACRON OPERATING ANAL YS I
S
3-17

Changes
in
Owners'
•
Changes
in
Equity
Other
Than
Year
Sales
P/E
Ratio
^
Earnings
Depreciation
Long-Term
Debt
Retained
Earnings
ro 00 lH• • • • o
rH CM rH o
orH rH i—
1
rH 'NT
ON o CM ON
CNJ i—
1
O CO 00r—
1
i—
1
11
CM ON O O
N
• • • • •
lD co O o ONID co CM 1—
1
ON co •sT o CO
in no NO or—
1
CO CM 00 oCO CO in
r- NO in "T
ON 00 r~- NO mr-> r- r- r- r~
c/>
“OCo>“O>b
go03
c03C-XLU
CO03
>
rH CM ro in 00• • • • •
CM CM CM CM CM
ON in NO in ONO in in ro CO
ON ON NO 00 rH
r-» in CM CM
00 o ro ro in• • • • •
00 CO NO 00 rHCM CO CO ro
rH CM o CO CO• • • • •
o t" NO in inrH
co ON r- 00
NO CM CO rHCO CM CM rH •—
1
CO 00 "T r- i—
1
CM rH
ON cc t— NO mr- r~ r~ !"
ts>
CO
E
03v—O
Q
CO
03
k_3CJ
jDCO
CO
o
goCO
*o03
CO C03 ^>“ 03
03 OS C
oCONJ
03 •—COfc= •—03 Q.> CO< O
CNJ
03w03
oCL03c
03c.O
CO
3-18
FIGURE
3-14.
CINCINNATI
MILACRON
CAPITAL
ANALYSIS

3.5.1 Operating Analysis
Sales in 1979 rose 18 percent to $748 million, and earningsjumped 67 percent to $55.4 million. In the first quarter of1980, sales were up 14.4 percent and earnings rose 21.1percent. Since 1976, sales have risen steadily, and profitshave climbed sharply, increasing by more than 50 percent eachyear from 1977 to 1979.
Return on equity has also increased significantly, almostdoubling between 1977 and 1979 when it reached 24.5 percent.The company's strong growth is similarly reflected in rises inthe operating ratio, the ratio of earnings to sales and theratio of earnings to assets. The ratio of sales to assets hasalso risen but less dramatically, reflecting a substantialincrease in the firm's profit margins.
Industry and investment forecasts for the remainder of 1980are optimistic and point to another year of record earnings.Some analysts, however, are cautioning that the machine toolboom that the company has enjoyed for several years may wane in1981. In the first quarter of 1980, the order backlogincreased 9 percent, reaching $735.7 million, up 34 percentfrom a year earlier. Orders for plastics machinery andindustrial products may decline somewhat in the second half of1980, but demand from the aerospace and auto industries is
expected to remain strong through the end of the year.
3.5.2 Capital Analysis
The company's long-term debt has risen slightly in the lastthree years after large declines in 1975 and 1976. Owners'equity other than retained earnings has also increasedsomewhat. These sources of funds, however, have notcontributed significantly to the firm's large capitalexpenditures which reached $36 million in 1979 and areprojected at $46 million for 1980. Most of the funds have beencash generated from operations.
The ability of the company to finance its projectsinternally is reflected in the steady decline in the ratio of
long-term debt to capitalization from over 40 percent in 1975
to under 30 percent in 1979. This drop occurred even with a
steady increase in the ratio of capital expenditures to total
assets over the same period. The coverage ratio has i isen
steadily, and the current ratio has declined steadily since
1975. Dividends have increased since 1976, with payments to
shareholders increasing 40 percent in 1979 over the previousyear. The company should not have any difficulty financing its
announced 1980 capital expenditures internally.
3-19

3.6 RESEARCH AND DEVELOPMENT
Cincinnati Milacron spent $18.2 million in 1979 and $16.4million in 1978 for research and development activities. Overthe five-year period ending in 1979, the firm spentapproximately $75 million on R&D. That figure equals 2.7percent of total sales, and the company believes that thispercentage is considerably greater than the average for themachinery industry as a whole.
Company president Jim Geier gives the R&D staff credit forthe fact that 40 percent of the company's current products werenot being manufactured by the firm five years earlier, and heexpects that pace of new product introduction to continue overthe next five-year period. The full-time R&D staff consists of511 employees.
3-20

4. CROSS & TRECKER
Cross & Trecker is a major manufacturer of automatedmetalcutting transfer lines; assembly and testing machines;stand-alone machine tools; automated systems for foundries; andautomated coal-handling systems. The company was formedthrough the 1979 merger of the Cross Company and the Kearney &
Trecker Corporation, a merger currently being challenged by theJustice Department for alleged antitrust violations. The autoand truck industry is the firm's largest single customer, andthe company's directors are optimistic about a continued strongdemand from this and other key industrial markets. The firmhas recently announced the largest expansion program of anydomestic machine tool producer in order to increase itscapacity to deal with a large backlog and a high rate of neworders
.
4.1 CORPORATE SIZE AND STRUCTURE
The Cross & Trecker Corporation is a holding company withthree operating units: The Cross Company, Kearney & TreckerCorporation and the Roberts Corporation. Among North Americanmachine tool manufacturers, it ranks tenth in revenues andeighth in net income. In fiscal 1979, foreign operationsaccounted for 15 percent of total revenues and 13 percent of
net income.
4.1.1 Revenue, Profit and Employment Statistics
In 1979, the first year of the merger. Cross & Trecker hadrevenues of $298 million and profits of $26.4 million. Thesewere significant increases from the previous year when the
combined sales of the two firms were $236 million, withcomb ined -prof i ts of $17.1 million. The firm employsapproximately 4,100 people. (See Table 4-1.)
4.1.2 Corporate Organization
Cross & Trecker is divided into three operating units, eachof which serves a different market and manufactures differentproduct lines. The three units—The Cross Company, Kearney $.
Trecker Corporation and the Roberts Corporation—are describedbelow. (See Figure 4-1.)
4-1

TABLE 4-1. CROSS & TRECKER REVENUE
,
PROFIT AND EMPLOYMENT STATISTICS
Revenues (Millions
)
Prof i ts (Millions
)
1979 5298 1979 $26.4
1978* 236 1978* 17.1
Total Number of Employees: 4,100
Pro forma combined data of Cross Company and Kearney &
Trecker Corporation.
• The Cross Company
The Cross Company is the largest of the threeoperating units in revenues and employment. Itsprimary products are multi-station transfer lines thatperform high-volume metalworking, assembly and testingoperations, and it derives 60 to 70 percent of itsbusiness from the auto industry. It is divided intothree divisions, each one a self-sufficientmanufacturing facility serving a different country.The largest of the three is the Cross-Fraser Division,located in Fraser, Michigan. The other two divisionsoperate in England and West Germany.
• Kearney & Trecker
Kearney & Trecker manufactures and sells numericallycontrolled machine tools and standard drillingmachines. The machine tools are used primarily inmedium and low-volume manufacturing. The unit'sRenewment Division remanufactures milling machines andmachining centers, principally of the company's ownmake
.
• Roberts Corporation
Roberts Corporation has two divisions. The IndustrialProducts Division in Michigan designs and buildsspecial automated systems that perform sand handling,iron pouring, mold and core making and other relatedfoundry operations. The Southern Division, inBirmingham, Alabama, designs and builds automatedcoal-handling systems for the power generatingindustry
.
4 . 2 MAJOR MARKETS AND PRODUCTS
Figure 4-2 presents the major market information for Cross& Trecker.
4-2

PRESIDENT
4-3
FIGURE
4-1.
CROSS
&
TRECKER
CORPORATE
ORGANIZATION

MARKET DATA
Major Markets: Automotive, aerospace, construction,appliance, farm machinery and foundryindustries
Percent of Sales to Automotive Industry: 50%
Major Automotive Customers: Ford, General Motors, Chrysler
Major Automotive Products: Metalcutting, assembly and testmachines for manufacturingcomponent parts and assemblies.
FIGURE 4-2. MARKET DATA FOR CROSS & TRECKER
Major Markets
Cross & Trecker's major markets include the automotive,aerospace, construction, appliance, farm machinery and foundryindustries. Figure 4-3 shows average sales by market over thelast five years.
• 22% AUTOMOTIVE• 7% TRUCKS• 6% DIESEL ENGINES
8% FOUNDRY2% POWER GENERATING
t• 10% MACHINERY• 9% AIRCRAFT AND AEROSPACE• 18% MISCELLANEOUS METALWORKING
• 8% FARM MACHINERY• 8% CONSTRUCTION AND
MINING MACHINERY• 2% OIL FIELD EQUIPMENT
FIGURE 4-3. SALES BY MARKET, FIVE YEAR AVERAGE
4-4

The Cross Company serves the markets involved in high-volumemetalworking— automotive trucks and diesel engines. The firmsells to 20 auto companies worldwide, and Ford, General Motorsand Caterpillar each accounted for more than 10 percent ofCross & Trecker revenues in fiscal 1979.
Both Cross and Kearney & Trecker sell to the med ium-volumemetalworking market—construction, farm and mining machineryand oil field equipment. The low-volume metalworkingindustries— aerospace, machinery and miscellaneous firms areserved by Kearney & Trecker. In larger industries such asautomotive and aerospace, Kearney & Trecker usually sells tosecond and third-tier suppliers and job shops that make toolingand parts for the major manufacturers. Job shops account for50 percent of Kearney & Trecker's sales. Roberts Corporationserves the foundry and power-generating industries withspecialized foundry equipment and automated coal-handlingsystems
.
4.2.1 Products
Cross & Trecker's machine tool products are manufactured bythe Cross Company and Kearney & Trecker. The RobertsCorporation produces equipment for the power-generating andfoundry industries.
Cross Products
Cross-Fraser and the two Cross plants overseas design andbuild transfer lines. The lines often reach several hundredfeet in length and are used by the transportation equipmentindustry to manufacture components for automobiles, trucks andtractors. Cross-Fraser also builds integrated manufacturingsystems that combine metalcutting, assembly and testingoperations. The systems are used to produce diesel engines,construction machinery, farm equipment and oil well drillingtools. Cross products are sold primarily by a direct salesforce
.
Kearney & Trecker Products
Kearney & Trecker's primary product line is standalonemachine tools. The company markets computer numericallycontrolled machining centers and milling machines, andmultiple-machine flexible manufacturing systems. Most ofKearney & Trecker's sales of numerically controlled machinetools consist of "Milwaukee-Matic" machining centers, whichperform a variety of machining ]obs in addition to milling.The flexible manufacturing systems are composed of standard CNCmachining centers and an automatic work transport system thatadvances parts on a demand basis. The systems operate undeu
’
4-5

direct numerical control, permitting them to produce a widevariety of parts that vary in size, shape and machiningrequirements
.
New Products and Sales
The Cross Company has recently announced a number of newproducts and sales to the automotive industry.
• Ford Motor Company has contracted with Cross-Fraser tosupply its Transmission and Chassis division with atransfer machining system to produce front-wheel-drivedifferential cases for the company's 1981 subcompactcars. The system is being described as a "first ofits kind" Decause it introduces automatic toolcompensation to spherical boring equipment. Thecompensation feature adjusts the size of the bore toallow for tool wear.
• Ford also selected Cross-Fraser to supply a metal-cutting system for the production of front covers forthe 3.8-liter V-6 engines due to be introduced in thefall of 1981. Although there is nothing unique aboutthe system being supplied, industry analysts consideredthe order significant because Cross won the contractover the Japanese supplier, Toshiba, who reportedlyunderbid Cross and other U.S. companies.
• Cummins Engine Company recently chose Cross-Fraser tobuild the cylinder block machining line for a newfamily of medium-duty truck diesel engines. The new10-liter engines are designed to be lightweight andfuel-efficient, and Cummins hopes that they willcapture an increasing share of the midrange truckmarket. The machining line will be installed inJamestown, New York, and will perform milling,drilling and boring operations on the blocks.
• In 1979, Cross announced the release of a new machinetool system, a 34-station nonsynchronous transfermachine for the assembly and testing of automobilemaster brake cylinders. Brake cylinder assembly is a
difficult process to automate, and Cross sees the600-pieces-per-hour production rate as a majoraccomplishment. The line's testing cycle takes onlyhalf the time that manual testing requires.
4-6

4 . 3 CORPORATE STRATEGY
Cross & Trecker's directors during the past year have beenhighly optimistic about the company's future. With a 17-monthbacklog and orders in the first half of 1980 outpacingdeliveries, they foresee a prolonged high level of orders. Acentral reason for their confidence is the major upheavaltaking place in the auto industry. Russell Hedden, the companypresident and chief executive officer, told a meeting ofsecurity analysts in May, 1980:
Automotive is our single biggest customer, buteven though the auto industry is havingwell-publicized troubles now, the outlook formachine tools has never been stronger. Bothgovernment mandates and the need to offer morefuel-efficient cars ensure that the autoindustry will be a substantial customer intothe future... General Motors has told us thatits needs along over the next four years couldabsorb the entire transfer line capacity ofour industry.
The company believes that it will outperform the machinetool industry as a whole because of the combination ofcapabilities brought together in the 1979 merger. By joiningCross' high-volume metalworking products with Kearney &
Trecker's low and medium-volume products, the merger hasenabled the firm to provide services to the entire spectrum ofmetalworking facilities.
In addition to increased coverage of the machine toolmarket, the merger holds out the possibility of technologycross-overs between the two firms. Kearney & Trecker is strongin the production of flexible machines, and Cress' strength isin the manufacture of h lgh-volume equipment. The company islooking toward a combination of these two capabilities to openup a relatively new market for flexible manufacturing systemscapable of medium to high volume production rates. The systemswould be transfer lines that incorporate flexible machiningcenters and thereby avoid the enormous costs to the auto andother industries of complete retooling for each new product.Cross estimates that there are 1,000 manufacturers in the U.S.who are potential customers for flexible systems. There arecurrently, by company estimates, only 22 systems in operation,and most of these are in medium-volume facilities.
There have recently been reports in trade journals that theplans for the integration of the two firms and an exchange oitechnology between them has not been proceeding as rapidly aswas hoped early in 1979. Two reasons are cited for the
4-7

apparent delay: the pending anti-trust suit filed against the1979 merger by the Justice Department and the very high backloglevel which is straining the company's resources to theexclusion of new projects. The directors are, however,committed to a $65 million, three-year expansion program thatis aimed at increasing capacity and accelerating new productdevelopment
.
4.4 PRODUCTION AND OPERATIONS
The Cross Company operates plants in Fraser, Michigan;Wendlingen/Neckar , Germany; and Merseyside, England. Kearney &
Trecker has facilities in Milwaukee, Wisconsin, and the twoRoberts Corporation plants are in Lansing, Michigan, andBirmingham, Alabama. Corporate headquarters are located inBloomfield Hills, Michigan.
4.4.1 Automotive Facilities
The Cross & Trecker plants that make significant shipmentsto the automotive industry are the four Cross Companyfactories. Together they employ approximately 1900 people andoccupy 360,000 square feet. The U.S. and English plants supplyU.S. automakers domestically and overseas while the Germanfacility sells primarily to foreign auto manufacturers.Details on the plants are given in Figures 4-4 through 4-7.
4.4.2 New Plants and Expansions
In late 1979, Cross & Trecker announced a three-year, $65million expansion program that involved all three of the firm'soperating units. The program is aimed at enlarging itsdomestic manufacturing operations and increasing the company'scombined worldwide annual sales capability to the $500 millionlevel
.
The expansion includes the construction of a
130,000-square-foot manufacturing facility for the CrossCompany in Port Huron, Michigan, that will be used for thedesign and manufacture of parts and components for the Fraserplant. (See Figure 4-8.) The plant is scheduled to beginoperations in March, 1981, and will eventually employ 500people. Together with a 20,000-square-foot addition to thecompany's headquarters office building, the Cross expansionproject will cost an estimated $21 million.
The three-year building program also calls for an83,500-square-foot plant to be built for Kearney & Trecker inGeorgetown, Kentucky, for machine tool component manufacturingand the acquisition and renovation of a 60,000-square-foot
4-8

SJ
CN
®M
c/3
cjo
a.
ooO'!
VIaa>“a<»
cLU
OZ
>»
cm0
ZU
I
•
j
>•H
5-*| QCD)
X \
P
O CD
CDI
W5-tj rd
E- ! U
|
;wcn
icn
cn!O
O's-UOU
t
->
u*W(A
5
</»tfl
«
ou
s~
(D
w(iJ,
PCl,
T3aCD
CCD
CD
-PP3OCn
Oc.O a- £
-3 «o2 ure ‘S3 2s sre mV) V)
coor-
UCD Ivo
cn pj(0 o
CO
</»
I/I
3}
oCJ
j2a.
4-9
FIGURE
4-4.
FRASER
PLANT
DATA

CN
-P14-1
OOOOCT>
©Nwcco
>*
C
3o
5-1
<L>
U<u
5-1
Fh
in
in
o5-1
U
win
o5-4
U
COa
5
oLO
w«O>£aELXJ
oZ
(0
£.2'«*w»0)
o»coO
cco
2 nM «
2 fs S(O ’£-a 2£ 3co co«> **C/3 C/3
• >4P «cn
co-pCrC•H>ou
T35-4
ro
COPtnC 'N
i H
04 U P1
H -H H>
IT) O
CO
0.
(/>
</>
a3
4-10
FIGURE
4-5.
COVINGTON
PLANT
DATA

CN
4-1
4-1
OOO
*
00m
«N
c/5
zre
zL
- QC3 rH3 ffl
O C0
J-i
<D
a0)
S-l
Eh
4
-
>
tc
c
5-
i
<D
4-)
c
;
cn
cn cn
cnl oOi Sh
5-41 Uu —
>»
5
ca
cre
re
co’5
rew0933CJ
>i(D
i-H
cn
oc
_re
a.
4->
4J
O
oa2 «6 2re
2 ft ,ore ^-3 £C -re re«« ««C/3 C/3
CMW
ocn ^(U onS-l iJ(X
>1<U
r-H
cn
soc«
CD
T3•Hcn Ts>i pCD
cn
s-i
a)
2
0r H
cHw
V)(Arew2"3<
4-11
FIGURE
4-6.
KNOWSLEY
PLANT
DATA

CM
-P4-1
OOOoCT\
Nc/5
cS3
—
Q
C
o
pCD
PCOCD
+J
fO
GP(D
P,4JEh ' C
l
M;
• Cfl
w i tn
m ! o0 !
PPiUu —
'
fs
oo
(0
c.2
m9)wQ>coo
cCD
tT>
C•Hi—
I
T3C0)*?
CO
a.
<d
PCpCD<<r
nJ
CP0PDM
1
cn
U)
opu
ooLD
(A930)>oTL£UJ
oZ
c<0
"oa2 «- 293 JrI fT3 «0“ o(O '£rs £s scs to
w 53
pid
PCoCD Pi
o
o
- sxG 3OJ aO'.
ca)
GC
T3 LJG(D
£
Crd
£P
;cu CD
CP o1/1
53
4-12
FIGURE
4-7.
WENDLINGEN
PLANT
DATA
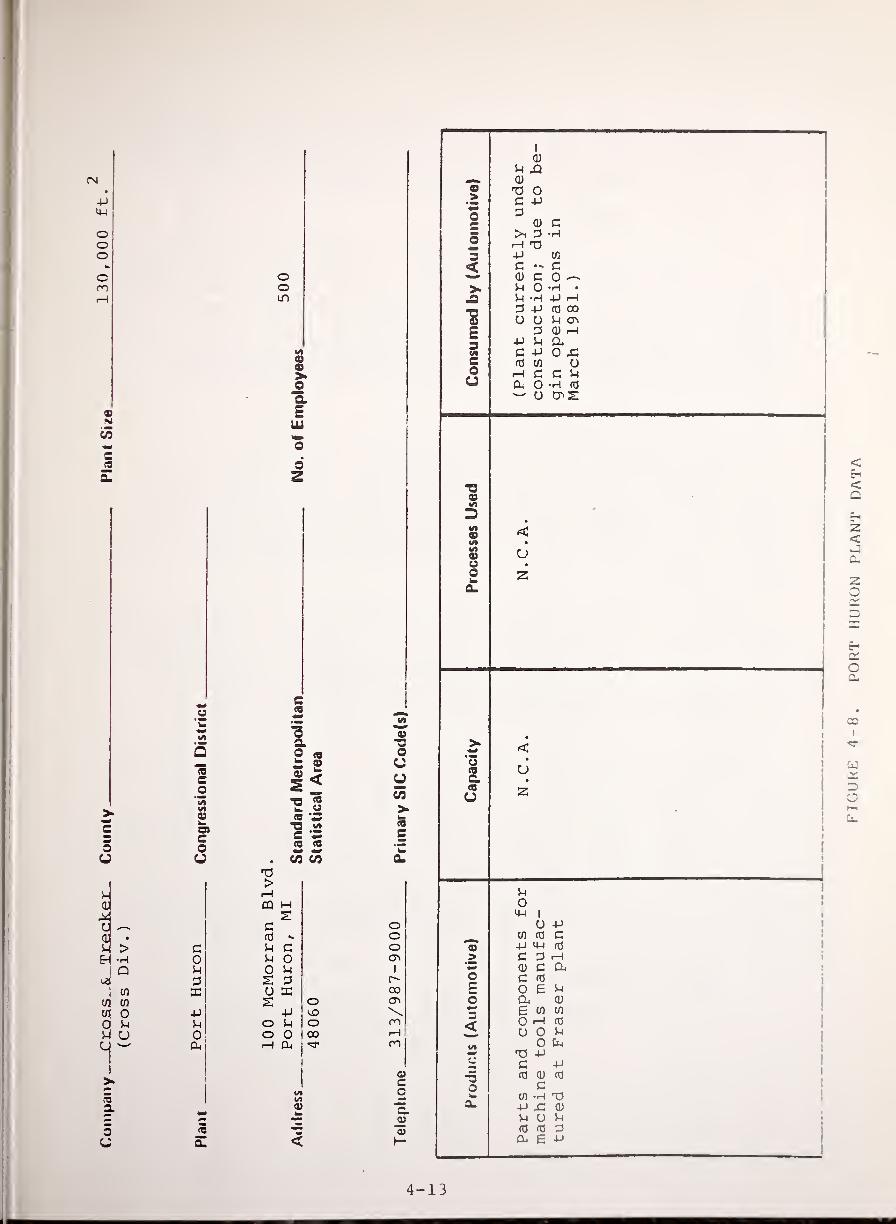
I
I
CM
9Nco
c9&
Ooin
99>oaEUi
o
a2
>c
3O
il
u<
Itn
cq tn
ggH uc
>5a
oc
5
co54
3E-P54
Oa,
_2a.
c9
^ 9!= O(0 wo .2c s9 9
. CO CO
'O>rH
CQ M
Cfd -
54 a5-4 oO 54
2 3O E2
44
O 54
O 0i—I 0-t
o<ooCO
I
i/i
l/t
9
<
4-13
FIGURE
4-8.
PORT
HURON
PLANT
DATA

building in Butler, Wisconsin, for the production of flexiblemachining systems. The Roberts Corporation will construct a
7,200 square-foot addition to one of its Birmingham plants to
fabricate and assemble coal-handling systems.
4.5 FINANCIAL STATUS
Cross and Kearney & Trecker merged in early 1979 when bothcompanies were in a strong financial position with high levelsof unfilled orders. The first-year performance of the mergedcompany has been strong, and the directors of the firm arehopeful of continued high levels of demands. A sizableexpansion program is aimed at increasing capacity to cut downthe backlog and permit the development of expanded productlines. (See Figures 4-9 and 4-10.)
4.5.1 Operating Analysis
Cross & Trecker had sales of $298 million in 1979, a 28percent increase over 1978. Profits surged 54 percent, from$17.1 million in 1978 to $26.4 million in 1979. The upwardearnings and sales trend continued in the first six months of1980 with revenues advancing 37 percent and net income rising62 percent. At March 31, 1980, the company's backlog ofunfilled orders was a record $530 million, up from $453 milliona year earlier.
Return on equity has improved substantially in the last twoyears and reached 22.4 percent in 1979. Combining the data ofthe two firms in the years prior to the merger, the operatingratio has risen steadily since 1976. The ratio of sales toassets has remained fairly constant since 1977, but marginshave improved as reflected in the rising percentages forearnings to total assets and earnings to sales.
Company spokesmen and industry analysts agree that the nextyear looks bright for Cross & Trecker with demand from the autoindustry for new transfer lines a major cause for optimism.Cross & Trecker president, Russell Hedden, predicted early in1980 that the company's profits would increase 20 to 25 percentin fiscal 1981 over 1980, and several months later, hesuggested that his prediction may have been too conservative.Investment analysts predict an earnings rise of 30 percent andcontinued strong performances in the following years as theexpansion program increases corporate capacity to sales of $500million annually.
4.5.2 Capital Analysis
At the time of the merger, both companies had large amountsof working capital at their disposal. This is reflected in the
4-14

. Sales*Year ($Millions)
Earnings
($Millions)
Return on
Equity, Percent
Operating Income*
SalesPercent
79 298 26.4 22.4 16.1
78 236 17.1 17 .
1
15.1
77 171 9.8 11.0 12.3
76 141 7.9 9.6 11.3
75 179 8.9 12.1 13.6
Earnings _ Sales Earnings „w T
- Percent —— PercentYear Total Assets Assets Sales
79 12.4 1.40 8.9
78 10.2 1.40 7.2
77 7.2 1.26 5.7
76 6.2 1.11 5.6
75 NA NA 5.0
‘Operating Income = Sales — Cost of Goods Sold — Selling, General and
Administrative Expenses, Before Depreciation, Interest, and Income Taxes.
Prior to 1979 , pro forma, combined data of Cross Co. and Keaine\ &
FIGURE 4-9. CROSS & TRECKEROPERATING ANALYSIS
4-15

I
Changes
in
Owners'
Changes
in
Equity
Other
Than
Year
Sales
P/E
Ratio
Earnings
Depreciation
Long-Term
Debt
Retained
Earnings
ro ro ro o• • • • Co o o 04 2
•'T M3 in in• • • • <C
ro O o rH 2
M3 o 03 o CDr~ M3 03 03 Orr ro 04 04 ro
1—
1
00 03 03
MO p' 03 CO04 r-H
in•
r- 1 1 i 1
00 M3 r—
1
rH 0303 ro r~ r-CM 04 r—
I
r-H i—
1
a
3
CO O' M3 inr-~- O' r-* r- r-
Qj54
ouu<U
O1)
54
E-*
>1<P
c5-)
fd
d)
«
Cfd
OU0)
wOuu44o
td
4-1
fd
•O
<u
c
oo
(d
e54
O
O5-1
a
03r~03
C-P
5-t
O•H54
CU
S -2h.w ra
<3°=
Q.CDo
CNJ
-Q
OEu_as
h-
o
“Ocas;o’>
a
CD Z,*5
CD
CJ asQ.X
CDas
>
aso> ro rH ^r in oCDuas 03 in 03 ro 03oCJ
ro CM r-H rH
o m• •
CM CM< c <c2 2 2
ro ro• * ^ cl* ^
2 2 2
t—I lD i—I i—
I
• # • •
n u) vo is
03 -sr mco 04
CM M)
03<2
.c
CD
*Q-
asCD
CJ 00 M3 M3CJ> • • •
cCD
CJ) m CNJ 03-CCJ
lx
o5
i
—
l i—
1
03
<2
<2
C2
MO
<2
00 r" MO LT)
r> r-~ r~~
wCo
E
09wca
CD
"oa cnj co
4-16
Average
for
the
Year
Capitalization
Defined
as
Total
Liabilities
-
Current
Liabilities
Operating
Profit/Interest
FIGURE
4-10.
CROSS
&
TRECKER
CAPITAL
ANALYSIS

recent declines in long-term debt and the minimal changes inowners' equity other than retained earnings. The firm'scoverage ratio has risen steadily over the last five years,reaching 39.3 in 1979. The percentage of long-term debt tocapitalization declined to 3.1 and the current ratio stood at2.0 at the end of the last fiscal year.
The company has announced a three-year, $65-millionexpansion program to increase the firm's worldwide productioncapacity. Financing will come from both internal and externalsources, according to company announcements. Given the firm'scurrent strong cash position, its 17-month order backlog andthe expectation of continued demand for its products, thereshould not be any difficulty in funding the building program.
4.6 GOVERNMENT RELATIONS
The only serious cloud on Cross & Trecker's horizon is a
pending antitrust suit filed against the company by the U.S.Justice Department in September, 1979. The suit challenges the1979 merger on the grounds that it violates antitrust laws andrequests that the company divest itself of either Cross orKearney & Trecker. The company does not believe that it is inviolation of antitrust statutes and has announced that it will"vigorously resist the government's attempt to undo" themerger. Industry trade journals, however, have reported thatthe spectre of the suit has interfered to some extent with a
full integration of the two companies and slowed down plans fordeveloping new, joint products.
4-17/4-18


5. GIDDINGS & LEWIS
Giddings & Lewis is a leading manufacturer of conventionaland numerically controlled machine tools, as well as a varietyof industrial products. Its machine tool line includesmachining centers, turning centers, milling machines, assemblymachines and electronic controls. The firm's primaryindustrial products are industrial brushes, grinding wheels,pressure cylinders and printed circuit boards. In the lastfive years, the company has made a series of acquisitions toexpand the size of its industrial products in an effort tocounteract the cyclicality of the machine tool market. Whileallowing for a possible dip in orders toward yearend, thecompany expects 1980 to be another year of record sales andearnings and sees strong growth potential through 1985.
5.1 CORPORATE SIZE AND STRUCTURE
Giddings & Lewis was founded in 1859 and currently ranksfourth in revenues and third in profits among U.S. machine toolmanufacturers. Following an aggressive policy ofdiversification in the last five years, the company hasacquired five firms that serve markets other than machinetools. The latest acquisition, in early 1980, was Margo, Inc.,a manufacturer of gas and chemical containers.
5.1.1 Revenue, Profit and Employment Statistics
In 1979, Giddings & Lewis had sales of $258 million, a JOpercent rise from 1978 sales of $199 million. Profits rose 59
percent from $18.2 million in 1978 to $28.9 million in 1979.Foreign business accounted for 11 percent of total sales in
1979. The company employs 4,100 people, 2,550 of whom areproduction employees. (See Table 5-1.)
TABLE 5-1. GIDDINGS & LEWIS REVENUES,PROFIT AND EMPLOYMENT
Revenues (millions) Profits (millions)
1979 $258 1979 $28.9
1978 199 1978 18.2
Total Number of Employees: 4,100
5-1

5.1.2 Corporate Organization
Giddings & Lewis is organized in two operating groups--Machine Tools and Industrial Products. The Machine Tools Grouphas five divisions and one subsidiary, and the IndustrialProducts Group is made up of one division and foursubsidiaries. The Machine Tool Group includes the followingunits:
@ Giddings & Lewis Machine Tool Company manufacturescomputer numerically controlled machining and turningcenters
.
® Davis Tool Company makes tooling for machines, andother machining accessories.
® Giddings & Lewis-Bickford Machine Company buildsmachining centers, drilling machines, finishers andgrinders
.
® Giddings & Lewis-Fraser Ltd, is located in Scotlandand manufactures boring, drilling and milling machines
® Giddings & Lewis Foundries makes iron castings, a
variety of iron products and provides pattern makingservices
.
® Gilman Engineering & Manufacturing Company makesautomatic assembly and manufacturing systems,balancing machines and vertical lathes.
The Industrial Products Group consists of the followingdivisions and subsidiaries:
© Giddings & Lewis Electronics Company builds computernumerical control systems and other electronicequipment
.
® The Osborn Manufacturing Company makes industrialbrushes, foundry molding machinery and grinding wheels
® Jackson Buff Corporation manufactures buffing andpolishing wheels, buffing compounds and abrasive belts
5-2

PRESIDENT
5-3
FIGURE
5-1.
GIDDINGS
&
LEWIS
CORPORATE
ORGANIZATION

6 Pressed Steel Tank Co . makes containers for gases,liquids and solids.
• Basic Electronics Mfg. Corp . manufactures printedcircuit boards.
The two Machine Tools and Industrial products groups wereformed in 1979 to strengthen company management. Frank J.Austin, Executive Vice President was made Chief OperatingOfficer and two executives were named Group Vice Presidents,Frank W. Jones for Machine Tools and Robert G. Chamberlain forIndustrial Products.
5 . 2 MAJOR MARKETS AND PRODUCTS
Figure 5-2 presents the major market information forGiddings & Lewis.
MARKET DATA
Major Markets: Automotive, aerospace, construction, machinetools and bearings industries.
Percent of Sales to Auto Industry: 25 to 30 Percent
Supplies to:
Major Automotive Products: Transfer lines, machiningcenters, turning centers,automatic assembly systems
FIGURE 5-2. GIDDINGS & LEWISMARKET DATA
Table 5-2 shows a breakdown of the company's 1979 net neworders for domestic machine tools, by industry. The automanufacturers are listed as accounting for 17 percent, butsizable portions of the orders grouped under internalcombustion engines, machine tools, and ball and roller bearingsare also sales to the auto industry. Taking the differentsegments together, the automakers account for 25 to 30 percentof the firm's total sales.
5-4

TABLE 5-2. 1979 NET NEW ORDERS BY INDUSTRYDOMESTIC MACHINE TOOLS ONLY
Fabricated Metal Products 7%Internal Combustion Engines 4
Farm Machinery 4
Construction Machinery 10Machine Tools 6
Ball & Roller BearingsOther Non-Electrical
7
Machinery 23Automotive 17Aircraft, Engines & Parts 13Other Transportation 3
All Other 6
100
5.2.1 Products
Giddings & Lewis' major product lines are machine tools,industrial brushes and steel cylinders, and each of theseproduct classes accounted for more than 10 percent of annualsales during the years 1975 to 1979. (See Table 5-3.) Therest of the firm's revenues come from sales of foundryequipment, grinding wheels, electronic controls, printedcircuit boards and a variety of other industrial products.
TABLE 5-3. FIVE-YEARBREAKDOWN OF SALES OFMAJOR PRODUCT LINES
1975 1976 1977 1978 1979
Machine Tools 85% 52% 62% 68% 68%
Industrial Brushes NA 16 14 12 10
Steel Cylinders NA 17 13 10 10
Machine Tools
The major types of machine tools produced by the companyare vertical machining centers, horizontal machining centers,computer controlled horizontal and vertical turning centers anaautomatic assembly machine systems used extensively by theautomobile industry. The company is putting increasing

emphasis on building manufacturing systems that combinecomputer controlled machining centers, special processmachines, inspection, assembly and testing, material handlingand computer assistance into the integrated manufacturing ofpalletized discrete parts. These systems, sold under the brandname Numer ima t ion , are designed for use in plants where volumeis below that of mass production industries. They provide theflexibility to either produce quantities too small for fullyautomated transfer lines or produce random workpieces in a
family of parts.
Automotive Orders
Giddings & Lewis is also developing new transfer lines tomeet the specific requirements of their large customers,particularly the auto manufacturers. One of the company'slatest projects has been the production of a 50-machineintegrated manufacturing and assembly system for the Moskvichauto plant in the U.S.S.R. The system, built by the firm'sGilman Engineering and Manufacturing Company, automaticallyconverts raw castings and hot-rolled bar stock into finished,ready- to- install flywheel/ring gear assemblies at a rate of 214an hour. Gilman combined the machinery of eleven differentsuppliers to build the sophisticated system.
In the third quarter of 1979, the company received twolarge orders for assembly equipment from auto manufacturers.The Gilman Engineering and Manufacturing Company received a
contract from a Swedish auto company for more than $7 millionto manufacture equipment to build automotive bodies. GeneralMotors placed an order for $5 million for automatic assemblymachines to assemble spindles and bearings for front and rearautomobile wheels.
5.3 CORPORATE STRATEGY
Giddings & Lewis is placing a heavy emphasis ondiversifying its product lines through the expansion of itsIndustrial Products Group. Since the recession of 1975, thecompany has pursued an aggressive acquisition program,purchasing five companies in five years. The firm hopes thatthe diversification will help to counteract the cyclicality ofthe machine tool iaustry and is working toward a product mix inwhich sales of industrial products will contribute 50 percentof total revenues. In 1979, the industrial product linesaccounted for about a quarter of total sales.
The firm is optimistic about the future performance of itsbroad line of machine tool products.
5-6

The company approaches its major machine tool customers asa firm that can provide a complete range of services forproduction machinery. Vice president, marketing, MichaelLindgren explained: "We think that one of our main sellingpoints is that we can offer single source responsibility. Wecan offer controls, loading devices--a complete package. Youcould call it sort of a turnkey operation."
Company forecasts for 1980, based on current order backlogs,project sales for the year at $310 million, with machine toolsaccounting for $200 million. Confidence about future years isbased on the expectations of continued strong demand from theautomotive and aerospace markets and on the general concern withimproving manufacturing productivity in domestic industries.
In the short term, there are several factors that may holdthe company back to a moderate degree. Company presidentGeorge Becker told a meeting of stock analysts in mid-1980 thatthe rate of profit growth may be slowed somewhat by:
• the effect of wage and price guidelines on the firm'sability to raise prices,
• competition from Japanese horizontal boring machines,
• the expenses of attending a major trade show and thecost of establishing a new company apprenticeshipprogram.
The company is quick to point out, however, that theseobstacles are largely temporary and do not alter the company'sprojections of strong growth in the next five years.
The company is in the process of reorganizing its machinetool sales effort in several parts of the country afterdropping Motch & Merryweather as its primary machine tooldistributor. The decision to begin distributing its productsdirectly was made after Motch was purchased by the Swiss firm,Oerlikon-Buhrle Holding, which manufactures several productsthat compete with Giddings & Lewis machine tools. As part ofits reorganization plan, it recently purchased its Indianapolisdistributor, Marshall & Huschart Machinery Co. of Indiana. Thesubsidiary will continue to function as the distributor ofseveral companies' products.
5.4 PRODUCTION AND OPERATIONS
Giddings & Lewis operates 14 plants in 11 locations,including two overseas. Five of the facilities makesignificant shipments to the auto industry. (See Figures 5-3,5-4 and 5-5.) Those five plants are:
• Two plants of the Giddings & Lewis Machine ToolCompany in Fond du Lac, Wisconsin
5-7

• One plant of the Giddings & Lewis-Bickford MachineCompany, Kaukauna, Wisconsin
• Two plants of the Gilman Engineering and ManufacturingCompany, Janesville, Wisconsin.
In 1979, the company spent $10 million on improvements toits plant and equipment. Major projects now under way are the
' construction of a new computer center, a new and expandedengineering facility for Giddings & Lewis Electronics Divisionand the installation of modernized production equipment,particularly at Giddings & Lewis-Fraser in Scotland.
Projected capital expenditures in 1980 to carry out theseprograms are $15 million. The company has recently approvedexpansion of facilities at Gilman Engineering in Janesville,Wisconsin and at Giddings & Lewis-Bickford in Kaukauna,Wisconsin. Plans have also been made to construct a new salesoffice in Manchester, England.
5.5 FINANCIAL STATUS
Giddings & Lewis will have another record year of sales andearnings in 1980 despite some lowering of profit margins.Projected capital expenditures for the year should not requireoutside financing. (See Figures 5-6 and 5-7.)
5.5.1 Operating Analysis
Giddings & Lewis’ sales and earnings have risen steadilyfrom 1975 to 1979 with the exception of 1976 when the companyfelt the effects of the general recession and a long strike atseveral of its facilities. In 1979, the company had sales of$258 million, a 30 percent rise from 1978 sales of $199million. Profits increased 59 percent, from $18.2 million in1978 to $28.9 million in 1979. Return on equity has shown a
sharp upward trend, tripling between 1975 and 1979 when itreached 32.4 percent.
Excluding 1976 again, the operating ratio, the ratio ofearnings to assets and the ratio of earnings to sales have allrisen each of the last five years. Given that the ratio ofsales to assets has risen only moderately while the ratio ofearnings to sales has doubled between 1977 and 1979, it wouldappear that margins have been steadily improving. Pressure onmargins is likely to increase in 1980, however, as the cost oflabor, material and energy go up while the company holds itsquotations within government price guidelines.
5-8

Profits are expected to grow despite lower margins becauseshipments are still increasing rapidly. The March, 1980,backlog stood at a record 5240 million, at least nine monthswork ahead. In the first quarter of 1980, income improved 40percent, year to year, on a 47.5 percent rise in sales.Revenues for the full year are expected to increase 20 percentwith the newly acquired Margo Inc. contributing an added 520million to annual sales.
5.5.2 Capital Analysis
The company’s long-term debt rose by 515 million in 1975and has decreased by 52.5 million since then. Owners' equity,other than retained earnings, has increased slightly during thesame five-year period. Dividend payments have climbed since1976 and rose sharply from 5.56 million in 1978 to 5.93 millionin 1979. The firm's long-term debt as a percentage ofcapitalization has declined from over 31 percent in 1976 to19.4 percent in 1979. The coverage ratio has increasedsteadily since 1976, reaching 24 in 1979, and the current ratiohas declined annually over the same period.
Capital expenditures have shown an upward trend, reachingmore than 510 million in 1978 and 1979. As a percentage oftotal assets, capital expenditures reached 8.6 percent in 1978and declined to 6.8 percent in 1979 at roughly the same levelof investment, reflecting the company's increased assets. Thefirm's estimated 515 million in capital expenditures for 1980should not require outside financing.
5.6 RESEARCH AND DEVELOPMENT
The company has 354 employees in its engineeringdepartments engaged wholly or partly in company-sponsoredresearch and product development. In 1979, Giddings & Lewisspent 59.1 million on research, product development andengineering, up from 57.7 million for the same activities in1978 .
During 1980 labor contracts will be negotiated at GilmanEngineering and Manufacturing Corporation. The OsbornManufacturing Corporation, the Menominee Foundry, Giddings &
Lewis Bickford Machine Co. and Giddings & Lewis Fraser Ltd. In1979, the only labor contract negotiated was a three-yearagreement with hourly rated employees at the Madison Foundry.
5-9

CO CO
<d aj
G0 0 '|
(0 (0 • I
r0|(Ti CTi 0|
• ® Goc r-H ex1—
1
•—
1
'—
•
'—
"
LOi
—
i
-p +j inM-l ip w
• •i—
i
tr c• • CO" co
CO
+J °l oc o' oto o o
r—
1
•«, (Am(X o w
05
5T >•OJ co 0 1
i
503 cN
LLi
<»=*» O
3 6a. 2
I
I
I
I
I
>>
s3c
(/)
525i/)
VIVWdOJc
a
cce
*D re
w ure C5a «
re re
W 05
* SSr ->
o05
>re
EVv«
u.
co
H H !
•
>CD
2i
. N Oja 4-> u o!<0 C/5 <0 i
x (Til
COi
1
cr> co -P 3 : r-jl
C T3 0 ’Xjro
OJi-H C
icn
T3 T3 \T3 G OJ £ •
CTi"T:
0 •'3' 0 i—IjO X
.
LO^1
>.
i
i
i
2SI C/5
—2 t/5
05
z -Z ST3 —
•
Q/w c. < H-
FIGURE
5-3.
FOND
du
LAC
PLANT
DATA

I
-—r0
M 0• S-i
U CO Cu4-1 a)
V£>
o 0 "T
o <C5
o '—
'
o • CNco m oCSJ ID
Maa>ca
a eN LUc/5
a -
aC. 2
#Cj
cfl
</»
</)
*2_03
a wQ o ro o"5
e0‘3
w•tf
0)
s*n
05w<
co35
>
~
k 2 »-® CO
a> T3c =
><3
E0 o re C3 wu a C/3 C/3 CL
•
CO CD
•H >£ • cQJ >
•H t3 m i—
1
Q G s co<43 fO M3
'C r—
1
CO (C .g fl 1
C71 0 c CP G M3
C 4-1 3 -H 3 M3•H «t3 33 <3 o r-
T3 o >C CO \T3 *H 3 O 3 —
1
-=r
•H CQ <d CM fd i
—
c —
'
00 ^ ID
>bac
£ Wl c(Q </)
Q » ow q.a 03
0CJ
s
a.a<
Vh-
5-11
FIGURE
5-4.
KAUKAUNA
PLANT
DATA

U1
QJ.cnu QJ
cn rj
-P4-1
cn
-P oG o03 O(—1 **
Qj r-
CM rH
Gurti
CM
00
p44
OooCMID
c/5
<=s
c©
~ >'=
5 Q
c
cn
•H
QJ
<^s
cn
tj)
c•HT3!
T3 "HHI Coh-
©c.
oO'
U0)
<U
c•HCPCWC<c
e
©c.2IA(/»
«k.encoCJ
<u
>cn
0)
c 1
03!
t~3!
IT)
(A©©>_o
aELU
oZ
c©
oa2 m
a> J?2 <"2 8© *3a ^c —© ©
pQG03
>QJ
r—
I
QJ
QQJ
• >[2 cn u~i
Qjirriri G uno ojlcoco Oicn
mVw
<
5-12
FIGURE
5-5.
JANESVILLE
PLANT
DATA

Sales Earnings
Year (SMillions) ($Millions)
Return on
Equity, Percent
Operating Income*
SalesPercent
79 258 28.9 32.4 22.4
78 199 18.2 26.7 19.4
77 150 8 .
2
13.7 13.9
76 97 2.8 5.5 8.9
75 122 5.1 10.5 10.7
Earnings _ SalesPercent
Year Total Assets Assets
Earnings
SalesPercent
79 19.0 1.70 11.2
78 14.7 1.62 9.1
77 8.1 1.47 5.5
76 3.1 1.07 2.9
75 5.8 1.38 4 .
2
’Operating Income = Sales - Cost of Goods Sold - Selling, General and
Administrative Expenses, Before Depreciation, Interest, and Income Taxes.
FIGURE 5-6. GIDDINGS & LEWIS OPERATIONAL ANALYSIS
5-13

I
Changes
in
Owners’
Changes
in
Equity
Other
Than
Year
Sales
P/E
Ratio
^
Earnings
Depreciation
Long-Term
Debt
Retained
Earnings
CN CTV xT xT vo
1 \ o O O o
XT ro uo r-
O rH r-H o nrH
O CO r- CO inin o VO 00 in
in xT m CN CN
a\ CN CN 00 rH• • • • •
00 CO 00 CN inCN r-H
VO *3* o CN VO
ro ro m O rorH
CO CTi o O' CNLO CTi in CTv CNCN rH rH rH
G\ 00 r- VO mr- r-~ r- r- r-
tr OV CN 00 rH i—
i
09 • • • • •
w3O
CD
QCCN ro CO in
a.x
Q.CDCJ>
CO09 o 00 CTi VO3>CD
• • • •
u.09>oo
24 15 r» XT
09
OEw09
09co
CLCDo
CD ^Q.CDO
C CL•— CD09 OCCO c-c 12O W
o
00 VO in rH XT
VO 00 in CN 00
XT in CN r-H av
CTi O i—
1 or-H CN ro ro ro
c09
1557 70 * * *
"> • • < < <b XT CN 2 2 2
^ ^O O LO rH
oo h inr- r- r- r- r-
CD09>
09wCD
oI
JCCD
CD
oh-COCD <o
09~o Sr09 09
= =a.' —a -
£ =
ints» CL
<uxT i—
1
XT 00 09 o <=*fc= CD 093
0909
(St C 1—
1
00 00 XT vo rH 09 — XIrH rH =«=» CD CD
ciJ
CD 09> CL 09Q.
rH
"o < o o •HfOa CNJ ro
<-p
o2*
5-14
FIGURE
5-7.
GIDDINGS
&
LEWIS
CAPITAL
ANALYSIS

6 . F . JOS . LAMB
The F. Jos. Lamb Company is a major manufacturer oftransfer lines and other dedicated machining systems, includingmetalcutting machines, in-process storage units, parts handlingautomation, inspection gaging, assembly and testing equipment.The auto industry is by far the company's largest market.Since the 65-year-old firm is privately held, it does not issueannual reports and releases only general information on itsfinancial performance and operations.
6.1 CORPORATE SIZE AND STRUCTURE
Lamb ranks among the top ten U.S. machine tool builders andis one of the machine tool companies that is most dependent onthe auto industry for sales. The company is divided into twooperating units: the Machine Tools Group and the SystemsProducts Division.
6.1.1 Revenues, Profit and Employment Statistics
According to a Lamb Company representative, the firm'ssales in 1979 were in excess of $200 million. Sales in 1978were slightly below that level. The company does not releaseearnings statistics. Total employment at the firm isapproximately 1,400 people.
6.1.2 Corporate Organization
The company's Machine Tools Group manufactures transferlines, machining centers and standard machine tools. It is notorganizationally subdivided. The Systems Products Division isprimarily engaged in producing automated systems to complementthe products manufactured by the Machine Tools Group. (SeeFigure 6-1.) The Systems Products Division is divided into thefollowing units:
• Fab-Tek Group manufactures automation equipment forthe machining of small parts (up to 25 pounds).
• Machine Tool Automation Group produces automationequipment for larger machine tools.
• Palastor Group provides specialized automationequipment for transfer lines and integrated machiningsystems
.
6-1

F .FIGURE 6-1 JOS. LA? IB CORPORATE ORGANIZATION

• Ransohof Division produces industrial and automotivemanufacturing washing and cleaning equipment.
• Cycloidal Drive Group manufactures a patented drivesystem for transfer lines.
6 . 2 MAJOR MARKETS AND PRODUCTS
Figure 6-2 presents the major market information for Lamb.
MARKET DATA
Major Markets: Automotive and heavy machinery industries
Percent of Sales to Auto Industry: 85 percent
Supplies to: General Motors, Chrysler
Major Products: Transfer lines and other dedicated machiningsystems, machining centers, standard machinetools and automation equipment
FIGURE 6-2. F. JOS. LAMB MARKET DATA
6.2.1 Major Markets
The auto companies account for approximately 85 percent ofLamb's sales, and major customers include General Motors,Chrysler and other U.S. vehicle manuf acturer s . Lamb'sremaining sales are primarily to heavy equipmentmanufacturers. The company also sells its products in Europe,Japan, Australia and New Zealand.
In marketing to the automakers. Lamb relies heavily on itslong-standing close relationship with the auto industry and ona reputation for engineering excellence. It has acted to keeppace with the new tooling demands of Detroit's redesign effortsand has placed a special emphasis on custom work to buildtransfer lines and dedicated machining systems for particularcustomer production requirements. One of the firm'sadvertising slogans is "Total Responsibility", referring toLamb's ability to deliver turnkey manufacturing systems. Thecompany handles the tooling projects from the design andproduction phases through to installation and the training ofoperation and maintenance personnel.
6-3

6.2.2 P roducts
Lamb's primary products are transfer lines and otherdedicated machining systems, machining centers, standardmachine tools and automation equipment for transfer lines andother machining equipment. A large percentage of the company'sproducts are custom designed for individual manufacturers.
The company's "state-of-the-art" product is a high-volume,turnkey machining line that is able to take a raw casting of acomponent, such as a cylinder head or cylinder block, and turnout a completely machined component at the end of the line.The system typically includes a transfer line; automationcomponents; cleaning, washing and filtration equipment; gagingmechanisms; and computers and industrial robots as required.
6.2.3 Recent Orders
The Lamb Company has recently been awarded six contracts byautomobile manufacturers for transfer and machining lines.Five of the orders have come from divisions of General Motorsand one from Chrysler.
• The Detroit Diesel Allison division of General Motorsordered 11 transfer machines for its new Romulus,Michigan, plant to machine cylinder heads for a newline of 8.2 liter diesel engines.
• The Chevrolet Motor division of General Motors hascontracted an automatic transfer- type machining systemfor cylinder blocks and heads to be used in theproduction of 1.8-liter, four-cylinder gasolineengines. The division expects to take delivery of theline in the summer or early fall of 1981.
General Motors awarded Lamb a contract for a machiningline to produce V-6 engines at a plant being builtnear Saltilio, Mexico. The Lamb line will produce theheads for the engines, which will be virtuallyidentical to the 2. 8-liter gasoline engines introducedfor GM ' s new front-drive X-body cars.
General Motors ofcutting transfer 1
factory to producewheel-drive transmexpected to enterWindsor plant.
Canada recentlyine from Lamb'sthe aluminum ca
issions. The trproduction in 19
rde red a metal-ind sor , Ontar io
,
es for front-nsm issi ons are2 a t GM ' s expanded
6-4

• The Chevrolet Motor Division of GM awarded a contractto Lamb early in 1980 for equipment to be used in a
machining system for steering knuckles. The order,according to trade publications, is part of a
$40- to-$50-million , major retooling effort at GM thatwill completely transform the design of its biggestmodels
.
• Lamb provided Chrysler with the machining equipmentfor one-piece, die-cast aluminum transaxle cases thatare scheduled to be used on the company's new line ofcompact-size Plymouth Reliant and Dodge Aries cars.
6.3 PRODUCTION AND OPERATIONS
Lamb has five facilities that manufactureand other products used by the auto industry,in Warren, Michigan; Windsor, Ontario; Indianaand Hamilton, Ohio. Details on the plants are6-3 to 6- 7
.
Lamb reports it has been expanding and updoperations for some time and will continue tothe market remains strong. However, no new piin the near future.
t ransf er linesThey are locatedpolis
,
Indiana
;
given in Figures
at ing its majordo so as long asants a re planned

<\2
©N
c/5
cCO
>£So
oujQ
jjji
W!
til
ra
C.
3c
u»
515c_o«</>
0)
oo
c0)
1-1
uc
d
2
oin
sffl>oaem9
9
eCO
o9.
2 «- £
2 f2 SCO S"D .2
' « flT3^ 05 CO
d)
rH rH•H OS
£ oCO
CD ^C
GQJ
S-l
Hso cd
in s
Wcnso
jo
a.
</>1/7
35-»
6-6
FIGURE
6-3.
WARREN
PLANT
DATA

6-7
3 o
FIGURE
6-4.
WINDSOR
PLANT
DATA

<\2
an
c/5
Cja
a.
LD00
0)>oaEUJ
6Z
w2
IA<a=s>
1/) o J)a w5 O to o
15<*»
o
2 « ao
</> o ™ CO
><SrS
c
V)
£CD •
£ oa *S*3
>w3(*
53
Co
0)
>S *=>
3 3«y a < CO CO a.
T3• C 20 n3 Hu
i—
l
(U -x:
If) 13 cn c—t. •H fX3 *r-
(
<rftf r—
1
fa fa CN1-3 0 CO O a
a Cu l
*
fO • rti CNU) c 2 C U"0 cd as o'
•H O -H i—IN*
T3 ID Td cn r-• C fa C 00 r-
P-H H rH M o'
5* ac
£ 1
/
o2 IS
£=> w <x
*» 5 S’c 3 £3 aC a. < f—
<E-i
<QE-i
2<gCOI—
(
fa
g<2<t-t
Q2
IDI.
KD
wa22Mfa
i
6-8

03
X03
©> i
03
><-P
02
©NcJ5
•mm
c_re
a.
>
©•aouoCO
>
>XI
g
cou
•3©W)
D©</>
</I
©uo•n
a.
1©o
<u2
<U2
<U2
i
I
3o
SBccCJ
o 2c sre re
CO CO
re
E
£i
i
i
i
Tj• 03
0 •
u > 03
•H pH
X!eQ *H
2or» ©
03 IW M o CnX M-i ac s rH -P c
0 io C -H
* X • % CO £ 03 GCO 0 c W G co o e -h
0 w 03 03 1—
1
ID 3 axc P OC P Oc \ •H o03 P CM P O CO a o3
* cc 03 03 00 rH a £\ S 00 £ 'T ro 03 03
o nH 03 CD
^ 03 © -S 03 a x 03
o o •H C 0) Ore i
t/i w p •H rH •HS-xi ©
03 rH Qj >03 3 © -P 3 E p
-w X re“
03 03 03 0 a)
c < h* £ X CJ 03
>
i
!
i
6-9
FIGURE
6-6.
WARREN
(FAB-TEK)
PLANT
DATA

<\z
0)Nwc©
>»
c
wO
oCJ
XJerd
^1
>*HQ4-4
M-l
.
O• XI
cn OO w1-3 C
(d
• (X
[X \o
>QJZb~*
2 '
s-xj= rd
<3^
oCM
s©>oc.
EUJ
oZ
</»
Q73c.2
©k=05
5o
c©
ca2 *°
- 2
S f—j ©Z. .«© ^3 *C -ra ©V) V)
co-PI—
I
•Herd
dd
4->
CO
x:4-1
XI*HIX
x:4
-
1
5-
1
Oz
ddo
co4->
om
J5a.
i/>
(/I
©w2<
i
CD
wOSDUM&4
6-10

7 . MOTCH & MERRYWEATHER
Motch & Merryweather is a machine tool builder and thelargest distributor of machine tools in the U.S. In early1979, after operating for 75 years under the control of theMotch family, the company was purchased bv Oerlikon-BuhrleHolding AG of Switzerland. The firm manufactures chuckingand griding machines, transfer lines and abrasives for grinding.It also distributes a broad range of machine tools produced byother manufacturers. The auto industry is one of the company'slargest markets.
7.1 CORPORATE SIZE AND STRUCTURE
Among U.S. machine tool manufacturers, Motch & Merryweatherranks seventh in revenues and ninth in income. Approximatelyhalf of the firm's sales are derived from distribution of othercompanies' products. Foreign customers accounted for 13percent of total sales in 1978.
7.1.1 Revenue, Profit and Employment Statistics
In 1978, the company had sales of $116 million, a 26percent increase over the $92 million in sales in 1977.Profits rose 33 percent, from $3.2 million in 1977 to $4.2million in 1978. The firm employs 1500 people, 200 of themoverseas. (See Table 7-1.)
i
4
I
TABLE 7-1. MOTCH & MERRYWEATHERREVENUE, PROFIT AND EMPLOYMENT STATISTICS
Revenues (millions) Profits (millions)
1978 $116 $4.21977 92 3.2
Total Number of Employees: 1,500
7-1

7.1.2 Corporate Organization
Motch & Merryweather is made up of four manufacturingdivisions, one manufacturing subsidiary and a distributiondivision. (See Figure 7-1.) They are described below.
9 Motch Manufacturing Division , based in Euclid, Ohio,makes conventional and numerically controlled verticalchucking machines, milling machines, transfer linesand special purpose machines.
• Cone-Blanchard Machine Company , a whol ly-ownedsubsidiary, produces chucking and grinding machines ata plant in Windsor, Vermont. The company has a secondplant in Aldridge, England.
• Blanchard Abrasives Division , Cambridge,Massachusetts, manufactures cylindrical wheels andabrasive segments used on Blanchard grinders.
• Motch Cutting Products Division , Euclid, Ohio,produces high-speed steel and carbide- tipped circularsaw blades.
• Jetstream Systems Company , Hayward, California, buildssystems for transporting and processing materialsusing jets of air or fluid.
• Distributor Division , sells and services machine toolsmanufactured by Motch and by other companies. Itmaintains seven district sales offices, staffed byover 100 sales personnel.
7.2 MAJOR MARKETS AND PRODUCTS
Figure 7-2 presents the major market information for Motch& Merryweather.
7-2

FIGURE 7-1. MOTCH & MERRYWEATHERCORPORATE ORGANIZATION
MARKET DATA
Major Markets: Automotive, aerospace, agriculturalmachinery, metalworking and power industries.
Percent of Sales to the Automotive Industry: 30
Automotive Customers: General Motors and others
Ma]or Automotive Products: Chucking, grinding and millingmachines; transfer lines.
FIGURE 7-2. MARKET DATA FORMOTCH & MERRYWEATHER
I
7-3

7.2.1
Major Markets
Motch & Merryweather 1 s major markets are the automotive,aerospace, agricultural machinery, metalworking and powerindustries. The automobile manufacturers account forapproximately 30 percent of the company's total sales. Salesto General Motors are about half of all sales to the autoindustry
.
7.2.2
Products
Each manufacturing division of the company produces andmarkets a separate product line. The Motch ManufacturingDivision makes two families of chucking machines: verticalautomatic chuckers, operated by either conventional orprogrammable controls, and vertical numerically controlledchuckers. The machines are frequently combined in multipleunit automatic transfer lines to produce complete parts for theautomotive, farm machinery and other medium or high-volume
division also builds special manufacturingcustom designed and incorporate Motch machinethose of other companies. The systems areindustry and other manufacturers to machine
industries. Thesystems that aretools along withused by the autoand assemble components and subassembl ie:
The Cone-Blanchard Machine Company has three main productlines: Blanchard Vertical Rotary Surface Grinders, ConornaticMultiple Spindle Bar and Chucking Automatics, and SpringfieldVertical Precision Grinders. Blanchard grinders are used forhigh-volume components such as connecting rods and cups, pumpbodies, small transmission housings and intake valves. TheCone-Blanchard plant in England manufactures the smaller modelsof the Blanchard and Conornatic lines. Abrasive products andgrinding accessories for use on Blanchard machines aremanufactured by the Blanchard Abrasives Division.
The Motch Cutting Products Division makes circularhigh-speed steel and carbide sawblades used in cutting metals,plastics and other materials. Jetstream Systems Company customdesigns conveying and processing equipment that useshigh-velocity, low-pressure air or fluid to lift and propelproducts or scrap material.
7.2.3
New Products
Motch & Merryweather is planning to begin distribution ofmachine tools manufactured by its new parent company,Derlikon-Buhr le Holding. Motch chairman, Dan Mortensen, hasrecently announced that the firm would soon be quoting priceson :
• Bevel gear cutting equipment made by Oerlikon Zurich
7-4

• Deep-hole boring equipment made by Oerlikon'sBoehringer unit in Germany
• Crankshaft milling machines.
The company will attempt to interest the auto industry inparticular in Oerlikon's line of deep-boring equipment. Italso hopes that the Swiss bevel gear cutting machines willallow it to challenge Gleason Works of Rochester, New York, fora share of that market.
7.3 CORPORATE STRATEGY
Motch & Merryweather is still in the process of adjustingto its acquisition by Oerlikon in early 1979 as the twocompanies discuss several new manufacturing and marketingopportunities created by purchase. Among the possibilities arejoint machine tool development and production. Oerlikonalready manufactures several lines of machine tools, includingproduction mills, jig borers, gear cutters and turningmachines. Motch plans to distribute those Oerlikon productsthat will fill gaps in current Motch product lines.
Motch chairman Dan Mortensen has also raised thepossibility of building some Oerlikon machines in the U.S. andof combining the technologies developed by two manufacturers."We like to think of ourselves as the best when it comes to thelatest in numerical control," he explained, "but some of thethings Oerlikon has done in other areas are excellent and couldbe advantageously combined with our technology."
The exchange of products between Motch and Oerlikon hasraised some problems with firms for whom Motch acts as a
distributor. Giddings & Lewis, the single largest customer ofthe Motch Distributor Division, has announced that it will dropMotch as its representative and begin distributing its machinetools directly. Giddings & Lewis cited potential conflictswith Oerlikon products that Motcli may import to the U.S.
In 1979, prior to the acquisition, Motch announced a
restructuring of its upper management. Company chairmanMortensen relinquished the additional title of president, whichwas given to Glenn D. Babbitt, formerly vice-president andgeneral manager of the company's Cone-Blanchard Machine Co.subsidiary. It was also announced that vice-chairman Clare R.Kubik would be stepping down and would be succeeded by Edwin R.Motch, vice-president and general manager of the machine tooldistributing arm of the company.
7-5
l

I
7.4 PRODUCTION AND OPERATIONS
Each of Motch & Merrywea t her ' s three U.S. plants sells someof its products to the auto industry. The facilities arelocated in Euclid, Ohio; Windsor, Vermont; and Cambridge,Massachusetts. Details on the plants are provided in Figures7-3, 7-4, and 7-5.
The company has not announced any current plans for newplant construction but has recently expanded the facilities ofthe Motch Division in Euclid, Ohio, to increase machine toolproduction capacity. A high bay assembly area of 23,000 squarefeet was added to the existing 1 50 , 00 0-square- foot facility.The additional space will allow the division to substantiallyincrease its output of numerically and conventionallycontrolled chucking machines and other special machine systems.
7.5 FINANCIAL STATUS
Merryweather when it paid $40 in cash for each outstandingshare of Motch common stock for a total purchase price ofmillion. Since the acquisition, Motch & Merryweather hasbeen reporting its financial statistics separately. The f
officers predicted that 1979 would be a year of continuedrecord sales and earnings, and the results of the first qusuggest that their prediction was probably accurate. Thecompany's performance through March, 1979, is discussed below.(See Figures 7-6 and 7-7.)
&
$54.6i
‘
not
1
irm' s
ar ter
7.5.1 Operating Analysis
Thepercent
company '
s
from 19771978 revenues reached $116 million,sales of $92 million. Profits rose
up33
26
percent, from $3During the firstpercent, year tocompared to $.35March, 1979, the
2 million in 1977 to $4.2 million in 1978.three months of 1979, sales climbed 50year, and profits jumped to $1.5 million,million in the first quarter of 1977. Incompany's order backlog stood at $112 million.
up $12 million from 1978 year end.
In the four years beforestagnant, actually decliningsteadily, however, and earniequity climbed as well, more1978 when it reached 18.7 peassets has not changed signiand the operating ratio rema'76 to '78. The ratio of eache improved margins, increabetween 1974 and 1978 when i
1978, revenues were fairlyin 1976. Margins improved
ngs rose consistently. Return onthan doubling between 1974 and
rcent. The ratio of sales toficantly over the last five years,med between 8 and 9 percent fromrnings to total assets, reflectingsed in each of the five yearst reached 7.6 percent.
7-6

I
CM• i
-P i
iw!
I
°|oOj
Lnjcr>
1
03N55
cre
0c
I
I
M<U
sz-pCO
^ a) i
2i
>i 1
pp '
a> .
s i
SZo-p
o
oLO
I
«o0)0)>_o
5.
EUJ
oZ
uWtf>
Q75
o'</>
inrewcncoO
re
c
- re
i re
re Js
5 8re «««“C 5re re
53 53
oe
T3 I
•H 1
r—1 j
O I
aH :
i
i
re
c.
-P r-tn <—
i
rHTSC ^CMCM ECM O
W T3•H
O rHin ocm 3rH W
I/I
inre
7-7
FIGURE
7-3.
EUCLID
PLANT
DATA

CN
-Pi
o'o:oi
Oi00
cSI
c/5
JSQ.
c
oO
cupo
^l
d) f
c !
p I
rO1
0) :
">1
>1 I
P '
>•HQ
0u
iT
i P: re
. -Co
i
c!
>-CQ
5 0)- c
is
io
5"reI*®
oV)3}wg>
3y
powTc•Hs
oinoo
V!®0>>_o
c.
£UJ
*0
6
(0
w f3
i QJ
0) J?
5 fT3 re
w ure \5c wc —re re
w wcr\
COoino
M>!
PI01cn;
Til
Cj
£toto0)
7-8
FIGURE
7-4.
WINDSOR
PLANT
DATA

i.
I
I
(N
-Hi
°Oio;
inCN
09N
c/5
o.
i>-H
i
Q
S_l t W(U
iS3
n >+j
i
r
rd
-a 0)
5c >*
o4-9
O _2 2
wfd
S-l
X!<5-1
QJ i?5-1
<a
= o2 cs- fd
£ rH
<S£
re
5"in</>
09w39
0o
d) I
T5!
•rH I
5-1
X!Efd
u
re
c.
o
VI090)>o
oZ
re
E re
w 09
I <5 «o
w «(0 »C .2
re re
W 05
-H <Cw 2-p »+j cu
Q5 tdO XS2= -Hrd 5h
IX X!£ i
r- fd cn
u oi
00ro
I
<S>
IS)
o>
7-9
FIGURE
7-5.
CAMBRIDGE
PLANT
DATA

Sales
Year ({Millions)
Earnings
({Millions)
Return on
Equity, Percent
Operating Income*
SalesPercent
78 116 4.2 18.7 00•00
77 92 3.2 16.5 9.0
76 77 2.2 12.9 8.2
75 92 1.6 10.7 5.4
74 91 1.0 7.6 5.5
Earnings „ Sales Earnings „w — Percent — PercentYear Total Assets Assets Sales
78 7 .
6
2.1 3.6
77 6.9 2.0 3.5
76 5.1 1.8 2.9
75 3.4 2.0 1.7
74 2 .
2
2.0 1.1
*Operating Income = Sales - Cost of Goods Sold - Selling, General and
Administrative Expenses, Before Depreciation, Interest, and Income Taxes.
FIGURE 7-6. MOTCH & MERRYWEATHEROPERATING ANALYSIS
7-10

1
co
CC
CO
00
CO0)
>
rH cn cn• o o • •
o o o
00 m r~ o rH
LD o rH m rH
CO VO VO in vo
rH rH rH rH rH
CM CN CN CD ocn CN rH rH
CO o r-• • • •
CO cn CN CN
VO CN r~ CN rHrH t" O'! OvrH
CO r~ VO inr- r* r» r- r~
£ .2(= CO
£
ax
aCOO
cn
< O'! 00 oo CN
"co r- CN cn CN
co09
COw09>oo
CNI
z09
OE09
h-
eo
aCOO
-3C09“O
b
CO ZaCOO
-oc09ax
CO
*a
o -o
co09
>
vo VO VO VO O• • • • •
CN CN CN CN CN
Ov rH cn• • • • •
CO CT\ VO m CN
C- o cn rH in• • • • •
Ov 00 in CNcn cn cn in
CO m (Ti LT)
LO CN •—I o O
-^r (N CN LO •—
I
(N i—I i—I i—
I
09COo in in CN VO
O)c O) • • • • •
CO c r~ CN rH o CN
co
E.c
09
CO
3cn
o
-3co
CJ
co
o
09c
09
09CO09
>• 09
o> a £“COw .2 £.2 «3 C31
a;
CO
(NJ
09> a 2;
CO< CJ> O(\ M
co h lor- r- r-
7-11
FIGURE
7-7.
MOTCH
&
MERRYWEATHER
CAPITAL
ANALYSIS

7.5.2 Capital Analysis
The ratio of the company's long-term debt to capitalizationdeclined from 52.5 percent in 1974 to 34 percent in 1977,rising again to 39.7 percent in 1978 when long-term debtincreased by $5.8 million. Owners' equity other than retainedearnings changed very little between '74 and '77. From 1975 to1978, the current ratio was unchanged at 2.6. Working capitalincreased from 1976 on, and the company has expressedconfidence in its ability to finance capital expenditures witha minimum of outside financing. If 1979 ended as it began,generating record levels of operating income, the firm'sconfidence would appear to have been justified.
nou2mij
5
T1
o3
n K>
X rectO O
s: mn:H —
r+ M. 00 00CT i— > .
CD CD1 CXI
CO
0J ao
.
c o (V) >c+ *—
h
1 0O_o —
200 copies


0034A00
0
K* -»o s
z >o a
mm>
> >cn rj2 2
h$03*
S3c a
r>IW ^
5S
§5? H9 o3) *n
<s- E*" 2c E
l 5S 2
S ?
§ 3> >
K " o *|f» v» s zP o w (/»
DM£ ^> z
-*o w2 **
> *°
5 §13** 2 >
ifl Ha 5
S'®