Proficy* Historian - GE Digital Support
125
Proficy* Historian A DVANCED T OPICS Version 5.5 June 2013
-
Upload
khangminh22 -
Category
Documents
-
view
3 -
download
0
Transcript of Proficy* Historian - GE Digital Support

Proficy* Historian
A D V A N C E D T O P I C S
V e r s i o n 5 . 5
J u n e 2 0 1 3

All rights reserved. No part of this publication may be reproduced in any form or by any electronic or mechanical means, including photocopying and recording, without permission in writing from GE Intelligent Platforms, Inc.
Disclaimer of Warranties and Liability
The information contained in this manual is believed to be accurate and reliable. However, GE Intelligent Platforms, Inc. assumes no responsibilities for any errors, omissions or inaccuracies whatsoever. Without limiting the foregoing, GE Intelligent Platforms, Inc. disclaims any and all warranties, expressed or implied, including the warranty of merchantability and fitness for a particular purpose, with respect to the information contained in this manual and the equipment or software described herein. The entire risk as to the quality and performance of such information, equipment and software, is upon the buyer or user. GE Intelligent Platforms, Inc. shall not be liable for any damages, including special or consequential damages, arising out of the user of such information, equipment and software, even if GE Intelligent Platforms, Inc. has been advised in advance of the possibility of such damages. The user of the information contained in the manual and the software described herein is subject to the GE Intelligent Platforms, Inc. standard license agreement, which must be executed by the buyer or user before the use of such information, equipment or software.
Notice
©2013 GE Intelligent Platforms, Inc. All rights reserved. *Trademark of GE Intelligent Platforms, Inc.
Microsoft® is a registered trademark of Microsoft Corporation, in the United States and/or other countries.
All other brands or names are property of their respective holders.
We want to hear from you. If you have comments, questions, or suggestions about our documentation, send them to the following email address:
Table of Contents
Advanced Topics .............................................................................................................................. 1
Data Input ......................................................................................................................................... 1
Calculation and Server-to-Server Collectors ................................................................................ 1
Recovery .................................................................................................................................. 2
Manual Recalculation ............................................................................................................... 2
Storage ........................................................................................................................................... 10
Archive Compression ................................................................................................................. 10
Determining whether held values are written during archive compression ........................... 14
Determining the expected value............................................................................................. 15
How Archive Compression Timeout Works ........................................................................... 17
Retrieval ......................................................................................................................................... 17
Sampling Modes ........................................................................................................................ 17
Current Value Sampling Mode ............................................................................................... 18
Lab Sampling Mode ............................................................................................................... 20
Interpolated Sampling Mode .................................................................................................. 21
Raw Data Sampling Modes .................................................................................................... 29
RawByFilterToggle Sampling Mode ....................................................................................... 32
Trend Sampling Mode ............................................................................................................ 36
Hybrid Modes ............................................................................................................................. 40
Example Case for Hybrid Mode ............................................................................................. 40
Calculation Modes ...................................................................................................................... 43
Raw Calculation Modes ......................................................................................................... 44
Interpolated Calculation Modes ............................................................................................. 53
Time Weighted Calculation Modes ........................................................................................ 60
Filtered Data Queries ............................................................................................................. 63
Other Calculation Modes ........................................................................................................ 83
iii
Advanced Topics Guide
iv
The StepValue Tag Property ...................................................................................................... 94
Comment Retrieval Mode ........................................................................................................ 101
Query Modifiers ........................................................................................................................ 102
ONLYGOOD......................................................................................................................... 102
INCLUDEREPLACED .......................................................................................................... 105
INCLUDEDELETED ............................................................................................................. 106
ONLYIFCONNECTED/ONLYIFUPTODATE ........................................................................ 107
ONLYRAW ........................................................................................................................... 112
LABSAMPLING .................................................................................................................... 113
ENUMNATIVEVALUE .......................................................................................................... 115
INCLUDEBAD ...................................................................................................................... 116
FILTERINCLUDEBAD .......................................................................................................... 118
USEMASTERFIELDTIME .................................................................................................... 119
Advanced Topics The topics in this e-Book are of an advanced nature. The material includes many examples, covering a wide range of Historian applications, and some detailed explanations of the inner workings of the product.
The intended audience is a user with a high level of computing/technical skills, specifically with Microsoft Windows and associated networking products. It is also presumed that the user will have prior experience working with the Historian product.
This e-Book is organized into 3 main sections: input, storage, and retrieval, following the typical data flow of an Historian system.
• Data Input : covers the time up until the data is sent over the network to the archiver.
• Storage :covers the time the archiver receives it until it is requested.
• Retrieval : covers the whole round trip from the client to the archiver and back with the requested data.
Since Historian can store and retrieve data, comments, and messages, the input, storage, and retrieval of each is discussed.
Windows 9x considerations are mentioned throughout as necessary.
Buffering applies to both input and storage and is mentioned in those sections.
There are additional software tools introduced in this document that do not ship with the product. Contact your technical support agent about such tools, should you require them.
Data Input The Data Input section covers:
• Calculation and Server-to-Server Collectors - also data only, no comments or messages
Calculation and Server-to-Server Collectors The Calculation and Server-to-Server collectors are collectors but have some unique behaviors not found in other standard collectors.
This chapter provides the following details:
• Recovery
• Manual Recalculation
1

Advanced Topics Guide
Recovery
This feature is unique to Calculation and Server-to-Server collectors. If the calculation engine is not running for a period of time, recovery makes it look like it was running. Recovery can also be used to fill in a hole of time where the collector was not able to communicate with the source archiver.
Recovery is applicable to both unsolicited and polled tags. Messages are also recovered. Comments are not recovered.
Normally, it is impossible to go back to the past and collect data. However, since these collectors are “deriving” data instead of “collecting” data, it is possible to recover past data, especially since the source of the derived data is archived in the Historian. It is important to understand that while recovery is possible in the calculation and Server-to-Server collectors, it only makes sense for certain types of calculation formulas.
Intended candidates for data recovery are formulas whose only inputs are Historian tags, since past data for these tags can be interpolated. Formulas that use data from external text files or from ADO via CreateObject will most likely not recover correct data because the inputs are not historized. If you are using these types of formulas, you should turn off recovery for the whole collector or insert VBScript code in the formula of individual tags to detect recovery. An example of this is given in the Historian documentation. A similar approach can be used to set a Max Recovery Time on a tag basis, overriding the collector wide setting.
Even calculation tags using only Historian tags as inputs have some caveats for recovery. If you are deriving calculated data from other calculated data, be sure to set up a trigger tag for each of the tags used in your formula. This way the tags will be processed in chain order. All tags are processed in time order.
The recovery logic is not intended to overcome polled collection overruns. If you configure too much collection, then you will get overruns.
You can control the amount of recovered data using Max Recovery Time configuration setting. You can turn off the recovery by setting it to zero.
Manual Recalculation
The Manual re-calc/re-replicate option is often the best choice for generating past derived data.
How Data Recovery works:
• When the recovery logic is executed, the collector will setup subscriptions for all the trigger tags.
• Next, it will recover data. The collector first determines how long it has been since the last write. It compares the current time to data in the registry key LastCalcRepWriteTime, which stores the last time data was written to the archive. The collector compares this to the Max Recovery Time that is specified in the user settings and performs a raw data query on the shorter of these two periods. Then it will take the shorter of these two and do a raw data query for all trigger tags. It will then process the returned samples in sequential order based on time. For example, if the collector was shut down for 8 hours, bnut Max Recovery Time was 4 hours, only 4 hours of data would be recovered.
• Recovery is performed before real time processing. Once recovery is complete, it will start polling and processing subscriptions in real time. The subscriptions in real time are queued up till the recovery is done.
• Recovery logic will place an end-of-collection marker at the point in time where the collector was shut down. This end-of-collection marker may or may not be there once the recovery is complete. As part of recovery logic, if it calculates a data point exactly at that timestamp where the end-of-collection marker is there, then it will be overwritten with the calculated good data.
2
Advanced Topics
• The recovery logic does not write samples to trigger tags or tags that are just in the formula. It is intended to write samples to the calculation tags.
• Messages are added to the log file that indicate when entering and exiting recovery mode.
Examples
The examples below assume the following tag configuration.
Machine 1:
Runs Data Archiver, iFix Collector (Collector 1), and Calculation Collectors.
Machine 2:
Runs iFix Collector (Collector 2), which collects and sends data to the archiver in Machine 1 (as a Remote Collector).
TagA and TagB are the iFix tags coming from Collector1 and Collector2, respectively. Both of these tags are scanned at a 1-minute poll rate.
Example 1
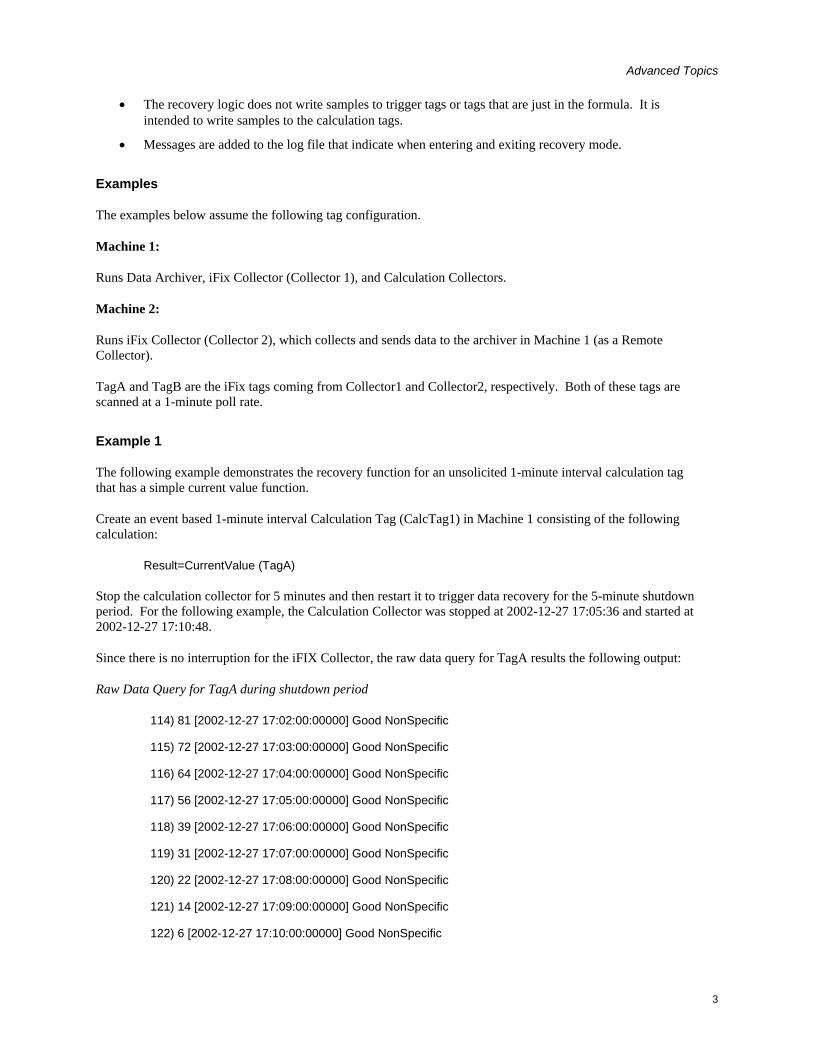
The following example demonstrates the recovery function for an unsolicited 1-minute interval calculation tag that has a simple current value function.
Create an event based 1-minute interval Calculation Tag (CalcTag1) in Machine 1 consisting of the following calculation:
Result=CurrentValue (TagA)
Stop the calculation collector for 5 minutes and then restart it to trigger data recovery for the 5-minute shutdown period. For the following example, the Calculation Collector was stopped at 2002-12-27 17:05:36 and started at 2002-12-27 17:10:48.
Since there is no interruption for the iFIX Collector, the raw data query for TagA results the following output:
Raw Data Query for TagA during shutdown period
114) 81 [2002-12-27 17:02:00:00000] Good NonSpecific
115) 72 [2002-12-27 17:03:00:00000] Good NonSpecific
116) 64 [2002-12-27 17:04:00:00000] Good NonSpecific
117) 56 [2002-12-27 17:05:00:00000] Good NonSpecific
118) 39 [2002-12-27 17:06:00:00000] Good NonSpecific
119) 31 [2002-12-27 17:07:00:00000] Good NonSpecific
120) 22 [2002-12-27 17:08:00:00000] Good NonSpecific
121) 14 [2002-12-27 17:09:00:00000] Good NonSpecific
122) 6 [2002-12-27 17:10:00:00000] Good NonSpecific
3
Advanced Topics Guide
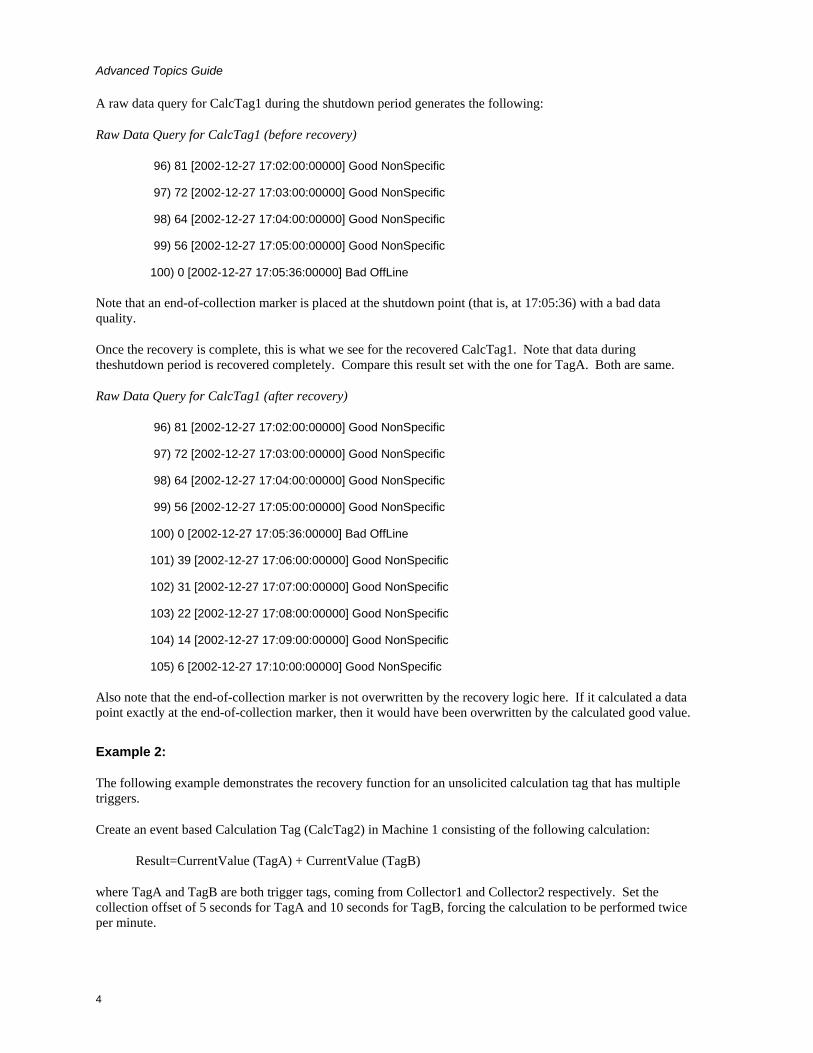
A raw data query for CalcTag1 during the shutdown period generates the following:
Raw Data Query for CalcTag1 (before recovery)
96) 81 [2002-12-27 17:02:00:00000] Good NonSpecific
97) 72 [2002-12-27 17:03:00:00000] Good NonSpecific
98) 64 [2002-12-27 17:04:00:00000] Good NonSpecific
99) 56 [2002-12-27 17:05:00:00000] Good NonSpecific
100) 0 [2002-12-27 17:05:36:00000] Bad OffLine
Note that an end-of-collection marker is placed at the shutdown point (that is, at 17:05:36) with a bad data quality.
Once the recovery is complete, this is what we see for the recovered CalcTag1. Note that data during theshutdown period is recovered completely. Compare this result set with the one for TagA. Both are same.
Raw Data Query for CalcTag1 (after recovery)
96) 81 [2002-12-27 17:02:00:00000] Good NonSpecific
97) 72 [2002-12-27 17:03:00:00000] Good NonSpecific
98) 64 [2002-12-27 17:04:00:00000] Good NonSpecific
99) 56 [2002-12-27 17:05:00:00000] Good NonSpecific
100) 0 [2002-12-27 17:05:36:00000] Bad OffLine
101) 39 [2002-12-27 17:06:00:00000] Good NonSpecific
102) 31 [2002-12-27 17:07:00:00000] Good NonSpecific
103) 22 [2002-12-27 17:08:00:00000] Good NonSpecific
104) 14 [2002-12-27 17:09:00:00000] Good NonSpecific
105) 6 [2002-12-27 17:10:00:00000] Good NonSpecific
Also note that the end-of-collection marker is not overwritten by the recovery logic here. If it calculated a data point exactly at the end-of-collection marker, then it would have been overwritten by the calculated good value.
Example 2:
The following example demonstrates the recovery function for an unsolicited calculation tag that has multiple triggers.
Create an event based Calculation Tag (CalcTag2) in Machine 1 consisting of the following calculation:
Result=CurrentValue (TagA) + CurrentValue (TagB)
where TagA and TagB are both trigger tags, coming from Collector1 and Collector2 respectively. Set the collection offset of 5 seconds for TagA and 10 seconds for TagB, forcing the calculation to be performed twice per minute.
4
Advanced Topics
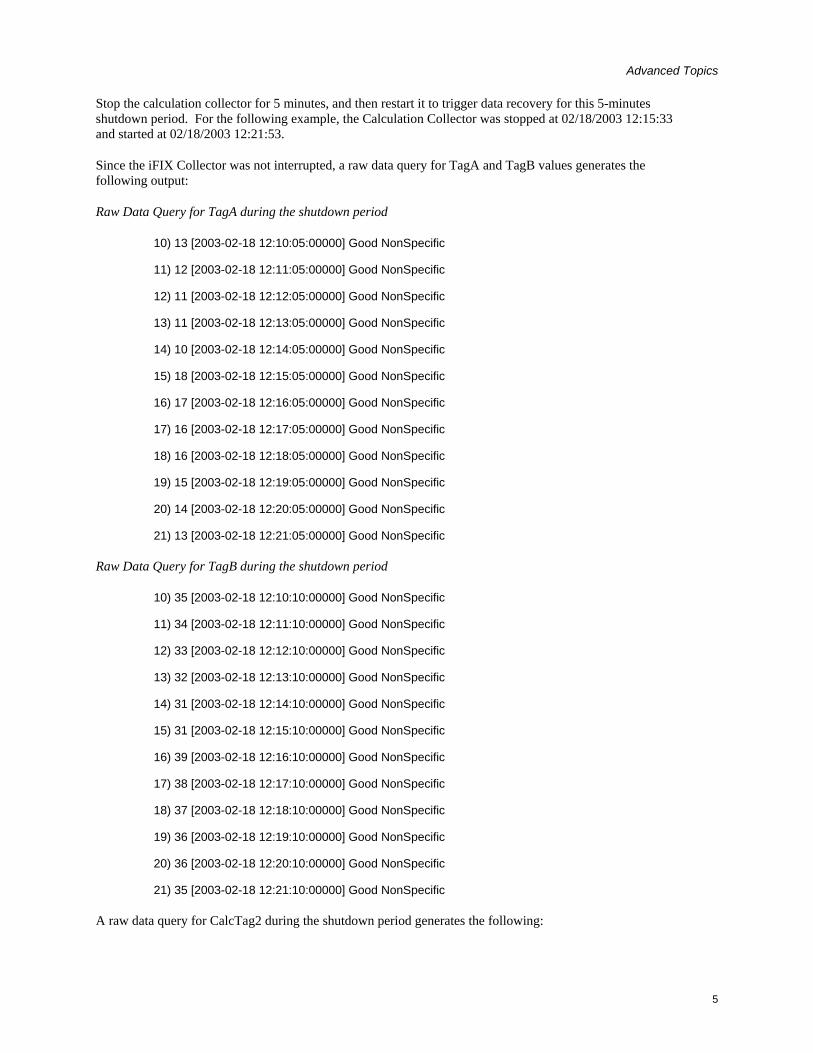
Stop the calculation collector for 5 minutes, and then restart it to trigger data recovery for this 5-minutes shutdown period. For the following example, the Calculation Collector was stopped at 02/18/2003 12:15:33 and started at 02/18/2003 12:21:53.
Since the iFIX Collector was not interrupted, a raw data query for TagA and TagB values generates the following output:
Raw Data Query for TagA during the shutdown period
10) 13 [2003-02-18 12:10:05:00000] Good NonSpecific
11) 12 [2003-02-18 12:11:05:00000] Good NonSpecific
12) 11 [2003-02-18 12:12:05:00000] Good NonSpecific
13) 11 [2003-02-18 12:13:05:00000] Good NonSpecific
14) 10 [2003-02-18 12:14:05:00000] Good NonSpecific
15) 18 [2003-02-18 12:15:05:00000] Good NonSpecific
16) 17 [2003-02-18 12:16:05:00000] Good NonSpecific
17) 16 [2003-02-18 12:17:05:00000] Good NonSpecific
18) 16 [2003-02-18 12:18:05:00000] Good NonSpecific
19) 15 [2003-02-18 12:19:05:00000] Good NonSpecific
20) 14 [2003-02-18 12:20:05:00000] Good NonSpecific
21) 13 [2003-02-18 12:21:05:00000] Good NonSpecific
Raw Data Query for TagB during the shutdown period
10) 35 [2003-02-18 12:10:10:00000] Good NonSpecific
11) 34 [2003-02-18 12:11:10:00000] Good NonSpecific
12) 33 [2003-02-18 12:12:10:00000] Good NonSpecific
13) 32 [2003-02-18 12:13:10:00000] Good NonSpecific
14) 31 [2003-02-18 12:14:10:00000] Good NonSpecific
15) 31 [2003-02-18 12:15:10:00000] Good NonSpecific
16) 39 [2003-02-18 12:16:10:00000] Good NonSpecific
17) 38 [2003-02-18 12:17:10:00000] Good NonSpecific
18) 37 [2003-02-18 12:18:10:00000] Good NonSpecific
19) 36 [2003-02-18 12:19:10:00000] Good NonSpecific
20) 36 [2003-02-18 12:20:10:00000] Good NonSpecific
21) 35 [2003-02-18 12:21:10:00000] Good NonSpecific
A raw data query for CalcTag2 during the shutdown period generates the following:
5
Advanced Topics Guide
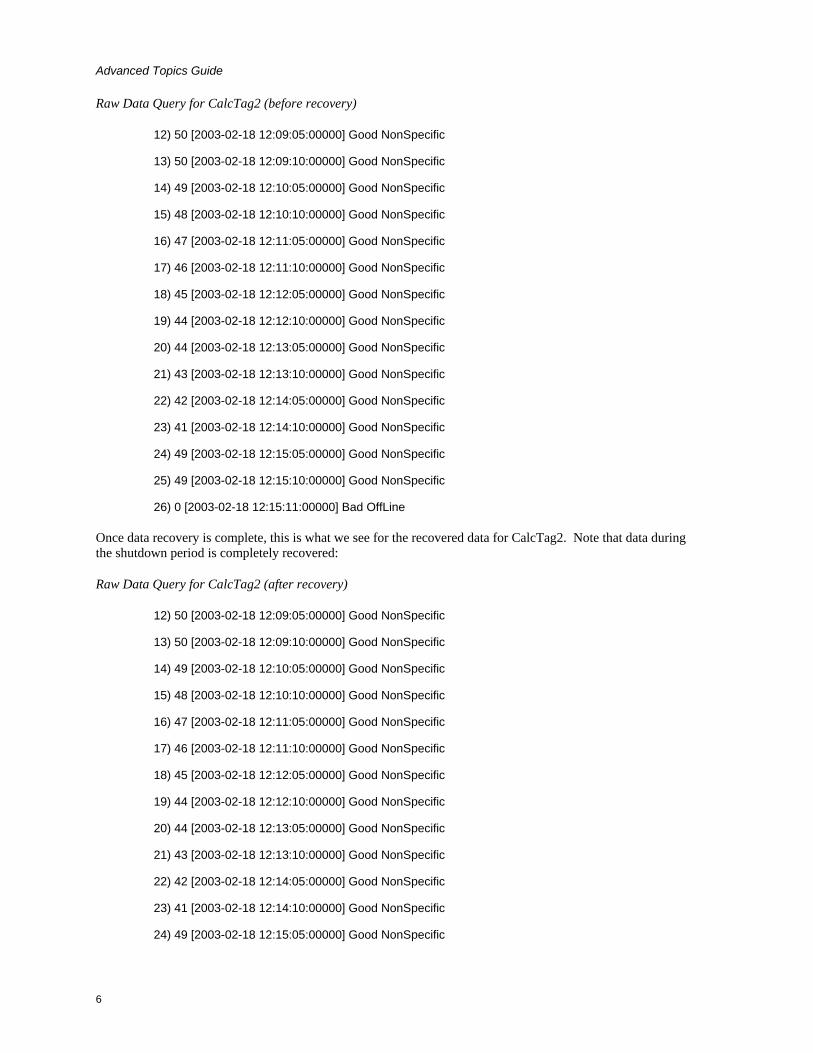
Raw Data Query for CalcTag2 (before recovery)
12) 50 [2003-02-18 12:09:05:00000] Good NonSpecific
13) 50 [2003-02-18 12:09:10:00000] Good NonSpecific
14) 49 [2003-02-18 12:10:05:00000] Good NonSpecific
15) 48 [2003-02-18 12:10:10:00000] Good NonSpecific
16) 47 [2003-02-18 12:11:05:00000] Good NonSpecific
17) 46 [2003-02-18 12:11:10:00000] Good NonSpecific
18) 45 [2003-02-18 12:12:05:00000] Good NonSpecific
19) 44 [2003-02-18 12:12:10:00000] Good NonSpecific
20) 44 [2003-02-18 12:13:05:00000] Good NonSpecific
21) 43 [2003-02-18 12:13:10:00000] Good NonSpecific
22) 42 [2003-02-18 12:14:05:00000] Good NonSpecific
23) 41 [2003-02-18 12:14:10:00000] Good NonSpecific
24) 49 [2003-02-18 12:15:05:00000] Good NonSpecific
25) 49 [2003-02-18 12:15:10:00000] Good NonSpecific
26) 0 [2003-02-18 12:15:11:00000] Bad OffLine
Once data recovery is complete, this is what we see for the recovered data for CalcTag2. Note that data during the shutdown period is completely recovered:
Raw Data Query for CalcTag2 (after recovery)
12) 50 [2003-02-18 12:09:05:00000] Good NonSpecific
13) 50 [2003-02-18 12:09:10:00000] Good NonSpecific
14) 49 [2003-02-18 12:10:05:00000] Good NonSpecific
15) 48 [2003-02-18 12:10:10:00000] Good NonSpecific
16) 47 [2003-02-18 12:11:05:00000] Good NonSpecific
17) 46 [2003-02-18 12:11:10:00000] Good NonSpecific
18) 45 [2003-02-18 12:12:05:00000] Good NonSpecific
19) 44 [2003-02-18 12:12:10:00000] Good NonSpecific
20) 44 [2003-02-18 12:13:05:00000] Good NonSpecific
21) 43 [2003-02-18 12:13:10:00000] Good NonSpecific
22) 42 [2003-02-18 12:14:05:00000] Good NonSpecific
23) 41 [2003-02-18 12:14:10:00000] Good NonSpecific
24) 49 [2003-02-18 12:15:05:00000] Good NonSpecific
6
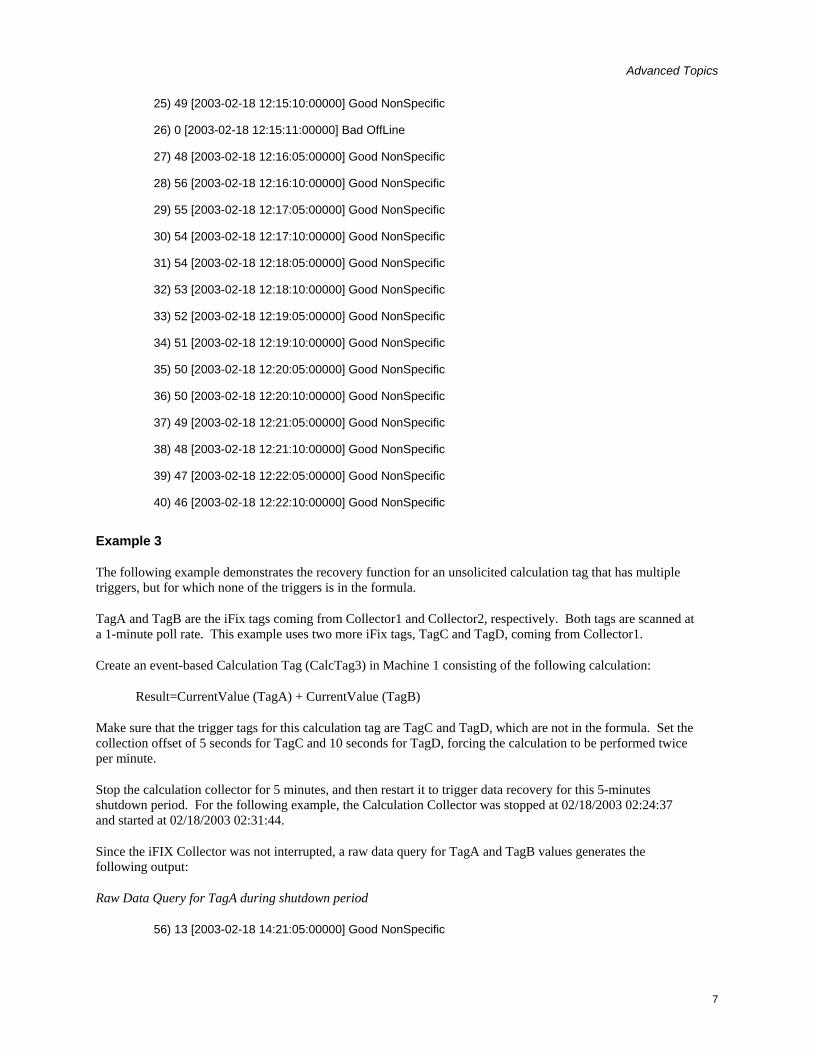
Advanced Topics
25) 49 [2003-02-18 12:15:10:00000] Good NonSpecific
26) 0 [2003-02-18 12:15:11:00000] Bad OffLine
27) 48 [2003-02-18 12:16:05:00000] Good NonSpecific
28) 56 [2003-02-18 12:16:10:00000] Good NonSpecific
29) 55 [2003-02-18 12:17:05:00000] Good NonSpecific
30) 54 [2003-02-18 12:17:10:00000] Good NonSpecific
31) 54 [2003-02-18 12:18:05:00000] Good NonSpecific
32) 53 [2003-02-18 12:18:10:00000] Good NonSpecific
33) 52 [2003-02-18 12:19:05:00000] Good NonSpecific
34) 51 [2003-02-18 12:19:10:00000] Good NonSpecific
35) 50 [2003-02-18 12:20:05:00000] Good NonSpecific
36) 50 [2003-02-18 12:20:10:00000] Good NonSpecific
37) 49 [2003-02-18 12:21:05:00000] Good NonSpecific
38) 48 [2003-02-18 12:21:10:00000] Good NonSpecific
39) 47 [2003-02-18 12:22:05:00000] Good NonSpecific
40) 46 [2003-02-18 12:22:10:00000] Good NonSpecific
Example 3
The following example demonstrates the recovery function for an unsolicited calculation tag that has multiple triggers, but for which none of the triggers is in the formula.
TagA and TagB are the iFix tags coming from Collector1 and Collector2, respectively. Both tags are scanned at a 1-minute poll rate. This example uses two more iFix tags, TagC and TagD, coming from Collector1.
Create an event-based Calculation Tag (CalcTag3) in Machine 1 consisting of the following calculation:
Result=CurrentValue (TagA) + CurrentValue (TagB)
Make sure that the trigger tags for this calculation tag are TagC and TagD, which are not in the formula. Set the collection offset of 5 seconds for TagC and 10 seconds for TagD, forcing the calculation to be performed twice per minute.
Stop the calculation collector for 5 minutes, and then restart it to trigger data recovery for this 5-minutes shutdown period. For the following example, the Calculation Collector was stopped at 02/18/2003 02:24:37 and started at 02/18/2003 02:31:44.
Since the iFIX Collector was not interrupted, a raw data query for TagA and TagB values generates the following output:
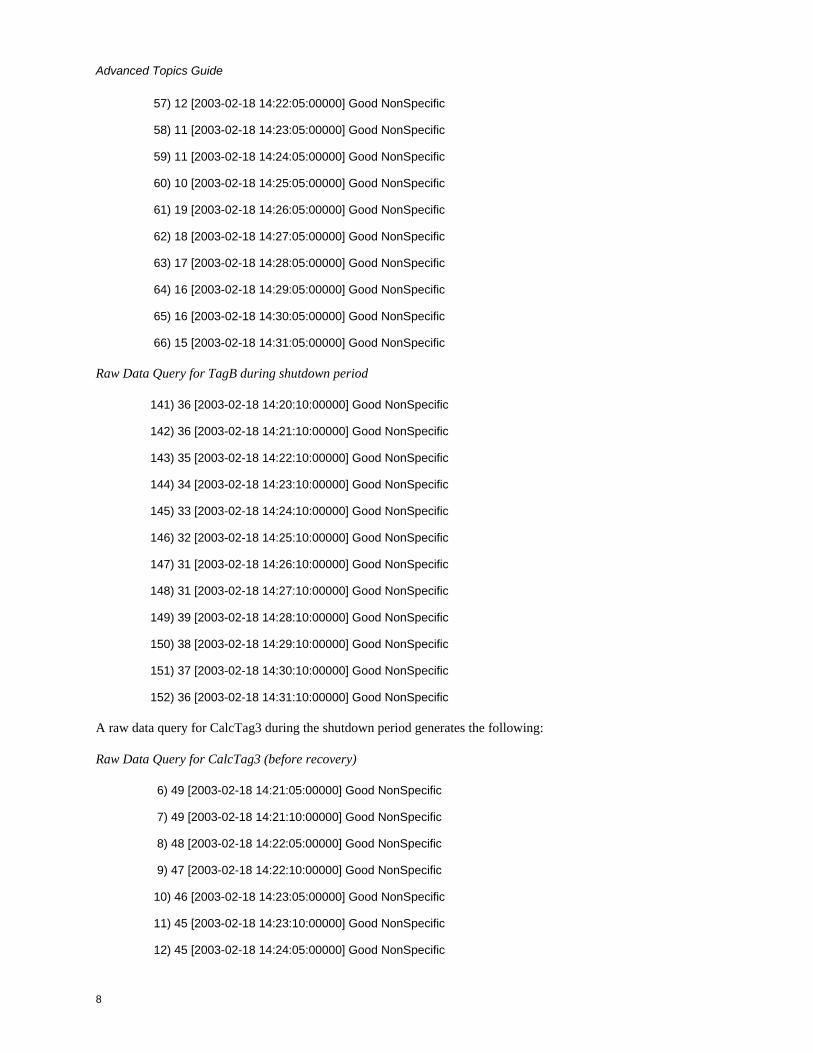
Raw Data Query for TagA during shutdown period
56) 13 [2003-02-18 14:21:05:00000] Good NonSpecific
7
Advanced Topics Guide
57) 12 [2003-02-18 14:22:05:00000] Good NonSpecific
58) 11 [2003-02-18 14:23:05:00000] Good NonSpecific
59) 11 [2003-02-18 14:24:05:00000] Good NonSpecific
60) 10 [2003-02-18 14:25:05:00000] Good NonSpecific
61) 19 [2003-02-18 14:26:05:00000] Good NonSpecific
62) 18 [2003-02-18 14:27:05:00000] Good NonSpecific
63) 17 [2003-02-18 14:28:05:00000] Good NonSpecific
64) 16 [2003-02-18 14:29:05:00000] Good NonSpecific
65) 16 [2003-02-18 14:30:05:00000] Good NonSpecific
66) 15 [2003-02-18 14:31:05:00000] Good NonSpecific
Raw Data Query for TagB during shutdown period
141) 36 [2003-02-18 14:20:10:00000] Good NonSpecific
142) 36 [2003-02-18 14:21:10:00000] Good NonSpecific
143) 35 [2003-02-18 14:22:10:00000] Good NonSpecific
144) 34 [2003-02-18 14:23:10:00000] Good NonSpecific
145) 33 [2003-02-18 14:24:10:00000] Good NonSpecific
146) 32 [2003-02-18 14:25:10:00000] Good NonSpecific
147) 31 [2003-02-18 14:26:10:00000] Good NonSpecific
148) 31 [2003-02-18 14:27:10:00000] Good NonSpecific
149) 39 [2003-02-18 14:28:10:00000] Good NonSpecific
150) 38 [2003-02-18 14:29:10:00000] Good NonSpecific
151) 37 [2003-02-18 14:30:10:00000] Good NonSpecific
152) 36 [2003-02-18 14:31:10:00000] Good NonSpecific
A raw data query for CalcTag3 during the shutdown period generates the following:
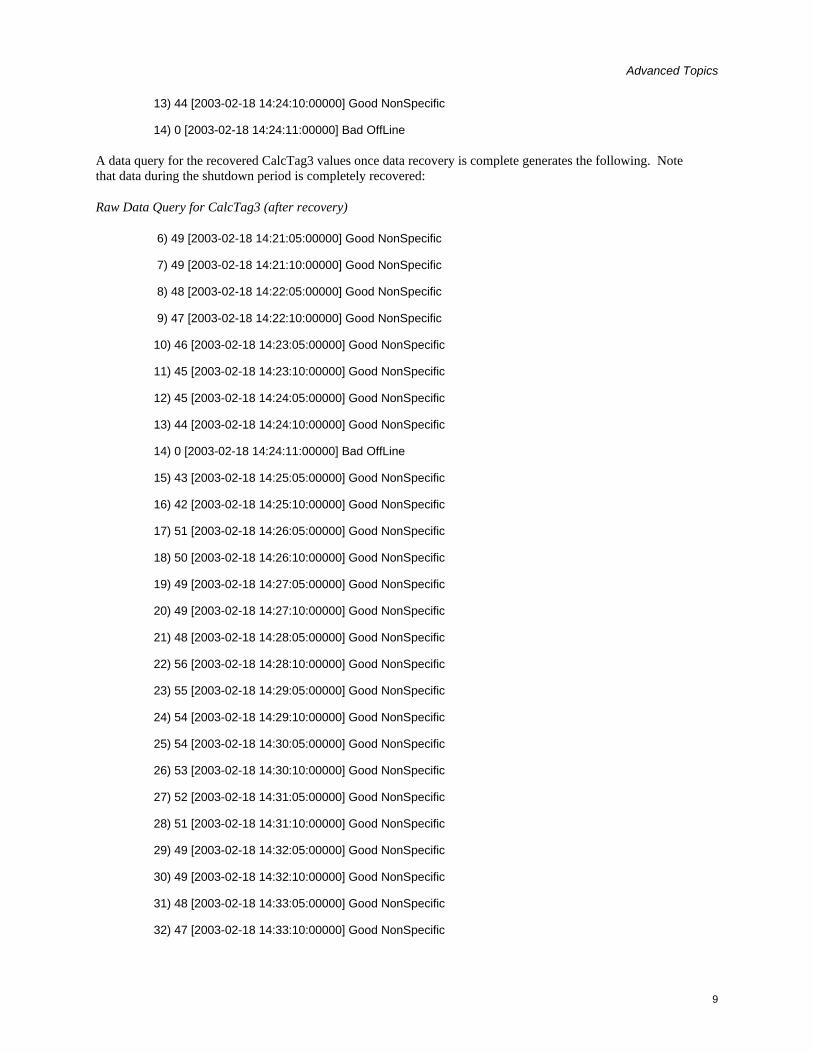
Raw Data Query for CalcTag3 (before recovery)
6) 49 [2003-02-18 14:21:05:00000] Good NonSpecific
7) 49 [2003-02-18 14:21:10:00000] Good NonSpecific
8) 48 [2003-02-18 14:22:05:00000] Good NonSpecific
9) 47 [2003-02-18 14:22:10:00000] Good NonSpecific
10) 46 [2003-02-18 14:23:05:00000] Good NonSpecific
11) 45 [2003-02-18 14:23:10:00000] Good NonSpecific
12) 45 [2003-02-18 14:24:05:00000] Good NonSpecific
8
Advanced Topics
13) 44 [2003-02-18 14:24:10:00000] Good NonSpecific
14) 0 [2003-02-18 14:24:11:00000] Bad OffLine
A data query for the recovered CalcTag3 values once data recovery is complete generates the following. Note that data during the shutdown period is completely recovered:
Raw Data Query for CalcTag3 (after recovery)
6) 49 [2003-02-18 14:21:05:00000] Good NonSpecific
7) 49 [2003-02-18 14:21:10:00000] Good NonSpecific
8) 48 [2003-02-18 14:22:05:00000] Good NonSpecific
9) 47 [2003-02-18 14:22:10:00000] Good NonSpecific
10) 46 [2003-02-18 14:23:05:00000] Good NonSpecific
11) 45 [2003-02-18 14:23:10:00000] Good NonSpecific
12) 45 [2003-02-18 14:24:05:00000] Good NonSpecific
13) 44 [2003-02-18 14:24:10:00000] Good NonSpecific
14) 0 [2003-02-18 14:24:11:00000] Bad OffLine
15) 43 [2003-02-18 14:25:05:00000] Good NonSpecific
16) 42 [2003-02-18 14:25:10:00000] Good NonSpecific
17) 51 [2003-02-18 14:26:05:00000] Good NonSpecific
18) 50 [2003-02-18 14:26:10:00000] Good NonSpecific
19) 49 [2003-02-18 14:27:05:00000] Good NonSpecific
20) 49 [2003-02-18 14:27:10:00000] Good NonSpecific
21) 48 [2003-02-18 14:28:05:00000] Good NonSpecific
22) 56 [2003-02-18 14:28:10:00000] Good NonSpecific
23) 55 [2003-02-18 14:29:05:00000] Good NonSpecific
24) 54 [2003-02-18 14:29:10:00000] Good NonSpecific
25) 54 [2003-02-18 14:30:05:00000] Good NonSpecific
26) 53 [2003-02-18 14:30:10:00000] Good NonSpecific
27) 52 [2003-02-18 14:31:05:00000] Good NonSpecific
28) 51 [2003-02-18 14:31:10:00000] Good NonSpecific
29) 49 [2003-02-18 14:32:05:00000] Good NonSpecific
30) 49 [2003-02-18 14:32:10:00000] Good NonSpecific
31) 48 [2003-02-18 14:33:05:00000] Good NonSpecific
32) 47 [2003-02-18 14:33:10:00000] Good NonSpecific
9
Advanced Topics Guide
Storage The Storage section covers:
• Archive compression
Archive Compression The Data Archiver performs archive compression procedures to conserve disk storage space. Archive compression can be used on tags populated by any method (collector, migration, file collector, SDK programs, Excel, etc.)
Archive compression is a tag property. Archive compression can be enabled or disabled on different tags and can have different deadbands.
Archive compression applies to numeric data types (scaled, float, double float, integer and double integer). It does not apply to string or blob data types. Archive compression is useful only for analog values, not digital values.
Archive compression can result in fewer raw samples stored to disk than were sent by collector.
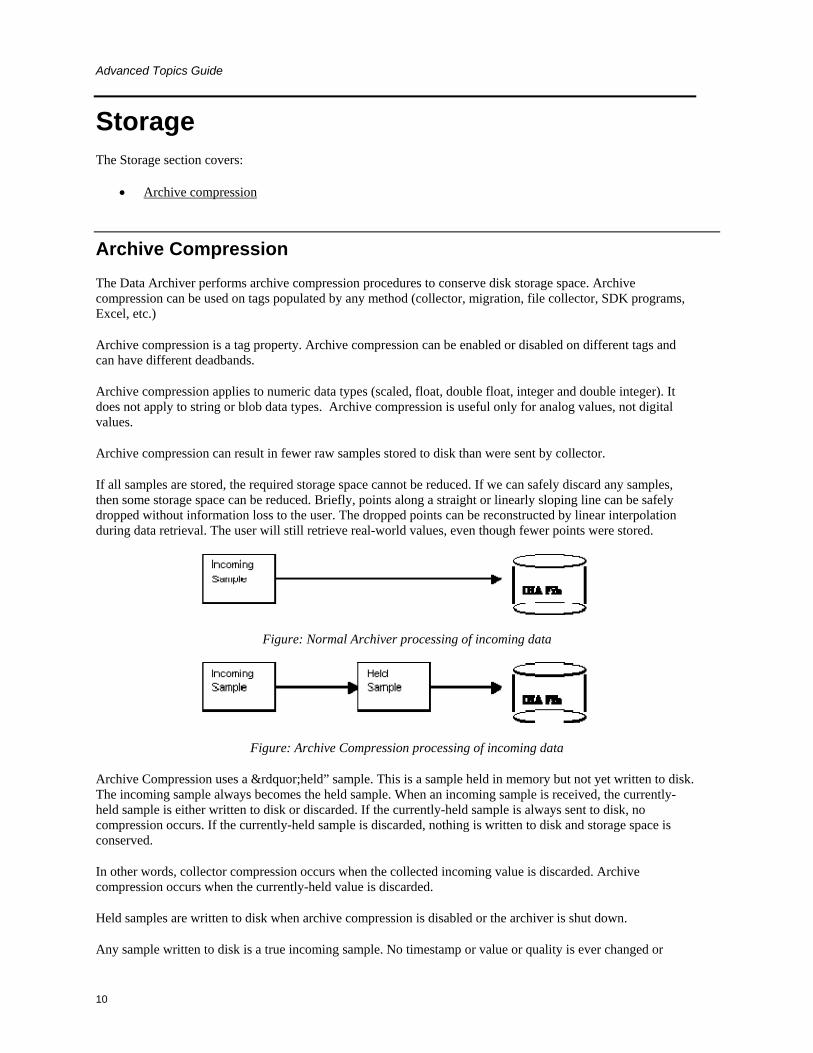
If all samples are stored, the required storage space cannot be reduced. If we can safely discard any samples, then some storage space can be reduced. Briefly, points along a straight or linearly sloping line can be safely dropped without information loss to the user. The dropped points can be reconstructed by linear interpolation during data retrieval. The user will still retrieve real-world values, even though fewer points were stored.
Figure: Normal Archiver processing of incoming data
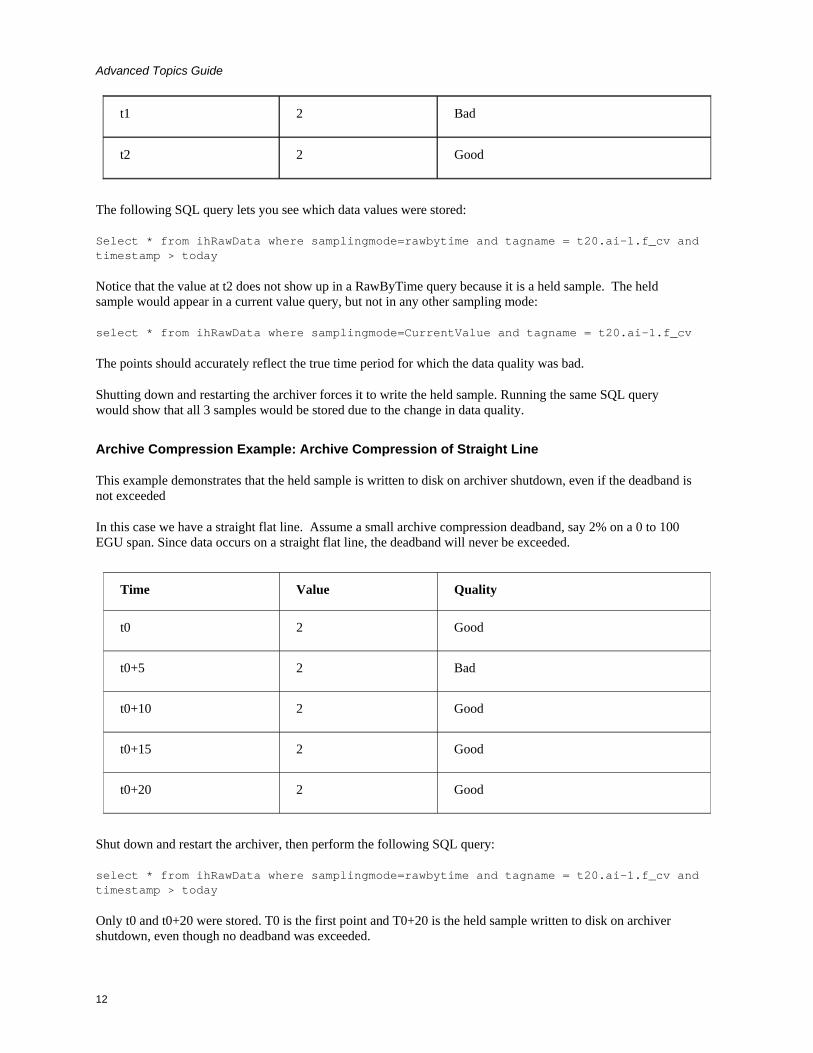
Figure: Archive Compression processing of incoming data
Archive Compression uses a ”held” sample. This is a sample held in memory but not yet written to disk. The incoming sample always becomes the held sample. When an incoming sample is received, the currently-held sample is either written to disk or discarded. If the currently-held sample is always sent to disk, no compression occurs. If the currently-held sample is discarded, nothing is written to disk and storage space is conserved.
In other words, collector compression occurs when the collected incoming value is discarded. Archive compression occurs when the currently-held value is discarded.
Held samples are written to disk when archive compression is disabled or the archiver is shut down.
Any sample written to disk is a true incoming sample. No timestamp or value or quality is ever changed or
10

Advanced Topics
interpolated.
Note that internal performance tags use an archive compression deadband of 0% or close to 0%.
The following describes the logic that is executed on every sample written to the archiver while archive compression is enabled for the tag:
IF the incoming sample data quality = held sample data quality
IF the new point is a bad
Toss the value to avoid repeated bads. Do we toss new bad or old bad?
ELSE
Decide if the new value exceeds the archive compresssion deadband
ELSE
// data quality is changed, flush held to disk
IF we have exceeded deadband or changed quality
// Store the old held sample in the archive
// Set up new deadband threshold using incoming value and value written to disk.
// Make the incoming value the held value
The effect of archive compression is demonstrated by the following examples.
Archive Compression Example: Change of data quality
This example demonstrates that:
• A change in data quality causes held samples to be stored.
• Held samples are returned only in a current value sampling mode query.
• Restarting the archiver causes the held sample to be flushed to disk.
Normally, a flat straight line would never cause the held value to be written to disk. An important exception is that changes in data quality force the held value to be written to disk. Assume a large archive compression deadband, such as 75% on a 0 to 100 EGU span.
Time Value Quality
t0 2 Good
11
Advanced Topics Guide
t1 2 Bad
t2 2 Good
The following SQL query lets you see which data values were stored:
Select * from ihRawData where samplingmode=rawbytime and tagname = t20.ai-1.f_cv and timestamp > today
Notice that the value at t2 does not show up in a RawByTime query because it is a held sample. The held sample would appear in a current value query, but not in any other sampling mode:
select * from ihRawData where samplingmode=CurrentValue and tagname = t20.ai-1.f_cv
The points should accurately reflect the true time period for which the data quality was bad.
Shutting down and restarting the archiver forces it to write the held sample. Running the same SQL query would show that all 3 samples would be stored due to the change in data quality.
Archive Compression Example: Archive Compression of Straight Line
This example demonstrates that the held sample is written to disk on archiver shutdown, even if the deadband is not exceeded
In this case we have a straight flat line. Assume a small archive compression deadband, say 2% on a 0 to 100 EGU span. Since data occurs on a straight flat line, the deadband will never be exceeded.
Time Value Quality
t0 2 Good
t0+5 2 Bad
t0+10 2 Good
t0+15 2 Good
t0+20 2 Good
Shut down and restart the archiver, then perform the following SQL query:
select * from ihRawData where samplingmode=rawbytime and tagname = t20.ai-1.f_cv and timestamp > today
Only t0 and t0+20 were stored. T0 is the first point and T0+20 is the held sample written to disk on archiver shutdown, even though no deadband was exceeded.
12

Advanced Topics
Archive Compression Example: Bad Data
This example demonstrates that repeated bad values are not stored.
Assume a large archive compression deadband, say 75%
Time Value Quality
t0 2 Good
t0+5 2 Bad
t0+10 2 Bad
t0+15 2 Bad
t0+20 2 Good
t0+25 3 Good
The t0+5 value is stored because of the change in data quality.
The t0+10 value is not stored because repeated bad values are not stored.
The t0+15 value is stored when the t0+20 comes in because of a change of quality
Archive Compression Example: Disabling archive compression for a tag
Assume a large archive compression deadband, say 75%
Time Value Quality
t0 2 Good
t0+5 10
Good
t0+10 99 Good
t0+15 Archive compression disabled
13

Advanced Topics Guide
The t0 value is stored because it is the first sample
The t0+5 is stored when the t0+10 comes in
The t0+10 is stored when archive compression is disabled for the tag
Archive Compression Example: Archive Compression of Good Data
This example demonstrates that the held value is written to disk when the deadband is exceeded
In this case, we have an upward ramping line. Assume a large archive compression deadband, say 75% on a 0 to 100 EGU span.
Time Value Quality
t0 2 Good
t0+5 10 Good
t0+10 10 Good
t0+15 10 Good
t0+20 99 Good
Shut down and restart the archiver, then perform the following SQL query:
select * from ihRawData where samplingmode=rawbytime and tagname = t20.ai-1.f_cv and timestamp > today
Because of archive compression, the t0+5 and t0+10 values are not stored. The t0+15 value is stored when the t0+20 arrives. The t0+20 value would not be stored until a future sample arrives, no matter how long that takes.
Determining whether held values are written during archive compression
When archive compression is enabled for a tag, its current value is held in memory and not immediately written to disk. When a new value is received, the actual value of the tag is compared to the expected value to determine whether or not the held value should be written to disk. If the values are sufficiently different, the held value is written. This is sometimes described as "exceeding archive compression".
A change of data quality always exceeds archive compression. Otherwise, the archive compression algorithm indirectly examines the value and time stamp for the tag's values.
Archive compression uses a deadband on the slope of the line connecting the data points, not the value or time stamp of the points themselves. The archive compression algorithm calculates out the next expected value based on this slope, applies a deadband value, and checks whether the new value exceeds that deadband.
The "expected" value is what the value would be if the line continued with the same slope. A deadband value is
14

Advanced Topics
an allowable deviation. If the new value is within the range of the expected value, plus or minus the deadband, it does not exceed archive compression and the current held value is not written to disk. (To be precise, the deadband is centered on the expected value, so that the actual range is plus or minus half of the deadband.)
Archive Compression Example: Exceeding Archive Compression
EGUs are 0 to 200000 for a simulation tag.
Enter 2% Archive compression. This displays as 4,000 EGU units in the administration UI.
When a sample arrives, the archiver calculates the next expected value based on the slope and time since the last value was written. Let's say that the expected value is 17,000.
The deadband of 4,000 is centered, so the archiver adds and subtracts 2,000 from the expected value. Thus, the actual value must be from 15,000 to 19,000 inclusive for it to be ignored by the compression algorithm.
In other words, the actual value must be less than 15,000 or greater than 19,000 for it to exceed compression and for the held value to be written.
Determining the expected value
The Archive Compression algorithm calculates the expected value from the slope, time, and offset (a combination of previous values and its timestamp):
ExpectedValue = m_CompSlope * Time + m_CompOffset;
where
m_CompSlope = deltaValue / deltaT
m_CompOffset = lastValue - (m_CompSlope * LastTimeSecs)
Archive Compression Example: Determining Expected Value
Values arriving into the archiver for tag1 are
Time Value
t0 2
t0+5 10
t0+10 20
The expected value at time stamp t0+15 is calculated based on the samples at t0+5 and t0+10:
m_CompSlope = deltaValue / deltaTime
m_CompSlope = (20-10) / 5
m_CompSlope = 2
m_CompOffset = lastValue - (m_CompSlope * LastTimeSecs)
m_CompOffset = 20 - (2 * 10)
15

Advanced Topics Guide
m_CompOffset = 0
ExpectedValue = m_CompSlope * Time + m_CompOffset;
ExpectedValue = 2 * 15 + 0;
ExpectedValue = 30
The expected value at t0+15 is 30.
Archive Compression Example: Archive Compression of a ramping tag
An iFIX tag is associated with an RA register. This value ramps up to 100 then drops immediately to 0.
Assume a 5-second poll time in Historian. How much archive compression can be performed to still "store" the same information?
With an archive compression of 75%, 25% or 5%, only the change in direction is logged:
11-Mar-2003 19:31:40.000 0.17 Good NonSpecific
11-Mar-2003 19:32:35.000 90.17 Good NonSpecific
11-Mar-2003 19:32:40.000 0.17 Good NonSpecific
11-Mar-2003 19:33:35.000 91.83 Good NonSpecific
11-Mar-2003 19:33:40.000 0.17 Good NonSpecific
An archive compression of 1% stores the most samples.
An archive compression of 0% logs every incoming sample. Even on a perfectly ramping signal with no deviations, 0% compression conserves no storage space and essentially disables archive compression.
Archive Compression Example: Archive Compression of a drifting tag
A drifting tag is one that ramps up, but for which the value barely falls within the deadband each time.
Even though a new held sample is created and the current one discarded, the slope is not updated unless the current slope exceeded. With a properly chosen deadband value, this is irrelevant: by specifying a certain deadband, the user is saying that the process is tolerant of changes within that deadband value and that they do not need to be logged.
Archive Compression Example: Archive Compression of a filling tank
In the case of a filling tank, the value (representing the fill level) ramps up, then stops. In this case, the system also uses collector compression, so when the value stops ramping, no more data is sent to the archiver. At some point in the future, the value will begin increasing again.
As long as nothing is sent to the archiver, no raw samples are stored. During this flat time (or plateau), it will appear flat in an interpolated retrieval because the last point is stretched. This illustrates that you should use interpolated retrieval methods on archived compressed data.
16

Advanced Topics
How Archive Compression Timeout Works
The Archive Compression Timeout value describes a period of time at which the held value is written to disk. If a value is held for a period of time that exceeds the timeout period, the next data point is considered to exceed the deadband value, regardless of the actual data received or the calculated slope.
After the value is written due to an archive compression timeout period, the timeout timer is reset and compression continues as normal.
Retrieval When retrieving data from Historian, you specify either a raw or non-raw sampling mode. Non-raw retrieval can include a calculation mode so that calculations are performed in the archiver before data is returned. This is detailed in the following topics:
• Sampling Modes
• Calculation Modes
• Filtered Data Queries
Some sampling and calculation modes are better suited to retrieving compressed data. Understanding the available modes helps you choose the best method for your archiving process.
The retrieval topics include descriptions of all methods of retrieval:
• API
• SDK
• OLE DB
• Charting
• Reporting via OLE DB and Excel Add In
Sampling Modes Many different sampling and calculation modes can be used on retrieval of data that has already been collected in the archive. Available sampling modes in Historian are:
CurrentValue
RawByTime
RawByNumber
RawByFilterToggle
Interpolated
Lab
Trend
17

Advanced Topics Guide
Calculated
A filtered data query can be performed with each sampling mode except CurrentValue. Calculation modes are used when the sampling mode is set to "Calculated".
These topics explain some of these retrieval concepts. Each sampling mode (except calculated) is described with details and examples, including how sample attributes are determined. Each sample returned by Historian during data retrieval has the following properties:
Timestamp – The time stamp of the collected sample or an interval time stamp
Value – The collected value or sampled value
Quality – Each sample in Current Value and Raw retrieval has a quality of "good" or "bad". Interpolated and Lab Retrieval express quality as a "per cent good".
Current value sampling is the simplest retrieval mode. Raw data retrieval is the second simplest method of retrieval. Intervals and interpolation concepts are common to Interpolation and Lab sampling. Interpolation and lab sampling are presented together so that they can be contrasted for values and qualities returned from the same set of collected data.
Example Data
Each topic contains all necessary data for executing each example in the form of a CSV file that can be imported by the Historian File Collector. You will have to copy and paste the appropriate data into a separate file with a CSV file name extension. Delete all archives before importing the data. You will not be able to import the data unless you adjust the active hours setting; this is true any time you import old data with the File Collector.
For details, see your Historian documentation.
Current Value Sampling Mode
Current Value Sampling Mode retrieves the data sample value with newest timestamp of any quality that was received by the archiver. This is not the same as retrieving the newest raw sample stored in the archive, since archive compression sometimes discards raw samples sent by the collector during the compression process.
Current Value Sampling retrieves a single sample containing the current value of the tag, not a series of historical samples. The sample has a timestamp, value, and quality.
Timestamp
Returns the time stamp on the sample sent to the archiver. The time stamp is not necessarily the current time. If collector compression is enabled and the deadband on the collector has not been exceeded for some time, the time stamp may be much earlier than the current time.
If data is sent to the archiver out of order, the current value is always the newest timestamp, even when the most recent value received is older than previous samples.
Example: Retrieving the current value of out of order data
Step 1: Import this file that contains out of order data for a tag
* Example of Out Of Order data
18

Advanced Topics
*
[Tags]
Tagname,DataType,HiEngineeringUnits,LoEngineeringUnits
OUTOFORDERTAG,SingleFloat,60,0
[Data]
Tagname,TimeStamp,Value,DataQuality
OUTOFORDERTAG,29-Mar-2002 14:50:00.000,50.0,Good
OUTOFORDERTAG,29-Mar-2002 14:20:00.000,20.0,Good
OUTOFORDERTAG,29-Mar-2002 14:30:00.000,30.0,Good
OUTOFORDERTAG,29-Mar-2002 14:10:00.000,10.0,Good
Step 2: Retrieve the data using current value sampling, using the following query:
select timestamp, tagname, value, quality from ihrawdata where samplingmode = CURRENTVALUE and tagname = OUTOFORDERTAG
The time stamp of the current value should be the newest timestamp with the value and quality that was sent to the archiver, as shown here:
Timestamp Tagname Value Quality
29-Mar-2002 14:50:00.000 OUTOFORDERTAG 50.00 Good NonSpecific
Even when collector compression is not used (and the collection interval is 1 second), this value can be up to 2 seconds old. The collector automatically writes held values to the archiver every 10,000 values (across all tags being collected) or every 2 seconds, whichever comes first.
If collector compression is being used, fewer samples are sent to the archiver. Therefore, the time stamp of the current value is the last sample to exceed collector compression. Archive compression has no effect, as the value is the last value received by the archiver, not the last value that exceeded archive compression and that was stored as a raw sample.
Value
Simply the value sent by the collector. The value is not interpolated to the current time or modified by the archiver during retrieval. The data type of the value will be the same data type as the tag's raw data.
Data Quality
Returns the quality of the data sent by the collector. The current value can be of a bad data quality and will flagged as such if the collector sends a sample with a bad data quality to the archiver. When the collector shuts down cleanly, it sends a bad data quality marker at shutdown time for all its tags. If the collector simply loses its connection to the archiver or crashes, the current value's quality will not automatically change to bad.
Example: Retrieving the current value of a tag
The following sequence of steps displays the behavior of CurrentValue sampling mode. After each step,
19
Advanced Topics Guide
retrieve the tag current value using this query:
select timestamp, tagname, value, quality from ihrawdata where samplingmode = CURRENTVALUE and tagname = IFIX.RAMP.F_CV
Step 1: Configure the tag IFIX.RAMP.F_CV in an iFIX collector running on different PC than archiver. Configure it to have a 1-second collection interval. The Current Value should be within one second of the value shown in a data link.
Step 2: Stop the iFIX collector. The end-of-collection marker is sent to the data, so the current value's quality should be marked as "bad" and its value set to zero.
Step 3: Restart the iFIX collector. The current value's quality should be marked as "good" and it should have a valid value.
Step 4: Put the block off scan in the PDB. The current value's quality should be marked as "bad". (Put the block back on scan when you've verified this.)
Step 5: Pull the network cable from the iFIX collector running on another machine. The current value remains unchanged as the value was good at the time the cable was pulled. To ensure that the Current Value is accurate, you would have to use the Heartbeat Address of the iFIX collector to verify that the collector is running.
Step 6: Enable collector compression for the point and ensure that the tag's value does not change. The time stamp of the current value will stay the same until the collector reports a change.
Anticipated usage
The current value can be used in any operator display. You should also display the data quality of the current value. You may choose to use the Heartbeat address of the collector so that you can confirm that the collector is running and that the current value is therefore up to date.
If the collector was shut down gracefully, then the current value would correctly display a bad data quality (and a value of 0). If the collector crashed or was disconnected from the server, then the current value will be the last value sent before the crash or disconnect.
Lab Sampling Mode
Lab Sampling is designed to duplicate the way iFIX classic Historian (HTA/HTC) returned data. This sampling mode returns only collected values. Each collected value is repeated until the next collected value, resulting in a jagged step plot instead of a smooth curve.
Interpolated values are used in other calculation modes. Lab sampling is never used by calculation modes.
Each sample has the following attributes:
• Timestamp: Lab sampling determines intervals and timestamps the same as interpolated retrieval.
• Value: Any value returned is an actual collected raw value; the data value is never interpolated.
• Data Quality: Lab sampling uses the same logic as interpolated sampling to determine percent good quality.
20
Advanced Topics
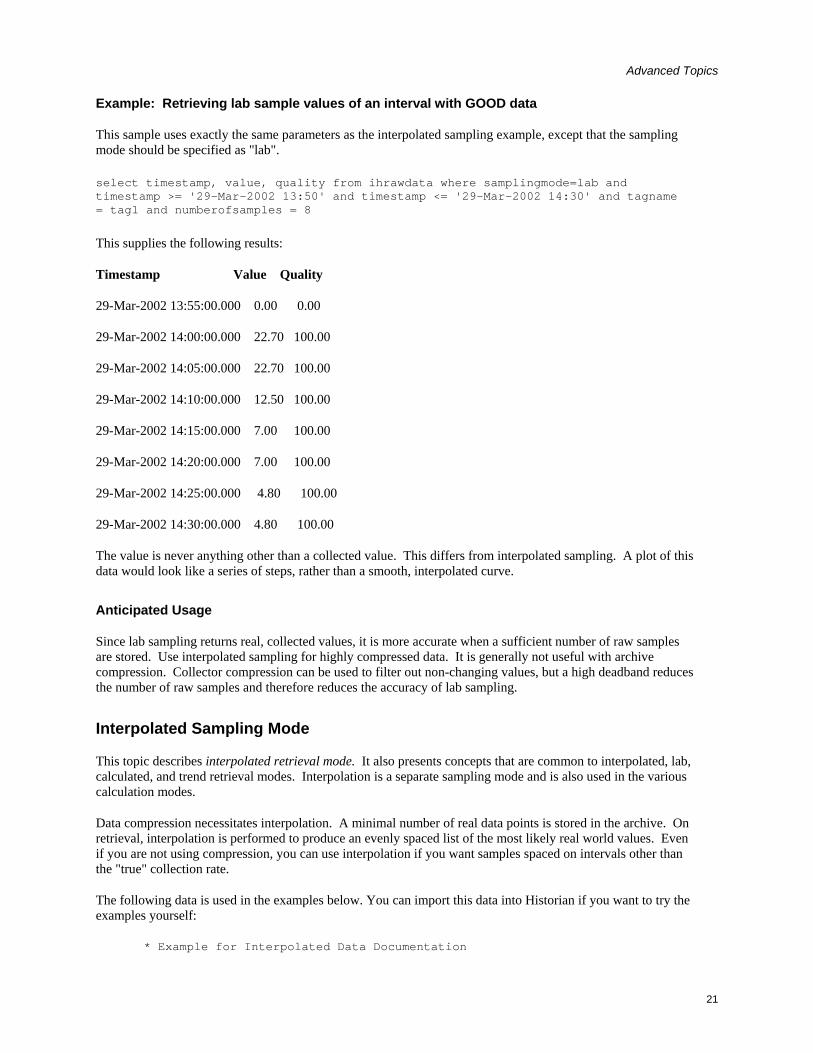
Example: Retrieving lab sample values of an interval with GOOD data
This sample uses exactly the same parameters as the interpolated sampling example, except that the sampling mode should be specified as "lab".
select timestamp, value, quality from ihrawdata where samplingmode=lab and timestamp >= '29-Mar-2002 13:50' and timestamp <= '29-Mar-2002 14:30' and tagname = tag1 and numberofsamples = 8
This supplies the following results:
Timestamp Value Quality
29-Mar-2002 13:55:00.000 0.00 0.00
29-Mar-2002 14:00:00.000 22.70 100.00
29-Mar-2002 14:05:00.000 22.70 100.00
29-Mar-2002 14:10:00.000 12.50 100.00
29-Mar-2002 14:15:00.000 7.00 100.00
29-Mar-2002 14:20:00.000 7.00 100.00
29-Mar-2002 14:25:00.000 4.80 100.00
29-Mar-2002 14:30:00.000 4.80 100.00
The value is never anything other than a collected value. This differs from interpolated sampling. A plot of this data would look like a series of steps, rather than a smooth, interpolated curve.
Anticipated Usage
Since lab sampling returns real, collected values, it is more accurate when a sufficient number of raw samples are stored. Use interpolated sampling for highly compressed data. It is generally not useful with archive compression. Collector compression can be used to filter out non-changing values, but a high deadband reduces the number of raw samples and therefore reduces the accuracy of lab sampling.
Interpolated Sampling Mode
This topic describes interpolated retrieval mode. It also presents concepts that are common to interpolated, lab, calculated, and trend retrieval modes. Interpolation is a separate sampling mode and is also used in the various calculation modes.
Data compression necessitates interpolation. A minimal number of real data points is stored in the archive. On retrieval, interpolation is performed to produce an evenly spaced list of the most likely real world values. Even if you are not using compression, you can use interpolation if you want samples spaced on intervals other than the "true" collection rate.
The following data is used in the examples below. You can import this data into Historian if you want to try the examples yourself:
* Example for Interpolated Data Documentation
21
Advanced Topics Guide
*
[Tags]
Tagname,DataType,HiEngineeringUnits,LoEngineeringUnits
TAG1,SingleFloat,60,0
BADDQTAG,SingleFloat,60,0
[Data]
Tagname,TimeStamp,Value,DataQuality
TAG1,29-Mar-2002 13:59:00.000,22.7,Good
TAG1,29-Mar-2002 14:08:00.000,12.5,Good
TAG1,29-Mar-2002 14:14:00.000,7.0,Good
TAG1,29-Mar-2002 14:22:00.000,4.8,Good
BADDQTAG,29-Mar-2002 13:59:00.000,22.7,Good
BADDQTAG,29-Mar-2002 14:08:00.000,12.5,Bad
BADDQTAG,29-Mar-2002 14:14:00.000,7.0,Bad
BADDQTAG,29-Mar-2002 14:22:00.000,4.8,Good
Timestamp
All sampling and calculation modes (except raw sampling) use the same method for creating intervals from the start and end time. Raw retrieval has no intervals, only a start and end time. Each mode differs in how it arrives at the value to assign to that interval.
The simplest case is when the interval is evenly divisible by the number of samples or by the interval in milliseconds. For example, the start and end times are one hour apart and you want data at ten-minute intervals, or 6 samples. The first time stamp occurs at the start time + one interval and represents the samples from a point greater than the start time to less than or equal to the interval time stamp.
Example: Determining interval timestamps for evenly divisible duration
Step 1: Import this data into the Historian. There is only a tag, with no data.
[Tags]
Tagname,DataType,HiEngineeringUnits,LoEngineeringUnits
c1,SingleFloat,100,0
Step 2: Retrieve data for that tag over a 1-hour duration with a 10-minute interval. Use the following query:
select timestamp from ihrawdata where timestamp >= 14:00 and timestamp <= 15:00 and tagname = c1 and numberofsamples = 6
or this query
22
Advanced Topics
select timestamp from ihrawdata where timestamp >= 14:00 and timestamp <= 15:00 and tagname = c1 and Intervalmilliseconds = 10M
Both SQL queries result in the same intervals and interval timestamps:
3/29/2002 14:10:00
3/29/2002 14:20:00
3/29/2002 14:30:00
3/29/2002 14:40:00
3/29/2002 14:50:00
3/29/2002 15:00:00
When the 1-hour duration is not evenly divisible, interval timestamps will include milliseconds even if the data samples do not use a resolution of milliseconds.
Example: Determining interval timestamps for a non-divisible duration
Divide the one hour duration from previous example into 7 intervals:
select timestamp from ihrawdata where timestamp >= 14:00 and timestamp <= 15:00 and tagname = c1 and numberofsamples = 7
3/29/2002 14:08:34.285
3/29/2002 14:17:08.571
3/29/2002 14:25:42.857
3/29/2002 14:34:17.142
3/29/2002 14:42:51.428
3/29/2002 14:51:25.714
3/29/2002 14:59:59.999
Note: Trend sampling determines intervals using a different method, described in the trend sampling topic.
Value
The logic for determining the value through interpolation is as follows:
• Attribute samples to intervals: Any raw sample is attributed to exactly one interval based on the raw sample and interval time stamp. The rule is that the sample has to have a time stamp greater than the interval start time, but less than or equal to the end time. This is because the end timestamp of the interval is the start timestamp on the next interval.
• Interpolate a value at each interval end time: For each interval end time, find the raw point before and after the end time. The interval time stamp is the interval end time; we can then interpolate the
23

Advanced Topics Guide
value at that time.
Example: Determining interval interpolated value
This example shows how linear interpolation determines the most likely real world value at the interval timestamp.
Using the same data set as above, there are raw points at
14:08:00.000,12.5,Good
14:14:00.000,7.0,Good
and you are trying to get an interpolated value at 14:10. The calculation used for linear interpolation would be:
interpolated value = previous raw sample + ((deltaY/deltaX) * offset)
Substituting the numbers for this example:
deltaY = 7.0 - 12.5 = -5.5
deltaX = 14-8 = 6
offset = 2 seconds (from 14:08 to 14:10)
Interpolated value = 12.5 + ((-5.5/6)*2) = 10.67
About Interpolated Data Types: When interpolating data, the data type of the value will be the same data type as that of the tag's raw data. Only floating point and double floating point values can be interpolated. Integers, strings, and blobs cannot be interpolated. When attempting to interpolate string and integer data, inerpolation will simply repeat the collected value for each interval until the next collected value.
Example: Retrieving interpolated values of an interval with GOOD data
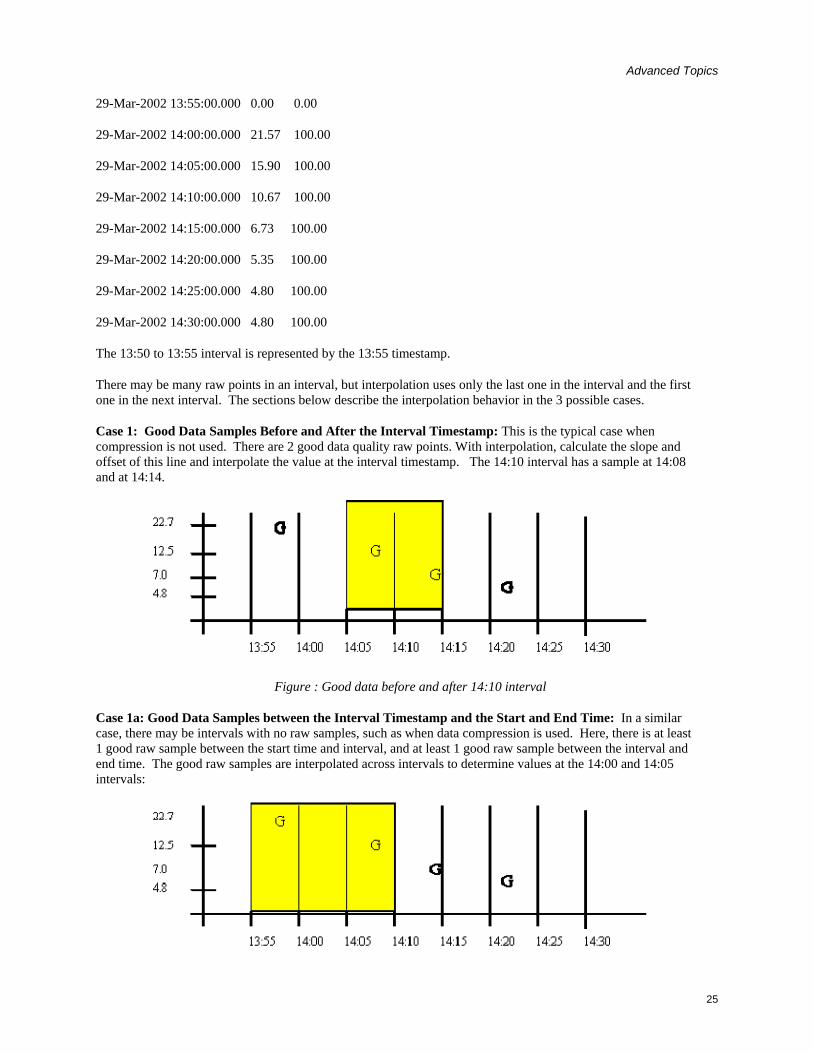
The raw samples for TAG1 can be plotted as follows. The “G” indicates a good data quality raw sample.
Use this SQL query to retrieve the data:
select timestamp, value, quality from ihrawdata where samplingmode=interpolated and timestamp >= '29-Mar-2002 13:50' and timestamp <= '29-Mar-2002 14:30' and tagname = tag1 and numberofsamples = 8
Timestamp Value Quality
24
Advanced Topics
29-Mar-2002 13:55:00.000 0.00 0.00
29-Mar-2002 14:00:00.000 21.57 100.00
29-Mar-2002 14:05:00.000 15.90 100.00
29-Mar-2002 14:10:00.000 10.67 100.00
29-Mar-2002 14:15:00.000 6.73 100.00
29-Mar-2002 14:20:00.000 5.35 100.00
29-Mar-2002 14:25:00.000 4.80 100.00
29-Mar-2002 14:30:00.000 4.80 100.00
The 13:50 to 13:55 interval is represented by the 13:55 timestamp.
There may be many raw points in an interval, but interpolation uses only the last one in the interval and the first one in the next interval. The sections below describe the interpolation behavior in the 3 possible cases.
Case 1: Good Data Samples Before and After the Interval Timestamp: This is the typical case when compression is not used. There are 2 good data quality raw points. With interpolation, calculate the slope and offset of this line and interpolate the value at the interval timestamp. The 14:10 interval has a sample at 14:08 and at 14:14.
Figure : Good data before and after 14:10 interval
Case 1a: Good Data Samples between the Interval Timestamp and the Start and End Time: In a similar case, there may be intervals with no raw samples, such as when data compression is used. Here, there is at least 1 good raw sample between the start time and interval, and at least 1 good raw sample between the interval and end time. The good raw samples are interpolated across intervals to determine values at the 14:00 and 14:05 intervals:
25
Advanced Topics Guide
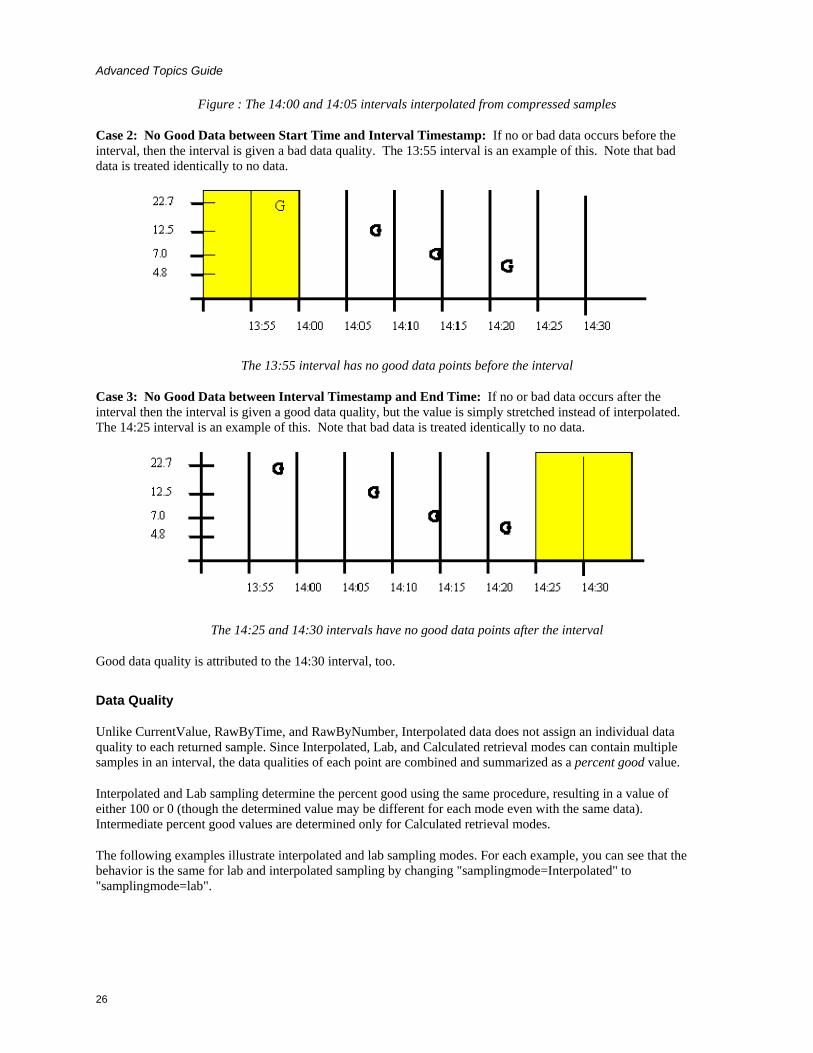
Figure : The 14:00 and 14:05 intervals interpolated from compressed samples
Case 2: No Good Data between Start Time and Interval Timestamp: If no or bad data occurs before the interval, then the interval is given a bad data quality. The 13:55 interval is an example of this. Note that bad data is treated identically to no data.
The 13:55 interval has no good data points before the interval
Case 3: No Good Data between Interval Timestamp and End Time: If no or bad data occurs after the interval then the interval is given a good data quality, but the value is simply stretched instead of interpolated. The 14:25 interval is an example of this. Note that bad data is treated identically to no data.
The 14:25 and 14:30 intervals have no good data points after the interval
Good data quality is attributed to the 14:30 interval, too.
Data Quality
Unlike CurrentValue, RawByTime, and RawByNumber, Interpolated data does not assign an individual data quality to each returned sample. Since Interpolated, Lab, and Calculated retrieval modes can contain multiple samples in an interval, the data qualities of each point are combined and summarized as a percent good value.
Interpolated and Lab sampling determine the percent good using the same procedure, resulting in a value of either 100 or 0 (though the determined value may be different for each mode even with the same data). Intermediate percent good values are determined only for Calculated retrieval modes.
The following examples illustrate interpolated and lab sampling modes. For each example, you can see that the behavior is the same for lab and interpolated sampling by changing "samplingmode=Interpolated" to "samplingmode=lab".
26
Advanced Topics
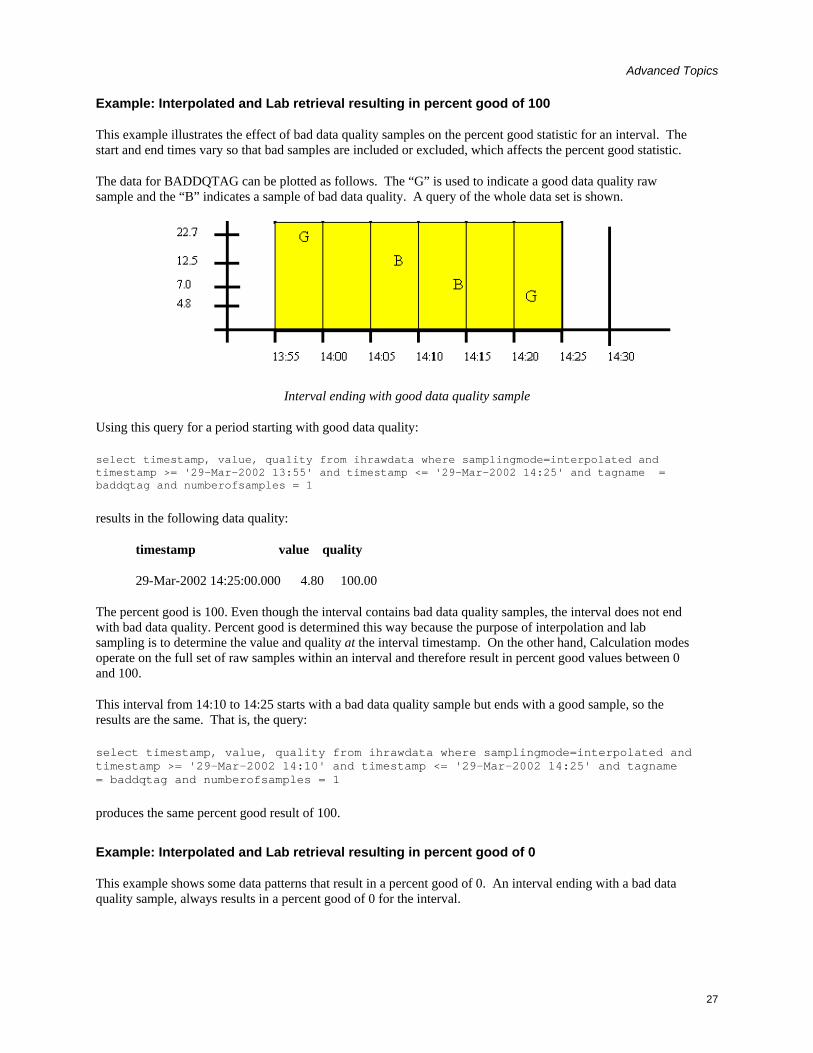
Example: Interpolated and Lab retrieval resulting in percent good of 100
This example illustrates the effect of bad data quality samples on the percent good statistic for an interval. The start and end times vary so that bad samples are included or excluded, which affects the percent good statistic.
The data for BADDQTAG can be plotted as follows. The “G” is used to indicate a good data quality raw sample and the “B” indicates a sample of bad data quality. A query of the whole data set is shown.
Interval ending with good data quality sample
Using this query for a period starting with good data quality:
select timestamp, value, quality from ihrawdata where samplingmode=interpolated and timestamp >= '29-Mar-2002 13:55' and timestamp <= '29-Mar-2002 14:25' and tagname = baddqtag and numberofsamples = 1
results in the following data quality:
timestamp value quality
29-Mar-2002 14:25:00.000 4.80 100.00
The percent good is 100. Even though the interval contains bad data quality samples, the interval does not end with bad data quality. Percent good is determined this way because the purpose of interpolation and lab sampling is to determine the value and quality at the interval timestamp. On the other hand, Calculation modes operate on the full set of raw samples within an interval and therefore result in percent good values between 0 and 100.
This interval from 14:10 to 14:25 starts with a bad data quality sample but ends with a good sample, so the results are the same. That is, the query:
select timestamp, value, quality from ihrawdata where samplingmode=interpolated and timestamp >= '29-Mar-2002 14:10' and timestamp <= '29-Mar-2002 14:25' and tagname = baddqtag and numberofsamples = 1
produces the same percent good result of 100.
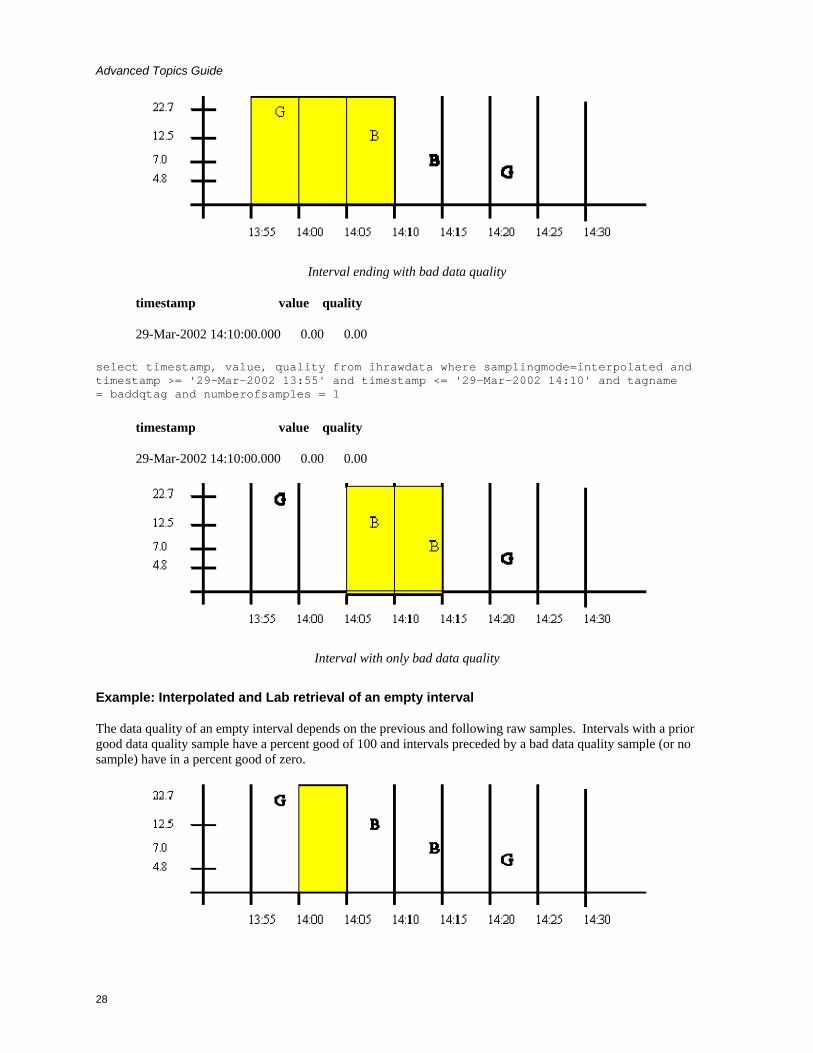
Example: Interpolated and Lab retrieval resulting in percent good of 0
This example shows some data patterns that result in a percent good of 0. An interval ending with a bad data quality sample, always results in a percent good of 0 for the interval.
27
Advanced Topics Guide
Interval ending with bad data quality
timestamp value quality
29-Mar-2002 14:10:00.000 0.00 0.00
select timestamp, value, quality from ihrawdata where samplingmode=interpolated and timestamp >= '29-Mar-2002 13:55' and timestamp <= '29-Mar-2002 14:10' and tagname = baddqtag and numberofsamples = 1
timestamp value quality
29-Mar-2002 14:10:00.000 0.00 0.00
Interval with only bad data quality
Example: Interpolated and Lab retrieval of an empty interval
The data quality of an empty interval depends on the previous and following raw samples. Intervals with a prior good data quality sample have a percent good of 100 and intervals preceded by a bad data quality sample (or no sample) have in a percent good of zero.
28

Advanced Topics
Figure: Empty interval of Good Data Quality
This query results in a percent good of 100:
select timestamp, value, quality from ihrawdata where samplingmode=interpolated and timestamp >= '29-Mar-2002 14:00' and timestamp <= '29-Mar-2002 14:05' and tagname = baddqtag and numberofsamples = 1
Figure: Empty intervals with Bad data quality
Both of these queries produce a percent good of 0. The first has no preceding sample and the second is preceded by bad data:
select timestamp, value, quality from ihrawdata where samplingmode=interpolated and timestamp >= '29-Mar-2002 13:50' and timestamp <= '29-Mar-2002 13:55' and tagname = baddqtag and numberofsamples = 1
select timestamp, value, quality from ihrawdata where samplingmode=interpolated and timestamp >= '29-Mar-2002 14:15' and timestamp <= '29-Mar-2002 14:20' and tagname = baddqtag and numberofsamples = 1
The lab retrieval at 14:15 has a value of 7 but quality of 0. Note that you should almost always ignore specific values when the percent good is 0.
Raw Data Sampling Modes
To use raw data retrieval, you need only specify a start and end time, or a start time and number of samples. Any specified interval duration is ignored. Raw data may be retrieved using one of two methods:
• RawByTime retrieval: Specify a start and end time for data retrieval. RawByTime returns all raw samples of all qualities with a time stamp greater than the start time and less than or equal to the end time. It will not return a raw sample with same time stamp as the start time. NumberOfSamples is ignored and all raw samples will be returned.
• RawByNumber retrieval: Specify a start time, a number of samples, and a direction (forward or backward). RawByNumber retrieval returns X raw samples of all qualities starting from a time stamp of the indicated start time, moving in the specified direction. It will return a raw sample with the same time stamp as the start time. If there is no sample at the specified start time, the retrieval count begins at the next sample.
Each sample has the following attributes:
• Timestamp: The time stamp sent by the collector along with the raw sample.
29

Advanced Topics Guide
• Value: The value sent by the collector along with the raw sample.
• Data Quality: The quality of data sent by the collector, as set by the collector.
Archive compression can reduce the number of raw samples stored in the archive. Archive compression may discard raw samples sent by the collector; these are not stored as raw samples and would not be returned by raw data retrieval.
If the current value has not been stored as a raw sample, will not be returned by a raw data retrieval.
If they exist within the requested time period, collected samples with a bad data quality and collector startup and shutdown markers will be returned in a raw data query.
Example: RawByTime retrieval of samples over a period of replaced data
Step 1: Import this data into the Historian:
[Tags]
Tagname,DataType,HiEngineeringUnits,LoEngineeringUnits
RAWTAG,SingleInteger,100,0
[Data]
Tagname,TimeStamp,Value,DataQuality
RAWTAG,29-Mar-2002 13:59:00.000,7,Good
RAWTAG,29-Mar-2002 14:08:00.000,8,Bad
Step 2: Import this data into the Historian so that there is replaced data:
[Data]
Tagname,TimeStamp,Value,DataQuality
RAWTAG,29-Mar-2002 13:59:00.000,22,Good
RAWTAG,29-Mar-2002 14:08:00.000,12,Bad
RAWTAG,29-Mar-2002 14:22:00.000,4,Good
Step 3: Retrieve the data using this RawByTime query
select timestamp, value, quality from ihrawdata where samplingmode=rawbytime and timestamp>='29-Mar-2002 13:59' and timestamp<='29-Mar-2002 14:22' and tagname=rawtag
The following results are obtained:
30
Advanced Topics
TimeStamp Value Quality
29-Mar-2002 14:08:00.000 12 Bad NonSpecific
29-Mar-2002 14:22:00.000 4 Good NonSpecific
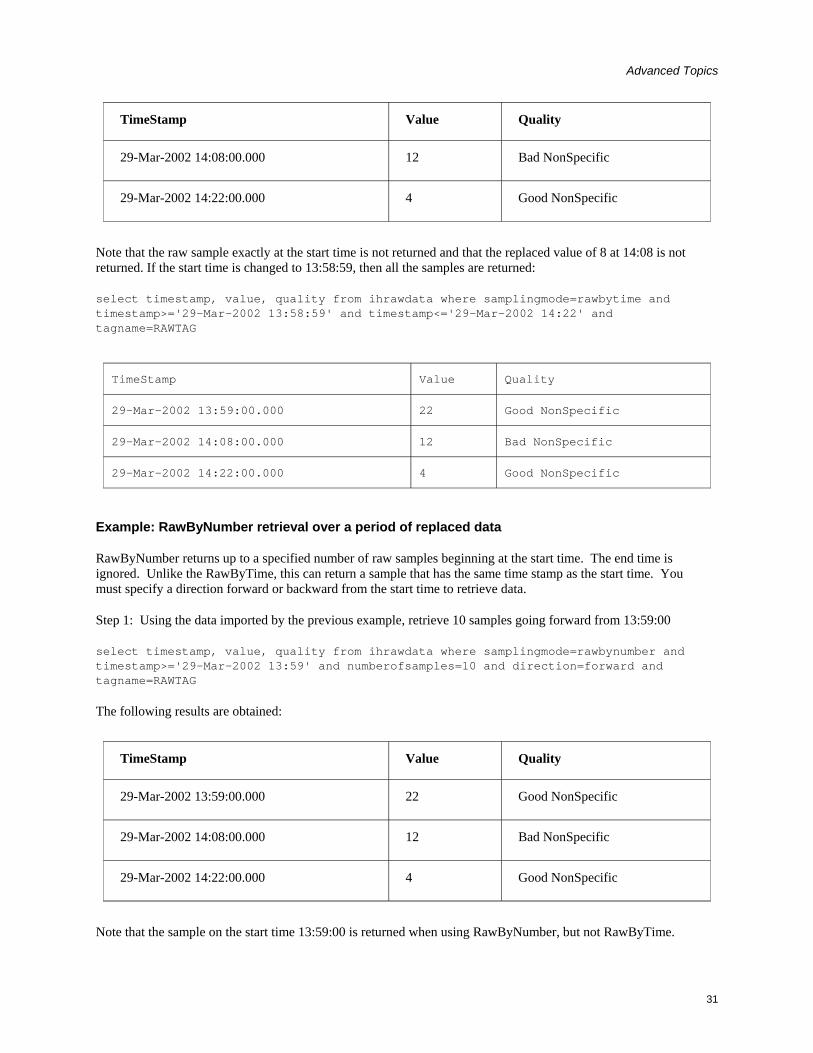
Note that the raw sample exactly at the start time is not returned and that the replaced value of 8 at 14:08 is not returned. If the start time is changed to 13:58:59, then all the samples are returned:
select timestamp, value, quality from ihrawdata where samplingmode=rawbytime and timestamp>='29-Mar-2002 13:58:59' and timestamp<='29-Mar-2002 14:22' and tagname=RAWTAG
TimeStamp Value Quality
29-Mar-2002 13:59:00.000 22 Good NonSpecific
29-Mar-2002 14:08:00.000 12 Bad NonSpecific
29-Mar-2002 14:22:00.000 4 Good NonSpecific
Example: RawByNumber retrieval over a period of replaced data
RawByNumber returns up to a specified number of raw samples beginning at the start time. The end time is ignored. Unlike the RawByTime, this can return a sample that has the same time stamp as the start time. You must specify a direction forward or backward from the start time to retrieve data.
Step 1: Using the data imported by the previous example, retrieve 10 samples going forward from 13:59:00
select timestamp, value, quality from ihrawdata where samplingmode=rawbynumber and timestamp>='29-Mar-2002 13:59' and numberofsamples=10 and direction=forward and tagname=RAWTAG
The following results are obtained:
TimeStamp Value Quality
29-Mar-2002 13:59:00.000 22 Good NonSpecific
29-Mar-2002 14:08:00.000 12 Bad NonSpecific
29-Mar-2002 14:22:00.000 4 Good NonSpecific
Note that the sample on the start time 13:59:00 is returned when using RawByNumber, but not RawByTime.
31
Advanced Topics Guide
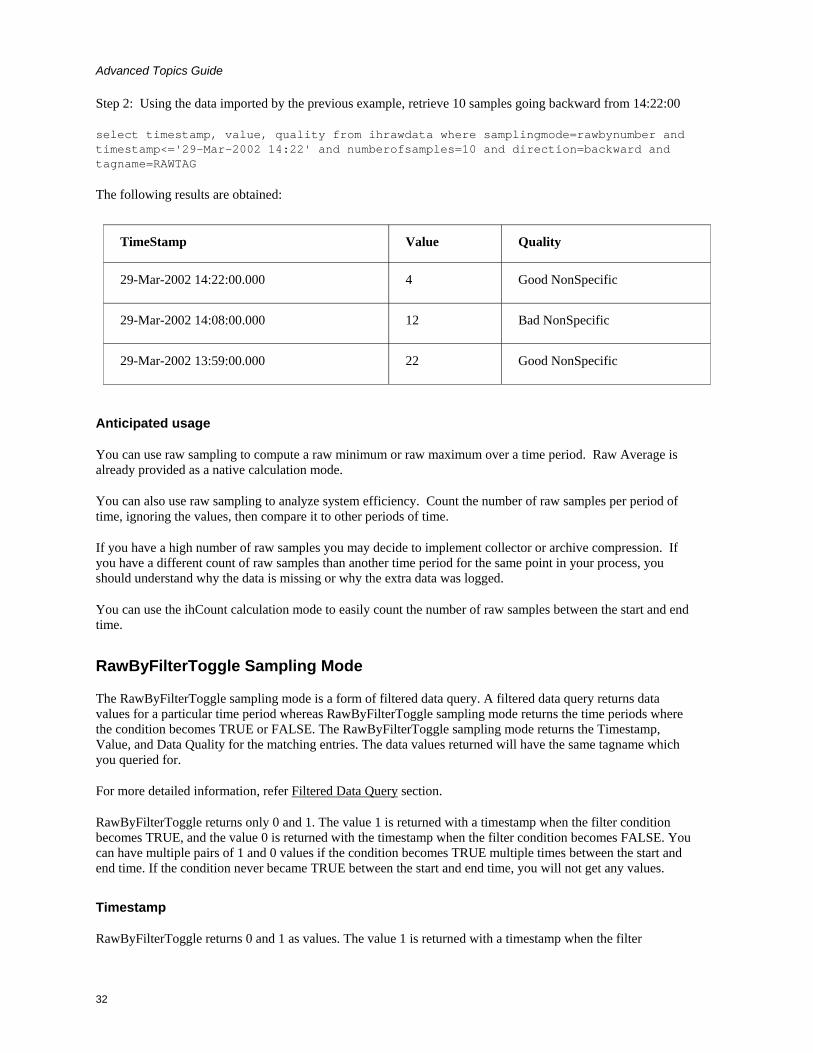
Step 2: Using the data imported by the previous example, retrieve 10 samples going backward from 14:22:00
select timestamp, value, quality from ihrawdata where samplingmode=rawbynumber and timestamp<='29-Mar-2002 14:22' and numberofsamples=10 and direction=backward and tagname=RAWTAG
The following results are obtained:
TimeStamp Value Quality
29-Mar-2002 14:22:00.000 4 Good NonSpecific
29-Mar-2002 14:08:00.000 12 Bad NonSpecific
29-Mar-2002 13:59:00.000 22 Good NonSpecific
Anticipated usage
You can use raw sampling to compute a raw minimum or raw maximum over a time period. Raw Average is already provided as a native calculation mode.
You can also use raw sampling to analyze system efficiency. Count the number of raw samples per period of time, ignoring the values, then compare it to other periods of time.
If you have a high number of raw samples you may decide to implement collector or archive compression. If you have a different count of raw samples than another time period for the same point in your process, you should understand why the data is missing or why the extra data was logged.
You can use the ihCount calculation mode to easily count the number of raw samples between the start and end time.
RawByFilterToggle Sampling Mode
The RawByFilterToggle sampling mode is a form of filtered data query. A filtered data query returns data values for a particular time period whereas RawByFilterToggle sampling mode returns the time periods where the condition becomes TRUE or FALSE. The RawByFilterToggle sampling mode returns the Timestamp, Value, and Data Quality for the matching entries. The data values returned will have the same tagname which you queried for.
For more detailed information, refer Filtered Data Query section.
RawByFilterToggle returns only 0 and 1. The value 1 is returned with a timestamp when the filter condition becomes TRUE, and the value 0 is returned with the timestamp when the filter condition becomes FALSE. You can have multiple pairs of 1 and 0 values if the condition becomes TRUE multiple times between the start and end time. If the condition never became TRUE between the start and end time, you will not get any values.
Timestamp
RawByFilterToggle returns 0 and 1 as values. The value 1 is returned with a timestamp when the filter
32

Advanced Topics
condition becomes TRUE, and the value 0 is returned with the timestamp when the filter condition becomes FALSE. You can have multiple pairs of 1 and 0 values if the condition becomes TRUE multiple times between the start and end time. If the condition never became TRUE between the start and end time, you will not get any values. You can use a filterexpression to return the time ranges that match the criteria.
The RawByFilterToggle sampling mode can return any timestamp between the start and end time, depending on if and when the condition becomes TRUE or FALSE. The timestamps returned can be queried further using RawByTime, RawByNumber, Interpolated, or any other sampling or calculation mode.
A RawByTime query returns a time range which does not include the start time but does include the end time. This is an OPC standard. If you want to return the valid time ranges including the start time but excluding the end time, then you must subtract a nano microsecond from the start and end time. For more information, refer RawByTime in Raw Data Sampling Modes section.
Value
This sampling mode only returns 0 and 1 as values. The value 1 is returned with a timestamp where the filter condition is TRUE and 0 is returned with the timestamp where the filter condition is FALSE.
Data Quality
The RawByFilterToggle considers only Good quality data.
Retrieving Data Using RawByFilterToggle Sampling Mode
The following two examples use this data that is imported into Proficy Historian. This data will be used in the examples for retrieving data with the RawByFilterToggle sampling mode.
[Tags]
Tagname,DataType,HiEngineeringUnits,LoEngineeringUnits
RAMP,SingleInteger,10,0
[Data]
Tagname,TimeStamp,Value,Data Quality
RAMP,25-Feb-2013 07:00:00.000,0,Good,
RAMP,25-Feb-2013 07:00:01.000,1,Good,
RAMP,25-Feb-2013 07:00:02.000,2,Good,
RAMP,25-Feb-2013 07:00:03.000,3,Good,
RAMP,25-Feb-2013 07:00:04.000,4,Good,
RAMP,25-Feb-2013 07:00:05.000,5,Good,
RAMP,25-Feb-2013 07:00:06.000,6,Good,
RAMP,25-Feb-2013 07:00:07.000,7,Good,
RAMP,25-Feb-2013 07:00:08.000,8,Good,
RAMP,25-Feb-2013 07:00:09.000,9,Good,
33
Advanced Topics Guide
RAMP,25-Feb-2013 07:00:10.000,10,Good,
RAMP,25-Feb-2013 07:00:11.000,11,Good,
RAMP,25-Feb-2013 07:00:12.000,12,Good,
RAMP,25-Feb-2013 07:00:13.000,13,Good,
RAMP,25-Feb-2013 07:00:14.000,14,Good,
RAMP,25-Feb-2013 07:00:15.000,15,Good,
RAMP,25-Feb-2013 07:00:16.000,16,Good,
RAMP,25-Feb-2013 07:00:17.000,17,Good,
RAMP,25-Feb-2013 07:00:18.000,18,Good,
RAMP,25-Feb-2013 07:00:19.000,19,Good,
RAMP,25-Feb-2013 07:00:20.000,20,Good,
RAMP,25-Feb-2013 07:00:21.000,21,Good,
RAMP,25-Feb-2013 07:00:22.000,22,Good,
RAMP,25-Feb-2013 07:00:23.000,23,Good,
RAMP,25-Feb-2013 07:00:24.000,24,Good,
RAMP,25-Feb-2013 07:00:25.000,25,Good,
RAMP,25-Feb-2013 07:00:26.000,26,Good,
RAMP,25-Feb-2013 07:00:27.000,27,Good,
RAMP,25-Feb-2013 07:00:28.000,28,Good,
RAMP,25-Feb-2013 07:00:29.000,29,Good,
RAMP,25-Feb-2013 07:00:30.000,30,Good,
RAMP,25-Feb-2013 07:00:31.000,31,Good,
RAMP,25-Feb-2013 07:00:32.000,32,Good,
RAMP,25-Feb-2013 07:00:33.000,33,Good,
RAMP,25-Feb-2013 07:00:34.000,34,Good,
RAMP,25-Feb-2013 07:00:35.000,35,Good,
RAMP,25-Feb-2013 07:00:36.000,36,Good,
RAMP,25-Feb-2013 07:00:37.000,37,Good,
RAMP,25-Feb-2013 07:00:38.000,38,Good,
RAMP,25-Feb-2013 07:00:39.000,39,Good,
RAMP,25-Feb-2013 07:00:40.000,40,Good,
RAMP,25-Feb-2013 07:00:41.000,41,Good,
34

Advanced Topics
RAMP,25-Feb-2013 07:00:42.000,42,Good,
RAMP,25-Feb-2013 07:00:43.000,43,Good,
RAMP,25-Feb-2013 07:00:44.000,44,Good,
RAMP,25-Feb-2013 07:00:45.000,45,Good,
RAMP,25-Feb-2013 07:00:46.000,46,Good,
RAMP,25-Feb-2013 07:00:47.000,47,Good,
RAMP,25-Feb-2013 07:00:48.000,48,Good,
RAMP,25-Feb-2013 07:00:49.000,49,Good,
RAMP,25-Feb-2013 07:00:50.000,50,Good,
RAMP,25-Feb-2013 07:00:51.000,51,Good,
RAMP,25-Feb-2013 07:00:52.000,52,Good,
RAMP,25-Feb-2013 07:00:53.000,53,Good,
RAMP,25-Feb-2013 07:00:54.000,54,Good,
RAMP,25-Feb-2013 07:00:55.000,55,Good,
RAMP,25-Feb-2013 07:00:56.000,56,Good,
RAMP,25-Feb-2013 07:00:57.000,57,Good,
RAMP,25-Feb-2013 07:00:58.000,58,Good,
RAMP,25-Feb-2013 07:00:59.000,59,Good,
Example 1: Determining the Time Range After the Condition Became TRUE
An example of a Query using RawByFilterToggle sampling mode is as follows:
set starttime=’02/25/2013 07:00:00’, endtime=’02/25/2013 07:10:00’ select timestamp, value, quality from ihrawdata where tagname = RAMP and samplingmode= rawbyfiltertoggle and filterexpression=’(RAMP>50)’ and filtermode=AfterTime
This query would determine when the ramp value exceeded 50 and returns the time range after that.
The following results are obtained:
TimeStamp Value Quality
02/25/2013 07:00:00 0 Good NonSpecific
02/25/2013 07:00:51 1 Good NonSpecific
02/25/2013 07:10:00 1 Good NonSpecific
35
Advanced Topics Guide
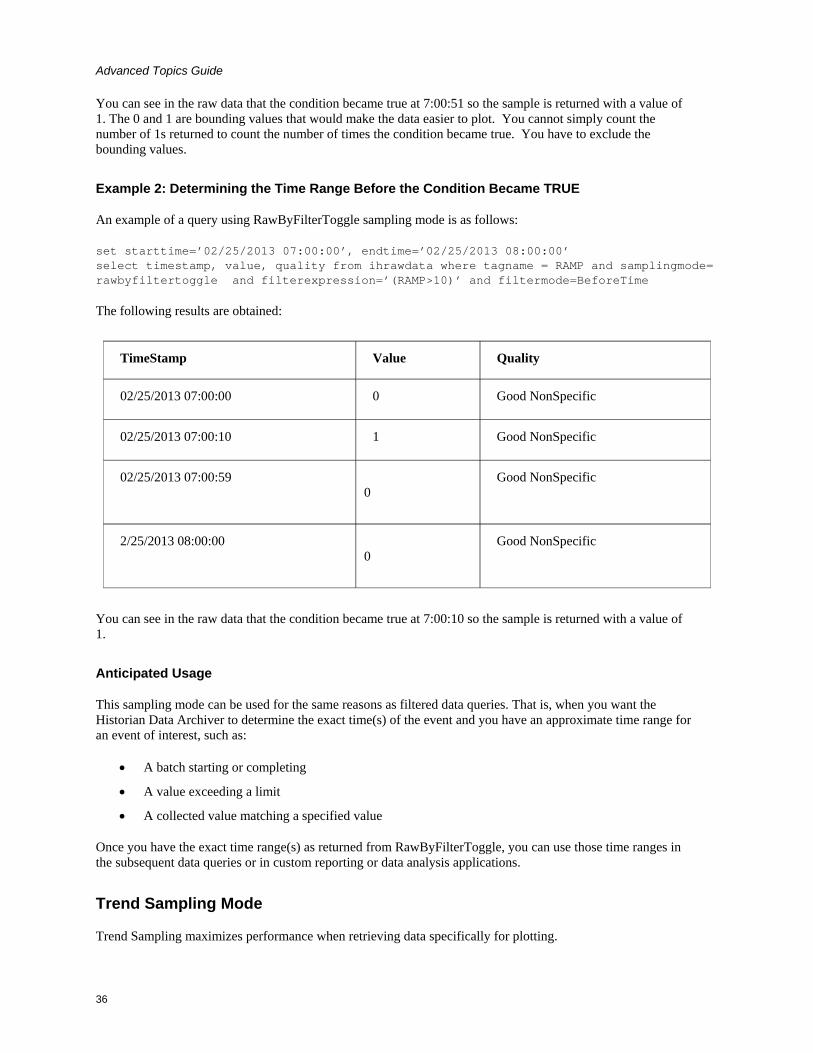
You can see in the raw data that the condition became true at 7:00:51 so the sample is returned with a value of 1. The 0 and 1 are bounding values that would make the data easier to plot. You cannot simply count the number of 1s returned to count the number of times the condition became true. You have to exclude the bounding values.
Example 2: Determining the Time Range Before the Condition Became TRUE
An example of a query using RawByFilterToggle sampling mode is as follows:
set starttime=’02/25/2013 07:00:00’, endtime=’02/25/2013 08:00:00’ select timestamp, value, quality from ihrawdata where tagname = RAMP and samplingmode= rawbyfiltertoggle and filterexpression=’(RAMP>10)’ and filtermode=BeforeTime
The following results are obtained:
TimeStamp Value Quality
02/25/2013 07:00:00 0 Good NonSpecific
02/25/2013 07:00:10 1 Good NonSpecific
02/25/2013 07:00:59 0
Good NonSpecific
2/25/2013 08:00:00 0
Good NonSpecific
You can see in the raw data that the condition became true at 7:00:10 so the sample is returned with a value of 1.
Anticipated Usage
This sampling mode can be used for the same reasons as filtered data queries. That is, when you want the Historian Data Archiver to determine the exact time(s) of the event and you have an approximate time range for an event of interest, such as:
• A batch starting or completing
• A value exceeding a limit
• A collected value matching a specified value
Once you have the exact time range(s) as returned from RawByFilterToggle, you can use those time ranges in the subsequent data queries or in custom reporting or data analysis applications.
Trend Sampling Mode
Trend Sampling maximizes performance when retrieving data specifically for plotting.
36
Advanced Topics
The trend sampling mode identifies significant points and returns them to the caller. These will be raw samples. Significant points are established by finding the raw minimum and raw maximum values within each interval. Note that this is not the same as finding the change in slope direction of a line, as archive compression does.
Trend sampling approximates a high resolution trend with only as much detail as could be drawn on the screen. For example, say you are about to draw a trend on the screen and you know that the area with the trend graph is only 100 pixels wide. You could not possibly represent any more than 100 points in those 100 pixels. By using the Trend sampling type, you can ensure you retrieve adjacent highs and lows to draw a visually accurate trend with only 100 points, regardless of whether the time period was one year or one hour.
Since Trend sampling does not need to acquire all data between the specified start and end times, it is a very efficient method of data retrieval, especially for large data sets. Depending on the requested start and end times (and the amount of data stored for that interval), it could be as much as 100 times faster than other methods.
When displaying data for reports or examination, this principle can be applied to other sampling types too. It is highly inefficient to trend data at a higher resolution than can be drawn on screen or printed on hard copy. This is useful even for calculation modes like "Average value". It is not suitable for Interpolated mode, since this results in a loss of detail that ihTrend sampling attempts to recapture.
The ihTrend sampling type returns adjacent highs and lows within each interval. If you ask for 100 samples, you will effectively receive 50 high values and 50 low values over 100 intervals. The retrieval process works as follows:
Step 1: Divide the query duration into even-length intervals, like other sampling modes.
Step 2: Determine the raw minimum and raw maximum for each interval. If there is only one point, then that is both the minimum and maximum.
Step 3: Since we want to return 2 samples per interval (a minimum and a maximum), we need twice as many intervals. Divide each interval in half. For example, a one hour interval of 01:00:00 to 02:00:00 becomes 2 intervals (01:00:00 to 01:30:00) and (01:30:00 to 02:00:00)
Step 4: Put the minimum in one half-interval and the maximum in the other. If minimum comes before maximum, put the minimum in the first half-interval and the maximum in second half-interval, and vice versa.
When doing filtered data queries, your maximum returned intervals must pass the throttle, even if only a few intervals actually match the filtered criteria.
Timestamp
There is no difference between full-interval timestamps and half-interval timestamps. Both are valid and all interval timestamps are in ascending order.
Trend sampling will always have an even number of samples, rounded up when necessary. For example, if you request num samples = 7 or num samples = 8, you will get 8 samples.
If you request results by interval instead of number of samples, you will get back twice the number of results you expect. For example, a 5-minute interval for a 40-minute duration is normally 40 / 5 = 8 samples. But with trend sampling, you get 16 evenly-spaced intervals.
37
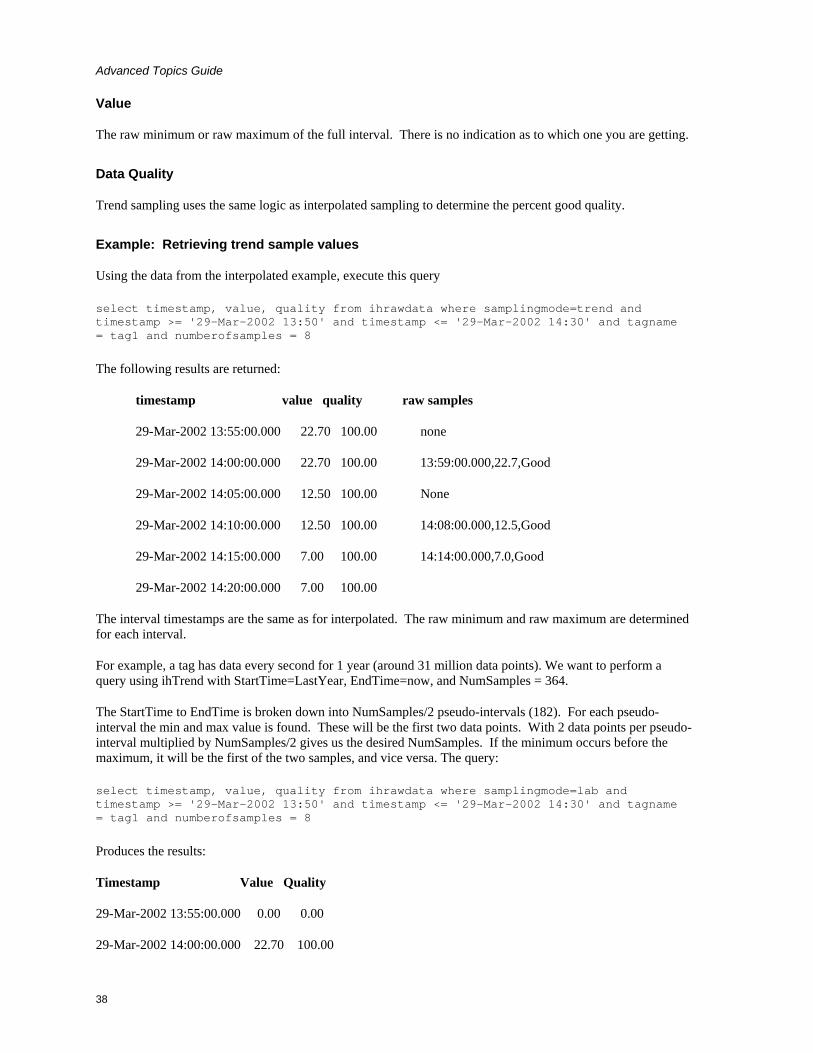
Advanced Topics Guide
Value
The raw minimum or raw maximum of the full interval. There is no indication as to which one you are getting.
Data Quality
Trend sampling uses the same logic as interpolated sampling to determine the percent good quality.
Example: Retrieving trend sample values
Using the data from the interpolated example, execute this query
select timestamp, value, quality from ihrawdata where samplingmode=trend and timestamp >= '29-Mar-2002 13:50' and timestamp <= '29-Mar-2002 14:30' and tagname = tag1 and numberofsamples = 8
The following results are returned:
timestamp value quality raw samples
29-Mar-2002 13:55:00.000 22.70 100.00 none
29-Mar-2002 14:00:00.000 22.70 100.00 13:59:00.000,22.7,Good
29-Mar-2002 14:05:00.000 12.50 100.00 None
29-Mar-2002 14:10:00.000 12.50 100.00 14:08:00.000,12.5,Good
29-Mar-2002 14:15:00.000 7.00 100.00 14:14:00.000,7.0,Good
29-Mar-2002 14:20:00.000 7.00 100.00
The interval timestamps are the same as for interpolated. The raw minimum and raw maximum are determined for each interval.
For example, a tag has data every second for 1 year (around 31 million data points). We want to perform a query using ihTrend with StartTime=LastYear, EndTime=now, and NumSamples = 364.
The StartTime to EndTime is broken down into NumSamples/2 pseudo-intervals (182). For each pseudo-interval the min and max value is found. These will be the first two data points. With 2 data points per pseudo-interval multiplied by NumSamples/2 gives us the desired NumSamples. If the minimum occurs before the maximum, it will be the first of the two samples, and vice versa. The query:
select timestamp, value, quality from ihrawdata where samplingmode=lab and timestamp >= '29-Mar-2002 13:50' and timestamp <= '29-Mar-2002 14:30' and tagname = tag1 and numberofsamples = 8
Produces the results:
Timestamp Value Quality
29-Mar-2002 13:55:00.000 0.00 0.00
29-Mar-2002 14:00:00.000 22.70 100.00
38

Advanced Topics
29-Mar-2002 14:05:00.000 22.70 100.00
29-Mar-2002 14:10:00.000 12.50 100.00
29-Mar-2002 14:15:00.000 7.00 100.00
29-Mar-2002 14:20:00.000 7.00 100.00
29-Mar-2002 14:25:00.000 4.80 100.00
29-Mar-2002 14:30:00.000 4.80 100.00
Example: Trend Data returned in the wrong interval
Note that, with trend sampling, data can be returned using an interval timestamp that does not contain the sample. A CSV file includes three values for each of 9 days:
[Data]
Tagname,TimeStamp,Value
Dfloattag5,01/05/03 8:00,95.00
Dfloattag5,01/05/03 15:00,88.00
Dfloattag5,01/05/03 16:00,80.00
Dfloattag5,01/06/03 7:00,11.00
Dfloattag5,01/06/03 10:00,13.00
Dfloattag5,01/06/03 13:00,93.00
Dfloattag5,01/07/03 8:00,99.0
Dfloattag5,01/07/03 11:00,86.0
Dfloattag5,01/07/03 12:00,16.0
Dfloattag5,01/08/03 8:00,0.00
Dfloattag5,01/08/03 12:00,99.00
Dfloattag5,01/08/03 14:00,100.00
If you use the following query:
Select timestamp,tagname,value Quality from ihrawdata where tagname =dfloattag5
And samplingmode= trend and intervalmilliseconds =24h
And timestamp> ‘1/02/2003 07:00:00’ and timestamp<= ‘01/10/2003 12:00:00’
Then the results include:
TimeStamp TagName Value Quality
6-Jan-2003 19:00:00 Dfloattag5 13.00 100
39

Advanced Topics Guide
7-Jan-2003 07:00:00 Dfloattag5 93.00 100
7-Jan-2003 19:00:00 Dfloattag5 99.00 100
8-Jan-2003 07:00:00 Dfloattag5 16.00 100
It is expected that the value 93 is listed for 1/6/03 19:00:00, since that is where the timestamp of the raw sample occurs. However, the maximum of 1/6/03 07:00:00 to 1/7/03 07:00:00 is:
Dfloattag5,01/06/03 13:00,93.00
which comes after the minimum of:
Dfloattag5,01/06/03 10:00,13.00
So it is placed in the second half-interval, even though its timestamp does not fall into the time range for that half-interval. Raw samples will never be placed in the wrong "real" interval, but may be placed in the wrong "fake" interval.
Anticipated Usage
Trend sampling is designed only for graphical plotting applications.
Hybrid Modes Hybrid mode is an advanced method of sampling collected data for trending. This mode of sampling has the ability to switch between sampled (like interpolated or trend) and raw data based on the actual and requested number of samples or a specified time interval. The purpose of these modes is to return the minimum number of points to speed and simplify trending .
Hybrid mode is available for Interpolated, Trend, and Lab modes of sampling. They are:
InterpolatedtoRaw
LabtoRaw
TrendtoRaw
• In all three hybrid modes, the behavior is as follows:
If the actual number of stored samples is more than requested you will receive sampled data (Interpolated, Lab, or Trend)
If the actual number of stored samples is fewer than requested you will receive the raw data samples.
Example Case for Hybrid Mode
This topic covers an example case of hybrid mode illustrating the switching of data between raw and calculated data.
Example: Data retrieval using InterpolatedtoRaw mode
The following data is used in the example below. You can import this data into Historian if you want to try the example yourself:
40

Advanced Topics
Tag1 5/16/2011 15:52:24 1,000.0000000 100.0000000
Tag1 5/16/2011 15:52:25 1,001.0000000 100.0000000
Tag1 5/16/2011 15:52:26 1,002.0000000 100.0000000
Tag1 5/16/2011 15:52:27 1,003.0000000 100.0000000
Tag1 5/16/2011 15:52:28 1,004.0000000 100.0000000
Tag1 5/16/2011 15:52:29 1,005.0000000 100.0000000
Tag1 5/16/2011 15:52:30 1,006.0000000 100.0000000
Case 1:
Use the following query to retrieve data for Tag 1 where it requests for 5 samples using InterpolatedtoRaw mode.
SET starttime= '5/16/2011 15:52:05 PM' , endtime= '5/16/2011 15:52:47 PM', numberofsamples = 5, samplingmode= Interpolatedtoraw
SELECT * FROM ihrawdata where tagname = "TAG1"
The query will return interpolated data as shown below because the actual number of raw samples (7) is greater than the requested number of samples (5):
tagname
timestamp value quality samplingmode numberofsa
mples
Tag1
5/16/2011 15:52:13
0.0000000 0.0000000
InterpolatedtoRaw
5
Tag1
5/16/2011 15:52:21
0.0000000 0.0000000
InterpolatedtoRaw
5
Tag1
5/16/2011 15:52:30
1,006.0000000
100.0000000
InterpolatedtoRaw
5
Tag1
Tag1 5/16/2011 15:52:38
1,006.0000000
100.0000000
InterpolatedtoRaw
5
Tag1
5/16/2011 15:52:47
1,006.0000000
100.0000000
InterpolatedtoRaw
5
Case 2:
41

Advanced Topics Guide
Use the following query to retrieve data for Tag 1 where it requests for 50 samples using InterpolatedtoRaw mode.
starttime= '5/16/2011 3:52:05 PM' , endtime= '5/16/2011 3:52:47 PM', numberofsamples = 50, samplingmode= Interpolatedtoraw
SELECT * FROM ihrawdata where tagname = "TAG1"
The query will return raw data as shown below because the actual sample count(7) is less than the requested sample count (50):
tagname
timestamp value quality samplingmode numberofsa
mples
Tag1
5/16/2011 15:52:24
1,000.0000000
100.0000000
InterpolatedtoRaw
50
Tag1
5/16/2011 15:52:25
1,001.0000000
100.0000000
InterpolatedtoRaw
50
Tag1
5/16/2011 15:52:26
1,002.0000000
100.0000000
InterpolatedtoRaw
50
Tag1
5/16/2011 15:52:27
1,003.0000000
100.0000000
InterpolatedtoRaw
50
Tag1
5/16/2011 15:52:28
1,004.0000000
100.0000000
InterpolatedtoRaw
50
Tag1
5/16/2011 15:52:29
1,005.0000000
100.0000000
InterpolatedtoRaw
50
Tag1
5/16/2011 15:52:30
1,006.0000000
100.0000000
InterpolatedtoRaw
50
Case 3:
Use the following query to retrieve data for Tag 1 where it requests for samples in a time interval (milliseconds), using InterpolatedtoRaw mode.
SET starttime= '5/16/2011 3:52:05 PM' , endtime= '5/16/2011 3:52:25 PM', intervalmilliseconds=10s , samplingmode= Interpolatedtoraw
42

Advanced Topics
Tag1 5/16/2011 15:52:24 1,000.0000000 100.0000000
Tag1 5/16/2011 15:52:25 1,001.0000000 100.0000000
The query will return raw data as shown below:
tagname timestamp value quality samplingmode
Tag1 5/16/2011 15:52:24
1,000.0000000 100.0000000 InterpolatedtoRaw
Tag1 5/16/2011 15:52:25
1,001.0000000 100.0000000 InterpolatedtoRaw
Calculation Modes This information is intended to supplement the information in the Historian electronic books and the SDK Help File.
Sampling and calculation modes are used on retrieval of data that has already been collected to the archive. Calculation modes are used when the sampling mode is set to "Calculated". It is helpful to separate the many modes into 3 main categories from simplest to most complex. A detailed explanation of the calculation modes with examples are discussed in following chapters.
Raw Calculation Modes – Easiest to understand. Only raw points are used to determine calculated value.
Count
RawTotal
RawAverage
RawStandardDeviation
FirstRawValue
FirstRawTime
LastRawValue
LastRawTime
Interpolated Calculation Modes – both raw and interpolated points are used to determine a value.
Minimum
MinimumTime
Maximum
MaximumTime
TimeGood
Time Weighted Calculation Modes – Most complicated. Time weighting on raw and interpolated points is
43
Advanced Topics Guide
used to determine a value.
Average
Total
StandardDeviation
Other Calculation Modes
STATECOUNT
STATETIME
OPCQOR and OPCQAND
TagStats
Each sample retrieved from Historian has a timestamp, value, and quality.
Timestamp - the same logic as for interpolated values. It is covered in detail in the Understanding Sampling Modes document and not covered at all in this document.
Value – depends entirely on the calculation mode being used
Quality - Depending on the calculation mode, this either means:
The percent of raw samples vs. total raw samples in the interval that were of good data quality.
The percent of time in the interval that the data was of good data quality
Filtered data queries are described in the Filtered Data Queries section.
Note on importing data for examples – This document intentionally contains all necessary data for executing the examples and reproducing the results. The tags and data are in the form of a CSV to be imported with the Historian File Collector. You will not be able to import the data unless you adjust the active hours setting and possibly the Create Offline Archives setting of the archiver. This is true any time you are importing old data with the File Collector. Refer the Historian EBook for more information.
Raw Calculation Modes
The calculation modes use only collected raw samples to determine the value for each interval.
Count mode
Counts the number of raw samples with good quality in the interval.
Value
The count of raw samples with good quality in the interval. The values of the each sample are ignored. The Count does not include any samples with bad quality, including the start and end of collection markers.
Quality
Percent good is always 100, even if the interval does not contain any raw samples or contains only bad quality samples.
44

Advanced Topics
Example: Calculating the count of raw samples
The following example demonstrates that only good samples are counted. Importing the following data ensures that at least one interval has 0 samples.
[Tags]
Tagname,DataType,HiEngineeringUnits,LoEngineeringUnits
COUNTTAG,SingleInteger,100,0
[Data]
Tagname,TimeStamp,Value,DataQuality
COUNTTAG,29-Mar-2002 13:59:00.000,22,Good
COUNTTAG,29-Mar-2002 14:08:00.000,12,Bad
COUNTTAG,29-Mar-2002 14:22:00.000,4,Good
The following query retrieves data with a start time of 14:00 and an end time of 14:30 with a 10-minute interval.
select timestamp, value, quality from ihrawdata where samplingmode=calculated and calculationmode=count and timestamp >= '29-Mar-2002 14:00' and timestamp <= '29-Mar-2002 14:30' and tagname = counttag and intervalmilliseconds = 10M
TimeStamp Value Quality
29-Mar-2002 14:10:00.000 0.00 100.00
29-Mar-2002 14:20:00.000 0.00 100.00
29-Mar-2002 14:30:00.000 1.00 100.00
NOTE: The bad raw sample at 14:08 is not counted, but the good sample at 14:22 is counted. The 14:11 to 14:20 interval has no raw samples, but still has a percent good of 100 percent.
Anticipated Usage
Count is useful for analyzing the distribution of the raw data samples to determine the effect of compression deadbands. It is also useful to determine which tags are consuming the most archive space.
45

Advanced Topics Guide
RawTotal mode
Retrieves the arithmetic total (sum) of sampled values for each interval.
Value
The sum of the good quality values of all raw samples in the interval. All bad quality samples are ignored.
Quality
Percent good is always 100, even if the interval does not contain any raw samples or it contains only bad quality samples.
Example: Calculating the Raw Total
The following example demonstrates that only good quality samples are included in the sum. Perform the following query on the same data set as that in the Count example above:
select timestamp, value, quality from ihrawdata where samplingmode=calculated and calculationmode=rawtotal and timestamp >= '29-Mar-2002 13:30' and timestamp <= '29-Mar-2002 14:30' and tagname = counttag and intervalmilliseconds = 10M
TimeStamp Value Quality
29-Mar-2002 13:40:00.000 0.00 100.00
29-Mar-2002 13:50:00.000 0.00 100.00
29-Mar-2002 14:00:00.000 22.00 100.00
29-Mar-2002 14:10:00.000 0.00 100.00
29-Mar-2002 14:20:00.000 0.00 100.00
29-Mar-2002 14:30:00.000 4.00 100.00
If the same start and end time are used, but the time span is treated as a single interval, then all values are added
46
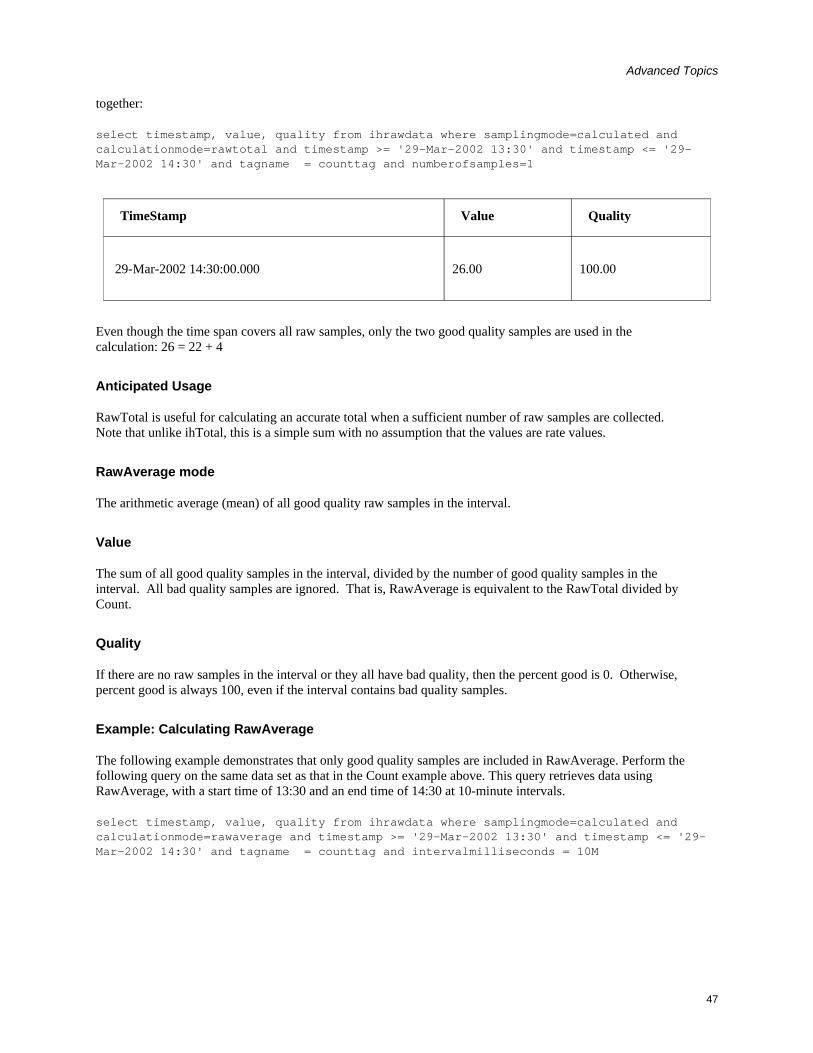
Advanced Topics
together:
select timestamp, value, quality from ihrawdata where samplingmode=calculated and calculationmode=rawtotal and timestamp >= '29-Mar-2002 13:30' and timestamp <= '29-Mar-2002 14:30' and tagname = counttag and numberofsamples=1
TimeStamp Value Quality
29-Mar-2002 14:30:00.000 26.00 100.00
Even though the time span covers all raw samples, only the two good quality samples are used in the calculation: 26 = 22 + 4
Anticipated Usage
RawTotal is useful for calculating an accurate total when a sufficient number of raw samples are collected. Note that unlike ihTotal, this is a simple sum with no assumption that the values are rate values.
RawAverage mode
The arithmetic average (mean) of all good quality raw samples in the interval.
Value
The sum of all good quality samples in the interval, divided by the number of good quality samples in the interval. All bad quality samples are ignored. That is, RawAverage is equivalent to the RawTotal divided by Count.
Quality
If there are no raw samples in the interval or they all have bad quality, then the percent good is 0. Otherwise, percent good is always 100, even if the interval contains bad quality samples.
Example: Calculating RawAverage
The following example demonstrates that only good quality samples are included in RawAverage. Perform the following query on the same data set as that in the Count example above. This query retrieves data using RawAverage, with a start time of 13:30 and an end time of 14:30 at 10-minute intervals.
select timestamp, value, quality from ihrawdata where samplingmode=calculated and calculationmode=rawaverage and timestamp >= '29-Mar-2002 13:30' and timestamp <= '29-Mar-2002 14:30' and tagname = counttag and intervalmilliseconds = 10M
47
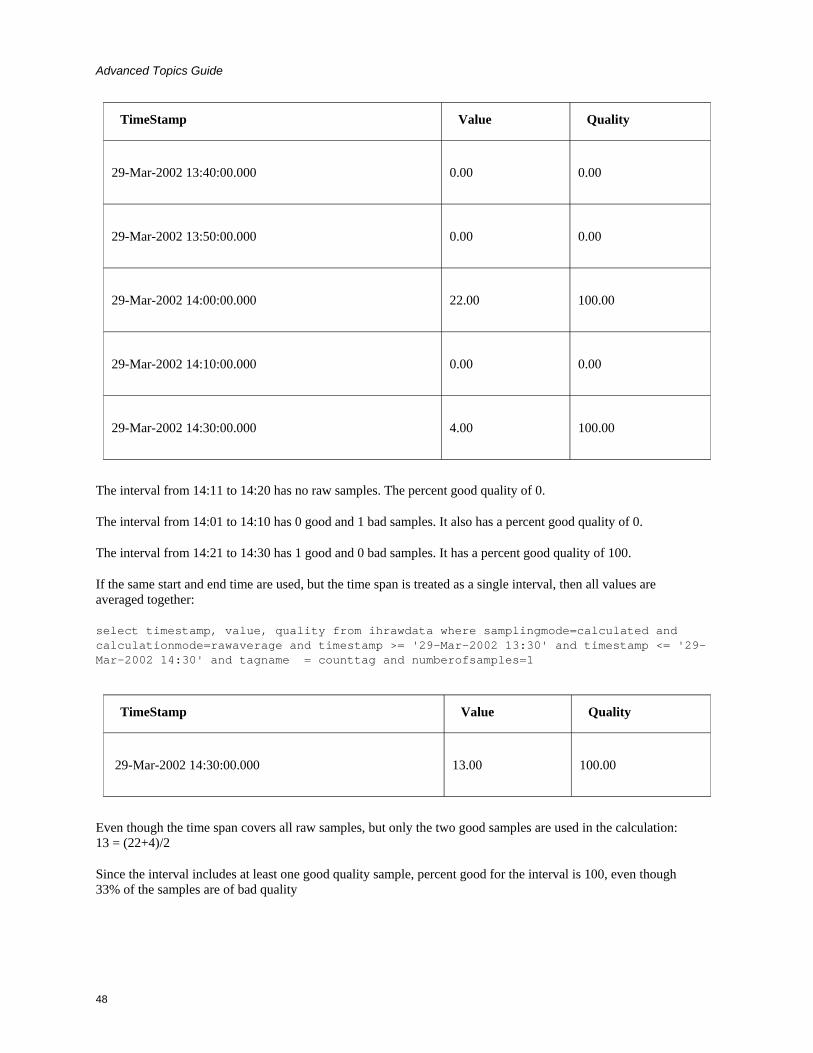
Advanced Topics Guide
TimeStamp Value Quality
29-Mar-2002 13:40:00.000 0.00 0.00
29-Mar-2002 13:50:00.000 0.00 0.00
29-Mar-2002 14:00:00.000 22.00 100.00
29-Mar-2002 14:10:00.000 0.00 0.00
29-Mar-2002 14:30:00.000 4.00 100.00
The interval from 14:11 to 14:20 has no raw samples. The percent good quality of 0.
The interval from 14:01 to 14:10 has 0 good and 1 bad samples. It also has a percent good quality of 0.
The interval from 14:21 to 14:30 has 1 good and 0 bad samples. It has a percent good quality of 100.
If the same start and end time are used, but the time span is treated as a single interval, then all values are averaged together:
select timestamp, value, quality from ihrawdata where samplingmode=calculated and calculationmode=rawaverage and timestamp >= '29-Mar-2002 13:30' and timestamp <= '29-Mar-2002 14:30' and tagname = counttag and numberofsamples=1
TimeStamp Value Quality
29-Mar-2002 14:30:00.000 13.00 100.00
Even though the time span covers all raw samples, but only the two good samples are used in the calculation: 13 = (22+4)/2
Since the interval includes at least one good quality sample, percent good for the interval is 100, even though 33% of the samples are of bad quality
48
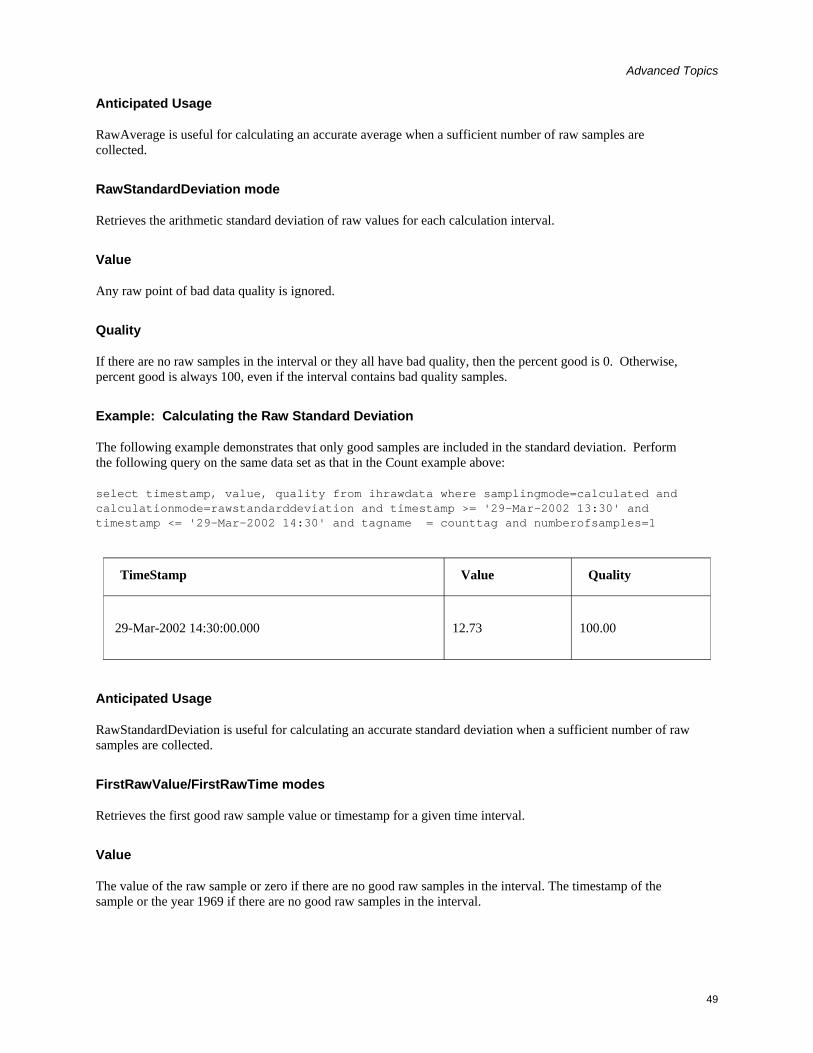
Advanced Topics
Anticipated Usage
RawAverage is useful for calculating an accurate average when a sufficient number of raw samples are collected.
RawStandardDeviation mode
Retrieves the arithmetic standard deviation of raw values for each calculation interval.
Value
Any raw point of bad data quality is ignored.
Quality
If there are no raw samples in the interval or they all have bad quality, then the percent good is 0. Otherwise, percent good is always 100, even if the interval contains bad quality samples.
Example: Calculating the Raw Standard Deviation
The following example demonstrates that only good samples are included in the standard deviation. Perform the following query on the same data set as that in the Count example above:
select timestamp, value, quality from ihrawdata where samplingmode=calculated and calculationmode=rawstandarddeviation and timestamp >= '29-Mar-2002 13:30' and timestamp <= '29-Mar-2002 14:30' and tagname = counttag and numberofsamples=1
TimeStamp Value Quality
29-Mar-2002 14:30:00.000 12.73 100.00
Anticipated Usage
RawStandardDeviation is useful for calculating an accurate standard deviation when a sufficient number of raw samples are collected.
FirstRawValue/FirstRawTime modes
Retrieves the first good raw sample value or timestamp for a given time interval.
Value
The value of the raw sample or zero if there are no good raw samples in the interval. The timestamp of the sample or the year 1969 if there are no good raw samples in the interval.
49
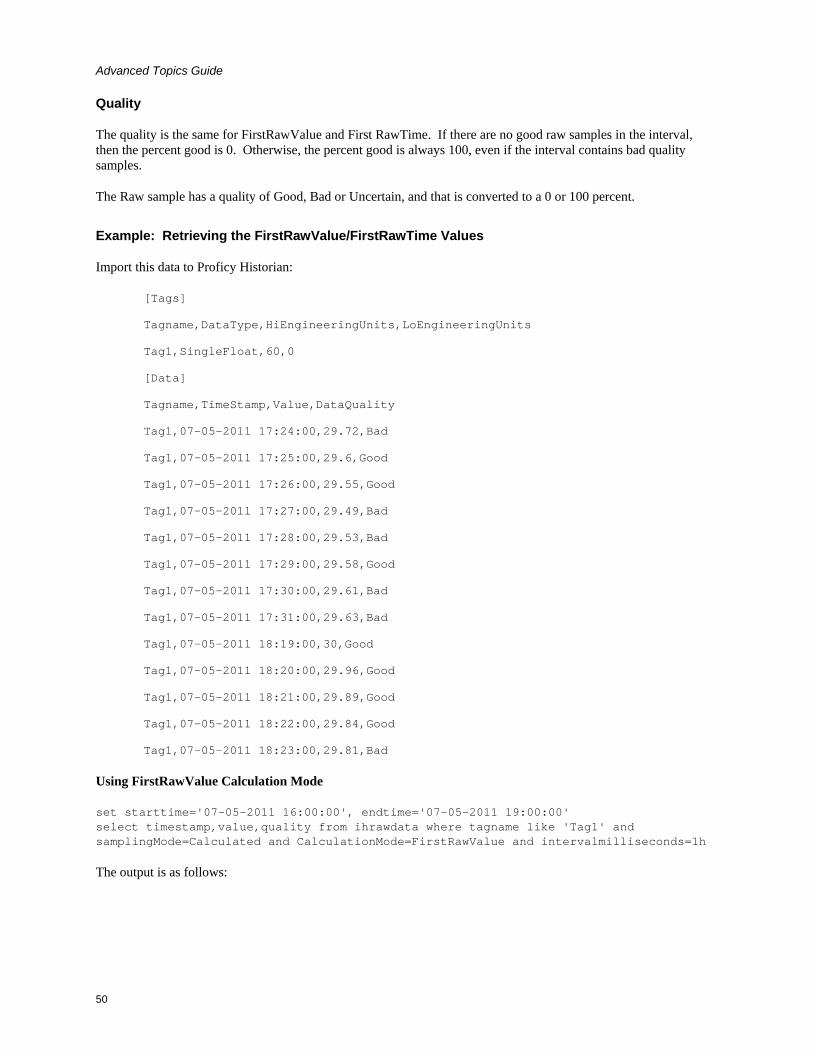
Advanced Topics Guide
Quality
The quality is the same for FirstRawValue and First RawTime. If there are no good raw samples in the interval, then the percent good is 0. Otherwise, the percent good is always 100, even if the interval contains bad quality samples.
The Raw sample has a quality of Good, Bad or Uncertain, and that is converted to a 0 or 100 percent.
Example: Retrieving the FirstRawValue/FirstRawTime Values
Import this data to Proficy Historian:
[Tags]
Tagname,DataType,HiEngineeringUnits,LoEngineeringUnits
Tag1,SingleFloat,60,0
[Data]
Tagname,TimeStamp,Value,DataQuality
Tag1,07-05-2011 17:24:00,29.72,Bad
Tag1,07-05-2011 17:25:00,29.6,Good
Tag1,07-05-2011 17:26:00,29.55,Good
Tag1,07-05-2011 17:27:00,29.49,Bad
Tag1,07-05-2011 17:28:00,29.53,Bad
Tag1,07-05-2011 17:29:00,29.58,Good
Tag1,07-05-2011 17:30:00,29.61,Bad
Tag1,07-05-2011 17:31:00,29.63,Bad
Tag1,07-05-2011 18:19:00,30,Good
Tag1,07-05-2011 18:20:00,29.96,Good
Tag1,07-05-2011 18:21:00,29.89,Good
Tag1,07-05-2011 18:22:00,29.84,Good
Tag1,07-05-2011 18:23:00,29.81,Bad
Using FirstRawValue Calculation Mode
set starttime='07-05-2011 16:00:00', endtime='07-05-2011 19:00:00' select timestamp,value,quality from ihrawdata where tagname like 'Tag1' and samplingMode=Calculated and CalculationMode=FirstRawValue and intervalmilliseconds=1h
The output is as follows:
50

Advanced Topics
TimeStamp Value Quality
07-05-2011 17:00:00 0.0000000 0.0000000
07-05-2011 18:00:00 29.6000000 100.0000000
07-05-2011 19:00:00 30.0 100.0000000
Using FirstRawTime Calculation Mode
set starttime='07-05-2011 16:00:00', endtime='07-05-2011 19:00:00' select timestamp,value,quality from ihrawdata where tagname like 'Tag1' and samplingMode=Calculated and CalculationMode=FirstRawTime and intervalmilliseconds=1h
The output is as follows:
TimeStamp Value Quality
07-05-2011 17:00:00 01-01-1970 05:30:00 0.0000000
07-05-2011 18:00:00 07-05-2011 17:25:00 100.0000000
07-05-2011 19:00:00 07-05-2011 18:20:00 100.0000000
For the time interval 16:00 to 17:00 there are no raw values so a value and quality of 0 is returned for both FirstRawValue and FirstRawTime. The first raw sample from17:00 to 18:00 is 29.72 but it is a bad data quality so it is skipped and the 29.6 is returned and its timestamp of 17:25 is returned in FirstRawTime. FirstRawValue calculation mode considers only good quality data. In the last interval the first good raw sample is 30 and is returned and its timestamp is returned as FirstRawTime.
LastRawValue/LastRawTime modes
Retrieves the last good raw sample value or timestamp for a given time interval.
Value
The value of the raw sample or zero if there are no good raw samples in the interval. The timestamp of the
51
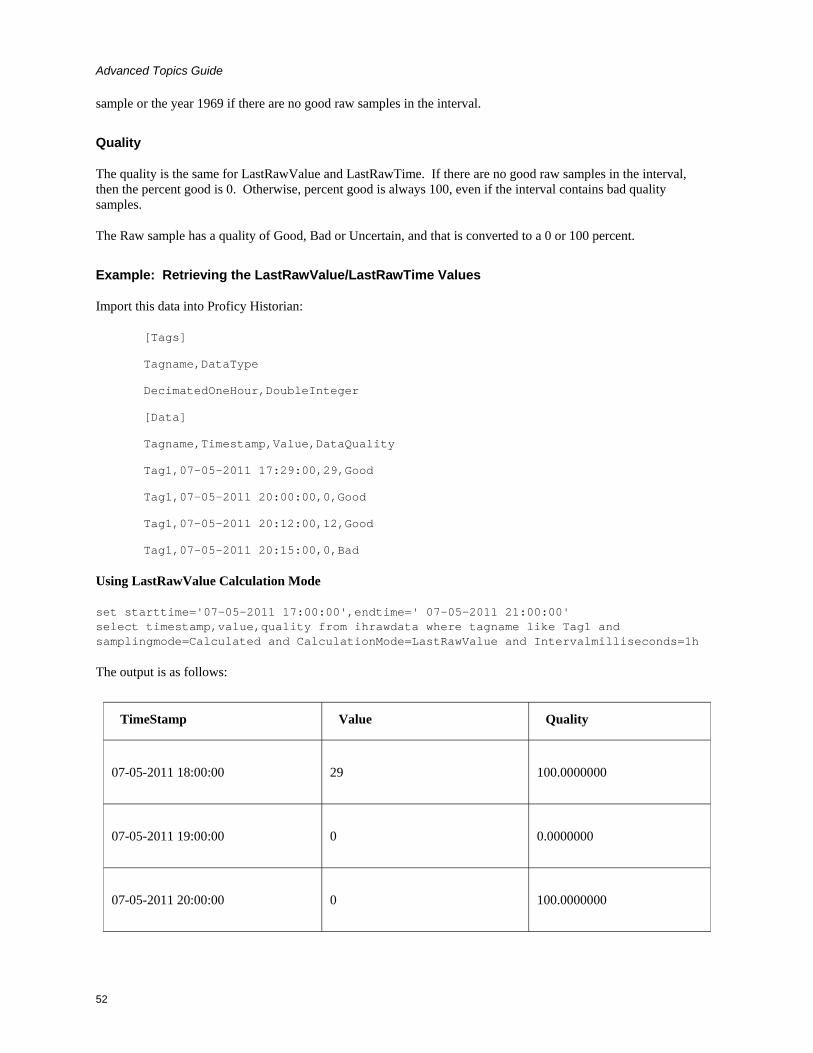
Advanced Topics Guide
sample or the year 1969 if there are no good raw samples in the interval.
Quality
The quality is the same for LastRawValue and LastRawTime. If there are no good raw samples in the interval, then the percent good is 0. Otherwise, percent good is always 100, even if the interval contains bad quality samples.
The Raw sample has a quality of Good, Bad or Uncertain, and that is converted to a 0 or 100 percent.
Example: Retrieving the LastRawValue/LastRawTime Values
Import this data into Proficy Historian:
[Tags]
Tagname,DataType
DecimatedOneHour,DoubleInteger
[Data]
Tagname,Timestamp,Value,DataQuality
Tag1,07-05-2011 17:29:00,29,Good
Tag1,07-05-2011 20:00:00,0,Good
Tag1,07-05-2011 20:12:00,12,Good
Tag1,07-05-2011 20:15:00,0,Bad
Using LastRawValue Calculation Mode
set starttime='07-05-2011 17:00:00',endtime=' 07-05-2011 21:00:00' select timestamp,value,quality from ihrawdata where tagname like Tag1 and samplingmode=Calculated and CalculationMode=LastRawValue and Intervalmilliseconds=1h
The output is as follows:
TimeStamp Value Quality
07-05-2011 18:00:00 29 100.0000000
07-05-2011 19:00:00 0 0.0000000
07-05-2011 20:00:00 0 100.0000000
52

Advanced Topics
07-05-2011 21:00:00 12 100.0000000
In the interval from 17:00 to 18:00 the last good value is 29. The 18:00 to 19:00 has no raw samples so the quality is bad. The 20:00 sample is returned as the last good value in the 19:00 to 20:00. In the final interval, the last raw sample is bad quality so it is ignored and the previous sample is returned.
Using LastRawTime Calculation Mode
set starttime='07-05-2011 17:00:00',endtime=' 07-05-2011 21:00:00' select timestamp,value,quality from ihrawdata where tagname like Tag1 and samplingmode=Calculated and CalculationMode=LastRawTime and Intervalmilliseconds=1h
The output is as follows:
TimeStamp Value Quality
07-05-2011 17:00:00 07-05-2011 17:29:00 100.0000000
07-05-2011 18:00:00 01-01-1970 05:30:00 0.0000000
07-05-2011 19:00:00 07-05-2011 20:00:00 100.0000000
07-05-2011 20:00:00 07-05-2011 20:12:00 100.0000000
NOTE: You can also use the INCLUDEBAD query modifier to include bad quality data. For more information, refer INCLUDEBAD section.
Interpolated Calculation Modes
Interpolation is used in many calculation modes. When using interpolated data, it is possible that there are no raw samples in the interval (such as with highly-compressed data) so the archiver requires additional samples to perform calculations.
The Minimum, MinimumTime, Maximum, and MaximumTime all use interpolation to arrive at two additional samples per interval. One is interpolated at the interval start time and one is interpolated at the interval end time. The interpolated samples are used in calculations just like raw, collected samples within the interval. In particular, the minimum or maximum calculated value can be a raw or interpolated value.
All described rules for interpolating a value at an interval's end time also apply to the interval's start time.
53

Advanced Topics Guide
There is no raw maximum or raw minimum sampling mode. To acquire these values, you must retrieve the raw samples using RawByTime or RawByNumber and compute the minimum or maximum yourself. Similarly, you must also manually calculate a minimum or maximum when using values acquired through lab sampling.
Minimum/Maximum and MinimumTime/MaximumTime
The minimum (or maximum) value in the interval and the time stamp of that value.
Value
Maximum returns the raw or interpolated value with the greatest value and good data quality in the interval. Minimum returns the raw or interpolated value with the lowest value and good data quality in the interval.
MaximumTime returns the time stamp of the Maximum value. MinimumTime returns the time stamp of the Minimum value.
In all cases, all raw samples of bad quality is ignored, both during interpolation and when calculating the maximum.
Quality
If the raw samples in the interval all have bad quality, or if the sample before the interval has bad quality, then percent good is 0. Otherwise, percent good is always 100, even if the interval does not contain any raw samples or contains both good and bad quality samples.
Example: Finding minimum and maximum of Downward Sloping Data
The following example demonstrates how a raw sample is interpolated at the interval's start and end time and how this interpolation is used with raw samples when calculating minimum and maximum values.
Import the following data:
[Tags]
Tagname,DataType,HiEngineeringUnits,LoEngineeringUnits
DOWNSLOPE,SingleFloat,100,0
[Data]
Tagname,TimeStamp,Value,DataQuality
DOWNSLOPE,29-Mar-2002 13:59:00.000,22,Good
DOWNSLOPE,29-Mar-2002 14:08:00.000,12,Good
DOWNSLOPE,29-Mar-2002 14:22:00.000,4,Good
The following query retrieves the Maximum value:
select timestamp, value, quality from ihrawdata where samplingmode=calculated and calculationmode=Maximum and timestamp >= '29-Mar-2002 13:50' and timestamp <= '29-Mar-2002 14:30' and tagname = DOWNSLOPE and numberofsamples = 8
The following query retrieves the MaximumTime:
54

Advanced Topics
select timestamp, value, quality from ihrawdata where samplingmode=calculated and calculationmode=MaximumTime and timestamp >= '29-Mar-2002 13:50' and timestamp <= '29-Mar-2002 14:30' and tagname = DOWNSLOPE and numberofsamples = 8
The following query retrieves the Minimum:
select timestamp, value, quality from ihrawdata where samplingmode=calculated and calculationmode=Minimum and timestamp >= '29-Mar-2002 13:50' and timestamp <= '29-Mar-2002 14:30' and tagname = DOWNSLOPE and numberofsamples = 8
The following query retrieves the MinimumTime:
select timestamp, value, quality from ihrawdata where samplingmode=calculated and calculationmode=MinimumTime and timestamp >= '29-Mar-2002 13:50' and timestamp <= '29-Mar-2002 14:30' and tagname = DOWNSLOPE and numberofsamples = 8
Interval Timestamp
Maximum Maximum Time
Minimum Minimum Time
Quality
13:55:00.000 0.00 31-Dec-1969 19:00:00.000
0.00 31-Dec-1969 19:00:00.000
0.00
14:00:00.000 22.00 13:59:00.000 20.89 14:00:00.000 100.00
14:05:00.000 20.89 14:00:00.000 15.33 14:05:00.000 100.00
14:10:00.000 15.33 14:05:00.000 10.86 14:10:00.000 100.00
14:15:00.000 10.86 14:10:00.000 8.00 14:15:00.000 100.00
14:20:00.000 8.00 14:15:00.000 5.14 14:20:00.000 100.00
14:25:00.000 5.14 14:20:00.000 4.00 14:25:00.000 100.00
14:30:00.000 4.00 14:30:00.000 4.00 14:30:00.000 100.00
The value is 4 for the entire interval of 14:26:00 to 14:30:00. However, the newest value is always returned for MinimumTime and MaximumTime for an interval, so the values instead are calculated as 14:30.
All modes have the same quality. A MaximumTime or MinimumTime of 1969 means there is no value in that interval.
Maximum always begins at the start of the interval because the data forms this is a downwards-sloping line.
55

Advanced Topics Guide
The Maximum takes the sample interpolated at the interval start time. The timestamp is still the interval end time.
When an interval has no raw samples, such as in the 14:05 interval, samples are interpolated at the beginning and the end of the interval. This means that the 14:05 interval has 2 samples to example at when calculating the Minimum or Maximum.
Example: Finding Minimum and Maximum of Changing Data
The following example uses a value that continually changes, rather than one that simply slopes upwards or downwards. Any Minimum or Maximum within an interval is necessarily a raw sample. If the minimum or maximum occurred as raw samples in the middle of the interval, these are also detected.
Import the following data:
[Tags]
Tagname,DataType,HiEngineeringUnits,LoEngineeringUnits
SAWTOOTH,SingleFloat,60,0
[Data]
Tagname,TimeStamp,Value,DataQuality
SAWTOOTH,29-Mar-2002 13:59:00.000,22.7,Good
SAWTOOTH,29-Mar-2002 14:01:00.000,12.5,Good
SAWTOOTH,29-Mar-2002 14:02:00.000,47.0,Good
SAWTOOTH,29-Mar-2002 14:03:00.000,2.4,Good
SAWTOOTH,29-Mar-2002 14:04:00.000,9.5,Good
SAWTOOTH,29-Mar-2002 14:08:00.000,12.5,Good
SAWTOOTH,29-Mar-2002 14:14:00.000,7.0,Good
SAWTOOTH,29-Mar-2002 14:22:00.000,4.8,Good
The following query retrieves the Maximum value:
select timestamp, value, quality from ihrawdata where samplingmode=calculated and calculationmode=Maximum and timestamp >= '29-Mar-2002 13:50' and timestamp <= '29-Mar-2002 14:30' and tagname = SAWTOOTH and numberofsamples = 8
The following query retrieves the MaximumTime value:
select timestamp, value, quality from ihrawdata where samplingmode=calculated and calculationmode=MaximumTime and timestamp >= '29-Mar-2002 13:50' and timestamp <= '29-Mar-2002 14:30' and tagname = SAWTOOTH and numberofsamples = 8
The following query retrieves the Minimum value:
select timestamp, value, quality from ihrawdata where samplingmode=calculated and calculationmode=Minimum and timestamp >= '29-Mar-2002 13:50' and timestamp <= '29-Mar-2002 14:30' and tagname = SAWTOOTH and numberofsamples = 8
56
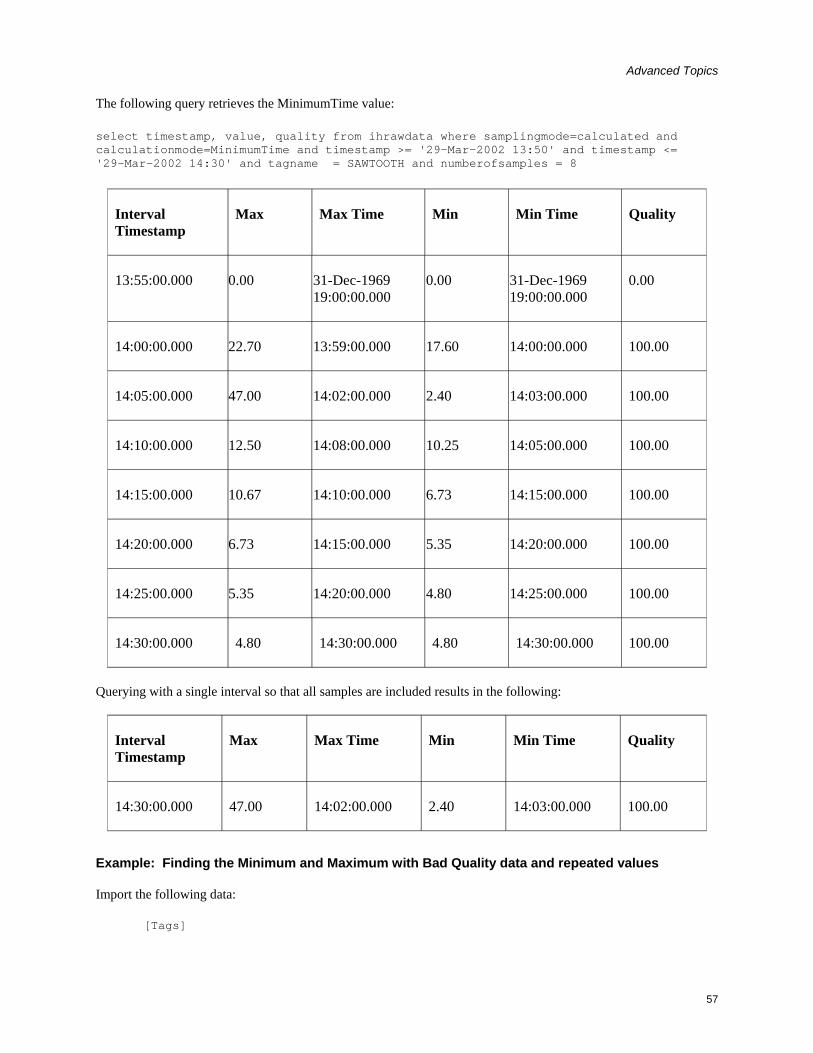
Advanced Topics
The following query retrieves the MinimumTime value:
select timestamp, value, quality from ihrawdata where samplingmode=calculated and calculationmode=MinimumTime and timestamp >= '29-Mar-2002 13:50' and timestamp <= '29-Mar-2002 14:30' and tagname = SAWTOOTH and numberofsamples = 8
Interval Timestamp
Max Max Time Min Min Time Quality
13:55:00.000 0.00 31-Dec-1969 19:00:00.000
0.00 31-Dec-1969 19:00:00.000
0.00
14:00:00.000 22.70 13:59:00.000 17.60 14:00:00.000 100.00
14:05:00.000 47.00 14:02:00.000 2.40 14:03:00.000 100.00
14:10:00.000 12.50 14:08:00.000 10.25 14:05:00.000 100.00
14:15:00.000 10.67 14:10:00.000 6.73 14:15:00.000 100.00
14:20:00.000 6.73 14:15:00.000 5.35 14:20:00.000 100.00
14:25:00.000 5.35 14:20:00.000 4.80 14:25:00.000 100.00
14:30:00.000 4.80 14:30:00.000 4.80 14:30:00.000 100.00
Querying with a single interval so that all samples are included results in the following:
Interval Timestamp
Max Max Time Min Min Time Quality
14:30:00.000 47.00 14:02:00.000 2.40 14:03:00.000 100.00
Example: Finding the Minimum and Maximum with Bad Quality data and repeated values
Import the following data:
[Tags]
57
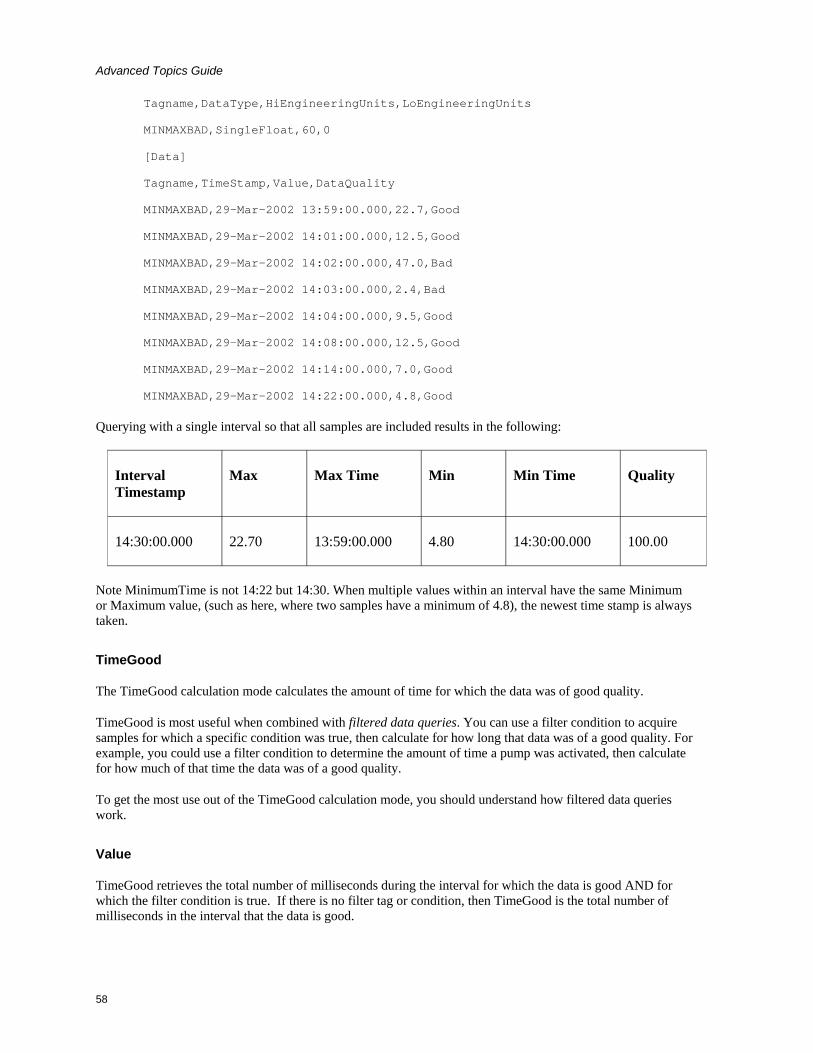
Advanced Topics Guide
Tagname,DataType,HiEngineeringUnits,LoEngineeringUnits
MINMAXBAD,SingleFloat,60,0
[Data]
Tagname,TimeStamp,Value,DataQuality
MINMAXBAD,29-Mar-2002 13:59:00.000,22.7,Good
MINMAXBAD,29-Mar-2002 14:01:00.000,12.5,Good
MINMAXBAD,29-Mar-2002 14:02:00.000,47.0,Bad
MINMAXBAD,29-Mar-2002 14:03:00.000,2.4,Bad
MINMAXBAD,29-Mar-2002 14:04:00.000,9.5,Good
MINMAXBAD,29-Mar-2002 14:08:00.000,12.5,Good
MINMAXBAD,29-Mar-2002 14:14:00.000,7.0,Good
MINMAXBAD,29-Mar-2002 14:22:00.000,4.8,Good
Querying with a single interval so that all samples are included results in the following:
Interval Timestamp
Max Max Time Min Min Time Quality
14:30:00.000 22.70 13:59:00.000 4.80 14:30:00.000 100.00
Note MinimumTime is not 14:22 but 14:30. When multiple values within an interval have the same Minimum or Maximum value, (such as here, where two samples have a minimum of 4.8), the newest time stamp is always taken.
TimeGood
The TimeGood calculation mode calculates the amount of time for which the data was of good quality.
TimeGood is most useful when combined with filtered data queries. You can use a filter condition to acquire samples for which a specific condition was true, then calculate for how long that data was of a good quality. For example, you could use a filter condition to determine the amount of time a pump was activated, then calculate for how much of that time the data was of a good quality.
To get the most use out of the TimeGood calculation mode, you should understand how filtered data queries work.
Value
TimeGood retrieves the total number of milliseconds during the interval for which the data is good AND for which the filter condition is true. If there is no filter tag or condition, then TimeGood is the total number of milliseconds in the interval that the data is good.
58

Advanced Topics
Quality
TimeGood always has a percent good of 100, even if there are no raw samples or if all samples have bad quality. In the latter case, the Value will be 0, but the percent good is still 100.
Example: Finding the amount of time the collector was running
The following example uses multiple intervals without a filter condition. If the data is good for the entire interval, the returned Value would be the length of the interval in milliseconds.
Import the following data (identical to that used in the examples for Interpolated Data).
* Example for Interpolated Data Documentation
*
[Tags]
Tagname,DataType,HiEngineeringUnits,LoEngineeringUnits
BADDQTAG,SingleFloat,60,0
[Data]
Tagname,TimeStamp,Value,DataQuality
BADDQTAG,29-Mar-2002 13:59:00.000,22.7,Good
BADDQTAG,29-Mar-2002 14:08:00.000,12.5,Bad
BADDQTAG,29-Mar-2002 14:14:00.000,7.0,Bad
BADDQTAG,29-Mar-2002 14:22:00.000,4.8,Good
The following SQL query retrieves data with a start time of 14:00 and an end time of 14:30 in 5-minute intervals.:
select timestamp,value,intervalmilliseconds from ihRawData where tagname = baddqtag and samplingmode=calculated and calculationmode=timegood and timestamp > '29-mar-2002 13:55:00' and timestamp < '29-mar-2002 14:30:00' and intervalmilliseconds=5m
timestamp value intervalmilliseconds
29-Mar-2002 14:00:00.000 60,000.00 300,000
29-Mar-2002 14:05:00.000 300,000.00 300,000
29-Mar-2002 14:10:00.000 180,000.00 300,000
29-Mar-2002 14:15:00.000 0.00 300,000
29-Mar-2002 14:20:00.000 0.00 300,000
29-Mar-2002 14:25:00.000 180,000.00 300,000
The percent quality for each returned interval is 100.00 and is not shown. By including the intervalmilliseconds column, you can compare the returned milliseconds to the total milliseconds for the interval.
59

Advanced Topics Guide
Note the following cases:
When data is good for the whole interval: From 14:01 to 14:05 the data is good, though no raw samples are contained. The value is equal to intervalmilliseconds (300,000).
When data starts bad while entering the interval and then turns good: The data is bad going into the 14:21 to 14:25 interval, resulting in a value of 180,000 (out of 300,000).
When data is bad from the middle of the interval to the end the interval: The data in the 14:06 to 14:10 interval starts with good quality and changes to bad quality. The value is therefore less than the calculated intervalmilliseconds (180,000 out of 300,000).
When there are no raw samples in an interval: The number of raw samples has no effect on the Value; it only affects the percent quality.
The interval from 14:01 to 14:05 contains no raw samples. The data quality throughout the entire interval is good. Therefore, for this interval, the Value is 300,000 (the length of the entire interval).
The interval from 14:16 to 14:20 contains no raw samples. The data quality throughout the entire interval is bad. At no time in this interval is there good data, so for this interval, the Value is 0.
The following example demonstrates the case of bad data throughout a section in the middle of an interval. The following query retrieves data from a larger interval that has a section of bad quality in the middle of 2 periods of good quality.
select timestamp,value,intervalmilliseconds from ihRawData where tagname = baddqtag and samplingmode=calculated and calculationmode=timegood and timestamp >= '29-mar-2002 14:05:00' and timestamp <= '29-mar-2002 14:25:00' and intervalmilliseconds=20m
timestamp value intervalmilliseconds
29-Mar-2002 14:25:00.000 360,000.00 1,200,000
A Value of 360,000 milliseconds corresponds to 3 minutes of good quality at the beginning of the interval and 3 minutes of good quality at the end of the interval.
Time Weighted Calculation Modes
The ihAverage, ihTotal, and ihStandardDeviation modes use time-weighted calculations of interpolated and raw samples. The following example illustrates this concept using ihAverage.
Import the following data:
* Example for Interpolated Data Documentation
*
[Tags]
Tagname,DataType,HiEngineeringUnits,LoEngineeringUnits
TAG2,SingleFloat,60,0
[Data]
60
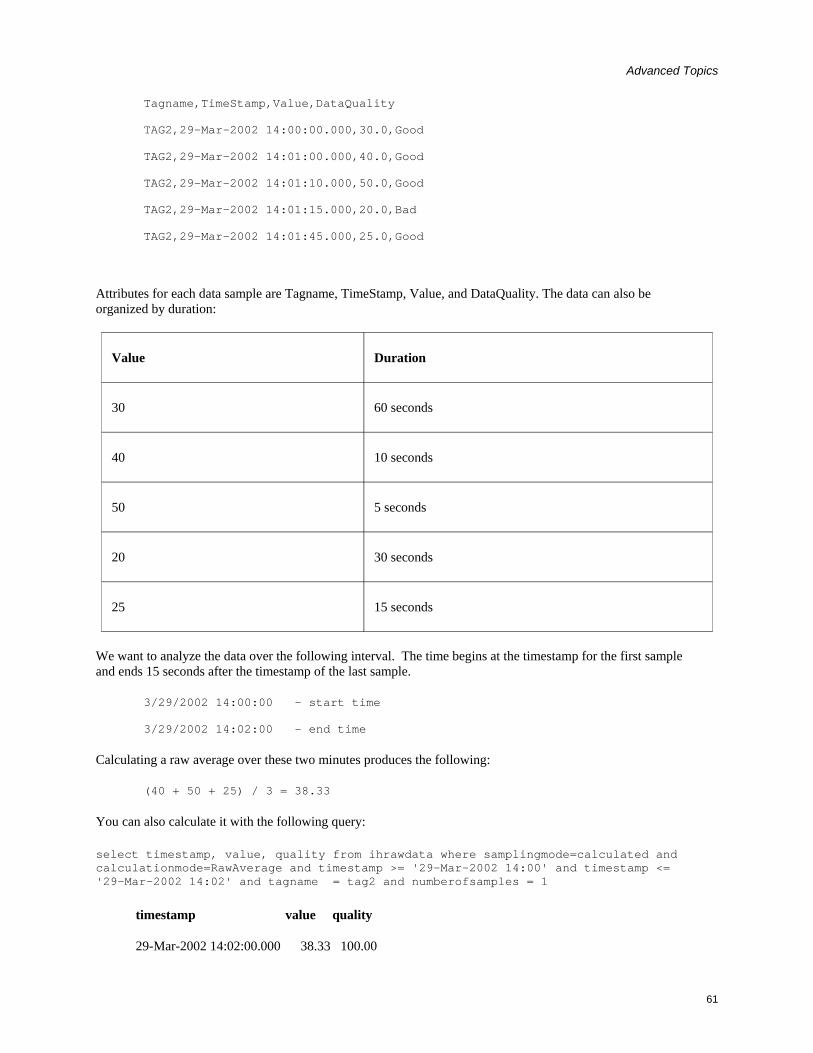
Advanced Topics
Tagname,TimeStamp,Value,DataQuality
TAG2,29-Mar-2002 14:00:00.000,30.0,Good
TAG2,29-Mar-2002 14:01:00.000,40.0,Good
TAG2,29-Mar-2002 14:01:10.000,50.0,Good
TAG2,29-Mar-2002 14:01:15.000,20.0,Bad
TAG2,29-Mar-2002 14:01:45.000,25.0,Good
Attributes for each data sample are Tagname, TimeStamp, Value, and DataQuality. The data can also be organized by duration:
Value Duration
30 60 seconds
40 10 seconds
50 5 seconds
20 30 seconds
25 15 seconds
We want to analyze the data over the following interval. The time begins at the timestamp for the first sample and ends 15 seconds after the timestamp of the last sample.
3/29/2002 14:00:00 - start time
3/29/2002 14:02:00 - end time
Calculating a raw average over these two minutes produces the following:
(40 + 50 + 25) / 3 = 38.33
You can also calculate it with the following query:
select timestamp, value, quality from ihrawdata where samplingmode=calculated and calculationmode=RawAverage and timestamp >= '29-Mar-2002 14:00' and timestamp <= '29-Mar-2002 14:02' and tagname = tag2 and numberofsamples = 1
timestamp value quality
29-Mar-2002 14:02:00.000 38.33 100.00
61

Advanced Topics Guide
The value of 30 is not used because RawAverage uses only samples whose timestamps are greater than the interval's start time. A value whose timestamp is 14:00 would be associated with the previous interval.
In a time-weighted average, the values are multiplied by the durations. The two-minute time weighted average is
((30 * 59.999) + (40 * 10) + (50 * 5) + (25*15)) / (60 + 10 + 5 + 15) = 31.38
You can calculate this with the following query:
select timestamp, value, quality from ihrawdata where samplingmode=calculated and calculationmode=Average and timestamp >= '29-Mar-2002 14:00' and timestamp <= '29-Mar-2002 14:02' and tagname = tag2 and numberofsamples = 1
This more closely describes the real situation, the value was 30 during most of the queried interval. The value of 30 is assigned to a timestamp of 14:00:00.001, which is the first possible timestamp greater than the interval start time (up to a resolution of milliseconds).
Note that the bad quality sample (whose value was 20) is ignored when calculating the time-weighted average. The quality was bad for 30 seconds out of the 2 minutes, so the percent good quality is 75. When performing time-weighted calculations, percent good represents the percentage of time within the interval that had data with good quality:
( 90 seconds of good data quality / 120 seconds of the total interval duration ) = 75%
Computing an Average when there is no raw sample at the start time:
There is rarely a raw sample available at the interval start time. However, the archiver needs to know the value at the start of an interval before it can perform time-weighted calculations. The archiver uses interpolation to get values it needs for which no raw samples are available.
For example, if we set the start time for the query to 14:05, then the archiver will interpolate a value at the timestamp of 14:05.
The RawAverage would then be calculated as follows:
select timestamp, value, quality from ihrawdata where samplingmode=calculated and calculationmode=RawAverage and timestamp >= '29-Mar-2002 14:00:05' and timestamp <= '29-Mar-2002 14:02' and tagname = tag2 and numberofsamples = 1
timestamp value quality
29-Mar-2002 14:02:00.000 38.33 100.00
Similarly, the time-weighted average would be calculated as follows:
select timestamp, value, quality from ihrawdata where samplingmode=calculated and calculationmode=Average and timestamp >= '29-Mar-2002 14:00:05' and timestamp <= '29-Mar-2002 14:02' and tagname = tag2 and numberofsamples = 1
timestamp value quality
29-Mar-2002 14:02:00.000 32.01 73.91
62
Advanced Topics
Average and Step Values
The average of the raw samples is the interval, but there is special logic for time weighting and for computing the value at the start of the interval.
Averages are computed differently depending on the value of the Tag.StepValue property. If StepValue=FALSE then the average works as it always did in 2.0 and 3.0. A value at the start of the interval is determined via interpolation.
If StepValue=TRUE then lab sampling, not interpolation, is used to determine the value at interval start time. This would more accurately reflect a value that steps or a value that uses collector compression and did not change for a long period of time.
ihTotal
Retrieves the time- weighted rate total for each calculation interval.
A rate total is considered for totalizing a continuous measurement. A factor is applied to the totalized value to convert into the appropriate engineering units. Since this is a rate total, a base rate of Units/Day is assumed. If the actual units of the continuous measurement is Units/Minute, multiply the results by 1440 Minutes / Day to convert the totalized number into the appropriate engineering units.
The formula for total is total = average * (interval in milliseconds / 1000) / 86400. The 86400 is number of seconds in a day. This formula takes the average, which is assumed to be already in units per day, and divides it into "units per interval".
Example of collecting a rate from a data source:
Assume an average of 240 barrels per day.
If your interval is one day, then the "units per interval" is units per DAY. Since the average was already assumed to be in units per day, you just get back the average.
240 = 240 * (86400000/1000) / 86400
240 = 240 * 1
If your interval is 1 hour, you should get back 1/24 of the average.
total = 240 * (3600000/1000) / 86400
total = 240 * 0.0417
total = 10
Ten is 1/24 of 240 and tells you 10 units were produced that hour.
Filtered Data Queries
You can retrieve data using an optional filter tag or filter expression if the client program or API you are using supports it.
Normally, a data query specifies a start and an end time for the query. Data is returned for ALL intervals between the start and end times. A filtered data query allows you to specify a filter tag or expression with
63
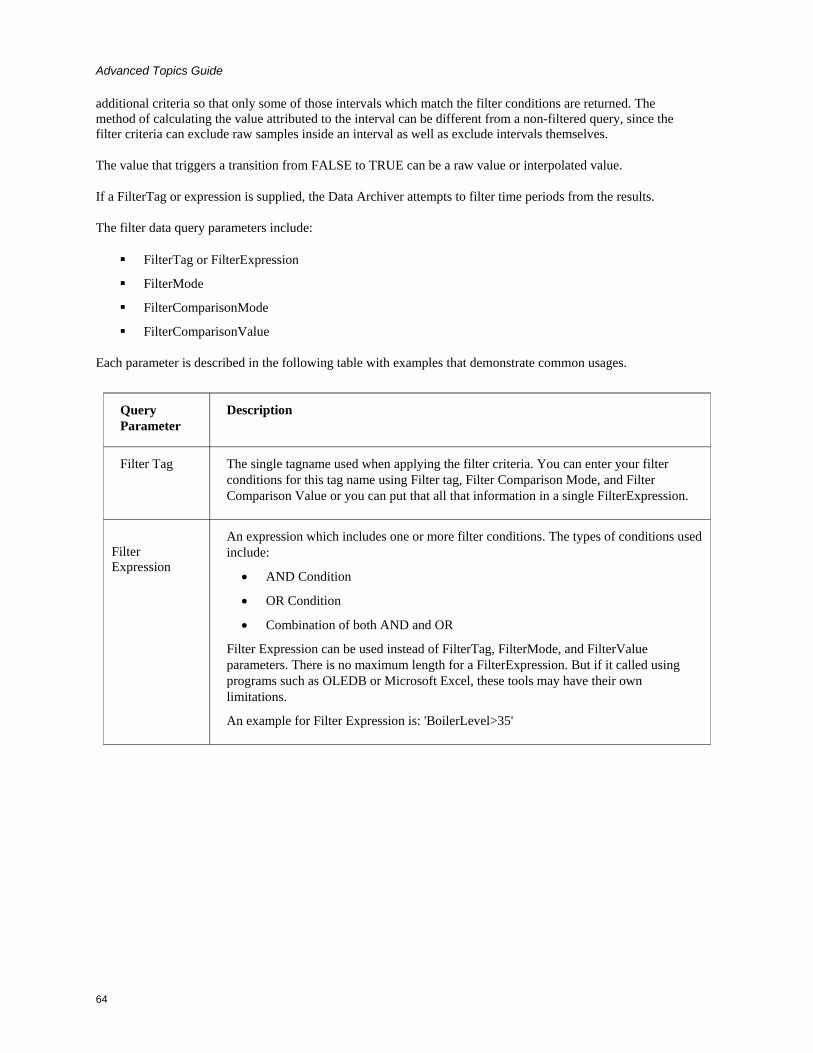
Advanced Topics Guide
additional criteria so that only some of those intervals which match the filter conditions are returned. The method of calculating the value attributed to the interval can be different from a non-filtered query, since the filter criteria can exclude raw samples inside an interval as well as exclude intervals themselves.
The value that triggers a transition from FALSE to TRUE can be a raw value or interpolated value.
If a FilterTag or expression is supplied, the Data Archiver attempts to filter time periods from the results.
The filter data query parameters include:
FilterTag or FilterExpression
FilterMode
FilterComparisonMode
FilterComparisonValue
Each parameter is described in the following table with examples that demonstrate common usages.
Query Parameter
Description
Filter Tag The single tagname used when applying the filter criteria. You can enter your filter conditions for this tag name using Filter tag, Filter Comparison Mode, and Filter Comparison Value or you can put that all that information in a single FilterExpression.
Filter Expression
An expression which includes one or more filter conditions. The types of conditions used include:
• AND Condition
• OR Condition
• Combination of both AND and OR
Filter Expression can be used instead of FilterTag, FilterMode, and FilterValue parameters. There is no maximum length for a FilterExpression. But if it called using programs such as OLEDB or Microsoft Excel, these tools may have their own limitations.
An example for Filter Expression is: 'BoilerLevel>35'
64
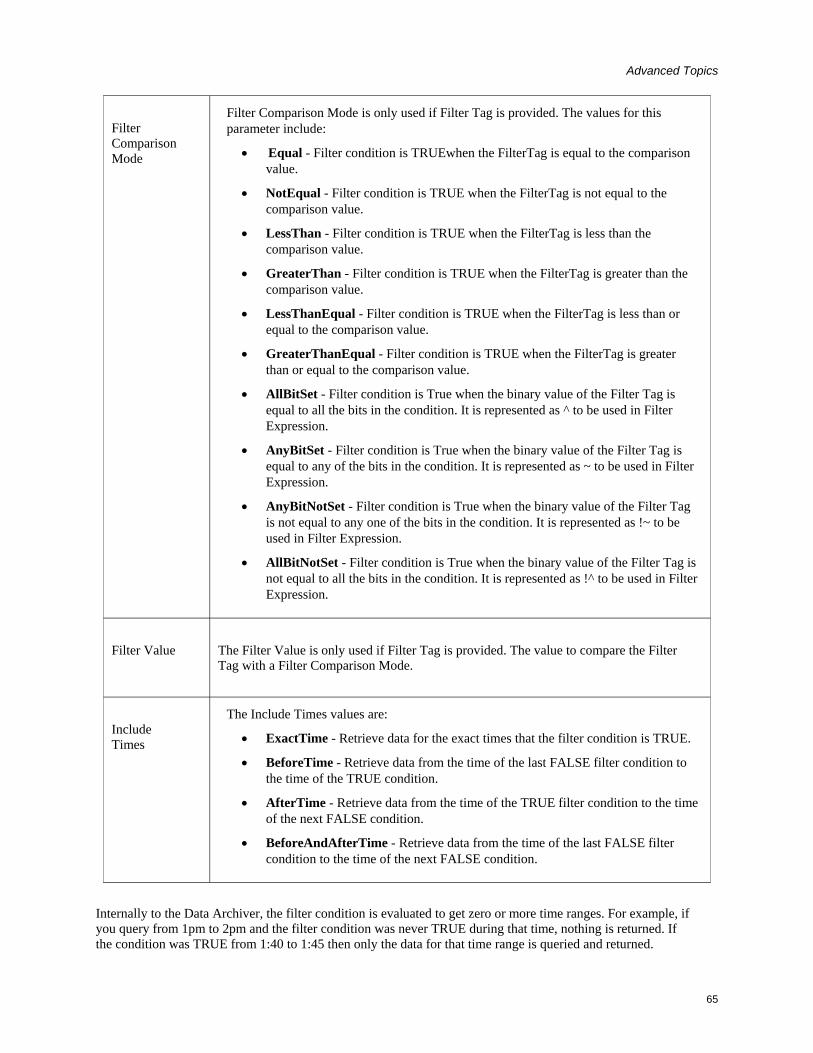
Advanced Topics
Filter Comparison Mode
Filter Comparison Mode is only used if Filter Tag is provided. The values for this parameter include:
• Equal - Filter condition is TRUEwhen the FilterTag is equal to the comparison value.
• NotEqual - Filter condition is TRUE when the FilterTag is not equal to the comparison value.
• LessThan - Filter condition is TRUE when the FilterTag is less than the comparison value.
• GreaterThan - Filter condition is TRUE when the FilterTag is greater than the comparison value.
• LessThanEqual - Filter condition is TRUE when the FilterTag is less than or equal to the comparison value.
• GreaterThanEqual - Filter condition is TRUE when the FilterTag is greater than or equal to the comparison value.
• AllBitSet - Filter condition is True when the binary value of the Filter Tag is equal to all the bits in the condition. It is represented as ^ to be used in Filter Expression.
• AnyBitSet - Filter condition is True when the binary value of the Filter Tag is equal to any of the bits in the condition. It is represented as ~ to be used in Filter Expression.
• AnyBitNotSet - Filter condition is True when the binary value of the Filter Tag is not equal to any one of the bits in the condition. It is represented as !~ to be used in Filter Expression.
• AllBitNotSet - Filter condition is True when the binary value of the Filter Tag is not equal to all the bits in the condition. It is represented as !^ to be used in Filter Expression.
Filter Value The Filter Value is only used if Filter Tag is provided. The value to compare the Filter Tag with a Filter Comparison Mode.
Include Times
The Include Times values are:
• ExactTime - Retrieve data for the exact times that the filter condition is TRUE.
• BeforeTime - Retrieve data from the time of the last FALSE filter condition to the time of the TRUE condition.
• AfterTime - Retrieve data from the time of the TRUE filter condition to the time of the next FALSE condition.
• BeforeAndAfterTime - Retrieve data from the time of the last FALSE filter condition to the time of the next FALSE condition.
Internally to the Data Archiver, the filter condition is evaluated to get zero or more time ranges. For example, if you query from 1pm to 2pm and the filter condition was never TRUE during that time, nothing is returned. If the condition was TRUE from 1:40 to 1:45 then only the data for that time range is queried and returned.
65

Advanced Topics Guide
Together the Filter Tag, Filter value, and Filter Comparison Mode define the criteria to apply to each interval to determine inclusion or exclusion. You can optionally use Filter Expression to include all the above parameters in one condition.
The Include Times defines how the time periods before and after transitions in the filter condition should be handled. An example with actual data and a graphic to clarify the behavior of each of the IncludeTime options is provided in the following topics.
You can retrieve data:
1. Using a Filtered Data Query
2. Using Filter Expression
Using a Filtered Data Query
The filter query logic has two problems to solve.
Which time ranges should be included? In the following example, you see that No Filter mode returns all intervals. Each mode has its own logic to determine if an interval passes the filter or not.
What value and quality should be attributed to the interval? If the filter condition is TRUE for the whole interval, then this is just like the non-filtered result. When the filter condition is TRUE only for part of the interval, raw samples get filtered out, changing the values returned.
For the following example, we know that we want to use AfterTime since the batch ID is written to the PLC at the start of the batch. The intervals included are the ones for the times the batch is running. You would use the BeforeTime if the batch ID was written at the end. Use the ExactTime if you are comparing 2 or more values at a single point in time.
* Example for Filtered Data Documentation
*
[Tags]
Tagname,DataType,HiEngineeringUnits,LoEngineeringUnits
BATCHID,VariableString,10,0
RAMP,SingleInteger,60,0
ONOFF,SingleInteger,60,0
HAS SPACE,SingleInteger,60,0
[Data]
Tagname,TimeStamp,Value,DataQuality
BATCHID,30-Jul-2002 07:00:00.000,B1,Good
BATCHID,30-Jul-2002 07:00:20.000,B2,Good
BATCHID,30-Jul-2002 07:00:34.000,B3,Good
BATCHID,30-Jul-2002 07:00:52.000,B1,Good
66
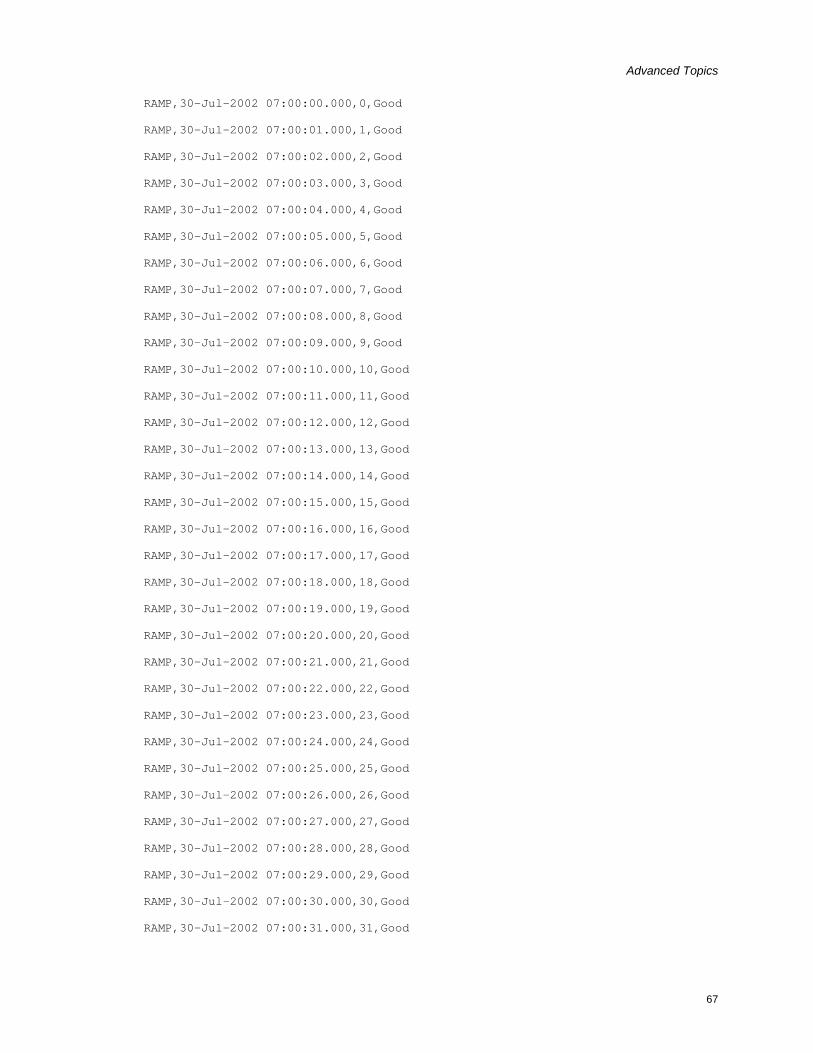
Advanced Topics
RAMP,30-Jul-2002 07:00:00.000,0,Good
RAMP,30-Jul-2002 07:00:01.000,1,Good
RAMP,30-Jul-2002 07:00:02.000,2,Good
RAMP,30-Jul-2002 07:00:03.000,3,Good
RAMP,30-Jul-2002 07:00:04.000,4,Good
RAMP,30-Jul-2002 07:00:05.000,5,Good
RAMP,30-Jul-2002 07:00:06.000,6,Good
RAMP,30-Jul-2002 07:00:07.000,7,Good
RAMP,30-Jul-2002 07:00:08.000,8,Good
RAMP,30-Jul-2002 07:00:09.000,9,Good
RAMP,30-Jul-2002 07:00:10.000,10,Good
RAMP,30-Jul-2002 07:00:11.000,11,Good
RAMP,30-Jul-2002 07:00:12.000,12,Good
RAMP,30-Jul-2002 07:00:13.000,13,Good
RAMP,30-Jul-2002 07:00:14.000,14,Good
RAMP,30-Jul-2002 07:00:15.000,15,Good
RAMP,30-Jul-2002 07:00:16.000,16,Good
RAMP,30-Jul-2002 07:00:17.000,17,Good
RAMP,30-Jul-2002 07:00:18.000,18,Good
RAMP,30-Jul-2002 07:00:19.000,19,Good
RAMP,30-Jul-2002 07:00:20.000,20,Good
RAMP,30-Jul-2002 07:00:21.000,21,Good
RAMP,30-Jul-2002 07:00:22.000,22,Good
RAMP,30-Jul-2002 07:00:23.000,23,Good
RAMP,30-Jul-2002 07:00:24.000,24,Good
RAMP,30-Jul-2002 07:00:25.000,25,Good
RAMP,30-Jul-2002 07:00:26.000,26,Good
RAMP,30-Jul-2002 07:00:27.000,27,Good
RAMP,30-Jul-2002 07:00:28.000,28,Good
RAMP,30-Jul-2002 07:00:29.000,29,Good
RAMP,30-Jul-2002 07:00:30.000,30,Good
RAMP,30-Jul-2002 07:00:31.000,31,Good
67
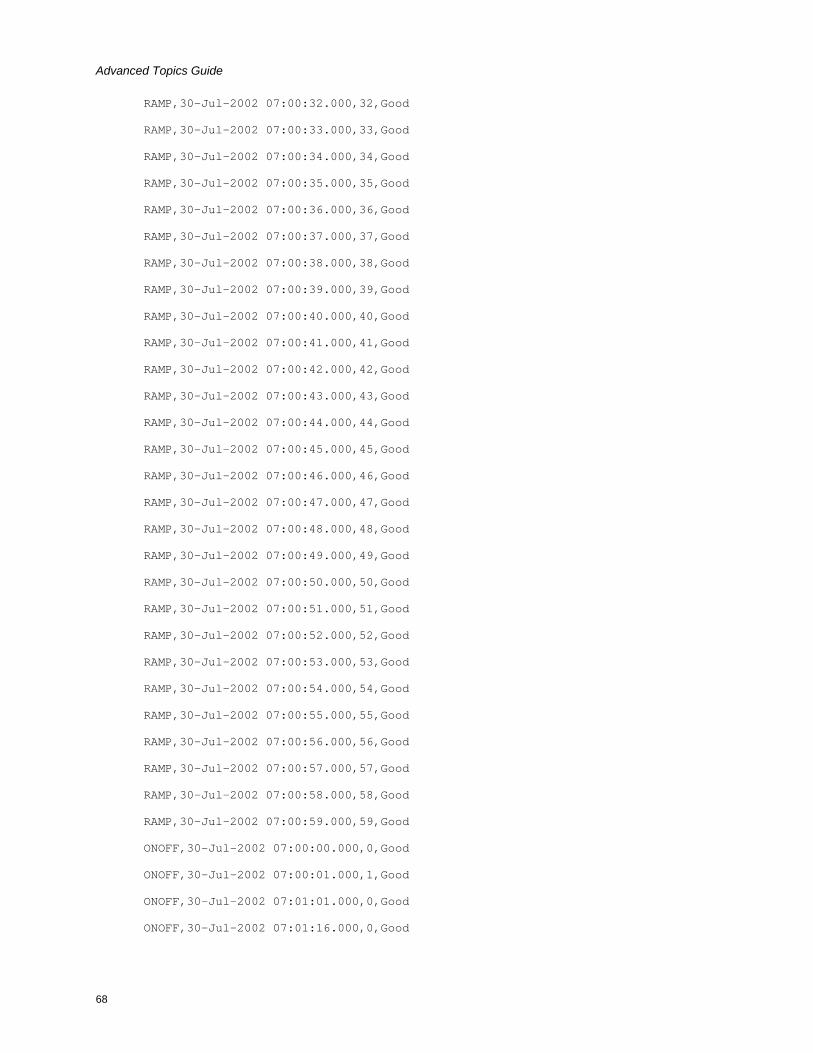
Advanced Topics Guide
RAMP,30-Jul-2002 07:00:32.000,32,Good
RAMP,30-Jul-2002 07:00:33.000,33,Good
RAMP,30-Jul-2002 07:00:34.000,34,Good
RAMP,30-Jul-2002 07:00:35.000,35,Good
RAMP,30-Jul-2002 07:00:36.000,36,Good
RAMP,30-Jul-2002 07:00:37.000,37,Good
RAMP,30-Jul-2002 07:00:38.000,38,Good
RAMP,30-Jul-2002 07:00:39.000,39,Good
RAMP,30-Jul-2002 07:00:40.000,40,Good
RAMP,30-Jul-2002 07:00:41.000,41,Good
RAMP,30-Jul-2002 07:00:42.000,42,Good
RAMP,30-Jul-2002 07:00:43.000,43,Good
RAMP,30-Jul-2002 07:00:44.000,44,Good
RAMP,30-Jul-2002 07:00:45.000,45,Good
RAMP,30-Jul-2002 07:00:46.000,46,Good
RAMP,30-Jul-2002 07:00:47.000,47,Good
RAMP,30-Jul-2002 07:00:48.000,48,Good
RAMP,30-Jul-2002 07:00:49.000,49,Good
RAMP,30-Jul-2002 07:00:50.000,50,Good
RAMP,30-Jul-2002 07:00:51.000,51,Good
RAMP,30-Jul-2002 07:00:52.000,52,Good
RAMP,30-Jul-2002 07:00:53.000,53,Good
RAMP,30-Jul-2002 07:00:54.000,54,Good
RAMP,30-Jul-2002 07:00:55.000,55,Good
RAMP,30-Jul-2002 07:00:56.000,56,Good
RAMP,30-Jul-2002 07:00:57.000,57,Good
RAMP,30-Jul-2002 07:00:58.000,58,Good
RAMP,30-Jul-2002 07:00:59.000,59,Good
ONOFF,30-Jul-2002 07:00:00.000,0,Good
ONOFF,30-Jul-2002 07:00:01.000,1,Good
ONOFF,30-Jul-2002 07:01:01.000,0,Good
ONOFF,30-Jul-2002 07:01:16.000,0,Good
68

Advanced Topics
ONOFF,30-Jul-2002 07:01:17.000,1,Good
ONOFF,30-Jul-2002 07:01:18.000,1,Good
ONOFF,30-Jul-2002 07:02:01.000,1,Good
ONOFF,30-Jul-2002 07:03:01.000,0,Good
HAS SPACE,30-Jul-2002 07:00:00.000,0,Good
HAS SPACE,30-Jul-2002 07:00:01.000,1,Good
HAS SPACE,30-Jul-2002 07:01:01.000,0,Good
HAS SPACE,30-Jul-2002 07:01:16.000,0,Good
HAS SPACE,30-Jul-2002 07:01:17.000,1,Good
HAS SPACE,30-Jul-2002 07:01:18.000,1,Good
HAS SPACE,30-Jul-2002 07:02:01.000,1,Good
HAS SPACE,30-Jul-2002 07:03:01.000,0,Good
The key to understanding this example is that the batch ID is written to the text tag at the start of the batch, and only at the start. It is not repeated during the batch. Other systems may write the batch ID at the end of the interval. You can tell the time period of a batch by looking at the raw samples of the batch ID tag.
BATCHID,30-Jul-2002 07:00:00.000,B1,Good
BATCHID,30-Jul-2002 07:00:20.000,B2,Good
BATCHID,30-Jul-2002 07:00:34.000,B3,Good
BATCHID,30-Jul-2002 07:00:52.000,B1,Good
In this system, since the batch ID is written at the start of the batch, you can tell that batch B1 ran from 07:00:01 to 07:00:19 and then batch B2 ran. This assumes that all time is attributable to some batch and there is no dead time between batches. If there is equipment downtime after a batch, you need to write some other value to the batch ID tag to indicate the end time of the batch.
The query parameters are given below:
Query Parameter Value
Start Time 07/30/2002 07:00:00
End Time 07/30/2002 07:01:00
Interval 10 seconds
How the Example was Developed:
69

Advanced Topics Guide
In this example, we chose to use RawTotal calculation mode, a simple sum of the raw samples, so that the results can be manually verified. SQL queries to the OLE DB provider are the easiest way to demonstrate retrieval results. The following SQL queries are pasted into ihSQL in order to execute.
When No Filter is used
select timestamp, value, quality from ihrawdata where tagname = ramp and samplingmode=calculated and calculationmode=rawtotal and timestamp >= "07/30/2002 07:00:00" and timestamp <= "07/30/2002 07:01:00" and intervalmilliseconds = 10s
When ExactTime filtering is added to the query
select timestamp, value, quality from ihrawdata where tagname = ramp and samplingmode=calculated and calculationmode=rawtotal and timestamp >= "07/30/2002 07:00:00" and timestamp <= "07/30/2002 07:01:00" and intervalmilliseconds = 10s and filtertag = batchid and filtervalue = B1 and filtermode = Exacttime and filtercomparisonmode=equal
When FilterMode is changed to BeforeTime
select timestamp, value, quality from ihrawdata where tagname = ramp and samplingmode=calculated and calculationmode=rawtotal and timestamp >= "07/30/2002 07:00:00" and timestamp <= "07/30/2002 07:01:00" and intervalmilliseconds = 10s and filtertag = batchid and filtervalue = B1 and filtermode = Beforetime and filtercomparisonmode=equal
When FilterMode is changed to AfterTime
select timestamp, value, quality from ihrawdata where tagname = ramp and samplingmode=calculated and calculationmode=rawtotal and timestamp >= "07/30/2002 07:00:00" and timestamp <= "07/30/2002 07:01:00" and intervalmilliseconds = 10s and filtertag = batchid and filtervalue = B1 and filtermode = Aftertime and filtercomparisonmode=equal
When FilterMode is changed to BeforeAndAfterTime
select timestamp, value, quality from ihrawdata where tagname = ramp and samplingmode=calculated and calculationmode=rawtotal and timestamp >= "07/30/2002 07:00:00" and timestamp <= "07/30/2002 07:01:00" and intervalmilliseconds = 10s and filtertag = batchid and filtervalue = B1 and filtermode = BeforeandAftertime and filtercomparisonmode=equal
The following graphic and table allows you to compare the results of the different filter modes. The output without filtering appears in the first column. Each remaining column uses a different filter mode and contains the value / percent good result for the interval. When a cell is blank, it means that interval was filtered out by the query. All returned intervals have a percent good of 100 percent.
70
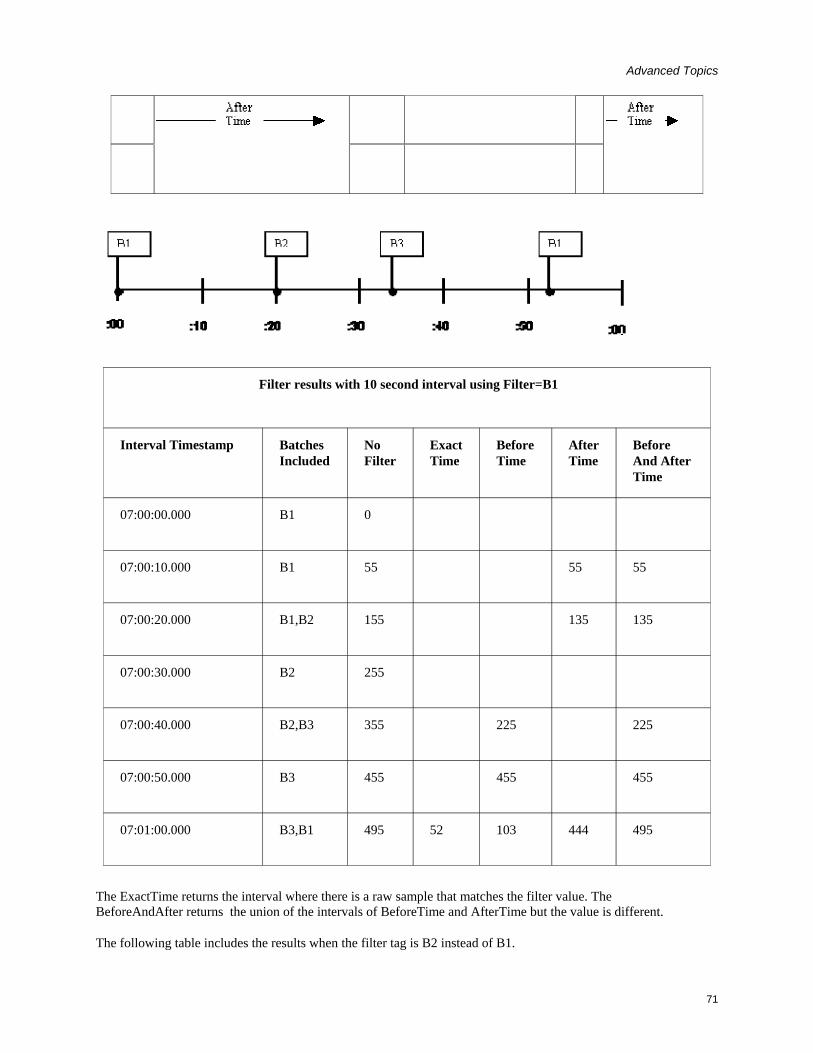
Advanced Topics
Filter results with 10 second interval using Filter=B1
Interval Timestamp Batches Included
No Filter
Exact Time
Before Time
After Time
Before And After Time
07:00:00.000 B1 0
07:00:10.000 B1 55 55 55
07:00:20.000 B1,B2 155 135 135
07:00:30.000 B2 255
07:00:40.000 B2,B3 355 225 225
07:00:50.000 B3 455 455 455
07:01:00.000 B3,B1 495 52 103 444 495
The ExactTime returns the interval where there is a raw sample that matches the filter value. The BeforeAndAfter returns the union of the intervals of BeforeTime and AfterTime but the value is different.
The following table includes the results when the filter tag is B2 instead of B1.
71

Advanced Topics Guide
Filter results with 10 second interval using Filter=B2
Interval Timestamp Batches Included
Exact Time
Before Time
After Time
Before And After Time
07:00:10.000 B1 55
55
07:00:20.000 B1,B2 0 155 20 155
07:00:30.000 B2 255 255
07:00:40.000 B2,B3
96 96
07:00:50.000 B3
07:01:00.000 B3,B1
NOTE: From 21-30 there is no raw sample for batch id but the interval is still properly included.
The following table includes the results when the filter tag is B3 instead of B1.
Filter results with 10 second interval using Filter=B3
Interval Timestamp Batches Included
Exact Time
Before Time
After Time
Before And After Time
07:00:10.000 B1 55
07:00:20.000 B1,B2 0 135
72

Advanced Topics
07:00:30.000 B2 255
07:00:40.000 B2,B3 34 130 259 225
07:00:50.000 B3 455 455
07:01:00.000 B3,B1 51 495
By examining this example, the behavior of filtered queries with good quality data is best described.
Other examples not given are:
• Using a numeric filter tag. Normally the filter tag is a string so that no interpolation is done on the value.
• Effect of bad data quality on filter tag and data tag. To match the filter condition, the raw filter value has to be of good data quality.
Using Filter Expressions
You can enter filter expressions in filtered data queries to indicate the desired time range. A Filter Expression has one or more filter conditions.
A filter condition has:
1. A Proficy Historian tag
2. A comparison (=, !=, >, <, <=, >=, ^, ~, !~, !^)
3. A value
For example: mytag < 7
You can add more than one filter condition in a filter expression using AND, OR within a parenthesis. For example: (mytag > 3) and (mytag < 7).
You can use bitwise comparison for a tag. By using bitwise comparison you can compare the binary values of the given filter tag with the bits specified in the condition. The Bitwise comparison modes are:
1. AllBitSet (^)
2. AnyBitSet (~)
3. AnyBitNotSet (!~)
4. AllBitNotSet (!^)
73
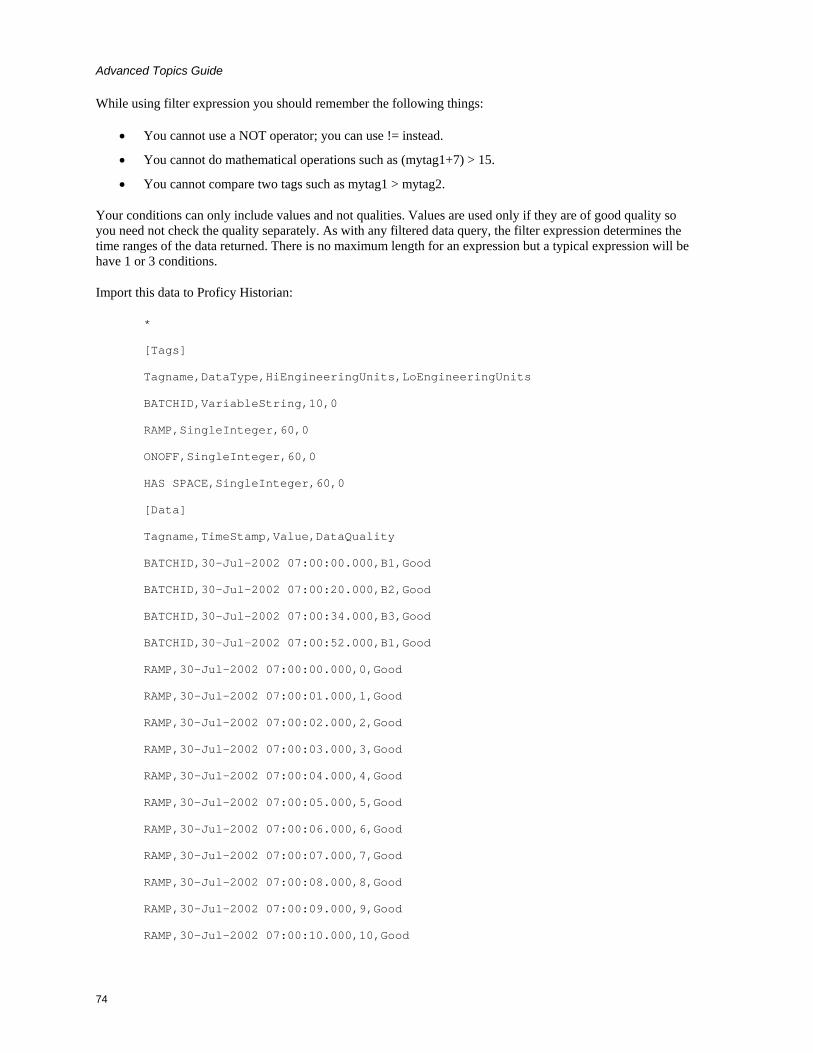
Advanced Topics Guide
While using filter expression you should remember the following things:
• You cannot use a NOT operator; you can use != instead.
• You cannot do mathematical operations such as (mytag1+7) > 15.
• You cannot compare two tags such as mytag1 > mytag2.
Your conditions can only include values and not qualities. Values are used only if they are of good quality so you need not check the quality separately. As with any filtered data query, the filter expression determines the time ranges of the data returned. There is no maximum length for an expression but a typical expression will be have 1 or 3 conditions.
Import this data to Proficy Historian:
*
[Tags]
Tagname,DataType,HiEngineeringUnits,LoEngineeringUnits
BATCHID,VariableString,10,0
RAMP,SingleInteger,60,0
ONOFF,SingleInteger,60,0
HAS SPACE,SingleInteger,60,0
[Data]
Tagname,TimeStamp,Value,DataQuality
BATCHID,30-Jul-2002 07:00:00.000,B1,Good
BATCHID,30-Jul-2002 07:00:20.000,B2,Good
BATCHID,30-Jul-2002 07:00:34.000,B3,Good
BATCHID,30-Jul-2002 07:00:52.000,B1,Good
RAMP,30-Jul-2002 07:00:00.000,0,Good
RAMP,30-Jul-2002 07:00:01.000,1,Good
RAMP,30-Jul-2002 07:00:02.000,2,Good
RAMP,30-Jul-2002 07:00:03.000,3,Good
RAMP,30-Jul-2002 07:00:04.000,4,Good
RAMP,30-Jul-2002 07:00:05.000,5,Good
RAMP,30-Jul-2002 07:00:06.000,6,Good
RAMP,30-Jul-2002 07:00:07.000,7,Good
RAMP,30-Jul-2002 07:00:08.000,8,Good
RAMP,30-Jul-2002 07:00:09.000,9,Good
RAMP,30-Jul-2002 07:00:10.000,10,Good
74
Advanced Topics
RAMP,30-Jul-2002 07:00:11.000,11,Good
RAMP,30-Jul-2002 07:00:12.000,12,Good
RAMP,30-Jul-2002 07:00:13.000,13,Good
RAMP,30-Jul-2002 07:00:14.000,14,Good
RAMP,30-Jul-2002 07:00:15.000,15,Good
RAMP,30-Jul-2002 07:00:16.000,16,Good
RAMP,30-Jul-2002 07:00:17.000,17,Good
RAMP,30-Jul-2002 07:00:18.000,18,Good
RAMP,30-Jul-2002 07:00:19.000,19,Good
RAMP,30-Jul-2002 07:00:20.000,20,Good
RAMP,30-Jul-2002 07:00:21.000,21,Good
RAMP,30-Jul-2002 07:00:22.000,22,Good
RAMP,30-Jul-2002 07:00:23.000,23,Good
RAMP,30-Jul-2002 07:00:24.000,24,Good
RAMP,30-Jul-2002 07:00:25.000,25,Good
RAMP,30-Jul-2002 07:00:26.000,26,Good
RAMP,30-Jul-2002 07:00:27.000,27,Good
RAMP,30-Jul-2002 07:00:28.000,28,Good
RAMP,30-Jul-2002 07:00:29.000,29,Good
RAMP,30-Jul-2002 07:00:30.000,30,Good
RAMP,30-Jul-2002 07:00:31.000,31,Good
RAMP,30-Jul-2002 07:00:32.000,32,Good
RAMP,30-Jul-2002 07:00:33.000,33,Good
RAMP,30-Jul-2002 07:00:34.000,34,Good
RAMP,30-Jul-2002 07:00:35.000,35,Good
RAMP,30-Jul-2002 07:00:36.000,36,Good
RAMP,30-Jul-2002 07:00:37.000,37,Good
RAMP,30-Jul-2002 07:00:38.000,38,Good
RAMP,30-Jul-2002 07:00:39.000,39,Good
RAMP,30-Jul-2002 07:00:40.000,40,Good
RAMP,30-Jul-2002 07:00:41.000,41,Good
RAMP,30-Jul-2002 07:00:42.000,42,Good
75
Advanced Topics Guide
RAMP,30-Jul-2002 07:00:43.000,43,Good
RAMP,30-Jul-2002 07:00:44.000,44,Good
RAMP,30-Jul-2002 07:00:45.000,45,Good
RAMP,30-Jul-2002 07:00:46.000,46,Good
RAMP,30-Jul-2002 07:00:47.000,47,Good
RAMP,30-Jul-2002 07:00:48.000,48,Good
RAMP,30-Jul-2002 07:00:49.000,49,Good
RAMP,30-Jul-2002 07:00:50.000,50,Good
RAMP,30-Jul-2002 07:00:51.000,51,Good
RAMP,30-Jul-2002 07:00:52.000,52,Good
RAMP,30-Jul-2002 07:00:53.000,53,Good
RAMP,30-Jul-2002 07:00:54.000,54,Good
RAMP,30-Jul-2002 07:00:55.000,55,Good
RAMP,30-Jul-2002 07:00:56.000,56,Good
RAMP,30-Jul-2002 07:00:57.000,57,Good
RAMP,30-Jul-2002 07:00:58.000,58,Good
RAMP,30-Jul-2002 07:00:59.000,59,Good
ONOFF,30-Jul-2002 07:00:00.000,0,Good
ONOFF,30-Jul-2002 07:00:01.000,1,Good
ONOFF,30-Jul-2002 07:01:01.000,0,Good
ONOFF,30-Jul-2002 07:01:16.000,0,Good
ONOFF,30-Jul-2002 07:01:17.000,1,Good
ONOFF,30-Jul-2002 07:01:18.000,1,Good
ONOFF,30-Jul-2002 07:02:01.000,1,Good
ONOFF,30-Jul-2002 07:03:01.000,0,Good
HAS SPACE,30-Jul-2002 07:00:00.000,0,Good
HAS SPACE,30-Jul-2002 07:00:01.000,1,Good
HAS SPACE,30-Jul-2002 07:01:01.000,0,Good
HAS SPACE,30-Jul-2002 07:01:16.000,0,Good
HAS SPACE,30-Jul-2002 07:01:17.000,1,Good
HAS SPACE,30-Jul-2002 07:01:18.000,1,Good
HAS SPACE,30-Jul-2002 07:02:01.000,1,Good
76

Advanced Topics
HAS SPACE,30-Jul-2002 07:03:01.000,0,Good
For the following scenarios, import the data tags provided.
Scenario 1: Rewriting a Query Using a Filter Expression
Here we write the same query using filter tag and filter expression. The output returned are the same. If you have only one condition it is your choice to use filter tag or filter expression.
Query Using the Filter Tag:
select timestamp, value, quality from ihrawdata where tagname = ramp and samplingmode=calculated and calculationmode=rawtotal and timestamp >= "07/30/2002 07:00:00" and timestamp <= "07/30/2002 07:01:00" and intervalmilliseconds = 10s and filtertag = batchid and filtervalue = B1 and filtermode = Beforetime and filtercomparisonmode=equal
Query Using a Filter Expression:
select timestamp, value, quality from ihrawdata where tagname = ramp and samplingmode=calculated and calculationmode=rawtotal and timestamp >= "07/30/2002 07:00:00" and timestamp <= "07/30/2002 07:01:00" and intervalmilliseconds = 10s and filterexpression='batchid=B1' and filtermode = Beforetime
In the above example, instead of using filtertag=BatchID, filtervalue=B1 and filtercomparisonmode=equal; we use filterexpression='BatchID=B1'.
Scenario 2: Filtering the Time when a Value is Between Two Limits
Here we use multiple filter conditions in the filter expression parameter. This is only possible using Filter Expression because the filter tag is limited to just one condition. This expression can be used to determine the time when a value is between two limits.
select timestamp, value, quality from ihrawdata where tagname = ramp and samplingmode=interpolated and timestamp >= "07/30/2002 06:00:00" and timestamp <= "07/30/2002 08:00:00" and intervalmilliseconds = 10s and filterexpression =’ramp>5 and ramp<21' and filtermode = Aftertime
In this example, we use two different conditions using the AND operator; filterexpression='ramp>5 and ramp<21'. The query returns the following data:
TimeStamp Value Quality
07-30-2002 07:00:10 10 100.0000000
07-30-2002 07:00:20 20 100.0000000
Scenario 3: Using the OR Operator
77
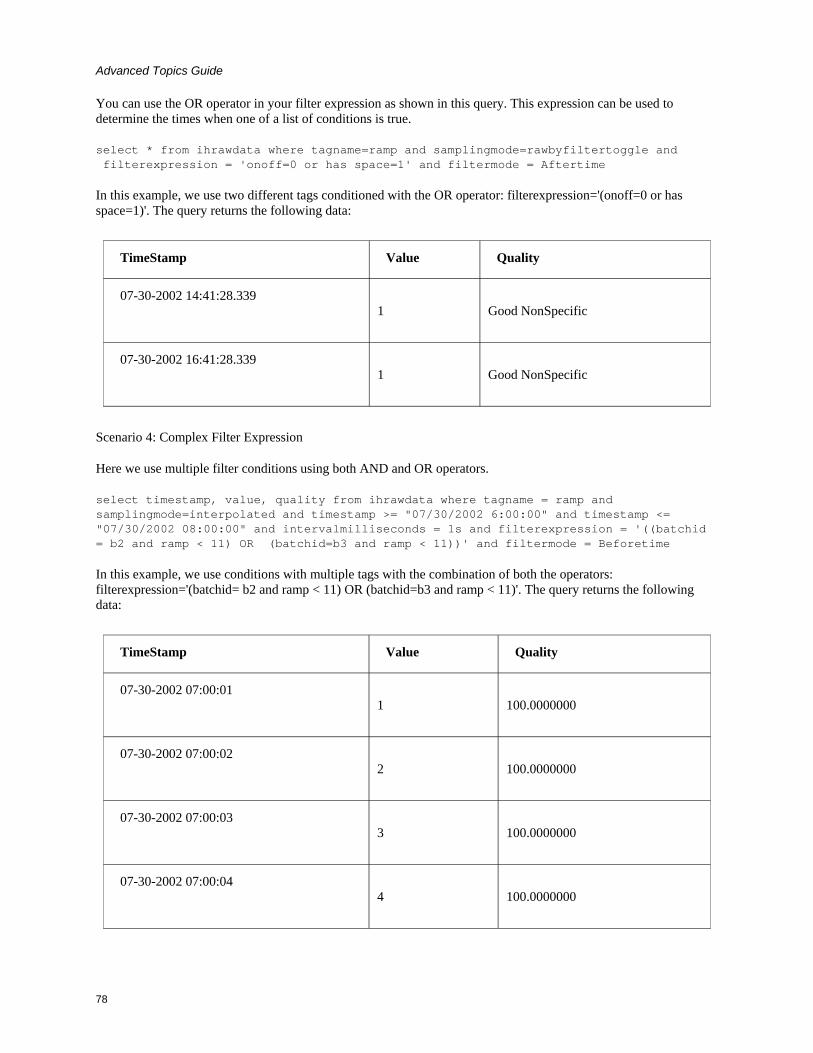
Advanced Topics Guide
You can use the OR operator in your filter expression as shown in this query. This expression can be used to determine the times when one of a list of conditions is true.
select * from ihrawdata where tagname=ramp and samplingmode=rawbyfiltertoggle and filterexpression = 'onoff=0 or has space=1' and filtermode = Aftertime
In this example, we use two different tags conditioned with the OR operator: filterexpression='(onoff=0 or has space=1)'. The query returns the following data:
TimeStamp Value Quality
07-30-2002 14:41:28.339 1 Good NonSpecific
07-30-2002 16:41:28.339 1 Good NonSpecific
Scenario 4: Complex Filter Expression
Here we use multiple filter conditions using both AND and OR operators.
select timestamp, value, quality from ihrawdata where tagname = ramp and samplingmode=interpolated and timestamp >= "07/30/2002 6:00:00" and timestamp <= "07/30/2002 08:00:00" and intervalmilliseconds = 1s and filterexpression = '((batchid = b2 and ramp < 11) OR (batchid=b3 and ramp < 11))' and filtermode = Beforetime
In this example, we use conditions with multiple tags with the combination of both the operators: filterexpression='(batchid= b2 and ramp < 11) OR (batchid=b3 and ramp < 11)'. The query returns the following data:
TimeStamp Value Quality
07-30-2002 07:00:01 1 100.0000000
07-30-2002 07:00:02 2 100.0000000
07-30-2002 07:00:03 3 100.0000000
07-30-2002 07:00:04 4 100.0000000
78

Advanced Topics
07-30-2002 07:00:05 5 100.0000000
07-30-2002 07:00:06 6 100.0000000
07-30-2002 07:00:07 7 100.0000000
07-30-2002 07:00:08 8 100.0000000
07-30-2002 07:00:09 9 100.0000000
07-30-2002 07:00:10 10 100.0000000
NOTE: We can use RawByFilterToggle as the sampling mode along with filter tag or filter expression. For more examples, refer to the RawByFilterToggle section.
Scenario 5: Using Bitwise Comparison Modes
Import this data into Proficy Historian:
[Tags]
Tagname,DataType,HiEngineeringUnits,LoEngineeringUnits
Tag1,SingleInteger,60,0
[Data]
Tagname,TimeStamp,Value,DataQuality
Tag1,07-05-2011 17:24:00,2,Bad
Tag1,07-05-2011 17:25:00,3,Good
Tag1,07-05-2011 17:26:00,4,Good
Tag1,07-05-2011 17:27:00,5,Bad
Tag1,07-05-2011 17:28:00,6,Bad
Tag1,07-05-2011 17:29:00,7,Good
Tag1,07-05-2011 17:30:00,8,Bad
Tag1,07-05-2011 17:31:00,9,Bad
79
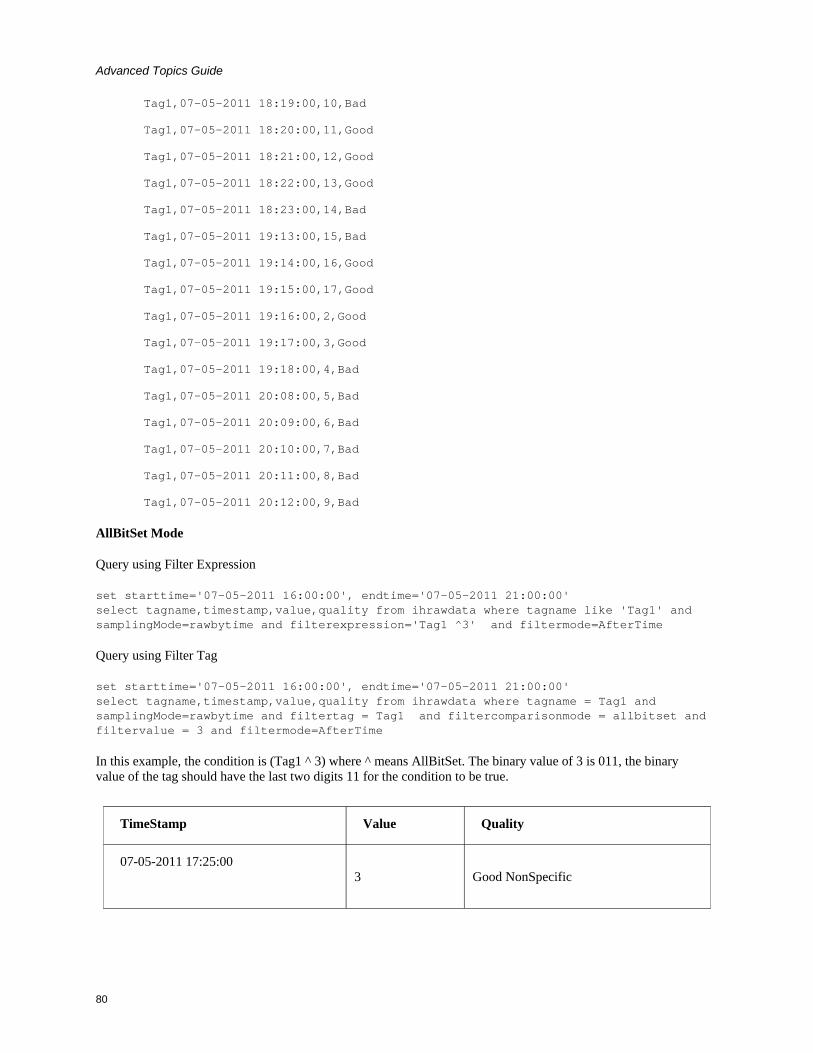
Advanced Topics Guide
Tag1,07-05-2011 18:19:00,10,Bad
Tag1,07-05-2011 18:20:00,11,Good
Tag1,07-05-2011 18:21:00,12,Good
Tag1,07-05-2011 18:22:00,13,Good
Tag1,07-05-2011 18:23:00,14,Bad
Tag1,07-05-2011 19:13:00,15,Bad
Tag1,07-05-2011 19:14:00,16,Good
Tag1,07-05-2011 19:15:00,17,Good
Tag1,07-05-2011 19:16:00,2,Good
Tag1,07-05-2011 19:17:00,3,Good
Tag1,07-05-2011 19:18:00,4,Bad
Tag1,07-05-2011 20:08:00,5,Bad
Tag1,07-05-2011 20:09:00,6,Bad
Tag1,07-05-2011 20:10:00,7,Bad
Tag1,07-05-2011 20:11:00,8,Bad
Tag1,07-05-2011 20:12:00,9,Bad
AllBitSet Mode
Query using Filter Expression
set starttime='07-05-2011 16:00:00', endtime='07-05-2011 21:00:00' select tagname,timestamp,value,quality from ihrawdata where tagname like 'Tag1' and samplingMode=rawbytime and filterexpression='Tag1 ^3' and filtermode=AfterTime
Query using Filter Tag
set starttime='07-05-2011 16:00:00', endtime='07-05-2011 21:00:00' select tagname,timestamp,value,quality from ihrawdata where tagname = Tag1 and samplingMode=rawbytime and filtertag = Tag1 and filtercomparisonmode = allbitset and filtervalue = 3 and filtermode=AfterTime
In this example, the condition is (Tag1 ^ 3) where ^ means AllBitSet. The binary value of 3 is 011, the binary value of the tag should have the last two digits 11 for the condition to be true.
TimeStamp Value Quality
07-05-2011 17:25:00 3 Good NonSpecific
80

Advanced Topics
07-05-2011 17:29:00 7 Good NonSpecific
07-05-2011 18:20:00 11 Good NonSpecific
07-05-2011 19:17:00 3 Good NonSpecific
AnyBitSet Mode
set starttime='07-05-2011 16:00:00', endtime='07-05-2011 21:00:00' select tagname,timestamp,value,quality from ihrawdata where tagname like 'Tag1' and samplingMode=rawbytime and filterexpression='Tag1 ~3'and filtermode=AfterTime
In this example, the condition is (Tag1 ~ 3) where ~ means AnyBitSet. The binary value of 3 is 011, the binary value of the tag should have at least one value set for the condition to be true.
TimeStamp Value Quality
07-05-2011 17:25:00 3 Good NonSpecific
07-05-2011 17:29:00 7 Good NonSpecific
07-05-2011 18:20:00 11 Good NonSpecific
07-05-2011 18:22:00 13 Good NonSpecific
07-05-2011 19:15:00 17 Good NonSpecific
07-05-2011 19:16:00 2 Good NonSpecific
07-05-2011 19:17:00 3 Good NonSpecific
81

Advanced Topics Guide
AnyBitNotSet Mode
set starttime='07-05-2011 16:00:00', endtime='07-05-2011 21:00:00' select tagname,timestamp,value,quality from ihrawdata where tagname like 'Tag1' and SamplingMode=rawbytime and filterexpression='Tag1 !~3'and filtermode=AfterTime
In this example, the condition is (Tag1 !~ 3) where !~ means AnyBitNotSet. With this comparison mode either one digit or both the digits need not be set for the condition to be TRUE.
TimeStamp Value Quality
07-05-2011 17:26:00 4 Good NonSpecific
07-05-2011 18:21:00 12 Good NonSpecific
07-05-2011 18:22:00 13 Good NonSpecific
07-05-2011 19:14:00 16 Good NonSpecific
07-05-2011 19:15:00 17 Good NonSpecific
07-05-2011 19:16:00 2 Good NonSpecific
AllBitNotSet Mode
set starttime='07-05-2011 16:00:00', endtime='07-05-2011 21:00:00' select tagname,timestamp,value,quality from ihrawdata where tagname like 'Tag1' and samplingMode=rawbytime and filterexpression='Tag1 !^3'and filtermode=AfterTime
In this example, the condition is (Tag1 !^ 3) where !^ means AllBitNotSet. With this comparison mode both the digits should not be set for the condition to be TRUE.
TimeStamp Value Quality
07-05-2011 17:26:00 4 Good NonSpecific
82

Advanced Topics
07-05-2011 18:21:00 12 Good NonSpecific
07-05-2011 19:14:00 16 Good NonSpecific
NOTE: Bad quality values are not considered.
Other Calculation Modes
STATECOUNT
Counts the number of times a tag has transitioned to another state from a previous state. A state transition is counted when the previous good sample is not equal to the state value and the next good sample is equal to state value.
The State Count calculation mode cannot be used on tags of BLOB data type.
Value
The number of transitions into the state in a given time interval.
Quality
The percent good is 100 if there are no bad samples within the time interval. Otherwise, the percent good is the percent of interval time that the value was of good quality.
Example: Calculating the state count of good quality data
This example shows a simple case of counting state transitions. In this example, the value 4 means that a machine is running so we want to count the number of times the tag transitioned from some other value to 4.
Import the following data.
[Tags]
Tagname,DataType,HiEngineeringUnits,LoEngineeringUnits
STATECOUNTTAG,SingleInteger,60,0
STATEBADTAG,SingleInteger,60,0
STATEBADTAG2,SingleInteger,60,0
[Data]
Tagname,TimeStamp,Value,DataQuality
STATECOUNTTAG,06-Aug-2012 8:59:00.000,2,Good
STATECOUNTTAG,06-Aug-2012 9:08:00.000,4,Good
83

Advanced Topics Guide
STATECOUNTTAG,06-Aug-2012 9:14:00.000,4,Good
STATECOUNTTAG,06-Aug-2012 9:22:00.000,2,Good
STATEBADTAG,06-Aug-2012 8:59:00.000,2,Good
STATEBADTAG,06-Aug-2012 9:08:00.000,0,Bad
STATEBADTAG,06-Aug-2012 9:14:00.000,2,Good
STATEBADTAG,06-Aug-2012 9:22:00.000,4,Good
STATEBADTAG2,06-Aug-2012 8:59:00.000,2,Good
STATEBADTAG2,06-Aug-2012 9:08:00.000,0,Bad
STATEBADTAG2,06-Aug-2012 9:14:00.000,4,Good
STATEBADTAG2,06-Aug-2012 9:22:00.000,2,Good
Execute the following query in Historian Interactive SQL:
set starttime='08/06/2012 8:00:00',endtime='08/06/2012 10:00:00' select timestamp,value,quality from ihrawdata where tagname = STATECOUNTTAG and samplingmode=Calculation and CalculationMode=StateCount and IntervalMilliseconds=20m and statevalue=4
The following results are returned:
TimeStamp Value Quality
8/6/2012 08:20:00 0.000000000000 0.0000000
8/6/2012 08:40:00 0.000000000000 0.0000000
8/6/2012 09:00:00 0.000000000000 5.0000000
8/6/2012 09:40:00 1.000000000000 100.0000000
8/6/2012 09:40:00 0.000000000000 100.0000000
8/6/2012 10:00:00 0.000000000000 100.0000000
84
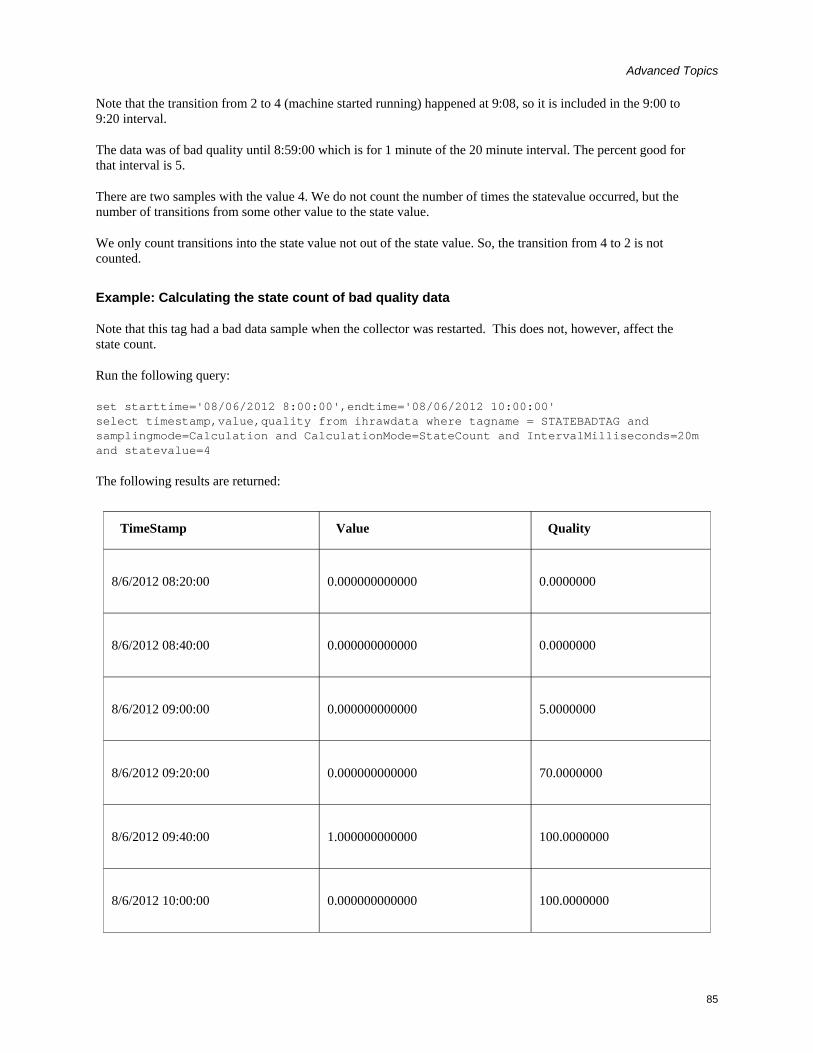
Advanced Topics
Note that the transition from 2 to 4 (machine started running) happened at 9:08, so it is included in the 9:00 to 9:20 interval.
The data was of bad quality until 8:59:00 which is for 1 minute of the 20 minute interval. The percent good for that interval is 5.
There are two samples with the value 4. We do not count the number of times the statevalue occurred, but the number of transitions from some other value to the state value.
We only count transitions into the state value not out of the state value. So, the transition from 4 to 2 is not counted.
Example: Calculating the state count of bad quality data
Note that this tag had a bad data sample when the collector was restarted. This does not, however, affect the state count.
Run the following query:
set starttime='08/06/2012 8:00:00',endtime='08/06/2012 10:00:00' select timestamp,value,quality from ihrawdata where tagname = STATEBADTAG and samplingmode=Calculation and CalculationMode=StateCount and IntervalMilliseconds=20m and statevalue=4
The following results are returned:
TimeStamp Value Quality
8/6/2012 08:20:00 0.000000000000 0.0000000
8/6/2012 08:40:00 0.000000000000 0.0000000
8/6/2012 09:00:00 0.000000000000 5.0000000
8/6/2012 09:20:00 0.000000000000 70.0000000
8/6/2012 09:40:00 1.000000000000 100.0000000
8/6/2012 10:00:00 0.000000000000 100.0000000
85

Advanced Topics Guide
Note that the bad value is ignored and the state change that happened at 9:22 is counted. We do not know if the machine had started and stopped while the collector was shutdown.
If the value did change to running while the collector was shut down then that change is counted as in shown in the following example:
set starttime='08/06/2012 8:00:00',endtime='08/06/2012 10:00:00' select timestamp,value,quality from ihrawdata where tagname = STATEBADTAG2 and samplingmode=Calculation and CalculationMode=StateCount and IntervalMilliseconds=20m and statevalue=4
TimeStamp Value Quality
8/6/2012 08:20:00 0.000000000000 0.0000000
8/6/2012 08:40:00 0.000000000000 0.0000000
8/6/2012 09:00:00 0.000000000000 5.0000000
8/6/2012 09:20:00 1.000000000000 70.0000000
8/6/2012 09:40:00 0.000000000000 100.0000000
8/6/2012 10:00:00 0.000000000000 100.0000000
The state change at 9:14 is counted and returned in the 9:20 interval.
Example: Calculating the state count of enumerated set data
When querying a tag that uses enumerated sets, use the string state name as the state value.
Using the data from previous example, assume that the STATECOUNTTAG had an enumerated set with the values as 2=Stopped and 4=Running.
You should use this query with statevalue of Running instead of the native value 4.
set starttime='08/06/2012 8:00:00',endtime='08/06/2012 10:00:00' select timestamp,value,quality from ihrawdata where tagname = STATECOUNTTAG and samplingmode=Calculation and CalculationMode=StateCount and IntervalMilliseconds=20m and statevalue='Running'
86

Advanced Topics
The results match with the results when statevalue=4 is used.
TimeStamp Value Quality
8/6/2012 08:20:00 0.000000000000 0.0000000
8/6/2012 08:40:00 0.000000000000 0.0000000
8/6/2012 09:00:00 0.000000000000 5.0000000
8/6/2012 09:20:00 1.000000000000 100.0000000
8/6/2012 09:40:00 0.000000000000 100.0000000
8/6/2012 10:00:00 0.000000000000 100.0000000
Anticipated Usage
State Count is useful to determine the number of times a value transitioned to a certain state such as when a digital state was turned on or the enumerated value was of certain value. It should mostly be used with integer values because it may not exactly match a float statevalue due to rounding.
STATETIME
Retrieves the duration that a tag was in a given state within an interval.
Value
State time retrieves the total number of milliseconds during the interval for which the data was in the statevalue.
Quality
The percent good is 100 if the data is good quality for the entire the time interval.
Import this data to use in the examples.
[Tags]
87

Advanced Topics Guide
Tagname,DataType,HiEngineeringUnits,LoEngineeringUnits
STATECOUNTTAG,SingleInteger,60,0
STATEBADTAG,SingleInteger,60,0
STATEBADTAG2,SingleInteger,60,0
[Data]
Tagname,TimeStamp,Value,DataQuality
STATECOUNTTAG,06-Aug-2012 8:59:00.000,2,Good
STATECOUNTTAG,06-Aug-2012 9:08:00.000,4,Good
STATECOUNTTAG,06-Aug-2012 9:14:00.000,4,Good
STATECOUNTTAG,06-Aug-2012 9:22:00.000,2,Good
STATEBADTAG,06-Aug-2012 8:59:00.000,2,Good
STATEBADTAG,06-Aug-2012 9:08:00.000,0,Bad
STATEBADTAG,06-Aug-2012 9:14:00.000,2,Good
STATEBADTAG,06-Aug-2012 9:22:00.000,4,Good
STATEBADTAG2,06-Aug-2012 8:59:00.000,2,Good
STATEBADTAG2,06-Aug-2012 9:08:00.000,0,Bad
STATEBADTAG2,06-Aug-2012 9:14:00.000,4,Good
STATEBADTAG2,06-Aug-2012 9:22:00.000,2,Good
Example: Calculating the state time of good quality data
Run this query in the Historian Interactive SQL:
set starttime='08/06/2012 8:00:00',endtime='08/06/2012 10:00:00' select timestamp,value,quality from ihrawdata where tagname = STATECOUNTTAG and samplingmode=Calculation and CalculationMode=StateTime and IntervalMilliseconds=20m and statevalue=4
The following results are returned:
TimeStamp Value Quality
8/6/2012 08:20:00 0.000000000000 0.0000000
8/6/2012 08:40:00 0.000000000000 0.0000000
88
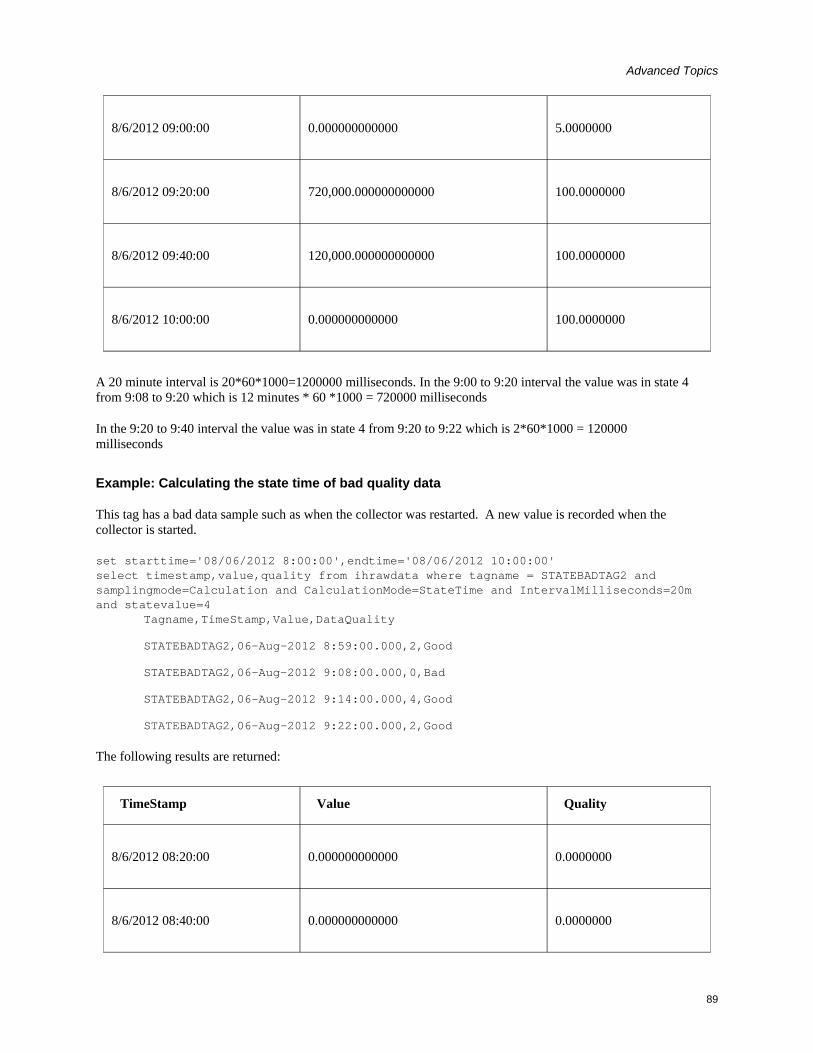
Advanced Topics
8/6/2012 09:00:00 0.000000000000 5.0000000
8/6/2012 09:20:00 720,000.000000000000 100.0000000
8/6/2012 09:40:00 120,000.000000000000 100.0000000
8/6/2012 10:00:00 0.000000000000 100.0000000
A 20 minute interval is 20*60*1000=1200000 milliseconds. In the 9:00 to 9:20 interval the value was in state 4 from 9:08 to 9:20 which is 12 minutes * 60 *1000 = 720000 milliseconds
In the 9:20 to 9:40 interval the value was in state 4 from 9:20 to 9:22 which is 2*60*1000 = 120000 milliseconds
Example: Calculating the state time of bad quality data
This tag has a bad data sample such as when the collector was restarted. A new value is recorded when the collector is started.
set starttime='08/06/2012 8:00:00',endtime='08/06/2012 10:00:00' select timestamp,value,quality from ihrawdata where tagname = STATEBADTAG2 and samplingmode=Calculation and CalculationMode=StateTime and IntervalMilliseconds=20m and statevalue=4
Tagname,TimeStamp,Value,DataQuality
STATEBADTAG2,06-Aug-2012 8:59:00.000,2,Good
STATEBADTAG2,06-Aug-2012 9:08:00.000,0,Bad
STATEBADTAG2,06-Aug-2012 9:14:00.000,4,Good
STATEBADTAG2,06-Aug-2012 9:22:00.000,2,Good
The following results are returned:
TimeStamp Value Quality
8/6/2012 08:20:00 0.000000000000 0.0000000
8/6/2012 08:40:00 0.000000000000 0.0000000
89

Advanced Topics Guide
8/6/2012 09:00:00 0.000000000000 5.0000000
8/6/2012 09:20:00 360,000.000000000000 70.0000000
8/6/2012 09:40:00 120,000.000000000000 100.0000000
8/6/2012 10:00:00 0.000000000000 100.0000000
In the interval between 9:00 to 9:20, the value was in state 4 from 9:14 to 9:20 = 6 minutes * 60 * 1000 = 360000 milliseconds.
In the interval between 9:20 to 9:40, the value was in state 4 from 9:20 to 9:22 = 2 minutes * 60 * 1000 = 120000 milliseconds.
Anticipated Usage
State Time is useful to determine the duration the tag was in a particular state. For example, if a tag records the state of a motor you can use statecount to determine the duration a motor was in idle state.
OPCQOR and OPCQAND
The OPCQOR is a bit-wise OR operation of all the 16 bit OPC qualities of the raw samples stored in the specified interval. This calculation mode can be used only if you have set the ”Store OPC Quality” to ”Enabled” in the Historian Administrator and your data is coming from an OPC Collector
The OPCQAND is a bit wise AND operation of all the 16 bit OPC qualities of the raw samples stored in the specified interval. This calculation mode can be used only if you have set the ”Store OPC Quality” to Enabled in the Historian Administrator and your data is coming from an OPC Collector.
When collecting data from OPC servers, Historian OPC collector will convert the 16 bits of OPC quality to a Historian quality and subquality. When ”Store OPC Quality” is enabled, the 16 bits are also stored with the data and can be retrieved here.
Use the returned value from OPCQOR like a data quality. By using OPCQOR and OPCQAND values, you can see if a condition occurred during an interval and therefore know how trustworthy your returned data is.
Value
The 16 bits are in the following format:
VVVVVVVVQQSSSSSS
The first 16 bits are for vendor to fill in. The next two are the actual quality, good, bad,uncertain. The rest of the bits are subquality.
90
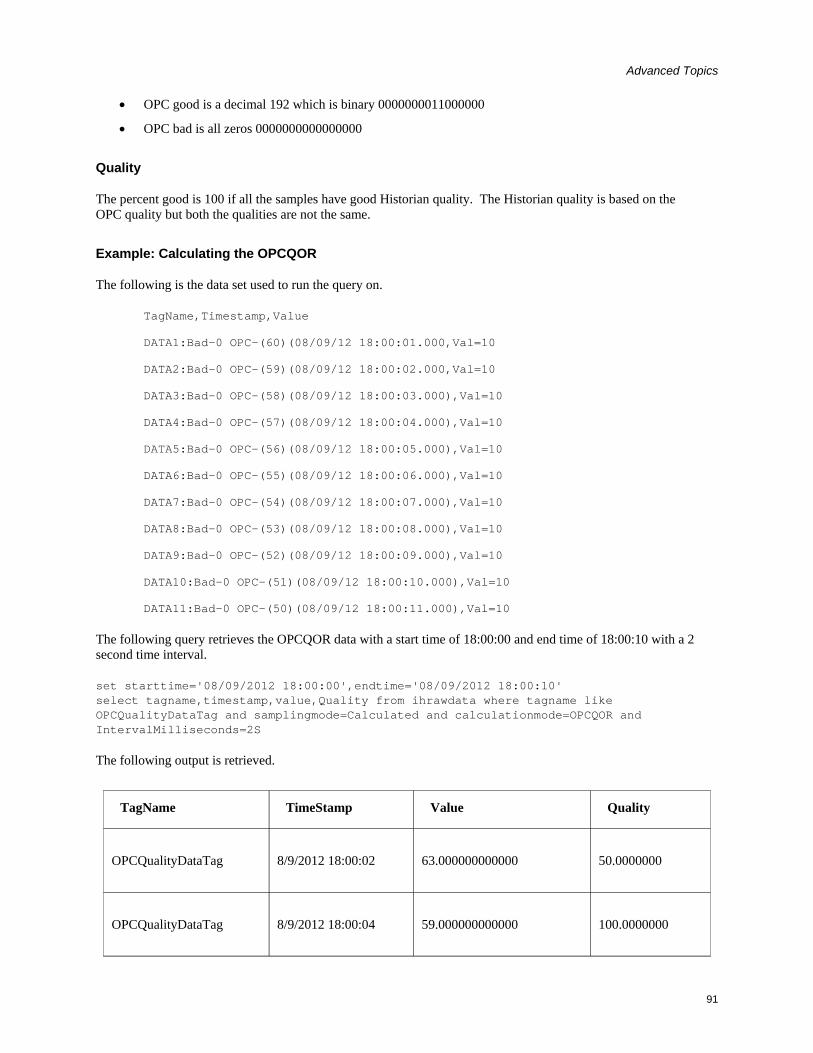
Advanced Topics
• OPC good is a decimal 192 which is binary 0000000011000000
• OPC bad is all zeros 0000000000000000
Quality
The percent good is 100 if all the samples have good Historian quality. The Historian quality is based on the OPC quality but both the qualities are not the same.
Example: Calculating the OPCQOR
The following is the data set used to run the query on.
TagName,Timestamp,Value
DATA1:Bad-0 OPC-(60)(08/09/12 18:00:01.000,Val=10
DATA2:Bad-0 OPC-(59)(08/09/12 18:00:02.000,Val=10
DATA3:Bad-0 OPC-(58)(08/09/12 18:00:03.000),Val=10
DATA4:Bad-0 OPC-(57)(08/09/12 18:00:04.000),Val=10
DATA5:Bad-0 OPC-(56)(08/09/12 18:00:05.000),Val=10
DATA6:Bad-0 OPC-(55)(08/09/12 18:00:06.000),Val=10
DATA7:Bad-0 OPC-(54)(08/09/12 18:00:07.000),Val=10
DATA8:Bad-0 OPC-(53)(08/09/12 18:00:08.000),Val=10
DATA9:Bad-0 OPC-(52)(08/09/12 18:00:09.000),Val=10
DATA10:Bad-0 OPC-(51)(08/09/12 18:00:10.000),Val=10
DATA11:Bad-0 OPC-(50)(08/09/12 18:00:11.000),Val=10
The following query retrieves the OPCQOR data with a start time of 18:00:00 and end time of 18:00:10 with a 2 second time interval.
set starttime='08/09/2012 18:00:00',endtime='08/09/2012 18:00:10' select tagname,timestamp,value,Quality from ihrawdata where tagname like OPCQualityDataTag and samplingmode=Calculated and calculationmode=OPCQOR and IntervalMilliseconds=2S
The following output is retrieved.
TagName TimeStamp Value Quality
OPCQualityDataTag 8/9/2012 18:00:02 63.000000000000 50.0000000
OPCQualityDataTag 8/9/2012 18:00:04 59.000000000000 100.0000000
91
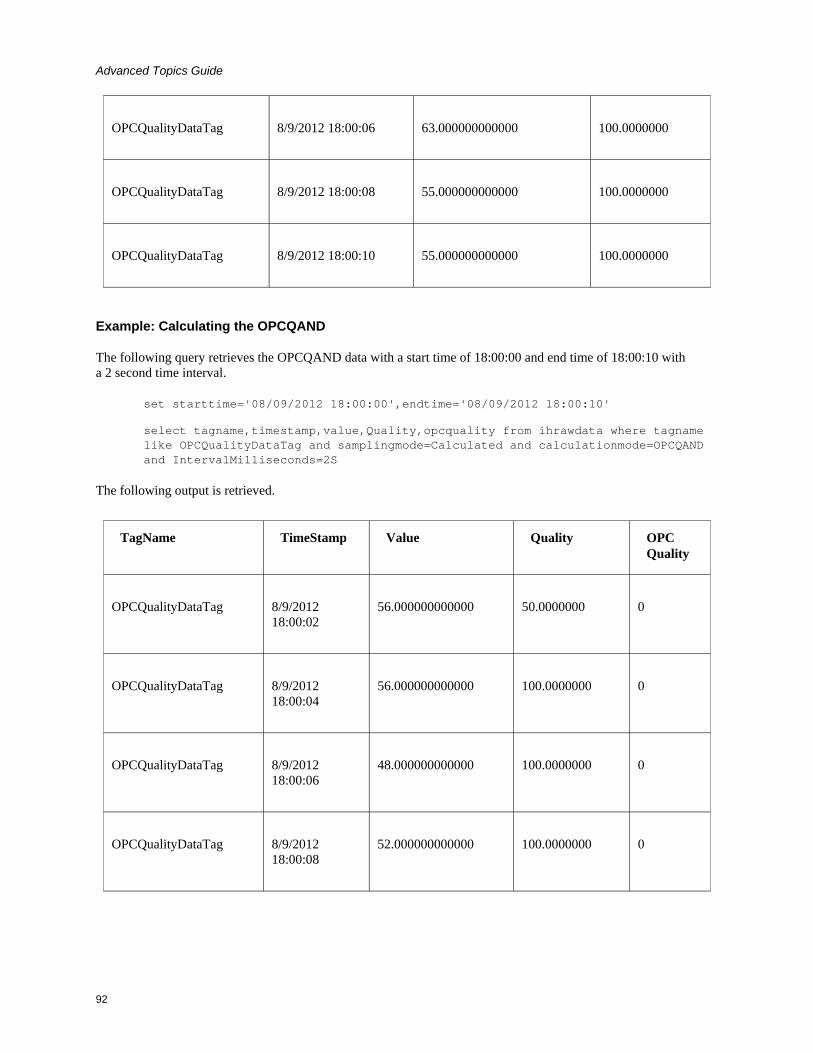
Advanced Topics Guide
OPCQualityDataTag 8/9/2012 18:00:06 63.000000000000 100.0000000
OPCQualityDataTag 8/9/2012 18:00:08 55.000000000000 100.0000000
OPCQualityDataTag 8/9/2012 18:00:10 55.000000000000 100.0000000
Example: Calculating the OPCQAND
The following query retrieves the OPCQAND data with a start time of 18:00:00 and end time of 18:00:10 with a 2 second time interval.
set starttime='08/09/2012 18:00:00',endtime='08/09/2012 18:00:10'
select tagname,timestamp,value,Quality,opcquality from ihrawdata where tagname like OPCQualityDataTag and samplingmode=Calculated and calculationmode=OPCQAND and IntervalMilliseconds=2S
The following output is retrieved.
TagName TimeStamp Value Quality OPC Quality
OPCQualityDataTag 8/9/2012 18:00:02
56.000000000000 50.0000000 0
OPCQualityDataTag 8/9/2012 18:00:04
56.000000000000 100.0000000 0
OPCQualityDataTag 8/9/2012 18:00:06
48.000000000000 100.0000000 0
OPCQualityDataTag 8/9/2012 18:00:08
52.000000000000 100.0000000 0
92
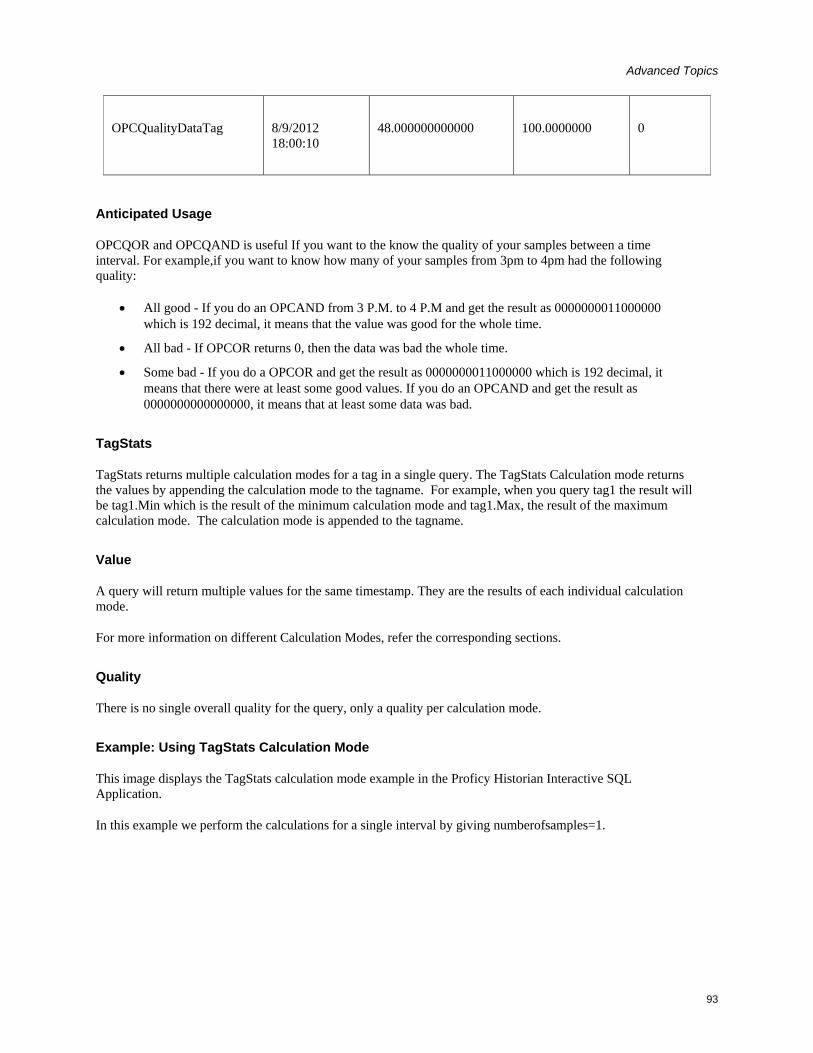
Advanced Topics
OPCQualityDataTag 8/9/2012 18:00:10
48.000000000000 100.0000000 0
Anticipated Usage
OPCQOR and OPCQAND is useful If you want to the know the quality of your samples between a time interval. For example,if you want to know how many of your samples from 3pm to 4pm had the following quality:
• All good - If you do an OPCAND from 3 P.M. to 4 P.M and get the result as 0000000011000000 which is 192 decimal, it means that the value was good for the whole time.
• All bad - If OPCOR returns 0, then the data was bad the whole time.
• Some bad - If you do a OPCOR and get the result as 0000000011000000 which is 192 decimal, it means that there were at least some good values. If you do an OPCAND and get the result as 0000000000000000, it means that at least some data was bad.
TagStats
TagStats returns multiple calculation modes for a tag in a single query. The TagStats Calculation mode returns the values by appending the calculation mode to the tagname. For example, when you query tag1 the result will be tag1.Min which is the result of the minimum calculation mode and tag1.Max, the result of the maximum calculation mode. The calculation mode is appended to the tagname.
Value
A query will return multiple values for the same timestamp. They are the results of each individual calculation mode.
For more information on different Calculation Modes, refer the corresponding sections.
Quality
There is no single overall quality for the query, only a quality per calculation mode.
Example: Using TagStats Calculation Mode
This image displays the TagStats calculation mode example in the Proficy Historian Interactive SQL Application.
In this example we perform the calculations for a single interval by giving numberofsamples=1.
93

Advanced Topics Guide
The StepValue Tag Property Retrieval generally does not take into account how a value changes. When retrieving data from the archive, Historian will attempt to interpolate it, which may result in an inaccurate representation of the data's real world changes, such as that shown in the following figure.
94

Advanced Topics
Figure 1: Ramped values compared to Stepped values.
In order for Historian to know that a tag did not ramp down between reported values, the StepValue tag property must be applied. This tag property is used to indicate that the value in the real world changes in a sharp step instead of a smooth linear interpolation. An example would be a digital signal that quickly goes 0 to 1. Or, a flow rate that goes 5 to 25 when an upstream valve is opened.
NOTE: The StepValue tag property only affects retrieval of Average values in Historian. It does not affect data collection or storage.
Example: Reporting Step Change
Copy and paste the following into an empty CSV file and import the file with the File collector.
[Tags]
Tagname,DataType,HiEngineeringUnits,LoEngineeringUnits
TAG1,SingleFloat,100,0
[Data]
Tagname,TimeStamp,Value,DataQuality
tag1,9/19/05 05:15:00,26.41,Good
95
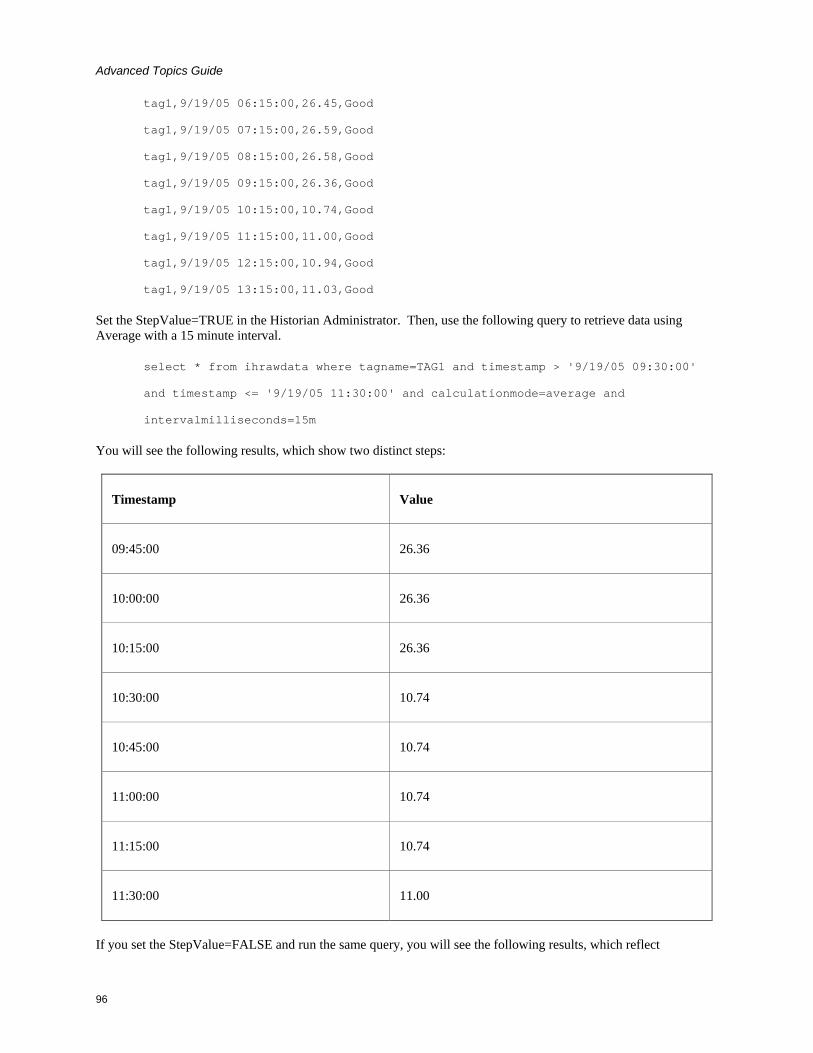
Advanced Topics Guide
tag1,9/19/05 06:15:00,26.45,Good
tag1,9/19/05 07:15:00,26.59,Good
tag1,9/19/05 08:15:00,26.58,Good
tag1,9/19/05 09:15:00,26.36,Good
tag1,9/19/05 10:15:00,10.74,Good
tag1,9/19/05 11:15:00,11.00,Good
tag1,9/19/05 12:15:00,10.94,Good
tag1,9/19/05 13:15:00,11.03,Good
Set the StepValue=TRUE in the Historian Administrator. Then, use the following query to retrieve data using Average with a 15 minute interval.
select * from ihrawdata where tagname=TAG1 and timestamp > '9/19/05 09:30:00'
and timestamp <= '9/19/05 11:30:00' and calculationmode=average and
intervalmilliseconds=15m
You will see the following results, which show two distinct steps:
Timestamp Value
09:45:00 26.36
10:00:00 26.36
10:15:00 26.36
10:30:00 10.74
10:45:00 10.74
11:00:00 10.74
11:15:00 10.74
11:30:00 11.00
If you set the StepValue=FALSE and run the same query, you will see the following results, which reflect
96

Advanced Topics
interpolated values..
Timestamp Value
09:45:00 22.46
10:00:00 18.55
10:15:00 14.64
10:30:00 10.74
10:45:00 10.80
11:00:00 10.87
11:15:00 10.93
11:30:00 11.00
Example: No raw sample at start time
Copy and paste these lines into an empty CSV file and import the file with the File collector.
[Tags]
Tagname,DataType,HiEngineeringUnits,LoEngineeringUnits,StepValue
TAG2,SingleFloat,100,0,TRUE
[Data]
Tagname,TimeStamp,Value,DataQuality
TAG2,9/19/05 13:59:00.000,22,Good
TAG2,9/19/05 14:08:00.000,12,Good
TAG2,9/19/05 14:22:00.000,4,Good
Use the following query to retrieve the data using Average with a 30 minute interval.
select * from ihrawdata where tagname=tag2 and timestamp >
'9/19/05 14:00:00' and timestamp <= '9/19/05 14:30:00' and
97
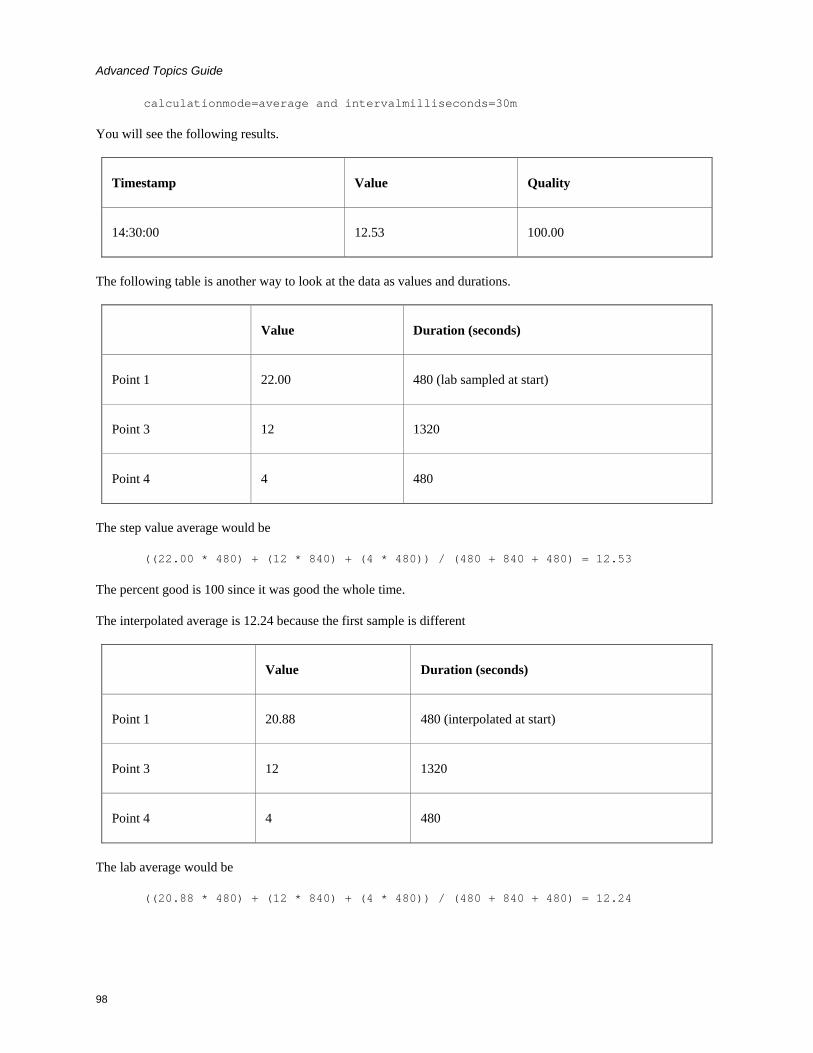
Advanced Topics Guide
calculationmode=average and intervalmilliseconds=30m
You will see the following results.
Timestamp Value Quality
14:30:00 12.53 100.00
The following table is another way to look at the data as values and durations.
Value Duration (seconds)
Point 1 22.00 480 (lab sampled at start)
Point 3 12 1320
Point 4 4 480
The step value average would be
((22.00 * 480) + (12 * 840) + (4 * 480)) / (480 + 840 + 480) = 12.53
The percent good is 100 since it was good the whole time.
The interpolated average is 12.24 because the first sample is different
Value Duration (seconds)
Point 1 20.88 480 (interpolated at start)
Point 3 12 1320
Point 4 4 480
The lab average would be
((20.88 * 480) + (12 * 840) + (4 * 480)) / (480 + 840 + 480) = 12.24
98

Advanced Topics
Example: Raw sample at start time
The point of this example is that if you have a raw sample on the interval start time then you don’t need to interpolate or lab sample. The average and lab average should be the same.
Copy and paste these lines into an empty CSV file and import the file with the File collector.
[Tags]
Tagname,DataType,HiEngineeringUnits,LoEngineeringUnits,StepValue
TAG3,SingleFloat,100,0,TRUE
[Data]
Tagname,TimeStamp,Value,DataQuality
TAG3,9/19/05 14:00:00.000,22,Good
TAG3,9/19/05 14:08:00.000,12,Good
TAG3,9/19/05 14:22:00.000,4,Good
Use the following query to retrieve the average with a 30 minute interval.
select * from ihrawdata where tagname=tag3 and timestamp >
'9/19/05 14:00:00' and timestamp <= '9/19/05 14:30:00' and
calculationmode=average and intervalmilliseconds=30m
You will see the following results.
Timestamp Value
14:30:00 12.53
The interpolated average (StepValue=FALSE) gives exact same value.
The percent good is 100 since it was good the whole time.
Example: Raw sample at end time
The point of this example is that if you have a raw sample on the interval end time then it is ignored because of the time weighting.
Copy and paste these lines into an empty CSV file and import the file with the File collector.
[Tags]
Tagname,DataType,HiEngineeringUnits,LoEngineeringUnits,StepValue
TAG5,SingleFloat,100,0,TRUE
99
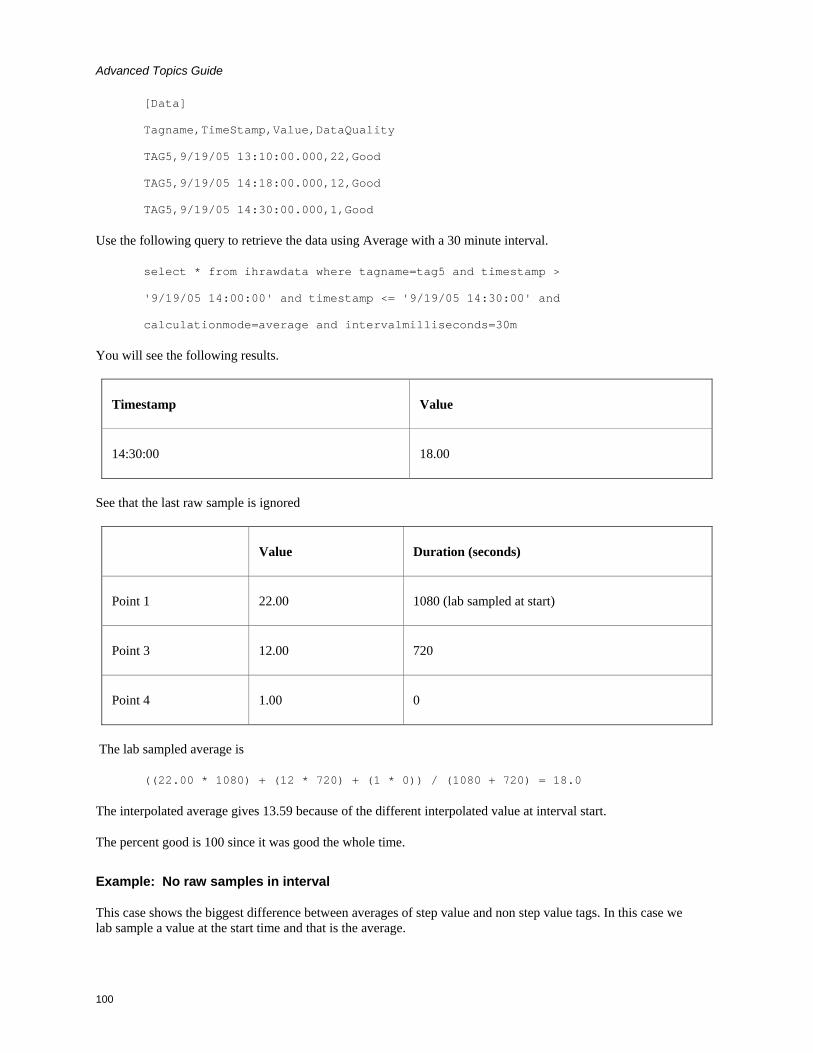
Advanced Topics Guide
[Data]
Tagname,TimeStamp,Value,DataQuality
TAG5,9/19/05 13:10:00.000,22,Good
TAG5,9/19/05 14:18:00.000,12,Good
TAG5,9/19/05 14:30:00.000,1,Good
Use the following query to retrieve the data using Average with a 30 minute interval.
select * from ihrawdata where tagname=tag5 and timestamp >
'9/19/05 14:00:00' and timestamp <= '9/19/05 14:30:00' and
calculationmode=average and intervalmilliseconds=30m
You will see the following results.
Timestamp Value
14:30:00 18.00
See that the last raw sample is ignored
Value Duration (seconds)
Point 1 22.00 1080 (lab sampled at start)
Point 3 12.00 720
Point 4 1.00 0
The lab sampled average is
((22.00 * 1080) + (12 * 720) + (1 * 0)) / (1080 + 720) = 18.0
The interpolated average gives 13.59 because of the different interpolated value at interval start.
The percent good is 100 since it was good the whole time.
Example: No raw samples in interval
This case shows the biggest difference between averages of step value and non step value tags. In this case we lab sample a value at the start time and that is the average.
100
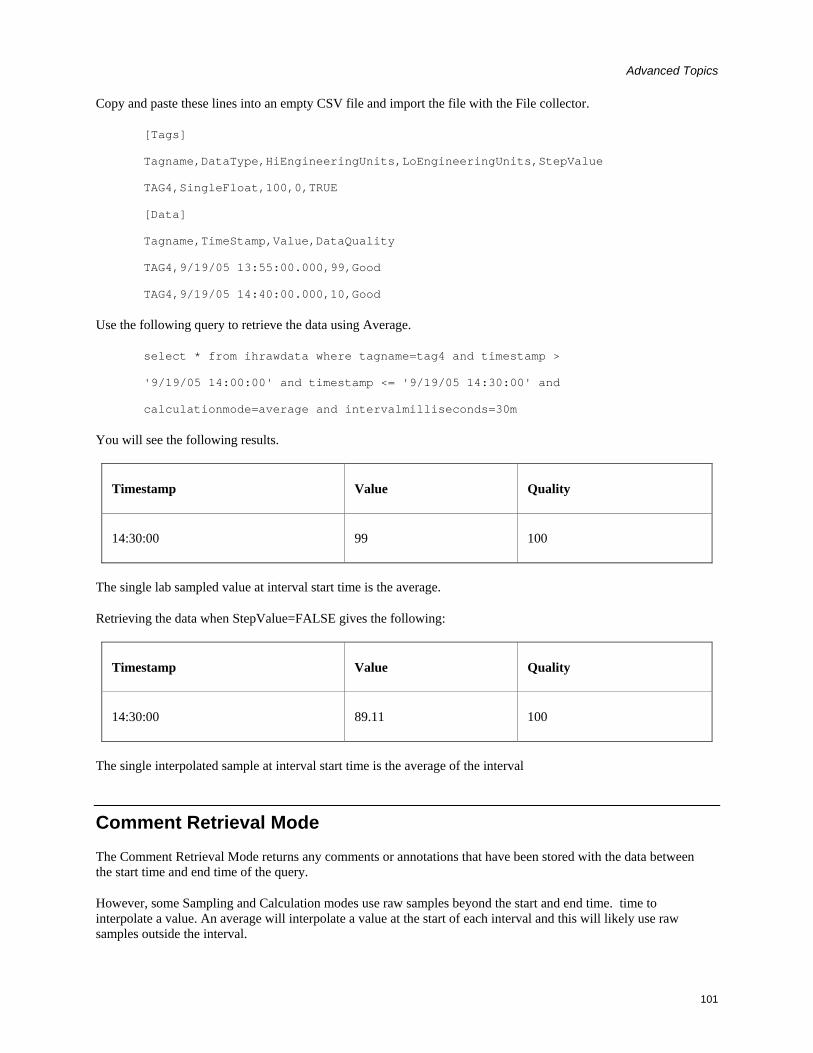
Advanced Topics
Copy and paste these lines into an empty CSV file and import the file with the File collector.
[Tags]
Tagname,DataType,HiEngineeringUnits,LoEngineeringUnits,StepValue
TAG4,SingleFloat,100,0,TRUE
[Data]
Tagname,TimeStamp,Value,DataQuality
TAG4,9/19/05 13:55:00.000,99,Good
TAG4,9/19/05 14:40:00.000,10,Good
Use the following query to retrieve the data using Average.
select * from ihrawdata where tagname=tag4 and timestamp >
'9/19/05 14:00:00' and timestamp <= '9/19/05 14:30:00' and
calculationmode=average and intervalmilliseconds=30m
You will see the following results.
Timestamp Value Quality
14:30:00 99 100
The single lab sampled value at interval start time is the average.
Retrieving the data when StepValue=FALSE gives the following:
Timestamp Value Quality
14:30:00 89.11 100
The single interpolated sample at interval start time is the average of the interval
Comment Retrieval Mode The Comment Retrieval Mode returns any comments or annotations that have been stored with the data between the start time and end time of the query.
However, some Sampling and Calculation modes use raw samples beyond the start and end time. time to interpolate a value. An average will interpolate a value at the start of each interval and this will likely use raw samples outside the interval.
101

Advanced Topics Guide
To retrieve the comments from raw values that were used beyond the interval, you can define a registry key on a computer running the Data Archiver.
Create a DWORD value under:
HKEY_LOCAL_MACHINE\Software\Intellution, Inc.\iHistorian\Services\DataArchiver
If you have the Data Archiver installed, the registry key should already exist and you are just adding a DWORD value.
Set CommentRetrievalMode to 1.
NOTES:
• You do not have to restart the Archiver for the changes to the registry to take place. The changes to registry setting take effect immediately.
• Raw data queries are not affected with this change.
• Any application can be used to query the data.
• The Comment Retrieval Mode may result in many comments being returned for a query. Therefore, it is not recommended for users who want to plot the data via the Proficy Real Time Information Portal (RTIP) Chart as it may cause slower performance.
Query Modifiers Query Modifiers are used for retrieving data that has been stored in the archive. They are used along with sampling and calculation modes to get a specific set of data. The following are the available Query Modifiers in Proficy Historian.
• ONLYGOOD
• INCLUDEREPLACED
• INCLUDEDELETED
• ONLYIFCONNECTED/ONLYIFUPTODATE
• ONLYRAW
• LABSAMPLING
• ENUMNATIVEVALUE
• INCLUDEBAD
• FILTERINCLUDEBAD
• USEMASTERFIELDTIME
ONLYGOOD
The ONLYGOOD modifier excludes bad and uncertain data quality values from retrieval and calculations. Use this modifier with any sampling or calculation mode but it is most useful with Raw and CurrentValue queries.
All the calculation modes such as minimum or average exclude bad values by default, so this modifier is not
102
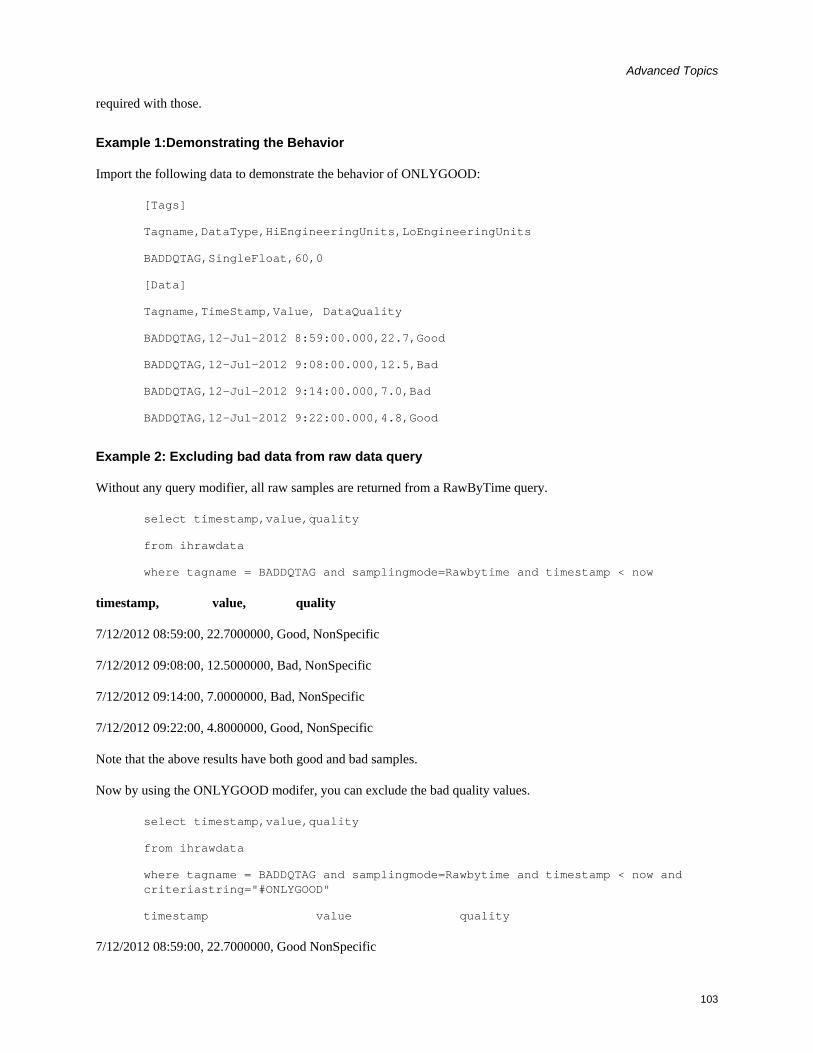
Advanced Topics
required with those.
Example 1:Demonstrating the Behavior
Import the following data to demonstrate the behavior of ONLYGOOD:
[Tags]
Tagname,DataType,HiEngineeringUnits,LoEngineeringUnits
BADDQTAG,SingleFloat,60,0
[Data]
Tagname,TimeStamp,Value, DataQuality
BADDQTAG,12-Jul-2012 8:59:00.000,22.7,Good
BADDQTAG,12-Jul-2012 9:08:00.000,12.5,Bad
BADDQTAG,12-Jul-2012 9:14:00.000,7.0,Bad
BADDQTAG,12-Jul-2012 9:22:00.000,4.8,Good
Example 2: Excluding bad data from raw data query
Without any query modifier, all raw samples are returned from a RawByTime query.
select timestamp,value,quality
from ihrawdata
where tagname = BADDQTAG and samplingmode=Rawbytime and timestamp < now
timestamp, value, quality
7/12/2012 08:59:00, 22.7000000, Good, NonSpecific
7/12/2012 09:08:00, 12.5000000, Bad, NonSpecific
7/12/2012 09:14:00, 7.0000000, Bad, NonSpecific
7/12/2012 09:22:00, 4.8000000, Good, NonSpecific
Note that the above results have both good and bad samples.
Now by using the ONLYGOOD modifer, you can exclude the bad quality values.
select timestamp,value,quality
from ihrawdata
where tagname = BADDQTAG and samplingmode=Rawbytime and timestamp < now and criteriastring="#ONLYGOOD"
timestamp value quality
7/12/2012 08:59:00, 22.7000000, Good NonSpecific
103
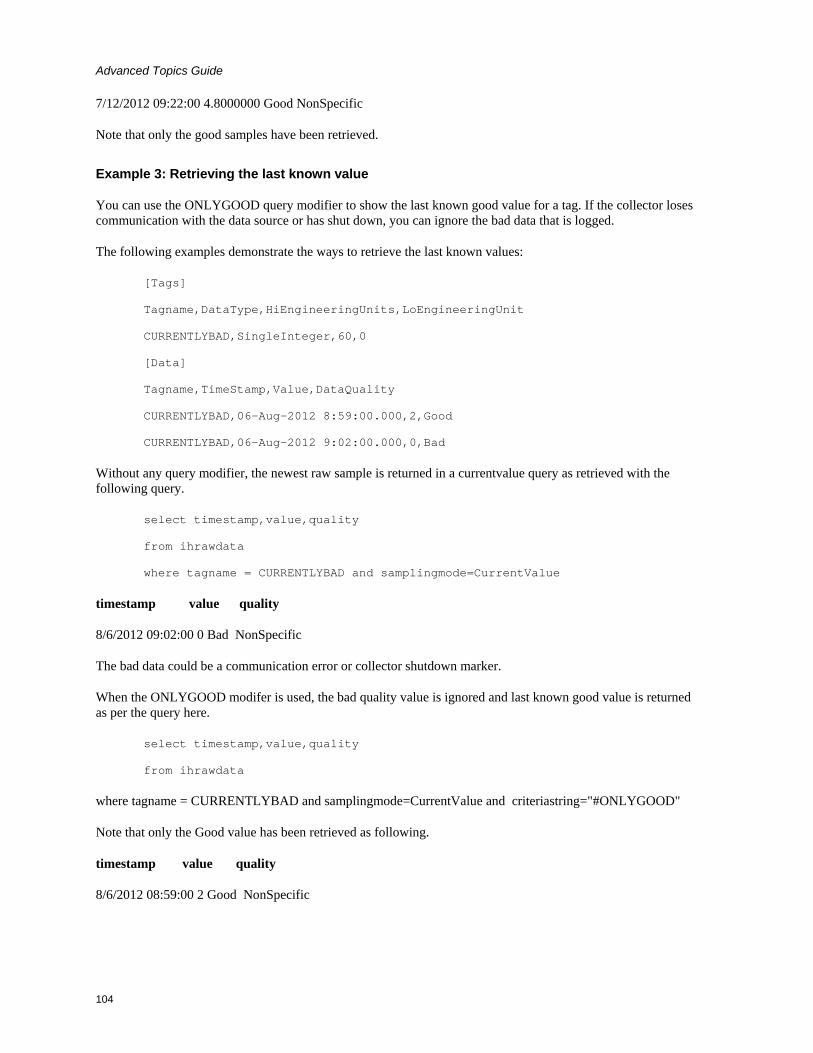
Advanced Topics Guide
7/12/2012 09:22:00 4.8000000 Good NonSpecific
Note that only the good samples have been retrieved.
Example 3: Retrieving the last known value
You can use the ONLYGOOD query modifier to show the last known good value for a tag. If the collector loses communication with the data source or has shut down, you can ignore the bad data that is logged.
The following examples demonstrate the ways to retrieve the last known values:
[Tags]
Tagname,DataType,HiEngineeringUnits,LoEngineeringUnit
CURRENTLYBAD,SingleInteger,60,0
[Data]
Tagname,TimeStamp,Value,DataQuality
CURRENTLYBAD,06-Aug-2012 8:59:00.000,2,Good
CURRENTLYBAD,06-Aug-2012 9:02:00.000,0,Bad
Without any query modifier, the newest raw sample is returned in a currentvalue query as retrieved with the following query.
select timestamp,value,quality
from ihrawdata
where tagname = CURRENTLYBAD and samplingmode=CurrentValue
timestamp value quality
8/6/2012 09:02:00 0 Bad NonSpecific
The bad data could be a communication error or collector shutdown marker.
When the ONLYGOOD modifer is used, the bad quality value is ignored and last known good value is returned as per the query here.
select timestamp,value,quality
from ihrawdata
where tagname = CURRENTLYBAD and samplingmode=CurrentValue and criteriastring="#ONLYGOOD"
Note that only the Good value has been retrieved as following.
timestamp value quality
8/6/2012 08:59:00 2 Good NonSpecific
104
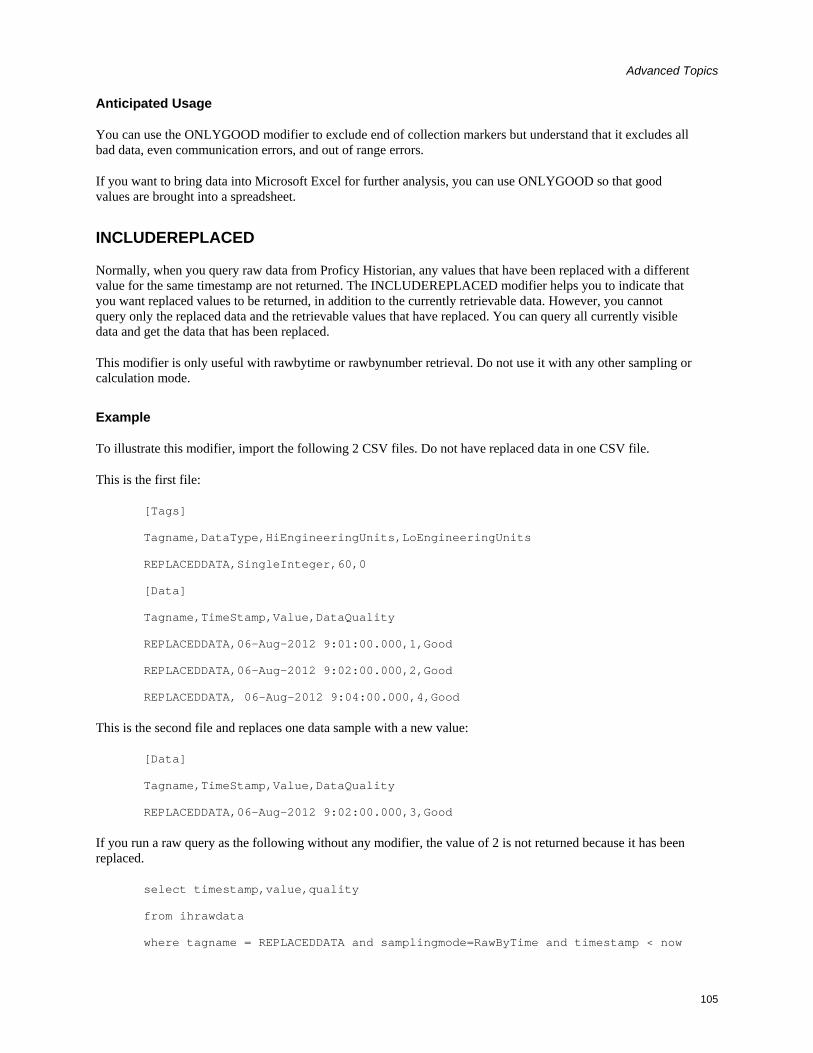
Advanced Topics
Anticipated Usage
You can use the ONLYGOOD modifier to exclude end of collection markers but understand that it excludes all bad data, even communication errors, and out of range errors.
If you want to bring data into Microsoft Excel for further analysis, you can use ONLYGOOD so that good values are brought into a spreadsheet.
INCLUDEREPLACED
Normally, when you query raw data from Proficy Historian, any values that have been replaced with a different value for the same timestamp are not returned. The INCLUDEREPLACED modifier helps you to indicate that you want replaced values to be returned, in addition to the currently retrievable data. However, you cannot query only the replaced data and the retrievable values that have replaced. You can query all currently visible data and get the data that has been replaced.
This modifier is only useful with rawbytime or rawbynumber retrieval. Do not use it with any other sampling or calculation mode.
Example
To illustrate this modifier, import the following 2 CSV files. Do not have replaced data in one CSV file.
This is the first file:
[Tags]
Tagname,DataType,HiEngineeringUnits,LoEngineeringUnits
REPLACEDDATA,SingleInteger,60,0
[Data]
Tagname,TimeStamp,Value,DataQuality
REPLACEDDATA,06-Aug-2012 9:01:00.000,1,Good
REPLACEDDATA,06-Aug-2012 9:02:00.000,2,Good
REPLACEDDATA, 06-Aug-2012 9:04:00.000,4,Good
This is the second file and replaces one data sample with a new value:
[Data]
Tagname,TimeStamp,Value,DataQuality
REPLACEDDATA,06-Aug-2012 9:02:00.000,3,Good
If you run a raw query as the following without any modifier, the value of 2 is not returned because it has been replaced.
select timestamp,value,quality
from ihrawdata
where tagname = REPLACEDDATA and samplingmode=RawByTime and timestamp < now
105

Advanced Topics Guide
timestamp value quality
8/6/2012 09:01:00 1 Good NonSpecific
8/6/2012 09:02:00 3 Good NonSpecific
8/6/2012 09:04:00 4 Good NonSpecific
Note that the value with 2 has not been returned.
To see the additional value of 2, run the query with INCLUDEREPLACED modifier as follows:
select timestamp,value,quality
from ihrawdata
where tagname = REPLACEDDATA and samplingmode=RawByTime and timestamp < now and criteriastring="#INCLUDEREPLACED"
timestamp value quality
8/6/2012 09:01:00 1 Good NonSpecific
8/6/2012 09:02:00 2 Good NonSpecific
8/6/2012 09:02:00 3 Good NonSpecific
8/6/2012 09:04:00 4 Good NonSpecific
Note that the value with 2 has been returned now.
Anticipated Usage
The INCLUDEREPLACED modifier can be used to detect and recover data that was overwritten by mistake. With a User API program, you can determine the samples that have been replaced and then build a CSV file and import with the File Collector.
INCLUDEDELETED
The INCLUDEDELETED modifier retrieves the value that was previously deleted. Data that has been deleted from the archiver is never actually removed but is marked as hidden. Use the INCLUDEDELETED modifier to retrieve the values that were deleted, in addition to any non-deleted values during the query time period.
This modifier is only useful with rawbytime or rawbynumber retrieval. Do not use it with any other sampling or calculation mode.
Example
Import this data to demonstrate the behavior of the INCLUDEDELETED query modifier.
[Tags]
Tagname,DataType,HiEngineeringUnits,LoEngineeringUnits
DELETEDDATA,SingleInteger,60,0
106
Advanced Topics
[Data]
Tagname,TimeStamp,Value,DataQuality
DELETEDDATA,06-Aug-2012 9:01:00.000,1,Good
DELETEDDATA,06-Aug-2012 9:02:00.000,2,Good
DELETEDDATA,06-Aug-2012 9:04:00.000,4,Good
Delete the raw sample at 9:02 and query the raw data without any modifier and you will get only the non-deleted values.
Run the following query:
select timestamp,value,quality
from ihrawdata
where tagname = DELETEDDATA and samplingmode=RawByTime and timestamp < now
timestamp value quality
8/6/2012 09:01:00 1 Good NonSpecific
8/6/2012 09:04:00 4 Good NonSpecific
Query with the INCLUDEDELETED modifier and you will get the deleted sample together with the non-deleted data.
select timestamp,value,quality
from ihrawdata
where tagname = DELETEDDATA and samplingmode=RawByTime and timestamp < now and criteriastring="#INCLUDEDELETED"
timestamp value quality
8/6/2012 09:01:00 1 Good NonSpecific
8/6/2012 09:02:00 2 Good NonSpecific
8/6/2012 09:04:00 4 Good NonSpecific
Anticipated Usage
The INCLUDE DELETED modifier can be used to detect and recover deleted data. Perform a query without the modifier and with the modifier and compare the results. You will detect the deleted samples. You can also determine the deleted samples with a User API program.
ONLYIFCONNECTED/ONLYIFUPTODATE
The ONLYIFCONNECTED and ONLYIFUPTODATE modifiers can be used on any sampling or calculation mode to retrieve bad data if the collector is not currently connected and sending data to the archiver. The bad data is not stored in the IHA file but is only returned in the query. If the collector reconnects and flushes data
107
Advanced Topics Guide
and you run the query again, the actual stored data is returned in the following situations:
• Collector loses connection to the Archiver
• Collector crashes
• Collector compression is used and no value exceeds the deadband
Any data query will return the last known value repeated till the current time with the quality of data as good. But the information could have changed in the real world and has yet to reach the archiver. Repeating the last known good value data can be misleading. Data should be returned as bad quality if no data is coming in from a collector.
The Data Archiver keeps track of the newest raw sample received for any tag for each collector. If no data is received for any tag, the collector is considered to be idle. If the collector is idle for more than 270 seconds, then either the data is heavily compressed or the collector is crashed or has lost connection. The collector idle time defaults to 270 seconds and this current setting appears in the dataarchiver.shw file. You can change the value using an SDK program. The setting applies to all collectors.
Use the ONLYIFUPTODATE modifier to return bad data from the time of the newest raw sample to the current time. However, if there is an unlikely chance that all tags are heavily compressed, then use the ONLYIFCONNECTED modifier. The difference in the behavior of the two modifiers is given in the following examples:
When you add an ONLYIFCONNECTED or ONLYIFUPTODATE modifier to the query, and the collector is disconnected from the archiver, bad values are returned from the time of the disconnect until the current time. Queries of data before the disconnect time are unaffected.
NOTES:
• The ONLYIFCONNECTED and ONLYIFUPTODATE modifiers are applicable to tags that are collected by data collectors.
• For raw by number, if the number of samples collected are greater or equal to the number of samples, bad data quality is not added.
• For raw by time, if the endtime is less than maximum data received time, bad data quality is not added.
• For raw by number backward, bad data quality is added at the beginning.
Example 1: Using ONLYIFCONNECTED to detect connection loss
To demonstrate the behavior of ONLYIFCONNECTED, you need to query data currently being collected.
Step 1: Configure the Simulation collector to collect any tag once per second with no compression. For example, collect the simulation RAMP tag.
Step2: Let the collector run for at least 5 minutes of collection.
Step 3: Disconnect the collector but leave it running. In this test, the collector was disconnected at 20:55:00.
Step 4: After about 5 minutes, query the data without ONLYIFCONNECTED and the last known value repeated with good quality to the current time, even though the collector is not connected.
set starttime='22-Aug-2012 20:53:00',endtime='now
108

Advanced Topics
select timestamp,value,quality
from ihrawdata
where tagname = RAMP and samplingmode=Interpolated and intervalmilliseconds=5s order by timestamp asc
timestamp value quality
8/22/2012 20:54:55 166.666666666667 100.0000000
8/22/2012 20:55:00 0.000000000000 100.0000000
8/22/2012 20:55:05 166.666666666667 100.0000000
8/22/2012 20:55:10 333.333333333333 100.0000000
8/22/2012 20:55:15 500.000000000000 100.0000000
8/22/2012 20:55:20 533.333333333333 100.0000000
8/22/2012 20:55:25 533.333333333333 100.0000000
8/22/2012 20:55:30 533.333333333333 100.0000000
8/22/2012 20:55:35 533.333333333333 100.0000000
Step 4: Run the query again with ONLYIFCONNECTED and the data is marked bad at the time of the collector disconnect
set starttime='22-Aug-2012 20:53:00',endtime='now
select timestamp,value,quality
from ihrawdata
where tagname = RAMP and samplingmode=Interpolated and intervalmilliseconds=5s and criteriastring=#onlyifconnected order by timestamp asc
timestamp value quality
8/22/2012 20:54:55 166.666666666667 100.0000000
8/22/2012 20:55:00 0.000000000000 100.0000000
8/22/2012 20:55:05 166.666666666667 100.0000000
8/22/2012 20:55:10 333.333333333333 100.0000000
8/22/2012 20:55:15 500.000000000000 100.0000000
8/22/2012 20:55:20 0.000000000000 0.0000000
8/22/2012 20:55:25 0.000000000000 0.0000000
8/22/2012 20:55:30 0.000000000000 0.0000000
109
Advanced Topics Guide
8/22/2012 20:55:35 0.000000000000 0.0000000
Step 5: Reconnect the collector and once the collector reconnects and flushes its buffered data run the query again with ONLYIFCONNECTED and the period of bad data is filled in with ramping values
timestamp value quality
8/22/2012 20:54:55 166.666666666667 100.0000000
8/22/2012 20:55:00 0.000000000000 100.0000000
8/22/2012 20:55:05 166.666666666667 100.0000000
8/22/2012 20:55:10 333.333333333333 100.0000000
8/22/2012 20:55:15 500.000000000000 100.0000000
8/22/2012 20:55:20 569.696969985962 100.0000000
8/22/2012 20:55:25 615.151515960693 100.0000000
8/22/2012 20:55:30 660.606061935425 100.0000000
8/22/2012 20:55:35 706.060606002808 100.0000000
Example 2: Querying Compressed Data
If all tags for a collector are compressed, then the newest raw sample across all tags can easily be older than 270 seconds even when the collector is connected to archiver. It is unlikely in a real system that a collector will send 0 raw samples for 270 seconds, but it is possible.
Step 1: Use the simulation collector and collect the constant tag as 1 second polled with a small deadband such as 1. In the example below, the newest raw sample is at 17:27:31 and the current time is 5 minutes or more.
Step 2: Query the data as interpolated with a 5 second interval and no modifier
set starttime='23-Aug-2012 17:00:30',endtime='now,rowcount=0
select timestamp,value,quality
from ihrawdata
where tagname = CONSTANT and samplingmode=Interpolated and intervalmilliseconds=5s
order by timestamp asc
timestamp value quality
8/23/2012 17:27:20 500.000000000000 100.0000000
8/23/2012 17:27:25 500.000000000000 100.0000000
8/23/2012 17:27:30 500.000000000000 100.0000000
8/23/2012 17:27:35 500.000000000000 100.0000000
110
Advanced Topics
8/23/2012 17:27:40 500.000000000000 100.0000000
The newest sample is repeated to the current time.
Step 3: Query with ONLYIFCONNECTED and you get the same results even when the newest raw sample is more than 270 seconds old. The data is old but the collector is currently connected.
set starttime='23-Aug-2012 17:00:30',endtime='now,rowcount=0
select timestamp,value,quality
from ihrawdata
where tagname = CONSTANT and samplingmode=Interpolated and intervalmilliseconds=5s and criteriastring=#onlyifconnected order by timestamp asc
timestamp value quality
8/23/2012 17:27:20 500.000000000000 100.0000000
8/23/2012 17:27:25 500.000000000000 100.0000000
8/23/2012 17:27:30 500.000000000000 100.0000000
8/23/2012 17:27:35 500.000000000000 100.0000000
8/23/2012 17:27:40 500.000000000000 100.0000000
Step 4: Query with ONLYIUPTODATE and the data is considered bad quality after the newest raw sample.
set starttime='23-Aug-2012 17:00:30',endtime='now,rowcount=0
select timestamp,value,quality
from ihrawdata
where tagname = CONSTANT and samplingmode=Interpolated and intervalmilliseconds=5s and criteriastring=#onlyifuptodate order by timestamp asc
timestamp value quality
8/23/2012 17:27:20 500.000000000000 100.0000000
8/23/2012 17:27:25 500.000000000000 100.0000000
8/23/2012 17:27:30 500.000000000000 100.0000000
8/23/2012 17:27:35 0.000000000000 0.0000000
8/23/2012 17:27:40 0.000000000000 0.0000000
If your collector can possibly have no data for any tag due to compression, use ONLYIFCONNECTED. Otherwise, if you want to detect data being old due to collector crash or disconnect, then use ONLYIFUPTODATE and optionally adjust the collector idle time.
111
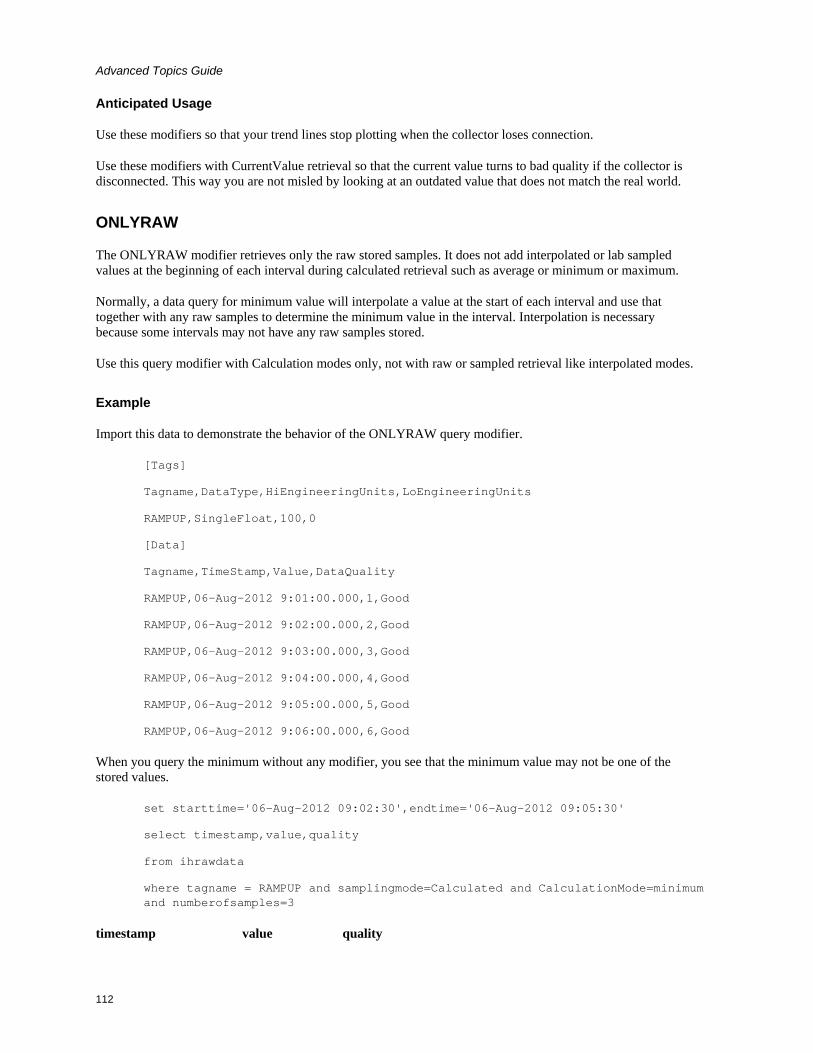
Advanced Topics Guide
Anticipated Usage
Use these modifiers so that your trend lines stop plotting when the collector loses connection.
Use these modifiers with CurrentValue retrieval so that the current value turns to bad quality if the collector is disconnected. This way you are not misled by looking at an outdated value that does not match the real world.
ONLYRAW
The ONLYRAW modifier retrieves only the raw stored samples. It does not add interpolated or lab sampled values at the beginning of each interval during calculated retrieval such as average or minimum or maximum.
Normally, a data query for minimum value will interpolate a value at the start of each interval and use that together with any raw samples to determine the minimum value in the interval. Interpolation is necessary because some intervals may not have any raw samples stored.
Use this query modifier with Calculation modes only, not with raw or sampled retrieval like interpolated modes.
Example
Import this data to demonstrate the behavior of the ONLYRAW query modifier.
[Tags]
Tagname,DataType,HiEngineeringUnits,LoEngineeringUnits
RAMPUP,SingleFloat,100,0
[Data]
Tagname,TimeStamp,Value,DataQuality
RAMPUP,06-Aug-2012 9:01:00.000,1,Good
RAMPUP,06-Aug-2012 9:02:00.000,2,Good
RAMPUP,06-Aug-2012 9:03:00.000,3,Good
RAMPUP,06-Aug-2012 9:04:00.000,4,Good
RAMPUP,06-Aug-2012 9:05:00.000,5,Good
RAMPUP,06-Aug-2012 9:06:00.000,6,Good
When you query the minimum without any modifier, you see that the minimum value may not be one of the stored values.
set starttime='06-Aug-2012 09:02:30',endtime='06-Aug-2012 09:05:30'
select timestamp,value,quality
from ihrawdata
where tagname = RAMPUP and samplingmode=Calculated and CalculationMode=minimum and numberofsamples=3
timestamp value quality
112
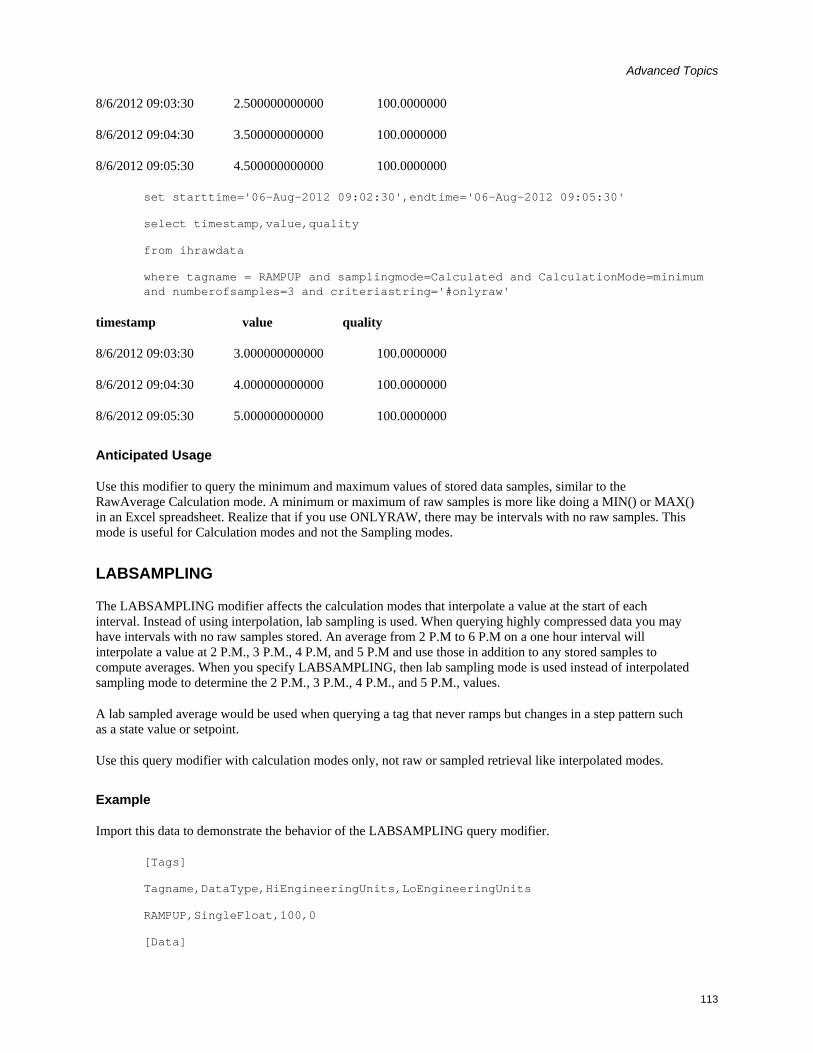
Advanced Topics
8/6/2012 09:03:30 2.500000000000 100.0000000
8/6/2012 09:04:30 3.500000000000 100.0000000
8/6/2012 09:05:30 4.500000000000 100.0000000
set starttime='06-Aug-2012 09:02:30',endtime='06-Aug-2012 09:05:30'
select timestamp,value,quality
from ihrawdata
where tagname = RAMPUP and samplingmode=Calculated and CalculationMode=minimum and numberofsamples=3 and criteriastring='#onlyraw'
timestamp value quality
8/6/2012 09:03:30 3.000000000000 100.0000000
8/6/2012 09:04:30 4.000000000000 100.0000000
8/6/2012 09:05:30 5.000000000000 100.0000000
Anticipated Usage
Use this modifier to query the minimum and maximum values of stored data samples, similar to the RawAverage Calculation mode. A minimum or maximum of raw samples is more like doing a MIN() or MAX() in an Excel spreadsheet. Realize that if you use ONLYRAW, there may be intervals with no raw samples. This mode is useful for Calculation modes and not the Sampling modes.
LABSAMPLING
The LABSAMPLING modifier affects the calculation modes that interpolate a value at the start of each interval. Instead of using interpolation, lab sampling is used. When querying highly compressed data you may have intervals with no raw samples stored. An average from 2 P.M to 6 P.M on a one hour interval will interpolate a value at 2 P.M., 3 P.M., 4 P.M, and 5 P.M and use those in addition to any stored samples to compute averages. When you specify LABSAMPLING, then lab sampling mode is used instead of interpolated sampling mode to determine the 2 P.M., 3 P.M., 4 P.M., and 5 P.M., values.
A lab sampled average would be used when querying a tag that never ramps but changes in a step pattern such as a state value or setpoint.
Use this query modifier with calculation modes only, not raw or sampled retrieval like interpolated modes.
Example
Import this data to demonstrate the behavior of the LABSAMPLING query modifier.
[Tags]
Tagname,DataType,HiEngineeringUnits,LoEngineeringUnits
RAMPUP,SingleFloat,100,0
[Data]
113

Advanced Topics Guide
Tagname,TimeStamp, Value,DataQuality
RAMPUP,06-Aug-2012 9:01:00.000,1,Good
RAMPUP,06-Aug-2012 9:02:00.000,2,Good
RAMPUP,06-Aug-2012 9:03:00.000,3,Good
RAMPUP,06-Aug-2012 9:04:00.000,4,Good
RAMPUP,06-Aug-2012 9:05:00.000,5,Good
RAMPUP,06-Aug-2012 9:06:00.000,6,Good
Run this query without a modifier to see the minimum values using the interpolated values:
set starttime='06-Aug-2012 09:02:30',endtime='06-Aug-2012 09:05:30'
select timestamp,value,quality
from ihrawdata
where tagname = RAMPUP and samplingmode=Calculated and CalculationMode=minimum and numberofsamples=3
timestamp value quality
8/6/2012 09:03:30 2.500000000000 100.0000000
8/6/2012 09:04:30 3.500000000000 100.0000000
8/6/2012 09:05:30 4.500000000000 100.0000000
The returned minimum values are not necessarily stored values. Now perform the same query but with the LABSAMPLING modifier.
set starttime='06-Aug-2012 09:02:30',endtime='06-Aug-2012 09:05:30'
select timestamp,value,quality
from ihrawdata
where tagname = RAMPUP and samplingmode=Calculated and CalculationMode=minimum and numberofsamples=3 and criteriastring='#labsampling'
timestamp value quality
8/6/2012 09:03:30 2.000000000000 100.0000000
8/6/2012 09:04:30 3.000000000000 100.0000000
8/6/2012 09:05:30 4.000000000000 100.0000000
The returned minimum values are stored values but sampled forward to each interval timestamp. This is the behavior of lab sampling and is applied here to calculated values.
114

Advanced Topics
Anticipated Usage
Use this modifier to query the minimum, maximum, and average values of tags that change in a step fashion and never ramp. For example, you may want to retrieve the minimum of a setpoint. This tag would change from one value directly to another without ramping. And the value may not change in a long period. A minimum should not return a value that ramps over a long period of time from one setpoint value to the next. This mode is useful for Calculation modes and not the Sampling modes.
ENUMNATIVEVALUE
The ENUMNATIVEVALUE modifier retrieves the native, numeric values such as 1 or 2 instead of string values such as on/off for the data that has enumerated states associated with it.
You can use ENUMNATIVEVALUE with any sampling or calculation mode.
Example
Import this data to demonstrate the use of ENUMNATIVEVALUE:
[Tags]
Tagname,DataType,HiEngineeringUnits,LoEngineeringUnits
STATETAG,SingleInteger,60,0
[Data]
Tagname,TimeStamp,Value,DataQuality
STATETAG,06-Aug-2012 9:08:00.000,4,Good
STATETAG,06-Aug-2012 9:14:00.000,4,Good
STATETAG,06-Aug-2012 9:22:00.000,2,Good
Assume the tag has an enumerated set associated where 2=Stopped and 4=Running. When you do the interpolated query you get the string value:
set starttime='06-Aug-2012 09:10:00',endtime='06-Aug-2012 09:30:00'
select timestamp,value,quality
from ihrawdata
where tagname = STATETAG and samplingmode=Interpolated and numberofsamples=6
timestamp value quality
8/6/2012 09:13:20 running 100.0000000
8/6/2012 09:16:40 running 100.0000000
8/6/2012 09:20:00 running 100.0000000
8/6/2012 09:23:20 stopped 100.0000000
8/6/2012 09:26:40 stopped 100.0000000
115

Advanced Topics Guide
8/6/2012 09:30:00 stopped 100.0000000
Using the ENUMNATIVEVALUE query modifier, you can get the numeric value suitable for plotting:
set starttime='06-Aug-2012 09:10:00',endtime='06-Aug-2012 09:30:00'
select timestamp,value,quality
from ihrawdata
where tagname = STATETAG and samplingmode=Interpolated and numberofsamples=6 and criteriastring='#enumnativevalue'
timestamp value quality
8/6/2012 09:13:20 4 100.0000000
8/6/2012 09:16:40 4 100.0000000
8/6/2012 09:20:00 4 100.0000000
8/6/2012 09:23:20 2 100.0000000
8/6/2012 09:26:40 2 100.0000000
8/6/2012 09:30:00 2 100.0000000
NOTE: For bad data, the values are returned as string values based on the Enumerated State table though the enumnativevalue is set to false.
Anticipated Usage
Use this to plot tags that use enumerated values. You can put the string value in a datalink and put the native value in a chart.
INCLUDEBAD
The INCLUDEBAD modifier directs the Data Archiver to consider raw samples of bad data quality when computing calculation modes. Use INCLUDEBAD modifier to consider both good and bad quality values.
You can use INCLUDEBAD with any Sampling or Calculation mode only if you want to include bad quality data. Use this modifier only if you believe the bad quality data has meaningful values and are useful as input to calculations. Most bad data quality values do not have meaningful values; they show 0 or unpredictable numbers. But in some cases, if the data is being written using a user program instead of a collector, you can use this query modifier.
Bad data always has a sub quality such as Comm Error or Configuration Error. When you use INCLUDEBAD any end of collection raw samples or calculation error raw samples are still ignored because they are not process data, just data markers that are inserted by collectors.
Example
Import this data to demonstrate the behavior of the INCLUDEBAD query modifier:
116
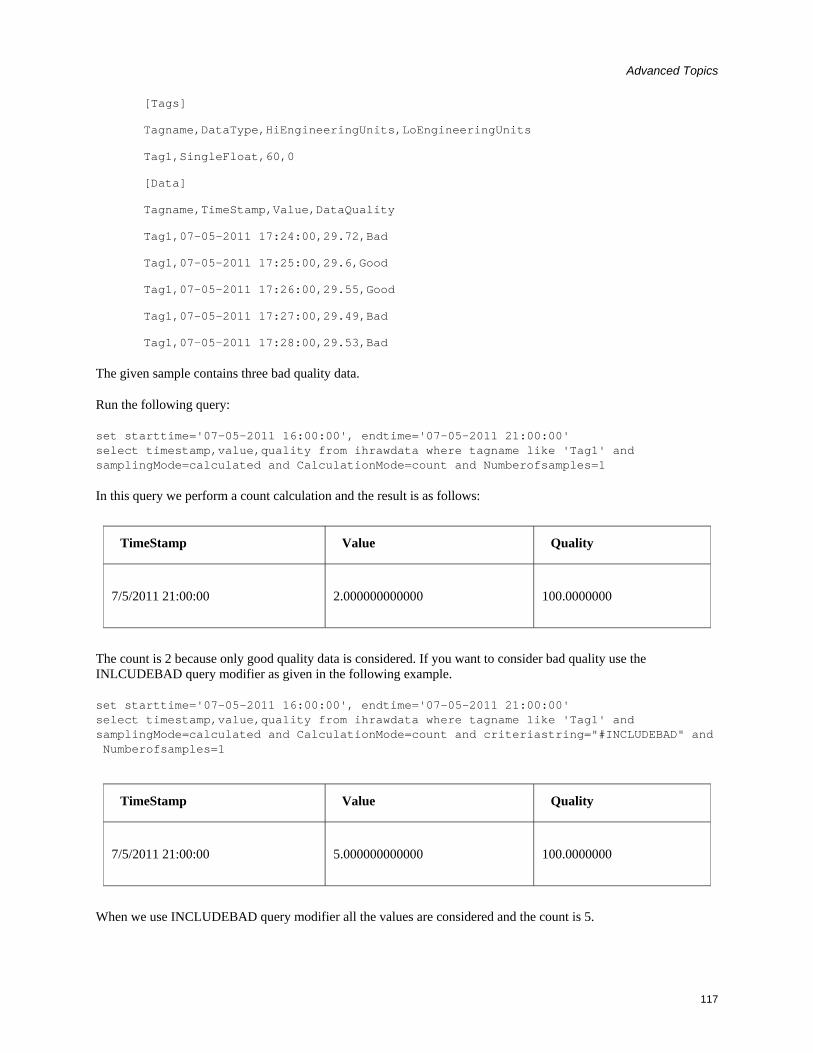
Advanced Topics
[Tags]
Tagname,DataType,HiEngineeringUnits,LoEngineeringUnits
Tag1,SingleFloat,60,0
[Data]
Tagname,TimeStamp,Value,DataQuality
Tag1,07-05-2011 17:24:00,29.72,Bad
Tag1,07-05-2011 17:25:00,29.6,Good
Tag1,07-05-2011 17:26:00,29.55,Good
Tag1,07-05-2011 17:27:00,29.49,Bad
Tag1,07-05-2011 17:28:00,29.53,Bad
The given sample contains three bad quality data.
Run the following query:
set starttime='07-05-2011 16:00:00', endtime='07-05-2011 21:00:00' select timestamp,value,quality from ihrawdata where tagname like 'Tag1' and samplingMode=calculated and CalculationMode=count and Numberofsamples=1
In this query we perform a count calculation and the result is as follows:
TimeStamp Value Quality
7/5/2011 21:00:00 2.000000000000 100.0000000
The count is 2 because only good quality data is considered. If you want to consider bad quality use the INLCUDEBAD query modifier as given in the following example.
set starttime='07-05-2011 16:00:00', endtime='07-05-2011 21:00:00' select timestamp,value,quality from ihrawdata where tagname like 'Tag1' and samplingMode=calculated and CalculationMode=count and criteriastring="#INCLUDEBAD" and Numberofsamples=1
TimeStamp Value Quality
7/5/2011 21:00:00 5.000000000000 100.0000000
When we use INCLUDEBAD query modifier all the values are considered and the count is 5.
117
Advanced Topics Guide
Anticipated Usage
The INCLUDEBAD modifier can be used to force the Data Archiver to consider every raw sample collected from a field device while still excluding Proficy Historian collection markers or calculation errors and timeouts. It is usually used if you are writing data with a custom program and not a collector and your program stores meaningful values with bad quality.
FILTERINCLUDEBAD
The FILTERINCLUDEBAD modifier directs the Data Archiver to consider the values of bad quality data when determining the time ranges that match the filter condition. This modifier is similar to the INCLUDEBAD but that modifier applies to the data tag and this modifier applies to the FilterTag. You can use this modifier if you are also using INCLUDEBAD because your application data of bad quality has meaningful values then you can also consider this modifier but, you do not need to use both modifiers at the same time.
Example: Filtered Data Query containing Bad Quality Filter Values
Import this data to demonstrate the behavior of the FILTERINCLUDEBAD query modifier:
[Tags]
Tagname,DataType,HiEngineeringUnits,LoEngineeringUnits
ExcelTag1,SingleFloat,60,0
[Data]
Tagname,TimeStamp,Value,DataQuality
ExcelTag1,07-05-2011 17:24:00,29.72,Bad
ExcelTag1,07-05-2011 17:25:00,29.6,Good
ExcelTag1,07-05-2011 17:26:00,29.55,Good
ExcelTag1,07-05-2011 17:27:00,29.49,Bad
ExcelTag1,07-05-2011 17:28:00,29.53,Bad
The given sample contains three bad quality data samples.
Run the following query:
set starttime='07-05-2011 16:00:00', endtime='07-05-2011 21:00:00' select timestamp,value,quality from ihrawdata where tagname=ExcelTag1 and samplingMode=Calculated and calculationmode=rawtotal and FilterExpression ='ExcelTag1>29.5' and numberofsamples=1
In this query, we use a filtered expression where the filter condition is ExcelTag1>29.5, and the result is as follows because it adds the two good values to compute the RawTotal:
118

Advanced Topics
TimeStamp Value Quality
7/5/2011 21:00:00 59.149999618530 100.0000000
Bad quality data is not considered while filtering. If you want to consider bad quality data then use FILTERINLCUDEBAD query modifier together with the INCLUDEBAD query modifier as in the following query:
set starttime='07-05-2011 16:00:00', endtime='07-05-2011 21:00:00' select timestamp,value,quality from ihrawdata where tagname=ExcelTag1 and samplingMode=Calculated and calculationmode=rawtotal and FilterExpression ='ExcelTag1>29.5' and numberofsamples=1 and CriteriaString='#FilterIncludeBad#IncludeBad'
• The result is as follows:
TimeStamp Value Quality
7/5/2011 21:00:00 118.399999618530 100.0000000
The value is 118 because all the values that are greater than 29.5 are added together, not just the good quality values.
Anticipated Usage
The FILTERINCLUDEBAD modifier can be used to force the Data Archiver to consider every raw sample collected from a field device when determining the time ranges while still excluding Proficy Historian injected end of collection markers or calculation errors and timeouts.
USEMASTERFIELDTIME
The USEMASTERFIELDTIME query modifier is used only for the MultiField tags. It returns the value of all the fields at the same timestamp of the master field time, in each interval returned.
The following are the points to remember while using this query modifier:
1. In your user defined data type, you have to indicate which field is the master field. You can define a master field when you define the type.
2. When you use this query modifier, the query returns raw values of all the field elements at the timestamp determined by the MasterField.
3. When you use this query modifier in Excel Add-in, the percentage good value displayed will be incorrect. It is recommended to use this query modifier using APIs.
4. Only few calculation modes are supported by USEMASTERFIELDTIME query modifier.
119
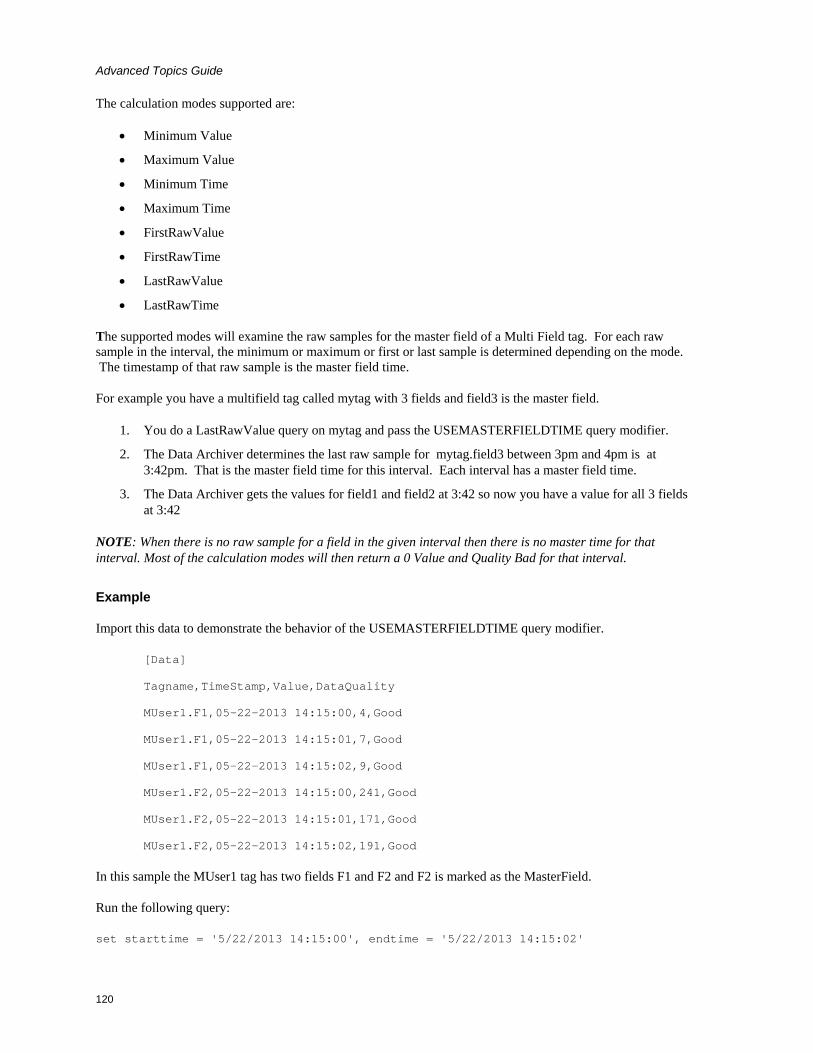
Advanced Topics Guide
The calculation modes supported are:
• Minimum Value
• Maximum Value
• Minimum Time
• Maximum Time
• FirstRawValue
• FirstRawTime
• LastRawValue
• LastRawTime
The supported modes will examine the raw samples for the master field of a Multi Field tag. For each raw sample in the interval, the minimum or maximum or first or last sample is determined depending on the mode. The timestamp of that raw sample is the master field time.
For example you have a multifield tag called mytag with 3 fields and field3 is the master field.
1. You do a LastRawValue query on mytag and pass the USEMASTERFIELDTIME query modifier.
2. The Data Archiver determines the last raw sample for mytag.field3 between 3pm and 4pm is at 3:42pm. That is the master field time for this interval. Each interval has a master field time.
3. The Data Archiver gets the values for field1 and field2 at 3:42 so now you have a value for all 3 fields at 3:42
NOTE: When there is no raw sample for a field in the given interval then there is no master time for that interval. Most of the calculation modes will then return a 0 Value and Quality Bad for that interval.
Example
Import this data to demonstrate the behavior of the USEMASTERFIELDTIME query modifier.
[Data]
Tagname,TimeStamp,Value,DataQuality
MUser1.F1,05-22-2013 14:15:00,4,Good
MUser1.F1,05-22-2013 14:15:01,7,Good
MUser1.F1,05-22-2013 14:15:02,9,Good
MUser1.F2,05-22-2013 14:15:00,241,Good
MUser1.F2,05-22-2013 14:15:01,171,Good
MUser1.F2,05-22-2013 14:15:02,191,Good
In this sample the MUser1 tag has two fields F1 and F2 and F2 is marked as the MasterField.
Run the following query:
set starttime = '5/22/2013 14:15:00', endtime = '5/22/2013 14:15:02'
120

Advanced Topics
121
select tagname, timestamp, value, quality from ihrawdata where tagname = 'MUser1' and samplingmode = calculated and calculationmode = minimum and criteriastring = '#USEMASTERFIELDTIME' and numberofsamples = 1
The output is as follows:
TagName TimeStamp Value Quality
MUser1.F1 05-22-2013 14:15:02
7 0.0000000
MUser1.F2 05-22-2013 14:15:02
171.000000000000 100.0000000
Here the minimum value for the Master Field tag F2 is 171 at 14:15:01 timestamp. That is the master time. Then the master time is used to get the value of F1 at the same timestamp which is 7 and this is returned even as the minimum value of F1 is 4.
In a multi field tag it is possible that some fields may be NULL at a given timestamp. In this case if F1 was a NULL value at 14:15:01 you would get a value of null and bad quality.