
PRODUCTIVITY, WORKPLACE PERFORMANCE AND ICT: INDUSTRY AND FIRM-LEVEL EVIDENCE FOR EUROPE AND THE US
28
PRODUCTIVITY, WORKPLACE PERFORMANCE AND ICT: INDUSTRY AND FIRM-LEVEL EVIDENCE FOR EUROPE AND THE US Nicola Matteucci n , Mary O’Mahony nn , Catherine Robinson nn and Thomas Zwick nnn Abstract This paper considers the contribution of information and communications technology (ICT), to international productivity performance. It first uses an international industry data set and a growth accounting framework, to show that ICT has typically had a lower impact on productivity in Europe than in the US, although there is considerable variation within Europe. The paper also analyses the European situation in greater depth by examining micro-economic data from Germany, Italy and the UK. While direct comparisons between the national findings are difficult, the results suggest that the UK experience with ICT has been closer to the US than other European countries. I Introduction An important indicator of workplace performance is productivity defined as the amount of output produced for inputs used. International comparisons of productivity offer an important point of reference for our economic and political performance, compared with our major trading partners and competitors. Such comparisons also offer insight into where different nationalities’ strengths lie, and in particular, highlight best-practice methods of combining inputs and incorporating new technologies and practices. International comparisons set the scene for more detailed analyses of the underlying causes of productivity differences. The purpose of this paper is to analyse the use of information and communications technology (ICT) as a driver of productivity differences between the US and Europe. In so doing, this paper highlights the complementary nature of industry and firm-level analyses in identifying the reasons for cross-country differences in workplace performance. n Universita` Politecnica delle Marche, Ancona, Italy nn National Institute of Economic and Social Research, London, UK nnn Centre for European Economic Research (ZEW), Mannheim, Germany kdlkdlkdooeopeoi Scottish Journal of Political Economy, Vol. 52, No. 3, July 2005 r Scottish Economic Society 2005, Published by Blackwell Publishing, 9600 Garsington Road, Oxford OX4 2DQ, UK and 350 Main Street, Malden, MA 02148, USA 359
-
Upload
independent -
Category
Documents
-
view
4 -
download
0
Transcript of PRODUCTIVITY, WORKPLACE PERFORMANCE AND ICT: INDUSTRY AND FIRM-LEVEL EVIDENCE FOR EUROPE AND THE US
PRODUCT I V I TY , WORKPLACEP ERFORMANCE AND I C T : I NDU S TRY
AND F I RM - L EVEL EV IDENCE FOREUROPE AND THE U S
Nicola Matteuccin, Mary O’Mahonynn, Catherine Robinsonnn and
Thomas Zwicknnn
Abstract
This paper considers the contribution of information and communications
technology (ICT), to international productivity performance. It first uses an
international industry data set and a growth accounting framework, to show that
ICT has typically had a lower impact on productivity in Europe than in the US,
although there is considerable variation within Europe. The paper also analyses the
European situation in greater depth by examining micro-economic data from
Germany, Italy and the UK. While direct comparisons between the national
findings are difficult, the results suggest that the UK experience with ICT has been
closer to the US than other European countries.
I Introduction
An important indicator of workplace performance is productivity defined as the
amount of output produced for inputs used. International comparisons of
productivity offer an important point of reference for our economic and political
performance, compared with our major trading partners and competitors. Such
comparisons also offer insight into where different nationalities’ strengths lie,
and in particular, highlight best-practice methods of combining inputs and
incorporating new technologies and practices. International comparisons set the
scene for more detailed analyses of the underlying causes of productivity
differences. The purpose of this paper is to analyse the use of information and
communications technology (ICT) as a driver of productivity differences
between the US and Europe. In so doing, this paper highlights the
complementary nature of industry and firm-level analyses in identifying the
reasons for cross-country differences in workplace performance.
nUniversita Politecnica delle Marche, Ancona, ItalynnNational Institute of Economic and Social Research, London, UKnnnCentre for European Economic Research (ZEW), Mannheim, Germany
kdlkdlkdooeopeoi
Scottish Journal of Political Economy, Vol. 52, No. 3, July 2005r Scottish Economic Society 2005, Published by Blackwell Publishing, 9600 Garsington Road, Oxford OX4 2DQ, UKand 350 Main Street, Malden, MA 02148, USA
359
ICT is considered to have both a direct and an indirect impact on productivity.
The direct impact may be measured by ICT capital investment over time, a capital
deepening effect; however, indirect impacts are the more subtle changes that result
as ICT capital changes the nature of production processes (Atrostic and Nguyen,
2004). These processes are generally described as workplace organisational
changes (Black and Lynch, 2001). In addition, these might also include external
benefits or spillovers from investing in ICT (Rincon and Vecchi, 2004).
Empirically, at both the industry level and the firm level, considerable evidence
now exists to suggest a strong positive impact of ICT on workplace productivity
in the US, with increasing evidence also emerging for other countries (OECD,
2004). This paper briefly reviews this evidence and then presents some new results.
Using the recently constructed industry-level international data set under-
lying O’Mahony and Van Ark (2003), this paper first compares labour and total
factor productivity (TFP) across countries, and examines the extent to which
these trends are associated with investment in ICT capital. This section of the
paper relies on the use of growth accounting methods.
Micro-studies, with their emphasis on econometric techniques, have
traditionally found a bigger impact of ICT than industry-level studies
(Brynjolfsson and Hitt, 1996; Lehr and Lichtenberg, 1999; Brynjolfsson and
Hitt, 2000). Some new research findings using micro-data for UK, Germany and
Italy are presented in the second part of the paper. Taken together these results
suggest that ICT is an important driver of productivity change.
The following section of the paper begins with an overview of the growth
accounting method. It then combines this with the international industry data
set to highlight some of the major trends and differences among European
countries in comparison with the US. The section concentrates on the extent of
ICT investment and is suggestive that this is an important influence on recent
divergences in productivity growth among these countries. Section III goes on to
elaborate on the nature of these relationships, analysed at the micro-level in a
handful of European countries, referring both to existing literature and
presenting new results that attempt to explain the precise nature of the impact
of new technology at the firm level. Section IV draws together both the macro-
and the micro-economic evidence and highlights the importance of micro-
economic analyses in explaining aggregate trends.
II Research Methods and Data
Growth accounting methods
The growth accounting approach to TFP estimation has been extensively
employed to estimate the impact of ICT capital deepening on output and
productivity growth (see e.g. Jorgenson and Stiroh, 2000; Oliner and Sichel,
2000; for the US, Oulton, 2002; for the UK). It is useful in that it allows for the
decomposition of output or labour productivity growth into contributions from
factor inputs and underlying productivity growth or TFP. This method is
employed in the industry analysis in section III.
N. MATTEUCCI, M. O’MAHONY, C. ROBINSON AND T. ZWICK360
r Scottish Economic Society 2005

Assume the production function of an industry in country ( j) may be
written as
Qjt ¼ Aj
t fjðLj
t;Kjt Þ; ð1Þ
where Q is real output (here measured as real value added (VA)), K and L are
capital and labour inputs, respectively, and A is an index of technical progress or
TFP. Under assumptions of perfectly functioning markets and constant returns
to scale, differentiating (1) with respect to time, yields an index of TFP growth
known as the Divisia index. This index is a valid measure of TFP growth in
continuous time, regardless of the functional form of the production function. In
practice, as changes are not observed continuously, an approximation is
required. Assuming a Translog production function, the Tornqvist index is the
appropriate approximation of the Divisia index (Jorgenson et al., 1987), and
output growth may then be decomposed into its various components in the
following way:
lnQ
jt
Qjt�1
!¼ ajðt; t� 1Þ ln L
jt
Ljt�1
!þ ð1� ajðt; t� 1ÞÞ ln K
jt
Kjt�1
!
þ lnA
jt
Ajt�1
!; ð2Þ
where a(t, t� 1) is the share of labour in VA averaged over the two time periods.
Incorporating quality adjustments to inputs stems originally from Jorgenson
and Griliches (1967). In studies relating to the impact of ICT on productivity,
this has involved quality adjustment of capital, accounting for substitution
between new technology and traditional capital. This approach is also adopted
here but in addition this analysis includes a labour quality adjustment, which is a
refinement to many of the earlier studies on the impact of ICT.
To incorporate quality adjustments to inputs, the growth in aggregate labour
and aggregate capital can be estimated as Tornqvist indexes of their
components. Suppose there are l types of labour and k types of capital. Then
these indexes are given by
lnLjt
Ljt�1
!¼Xl
a jl ðt; t� 1Þ ln
Ljl;t
Ljl;t�1
!; ð3aÞ
lnK
jt
Kjt�1
!¼Xk
akjðt; t� 1Þ lnK
jk;t
Kjk;t�1
!; ð3bÞ
where a jl ðt; t� 1Þ is the share of type l labour in the total wage bill and a j
k
ðt; t� 1Þ is the share of type k capital in the value of capital. Thus if the
employment of (highly paid) skilled labour is growing faster than unskilled
types, weighting by wage bill shares leads to faster growth in labour input than a
simple count of hours worked.
PRODUCTIVITY, WORKPLACE PERFORMANCE AND ICT 361
r Scottish Economic Society 2005
Econometric Analysis
In the sections reporting results based on firm-level data, regression analysis is
employed to estimate augmented production functions. All three studies use a
standard Cobb–Douglas framework, where output is related to a time-variant
index of technical progress (Hicks neutral, common to all firms) and to j
productive inputs (Xj) and variables that measure the use of ICT (I ) plus other
control variables. In its general form this relation can be log-linearised, in a form
amenable to direct estimation:
ln Yit ¼ ln Aþ Sjaj ln Xijt þ Sjbj ln Iijt þ Sjgj ln Zijt þ Zit: ð4Þ
The variables included and details of the econometric methods employed are
discussed in each subsection.
Data
The industry analysis employs the data set underlying O’Mahony and Van Ark
(2003). Output is real gross VA and the volume of labour input is measured by
hours worked. The growth accounting analysis was carried out for 26 individual
industries in the US, France, Germany and the UK. Capital is measured as
consisting of six asset types of which three are ICT, defined as computing
equipment, software and communications equipment. In the estimates below,
contributions of ICT and non-ICT capital are shown separately, thus delineating
the main capital quality components. Oliner and Sichel (2000) highlight the fact
that in the growth accounting framework, the productive stock is the variable of
interest (i.e. how much assets produce each period) and not the wealth stock
(their market value). To take account of this, user costs rather than acquisition
prices are employed in constructing weights for each type of asset. In addition
the special nature of ICT capital stock requires adjustment to the standard
approach to deflation. Deflators based on the US hedonic price index, adjusted
for international price or exchange rate movements, have been employed in
many international or individual country studies of the impact of ICT capital on
growth, (e.g. Colecchia and Schreyer, 2002; Oulton, 2002; Van Ark et al., 2002
to name but a few). This is primarily because a viable alternative is generally not
available outside the US, given time series requirements for the analysis
considered here. This is also the approach adopted in this analysis.
Investment series at constant prices are converted into estimates of
productive capital stocks using the perpetual inventory method with geometric
depreciation rates. US depreciation rates are employed for all four countries but
these are allowed to vary by asset type and hence by industry.1 In addition to
incorporating a quality adjustment for capital, the data set also includes quality
adjustments for labour force skills. This is achieved by disaggregating hours
1Further details on capital services estimation are provided in O’Mahony and Van Ark(2003) and its practical application in the data set employed in this paper is extensivelyconsidered in Inklaar et al. (2003). In addition, output series for the ICT producing sectoremploy deflators based on the US hedonic price indexes for these industries.
N. MATTEUCCI, M. O’MAHONY, C. ROBINSON AND T. ZWICK362
r Scottish Economic Society 2005
worked by skill type and weighting each by its share in the total wage bill, as in
equation (3a). The skill divisions are allowed to vary across country. The
difference between the growth in this index and one which simply adds together
hours is the labour quality index shown in the tables.
The data employed in each of the micro-economic studies reported below
vary by country and so are described in each subsection. In general, although
they consist of surveys of firms or establishments that contain data on the use of
information technology.
III Inter-Country Comparisons of Industry Performance
Labour productivity levels
This section considers the industry evidence on comparative productivity
performance since 1979 using the data set underlying O’Mahony and Van Ark
(2003). It compares productivity growth rates in four countries during this time
period, the US, the UK, France and Germany, focusing on the industry
distribution of productivity growth differences between the US, on the one
hand, and the three EU countries on the other. The analysis considers the extent
to which investment in ICT is associated with these cross industry differences,
and is confined to market sectors, as non-market services (health, education and
public administration) are not accurately measured in the underlying national
accounts data.
Before considering growth rates it is useful to place these in the context of
relative productivity levels. Table 1 shows output per hour worked relative to
levels in the US in the three EU countries in the market economy and a broad
three way division of this total into agriculture, production industries and
market services. Over the two decades covered here, the European countries
have narrowed their labour productivity gap with the US in the market
economy, continuing the process of postwar convergence. However, the mid-
1990s represented a break in this process with the US moving further ahead, and
significantly so relative to France and Germany. The broad industry breakdown
in Table 1 shows that this break was largely driven by trends in market services.
Note that the numbers for the aggregate economy reflect not only the US going
ahead in market services but also the increasing share of economic activity
represented by that sector in all four countries.
An extensive literature has developed in recent years linking this change in
the relative fortunes of the US to that country’s earlier adoption of ICT. Thus,
Jorgenson and Stiroh (2000) and Oliner and Sichel (2000, 2002) have shown a
significant and growing impact of ICT capital deepening on labour productivity
growth in the US. Recently evidence has suggested that there may also be a
payoff from investment in ICT equipment on TFP growth (Stiroh, 2002;
O’Mahony and Vecchi, 2005). In much of the US literature the importance of
service sectors in driving these changes has been identified (see e.g. Triplett and
Bosworth, 2003).
O’Mahony and Van Ark (2003) and Inklaar et al. (2003) have extensively
analysed the importance of increased investment in ICT comparing aggregates
PRODUCTIVITY, WORKPLACE PERFORMANCE AND ICT 363
r Scottish Economic Society 2005

across European Union member states with the US. This section focuses on the
three European countries mentioned above and on the varying experiences in
manufacturing and market service sectors.
Growth accounting results
Growth accounting estimates of input growth and TFP were calculated for 25
market sectors annually for the period 1979–2000.2 Table 2 summarises the main
findings from the growth accounting approach for the market economy,
employing labour productivity decompositions derived by dividing both sides of
equation (2) by hours worked. The sample is split into two time periods, from
1979 to 1995 and thereafter. The year 1995 is generally considered the break
point in trend US labour productivity growth (see the discussion in Inklaar and
McGuckin, 2003).
The first striking feature of Table 2 is the pronounced acceleration in US
labour productivity growth in the second period relative to the first. In contrast
rates in the UK and Germany were largely unchanged while France shows a
decline. In the US, the decomposition of the sources of growth show that the
Table 1
Comparative labour productivity levels by sector: output per hour worked (US5 100)
1979 1990 1995 2001
United Kingdom
Market economya 62 67 75 73
Agriculture 95 63 73 53
Industryb 56 66 75 77
Market servicesc 64 67 73 72
France
Market economy 84 99 99 91
Agriculture 44 39 52 42
Industry 85 89 91 93
Market services 98 118 112 95
Germany
Market economy 85 91 93 89
Agriculture 27 24 29 25
Industry 86 83 79 80
Market services 88 97 104 94
Notes:aTotal economy excluding, health, education, public administration and real estate.bMining, manufacturing, utilities and construction.cTransport, communications, distribution, hotels and catering, financial and business services and personalservices.Source:Updates of estimates in O’Mahony and DeBoer (2002).
2 Tables by detailed industry and country are printed in O’Mahony and Van Ark (2003); theunderlying data are downloadable from www.niesr.ac.uk/epke/
N. MATTEUCCI, M. O’MAHONY, C. ROBINSON AND T. ZWICK364
r Scottish Economic Society 2005
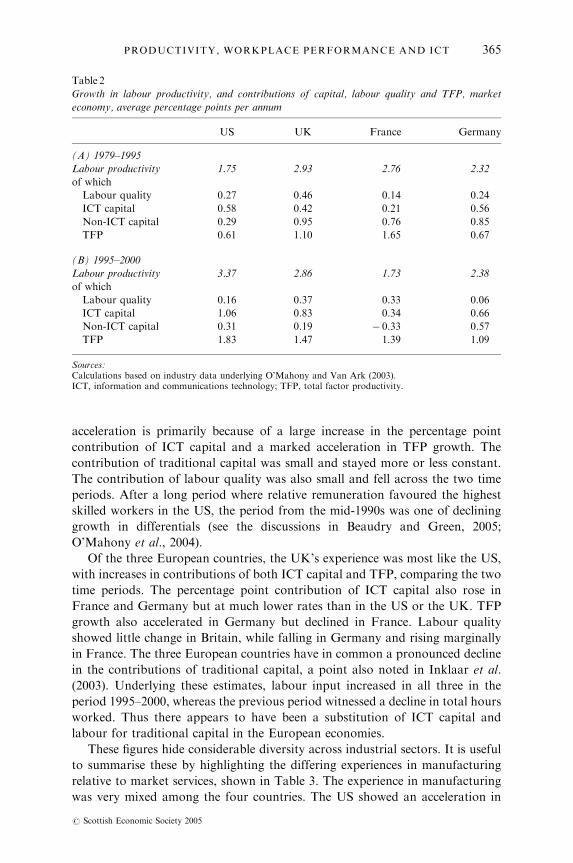
acceleration is primarily because of a large increase in the percentage point
contribution of ICT capital and a marked acceleration in TFP growth. The
contribution of traditional capital was small and stayed more or less constant.
The contribution of labour quality was also small and fell across the two time
periods. After a long period where relative remuneration favoured the highest
skilled workers in the US, the period from the mid-1990s was one of declining
growth in differentials (see the discussions in Beaudry and Green, 2005;
O’Mahony et al., 2004).
Of the three European countries, the UK’s experience was most like the US,
with increases in contributions of both ICT capital and TFP, comparing the two
time periods. The percentage point contribution of ICT capital also rose in
France and Germany but at much lower rates than in the US or the UK. TFP
growth also accelerated in Germany but declined in France. Labour quality
showed little change in Britain, while falling in Germany and rising marginally
in France. The three European countries have in common a pronounced decline
in the contributions of traditional capital, a point also noted in Inklaar et al.
(2003). Underlying these estimates, labour input increased in all three in the
period 1995–2000, whereas the previous period witnessed a decline in total hours
worked. Thus there appears to have been a substitution of ICT capital and
labour for traditional capital in the European economies.
These figures hide considerable diversity across industrial sectors. It is useful
to summarise these by highlighting the differing experiences in manufacturing
relative to market services, shown in Table 3. The experience in manufacturing
was very mixed among the four countries. The US showed an acceleration in
Table 2
Growth in labour productivity, and contributions of capital, labour quality and TFP, market
economy, average percentage points per annum
US UK France Germany
(A) 1979–1995
Labour productivity 1.75 2.93 2.76 2.32
of which
Labour quality 0.27 0.46 0.14 0.24
ICT capital 0.58 0.42 0.21 0.56
Non-ICT capital 0.29 0.95 0.76 0.85
TFP 0.61 1.10 1.65 0.67
(B) 1995–2000
Labour productivity 3.37 2.86 1.73 2.38
of which
Labour quality 0.16 0.37 0.33 0.06
ICT capital 1.06 0.83 0.34 0.66
Non-ICT capital 0.31 0.19 � 0.33 0.57
TFP 1.83 1.47 1.39 1.09
Sources:Calculations based on industry data underlying O’Mahony and Van Ark (2003).ICT, information and communications technology; TFP, total factor productivity.
PRODUCTIVITY, WORKPLACE PERFORMANCE AND ICT 365
r Scottish Economic Society 2005
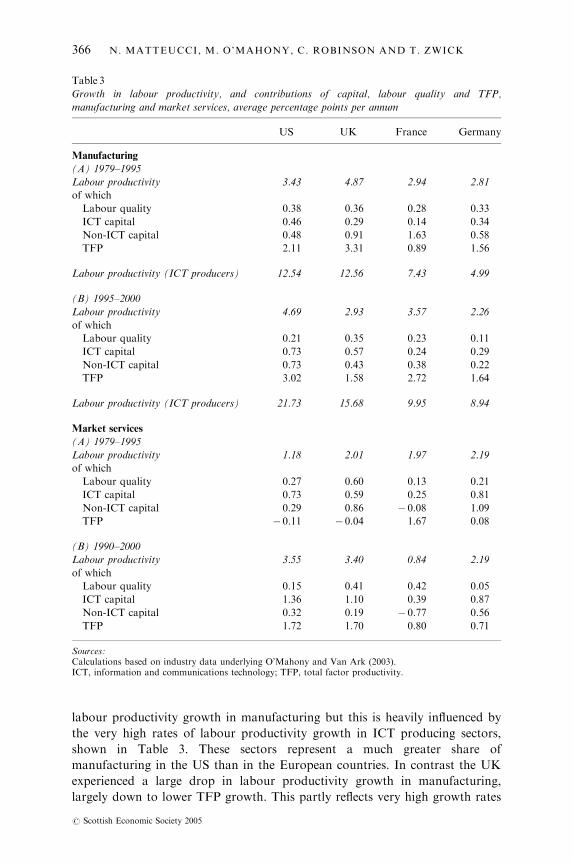
labour productivity growth in manufacturing but this is heavily influenced by
the very high rates of labour productivity growth in ICT producing sectors,
shown in Table 3. These sectors represent a much greater share of
manufacturing in the US than in the European countries. In contrast the UK
experienced a large drop in labour productivity growth in manufacturing,
largely down to lower TFP growth. This partly reflects very high growth rates
Table 3
Growth in labour productivity, and contributions of capital, labour quality and TFP,
manufacturing and market services, average percentage points per annum
US UK France Germany
Manufacturing
(A) 1979–1995
Labour productivity 3.43 4.87 2.94 2.81
of which
Labour quality 0.38 0.36 0.28 0.33
ICT capital 0.46 0.29 0.14 0.34
Non-ICT capital 0.48 0.91 1.63 0.58
TFP 2.11 3.31 0.89 1.56
Labour productivity (ICT producers) 12.54 12.56 7.43 4.99
(B) 1995–2000
Labour productivity 4.69 2.93 3.57 2.26
of which
Labour quality 0.21 0.35 0.23 0.11
ICT capital 0.73 0.57 0.24 0.29
Non-ICT capital 0.73 0.43 0.38 0.22
TFP 3.02 1.58 2.72 1.64
Labour productivity (ICT producers) 21.73 15.68 9.95 8.94
Market services
(A) 1979–1995
Labour productivity 1.18 2.01 1.97 2.19
of which
Labour quality 0.27 0.60 0.13 0.21
ICT capital 0.73 0.59 0.25 0.81
Non-ICT capital 0.29 0.86 � 0.08 1.09
TFP � 0.11 � 0.04 1.67 0.08
(B) 1990–2000
Labour productivity 3.55 3.40 0.84 2.19
of which
Labour quality 0.15 0.41 0.42 0.05
ICT capital 1.36 1.10 0.39 0.87
Non-ICT capital 0.32 0.19 � 0.77 0.56
TFP 1.72 1.70 0.80 0.71
Sources:Calculations based on industry data underlying O’Mahony and Van Ark (2003).ICT, information and communications technology; TFP, total factor productivity.
N. MATTEUCCI, M. O’MAHONY, C. ROBINSON AND T. ZWICK366
r Scottish Economic Society 2005
relative to other countries in the 1980s (the Thatcher effect) and very poor
performance in the mid- to late-1990s. Note however that despite this relatively
poor performance, UK manufacturing continued to invest heavily in ICT
capital. As with the market economy, traditional capital intensity declined in
UK manufacturing. France showed patterns in manufacturing closer to the US,
with a large increase in TFP while the German experience was a (muted) version
of that experienced by Britain, i.e. a slowdown in labour productivity growth
and non-ICT capital intensity but in Germany’s case TFP growth did not fall.
Underlying these trends were accelerations in labour productivity growth (and
TFP) in ICT producing manufacturing sectors in all three countries, similar to
that experienced in the US, but at much lower rates.
Turning to market services, there is a clear division between the US and the
UK on the one hand, and the remaining two European countries, on the other.
In the US and the UK, comparing the two time periods, there was an
acceleration in both labour productivity and TFP growth in market services,
with the UK performance dampened again by a fall in the contribution of non-
ICT capital. In both countries, the contributions of ICT capital have become
very large, accounting for about one-third of labour productivity growth. In
contrast France showed declining growth rates in both labour productivity and
TFP growth and very low contributions from ICT investment. Germany
performs better than France with no change in labour productivity growth and
an acceleration in TFP growth but at nothing like the rates experienced in the
US and UK. Neither France nor Germany shows a large increase in the
contribution of ICT capital.
Therefore looking beneath the aggregate figures suggests that comparisons
between the US and UK yield a different picture than those comparing the US
and Continental European countries. Britain performs relatively badly in
manufacturing but looks better in market services. However this conclusion
should be tempered with a note of caution as the relative levels estimates in
Table 1 show Britain a long way behind both France and Germany in market
services. Nevertheless it is possible that Britain may make up some of this
deficiency by its earlier adoption and more extensive use of ICT, and thus there
is some cause for cautious optimism in the case of the UK.
The results above show that ICT capital has had a significant impact in
raising labour productivity growth through the capital deepening channel.
However there may be external effects from investing in this type of capital
which also raise underlying TFP growth. Or it may be the case that omitted
variables such as organisational changes associated with adoption of ICT raises
TFP growth. Some suggestion of a positive impact of ICT on TFP can be seen
from dividing market services into a number of subdivisions. Table 4 shows TFP
growth rates and the percentage point contribution of ICT capital for one such
division. In all four countries TFP growth in the Communications sector showed
accelerating TFP growth simultaneously with increased contributions of ICT
capital. In the US and the UK, TFP growth rates appear to accelerate in sectors
where the ICT contributions were greatest but such a pattern is not so readily
observable for France and Germany.
PRODUCTIVITY, WORKPLACE PERFORMANCE AND ICT 367
r Scottish Economic Society 2005

Turning to the whole sample of 25 industries, it is useful to consider the
correlation between TFP growth and ICT capital’s contribution to labour
productivity growth. A positive and significant correlation suggests that there
may be an impact of ICT capital on TFP growth that is not captured by the
growth accounting method. Table 5 shows such an effect is apparent in the US
and the UK in the post-1995 period, but not earlier. In contrast, the correlation
is negative in France and Germany during the later period.
The results in Tables 4 and 5 are suggestive that the increased investment in
ICT may be an important driver of TFP growth since the mid-1990s, at least in
the US and the UK. The growth accounting method is not capable of measuring
spillover effects because by definition it assumes no divergence between private
Table 4
TFP growth and labour productivity contributions of ICT capital: market services
US UK France Germany
TFP growth
1979–1995
Communications � 0.28 2.46 4.93 1.99
Distributiona 0.98 0.41 2.63 1.39
Financial services � 3.24 � 1.79 2.77 0.26
Business services 0.11 � 1.08 2.00 � 2.05
Other servicesb � 0.04 0.63 � 0.78 0.38
1995–2000
Communications 3.00 5.87 7.63 13.10
Distribution 5.12 1.89 0.30 0.63
Financial services 0.82 2.63 � 1.21 2.36
Business services � 0.72 0.82 1.47 � 1.56
Other services � 0.65 1.10 0.33 0.19
Contribution ICT capital to labour productivity growth
1979–1995
Communications 0.90 0.74 0.40 1.61
Distribution 0.84 0.74 0.13 0.29
Financial services 1.67 1.12 1.03 1.40
Business services 0.51 0.63 0.10 1.51
Other services 0.21 0.07 0.14 0.11
1995–2000
Communications 1.89 3.00 0.55 1.91
Distribution 1.28 1.56 0.28 0.66
Financial services 3.06 1.05 1.59 1.59
Business services 0.73 1.30 0.18 1.12
Other services 0.57 0.14 0.25 0.22
Notes:Percentage points per annum.aWholesale plus retail trade.bTransport, hotels and catering, personal services.Sources:Calculations based on industry data underlying O’Mahony and Van Ark (2003).ICT, information and communications technology.
N. MATTEUCCI, M. O’MAHONY, C. ROBINSON AND T. ZWICK368
r Scottish Economic Society 2005
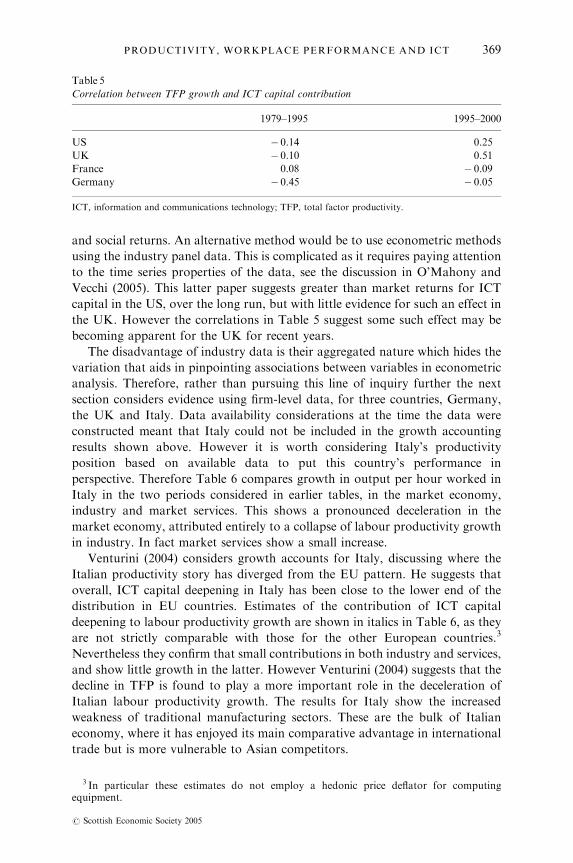
and social returns. An alternative method would be to use econometric methods
using the industry panel data. This is complicated as it requires paying attention
to the time series properties of the data, see the discussion in O’Mahony and
Vecchi (2005). This latter paper suggests greater than market returns for ICT
capital in the US, over the long run, but with little evidence for such an effect in
the UK. However the correlations in Table 5 suggest some such effect may be
becoming apparent for the UK for recent years.
The disadvantage of industry data is their aggregated nature which hides the
variation that aids in pinpointing associations between variables in econometric
analysis. Therefore, rather than pursuing this line of inquiry further the next
section considers evidence using firm-level data, for three countries, Germany,
the UK and Italy. Data availability considerations at the time the data were
constructed meant that Italy could not be included in the growth accounting
results shown above. However it is worth considering Italy’s productivity
position based on available data to put this country’s performance in
perspective. Therefore Table 6 compares growth in output per hour worked in
Italy in the two periods considered in earlier tables, in the market economy,
industry and market services. This shows a pronounced deceleration in the
market economy, attributed entirely to a collapse of labour productivity growth
in industry. In fact market services show a small increase.
Venturini (2004) considers growth accounts for Italy, discussing where the
Italian productivity story has diverged from the EU pattern. He suggests that
overall, ICT capital deepening in Italy has been close to the lower end of the
distribution in EU countries. Estimates of the contribution of ICT capital
deepening to labour productivity growth are shown in italics in Table 6, as they
are not strictly comparable with those for the other European countries.3
Nevertheless they confirm that small contributions in both industry and services,
and show little growth in the latter. However Venturini (2004) suggests that the
decline in TFP is found to play a more important role in the deceleration of
Italian labour productivity growth. The results for Italy show the increased
weakness of traditional manufacturing sectors. These are the bulk of Italian
economy, where it has enjoyed its main comparative advantage in international
trade but is more vulnerable to Asian competitors.
Table 5
Correlation between TFP growth and ICT capital contribution
1979–1995 1995–2000
US � 0.14 0.25
UK � 0.10 0.51
France 0.08 � 0.09
Germany � 0.45 � 0.05
ICT, information and communications technology; TFP, total factor productivity.
3 In particular these estimates do not employ a hedonic price deflator for computingequipment.
PRODUCTIVITY, WORKPLACE PERFORMANCE AND ICT 369
r Scottish Economic Society 2005

IV The Impact of ICT on Firm-Level Performance
Micro-economic data are generally more detailed and enable more specific
estimation of the mechanisms through which productivity changes travel. One of
the fundamental problems with micro-economic analyses has been the sheer data
requirements. This has been compounded by an inability to compare survey
results from one country to another, usually because of a lack of coordination in
surveys. In addition, institutional differences might sometimes make compar-
isons less than meaningful. In this section, firm-level evidence from three
European countries (Germany, Italy and the UK) is considered, to see if
together these provide further evidence of productivity impacts from the use of
information technology.
ICT and workplace performance in Germany
In recent years, several authors investigated the impact of ICT investments on
establishment or firm productivity in Germany. Zwick (2003) finds substantial
effects of ICT investments on establishment productivity. In contrast to the bulk
of the literature, establishments without ICT capital are also included and
lagged effects of ICT investments are analysed. In addition, a broad range of
establishment and employee characteristics are taken into account in order to
avoid omitted variable bias. It is shown that taking into account unobserved
heterogeneity of the establishments using a fixed effects panel estimation
increases the estimated lagged productivity impact of ICT investments. Also the
endogeneity of ICT investments is corrected by introducing an instrumental
variables estimator with external instruments. This correction increases the
estimated productivity impact of ICT.
Hempell (2005) also finds a very high net-rate of return to ICT investments
on the basis of the Mannheim Innovation Panel in Services. He uses a translog
production function including non-ICT capital, ICT capital and labour, and
Table 6
Labour productivity growth for Italy, 1979–2000
1979–1995 1995–2000
Labour
productivity
growth
Contribution of
ICT capital
Labour
productivity
growth
Contribution
of ICT capital
Market economy 2.30 0.26 1.18 0.31
Industry 2.90 0.23 0.96 0.27
Market services 0.62 0.37 0.84 0.40
Sources:Calculations based on industry data underlying O’Mahony and Van Ark (2003), GGDC Total EconomyGrowth Accounting database of Timmer et al. (2003) and, for ICT capital, Bassenetti et al. (2004).ICT, information and communications technology.
N. MATTEUCCI, M. O’MAHONY, C. ROBINSON AND T. ZWICK370
r Scottish Economic Society 2005

corrects the endogeneity of ICT intensity and unobserved heterogeneity by using
system GMM estimations. Controlling for unobserved heterogeneity reduces the
coefficient of ICT capital and it is no longer significant. When endogeneity is
also taken into account, the measured productivity effect, however, increases
again. Also on the basis of the Mannheim Innovation Panel, Licht and Moch
(1999) find a very high impact of personal computers on productivity, while the
impact of ICT investments on productivity is smaller. Bertschek and Kaiser
(2004) find similarly high impacts of ICT investments on productivity in a
comparable econometric setting using the German ‘Service Sector Business
Survey’.
These papers do not distinguish between the potentially different impact ICT
investments have on productivity in the manufacturing and service sector in
Germany. The estimation presented here therefore first tests if the impact differs
between both sectors and then estimates the different productivity effects. It uses
the two-step estimation procedure developed by Black and Lynch (2001) and
implemented by Zwick (2003). The estimation is based on the representative
German IAB establishment panel, waves 1997–2001. A definition of all variables
as well as their average values can be found in Table A1 in Zwick (2003).
This study estimates the impact of ICT investment in 1996/1997 on average
productivity in 1997–2000. In order to account for unobserved time-invariant
heterogeneity, the parameters of the time-variant input factors capital and
labour from equation (4) are determined by a simple fixed effects Cobb–Douglas
production function on the basis of panel data from 1997 to 2000 in the first
step. The effects of the (almost) time-invariant determinants including ICT
investments are regressed on the fixed effects from the panel analysis in the
second step. The fixed effects estimation in the first step is
lnYt ¼ a lnKt þ b lnLt þ uþ et with t ¼ 1997�2000; ð5Þ
where Y is VA (sales minus input costs), K is capital which is calculated by the
perpetual inventory method from replacement investments (Black and Lynch,
2001; Hempell, 2005),4 L is the number of employees, u is the unobserved time-
invariant establishment-specific fixed effect, and et the idiosyncratic component
of the error term. The results of this estimation step are identical to those by
Zwick (2003, Table A8).5
On the basis of estimating equation (5), the fixed effect u for every
establishment can be calculated. The fixed effect is the average establishment-
specific difference to productivity predicted on the basis of the variable inputs or
in other words TFP. It serves as the dependent variable for the second
estimation step. The vector of explanatory variables in the second step contains
all (almost) time-invariant establishment characteristics that might have an
4Depreciation is assumed to be linear while the average depreciation rate is assumed to equal10%. The average growth rate of investments is assumed to equal 5% (Hempell, 2005). Changesin these assumptions did not influence the results from the productivity estimations.
5Note that the first step total factor productivity estimations suffer from omitted variablebias and measurement error – labour and capital coefficients therefore may be too low (Harrisand Drinkwater, 2000).
PRODUCTIVITY, WORKPLACE PERFORMANCE AND ICT 371
r Scottish Economic Society 2005
impact on establishment productivity from equation (4): ICT investments
(ICT ), training investments, the share of qualified employees, work organisa-
tion, the presence of works councils or if an establishment is bound by collective
bargaining, five establishment size dummies, 16 dummies for sector, dummies
for East or West German establishments, exporters and four legal forms. It
includes three dummy variables indicating if an establishment introduced re-
organisations (introduction of team work, reduction of hierarchies, and
introduction of autonomous workgroups) that are closely correlated (Wolf
and Zwick, 2002). This means that there may be multi-collinearity if they are
estimated separately. Therefore, the observed three re-organisations are
aggregated to one independent ‘re-organisations’ factor R by a factor analysis.
All variables (besides the dummy for works councils) are in values for 1997 and
collected in vector X.6
u ¼ g ICTþ d0X þ e: ð6Þ
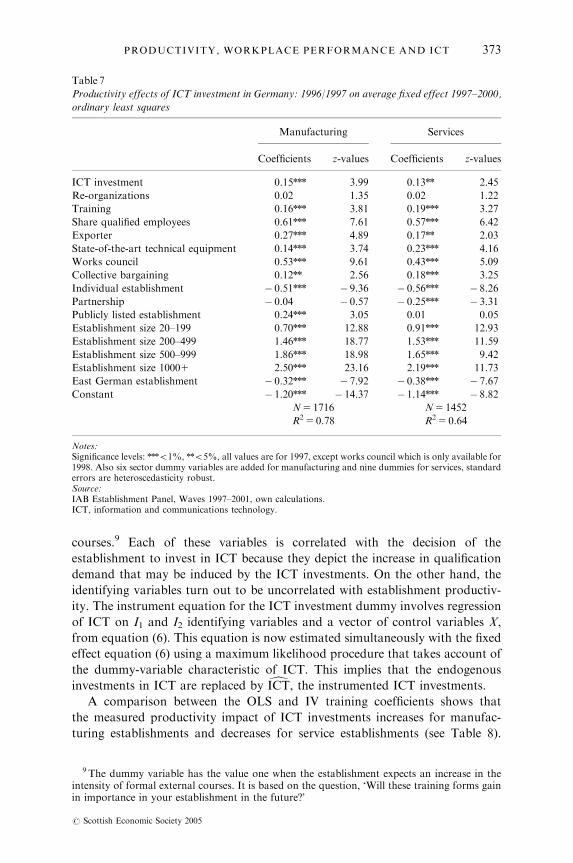
In order to test if the manufacturing and services sectors differ significantly in
their productivity determinants, a Chow-test is performed. It shows that
equation (6) should be estimated separately for both sectors.7 The estimation
results of equation (6) are shown in Table 7. ICT investments have a significant
positive impact on the establishment-specific fixed effects in the manufacturing
and the services sector. Both coefficients do not differ, however. The control
variables all have the expected effects on the productivity of the enterprises. The
productivity gap between East and West Germany is still persistent, individual
establishments and partnerships are on average less productive than limited
liability companies and publicly listed establishments, and the sector dummies
are jointly significant (see also Wolf and Zwick, 2002). The larger the enterprise
the higher is its productivity. We find that works councils and collective
bargaining have a positive impact on productivity (see also Hubler and Jirjahn,
2003; Zwick, 2004). Re-organisations that increase employee participation do
not have a positive impact on productivity which may be a consequence of
endogeneity bias (Wolf and Zwick, 2002). Establishments that train the
workforce and have a high share of qualified employees are more efficient
(Black and Lynch, 2001; Zwick, 2005). The main difference between service and
manufacturing sector is that publicly listed establishments are not more
productive than limited liability establishments in the service sector while
partnerships are not less productive in the manufacturing sector.
Final statements on the effects of ICT investments on productivity can only
be made, however, if we control for training endogeneity. Two suitable exclusion
restrictions can be identified: an expected increase in demand for qualification
and training8 and an expected increase in the incidence of formal training
6Details of the construction of R are given in Zwick (2003) as are descriptive statistics for X(Table A1).
7 The test statistic is: w2(17)5 51.07, Prob o0.01.8 The dummy variable has the value one when the establishment expects an increase in the
demand for qualification and training. It is based on the question, ‘Which personnel problemsdo you expect in the following two years?’
N. MATTEUCCI, M. O’MAHONY, C. ROBINSON AND T. ZWICK372
r Scottish Economic Society 2005
courses.9 Each of these variables is correlated with the decision of the
establishment to invest in ICT because they depict the increase in qualification
demand that may be induced by the ICT investments. On the other hand, the
identifying variables turn out to be uncorrelated with establishment productiv-
ity. The instrument equation for the ICT investment dummy involves regression
of ICT on I1 and I2 identifying variables and a vector of control variables X,
from equation (6). This equation is now estimated simultaneously with the fixed
effect equation (6) using a maximum likelihood procedure that takes account of
the dummy-variable characteristic of ICT. This implies that the endogenous
investments in ICT are replaced by dICT, the instrumented ICT investments.
A comparison between the OLS and IV training coefficients shows that
the measured productivity impact of ICT investments increases for manufac-
turing establishments and decreases for service establishments (see Table 8).
Table 7
Productivity effects of ICT investment in Germany: 1996/1997 on average fixed effect 1997–2000,
ordinary least squares
Manufacturing Services
Coefficients z-values Coefficients z-values
ICT investment 0.15nnn 3.99 0.13nn 2.45
Re-organizations 0.02 1.35 0.02 1.22
Training 0.16nnn 3.81 0.19nnn 3.27
Share qualified employees 0.61nnn 7.61 0.57nnn 6.42
Exporter 0.27nnn 4.89 0.17nn 2.03
State-of-the-art technical equipment 0.14nnn 3.74 0.23nnn 4.16
Works council 0.53nnn 9.61 0.43nnn 5.09
Collective bargaining 0.12nn 2.56 0.18nnn 3.25
Individual establishment � 0.51nnn � 9.36 � 0.56nnn � 8.26
Partnership � 0.04 � 0.57 � 0.25nnn � 3.31
Publicly listed establishment 0.24nnn 3.05 0.01 0.05
Establishment size 20–199 0.70nnn 12.88 0.91nnn 12.93
Establishment size 200–499 1.46nnn 18.77 1.53nnn 11.59
Establishment size 500–999 1.86nnn 18.98 1.65nnn 9.42
Establishment size 10001 2.50nnn 23.16 2.19nnn 11.73
East German establishment � 0.32nnn � 7.92 � 0.38nnn � 7.67
Constant � 1.20nnn � 14.37 � 1.14nnn � 8.82
N5 1716 N5 1452
R2 5 0.78 R2 5 0.64
Notes:Significance levels: nnno1%, nno5%, all values are for 1997, except works council which is only available for1998. Also six sector dummy variables are added for manufacturing and nine dummies for services, standarderrors are heteroscedasticity robust.Source:IAB Establishment Panel, Waves 1997–2001, own calculations.ICT, information and communications technology.
9 The dummy variable has the value one when the establishment expects an increase in theintensity of formal external courses. It is based on the question, ‘Will these training forms gainin importance in your establishment in the future?’
PRODUCTIVITY, WORKPLACE PERFORMANCE AND ICT 373
r Scottish Economic Society 2005

Investments in ICT in 1996/1997 increase the average productivity of
manufacturing establishments in 1997–2000 by 36% while they do not have
an impact on productivity of service establishments. Obviously the selection
mechanism is different in both sectors: while in the manufacturing sector it is the
establishments with a productivity deficit that invest in ICT, this does not seem
to be the case for the services sector. The other covariates are very similar in
both regressions.
The results of the instrumental equation that explains the decision of the
establishments to invest in ICT or not can be found in Table 9. According to the
theoretical considerations, expected higher demand for training and qualifica-
tions and an increase of the importance of formal internal training courses have
a positive impact on the probability that an establishment invests in ICT.
International competitive pressure has a positive impact on the propensity of
establishments to invest in ICT because strong international competition drives
establishments to innovation and rapid technology adoption (Osterman, 1994).
Table 8
Productivity effects of ICT investment in Germany: 1996/1997 on average fixed effect 1997–2000,
instrumental variables regression
Manufacturing Services
Coefficients z-values Coefficients z-values
ICT investment 0.36nnn 3.28 0.08 0.33
Re-organizations 0.08 0.54 0.03 1.55
Training 0.15nnn 3.43 0.21nnn 3.37
Share qualified employees 0.58nnn 7.01 0.57nnn 6.52
Exporter 0.24nnn 4.24 0.19nn 2.21
State-of-the-art technical equipment 0.13nnn 3.42 0.25nnn 4.25
Works council 0.50nnn 8.68 0.45nnn 5.12
Collective bargaining 0.12nn 2.57 0.18nnn 3.27
Individual establishment � 0.50nnn � 9.08 � 0.57nnn � 8.27
Partnership � 0.04 � 0.64 � 0.26nnn � 3.32
Publicly listed establishment 0.23nnn 3.04 � 0.00 � 0.00
Establishment size 20–199 0.69nnn 12.61 0.93nnn 12.97
Establishment size 200–499 1.44nnn 18.34 1.55nnn 11.61
Establishment size 500–999 1.86nnn 19.15 1.67nnn 9.44
Establishment size 10001 2.48nnn 22.89 2.24nnn 12.16
East German establishment � 0.32nnn � 7.88 � 0.38nnn � 7.72
Constant � 1.24nnn � 14.50 � 1.09nnn � 7.59
N5 1716 N5 1452
Wald test of
independent equations,
Prob4w2 5 0.04
Wald test of
independent equations,
Prob4w2 5 0.37
Notes:Significance levels: nnno1%, nno5%, all values are for 1997, except works council which is only available for1998. Also six sector dummy variables are added for manufacturing and nine dummies for services, standarderrors are heteroscedasticity robust.Source:IAB Establishment Panel, Waves 1997–2001, own calculations.ICT, information and communications technology.
N. MATTEUCCI, M. O’MAHONY, C. ROBINSON AND T. ZWICK374
r Scottish Economic Society 2005

It is also found that the adoption of ICT is positively influenced by the adoption
or presence of organisational forms that increase the participation of employees
(Bresnahan et al., 2002). In addition, the qualification level of the employees and
training investments have a positive impact on the inclination of the establish-
ment to invest in ICT (Zwick, 2003). The enterprises need well-educated
employees in order to effectively implement new ICT and the complementary
new organisational forms that require greater levels of cognitive skill, flexibility,
and autonomy. Works councils also have a positive impact on ICT investments.
Larger establishments do not seem to invest more frequently in ICT.
ICT and workplace performance in Italy
For Italy, micro-data sets providing data on ICT investment are still in short
supply. The Survey on Firms Accounts (see ISTAT, 2001) provides a truly
longitudinal firm-level data set, but its micro-data are not released to external
researchers. Using these data, Milana and Zeli (2004) analyse the TFP
determinants in a sample of 2248 Italian non-agricultural firms, focusing on
ICT. The authors build a Malmqvist-like index of TFP growth for each firm,
and then estimate, separately for each industry, a firm-level regression for TFP
Table 9
Instrumental variable regression for Germany, endogeneous variable: ICT investments 1996/1997
Variables
Manufacturing Services
Coefficient z-value Coefficient z-value
Re-organizations 0.14nnn 5.78 0.18nnn 6.50
Training 0.16n 1.94 0.18nn 2.06
Share qualified employees 0.51nnn 3.55 0.14 1.10
Exporter 0.35nnn 3.56 0.26nn 2.08
State-of-the-art technical equipment 0.15nn 2.07 0.21nn 2.52
Works council 0.40nnn 3.94 0.29nn 2.31
Individual establishment � 0.16 � 1.62 � 0.19n 1.93
Partnership 0.09 0.71 � 0.01 � 0.06
Publicly listed establishment 0.12 0.66 � 0.23 � 0.99
Establishment size 20–199 0.11 1.18 0.12 1.22
Establishment size 200–499 0.26 1.59 0.32 1.58
Establishment size 500–999 0.01 0.03 0.32 1.16
Establishment size 10001 0.27 1.22 0.91nn 2.46
Expected large demand for training and
qualification (instrument)
0.15n 1.64 0.20n 1.87
Expected increase in formal internal
courses (instrument)
� 0.09 � 0.77 0.37n 1.74
Constant � 1.01nnn � 6.85 � 0.75nnn � 4.19
Notes:Significance levels: nnno1%, nno5%. All variables take the values of year 1997 (except works councils thatare only available for 1998). Also six sector dummy variables are added for manufacturing and nine dummiesfor services, standard errors are heteroscedasticity robust.Source:IAB Establishment Panel, Waves 1997 and 1998, own calculations.ICT, information and communications technology.
PRODUCTIVITY, WORKPLACE PERFORMANCE AND ICT 375
r Scottish Economic Society 2005

changes, expressed as long differences over the period 1996–1999. The latter are
regressed on the intensities of R&D and ICT capital stock on total capital,
together with the wage share of skilled workers on total labour costs; moreover,
controls for size, location and other firm characteristics are used. Among their
results, the coefficient on ICT capital intensity is positive and significant for
most industries, the skill factor is of smaller significance (and only for a few
industries), while the R&D intensity is never significant.
This paper uses the Capitalia data set, representative of manufacturing. It is
based on a rotating panel and gives both a larger sample (ALL), fixed for a
3-year period (there are two waves, 1995–1997 and 1998–2000) and a
longitudinal smaller one (LONG), composed of those firms which are present
across the two waves. The LONG sample will be the reference sample: besides
the econometric reasons explained later, it is also more representative of
manufacturing.
For the regression analysis, aimed at measuring the ICT impact on TFP, a
standard Cobb–Douglas framework is employed as outlined above, but where
ICT capital is separated from other forms of capital:
ln Yit ¼ ln Aþ ltþ a ln Lit þ b ln Kit þ g ln KICTit þ Zit: ð7Þ
In this framework, the TFP addendum should measure the residual growth of
output (exogenous disembodied technical progress), left after accounting for the
growth of all the productive inputs. In practice, a series of factors can still
influence TFP – particularly in a growth accounting framework, where the input
coefficients are set to their nominal input shares. TFP will also pick up any
returns to scale, resource reallocation and ‘omitted variables’ bias. This paper
focuses on the first and the third element. As employed recently by a few
scholars,10 one way to control for the presence of increasing (or ‘excess’, with
respect to the single input) returns – particularly those attributable to the ICT
capital – is that of calculating first the usual index of TFP, and then to use it as
the dependent variable in the Cobb–Douglas estimation.11 This solution also has
the advantage of avoiding other biases, such as measurement errors involved in
the direct estimation of the ICT elasticity parameter with the production
function in differences.12 However, this strategy is not immune from the
‘omitted variable’ bias; in fact, a positive and significant ‘excess’ output elasticity
coefficient found for ICT capital could partly capture the impact of other
unmeasured inputs. As recently explored by the literature (see Brynjolfsson and
Hitt, 2000; Bresnahan et al., 2002; Brynjolfsson and Hitt, 2003), ICT investment
10 See Brynjolfsson and Hitt (2003). A different procedure for detecting excess return ischosen by Lehr and Lichtenberg (1999), who go to estimate the excess return directly, withoutcalculating the TFP index.
11 The theoretical framework underlying this procedure is presented in Brynjolfsson and Hitt(2003). A different procedure for detecting excess returns on IT capital is chosen by Lehr andLichtenberg (1999), who estimate the excess returns directly, without calculating the TFP index.
12 In a production function estimated in differences, labour adjusts faster than the otherquasi-fixed factors like capital (be it normal or ICT). Because of the small share of ICT capital,its real contribution to productivity is more likely to be overwhelmed by measurement errors(Brynjolfsson and Hitt, 2003).
N. MATTEUCCI, M. O’MAHONY, C. ROBINSON AND T. ZWICK376
r Scottish Economic Society 2005
is typically accompanied by other complementary (mostly intangible) assets, like
innovations in business methods and organisation; moreover, productivity gains
should show up with a delay (see also David, 1990). Most of these
complementary assets are difficult to measure, and cannot easily be proxied
by qualitative variables or simple dummies. Hence this paper borrows from the
previous literature (as surveyed in e.g. Griliches, 1995; Bartelsman and Doms,
2000; Mairesse and Monhen, 2003), taking the firms’ own R&D capital as a
proxy for most of these immeasurable phenomena.
Having calculated the TFP index, and taking time differences, the TFP index
is regressed on the ICT and R&D capital, to test the ‘excess elasticity’
assumption. However, in many micro-data sets (including the one employed
here) ICT and R&D inputs are not segregated out of the traditional inputs (total
labour and capital), so that applying the above procedure suffers a double
counting problem. The solution traditionally found in the literature is that of
considering the ‘normal’ output elasticities of the ICT and R&D capital as
already incorporated in those of the traditional inputs (which in this case
represent a mix of heterogeneous inputs), imputed during the calculation of the
TFP index; consequently, those elasticities being estimated can, if significant, be
interpreted as the ‘excess’ ‘above average’ elasticities of the ICT and R&D
capital.13
The same logic applies when the data set does not allow the construction of
the R&D and ICT capital stocks, but offers data on R&D and ICT investment,
at least for 1 year (like ours). In this case, the production function can be
expressed in terms of ‘excess’ rate of return, and the ICT and R&D investment
are taken as proxies for their respective capital variations.14 Therefore our
estimating equation becomes
Dln TFP98�00 ¼ lþ rðICT=VAÞ98 þ sðR&D=VAÞ98þz ln EMPL98
þwSPINOFFSþ fM&Aþ SjjjINDUSTRYj þ e;
ð8Þ
with the ICT and R&D investment intensity coefficients representing excess rates
of return, both for ICT (r5 @VA/@KICT) and R&D (s5 @VA/@KR&D).
Looking at the left-hand side of equation (8), the TFP index is computed as
VA minus labour and capital inputs (all in logs), multiplied by their respective
shares on VA. These shares (averaged over 1998–2000) do not refer to single
firms, but are computed for each industry. This is equivalent to assuming that
there are as many perfectly competitive markets as industries, each of them with
a different capital/labour ratio (Baily et al., 1992). All monetary variables have
13This procedure is quite common in the ‘R&D productivity’ literature. An early descriptioncan be found in Griliches and Lichtenberg (1984, sect. 5). Other data sets, instead, allow thedouble counting correction: an illustrative exercise is presented in Hall and Mairesse (1995).
14 This implies assuming a negligible depreciation rate for the R&D capital stock, close tozero (on this point, see also Griliches and Lichtenberg, 1984). Further details on the theoreticalframework underlying the ‘rate of return’ specification can be found in Mairesse and Sassenou(1991); more recent empirical evidence is presented in Hall and Mairesse (1995) and Harhoff(1998).
PRODUCTIVITY, WORKPLACE PERFORMANCE AND ICT 377
r Scottish Economic Society 2005

been deflated and labour input is measured by the number of total workers.15
Finally, the change in TFP is computed as a 2-year log difference between the
initial and final year of the last wave of the Capitalia survey (1998–2000). In
principle, the analysis could have started by using the previous wave of the
survey (1995–1997). However, for the reasons that shall be explained later, both
the use of longer differences and panel data estimation with first differences were
not feasible solutions.
Moving to the right-hand side of equation (8), the R&D investment intensity
refers to the initial year of the survey wave: in this way, R&D intensity is pre-
determined with respect to the TFP variation. However, contrary to R&D
expenditures, the survey does not provide annual data on ICT investments: firms
are asked to report only their cumulative expenditures on ICT items over the
previous 3 years. As a consequence, that referring to the initial year (1998) is not
the ‘true’ ICT intensity, but represents one-third of the total investment in ICT
during 1998–2000. Because of this imputation, the ICT intensity variable is not
truly pre-determined with respect to TFP changes, and this aggravates the
problem of endogeneity. To alleviate the latter, the previous wave of the
Capitalia survey (1995–1997) was employed from which a lagged variable for
ICT intensity was obtained, referring to the year 1997. The lack of annual data
for ICT investment prevented implementation of panel data estimation in first
differences or performing an estimation of equation (8) based on differences
longer than 2 years: in effect, the only way to get a truly lagged ICT variable it to
compute an index of TFP change over the last wave of the survey and to regress
it on the ICT intensity resulting from the previous wave. Obviously, to do it is
not possible to use the entire (ALL) sample of the last wave, but instead results
are based on the (LONG) sample of firms that took part in both waves (reducing
dramatically the number of observations from 3918 to 1119). Finally, the ICT
intensity is expressed at constant (1995) prices, and the deflation procedure takes
into account its internal composition by item.
The other explanatory variables included in equation (4) are used as controls.
The natural log of total workers (ln EMPL) should capture the possible effect of
firm size on TFP growth. As the TFP index could have been affected by
discontinuous changes in the size of firms, two other dummy variables are
inserted in the regression: one for the spin-offs or the selling of plants or lines of
business (SPINOFFS) and another for mergers and acquisitions (M&A) that
occurred during the period 1998–2000. Finally, 16 industry dummies are
included (not shown in the tables).
Table 10 presents the results of two OLS regressions carried out for equation
(8) without lagging ICT intensities: the main advantage of doing so is the
possibility of comparing the results arising from the LONG and the ALL
sample, with the latter having a very large number of observations. First of all,
the findings are quite consistent between the two samples. The estimated (gross)
15 Further details on deflation and econometric methodology are provided in Matteucci andSterlacchini (2004), who also present some sample descriptive statistics. Here it is sufficient tonote that the ICT deflator used builds on US hedonic prices.
N. MATTEUCCI, M. O’MAHONY, C. ROBINSON AND T. ZWICK378
r Scottish Economic Society 2005
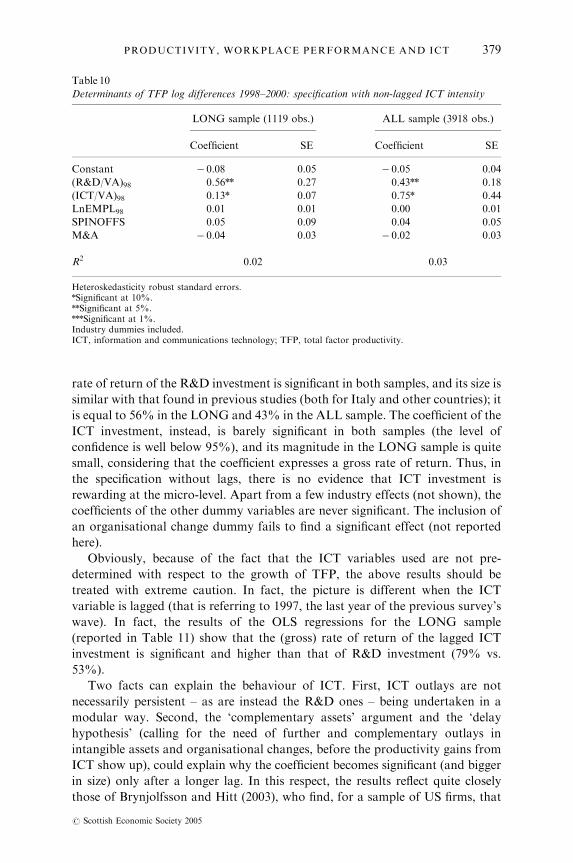
rate of return of the R&D investment is significant in both samples, and its size is
similar with that found in previous studies (both for Italy and other countries); it
is equal to 56% in the LONG and 43% in the ALL sample. The coefficient of the
ICT investment, instead, is barely significant in both samples (the level of
confidence is well below 95%), and its magnitude in the LONG sample is quite
small, considering that the coefficient expresses a gross rate of return. Thus, in
the specification without lags, there is no evidence that ICT investment is
rewarding at the micro-level. Apart from a few industry effects (not shown), the
coefficients of the other dummy variables are never significant. The inclusion of
an organisational change dummy fails to find a significant effect (not reported
here).
Obviously, because of the fact that the ICT variables used are not pre-
determined with respect to the growth of TFP, the above results should be
treated with extreme caution. In fact, the picture is different when the ICT
variable is lagged (that is referring to 1997, the last year of the previous survey’s
wave). In fact, the results of the OLS regressions for the LONG sample
(reported in Table 11) show that the (gross) rate of return of the lagged ICT
investment is significant and higher than that of R&D investment (79% vs.
53%).
Two facts can explain the behaviour of ICT. First, ICT outlays are not
necessarily persistent – as are instead the R&D ones – being undertaken in a
modular way. Second, the ‘complementary assets’ argument and the ‘delay
hypothesis’ (calling for the need of further and complementary outlays in
intangible assets and organisational changes, before the productivity gains from
ICT show up), could explain why the coefficient becomes significant (and bigger
in size) only after a longer lag. In this respect, the results reflect quite closely
those of Brynjolfsson and Hitt (2003), who find, for a sample of US firms, that
Table 10
Determinants of TFP log differences 1998–2000: specification with non-lagged ICT intensity
LONG sample (1119 obs.) ALL sample (3918 obs.)
Coefficient SE Coefficient SE
Constant � 0.08 0.05 � 0.05 0.04
(R&D/VA)98 0.56nn 0.27 0.43nn 0.18
(ICT/VA)98 0.13n 0.07 0.75n 0.44
LnEMPL98 0.01 0.01 0.00 0.01
SPINOFFS 0.05 0.09 0.04 0.05
M&A � 0.04 0.03 � 0.02 0.03
R2 0.02 0.03
Heteroskedasticity robust standard errors.nSignificant at 10%.nnSignificant at 5%.nnnSignificant at 1%.Industry dummies included.ICT, information and communications technology; TFP, total factor productivity.
PRODUCTIVITY, WORKPLACE PERFORMANCE AND ICT 379
r Scottish Economic Society 2005
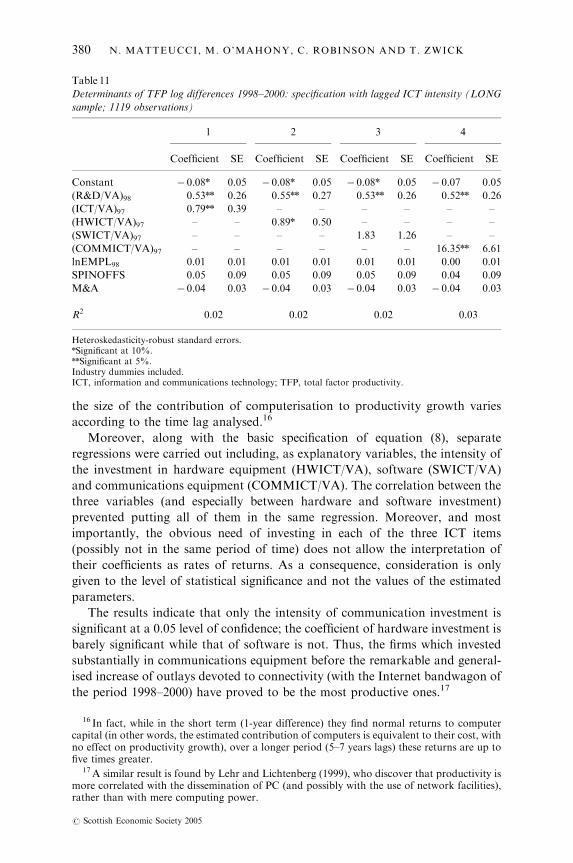
the size of the contribution of computerisation to productivity growth varies
according to the time lag analysed.16
Moreover, along with the basic specification of equation (8), separate
regressions were carried out including, as explanatory variables, the intensity of
the investment in hardware equipment (HWICT/VA), software (SWICT/VA)
and communications equipment (COMMICT/VA). The correlation between the
three variables (and especially between hardware and software investment)
prevented putting all of them in the same regression. Moreover, and most
importantly, the obvious need of investing in each of the three ICT items
(possibly not in the same period of time) does not allow the interpretation of
their coefficients as rates of returns. As a consequence, consideration is only
given to the level of statistical significance and not the values of the estimated
parameters.
The results indicate that only the intensity of communication investment is
significant at a 0.05 level of confidence; the coefficient of hardware investment is
barely significant while that of software is not. Thus, the firms which invested
substantially in communications equipment before the remarkable and general-
ised increase of outlays devoted to connectivity (with the Internet bandwagon of
the period 1998–2000) have proved to be the most productive ones.17
Table 11
Determinants of TFP log differences 1998–2000: specification with lagged ICT intensity (LONG
sample; 1119 observations)
1 2 3 4
Coefficient SE Coefficient SE Coefficient SE Coefficient SE
Constant � 0.08n 0.05 � 0.08n 0.05 � 0.08n 0.05 � 0.07 0.05
(R&D/VA)98 0.53nn 0.26 0.55nn 0.27 0.53nn 0.26 0.52nn 0.26
(ICT/VA)97 0.79nn 0.39 – – – – – –
(HWICT/VA)97 – – 0.89n 0.50 – – – –
(SWICT/VA)97 – – – – 1.83 1.26 – –
(COMMICT/VA)97 – – – – – – 16.35nn 6.61
lnEMPL98 0.01 0.01 0.01 0.01 0.01 0.01 0.00 0.01
SPINOFFS 0.05 0.09 0.05 0.09 0.05 0.09 0.04 0.09
M&A � 0.04 0.03 � 0.04 0.03 � 0.04 0.03 � 0.04 0.03
R2 0.02 0.02 0.02 0.03
Heteroskedasticity-robust standard errors.nSignificant at 10%.nnSignificant at 5%.Industry dummies included.ICT, information and communications technology; TFP, total factor productivity.
16 In fact, while in the short term (1-year difference) they find normal returns to computercapital (in other words, the estimated contribution of computers is equivalent to their cost, withno effect on productivity growth), over a longer period (5–7 years lags) these returns are up tofive times greater.
17A similar result is found by Lehr and Lichtenberg (1999), who discover that productivity ismore correlated with the dissemination of PC (and possibly with the use of network facilities),rather than with mere computing power.
N. MATTEUCCI, M. O’MAHONY, C. ROBINSON AND T. ZWICK380
r Scottish Economic Society 2005
To summarise, the predetermination of the ICT variable suggests that the
second specification (with the lagged ICT intensity) is the most suitable one to
analyse the TFP growth. With this specification, a significant relation between
ICT investment and TFP emerges, similar to that found recently for other
countries. Finally, we are aware of the limits of our test, given that it does not
address completely the possible endogeneity of the ICT and R&D variables.
ICT and workplace performance UKn
Micro-work for the UK on the use and impact of ICT has been limited to a
handful of studies, primarily commissioned by the UK National Statistics Office
(Clayton et al., 2003; Clayton and Waldron, 2003; Criscuolo and Waldron,
2003). The focus of these studies has been the measurement of the impact of
computer network use on labour and TFP. Criscuolo and Waldron (2003)
limited their study to UK manufacturing, following the work of Atrostic and
Nguyen (2002) for the US. While the questions available from the survey do not
allow an exact comparison of findings with the US study, they consider e-buying
and e-selling separately and find productivity impacts differing in sign. In
particular, they do not find a positive impact from e-selling, which they partly
attribute to negative pricing effects, because of improved price transparency.
The authors also highlight the fact that any impact detected is likely to be an
underestimation of the productivity effect of ICT because presently there are no
ICT capital stock series available at the micro-level.18
Clayton and Criscuolo (2002) argue that e-commerce has had a significantly
positive impact on the way business to business transactions are conducted,
improving information flows between suppliers and consumers, and speeding up
market access. However, only around 2% of business sales are thought to
transmit through e-commerce, which makes it difficult to identify these sorts of
effects at the industry level, as in section II. Also, ICT activity as a whole
accounted for less than 10% of UK VA (Clayton and Criscuolo, 2002) which
highlights the importance of growth in ICT use rather than absolute levels, even
at the micro-level of analysis.
Enterprise panels linking ICT investment and productivity performance
similar to those employed in Germany and Italy are not yet readily available for
the UK, although there is on-going research facilitated by the Office for
National Statistics linking of survey data to financial information from the
annual business inquiry (ABI). Instead in this section preliminary results from
linking a survey of e-commerce for 2001 to financial information from the ABI
are presented. This covers both production industries and service sectors.
Combining data sets is an extremely useful way of increasing the potential of
micro-data. The merged data set for the UK consists of a single cross-section for
2001 which includes variables on the nature of e-commerce activity and financial
variables from the ABI.
18Although ONS are currently engaged on matching business investment surveys to financialdata.
PRODUCTIVITY, WORKPLACE PERFORMANCE AND ICT 381
r Scottish Economic Society 2005
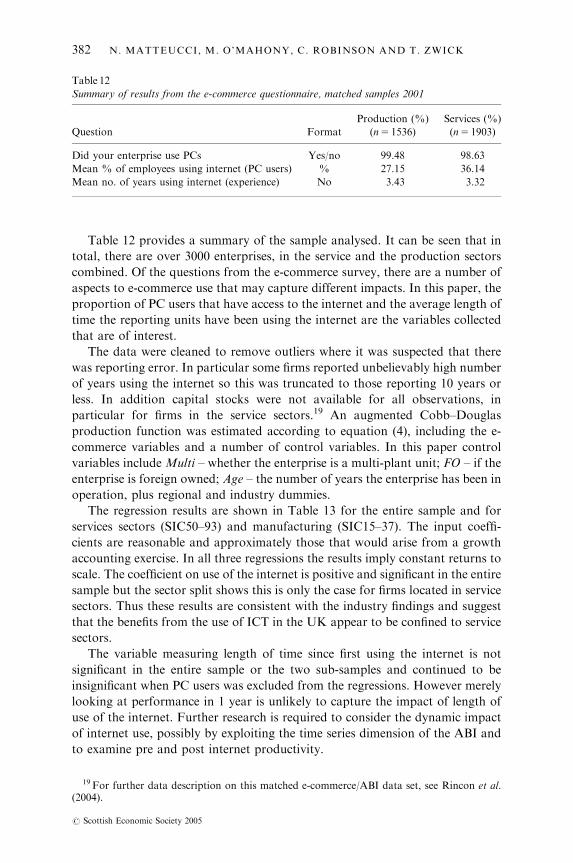
Table 12 provides a summary of the sample analysed. It can be seen that in
total, there are over 3000 enterprises, in the service and the production sectors
combined. Of the questions from the e-commerce survey, there are a number of
aspects to e-commerce use that may capture different impacts. In this paper, the
proportion of PC users that have access to the internet and the average length of
time the reporting units have been using the internet are the variables collected
that are of interest.
The data were cleaned to remove outliers where it was suspected that there
was reporting error. In particular some firms reported unbelievably high number
of years using the internet so this was truncated to those reporting 10 years or
less. In addition capital stocks were not available for all observations, in
particular for firms in the service sectors.19 An augmented Cobb–Douglas
production function was estimated according to equation (4), including the e-
commerce variables and a number of control variables. In this paper control
variables include Multi – whether the enterprise is a multi-plant unit; FO – if the
enterprise is foreign owned; Age – the number of years the enterprise has been in
operation, plus regional and industry dummies.
The regression results are shown in Table 13 for the entire sample and for
services sectors (SIC50–93) and manufacturing (SIC15–37). The input coeffi-
cients are reasonable and approximately those that would arise from a growth
accounting exercise. In all three regressions the results imply constant returns to
scale. The coefficient on use of the internet is positive and significant in the entire
sample but the sector split shows this is only the case for firms located in service
sectors. Thus these results are consistent with the industry findings and suggest
that the benefits from the use of ICT in the UK appear to be confined to service
sectors.
The variable measuring length of time since first using the internet is not
significant in the entire sample or the two sub-samples and continued to be
insignificant when PC users was excluded from the regressions. However merely
looking at performance in 1 year is unlikely to capture the impact of length of
use of the internet. Further research is required to consider the dynamic impact
of internet use, possibly by exploiting the time series dimension of the ABI and
to examine pre and post internet productivity.
Table 12
Summary of results from the e-commerce questionnaire, matched samples 2001
Question Format
Production (%)
(n5 1536)
Services (%)
(n5 1903)
Did your enterprise use PCs Yes/no 99.48 98.63
Mean % of employees using internet (PC users) % 27.15 36.14
Mean no. of years using internet (experience) No 3.43 3.32
19 For further data description on this matched e-commerce/ABI data set, see Rincon et al.(2004).
N. MATTEUCCI, M. O’MAHONY, C. ROBINSON AND T. ZWICK382
r Scottish Economic Society 2005

V Conclusions ^ ICTand productivity
This paper considered the impact of ICT on productivity in European countries,
using both industry and firm-level data. Both sources of information suggest
that there appear to be some productivity impacts from investment in ICT in all
three countries, but there is little evidence to suggest that these impacts are as yet
close to those found for the US. Of the European countries studied, the UK
experience is closest to the US, with both the industry- and firm-level evidence
pointing to a greater impact in services than in manufacturing. In contrast the
evidence presented suggests little evidence of a significant impact from ICT on
service sectors in the Continental European countries.
It is too early to tell if the lack of a US style payoff to ICT investment in
Europe is because of lagged adjustments given the earlier adoption of this
technology in the US or if the answer lies in the institutional framework facing
firms in Europe. The European country that appears to be performing best is the
UK which is generally regarded as one of the least regulated of the larger EU
countries. But there may also be other explanations, such as the rapid expansion
in higher education in the UK in the 1990s. In addition it should be recalled that
the UK productivity levels remain well below those in countries like France and
Germany so that the UK has had more scope for catch-up growth.
In Germany, ICT investments lead to a significant productivity increase for
several years in manufacturing, while the available evidence suggests service
establishments have not yet increased their VA by investing in ICT.
Acknowledgements
The authors gratefully acknowledge the financial contribution of the European
Commission (Research contract HPSE-CT-2001, Employment Prospects in the
Knowledge Economy-EPKE). We would like to thank our EPKE consortium
Table 13
Regression results, all firms, services and manufacturing, 2001
Services Manufacturing
Constant 1.427n (0.084) 1.351n (0.257) 1.385n (0.102)
Emp 0.263n (0.011) 0.290n (0.016) 0.229n (0.018)
Kap 0.116n (0.012) 0.147n (0.021) 0.093n (0.015)
Inter 0.633n (0.012) 0.582n (0.019) 0.678n (0.016)
Experience 0.003 (0.004) 0.002 (0.008) 0.005 (0.005)
PC users 0.090n (0.028) 0.131n (0.044) � 0.040 (0.037)
Age 0.008 (0.008) 0.016 (0.023) 0.007 (0.008)
Age2 � 0.002 (0.003) � 0.001 (0.031) � 0.002 (0.003)
Multi � 0.018 (0.020) � 0.021 (0.038) 0.001 (0.021)
FO 0.015 (0.018) � 0.001 (0.003) 0.034 (0.020)
No. of observations 2422 1150 1154
Standard errors in parentheses.nSignificant at the 5% level.Specifications include SSR region and two-digit industry dummies.
PRODUCTIVITY, WORKPLACE PERFORMANCE AND ICT 383
r Scottish Economic Society 2005

partners and specifically Francesco Venturini and Michela Vecchi for comments.
Thanks also to Lucy Stokes for assistance. Any errors are the responsibility of
the authors.
References
ATROSTIC, B. K. and NGUYEN, S. V. (2002). Computer networks and U.S. manufacturing plantproductivity: new evidence from the CNUS data. CES-WP-02-01, January 2002.
ATROSTIC, B. K. and NGUYEN, S. V. (2004). IT and productivity in US manufacturing: docomputer networks matter? Mimeo, US Census Bureau.
BAILY, M. N., HULTEN, C. and CAMPBELL, D. (1992). Productivity dynamics in manufacturingplants. Brookings Papers on Economic Activity: Microeconomics, pp. 187–249.
BASSENETTI, A., IOMMI, M., JONA-LASINO, C. and ZOLLINA, F. (2004). La Crescitadell’Economia Italiana negli Anni Novanta tra Ritardo Tecnologico e Rallentamentodella Produttivita, Temi di Discussione, Bank of Italy, forthcoming.
BARTELSMAN, E. and DOMS, M. (2000). Understanding productivity: lessons from longitudinalmicro datasets. Journal of Economic Literature, 38, pp. 569–954.
BEAUDRY, P. and GREEN, D. (2005). Changes in US wages 1976–2000, on going skill bias ormajor technological change. Journal of Labour Economics, forthcoming.
BERTSCHEK, I. and KAISER, U. (2004). Productivity effects of organizational change:microeconometric evidence. Management Science, 50, pp. 394–404.
BLACK, S. E. and LYNCH, L. M. (2001). How to compete: the impact of workplace practices andinformation technology on productivity. The Review of Economics and Statistics, 83, 3,pp. 434–45.
BRESNAHAN, T., BRYNJOLFSSON, E. and HITT, L. (2002). Information technology, workplaceorganization and the demand for skilled labor: firm-level evidence. The Quarterly Journalof Economics, 117, 1, pp. 339–76.
BRYNJOLFSSON, E. and HITT, L. (1996). Paradox lost? Firm-level evidence on the returns toinformation systems. Management Science, 42, 4, pp. 541–58.
BRYNJOLFSSON, E. and HITT, L. (2000). Beyond computation: information technology,organizational transformation and business performance. Journal of Economic Perspec-tives, 14, pp. 23–48.
BRYNJOLFSSON, E. and HITT, L. (2003). Computing productivity: firm-level evidence. TheReview of Economics and Statistics, 85, 4, pp. 793–808.
CAPITALIA (2002). Indagine sulle imprese manifatturiere. Ottavo rapporto sull’industriaitaliana e sulla politica industriale (survey on manufacturing firms). December, Rome.
CLAYTON, T. and CRISCUOLO, C. (2002). Electronic commerce and business change. EconomicTrends, 583, pp. 62–9.
CLAYTON, T., CRISCUOLO, C., GOODRIDGE, P. and WALDRON, K. (2003). Enterprisee-commerce: measurement and impact. In OECD (ed.), The Economic Impact of ICT –Measurement, Evidence and Implications. Paris: OECD.
CLAYTON, T. and WALDRON, K. (2003). E-commerce adoption and business impact, a progressreport. Economic Trends, 591, pp. 33–40.
COLECCHIA, A. and SCHREYER, P. (2002). ICT investment and economic growth in the 1990s:is the United States a unique case? A comparative study of nine OECD countries. Reviewof Economic Dynamics, 5, pp. 408–42.
CRISCUOLO, C. and WALDRON, K. (2003). E-commerce and firm productivity. EconomicTrends, 600, pp. 52–7.
DAVID, P. (1990). The dynamo and the computer: an historical perspective on the modernproductivity paradox. American Economic Review, 80, 2, pp. 355–61.
GRILICHES, Z. (1995). R&D and productivity: econometric results and measurement issues. InP. Stoneman (ed.), Handbook of the Economics of Innovation and Technological Change.Oxford: Blackwell.
GRILICHES, Z. and LICHTENBERG, F. (1984). R&D and productivity growth at the industrylevel: is there still a relationship? In Z. Griliches (ed.), R&D, Patents, and Productivity.Chicago: The University of Chicago Press.
HALL, B. H. and MAIRESSE, J. (1995). Exploring the relationship between R&D andproductivity in French manufacturing firms. Journal of Econometrics, 65, pp. 263–93.
N. MATTEUCCI, M. O’MAHONY, C. ROBINSON AND T. ZWICK384
r Scottish Economic Society 2005
HARHOFF, D. (1998). R&D and productivity in German manufacturing firms. Economics ofInnovation and New Technologies, 6, pp. 29–49.
HARRIS, R. I. D. and DRINKWATER, S. (2000). UK plant and machinery capital stocks andplant closures. Oxford Bulletin of Economics and Statistics, 62, 2, pp. 243–65.
HEMPELL, T. (2005). What’s spurious? what’s real? Measuring the productivity impacts of ICTat the firm level. Empirical Economics, forthcoming.
HUBLER, O. and JIRJAHN, U. (2003). Works councils and collective bargaining in Germany:the impact on productivity and wages. Scottish Journal of Political Economy, 50, 4,pp. 471–91.
INKLAAR, R. C. and MCGUCKIN, R. (2003). Structural and cyclical performance. Chapter IV.In M. O’Mahony and B. Van Ark (eds.), EU Productivity and Competitiveness: AnIndustry Perspective. Can Europe Resume the Catching-Up Process? European Commis-sion, Enterprise Publications.
INKLAAR, R. C., O’MAHONY, M. and TIMMER, M. P. (2003). ICT and Europe’s productivityperformance, industry level growth accounting comparisons with the US. GGDCResearch Memorandum GD-68, Groningen Growth and Development Centre.
ISTAT (2001). Conti Economici delle Imprese (Survey on firms’ accounts), Year 1997, CollanaInformazioni, No.19, Rome.
JORGENSON, D. W., GALLOP, F. M. and FRAUMENI, B. (1987). Productivity and US EconomicGrowth. Cambridge, MA: Harvard University Press.
JORGENSON, D. W. and GRILICHES, Z. (1967). The explanation of productivity change. Reviewof Economic Studies, 34, pp. 249–83.
JORGENSON, D. and STIROH, K. (2000). Raising the speed limit: US economic growth in theinformation age. Brookings Papers on Economic Activity, 1, pp. 125–211.
LEHR, B. and LICHETNBERG, F. (1999). Information technology and its impact on productivity:firm-level evidence from government and private data sources, 1977–1993. CanadianJournal of Economics, 32, pp. 335–62.
LICHT, G. and MOCH, D. (1999). Innovation and information technology in services. CanadianJournal of Economics, 32, pp. 363–83.
MAIRESSE, J. and MONHEN, P. (2003). Econometrie de l’Innovation. In P. Mustar andH. Penan (eds.), Encyclopedie de l’Innovation. Paris: Economica.
MAIRESSE, J. and SASSENOU, M. (1991). R&D and productivity: a survey of econometricstudies at the firm level. NBER Working Paper No. 3666, March.
MATTEUCCI, N. and STERLACCHINI, A. (2004). ICT, R&D and productivity: evidence fromItalian manufacturing firms. Paper Presented at the Information Technology: Productivityand Growth Conference, 25 October 2004, London, available at http://www.niesr.ac.uk/epke/finalconf.html
MILANA, C. and ZELI, A. (2004). Productivity slowdown and the role of ICT in Italy: a firm-level analysis. In OECD (ed.), The Economic Impact of ICT – Measurement, Evidence andImplications. Paris: OECD.
OECD (2004). The Economic Impact of ICT – Measurement, Evidence and Implications. Paris:OECD.
OLINER, S. and SICHEL, D. (2000). The resurgence of growth in the late 1990s: is informationtechnology the story? Journal of Economic Perspectives, 14, 4, pp. 3–22.
OLINER, S. and SICHEL, D. (2002). Information technology and productivity: where are we nowand where are we going? Board of Governors of the Federal Reserve, Finance andEconomics Discussion Paper No. 2002-29.
OULTON, N. (2002). ICT and productivity growth in the United Kingdom. Oxford Review ofEconomic Policy, 18, 363–79.
O’MAHONY, M. and DEBOER, W. (2002). Britain’s relative productivity performance: hasanything changed? National Institute Economic Review, 179, 39–43.
O’MAHONY, M., ROBINSON, C. and VECCHI, M. (2004). The impact of ICT on the demand forskilled labour: a cross-country comparison. EPKE Working Paper, available at http://www.niesr.ac.uk/epke/working_papers.html
O’MAHONY, M. and VAN ARK, B. (2003). EU Productivity and Competitiveness: An IndustryPerspective. Can Europe Resume the Catching-Up Process? European Commission,Enterprise publications.
O’MAHONY, M. and VECCHI, M. (2005). Quantifying the impact of ICT capital on outputgrowth: a heterogeneous dynamic panel approach. Economica, forthcoming.
OSTERMAN, P. (1994). How common is workplace transformation and who adopts it? Industrialand Labor Relations Review, 47, pp. 173–88.
PRODUCTIVITY, WORKPLACE PERFORMANCE AND ICT 385
r Scottish Economic Society 2005
RINCON, A., ROBINSON, C. and VECCHI, M. (2004). The productivity impact of e-commerce inthe UK: evidence from microdata. NIESR Discussion Paper, forthcoming.
RINCON, A. and VECCHI, M. (2004). The dynamic impact of ICT spillovers on companies’productivity performance. NIESR Discussion Paper No. 245.
STIROH, K. J. (2002). Information technology and the US productivity revival: what do theindustry data say? American Economic Review, 92, 5, pp. 1559–76.
TIMMER, M. P., YPMA, G. and VAN ARK, B. (2003). IT in the European Union: DrivingProductivity Divergence? GGDC Research Memorandum GD-67, October 2003.
TRIPLETT, J. E. and BOSWORTH, B. P. (2003). Productivity measurement in service industries:‘Baumol’s disease’ has been cured. Federal Reserve Bank of New York Economic PolicyReview, 9, 3, pp. 23–33.
VAN ARK, B., MELKA, J., MULDER, N., TIMMER, M. P. and YPMA, G. (2002). ICT investmentand growth accounts for the European Union, 1980–2000. GGDC Research Memor-andum GD-56, Groningen Growth and Development Centre.
VENTURINI, F. (2004). The determinants of the Italian slowdown: what do the data say? EPKEWorking Paper, www.niesr.ac.uk/epke/working_papers.html
WOLF, E. and ZWICK, T. (2002). Reassessing the impact of high performance workplaces. ZEWDiscussion Paper 02-07, Mannheim.
ZWICK, T. (2003). The impact of ICT investment on establishment productivity. NationalInstitute Economic Review, 184, pp. 99–110.
ZWICK, T. (2004). Employee participation and productivity. Labour Economics, 11, 6,pp. 715–40.
ZWICK, T. (2005). Continuing vocational training forms and establishment productivity inGermany. German Economic Review, 6, 2, 155–184.
Date of receipt of final manuscript: 28 February 2005.
nThis work contains statistical data from ONS which is Crown copyright and
reproduced with the permission of the controller of HMSO and Queen’s Printer
for Scotland. The use of the ONS statistical data in this work does not imply the
endorsement of the ONS in relation to the interpretation or analysis of the
statistical data.
N. MATTEUCCI, M. O’MAHONY, C. ROBINSON AND T. ZWICK386
r Scottish Economic Society 2005