Productivity variation around the Crozet Plateau: A naturally iron fertilised area of the Southern...
12
Productivity variation around the Crozet Plateau: A naturally iron fertilised area of the Southern Ocean Maria T. Hernandez-Sanchez a, * , Hugh J. Venables b , Rachel A. Mills c , George Wolff d , Elizabeth H. Fisher d , Jens Holtvoeth d , Melanie J. Leng e , Richard D. Pancost a a Organic Geochemistry Unit, Bristol Biogeochemistry Research Centre, School of Chemistry, University of Bristol, Cantock’s Close, Bristol BS8 1TS, UK b Polar Oceans, British Antarctic Survey, High Cross, Madingley Road, Cambridge CB3 0ET, UK c School of Ocean and Earth Science, National Oceanography Centre, Southampton. European Way, Southampton SO14 3ZH, UK d Department of Earth and Ocean Sciences, University of Liverpool, 4, Brownlow Street, Liverpool L69 3GP, UK e NERC Isotope Geosciences Laboratory, British Geological Survey, Nottingham NG12 5GG, UK article info Article history: Received 29 July 2009 Received in revised form 27 January 2010 Accepted 15 May 2010 Available online 11 June 2010 abstract The Crozet Plateau is an area of interest as it is a region of the Southern Ocean where annual primary pro- ductivity is relatively high. We describe spatial and temporal variations in the biomarker distributions and carbon and nitrogen isotopic signatures of organic matter formed within surface waters around the plateau during an algal bloom. In the centre of the bloom, diatom-derived sterols dominate, whereas alkenones are relatively more abundant outside and at the edge of the bloom. Bulk organic d 13 C and d 15 N values are enriched inside the bloom area, ranging from 18.7‰ to 17.6‰ and +1.6‰ to +3.7‰, respec- tively, compared to 25.7‰ to 20.9‰ and 2.0‰ to +1.3‰, respectively, outside the bloom area. Variation in bulk d 15 N values is attributed primarily to NH 3 or dissolved organic N uptake, with only a minor contribution from Rayleigh fractionation of the NO 3 pool. Compound specific d 13 C values (cholest-5-en-3b-ol, cholesta-5,22-dien-3b-ol, 24-methylcholesta-5,22-dien-3b-ol, 24-methylcholesta- 24(28)-dien-3b-ol and alkenones) are also enriched in the Fe fertilised region relative to other areas, presumably reflecting higher phytoplankton growth rate, consumption of dissolved inorganic carbon and perhaps more intense use of carbon concentrating mechanisms. The observations confirm previous interpretations that Fe fertilisation in the Crozet region has affected nutrient utilisation and the algal community structure; it also suggests that lipid biomarkers and their d 13 C values record a specific bloom signature that may be recorded in underlying sediments. Ó 2010 Elsevier Ltd. All rights reserved. 1. Introduction The Southern Ocean is the largest high nutrient, low chlorophyll (HNLC) region in the modern ocean, with Fe limitation of primary production thought to be a major control on biogeochemical pro- cesses in the region (Frew et al., 2001; Gall et al., 2001). Dust input during the last glacial period is thought to have supplied bioavail- able Fe to the HNLC area, leading to higher productivity, enhanced macro-nutrient utilisation and atmospheric CO 2 drawdown (Brezinski et al., 2002). Thus, regions of natural Fe fertilisation are of interest as potential analogues for past Fe replete conditions. The region north of the Crozet Plateau (45–47°S, 49–51°E) is one such region in the Southern Ocean as it experiences an annual phytoplankton bloom initiated by relief of light limitation (Moore et al., 2007a,b; Venables et al., 2007) and a supply of Fe from the basaltic plateau to a deep winter mixed layer (Pollard et al., 2007; Planquette et al., 2007). The region has been the recent focus of an interdisciplinary surface ocean-to-sediment study (Pollard et al., 2007), with results showing an increase in phytoplankton productivity (Seeyave et al., 2007), uptake of inorganic C (Bakker et al., 2007) and NO 3 (Sanders et al., 2007) and enhanced C export inside the Fe fertilised region to the north of the plateau vs. the HNLC region to the south of the plateau (Pollard et al., 2009). Thus, comparison of waters north of the Crozet Plateau with surrounding HNLC regions provides an opportunity to evaluate the biogeochemical characteristics of Fe fertilised Southern Ocean waters, some of which could be preserved in sediments and used as tracers for past Fe fertilisation. In previous work (Hernandez et al., 2008), we concluded that biomarker distributions vary around the plateau and, in particular, that high productivity areas are characterised by a dominance of C 28 and C 27 sterols (likely sourced by diatoms). Here, we expand that preliminary work, by examining a wider range of biomarker and isotopic parameters, supplemented by scanning electron microscopy (SEM) observa- tions and by combining our interpretation with other datasets gen- erated during the CROZEX experiment (Pollard et al., 2007). 0146-6380/$ - see front matter Ó 2010 Elsevier Ltd. All rights reserved. doi:10.1016/j.orggeochem.2010.05.014 * Corresponding author. Tel.: +44 (0) 177 954 6395; fax: +44 (0) 117 925 1295. E-mail address: [email protected] (M.T. Hernandez- Sanchez). Organic Geochemistry 41 (2010) 767–778 Contents lists available at ScienceDirect Organic Geochemistry journal homepage: www.elsevier.com/locate/orggeochem
Transcript of Productivity variation around the Crozet Plateau: A naturally iron fertilised area of the Southern...
Organic Geochemistry 41 (2010) 767–778
Contents lists available at ScienceDirect
Organic Geochemistry
journal homepage: www.elsevier .com/locate /orggeochem
Productivity variation around the Crozet Plateau: A naturally iron fertilised areaof the Southern Ocean
Maria T. Hernandez-Sanchez a,*, Hugh J. Venables b, Rachel A. Mills c, George Wolff d, Elizabeth H. Fisher d,Jens Holtvoeth d, Melanie J. Leng e, Richard D. Pancost a
a Organic Geochemistry Unit, Bristol Biogeochemistry Research Centre, School of Chemistry, University of Bristol, Cantock’s Close, Bristol BS8 1TS, UKb Polar Oceans, British Antarctic Survey, High Cross, Madingley Road, Cambridge CB3 0ET, UKc School of Ocean and Earth Science, National Oceanography Centre, Southampton. European Way, Southampton SO14 3ZH, UKd Department of Earth and Ocean Sciences, University of Liverpool, 4, Brownlow Street, Liverpool L69 3GP, UKe NERC Isotope Geosciences Laboratory, British Geological Survey, Nottingham NG12 5GG, UK
a r t i c l e i n f o a b s t r a c t
Article history:Received 29 July 2009Received in revised form 27 January 2010Accepted 15 May 2010Available online 11 June 2010
0146-6380/$ - see front matter � 2010 Elsevier Ltd. Adoi:10.1016/j.orggeochem.2010.05.014
* Corresponding author. Tel.: +44 (0) 177 954 6395E-mail address: maite.hernandezsanchez@brist
Sanchez).
The Crozet Plateau is an area of interest as it is a region of the Southern Ocean where annual primary pro-ductivity is relatively high. We describe spatial and temporal variations in the biomarker distributionsand carbon and nitrogen isotopic signatures of organic matter formed within surface waters aroundthe plateau during an algal bloom. In the centre of the bloom, diatom-derived sterols dominate, whereasalkenones are relatively more abundant outside and at the edge of the bloom. Bulk organic d13C and d15Nvalues are enriched inside the bloom area, ranging from �18.7‰ to �17.6‰ and +1.6‰ to +3.7‰, respec-tively, compared to �25.7‰ to �20.9‰ and �2.0‰ to +1.3‰, respectively, outside the bloom area.Variation in bulk d15N values is attributed primarily to NH3 or dissolved organic N uptake, with only aminor contribution from Rayleigh fractionation of the NO�3 pool. Compound specific d13C values(cholest-5-en-3b-ol, cholesta-5,22-dien-3b-ol, 24-methylcholesta-5,22-dien-3b-ol, 24-methylcholesta-24(28)-dien-3b-ol and alkenones) are also enriched in the Fe fertilised region relative to other areas,presumably reflecting higher phytoplankton growth rate, consumption of dissolved inorganic carbonand perhaps more intense use of carbon concentrating mechanisms. The observations confirm previousinterpretations that Fe fertilisation in the Crozet region has affected nutrient utilisation and the algalcommunity structure; it also suggests that lipid biomarkers and their d13C values record a specific bloomsignature that may be recorded in underlying sediments.
� 2010 Elsevier Ltd. All rights reserved.
1. Introduction
The Southern Ocean is the largest high nutrient, low chlorophyll(HNLC) region in the modern ocean, with Fe limitation of primaryproduction thought to be a major control on biogeochemical pro-cesses in the region (Frew et al., 2001; Gall et al., 2001). Dust inputduring the last glacial period is thought to have supplied bioavail-able Fe to the HNLC area, leading to higher productivity, enhancedmacro-nutrient utilisation and atmospheric CO2 drawdown(Brezinski et al., 2002). Thus, regions of natural Fe fertilisationare of interest as potential analogues for past Fe replete conditions.
The region north of the Crozet Plateau (45–47�S, 49–51�E) isone such region in the Southern Ocean as it experiences an annualphytoplankton bloom initiated by relief of light limitation (Mooreet al., 2007a,b; Venables et al., 2007) and a supply of Fe from thebasaltic plateau to a deep winter mixed layer (Pollard et al.,
ll rights reserved.
; fax: +44 (0) 117 925 1295.ol.ac.uk (M.T. Hernandez-
2007; Planquette et al., 2007). The region has been the recent focusof an interdisciplinary surface ocean-to-sediment study (Pollardet al., 2007), with results showing an increase in phytoplanktonproductivity (Seeyave et al., 2007), uptake of inorganic C (Bakkeret al., 2007) and NO�3 (Sanders et al., 2007) and enhanced C exportinside the Fe fertilised region to the north of the plateau vs. theHNLC region to the south of the plateau (Pollard et al., 2009).
Thus, comparison of waters north of the Crozet Plateau withsurrounding HNLC regions provides an opportunity to evaluatethe biogeochemical characteristics of Fe fertilised Southern Oceanwaters, some of which could be preserved in sediments and usedas tracers for past Fe fertilisation. In previous work (Hernandezet al., 2008), we concluded that biomarker distributions varyaround the plateau and, in particular, that high productivity areasare characterised by a dominance of C28 and C27 sterols (likelysourced by diatoms). Here, we expand that preliminary work, byexamining a wider range of biomarker and isotopic parameters,supplemented by scanning electron microscopy (SEM) observa-tions and by combining our interpretation with other datasets gen-erated during the CROZEX experiment (Pollard et al., 2007).
768 M.T. Hernandez-Sanchez et al. / Organic Geochemistry 41 (2010) 767–778
Specifically, phytoplankton biomarker concentrations (C26–C30
sterols and alkenones), distributions and compound specific d13Cvalues and bulk organic d13C and d15N values have been deter-mined in suspended particulate organic matter (POM) collectedfrom the plateau surface water inside the Fe fertilised region andthe HNLC area south of the plateau. Specific objectives were to:(i) Determine if total phytoplankton biomarker (C26–C30 sterolsand alkenones) concentrations and distributions are significantlydifferent due to the effect of iron fertilisation, (ii) determine possi-ble sources of lipid biomarkers, utilising published observations ofthe occurrence of sterols and alkenones in phytoplankton and SEMobservations of filters and informed via previous observations ofCrozet phytoplankton community structure, and (iii) evaluate pos-sible factors controlling the isotopic composition of organic matter(OM) in this particular setting.
2. Methods
2.1. Setting and sampling
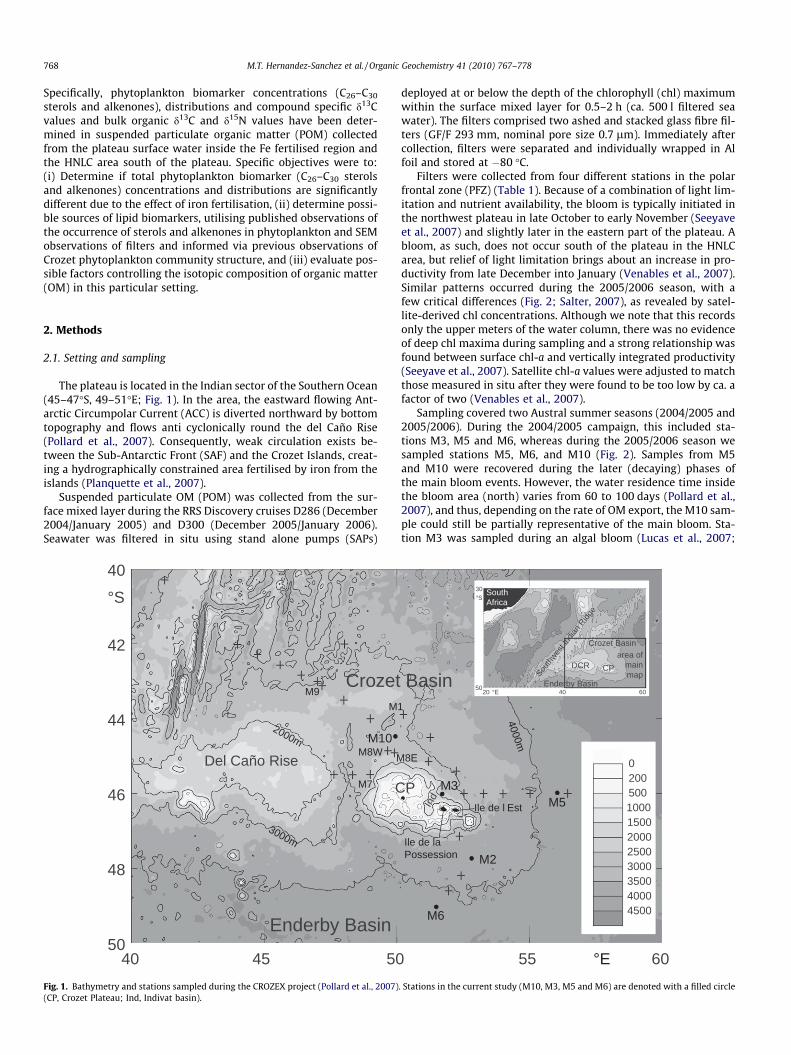
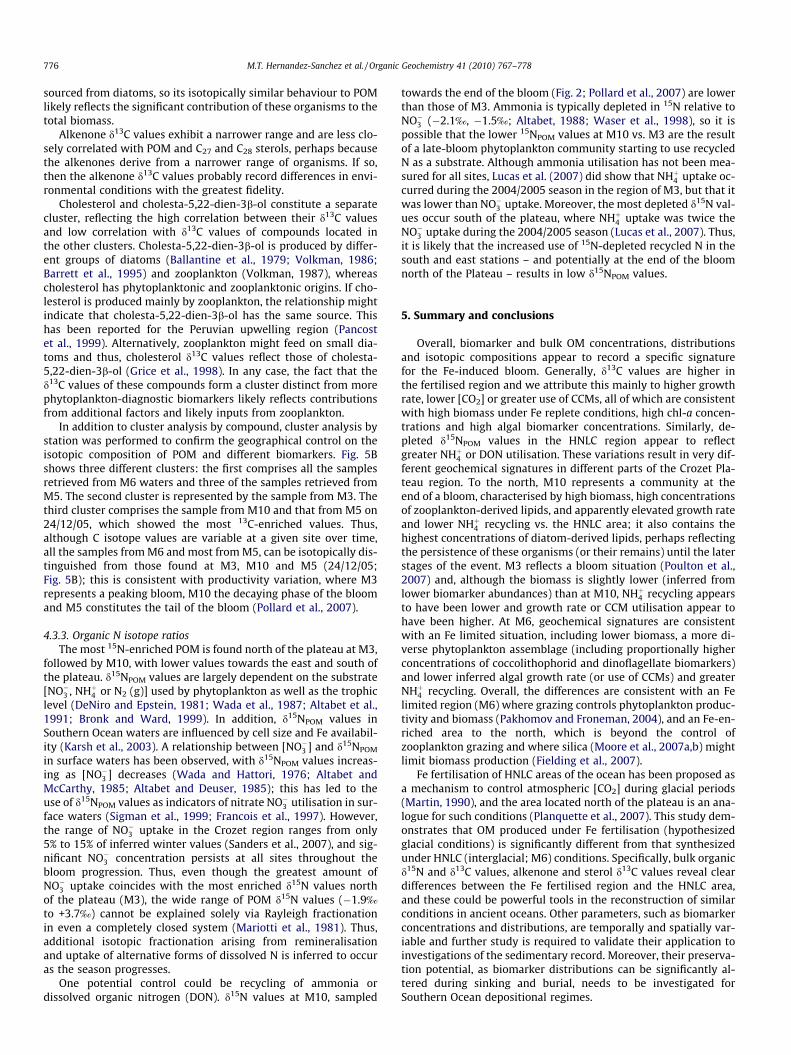
The plateau is located in the Indian sector of the Southern Ocean(45–47�S, 49–51�E; Fig. 1). In the area, the eastward flowing Ant-arctic Circumpolar Current (ACC) is diverted northward by bottomtopography and flows anti cyclonically round the del Caño Rise(Pollard et al., 2007). Consequently, weak circulation exists be-tween the Sub-Antarctic Front (SAF) and the Crozet Islands, creat-ing a hydrographically constrained area fertilised by iron from theislands (Planquette et al., 2007).
Suspended particulate OM (POM) was collected from the sur-face mixed layer during the RRS Discovery cruises D286 (December2004/January 2005) and D300 (December 2005/January 2006).Seawater was filtered in situ using stand alone pumps (SAPs)
M10
Del Caño Rise
C
Crozet
Enderby Basin
M8W M
M7
M1M9
50
48
46
44
42
40°S
504540
3000m
2000m
Fig. 1. Bathymetry and stations sampled during the CROZEX project (Pollard et al., 2007)(CP, Crozet Plateau; Ind, Indivat basin).
deployed at or below the depth of the chlorophyll (chl) maximumwithin the surface mixed layer for 0.5–2 h (ca. 500 l filtered seawater). The filters comprised two ashed and stacked glass fibre fil-ters (GF/F 293 mm, nominal pore size 0.7 lm). Immediately aftercollection, filters were separated and individually wrapped in Alfoil and stored at �80 �C.
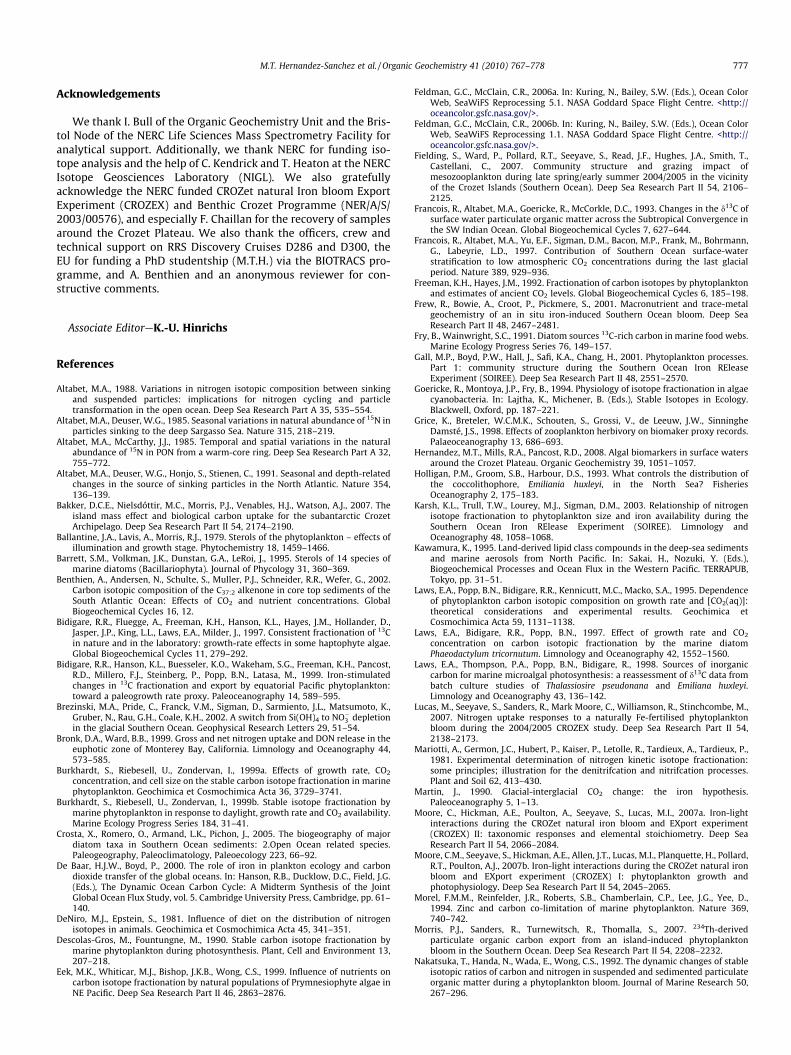
Filters were collected from four different stations in the polarfrontal zone (PFZ) (Table 1). Because of a combination of light lim-itation and nutrient availability, the bloom is typically initiated inthe northwest plateau in late October to early November (Seeyaveet al., 2007) and slightly later in the eastern part of the plateau. Abloom, as such, does not occur south of the plateau in the HNLCarea, but relief of light limitation brings about an increase in pro-ductivity from late December into January (Venables et al., 2007).Similar patterns occurred during the 2005/2006 season, with afew critical differences (Fig. 2; Salter, 2007), as revealed by satel-lite-derived chl concentrations. Although we note that this recordsonly the upper meters of the water column, there was no evidenceof deep chl maxima during sampling and a strong relationship wasfound between surface chl-a and vertically integrated productivity(Seeyave et al., 2007). Satellite chl-a values were adjusted to matchthose measured in situ after they were found to be too low by ca. afactor of two (Venables et al., 2007).
Sampling covered two Austral summer seasons (2004/2005 and2005/2006). During the 2004/2005 campaign, this included sta-tions M3, M5 and M6, whereas during the 2005/2006 season wesampled stations M5, M6, and M10 (Fig. 2). Samples from M5and M10 were recovered during the later (decaying) phases ofthe main bloom events. However, the water residence time insidethe bloom area (north) varies from 60 to 100 days (Pollard et al.,2007), and thus, depending on the rate of OM export, the M10 sam-ple could still be partially representative of the main bloom. Sta-tion M3 was sampled during an algal bloom (Lucas et al., 2007;
M2
M3M5
M6
Ile de l Est
Ile de laPossession
P
Basin
8E
Ind
6055 °E
4000m
020050010001500200025003000350040004500
20 060450
30 SouthAfrica
DCR CParea of
mainmap
°S
°E
Southw
est In
dian R
idge
Enderby Basin
Crozet Basin
. Stations in the current study (M10, M3, M5 and M6) are denoted with a filled circle
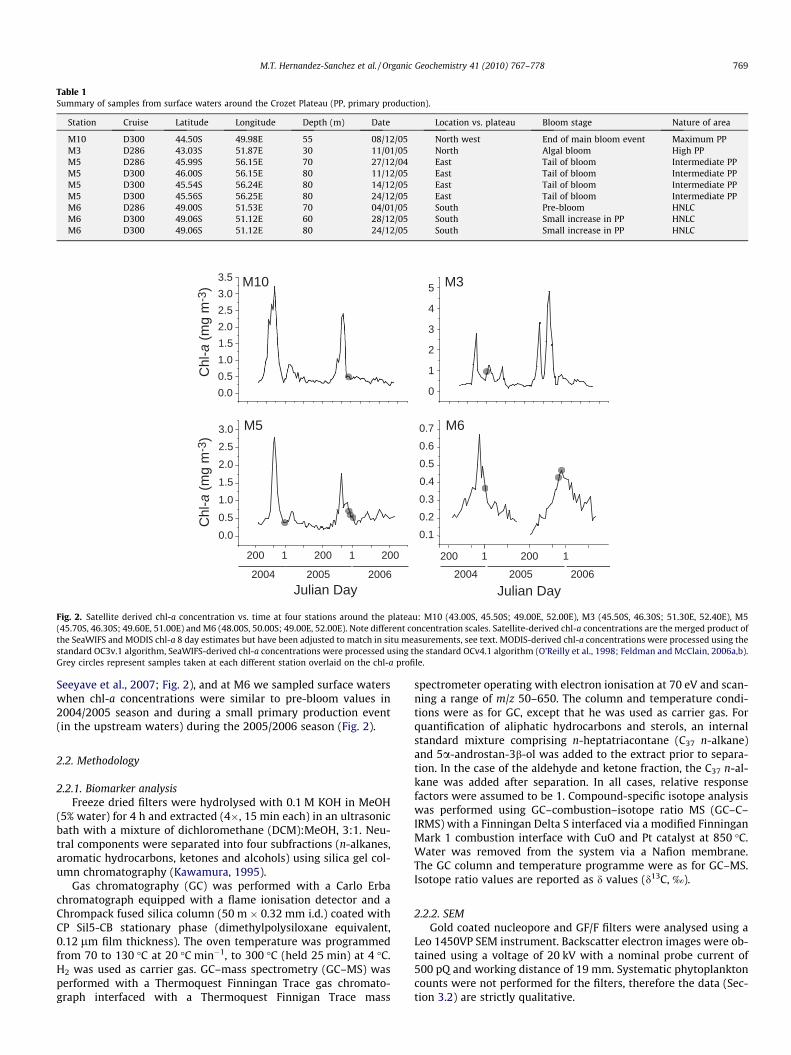
Table 1Summary of samples from surface waters around the Crozet Plateau (PP, primary production).
Station Cruise Latitude Longitude Depth (m) Date Location vs. plateau Bloom stage Nature of area
M10 D300 44.50S 49.98E 55 08/12/05 North west End of main bloom event Maximum PPM3 D286 43.03S 51.87E 30 11/01/05 North Algal bloom High PPM5 D286 45.99S 56.15E 70 27/12/04 East Tail of bloom Intermediate PPM5 D300 46.00S 56.15E 80 11/12/05 East Tail of bloom Intermediate PPM5 D300 45.54S 56.24E 80 14/12/05 East Tail of bloom Intermediate PPM5 D300 45.56S 56.25E 80 24/12/05 East Tail of bloom Intermediate PPM6 D286 49.00S 51.53E 70 04/01/05 South Pre-bloom HNLCM6 D300 49.06S 51.12E 60 28/12/05 South Small increase in PP HNLCM6 D300 49.06S 51.12E 80 24/12/05 South Small increase in PP HNLC
0.00.51.01.52.02.53.03.5 M10
0
1
2
3
4
5
0.00.51.01.52.02.53.0
0.10.20.30.40.50.60.7
M3
M5 M6
Chl
-a (m
g m
-3)
2004 2005 2006Julian Day
2004 2005 2006Julian Day
Chl
-a (m
g m
-3)
1 200 1 200200 2001 1200
Fig. 2. Satellite derived chl-a concentration vs. time at four stations around the plateau: M10 (43.00S, 45.50S; 49.00E, 52.00E), M3 (45.50S, 46.30S; 51.30E, 52.40E), M5(45.70S, 46.30S; 49.60E, 51.00E) and M6 (48.00S, 50.00S; 49.00E, 52.00E). Note different concentration scales. Satellite-derived chl-a concentrations are the merged product ofthe SeaWIFS and MODIS chl-a 8 day estimates but have been adjusted to match in situ measurements, see text. MODIS-derived chl-a concentrations were processed using thestandard OC3v.1 algorithm, SeaWIFS-derived chl-a concentrations were processed using the standard OCv4.1 algorithm (O’Reilly et al., 1998; Feldman and McClain, 2006a,b).Grey circles represent samples taken at each different station overlaid on the chl-a profile.
M.T. Hernandez-Sanchez et al. / Organic Geochemistry 41 (2010) 767–778 769
Seeyave et al., 2007; Fig. 2), and at M6 we sampled surface waterswhen chl-a concentrations were similar to pre-bloom values in2004/2005 season and during a small primary production event(in the upstream waters) during the 2005/2006 season (Fig. 2).
2.2. Methodology
2.2.1. Biomarker analysisFreeze dried filters were hydrolysed with 0.1 M KOH in MeOH
(5% water) for 4 h and extracted (4�, 15 min each) in an ultrasonicbath with a mixture of dichloromethane (DCM):MeOH, 3:1. Neu-tral components were separated into four subfractions (n-alkanes,aromatic hydrocarbons, ketones and alcohols) using silica gel col-umn chromatography (Kawamura, 1995).
Gas chromatography (GC) was performed with a Carlo Erbachromatograph equipped with a flame ionisation detector and aChrompack fused silica column (50 m � 0.32 mm i.d.) coated withCP Sil5-CB stationary phase (dimethylpolysiloxane equivalent,0.12 lm film thickness). The oven temperature was programmedfrom 70 to 130 �C at 20 �C min�1, to 300 �C (held 25 min) at 4 �C.H2 was used as carrier gas. GC–mass spectrometry (GC–MS) wasperformed with a Thermoquest Finningan Trace gas chromato-graph interfaced with a Thermoquest Finnigan Trace mass
spectrometer operating with electron ionisation at 70 eV and scan-ning a range of m/z 50–650. The column and temperature condi-tions were as for GC, except that he was used as carrier gas. Forquantification of aliphatic hydrocarbons and sterols, an internalstandard mixture comprising n-heptatriacontane (C37 n-alkane)and 5a-androstan-3b-ol was added to the extract prior to separa-tion. In the case of the aldehyde and ketone fraction, the C37 n-al-kane was added after separation. In all cases, relative responsefactors were assumed to be 1. Compound-specific isotope analysiswas performed using GC–combustion–isotope ratio MS (GC–C–IRMS) with a Finningan Delta S interfaced via a modified FinninganMark 1 combustion interface with CuO and Pt catalyst at 850 �C.Water was removed from the system via a Nafion membrane.The GC column and temperature programme were as for GC–MS.Isotope ratio values are reported as d values (d13C, ‰).
2.2.2. SEMGold coated nucleopore and GF/F filters were analysed using a
Leo 1450VP SEM instrument. Backscatter electron images were ob-tained using a voltage of 20 kV with a nominal probe current of500 pQ and working distance of 19 mm. Systematic phytoplanktoncounts were not performed for the filters, therefore the data (Sec-tion 3.2) are strictly qualitative.
770 M.T. Hernandez-Sanchez et al. / Organic Geochemistry 41 (2010) 767–778
2.2.3. Bulk organic isotopesThe d13C values of bulk OM were obtained using a Carlo Erba
1500 instrument on-line to a VG TripleTrap (plus secondary cryo-genic trap in the mass spectrometer), and Optima dual inlet massspectrometer. The d13C values were calculated to the V-PDB scaleusing an in-laboratory standard (BROC1) calibrated against NBS-19 and NBS-22 standards. Replicate analyses of homogenised sam-ples indicated a precision of ±<0.1‰ (1 SD). 15N/14N analyses werecarried out using a ThermoFinnigan system comprising an elemen-tal analyser linked under continuous flow with a Delta + XL massspectrometer. Isotope ratio values were calculated vs. atmosphericN2 by comparison with standards calibrated against IAEA-N-1 (as-sumed d15N, +0.4‰) and N-2 (assumed d15N, +20.3‰). Analyticalprecision was typically 60.3‰. Statistical analysis between d13Cvalues was performed using SPSS software via Pearson correlationthrough the average linkage between groups method.
3. Results
3.1. Biomarker concentrations and distributions
Total biomarker concentrations vary considerably around theCrozet region (Table 2). The highest values are observed at M10and M3, in the maximum productivity region, even though sam-
Table 2Abundance (ng l�1) of sterols and alkenones in surface waters north (M3 and M10), east
Compound (ng l�1) M5
27/12/04(70 m)
11/12/05(80 m)
14/12/05(80 m)
24/12(80 m
24-Norcholesta-5,22-dien-3b-ol (A) 23 20 3.1 1524-Norcholest-22-en-3b-ol (B) 0.97 2.8 0.33 1.6C27 sterol (E)a 1.6 3.5 0 0Cholesta-5,22-dien-3b-ol (D) 85 42 6.9 40.2Cholest-22-en-3b-ol (E) 2.5 3.4 0.55 4.1Cholest-5-en-3b-ol (F) 78 68 11 39Cholestan-3b-ol (G) 3.2 3.2 0.5 3.9C28 Sterol (H)a 0 0 0 0Cholesta-5,24-dien-3b-ol (I) 24 21 0 024-Methylcholesta-5,22-dien-3b-ol
(J)80 184 29 150
C27 sterol (K)a 6.6 0 0 024-Methylcholest-22-en-3b-ol (L) 0 12 1.2 7.424-Methylcholesta-5,24(28)-dien-
3b-ol (M)27 16 3.6 16
24-Methylcholest-24(28)-en-3b-ol(N)
0 0 0.9 0
24-Methylcholes-5-en-3b-ol (O) 2.6 4.4 0 3.923,24-Dimethylcholesta-5,22-dien-
3b-ol (P)3.5 5.4 0 0
24-Ethylcholest-5-en-3b-ol (Q) 11 8 1.2 7.724-Ethylcholesta-5,24(28)-dien-3b-
ol (R)8.7 12 1.8 0
24-Propylcholesta-5,24(28)-dien-3b-ol (S)
20 12 0.40 1.8
4,23,24-Trimethylcholest-22-en-3b-ol (T)
3.4 1.9 0.50 3.7
Total sterols 380 420 61 290C37:4 MeK 0 0.24 0.027 0.073C37:3 MeK 0 12 1.1 2.1C37:2 MeK 0 0.95 0.14 0.25C38:3 EtK 0 3.3 0.41 1.3C38:3 MeK 0 3.8 0.32 0.64C38:2 EtK 0 0 0.014 0C38:2 MeK 0 0 0.037 0Total alkenones 0 20.3 3.04 4.4Total 380 440 63 294
Uk37
0.050 0.089 0.075
Uk0
370.069 0.11 0.108
a Tentatively assigned monounsaturated sterol.
pling did not coincide with peak bloom conditions (M10). In theHNLC area (M6), concentrations are one to two orders of magni-tude lower. In the intermediate productivity area (M5), they arealso an order of magnitude lower than to the north, but do increasebetween mid and late December. In this section, concentrationsand variations in the distribution of specific biomarkers are dis-cussed in detail.
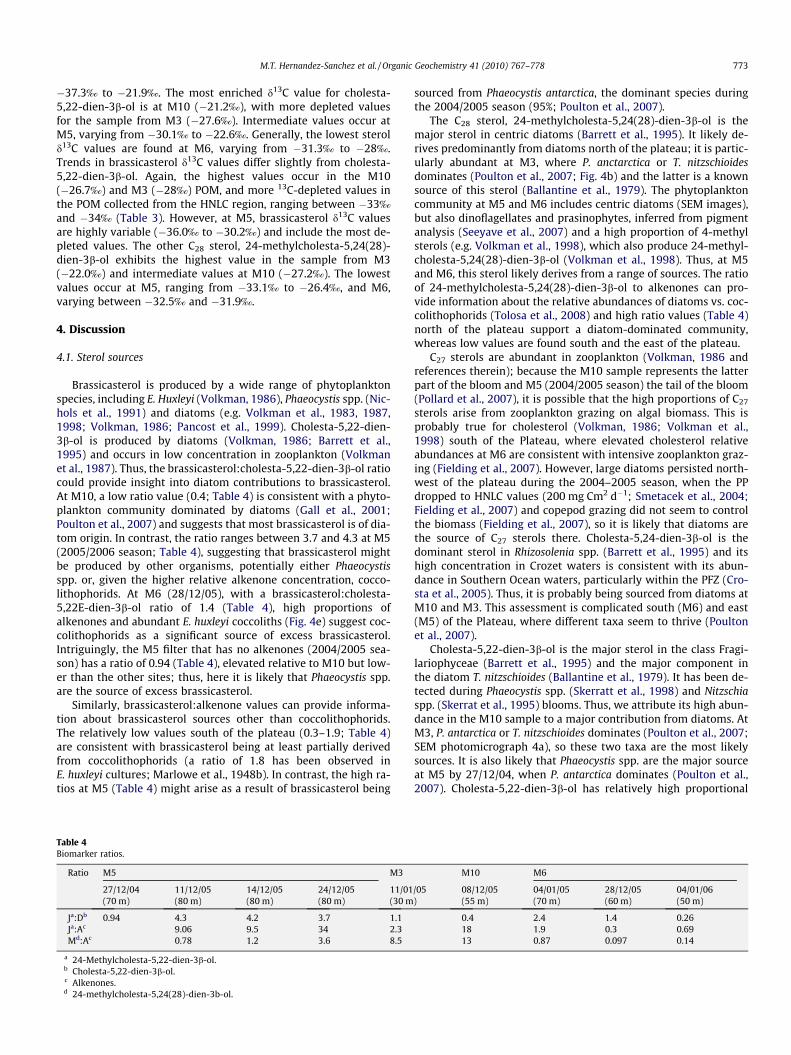
Although a wide range of C26–C30 sterols is present, the distribu-tion is dominated by C27 and C28 components. Specifically, 24-meth-ylcholesta-5,22-dien-3b-ol (brassicasterol; 13–730 ng l�1),cholesta-5,22-dien-3b-ol (6.9–1900 ng l�1), cholesta-5-en-3b-ol(4.9–2200 ng l�1) and 24-methylcholesta-5,24(28)-dien-3b-ol(3.6–540 ng l�1), dominate the distributions at most stations. Totalsterol concentrations are highest in the bloom area (M10) at 08/12/05, with a total of 8300 ng l�1, slightly lower (1200 ng l�1) inthe samples from M3 in 2004/2005 and 10 to 100 times lower atM5 and M6 (all time intervals). Brassicasterol concentration is alsohighest to the north of the plateau, at M10 (730 ng l�1) and M3(105 ng l�1), and lower to the east and south, ranging between29 ng l�1 (14/12/05) and 150 ng l�1 (24/12/05) at M5 and 13 ng l�1
(28/12/05) and 62 ng l�1 (04/01/05) at M6. Cholesta-5,22-dien-3b-ol is also abundant northwest of the plateau (1900 ng l�1), but muchless abundant to the north (95 ng l�1 at M3), east (from 6.9 to85 ng l�1 at M5) and south (9.4 increasing to 120 ng l�1 at M6). TheC29 (ethyl cholesterols) and C30 (propyl cholesterol) components ex-
(M5) and south (M6) of the Crozet Plateau.
M3 M10 M6
/05)
11/01/05(30 m)
08/12/05(55 m)
04/01/05(70 m)
28/12/05(60 m)
04/01/06(50 m)
63 340 15 3.1 280 29 0 0.18 05.3 0 3.9 0 095 1900 26 9.4 1203.5 91 0.88 0.70 0106 2200 50.5 4.9 120 67 0 0.5 8236 0 0 0 098 1600 40.4 0 0105 730 62 13 32
10.7 0 0 0 1900 62 2.5 1.07 0380 540 29 4.2 6.8
6.5 109 0 0 48
0 0 3.2 0.73 370 0 0 0 0
20 190 5.2 2.2 0140 310 68 4.8 27
59 84 23 2.1 41
26 44 3.5 0.72 31
1200 8300 330 48 6600.39 0.34 0.098 0.69 0.4428 20 21 31 264.1 2.5 1.9 1.3 1.074.2 12 3.6 0.81 118.08 5.3 6.8 9.3 7.20 0 0 0 0.200 0 0 0 0.07945 40.1 33 43 461240 8340 360 90 7050.11 0.093 0.077 0.016 0.022
0.12 0.11 0.081 0.037 0.039
M.T. Hernandez-Sanchez et al. / Organic Geochemistry 41 (2010) 767–778 771
hibit similar trends (Table 2), with maximum values at M10, fol-lowed by M3, and significantly lower abundances at M5 and M6.
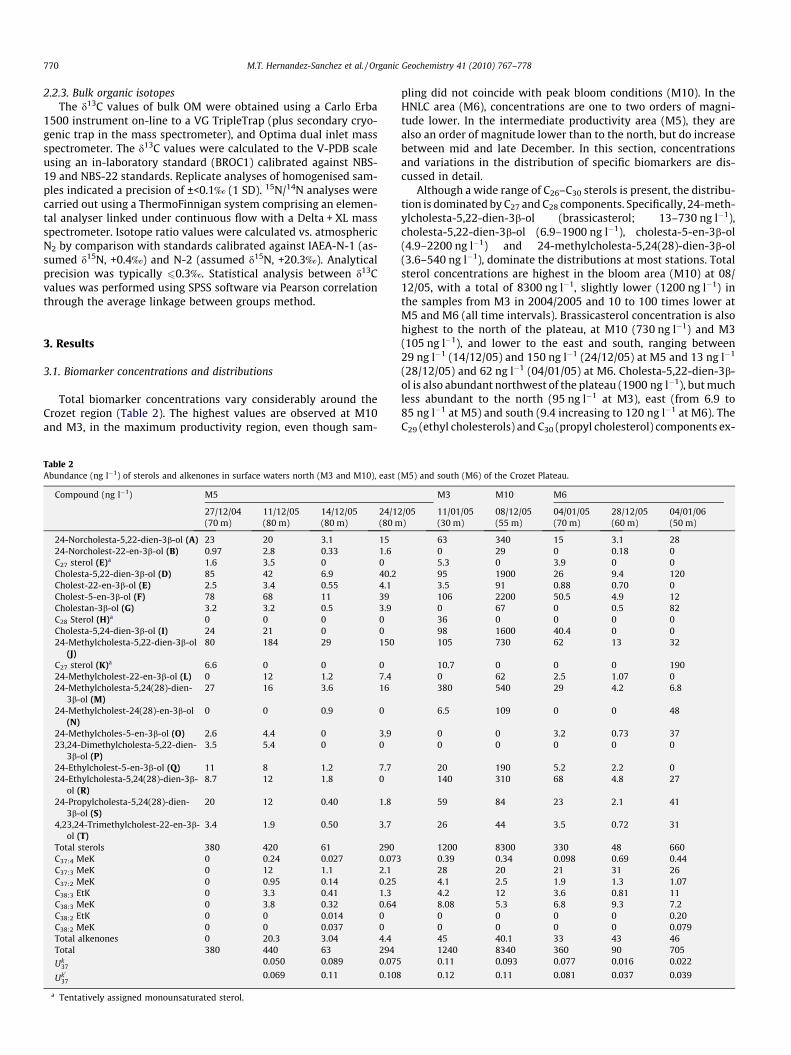
A striking characteristic of the sterol distribution is the domi-nance of brassicasterol, which constitutes 22% (27/12/04) to 50%(24/12/05) of the total sterols in the M5 samples, 19% (4/01/05)to 29% (4/01/06) at M6 and about 9% at M10 and M3 (Fig. 3). Therelative abundance of 24-methylcholesta-5,24(28)-dien-3b-ol islower than brassicasterol (normally <9%) and relatively constantbetween stations, with the exception of M3, where it constitutes33%. C27 sterols occur in high relative abundance in all samples,generally representing ca. 30% of the total sterols; however, atM10 and M5 (2004/2005 season) they represent 70% and 52% ofthe total, respectively. C26 sterols are present at every station,but their relative abundances are comparatively low. C29 sterolsare also present in low relative abundances in most samples. How-ever, they represent from 10% (4/01/06) to 22% (4/01/05) of the to-tal sterols. For the samples from M6 and comprise 14% at M3, asignificantly greater proportion than at M5 and M10. C30 sterolshave low relative abundances in all samples, except for those fromM3 and M6, where they constitute between 5% and 8% of the totalsterols. A higher proportional abundance of C30 sterols is also ob-served for the sample collected at M5 during the 2004/2005 sea-son, where it accounts for 6% of the total sterol composition.
C37 methyl ketones with two, three or four double bonds andC38 ethyl and methyl ketones with predominantly three doublebonds (alkenones) occur in all samples except that collected atM5 during the 2004/2005 season, which contains no alkenones.The summed concentration of the C37 methyl ketones ranges from1.2 to 34 ng l�1. C38 methyl ketone concentration ranges from 0.32to 9.4 ng l�1. These are lower than those of sterols at all four sites(Table 2), but show somewhat less variability; hence, their propor-
M5. 14 DecemberM5. 11 December 2005 440 ng l-1
ABDE
JL
NOQ
TSR
M
I
FG
C26sterolsC27 sterolsC28sterolsC29 sterolsC30sterolsAlkenones
% of total sterol compositio
ABDE
JL
NOQ
TSR
M
I
FG
M10. 8 DecembeM3. 11 January 2005
δ13C (%o)
1200 ng l-1
ABDE
JL
NOQ
TSR
M
I
FG
330 ng l-1M6. 28 DecemberM6. 4 January 2005
-20-22-24-26-28-30-32-34-36-38 -2-24-26-28-30-32-34-36-38
6050403020100 50403020100
Fig. 3. Relative abundance of algal biomarkers: north (M3 and M10), east (M5) and southsite (x axis represents %). Pie charts (right) display contribution of compound classes (Csterol plus alkenone concentrations. Black circles display sterol d13C values.
tional abundances change considerably relative to the sterols. AtM10, alkenones represent only 0.47% of the total quantified bio-markers, whereas at M3, M5 and M6, they represent a much largerproportion. At M5, relative abundances decrease from 4.9% in the14/12/05 sample to 1.4% in the 24/12/05 sample, as absolute con-centrations of both alkenones and sterols increase. At M6, alkenon-es constitute 9.1% of the total quantified biomarkers on 4/01/05and 6.5% of the total a year later (4/01/06); however, much higherproportional abundances (47%) occur in the 28/12/05 sample.
Uk37 values (Table 2) indicate sea surface temperatures (SSTs)
between �0.8 and 2.1 �C using the calibration of Prahl andWakeham (1987; Uk
37 ¼ 0:033T þ 0:043 for particulate matter andsediment trap material), whereas they indicate SST between 0.3and 6.4 �C using the calibration of Sikes and Volkman (1993;Uk0
37 ¼ 1=ð1þ e�0:22ðT�15:1Þ). The latter generally agree with, but areslightly lower than, temperatures measured directly during sam-pling (3–8 �C). Note that, in some cases, compound concentrationsare close to detection limits (Pelejero and Calvo, 2003) and forthese samples, temperature estimates should be interpreted morecautiously.
3.2. SEM
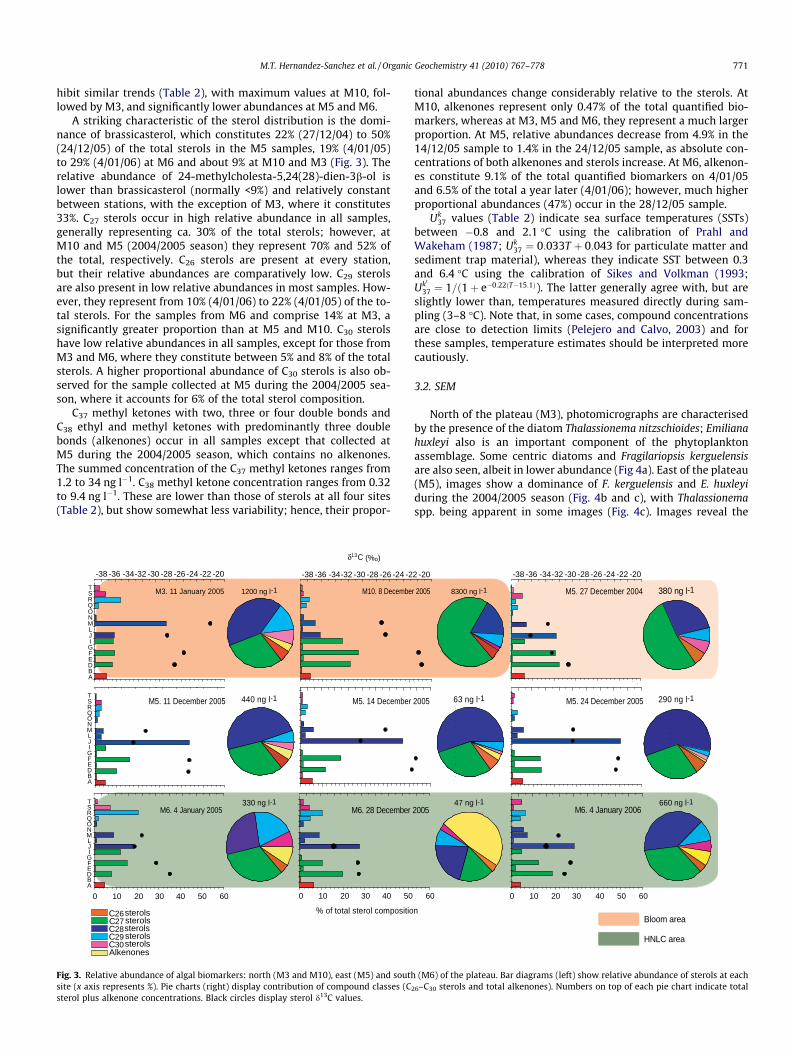
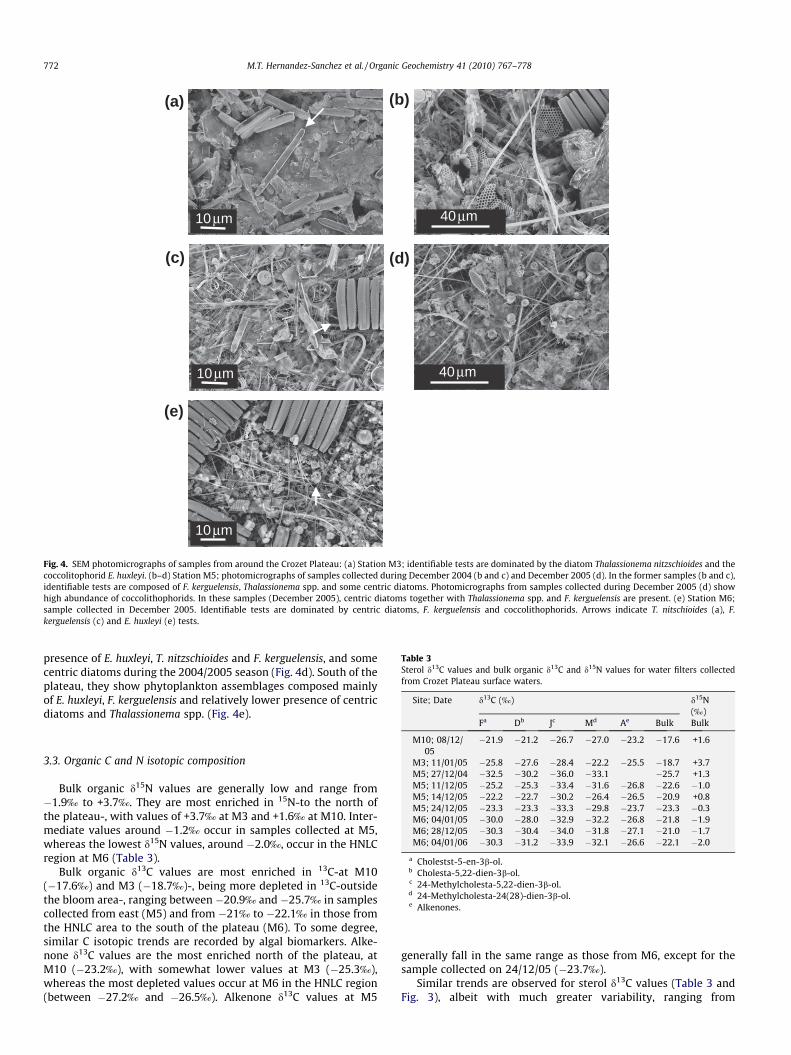
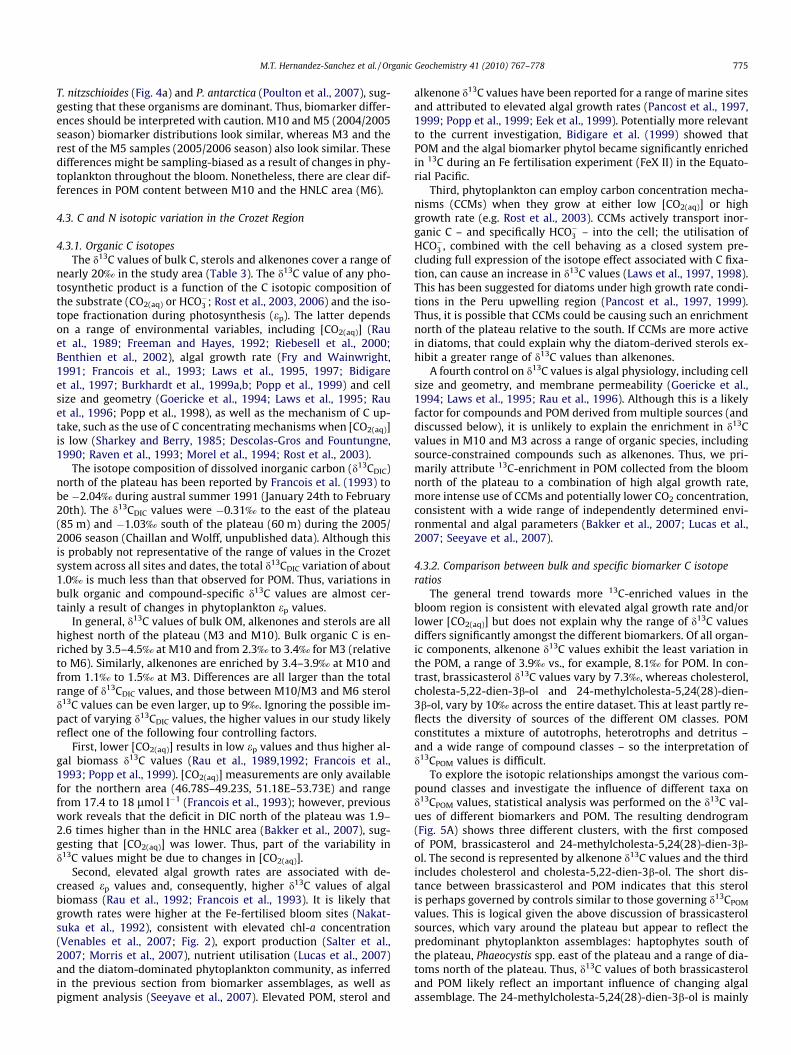
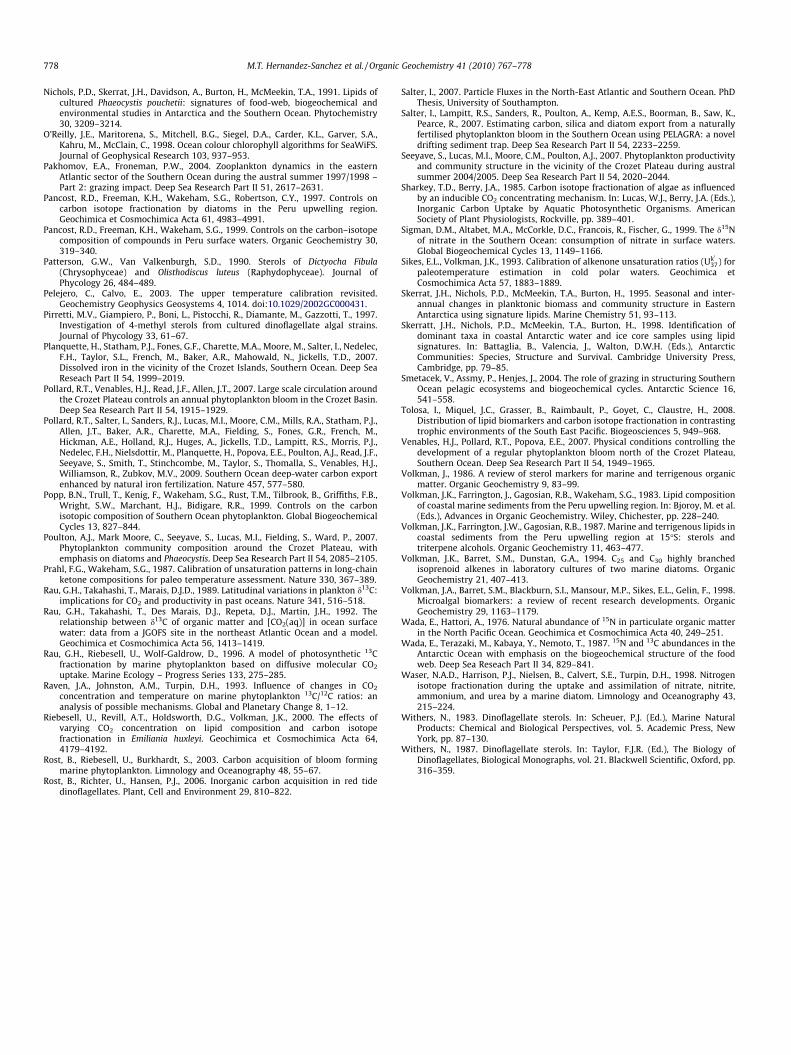
North of the plateau (M3), photomicrographs are characterisedby the presence of the diatom Thalassionema nitzschioides; Emilianahuxleyi also is an important component of the phytoplanktonassemblage. Some centric diatoms and Fragilariopsis kerguelensisare also seen, albeit in lower abundance (Fig 4a). East of the plateau(M5), images show a dominance of F. kerguelensis and E. huxleyiduring the 2004/2005 season (Fig. 4b and c), with Thalassionemaspp. being apparent in some images (Fig. 4c). Images reveal the
2005 M5. 24 December 2005
M5. 27 December 2004 380 ng l-1
63 ng l-1 290 ng l-1
n
r 2005 8300 ng l-1
200547 ng l-1
M6. 4 January 2006660 ng l-1
-202 -20-22-24-26-28-30-32-34-36-38
60 6050403020100
Bloom area
HNLC area
(M6) of the plateau. Bar diagrams (left) show relative abundance of sterols at each26–C30 sterols and total alkenones). Numbers on top of each pie chart indicate total
(a) (b)
(c) (d)
(e)
40μm
40μm
10μm
10μm
10μm
Fig. 4. SEM photomicrographs of samples from around the Crozet Plateau: (a) Station M3; identifiable tests are dominated by the diatom Thalassionema nitzschioides and thecoccolitophorid E. huxleyi. (b–d) Station M5; photomicrographs of samples collected during December 2004 (b and c) and December 2005 (d). In the former samples (b and c),identifiable tests are composed of F. kerguelensis, Thalassionema spp. and some centric diatoms. Photomicrographs from samples collected during December 2005 (d) showhigh abundance of coccolithophorids. In these samples (December 2005), centric diatoms together with Thalassionema spp. and F. kerguelensis are present. (e) Station M6;sample collected in December 2005. Identifiable tests are dominated by centric diatoms, F. kerguelensis and coccolithophorids. Arrows indicate T. nitschioides (a), F.kerguelensis (c) and E. huxleyi (e) tests.
Table 3Sterol d13C values and bulk organic d13C and d15N values for water filters collectedfrom Crozet Plateau surface waters.
Site; Date d13C (‰) d15N(‰)
a b c d e
772 M.T. Hernandez-Sanchez et al. / Organic Geochemistry 41 (2010) 767–778
presence of E. huxleyi, T. nitzschioides and F. kerguelensis, and somecentric diatoms during the 2004/2005 season (Fig. 4d). South of theplateau, they show phytoplankton assemblages composed mainlyof E. huxleyi, F. kerguelensis and relatively lower presence of centricdiatoms and Thalassionema spp. (Fig. 4e).
F D J M A Bulk Bulk
M10; 08/12/05
�21.9 �21.2 �26.7 �27.0 �23.2 �17.6 +1.6
M3; 11/01/05 �25.8 �27.6 �28.4 �22.2 �25.5 �18.7 +3.7M5; 27/12/04 �32.5 �30.2 �36.0 �33.1 �25.7 +1.3M5; 11/12/05 �25.2 �25.3 �33.4 �31.6 �26.8 �22.6 �1.0M5; 14/12/05 �22.2 �22.7 �30.2 �26.4 �26.5 �20.9 +0.8M5; 24/12/05 �23.3 �23.3 �33.3 �29.8 �23.7 �23.3 �0.3M6; 04/01/05 �30.0 �28.0 �32.9 �32.2 �26.8 �21.8 �1.9M6; 28/12/05 �30.3 �30.4 �34.0 �31.8 �27.1 �21.0 �1.7M6; 04/01/06 �30.3 �31.2 �33.9 �32.1 �26.6 �22.1 �2.0
a Cholestst-5-en-3b-ol.b Cholesta-5,22-dien-3b-ol.c 24-Methylcholesta-5,22-dien-3b-ol.d 24-Methylcholesta-24(28)-dien-3b-ol.e Alkenones.
3.3. Organic C and N isotopic composition
Bulk organic d15N values are generally low and range from�1.9‰ to +3.7‰. They are most enriched in 15N-to the north ofthe plateau-, with values of +3.7‰ at M3 and +1.6‰ at M10. Inter-mediate values around �1.2‰ occur in samples collected at M5,whereas the lowest d15N values, around �2.0‰, occur in the HNLCregion at M6 (Table 3).
Bulk organic d13C values are most enriched in 13C-at M10(�17.6‰) and M3 (�18.7‰)-, being more depleted in 13C-outsidethe bloom area-, ranging between �20.9‰ and �25.7‰ in samplescollected from east (M5) and from �21‰ to �22.1‰ in those fromthe HNLC area to the south of the plateau (M6). To some degree,similar C isotopic trends are recorded by algal biomarkers. Alke-none d13C values are the most enriched north of the plateau, atM10 (�23.2‰), with somewhat lower values at M3 (�25.3‰),whereas the most depleted values occur at M6 in the HNLC region(between �27.2‰ and �26.5‰). Alkenone d13C values at M5
generally fall in the same range as those from M6, except for thesample collected on 24/12/05 (�23.7‰).
Similar trends are observed for sterol d13C values (Table 3 andFig. 3), albeit with much greater variability, ranging from
M.T. Hernandez-Sanchez et al. / Organic Geochemistry 41 (2010) 767–778 773
�37.3‰ to �21.9‰. The most enriched d13C value for cholesta-5,22-dien-3b-ol is at M10 (�21.2‰), with more depleted valuesfor the sample from M3 (�27.6‰). Intermediate values occur atM5, varying from �30.1‰ to �22.6‰. Generally, the lowest sterold13C values are found at M6, varying from �31.3‰ to �28‰.Trends in brassicasterol d13C values differ slightly from cholesta-5,22-dien-3b-ol. Again, the highest values occur in the M10(�26.7‰) and M3 (�28‰) POM, and more 13C-depleted values inthe POM collected from the HNLC region, ranging between �33‰
and �34‰ (Table 3). However, at M5, brassicasterol d13C valuesare highly variable (�36.0‰ to �30.2‰) and include the most de-pleted values. The other C28 sterol, 24-methylcholesta-5,24(28)-dien-3b-ol exhibits the highest value in the sample from M3(�22.0‰) and intermediate values at M10 (�27.2‰). The lowestvalues occur at M5, ranging from �33.1‰ to �26.4‰, and M6,varying between �32.5‰ and �31.9‰.
4. Discussion
4.1. Sterol sources
Brassicasterol is produced by a wide range of phytoplanktonspecies, including E. Huxleyi (Volkman, 1986), Phaeocystis spp. (Nic-hols et al., 1991) and diatoms (e.g. Volkman et al., 1983, 1987,1998; Volkman, 1986; Pancost et al., 1999). Cholesta-5,22-dien-3b-ol is produced by diatoms (Volkman, 1986; Barrett et al.,1995) and occurs in low concentration in zooplankton (Volkmanet al., 1987). Thus, the brassicasterol:cholesta-5,22-dien-3b-ol ratiocould provide insight into diatom contributions to brassicasterol.At M10, a low ratio value (0.4; Table 4) is consistent with a phyto-plankton community dominated by diatoms (Gall et al., 2001;Poulton et al., 2007) and suggests that most brassicasterol is of dia-tom origin. In contrast, the ratio ranges between 3.7 and 4.3 at M5(2005/2006 season; Table 4), suggesting that brassicasterol mightbe produced by other organisms, potentially either Phaeocystisspp. or, given the higher relative alkenone concentration, cocco-lithophorids. At M6 (28/12/05), with a brassicasterol:cholesta-5,22E-dien-3b-ol ratio of 1.4 (Table 4), high proportions ofalkenones and abundant E. huxleyi coccoliths (Fig. 4e) suggest coc-colithophorids as a significant source of excess brassicasterol.Intriguingly, the M5 filter that has no alkenones (2004/2005 sea-son) has a ratio of 0.94 (Table 4), elevated relative to M10 but low-er than the other sites; thus, here it is likely that Phaeocystis spp.are the source of excess brassicasterol.
Similarly, brassicasterol:alkenone values can provide informa-tion about brassicasterol sources other than coccolithophorids.The relatively low values south of the plateau (0.3–1.9; Table 4)are consistent with brassicasterol being at least partially derivedfrom coccolithophorids (a ratio of 1.8 has been observed inE. huxleyi cultures; Marlowe et al., 1948b). In contrast, the high ra-tios at M5 (Table 4) might arise as a result of brassicasterol being
Table 4Biomarker ratios.
Ratio M5 M3
27/12/04(70 m)
11/12/05(80 m)
14/12/05(80 m)
24/12/05(80 m)
11/01(30 m
Ja:Db 0.94 4.3 4.2 3.7 1.1Ja:Ac 9.06 9.5 34 2.3Md:Ac 0.78 1.2 3.6 8.5
a 24-Methylcholesta-5,22-dien-3b-ol.b Cholesta-5,22-dien-3b-ol.c Alkenones.d 24-methylcholesta-5,24(28)-dien-3b-ol.
sourced from Phaeocystis antarctica, the dominant species duringthe 2004/2005 season (95%; Poulton et al., 2007).
The C28 sterol, 24-methylcholesta-5,24(28)-dien-3b-ol is themajor sterol in centric diatoms (Barrett et al., 1995). It likely de-rives predominantly from diatoms north of the plateau; it is partic-ularly abundant at M3, where P. anctarctica or T. nitzschioidesdominates (Poulton et al., 2007; Fig. 4b) and the latter is a knownsource of this sterol (Ballantine et al., 1979). The phytoplanktoncommunity at M5 and M6 includes centric diatoms (SEM images),but also dinoflagellates and prasinophytes, inferred from pigmentanalysis (Seeyave et al., 2007) and a high proportion of 4-methylsterols (e.g. Volkman et al., 1998), which also produce 24-methyl-cholesta-5,24(28)-dien-3b-ol (Volkman et al., 1998). Thus, at M5and M6, this sterol likely derives from a range of sources. The ratioof 24-methylcholesta-5,24(28)-dien-3b-ol to alkenones can pro-vide information about the relative abundances of diatoms vs. coc-colithophorids (Tolosa et al., 2008) and high ratio values (Table 4)north of the plateau support a diatom-dominated community,whereas low values are found south and the east of the plateau.
C27 sterols are abundant in zooplankton (Volkman, 1986 andreferences therein); because the M10 sample represents the latterpart of the bloom and M5 (2004/2005 season) the tail of the bloom(Pollard et al., 2007), it is possible that the high proportions of C27
sterols arise from zooplankton grazing on algal biomass. This isprobably true for cholesterol (Volkman, 1986; Volkman et al.,1998) south of the Plateau, where elevated cholesterol relativeabundances at M6 are consistent with intensive zooplankton graz-ing (Fielding et al., 2007). However, large diatoms persisted north-west of the plateau during the 2004–2005 season, when the PPdropped to HNLC values (200 mg Cm2 d�1; Smetacek et al., 2004;Fielding et al., 2007) and copepod grazing did not seem to controlthe biomass (Fielding et al., 2007), so it is likely that diatoms arethe source of C27 sterols there. Cholesta-5,24-dien-3b-ol is thedominant sterol in Rhizosolenia spp. (Barrett et al., 1995) and itshigh concentration in Crozet waters is consistent with its abun-dance in Southern Ocean waters, particularly within the PFZ (Cro-sta et al., 2005). Thus, it is probably being sourced from diatoms atM10 and M3. This assessment is complicated south (M6) and east(M5) of the Plateau, where different taxa seem to thrive (Poultonet al., 2007).
Cholesta-5,22-dien-3b-ol is the major sterol in the class Fragi-lariophyceae (Barrett et al., 1995) and the major component inthe diatom T. nitzschioides (Ballantine et al., 1979). It has been de-tected during Phaeocystis spp. (Skerratt et al., 1998) and Nitzschiaspp. (Skerrat et al., 1995) blooms. Thus, we attribute its high abun-dance in the M10 sample to a major contribution from diatoms. AtM3, P. antarctica or T. nitzschioides dominates (Poulton et al., 2007;SEM photomicrograph 4a), so these two taxa are the most likelysources. It is also likely that Phaeocystis spp. are the major sourceat M5 by 27/12/04, when P. antarctica dominates (Poulton et al.,2007). Cholesta-5,22-dien-3b-ol has relatively high proportional
M10 M6
/05)
08/12/05(55 m)
04/01/05(70 m)
28/12/05(60 m)
04/01/06(50 m)
0.4 2.4 1.4 0.2618 1.9 0.3 0.6913 0.87 0.097 0.14
(A)
(B)
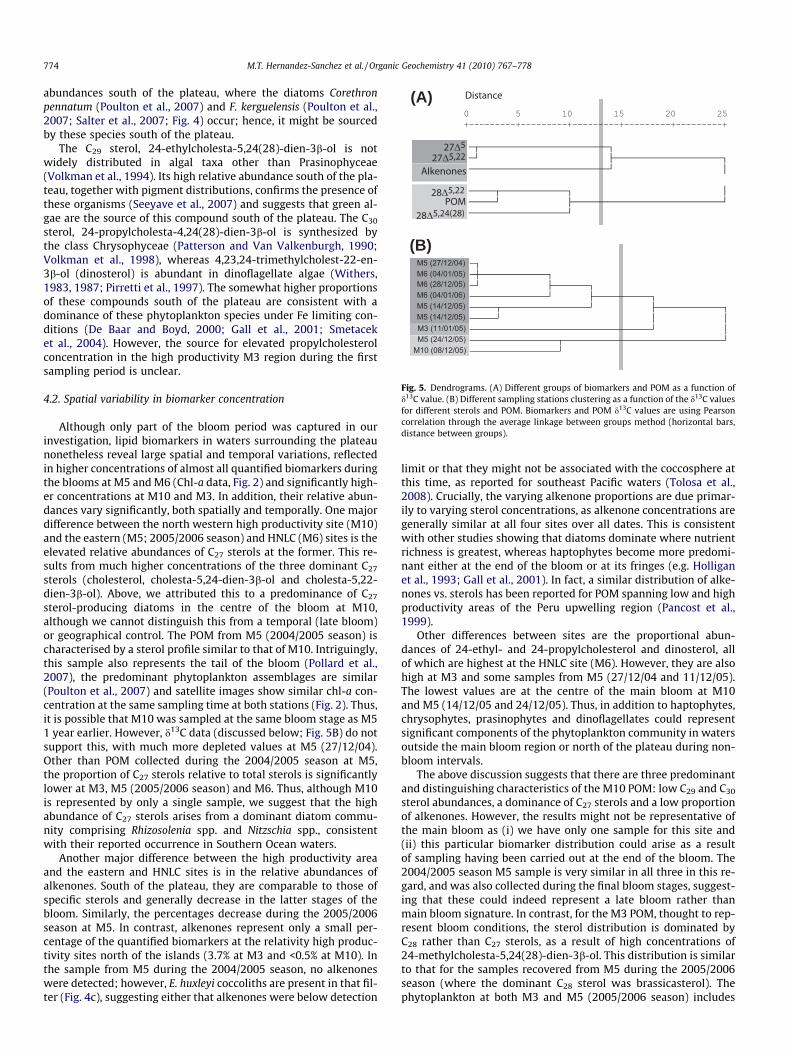
Fig. 5. Dendrograms. (A) Different groups of biomarkers and POM as a function ofd13C value. (B) Different sampling stations clustering as a function of the d13C valuesfor different sterols and POM. Biomarkers and POM d13C values are using Pearsoncorrelation through the average linkage between groups method (horizontal bars,distance between groups).
774 M.T. Hernandez-Sanchez et al. / Organic Geochemistry 41 (2010) 767–778
abundances south of the plateau, where the diatoms Corethronpennatum (Poulton et al., 2007) and F. kerguelensis (Poulton et al.,2007; Salter et al., 2007; Fig. 4) occur; hence, it might be sourcedby these species south of the plateau.
The C29 sterol, 24-ethylcholesta-5,24(28)-dien-3b-ol is notwidely distributed in algal taxa other than Prasinophyceae(Volkman et al., 1994). Its high relative abundance south of the pla-teau, together with pigment distributions, confirms the presence ofthese organisms (Seeyave et al., 2007) and suggests that green al-gae are the source of this compound south of the plateau. The C30
sterol, 24-propylcholesta-4,24(28)-dien-3b-ol is synthesized bythe class Chrysophyceae (Patterson and Van Valkenburgh, 1990;Volkman et al., 1998), whereas 4,23,24-trimethylcholest-22-en-3b-ol (dinosterol) is abundant in dinoflagellate algae (Withers,1983, 1987; Pirretti et al., 1997). The somewhat higher proportionsof these compounds south of the plateau are consistent with adominance of these phytoplankton species under Fe limiting con-ditions (De Baar and Boyd, 2000; Gall et al., 2001; Smetaceket al., 2004). However, the source for elevated propylcholesterolconcentration in the high productivity M3 region during the firstsampling period is unclear.
4.2. Spatial variability in biomarker concentration
Although only part of the bloom period was captured in ourinvestigation, lipid biomarkers in waters surrounding the plateaunonetheless reveal large spatial and temporal variations, reflectedin higher concentrations of almost all quantified biomarkers duringthe blooms at M5 and M6 (Chl-a data, Fig. 2) and significantly high-er concentrations at M10 and M3. In addition, their relative abun-dances vary significantly, both spatially and temporally. One majordifference between the north western high productivity site (M10)and the eastern (M5; 2005/2006 season) and HNLC (M6) sites is theelevated relative abundances of C27 sterols at the former. This re-sults from much higher concentrations of the three dominant C27
sterols (cholesterol, cholesta-5,24-dien-3b-ol and cholesta-5,22-dien-3b-ol). Above, we attributed this to a predominance of C27
sterol-producing diatoms in the centre of the bloom at M10,although we cannot distinguish this from a temporal (late bloom)or geographical control. The POM from M5 (2004/2005 season) ischaracterised by a sterol profile similar to that of M10. Intriguingly,this sample also represents the tail of the bloom (Pollard et al.,2007), the predominant phytoplankton assemblages are similar(Poulton et al., 2007) and satellite images show similar chl-a con-centration at the same sampling time at both stations (Fig. 2). Thus,it is possible that M10 was sampled at the same bloom stage as M51 year earlier. However, d13C data (discussed below; Fig. 5B) do notsupport this, with much more depleted values at M5 (27/12/04).Other than POM collected during the 2004/2005 season at M5,the proportion of C27 sterols relative to total sterols is significantlylower at M3, M5 (2005/2006 season) and M6. Thus, although M10is represented by only a single sample, we suggest that the highabundance of C27 sterols arises from a dominant diatom commu-nity comprising Rhizosolenia spp. and Nitzschia spp., consistentwith their reported occurrence in Southern Ocean waters.
Another major difference between the high productivity areaand the eastern and HNLC sites is in the relative abundances ofalkenones. South of the plateau, they are comparable to those ofspecific sterols and generally decrease in the latter stages of thebloom. Similarly, the percentages decrease during the 2005/2006season at M5. In contrast, alkenones represent only a small per-centage of the quantified biomarkers at the relativity high produc-tivity sites north of the islands (3.7% at M3 and <0.5% at M10). Inthe sample from M5 during the 2004/2005 season, no alkenoneswere detected; however, E. huxleyi coccoliths are present in that fil-ter (Fig. 4c), suggesting either that alkenones were below detection
limit or that they might not be associated with the coccosphere atthis time, as reported for southeast Pacific waters (Tolosa et al.,2008). Crucially, the varying alkenone proportions are due primar-ily to varying sterol concentrations, as alkenone concentrations aregenerally similar at all four sites over all dates. This is consistentwith other studies showing that diatoms dominate where nutrientrichness is greatest, whereas haptophytes become more predomi-nant either at the end of the bloom or at its fringes (e.g. Holliganet al., 1993; Gall et al., 2001). In fact, a similar distribution of alke-nones vs. sterols has been reported for POM spanning low and highproductivity areas of the Peru upwelling region (Pancost et al.,1999).
Other differences between sites are the proportional abun-dances of 24-ethyl- and 24-propylcholesterol and dinosterol, allof which are highest at the HNLC site (M6). However, they are alsohigh at M3 and some samples from M5 (27/12/04 and 11/12/05).The lowest values are at the centre of the main bloom at M10and M5 (14/12/05 and 24/12/05). Thus, in addition to haptophytes,chrysophytes, prasinophytes and dinoflagellates could representsignificant components of the phytoplankton community in watersoutside the main bloom region or north of the plateau during non-bloom intervals.
The above discussion suggests that there are three predominantand distinguishing characteristics of the M10 POM: low C29 and C30
sterol abundances, a dominance of C27 sterols and a low proportionof alkenones. However, the results might not be representative ofthe main bloom as (i) we have only one sample for this site and(ii) this particular biomarker distribution could arise as a resultof sampling having been carried out at the end of the bloom. The2004/2005 season M5 sample is very similar in all three in this re-gard, and was also collected during the final bloom stages, suggest-ing that these could indeed represent a late bloom rather thanmain bloom signature. In contrast, for the M3 POM, thought to rep-resent bloom conditions, the sterol distribution is dominated byC28 rather than C27 sterols, as a result of high concentrations of24-methylcholesta-5,24(28)-dien-3b-ol. This distribution is similarto that for the samples recovered from M5 during the 2005/2006season (where the dominant C28 sterol was brassicasterol). Thephytoplankton at both M3 and M5 (2005/2006 season) includes
M.T. Hernandez-Sanchez et al. / Organic Geochemistry 41 (2010) 767–778 775
T. nitzschioides (Fig. 4a) and P. antarctica (Poulton et al., 2007), sug-gesting that these organisms are dominant. Thus, biomarker differ-ences should be interpreted with caution. M10 and M5 (2004/2005season) biomarker distributions look similar, whereas M3 and therest of the M5 samples (2005/2006 season) also look similar. Thesedifferences might be sampling-biased as a result of changes in phy-toplankton throughout the bloom. Nonetheless, there are clear dif-ferences in POM content between M10 and the HNLC area (M6).
4.3. C and N isotopic variation in the Crozet Region
4.3.1. Organic C isotopesThe d13C values of bulk C, sterols and alkenones cover a range of
nearly 20‰ in the study area (Table 3). The d13C value of any pho-tosynthetic product is a function of the C isotopic composition ofthe substrate (CO2(aq) or HCO�3 ; Rost et al., 2003, 2006) and the iso-tope fractionation during photosynthesis (ep). The latter dependson a range of environmental variables, including [CO2(aq)] (Rauet al., 1989; Freeman and Hayes, 1992; Riebesell et al., 2000;Benthien et al., 2002), algal growth rate (Fry and Wainwright,1991; Francois et al., 1993; Laws et al., 1995, 1997; Bidigareet al., 1997; Burkhardt et al., 1999a,b; Popp et al., 1999) and cellsize and geometry (Goericke et al., 1994; Laws et al., 1995; Rauet al., 1996; Popp et al., 1998), as well as the mechanism of C up-take, such as the use of C concentrating mechanisms when [CO2(aq)]is low (Sharkey and Berry, 1985; Descolas-Gros and Fountungne,1990; Raven et al., 1993; Morel et al., 1994; Rost et al., 2003).
The isotope composition of dissolved inorganic carbon (d13CDIC)north of the plateau has been reported by Francois et al. (1993) tobe �2.04‰ during austral summer 1991 (January 24th to February20th). The d13CDIC values were �0.31‰ to the east of the plateau(85 m) and �1.03‰ south of the plateau (60 m) during the 2005/2006 season (Chaillan and Wolff, unpublished data). Although thisis probably not representative of the range of values in the Crozetsystem across all sites and dates, the total d13CDIC variation of about1.0‰ is much less than that observed for POM. Thus, variations inbulk organic and compound-specific d13C values are almost cer-tainly a result of changes in phytoplankton ep values.
In general, d13C values of bulk OM, alkenones and sterols are allhighest north of the plateau (M3 and M10). Bulk organic C is en-riched by 3.5–4.5‰ at M10 and from 2.3‰ to 3.4‰ for M3 (relativeto M6). Similarly, alkenones are enriched by 3.4–3.9‰ at M10 andfrom 1.1‰ to 1.5‰ at M3. Differences are all larger than the totalrange of d13CDIC values, and those between M10/M3 and M6 sterold13C values can be even larger, up to 9‰. Ignoring the possible im-pact of varying d13CDIC values, the higher values in our study likelyreflect one of the following four controlling factors.
First, lower [CO2(aq)] results in low ep values and thus higher al-gal biomass d13C values (Rau et al., 1989,1992; Francois et al.,1993; Popp et al., 1999). [CO2(aq)] measurements are only availablefor the northern area (46.78S–49.23S, 51.18E–53.73E) and rangefrom 17.4 to 18 lmol l�1 (Francois et al., 1993); however, previouswork reveals that the deficit in DIC north of the plateau was 1.9–2.6 times higher than in the HNLC area (Bakker et al., 2007), sug-gesting that [CO2(aq)] was lower. Thus, part of the variability ind13C values might be due to changes in [CO2(aq)].
Second, elevated algal growth rates are associated with de-creased ep values and, consequently, higher d13C values of algalbiomass (Rau et al., 1992; Francois et al., 1993). It is likely thatgrowth rates were higher at the Fe-fertilised bloom sites (Nakat-suka et al., 1992), consistent with elevated chl-a concentration(Venables et al., 2007; Fig. 2), export production (Salter et al.,2007; Morris et al., 2007), nutrient utilisation (Lucas et al., 2007)and the diatom-dominated phytoplankton community, as inferredin the previous section from biomarker assemblages, as well aspigment analysis (Seeyave et al., 2007). Elevated POM, sterol and
alkenone d13C values have been reported for a range of marine sitesand attributed to elevated algal growth rates (Pancost et al., 1997,1999; Popp et al., 1999; Eek et al., 1999). Potentially more relevantto the current investigation, Bidigare et al. (1999) showed thatPOM and the algal biomarker phytol became significantly enrichedin 13C during an Fe fertilisation experiment (FeX II) in the Equato-rial Pacific.
Third, phytoplankton can employ carbon concentration mecha-nisms (CCMs) when they grow at either low [CO2(aq)] or highgrowth rate (e.g. Rost et al., 2003). CCMs actively transport inor-ganic C – and specifically HCO�3 – into the cell; the utilisation ofHCO�3 , combined with the cell behaving as a closed system pre-cluding full expression of the isotope effect associated with C fixa-tion, can cause an increase in d13C values (Laws et al., 1997, 1998).This has been suggested for diatoms under high growth rate condi-tions in the Peru upwelling region (Pancost et al., 1997, 1999).Thus, it is possible that CCMs could be causing such an enrichmentnorth of the plateau relative to the south. If CCMs are more activein diatoms, that could explain why the diatom-derived sterols ex-hibit a greater range of d13C values than alkenones.
A fourth control on d13C values is algal physiology, including cellsize and geometry, and membrane permeability (Goericke et al.,1994; Laws et al., 1995; Rau et al., 1996). Although this is a likelyfactor for compounds and POM derived from multiple sources (anddiscussed below), it is unlikely to explain the enrichment in d13Cvalues in M10 and M3 across a range of organic species, includingsource-constrained compounds such as alkenones. Thus, we pri-marily attribute 13C-enrichment in POM collected from the bloomnorth of the plateau to a combination of high algal growth rate,more intense use of CCMs and potentially lower CO2 concentration,consistent with a wide range of independently determined envi-ronmental and algal parameters (Bakker et al., 2007; Lucas et al.,2007; Seeyave et al., 2007).
4.3.2. Comparison between bulk and specific biomarker C isotoperatios
The general trend towards more 13C-enriched values in thebloom region is consistent with elevated algal growth rate and/orlower [CO2(aq)] but does not explain why the range of d13C valuesdiffers significantly amongst the different biomarkers. Of all organ-ic components, alkenone d13C values exhibit the least variation inthe POM, a range of 3.9‰ vs., for example, 8.1‰ for POM. In con-trast, brassicasterol d13C values vary by 7.3‰, whereas cholesterol,cholesta-5,22-dien-3b-ol and 24-methylcholesta-5,24(28)-dien-3b-ol, vary by 10‰ across the entire dataset. This at least partly re-flects the diversity of sources of the different OM classes. POMconstitutes a mixture of autotrophs, heterotrophs and detritus –and a wide range of compound classes – so the interpretation ofd13CPOM values is difficult.
To explore the isotopic relationships amongst the various com-pound classes and investigate the influence of different taxa ond13CPOM values, statistical analysis was performed on the d13C val-ues of different biomarkers and POM. The resulting dendrogram(Fig. 5A) shows three different clusters, with the first composedof POM, brassicasterol and 24-methylcholesta-5,24(28)-dien-3b-ol. The second is represented by alkenone d13C values and the thirdincludes cholesterol and cholesta-5,22-dien-3b-ol. The short dis-tance between brassicasterol and POM indicates that this sterolis perhaps governed by controls similar to those governing d13CPOM
values. This is logical given the above discussion of brassicasterolsources, which vary around the plateau but appear to reflect thepredominant phytoplankton assemblages: haptophytes south ofthe plateau, Phaeocystis spp. east of the plateau and a range of dia-toms north of the plateau. Thus, d13C values of both brassicasteroland POM likely reflect an important influence of changing algalassemblage. The 24-methylcholesta-5,24(28)-dien-3b-ol is mainly
776 M.T. Hernandez-Sanchez et al. / Organic Geochemistry 41 (2010) 767–778
sourced from diatoms, so its isotopically similar behaviour to POMlikely reflects the significant contribution of these organisms to thetotal biomass.
Alkenone d13C values exhibit a narrower range and are less clo-sely correlated with POM and C27 and C28 sterols, perhaps becausethe alkenones derive from a narrower range of organisms. If so,then the alkenone d13C values probably record differences in envi-ronmental conditions with the greatest fidelity.
Cholesterol and cholesta-5,22-dien-3b-ol constitute a separatecluster, reflecting the high correlation between their d13C valuesand low correlation with d13C values of compounds located inthe other clusters. Cholesta-5,22-dien-3b-ol is produced by differ-ent groups of diatoms (Ballantine et al., 1979; Volkman, 1986;Barrett et al., 1995) and zooplankton (Volkman, 1987), whereascholesterol has phytoplanktonic and zooplanktonic origins. If cho-lesterol is produced mainly by zooplankton, the relationship mightindicate that cholesta-5,22-dien-3b-ol has the same source. Thishas been reported for the Peruvian upwelling region (Pancostet al., 1999). Alternatively, zooplankton might feed on small dia-toms and thus, cholesterol d13C values reflect those of cholesta-5,22-dien-3b-ol (Grice et al., 1998). In any case, the fact that thed13C values of these compounds form a cluster distinct from morephytoplankton-diagnostic biomarkers likely reflects contributionsfrom additional factors and likely inputs from zooplankton.
In addition to cluster analysis by compound, cluster analysis bystation was performed to confirm the geographical control on theisotopic composition of POM and different biomarkers. Fig. 5Bshows three different clusters: the first comprises all the samplesretrieved from M6 waters and three of the samples retrieved fromM5. The second cluster is represented by the sample from M3. Thethird cluster comprises the sample from M10 and that from M5 on24/12/05, which showed the most 13C-enriched values. Thus,although C isotope values are variable at a given site over time,all the samples from M6 and most from M5, can be isotopically dis-tinguished from those found at M3, M10 and M5 (24/12/05;Fig. 5B); this is consistent with productivity variation, where M3represents a peaking bloom, M10 the decaying phase of the bloomand M5 constitutes the tail of the bloom (Pollard et al., 2007).
4.3.3. Organic N isotope ratiosThe most 15N-enriched POM is found north of the plateau at M3,
followed by M10, with lower values towards the east and south ofthe plateau. d15NPOM values are largely dependent on the substrate[NO�3 , NHþ4 or N2 (g)] used by phytoplankton as well as the trophiclevel (DeNiro and Epstein, 1981; Wada et al., 1987; Altabet et al.,1991; Bronk and Ward, 1999). In addition, d15NPOM values inSouthern Ocean waters are influenced by cell size and Fe availabil-ity (Karsh et al., 2003). A relationship between [NO�3 ] and d15NPOM
in surface waters has been observed, with d15NPOM values increas-ing as [NO�3 ] decreases (Wada and Hattori, 1976; Altabet andMcCarthy, 1985; Altabet and Deuser, 1985); this has led to theuse of d15NPOM values as indicators of nitrate NO�3 utilisation in sur-face waters (Sigman et al., 1999; Francois et al., 1997). However,the range of NO�3 uptake in the Crozet region ranges from only5% to 15% of inferred winter values (Sanders et al., 2007), and sig-nificant NO�3 concentration persists at all sites throughout thebloom progression. Thus, even though the greatest amount ofNO�3 uptake coincides with the most enriched d15N values northof the plateau (M3), the wide range of POM d15N values (�1.9‰
to +3.7‰) cannot be explained solely via Rayleigh fractionationin even a completely closed system (Mariotti et al., 1981). Thus,additional isotopic fractionation arising from remineralisationand uptake of alternative forms of dissolved N is inferred to occuras the season progresses.
One potential control could be recycling of ammonia ordissolved organic nitrogen (DON). d15N values at M10, sampled
towards the end of the bloom (Fig. 2; Pollard et al., 2007) are lowerthan those of M3. Ammonia is typically depleted in 15N relative toNO�3 (�2.1‰, �1.5‰; Altabet, 1988; Waser et al., 1998), so it ispossible that the lower 15NPOM values at M10 vs. M3 are the resultof a late-bloom phytoplankton community starting to use recycledN as a substrate. Although ammonia utilisation has not been mea-sured for all sites, Lucas et al. (2007) did show that NHþ4 uptake oc-curred during the 2004/2005 season in the region of M3, but that itwas lower than NO�3 uptake. Moreover, the most depleted d15N val-ues occur south of the plateau, where NHþ4 uptake was twice theNO�3 uptake during the 2004/2005 season (Lucas et al., 2007). Thus,it is likely that the increased use of 15N-depleted recycled N in thesouth and east stations – and potentially at the end of the bloomnorth of the Plateau – results in low d15NPOM values.
5. Summary and conclusions
Overall, biomarker and bulk OM concentrations, distributionsand isotopic compositions appear to record a specific signaturefor the Fe-induced bloom. Generally, d13C values are higher inthe fertilised region and we attribute this mainly to higher growthrate, lower [CO2] or greater use of CCMs, all of which are consistentwith high biomass under Fe replete conditions, high chl-a concen-trations and high algal biomarker concentrations. Similarly, de-pleted d15NPOM values in the HNLC region appear to reflectgreater NHþ4 or DON utilisation. These variations result in very dif-ferent geochemical signatures in different parts of the Crozet Pla-teau region. To the north, M10 represents a community at theend of a bloom, characterised by high biomass, high concentrationsof zooplankton-derived lipids, and apparently elevated growth rateand lower NHþ4 recycling vs. the HNLC area; it also contains thehighest concentrations of diatom-derived lipids, perhaps reflectingthe persistence of these organisms (or their remains) until the laterstages of the event. M3 reflects a bloom situation (Poulton et al.,2007) and, although the biomass is slightly lower (inferred fromlower biomarker abundances) than at M10, NHþ4 recycling appearsto have been lower and growth rate or CCM utilisation appear tohave been higher. At M6, geochemical signatures are consistentwith an Fe limited situation, including lower biomass, a more di-verse phytoplankton assemblage (including proportionally higherconcentrations of coccolithophorid and dinoflagellate biomarkers)and lower inferred algal growth rate (or use of CCMs) and greaterNHþ4 recycling. Overall, the differences are consistent with an Felimited region (M6) where grazing controls phytoplankton produc-tivity and biomass (Pakhomov and Froneman, 2004), and an Fe-en-riched area to the north, which is beyond the control ofzooplankton grazing and where silica (Moore et al., 2007a,b) mightlimit biomass production (Fielding et al., 2007).
Fe fertilisation of HNLC areas of the ocean has been proposed asa mechanism to control atmospheric [CO2] during glacial periods(Martin, 1990), and the area located north of the plateau is an ana-logue for such conditions (Planquette et al., 2007). This study dem-onstrates that OM produced under Fe fertilisation (hypothesizedglacial conditions) is significantly different from that synthesizedunder HNLC (interglacial; M6) conditions. Specifically, bulk organicd15N and d13C values, alkenone and sterol d13C values reveal cleardifferences between the Fe fertilised region and the HNLC area,and these could be powerful tools in the reconstruction of similarconditions in ancient oceans. Other parameters, such as biomarkerconcentrations and distributions, are temporally and spatially var-iable and further study is required to validate their application toinvestigations of the sedimentary record. Moreover, their preserva-tion potential, as biomarker distributions can be significantly al-tered during sinking and burial, needs to be investigated forSouthern Ocean depositional regimes.
M.T. Hernandez-Sanchez et al. / Organic Geochemistry 41 (2010) 767–778 777
Acknowledgements
We thank I. Bull of the Organic Geochemistry Unit and the Bris-tol Node of the NERC Life Sciences Mass Spectrometry Facility foranalytical support. Additionally, we thank NERC for funding iso-tope analysis and the help of C. Kendrick and T. Heaton at the NERCIsotope Geosciences Laboratory (NIGL). We also gratefullyacknowledge the NERC funded CROZet natural Iron bloom ExportExperiment (CROZEX) and Benthic Crozet Programme (NER/A/S/2003/00576), and especially F. Chaillan for the recovery of samplesaround the Crozet Plateau. We also thank the officers, crew andtechnical support on RRS Discovery Cruises D286 and D300, theEU for funding a PhD studentship (M.T.H.) via the BIOTRACS pro-gramme, and A. Benthien and an anonymous reviewer for con-structive comments.
Associate Editor—K.-U. Hinrichs
References
Altabet, M.A., 1988. Variations in nitrogen isotopic composition between sinkingand suspended particles: implications for nitrogen cycling and particletransformation in the open ocean. Deep Sea Research Part A 35, 535–554.
Altabet, M.A., Deuser, W.G., 1985. Seasonal variations in natural abundance of 15N inparticles sinking to the deep Sargasso Sea. Nature 315, 218–219.
Altabet, M.A., McCarthy, J.J., 1985. Temporal and spatial variations in the naturalabundance of 15N in PON from a warm-core ring. Deep Sea Research Part A 32,755–772.
Altabet, M.A., Deuser, W.G., Honjo, S., Stienen, C., 1991. Seasonal and depth-relatedchanges in the source of sinking particles in the North Atlantic. Nature 354,136–139.
Bakker, D.C.E., Nielsdóttir, M.C., Morris, P.J., Venables, H.J., Watson, A.J., 2007. Theisland mass effect and biological carbon uptake for the subantarctic CrozetArchipelago. Deep Sea Research Part II 54, 2174–2190.
Ballantine, J.A., Lavis, A., Morris, R.J., 1979. Sterols of the phytoplankton – effects ofillumination and growth stage. Phytochemistry 18, 1459–1466.
Barrett, S.M., Volkman, J.K., Dunstan, G.A., LeRoi, J., 1995. Sterols of 14 species ofmarine diatoms (Bacillariophyta). Journal of Phycology 31, 360–369.
Benthien, A., Andersen, N., Schulte, S., Muller, P.J., Schneider, R.R., Wefer, G., 2002.Carbon isotopic composition of the C37:2 alkenone in core top sediments of theSouth Atlantic Ocean: Effects of CO2 and nutrient concentrations. GlobalBiogeochemical Cycles 16, 12.
Bidigare, R.R., Fluegge, A., Freeman, K.H., Hanson, K.L., Hayes, J.M., Hollander, D.,Jasper, J.P., King, L.L., Laws, E.A., Milder, J., 1997. Consistent fractionation of 13Cin nature and in the laboratory: growth-rate effects in some haptophyte algae.Global Biogeochemical Cycles 11, 279–292.
Bidigare, R.R., Hanson, K.L., Buesseler, K.O., Wakeham, S.G., Freeman, K.H., Pancost,R.D., Millero, F.J., Steinberg, P., Popp, B.N., Latasa, M., 1999. Iron-stimulatedchanges in 13C fractionation and export by equatorial Pacific phytoplankton:toward a paleogrowth rate proxy. Paleoceanography 14, 589–595.
Brezinski, M.A., Pride, C., Franck, V.M., Sigman, D., Sarmiento, J.L., Matsumoto, K.,Gruber, N., Rau, G.H., Coale, K.H., 2002. A switch from Si(OH)4 to NO�3 depletionin the glacial Southern Ocean. Geophysical Research Letters 29, 51–54.
Bronk, D.A., Ward, B.B., 1999. Gross and net nitrogen uptake and DON release in theeuphotic zone of Monterey Bay, California. Limnology and Oceanography 44,573–585.
Burkhardt, S., Riebesell, U., Zondervan, I., 1999a. Effects of growth rate, CO2
concentration, and cell size on the stable carbon isotope fractionation in marinephytoplankton. Geochimica et Cosmochimica Acta 36, 3729–3741.
Burkhardt, S., Riebesell, U., Zondervan, I., 1999b. Stable isotope fractionation bymarine phytoplankton in response to daylight, growth rate and CO2 availability.Marine Ecology Progress Series 184, 31–41.
Crosta, X., Romero, O., Armand, L.K., Pichon, J., 2005. The biogeography of majordiatom taxa in Southern Ocean sediments: 2.Open Ocean related species.Paleogeography, Paleoclimatology, Paleoecology 223, 66–92.
De Baar, H.J.W., Boyd, P., 2000. The role of iron in plankton ecology and carbondioxide transfer of the global oceans. In: Hanson, R.B., Ducklow, D.C., Field, J.G.(Eds.), The Dynamic Ocean Carbon Cycle: A Midterm Synthesis of the JointGlobal Ocean Flux Study, vol. 5. Cambridge University Press, Cambridge, pp. 61–140.
DeNiro, M.J., Epstein, S., 1981. Influence of diet on the distribution of nitrogenisotopes in animals. Geochimica et Cosmochimica Acta 45, 341–351.
Descolas-Gros, M., Fountungne, M., 1990. Stable carbon isotope fractionation bymarine phytoplankton during photosynthesis. Plant, Cell and Environment 13,207–218.
Eek, M.K., Whiticar, M.J., Bishop, J.K.B., Wong, C.S., 1999. Influence of nutrients oncarbon isotope fractionation by natural populations of Prymnesiophyte algae inNE Pacific. Deep Sea Research Part II 46, 2863–2876.
Feldman, G.C., McClain, C.R., 2006a. In: Kuring, N., Bailey, S.W. (Eds.), Ocean ColorWeb, SeaWiFS Reprocessing 5.1. NASA Goddard Space Flight Centre. <http://oceancolor.gsfc.nasa.gov/>.
Feldman, G.C., McClain, C.R., 2006b. In: Kuring, N., Bailey, S.W. (Eds.), Ocean ColorWeb, SeaWiFS Reprocessing 1.1. NASA Goddard Space Flight Centre. <http://oceancolor.gsfc.nasa.gov/>.
Fielding, S., Ward, P., Pollard, R.T., Seeyave, S., Read, J.F., Hughes, J.A., Smith, T.,Castellani, C., 2007. Community structure and grazing impact ofmesozooplankton during late spring/early summer 2004/2005 in the vicinityof the Crozet Islands (Southern Ocean). Deep Sea Research Part II 54, 2106–2125.
Francois, R., Altabet, M.A., Goericke, R., McCorkle, D.C., 1993. Changes in the d13C ofsurface water particulate organic matter across the Subtropical Convergence inthe SW Indian Ocean. Global Biogeochemical Cycles 7, 627–644.
Francois, R., Altabet, M.A., Yu, E.F., Sigman, D.M., Bacon, M.P., Frank, M., Bohrmann,G., Labeyrie, L.D., 1997. Contribution of Southern Ocean surface-waterstratification to low atmospheric CO2 concentrations during the last glacialperiod. Nature 389, 929–936.
Freeman, K.H., Hayes, J.M., 1992. Fractionation of carbon isotopes by phytoplanktonand estimates of ancient CO2 levels. Global Biogeochemical Cycles 6, 185–198.
Frew, R., Bowie, A., Croot, P., Pickmere, S., 2001. Macronutrient and trace-metalgeochemistry of an in situ iron-induced Southern Ocean bloom. Deep SeaResearch Part II 48, 2467–2481.
Fry, B., Wainwright, S.C., 1991. Diatom sources 13C-rich carbon in marine food webs.Marine Ecology Progress Series 76, 149–157.
Gall, M.P., Boyd, P.W., Hall, J., Safi, K.A., Chang, H., 2001. Phytoplankton processes.Part 1: community structure during the Southern Ocean Iron REleaseExperiment (SOIREE). Deep Sea Research Part II 48, 2551–2570.
Goericke, R., Montoya, J.P., Fry, B., 1994. Physiology of isotope fractionation in algaecyanobacteria. In: Lajtha, K., Michener, B. (Eds.), Stable Isotopes in Ecology.Blackwell, Oxford, pp. 187–221.
Grice, K., Breteler, W.C.M.K., Schouten, S., Grossi, V., de Leeuw, J.W., SinningheDamsté, J.S., 1998. Effects of zooplankton herbivory on biomaker proxy records.Palaeoceanography 13, 686–693.
Hernandez, M.T., Mills, R.A., Pancost, R.D., 2008. Algal biomarkers in surface watersaround the Crozet Plateau. Organic Geochemistry 39, 1051–1057.
Holligan, P.M., Groom, S.B., Harbour, D.S., 1993. What controls the distribution ofthe coccolithophore, Emiliania huxleyi, in the North Sea? FisheriesOceanography 2, 175–183.
Karsh, K.L., Trull, T.W., Lourey, M.J., Sigman, D.M., 2003. Relationship of nitrogenisotope fractionation to phytoplankton size and iron availability during theSouthern Ocean Iron RElease Experiment (SOIREE). Limnology andOceanography 48, 1058–1068.
Kawamura, K., 1995. Land-derived lipid class compounds in the deep-sea sedimentsand marine aerosols from North Pacific. In: Sakai, H., Nozuki, Y. (Eds.),Biogeochemical Processes and Ocean Flux in the Western Pacific. TERRAPUB,Tokyo, pp. 31–51.
Laws, E.A., Popp, B.N., Bidigare, R.R., Kennicutt, M.C., Macko, S.A., 1995. Dependenceof phytoplankton carbon isotopic composition on growth rate and [CO2(aq)]:theoretical considerations and experimental results. Geochimica etCosmochimica Acta 59, 1131–1138.
Laws, E.A., Bidigare, R.R., Popp, B.N., 1997. Effect of growth rate and CO2
concentration on carbon isotopic fractionation by the marine diatomPhaeodactylum tricornutum. Limnology and Oceanography 42, 1552–1560.
Laws, E.A., Thompson, P.A., Popp, B.N., Bidigare, R., 1998. Sources of inorganiccarbon for marine microalgal photosynthesis: a reassessment of d13C data frombatch culture studies of Thalassiosire pseudonana and Emiliana huxleyi.Limnology and Oceanography 43, 136–142.
Lucas, M., Seeyave, S., Sanders, R., Mark Moore, C., Williamson, R., Stinchcombe, M.,2007. Nitrogen uptake responses to a naturally Fe-fertilised phytoplanktonbloom during the 2004/2005 CROZEX study. Deep Sea Research Part II 54,2138–2173.
Mariotti, A., Germon, J.C., Hubert, P., Kaiser, P., Letolle, R., Tardieux, A., Tardieux, P.,1981. Experimental determination of nitrogen kinetic isotope fractionation:some principles; illustration for the denitrifcation and nitrifcation processes.Plant and Soil 62, 413–430.
Martin, J., 1990. Glacial-interglacial CO2 change: the iron hypothesis.Paleoceanography 5, 1–13.
Moore, C., Hickman, A.E., Poulton, A., Seeyave, S., Lucas, M.I., 2007a. Iron-lightinteractions during the CROZet natural iron bloom and EXport experiment(CROZEX) II: taxonomic responses and elemental stoichiometry. Deep SeaResearch Part II 54, 2066–2084.
Moore, C.M., Seeyave, S., Hickman, A.E., Allen, J.T., Lucas, M.I., Planquette, H., Pollard,R.T., Poulton, A.J., 2007b. Iron-light interactions during the CROZet natural ironbloom and EXport experiment (CROZEX) I: phytoplankton growth andphotophysiology. Deep Sea Research Part II 54, 2045–2065.
Morel, F.M.M., Reinfelder, J.R., Roberts, S.B., Chamberlain, C.P., Lee, J.G., Yee, D.,1994. Zinc and carbon co-limitation of marine phytoplankton. Nature 369,740–742.
Morris, P.J., Sanders, R., Turnewitsch, R., Thomalla, S., 2007. 234Th-derivedparticulate organic carbon export from an island-induced phytoplanktonbloom in the Southern Ocean. Deep Sea Research Part II 54, 2208–2232.
Nakatsuka, T., Handa, N., Wada, E., Wong, C.S., 1992. The dynamic changes of stableisotopic ratios of carbon and nitrogen in suspended and sedimented particulateorganic matter during a phytoplankton bloom. Journal of Marine Research 50,267–296.
778 M.T. Hernandez-Sanchez et al. / Organic Geochemistry 41 (2010) 767–778
Nichols, P.D., Skerrat, J.H., Davidson, A., Burton, H., McMeekin, T.A., 1991. Lipids ofcultured Phaeocystis pouchetii: signatures of food-web, biogeochemical andenvironmental studies in Antarctica and the Southern Ocean. Phytochemistry30, 3209–3214.
O’Reilly, J.E., Maritorena, S., Mitchell, B.G., Siegel, D.A., Carder, K.L., Garver, S.A.,Kahru, M., McClain, C., 1998. Ocean colour chlorophyll algorithms for SeaWiFS.Journal of Geophysical Research 103, 937–953.
Pakhomov, E.A., Froneman, P.W., 2004. Zooplankton dynamics in the easternAtlantic sector of the Southern Ocean during the austral summer 1997/1998 –Part 2: grazing impact. Deep Sea Research Part II 51, 2617–2631.
Pancost, R.D., Freeman, K.H., Wakeham, S.G., Robertson, C.Y., 1997. Controls oncarbon isotope fractionation by diatoms in the Peru upwelling region.Geochimica et Cosmochimica Acta 61, 4983–4991.
Pancost, R.D., Freeman, K.H., Wakeham, S.G., 1999. Controls on the carbon–isotopecomposition of compounds in Peru surface waters. Organic Geochemistry 30,319–340.
Patterson, G.W., Van Valkenburgh, S.D., 1990. Sterols of Dictyocha Fibula(Chrysophyceae) and Olisthodiscus luteus (Raphydophyceae). Journal ofPhycology 26, 484–489.
Pelejero, C., Calvo, E., 2003. The upper temperature calibration revisited.Geochemistry Geophysics Geosystems 4, 1014. doi:10.1029/2002GC000431.
Pirretti, M.V., Giampiero, P., Boni, L., Pistocchi, R., Diamante, M., Gazzotti, T., 1997.Investigation of 4-methyl sterols from cultured dinoflagellate algal strains.Journal of Phycology 33, 61–67.
Planquette, H., Statham, P.J., Fones, G.F., Charette, M.A., Moore, M., Salter, I., Nedelec,F.H., Taylor, S.L., French, M., Baker, A.R., Mahowald, N., Jickells, T.D., 2007.Dissolved iron in the vicinity of the Crozet Islands, Southern Ocean. Deep SeaReseach Part II 54, 1999–2019.
Pollard, R.T., Venables, H.J., Read, J.F., Allen, J.T., 2007. Large scale circulation aroundthe Crozet Plateau controls an annual phytoplankton bloom in the Crozet Basin.Deep Sea Research Part II 54, 1915–1929.
Pollard, R.T., Salter, I., Sanders, R.J., Lucas, M.I., Moore, C.M., Mills, R.A., Statham, P.J.,Allen, J.T., Baker, A.R., Charette, M.A., Fielding, S., Fones, G.R., French, M.,Hickman, A.E., Holland, R.J., Huges, A., Jickells, T.D., Lampitt, R.S., Morris, P.J.,Nedelec, F.H., Nielsdottir, M., Planquette, H., Popova, E.E., Poulton, A.J., Read, J.F.,Seeyave, S., Smith, T., Stinchcombe, M., Taylor, S., Thomalla, S., Venables, H.J.,Williamson, R., Zubkov, M.V., 2009. Southern Ocean deep-water carbon exportenhanced by natural iron fertilization. Nature 457, 577–580.
Popp, B.N., Trull, T., Kenig, F., Wakeham, S.G., Rust, T.M., Tilbrook, B., Griffiths, F.B.,Wright, S.W., Marchant, H.J., Bidigare, R.R., 1999. Controls on the carbonisotopic composition of Southern Ocean phytoplankton. Global BiogeochemicalCycles 13, 827–844.
Poulton, A.J., Mark Moore, C., Seeyave, S., Lucas, M.I., Fielding, S., Ward, P., 2007.Phytoplankton community composition around the Crozet Plateau, withemphasis on diatoms and Phaeocystis. Deep Sea Research Part II 54, 2085–2105.
Prahl, F.G., Wakeham, S.G., 1987. Calibration of unsaturation patterns in long-chainketone compositions for paleo temperature assessment. Nature 330, 367–389.
Rau, G.H., Takahashi, T., Marais, D.J.D., 1989. Latitudinal variations in plankton d13C:implications for CO2 and productivity in past oceans. Nature 341, 516–518.
Rau, G.H., Takahashi, T., Des Marais, D.J., Repeta, D.J., Martin, J.H., 1992. Therelationship between d13C of organic matter and [CO2(aq)] in ocean surfacewater: data from a JGOFS site in the northeast Atlantic Ocean and a model.Geochimica et Cosmochimica Acta 56, 1413–1419.
Rau, G.H., Riebesell, U., Wolf-Galdrow, D., 1996. A model of photosynthetic 13Cfractionation by marine phytoplankton based on diffusive molecular CO2
uptake. Marine Ecology – Progress Series 133, 275–285.Raven, J.A., Johnston, A.M., Turpin, D.H., 1993. Influence of changes in CO2
concentration and temperature on marine phytoplankton 13C/12C ratios: ananalysis of possible mechanisms. Global and Planetary Change 8, 1–12.
Riebesell, U., Revill, A.T., Holdsworth, D.G., Volkman, J.K., 2000. The effects ofvarying CO2 concentration on lipid composition and carbon isotopefractionation in Emiliania huxleyi. Geochimica et Cosmochimica Acta 64,4179–4192.
Rost, B., Riebesell, U., Burkhardt, S., 2003. Carbon acquisition of bloom formingmarine phytoplankton. Limnology and Oceanography 48, 55–67.
Rost, B., Richter, U., Hansen, P.J., 2006. Inorganic carbon acquisition in red tidedinoflagellates. Plant, Cell and Environment 29, 810–822.
Salter, I., 2007. Particle Fluxes in the North-East Atlantic and Southern Ocean. PhDThesis, University of Southampton.
Salter, I., Lampitt, R.S., Sanders, R., Poulton, A., Kemp, A.E.S., Boorman, B., Saw, K.,Pearce, R., 2007. Estimating carbon, silica and diatom export from a naturallyfertilised phytoplankton bloom in the Southern Ocean using PELAGRA: a noveldrifting sediment trap. Deep Sea Research Part II 54, 2233–2259.
Seeyave, S., Lucas, M.I., Moore, C.M., Poulton, A.J., 2007. Phytoplankton productivityand community structure in the vicinity of the Crozet Plateau during australsummer 2004/2005. Deep Sea Research Part II 54, 2020–2044.
Sharkey, T.D., Berry, J.A., 1985. Carbon isotope fractionation of algae as influencedby an inducible CO2 concentrating mechanism. In: Lucas, W.J., Berry, J.A. (Eds.),Inorganic Carbon Uptake by Aquatic Photosynthetic Organisms. AmericanSociety of Plant Physiologists, Rockville, pp. 389–401.
Sigman, D.M., Altabet, M.A., McCorkle, D.C., Francois, R., Fischer, G., 1999. The d15Nof nitrate in the Southern Ocean: consumption of nitrate in surface waters.Global Biogeochemical Cycles 13, 1149–1166.
Sikes, E.L., Volkman, J.K., 1993. Calibration of alkenone unsaturation ratios (Uk0
37) forpaleotemperature estimation in cold polar waters. Geochimica etCosmochimica Acta 57, 1883–1889.
Skerrat, J.H., Nichols, P.D., McMeekin, T.A., Burton, H., 1995. Seasonal and inter-annual changes in planktonic biomass and community structure in EasternAntarctica using signature lipids. Marine Chemistry 51, 93–113.
Skerratt, J.H., Nichols, P.D., McMeekin, T.A., Burton, H., 1998. Identification ofdominant taxa in coastal Antarctic water and ice core samples using lipidsignatures. In: Battaglia, B., Valencia, J., Walton, D.W.H. (Eds.), AntarcticCommunities: Species, Structure and Survival. Cambridge University Press,Cambridge, pp. 79–85.
Smetacek, V., Assmy, P., Henjes, J., 2004. The role of grazing in structuring SouthernOcean pelagic ecosystems and biogeochemical cycles. Antarctic Science 16,541–558.
Tolosa, I., Miquel, J.C., Grasser, B., Raimbault, P., Goyet, C., Claustre, H., 2008.Distribution of lipid biomarkers and carbon isotope fractionation in contrastingtrophic environments of the South East Pacific. Biogeosciences 5, 949–968.
Venables, H.J., Pollard, R.T., Popova, E.E., 2007. Physical conditions controlling thedevelopment of a regular phytoplankton bloom north of the Crozet Plateau,Southern Ocean. Deep Sea Research Part II 54, 1949–1965.
Volkman, J., 1986. A review of sterol markers for marine and terrigenous organicmatter. Organic Geochemistry 9, 83–99.
Volkman, J.K., Farrington, J., Gagosian, R.B., Wakeham, S.G., 1983. Lipid compositionof coastal marine sediments from the Peru upwelling region. In: Bjoroy, M. et al.(Eds.), Advances in Organic Geochemistry. Wiley, Chichester, pp. 228–240.
Volkman, J.K., Farrington, J.W., Gagosian, R.B., 1987. Marine and terrigenous lipids incoastal sediments from the Peru upwelling region at 15�S: sterols andtriterpene alcohols. Organic Geochemistry 11, 463–477.
Volkman, J.K., Barret, S.M., Dunstan, G.A., 1994. C25 and C30 highly branchedisoprenoid alkenes in laboratory cultures of two marine diatoms. OrganicGeochemistry 21, 407–413.
Volkman, J.A., Barret, S.M., Blackburn, S.I., Mansour, M.P., Sikes, E.L., Gelin, F., 1998.Microalgal biomarkers: a review of recent research developments. OrganicGeochemistry 29, 1163–1179.
Wada, E., Hattori, A., 1976. Natural abundance of 15N in particulate organic matterin the North Pacific Ocean. Geochimica et Cosmochimica Acta 40, 249–251.
Wada, E., Terazaki, M., Kabaya, Y., Nemoto, T., 1987. 15N and 13C abundances in theAntarctic Ocean with emphasis on the biogeochemical structure of the foodweb. Deep Sea Reseach Part II 34, 829–841.
Waser, N.A.D., Harrison, P.J., Nielsen, B., Calvert, S.E., Turpin, D.H., 1998. Nitrogenisotope fractionation during the uptake and assimilation of nitrate, nitrite,ammonium, and urea by a marine diatom. Limnology and Oceanography 43,215–224.
Withers, N., 1983. Dinoflagellate sterols. In: Scheuer, P.J. (Ed.), Marine NaturalProducts: Chemical and Biological Perspectives, vol. 5. Academic Press, NewYork, pp. 87–130.
Withers, N., 1987. Dinoflagellate sterols. In: Taylor, F.J.R. (Ed.), The Biology ofDinoflagellates, Biological Monographs, vol. 21. Blackwell Scientific, Oxford, pp.316–359.