Productivity model in hot and humid environment based on heat tolerance time analysis
6
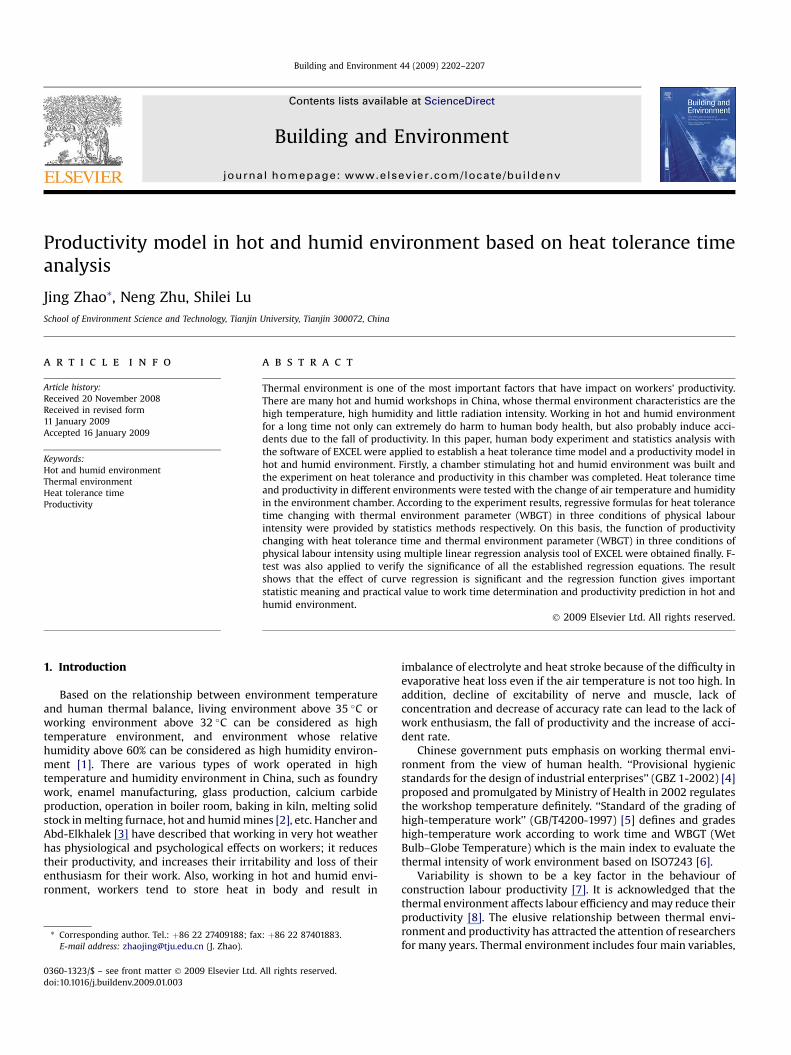
Productivity model in hot and humid environment based on heat tolerance time analysis Jing Zhao * , Neng Zhu, Shilei Lu School of Environment Science and Technology, Tianjin University, Tianjin 300072, China article info Article history: Received 20 November 2008 Received in revised form 11 January 2009 Accepted 16 January 2009 Keywords: Hot and humid environment Thermal environment Heat tolerance time Productivity abstract Thermal environment is one of the most important factors that have impact on workers’ productivity. There are many hot and humid workshops in China, whose thermal environment characteristics are the high temperature, high humidity and little radiation intensity. Working in hot and humid environment for a long time not only can extremely do harm to human body health, but also probably induce acci- dents due to the fall of productivity. In this paper, human body experiment and statistics analysis with the software of EXCEL were applied to establish a heat tolerance time model and a productivity model in hot and humid environment. Firstly, a chamber stimulating hot and humid environment was built and the experiment on heat tolerance and productivity in this chamber was completed. Heat tolerance time and productivity in different environments were tested with the change of air temperature and humidity in the environment chamber. According to the experiment results, regressive formulas for heat tolerance time changing with thermal environment parameter (WBGT) in three conditions of physical labour intensity were provided by statistics methods respectively. On this basis, the function of productivity changing with heat tolerance time and thermal environment parameter (WBGT) in three conditions of physical labour intensity using multiple linear regression analysis tool of EXCEL were obtained finally. F- test was also applied to verify the significance of all the established regression equations. The result shows that the effect of curve regression is significant and the regression function gives important statistic meaning and practical value to work time determination and productivity prediction in hot and humid environment. Ó 2009 Elsevier Ltd. All rights reserved. 1. Introduction Based on the relationship between environment temperature and human thermal balance, living environment above 35 C or working environment above 32 C can be considered as high temperature environment, and environment whose relative humidity above 60% can be considered as high humidity environ- ment [1]. There are various types of work operated in high temperature and humidity environment in China, such as foundry work, enamel manufacturing, glass production, calcium carbide production, operation in boiler room, baking in kiln, melting solid stock in melting furnace, hot and humid mines [2], etc. Hancher and Abd-Elkhalek [3] have described that working in very hot weather has physiological and psychological effects on workers; it reduces their productivity, and increases their irritability and loss of their enthusiasm for their work. Also, working in hot and humid envi- ronment, workers tend to store heat in body and result in imbalance of electrolyte and heat stroke because of the difficulty in evaporative heat loss even if the air temperature is not too high. In addition, decline of excitability of nerve and muscle, lack of concentration and decrease of accuracy rate can lead to the lack of work enthusiasm, the fall of productivity and the increase of acci- dent rate. Chinese government puts emphasis on working thermal envi- ronment from the view of human health. ‘‘Provisional hygienic standards for the design of industrial enterprises’’ (GBZ 1-2002) [4] proposed and promulgated by Ministry of Health in 2002 regulates the workshop temperature definitely. ‘‘Standard of the grading of high-temperature work’’ (GB/T4200-1997) [5] defines and grades high-temperature work according to work time and WBGT (Wet Bulb–Globe Temperature) which is the main index to evaluate the thermal intensity of work environment based on ISO7243 [6]. Variability is shown to be a key factor in the behaviour of construction labour productivity [7]. It is acknowledged that the thermal environment affects labour efficiency and may reduce their productivity [8]. The elusive relationship between thermal envi- ronment and productivity has attracted the attention of researchers for many years. Thermal environment includes four main variables, * Corresponding author. Tel.: þ86 22 27409188; fax: þ86 22 87401883. E-mail address: [email protected] (J. Zhao). Contents lists available at ScienceDirect Building and Environment journal homepage: www.elsevier.com/locate/buildenv 0360-1323/$ – see front matter Ó 2009 Elsevier Ltd. All rights reserved. doi:10.1016/j.buildenv.2009.01.003 Building and Environment 44 (2009) 2202–2207
-
Upload
independent -
Category
Documents
-
view
3 -
download
0
Transcript of Productivity model in hot and humid environment based on heat tolerance time analysis
lable at ScienceDirect
Building and Environment 44 (2009) 2202–2207
Contents lists avai
Building and Environment
journal homepage: www.elsevier .com/locate /bui ldenv
Productivity model in hot and humid environment based on heat tolerance timeanalysis
Jing Zhao*, Neng Zhu, Shilei LuSchool of Environment Science and Technology, Tianjin University, Tianjin 300072, China
a r t i c l e i n f o
Article history:Received 20 November 2008Received in revised form11 January 2009Accepted 16 January 2009
Keywords:Hot and humid environmentThermal environmentHeat tolerance timeProductivity
* Corresponding author. Tel.: þ86 22 27409188; faxE-mail address: [email protected] (J. Zhao).
0360-1323/$ – see front matter � 2009 Elsevier Ltd.doi:10.1016/j.buildenv.2009.01.003
a b s t r a c t
Thermal environment is one of the most important factors that have impact on workers’ productivity.There are many hot and humid workshops in China, whose thermal environment characteristics are thehigh temperature, high humidity and little radiation intensity. Working in hot and humid environmentfor a long time not only can extremely do harm to human body health, but also probably induce acci-dents due to the fall of productivity. In this paper, human body experiment and statistics analysis withthe software of EXCEL were applied to establish a heat tolerance time model and a productivity model inhot and humid environment. Firstly, a chamber stimulating hot and humid environment was built andthe experiment on heat tolerance and productivity in this chamber was completed. Heat tolerance timeand productivity in different environments were tested with the change of air temperature and humidityin the environment chamber. According to the experiment results, regressive formulas for heat tolerancetime changing with thermal environment parameter (WBGT) in three conditions of physical labourintensity were provided by statistics methods respectively. On this basis, the function of productivitychanging with heat tolerance time and thermal environment parameter (WBGT) in three conditions ofphysical labour intensity using multiple linear regression analysis tool of EXCEL were obtained finally. F-test was also applied to verify the significance of all the established regression equations. The resultshows that the effect of curve regression is significant and the regression function gives importantstatistic meaning and practical value to work time determination and productivity prediction in hot andhumid environment.
� 2009 Elsevier Ltd. All rights reserved.
1. Introduction
Based on the relationship between environment temperatureand human thermal balance, living environment above 35 �C orworking environment above 32 �C can be considered as hightemperature environment, and environment whose relativehumidity above 60% can be considered as high humidity environ-ment [1]. There are various types of work operated in hightemperature and humidity environment in China, such as foundrywork, enamel manufacturing, glass production, calcium carbideproduction, operation in boiler room, baking in kiln, melting solidstock in melting furnace, hot and humid mines [2], etc. Hancher andAbd-Elkhalek [3] have described that working in very hot weatherhas physiological and psychological effects on workers; it reducestheir productivity, and increases their irritability and loss of theirenthusiasm for their work. Also, working in hot and humid envi-ronment, workers tend to store heat in body and result in
: þ86 22 87401883.
All rights reserved.
imbalance of electrolyte and heat stroke because of the difficulty inevaporative heat loss even if the air temperature is not too high. Inaddition, decline of excitability of nerve and muscle, lack ofconcentration and decrease of accuracy rate can lead to the lack ofwork enthusiasm, the fall of productivity and the increase of acci-dent rate.
Chinese government puts emphasis on working thermal envi-ronment from the view of human health. ‘‘Provisional hygienicstandards for the design of industrial enterprises’’ (GBZ 1-2002) [4]proposed and promulgated by Ministry of Health in 2002 regulatesthe workshop temperature definitely. ‘‘Standard of the grading ofhigh-temperature work’’ (GB/T4200-1997) [5] defines and gradeshigh-temperature work according to work time and WBGT (WetBulb–Globe Temperature) which is the main index to evaluate thethermal intensity of work environment based on ISO7243 [6].
Variability is shown to be a key factor in the behaviour ofconstruction labour productivity [7]. It is acknowledged that thethermal environment affects labour efficiency and may reduce theirproductivity [8]. The elusive relationship between thermal envi-ronment and productivity has attracted the attention of researchersfor many years. Thermal environment includes four main variables,

Fig. 1. Chamber structure.
Productivity
Time
Developing stage Mature stage Decline stage
Fig. 2. The change law of productivity.
J. Zhao et al. / Building and Environment 44 (2009) 2202–2207 2203
namely air temperature, relative humidity and wind velocity, aswell as mean radiant temperature [9]. Early research indicated thatthe most comfortable temperature yields optimal work perfor-mance [10]. In other words, the best environment for working is thethermally comfortable environment. Based on Olli’s review [11],available data do not provide compelling or consistent evidencethat temperature variations within the comfort zone significantlyaffect worker performance. Relative humidity may also affectproductivity. A maximum relative humidity between 50% and 65%is normally provided at the design stage. A higher relative humidityaffects the perceived indoor air quality and thus affects thermalcomfort [12].
Over the years, many attempts have been made to establishmathematical models reflecting the relationship between thethermal environment and construction labour productivity. Onceestablished, the models were used to forecast the change inproductivity due to thermal environment variations. Koehn andBrown [13] investigated and used a wide range of publishedproductivity data to derive two non-linear relationships relatingproductivity with air temperature and relative humidity; Thomasand Yiakoumis [14] collected data from a number of commercialprojects and used a multiple regression analysis technique toobtain the relationship; Hancher and Abd-Elkhalek [3] utilizeda simple thermal index, the wet bulb–globe temperature (WBGT),to evaluate the combined effect of hot weather on the physiological
Table 1Volunteers’ background statistics result.
Classification Data
Age of trial volunteers maximum 26minimum 19average 23.1standard error 5.11
Weight of trial volunteers (Kg) maximum 90minimum 64average 72.1standard error 9.15
Age of trial volunteers (cm) maximum 182minimum 160average 170.2standard error 4.68
and sensory response of the human body; Sherif Mohamedand andKorb Srinavin [15] built a regression model reflecting the rela-tionship between the thermal comfort index (PMV) and produc-tivity. The models, however, failed to accurately demonstrate theproductivity performance in hot and humid environment consid-ering human body heat tolerance limit.
This paper attempts to establish a mathematic model forproductivity based on the heat tolerance time experiment in hotand humid environment using regression analysis tool of EXCEL inthree conditions of physical labour intensity. This model helps todetermine safe working time for workers in hot and humid envi-ronment according to the thermal environment and physical labourintensity, and also predict productivity performance according tothe thermal environment and physical labour intensity in the rangeof heat tolerance time.
2. Tolerance to hot and humid environment experiment
2.1. Chamber
A chamber with 3 m� 2.5 m� 2.2 m (length�width� height)stimulating hot and humid environment was built by stainlesssteels. Supply air outlets with different types and sizes wereinstalled on the top and side wall to form different airflow orga-nization. Return air outlets were installed on the lower part of thechamber. Fig. 1 shows the structure of this chamber. The heatsource was provided by two heat pump unit air conditioners anda reserve electric heater to ensure high enough temperature in thechamber. And a steam humidifier was fixed in the air supply systemto realize the high humidity environment. The envelope and floorof the chamber were insulated by thermal insulation materials. All
WBGT
Hea
t To
lera
nce
Tim
e
Fig. 3. The change law of heat tolerance time with WBGT in the condition of heavyphysical labour.

WBGT
Hea
t To
lera
nce
Tim
e
Fig. 4. The change law of heat tolerance time with WBGT in the condition of mediumphysical labour. Fig. 6. ‘‘Heat tolerance time model’’ regression analysis in condition of heavy physical
labour from the software of EXCEL.
J. Zhao et al. / Building and Environment 44 (2009) 2202–22072204
the heat and humidity source equipments were laid outside thechamber. So in the chamber there was no radiant heat source. Andglobe temperature can represent the comprehensive influence ofair velocity and temperature where no radiant heat load existed. Soit could be considered that the radiant temperature kept constant.In this experiment, a new WBGT measuring instrument was used todirectly measure wet bulb temperature, globe temperature, airtemperature and WBGT respectively. Therefore, the hot and humidextreme environment can be stimulated with different combina-tion of temperature and humidity. WBGT index which cancomprehensively reflect the influence of temperature, humidity,velocity and radiation [6] was taken as the only thermal environ-ment evaluation index in this paper.
2.2. Experiment process
Heat tolerance and physiological indices of human body havea close relationship. This paper mainly analyzed the physiologicalindices of human body and productivity performance in hot andhumid environment based on the influencing factors of heattolerance. In the experiment the heat tolerance indices andproductivity in different environmental parameters were moni-tored with different combination of temperature and humidity. Thetemperature was controlled in the six conditions of 30, 32, 34, 36,38, 40 �C, and the humidity was controlled in four conditions of40%, 60%, 80%, 90%. The measuring point of air temperature in thechamber is 1.5 m for standing task and 1.1 m for sitting task.Considering uneven heated, the air temperature around head,ankle and abdomen were also measured and the measuring pointsare 0.1 m, 1.1 m and 1.7 m for standing task and 0.1 m, 0.6 m and1.1 m for sitting task. The physiological indices such as bodytemperature, blood pressure and heart rate were tested every20 min. When the heat tolerance limit of trial volunteers came, thephysiological indices and productivity were also recorded. Totally204 healthy university students with the age ranges from19 to 26were chosen from Tianjin University with the principle of voluntary
WBGT
Hea
t To
lera
nce
Tim
e
Fig. 5. The change law of heat tolerance time with WBGT in the condition of lightphysical labour.
participation as the trial volunteers who hadn’t any disease history.Most of them came from North China. Before normal experiment,all the trial volunteers had better sleeping and diet, and weretrained in the knowledge of heat stress hazards and treatment ofrisk, danger and heat stroke symptoms. Table 1 shows the volun-teers’ background statistics result. In the every experiment process,4 trial volunteers with shirt and trousers(clo¼ 1.88)activatedsynchronously in different physical labour intensity. One personengaged in heavy labour with average metabolism rate being396 kcal/h, two people engaged in medium labour with averagemetabolism rate being 228 kcal/h and one person engaged in lightlabour with average metabolism rate being 78 kcal/h [16]. The tasksof heavy, medium, light labour intensity were lifting dumbbells,installing pipe fittings, reading respectively. It was calculated thatthe labour intensity classification conformed to the metabolismload comparison table [17]. Their work couldn’t stop until theirphysiological indices indicated that they couldn’t continue workingany more or they subjectively couldn’t suffer from the labourintensity and the extreme thermal environment. Then the timewhen trial volunteers stop working was recorded and taken as heattolerance time. Productivity (%) in this paper means the ratio oflabour performance in extreme environment to labour perfor-mance in comfortable environment at the same time during workprocess. The productivity performance was recorded every 20 minduring the process of experiment till experiment stopped.
Lind and Bass [18] considered that the best working time in hotand humid environment is 100 min every day. In hot and humidenvironment, the sweating quantity may be 6–8 l in one day. Whenwater loss rate is more than 1.5–2%, productivity can be fall down;When water loss rate more than 5%, heat harmfulness may happen[19]. Therefore, when working in hot and humid environment,water should be supplemented every 15–20 min and the watertemperature should be 10–15 �C. In this experiment, every volun-teer was required to rest for 5 min every 20 min working. During
Fig. 7. ‘‘Heat tolerance time model’’ regression analysis in condition of mediumphysical labour from the software of EXCEL.

Fig. 8. ‘‘Heat tolerance time model’’ regression analysis in condition of light physicallabour from the software of EXCEL.
Table 3The comparison between regression value and critical value of F-test in ‘‘produc-tivity model’’.
Physical labour intensity Regression value (F) Critical value (F0.05)
heavy 183.71 F0.05(3,84-3-1)¼ 2.72medium 250.32 F0.05(3, 50-3-1)¼ 2.81light 107.26 F0.05(3, 36-3-1)¼ 2.90
J. Zhao et al. / Building and Environment 44 (2009) 2202–2207 2205
resting time, volunteers were instructed to drink a certain amountof water and their physiological indices such as body temperature,blood pressure, and heart rate were also tested. So the ratio ofworking time to rest time was 4:1 during this experiment.
2.3. Experiment result analysis
Working in hot and humid environment, the physiologicalindices were influenced greatly: heart rate could accelerate forabout 20 min, then hold the line or fluctuate in a small range;mouth temperature could increase 1 �C rapidly for about 20 min,then the increasing trend could be slower or fluctuation could comeout; when the mouth temperature came to 38.5–39 �C, trialvolunteers couldn’t work on and abnormal status of body such asnaupathia, weakness or swirl would appear, which indicated thatthe human heat tolerance limit came; low blood pressure coulddecrease immediately within 20 min of the beginning of working,then fluctuate; the change of high blood pressure would be muchcomplex.
Working in hot and humid environment, human body sweatedgreatly to maintain the balance of body heat by sweat evaporation.It can be seen from the experiment that the high humidity is, theless sweat came and the shorter heat tolerance time is. It wascalculated that when water loss rate per unit time reaches 0.02%–0.03%, human body came to the tolerance limit.
3. Productivity model in hot and humid environment
3.1. The rule of the productivity with time in comfortable condition
In order to compare the basic change rule of productivity in hotand humid environment, the productivity in condition of ASHRAEcomfort zone was also tested, shown as Fig. 2. According to theadaptive comfort standard (ACS) [20], the parameters of thecomfortable environment in which the experiment conducted were26 �C, 60%, 0.2 m/s. It’s concluded that productivity would rise withwork time notably and be in the developing stage within some timeof the beginning of work because of the skill improvement, thenwould be stable and in the mature stage, finally would decrease
Table 2The comparison between regression value and critical value of F-test in ‘‘Heattolerance time model’’.
Physical labour intensity Regression value (F) Critical value (F0.05)
heavy 16.04 F0.05(3,13-3-1)¼ 3.86medium 48.26 F0.05(3,21-3-1)¼ 3.20light 36.82 F0.05(3,21-3-1)¼ 3.20
sharply after tolerance limit and be in decline stage. Therefore, thechange law of productivity can be described as three stages incomfortable condition.
3.2. Heat tolerance time model in hot and humid environment
Heat tolerance time means the working period lasted frombeginning to the time when human body heat tolerance extremecame. While, heat tolerance extreme containing both objective andsubjective meaning means that the physiological indices of workersworking in hot and humid environment come to a dangerous valueor some heat stress disorder symptoms appear, such as vertigo,nausea, etc. In this experiment, when mouth temperature came to38.5 �C, or heart rate came to 165 bpm, or water loss rate came to1%, or some heat stress disorder symptoms appeared, workers wererequired to stop working and that time was considered to be theheat tolerance time.
According to the experiment results, the change of law of heattolerance time with WBGT can be fitted by linear polynomial,quadratic polynomial and cubic polynomial respectively in threeconditions of physical labour intensity respectively using thesoftware of EXCEL [21–23]. The regression results show that onlythe correlation coefficients (R Square) of cubic polynomialfunctions in conditions of heavy, medium and light physicallabour are all more than 0.8, so the cubic polynomial functionswere selected as the final regression results. Figs. 3–5 show theregression curves. These three curves may be a little different inview of the style, especially for Fig. 5, because of the differentWBGT indices at the beginning of the curves. WBGT index beganwith 34 in Fig. 4, 34.5 in Fig. 5, 35 in Fig. 6 due to the differentphysical labour intensity. It can be easily seen that when WBGTmore than 35, all the three curves have the similar style. So inhot and humid environment, the heat tolerance time model inthe form of cubic polynomial are significant, shown as formulas(1)–(3). It’s worth notice that Figs. 3–5 only concluded from theexperiment data in the condition of ‘‘WBGT> 34’’ where heattolerance time had more significant relation with WBGT.
Fig. 9. ‘‘Productivity model’’ regression analysis in condition of heavy physical labourfrom the software of EXCEL.

Fig. 10. ‘‘Productivity model’’ regression analysis in condition of medium physicallabour from the software of EXCEL.
J. Zhao et al. / Building and Environment 44 (2009) 2202–22072206
Heavy physical labour:
thtt ¼ 0:0519WBGT3 � 5:6694WBGT2 þ 206:04WBGT
� 2490:3 (1)
Medium physical labour:
thtt ¼ 0:1508WBGT3 � 16:0601WBGT2 þ 608:11WBGT
� 7411:8 (2)
Light physical labour:
thtt ¼ 0:0869WBGT3 � 9:3769WBGT2 þ 336:24WBGT
� 4004:5 (3)
where thtt (h) is heat tolerance time.Even though the correlation coefficients of the regression
functions are high enough, regression analysis also needed becauseof the limited sample size. F-test is an effective method to test thesignificance of the established regression equations [22]. The F-testresults from EXCEL [21,22] are shown as Figs. 6–8. With a signifi-cance level of 0.05, the critical value F0.05 can be obtained through‘‘F Distribution Table’’ [22]. Table 2 shows the comparison betweenregression value and critical value of F-test in ‘‘Heat tolerance timemodel’’. It can be easily seen that F>> F0.05, so the regression effectis very significant and the fitting functions have much statisticalsignificance.
3.3. Productivity model in hot and humid environment
According to the experiment results, the function of produc-tivity with the variable being WBGT and heat tolerance time can be
Fig. 11. ‘‘Productivity model’’ regression analysis in condition of light physical labourfrom the software of EXCEL.
regressed using the multiple linear regression tool of EXCEL [21–23] in three conditions of physical labour intensity respectively,shown as formulas (4)–(6). In the process of regression analysis, wetook WBGT as variable 1, t as variable 2, t2 as variable 3. Figs. 9–11show the regression analysis results from the software of EXCEL. Itcan be seen from the regression analysis results that the correlationcoefficients (R Square) in three conditions are all more than 0.85.Also, F-test was adopted to test the significance of the establishedregression equations. Table 3 shows the comparison betweenregression value and critical value of F-test in ‘‘productivity model’’.It can be easily seen that F>> F0.05, so the effect of curve regressionis significant and the regression function gives important statisticmeaning and practical value.
Heavy physical labour:
P ¼ �0:5963t2 þ 0:9115t � 0:0676WBGT þ 2:44; t � thtt (4)
Medium physical labour:
P ¼ �0:364t2 þ 0:7476t � 0:05301WBGT þ 2:09; t � thtt (5)
Light physical labour:
P ¼ �0:286t2 þ 0:6256t � 0:07WBGT þ 2:94; t � thtt (6)
where t (h) is work time; t (h) is heat tolerance time; P (%) isproductivity.
4. Conclusion
In this paper, human body experiment and statistics analysiswith the software of EXCEL were applied to establish a heat toler-ance time model and a productivity model in hot and humidenvironment. With the combination of two models, we can obtaina complete model to determine work time and predict productivityperformance in conditions of heavy, medium and light physicallabour in hot and humid environment, shown as formulas (7)–(9).
Heavy physical labour:
thtt ¼ 0:0519WBGT3 � 5:6694WBGT2 þ 206:04WBGT � 2490:3
P ¼ �0:5963t2 þ 0:9115t � 0:0676WBGT þ 2:44; t � t ð7Þ
httMedium physical labour:
thtt ¼ 0:1508WBGT3�16:0601WBGT2þ608:11WBGT �7411:82
P ¼ �0:364t þ0:7476t�0:05301WBGT þ2:09; t � thtt ð8ÞLight physical labour:
thtt ¼ 0:0869WBGT3 � 9:3769WBGT2 þ 336:24WBGT � 4004:5
P ¼ �0:286t2 þ 0:6256t � 0:07WBGT þ 2:94; t � thtt ð9Þ
Acknowledgements
The authors would like to thank all the trial volunteers whoshowed the enthusiasm and seriousness in the experiment forcompleting this experiment.

J. Zhao et al. / Building and Environment 44 (2009) 2202–2207 2207
References
[1] Zhu N, Zhao J. Research on heat tolerance of extreme thermal environment inhyperthermal coal mine. Building Energy and Environment 2006;25(5):34–7.
[2] Lu SL, Zhu N, Sun LJ. Heat stress index and evaluation for extreme heatenvironment. Journal of Refrigeration 2006;27(4):45–9.
[3] Hancher DE, Abd-Elkhalek HA. The effect of hot weather on construction laborproductivity and costs. Cost Engineering 1998;40(4):32–6.
[4] Ministry of Health. Hygienic standards for the design of industrial enterprises(GBZ 1-2002). Beijing: China Law Press; 2002.
[5] General Administration of Quality Supervision. Inspection and quarantine ofthe People’s Republic of China. Standard of the grading of high-temperaturework (GB/T4200-1997). Beijing: China Standard Press; 1997.
[6] ISO 7243. Hot environments-estimation of the heat stress on working man,based on the WBGT-index (wet bulb globe temperature). Geneva: ISO; 1989.
[7] Aynur K, Serdar U. A different approach to construction labour in Turkey: com-parative productivity analysis. Building and Environment 2004;39(1):93–100.
[8] Thomas HR, Riley DR, Sanvido VE. Loss of labor productivity due to deliverymethods and weather. Journal of Construction Engineering and Management1999;125(1):39–46.
[9] Auliciems A, Szokolay SV. Thermal comfort. Australia: Department of Archi-tecture, University of Queensland; 1997.
[10] Korb S, Sherif M. Thermal environment and construction workers’ productivity:some evidence from Thailand. Building and Environment 2003;38(2):339–45.
[11] Olli S, William JF, David F. Cost benefit analysis of the night-time ventilativecooling in office building, http://www.osti.gov/bridge/servlets/purl/813396-hZB8LT/native/813396.pdf; 1 June 2003.
[12] Kosonena R, Tan F. Assessment of productivity loss in air-conditioned build-ings using PMV index. Energy and Buildings 2004;36(10):987–93.
[13] Koehn E, Brown G. Climatic effects on construction. Journal of ConstructionEngineering and Management 1985;111(2):129–37.
[14] Thomas HR, Yiakoumis I. Factor model of construction productivity. Journal ofConstruction Engineering and Management 1987;113(4):623–39.
[15] Sherif M, Korb S. Forecasting labor productivity changes in constructionusing the PMV index. International Journal of Industrial Ergonomics2005;35(4):345–51.
[16] ISO 8996. Ergonomics of the thermal environment – determination of meta-bolic rate. Geneva: ISO; 2004.
[17] American Conference of Governmental Industrial Hygienists. TLVs and BEIs;1999.
[18] Lind AR, Bass DE. Optimal exposure time for development of WHO.Symposium on temperature acclimation on acclimatization to heat. Fed Proc1969;22:704–8.
[19] Belding HS, Hatch TF. Index for evaluating heat stress in terms of resultingphysiological strain. Heat Pip Air Condition 1955;27:129–35.
[20] ASHRAE Inc. ASHRAE Standard 55dthermal environmental conditions forhuman occupancy, Atlanta; 1992.
[21] Zhao M. The realization of multiple linear regression forecast and verifi-cation in EXCEL. Journal of Jilin Institute of Chemical Technology2003;20(2):85–7.
[22] He XQ, Liu WQ. Applying regression analysis. Beijing: People’s University ofChina Press; 2001.
[23] John N, William W, Michael HK. Applying linear regression model. Beijing:China Statistics Press; 1990.