Diffusion, super-diffusion and coalescence from a single step

Pd
La
b
a
ARRAA
KADPRT
1
aficcirtfitfta
oitib
(
0d
Research Policy 41 (2012) 401– 413
Contents lists available at SciVerse ScienceDirect
Research Policy
jou rn al h om epage: www.elsev ier .com/ locate / respol
roduction technologies and financial performance: The effect of uneveniffusion among competitors
ucio Fuentelsaza,1, Jaime Gómeza,1, Sergio Palomasb,∗
Research Group Generés, Marketing and Strategy, Universidad de Zaragoza, Gran Vía 2, 50005 Zaragoza, SpainResearch Group Generés, Marketing and Strategy, Universidad de Zaragoza, María de Luna 3 (Edificio Betancourt), 50018 Zaragoza, Spain
r t i c l e i n f o
rticle history:eceived 9 June 2010eceived in revised form 30 August 2011ccepted 13 September 2011vailable online 11 October 2011
a b s t r a c t
We explore the impact of a production technology on financial performance from the perspectives oftechnology diffusion and competitive strategy theory. We analyse how diffusion at firm and marketlevels influences the returns from the technology. We suggest that firm heterogeneity in the level oftechnology use leads to competitive advantages for relatively intensive adopters. We empirically testour propositions through the analysis of the diffusion of the Automated Teller Machine among Spanish
eywords:TMiffusionrofitabilityelative use
savings banks between 1986 and 2004. Our results show that it is not the absolute but the relative levelof use that drives the impact of the technology on profitability. Furthermore, as the technology is moreintensively deployed in the market, the profitability of every firm decreases. Interestingly, in our empiricalsetting, this negative effect eventually leads to an aggregate negative impact on the profitability of thesavings banks.
echnology
. Introduction
The management of new technologies is receiving increasingttention in strategic management research (Greve, 2009). Therequent introduction of new technologies, their ever shorten-ng lifecycles and their fast rates of diffusion have redefined theharacteristics and boundaries of many industries, posing complexhallenges to the firm (Bettis and Hitt, 1995). The ease with whichmitation occurs plays a critical role in the determination of theents that a firm is able to capture from a new technology. One ofhe consequences of the diffusion of a new technology among therms operating in an industry is a competitive process which altershe price of goods and services and the remuneration of productiveactors (Schumpeter, 1934; Teece, 1986). This process results inhe dissipation of the economic rents that might otherwise haveccrued to the innovator.
The importance of imitation for the appropriation of the valuef an innovation is clear in information technologies (IT). Adopt-ng firms usually have to learn to live with the wide diffusion of
hese technologies, which should dissipate any potential compet-tive advantage (Carr, 2003). As a result, these technologies haveeen described as strategic necessities: their impact on performance∗ Corresponding author. Tel.: +34 976 761000; fax: +34 976 761767.E-mail addresses: [email protected] (L. Fuentelsaz), [email protected]
J. Gómez), [email protected] (S. Palomas).1 Tel.: +34 976 761000; fax: +34 976 761767.
048-7333/$ – see front matter © 2011 Elsevier B.V. All rights reserved.oi:10.1016/j.respol.2011.09.006
© 2011 Elsevier B.V. All rights reserved.
makes their adoption a necessary condition for any firm to stayin business, but their wide availability reduces their capability togenerate above-normal profits (Clemons and Kimbrough, 1986;Clemons and Row, 1991). Given the importance of imitation in thiscontext, this article focuses on an IT application to investigate howcompetitive imitation conditions the impact of a new productiontechnology on firm profitability.
Researchers on the impact of technological innovations onfinancial performance have explored several sources of economicrents for adopters apart from the adoption in itself. Among them,we can highlight the control of complementary resources and capa-bilities (Aral and Weill, 2007; Powell and Dent-Micallef, 1997;Schroeder et al., 2002), the degree of fit between the technologyand the strategy of the firm (Chan and Reich, 2007; Chari et al.,2008; Henderson and Venkatraman, 1993; Oh and Pinsonneault,2007), the importance of innovative capabilities that lead to a con-tinuous flow of innovations (Damanpour et al., 2009; Roberts, 1999;Roberts and Amit, 2003) and the timing of adoption (Dos Santos andPeffers, 1995; Hoppe, 2000). These research streams share the ideathat imitability plays a critical role. However, empirical analysesof how the imitation process by itself determines the capability ofadopters to profit from their innovations are scarce.
To explore the effect of competitive imitation, we focus on twofeatures of the technology diffusion process. Firstly, it leads to per-
sistent levels of heterogeneity among the firms that populate anindustry. Internal deployment differs from adopter to adopter inits intensity and temporal profile (Battisti et al., 2009; Battisti andStoneman, 2003, 2005; Fuentelsaz et al., 2003; Mansfield, 1963b).
4 arch P
Dcoo(itftd
fiwOlrpla
taq(1t1Ptreiauw
2
gaeanfnIItneiTscfitot
iiT
02 L. Fuentelsaz et al. / Rese
ifferences in level of use may allow some firms to improve theirompetitive position in relation to their rivals.2 Secondly, as a resultf the growing intensity with which every firm uses the technol-gy, it becomes more and more intensively deployed in the industryBattisti and Stoneman, 2003; Karshenas and Stoneman, 1995). Thencrease in the industry-wide diffusion affects the potential rentshat accrue to adopters (Schumpeter, 1934; Teece, 1986). There-ore, the observation of the imitation (diffusion) process of theechnology can shed light on the pattern of rent generation andissipation.
Given that the concept of competitive advantage emphasizes arm’s relative position (Porter, 1985, 1991), in this research, weill focus on the differences in the level of use between firms.ur framework attributes a limited importance to the absolute
evel of use of the technology and changes its focus towards theelative level of use of the focal firm compared to its direct com-etitors. We also analyse how the diffusion process at the market
evel influences profitability over time through its impact on thettractiveness of the industry.
We study the impact of technology on financial performance inhe context of the diffusion of the Automated Teller Machine (ATM)mong Spanish savings banks. This classical IT application has fre-uently been defined as a strategic necessity in the banking sectorBanker and Kauffman, 1988; Clemons, 1991; Clemons and Row,991). Previous research suggests that late and non-adopters foundhemselves at a competitive disadvantage (Banker and Kauffman,988; Clemons, 1991; Clemons and Row, 1991; Dos Santos andeffers, 1995; Hannan and McDowell, 1990). In the Spanish case,his technology was adopted by all the savings banks within aelatively short period of time, questioning its capability to gen-rate competitive advantages. Our sample allows us to analyse thempact of the ATM almost from its inception to its consolidation as
basic IT in retail banking. Interestingly, our data not only allowss to observe the time of first adoption, but also the intensity withhich the technology has been internally diffused by each firm.
. Technology diffusion and competitive advantage
Research on the impact of IT has concluded that these technolo-ies give adopters several benefits, such as increased labour anddministrative productivity, higher flexibility and improved costfficiency (Clemons and Row, 1991; Hitt and Brynjolfsson, 1996; Ohnd Pinsonneault, 2007; Rai et al., 1997). However, these benefits doot seem to be easily translated into abnormal economic rents (see,
or instance, Hitt and Brynjolfsson, 1996; Rai et al., 1997). The expla-ation for this apparent contradiction is that the high imitability of
T usually precludes them from generating competitive advantages.n other words, any potential advantages stemming from IT adop-ion would be competed away as soon as other firms adopt theew technology, leading to a situation of competitive parity. How-ver, any firm that decides not to adopt the technology will findtself at a competitive disadvantage, which threatens its existence.his is what has come to be called the strategic necessity hypothe-is (Clemons and Kimbrough, 1986; Clemons and Row, 1991). Theonclusions of this hypothesis can be summarized in two points: (i)rms failing to adopt the technology will experience a reduction in
heir competitiveness and have less-than-normal returns; (ii) thenly reward that adopters can expect is competitive parity, givenhat this is a non-scarce (and non-inimitable) resource.2 By level of use we mean the intensity with which the technology has beenncorporated into the productive process, which has been termed intrafirm diffusionn technology diffusion research (Battisti and Stoneman, 2003; Mansfield, 1963b).herefore, level of use means “amount of technology deployed per activity unit”.
olicy 41 (2012) 401– 413
This hypothesis is based on the commodity character of IT and itslow acquisition and adjustment costs (Carr, 2003; Mata et al., 1995).However, the hypothesis may result in an unnecessarily restrictiveperspective of the diffusion process. Contrary to the assumption offast and homogeneous adoption that is implicitly maintained in thestrategic necessity hypothesis, the diffusion process can be com-plex. Research on technology diffusion has shown that, even whena technology is valuable and readily available, its adoption by differ-ent organizations takes a long time to occur (Battisti and Stoneman,2003; Greve, 2009; Griliches, 1957; Mansfield, 1961, 1963a; Rogers,1983) and every adopter also requires long periods to completelyincorporate it into its productive process (Battisti and Stoneman,2005; Fuentelsaz et al., 2003; Mansfield, 1963b). Factors such as thelack of complementary assets or technologies, incompatibility withthe strategy or the activities carried out by the firm, the presence ofsubstitute technologies, and differences in financial resources canprevent some firms from exploiting a technology as successfully asothers, creating persistent differences in their level of use (Battistiet al., 2009; Battisti and Iona, 2009; Battisti and Stoneman, 2005;Fuentelsaz et al., 2003; Hollenstein and Woerter, 2008; Mansfield,1963b).
Technological diffusion research shows that diffusion deviatessystematically from the ideal scenario of perfect and immedi-ate imitation. Some firms deploy the technology in ways thattheir rivals seem unable to emulate. Thus, new technologies maybe capable of generating firm heterogeneity even when they arewidely available in the market. Therefore, to explore whether thediffusion process actually results in the dissipation of superioreconomic rents or whether, in contrast, differences in intrafirm dif-fusion are persistent enough to allow for the existence of durablecompetitive advantages is a valuable task that may complementother perspectives. With these ideas in mind, we argue that thestudy of the diffusion process of a technology can reveal impor-tant information for the explanation of performance differencesbetween firms.
Our framework is borrowed from competitive strategy theory,which states that the success of a firm depends on the attractivenessof the industry and on the relative position the firm has vis-à-visits rivals (Porter, 1980, 1991). The concept of industry attractive-ness includes factors that affect all the firms that compete in theindustry. Consequently, it is not useful for explaining intra-industryperformance differences. Relative position depends on the total costand the value added by the activities that the firm implements, incomparison to the value added and cost incurred by the other firmsoperating in the market (Porter, 1991, 1996). The key point of thecompetitive strategy framework is that the competitive value of anydecision made by a firm has to be evaluated in relation to its directcompetitors. Therefore, we will focus on the concept of relativeposition and how it can be used to explain competitive advantagesstemming from IT-based production technologies. Additionally, toobtain a fuller picture of the result of competitive imitation, wediscuss how the diffusion process at the market level affects theprofitability of both adopters and non-adopters.
2.1. IT adoption and competitive advantage
In the first years of IT research, there were different positionsregarding the potential of IT to provide competitive advantages andsuperior financial performance. Early case studies characterized ITas groundbreaking technologies which would redefine the basis ofmodern competition in favour of intensive users (Clemons, 1986;McFarlan, 1984; Parsons, 1983; Porter and Millar, 1985). In this
first stage, discussion on the impact of IT on financial performancemostly consisted of conceptual frameworks to assist managers inthe introduction of ITs, and empirical evidence was mostly based onselected case studies of successful IT implementation (Powell and
rch Po
Dtw
sgfi(Ktcf(wbsptmcctRa1pdgnidfi
rcfiapacbp(tAtiewegtFtcwi
thgs2pbt
L. Fuentelsaz et al. / Resea
ent-Micallef, 1997). Financial performance measurement tendedo be centred on the case under analysis, and it was usually mixedith operational performance measures (Rai et al., 1997).
In contrast, later empirical research, conducted on largeamples, using robust research methodologies, and taking homo-eneous and generalizable approaches to the measurement ofnancial performance, failed to find consistent positive effectsFloyd and Wooldridge, 1990; Hitt and Brynjolfsson, 1996;ettinger et al., 1994; Rai et al., 1997). These authors attributed
he apparent lack of relationship between IT investment and finan-ial performance to the inability of adopting firms to prevent rivalsrom imitating the technology. In this context, Clemons and Row1991) coined the term strategic necessity to refer to technologiesithout which a firm would face severe competitive disadvantage,
ut whose adoption is unlikely to lead to profitability increases. Thetrategic necessity hypothesis considers that it is difficult to appro-riate the value from IT because, soon after their introduction, theseechnologies are widely available throughout the industry as com-
odities and at decreasing costs (Carr, 2003; Mata et al., 1995). Theonventional views in strategic management state that, under theseonditions, an asset cannot be the source of a competitive advan-age (Amit and Schoemaker, 1993; Barney, 1991; Peteraf, 1993;umelt, 1987). Once the value of a resource is known (in this case,n IT application), in the absence of isolating mechanisms (Rumelt,987) or ex-post barriers to competition (Peteraf, 1993), every com-etitor may adopt it, resulting in its industry-wide imitation and theissipation of any potential economic rent. Therefore, the argumentoes, the mere acquisition and deployment of an IT application isot enough to obtain competitive advantages. In other words, the
ntensity with which the technology is incorporated into the pro-uctive process (i.e., level of use) will not necessarily be related tonancial performance.
However, it does not imply that firms cannot obtain economicents from the adoption of a specific IT application. Indeed, ourontention is that technology deployment is a necessary but insuf-cient condition for competitive advantages to arise. It is not thebsolute, but the relative level of use that determines the com-etitive value of a new technology. Competitive strategy theoryrgues that firms that perform their activities at a collectively lowerost than their rivals, or perform them in ways that create higheruyer value, allowing the firm to set a higher price than their com-etitors, achieve a competitive advantage and superior profitabilityPorter, 1991, 1996). Therefore, the existence of competitive advan-ages should be examined within the competitive scope of the firm.pplying this logic to the case of new technologies, it can be inferred
hat the impact of an IT application depends not only on the adopt-ng firm’s efforts (the absolute level) but also on the technologicalfforts made by the other firms in the market. A given level of use,ith the corresponding improvement in operational efficiency or
ffectiveness (Devaraj and Kohli, 2003; Fuentelsaz et al., 2009), willenerate different competitive outcomes depending on the extento which competitors have been able to put the technology to use.irms that can diffuse the technology internally with more intensityhan their direct competitors will obtain higher aggregated effi-iency improvements. As a result, these relatively intensive usersill obtain a competitive advantage and, consequently, an increase
n profitability.This implies a shift in the causal link between technology adop-
ion and profitability from the direct link that the strategic necessityypothesis considers. Bearing in mind that technologies are hetero-eneously adopted and internally diffused by firms operating in theame industry (Battisti and Stoneman, 2003, 2005; Fuentelsaz et al.,
003; Mansfield, 1963b), the possibility of the existence of com-etitive advantages should be acknowledged. An organization maye an intensive user and obtain moderate or no returns from theechnology if its direct competitors have massively incorporatedlicy 41 (2012) 401– 413 403
the same technology into their productive processes. Conversely,a firm with an apparently low level of technology use may enjoya competitive advantage in markets where competitors are unableto deploy it satisfactorily.
Hypothesis 1. A higher level of use relative to other firms com-peting in the same markets positively influences firm profitability.
2.2. Diffusion in the market and firm profitability
So far, we have focused on the diffusion process occurring withinthe focal firm and its competitors (i.e., their intrafirm diffusion pro-cesses). However, diffusion at market level is also important forexplaining the impact of a new technology on profitability. As thenumber of adopters and the intensity with which the technologyis deployed in the industry increase, the resulting changes in theproductive structure and the market conditions will also have animpact on firm performance by altering the attractiveness of theindustry.
Classical works in economics have suggested that the imita-tion of a technology dissipates the economic rents of the innovator(Schumpeter, 1934, 1950). New adopters erode the profits obtainedby previous adopters because they bid for the productive factorsnecessary for using the technology and push market prices downin their attempts to remain competitive. This is what has beencalled the stock effect in technology diffusion research (Götz, 1999;Karshenas and Stoneman, 1993). Non-adopters are also affected bythe diffusion of the technology. As the technology is more inten-sively incorporated into the productive process, industry averagecosts fall, resulting in lower product prices. Therefore, as the tech-nology penetrates into the industry, the average profitability fornon-adopters also decreases (Jovanovich and MacDonald, 1994;Stoneman and Kwon, 1996). It is important to note that most pre-vious research assumed this negative effect, but only a few articleshave empirically explored this relationship (e.g., Schroeder, 1990;Stoneman and Kwon, 1996).
An extreme case is presented in Schroeder (1990). This is adescriptive case study in which the author analysed the diffusion ofa new production technology in the founding industry, the Flask-less Matchplate Molding. This new productive process significantlyincreased efficiency in the matchplate market. Adopters initiallyobtained significant increases in profitability. However, within afew years, every firm in the sector was forced to adopt the new tech-nology to stay in the matchplate business, which led to its intensiveimitation. The dramatic increases in efficiency spread throughoutthe industry and pushed prices down. When the diffusion processwas completed, average profitability had fallen below the levelsthat had existed before the introduction of the Flaskless Match-plate Molding. Schroeder cites a manager who reported that, afterthe introduction of the technology in 1972, gross margins rose from13 to 22 percent. Twelve years later, when the technology had beenwidely adopted, margins for the same activity had dropped to lessthan 8 percent (Schroeder, 1990, p. 32).
There are situations in which the industry-wide diffusion maygenerate positive externalities. First, diffusion of a technologyprompts its establishments as a dominant design (Schilling, 1999;Suarez, 2004). After a dominant design emerges, uncertainty aboutthe future of the technology is reduced, attracting technology andcomplementary assets suppliers and increasing the confidence ofcustomers (Anderson and Tushman, 1990; Schilling, 1999). As aresult, the diffusion of the technology may enhance profitabilityat decreasing marginal rates. However, this effect should be found
only in the first stages of the diffusion process, when the market forthe technology and complementary assets is still developing. Aftera dominant design has been settled and potential suppliers havealready accrued, the congestion effect described above is expected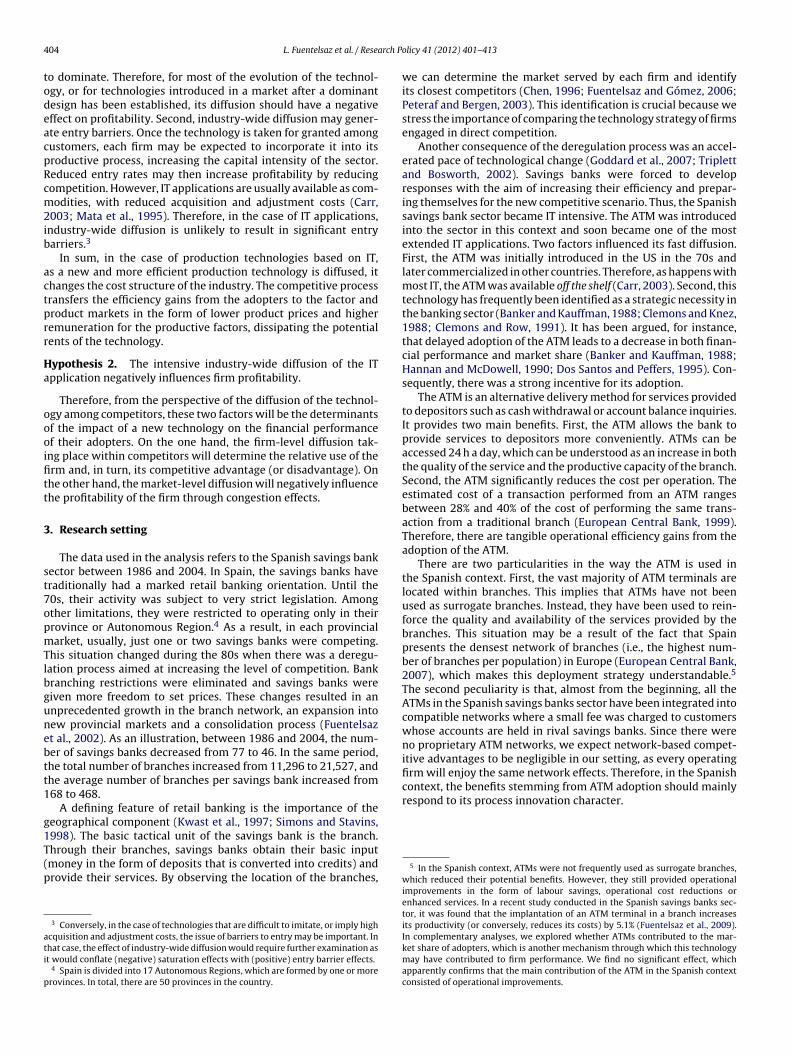
4 arch P
todeacpRcm2ib
actprr
Ha
oooifitt
3
st7opmTlbgunebtt1
g1T(p
ati
p
context, the benefits stemming from ATM adoption should mainlyrespond to its process innovation character.
04 L. Fuentelsaz et al. / Rese
o dominate. Therefore, for most of the evolution of the technol-gy, or for technologies introduced in a market after a dominantesign has been established, its diffusion should have a negativeffect on profitability. Second, industry-wide diffusion may gener-te entry barriers. Once the technology is taken for granted amongustomers, each firm may be expected to incorporate it into itsroductive process, increasing the capital intensity of the sector.educed entry rates may then increase profitability by reducingompetition. However, IT applications are usually available as com-odities, with reduced acquisition and adjustment costs (Carr,
003; Mata et al., 1995). Therefore, in the case of IT applications,ndustry-wide diffusion is unlikely to result in significant entryarriers.3
In sum, in the case of production technologies based on IT,s a new and more efficient production technology is diffused, ithanges the cost structure of the industry. The competitive processransfers the efficiency gains from the adopters to the factor androduct markets in the form of lower product prices and higheremuneration for the productive factors, dissipating the potentialents of the technology.
ypothesis 2. The intensive industry-wide diffusion of the ITpplication negatively influences firm profitability.
Therefore, from the perspective of the diffusion of the technol-gy among competitors, these two factors will be the determinantsf the impact of a new technology on the financial performancef their adopters. On the one hand, the firm-level diffusion tak-ng place within competitors will determine the relative use of therm and, in turn, its competitive advantage (or disadvantage). Onhe other hand, the market-level diffusion will negatively influencehe profitability of the firm through congestion effects.
. Research setting
The data used in the analysis refers to the Spanish savings bankector between 1986 and 2004. In Spain, the savings banks haveraditionally had a marked retail banking orientation. Until the0s, their activity was subject to very strict legislation. Amongther limitations, they were restricted to operating only in theirrovince or Autonomous Region.4 As a result, in each provincialarket, usually, just one or two savings banks were competing.
his situation changed during the 80s when there was a deregu-ation process aimed at increasing the level of competition. Bankranching restrictions were eliminated and savings banks wereiven more freedom to set prices. These changes resulted in annprecedented growth in the branch network, an expansion intoew provincial markets and a consolidation process (Fuentelsazt al., 2002). As an illustration, between 1986 and 2004, the num-er of savings banks decreased from 77 to 46. In the same period,he total number of branches increased from 11,296 to 21,527, andhe average number of branches per savings bank increased from68 to 468.
A defining feature of retail banking is the importance of theeographical component (Kwast et al., 1997; Simons and Stavins,
998). The basic tactical unit of the savings bank is the branch.hrough their branches, savings banks obtain their basic inputmoney in the form of deposits that is converted into credits) androvide their services. By observing the location of the branches,3 Conversely, in the case of technologies that are difficult to imitate, or imply highcquisition and adjustment costs, the issue of barriers to entry may be important. Inhat case, the effect of industry-wide diffusion would require further examination ast would conflate (negative) saturation effects with (positive) entry barrier effects.
4 Spain is divided into 17 Autonomous Regions, which are formed by one or morerovinces. In total, there are 50 provinces in the country.
olicy 41 (2012) 401– 413
we can determine the market served by each firm and identifyits closest competitors (Chen, 1996; Fuentelsaz and Gómez, 2006;Peteraf and Bergen, 2003). This identification is crucial because westress the importance of comparing the technology strategy of firmsengaged in direct competition.
Another consequence of the deregulation process was an accel-erated pace of technological change (Goddard et al., 2007; Triplettand Bosworth, 2002). Savings banks were forced to developresponses with the aim of increasing their efficiency and prepar-ing themselves for the new competitive scenario. Thus, the Spanishsavings bank sector became IT intensive. The ATM was introducedinto the sector in this context and soon became one of the mostextended IT applications. Two factors influenced its fast diffusion.First, the ATM was initially introduced in the US in the 70s andlater commercialized in other countries. Therefore, as happens withmost IT, the ATM was available off the shelf (Carr, 2003). Second, thistechnology has frequently been identified as a strategic necessity inthe banking sector (Banker and Kauffman, 1988; Clemons and Knez,1988; Clemons and Row, 1991). It has been argued, for instance,that delayed adoption of the ATM leads to a decrease in both finan-cial performance and market share (Banker and Kauffman, 1988;Hannan and McDowell, 1990; Dos Santos and Peffers, 1995). Con-sequently, there was a strong incentive for its adoption.
The ATM is an alternative delivery method for services providedto depositors such as cash withdrawal or account balance inquiries.It provides two main benefits. First, the ATM allows the bank toprovide services to depositors more conveniently. ATMs can beaccessed 24 h a day, which can be understood as an increase in boththe quality of the service and the productive capacity of the branch.Second, the ATM significantly reduces the cost per operation. Theestimated cost of a transaction performed from an ATM rangesbetween 28% and 40% of the cost of performing the same trans-action from a traditional branch (European Central Bank, 1999).Therefore, there are tangible operational efficiency gains from theadoption of the ATM.
There are two particularities in the way the ATM is used inthe Spanish context. First, the vast majority of ATM terminals arelocated within branches. This implies that ATMs have not beenused as surrogate branches. Instead, they have been used to rein-force the quality and availability of the services provided by thebranches. This situation may be a result of the fact that Spainpresents the densest network of branches (i.e., the highest num-ber of branches per population) in Europe (European Central Bank,2007), which makes this deployment strategy understandable.5
The second peculiarity is that, almost from the beginning, all theATMs in the Spanish savings banks sector have been integrated intocompatible networks where a small fee was charged to customerswhose accounts are held in rival savings banks. Since there wereno proprietary ATM networks, we expect network-based compet-itive advantages to be negligible in our setting, as every operatingfirm will enjoy the same network effects. Therefore, in the Spanish
5 In the Spanish context, ATMs were not frequently used as surrogate branches,which reduced their potential benefits. However, they still provided operationalimprovements in the form of labour savings, operational cost reductions orenhanced services. In a recent study conducted in the Spanish savings banks sec-tor, it was found that the implantation of an ATM terminal in a branch increasesits productivity (or conversely, reduces its costs) by 5.1% (Fuentelsaz et al., 2009).In complementary analyses, we explored whether ATMs contributed to the mar-ket share of adopters, which is another mechanism through which this technologymay have contributed to firm performance. We find no significant effect, whichapparently confirms that the main contribution of the ATM in the Spanish contextconsisted of operational improvements.
L. Fuentelsaz et al. / Research Policy 41 (2012) 401– 413 405
0,00
0,50
1,00
1,50
2,00
2,50
3,00
3,50
2004200220001998199619941992199019881986Year
ATM
s pe
r bra
nch
Mean
Minimum
Maximum
1986 198 7 198 8 198 9 199 0 199 1 1992 199 3 199 4 199 5 199 6 1997 199 8 199 9 200 0 200 1 20 02 200 3 200 4 Mean 0.24 0.32 0.41 0.51 0.57 0.65 0.73 0.81 0.86 0.91 0.96 1.02 1.09 1.15 1.20 1.25 1.29 1.32 1.33
Minimum 0.00 0.00 0.09 0.12 0.12 0.14 0.20 0.28 0.34 0.40 0.44 0.49 0.52 0.55 0.60 0.65 0.70 0.73 0.75
Maximum 1.50 1.88 1.47 1.47 1.47 1.63 1.71 1.81 1.78 1.79 1.83 1.86 2.42 2.62 3.17 3.21 2.91 2.75 2.69
S.D. 0.24 0.27 0.26 0.30 0.28 0.29 0.32 0.34 0.34 0.34 0.32 0.33 0.39 0.41 0.45 0.46 0.45 0.46 0.45
6 15,2
mong
i1safbwwifpa(h
viltaAadwadfdiod
fHS
sFi
tion rate and the evolution of the population in the 50 provincial
ATMs 3,05 8 3,95 4 5,60 9 7,80 8 9,43 7 11 ,08 4 12 ,26 8 13 ,34 6 14 ,14
Fig. 1. Number of ATMs per branch a
By 1988, every savings bank had installed its first ATM. At thendustry level, the diffusion process was strikingly fast. Between986 and 2004, the number of ATM terminals operated by theavings banks rose tenfold, from 3058 to 30,349, and the aver-ge number of ATM terminals operated by each savings bank roserom 40 to 660. In the same period, the branch network only dou-led and the number of inhabitants increased by 12%. As a result,hile the density of ATMs in the savings bank industry in 1986as of one ATM for every 12,581 inhabitants, 19 years later it had
ncreased to one ATM for every 1423 inhabitants. The intrafirm dif-usion level of the ATM also increased dramatically in the sameeriod.6 This process is important because it represents how thedopting organization is actually putting the technology to useMansfield, 1963b; Battisti and Stoneman, 2003) and captures theeterogeneity in the level of use by the organization.
Fig. 1 depicts the intrafirm diffusion process of the ATM. Theertical axis shows the ratio of ATM terminals per branch. The hor-zontal axis shows calendar years, from 1986 to 2004. The upperine shows the maximum intrafirm diffusion level in each period,he lower line represents the minimum intrafirm diffusion level,nd the middle line represents the mean intrafirm diffusion level.s the figure shows, the internal diffusion of the ATM continued for
long time after the initial adoption. In 2004, the mean intrafirmiffusion level was more than three times the mean level of 1988,hen every savings bank had already adopted the ATM. It can
lso be observed that this process was very heterogeneous, as theifference between the maximum and the minimum intrafirm dif-usion levels in each period shows. The most intensive users haveeployed the ATM up to 3.5 times more intensively than the least
ntensive users. There are no signs of convergence in the 19 yearsf evolution that we observe, and the standard deviation almostoubles between the first and last years of our observation window.
The ATM diffusion process has received a great deal of attention
rom the technological diffusion literature (Fuentelsaz et al., 2003;annan and McDowell, 1984, 1987; Saloner and Shepard, 1995;harma, 1993). The adoption of the technology has been found to6 We measure the level of use as the ratio of ATM terminals to branches. This mea-ure has previously been used for the analysis of this technology (see, for instance,uentelsaz et al., 2003; or Humphrey, 1994) and is consistent with research on thentrafirm diffusion of technologies (Mansfield, 1963b; Battisti and Stoneman, 2003).
86 16 ,54 2 18 ,979 21 ,49 1 23 ,37 4 24,82 9 26 ,23 7 27 ,968 29 ,16 2 30 ,34 9
Spanish savings banks (1986–2004).
depend on a number of factors such as technical improvements,industry level characteristics (regulation, concentration), the adop-tion behaviour of rivals (rival precedence, percentage of adopters)and the characteristics of the firm and its strategy (labour expenses,size of the branch, products offered). In sharp contrast, intrafirmdiffusion has been less studied, arguably because of limited dataavailability (Battisti et al., 2007). However, the patterns identifiedin the internal deployment process seem to parallel those in inter-firm diffusion (Fuentelsaz et al., 2003). Therefore, the heterogeneityin the deployment of the ATM may be a result of the competitiveenvironment in which each firm operates, the strategy it follows orits specific configuration of resources and activities.7
4. Data and methods
4.1. Data and variables
Our empirical analysis considers the period 1986–2004. Thisperiod covers the diffusion of ATMs almost from their inception,when the technology had still not been adopted by every organiza-tion and the average intrafirm diffusion level was below one ATMterminal per every four branches. The data were collected fromtwo public sources: the Spanish Confederation of Savings Banks(CECA) and the National Institute of Statistics (INE). CECA is a pro-fessional association that includes all the savings banks operatingin the country. It publishes the balance sheets and financial state-ments of every firm at the end of the year, as well as the distributionof their branches among the 50 provinces that make up the Spanishnational territory. CECA also reports the number of ATMs deployedby each firm. The INE is our source for information about the infla-
markets.
7 Note that this research is concerned with the consequences of the diffusionprocess, not with its causes. It will be assumed that differences in the level of adop-tion will be the result of differences in firm specific characteristics and competitiveenvironments. Nevertheless, we have to assume that there is some degree of endo-geneity in decisions regarding technology strategy. This will be taken into accountin Section 4.

4 arch P
4
pctnidTfiubaoaop
mtgad1tsssfis
4
duut
L
wswp
fIt
R
ia
bBboii
depending on whether branches are located in small villages orlarge cities. Therefore, we also include a control for the rural orien-tation of the focal savings banks. It is measured as the percentage
06 L. Fuentelsaz et al. / Rese
.1.1. Dependent variablesThe usual methods employed in the literature to measure the
rofitability of the firm include accounting-based measures, price-ost margins and Tobin’s q ratio (Scherer and Ross, 1990). Sincehe Spanish savings banks are not publicly traded, Tobin’s q ratio isot available as a profitability measure. In addition, the multiplic-
ty of products and services offered by retail banking firms makes itifficult to estimate an appropriate measure of price-cost margin.herefore, we measure profitability through an accounting-basednancial measure: Return on Assets (ROA). ROA has already beensed as the financial performance measure when analysing theanking sector (see, for instance, Barnett et al., 1994 or Robertsnd Amit, 2003), and, more generally, when assessing the impactf information systems investments on business profitability (Hittnd Brynjolfsson, 1996). This measure is calculated as the ratiof pretax profits divided by total assets, expressed in percentageoints.
The use of secondary sources of information on financial perfor-ance is especially suitable for within-industry studies. However,
wo concerns are usually associated with their use: potential aggre-ation problems when working at the strategic business unit levelnd restrictions to interfirm comparability as a consequence ofifferences in accounting policies (Venkatraman and Ramanujam,986, p. 808). Aggregation problems are irrelevant because we takehe organization as the unit of analysis. Regarding comparability,avings banks are subject to close government monitoring and verytrict accounting norms, which preclude them from applying firm-pecific accounting policies. Therefore, the usual concerns aboutnancial performance measures of profitability do not seem to beignificant in this setting.
.1.2. Independent variablesThe variables of interest in this research are those related to the
iffusion of the technology: the level of use of each firm, its relativese and the extent of technology diffusion in the market. Level ofse is a measure of intrafirm diffusion constructed as the ratio ofhe number of ATMs per branch.
evel of usei = ATMi
Branchesi
here i stands for the firm (time subscripts have been removed forimplicity). This variable is meant to represent the intensity withhich the technology has been incorporated into the productiverocess of the focal firm.
Relative use (Hypothesis 1) is measured as the level of use of theocal firm compared with the level of use of its direct competitors.8
t is expressed as a ratio, so that small differences will be less impor-ant the more intensively the technology is used:
level of use
elative usei = iaverage level of use of rivalsi
A value of 1 in this variable means that, on average, the firm hasncorporated the ATM with the same intensity as its rivals. Valuesbove 1 mean that the firm uses the ATM more intensively than
8 Market overlap (or market coincidence) is a necessary condition for firms toe labelled as competitors (Chen, 1996; Fuentelsaz and Gómez, 2006; Peteraf andergen, 2003). In the context of retail banking activities, geographic location ofranches is a valid criterion for the identification of the markets in which the firmperates (Kwast et al., 1997; Simons and Stavins, 1998). As a consequence, the phys-cal coincidence of branches is the method we choose to identify the pattern ofnterfirm rivalry.
olicy 41 (2012) 401– 413
its competitors. Conversely, values below 1 imply that the firm is alow user of the ATM with respect to its direct rivals.9
Technology diffusion in the market (Hypothesis 2) is the thirdvariable of interest. A simple count of the number of adopters doesnot sufficiently capture the industry level of diffusion (Battisti andStoneman, 2003). Instead, it is necessary to account for the intensityof technology deployment. Accordingly, the diffusion of the tech-nology at the industry level is measured as the number of ATMs inuse per 1000 inhabitants in the market domain of firm i.
Technology diffusioni = ATM in market domaini
population in market domaini× 1000
A higher value of this variable would mean that the technologyis more diffused. Unfortunately, information about the number ofATMs at the provincial level is not available. In order to estimatethe intensity of diffusion in each province (ATMs/population), weassume that savings banks distribute their ATMs among the differ-ent provinces proportionally to their branches.10 To calculate thismeasure at the firm level, we calculate the weighted average of theprovinces in which firm i operates.11
4.1.3. Control variablesA number of control variables are included in the estimations.
First, following conventional structure-performance foundations,we include controls for market concentration and market share. Tooperationalize these variables, concentration is measured throughthe weighted Herfindahl index in the markets in which the firmoperates (branches are used as a weight). The market share of a firmin a given market is calculated in terms of the number of branches.Firms operating in more concentrated markets are expected toobtain higher profitability as a consequence of the potential allevi-ation of competition. Similarly, the efficiency hypothesis suggeststhat market share is correlated with firm profitability.
We consider a control for firm size (logarithm of total assets). Theeffect of size in the banking sector is not clear. Although there arescale economies in the sector, the optimum size may be relativelysmall. Beyond this optimum scale it cannot be predicted a prioriwhether coordination costs or efficiency benefits will predominate(Berger et al., 1999; Boot and Marinc, 2008). We also control forfirm risk (total loans to total assets). Firms that absorb higher levelsof risk tend to obtain better results because of the higher interestrate charged on this kind of financial assets (Carbó et al., 2003). Theperiod analysed was characterized by a marked growth in everyorganization. As variations in assets may influence the financialperformance of the firm, we also include a control for growth, cal-culated as the ratio of the total assets in period t to total assets inperiod t − 1.
There may be systematic differences in financial performance
9 The “average level of use of rivals” is calculated as a weighted average of thelevel of use of direct competitors. As weights, we use the number of branches inorder to calculate the market share of rivals in the market domain of firm i.
10 As long as there is some firm-level component that determines the intrafirmdiffusion level of each organization, the variable we calculate will be correlatedwith the actual value we try to approximate. This assumption does not seem unrea-sonable according to received literature (e.g., Battisti and Stoneman, 2005; Battistiet al., 2009; Hollenstein and Woerter, 2008). However, we are generating measure-ment errors. If measurement errors were correlated with financial performance,which would happen if characteristics of the market influenced both ROA and thedeployment of the technology, our measure would be correlated with shocks inthe dependent variable. The estimation methodology will control for the potentialendogeneity of the variable.
11 We use the market share of firm i in province k as the weighting variable. Thenumber of branches is used as a proxy for market share.

L. Fuentelsaz et al. / Research Po
Tab
le
1D
escr
ipti
ve
stat
isti
cs.
Var
iabl
e
Mea
n
Std
. dev
.
Min
Max
(1)
(2)
(3)
(4)
(5)
(6)
(7)
(8)
(9)
(10)
(11)
1.
RO
A1.
13
0.54
−2.3
2
4.35
1.00
2.
Con
cen
trat
ion
0.15
0.08
0.02
0.53
0.02
1.00
3.
Shar
e0.
40
0.24
0.02
0.99
0.16
0.28
1.00
4.
Size
14.0
4
1.31
10.0
1
17.9
3
−0.1
0
0.03
0.25
1.00
5.
Ris
k
0.53
0.13
0.17
0.89
−0.1
3
−0.0
9
−0.2
9
0.11
1.00
6.
Gro
wth
1.08
0.07
0.80
1.73
−0.0
4
−0.0
4
−0.1
1
0.04
−0.0
1
1.00
7.
Ru
ral
0.29
7
0.69
8
0.00
6.92
0.15
0.25
0.35
−0.2
9
−0.3
8
−0.0
9
1.00
8.
Inst
alle
d
base
0.44
0.21
0.00
1.00
−0.1
7
−0.0
6
−0.0
6
0.60
0.11
0.03
−0.3
1
1.00
9.
Leve
l of u
se0.
81
0.49
0.00
3.20
−0.0
9
−0.0
4
−0.0
6
0.48
0.47
0.00
3
−0.5
6
0.39
1.00
10. R
elat
ive
use
0.95
0.74
0.00
16.0
2
0.01
−0.1
0
−0.0
5
0.06
0.01
0.16
−0.3
1
0.13
0.34
1.00
11. T
ech
nol
ogy
dif
fusi
on0.
41
0.27
0.00
1
1.06
−0.1
7
−0.0
3
−0.4
1
0.31
0.50
−0.0
03
−0.2
8 0.
24
0.61
−0.0
7
1.00
licy 41 (2012) 401– 413 407
of branches located in cities of fewer than 10,000 inhabitants.Additionally, while industry-wide interoperability prevents firm-specific network effects, there may still be firm-specific scaleeconomies resulting from the number of ATM terminals operatedby the focal firm. For instance, a larger installed base permitsspreading installation and maintenance costs, discounts for theacquisition of ATM terminals in large numbers and discounts forfrequently-contracted technical services. Therefore, we include acontrol for installed base, measured as the number of ATM terminals(in thousands) operated by the focal firm.
We allow for year and firm fixed effects. Year fixed effectsare included to control for the economic cycle and other year-specific unobservable factors affecting all the firms in the industry.The ATM is a classical network technology (Saloner and Shepard,1995; Sharma, 1993). However, in our setting, network effectsmay be irrelevant for obtaining competitive advantages becauseof the absence of proprietary ATM networks and the emphasison the process innovation character of the technology, instead oftheir potential to work as surrogate branches. The inclusion ofyear dummies will control for any network effect on firm finan-cial performance, as the network effect will be the same for everyorganization. Firm fixed effects control for firm-specific unobservedheterogeneity. It is important to note that, during the observationwindow, there were many M&As between savings banks. In orderto recognize the potential restructuring influence of these corpo-rate operations a new fixed effect is considered every time that amerger takes place. Descriptive statistics are provided in Table 1.
4.2. Model and estimation
We propose a fixed-effects panel data model. Additionally, weinclude year fixed effects to parameterize the economic cycleand other factors affecting the whole sample of firms each year.Accordingly, we specify a two-way fixed-effects model expressedas follows (time subscript t is now included in the specification):
Yit = ˛i + ˛t +7∑
j=1
ˇjZjit + ˇ8level of useit + ˇ9relative useit
+ ˇ10technology diffusionit + uit
where Yit is our profitability measure, ROA of firm i in year t(expressed in percentage points), ˛i and ˛t stand for firm and yearfixed effects, Zjit are the control variables, uit is the error term andthe other variables have previously been defined.
A major concern in the model is the potential endogeneity ofthe variables related to the diffusion of the technology. Level of use,relative use and installed base are decisions under the control of thefirm and, as such, are influenced by its strategy or its configura-tion of resources and activities, which may also influence financialperformance. Thus, it is necessary to control for unobserved het-erogeneity and potential simultaneity. Technology diffusion is notdirectly under the control of the firm, since it reflects decisionsmade not only by the firm, but also by its rivals. However, changesin the level of use by a firm may induce responses by its competi-tors, generating some endogeneity in this variable. Additionally, theproxy used here induces measurement errors that pose a poten-tial endogeneity problem (see footnote 10). Therefore, we cannotassure the exogeneity of the variable. Consequently, we also controlfor the potential endogeneity of technology diffusion.
It can be argued that the inclusion of fixed effects is a valid con-trol for time-invariant omitted variables, alleviating endogeneity
problems (Greene, 2003). However, the long observation windowused in this research (19 years) casts some doubts on the sta-bility of the omitted variables. Therefore, we complement theempirical analysis with a more robust estimation method, the
4 arch P
HiGeAelp
cvvbtiivftlitfiithWv
5
eafiwtt
Omvrue2tacnsimafTm
m
ors
08 L. Fuentelsaz et al. / Rese
eteroskedastic Two Stage Least Squares (H2SLS). H2SLS is a mod-fied version of the conventional 2SLS estimator based on theMM that results in greater efficiency in the presence of het-roskedasticity of unknown form (Davidson and MacKinnon, 1993).
Pagan–Hall (1983) test was used to check for the presence of het-roskedasticity, confirming the appropriateness of H2SLS. We treatevel of use, relative use, technology diffusion and installed base asotentially endogenous variables.
H2SLS is more efficient than 2SLS only in the over-identifiedase; that is, when there are more instruments than endogenousariables. We use lagged values of the potentially endogenousariables as instruments. Lagged values are suitable instrumentsecause they cannot be associated with unanticipated shocks inhe dependent variable in the current period, which, theoretically,s a sufficient condition for an instrument to fulfil the orthogonal-ty condition. We consider three lags of the potential endogenousariables as instruments. In Table 2 we show the conventional testsor the adequacy of the set of instruments. Under-identificationests reject the null hypothesis that the instruments are uncorre-ated with the potentially endogenous variables. In other words, thenstruments are relevant. The first-stage F statistic is well abovehe critical values suggested by Stock and Yogo (2003). There-ore, the “weak instruments” problem is discarded. Finally, wemplement Hansen’s J-statistic to check for the exogeneity of thenstruments. This is a form of Sargan test that is consistent inhe presence of heteroskedasticity. The test fails to reject the nullypothesis that the instruments are orthogonal to the error term.e conclude that the instruments used in the H2SLS estimation are
alid.
. Results
Our empirical analysis proceeds in two stages. Firstly, we runstimations on the effect of the variables of interest discussedbove on financial performance. Secondly, once we have quanti-ed the influence of the different aspects of the diffusion process,e explore their evolution during our 19-year observation window
o analyse the net impact on financial performance depending onhe values observed in our sample.
Table 2 presents the estimation results. Columns 1–5 show theLS estimations, while columns 6 to 10 show the H2SLS esti-ations in which we correct for the endogeneity of the main
ariables of the model.12 As can be seen in Table 1, level of use,elative use and technology diffusion present high correlation val-es. To explore a potential problem of multicollinearity, we showstimations including each of the variables at a time (columns–4 for the OLS, and 7–9 for the H2SLS) and the three simul-aneously (columns 5 and 10). The estimates for these variablesre relatively stable, with the only relevant change occurring inolumn 8, where the parameter of relative use becomes non sig-ificant (nevertheless, in the fully specified model it becomesignificant). We also calculate the Variance Inflation Factors (VIF)n the specification that includes all the relevant variables. The
ean VIF is 3.42. The VIF for the technology diffusion variablesre 4.54 (level of use), 1.61 (relative use) and 4.23 (technology dif-usion), respectively, well below the recommended level of 10.herefore, our estimations do not seem to be seriously affected by
ulticollinearity.At the bottom of table we show Wald tests comparing nestedodels. The tests confirm that the fully specified models (columns
12 Note that using lags of the dependent variable as instruments leads to the lossf a number of observations. Additionally, firms for whom only one observationemains after dropping three observations are excluded as a consequence of theingleton variables problem that appears when estimating fixed-effects models.
olicy 41 (2012) 401– 413
5 and 10) are preferable to their nested counterparts. Therefore, ourdiscussion of the results will focus on these two estimations, payingspecial attention to those shown in model 10, as this estimation isrobust to endogeneity.
Level of use is not significant in any of the estimations. This meansthat the level of use by itself has no impact on the profitability of thefirm. Thus, the pattern shown in our sample is consistent with thestrategic necessity hypothesis, according to which the simple adop-tion of IT does not guarantee profitability gains (see, for instance,Chari et al., 2007, 2008; Powell and Dent-Micallef, 1997). Interest-ingly, this result appears both when we estimate the effect of thelevel of use in isolation and when we include the three relevant vari-ables in the estimation. Controlling for endogeneity does not seemto significantly change the estimated effect of the absolute level ofuse.
Relative use positively influences the profitability of the firm(Hypothesis 1 is supported). After controlling for endogeneity(columns 8 and 10), the value of the parameter notably increases.However, it has statistical significance only in the fully specifiedmodel, which is preferred according to the Wald test. Our estimatesindicate that an increase of one standard deviation in the rela-tive level of use will generate an increase in ROA of 0.356 percentpoints. Compared to the mean ROA in the sample (1.128), this effectcan be considered as economically important. Therefore, firms thatare able to incorporate the technology more intensively than theirdirect competitors obtain a stronger competitive position that leadsto significant increases in financial performance. Our estimationsof the effect of the level of use and the relative use suggest that whatexplains the impact of the technology on the competitive positionof the firm is not how intensively it has incorporated the technol-ogy into the productive process, but how intensively the firm hasdone it in relation to its competitors.
The effect of technology diffusion is consistently negative, sup-porting Hypothesis 2. Therefore, we confirm the occurrence ofcompetitive dynamics in the form described by Schumpeter (1934,1950), according to which the value of the technology decreaseswith the intensity of diffusion. H2SLS estimations show a less pro-nounced negative effect for this variable. At its mean value (0.406ATMs per every 1000 inhabitants), the industry-wide diffusion hasa negative impact on ROA of 0.494 points. A question that ariseshere is whether the negative impact of industry-wide diffusion orthe positive impact of the relative level of use predominates. Takingthe mean values of relative use and technology diffusion, their netimpact on ROA is −0.044 (=0.946 × 0.475 − 0.406 × 1.216), whichis not statistically different from 0. Thus, industry-wide diffusionseems to dissipate any benefits obtained through ATM adoption(we elaborate on this analysis below).
Regarding our control variables, we observe that concentrationpresents the expected positive coefficient, but it is not signifi-cant in most cases. Market share is significant only in models 1–5,showing a counterintuitive negative effect. However, in the H2SLSestimations, the parameter is not significant. This suggests thatthe structure of the market did not have a significant influence onfinancial performance in our sample. Firm size shows consistentlynegative effects on performance. Therefore, the Spanish savingsbanks seem to be operating well above their optimum scale.13
This result is consistent with previous research (see, for instance,Barnett et al., 1994; Dos Santos and Peffers, 1995). The variables
risk, growth, rural and installed base are not significant in any of theestimations.13 Note that, after the deregulation process, Spanish savings banks grew dramati-cally, presumably well above their optimum scale. For instance, the average savingsbank operated 468 branches in 2004.

L. Fuentelsaz
et al.
/ R
esearch Policy
41 (2012) 401– 413409
Table 2Estimation results.
Dependent variable: ROA (1) (2) (3) (4) (5) (6) (7) (8) (9) (10)
OLS OLS OLS OLS OLS H2SLS H2SLS H2SLS H2SLS H2SLS
Concentration 0.311 (0.593) 0.360 (0.593) 0.251 (0.584) 0.519 (0.600) 0.473 (0.585) 0.842 (0.583) 0.975* (0.566) 0.707 (0.556) 0.869 (0.573) 0.795 (0.540)Share −0.848*** (−0.271) −0.905*** (0.274) −0.814*** (0.266) −0.623** (0.275) −0.590** (0.291) −0.312 (0.334) −0.391 (0.341) −0.158 (0.343) −0.283 (0.327) −0.283 (0.316)Size −0.556*** (0.157) −0.561*** (0.158) −0.512*** (0.160) −0.514*** (0.155) −0.450*** (0.157) −0.564*** (0.202) −0.507** (0.197) −0.575*** (0.198) −0.547*** (0.197) −0.516*** (0.195)Risk −0.232 (0.328) −0.220 (0.326) −0.222 (0.328) −0.093 (0.328) −0.065 (0.324) −0.517 (0.378) −0.443 (0.368) −0.543 (0.374) −0.320 (0.387) −0.282 (0.373)Growth 0.339 (0.222) 0.349 (0.221) 0.269 (0.209) 0.306 (0.222) 0.209 (0.209) 0.211 (0.243) 0.226 (0.243) 0.230 (0.240) 0.158 (0.235) 0.124 (0.231)Rural −0.033 (0.230) −0.031 (0.229) −0.004 (0.230) −0.150 (0.240) −0.114 (0.236) 0.119 (0.278) 0.185 (0.273) 0.190 (0.282) 0.053 (0.284) 0.206 (0.275)Installed base −0.019 (0.030) −0.017 (0.031) −0.021 (0.029) −0.032 (0.034) −0.034 (0.034) 0.013 (0.031) 0.010 (0.031) 0.015 (0.030) −0.005 (0.035) 0.007 (0.036)Year dummies Yes*** Yes*** Yes*** Yes*** Yes*** Yes*** Yes*** Yes*** Yes*** Yes***
Level of use – −0.052 (0.116) – – −0.028 (0.131) – 0.008 (0.142) – – −0.268 (0.232)Relative use – – 0.068** (0.034) – 0.097*** (0.036) – – 0.168 (0.159) – 0.475* (0.247)Technology diffusion – – – −1.378*** (0.326) −1.465*** (0.364) – – – −1.215*** (0.457) −1.216** (0.478)
Adjusted R2 0.26 0.26 0.26 0.28 0.28 0.18 0.18 0.188 0.19 0.20F 9.93*** 9.58*** 10.04*** 10.05*** 10.13*** 6.64*** 6.36*** 6.53*** 6.85*** 6.81***
Underidentification test – – – – – 8.97** 36.19*** 69.80*** 140.68*** 68.38***
First-stage F – – – – – 150.71 84.98 62.13 26.65 17.88J-statistic – – – – – 2.32 3.59 3.62 4.25 7.30Wald test against 1 (6) – 0.20 3.58** 17.89*** 25.02*** – 0.00 1.12 7.07*** 11.15**
Wald test against 2 (7) – – – – 23.20*** – – – – 11.10***
Wald test against 3 (8) – – – – 21.02*** – – – – 9.86***
Wald test against 4 (9) – – – – 7.60** – – – – 5.12*
Number of Obs. 956 956 956 956 956 748 748 748 748 748
Standard errors in parentheses. Standard errors robust to autocorrelation and heteroskedasticity.* Variable statistically significant at 10%.
** Variable statistically significant at 5%.*** Variable statistically significant at 1%.

410 L. Fuentelsaz et al. / Research P
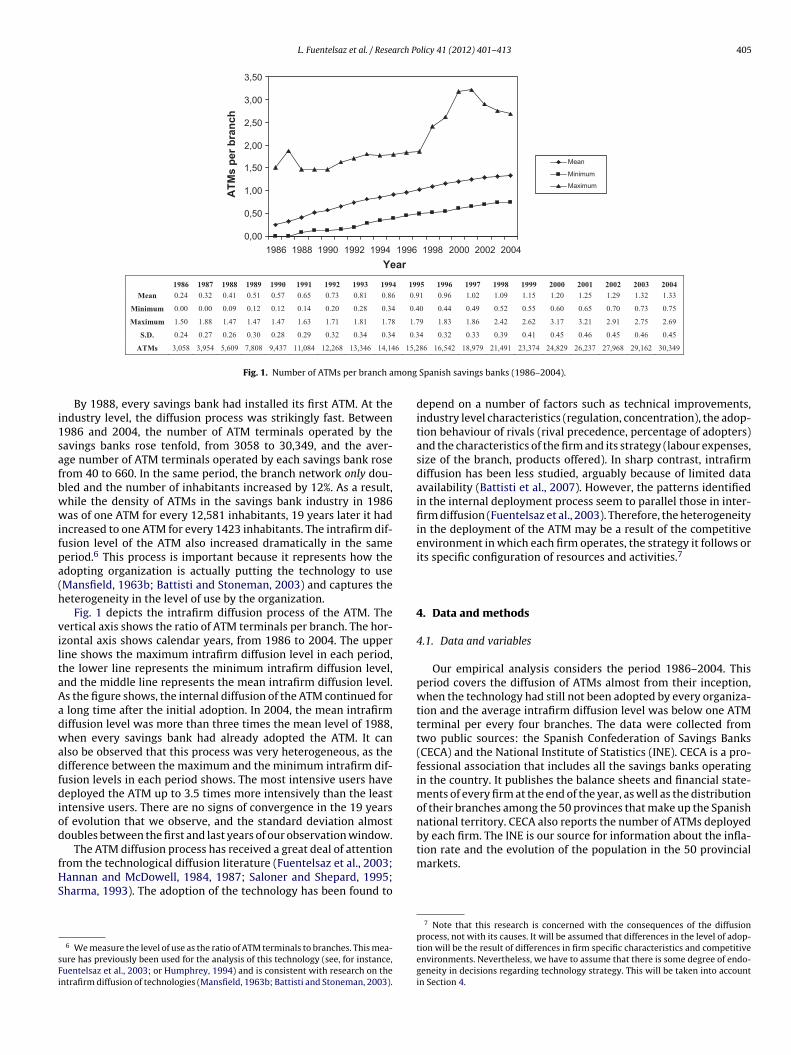
-1,00
-0,75
-0,50
-0,25
0,00
0,25
0,50
0,75
1,00
2004200220001998199619941992199019881986Year
Cor
rela
tion
with
RO
A
Level of use
Relative use
Technology diffusion
5
dwuiescrbisftm
irrattmIw
wtpitHepi(eo
auan
P
i
vantage, while firms exceeding it obtain competitive advantagesin their local context and increased profitability. Therefore, our
Fig. 2. Correlation between ROA and diffusion variables (1986–2004).
.1. Longitudinal analysis
Our model predicts the impact of the ATM on profitabilityepending on the diffusion of the technology within the firm,ithin its competitors and at market level. The estimation can besed to approximate the impact of the technology. Our database
ncludes information comprising a period of 19 years, which cov-rs most of the diffusion of the ATM in the Spanish savings banksector. With this information, we now try to further explore the pro-ess by which the diffusion of the technology erodes the potentialents of adopters. The traditional economic view depicts a processy which, over time, as the innovation is diffused in the market the
nitial gains of the first few adopters shrink and, eventually, are dis-ipated through the competitive process (Schumpeter, 1934). In ourramework, this can be explained through the interplay betweenhe relative level of use and the diffusion of the technology in the
arket.Fig. 2 summarizes the correlation between our measure of prof-
tability and the three technology diffusion variables: level of use,elative use and technology diffusion. The vertical axis shows the cor-elations, with the value 0 in the middle of the axis. The horizontalxis shows calendar years. The lines represent the correlation of thehree variables with ROA for each of the years. As the graph shows,here is no clear pattern in the case of level of use, with approxi-
ately as many positive as negative values of correlation with ROA.n the case of relative use, positive values seem to predominate,
hile the opposite is true for technology diffusion.In our sample, the diffusion process continued during the
hole observation window, increasing the intensity with whichhe technology was incorporated by the savings banks. From theerspective of the relative levels of use, the impact of this trend is
ndeterminate, as some firms will enhance their competitive posi-ions over time, others will maintain theirs, and some will fall back.owever, from the perspective of the market, the situation is differ-nt. With the development of the diffusion process, the technologyrogressively saturates the market, which may eventually change
ts structural conditions and erode the economic rents of adoptersPorter, 1985; Schroeder, 1990). Now we will focus our interest onxploring how the impact of the technology on profitability variesver time.
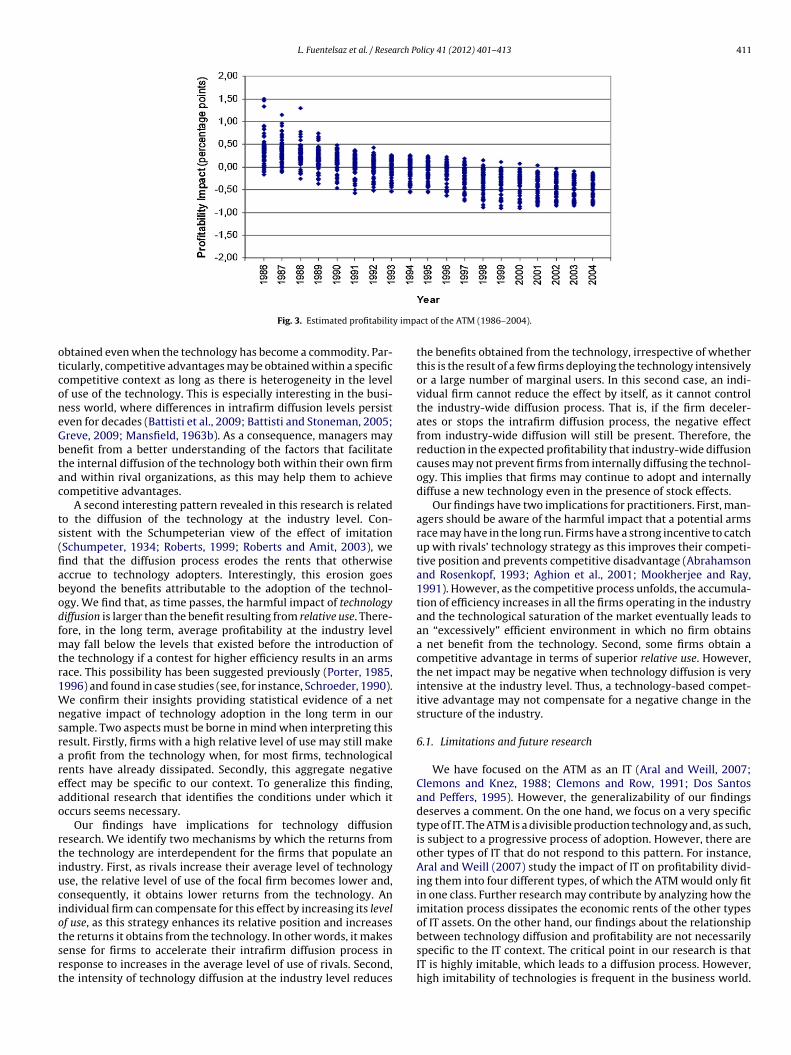
We estimate the impact of the ATM on profitability that can bettributed to the diffusion process as the joint effect of the relativese (which determines the size of the profitability contribution)nd the technology diffusion in the market (which determines theegative saturation effect) according to the following expression:
rofitability impactit = ˇ2relative useit + ˇ3technology diffusionit
Fig. 3 shows the evolution of the impact of ATM on ROA accord-ng to the previous expression, using the parameters estimated in
olicy 41 (2012) 401– 413
model 10 (H2SLS with fixed effects).14 The vertical axis representsthe estimated impact of the ATM on profitability. Each point repre-sents the profitability obtained by a firm in the period specified onthe horizontal axis. The figure presents exploratory evidence thatseems to confirm that the effect of the ATM on firm profitabilitydecreased over time. This decrease was more pronounced duringthe first years of the technology diffusion process while, in the finalyears, it stabilized.
Interestingly, during the observation window, the averageimpact of the ATM on profitability in the savings bank sector seemsto become negative. At first, the low level of diffusion in the industrymay have allowed most adopters to obtain net benefits. Accordingto our estimations, the average impact on profitability is positiveand statistically significant up to 1990 (net effect = 0.111, p < 0.01).However, in the long term, the stock effect triggered by the dif-fusion process seems to have dissipated the economic rents thatinitially accrued to technology adopters. Between 1991 and 1994the impact on profitability is not statistically different from 0. How-ever, an interesting and unexpected pattern is found from 1995onwards when the net impact is negative and statistically signifi-cant. This means that the diffusion process has apparently alteredthe structural conditions in the industry, leading to a general reduc-tion in profitability. By way of illustration, in 1988, the first year inwhich every firm had already adopted the ATM, our model esti-mates suggest that the average benefit obtained by savings banksfrom the deployment of the ATM was of 0.448 percentage points(p < 0.01) while, 19 years later, the competitive imitation processhad led to a mean impact on ROA of −0.460 (p < 0.01). This phe-nomenon, which is initially surprising, is consistent with previousfindings about the impact of new technologies that are intensivelydiffused in an industry (e.g., Schroeder, 1990).
6. Conclusions and discussion
In this article, we explore the impact of a production technologyon financial performance from a technology diffusion perspective.We pay special attention to two stylized facts about the diffu-sion process: the persistent heterogeneity that exists in intrafirmdiffusion levels and the long time periods that industry-widediffusion requires (Battisti and Stoneman, 2003; Battisti et al.,2009; Mansfield, 1961, 1963b). Our results demonstrate that thewide availability of a technology does not necessarily result inits immediate imitation and the dissipation of any potential com-petitive advantage. Indeed, interesting patterns that contribute toour understanding of the impact of new technologies on financialperformance arise when the diffusion process is included in theanalysis.
The most important finding in this research is the relation-ship between relative use and financial performance. We find norelationship between the absolute level of technology use andprofitability. While this result may seem counter-intuitive at firstglance, it is compatible with related research which signals thathigh imitability may prevent competitive advantage (Carr, 2003;Clemons and Row, 1991) and previous empirical findings (Chariet al., 2007, 2008; Powell and Dent-Micallef, 1997). In contrast, therelative level of use has a direct relationship with financial perfor-mance. The average level of technology use of competitors is hereconceived as a competitive reference point. Organizations that donot keep up with this reference level are at a competitive disad-
results show that technology-based competitive advantage can be
14 Two outliers were dropped to keep the graph nicely scaled, one in 1986 and theother in 1987.
L. Fuentelsaz et al. / Research Policy 41 (2012) 401– 413 411
y impa
otconeGbtac
ts(fiabodfmtr1Wnsrareao
rtiuciotsrt
Fig. 3. Estimated profitabilit
btained even when the technology has become a commodity. Par-icularly, competitive advantages may be obtained within a specificompetitive context as long as there is heterogeneity in the levelf use of the technology. This is especially interesting in the busi-ess world, where differences in intrafirm diffusion levels persistven for decades (Battisti et al., 2009; Battisti and Stoneman, 2005;reve, 2009; Mansfield, 1963b). As a consequence, managers mayenefit from a better understanding of the factors that facilitatehe internal diffusion of the technology both within their own firmnd within rival organizations, as this may help them to achieveompetitive advantages.
A second interesting pattern revealed in this research is relatedo the diffusion of the technology at the industry level. Con-istent with the Schumpeterian view of the effect of imitationSchumpeter, 1934; Roberts, 1999; Roberts and Amit, 2003), wend that the diffusion process erodes the rents that otherwiseccrue to technology adopters. Interestingly, this erosion goeseyond the benefits attributable to the adoption of the technol-gy. We find that, as time passes, the harmful impact of technologyiffusion is larger than the benefit resulting from relative use. There-ore, in the long term, average profitability at the industry level
ay fall below the levels that existed before the introduction ofhe technology if a contest for higher efficiency results in an armsace. This possibility has been suggested previously (Porter, 1985,996) and found in case studies (see, for instance, Schroeder, 1990).e confirm their insights providing statistical evidence of a net
egative impact of technology adoption in the long term in ourample. Two aspects must be borne in mind when interpreting thisesult. Firstly, firms with a high relative level of use may still make
profit from the technology when, for most firms, technologicalents have already dissipated. Secondly, this aggregate negativeffect may be specific to our context. To generalize this finding,dditional research that identifies the conditions under which itccurs seems necessary.
Our findings have implications for technology diffusionesearch. We identify two mechanisms by which the returns fromhe technology are interdependent for the firms that populate anndustry. First, as rivals increase their average level of technologyse, the relative level of use of the focal firm becomes lower and,onsequently, it obtains lower returns from the technology. Anndividual firm can compensate for this effect by increasing its levelf use, as this strategy enhances its relative position and increases
he returns it obtains from the technology. In other words, it makesense for firms to accelerate their intrafirm diffusion process inesponse to increases in the average level of use of rivals. Second,he intensity of technology diffusion at the industry level reducesct of the ATM (1986–2004).
the benefits obtained from the technology, irrespective of whetherthis is the result of a few firms deploying the technology intensivelyor a large number of marginal users. In this second case, an indi-vidual firm cannot reduce the effect by itself, as it cannot controlthe industry-wide diffusion process. That is, if the firm deceler-ates or stops the intrafirm diffusion process, the negative effectfrom industry-wide diffusion will still be present. Therefore, thereduction in the expected profitability that industry-wide diffusioncauses may not prevent firms from internally diffusing the technol-ogy. This implies that firms may continue to adopt and internallydiffuse a new technology even in the presence of stock effects.
Our findings have two implications for practitioners. First, man-agers should be aware of the harmful impact that a potential armsrace may have in the long run. Firms have a strong incentive to catchup with rivals’ technology strategy as this improves their competi-tive position and prevents competitive disadvantage (Abrahamsonand Rosenkopf, 1993; Aghion et al., 2001; Mookherjee and Ray,1991). However, as the competitive process unfolds, the accumula-tion of efficiency increases in all the firms operating in the industryand the technological saturation of the market eventually leads toan “excessively” efficient environment in which no firm obtainsa net benefit from the technology. Second, some firms obtain acompetitive advantage in terms of superior relative use. However,the net impact may be negative when technology diffusion is veryintensive at the industry level. Thus, a technology-based compet-itive advantage may not compensate for a negative change in thestructure of the industry.
6.1. Limitations and future research
We have focused on the ATM as an IT (Aral and Weill, 2007;Clemons and Knez, 1988; Clemons and Row, 1991; Dos Santosand Peffers, 1995). However, the generalizability of our findingsdeserves a comment. On the one hand, we focus on a very specifictype of IT. The ATM is a divisible production technology and, as such,is subject to a progressive process of adoption. However, there areother types of IT that do not respond to this pattern. For instance,Aral and Weill (2007) study the impact of IT on profitability divid-ing them into four different types, of which the ATM would only fitin one class. Further research may contribute by analyzing how theimitation process dissipates the economic rents of the other typesof IT assets. On the other hand, our findings about the relationship
between technology diffusion and profitability are not necessarilyspecific to the IT context. The critical point in our research is thatIT is highly imitable, which leads to a diffusion process. However,high imitability of technologies is frequent in the business world.
4 arch P
Sge(Dnf1aas
pimRnapitnsiftw
A
etMgatsM0(Wr
R
A
A
A
A
A
A
B
B
B
B
12 L. Fuentelsaz et al. / Rese
ome sectors are characterized by their dependence on technolo-ies developed by technology suppliers (Dolata, 2009). In addition,xternal technology sourcing is becoming increasingly frequentArora et al., 2001; Linder et al., 2003; Ricart and Adegbesan, 2007).ependence on external sources reduces the appropriability ofew technologies because they become more difficult to protect
rom imitation by competitors (Ricart and Adegbesan, 2007; Teece,986). Therefore, our analysis of the technology diffusion processnd the competitive dynamics that it triggers can inform managersbout the outcomes of their technology strategy in a wide array ofettings.
In this research, we have assumed that the coefficients in ourarameters were constant across the different provincial markets
n which each savings bank operates. However, this assumptionay be relaxed by applying multilevel modelling (Goldstein, 1995;
abe-Hesketh, 2008; Snijders and Bosker, 1999). This is a tech-ique that can be used to handle grouped data. Multilevel modellingllows coefficients to vary among different groups within the sam-le. For instance, groups may be identified according to the markets
n which each organization operates. Therefore, it would be possibleo identify market level effects that influence the impact of the tech-ology on profitability. We have not applied this approach becauseavings banks do not focus their activities on a single province, sot is not possible to identify independent sub-markets. However,uture research could apply multilevel modelling to further explorehe effect of technologies on firm performance in other settings inhich firms can be accurately assigned to different markets.
cknowledgements
We acknowledge the valuable feedback that we received onarlier versions of this article from Dolores Anón, Giuliana Bat-isti, Andrea Fosfuri, Javier Gimeno, Gianvito Lanzolla, Juan Pablo
aícas, Mariano Nieto, Yolanda Polo, Idana Salazar and Pilar Var-as. We are also grateful to Research Policy editor Ben Martinnd three anonymous reviewers, whose comments and sugges-ions greatly improved this manuscript. Remaining errors are ourole responsibility. This research was supported by the Spanishinistry of Science and Technology and FEDER (projects ECO2008-
4129 and ECO2011-22947), and the Diputación General de AragónS09/PM062). A previous version of this paper was included in the
orking Paper Series of the Spanish Fundación de las Cajas de Ahor-os (FUNCAS) (document number 451/2009).
eferences
brahamson, E., Rosenkopf, L., 1993. Institutional and competitive bandwag-ons: using mathematical modelling as a tool to explore innovation diffusion.Academy of Management Review 18, 487–517.
ghion, P., Harris, C., Howitt, P., Vickers, J., 2001. Competition, imitation and growthwith step-by-step innovation. Review of Economic Studies 68, 467–492.
mit, R., Schoemaker, P.J.H., 1993. Strategic assets and organizational rent. StrategicManagement Journal 14, 33–46.
nderson, P., Tushman, M.L., 1990. Technological discontinuities and dominantdesigns: a cyclical model of technological change. Administrative Science Quar-terly 35, 604–633.
ral, S., Weill, P., 2007. IT assets, organizational capabilities, and firm performance:how resource allocations and organizational differences explain performancevariation. Organization Science 18, 763–780.
rora, A., Fosfuri, A., Gambardella, A., 2001. Markets for technology and their impli-cation for corporate strategy. Industrial and Corporate Change 10, 419–451.
anker, R., Kauffman, R.J., 1988. Strategic contributions of information technology:an empirical study of ATM networks. In: DeGross, J.I., Olson, M.H. (Eds.), Proceed-ings of the Ninth International Conference on Information Systems. Minneapolis,MN, pp. 141–150.
arnett, W.P., Greve, H.R., Park, D.Y., 1994. An evolutionary model of organizational
performance. Strategic Management Journal 15, 11–28.arney, J., 1991. Firm resources and sustained competitive advantage. Journal ofManagement 17, 99–120.
attisti, G., Canepa, A., Stoneman, P., 2009. E-business usage across and within firmsin the UK: profitability, externalities and policy. Research Policy 38, 133–143.
olicy 41 (2012) 401– 413
Battisti, G., Hollenstein, H., Stoneman, P., Woerter, M., 2007. Inter and intra firmdiffusion of ICT in the United Kingdom and Switzerland: an internationallycomparative study based on firm-level data. Economics of Innovation and NewTechnology 16, 669–687.
Battisti, G., Iona, A., 2009. The intra-firm diffusion of complementary innovations:evidence from the adoption of management practices by British establishments.Research Policy 38, 1326–1339.
Battisti, G., Stoneman, P., 2003. Inter- and Intra-firm effects in the diffusion of newprocess technology. Research Policy 32, 1641–1655.
Battisti, G., Stoneman, P., 2005. The Intra-firm diffusion of new process technologies.International Journal of Industrial Organization 23, 1–22.
Berger, A.N., Demsetz, R.S., Strahan, P.E., 1999. The consolidation of the financialservices industry: causes, consequences and implications for the future. Journalof Banking and Finance 23, 135–194.
Bettis, R.A., Hitt, M.A., 1995. The new competitive landscape. Strategic ManagementJournal 16, 7–19 (Special issue).
Boot, A.W.A., Marinc, M., 2008. The evolving landscape of banking. Industrial andCorporate Change 17, 1173–1203.
Carbó, S., López del Paso, R., Rodríguez, F., 2003. Medición de la competencia ensectores bancarios regionales. Revista de Economía Aplicada 32 (11), 5–33.
Carr, N.G., 2003. IT doesn’t matter. Harvard Business Review 81, 41–49.Chan, Y.E., Reich, B.H., 2007. IT alignment: what have we learnt? Journal of Informa-
tion Technology 22, 297–315.Chari, M.D.R., Devaraj, S., David, P., 2007. International diversification and firm
performance: role of information technology investments. Journal of WorldBusiness 42, 184–197.
Chari, M.D.R., Devaraj, S., David, P., 2008. The impact of information technologyinvestments and diversification strategies on firm performance. ManagementScience 54, 224–234.
Chen, M.J., 1996. Competitor analysis and interfirm rivalry. Toward a theoreticalintegration. Academy of Management Journal 21, 100–134.
Clemons, E.K., 1986. Information systems for sustainable competitive advantage.Information and Management 11, 131–136.
Clemons, E.K., 1991. Corporate strategies for information technology: a resourcebased approach. Computer 24, 23–32.
Clemons, E.K., Kimbrough, S., 1986. Information systems, telecommunications, andtheir effect on industrial organization. In: Proceedings of the 7th InternationalConference on Information Systems, San Diego, CA.
Clemons, E.K., Knez, M., 1988. Competition and cooperation in information systemsinnovation. Information and Management 15, 25–35.
Clemons, E.K., Row, M.C., 1991. Sustaining IT advantage. The role of structural dif-ferences. MIS Quarterly 15, 275–292.
Damanpour, F., Walker, R.M., Avellaneda, C.N., 2009. Combinative effects of inno-vation types and organizational performance; a longitudinal study of serviceorganizations. Journal of Management Studies 46, 650–675.
Davidson, R., MacKinnon, J., 1993. Estimation and Inference in econometrics. OxfordUniversity Press, Oxford.
Devaraj, S., Kohli, R., 2003. Performance impacts of information technology: is actualusage the missing link. Management Science 49, 273–289.
Dolata, U., 2009. Technological innovations and sectoral change: transformativecapacity, adaptability, patterns of change: an analytical framework. ResearchPolicy 38, 1066–1076.
Dos Santos, B., Peffers, K., 1995. Rewards to investors in innovative informationtechnology applications: first movers and early followers in ATMs. OrganizationScience 6, 241–259.
European Central Bank, 1999. The effects of technology on the EU banking systems,July 1999. http://www.ecb.eu/pub/pdf/other/techbnken.pdf.
European Central bank, 2007. EU Banking Structures, October 2007.http://www.ecb.int/pub/pdf/other/eubankingstructures2007en.pdf.
Floyd, S.W., Wooldridge, B., 1990. Path analysis of the relationship between com-petitive strategy, information technology, and financial performance. Journal ofmanagement information systems 7, 47–64.
Fuentelsaz, L., Gómez, J., 2006. Multipoint competition, strategic similarity and entryinto geographic markets. Strategic Management Journal 27, 477–499.
Fuentelsaz, L., Gómez, J., Palomas, S., 2009. The effects of new technologies onproductivity: an intrafirm diffusion-based assessment. Research Policy 38,1172–1180.
Fuentelsaz, L., Gómez, J., Polo, Y., 2002. Followers’ entry timing. Evidence from theSpanish banking sector after deregulation. Strategic management Journal 23,245–264.
Fuentelsaz, L., Gómez, J., Polo, Y., 2003. Intrafirm diffusion of new technologies: anempirical application. Research Policy 32, 533–551.
Goddard, J., Molyneux, P., Wilson, J.O.S., Tavakoli, M., 2007. European banking: anoverview. Journal of Banking and Finance 31, 1911–1935.
Goldstein, H., 1995. Multilevel Statistical Models, 2nd ed. Edward Arnold, London.Götz, G., 1999. Monopolistic competition and the diffusion of new technology. RAND
Journal of Economics 30, 679–693.Greene, W.H., 2003. Econometric Analysis, 5th ed. Prentice Hall, New York, NY.Greve, H.R., 2009. Bigger and safer. The diffusion of competitive advantage. Strategic
Management Journal 30, 1–23.Griliches, Z., 1957. Hybrid corn: an exploration in the economics of technical change.
Econometrica 25, 501–522.Hannan, T.H., McDowell, J.M., 1984. The determinants of technology adoption: the
case of the banking firm. RAND Journal of Economics 15, 328–335.Hannan, T.H., McDowell, J.M., 1987. Rival precedence and the dynamics of technol-
ogy adoption: an empirical analysis. Economica 54 (214), 155–171.

rch Po
H
H
H
H
H
H
J
K
K
K
K
L
M
M
M
M
M
M
O
P
P
P
P
P
P
P
P
L. Fuentelsaz et al. / Resea
annan, T.H., McDowell, J.M., 1990. The impact of technology adoption on marketstructure. Review of Economics and Statistics 72, 164–168.
enderson, J.C., Venkatraman, N., 1993. Strategic alignment: leveraging informationtechnology for transforming organizations. IBM Systems Journal 32, 4–16.
itt, L., Brynjolfsson, E., 1996. Productivity, business profitability, and consumer sur-plus: three different measures of information technology value. MIS Quarterly20, 121–142.
ollenstein, H., Woerter, M., 2008. Inter- and intra-firm diffusion of technology: theexample of e-commerce: an analysis based on Swiss firm-level data. ResearchPolicy 37, 545–564.
oppe, H.C., 2000. Second mover advantages in the strategies adoption of new tech-nology under uncertainty. International Journal of Industrial Organization 18,315–338.
umphrey, D.B., 1994. Delivering deposit services: ATMs versus branches. FederalReserve Bank of Richmond Economic Quarterly 80, 59–81.
ovanovich, B., MacDonald, G.M., 1994. The life cycle of a competitive industry.Journal of Political Economy 102, 322–347.
arshenas, M., Stoneman, P., 1993. Rank, stock, order and epidemic effects in thediffusion of new process technologies: an empirical model. RAND Journal ofEconomics 24, 503–528.
arshenas, M., Stoneman, P., 1995. Technological diffusion. In: Stoneman, P. (Ed.),Handbook of the Economics of Innovation and Technological Change. BlackwellPublishers, Oxford.
ettinger, W.J., Grover, V., Guha, S., Segars, A.H., 1994. Strategic information systemsrevisited: a study in sustainability and performance. MIS Quarterly 18, 31–58.
wast, M.L., Starr-McCluer, M., Wolken, J.D., 1997. Market definition and the analysisof antitrust in banking. Antitrust Bulletin 42, 973–995.
inder, J.C., Jarvenpaa, S., Davenport, T.H., 2003. Toward an innovation sourcingstrategy. Sloan Management Review 44, 43–49.
ansfield, E., 1961. Technical change and the rate of imitation. Econometrica 29,741–766.
ansfield, E., 1963a. The speed of response of firms to new techniques. QuarterlyJournal of Economics 77, 290–311.
ansfield, E., 1963b. Intrafirm rates of diffusion of an innovation. The Review ofEconomics and Statistics 45, 348–359.
ata, F.J., Fuerst, W.L., Barney, J.B., 1995. Information technology and sustainedcompetitive advantage: a resource based analysis. MIS Quarterly 19, 487–505.
cFarlan, F.W., 1984. Information technology changes the way you compete. Har-vard Business Review 62, 98–103.
ookherjee, D., Ray, D., 1991. On the competitive pressure created by the diffusionof innovations. Journal of Economic Theory 54, 124–147.
h, W., Pinsonneault, A., 2007. On the assessment of the strategic value of infor-mation technologies: conceptual and analytical approaches. MIS Quarterly 31,239–265.
agan, A.R., Hall, D., 1983. Diagnostic tests as residual analysis. Econometric Reviews2, 159–218.
arsons, G.L., 1983. Information technology. A new competitive Weapon. Sloan Man-agement Review 25, 3–14.
eteraf, M.A., 1993. The cornerstones of competitive advantage. A resource basedview. Strategic Management Journal 14, 179–191.
eteraf, M.A., Bergen, M.E., 2003. Scanning competitive landscape. A market-basedand resource-based framework. Strategic Management Journal 24, 1027–1041.
orter, M., 1980. Competitive Strategy: Techniques For Analyzing Industries AndCompetitors. Free Press, New York.
orter, M., 1985. Competitive Advantage: Creating and Sustaining Superior Perfor-mance. Free Press, New York.
orter, M.E., 1991. Towards a dynamic theory of strategy. Strategic ManagementJournal 12, 95–117 (Special Issue).
orter, M.E., 1996. What is strategy? Harvard Business Review 74 (6), 61–78.
licy 41 (2012) 401– 413 413
Porter, M.E., Millar, V.E., 1985. How information gives you competitive advantage.Harvard Business Review 63 (4), 149–160.
Powell, T.C., Dent-Micallef, A., 1997. Information technology as competitiveadvantage: the role of human, business, and technology resources. StrategicManagement Journal 18, 375–405.
Rabe-Hesketh, S., 2008. Multilevel and Longitudinal Modeling Using STATA, CollegeStation, Texas.
Rai, A., Patnayakuni, R., Patnayakuni, N., 1997. Technology investment and businessperformance. Communications of the ACM 40 (7), 89–97.
Ricart, J.E., Adegbesan, T., 2007. Appropriating value from external technology:absorptive capacity dimensions and innovation strategy. WP 669, IESE BusinessSchool, University of Navarra.
Roberts, P.W., 1999. Product innovation, product-market competition and persistentprofitability in the U.S. pharmaceutical industry. Strategic Management Journal20, 655–670.
Roberts, R.W., Amit, R., 2003. The dynamics of innovative activity and competitiveadvantage. The case of Australian retail banking, 1981 to 1995. OrganizationScience 14, 107–122.
Rogers, E.M., 1983. Diffusion of Innovations, 3rd ed. The Free Press, NY.Rumelt, R.P., 1987. Theory, strategy, and entrepreneurship. In: David Teece (Ed.),
The Competitive Challenge: Strategies for Industrial Innovation and Renewal.Ballinger, Cambridge, MA, pp. 137–158.
Saloner, G., Shepard, A., 1995. Adoption of technologies with network effects: anempirical examination of the adoption of automated teller machines. RANDJournal of Economics 26, 479–501.
Scherer, F.M., Ross, D., 1990. Industrial Market Structure and Economic Performance.Houghton Mifflin, Boston, MA.
Schilling, M., 1999. Winning the standards race: building installed base and the avail-ability of complementary goods. European Journal of Management 17, 265–274.
Schroeder, D.M., 1990. A dynamic perspective on the impact of process innovationupon competitive advantage. Strategic Management Journal 11, 25–41.
Schroeder, R.G., Bates, K.A., Junttila, M.A., 2002. A resource based view of manufac-turing strategy and the relationship to manufacturing performance. StrategicManagement Journal 23, 105–117.
Schumpeter, J.A., 1934. The Theory of economic Development. Harvard UniversityPress, Cambridge, MA.
Schumpeter, J.A., 1950. Capitalism, Socialism, and Democracy, 3rd ed. Harper &Brothers, NY.
Sharma, S., 1993. Behind the diffusion curve: an analysis of ATM adoption, WorkingPaper No 686 Department of Economics, University of California, Los Angeles.
Simons, K., Stavins, J., 1998. Has antitrust policy in banking become obsolete? NewEngland Economic Review, Federal Reserve Bank of Boston, March–April, 13–26.
Snijders, T.A.B., Bosker, R.J., 1999. Multilevel Analysis: An Introduction to Basic andAdvanced Multilevel Modeling. Sage, London.
Stock, J.H., Yogo, M., 2003. Testing for weak instruments in linear IV regression,Department of Economics, Harvard University, working paper.
Stoneman, P., Kwon, M.J., 1996. Technology adoption and firm profitability. TheEconomic Journal 106, 952–962.
Suarez, F.F., 2004. Battles for technological dominance: an integrative framework.Research Policy 33, 271–286.
Teece, D.J., 1986. Profiting from technological innovation. Implications forintegration, collaboration, licensing and public policy. Research Policy 15,285–305.
Triplett, J.E., Bosworth, B.P., 2002. Baumol’s disease’ has been cured: IT and multifac-
tor productivity in U.S. services industries, Brookings Institution Working Paper(July 2002).Venkatraman, N., Ramanujam, V., 1986. Measurement of business performancein strategy research: a comparison of approaches. Academy of ManagementReview 11, 801–814.
Copyright © 2022 FDOKUMEN