
Production System Design and Implementation in the ...
103
Production System Design and Implementation in the European Automotive Components Industry by Bukola L. Masha B.S. Mechanical Engineering University of Minnesota, 2000 Submitted to the Department of Mechanical Engineering in Partial Fulfillment of the Requirements for the Degree of Master of Science in Mechanical Engineering at the Massachusetts Institute of Technology May 2002 LChrc() MASSACHUSETS INSTITU OF TECHANOLOGY OCT 2 5 2 LIBRARIES © 2002 Massachusetts Institute of Technology All rights reserved Signature of author...... ..................... ..... .................................... Department of Mechanical Engineering April 29, 2002, C ertified by.................................................. ..... David S. Cochran Associate Professor of Mechanical Engineering Thesis Supervisor A ccepted by ............................ . ................ Ain A. Sonin Chairman, Department Committee on Graduate Students
-
Upload
khangminh22 -
Category
Documents
-
view
0 -
download
0
Transcript of Production System Design and Implementation in the ...

Production System Design and Implementation in the European
Automotive Components Industry
by
Bukola L. Masha
B.S. Mechanical EngineeringUniversity of Minnesota, 2000
Submitted to the Department of Mechanical Engineeringin Partial Fulfillment of the Requirements for the Degree of
Master of Science in Mechanical Engineering
at the
Massachusetts Institute of Technology
May 2002
LChrc()
MASSACHUSETS INSTITU
OF TECHANOLOGY
OCT 2 5 2
LIBRARIES
© 2002 Massachusetts Institute of TechnologyAll rights reserved
Signature of author...... ..................... ..... ....................................Department of Mechanical Engineering
April 29, 2002,
C ertified by.................................................. .....David S. Cochran
Associate Professor of Mechanical EngineeringThesis Supervisor
A ccepted by ............................ . ................
Ain A. SoninChairman, Department Committee on Graduate Students

MITLibrariesDocument Services
Room 14-055177 Massachusetts AvenueCambridge, MA 02139Ph: 617.253.2800Email: [email protected]://Iibraries.mit.edu/docs
DISCLAIMER OF QUALITY
Due to the condition of the original material, there are unavoidableflaws in this reproduction. We have made every effort possible toprovide you with the best copy available. If you are dissatisfied withthis product and find it unusable, please contact Document Services assoon as possible.
Thank you.
The images contained in this document are ofthe best quality available.
The Archives copy is also missing page 49. This is the most completeversion available.
-izI~zzz~

Page Intentionally Left Blank
2

Production System Design and Implementation in the European
Automotive Components Industry
by
Bukola L. Masha
Submitted to the Department of Mechanical Engineeringon May 1", 2002 in Partial Fulfillment of the Requirements for the Degree of
Master of Science in Mechanical Engineering
ABSTRACT
In today's highly competitive and global market environment, companies are continuallysearching for ways to improve upon their business practices to gain a competitiveadvantage. Over the past decade, significant focus has been directed toward the field ofmanufacturing operations and in particular toward the successes of the Toyota ProductionSystem (TPS). Numerous companies in various industries have tried to implement theTPS system, however, this has been accomplished with varying degrees of success. Themain separator of those who were successful from those who failed is the utilization of athoroughly holistic approach. The Manufacturing System Design Decomposition(MSDD) is such an approach.
The MSDD provides a framework for designing, analyzing, evaluating, improving andcontrolling manufacturing systems. The frame work is based on axiomatic designdecomposition and allows the designer to understand the interrelation between theFunctional Requirements (FR's) and Design Parameters (DP's). Many of these DP's canbe drawn from successful tools implemented in the Japanese manufacturing companies,primarily Toyota. The MSDD allows the designer to track these FR's and DP's to thehigh-level objectives of the enterprise. It is primarily this ability of the designer tounderstand the relationship between the FR's and DP's that has allowed for great successutilizing the MSDD approach.
This thesis presents the Production System Design Framework, which encompasses theMSDD, and sets the theory for its successful implementation in a manufacturing facilityin Europe. The thesis is based prim arily on the experience of the author utilizing theMSDD and its respective evaluation tools and technique in a supply chain design projectand a manufacturing system redesign project in a European climate control componentsmanufacturer. The MSDD played a vital role in the successful implementation of theseprojects.
Thesis Supervisor: David S. CochranTitle: Associate Professor of Mechanical Engineering
3

Acknowledgments
I would like to start by thanking Prof David S. Cochran for not only providingme with the opportunity to undertake such fascinating research and for granting me myMasters of Science from MIT, but also for contributing significantly to my developmentas a professional. By working closely with Prof Cochran I have had the opportunity toobserve and learn important positive traits from him that will aid me throughout mycareer, for this I am especially grateful. Thank you for challenging me yet at the sametime respecting me as a person.
I would also like to thank all the people that aided me in my project at theBasildon plant, especially John Hall, Malcom Monger and Mike Brown without theirguidance and assistance was greatly appreciated. I would like to especially thank KinElenwo for his professional and personal guidance while at the Basildon plant.
Without the steadfast support of my family and my Fiancee Erin Wickliff I wouldnot be were I am today, for this I am eternally grateful. My mother Glenda, always andeternally supportive, no matter what, she could get me back on my feet and back to work,my father always their with great advice, my dear sisters one could not ask for a bettersupport network or better people to pick me up form the airport. Last but not least, mydear Erin, who is always there whether is be to proof read a paper at 2 am or justsomeone to talk too. Thank you everyone. To my friend Tesfu, it was great having afriend that inspired you to do your best all through undergrad, we got to learn so muchfrom each other it was very very nice.
Finally, I would like to thank all my friends from the lab who have created a verypleasant working environment and have also contributed greatly to my work- Martin,Henning, Cesar, Carlos, Memo, Jey, Zhenwei, Abhinav, Keith, Jongyoon, Yong-Suk,Jochen and Quinton.
4

Table of Contents
A B S T R A C T ............................................................................................. 3
A CKN OW LEDGEM ENTS ................................................................................ 4
TABLE OF CONTENTS................................... .. .............................. 5
L IST OF FIGU R ES.................................................................................. . .. 7
L IST OF T AB LES.................................................................................... 9
CHAPTER 1: INTRODUCTION.......................................................................10
1.1 T hesis objectiv e ....................................................................... 11
1.2 T h esis O utlin e .......................................................................... 11
CHAPTER 2: AUTOMOTIVE MANUFACTURING: A HISTORY OF THE INDUSTRY .... .... 14
2.1 C raft P roduction ........................................................................ 15
2.2 Mass Production..........................................15
2.3 Lean Manufacturing.................................................................17
2.3.1 Background ............................................................ 17
2.3.2 P rinciples .................................................................. 18
CHAPTER 3: OVERVIEW OF THE MSDD, THE QUESTIONNAIRE AND THE DATABASE.........28
3.1 Axiomatic Design Approach in Production System Design Decomposition .29
3.2 Introduction to the Manufacturing System Design Decomposition ............ 31
3.2.1 Quality Branch...........................................................34
3.2.2 Identifying and Resolving Problems Branch.........................36
3.2.3 Predictable Output Branch................................................38
3.2.4 Delay Reduction Branch.............................................40
3.2.5 Direct Labor Branch.......................................................42
3.2.6 Indirect Labor Branch...................................................44
3.3 MSDD Questionnaire ................................................................. 45
3.4 M SD D D atabase ...................................................................... 45
5

CHAPTER 4: VISTEON BASILDON VISION 2001 PROJECT ........................................ 48
4 .1 P lant Introdu ction ..................................................................... 49
4.1.1 Plant Overview and Physical Layout ................................. 49
4.1.2 Product and Manufacturing Process Overview.........................51
4.2 V alue Stream D escription ............................................................ 55
4.2.1 Pre- V ision (2000)........................................................55
4.2.2 Post Vision (2001).......................................................58
4.2.3 Future State of Vision 2001 Project...... ................ 61
4.3 MSDD Evaluation of Moduling Process ........................................ 62
4.3.1 Pre- V ision (2000)........................................................62
4.3.2 Post Vision (2001).......................................................69
4.4 Measurable and the Achievement of the MSDD.................................77
4.4.1 Motivation....................................... 77
4.4.2 Analysis Method ........................................................ 78
4.4.3 Evaluation and Comparison of Pre (2000) and Post (2001)...........79
CHAPTER 5: VISTEON BASILDON BESMART PROJECT................. .............. 80
5.1 O verview .......................................................................... . . 8 1
5.2 Understanding the Problem .......................................................... 82
5 .3 E xisting System ........................................................................ 83
5.4 Proposed Solution: Line Side Replenishment System .......................... 86
5.5 Proposed Solution: Supplier Electronic Replenishment System.............88
5.6 Proposed Solution: Marketplace................................................. 98
5.7 Acceptance of Users Involved......................................................100
R EFER E N C E S ........................................................................................ 10 1
6

List of Figures
Figure 1-1: Automotive "Push" Production and Scheduling System
Figure 1-2: Automotive "Pull" Production and Scheduling
Figure 1-3: The Toyota Production System Design Model
Figure 3. 1: Manufacturing System Design Decomposition
Figure 3.2: High Level Objectives of the MSDD
Figure 3.3: Six Branches of the MSDD
Figure 3.4: Quality Branch of the MSDD
Figure 3.5: Identifying and Resolving Problems Branch of the MSDD
Figure 3.6: Predictable Output Branch of the MSDD
Figure 3.7: Delay Reduction Branch of the MSDD
Figure 3.8: Direct Labor Branch of the MSDD
Figure 3.9: Indirect Labor Branch of the MSDD
Figure 3-10: MSDD database working window
Figure 4-4: Schematic of Basildon Plant Physical Layout prior to Vision 2001
Figure 4-2: Schematic of Basildon Plant Physical Layout post Vision 2001
Figure 4-3: Exploded View of Radiator and Condenser module.
Figure 4-4: Schematic of Processes for Radiator
Figure 4-5: Schematic of Processes for Condenser
Figure 4-6: Bubble diagram of Module assembly process.
Figure 4-7: Schematic of the departmental layout of radiator and condenser area
Figure 4-8: Value stream map of departmental area
Figure 4-9: Layout of the green-end and hard -end capacity cells.
Figure 4-10: Present State Value stream map of Moduling process
Figure 4-11: Future state Value stream map of Moduling Process
Figure 4-12: MSDD evaluation result of Pre Vision 2001 (2000)-FR-Qx
Figure 4-13: MSDD evaluation result of Pre Vision 2001 system (2000) -FR-Qx
Figure 4-14: MSDD evaluation result of Pre Vision 2001 system (2000) -FR-Rx
Figure 4-15: MSDD evaluation result of Pre Vision 2001 system (2000) -FR-Px
7

Figure 4-16: MSDD evaluation result of Pre Vision 2001 system (2000) -FR-Tx
Figure 4-17: MSDD evaluation result of Post Vision 2001 system (2001) -FR-Dx
Figure 4-18: Comparison of two evaluation results
Figure 4-19: MSDD evaluation result of Post Vision 2001 system (2001) -FR-Qx
Figure 4-50: MSDD evaluation result of Post Vision 2001 system (2001) -FR-Rx
Figure 4-21: MSDD evaluation result of Post Vision 2001 system (2001) -FR-Px
Figure 4-22: MSDD evaluation result of Post Vision 2001 system (2001) -FR-Tx
Figure 4-23: MSDD evaluation result of Post Vision 2001 system (2001) -FR-Dx
Figure 5-1: FRs that affects Material Supply Design and Operation
Figure 5-2: Schematic of existing EP parts ordering system
Figure 5-3: Value Stream of Existing Supplier Replenishment System
Figure 5-4: Part Retrieval process for Fast Moving Parts
Figure 5-5: Example of Log in screen
Figure 5-6: Example of Pop up Dialog help screen
Figure 5-7: Example of Part Usage Identification Screen
Figure 5-8: Example of Request Excel Report dialog box
Figure 5-9: Example of Excel file in Ford Bridgend SERT system
Figure 5-10: Proposed SERT system
Figure 5-11: Proposed Marketplace layout
8

List of Tables
Table 4-1: Top and bottom pair performers of Moduling g area (2000)
Table 4-2: Top and bottom pair performers of moduling area (2001)
Table 4-3: Measurables and FRs for design comparison
Table 4- 4: Comparison of performance of measurables and FRs.
Table 5-1: Part Retrieval process for Fast Moving Parts
9

Chapter 1: Introduction
10

1.1 Thesis objective
The objective of this thesis is to present a structured approach for the design of a
manufacturing system by demonstrating the successful implementation of a design
projects in a European Automotive component suppliers manufacturing systems. This
thesis shows how the Manufacturing System Design Decomposition (MSDD) and its
respective Evaluation tools were used to demonstrated the successful areas of the
redesign project and target areas of future work.
Given the lack of a comprehensive and structured framework to link the various elements
of a manufacturing system, the Production System Design Laboratory at MIT developed
the Manufacturing System Design Decomposition (MSDD). This tool is useful in
designing, controlling, evaluating, and improving manufacturing systems [Opereza,
2001]. A maj or section of a Visteon plant's manufacturing system was evaluated
utilizing the MSDD frame work, this plant is located in Basildon England. Visteon
Basildon plant (Basildon plant) is part of the Climate Control division of Visteon UK
limited. The Basildon plant manufactures a variety of radiators, intercoolers and
condensers for numerous customers e.g. Ford Motor Company, Volkswagen etc. In an
effort to become more competitive the Basildon Plant began work on several projects in
conjunction with the Productions System Design (PSD) lab at MIT, headed by Professor
David S. Cochran. These projects include the Basildon England Simultaneous Material
Replenishment Trigger (BESMART), a system to improve the plants internal material
supply chain, the Supplier Electronic Replenishment System (SERT), a system to
improve the external supply chain of the plant with parts suppliers and keep them up-to -
date with actual usage of their parts in plant and a new manufacturing system for the
radiator and condenser module product line of the plant known as the Vision 2001
project.
1.2 Thesis outline
Chapter 1 defines the objective of this thesis and provides a summary of each of the five
chapters.
11

Chapter 2 gives a brief history of the origins of the automobile manufacturing industry,
and its transition from a craft based industry to a mass production based industry. The
chapter concludes with an overview of the Japanese lean manufacturing practices, their
background, and the key principles that form the foundation of the Toyota Production
System (TPS).
Chapter 3 provides an overview of the Manufacturing System Design Decomposition
(MSDD). One of the key capabilities the MSDD provides to a manufacturing system
designer is the ability to communicate information across the different levels of an
organization. The MSDD accomplishes this by separating means from objectives and
explaining the interrelation between the different elements of a manufacturing system and
how these achieve high-level requirements. The chapter begins with an overview of
axiomatic design as it relates to production system design. Axiomatic design provides
the backbone for providing a holistic system view in production system design gives the
relation between system objectives, as seen by the customer, and the requirements for
subsystem design. The chapter goes on to give a summary of the MSDD and its six
branches, or categories: Quality, Identifying and Resolving Problems, Predictable Output,
Delay Reduction, Direct Labor, and Indirect Labor.
Chapter 4 presents a case study of an evaluation performed by the PSD team of that
analyzes the improvements of the Basildon production system. The chapter concentrates
on the radiator and condenser moduling process of the production system. The chapter
begins by giving an overview of the products and process in the Basildon plant including
the product, material flow and information flow. The chapter continues with a detailed
analysis of each branch of the MSDD as it relates to the prior and present production
system in the Basildon plant. The chapter concludes by demonstrating how by meeting
the FR's of the system performance measures of the system will also improve. The
analysis is performed using traditional performance metrics as the evaluating criteria.
Potential areas for improvement areas are identified based on this approach.
12

Chapter 5 presents the work carried out in the Basildon plant on the Basildon England
Simultaneous Material Replenishment Trigger (BESMART) project and the Supplier
Electronic Replenishment System (SERT) project. This chapter begins by demonstrating
the steps undertaken by the team to understand the problems inherent in the material
replenishment system for the externally purchased parts. The chapter continues by
outline the proposed systems the steps explain the material and information flow for the
external parts purchased by the plant.
13

Chapter 2: AUTOMOTIVE MANUFACTURING:
A HISTORY OF THE INDUSTRY
14

2.1 Craft Production
Craft production can be defined as the use of extremely skilled workers who utilize
simple, flexible tools to create a product made to specific customer requirements
[Womack et. al, 1990]. Craft production was characterized primarily by the usage of a
skilled workforce in the areas of design, machine usage and part fitting. The training
process of these skilled workers usually began with an apprenticeship that enabled them
to improve there skill set and would ideally lead to the worker operating their individual
workshop, performing contract work for the large assemblers of the day. There was very
limited specialized tooling; the skilled craftsmen would utilize general-purpose machine
tools to perform their operations.
Due to the high cost of the vehicles production volumes were generally very low at less
than one thousand vehicles per annum [Womack et. al, 1990]. Eventually craft
production gave way to mass production, however several craft producers are still in
business today, primarily due to their exclusivity, prestige and customizability.
2.2 Mass Production
The father of mass production is generally considered to be Henry Ford. His techniques
introduced in the early 19th century drastically reduced costs while simultaneously
increasing quality, in the automobile industry. In contrast to craft production mass
production was able to work under the assumption that cost per unit drops dramatically as
15

production volume increase [Womack et. al, 1990]. This allowed Ford to manufacture a
car that was in the price range of the ordinary man, justifying the high volumes.
The craft to mass transition primarily occurred not because of the advent of the moving
assembly line as most people think but due to the religious zeal to which Ford followed a
gauging system that allowed for the complete and consistent interchange ability of parts
and the simplicity of attaching them to each other [Womack et. al, 1990]. The recent
advances in machine tools and Fords ability to work with prehardened metals assisted
this complete interchange ability. This allowed Ford to overcome the warping that
occurred due to the hardening of machined parts in the crafts production industry. These
new tools were also designed with very short set-up times that allowed for an
inexperienced operator to operate the machines with minimal training. The ability of Ford
to reduce the part count via innovative product design also assisted in the transaction to
lean. All of these allowed for the reduction of costs as the volume increases [Womack et.
al, 1990].
Ford not only pioneered the above stated technological advances but he also made
headway in the workforce area and factory design. The most predominant of these
improvements was the moving assembly line. As Ford divided his labor into functional
groups, dependent on the specific task, he created the functional layout predominant in
factories all over the world today. Each specific task could be performed at a specific
cycle time. By designing the layout of the factory to this cycle time, which allowed for
production to occur at a steady high volume state [Womack et. al, 1990].
16

Ford faced several challenges as he developed mass production. In particular in the
1920's it became apparent that Ford could not please all his markets with just a single
product. To solve this problem he introduced multiple models for different regions of the
world. This required the building and tooling of entirely new plants, as the tools were
dedicated to particular model. In the 1920's Ford encountered trade barriers that
restricted the import of finished goods. To overcome this Ford decided to manufacture
the parts in Detroit and ship the less restricted unfinished goods closer to the point of
usage for assembly [Womack et. al, 1990].
The lessons of Ford spread quickly throughout the world, not only in the auto industry
but numerous other industries. The mass production technique was seen as a giant leap
forward to the older methods of craft production. Yet there were side effects to mass
production. Due to the cost of the large expensive production lines shut downs were to
be prevented at all costs. This institutionalized within the system large buffers between
operations consisting of both workers and inventory. The routine jobs and poor factory
conditions led to the rise of powerful unions such as the United Auto Workers (UAW)
that often had an adversarial relationship with management [Womack et. al, 1990].
2.3 Lean Manufacturing
2.3.1 Background
Numerous definitions abound as to the principles of lean, a term coined by the
International Motor Vehicle Program (IMVP) and MIT [Womack, Jones and Roos, 1991]
to describe the system pioneered by Toyota Motor Company in Japan. Some of the best
17

are: Perfect Quality, Right Quantity and Right Mix utilizing the least resources [Cochran
et. al, 2000].
Lean production was brought about in post World War II era in Japan when Eiji Toyoda
and Taiichi Ohno began to develop the Toyota Production System that marked the
beginning of the "lean" production era. It is said that necessity is the mother of invention,
the Toyota Production system is no exception to the rule. The primary reason that
necessitated the development of the Toyota Production system was the need of Toyota to
manufacture a wide variety of vehicles from luxury cars to large trucks, in a war ravaged,
capital and foreign exchange starved economy, where it was impossible to purchase the
large expensive western machinery that was fast and dedicated to a single product. Japan
also lacked the benefits of the guest worker that was quite predominant in the western
world [Womack et. al, 1990]. This accompanied by the strong labor movement restricted
Toyotas use of their workforce as an expendable cost. All of these restrictions forced
Toyota to develop the lean production system with its characteristic flexibility, reliability
and cost effectiveness in order to compete with the western mass producers.
2.3.2 Principles
The cornerstone of the Toyota Production System is the reduction of waste in every
possible form throughout the entire organization by applying a systems thinking approach
to avoid sub optimization. Following two basic principles, Toyota was able to reduce
costs while delivering products faster and with better quality than their Western
counterparts.
18

Just In Time (JIT):
The Just-in-Time Kanban controlled production management system was developed by
trial and error over a period of many years. The development of the system was primarily
the result of efforts of Ohno [Neise, 2000]. Just in Time (JIT) basically means to produce
the necessary units in the necessary quantities at the necessary point in time. The Kanban
system is a tool for achieving this goal. [Monden, 1998].
The first step of Just In Time is calculating your Takt time. This cycle time or takt time is
considered to be the heart bit of the factory, and is determined by the rate of demand of
the customer [Ohno, 1988]. Takt time (the German word for the musical meter, which
came to Japan in the 1930s when Japan was learning airplane manufacturing from
German engineers) is the tool to link production to the customer by matching the pace of
production to the pace of actual final sales. Determining Takt time is the first step in
establishing and effective JIT system. Takt time allows you to determine [Liker, 1997]:
" What are the requirements?
" How many of a suppliers process products are required by its customers?
" How can we create a process that can fulfill that need in a minimum of waste and
in the shortest time?
Once the Takt time of a manufacturing system has been established and defined it is
possible to implement an effect Pull system. A pull system begins with the end customer
who places the order. This causes a manufacturing order to be created which in turn
triggers the sub supplier's parts to be ordered. This varies drastically from the traditional
19

system utilized by such forerunners of mass production as GM and Ford, know as the
central scheduling system or Push system. The Pull stem relies on the final production
step in the system driving production through out the entire system. This system then
pulls component parts from the sub supplier up through the supply chain. This is the
foundation of supply chain management [Cortada, 1995].
Kanban is a Japanese term meaning card signals, that is, visible records and is a tool for
the achievement of JIT production by allowing for the implementation of a Pull system
[Cortada, 1995]. There are two basic types of Kanban: withdrawal Kanban and
production ordering Kanban. The first specifies amount and type of parts a subsequent
process should draw from the preceding process and is not only used in-house, but also to
withdraw items from suppliers. The latter prescribes the quantity and type of products the
preceding process should supply. Generally, a Kanban of either nature describes a
particular part and the stands for a defined quantity of parts. In current literature the
utilization of these two Kanban within the manufacturing system is often referred to as a
two-card system [Neise, 2000]. Unfortunately a high percentage of people think that
Kanban is the cornerstone of the Toyota Production System [Shingo, 1989], when it
really is just a tool to aid the principle of Just-in-time, which represents in turn a
remarkable difference with traditional mass production systems.
A tool that is used to transfer a pull system through out the Toyota organization is the
Heijunka box. The Heijunka box is utilized to level production over a particular time
period. Heijunka balances the workload to be performed to the capacity or capability of
20

the process to be completed. This leads to a dual functionality of Heijunka in the
reduction of inventories due to the reduction in batch size and the increased model mix
and the ability to equate the workloads between production processes to capacity
[Colman et. al, 1994].
Toyota's Heijunka is a component of TPS that is widely misunderstood by western
manufacturing. It is widely believed that Toyota Freezes their Production schedules (for
example the sequence cars are run down a production line) far in advance, and this
freezing allows for the smooth running of production. While it is true that Toyota
produces Heijunka production planning on a monthly basis, the setting of monthly
volumes for different model variation does not lock in the actual production sequence.
This sequence can be changed up till the last day prior to the beginning of the production
process, body welding and assembly process [Liker, 1997].
"Traditional" mass-producers tend to rely on long run sizes due to long changeovers that
make the implementation of a JIT system difficult. The way that Toyota overcame this
obstacle was through he implementation of a Single Minute Exchange of Dies (SMED)
system.
Ohno was one of the first person to do active work on changeover reduction that enabled
Toyota to produce several types of stamped parts on a few presses using multiple dies
designed to be change in a relatively short period of time. There are two reasons why this
technological advance created greater efficiencies, making small batches eliminated the
21

carrying cost of huge inventories and secondly allowed for quicker and less costly quality
detections and correction [Womack et. al, 1990].
SMED is one of the key tenets of TPS. The single minute states that all changeovers
should occur in less than 10 minutes, hence the single minute. The principles to achieve
this were devised by Shigeo Shingo and are as follows [Shingo, 1987].
* Clearly distinguish internal from external set-up.
" Convert internal to external set up, hence reducing the internal set up and
reducing actual machine down time.
" Improve functional clamps.
" Eliminate adjustments.
The benefits of adopting SMED can be summarized as:
" Reduction of batch size increase model mix by reducing change over time. This
also leads to a secondary benefit of reducing WIP and finished goods inventory.
" Increased machine operating rates due to reduced set-up time.
* Increased flexibility of the system due to rapid response to mix and volume
change.
"Traditional" mass-producers relied on a Push system. This system by forecasting the
demand of final car sales. The scheduled amount of cars generates a production schedule
for all upstream suppliers of car components and subcomponents. At each of these stages,
the production schedule accounts for a "fall-out" or defective-parts rate to ensure that the
right amount gets delivered to the subsequent stages. But the fall-out rate, as well as the
scheduled demand, is stochastic. Consequently, the amount produced at each stage,
22

doesn't necessarily match the amount sold, therefore resulting in inventory accumulation
[Oropeza, 2001].
A push system causes the build up of large uncontrolled "buffer" inventories that cause
problems in the system to be hidden. This system is illustrated in Figure: 1-1
Customer
Inventory on Planned Vehicle AssemblyHand Requirements Inventory
Dealer
MRP "Push" Production Schedule HNISHED
Inventory
Second-tier 2 First-tier $V Vehicle a Staging
Subcomponents Components Assembly
Inventory Inventory Inventory
Figure 1-1: Automotive "Push" Production and Scheduling System [Adapted from Cochran, 1999]
The Toyota Production System JIT pull system is based on actual consumed quantities.
When a car is sold, the car is retrieved from the assembler's Standard Work in Progress
(SWIP). This is similar to a buffer with the major differences being that it is operated on
a first in first out (FIFO) system and it is controlled. The necessary upstream components
are pulled into the assembly plant to make another car of the same type as the one
withdrawn. This system, is illustrated in Figure: 1-2
23

P P ? WithdrawalSignal Production Kanban ........... KanbanKanban Kanban ..
Delivery Pitch Cso e
/ DDeaerr
Heijunka Box
Second-tier First-tier Vehicle fDG ISubcomponents Subcomponen Asseblyg
SWIP SWIP SWIP
Figure 1-2: Automotive "Pull" Production and Scheduling System [Adapted from Cochran, 1999]
Whenever an item is retrieved from the SWIP at any stage, a signal is sent
upstream to request replenishment material to re-stock the missing part at the SWIP. This
is done with the aid of production and withdrawal replenishment Kanban cards.
Jidoka:
Jidoka is the abbreviated for of the Japanese word "Ninbenno-aru Jidoka" which might
be loosely interpreted as autonomous defects control [Monden, 1993]. This represents the
second pillar of the Toyota Production System as illustrated in Figure: 1-3. Traditional
mass producers tend to maximize machine utilization for two fundamental reasons: to
reduce investment per part produced and to reduce labor per part produced. This results
in faster and more automated equipment. At Toyota, operator utilization is considered to
be more valuable than the equipment utilization [Shingo, 1989]. This leads to the concept
of an idle machine being preferred to an idle worker. At Toyota, they increase the amount
of value-added activities by introducing the concept of autonomation. By increasing the
machine cycle times, the operators have enough time to operate various machines at the
same time, while the others are running. To do this, it was necessary to separate the
24

worker from the machine, allowing him/her to walk away from the machine while the
machine performs the operation automatically. This is accomplished by manually feeding
the parts to be processed into each machine and by pressing a "walk-away" switch. The
machine would then automatically process the part and unload it, finishing its cycle and
waiting for the operator to arrive and retrieve the finished part and to load in the new on
[Oropeza, 2001].
TPS
Responsive to Customer,High Quality, Lw Cost,Volume and Mix Flexibility
I- 0A
Level and Balance Production
The Foundation is Lead Time Reduction Enabledby Less Than 10 Minute Set Up Time
Figure 1-3: The Toyota Production System Design Model [Cochran, 1999]
Within Toyota the concept of Standardized work is integral to their success of continuous
improvement. Within Toyota standardized work is accomplished through the use of two
devices known as a Standard Operations Routine (SOR) sheet and a Standard Operations
(SO) sheet. The SOR sheet lays out a detailed description of the operators work loop
25

while the SO sheet combines the operator work loop with Takt time and amount of WIP
[Shingo, 1987].
Standardization of work allows for ease of continuous improvement as muda and quality
errors due to operators work method can easily be detected and corrected. For this reason
in the Manufacturing System Design Decomposition designed at MIT, standardized work
is dictated as the first step towards effective lean implementations in a medium to high
volume repetitive manufacturer [Cochran et. al, 2000]. It is essential that the operator
play a decisive role in all improvements made.
Continuous improvement is driven by the lean producer due to their overarching goals of
zero defects while reducing costs. These improvements are made in small increments by
teams performing Kaizan blitzes. This is defined as a group of people working together
over a short period of time to analyses and implement changes to a particular process or
operation. In addition to Kaizan blitzes, the individual shop floor operator is empowered
to stop the entire production process if they discover a quality problem via an andon cord,
usually found above the workers head [Shingo, 1987]. This creates a situation where a
large proportion of the plants energies are placed on systematically tracing back to the
root cause of the quality issue to insure that it never reoccurs. Poka yoke devices are
also implemented to accomplish a similar out come. If a defect is detected a signal is sent
to stop the process so as the process can be analyzed [Womack et. al, 1990].
Within a lean organization production is set up to facilitate one-piece flow. One-piece
flow is a key tenant of lean production as it allows for quick detection of quality issues
26

through minimal inventory. A cellular layout helps to facilitate one-piece flow by
allowing one multi skilled operator to operate several machines at once hence consuming
the least resources. The Cell is a group of processes designed to make a family of parts
in a flexible way. The worker in the cell is multiprocess: they can run more than one
procees and they can run different kinds of processes [Black, 1991].
The manufacturing cell also provides several other secondary benefits, of which the most
notable is its ability to enhance flexibility within an organization. A particular cell can
be designed to run at multiple cycle times to match varying takt times by varying the
number of operators in the cell and changing the work loops.
27

Chapter 3: OVERVIEW OF THE MSDD, THE
QUESTIONNAIRE AND THE DATABASE
28

3.1 Axiomatic Design Approach in Production System Design
Decomposition
A holistic system view in production system design gives the relation between system
objectives, as seen by the customer, and the requirements for subsystem design. Such a
relation helps to prevent local sub-optimization [Mierzeja, 2000]. An approach to relate
these objectives is the decomposition method provided by the axiomatic design theory
[Suh, 1990], which can be understood as a top-down analysis of objectives and
requirements [Duda, 1999]. "The ultimate goal of the Axiomatic Design is to establish a
science base for design and to improve design activities by providing the designer with 1)
a theoretical foundation based on logical and rational thought processes and 2) tools."
[Suh, Albano, 1995].
Axiomatic design breaks a problem down by answering two basic questions:
1. What are the objectives of the subsystem?
2. How can given objective be achieved?
The answer to question one establishes what the Functional Requirement (FR) of the
system would be and the second questions establishes the Design Parameters (DP) of the
system. The pairs of DPs and FR's can be further decomposed into lower levels of
details by answering the same questions for the DPs.
The functional requirements (FRs) represent the goals of the design or what we want to
achieve, these can also be know as the requirements (Rs). The design parameters (DPs)
express how we want to satisfy the functional requirements, these can also be known as
the solutions (Ss).
29

There are two axioms, which guide the design process and enable good designs to be
identified. The two axioms are the Independence Axiom and the Information Axiom.
They are stated as follows [Suh, 1990]:
The Independence axiom maintains the independence of the functional requirements.
Alternate Statement 1: An optimal design always maintains the
independence of the functional requirements.
Alternate Statement 2: In an acceptable design, the design parameters and
the functional requirements are related in such a way that specific design
parameter can be adjusted to satisfy its corresponding functional requirement
without effecting other functional requirements [Linck, 20011.
The Information Axiom minimizes the information content of the design.
30
WIMP.-

3.2 Introduction to the Manufacturing System Design
Decomposition
The MSDD decomposes a general system design for discrete parts manufacturing. There
are six levels of FR-DP pairs in the Decomposition shown in Figure 3.1 [Cochran et. al.,
1999]. The first level FR captures the highest level objective of manufacturing within an
enterprise, "Maximize long-term return on investment," and the sixth level functional
requirements are specific details of a manufacturing system design. To further
decompose this level would require going into detail of the particular manufacturing
system in question.
r r
- -PSD .-
-P-MANUFACTURINGSYSTEM- -L---- ESIGN DEOMSTION
Figure 3. 1: Manufacturing System Design Decomposition
Once you have stated the highest level objective of manufacturing within an enterprise
you can further decompose the system to the second level FRs of the MSDD which state
that to maximize long term investment, you must maximize sales revenue, minimize
production costs, and minimize investment over the production system lifecycle. The
31

third level FRs further decompose the design into manufacture products to target design
specifications, deliver products on time, meet the customer expected lead time, reduce
waste in direct labor, reduce waste in indirect labor, and minimize facilities cost
[Oropeza, 2000]. The top three levels are shown here in Figure 3.2.
FRIMaximize longterm return oninvestment
DPIManufacturing
system design
FRI I FR12 FRI13Maximize sales Minimize Minimize
revenue manufacturing investment overcosts production
sys tem lifecycle
DPI1I DP12 DP13Production to Elimination of Investmentmaximize non-value based on acustomer adding sources long termsatisfaction of cost strategy
FR111 FR1 12 Q - FR1 13 X FR121 FRI122 FR1 23Manufac tare Deliver Meet customer Reduce waste in Reduce waste in Minimizeproducts to products on expected lead direct labor indirect labor facilities costtarget design time timespecifications
DP111 DPI12 DP113 DP121 DP122 DP123Production Throughput Mean Elimination of Reduction of Reduction ofprocesses with time variation throughput non-value indirect labor consumedminimal reduction time reduction adding manual tasks floor spacevariation from tasks
the target I
Figure 3.2: High Level Objectives of the MSDD
The lower level objectives (levels 4 through 6) of the MSDD are divided into six
branches, or categories: Quality, Identifying and Resolving Problems, Predictable Output,
32

Delay Reduction, Direct Labor, and Indirect Labor. These six branches are illustrated in
Figure 3.3, and they are briefly described in the rest of this chapter [Kuest, 1999].
Quality Identifying & Predictable Output Delav Reduction Direct Labor Indirect Labor
ResolvingProblems
- - - - -i-r -
r -,a -- -- r~
Figure 3.3: Six Branches of the MSDD
33

3.2.1 Quality Branch
The Quality branch of the Manufacturing System Design Decomposition shown in Figure
3.4 decomposes the following FR-DP pair:
FR 111: Manufacture products to target design specifications
DP 111: Production processes with minimal variation from the mean
r F'Q - - " - "" -F R-01 FR-02 FR-03 IOperate Center process Reduceprocesses mean an the variation inwithin control target Process Cutp Litlimis
PM-03PM-01 PM-02 VarancaofNumber of Ofterence process outputdefects per n bemenpartswith an process meanassignebe and target
DP-01 DP-Q2 DP-Q3Elimination of Process Reduction ofassipacle parameter process Io isecauses of adjusimentvariallon
FR-Q13 FR-014 FR-Q31 FR-032Elirrnate Elirinate Reduce noise Reduce mpact
method matertal in amecess ofinput noise anassignabie assignable inputs procaess outputcauses causes
PM-032PM-Q13 PM-Q14 PM-Q31 OutputNumberof Numbwofdects Variance of variance?deleclspern aPernptis processirputs inputvariance
*bs parisasegnable asign"etotheto the aramss maimy of
incoming maerial
DP-11l DP-Q12 DP-Q13 DP-Q14Failure mode Stable oulput Process plan Suppler qualiyand effects from Operatrs design programanalys
FR-Q121 FR-01ZZ FR-0123Ensure that Ensure that Ensure thatoperatOr has operator operator hunnknoWedge of consiSteniti errors 0o notreniredtasks perforrrtasks translateto
coructty defectsPM-0121Numberof PMQ122 PM-01123defets per n Number of Number ofpartscause by defects per n defects PC nan oprdoesaO ets cauad by pais eased byotunderdsing nonataindar human erroraboutmtdhods, nma s
DP-Q121 DP-0122 DP-Q123Traning Standardwork Mistake proofprogram rlthods operations
(Poka-Yoke)
DP-031 OP-Q32Connersicn of Robust processearrere, designcauses toasale
Figure 3.4: Quality Branch of the MSDD
34
Quality
FR-Q11Eliminaterncthilneassomatlecauses
PM-011Nuberot"detemispernpmrt assigr-bleto equ wrient
FR-Q12ElirrmateoperatorassignabiaCauses
PM-Q12Number ofdefetspernpartnser.to operators
I

To accomplish DP 111, processes must be stable, be centered on the target mean, and
have little variation. For this to occur in a manufacturing environment the MSDD shows
that three solutions must be fulfilled, that is eliminate assignable cause of variation, a
process parameter must be met and finally production noise must be reduced. Some of
these are further decomposed [Oropeza, 2001].
35
..... |ii l ilm ll| i lI ....... I I l illI " . M I I N MI h1 a 2.ia ll

3.2.2 Identifying and Resolving Problems Branch
The Identifying and Resolving Problems branch of the Manufacturing System Design
Decomposition shown in Figure 3.7 decomposes the following FR-DP pair:
FR-Ri: Respond rapidly to production disruptions
DP-R1: Procedure for detection and response to production
Identifying andResolving Proble
FR-RIRespondMs ~ rapidlytoproductiondisruptions
PM-R1Tire betweenoccurrence andresolution ofdisruplions
DP -R1Pracedure fordetection &response toproductiondisruptions
FR-R11 FR-R12 FR-R13Repidly Commurncate Solve nroblensrecognize probimstn the irnedieteproduction right peopledisruptions
PM-R12 PF-R13PM-R11 Time beteen ne catmen-ne ballen der1ceik Of seport mrOurceS arnernce of OfM the undiItnIngdruWt nd eiO dWUisuian is and dhet theIdenrieiOn of sapport merrr dearuillon I. endihal the -nder1n-g mletgasuptm is Wt the mwhion
-j- drmumhon is
DP-R11 DP-R12 DP-R13Susetrem Process ftr Standard
gorruration to teedback 11 metd toI nsabe opertor's opercion idertify andde ion ct state irrmate root
disrubonscaue
FR-RI1I FR-R112 FR.R113 FR-R121 FR-R122 FR-R123Idertfy Identfy Idrntf wiat Idenif correct Merimee deley MSInFnizEtUIe INr
dismrptltns disruptions the disruplion it support n contacting &*Pwr'tse-'r
when they wherethey resources correct spport to u ndeO
occur Occur nmsurces do*
PM-Il l PM-Rh1 PM-R113 PM-R121 PM-R122 -I
Time between Time mateen Time betmr Trime etwiien Time between corftafcoredoccurrence and didantil oof idrheronof dertltiodmof idetiftation aoPrt resourcerecogntion that d'rwrutasnend here diinon mug the and cortact of and appartdisruption idendiaenot ourred and omucilon is and correct surpport 1 s0.0Occurred Weethe idertosonof the r - resource unWdesM1n1ng
diwrupton vma the the coiract wid theocuiud desupbm is uppod resre muges
DP-R111 DP-R112 - 1P-R13 DP-R121 OP-RI22 3P-Ri23Increased Simpilmed Context Specified Rapid support Systemthatoperator material flow sensitive support centact corweyswhatsampling rate of paths feedback resources far procedure the dsrution iseqiwiment each failurestatus modes
Figure 3.7: Identifying and Resolving Problems Branch of the MSDD
36
disruptions
I

To accomplish DP-R 1, a three part process must occur, you must recognize the
disruption, communicate the disruption and solve the problem [Oropeza, 2001]. These
parameters are further decomposed.
37

p
3.2.3 Predictable Output Branch
The Predictable Output branch of the Manufacturing System Design Decomposition
51own in Figure 3.10 decomposes the following FR-DP pair:
FR-P1: Minimize production disruptions
DP-P1: Predictable production resources
Predictable FR-PI
Output Minimizeprodauctiondisruptions
PM-P 1Number otonnance ofdesttions aAnunt ortimetst to dixurtbonS
DP-P1Prec rltatieeproductionresources0peciple,
FR-P11 FR-P2 FR-P13 FR-P14Ensure Ensure Ensure Ensure material
S availaebiw of predictable oredictable avalietyrlervart equipment worker eutputproduction output
-IIrformallon
PM-P11 Number of PM-P13 PM-P14S Number of olmwrncs Of Number of Number Wf
cofa ntncas of unplanned druot wue to dtrupilons due to
tirrnrnation eebm e"t operses, Materil
C12uvions, dowitm, Amount of shortalis,EnAmou rt of rm ounic e te utnrentime amou t of
interrupiontime Urmn td for o prdlo cn f iterprioen time
t A inom tnrn equPnent fc M scsrupbomn cowftme hrge
D P.P1 DP-P12 OP-P13 DP-P14Capaone and Vaietemance of Mativated work- Standardreliable equipment force maeralInformation reliability pe rfbrrrlng repienisihmentsysten slandard Systems
FRP11 FRP22 F-P131 F-P132 FR-P133 FR-P141 FR-P142
Ensure that Serice Reduce Ensue Do not Interrupt Ensure that Ensure propere quipeeit is equipment variabilty of availability of production for partsare firring of part
rasgy regularty taskcampleten workers worker adabletothe amvasrviceable time allowanes matenal
PM-P122 PM-PI32 handlersPRI-P121 Frequency of PM-P131 Numnber of PM-P133
Amount of tirm equipment Variance in task occurrences of Nwmbar of PM-P141 PM-P142
required to servicing complioin time operator disr"- ndue to Number of Parts
service lateness, ciperelor occurrencas Of demanded-equipment Amount of a* in 's marketplace Donts delivered
oprtr l-ruplon time shortagesateness fo rl
DP.P121 DP-PI22 DP-P131 DP-P132 DP-P133 DP-P141 DP-F142Machines Regular Slandald"ok Perrect Mutual Relief Stadardwork Pants mvecitodlesignied for preventative mathocs to Attendance Syslem with in process dINnvdreamnsermbltity maintenance p"N4de Program cross-trained between suo. oiberations
program Weilb wo rkers 9sitem il rding to
Figure 3.6: Predictable Output Branch of the MSDD
38

To accomplish DP-P 1, four aspects of a manufacturing system must be available and
predictable; these include the production equipment, operators, information and
materials. Some of these aspects are further decomposed [Oropeza, 2001].
39

3.2.4 Delay Reduction Branch
Delay Reduction branch of the Manufacturing System Design Decomposition shown
in Pigure 3.13 decomposes the following FR-DP pair:
FR 113: Meet customer expected lead time
DP 113: Mean throughput time reduction
Delay g . .... . - - - - - m--.- - ..-
Reduction FR-T1 FR-T2 FR-T3 FR-T4 FR-T5Reduce lot Reduce Reduce run Reduce Reducedelay process delay sizs rolay transportation sysematic
(coused by r. r,) delay operationaldelays
PM-T2 PM-1 PM.T4 PM-T5PM-T1 PM-T2 Inventory due Invertory due to Pradutiontime
ariventry due Inrentodue ue to run sze transportation losI e toto lot sie delay to process delay delay amongnes
delay among resourcesI
DOP. T1 DP-T2 DP-T3 D P-T4 DP-T5Reduction d Production Producton of Material flow Subsystemtranster batci desned for Me desred mis oriented layot design to avoidsize trhe takt time and quartity design proouctri(singie-piece dumg eacn inlerruptionslow) demand interval
FR-T21 FR-T22 FR-T23 FR-T31 FR-1l2 FR-T51 FR-T52 FR-T53Define Ensurethal Ensurethatpart Provide Producein Ensjre tht Ensurethar Eneier
tlak time(s) production arrival rate is knowledge of sufficiently support pro*udlen sujeortcycle time equal to service demanded small run sizes resures dont sowuwe rweema
eQualstakl time rate tr prcduct mix interfere wth (reptseran CpeopletarSomrier(partypesamion on) ruret intreroen) a ntrerfere
quantitiesn resurs vih oee another resh one rxther
PM-T21 PM-T2 PM-T23 PM-T32 PM-T51 PM-TS? PM-T53Has takttime Difference Difference PM-T31 Actual run see Proauctiontime Prodiantlime Produdan Umsbeen defined? between between arrmval Has thi -target ru size lool due to lostie to lost due to(Yesil No) production and Serice Information ageeit Perdudion support
cycle time and rates been proioeay maources resources resoers
takt time (Yoee/No interforenios wth interfesnces vith irnterwnuashprodudcon oneenother oneanother
DP-T21 DP-22 DP-T23 DP-T31 DP-T32 DP-T51 DP-T52 DP-T53Delntlonor sOsyster Arrival or parts information Design Quick Submylems and Ensure Ensuregr fl nsot neealed to meer at down srear flow fr:m changseaer for equipmet coordination coordinasionuIrntomers to the desred lakt rergions dofnstreamn material oasnkied to an separation and separationacieetekt time (desnimd according to customer handling am *aort 9"op of production of support worktmessn s are equapment Whirtas nq a trk patters potters
ideal range piatah rrapa
FR-T221 FR-T222 FR-T223Ensure that Ensure that Ensure totalautom etc ce manual cycle cycletrne lesxtime -G timne e t takt timeminimurn laitime
PM-T223PM-T221 PM-T'222 Is averageHas this been Has this be en cycle timne lessachlevad? (Yes acriemed') (Y es than 12K Ilme InI No) I No) desired time
iervar?
DP- T221 DP- T222 DP-T223Design of Desigt of StaggeraPonrodate apropriate production ofautomatic work oerator work parts aithcootenl at each contanit/loops Thlwrentcyclestation times
Figure 3.: Delay Reduction Branch of the MSDD
40

To accomplish DP 113, five aspects of a manufacturing system must be fulfilled
Reduction of transfer batch, production must be designed to takt time, production mix
and quantity must be met, a material flow oriented design must be fulfilled and
production system must be designed to reduce interruptions. Some of these aspects are
further decomposed [Oropeza, 2001].
41

.,.5 Direct Labor Branch
The Direct Labor branch of the Manufacturing System Design Decomposition shown in
Figure 3.20 decomposes the following FR-DP pair:
FR 121: Reduce waste in direct labor
DP 121: Elimination of non-value adding manual tasks
r FRD1 FR-D2 FR-D3Eliminate Eliminate Eliminateoperators' wasted motion operators'waiting on of operators waiting on othermachines operators
PM-D1 PM-D2 PM-D3Percentage of Percentage of Percentage ofoperators' time operators' time operatori' timespent waiting spent on sent maiting anon equipment wasted motions other operators
DP-D1 DP-D2 DP-D3Human- Design of Balan ce dMachine workstations/ work-loopsseparation work-loops to
facilit ateoperatortasks
FR-DI FR-D12 FR-D21 FRReduce time Enable werker Minirrnze Mioperators to operate more wasted motion waspend on non- than one of operators invalue added machine I between wotasks at each station stations prestation
PM-D12 PM-021 PMVPM-DI 1 Percentage of Percentage of PerPercentage of stations in a operators'time opeoperatorstime systemthat spentwalking spapent on non each worker between mataklue-wdding can operate stations
tasks Mi~eiaking at a
station
DP-D11 DP-D12 DP-D21 DPMachines & Train the Configure Stastations workers to machines / equdesigned to run operate multiple stations to locaautonomously stations reduce walking stat
distance (s
sted motion
-D2rvimizested motionoperators'rk,paration
-D22c=tage ofrators' time
nt on vesed
FR-023M iNrmizewasted motionin operators'work tasks
PM- 023Percentage ofoperators' timespent on
k prearaion during workroutine
-D22 DP-D23ndard tools J Ergonomicipment interface betweenated at each the work er,ion m ine and
)tum
Figure 3.8: Direct Labor Branch of the MSDD
42
DirecLabo

To accomplish DP 121, it is essential to eliminate all operator assignable waste. At this
time three forms of operator assignable waste have been identified [Oropeza, 2001].
These include waiting on machines, unnecessary motions, and waiting on operators.
Some of these aspects are further decomposed.
43

3.2.6 Indirect Labor Branch
The Indirect Labor branch of the Manufacturing System Design Decomposition shown in
Figure 3.24 decomposes the following FR-DP pair:
FR 122: Reduce waste in indirect labor
DP 122: Reduction of indirect labor tasks
IndirectLabor FR-11
Improveeffe ctive ne ss ofproductionmanagers
PM-11Amount ofindirect laborrequired tomanage system
D P-11Self directedwork teams(horizo nt alorganization)
FR-12Eliminateinformationdisruptions
PM-12Amount ofindirect laborrequired toschedulesystem
D P-12Seamlessinf ormation flow(visual factory)
Figure 3.9: Indirect Labor Branch of the MSDD
To accomplish DP 122, the indirect workforce must be utilized more effectively. One
way of accomplishing this is by flattening the management structure. In many industries
grate effectiveness gains have been realized through more effective scheduling
techniques [Oropeza, 2001].
44

3.3 MSDD Questionnaire
The MSDD questionnaire contains specific questions about the FR-DP pairs stated in the
MSDD. The questions use a five-point Likert scale, with each scale measureing a specific
content i.e. the content of a particular FR-DP pair. Questions are answered with one of
the following choices: (1) strongly disagree, (2) disagree, (3) neither agree nor disagree,
(4) agree, (5) strongly agree, and (0) not applicable. Several question in the questionnaire
are open ended forcing the respondent to answer in their own words. This can lead to a
deeper coverage of the system. It was important in the development of the questionnaire
that the number of open ended questions were kept to a minimum due to the wide scope
of the MSDD, which would requiring excessive time for respondents to fill out the
questionnaire if there were to many open ended questions. Open-ended questions where
primarily uses when it is felt that additional information is necessary, e.g., asking for the
amount of time spent on equipment maintenance [Linck, 2001]. In it's current state the
MSDD questionnaire takes approximately one hour to complete.
The MSDD questionnaire utilized several question to compare and validate the answers
of the participant. For example, the following questions are asked about FR-DP P122
"Service equipment regularly." - "Regular preventative maintenance program" [Linck,
2001].
" We dedicate a portion of every day solely to preventive maintenance and followthe preventive maintenance schedule.
" We emphasize proper maintenance as a strategy for achieving schedulecompliance.
" We are usually behind production schedule and have no time for preventivemaintenance. Repair is our maintenance.
3.4 MSDD Database
The MSDD database provides a graphical user interface for the application of the MSDD
questionnaire. This allows for greater ease in administering and analyzing the
questionnaire, and to document observations made during the case study.
45

The general functionality of the database is explained by referring to a database screen
shown in Figure 3-3-25 [Linck, 2001]. The numbers are used to explain the
functionalities. The user can select one or two questionnaires he/she would like to display
(1). FR-DP pairs with associated questions are highlighted as colored boxes. Clicking on
any colored box of the MSDD (2') shows the associated questions in the lower half of the
screen (2"). The user can change the answer and edit the comment field.
Me edit Vew insert Fgrmt Records Tools Wfrndow kieip
plea" $1011ec( theevaluation. you wouldALe to displar~
"lant M iupar pilot project-echE01
UA
L b ED
2' E P 0 Op E W0 000 W00W]H
EE1 LE] 00 [10 [00Quality dent Resolve Predictble Output Delay Reduction Operational Invest-
Problems Costs ment
ValueStream (Plant M fBumper pilot project ]Jochen Linck
R/DP 021 Ensure that operator has knowledge of TraIning program
Question Arnwe Commernt
Reset width
3Deset boxes
Keyword search
operator
Display
ntegrator:
Design Methods:
Spear TP5 Rules
Edit Design Mehods
ShowDependencies
Work withdLsign matrx
pertor ancevery good:
*good:
medium:
Upoorvery poor
71 F vg-uat-d
Figure 3-10: MSDD database working window
(3) Clicking on the "A" button next to the questionnaire selection field opens a window
with a numerical analysis of the questionnaire. It shows how many questions scored very
poor to very good. It also allows filtering of questions by score to facilitate a first analysis
of the questionnaire.
46
We have standardized training procedures 1 No change.for each operation. I
Operators know upstream and downstream r5 Very good training of system coherences for allprocesses. participants at the ayslem with the physical
Operators are usually trained on the ob. No change.
We continuously improve training procedures. No change.
' 1. sthormy dagee 5 strongly agreeR7- d1b 1 1, *1 of 6 4

(4) The "keyword search" highlights all FR-DP pairs related to an entered word. This
feature currently looks in the text of FRs, DPs and questions. The keyword search can
greatly support the determination of design objectives and the understanding of the
MSDD.
(5) The "integrator" provides a platform to relate FR-DP pairs system design aspects such
as cell design and scheduling, or to design projects. The user can select from an array of
integrators to highlight related FR-DP pairs.
(6) The sixth functionality shows how the MSDD can be linked with existing
manufacturing system design methodologies.
(7) If the box "Show dependencies" is activated, the user can click on any FR or DP box
to highlight the dependencies. Clicking on a DP box highlights all FRs that are affected
by the DP, clicking on an FR box shows all DPs that affect the FR. This feature can be
helpful in determining dependent design objectives. The button "Work with design
matrix" directs the user to the administration of the dependencies [Linck, 2001].
47

Chapter 4: VISTEON BASILDON VISION 2001
PROJECT
48

MIT LibrariesDocument Services
Room 14-055177 Massachusetts AvenueCambridge, MA 02139Ph: 617.253.2800Email: [email protected]://libraries-mit.edu/docs
DISCLAIMER OF QUALITY
Due to the condition of the original material, there are unavoidableflaws in this reproduction. We have made every effort possible toprovide you with the best copy available. If you are dissatisfied withthis product and find it unusable, please contact Document Services assoon as possible.
Thank you.
MISSING PAGE(S)
49

Non Production Support Areas
Radiator Braze oven
Rad Core Build
Rad Tube Mill
Rad Tank Press
Press Shop
Intercooler Area
Condenser Area
Condenser Brace Oven
visteon Basildon Plant
Figure 4-1: Schematic of Basildon Plant Physical Layout prior to Vision 2001
U
UU
U
Non Production Support Areas
Radiator and Condenser Braze oven
Rad Core Build
Rad Tube Mill
Rad Tank Press
Press Shop
Intercooler Area
Condenser Area
Condenser Brace Oven
Cellular layout for modules
vsteon Basildon Plant
Figure 4-2: Schematic of Basildon Plant Physical Layout post Vision 2001
50

4.1.2 Product and Manufacturing Process Overview
4.1.2.1 Product Introduction
For the purpose of this case study we will concentrate on the Radiator and the Condenser
product lines as they combine to form the module shipped to the customer. An exploded
view of the module can be seen in
Figure 4-3.
Radiator Core
Radiator Tank
Cap and Baffle
Figure 4-3: Exploded View of Radiator and Condenser module.
A majority of the component parts used to manufacture the radiator and condenser that
make up a module are manufactured within the Basildon facility. The major part that is
manufactured by external suppliers are the radiator tanks manufacture by 6 di fferent
injection molding suppliers and shipped in from the US, UK and Japan. These parts are
referred to as EP parts within the Basildon facility.
51
Condenser Core

4.1.2.2 Manufacturing Process Overview
The Module can be decomposed into two major categories, the Radiator and the
Condenser. These categories combine to form the module. The basic manufacturing
process is similar for both products and includes the core build, braze and final assembly.
4.1.2.2.1 Radiator Assembly Overview
4.1.2.2.1.1 Product and Process Introduction
The Radiator assembly process can be categorized into two groups pre-braze and post-
braze.
Figure 4-4 shows a schematic of two groups combining into the final product. The pre-
braze processes refers to all radiator assembly processes before the brazing process. At
this stage all the assembled parts are aluminum and held together by the side supports and
headers. The brazing process essentially fuses all the contact surfaces together. The
Brazing process is a complex combination of varying temperature ovens to allow for the
precise heat treatment of the product.
The post-braze operations begin with the tank press process which is the final assembly
stage assembling the radiator tanks to the radiator core. This is followed by a quality
check test know as the leak check. Every radiator undergoes a leak check, and is
immediately preceded by the buy off process, comprising of scanning a barcode label on
the radiator to enter it into the MRP system as a completed product.
Pre Braze Braze Post Braze
Operations OperationsTube Mill Tank Press
Side Support Press Leak CheckHeader Press Buy OffCore build
Figure 4-4: Schematic of Processes for Radiator
52

4.1.2.2.1.2 Product Variety and Families
The two product varieties that we are concerned with for this case study are the C170 and
CD132 product families, for the Modeo and Focus car families. The major differences
between these two families can be characterized in 3 areas:
1. Radiator Tanks
Ii. Tube diameters
III. General dimensions
4.1.2.2.2 Condenser Assembly Overview
The assembly process for the Condenser is very similar to that of the radiator. As shown
in Figure 4-5, the primary difference is most of the assembly is done prior to the brazing
process, and there are no plastic end tanks used in the assembly.
Pre Braze
Operations
Tube Mill
Side Support Press
Header Press
Core build
Cap and Baffle
Braze Post Braze.
Operations
Mass Spectrometer
Figure 4-5: Schematic of Processes for Condenser
The primary differences that can be noted from the figure are the cap and baffle operation
that is performed after the core is built, which is the final assembly step before brazing.
After brazing a quality check is performed called the mass spec test.
53

The condenser and radiator are then assembled to each other to form a module. The total
assembly procees for radiator and condenser system can be seen in Figure 4-6.
N.(:Fins :
11(:Tubes
Fins
Core Radiator
RadiatorTanks
Mo dul~e
Al Stock
A =Stock
Figure 4-6: Bubble diagram of Module assembly process.
54
Core Condense~r
Cap andBaffle

4.2 Value Stream Description
4.2.1 Pre Vision 2001 (2000)
4.2.1.1 Overview and Physical Layout
A schematic of the departmental layout is shown in Figure 4-7. The top figures shows all
3 groups that make up the Radiator and HC Condenser production area. The bottom right
portion of the figure highlights the location of the HC Condenser department and the
Radiator department on the Basildon area map. The bottom left portion of the figure
illustrates a high-level flow path between the different departments. As shown on the left
side of Figure 4-7, the CD- 132 condensers must travel from the HC Condenser to the
Radiator tank press assembly cells to be moduled and C 170 Radiators must travel from
the radiator tank press cell to the condenser cell to be assembled, an estimated distance of
500 feet. The pallets that transported the condenser and radiators hold 16 radiators each
or 52 condensers each.
In general, the operating pattern for the Radiator and Condenser business unit is 3 shifts
of 8 hours each. Excluding breaks and lunch, there is a total of 7.2 hours of work per
shift.
55

Core Buildand
integratedfin mill
Rad Core Build
Fin
P
EmC
UM
I'Mill aModuling IStation Mass Spec
Tank Press Leak Check
Buffer
FREDE
Tank Press ModuleC ell
CondenserC ell
Module
Distance Traveled
R adfa Rrs: 500 Ft
S00ondensers: 500 Ft500
Figure 4-7: Schematic of the departmental layout of radiator and condenser area
56
iz~I
Cap and
Baffle

4.2.1.2 Operations Management
4.2.1.2.1 Material Flow & Information Flow
The core processes for departmental layout begins with four schedules being sent to the
two departments. One schedule is sent to the Radiator core build a second schedule is
sent to the radiator tank press, a third schedule is sent to the condenser core build area
and finally a fourth schedule is sent to the Condenser final assembly cells. The value
stream map can be found in Figure 4-8.
Production control CUSTOMERS
-10 day Forecast-Daily Requirements CMMS
daily
Core Buildschedule Tank Press Shipping
schedule schedule Shipping
Core Build. Tank Press
C 170Radiators
Cond Core CD 132 toschedule Condenser
Core BuildL Cond Cell
Figure 4-8: Value stream map of departmental area
4.2.1.2.1.1 Radiator
The radiator production process begins with the core build process producing to their
schedule and sending product to the uncontrolled inventory held between the core build
process and the tank press process. The tank press cell produces the final radiator and
depending on whether the product is a CD 132 or C 170 the final product is either
moduled with a condenser or transported to the Condenser department for moduling.
57

Prior to Vision 2001 and the implementation of the BESMART system all material
replenishment was accomplished by utilizing an order sheet that forecasted at the
beginning of the shift the usage for the entire shift. This system had several inefficacies
that were improved upon through the implementation of the BESMART system (see
Chapter 5).
4.2.1.2.1.2 Condenser
The condenser production process begins similarly with the core build process producing
to their schedule and sending product to a smaller inventory area in respect to the radiator
core inventory area. The core build cell performs the final quality check and depending
on whether the product is CD 132 or C 170 the final product is either moduled with a
radiator or transported to the Radiator department for moduling. Prior to BESMART all
material replenishment was accomplished by utilizing an order sheet that forecasted at the
beginning of the shift the usage for the entire shift. This system had several inefficacies
that were improved upon through the implementation of the BESMART system (see
Chapter 5).
4.2.2 Post Vision 2001 (2001)
4.2.2.1 Overview and Physical Layout
A schematic of the new cellular layout is shown in Figure 2-3. The left portion of the
figure highlights the location of the new HC Condenser and Radiator moduling
department on the Basildon area map. This new layout has reduced the need to transport
product between the HC condenser department and the Radiator department, reducing
forklift traffic through the facility (see Chapter 5).
58

Cap andBaffle Cell
Core Buildandintegratedfin mill
Close coupledfin mill and RaCore Build
-I
Tank Press
Leak Check
M
ModulingStation
Distribution Point
Figure 4-9: Layout of the green-end and hard-end capacity cells.
In general, the operating pattern for the Radiator and Condenser business unit is 3 shifts
of 8 hours each. Excluding breaks and lunch, there is a total of 7.2 hours of work per
shift. The Module production system works on a five-day week with the option to work
on Saturday and Sunday.
59
ass Spec
|___1

4.2.2.2 Operations Management
4.2.2.2.1 Material Flow & Information Flow
The new system has reduced material and information flow in the system, by creating a
more customer focused layout. The core processes for the new layout begins with three
schedules being sent out to one department group. One schedule is sent to the Radiator
core build a second schedule is sent to the condenser core build area, a third schedule is
sent to the Radiator and Condenser module cell. The values stream map can be found in
Figure 4-10.
Production control CUSTOMERS
-10 day Forecast-Daily Requirements CMMS
Rad Core Module dschedule schedule Ssipring
schedule
Rad Core
Build.
tank Press & Sr
ond re sSec Cellpin
schedule
Figure 4- 10: Present State Value stream map of Moduling process
4.2.2.2.1.1 Radiator
The radiator production begins with the core build process producing to their schedule
and sending product to the tank press process located in the radiator and condenser
module cell. The tank press process produces the final radiator, which is sequenced with
a condenser to be moduled in the same cell. Prior to BESMART all material
60

replenishment was accomplished by utilizing an order sheet that forecasted at the
beginning of the shift the usage for the entire shift. This system had several inefficacies
that were improved upon through the implementation of the BESMART system (see
Chapter 5).
4.2.2.2.1.2 Condenser
The condenser production process begins with the core build process producing to their
schedule and sending product to mass spec process located in the radiator and condenser
module cell. The major difference with this process over the pre vision 2001 is the fact
that the cap and baffle process is done prior to the core build. In the radiator and
condenser module cell the condenser goes through the final quality check in the mass
spectrometer after which the condenser is moduled with a sequenced condenser. Prior to
BESMART all material replenishment was accomplished by utilizing an order sheet that
forecasted at the beginning of the shift the usage for the entire shift. This system had
several inefficacies that were improved upon through the implementation of the
BESMART system (see Chapter 5).
4.2.3 Future State of Vision 2001 Project
Figure 4-11 captures the ideal future state map for the system. This system relies on
maintaining a marketplace between final assembly and shipping that would trigger
production throughout the line. This marketplace would rely on a Kanban system for
replenishment. The build information between final assembly and core build would
occur via the transfer of Braze clips, which will trigger the need to build new product.
61

Production control Process-10 day Forecast-Daily Requirements CMMS
daily
Shipping.......... SD.....oschedule
Rad Core - - - - - - - - - - - - - -Build. S WI
Tank Press &e Shipping
Cond Core -- - - - - - - - - - - - --Build.
Figure 4-11: Future state Value stream map of Moduling Process
4.3 MSDD Evaluations of Moduling Process
4.3.1 Pre Vision 2001 (2000)
This evaluation was performed on the module value stream prior to Vision 200 1. The
evaluation of this area will highlight the overall system design aspects with respect to the
MSDD.
4.3.1.1 General MSDD Evaluation
The overall evaluation of the Pre Vision value stream is shown in Figure: 4 -12. The score
of each FR-DP pair comes form the evaluation preformed by a member of the PSD lab
very familiar with the Basildon plant operations. This allowed for a truly independent
review. Among the 42 leaf-level FR-DP pairs, there are 5 very poor, 13 poor, 17
moderate, 7 good and zero very good scores. The overall evaluation result of module
value stream is straddling the poor to medium poor region.
62

Pre Vision 2001 (2000)
FWtMoert1
Quality 0 4 5 0 0lD&RProb 2 4 1 0 0
Pred Output 1 4 3 0 0Delay Red 2 1 6 3 0Labor 0 0 2 4 0
Total 5 13 17 7 0
5
[1 [1
[1 1 I 1 [1 [1 00 11 11 El0 0 0 0
WLW11 EIi 11 Q El El WED1 WLW1111111 1111 E1 EIE E 0 00 0
Quality Ident. _Resolve Predictable Output Delay Reduction Operational Invest-Problems Costs ment
Figure 4-12: MSDD evaluation result of Pre Vision 2001 (2000)
Table 4-1 lists the top and bottom 5 pair performers of the evaluation. Each of the top
five performers deals with the design of the work. This is a particular aspect stressed
during the training originally attended by the engineers. Due to the training and seminars
performed at the Basildon plant by Prof. David Cochran the engineers began to
understand some of the issues caused by productions lines that were set up to minimize
labor content without really examining the work. From these classes the engineers began
to attack the work by designing effective cells. Identification of problems is extremely
difficult in the old system as the delay as product flows from the core build to the tank
press meant that quality issues could go undetected for up to 2 days. One of the poorest
performers is the existence of a regular preventive maintenance program.
63

Top 5 FR-DPPerformers
Bottom 5FR-DPPerformers
ID Num FR DP Score
Minimize wasted motion in operators' Ergonomic interface between the
D23 work tasks worker, machine and fixture 4Minimize wasted motion of operators Configure machines / stations to
D21 between stations reduce walking distance 4Reduce time operators spend on non- Machines & stations designed to
D11 value added tasks at each station run autonomously 4Ensure that support activities Ensure coordination andpeople/automation) don't interfere with separation of support work
T53 one another patterns 4Ensure coordination and
Ensure that production activities don't separation of production workT52 interfere with one another patterns 4
ID Num FR DP ScoreProvide knowledge of demanded produc Information flow from downstream
T31 mix (part types and quantities) customer 1.429Material flow oriented layout
T4 Reduce transportation delay design 1. 33Regular preventative maintenance
P132 Service equipment regularly program 1.25Increased operator sampling rate
R111 Identify disruptions when they occur of equipment status 1.2R1 12 Identify disruptions where they occur Simplified material flow paths 1
Table 4-1: Top and bottom pair performers of moduling area (2000)
4.3.1.2 Evaluation by MSDD Branch
Quality (FR-DP Qx)
The Basildon plant has implemented several Poke yoke devices that prevent them from
sending bad quality product to the customer. However, the scrap rate within the system
is disturbing. Process quality is reflected by the large inventories of scrapped radiators
and condensers in the repair area. There are problems inherent in the system design and
operation contributing to the defect rate at Basildon.
64
4.3.1.2.1

Standardized work methods havebeen developed and are effectively
Operate displayed; however workers do notprocesses within Elimination of assignable causes of effectively follow work methods and
Q1 control limits variation there is no method of enforcement.The processes are within tolerance;however there is no formalized root
Center process cause analysis available to ensureQ2 mean on the targe Process parameter adjustment that error does not re occurs.
Issues are not dealt with a soon asthey occur they are noted and broughup in a VPS meeting at a later date.This hampers the ability to do a formalroot cause analysis; the VPS meeting
Reduce variation is not effective methods of presentingQ3 in process output Reduction of process noise issues.
Quality Moderate1 04 5 00
Figure 4-12: MSDD evaluation result of Pre Vision 2001 system (2000)
4.3.1.2.2 Identifying and Resolving Problems (FR-DP Rx)
Basildon overall performance in this area is poor. Identification and communication of
production disruption is camouflaged by large buffers in inventory between processes.
Fire fighting and lack of satisfactory support characterize the production problems. Due
to the fact that parts can be in this large buffer for up to 2 days quality problems can go
unrecognized for this extended period of time. This leads to large scrap rates and product
being sent to the repair area.
65
Comments (Pre-Vision)FR DP

FR JDP Comments (Pre-Vision)
The large buffer of up to 2000Rapidly recognize radiators between the core build andproduction Configurations to enable detection tank press process does not allow for
R11 disruptions of disruptions detection of quality issues
The plant has radio communicationCommunicate and IT paging systems. However theproblems to the Specified communication paths and factory is missing visual systems such
R12 right people procedures as an Andon board.
There is no standard problem solvingmethod. Problems are noted, a quickfix is implemented and the problem isbrought up at weekly or bi weekly
Solve problems Standard method to identify and meetings at which point it is to late toR1 3 immediately eliminate root cause. do an effective root cause analysis.
ID&IR Moderate
1 2 4 100
Figure 4-13: MSDD evaluation result of Pre Vision 2001 system (2000)
4.3.1.2.2.1 Predictable Output (FR-DP Px)
One of the major roots causes challenging the ability of the Basildon plant to maintain
predictable output stems from the lack of preventative maintenance. Maintenance of
equipment to ensure availability is characterized by a system that utilizes a fire fighting
methodology. The system is not set up to allow for preventive maintenance as the plant
runs three 8 hr shifts and often works on weekends not allowing any time for preventative
maintenance. The system also runs on a forecast push system in the delivery of EP parts.
A survey was carried out to determine the average amount per week of lost production
time attributed to waiting for stock to be delivered to the point of fit on the shop floor
(see the attached copy of the results). Across the plant the average Production time lost
was 36.9 hours per week. The current process also required a manual stock check each
shift and the filling out of 7 - 8 A4 stock sheets across the plant identifying the parts
required and the expected delivery time of each part which then had to be taken to the
Warehouse, this was considered to be a waste of the Supervisors time.
66

FR DP Comments (Pre-Vision)The information system in the plantrelies primarily on planning and
Ensure availability scheduling, which is never correct ancof relevant requires constant adjustment. This
P11 production Capable and reliable information takes up a majority of the supervisor'sinformation system time in the facility.
The workforce is not very welleducated on lean techniques and theneed to transfer knowledge,participate in continuousimprovement. There is a rewardsystem in place for suggestionshowever there is still a high level of
Ensure predictable Motivated workforce performing distrust between management andP12 worker output standardized work the union workers
There is no preventative maintenanceprogram set up in the plant. Due tothe shift structure of the plant 8 3hrshifts 6-7 days a week, Preventative
Ensure predictable maintenance programs would beP13 equipment output Maintenance if equipment reliability difficult to set up.
The present system relies on aforecast system and due to machine
Ensure material unreliability forecasts are constantlyavailability even revued, causing double handling, andthought fallout Standard material replenishment an inability to keep track of inventory
P14 exists approach leading to stock outs.
O utput 1
oro
Figure 4-14: MSDD evaluation result of Pre Vision 2001 system (2000)
4.3.1.2.2.2 Delay Reduction (FR-DP Tx)
The overall performance in the Delay Reduction category is poor. The departmental
layout and machine design greatly contributes to the poor performance in the five types
of delays. However, scheduling practice and long changeover times tend to drive the
large run sizes in the master schedule. In addition these large runs sizes are intended to
be balanced to production scheduling in assembly. The end result is a long throughput
time and limited responsiveness to changes in customer demand.
67

Reduction of Parts are being transported in big batches, lot delay is
transfer batch still a major part of total production delay.TI Reduce lot delay size (single-piece
flow)Production Due to the knowledge gained by the engineers within
T2 Reduce process designed for the the plant on lean techniques a very good first attemptdelay takt time has been made to balance hr mfg process to takt time
Production of the Some work has been done to reduce setup times of
. desired mix and machines however there is still a false belief that long
T3 Reduce run size quantity during runs are better than short runs. Production scheduledelay each demand are not leveled.
intervalThe layout of the system does not allow for short
Reduce Material flow transportation distances and also creates large
T4 transportation oriented layout buffers and s disconnect between the corebuild and
delay design final assembly stations
Reduce Subsystem The support activities doesn't interfere much for
systematic design to avoid production activities. Operators' operations are notT5 operational production likely to interfere with each other. Standard support
delays interruptions work patterns are not established yet.
Dela Moder2_e
Figure 4-15: M MSDD evaluation result of Pre Vision 2001 system (2000)
4.3.1.2.2.3 Labor (FR-DP Dx)
Each labor group is set up autonomous to the other. There is very little information
transfer from the different stages of the operation. Due to the large buffers between the
operations the work is not balanced with each operation receiving individual schedules.
The relationship between direct labor and management can be tense with labor being very
weary of new ideas from management and vice versa being weary of the giving any
continuous improvement information.
68
DIP CommrrentsFR

I V. .-. - -
Eliminate Most of the machines have a very short cycle times,
D1 operators' Human-machine the only machine that has issues with man machinewaiting on separation separation is the fin mill.machines
Design of Originally the system was designed to maximize theEliminate wasted workstations / machine operation uptime, however with lean training
D2 motion of workloops to given to the engineers at the plant progress has beenoperators facilitate made to design better work loops
operators tasksEliminate In almost all cases, operators work in isolation. Work
D3 operators' Balanced content across operators and across departments iswaiting on other workloops not well-balanced.operators
Labor ModerateM_ _0 0___2 4 0
Figure 4-16: MSDD evaluation result of Pre Vision 2001 system (2000)
4.3.2 Post Vision 2001 (2001)
4.3.2.1 General MSDD Evaluation
Figure 4- 17 shows the MSDD evaluation result of the post Vision 2001 manufacturing
system. The score of each FR-DP pair comes form the evaluation preformed by a
member of the PSD lab very familiar with the Basildon plant operations. This allowed
for a truly independent review. Among the 42 leaf-level FR-DP pairs, there are 0 very
poor, 6 poor, 19 moderate, 16 good and 1 very good scores. The overall evaluation result
of module value stream is straddling the moderate to good region. On average this is a
one-point shift in the plants performance.
69
CommentsDPFR

El
uy
Qul
I 0
Ident. _Resolve Predictable Output Delay ReductionProblems
Quality 0 2 7 0 0ID&RProb 0 3 4 0 0Pred Output 0 1 5 2 0Delay Red 0 0 3 8 1Labor 0 0 0 6 0Total 0 6 19 16 1
a'nQ LL
Ell 100
LIEL
---- YT
Operational Invest-Costs ment
Figure 4-17: MSDD evaluation result of Post Vision 2001 system (2001)
Table 4-2 shows the top and bottom pair performers of the post vision 2001 evaluation.
Among the best 5 pairs, all 5 relate to physical planning and design a highlighted strength
of the Basildon plant. A simplified system design physically integrating all the process
into a customer focused group's leads to much easier detection of where disruptions
occur. One of the key improvements that can be seen in the rating of FR-D1 1 and FR-
T221 was the introduction of the close-coupled fin mill and core build. This design was
key in leveling production. We can summarize that the capacity cell area has taken into
design consideration a number of FR-DP pairs from the Direct Labor branch. However,
improvements can still be achieved in areas relating to preventative maintenance, root
cause analysis and solving problems immediately to ensure predictable operation of the
production cells.
70

Top 5 FR-DPPerformers
Bottom 5FR-DPPerformers
ID Num FR DP' Score
Minimize wasted motion of operators Configure machines / stations to
D21 between stations reduce walking distance 4.125Reduce time operators spend on non- Machines & stations designed to
D11 value added tasks at each station run autonomously 4.167
Eliminate operators' waiting on other
D3 operators Balanced work-loops 4.25
Ensure that automatic cycle time <=
minimum desired production pace (or Design of appropriate automatic
T221 takt time) work content at each station 4.417Ensure coordination and
Ensure that production activities don't separation of production work
T52 interfere with one another patterns 4.5
ID Num FR ,DP - ScoraRegular preventative maintenance
P132 Service equipment regularly program 1.5Reduce impact of input noise on process
Q32 output Robust process design 2Conversion of common causes
Q31 Reduce noise in process inputs into assignable causes 2.25Standard method to identify and
R13 Solve problems immediately eliminate root cause 2.25
R113 Identify what the disruption is Feedback of sub-system state 2.333
Table 4-2: Top and bottom pair performers of moduling area (2001)
Figure 4-18 shows the comparison of the evaluation results of the post Vision 2001
system (upper) and the pre Vision 2001 system (lower). Out of 42 FR -DP pairs, 16 of
them are same or very close for both systems and the post Vision 2001 system is better in
the other 26 pairs. The comparison shows clearly that the Post Vision evaluation result is
much better than the pre Vision results. However, the fact that 16 pairs have not changed
there is still a need for improvement.
71

0
me~~~ ~ E&4MN E0 0 1 Eli
MM M on ME 00M
Quality Ident..-Resolve Predictable Output Delay Reduction Operational Invest-Problems Costs ment
Figure 4-18: Comparison of two evaluation results
4.3.2.2 Evaluation by MSDD Branch
4.3.2.2.1.1 Quality (FR-DP Qx)
Quality was not one of the main targets of the Vision 2001 project, for this reason only a
slight increase in quality was noted. This can be attributed primarily to the increase in
knowledge of upstream/downstream processes of the operators. However, areas still
exist for continuous improvement. Operators work in continuous loops that can vary
from cycle-to-cycle and operator-to-operator. Best practices in work methods have not
been captured and shared across the workforce. The plant needs to put in place and
effectively utilize cause and effect tools and databases.
72

FR DP Comments
Through some initial training of the operators in the
Operate Elimination of concepts of lean techniques and the fact that they are
Q1 pocesses within sgnable seeing the results of some of the initial initiatives the
control limits causes of operators are more apt to following the standardizedvariation work methods laid out by the engineers
Process The processes are within tolerance; however there is
Q2 Center process parameter no formalized root cause analysis available to ensuremean on target adjustment that error does not re occurs.
The Basildon plant has begun to attack issues when
they occur instead of waiting for the VPS meeting at a
Q3 Reduce variation Reduction of later date. This is a first step in doing better rootin process output noisecause analysis; however a formal method is not laid
Out.
Quality 0d0IN____ 0 2___7__0___0
Figure 4-19: MSDD evaluation result of Post Vision 2001 system (2001)
4.3.2.2.1.2 Identifying and Resolving Problems (FRDP Rx)
This is an area that the Vision 2001 plan has greatly enhanced. The reduction throughput
time from a couple of days to a couple of hours is one of the great improvements. The
plant has identified that its ability to recognize and log problems when they occur is an
issue. To this effect the VPS department has developed and is in the process of
implementing a very simple IT device to track quality issues when they occur and to send
a warning notice to all the people in the system when an error is noted X number of
times. However, real-time communication of takt time and the cell's status is not evident
through information devices (e.g. - andon boards, alarms) or through process design (e.g.
- accumulating empty containers). Communication and resolution of problems has had
marginal-to-no improvements primarily in maintenance.
73
CommentsDPFR

removal of the large buffer between the core build aswitch to one piece flow from final assembly has
recognize Configuration to enabled quicker and unavoidable detection of
R11 rcon enable detection production disruptions through equipment/processproduction of disruptions failure. However, operators cannot easily anddisruptions accurately determine, on a frequent basis, whether
they are ahead or behind production schedule.
Specified The plant has radio communication and IT paging
Communicate cm itio systems. Response times to these communication
R12 problems to the communication methods are still however considered slow. The
right people paths and factory is missing visual systems such as an Andonprocedures board.
There is no standard problem solving methodavailable in the plant. Problems are noted, a quick fix
Standard method is implemented and the problem is brought up atweekly or bi weekly meetings at which point it is to
R13 Solve problems to identify and late to do an effective root cause analysis. Due to thedae rt more customer focused indirect labor units set up ascause. well as the direct labor units it is easier to assign
responsibility leading to slight improvements insolving problems.
M&R ModerdeProbe 0 3______ 0 0
Figure 4-10: MSDD evaluation result of Post Vision 2001 system (2001)
4.3.2.2.1.3 Predictable Output (FR-DP Px)
The primary factor that has aided in improving predictable output is the BESMART
system due to its effect on the material supply program that ensures material availability.
There are still some steps that need to be implemented to extended the benefits of the
BESMART system across the entire supply chain. Within the operation communication
has improved due to the close proximity of all the different process. There has also been
an improvement in communication between management / engineering and the shop floor
as the customer focused production groups have been extended to encompass engineering
and management. However, production disruptions do still occur, the major causes of
which arise from support functions external to the area including a weak preventive
maintenance program execution to ensure high equipment availability.
74
CommfentsFR DIP

With the new BESMART pull system the information
Ensure system has become much simpler and much more
availability of Capable and reliable, This system has freed up a significantP1 evanbity f reliable portion of the supervisors time allowing them to spend
P11 relevant information more time on continuous improvement and root causeproduction system analysis. The facility could still use a andon board toinformation ensure that everyone is in tune with all nessesary
information.
The direct labor workforce has become more
Motivated educated on lean techniques and the need to transfer
Ensure workforce knowledge, participate in continuous improvement.
P12 predictable performing One of the key ways that the workforce was
worker output standardized motivated to participate in standardized work wasw prd through the building of life size demos of the new cellwork layouts so that their input could be incorporated into
the new design inspiring a sense of ownership.
There is no preventative maintenance program set up
Ensure Maintenance of in the plant. Due to the shift structure of the plant 8
P13 predictable equipment 3hr shifts 6-7 days a week, Preventative maintenanceequipment output reliability programs would be difficult to set up. This is the next
major target of improvement for the facility
With the new BESMART pull system the material
Ensure material Standard replenishment system is not affected by machine
availability even material breakdown as severely. This system has freed up a
P14 though fallout replenishment significant portion of the supervisors time allowingexists approach them to spend more time on continuous improvement
and root cause analysis.
Pred. Mod e-Output 0 5______ 2 0
Figure 4-2 1: MSDD evaluation result of Post Vision 2001 system (2001)
4.3.2.2.1.4 Delay Reduction (FR-DP Tx)
Overall, performance in the Delay Reduction branch has increased from poor to a
moderate-to-good condition. Layout design, and human-machine separation have
enabled psudo single-piece flow within the cells. As a result, improvements in
throughput time and reduction in lot, process, and run size delays have been achieved.
However, a pull system is suppose to exist between final assembly and the core build, via
the braze clips being returned. However, discipline issues and a lack of trust in the
robustness of the pull system by operators and supervisors has made this system
75
FR DP Comments

ineffective. Once this occurs only one schedule to final assembly would need to be made
for the entire process.
Within the system between corebuild and finalassembly single piece flow has been implemented
Reduction of however, the supply of raw materials particularly to
transfer batch the core build stage is still done in large containersT1 Reduce lot delay se ba-ce due to the long runs of the down stream process.
size (single-piece Change over times need to be aggressively attackedflow) to reduce these numbers. A effective KANBAN
system needs to be implemented for these parts aswell to aid in reducing the batch sizes.
Due to the knowledge gained by the engineers withinthe plant on lean techniques a very good first attempt
Production has been made to balance the mfg process to takt
T2 Reduce process designed for the time, hence within the cells, production is generallydelay takt time balanced to takt time. However, customer-supplier
relations are not clear nor directly linked throughoutthe value stream.
Production of the
Reduce run size desired mix and Production schedule are now leveled in the entireT3 delay quantity during system.
each demandinterval
Reduce Material flow The layout of the system allows for minimalR4 Mransported laot transportation distances and has reduced the buffers
T4 transportation oriented layout between the process 16 times with the final assemblydelay design pacing the rest of the system.
Reduce Subsystem The support activities doesn't interfere much for
T5 systematic design to avoid production activities. Operators' operations are not
operational production likely to interfere with each other. Standard support
delays interruptions work pattems are not established yet.
Dela 0oderate
Figure 4-22: MSDD evaluation result of Post Vision 2001 system (2001)
76
Comments,DPFR

4.3.2.2.1.5 Labor (FR-DP Dx)
There has been quite an improvement in labor knowledge of the concepts of "lean" and
the benefits. Over the last 2 years the Basildon plant has made several improvements that
the operators have seen the benefits of and are hence more open to new things. The
Vision 2001 system has also aided in balancing the work loops and improving
communication between the operators at different stages of production due to their close
proximity.
Eliminate Most all operators run 2 machines. There Basildon
D1 operators' Human-machine plant did a very good job of balancing each process towafting on separation run at takt time within the operators work loop.machines
Design of The workloops and narrow equipment design reduces
Eliminate wasted workstations / walking distance. Ergonomics in transporting the
D2 motion of workloops to heavy gears between stations have improved with the
operators facilitate use of gravity rails. There is limited success in
operators tasks implementing standardized locations of work tools.
Eliminate Workloops within the cells are somewhat balanced.
D3 operators' Balanced In some cases, an operator can work ahead of thewaiting on other workloops other operators for a limited time.operators
Labor Moderate
1_ 0 0 0 6 0
Figure 4-23: MSDD evaluation result of Post Vision 2001 system (2001)
4.4 Measurables and the Achievement of the MSDD
4.4.1 Motivation
In a conventional manufacturing environment performance measures have been used to
evaluate the overall performance of manufacturing systems. These measurables
primarily focused on aspects such as inventory, capital investment, floor area, and direct
labor. The MSDD has taken a systemic perspective into manufacturing system design
and evaluation. The MSDD provides that a well-designed manufacturing system should
achieve high performance in both quantifiable and non-quantifiable measures. In terms
of quantifiable measures, a system design solution that satisfies the requirements of the
77
CommentsDPFR

MSDD should be highly consistent with and ensure the satisfaction of the assessed
performance measures. Traditionally the non-quantifiable measures have been ignored
due to the effort required to gauge them accurately. The MSDD attempts to successfully
gauge these non-quantifiable measures in a systematic manner.
The following sections intends to prove the hypothesis of the designers of the MSDD that
the manufacturing system that performs better on the FRs stated by the MSDD will also
have superior measurable performance.
4.4.2 Analysis Method
In order to use the MSDD to compare different quantifiable performance of
manufacturing systems, the FRs that most directly impact a given set of measurables have
been identified. Table 4-3 lists ten major general manufacturing measurables and their
corresponding FRs. As indicated by boldface, a number of FRs have been rolled-up to an
appropriate parent level FR. Moreover, an asterix indicates FRs not evaluated in the
MSDD Evaluation Tool v5.3.
General Mfg. FRs Number ofMeasurable leaf-level FRsFloor Area T4, D21, 123* 2In-cell inventory P13,T1,T3,T5 8WIP P14,T1,T2,T4 9Throughput time 113 12
Direct labor 121 6
Indirect labor RI, P11, P123, P13, P14, 15T51, T53, 122*
Good parts/labor hour 111, 112, 113 36
Internal Scrap 111, 112, 113 36
# of product models T223, T3, D22, 13* 4
Capital Investment 123*, 13* --
Bold indicates an MSDD branch containing leaf FRs evaluated herein
* indicates FRs not used in the MSDD Evaluation Tool
Table 4-3: Measurables and FRs for design comparison
In order to provide a comparative baseline, the data has been volume adjusted. For
conciseness of presentation, the data has been also been normalized and formatted as
shown below [Won et al, 2001].
78

4.4.3 Evaluation and Comparison of Pre Vision 2001 (2000) and Post
Vision 2001 (2001)
The data in Table 4-4 compares the data collected on the Pre Vision 2001 (2000) and Post
Vision 2001 (2001).
Performance Satisfied Leaf FRsOperational ire vision Post visIon Pre vision -ost visionMeasures (2000) (2001) (2000) (2001)
Floor Area 1 0.91 1 of 2 2 of 2In-cell inventory 1 1 5 of 9 8 of 9WIP between core 1 0.06 2 of 9 8 of 9build and finalassemblyThroughput Time 1 0.03 5 of 12 11 of 12Capital Investment 1 1.07 2 of 2 2 of 2Direct Workers 1 0.93 6 of 6 6 of 6Indirect Workers 1 0.95 4 of 15 6 of 15Good Parts / labour 1 0.93 9 of 36 20 of 36- hour (w/oovertime)#of Products 1 1 1 of 4 3 of 4
Table 4- 4: Machining performance of measurables and FRs.
In all cases except for capital investment the Post Vision 2001 system exhibits superior
measurable and MSDD performance. Of particular note is the WIiP and the Throughput
time of the Post Vision 2001 system. This was key as one of the major proposed
improvements of the system was in improving flexibility and reducing scrap through
quick problem ID, Delay reduction and increasing predictable output.
79

Chapter 5: VISTEON BASILDON BESMART
PROJECT
80

5.1 Overview
Material supply supports the manufacturing system by interacting with the three major
elements of any manufacturing system design: people, equipment/material, and
information. In addition, material supply interacts with manufacturing systems on two
levels: externally and internally. The first layer, e xternal, describes the exchanges that
result in material transfer from external suppliers into initial contact with the requesting
source. The second layer, internal, focuses upon the interactions that result in the
completion of material delivery to the requesting source. Within the framework of the
MSDD, effective material replenishment strategies are characterized by designs that
successfully integrate all five elements into a stable manufacturing system design.
The objective of this case example is to highlight an effective material supply design and
operation. As such, twenty-three FRs within the MSDD have been identified to material
replenishment functions (Figure 5-1). For this case example, six FRs and their DPs have
been selected to highlight these dependencies as reflected in the MSDD.
N Case example highlighted FRs
[]& Material supply FRs
rR)
FRDP
F DP
PRDP
Quality Problem Predictable Delay OperationalSolving Output Reduction Costs -
Figure 5-1: FRs that affects Material Supply Design and Operation
81

The goals of the Basildon England Simultaneous Material Replenishment Trigger
(BESMART) project were to develop a pull system for the externally purchased parts (EP
parts) to be delivered to the line side operators from a designated marketplace. Included
within this project is the incorporation of EP parts suppliers into an efficient pull system
to replace the stock removed from the market place, hence reducing the inventory on
hand at the plants. This system would work hand in hand with the new pull system being
developed for the line side operator. For this project we develop a system that would
work with the existing systems in the plant and would be applicable to all areas of the
plant. The system is based around one of the major high volume products, radiators and
it's respective EP parts. Once a system has been created for radiators, it can then be
rolled out for all the other products manufactured in the plant.
5.2 Understanding The Problem
The first step of the project was to understand the problem. In order to accomplish this
we took guided and unguided tours of the plant to understand the production system of
the radiators, condensers and condensers. To familiarize ourselves with the Visteon
Production System model we reviewed several documents detailing the system. Several
meetings were held with other VPS team members, Material Handling and Logistics
(MP&L) group members and including the plant manager and engineering manager in
order to capture their vision of the plant of the future and how the project can align with
their needs. To get supplier input we had several meetings with one of the plant's major
suppliers located in Birmingham, England. At these meetings we discussed ways in
which communication between supplier and customer could be improved so as to
increase just in time delivery. Finally we visited the Bridgend Ford plant in Bridgend
Wales, as an example of a plant utilizing the smart card/call system envisioned for
Basildon plant. From all our meetings we were able to formulate several solutions to the
stated problem.
82

The design of the system was broken into two parts. The first was the development of the
line side replenishment pull system for EP parts. The second was the development of
pull system for the supplier of EP parts.
5.3 Existing Systems
The existing line-side replenishment system required a shift Supervisor to visit each line-
side stations at the beginning of a shift. The Supervisor would review the stock levels,
determines minimum & maximum components per rack and physically count the number
of parts used at each station. Using this information, the supervisor then makes a
judgment on the parts that will be required in order to complete the shift target on
component production. This information is recorded on a stock sheet, which is broken
into 8 columns, one for each hour of the shift. The parts to be delivered are recorded in
each column on an hourly bases. This stock sheet is then sent to the warehouse where the
picker is responsible for delivering the parts to the rollers located in the hole in the wall *
at which time a forklift driver will deliver it to the appropriate line side station.
The above method of stock delivery falls short of the principles and methods of the
developed under the Toyota Production System, due to the lack of flexibility once the EP
parts delivery schedule to the shop floor has been made. The system is highly dependant
on the shift supervisors and his judgment on what will be required, hence this introduces
a large amount of human error. The major problems of this system are that the plant
often ends up with too much stock or too little stock on the line side. This system also
relies on the shift supervisor physically going up into the warehouse on the occasion that
a rush order or build change is required, a regular occurrence. The major benefits of
introducing a better system are that it would release the shift supervisor to take on other
duties and decrease the amount of inventory on the shop floor, which would allow for the
input of new business into the plant, by increasing space on the shop floor.
* The hole in the wall is the 8 ft elevation between the warehouse and the production floor.
83

Shift Supervisor gets information to co
Stock Sheet from the Line side inventory informati
Stock sheet is taken
to warehouse picker
Warehouse
mpile stock sheet
on
Line
Hole in the
4 Wall
Parts are taken
from whole in
the wall to their
designated line-
side address
Figure 5-2: Schematic of existing EP parts ordering system
5.1.1.1.1.1 Flow chart of existing line- side replenishment
The existing supplier replenishment system for EP parts starts with the customer
requirements being sent via CMMS to our suppliers as well as to the plant". This
information is used to develop the production schedules in the daily production meetings.
The information from these meetings is given to an individual in MP&L responsible for
ordering stockx. This individual then combines this information from that gathered from
the warehouse on stock levels*** to manually calculate the requirements of the plant.
This information is sent to the supplier and that is the quantity of product shipped to the
plant. The supplier then ships the product within 24 hours. In the case of supplier
located outside England, weekly supplies are shipped by sea and stored at satellite storage
facility managed by a logistics company. The daily requirements are sent to these
companies and those are the volumes shipped daily. Below is a flow diagram of the
existing process.
** Note not all suppliers are on CMMS. Hence they receive faxes from the Basildon plant about ourrequirementsY Primary contact in this area is Chris Davies*** This information is gathered every 3 days.
84

Production
Suppliers Control Customer
F pir -CaueSramosxitntSplerRpensmntSse
MRP/LINEFre
aily Production
s n update Meeting pa ia
MP&L
Dail~y
Tank
Assembly 30 1111= FF =11=311=1Sipn
Figure 5-3: Value Stream of Existing Supplier Replenishment System
The warehouse is not set up in a market place fashion at this time. The warehouse is
presently divided into 3 sections a receiving pitch, fast moving area and slow moving
area with racking. The pitch is presently too large, this encourages the practice of leaving
stock in the pitch for an extended period of time. The fast moving area organization can
be made more effective. Each row has a list of parts to be stored there. However, within
the row pallets are stacked wherever space is available. The slow moving section is the
only labeled section of the warehouse. This section has laminated signs on the racks that
show what is stored in those particular racks and where they are located. Observing this
system we have found it inadequate as the picker wastes an immense amount of time on
unnecessary tasks. Below you will find a flow diagram that shows the process that the
picker uses to locate a requested part.
85

Shill Supervisor gets information to compile stock sheet from the Line Side
inventory Informnation. inventoryStock
Sheet
Stock sheet istaken toStcwarehouse picker
LiHole in the
FasZt Moving Storage Wall
No part
Pitch
Figure 5-4: Part Retrieval process for Fast Moving Parts
This system has several inadequacies, the most obvious being the time wastage as the
picker walks around the fast-moving and pitch areas looking for a part. There is also
time wasted by the individual taking stock levels.
5.4 Proposed Solutions- Line-side Replenishment System
The system that we envisioned and has been implemented revolves around the utilization
of the existing PC terminals at each individual buyoff station in the plant. A software
program has been designed that would run simultaneously with CMMS3 at each buy off
stations. This program will be password accessible by the operator of the buy off station.
The program will allow the operator to select the radiator that he/she is building. This
will in turn display a list of all the EP parts that are used in manufacturing that radiator.
This screen will allow the operator to order by number of parts or pallets that he/she will
require. The operator will also have the option to order the parts urgently if need be. The
operator will have the option to invoke another screen that gives him/her a status report
on all pending orders. The operator will also have the capabilities to cancel an order
86

utilizing the same screen that allows him/her to check on the status of the order. At
his/her terminal there shall be functionality for the use of the g roup leader to return stock
to the marketplace via a third screen.
At the market place there is a single terminal situated at a convenient height for the picker
(forklift driver in warehouse). This terminal has its own system, which will display a list
of pending requests and their status (Normal or Urgent). The picker will select items to
be picked and this will automatically print a docket for each item. On return from the
stacks the operator will enter an Acceptance signal or OOS signal against each item. At
this stage this acceptance will be done manually using a mouse and clicking on the
appropriate button, however it is envisioned that bar codes could play a significant and
useful role in this operation.
In the event that nil stock is found in the market place a signal shall be sent to the
operator on the line-side as well as to the MP&L office. This shall trigger them to send
an urgent request for product to the supplier. It is envisioned that this process could be
automated by sending an email or fax to the supplier that will alert them that we are out
of stock and to send the amount of stock required to replenish the market place.
The MP&L office has the capabilities to view a pop up dialog display with a list of
requests/orders. The list will have user configurable parameters for date range, station ID,
request status etc. Tables of radiators and associated parts will be maintained from the
CMMS database. These options will be password controlled.
A development company called Wychtree Technologies was contracted to develop the
BESMART software. There quote for the BESMART system is E8,500 plus VAT. As a
team we believe this to be a very reasonable cost and are quite confident that Wychtree
Technologies will be able to deliver on their proposal. This primarily stems from the
work that the company did with the Visteon Swansea plant in which they were extremely
satisfied with.
By implementing the BESMART system we believe that inventory on the shop floor can
be reduced by up to 50%. This translates into an approximate cost of f 2,090,000 per
87

annum in inventory costs. This also translates into 50 square feet of space in the tank
press area, which could be used for an additional 2 tank presses increasing the number of
tank presses by 10%. A 12.5% gain in shop floor supervisor productivity would also be
gained.
5.5 Proposed Solutions- Supplier Electronic Replenishment
Trigger
The Supplier Electronic Replenishment Trigger (SERT) revolves around the use of a
marketplace. This marketplace will be housed in the existing warehouse and will
comprise of a mapped out area with designated positions for all our high volume,
medium volume and low volume parts. Each part will have a Min/Max level that will be
set up using the daily requirement of the plant. The max level that has been agreed on is
a 1.5 day supply .Our suppliers would only need to receive information about product
flow out of the market place, as it will be their responsibility to replenish what is taken
out, hence keeping the marketplace at a constant volume.
The first step in defining a solution for the Supplier Electronic Replenishment Trigger
(SERT) was to brainstorm solutions. From this process we developed 10 different
solutions. In order to analyze all the solutions we developed a weighted scoring model.
In preparing the weighted scoring model we received input on the weights of each criteria
from the plant manager, MP&L manager, Senior VPS engineer, Visteon Lean mfg coach,
twoVPS team member. Compiling all the input from these individuals a model was
developed. The criteria/weights that were used upon rating the solutions are as follows.
88

Criteria Weights (%)
Flexible solution that can be applied plant/company wide 15
Implementation cost 5
User friendly 10
Payback 20
Installation time of new system 2.5
Compatibility with supplier system 5
Compatibility with plant system 10
Robustness of system 15
Product replenishment rate/Marketplace size 12.5
Upgradeable 5
Table 5-1: Part Retrieval process for Fast Moving Parts
The solutions that were in the top five percent based on the prior weighted scoring model
are below in descending order: -
Solution 1 - Web Based Ordering System
This system will compile a database of all calls that arrive into the marketplace that will
be set up once the BESMART system is introduced into the plant. This database will be
accessible to our external suppliers via an extranet site. It is then the responsibility of the
external supplier to ship the amount of material used during the time elapsed since their
last shipment. The market place will hold anywhere from 1-2 days of supply allowing for
any variation in production to occur. Special circumstances will need to be put in place
for the low usage parts. For these low usage parts once a call has been place to the
marketplace an email will be sent to the supplier informing them that an order has been
requested and that they should check the web site. The email will contain a direct link to
the site where their order is stored. All shipments for replenishment will be made within
24 hrs. There will be a minimum shipment level that will be established within the
system that will ensure that shipment costs are not wasted shipping insignificant volumes.
Necessary security measures will be put in place to protect the system and Visteon.
89

Solution 2 - Fax Based Ordering System-Automatic
The product that is called from the market place is stored in a database similar to solution
1 above. This data is then retrieved from a database and automatically faxed to the
supplier as an order sheet. The supplier then ships the product following the same
procedure stated in solution 1.
Solution 3 - Email Based Ordering System-Automatic
The product that is called from the market place is stored in a database similar to solution
1 above. This data is then retrieved from a database and automatically email to the
supplier as an order sheet. The supplier then ships the product following the same
procedure stated in solution 1.
The other solutions that were brainstormed were: -
Solution 4 - Card Based Ordering System
This system uses the smart card system to replenish the stock in the market place. The
supplier places a card on a pallet. This card is then placed in a card box as the forklift
driver delivers the pallet to the line. The cards are then collected and sent back to their
respective suppliers who in turn ship the product out based on the cards received.
Solution 5 - Email Based Ordering System-Manual
The product that is called from the market place is stored in a database similar to solution
1 prior. This data is then retrieved manually and is broken down into its respective
suppliers list and emailed to the suppliers by an individual in MP&L.
Solution 6 - Fax Based ordering system - Manual
This system is very similar to that of solution 4, except the orders are faxed instead of
sent via email.
90

Solution 7 - Pallet based system
Each pallet is designated for a particular product/supplier as the product on that pallet is
used the pallet is returned to the supplier to be filled up and sent back. The pallet
becomes the trigger for replenishment.
Solution 8 - Operator Based Ordering System - Barcode reader - Web
As an operator scans the finished radiator at the buy off stations, a system keeps a
database of the product used and this database can be used to generate an ordering pull
system using solution I prior.
Solution 9 - Operator Based Ordering System - Barcode reader - Email automatic
As an operator scans the finished radiator at the buy off stations, a system keeps a
database of the product used and this database can be used to generate an ordering pull
system using solution 3 prior.
Solution 10 - Operator Based Ordering System - Barcode reader - Email manual
As an operator scans the finished radiator at the buy off stations, a system keeps a
database of the product used and this database can be used to generate an ordering pull
system using solution 4 prior.
The system that we are most in favor of at this time is the Web based system.
Presently the Ford Bridgend plant has a similar system up and running with two of their
suppliers, the Visteon Swansea plant and the Visteon Belfast Plant. However, these
suppliers are both part of Visteon and hence have access to the Ford Intranet. Our site
would need to be an extranet site to cater to the majority of our suppliers that do not have
access to Visteon Intranet.
We propose creating a web page that will have Read Only access for our external parts
suppliers to interrogate the database that will hold the calls from the marketplace. The
web page will have the following screens.
91
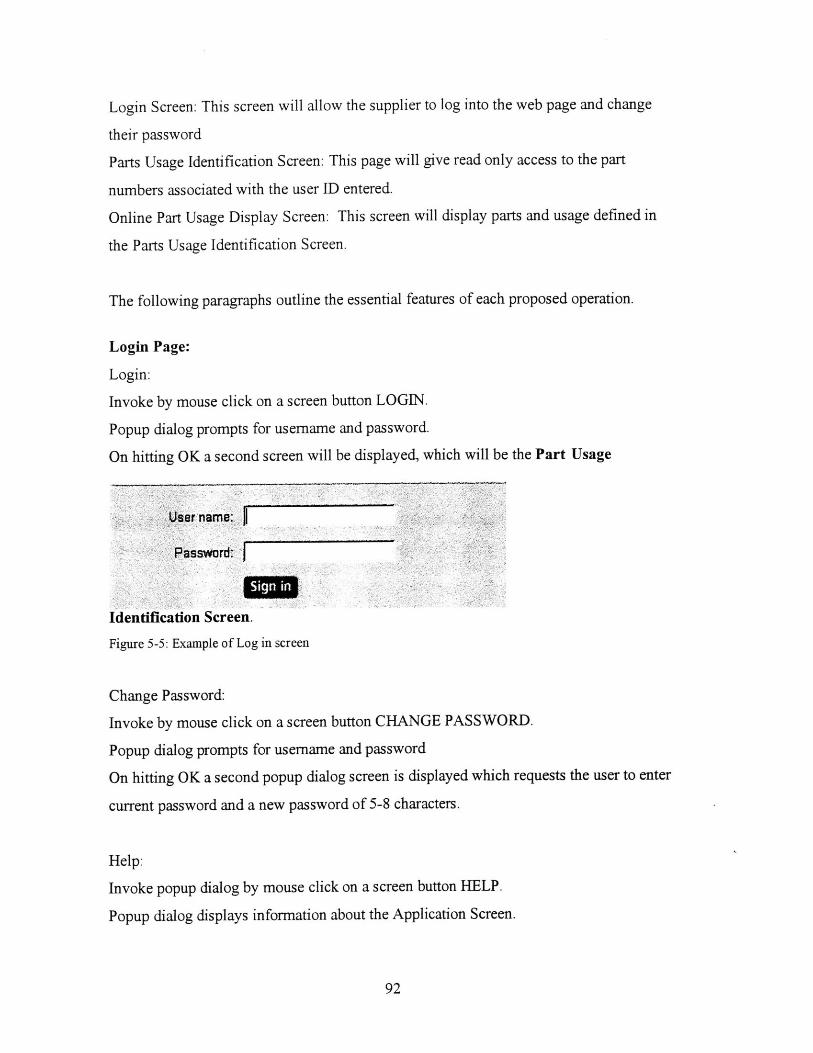
Login Screen: This screen will allow the supplier to log into the web page and change
their password
Parts Usage Identification Screen: This page will give read only access to the part
numbers associated with the user ID entered.
Online Part Usage Display Screen: This screen will display parts and usage defined in
the Parts Usage Identification Screen.
The following paragraphs outline the essential features of each proposed operation.
Login Page:
Login:
Invoke by mouse click on a screen button LOGIN.
Popup dialog prompts for username and password.
On hitting OK a second screen will be displayed, which will be the Part Usage
User name:
Password:
Identification Screen.
Figure 5-5: Example of Log in screen
Change Password:
Invoke by mouse click on a screen button CHANGE PASSWORD.
Popup dialog prompts for usemrname and password
On hitting OK a second popup dialog screen is displayed which requests the user to enter
current password and a new password of 5-8 characters.
Help:
Invoke popup dialog by mouse click on a screen button HELP.
Popup dialog displays information about the Application Screen.
92

SMA RT
Card Part UsageIdenhfies me usage (trmber of pans. number of SMART card cyrJes) for a given part. of group of parts. meet:ng a prede5ned criera Thisreporvis usefui fer tdeotrtying usage tssues. ie SMART carc vtf inreasea usage m"y ce worth ropackaegngto cal.
To create the report:
i Enterthe date range forthe report, if you do not change these dotes, the first firne the report is no), te system vIll create the repurt irc-e eatiest date in tMe system to tode/s date. and a.'ter tha the system vet defAult to the dates last entered when t-e report was run.
2. Enter the par, nmiber. te part nurrber can be pariafly entorei anm tte % symbol can be ertered inone or more boxes as a w ~d ort3H boxes are left bfank. ag pans wie be retrumed in the report.
3. Select the requested domain from the list. The de4auWt for this box wvll be Al domains
4 Select to create an Online report or an Excel report, onme alg report carameters are set
Figure 5-6: Example of Pop up Dialog help screen
Part Usage Identification Screen:
Enter Part and Duration of Usage:
Enter via pull down menu the Start and End Dates and Times (in hours and minutes) that
you would like to view part ordering.
Enter part number to view usage or use a pull down menu that will allow the user to view
groups of product, example All, Radiators, Condensers, Condensers etc.
SMARTPMEn Ana pfeaJ EMevlrane,,,
SM4RT - Pint Umgv
Starrdate O3I IAUG3 12500EW date FIO-3JAUG j2O2 3
Part Numbor - -1Laft b..Ks*)bl tosw.ani Q2 ,Th a w a
Domain code mfl j
Returato report menu ! Help
Figure 5-7: Example of Part Usage Identification Screen
93

Request Online Report:
Invoke by mouse click on a screen button ONLINE REPORT.
This takes them to the next screen Parts Usage Display Screen.
Request Excel Report:
Invoke by mouse click on a screen button EXCEL REPORT.
Popup dialog prompts user if they want to save the file or open it from current location.
Mx
You have chcnen to downhoad a fie hom thist cabot
iepPatUsage-csv fom bvp*l.bdgendfo&eon
What would youlo do withthit fie?
r Dpen this fom its ctrArbenation
K_ C j More Info
Figure 5-8: Example of Request Excel Report dialog box
Log Out:
Close the Part Usage Identification Screen by mouse click on a screen button LOG
OUT, and return to Log In Screen.
Help:
Invoke popup dialog by mouse click on a screen button HELP.
Popup dialog displays information about the Application Screen.
94
11110 Mill

Online Part Usage Display Screen:
View Usage:
Screen displays Usage tables of requested parts over requested duration.
All information entered on the Part Usage Identification Screen is displayed at the top
of the page.
Log Out:
Close the Online Part Usage Display Screen by mouse click on a screen button LOG
OUT, and return to Log In Screen.
Help:
Invoke popup dialog by mouse click on a screen button HELP.
Popup dialog displays information about the Application Screen.
Excel Part Usage Display:
If the user chooses to save the file they may then save it to file.
If the user chooses to display the data it will be in the following format.
A4~4 u! Part Prefix
Part UsageAll the information entered on the Part Usage Identlficalon Screen will be place as a header.
4 Part Prefix Part Bass |Part Suffix Part Name Unit Pack Quantity Usage
Figure 5-9: Example of Excel file in Ford Bridgend SERT system
In some cases multiple suppliers supply a single part. Hence it will be necessary to
include in the database a factor so as when a supplier pulls up the usage it does not show
them actual usage it shows them the Actual usage X the supplier factor.
95

An Internet company that has a good history of hosting secure Visteon/Ford websites
would host the web page. Hence, the only necessary costs of the SERT (Supplier
Electronic Replenishment Trigger) system would be to develop a web site to allow the
external suppliers to interrogate the server with all the information on calls to the
marketplace and pay a monthly fee to the company hosting our website.
PRODUCTIONCONTROL
SuplirsOrders CustomerSupplier
MOVE -CMMS Frcs
ProductionMeeting
Daily
pull
Rad TankG Final F SHIPPING
Daily Assembly
Figure 5-10: Proposed SERT system
At this point we are in the stages of getting a definitive quote from systems
developers on the building of the actual website. At this time the best quote that we have
received is from Wychtree Technology. We have all been very impressed with the
interaction that we have had with this development company to date. The final quote is
expected within the week and will be in the range of E3500 ± £1500 plus VAT. We
received another quote from Logica, which was quite substantially more than that
received by Wychtree Technology. Logica estimated between £50,000 - E250,000 to
implement the entire system from the SERT system to the BESMART. The lowest quote
to host the SERT web page that we have received to date is approximately E750 a month
96

received from IOC. There will also be a onetime set up cost of f 1500 for the web page.
This would put the entire IOC/Wychtree Technologies system minus the hardware
requirements at approximately £15,000. Discussions with members of the MP&L group
in Swansea have shown that they are using a similar SERT system with Bridgend and it
allows them to accomplish their job in almost a quarter of the time.
The benefits of implementing the SERT system are numerous. Talking with the
MP&L department at Ford Bridgend where a similar system is in operation it has reduced
inventory in their warehouse drastically by running a min/max system and having their
suppliers replenish their usage to their max levels as well as drastically reducing the
workload in the MP&L office. Initial estimates are that, by implementing such a system
in the Basildon plant we will reduce the work load of the MP&L analyst by up to 50%
freeing them up to accomplish numerous other tasks. This converts into a cost saving of
E12,000 per analyst, per annum.
97

5.6 Proposed Solutions- Marketplace
The proposed solution for the market place begins by re-designating the types of parts
used in the plant into 3 categories. High volume parts can be defined as parts with a one
and a half day requirement of greater than four pallets. Medium volume parts are defined
as parts with a one and a half days requirement of four to three pallets.
The diagram below shows the proposed layout of the new marketplace. Also
shown are the estimated space requirements for all the radiator tanks used in the plant.
- Signifies racking being used
Signifies pallets being stacked
Signifies estimated spacerequirement for C-170 Rad
Stacked Pallets-High and Medium
Volume
-L i lklt P S1-1
Market Place Set- up
Racks- Low Volume
''''III''''
''''I 1 1 H'''
Hole inthe Wall
nFigure 5-11: Proposed Marketplace layout
98
N
111=1 I I I

In the preceding solution the only on cost would be to mark up the designated positions
with placards hung from the roof using chain linkO. However to improve FIFO in the
plant it would be better to utilize racking through out the entire market place. This would
require an extra on cost of E38,000 (quoted by Dexion, see Appendix B, Richard Mason)
and would reduce the amount of pallets that can be stored in the fast and medium moving
section of the marketplace by 10%. A suggestion to increase FIFO in the warehouse is to
change the sticker color on the chep pallets arriving into plant on daily basics rotating the
colors every seven days. Most all-high and medium volume products will be used in that
period of time and it will be easy to trace defective product once detected.
We also examined implement gravity fed roller racking. This would force the
implementation of FIFO but would not utilize the space available in the marketplace very
economically as most of our parts in the fast moving area would be only 4 deep. The cost
of implementing the gravity fed roller racking would be approximately E60,000.
5.7 Acceptance of Users Involved
A fundamental question at this stage is "Will the Systems be accepted by users without
resistance?" The procurement of this new, easy to use BESMART and SERT systems
has been ramified by the demand from the shop floor line side operators, shift
supervisors, MP&L and the VPS team. From the initial discussions, about 90% of all the
users would like to do away with the existing system and they prefer this new
computerized system as their choice. The primary reasons sighted for this were: -
" Reduced time wastage on waiting for material handling and delivery
" Eliminate human error
" Reduce paper work
" Encourage the use of computer system
" Maintain stock control at line side and market place
* Maintain production operations.
* Achieving overall performance and production target
would require the remarking of the entire market place.
99

All the users are currently using the computerized CMMS3 barcode system and are well
acquainted with the computer environment. They are comfortable with the use of
keyboard and track ball mouse to select an object from the computer desktop. However, it
must be recommended that training be given to all users in the areas of basic use of
computer skills, and the use of BESMART software.
100

References
Arinez, J. F., Cochran, D. S. "An Equipment Design Approach to achieve ProductionSystem Requirements" Proceedings of the 33rd CIRP International Seminar onManufacturing Systems. June 5-7, 2000.
Arinez, Jorge F. and David S. Cochran. "Application of a Production System DesignFramework to Equipment Design." Proceedings of the 3 2 nd CIRP International Seminaron Manufacturing Systems. Leuven, Belgium, May 24-26, 1999.
Cochran, David S. "The Production System Design and Deployment Framework."Proceedings of the 1999 SAE International Automotive Manufacturing Conference.Detroit, MIl, May 11-13, 1999.
Cochran, D. S., Arinez, J. F., Duda, J. W., Linck, J., "A Decomposition Approach forManufacturing System Design" Journal of Manufacturing Systems, 2000
Cochran, D. S., "Production System Design" Oxford University Press, 1999.
Parnaby, J. "Concept of a Manufacturing System." International Journal of ProductionResearch. Vol. 17-2 (1979): 123-135
Duda, J. W., "A Decomposition-Based Approach to Linking Strategy, PerformanceMeasurement, and Manufacturing System Design." Ph.D. Thesis, Massachusetts Instituteof Technology. 2000.
Gomez, Deny D., Daniel C. Dobbs and David S. Cochran. "Equipment Evaluation ToolBased on the Manufacturing System Design Decomposition." Proceedings of the ThirdWorld Congress on Intelligent Manufacturing Processes and Systems. Cambridge, MA,June 28-30, 2000.
Hayes, R.H., and Wheelwright, S.C. "Link manufacturing process and productlifecycles", Harvard Business Review, January-February 1979.
Hopp, W. and Spearman, M. (1996), Factory Physics, Irwin/McGraw-Hill, Boston, MA.
101

Linck, J., "A Decomposition-Based Approach for Manufacturing System Design." SM.Thesis, Massachusetts Institute of Technology. 2001.
Monden, Yasuhiro. Toyota Production System: An Integrated Approach to Just In Time.2 " ed. Norcross, Georgia: Industrial Engineering and Management Press, 1993.
Mierzejewska, A.W., "Integrrating Information Flow with Linked-Cell Design inaManufacturing System Development." SM. Thesis, Massachusetts Institute ofTechnology. 2000.
Ohno, Taiichi. Toyota Production System. Beyond Large-Scale Production. Portland,OR: Productivity Press, 1988.
Oropeza, G., "Production System Design and Implementation in the AutomotiveComponents Industry." SM. Thesis, Massachusetts Institute of Technology. 2001.
Shingo, Shigeo. A Study of the Toyota Production System From an IndustrialEngineering Viewpoint. Trans. Andrew P. Dillon. Portland, OR: Productivity Press,1989
Suh, Nam P. The Principles of Design. New York: Oxford University Press, 1990.
102