Perspective of membrane technology in dairy industry: a review
Upload
independentCategory
view
1download
0
Product Quality in the Canadian Dairy Industry
Authors:
Lia Nogueira Ph.D. Student
School of Economic Sciences Washington State University
P.O. Box 64-6210 Pullman, WA 99164-6210
Kathy Baylis* Assistant Professor
Food and Resource Economics Faculty of Agricultural Sciences
341-2357 Main Mall University of British Columbia
Vancouver, B.C. Canada, V6T 1Z4 [email protected]
(604) 827-5081
Paper prepared for presentation at the Canadian Agricultural Economics Society NAREA-
CAES Conference, June 20-23, 2004, Halifax, Nova Scotia.
* Corresponding author
Copyright 2004 by Lia Nogueira and Kathy Baylis. All rights reserved. Readers may make verbatim copies of this document for non-commercial purposes by any means, provided that this copyright notice appears on all such copies.
Product Quality in the Canadian Dairy Industry
Lia Nogueira1 and Kathy Baylis2
Supply management has been shown to increase the price of milk. Technological change
has induced (and allowed) processors to substitute alternative inputs, many of which can be
imported tariff-free, for the traditional ingredients to lower costs and maximize profit. Meanwhile,
there has been a great deal of consolidation in the dairy processing industry. We analyse the effect
of these trends on cheese quality by measuring the increase in casein imports. Results suggest that
supply management is negatively affecting cheese quality, by increasing casein imports due to the
higher milk price. Furthermore, we were able to calculate that approximately 9.8% of specialty
cheese is produced used casein. A 22% ad valorem tariff is needed to drive casein imports down to
zero.
INTRODUCTION
Dairy production often occurs in distorted, highly protected environments, which affect
both the price and quality of the end product. In Canada, high import tariffs, implemented in
conjunction with a supply management policy, provide support for dairy farmers and increase the
price of milk to processors3. Over the past decade, technological change has induced processors to
substitute alternative inputs, many of which can be imported tariff-free, for the traditional
ingredients, which in turn has affected the quality of final products such as cheese. In this paper,
we ask what effect supply management has had on the quality of processed dairy products in
Canada.
There has been a great deal of research on the price and efficiency effects of Canada’s
1 Ph.D. student, School of Economic Sciences, Washington State University. 2 Assistant Professor, Food and Resource Economics, University of British Columbia. 3 In this context, producer is the farmer and processor is the manufacturer.
supply management system for dairy production (Barichello and Stennes, 1994; Barichello, 1999;
Meilke, Sarker and Le Roy, 1988; Richards, 1996; Richards and Jeffrey, 1997; Romain, 2001;
Vercammen and Schmitz, 1994; etc.) but little (or no) work has been done on the effects of supply
management on the quality of processed milk products at the consumer level.
It is generally accepted that supply management, though production quotas and high import
tariffs, has raised the price of milk for Canadian cheese manufacturers (Barichello and Stennes,
1994; Barichello, 1999; Richards, 1996; Richards and Jeffrey, 1997; Romain, 2001; etc.), thereby
causing these firms to search for ways to substitute away from national milk inputs to lower costs
and maximize profit. Even though processors can pay a special world price4 for dairy ingredients,
according to the Canadian Dairy Commission, processors are reducing costs by replacing domestic
dairy ingredients with less expensive imported ingredients. Meanwhile, there has been a great deal
of consolidation in the dairy processing industry. These trends have been exerting considerable
competitive pressure on the Canadian dairy industry in recent years. This competitive pressure
may have led to a greater use of extenders5. A vital research question is whether this trend has
been exacerbated by supply management.
The dairy industry provides an important illustration of how trade barriers, subsidies and
international trade agreements can influence production decisions in a domestic market. Whereas
milk, cheese and other traditional dairy products face prohibitive import barriers, some ingredients
that replace milk in dairy products, such as casein (the main protein in milk), butteroil–sugar
blends and some milk protein concentrates, are not subject to import tariffs in Canada. Canadian
dairy producers argue that dairy ingredients and substitutes entering the country without effective
4 The world price is lower than the domestic, for example, in Quebec in December 1996, the price for milk used to produce cheddar cheese (domestic price) was $51/hl, the price for milk used in cheese for further processing (based on U.S. milk price) was $34.91/hl, and the price for milk used in products for the export market (based on world market milk price) was $27.20/hl.
tariffs undermine the supply management system (Task Force on National Dairy Policy, 1991 and
Wilson, 2003). Ishikawa and Spencer (1996) argue that subsidies that are supposed to increase
rents for the producers of a final good may also shift rents to foreign firms who supply
intermediate goods, assuming Cournot competition for both goods.
Butteroil–sugar blends are able to circumvent the import tariffs on dairy products, making
it possible for importers to access cheap butteroil. After importation, butteroil is separated from the
sugar and used in ice cream manufacturing, thereby competing with domestic cream and butter.
These substitution possibilities have been an important issue for the Dairy Farmers of Canada,
since around 30% of ice cream production in Canada is now produced using butteroil.
Specifically, the hypotheses we want to test are the effects of the higher milk price due to
supply management, cheese production and consolidation on casein imports. The rest of the paper
proceeds as follows. The next section consists on the description of the Canadian cheese industry.
Then we present the development of the empirical model. After the discussion of the results, the
paper ends with some brief conclusions.
5 Extenders are mixes of functional ingredients such as dairy ingredients (skim milk powder, whey, whey protein concentrates, casein, caseinates, etc), starch, gums, stabilizers, enzymes and sometimes flavours.
BACKGROUND ON THE CANADIAN CHEESE INDUSTRY
Casein is the main protein in milk and the main component of cheese. As an ingredient, it
can be used in several products due to its various functional properties, including a higher yield in
cheese and stability in yogurt and ice cream. It is also used in bakery and confectionery products.
Milk protein concentrates (MPCs) are dairy blends without a strict definition and are not regulated
in most countries (including Canada and the United States). This lack of definition and regulation
enables exporting companies to label a wide range of products under this category, including
mixes of skim milk, casein, caseinates and whey protein concentrates, or even mixes of cheese and
other ingredients.
Some of these products can be categorized as extenders, which are mixes of functional
ingredients such as dairy ingredients (skim milk powder, whey, whey protein concentrates, casein,
caseinates, etc), starch, gums, stabilizers and enzymes; sometimes even flavours. These extenders
are used in a variety of dairy products to increase yield. The most common use is in cheese.
Extended cheese has been produced in many countries for several years. The type of extended
cheese depends on each country’s regulation and market (consumers’ tastes and budget). Usually
processed cheese includes extenders, not only to increase yield, but also to provide stability and
other functional properties. Cheese for further processing, such as mozzarella or pizza cheese, also
may use extenders. Any cheese can be produced with extenders. The amount of extender used
varies depending on the desired characteristics and price of the final product.
In general, 100 litres (lt) of milk produce 10 kilograms (kg) of cheese. To see the effect of
extenders, in particular casein, adding 1.5 kg of casein and 1.5 kg of fat to 100 lt of milk, results in
a 50% yield increase (Mangold, 2001). For yogurt, 1 lt of milk yields 1 lt of yogurt. The milk
equivalents for ice cream are 3.8 lt of ice cream for 6.8 kg of milk, or 100 lt of milk yields 57.67 lt
of ice cream (Potter and Hotchkiss, 1995).
The use of extenders is generally associated with a lower–quality product. Consumers are
often unaware that they are being sold an “extended” product, which is inferior in quality when
compared to traditionally manufactured products. Extenders are not harmful to human health, but
the “extended” products may have different characteristics (especially flavour) than the traditional
good. As an example, high–end (boutique) cheese and premium ice cream are exclusively
manufactured using milk and cream (for ice cream). Generally, extenders are used in lower–priced
products, like cheese for further processing and dairy spreads.
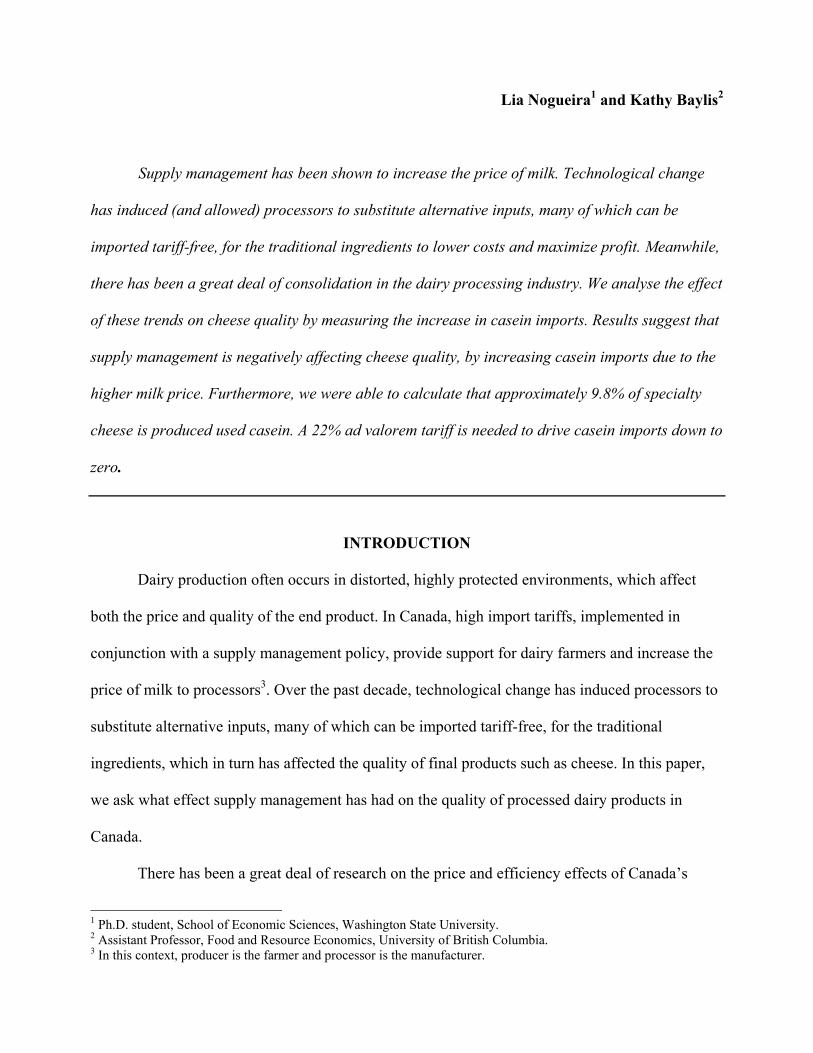
Casein, caseinates and MPCs are not subject to high import tariffs, making it less
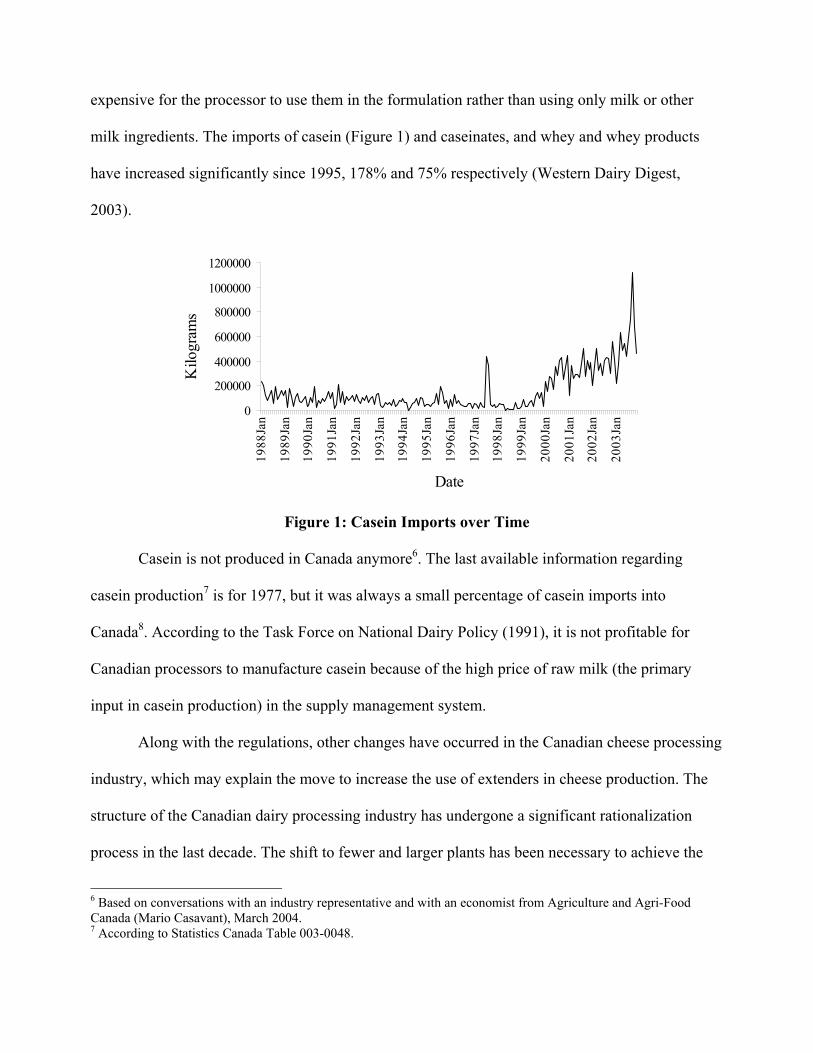
expensive for the processor to use them in the formulation rather than using only milk or other
milk ingredients. The imports of casein (Figure 1) and caseinates, and whey and whey products
have increased significantly since 1995, 178% and 75% respectively (Western Dairy Digest,
2003).
0
200000
400000
600000
800000
1000000
120000019
88Ja
n
1989
Jan
1990
Jan
1991
Jan
1992
Jan
1993
Jan
1994
Jan
1995
Jan
1996
Jan
1997
Jan
1998
Jan
1999
Jan
2000
Jan
2001
Jan
2002
Jan
2003
Jan
Date
Kilo
gram
s .
Figure 1: Casein Imports over Time
Casein is not produced in Canada anymore6. The last available information regarding
casein production7 is for 1977, but it was always a small percentage of casein imports into
Canada8. According to the Task Force on National Dairy Policy (1991), it is not profitable for
Canadian processors to manufacture casein because of the high price of raw milk (the primary
input in casein production) in the supply management system.
Along with the regulations, other changes have occurred in the Canadian cheese processing
industry, which may explain the move to increase the use of extenders in cheese production. The
structure of the Canadian dairy processing industry has undergone a significant rationalization
process in the last decade. The shift to fewer and larger plants has been necessary to achieve the
6 Based on conversations with an industry representative and with an economist from Agriculture and Agri-Food Canada (Mario Casavant), March 2004. 7 According to Statistics Canada Table 003-0048.
efficiency level and economies of scale required to remain competitive. Currently, the three major
companies (Parmalat Canada, Agropur and Saputo Inc), who own 36% of the plants, process 70%
of the milk produced in Canada (Canadian Dairy Industry Profile, 2002). Almost 27% of the plants
operating in 1990 have been closed. Consolidation has also occurred at the retailing level, where
the three major retailers account for more than 70% of the total grocery trade (Western Dairy
Digest, 2001). There are concerns that this consolidation reflects a significant degree of market
power9.
There have been many regulations to deal with the fact that the increased milk price will
make Canadian processors less competitive, such as the industrial milk subsidy and several export
subsidies and programs. All of these (including the industrial milk subsidy) have been ruled as
violating the GATT and have subsequently been removed. However, while in place, they affected
the relative price of inputs, and hence presumably affected the demand for extenders. Therefore, to
understand the evolution of cheese quality in Canada, we need to review these rules.
By raising the price of milk, the supply management system may increase casein imports.
By implementing programs to mitigate against the higher milk price, the Canadian government
may be reducing the increase in casein imports. As Canada is forced to eliminate these programs
due to the GATT, there may be a further increase in casein imports. One can compare the effect of
supply management and the effect that the elimination of regulations, like the industrial milk
subsidy and the export program has had on casein imports.
In August 1995, a new pricing and pooling system, the Harmonized Milk Classification
System, was established. The Harmonized system classifies industrial milk in relation to its end
8 Domestic casein production in 1977 was equivalent to 14.42% of the imports in that year. Making the comparison with more recent data, domestic production of casein in 1977 is found to be only 0.108% of the 1988 imports. 9 Schmitz and Schmitz (1994) find no evidence in their theoretical study to support the claim that supply management has reduced processor and retailer market power.
use. Prices and allocation of industrial milk vary according to the class (CDC, 2003).
The milk classification system includes classes that have special (competitive) prices for
further processing. These special classes were created to allow Canadian products to compete
internationally. Currently, the special classes include cheese (class 5a), other dairy products for
further processing (class 5b), dairy ingredients for confectionery (class 5c) and planned exports
(class 5d) (CDC, 2003). These special milk classes may mitigate the increase in casein imports by
offering a lower price than the other classes, but the actual quantity of milk produced under these
classes is low compared to the other ones10.
Canada implemented a number of changes to the supply management structure because of
the 1995 WTO negotiations. These changes include the elimination of both payments on dairy
product exports financed by levies on milk producers and the industrial milk subsidy, organizing
both pooling arrangements and quota exchanges and the introduction, modification and
termination of several programs, like the Surplus Removal Program, the Optional Export Program
and the Commercial Export Milk system (Food Bureau, 2003). With these export programs,
processors had access to less expensive milk. Once the programs are eliminated, they had to keep
costs low to be able to continue to export. One option is to switch technology and produce
extended cheese.
10 The quantity of milk produced under class 5a (cheese for further processing) has been between 7 and 13% of the milk produced under class 3a (specialty cheese) for Canada, from 1997 to 2003.
EMPIRICAL MODEL
We want to estimate how the use of extenders changed as a function of milk price and
market structure. Because it is not possible to differentiate between the two types of cheese in the
dataset, it is necessary to estimate the demand for extenders as a function of the price of all inputs,
price of all outputs and number of firms. But there are also some limitations regarding extenders.
Given that extenders can be mixes of different ingredients, they are categorized into broad
definitions, making it impossible to get information about production, utilization, imports and
exports. To solve this, we decided to use casein as a proxy for extenders. As mentioned in the
Background section, casein is considered as an extender on its own (since it increases yield in
cheese), and it is also included in cheese extenders that contain other ingredients. Therefore, we
estimate the demand for casein11 as a function of outputs, marginal costs and number of plants.
With these results, we can infer the effect of these high levels of protection on cheese quality.
We estimate the derived demand for casein12 as a function of the reduced form demand for
the outputs (cheddar, specialty cheese, ice cream and yogurt), the marginal costs and the number
of plants. As noted above, Canada did not produce casein in the period studied (1993 to 2002). The
casein available for domestic consumption is all imported13. The marginal costs are the costs for
the main inputs, that is milk price, metal index (because is the major component for machinery)
and wage (labour costs).
The derived demand was obtained from the reduced form demand equations for the
primary dairy products that use casein, that is, cheddar, specialty cheese, yogurt and ice cream
taking into account the marginal costs (the price of milk, metal index and wage) and the number of
plants. This yields the estimation equation 1 in which casein is a function of the outputs (cheese,
ice cream and yogurt quantities instrumented with their own reduced form demand equations, the
marginal costs (milk price, metal index and wage) and the number of plants. A lag for casein
imports, the (instrumented) casein price and yearly dummy variables are also used in the
estimation equation 1.
11 We did not use the variables in logarithm form since some observations for casein imports are zeros. 12 Casein is used in a variety of products. In the food industry casein is also used in bakery and confectionery products. But casein is also used in other manufacturing industries. Unfortunately there is not information regarding other uses for casein. 13 There is some re-exportation of casein, but it is supposed to be imported under a different category.
As the supply of the final product (cheese, yogurt and ice cream) could be affected by the
quantity of an input (like casein), we instrumented the quantities of cheddar, specialty cheese
yogurt and ice cream using variables that affect their demand (unemployment, population, income,
Consumer Price Index (CPI) for all products, cheese and dairy products, Industrial Price Index
(IPI) for ice cream, one lag, yearly dummy variables and a dummy variable for the months April to
August and December in the cheddar and yogurt equations, April to August in the specialty cheese
equation and March to August in the ice cream equation, when sales for each product were
elevated). The casein price was instrumented because of concerns of endogeneity and variables
that affect the supply price of Canadian casein imports were used as instruments: the U.S.
industrial milk price, the U.S. energy index, the U.S. wage and the Canada–U.S. exchange rate.
Yearly dummies were used to capture technology changes in supply and taste changes in demand,
as well as changes in regulations. The lags are included to correct for autocorrelation.
0it
Y
jjjit11it10
it9it8it7it6it5
it4it3it21it10it
YearDummyTimePlants
WageMetalIndexicePrMilkIceCreamYogurtheeseSpecialtyCCheddaricePrCaseinCaseinCasein
εβββ
ββββββββββ
++++
+++++++++=
∑
−
(1)
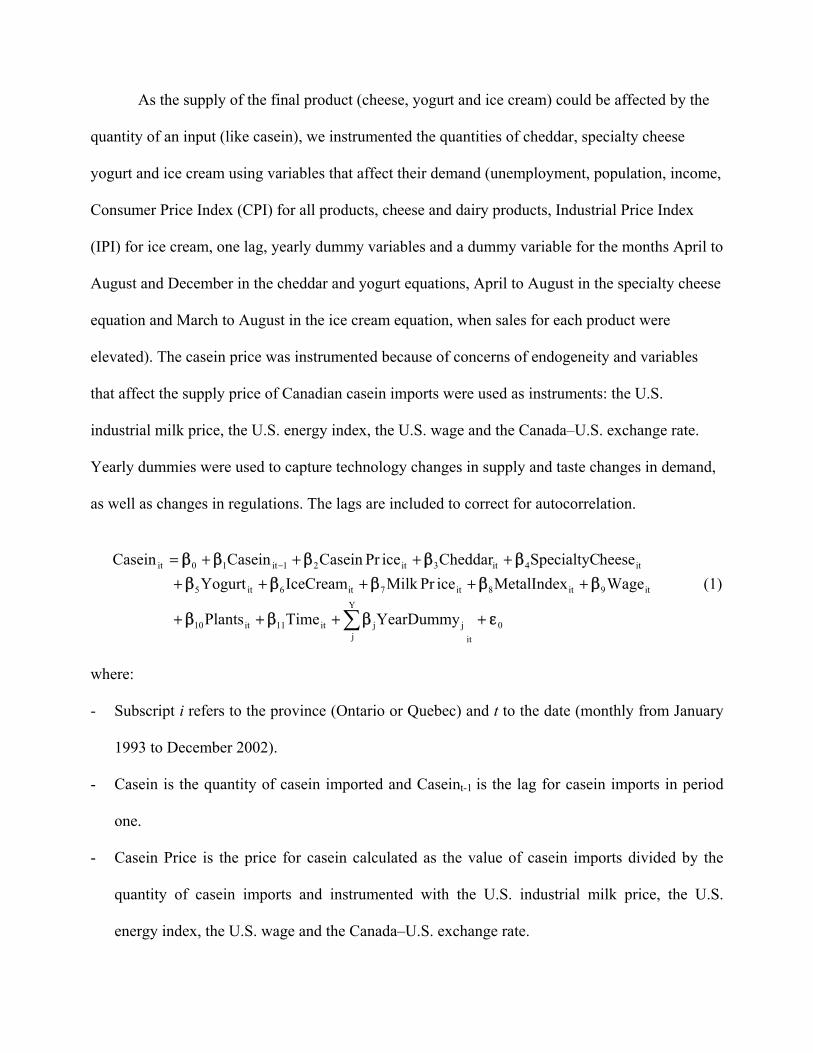
where:
- Subscript i refers to the province (Ontario or Quebec) and t to the date (monthly from January
1993 to December 2002).
- Casein is the quantity of casein imported and Caseint-1 is the lag for casein imports in period
one.
- Casein Price is the price for casein calculated as the value of casein imports divided by the
quantity of casein imports and instrumented with the U.S. industrial milk price, the U.S.
energy index, the U.S. wage and the Canada–U.S. exchange rate.
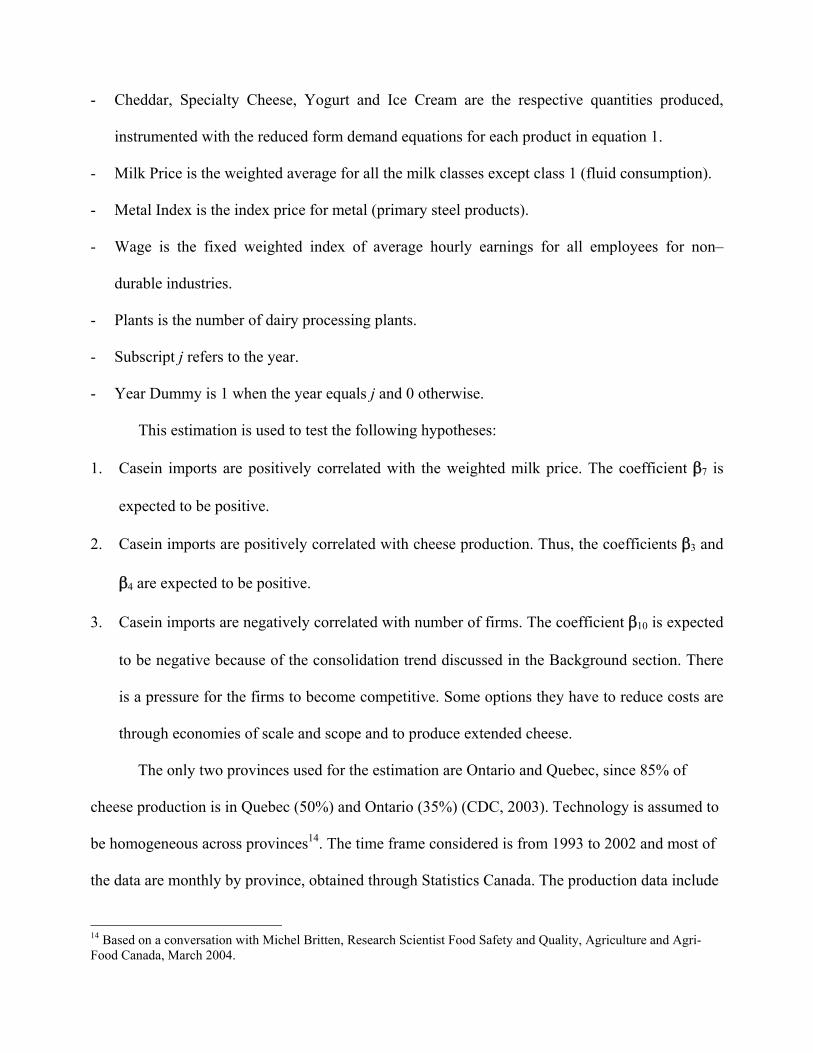
- Cheddar, Specialty Cheese, Yogurt and Ice Cream are the respective quantities produced,
instrumented with the reduced form demand equations for each product in equation 1.
- Milk Price is the weighted average for all the milk classes except class 1 (fluid consumption).
- Metal Index is the index price for metal (primary steel products).
- Wage is the fixed weighted index of average hourly earnings for all employees for non–
durable industries.
- Plants is the number of dairy processing plants.
- Subscript j refers to the year.
- Year Dummy is 1 when the year equals j and 0 otherwise.
This estimation is used to test the following hypotheses:
1. Casein imports are positively correlated with the weighted milk price. The coefficient β7 is
expected to be positive.
2. Casein imports are positively correlated with cheese production. Thus, the coefficients β3 and
β4 are expected to be positive.
3. Casein imports are negatively correlated with number of firms. The coefficient β10 is expected
to be negative because of the consolidation trend discussed in the Background section. There
is a pressure for the firms to become competitive. Some options they have to reduce costs are
through economies of scale and scope and to produce extended cheese.
The only two provinces used for the estimation are Ontario and Quebec, since 85% of
cheese production is in Quebec (50%) and Ontario (35%) (CDC, 2003). Technology is assumed to
be homogeneous across provinces14. The time frame considered is from 1993 to 2002 and most of
the data are monthly by province, obtained through Statistics Canada. The production data include
14 Based on a conversation with Michel Britten, Research Scientist Food Safety and Quality, Agriculture and Agri-Food Canada, March 2004.
exports. The weighted average price of milk takes into consideration all prices and volumes,
including the lower (competitive) prices for the special classes. The special classes are cheese for
further processing (mainly mozzarella and pizza cheese, some cheddar), other dairy products for
further processing, dairy products for confectionery and planned exports.
The system of equations was estimated using three–stage least squares in STATA. This
command allows estimating a system of structural equations, where the left–hand side variables in
the reduced form demand equations are explanatory variables in equation 1. In this way, we
instrument the production quantities used in the main estimation equation (equation 1) with their
own demand equations. The casein price is also instrumented. All other variables are treated as
exogenous to the system and they are used as instruments for the endogenous variables. Three–
stage least squares also assumes that the error terms may be correlated across the equations.
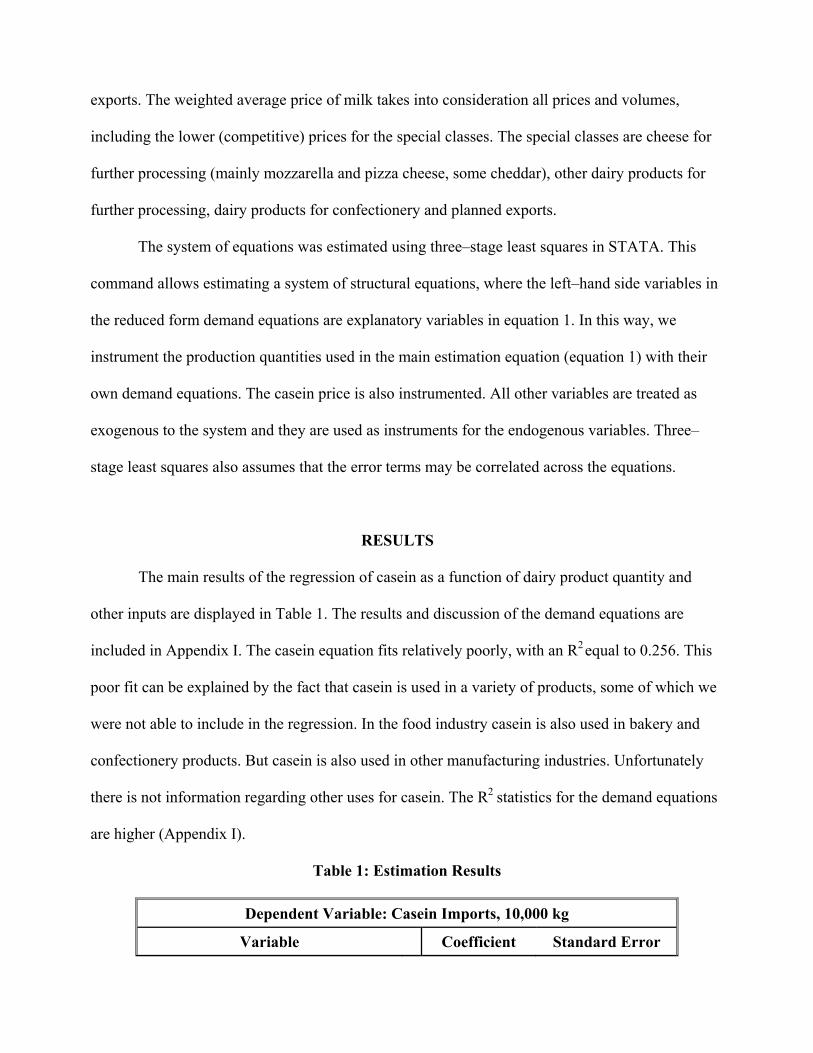
RESULTS
The main results of the regression of casein as a function of dairy product quantity and
other inputs are displayed in Table 1. The results and discussion of the demand equations are
included in Appendix I. The casein equation fits relatively poorly, with an R2
equal to 0.256. This
poor fit can be explained by the fact that casein is used in a variety of products, some of which we
were not able to include in the regression. In the food industry casein is also used in bakery and
confectionery products. But casein is also used in other manufacturing industries. Unfortunately
there is not information regarding other uses for casein. The R2
statistics for the demand equations
are higher (Appendix I).
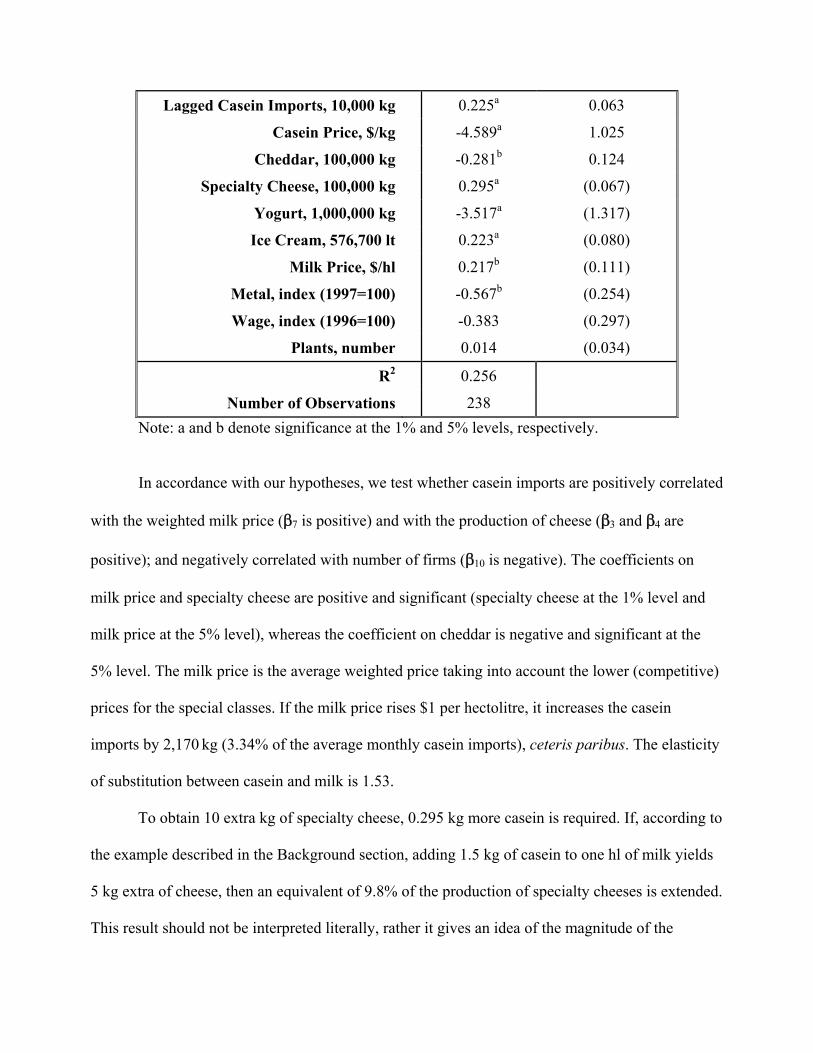
Table 1: Estimation Results
Dependent Variable: Casein Imports, 10,000 kg
Variable Coefficient Standard Error
Lagged Casein Imports, 10,000 kg 0.225a 0.063
Casein Price, $/kg -4.589a 1.025
Cheddar, 100,000 kg -0.281b 0.124
Specialty Cheese, 100,000 kg 0.295a (0.067)
Yogurt, 1,000,000 kg -3.517a (1.317)
Ice Cream, 576,700 lt 0.223a (0.080)
Milk Price, $/hl 0.217b (0.111)
Metal, index (1997=100) -0.567b (0.254)
Wage, index (1996=100) -0.383 (0.297)
Plants, number 0.014 (0.034)
R2 0.256
Number of Observations 238 Note: a and b denote significance at the 1% and 5% levels, respectively.
In accordance with our hypotheses, we test whether casein imports are positively correlated
with the weighted milk price (β7 is positive) and with the production of cheese (β3 and β4 are
positive); and negatively correlated with number of firms (β10 is negative). The coefficients on
milk price and specialty cheese are positive and significant (specialty cheese at the 1% level and
milk price at the 5% level), whereas the coefficient on cheddar is negative and significant at the
5% level. The milk price is the average weighted price taking into account the lower (competitive)
prices for the special classes. If the milk price rises $1 per hectolitre, it increases the casein
imports by 2,170 kg (3.34% of the average monthly casein imports), ceteris paribus. The elasticity
of substitution between casein and milk is 1.53.
To obtain 10 extra kg of specialty cheese, 0.295 kg more casein is required. If, according to
the example described in the Background section, adding 1.5 kg of casein to one hl of milk yields
5 kg extra of cheese, then an equivalent of 9.8% of the production of specialty cheeses is extended.
This result should not be interpreted literally, rather it gives an idea of the magnitude of the
percentage of extended cheese if all processors in the extended market were using 1.5 kg of casein
per one hl of milk. The coefficient on cheddar is negative, suggesting that cheddar is manufactured
in the traditional way. The positive sign on the coefficient on specialty cheese is driven by
mozzarella cheese, which makes up the majority of this class. Mozzarella cheese is mainly used in
pizza. As discussed in previous chapters, there is a trend to decrease costs for cheese for further
processing, even with the lower price assigned to the milk used for this class.
Next, we estimate the amount of milk that is being displaced by casein15. If milk price
increases $1/hl, the 2,170 kg increase per month in casein imports will displace 722.65 hl of milk
per month. Thus, a one dollar increase in the price of milk would suggest that there is a spillover
effect of supply management that increases input substitution away from domestic milk, which
decreases the revenue created by supply management by $37,701 per month for Ontario and
$40,230 per month for Quebec, per month (using the weighted price for milk of December 2002);
or $33,033 per month using the average weighted price for the period studied (1993 to 2002).
Variable costs are negative as expected. Metal is significant at the 5% level, whereas wage
is not statistically significant. An increase of one in the metal index, decreases casein imports by
5,674 kg (8.7% of the average monthly casein imports). For wage, the decrease is lower: 3,830 kg
(5.9% of the average monthly casein imports).
The coefficient on the number of plants is positive, although not significant. This result
may be driven by the manipulation needed to obtain consistent data16. However, some authors
show theoretically that, if the quantity is lower and the price is higher than socially optimal, a
monopolist might choose the same level of quality for a good as the social optimum (Acharyya,
15 To estimate the amount of milk displaced by casein, we took the formula to extend cheese (1.5 kg of casein yield 5 extra kg of cheese) and used the coefficient on milk price to calculate the corresponding amount of extra cheese being produced. Then, we multiplied that number times the yield for cheese (10%) to obtain the quantity of milk.
1998; Beath and Katsoulacos, 1991 and Lambertini, 1998). Given that processors may be thought
to have market power and face a protected market, this may be the case. Certainly their results are
consistent with our findings. Removing one plant from the market is associated with a 140 kg
(0.21% of the average monthly casein imports) decrease in casein imports.
The coefficient on yogurt is negative and the one on ice cream is positive, both are
significant at the 1% level. These coefficients are not as meaningful as those on cheddar and
specialty cheese because the functional properties of casein in yogurt and ice cream are different
than in cheese. The results, however, imply that a 100 kg increase in yogurt production decreases
casein imports 3.52 kg, and an increase of 57.67 lt of ice cream increases casein imports 0.22 kg.
The coefficient on the lagged casein imports is positive and significant at the 1% level, as
expected, because demand is usually based on past consumption. The casein price coefficient also
has the expected negative sign and it is significant at the 1% level. This result suggests a negative
own price effect for casein, giving an own price elasticity of -4.63. The effect of a one dollar
increase in the price of casein, for example due to the implementation of a tariff, is to decrease
casein imports by 45,890 kg per month (70.7% of the average monthly casein imports). This
translates into 15,296 hl per month more milk being used in cheese manufacturing, and an average
increase in farmers’ revenue of $699,175 per month. The value of casein imports for Quebec in
December 2002 is $1,137,695. Adding a 10% ad valorem tax on casein imports increases the
amount of money paid to $1,251,465. Using the quantity imported for this period, the casein price
before the tariff is $6.34/kg and after the tariff is $6.98/kg. The increase in price decreases casein
imports by 29,103 kg per month (45% of the average monthly casein imports), translating into
9,701 hl more milk per month being used in cheese processing and an average increase in farmers’
16 The methodology for the Annual Survey of Manufactures (ASM) changed in 2000 when the data universe was expanded to include all manufacturing units. To obtain a consistent dataset, we transformed the number of plants from 1993 to 1999 to the new methodology based on the annual change from the old methodology.
revenue of $443,428 per month. To drive casein imports down to zero, a 22% ad valorem tariff is
needed. These results provide justification for Canadian dairy farmers’ concern about
implementing tariffs on casein and similar products.
The results suggest that casein is highly positively affected by changes in the price of milk.
A one dollar increase in the price of milk causes around 723 hl of milk to be displaced per month,
which means that there is a spillover effect of supply management that increases input substitution
away from domestic milk, which decreases the revenue created by supply management by
approximately $33,000 per month. This correlation is also observed between casein and the output
quantities specialty cheese and ice cream. As mentioned above, the regression results suggest an
equivalent of 9.8% of the production of specialty cheese is extended. The results for cheddar
suggest that this kind of cheese is manufactured in the traditional way. For yogurt, the coefficient
is negative. This result can be explained because casein may be making other products easier
and/or less expensive to produce relative to yogurt and, therefore, a substitution away from yogurt
is observed. The coefficient on yogurt may also be reflecting some other trends, like demand for
healthier food. According to the Food Bureau (2003), “growth in yogurt demand since the late–
eighties has been driven by demand for more health–oriented food”.
We conclude that supply management, by increasing the price of milk, is negatively
affecting cheese quality. On the other hand, the decreasing number of plants has a positive effect
(although not significant) on quality (lowering the imports of casein). We cannot make any
assumptions concerning the driving forces of this decrease, or what would happen to the number
of plants without supply management. Besides, consolidation is a trend observed worldwide in
many industries.
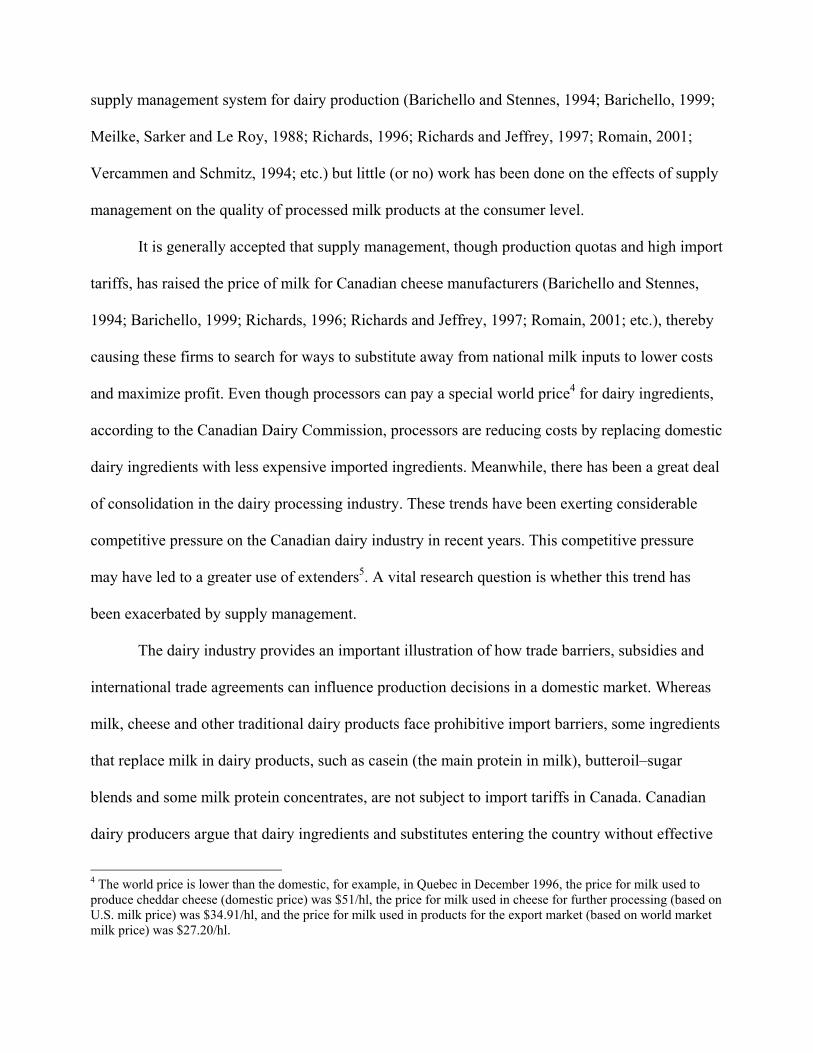
The use of casein did change substantially over time. These changes may have been caused
by changes in regulations (such as the implementation of the GATT) and technological
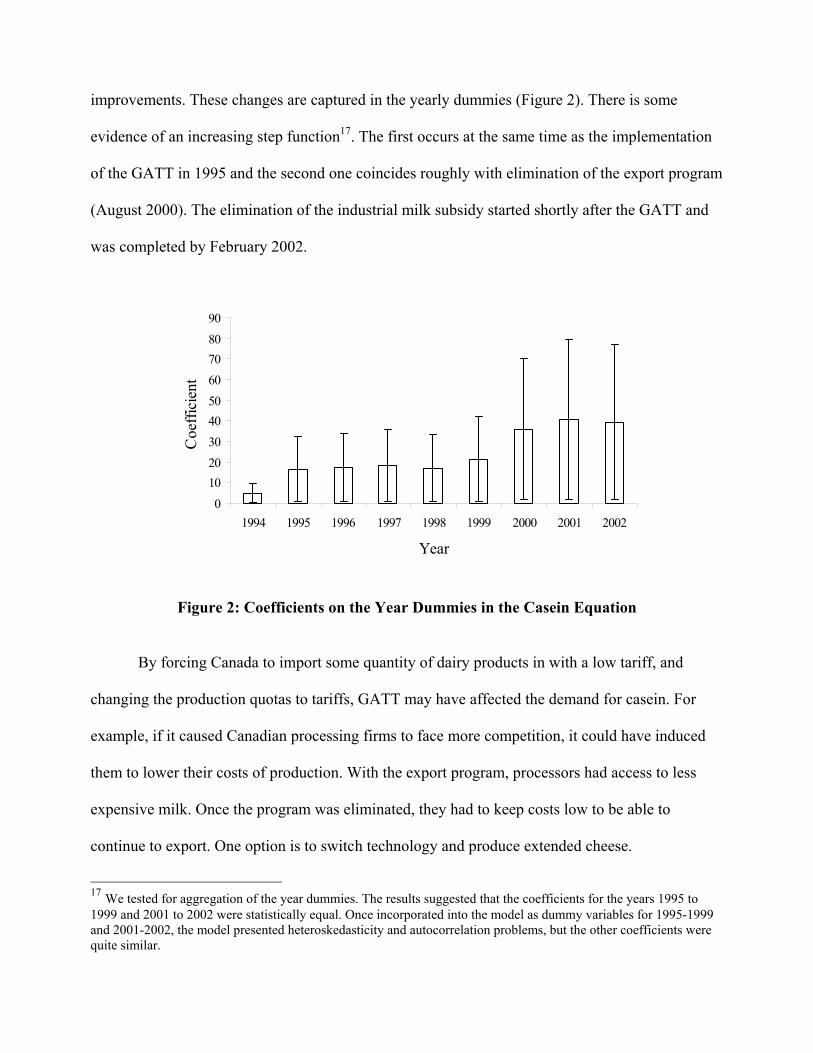
improvements. These changes are captured in the yearly dummies (Figure 2). There is some
evidence of an increasing step function17. The first occurs at the same time as the implementation
of the GATT in 1995 and the second one coincides roughly with elimination of the export program
(August 2000). The elimination of the industrial milk subsidy started shortly after the GATT and
was completed by February 2002.
0102030405060708090
1994 1995 1996 1997 1998 1999 2000 2001 2002
Year
Coe
ffici
ent .
Figure 2: Coefficients on the Year Dummies in the Casein Equation
By forcing Canada to import some quantity of dairy products in with a low tariff, and
changing the production quotas to tariffs, GATT may have affected the demand for casein. For
example, if it caused Canadian processing firms to face more competition, it could have induced
them to lower their costs of production. With the export program, processors had access to less
expensive milk. Once the program was eliminated, they had to keep costs low to be able to
continue to export. One option is to switch technology and produce extended cheese.
17 We tested for aggregation of the year dummies. The results suggested that the coefficients for the years 1995 to 1999 and 2001 to 2002 were statistically equal. Once incorporated into the model as dummy variables for 1995-1999 and 2001-2002, the model presented heteroskedasticity and autocorrelation problems, but the other coefficients were quite similar.
The effect of supply management can be measured by comparing the milk price difference
between Canada and the United States. The U.S. price for industrial milk in December 2002 was
24.13 USD/hl. Using the exchange rate for December 2002, 1.56 CAD/USD, the price is
$37.64/hl. The weighted milk price for December 2002 is $52.17/hl for Ontario and $55.67/hl for
Quebec. The difference is $14.52/hl for Ontario and $18.03/hl for Quebec. The average difference
in price for both provinces is $16.28/hl. The higher price for industrial milk in Canada than in the
United States increased casein imports by 35,294 kg (54.4% of the average monthly casein
imports). This means that in December 2002, 11,765 hl of milk were displaced, causing a spillover
effect that decreases farmers’ revenue by $634,358 (using the average weighted milk price for
Ontario and Quebec in December 2002).
In December 2002, the total volume of milk produced in Quebec was 2,222,428.2 hl,
generating $36,181,131 in extra revenue for farmers due to supply management. At the same time,
supply management also caused a spillover effect that decreased farmers’ revenue by $654,946.
The spillover effect is 1.81% of the extra revenue, which is a considerable amount for Canadian
farmers.
For the next part of the simulation, we use the average of the coefficients on the yearly
dummy variables for the years 1995 to 1999 (first step in Figure 2) and on the yearly dummies for
the years 2001 to 2002 (second step in Figure 2). We examine the different effects of supply
management (as captured by the difference in price between Canada and the United States), the
elimination of the export program (as captured in the average for the years 2001 to 2002) and the
elimination of the industrial milk subsidy and the implementation of the GATT (as captured by the
average for the years 1995 to 1999) on the imports of casein by comparing the extra quantity of
casein imported because of these three factors.
All the coefficients on the yearly dummy variables for the casein equation are positive and
significant at the 1% level (except 1994, significant at the 10% and 1998, significant at the 5%).
The average of the coefficients on the yearly dummies for 1995 to 1999 is 18.187. This positive
result was expected given the changes in regulation, like the elimination of the industrial milk
subsidy, occurred after the GATT. The average of the coefficients on the years 2001 to 2002
(subtracting the average for the years 1995 to 1999 to get the increase only) is 21.886. This result
is interesting since it coincides with the elimination of the export program in August 2000. It can
be considered as an approximate measure of the average difference in kilograms of casein with
and without the export program. Thus, imports of casein greatly increased after the elimination of
the export program.
The quantity of casein imported after the GATT (elimination of the industrial milk
subsidy) is 181,780 kg (280% of the average monthly casein imports) and after the year 2001
(elimination of the export program) it increased to 218,863 kg (337% of the average monthly
casein imports). These two dates mark changes in the supply management system as well as
technological changes. After the year 2001, 72,955 hl of milk were displaced, producing a
decrease in farmers’ revenue of $3,334,748 due to the spillover effect. After the GATT, 60,593 hl
of milk were displaced and the spillover effect decreased farmers’ revenue by $2,769,725. As
mentioned before, the effect of supply management as captured by the difference in milk price
between Canada and the United States increased casein imports by 35,294 kg (54.4% of the
average monthly casein imports), displacing 11,765 hl of milk and causing a spillover effect that
decreases farmers’ revenue by $634,358.
Comparing the three effects, one can see that the elimination of the export program, as
captured by the average of the yearly dummies for the years 2001 to 2002, caused the greatest
decrease in farmers’ revenue due to the spillover effect, followed by the elimination of the
industrial milk subsidy (average of the yearly dummies for the years 1995-1999) and then the
effect of supply management. The effect of supply management caused around 19% of the revenue
loss to farmers due to the elimination of the export program and 23% of the revenue loss to
farmers due to the elimination of the industrial milk subsidy. That said, the end of the export
program and the industrial milk subsidy may only have precipitated faster technical change that
may well have occurred anyway, especially in the last two years. Therefore, this result should not
be interpreted literally but it gives an idea of the impact Canadian regulations have had on the
increase in the imports of casein.
CONCLUSION
This paper uses empirical analysis to examine the effects of supply management on quality
in the dairy industry, thereby filling a gap in the literature. Specifically, we use the derived
demand equation for casein as a function of the reduced form demand for the outputs (cheddar,
specialty cheese, yogurt and ice cream), the instrumented casein price, the marginal costs (milk
price, wage and metal) and the number of plants to determine the effect of high levels of protection
on product quality.
The results provide evidence that suggests that supply management negatively affects
cheese quality. The quantity of casein imports increases in response to an increase in the price of
milk. The results suggest that approximately 9.8% of specialty cheese is produced using casein.
Furthermore, we estimate the amount of milk displaced by casein if milk price increases one
dollar, 722.65 hl of milk per month; and the implied spillover effect on Canadian dairy farmers,
which, on average, decreases their revenue by $33,033 per month.
The results, regarding the number of plants, are that a decrease in the number of plants
decreases the quantity of casein. Removing one plant from the market is associated with a 140 kg
(0.21% of the average monthly casein imports) decrease in casein imports. Over the time–frame of
this study, the dairy processing industry has undergone a great deal of rationalization. Economies
of scale and scope, which enable firms to lower costs without the need to use extenders in the
products, are one possible explanation for this rationalization. Another possible explanation is that
market power allows firms to better capture rents associated with quality.
It is generally accepted that supply management has increased the price of milk (as
discussed in the Introduction). Consequently, we find evidence that supply management has
increased imports of casein (2,170 kg for each $/hl, which is 3.34% of the average monthly casein
imports), while decreasing farmers’ revenue (due to the spillover effect) and cheese quality. In
December 2002, imports of casein increased by 35,294 kg (54.4% of the average monthly casein
imports) given the relatively higher Canadian milk price (compared to the U.S. milk price) due to
supply management. This means that 11,765 hl of milk have been displaced, causing the spillover
effect to decrease farmers’ revenue by $634,358.
The spillover effect for Quebec in December 2002 is 1.81% of the extra revenue produced
by supply management due to the higher Canadian milk price compared to the U.S milk price.
This evidence suggests that supply management is negatively affecting cheese quality. However,
in August 2000, Canada eliminated the export program because of WTO negotiations. This effect
is captured in the average for the coefficients on the yearly dummy variables for the 2001 to 2002.
The coefficient is positive, suggesting that the export program affects imports of casein. This
effect is causing the greatest spillover effect decreasing farmers’ revenue. This is because
processors that want to continue exporting need to explore alternative production techniques to
keep costs low. The availability of technology to extend cheese contributed to the increase in
imports of casein.
This area requires further study, since casein imports are not subject to import tariffs.
Import tariffs (or reclassification), for example, a 10% ad valorem tariff would decrease casein
imports by 29,103 kg per month (45% of the average monthly casein imports), translating into
9,701 hl more milk being used in cheese processing and an average increase in farmers’ revenue of
$443,428 per month. To drive casein imports down to zero, a 22% ad valorem tariff is needed.
Another interesting issue is whether casein will be produced again in Canada.
The processing industry is able to charge higher prices for their products due to supply
management. As mentioned in the Background section, evidence suggests that the processing
sector has a significant degree of market power (Schmitz and Schmitz, 1994). Regulations in
Canada, together with the worldwide consolidation trend, have allowed dairy processors to charge
higher prices. Furthermore, processors are able to price and quality discriminate among consumers
using different brands. Unfortunately, at this stage, we cannot incorporate this effect into the study,
but it is an area open for further consideration.
Currently, there are more and better (in terms of taste and appearance) substitutes, made
from alternative sources, for traditional products. However, this does not mean that products are of
higher quality. Actually, in most cases it is the other way around. The incentive for firms to launch
substitute products is to create niche markets to obtain better profits for lower–cost products. This
incentive is exacerbated by regulations that increase the price of traditional ingredients, while
allowing low–cost substitutes to be imported barrier–free. These regulations have a significant
effect on the quality of the end product and farmers’ revenue.
REFERENCES
Acharyya, R. (1998). Monopoly and Product Quality: Separating or Pooling Menu? Economic
Letters. 61(2): 187-194.
Barichello, R.R. (1999). The Canadian Dairy Industry: Prospects for Future Trade. Canadian
Journal of Agricultural Economics. 47(5): 45-55.
Barichello, R. R. and B. K. Stennes (1994). Cost Competitiveness of the Canadian Dairy Industry:
A Farm Level Analysis. Paper prepared for the “Supply Management in Transition”
Conference, Quebec, Canada, June 28-30, 1994.
Beath, J. and Y. Katsoulacos (1991). The Economic Theory of Product Differentiation. Cambridge
University Press, First Edition, Great Britain. 75-83.
CDC (2003). Canadian Dairy Commission. <http://www.cdc.ca/>
Canadian Dairy Industry Profile (2002). Agriculture and Agri–Food Canada.
<http://www.dairyinfo.gc.ca/pdf_files/dairyprofile.pdf>
Food Bureau (2003). The Canadian Dairy Processing Industry Sub–sector Profile. Agriculture and
Agri–Food Canada. October 10, 2003.
<http://www.agr.gc.ca/food/profiles/dairy/dairy_e.html>
Ishikawa, J. and B. J. Spencer (1996). Rent Shifting Export Subsidies with an Imported
Intermediate Product. NBER Working Paper 5458.
Lambertini, L. (1998). Does Monopoly Undersupply Product Quality? Working Papers from
Universita degli Studi di Bologna. <http://www.dse.unibo.it/wp/317.pdf>
Mangold, P. (2001). Milk Proteins and More. Presentation prepared for La foundation des
Gouverneurs, October 31, 2001.
Meilke, K., R. Sarker and D. Le Roy (1998). The Potential for Increased Trade in Milk and Dairy
Products between Canada and the United States under Trade Liberalization. Canadian
Journal of Agricultural Economics. 46(2): 149-169.
Potter, N. N. and J. H. Hotchkiss (1995). Food Science. AVI Publishing Company, Fifth Edition,
U.S.A. 279-315.
Richards, T. J. (1996). The Effect of Supply Management on Dairy Productivity. The Canadian
Journal of Economics. 29(Special Issue Part 2): S458-S462.
Richards, T. J. and S. R. Jeffrey (1997). The Effect of Supply Management on Herd Size in
Alberta Dairy. American Journal of Agricultural Economics. 79(2): 555-565.
Romain, R. (2001). The Future of the Dairy Industry in Canada. Discussion Series SD.01.01
Centre de Recherché en Economie Agroalimentaire Universite Laval.
Schmitz, A. and T. G. Schmitz (1994). Supply Management: The Past and Future. Canadian
Journal of Agricultural Economics. 42(2): 125-148.
StataCorp. (2001). Stata Statistical Software: Release 7.0. College Station, TX: Stata Corporation.
Reference Manual Volume 3: 44-63.
Statistics Canada. < http://www.statcan.ca/>
Task Force on National Dairy Policy (1991). Evolution of the Canadian Dairy Industry. May 31.
USDA Economic Research Service. <http://www.ers.usda.gov/Briefing/Dairy/>
U.S. Department of Labour, Bureau of Labour Statistics. <http://www.bls.gov/data/home.htm>
Vercammen, J. and A. Schmitz (1994). Deregulating Supply–Managed Industries: The
Unexpected Trade Effects. Paper presented at “Supply Management in Transition Towards
the 21st Century”, June 28-30, 1994, Quebec, Canada.
Western Dairy Digest (2001). Volume 2 Number 3, Spring 2001.
<http://www.westerndairyscience.com>
Western Dairy Digest (2003). Volume 4 Number 3, Spring 2003.
<http://www.westerndairyscience.com>
Wilson, B. (2003). Dairy farmers want butteroil problem fixed. The Western Producer, April 25,
2003. < http://www.producer.com/>
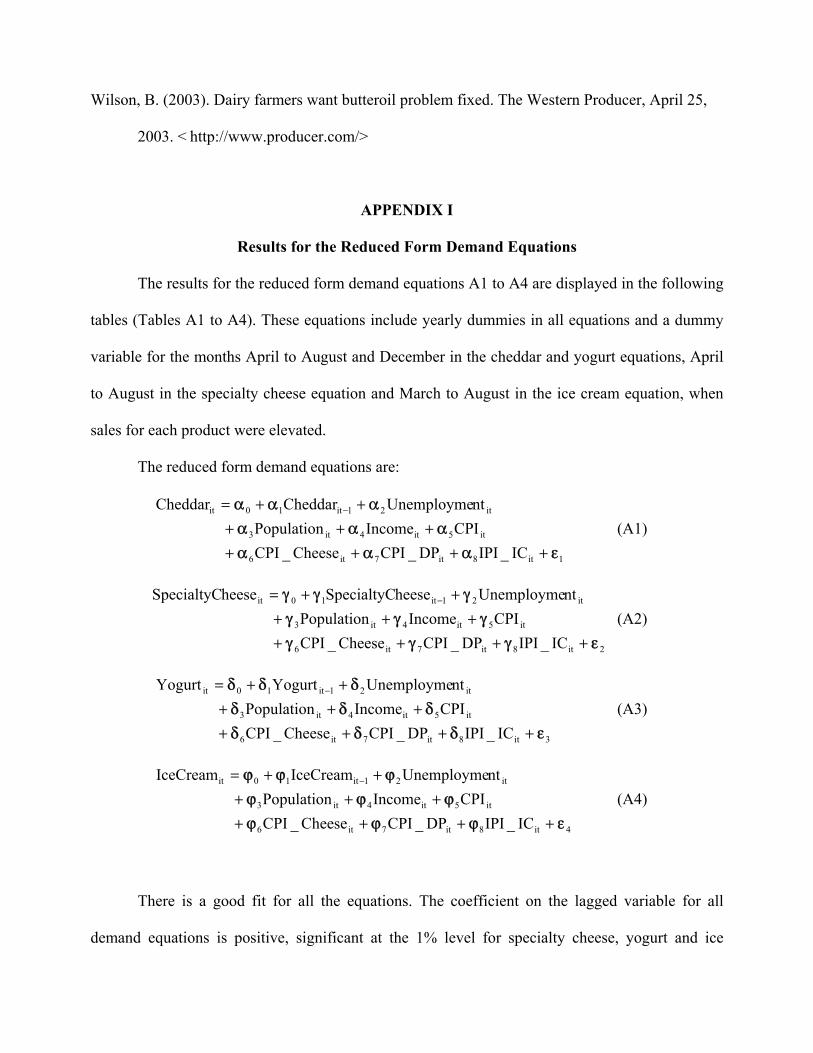
APPENDIX I
Results for the Reduced Form Demand Equations
The results for the reduced form demand equations A1 to A4 are displayed in the following
tables (Tables A1 to A4). These equations include yearly dummies in all equations and a dummy
variable for the months April to August and December in the cheddar and yogurt equations, April
to August in the specialty cheese equation and March to August in the ice cream equation, when
sales for each product were elevated.
The reduced form demand equations are:
1it8it7it6
it5it4it3
it21it10it
IC_IPIDP_CPICheese_CPICPIIncomePopulation
ntUnemploymeCheddarCheddar
εαααααα
ααα
+++++++
++= −
(A1)
2it8it7it6
it5it4it3
it21it10it
IC_IPIDP_CPICheese_CPICPIIncomePopulation
ntUnemploymeheeseSpecialtyCheeseSpecialtyC
εγγγγγγ
γγγ
+++++++
++= −
(A2)
3it8it7it6
it5it4it3
it21it10it
IC_IPIDP_CPICheese_CPICPIIncomePopulation
ntUnemploymeYogurtYogurt
εδδδδδδ
δδδ
+++++++
++= −
(A3)
4it8it7it6
it5it4it3
it21it10it
IC_IPIDP_CPICheese_CPICPIIncomePopulation
ntUnemploymeIceCreamIceCream
εϕϕϕϕϕϕ
ϕϕϕ
+++++++
++= −
(A4)
There is a good fit for all the equations. The coefficient on the lagged variable for all
demand equations is positive, significant at the 1% level for specialty cheese, yogurt and ice
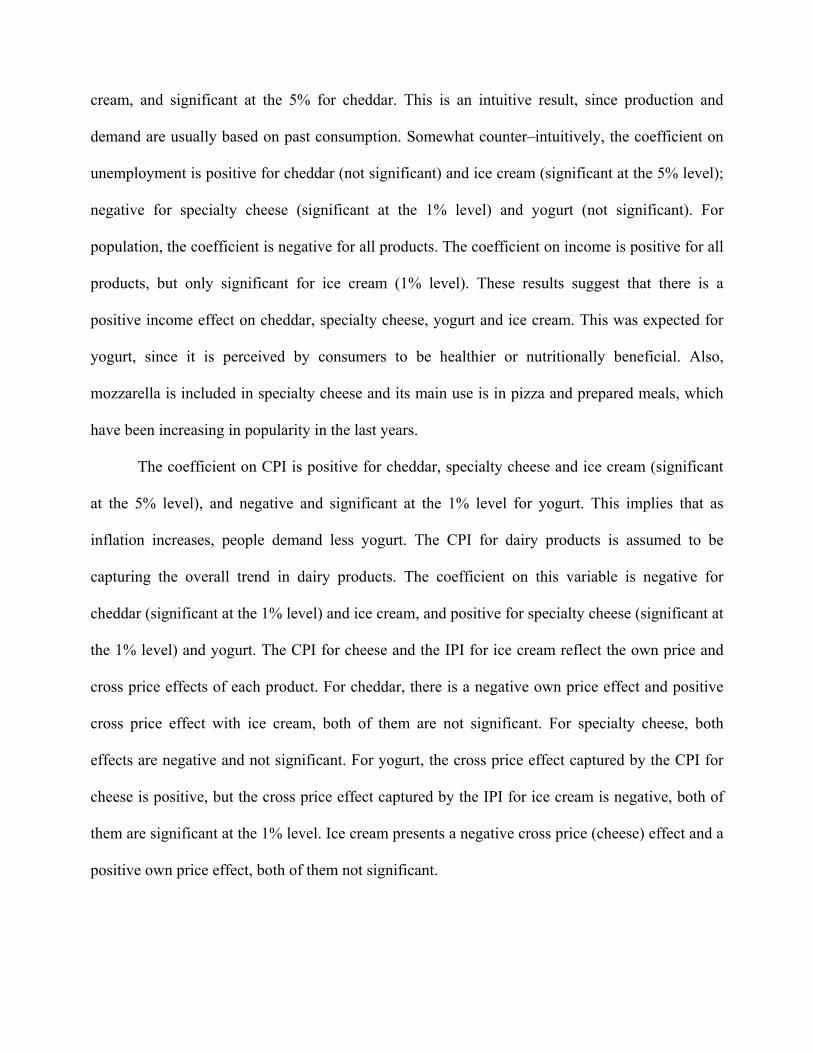
cream, and significant at the 5% for cheddar. This is an intuitive result, since production and
demand are usually based on past consumption. Somewhat counter–intuitively, the coefficient on
unemployment is positive for cheddar (not significant) and ice cream (significant at the 5% level);
negative for specialty cheese (significant at the 1% level) and yogurt (not significant). For
population, the coefficient is negative for all products. The coefficient on income is positive for all
products, but only significant for ice cream (1% level). These results suggest that there is a
positive income effect on cheddar, specialty cheese, yogurt and ice cream. This was expected for
yogurt, since it is perceived by consumers to be healthier or nutritionally beneficial. Also,
mozzarella is included in specialty cheese and its main use is in pizza and prepared meals, which
have been increasing in popularity in the last years.
The coefficient on CPI is positive for cheddar, specialty cheese and ice cream (significant
at the 5% level), and negative and significant at the 1% level for yogurt. This implies that as
inflation increases, people demand less yogurt. The CPI for dairy products is assumed to be
capturing the overall trend in dairy products. The coefficient on this variable is negative for
cheddar (significant at the 1% level) and ice cream, and positive for specialty cheese (significant at
the 1% level) and yogurt. The CPI for cheese and the IPI for ice cream reflect the own price and
cross price effects of each product. For cheddar, there is a negative own price effect and positive
cross price effect with ice cream, both of them are not significant. For specialty cheese, both
effects are negative and not significant. For yogurt, the cross price effect captured by the CPI for
cheese is positive, but the cross price effect captured by the IPI for ice cream is negative, both of
them are significant at the 1% level. Ice cream presents a negative cross price (cheese) effect and a
positive own price effect, both of them not significant.
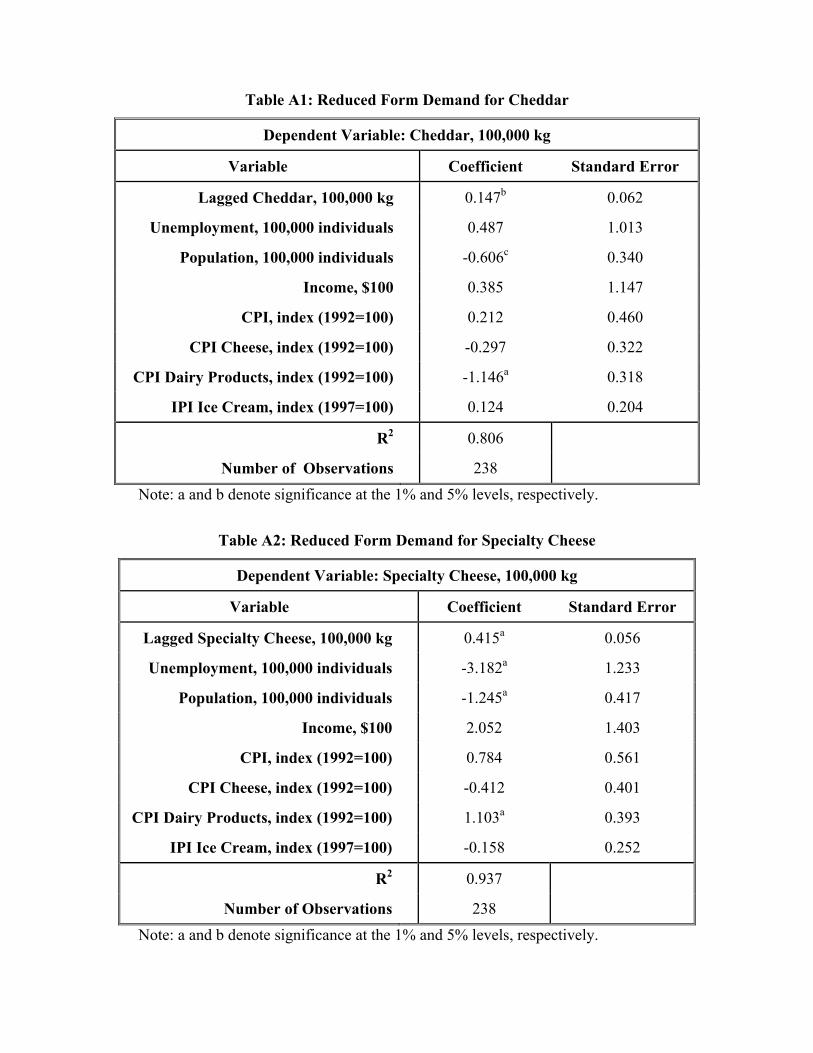
Table A1: Reduced Form Demand for Cheddar
Dependent Variable: Cheddar, 100,000 kg
Variable Coefficient Standard Error
Lagged Cheddar, 100,000 kg 0.147b 0.062
Unemployment, 100,000 individuals 0.487 1.013
Population, 100,000 individuals -0.606c 0.340
Income, $100 0.385 1.147
CPI, index (1992=100) 0.212 0.460
CPI Cheese, index (1992=100) -0.297 0.322
CPI Dairy Products, index (1992=100) -1.146a 0.318
IPI Ice Cream, index (1997=100) 0.124 0.204
R2 0.806
Number of Observations 238 Note: a and b denote significance at the 1% and 5% levels, respectively.
Table A2: Reduced Form Demand for Specialty Cheese
Dependent Variable: Specialty Cheese, 100,000 kg
Variable Coefficient Standard Error
Lagged Specialty Cheese, 100,000 kg 0.415a 0.056
Unemployment, 100,000 individuals -3.182a 1.233
Population, 100,000 individuals -1.245a 0.417
Income, $100 2.052 1.403
CPI, index (1992=100) 0.784 0.561
CPI Cheese, index (1992=100) -0.412 0.401
CPI Dairy Products, index (1992=100) 1.103a 0.393
IPI Ice Cream, index (1997=100) -0.158 0.252
R2 0.937
Number of Observations 238 Note: a and b denote significance at the 1% and 5% levels, respectively.
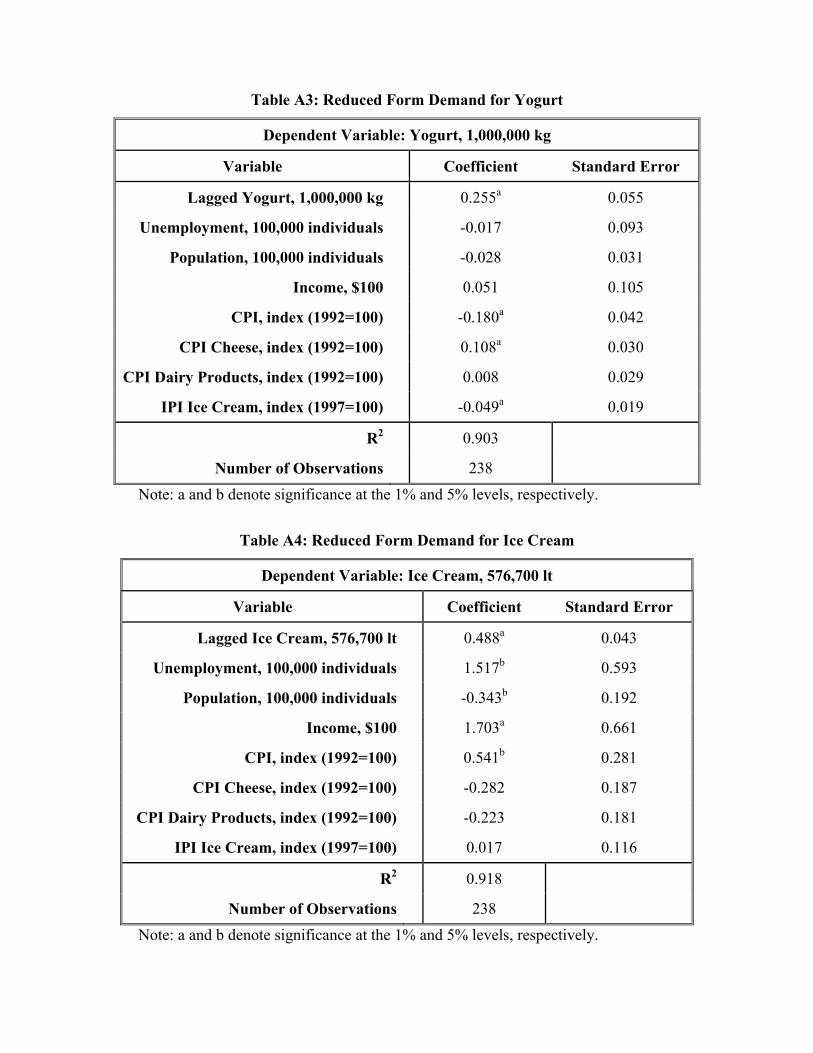
Table A3: Reduced Form Demand for Yogurt
Dependent Variable: Yogurt, 1,000,000 kg
Variable Coefficient Standard Error
Lagged Yogurt, 1,000,000 kg 0.255a 0.055
Unemployment, 100,000 individuals -0.017 0.093
Population, 100,000 individuals -0.028 0.031
Income, $100 0.051 0.105
CPI, index (1992=100) -0.180a 0.042
CPI Cheese, index (1992=100) 0.108a 0.030
CPI Dairy Products, index (1992=100) 0.008 0.029
IPI Ice Cream, index (1997=100) -0.049a 0.019
R2 0.903
Number of Observations 238 Note: a and b denote significance at the 1% and 5% levels, respectively.
Table A4: Reduced Form Demand for Ice Cream
Dependent Variable: Ice Cream, 576,700 lt
Variable Coefficient Standard Error
Lagged Ice Cream, 576,700 lt 0.488a 0.043
Unemployment, 100,000 individuals 1.517b 0.593
Population, 100,000 individuals -0.343b 0.192
Income, $100 1.703a 0.661
CPI, index (1992=100) 0.541b 0.281
CPI Cheese, index (1992=100) -0.282 0.187
CPI Dairy Products, index (1992=100) -0.223 0.181
IPI Ice Cream, index (1997=100) 0.017 0.116
R2 0.918
Number of Observations 238 Note: a and b denote significance at the 1% and 5% levels, respectively.
Copyright © 2022 FDOKUMEN