IDENTIFICATION OF MARKET POWER IN THE HUNGARIAN DAIRY INDUSTRY: A PLANT-LEVEL ANALYSIS
17
IDENTIFICATION OF MARKET POWER IN THE HUNGARIAN DAIRY INDUSTRY: A PLANT-LEVEL ANALYSIS Oleksandr Perekhozhuk 1 , Heinrich Hockmann 1 , Lajos Zoltan Bakucs 2 , Imre Fertö 2 , 1 Leibniz Institute of Agricultural Development in Central and Eastern Europe (IAMO), Halle (Saale), Germany 2 Institute of Economics of the Hungarian Academy of Sciences, Budapest, Hungary. Paper prepared for presentation at the EAAE 2011 Congress Change and Uncertainty Challenges for Agriculture, Food and Natural Resources August 30 to September 2, 2011 ETH Zurich, Zurich, Switzerland Copyright 2011 by Oleksandr Perekhozhuk, Heinrich Hockmann, Lajos Zoltan Bakucs and Imre Fertö. All rights reserved. Readers may make verbatim copies of this document for non-commercial purposes by any means, provided that this copyright notice appears on all such copies.
Transcript of IDENTIFICATION OF MARKET POWER IN THE HUNGARIAN DAIRY INDUSTRY: A PLANT-LEVEL ANALYSIS
IDENTIFICATION OF MARKET POWER IN THE HUNGARIAN DAIRY INDUSTRY: A PLANT-LEVEL
ANALYSIS
Oleksandr Perekhozhuk1, Heinrich Hockmann1,
Lajos Zoltan Bakucs2, Imre Fertö2,
1 Leibniz Institute of Agricultural Development in Central and Eastern Europe (IAMO),
Halle (Saale), Germany 2 Institute of Economics of the Hungarian Academy of Sciences, Budapest, Hungary.
Paper prepared for presentation at the EAAE 2011 Congress Change and Uncertainty Challenges for Agriculture,
Food and Natural Resources
August 30 to September 2, 2011 ETH Zurich, Zurich, Switzerland
Copyright 2011 by Oleksandr Perekhozhuk, Heinrich Hockmann, Lajos Zoltan Bakucs and Imre Fertö. All rights reserved. Readers may make verbatim copies of this document for non-commercial purposes by any means, provided that this copyright notice appears on all such copies.
ABSTRACT
The objective of this paper is to provide an alternative model which can be used to test for oligopsony market power applying plant-level data. For this purpose, we took into account empirical studies and specific developments in the Hungarian dairy industry and specified a model that provides useful benchmarks for an econometric test of market power. The results of the econometric analysis show that the effects from policy changes in Hungary, as well as from plant specific issues are highly statistically significant, and produce evidence suggesting the exercise of oligopsony market power in the Hungarian dairy industry.
Keywords: Hungarian dairy industry, market power, oligopsony, translog.
1. INTRODUCTION
Since the 1980s, numerous studies on New Empirical Industrial Organization (NEIO) have been conducted. These studies paid special attention to measuring market power in agricultural and food markets. In most of these studies, e. g. Schroeter (1988), Azzam and Pagoulatos (1990), and Schroeter and Azzam (1990), evidence of buyer and/or seller market power in the U.S. beef packing industry was produced by interpreting market level data. Morrison Paul (2001), conducting a plant-level analysis, found market power to be present in both the cattle input and beef output market. In contrast to the majority of these studies, Muth and Wohlgenant (1999) could not prove the existence of oligopsony power in the U.S. beef packing industry. A result that was also obtained by Hyde and Perloff (1998) for oligopsony market power in the Australian retail meat sector, and by Quagrainie et al. (2003) for processor power in the Canadian cattle and hog markets.
In the recent past, agricultural economists have started to focus on the analysis of market structure and pricing in the market for raw milk in the Central and Eastern European Countries (CEECs). Perekhozhuk et al. (2007) used a production function framework to investigate production technology and to test for market power in the Ukrainian milk processing industry. Anders (2008) estimated the degree of oligopoly and oligopsony market power in the German food retail industry by evaluating a set of monthly retail beef and pork marketing data of the federal state of Hesse. Applying the revenue function approach, Hockmann and Vöneki (2009) found considerable oligopsony market power in the Hungarian milk market. The econometric results obtained by Bakucs et al. (2010) have revealed the existence of oligopsony market power in the Hungarian slaughter hog market.
At this point, it is necessary to underline that all of these studies relied on the New Empirical Industrial Organization theory (NEIO) and used market-level data, which were available only to a limited extent, to estimate the degree of market power at a national level. At a regional level, as far as we know, the degree of market power has been estimated only by Wann and Sexton (1992), Weliwita and Azzam (1996), Koontz and Garcia (1997), Anders (2008) as well as Perekhozhuk et al. (2009); and in so doing have found evidence of market power.
There are a lot of empirical studies that have estimated and tested for oligopoly and/or oligopsony power on the basis of industry-level data, while there is only little literature on such studies analyzing plant-level data. Morrison Paul (2001), using plant-level data of U.S. beef packing plants, identified the presence of market power based on estimating input demand equations derived from a Generalized-Leontief-Quadratic cost function. Moreover, the parameter of market power was specified as a function of the number of cattle buyers, the expenditures for cattle procurement, the overtime payments to workers, and others variables.
The objective of this paper is to provide an analysis of market power at firm-level and to identify firm-specific effects that may affect both market structure and pricing in the Hungarian dairy industry. Using a unique plant-level data set in this paper, we will therefore focus on specifying a parameter for oligopsony power that takes into account policy changes in Hungary, the legal form of enterprises as well as firms-specific issues .
Our paper is organized as follows: The next section describes, in due depth, the restructuring process in the Hungarian dairy sector that is currently changing the market structure in the Hungarian dairy sector. Section 3 provides a theoretical model which may be used to test the firm’s conjectural elasticities. The model’s estimates are applied to develop an econometric test for market behavior based on plant-level data in Section 4. Descriptions of data sources and variables used in the econometric analysis are presented in Section 5. Estimation results and specification tests of the parameter of oligopsony market power are discussed in Section 6. The final section summarizes our results and draws conclusions.
2. STRUCTURAL CHANGE IN THE HUNGARIAN DAIRY SECTOR
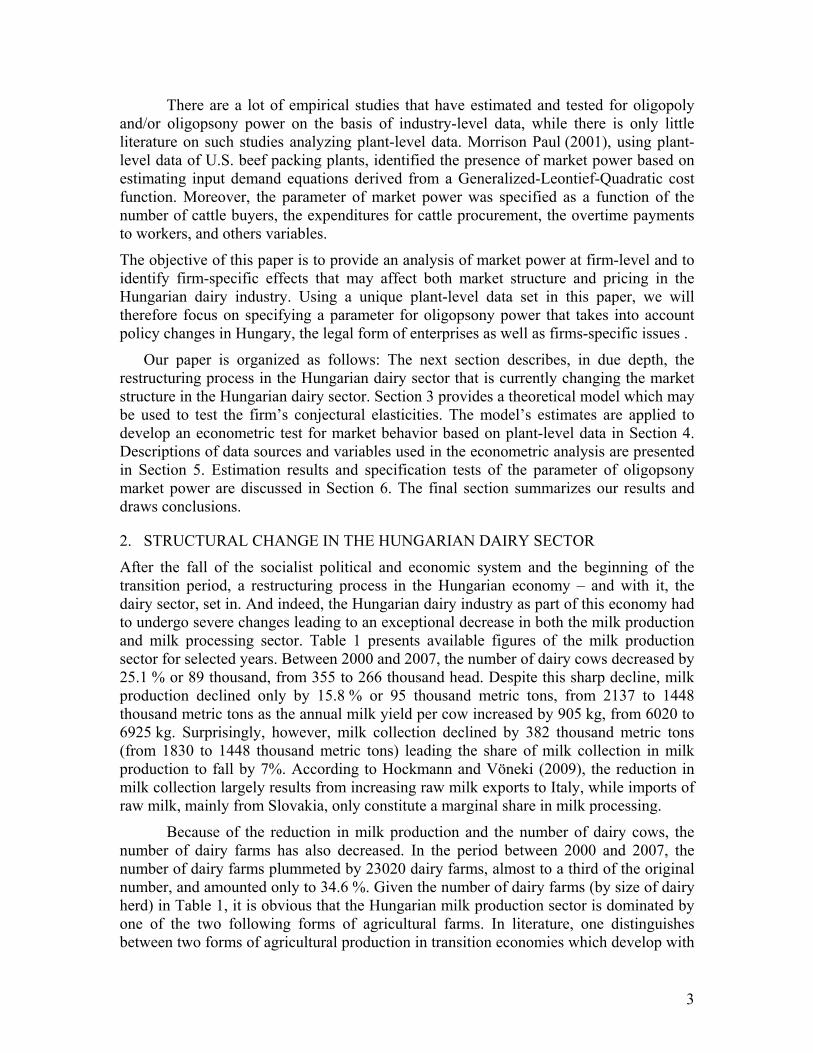
After the fall of the socialist political and economic system and the beginning of the transition period, a restructuring process in the Hungarian economy – and with it, the dairy sector, set in. And indeed, the Hungarian dairy industry as part of this economy had to undergo severe changes leading to an exceptional decrease in both the milk production and milk processing sector. Table 1 presents available figures of the milk production sector for selected years. Between 2000 and 2007, the number of dairy cows decreased by 25.1 % or 89 thousand, from 355 to 266 thousand head. Despite this sharp decline, milk production declined only by 15.8 % or 95 thousand metric tons, from 2137 to 1448 thousand metric tons as the annual milk yield per cow increased by 905 kg, from 6020 to 6925 kg. Surprisingly, however, milk collection declined by 382 thousand metric tons (from 1830 to 1448 thousand metric tons) leading the share of milk collection in milk production to fall by 7%. According to Hockmann and Vöneki (2009), the reduction in milk collection largely results from increasing raw milk exports to Italy, while imports of raw milk, mainly from Slovakia, only constitute a marginal share in milk processing.
Because of the reduction in milk production and the number of dairy cows, the number of dairy farms has also decreased. In the period between 2000 and 2007, the number of dairy farms plummeted by 23020 dairy farms, almost to a third of the original number, and amounted only to 34.6 %. Given the number of dairy farms (by size of dairy herd) in Table 1, it is obvious that the Hungarian milk production sector is dominated by one of the two following forms of agricultural farms. In literature, one distinguishes between two forms of agricultural production in transition economies which develop with
3
large-scale and small-scale agriculture: 1) agricultural farms (agricultural enterprises) that generally own 10 or more head of milk cows and 2) individual farms, so-called personal subsidiary plots (private family plots or private subsidiary plots), which, as a rule, own only 1-9 head of milk cows. This form of agricultural production, also known as dual structure of agricultural production is characteristic for Central and Eastern European Countries (CEEC), New Independent States (NIS), China and India (OECD, 1999, p. 68-69).
Table 1. Development of the milk production sector in Hungary for selected years, 2000-2007
Item 2000 2003 2005 2007 Number of dairy cows, 1000 head 355 310 285 266Annual milk yield, kg per cow* 6020 6552 6768 6925Milk production, 1000 t 2137 2031 1929 1842Milk collection, 1000 t 1830 1717 1518 1448Milk collection share in/of milk production, %* 86 85 79 79Number of dairy farms 35190 22000 16250 12170Number of dairy farms by size of dairy herd:
Between 1 and 2 21850 13050 7090 4610Between 3 and 9 11040 6840 6760 5170Between 10 and 19 1130 980 1160 1210Between 20 and 29 270 280 390 290Between 30 and 49 170 190 190 340Between 50 and 99 140 170 210 120100 or more 610 490 460 420
Note: The superscript * denotes authors' calculation based on data from EUROSTAT and FAOSTAT. Source: EUROSTAT and FAOSTAT.
From Table 1 it can be seen that the number of individual farms that own between 1 and 9 cows was significantly reduced by 23110 dairy farms, from 32890 to 9780 dairy farms, and thus, in 2007, amounted to only 29.7 % of the original number. Despite this significant drop in the number of individual dairy farms, their share remained high, accounting for 80.4 % of all dairy farms. Surprisingly, the number of agricultural dairy farms with more than 50 cows also decreased, by 210, from 750 to 540 dairy farms whereas the number of dairy farms with between 10 and 49 dairy cows slightly increased by 270 dairy farms, and thus amounted to 17.2 % of all dairy farms.
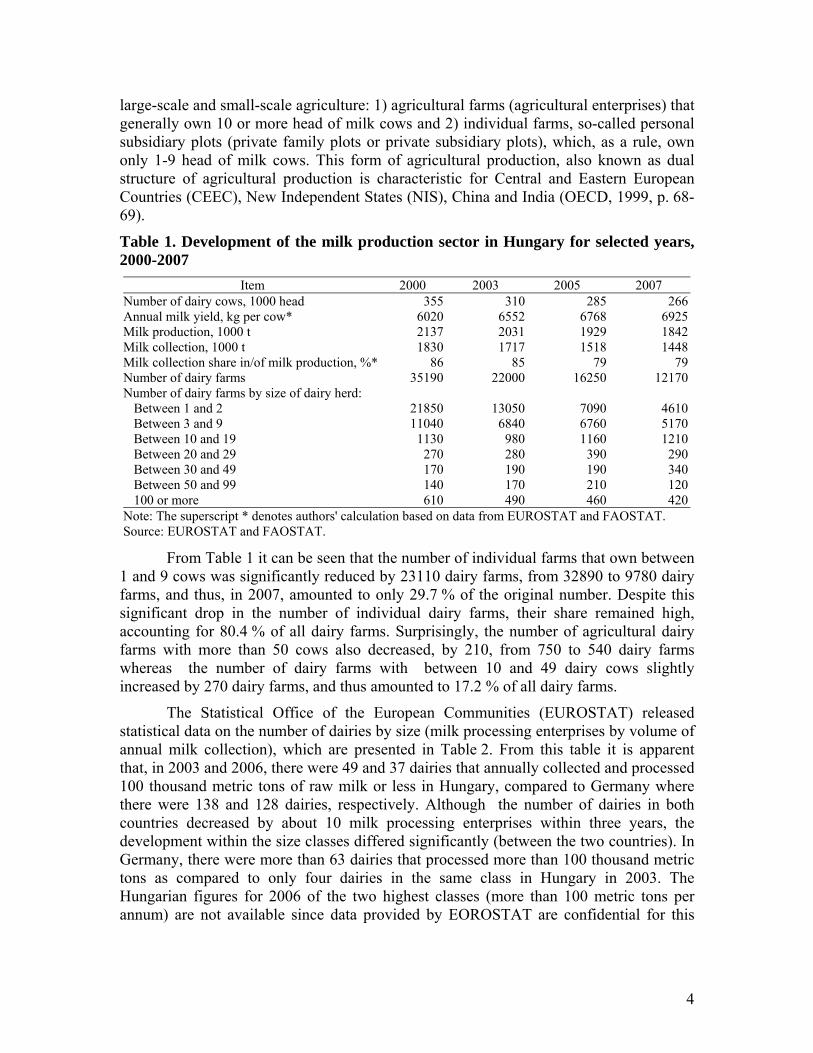
The Statistical Office of the European Communities (EUROSTAT) released statistical data on the number of dairies by size (milk processing enterprises by volume of annual milk collection), which are presented in Table 2. From this table it is apparent that, in 2003 and 2006, there were 49 and 37 dairies that annually collected and processed 100 thousand metric tons of raw milk or less in Hungary, compared to Germany where there were 138 and 128 dairies, respectively. Although the number of dairies in both countries decreased by about 10 milk processing enterprises within three years, the development within the size classes differed significantly (between the two countries). In Germany, there were more than 63 dairies that processed more than 100 thousand metric tons as compared to only four dairies in the same class in Hungary in 2003. The Hungarian figures for 2006 of the two highest classes (more than 100 metric tons per annum) are not available since data provided by EOROSTAT are confidential for this
4
year. Their number is therefore open to conjecture; we suppose that there could have been three dairies at a maximum (cf. Table 2).
Table 2: Number of dairies by volume of annual milk collection in metric tons
Germany Hungary Item
2003 2006 2003 2006 Number of dairy plants 201 190 53 39*Number of dairy plants by classes of volume of milk collection (t/year):
5 000 or less 39 37 26 16Between 5 001 and 20 000 25 21 11 12Between 20 001 and 50 000 33 33 8 4Between 50 001 and 100 000 41 37 4 5Between 100 001 and 300 000 43 40 3 (c)More than 300 000 20 22 1 (c)
Note: The superscript * denotes rough estimates calculated by the authors based on data from EUROSTAT. (c) denotes that data are not published for confidentiality reasons. Source: EUROSTAT.
Despite the fact that the number of dairy plants in the lowest class (≤ 5000 t/year) decreased, their number still remains high and amounts to more than 40 % of all dairy plants in the industry. In Germany, on the other hand, these dairy plants make up less than 20 %. Moreover, the share of dairies with an annual collection volume of equal or less than 20000 metric tons account for more than 75 % in Hungary and around 29 % in Germany. Compared to Germany, the Hungarian dairy industry is comprised of a few large and many small milk processing plants (dairies).
At this point it is helpful to look at measures suitable for making further statements on concentration processes of the Hungarian dairy sector. We, therefore, calculated the concentration of firms in an industry. The calculation had to be based on firm-level rather than plant-level data because of confidentiality reasons that would not have disclosed either name or form of ownership. Thus using individual plant data would have led to ambiguous results as a single firm may have multiple plants. However, most Hungarian dairy firms are single-plant firms. Only two multi-plant firms operate five dairy plants. Data sources came from the Institute of Economics of the Hungarian Academy of Science (IEHAS) and were collected by the Hungarian Tax Authority.
Table 3 contains the number of dairy plants N , the Herfindahl-Hirschman Index
(HHI), and the three selected concentration ratios 1CR , 4CR , and , denoting
the largest, the four, and ten largest dairy plants, respectively. Looking at the whole period from a 1993 to 2006, the number of dairy plants decreased from 35 to 21, though not steadily as the lowest number of 19 was reported for the years 2003 and 2004. Again, for confidentiality reasons, we cannot accurately specify whether the decline in the number of milk processing firms was associated with the exit of firms from the industry, mergers or acquisitions. However, a straightforward comparison between the number of plants from Table 3 and the number of farms from Table 1 yields marked differences: In 2005, there were only 20 dairy plants compared to16250 dairy farms (Table 1). From this, we conclude that the market structure of the Hungarian market for raw milk is oligopsonistic, all the more so because the calculated average of milk suppliers (i.e. dairy farm) per milk processor (i.e. dairy plant) amounts to 813.
10CR
5
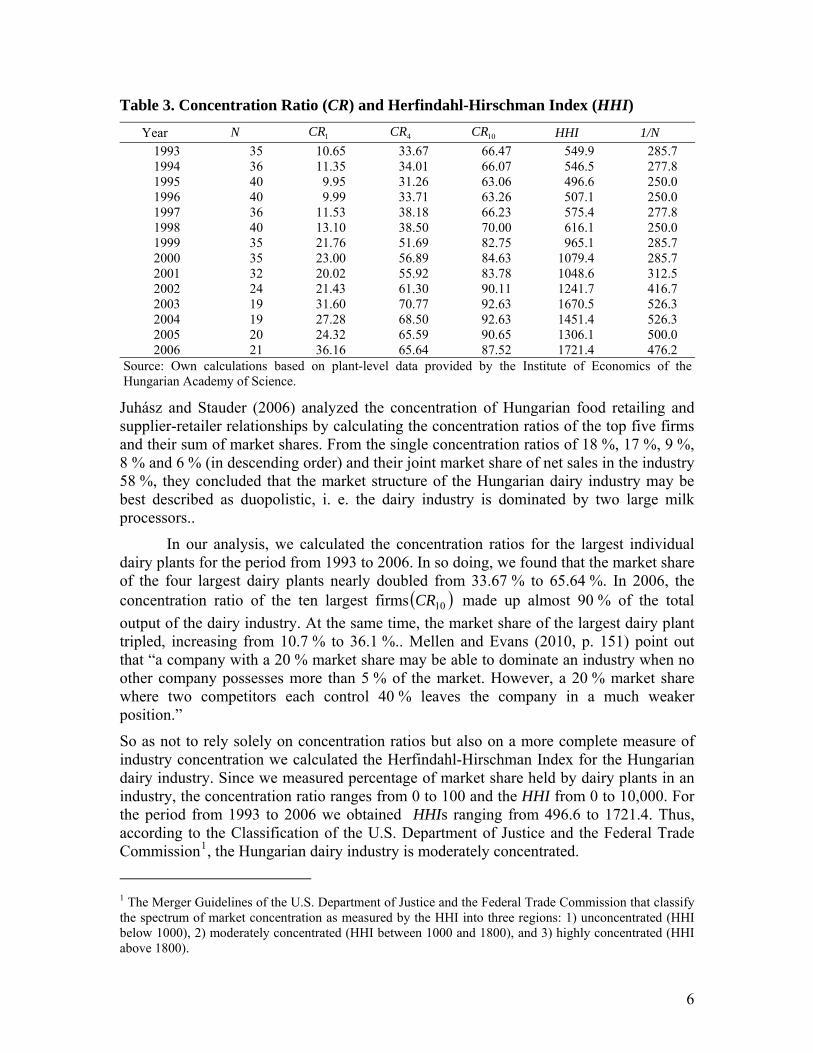
Table 3. Concentration Ratio (CR) and Herfindahl-Hirschman Index (HHI)
Year N 1CR 4CR 10CR HHI 1/N 1993 35 10.65 33.67 66.47 549.9 285.7 1994 36 11.35 34.01 66.07 546.5 277.8 1995 40 9.95 31.26 63.06 496.6 250.0 1996 40 9.99 33.71 63.26 507.1 250.0 1997 36 11.53 38.18 66.23 575.4 277.8 1998 40 13.10 38.50 70.00 616.1 250.0 1999 35 21.76 51.69 82.75 965.1 285.7 2000 35 23.00 56.89 84.63 1079.4 285.7 2001 32 20.02 55.92 83.78 1048.6 312.5 2002 24 21.43 61.30 90.11 1241.7 416.7 2003 19 31.60 70.77 92.63 1670.5 526.3 2004 19 27.28 68.50 92.63 1451.4 526.3 2005 20 24.32 65.59 90.65 1306.1 500.0 2006 21 36.16 65.64 87.52 1721.4 476.2
Source: Own calculations based on plant-level data provided by the Institute of Economics of the Hungarian Academy of Science.
Juhász and Stauder (2006) analyzed the concentration of Hungarian food retailing and supplier-retailer relationships by calculating the concentration ratios of the top five firms and their sum of market shares. From the single concentration ratios of 18 %, 17 %, 9 %, 8 % and 6 % (in descending order) and their joint market share of net sales in the industry 58 %, they concluded that the market structure of the Hungarian dairy industry may be best described as duopolistic, i. e. the dairy industry is dominated by two large milk processors..
In our analysis, we calculated the concentration ratios for the largest individual dairy plants for the period from 1993 to 2006. In so doing, we found that the market share of the four largest dairy plants nearly doubled from 33.67 % to 65.64 %. In 2006, the concentration ratio of the ten largest firms 10CR made up almost 90 % of the total
output of the dairy industry. At the same time, the market share of the largest dairy plant tripled, increasing from 10.7 % to 36.1 %.. Mellen and Evans (2010, p. 151) point out that “a company with a 20 % market share may be able to dominate an industry when no other company possesses more than 5 % of the market. However, a 20 % market share where two competitors each control 40 % leaves the company in a much weaker position.”
So as not to rely solely on concentration ratios but also on a more complete measure of industry concentration we calculated the Herfindahl-Hirschman Index for the Hungarian dairy industry. Since we measured percentage of market share held by dairy plants in an industry, the concentration ratio ranges from 0 to 100 and the HHI from 0 to 10,000. For the period from 1993 to 2006 we obtained HHIs ranging from 496.6 to 1721.4. Thus, according to the Classification of the U.S. Department of Justice and the Federal Trade Commission1, the Hungarian dairy industry is moderately concentrated.
1 The Merger Guidelines of the U.S. Department of Justice and the Federal Trade Commission that classify the spectrum of market concentration as measured by the HHI into three regions: 1) unconcentrated (HHI below 1000), 2) moderately concentrated (HHI between 1000 and 1800), and 3) highly concentrated (HHI above 1800).
6
Considering the structural change in the Hungarian dairy sector, there is empirical evidence that milk processors (dairy plants) may exercise market power in the input market for raw milk. Moreover, Hockmann and Vöneki (2009) estimated industry-wide indexes of market power and found evidence of oligopsony power. In addition to many NEIO studies, the purpose of this paper is to provide an alternative model that may be used to test for oligopsony market power based on firm-level data without additional assumptions about the aggregation of firms’ marginal product, and consequently of firms’ conjectural elasticities which must be taken into account when applying industry-level data (cf. Azzam and Pagoulatos, 1990; Muth and Wohlgenant, 1999).
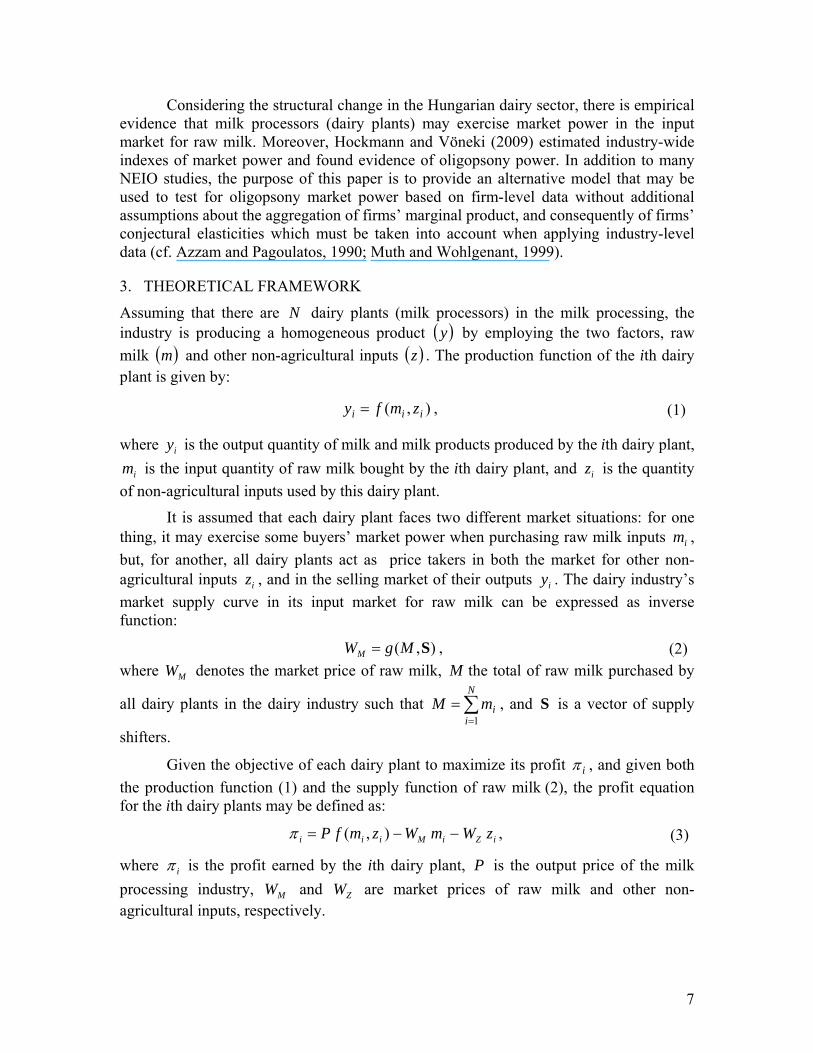
3. THEORETICAL FRAMEWORK
Assuming that there are dairy plants (milk processors) in the milk processing, the industry is producing a homogeneous product
N y by employing the two factors, raw
milk and other non-agricultural inputs m z . The production function of the ith dairy plant is given by:
),( iii zmfy , (1)
where is the output quantity of milk and milk products produced by the ith dairy plant,
is the input quantity of raw milk bought by the ith dairy plant, and is the quantity
of non-agricultural inputs used by this dairy plant.
iy
im iz
It is assumed that each dairy plant faces two different market situations: for one thing, it may exercise some buyers’ market power when purchasing raw milk inputs ,
but, for another, all dairy plants act as price takers in both the market for other non-agricultural inputs , and in the selling market of their outputs . The dairy industry’s
market supply curve in its input market for raw milk can be expressed as inverse function:
im
iz iy
),( SMgWM , (2)where denotes the market price of raw milk, MW M the total of raw milk purchased by
all dairy plants in the dairy industry such that , and is a vector of supply
shifters.
imM1
N
i
S
Given the objective of each dairy plant to maximize its profit i , and given both
the production function (1) and the supply function of raw milk (2), the profit equation for the ith dairy plants may be defined as:
iZiMiii zWmWzmfP ),( , (3)
where i is the profit earned by the ith dairy plant, is the output price of the milk
processing industry, MW and are market prices of raw milk and other non-agricultural inputs, respectively.
P
ZW
7
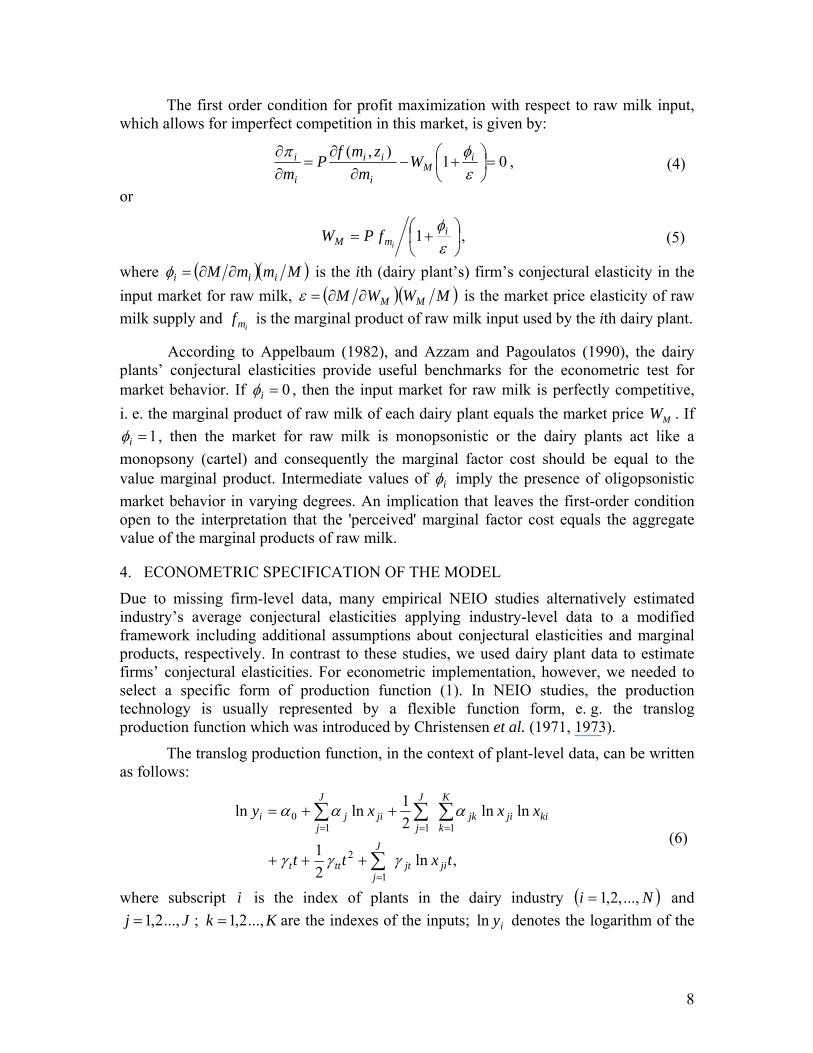
The first order condition for profit maximization with respect to raw milk input, which allows for imperfect competition in this market, is given by:
01),(
i
Mi
ii
i
i Wm
zmfP
m, (4)
or
i
mM ifPW 1 , (5)
where MmmM iii is the ith (dairy plant’s) firm’s conjectural elasticity in the
input market for raw milk, MWWM MM is the market price elasticity of raw
milk supply and is the marginal product of raw milk input used by the ith dairy plant. imf
According to Appelbaum (1982), and Azzam and Pagoulatos (1990), the dairy plants’ conjectural elasticities provide useful benchmarks for the econometric test for market behavior. If 0i , then the input market for raw milk is perfectly competitive,
i. e. the marginal product of raw milk of each dairy plant equals the market price . If MW
1i , then the market for raw milk is monopsonistic or the dairy plants act like a
monopsony (cartel) and consequently the marginal factor cost should be equal to the value marginal product. Intermediate values of i imply the presence of oligopsonistic
market behavior in varying degrees. An implication that leaves the first-order condition open to the interpretation that the 'perceived' marginal factor cost equals the aggregate value of the marginal products of raw milk.
4. ECONOMETRIC SPECIFICATION OF THE MODEL
Due to missing firm-level data, many empirical NEIO studies alternatively estimated industry’s average conjectural elasticities applying industry-level data to a modified framework including additional assumptions about conjectural elasticities and marginal products, respectively. In contrast to these studies, we used dairy plant data to estimate firms’ conjectural elasticities. For econometric implementation, however, we needed to select a specific form of production function (1). In NEIO studies, the production technology is usually represented by a flexible function form, e. g. the translog production function which was introduced by Christensen et al. (1971, 1973).
The translog production function, in the context of plant-level data, can be written as follows:
,ln2
1
lnln2
1lnln
1
2
1110
txtt
xxxy
jijt
J
jttt
K
kkijijk
J
j
J
jjiji
(6)
where subscript is the index of plants in the dairy industry and
; are the indexes of the inputs; denotes the logarithm of the
i
2,1
Ni ...,,2,1Jj ...,2,1 Kk ..., iyln
8
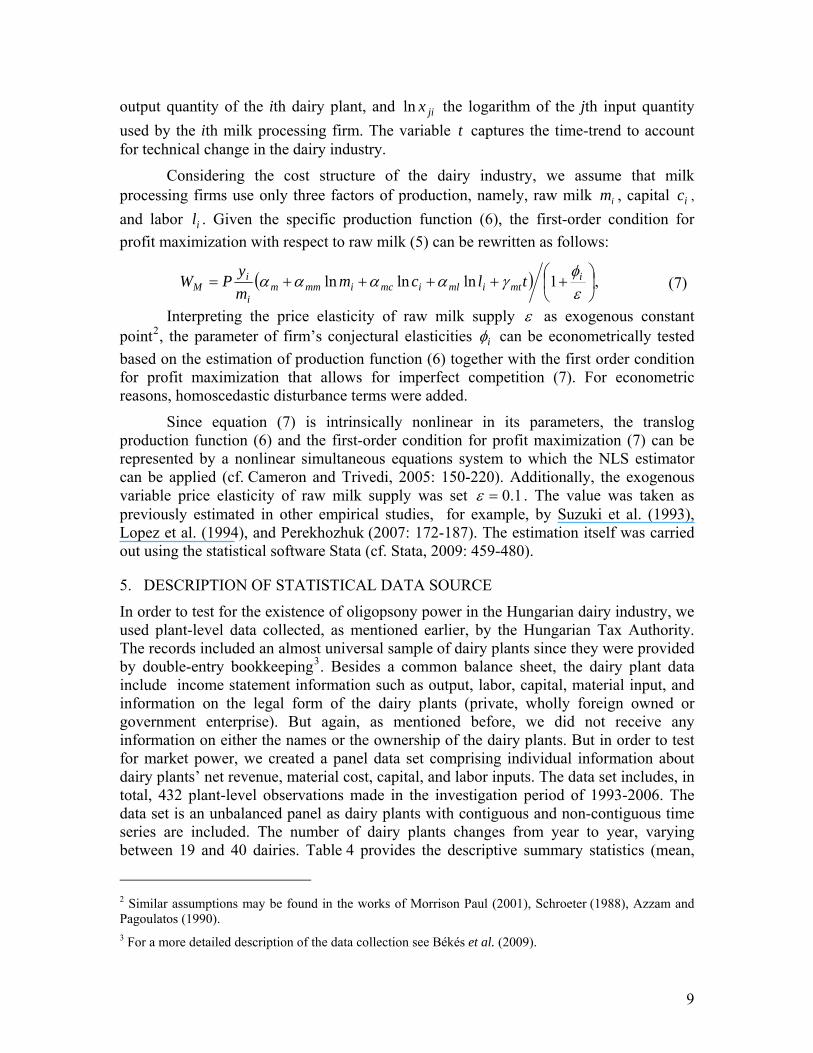
output quantity of the ith dairy plant, and jixln the logarithm of the jth input quantity
used by the ith milk processing firm. The variable captures the time-trend to account for tech
m ilk
ndition
profit maximization with respect to raw milk (5) can be rewritten as follows:
tnical change in the dairy industry.
Considering the cost structure of the dairy industry, we assu e that mprocessing firms use only three factors of production, namely, raw milk im , capital ic ,
and labor il . Given the specific production function (6), the first-order co for
,1lnlnln
mtimlimcimmmi
M tlcmm
PW (7)
Interpreting the price elasticity of raw milk supply
iiy
as exogenous constant point2, the parameter of firm’s conjectural elasticities i can be econometrically tested
based on the estimation of production function (6) together with the first order condition for profit maximization that allows for imperfect competition (7). For econometric reasons, homoscedastic disturbance terms were added.
Since equation (7) is intrinsically nonlinear in its parameters, the translog production function (6) and the first-order condition for profit maximization (7) can be represented by a nonlinear simultaneous equations system to which the NLS estimator can be applied (cf. Cameron and Trivedi, 2005: 150-220). Additionally, the exogenous variable price elasticity of raw milk supply was set 1.0 . The value was taken as previously estimated in other empirical studies, for example, by Suzuki et al. (1993), Lopez et al. (1994), and Perekhozhuk (2007: 172-187). The estimation itself was carried
480).
between 19 and 40 dairies. Table 4 provides tive summary statistics (mean,
out using the statistical software Stata (cf. Stata, 2009: 459-
5. DESCRIPTION OF STATISTICAL DATA SOURCE
In order to test for the existence of oligopsony power in the Hungarian dairy industry, we used plant-level data collected, as mentioned earlier, by the Hungarian Tax Authority. The records included an almost universal sample of dairy plants since they were provided by double-entry bookkeeping3. Besides a common balance sheet, the dairy plant data include income statement information such as output, labor, capital, material input, and information on the legal form of the dairy plants (private, wholly foreign owned or government enterprise). But again, as mentioned before, we did not receive any information on either the names or the ownership of the dairy plants. But in order to test for market power, we created a panel data set comprising individual information about dairy plants’ net revenue, material cost, capital, and labor inputs. The data set includes, in total, 432 plant-level observations made in the investigation period of 1993-2006. The data set is an unbalanced panel as dairy plants with contiguous and non-contiguous time series are included. The number of dairy plants changes from year to year, varying
the descrip
2 Similar assumptions may be found in the works of Morrison Paul (2001), Schroeter (1988), Azzam and Pagoulatos (1990). 3 For a more detailed description of the data collection see Békés et al. (2009).
9
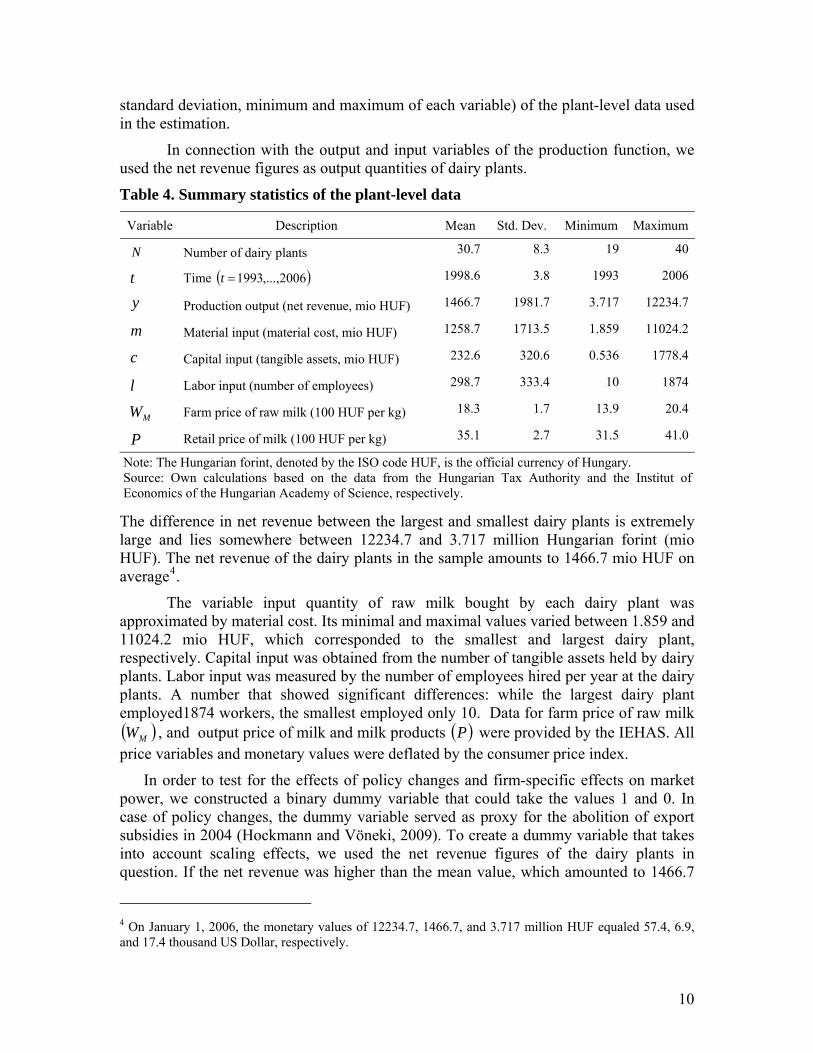
standard deviation, minimum and maximum of each variable) of the plant-level data used in the estimation.
In connection with the output and input variables of the production function, we used the net revenue figures as output quantities of dairy plants.
Table 4. Summary statistics of the plant-level data
Variable Description Mean Std. Dev. Minimum Maximum
N Number of dairy plants 30.7 8.3 19 40
t Time 2006,...,1993t 1998.6 3.8 1993 2006
y Production output (net revenue, mio HUF) 1466.7 1981.7 3.717 12234.7
m Material input (material cost, mio HUF) 1258.7 1713.5 1.859 11024.2
c Capital input (tangible assets, mio HUF) 232.6 320.6 0.536 1778.4
l Labor input (number of employees) 298.7 333.4 10 1874
MW Farm price of raw milk (100 HUF per kg) 18.3 1.7 13.9 20.4
P Retail price of milk (100 HUF per kg) 35.1 2.7 31.5 41.0
Note: The Hungarian forint, denoted by the ISO code HUF, is the official currency of Hungary. Source: Own calculations based on the data from the Hungarian Tax Authority and the Institut of Economics of the Hungarian Academy of Science, respectively.
The difference in net revenue between the largest and smallest dairy plants is extremely large and lies somewhere between 12234.7 and 3.717 million Hungarian forint (mio HUF). The net revenue of the dairy plants in the sample amounts to 1466.7 mio HUF on average4.
The variable input quantity of raw milk bought by each dairy plant was approximated by material cost. Its minimal and maximal values varied between 1.859 and 11024.2 mio HUF, which corresponded to the smallest and largest dairy plant, respectively. Capital input was obtained from the number of tangible assets held by dairy plants. Labor input was measured by the number of employees hired per year at the dairy plants. A number that showed significant differences: while the largest dairy plant employed1874 workers, the smallest employed only 10. Data for farm price of raw milk
, and output price of milk and milk products MW P were provided by the IEHAS. All price variables and monetary values were deflated by the consumer price index.
In order to test for the effects of policy changes and firm-specific effects on market power, we constructed a binary dummy variable that could take the values 1 and 0. In case of policy changes, the dummy variable served as proxy for the abolition of export subsidies in 2004 (Hockmann and Vöneki, 2009). To create a dummy variable that takes into account scaling effects, we used the net revenue figures of the dairy plants in question. If the net revenue was higher than the mean value, which amounted to 1466.7
4 On January 1, 2006, the monetary values of 12234.7, 1466.7, and 3.717 million HUF equaled 57.4, 6.9, and 17.4 thousand US Dollar, respectively.
10
mio HUF, then the dummy variable was set to 1. Using the information on the legal form of the firms, we created three dummy variables to separately capture the effects of being either a private, wholly foreign owned and government enterprise.
6. ESTIMATION RESULTS AND SPECIFICATION TESTING
Concerning the estimation and interpretation of the parameter of market power, a number of additional aspects can be found in other empirical studies. Based on plant-level data, Morrison Paul (2001) came to the conclusion that the parameter of market power has to be a function of, among others, specific variables for the number of cattle buyers, and the expenditures for both cattle procurement and working overtime. Schroeter (1988) modeled the parameter of market power as a general function of exogenous variables whose values vary with changing market conditions. Hockmann and Vöneki (2009) introduced a binary dummy variable to capture effects resulting from the removal of export subsidies at the beginning of 2004 and estimated the parameter of oligopsony power over time.
Based on conclusions of empirical NEIO studies together with developments in the Hungarian dairy industry, we extended the model of oligopsony market behavior introduced in the theoretical section (equations (6) and (7)) and estimated four market structure models. In the first model, the parameter of oligopsony market behavior was set to represent competitive market behavior, consequently/i.e. C was restricted to zero
(Model 1). . In the second model, the parameter C was estimated to be a constant
(Model 2). In Model 3, we used dummy variables to capture various effects from policy changes (PC) over time , exactly from 1993 to 2006, and the change of scale in the production of the enterprises (SE). Finally, instead of considering the scale effect (SE), Model 4 covers effects induced by the legal form of the firm, i.e. private (PE), foreign owned (FE), and government enterprises (GE). For a general comparison of the estimated models, Table 5 lists the summary of the statistical inference from the NLS estimations
T
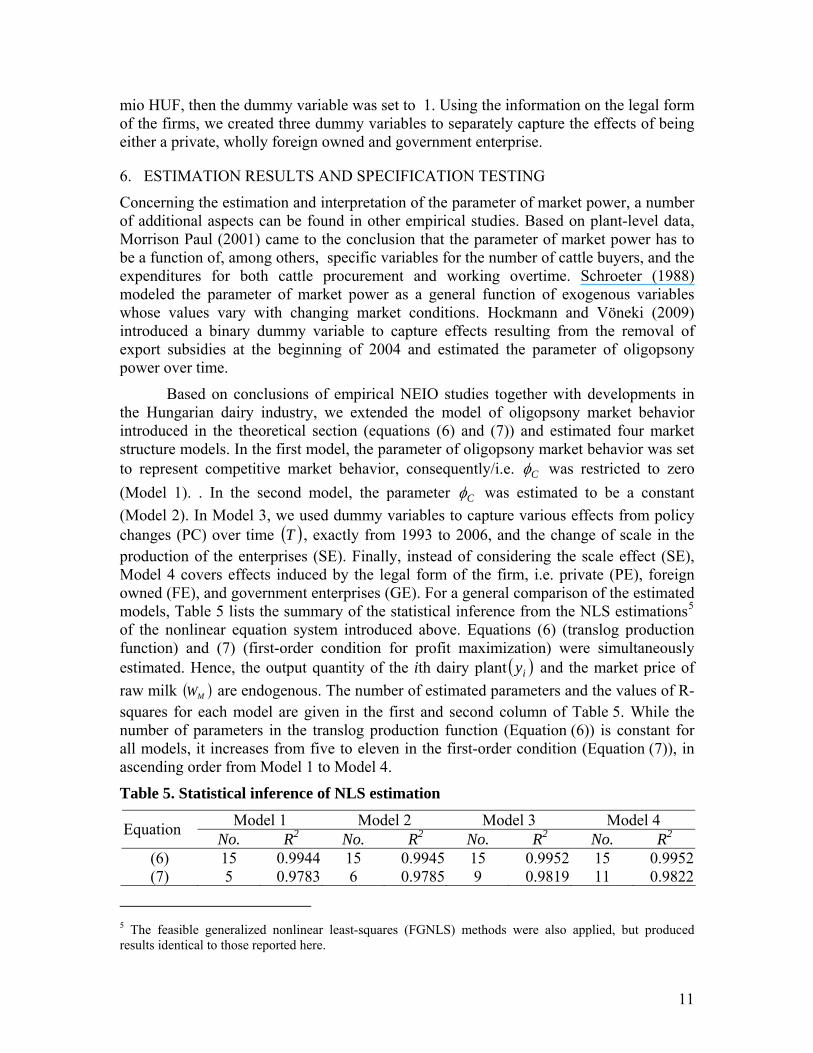
5 of the nonlinear equation system introduced above. Equations (6) (translog production function) and (7) (first-order condition for profit maximization) were simultaneously estimated. Hence, the output quantity of the ith dairy plant iy and the market price of
raw milk are endogenous. The number of estimated parameters and the values of R-squares for each model are given in the first and second column of Table 5. While the number of parameters in the translog production function (Equation (6)) is constant for all models, it increases from five to eleven in the first-order condition (Equation (7)), in ascending order from Model 1 to Model 4.
MW
Table 5. Statistical inference of NLS estimation
Model 1 Model 2 Model 3 Model 4 Equation
No. R2 No. R2 No. R2 No. R2
(6) 15 0.9944 15 0.9945 15 0.9952 15 0.9952(7) 5 0.9783 6 0.9785 9 0.9819 11 0.9822
5 The feasible generalized nonlinear least-squares (FGNLS) methods were also applied, but produced results identical to those reported here.
11
The fit of the estimated models is quite good. The lowest and largest R-square generated by the production function (6) are almost equal and range from 0.9944 for the competition model (Model 1) to 0.9952 for Model 3 and 4, respectively. The lowest and the largest R-square values for the first-order condition (7) are 0.9783 in Model 1 and 0.9822 in Model 4. Thus, altogether, Model 4 performs slightly better.
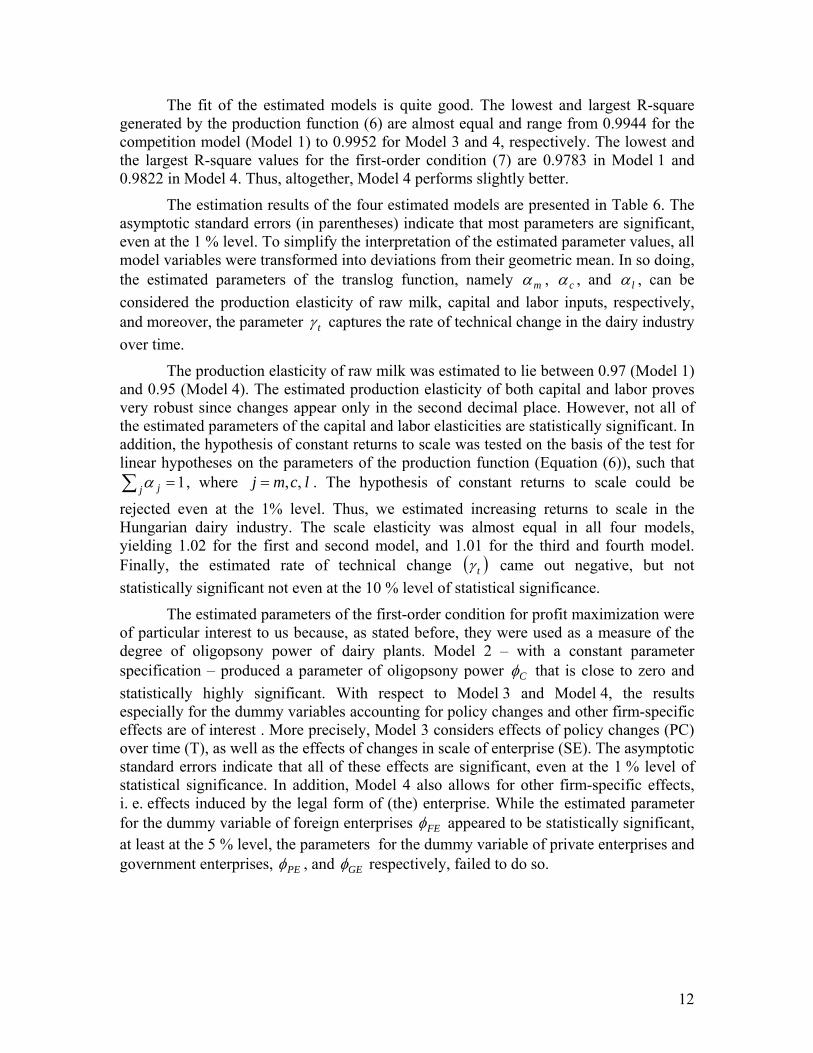
The estimation results of the four estimated models are presented in Table 6. The asymptotic standard errors (in parentheses) indicate that most parameters are significant, even at the 1 % level. To simplify the interpretation of the estimated parameter values, all model variables were transformed into deviations from their geometric mean. In so doing, the estimated parameters of the translog function, namely m , c , and l , can be
considered the production elasticity of raw milk, capital and labor inputs, respectively, and moreover, the parameter t captures the rate of technical change in the dairy industry
over time.
The production elasticity of raw milk was estimated to lie between 0.97 (Model 1) and 0.95 (Model 4). The estimated production elasticity of both capital and labor proves very robust since changes appear only in the second decimal place. However, not all of the estimated parameters of the capital and labor elasticities are statistically significant. In addition, the hypothesis of constant returns to scale was tested on the basis of the test for linear hypotheses on the parameters of the production function (Equation (6)), such that
1 j j , where . The hypothesis of constant returns to scale could be
rejected even at the 1% level. Thus, we estimated increasing returns to scale in the Hungarian dairy industry. The scale elasticity was almost equal in all four models, yielding 1.02 for the first and second model, and 1.01 for the third and fourth model. Finally, the estimated rate of technical change
lcmj ,,
t came out negative, but not
statistically significant not even at the 10 % level of statistical significance.
The estimated parameters of the first-order condition for profit maximization were of particular interest to us because, as stated before, they were used as a measure of the degree of oligopsony power of dairy plants. Model 2 – with a constant parameter specification – produced a parameter of oligopsony power C that is close to zero and
statistically highly significant. With respect to Model 3 and Model 4, the results especially for the dummy variables accounting for policy changes and other firm-specific effects are of interest . More precisely, Model 3 considers effects of policy changes (PC) over time (T), as well as the effects of changes in scale of enterprise (SE). The asymptotic standard errors indicate that all of these effects are significant, even at the 1 % level of statistical significance. In addition, Model 4 also allows for other firm-specific effects, i. e. effects induced by the legal form of (the) enterprise. While the estimated parameter for the dummy variable of foreign enterprises FE appeared to be statistically significant, at least at the 5 % level, the parameters for the dummy variable of private enterprises and government enterprises, PE , and GE respectively, failed to do so.
12
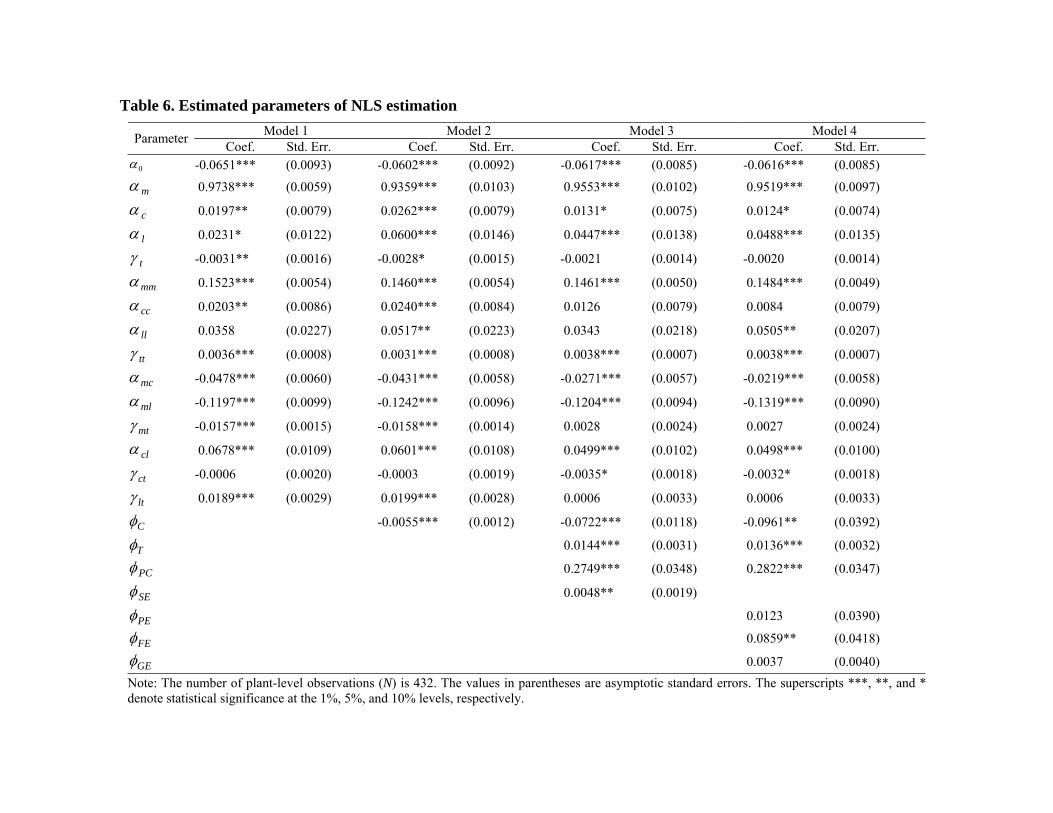
Table 6. Estimated parameters of NLS estimation
Model 1 Model 2 Model 3 Model 4 Parameter
Coef. Std. Err. Coef. Std. Err. Coef. Std. Err. Coef. Std. Err.
0 -0.0651*** (0.0093) -0.0602*** (0.0092) -0.0617*** (0.0085) -0.0616*** (0.0085)
m 0.9738*** (0.0059) 0.9359*** (0.0103) 0.9553*** (0.0102) 0.9519*** (0.0097)
c 0.0197** (0.0079) 0.0262*** (0.0079) 0.0131* (0.0075) 0.0124* (0.0074)
l 0.0231* (0.0122) 0.0600*** (0.0146) 0.0447*** (0.0138) 0.0488*** (0.0135)
t -0.0031** (0.0016) -0.0028* (0.0015) -0.0021 (0.0014) -0.0020 (0.0014)
mm 0.1523*** (0.0054) 0.1460*** (0.0054) 0.1461*** (0.0050) 0.1484*** (0.0049)
cc 0.0203** (0.0086) 0.0240*** (0.0084) 0.0126 (0.0079) 0.0084 (0.0079)
ll 0.0358 (0.0227) 0.0517** (0.0223) 0.0343 (0.0218) 0.0505** (0.0207)
tt 0.0036*** (0.0008) 0.0031*** (0.0008) 0.0038*** (0.0007) 0.0038*** (0.0007)
mc -0.0478*** (0.0060) -0.0431*** (0.0058) -0.0271*** (0.0057) -0.0219*** (0.0058)
ml -0.1197*** (0.0099) -0.1242*** (0.0096) -0.1204*** (0.0094) -0.1319*** (0.0090)
mt -0.0157*** (0.0015) -0.0158*** (0.0014) 0.0028 (0.0024) 0.0027 (0.0024)
cl 0.0678*** (0.0109) 0.0601*** (0.0108) 0.0499*** (0.0102) 0.0498*** (0.0100)
ct -0.0006 (0.0020) -0.0003 (0.0019) -0.0035* (0.0018) -0.0032* (0.0018)
lt 0.0189*** (0.0029) 0.0199*** (0.0028) 0.0006 (0.0033) 0.0006 (0.0033)
C -0.0055*** (0.0012) -0.0722*** (0.0118) -0.0961** (0.0392)
T 0.0144*** (0.0031) 0.0136*** (0.0032)
PC 0.2749*** (0.0348) 0.2822*** (0.0347)
SE 0.0048** (0.0019)
PE 0.0123 (0.0390)
FE 0.0859** (0.0418)
GE 0.0037 (0.0040)
Note: The number of plant-level observations (N) is 432. The values in parentheses are asymptotic standard errors. The superscripts ***, **, and *denote statistical significance at the 1%, 5%, and 10% levels, respectively.
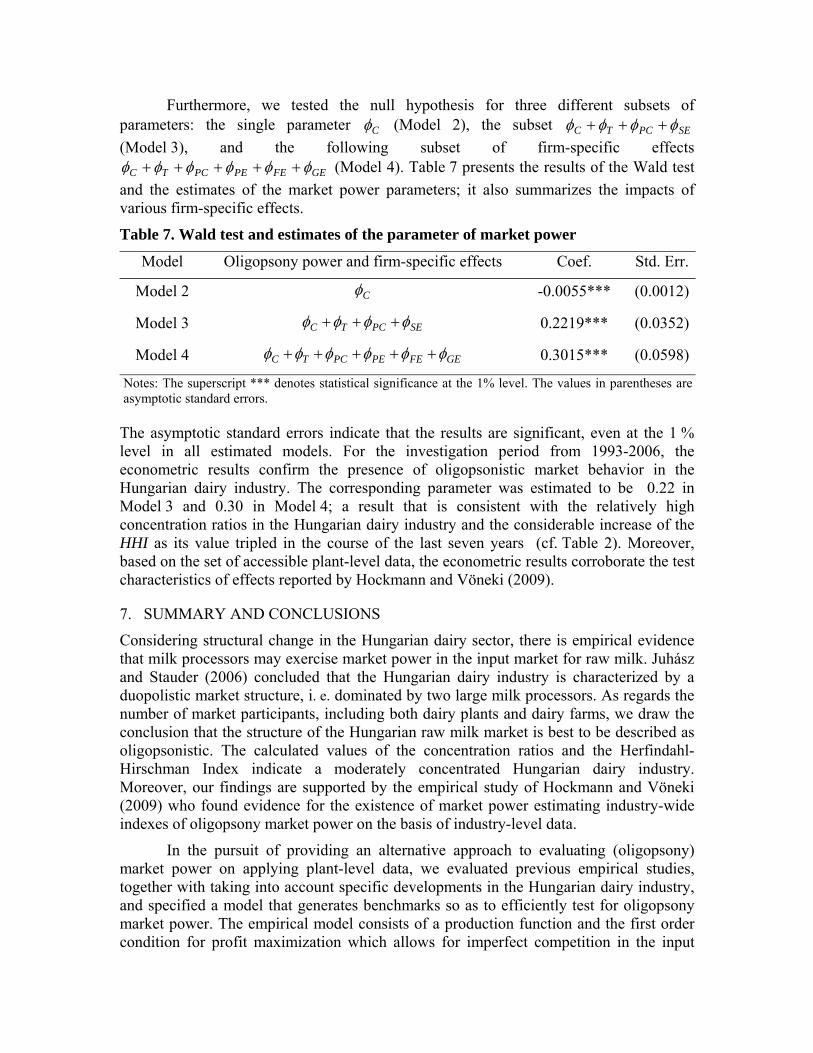
Furthermore, we tested the null hypothesis for three different subsets of parameters: the single parameter C (Model 2), the subset SEPCTC
(Model 3), and the following subset of firm-specific effects
GEFEPEPCTC (Model 4). Table 7 presents the results of the Wald test
and the estimates of the market power parameters; it also summarizes the impacts of various firm-specific effects.
Table 7. Wald test and estimates of the parameter of market power
Model Oligopsony power and firm-specific effects Coef. Std. Err.
Model 2 C -0.0055*** (0.0012)
Model 3 SEPCTC 0.2219*** (0.0352)
Model 4 GEFEPEPCTC 0.3015*** (0.0598)
Notes: The superscript *** denotes statistical significance at the 1% level. The values in parentheses are asymptotic standard errors.
The asymptotic standard errors indicate that the results are significant, even at the 1 % level in all estimated models. For the investigation period from 1993-2006, the econometric results confirm the presence of oligopsonistic market behavior in the Hungarian dairy industry. The corresponding parameter was estimated to be 0.22 in Model 3 and 0.30 in Model 4; a result that is consistent with the relatively high concentration ratios in the Hungarian dairy industry and the considerable increase of the HHI as its value tripled in the course of the last seven years (cf. Table 2). Moreover, based on the set of accessible plant-level data, the econometric results corroborate the test characteristics of effects reported by Hockmann and Vöneki (2009).
7. SUMMARY AND CONCLUSIONS
Considering structural change in the Hungarian dairy sector, there is empirical evidence that milk processors may exercise market power in the input market for raw milk. Juhász and Stauder (2006) concluded that the Hungarian dairy industry is characterized by a duopolistic market structure, i. e. dominated by two large milk processors. As regards the number of market participants, including both dairy plants and dairy farms, we draw the conclusion that the structure of the Hungarian raw milk market is best to be described as oligopsonistic. The calculated values of the concentration ratios and the Herfindahl-Hirschman Index indicate a moderately concentrated Hungarian dairy industry. Moreover, our findings are supported by the empirical study of Hockmann and Vöneki (2009) who found evidence for the existence of market power estimating industry-wide indexes of oligopsony market power on the basis of industry-level data.
In the pursuit of providing an alternative approach to evaluating (oligopsony) market power on applying plant-level data, we evaluated previous empirical studies, together with taking into account specific developments in the Hungarian dairy industry, and specified a model that generates benchmarks so as to efficiently test for oligopsony market power. The empirical model consists of a production function and the first order condition for profit maximization which allows for imperfect competition in the input
market for raw milk. The production technology in the Hungarian dairy industry is represented by a translog production function, which imposes considerably less a priori restrictions on the technology than neoclassical production functions. All of the estimated production elasticities were found to be positive at the sample mean. A result also true of the production elasticities of capital and labor, certainly; but they failed to be highly statistically significant. The hypothesis of constant returns to scale could not be confirmed. Instead, the econometric results revealed increasing returns to scale in the Hungarian dairy industry.
We estimated the parameter of oligopsony market power in the Hungarian dairy industry using plant-level data. The null hypothesis test for perfect competition in the Hungarian dairy industry was rejected. Furthermore, in order to test for the effects of policy changes and firm-specific effects on market power, subsets of relevant parameters were specified. For this reason, in addition to the basic model, three other models were estimated. The estimation yielded highly statistically significant coefficients as regards a effects from policy changes over time and firm-specific effects triggered by changes in scale, and thus produced evidence of the exercise of market power by Hungarian dairy enterprises. At the same time, effects of the legal form of dairy plants led to inconsistent results: while effects of foreign owned enterprises (plants) yielded significant, those of being either a private or government enterprise did not. The econometric results of models, together with the firm-specific effects, provide empirical evidence of oligopsony market power in the input market for raw milk. For the investigation period from 1993 to 2006, the estimated parameter of oligopsony market power amounted to 0.22 and 0.30, respectively. This econometric result is consistent with the oligopsonistic structure of the Hungarian dairy industry and confirms the findings of earlier analyses of the Hungarian market for raw milk.
REFERENCES
Anders, S.M. Imperfect Competition in German Food Retailing: Evidence from State Level Data. Atlantic Economic Journal 36 (2008): 1573-9678.
Appelbaum, E. The Estimation of the Degree of Oligopoly Power, Journal of Econometrics 19 (1982): 287-299.
Azzam, A. M., and E. Pagoulatos. “Testing Oligopolistic and Oligopsonistic Behaviour: An Application to the US Meat-Packing Industry.” Journal of Agricultural Economics 41 (1990): 362-370.
Bakucs, L.Z., Fertö, I., Hockmann, H. and Perekhozhuk, O. Estimating Oligopsony Power in the Hungarian Market for Slaughter Hogs. Eastern European Economics 48 (2010): 64–78.
Békés, G., Harasztosi, P., and B. Muraközy. Firms and Products in International Trade: Data and Patterns for Hungary. Discussion paper. (2009). Available at http://www.econ.core.hu/file/download/mtdp/MTDP0919.pdf
Christensen, L. R., Jorgenson D.W., and L. J. Lau. “Conjugate Duality and the Transcendental Logarithmic Function.” Econometrica 39 (1971): 255-256.
15
Christensen, L. R., Jorgenson D.W., and L. J. Lau. “Transcendental Logarithmic Productions Frontiers.” The Review of Economics and Statistics 55 (1973): 28-45.
Cameron A.C., and P. K. Trivedi. Microeconometrics: Methods and Application. First Edition. Cambridge, New York: Cambridge University Press, 2005.
EUROSTAT. The statistical office of the European Union. Luxembourg. Available at Internet <http://epp.eurostat.ec.europa.eu>. Last update 15.12.2010.
EUROSTAT. Statistical databases of the European Union. Available at: http://epp.eurostat.ec.europa.eu
FAOSTAT. Statistical databases of the Food and Agriculture Organization of the United Nations. Available at: http://faostat.fao.org
Hyde, C.E. and Perloff, J.M. Multimarket market power estimation: the Australian retail meat sector. Applied Economics 30 (1998): 1169-1176.
Hockmann, H., and É. Vőneki. “Collusion in the Hungarian market for raw milk.” Outlook on Agriculture 38 (2009): 39-45.
Juhász, A., and M. Stauder. “Concentration in Hungarian Food Retailing and Supplier-Retailer Relationships.” Poster paper prepared for presentation at the International Association of Agricultural Economists Conference, Gold Coast, Australia, August 12-18, 2006.
Koontz, S. R., and P. Garcia. “Meat-Packer Conduct in Fed Cattle Pricing: Multiple-Market Oligopsony Power.” Journal of Agricultural and Resource Economics 22 (1997): 87-103.
Lopez, R. A., Altobello, M. A., and F. A. Shah. “Amenity Benefits and Public Policy: An Application to the Connecticut Dairy Sector.” Journal of Agricultural and Applied Economics 26 (1994): 485-496
Mellen, C.M., and F. C. Evans. Valuation for M&A: Building Value in Private Companies. Second Edition. Hoboken, New Jersey: John Wiley & Sons Inc, 2010.
Morrison Paul, C. J. “Cost Economies and Market Power: The Case of The U.S. Meat Packing Industry.” The Review of Economics and Statistics 83 (2001): 531-540.
Muth, M. K., and M. K. Wohlgenant. “Measuring the Degree of Oligopsony Power in the Beef Packing Industry in the Absence of Marketing Input Quantity Data.” Journal of Agricultural and Resource Economics 24 (1999): 299-312.
Quagrainie et al. (2003)
OECD. Agricultural Policies in Emerging and Transition Economies. (1999). Paris: OECD Publishing.
Perekhozhuk, O. “Marktstruktur und Preisbildung auf dem ukrainischen Markt für Rohmilch.” Studies on the Agricultural and Food Sector in Central and Eastern Europe 41 (2007). Available at http://www.iamo.de/dok/sr_vol41.pdf
Perekhozhuk, O., Grings, M., and T. Glauben. “Regional-Level Analysis of Oligopsony Power in the Ukrainian Milk Processing Industry: Evidence from Transition Countries.”
16
17
Paper presented at the CEA 43rd Annual Conference, University of Toronto, Ontario, Canada, May 28 - 31, 2009.
Schroeter, J. R. “Estimating the Degree of Market Power in the Beef Packing Industry.” The Review of Economics and Statistics 70 (1988): 158-162.
Schroeter, J., and A. Azzam. “Measuring market power in multi-product oligopolies: the US meat industry.” Applied Economics 22 (1990): 1365-1376.
Stata base reference manual release 10. Volume 2. College Station, Texas: Stata Press, 2009
Suzuki, N., Lenz, J. E., and O. D. Forker. “A Conjectural Variations Model of Reduced Japanese Milk Price Supports.” American Journal of Agricultural Economics 75 (1993): 210-218.
Wann, J. J., and R. J. Sexton. “Imperfect competition in multiproduct food industries with application to pear processing.” American Journal of Agricultural Economics 74 (1992): 980-990.
Weliwita, A., and A. Azzam. “Identifying Implicit Collusion under Declining Output Demand.” Journal of Agricultural and Resource Economics 21 (1996): 235-246.