Produced by Deloitte Center for Financial Services in Central Europe The Banking Sector in Central...
24
Produced by Deloitte Center for Financial Services in Central Europe December 2012 The Banking Sector in Central Europe Performance Overview Romania
Transcript of Produced by Deloitte Center for Financial Services in Central Europe The Banking Sector in Central...

Produced by Deloitte Center for Financial Services in Central EuropeDecember 2012
The Banking Sector in Central EuropePerformance Overview
Romania

2 The Banking Sector in Central Europe Performance Overview

For most Central European countries, the last decade of the 20th Century was when their commercial
banking systems just started to be developed. After the Communist era, banks were short of capital
therefore needed to be commercialised and privatised. The fact that this was taking place at the same
time in most countries has led to significant similarities between most of the region’s banking markets.
The level of assets to GDP is small compared to Western European countries, but this is quickly growing
despite the legacy of the crisis. On the other hand, the operations of CE banks are in many areas more
advanced than those in their parent organisations, because they managed to skip some stages of banking
evolution to move directly to the newest solutions.
Almost five years after the global turmoil of the financial crisis and the worst global economic downturn
of recent times, banks in the region are striving for success in a continually changing industry. The global
banking sector has faced a series of problems since 2008 that have decimated the overall net profit
of the sector to just 10% of its previous level. Central European banks faced the same difficulties of falling
profitability, but the nature of the process differed from country to country.
Among the many factors contributing to the current state of affairs, one of the most important
is the resilience of each market to economic slowdown, which highlights some differences between CE
countries. The Polish, Czech and Slovak banking sectors managed to get through the crisis much more
easily than those in the region’s southern countries, where sector-wide ROE is well below 10% and
in some cases even negative. The key factors that have pushed national banking systems towards
negative profitability are the new regulations and severe taxes introduced in Hungary and some other
countries. The high concentration of the banking sector, where the top 10 banks hold more than 70%
of the sector’s assets, is making cost effectiveness easier to achieve in countries like Croatia and Slovakia.
Differences in the rates of unemployment growth are also causing variations in the level of credit risk and
its impact on banks’ results.
While taking into account their disparities and similarities, the different banking sectors across the region
face the same challenges and continue to offer considerable opportunities, which require careful analysis
and prioritisation to leverage. Part of the challenge for the banks will be how to continue finding suitable
business models that fit current circumstances on both a regional and a national level. Whether they
are looking to recover, restructure, comply, recapitalise or simply to grow, banks in the CE region need
to generate success on multiple fronts.
The Banking Sector in Central Europe - Performance Overview analyses the banking sectors in Bulgaria,
Croatia, the Czech Republic, Hungary, Poland, Serbia, Slovakia and Romania. It focuses on the financial
results of each sector and aims to describe the individual factors impacting the profitability of each
country’s banking industry.
The report seeks to identify the key individual revenue drivers and particular elements that influence
the level of costs that banks have to contend with. It also addresses the question of how heavily those
provisions created to de-risk loans with a high probability of default are impacting upon each sector’s net
profits. We look at the impact of the new banking taxes and other regulations that have been introduced
in some countries.
Understanding the drivers of banks’ financial results is the key to making the right decisions in a con-
stantly changing market environment. We hope our study and the insights from local markets will help
banking executives understand our region better and make better choices in terms of strategic directions.
Zbigniew Szczerbetka
Partner
Financial Services Industry Leader
Deloitte Central Europe
Foreword
The Banking Sector in Central Europe Performance Overview 3

Poland4.3%
3.3%
1.6%
0.0%
1.6%
2.5%
1.7%Czech Republic
Slovakia
Hungary
Romania
1.7%Bulgaria
Croatia
Serbia
Figure R1: 2011/2010 GDP growth in Central Europe
4 The Banking Sector in Central Europe Performance Overview
Central Europe

Eight core CE markets examined. Although the term “Central Europe” conveniently embraces several coun-tries in one phrase, it would be misleading to think that geographical proximity always predicates similarities in terms of banking activity in different states. Instead, the countries across the region comprise a remarkable patchwork of financial sectors at different stages of development, with varying levels of sophistication and multiple approaches to the challenges posed by the financial and economic crisis.
In this report, Deloitte analyses eight leading banking markets from Central Europe including:
• the biggest economies in the region – Poland, the Czech Republic, Slovakia and Hungary
• the largest Balkan countries – Bulgaria, Croatia, Romania and Serbia
Multi-dimensional approach. The analysis includes an in-depth look at these markets via several different sets of lenses. We take a view that is both broad and deep, striving to drill down into several key issues. So the report investigates the current structure and potential for future consolidation activity in each national market. The presence of the state is also taken into the equation, as well as exploring asset and liabili-ties structures. The funding base of each country, which is currently the key element of future growth, is scruti-nised. And we probe profitability trends on several levels of the P&L statement including: (i) the capacity to generate revenue; (ii) cost adjustments and operational efficiency; and (iii) trends in asset quality and the cost of risk. This results in a multi-dimensional picture for all the analysed countries.
Similar, but not homogeneous. Naturally, many parallels could be drawn among countries and their respective banking systems. This is understandable, especially as the forces shaping the developments of private banks are closely related to culminate in: (i) a prominent presence of foreign investors; (ii) market consolidation ahead of levels seen in Western Europe; and (iii) rapid growth experienced during the run-up to the financial crisis. Nevertheless, there are also notable discrepancies in the evolution of CE’s banking sectors such as: (i) the varying size and sophistication of financial intermediation; (ii) different approaches to foreign wholesale funding, ranging from outright dependence to a complete ability to self-fund; and (iii) FX lending levels that range from virtually non-existent to dominating the loanbook.
Slow economic growth is affecting financial institutions’ resultsThe differences between the region’s individual banks have increased since 2008, although the overall trends they face are expected to be similar for all. Yet there are major differences in both the magnitude and timing of events, which are easily visible when comparing the development of local economies. While Poland survived the crisis with a substantial growth in GDP (averaging 3.3% between 2009 and 2011) other countries have faced either a significant decline in their growth rate (Slovakia recorded – 0.9% over the same period) or even recession (such as in Bulgaria, Croatia, the Czech Republic, Hungary, Romania and Serbia). This contrast may be reflected in banks’ future revenues.
Central Europe
The assets of the financial sector in Central Europe have risen each year by an average of 8.0% to reach around EUR 893.4B.
The Banking Sector in Central Europe Performance Overview 5
Poland12%
15%
-2%
7%
0.2%
1%
15%Czech Republic
Slovakia
Hungary
Romania
6%Bulgaria
Croatia
Serbia
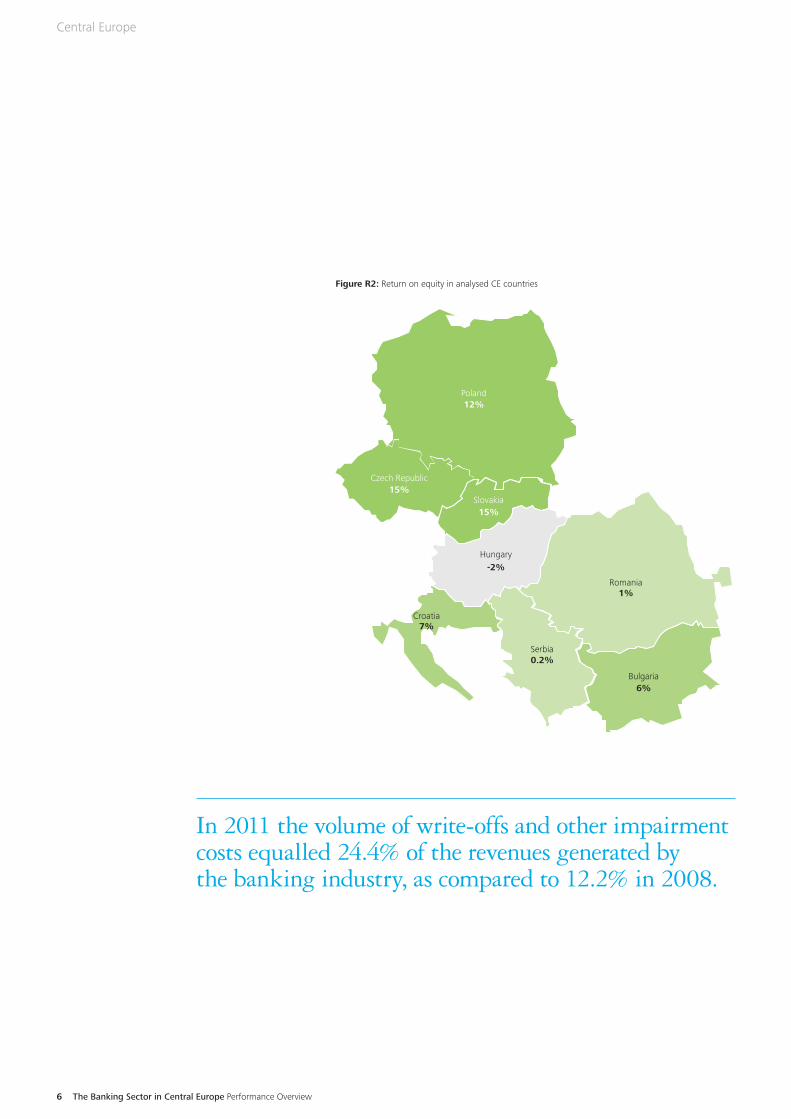
Figure R2: Return on equity in analysed CE countries
In 2011 the volume of write-offs and other impairment costs equalled 24.4% of the revenues generated by the banking industry, as compared to 12.2% in 2008.
6 The Banking Sector in Central Europe Performance Overview
Central Europe
The banking sector is growing but its profitability is sufferingThe position of Central Europe’s financial institutions is relatively good. Since year after the economic melt-down, the assets of the financial sector have risen each year by an average of 8.0% to reach around EUR 893.4B. Interestingly, the value of these aggregated assets of Central Europe’s financial institutions is compa-rable with that of Denmark (at EUR 919.7), and is smaller than those in most western countries. The growth rate in the region amounted to 5.8% in 2011 and was largely accounted for by the largest economies in the region – Poland and the Czech Republic
The overall business activity of the region’s financial institutions is still increasing. While the banks have reacted to the worsening economic situation with a more risk-aware approach, through cost optimisation and (when possible) by deleveraging assets, their rev-enues have continued to rise. However, their profitability is ~40% lower than in 2008. The reason for such a significant decline is explained by the very high level of impairment costs (the gap between an asset’s value on the balance sheet and its recoverable amount). In 2011 the volume of write-offs and other impairment costs equalled 24.4% of the revenues generated by the bank-ing industry, as compared to 12.2% in 2008. Had impair-ment costs remained at the 2008 level, banks’ ROE would now stand at 12.7% - 51.9% higher than today.
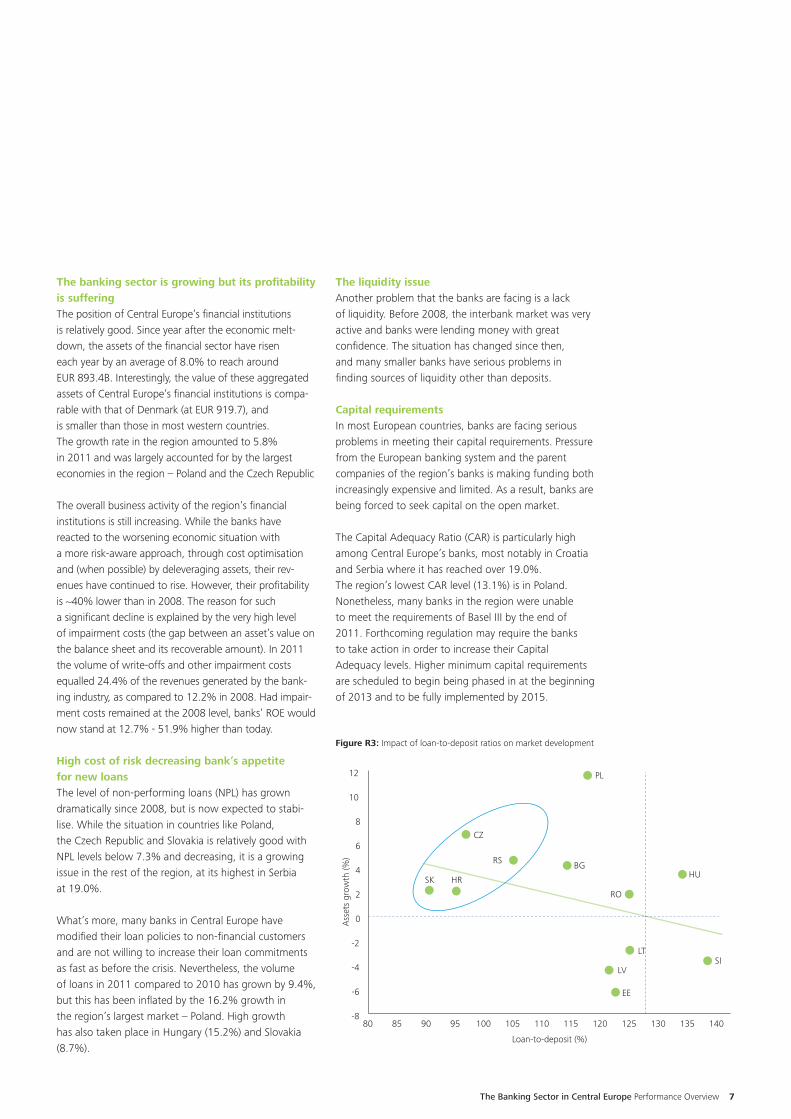
High cost of risk decreasing bank’s appetite for new loans The level of non-performing loans (NPL) has grown dramatically since 2008, but is now expected to stabi-lise. While the situation in countries like Poland, the Czech Republic and Slovakia is relatively good with NPL levels below 7.3% and decreasing, it is a growing issue in the rest of the region, at its highest in Serbia at 19.0%.
What’s more, many banks in Central Europe have modified their loan policies to non-financial customers and are not willing to increase their loan commitments as fast as before the crisis. Nevertheless, the volume of loans in 2011 compared to 2010 has grown by 9.4%, but this has been inflated by the 16.2% growth in the region’s largest market – Poland. High growth has also taken place in Hungary (15.2%) and Slovakia (8.7%).
The liquidity issueAnother problem that the banks are facing is a lack of liquidity. Before 2008, the interbank market was very active and banks were lending money with great confidence. The situation has changed since then, and many smaller banks have serious problems in finding sources of liquidity other than deposits.
Capital requirementsIn most European countries, banks are facing serious problems in meeting their capital requirements. Pressure from the European banking system and the parent companies of the region’s banks is making funding both increasingly expensive and limited. As a result, banks are being forced to seek capital on the open market.
The Capital Adequacy Ratio (CAR) is particularly high among Central Europe’s banks, most notably in Croatia and Serbia where it has reached over 19.0%. The region’s lowest CAR level (13.1%) is in Poland. Nonetheless, many banks in the region were unable to meet the requirements of Basel III by the end of 2011. Forthcoming regulation may require the banks to take action in order to increase their Capital Adequacy levels. Higher minimum capital requirements are scheduled to begin being phased in at the beginning of 2013 and to be fully implemented by 2015.
Figure R3: Impact of loan-to-deposit ratios on market development
12
10
8
6
4
2
0
-2
-4
-6
-8
BG
PL
CZ
HRSK
RO
RS
HU
SI
Loan-to-deposit (%)
Ass
ets
grow
th (%
)
LV
EE
LT
80 120100 14090 13011085 12510595 135115
The Banking Sector in Central Europe Performance Overview 7
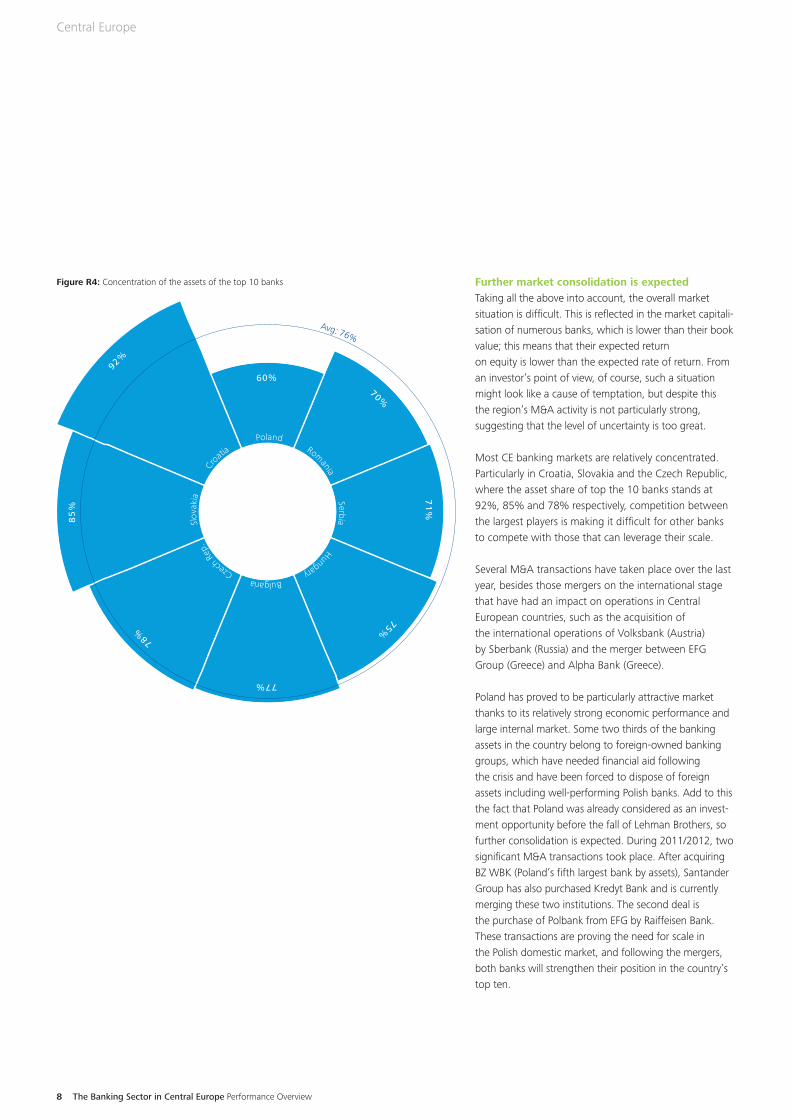
Further market consolidation is expectedTaking all the above into account, the overall market situation is difficult. This is reflected in the market capitali-sation of numerous banks, which is lower than their book value; this means that their expected return on equity is lower than the expected rate of return. From an investor’s point of view, of course, such a situation might look like a cause of temptation, but despite this the region’s M&A activity is not particularly strong, suggesting that the level of uncertainty is too great.
Most CE banking markets are relatively concentrated. Particularly in Croatia, Slovakia and the Czech Republic, where the asset share of top the 10 banks stands at 92%, 85% and 78% respectively, competition between the largest players is making it difficult for other banks to compete with those that can leverage their scale.
Several M&A transactions have taken place over the last year, besides those mergers on the international stage that have had an impact on operations in Central European countries, such as the acquisition of the international operations of Volksbank (Austria) by Sberbank (Russia) and the merger between EFG Group (Greece) and Alpha Bank (Greece).
Poland has proved to be particularly attractive market thanks to its relatively strong economic performance and large internal market. Some two thirds of the banking assets in the country belong to foreign-owned banking groups, which have needed financial aid following the crisis and have been forced to dispose of foreign assets including well-performing Polish banks. Add to this the fact that Poland was already considered as an invest-ment opportunity before the fall of Lehman Brothers, so further consolidation is expected. During 2011/2012, two significant M&A transactions took place. After acquiring BZ WBK (Poland’s fifth largest bank by assets), Santander Group has also purchased Kredyt Bank and is currently merging these two institutions. The second deal is the purchase of Polbank from EFG by Raiffeisen Bank. These transactions are proving the need for scale in the Polish domestic market, and following the mergers, both banks will strengthen their position in the country’s top ten.
Figure R4: Concentration of the assets of the top 10 banks
70%
71
%
60%
78%
75%
92%
77%
85
%
Romania
SerbiaPoland
Czec
h Re
p. Hungary
Croati
a
Bulgaria
Slov
akia
Avg: 76%
8 The Banking Sector in Central Europe Performance Overview
Central Europe

In other Central-European countries, meanwhile, a lack of any large scale foreign interest has meant that banking transactions have mainly involved the divest-ment or winding up of smaller subsidiaries by larger Western-European banking groups.
Yet it is expected that M&A activity will increase in years to come. Firstly, international players will continue to leave due to their strategic refocus and the limited opportunities for them to gain the scale needed to fulfil their potential in the region. Secondly, there are still too many universal banks in most CE countries. This will result in further sector consolidation as the leading players strengthen their positions. Thirdly, we expect a heavy wave of asset deleveraging by the larger players, involving NPL and non-core loan portfolios, which might take place as a direct sale, albeit one with a complex structure.
Business model optimisationRecession in the financial markets has forced banks to seek savings opportunities in all areas of their opera-tions. As a result, banks are increasingly recognising the lower costs involved in leveraging existing customers rather than attracting new ones, largely through increas-ing their satisfaction with products and services. As a result, customer loyalty levels are increasing.
At the same time banks, are investing in new technolo-gies, upgrading existing core systems and hiring teams of young professionals to create products to attract a younger, more sophisticated customer group that understands and uses mobile technology, even though they are not generating high revenues
This makes the current situation even more interesting – while the banks are cutting costs, they are also simultaneously reaching for two very different groups of customers.
Competition through innovationIn recent years, some fascinating product innovations have been introduced and popularised. Interestingly, at a time when innovation may dictate whether or not banks will survive, only a few of these were actually introduced by financial institutions. This is because not just non-banking but even non-financial companies are becoming increasingly active within the financial services market, forcing incumbents to revise their business
models to become more flexible, either by increasing the level of innovation within the organisation or by cooperating with third parties in virtually every area. Since the banking ratio (the proportion of the popula-tion using banking services) in some of the region’s countries still shows scope for improvement, this is creating an opportunity for financial institutions both to attract new customers and to improve customer satisfaction.
Regardless of industry, innovation requires a top-down approach. Company leaders need to provide a roadmap for employees and encourage out-of-the-box thinking that drives ideas in terms both of new products and areas for improvement within the organisation’s busi-ness processes. Not only does this approach improve efficiency, it also motivates teams and has a direct positive impact on the quality of services.
Even in the highly regulated banking sector, it is possible to work with companies from numerous other industries to address various areas of the business. Global con-cepts and ideas such as Groupon Now, Foursquare, Square, Cardlytics and MoneyAisle show the kinds of opportunity that are still available.
Moreover, innovation should include banks’ core systems. Many of these are still not meeting the needs of a changing market and are restricting the potential development of new opportunities. Investments in this area will generate long-term benefits, including an enhanced ability to assess customer needs and expecta-tions so enabling banks to tailor products more precisely.
Customer-centricityIn order to win new customers and retain existing ones, banks need to understand and address the changing needs and expectations of their customers. A wider range of products, high-quality innovative services and transpar-ency together provide a strong basis for competitive advantage, a foundation stone of customer satisfaction and, in the long term, a powerful driver of loyalty.
M&A activity will increase in years to come.
The Banking Sector in Central Europe Performance Overview 9

A recent report, “Setting a new course: The customer experience challenge facing Central Europe’s retail banks”, which was published by Deloitte based on a survey carried out by TNS Global in Poland, the Czech Republic, Slovakia, Hungary and Romania, helps to pin-point this key issue.
It represents a significant move away from the business model of the past, in which revenues were derived through transaction fees and banks were largely content to see customers “churn” from one provider to the next. Today, therefore, banks are making investments in quality to improve customer loyalty at the same time as reducing risk through more robust approaches to credit-process design and operational excellence.
In this process, the experience of other European banks can prove to be particularly beneficial. Regional financial institutions understand and benchmark the business cases of other institutions and can avoid the problems encountered by pioneers.
What next?The banking market is becoming more and more challenging, and banks must take a series of key actions to build sustainable competitive advantage.
The traditional sources of income for banks are becom-ing much more restricted than before the crisis:
• The availability of mortgages is limited due to prob-lems with long-term financing
• Consumer finance and SME lending are weak, due to the high risks involved that result from slow economic growth and growing unemployment
• Revenues from deposits have significantly decreased as a result of the high cost of liquidity and intense competition for deposits in those markets with high loan-to-deposit ratios
• Transactional fees are gradually decreasing as custom-ers make the shift towards electronic banking, where services are much less costly
As a result, banks are seeking other sources of income and trying to increase their cross-sell ratios as a means of improving the falling revenues they make from each individual customer.
In most countries in the region, the penetration of banking services is very high, leaving limited room for further organic growth. The banks therefore have to concentrate on improving service quality in order to secure the loyalty of existing customers. The best way to do this is to understand customer needs and, most important, the possible future changes that will take place. Deep understanding of customer needs and addressing them in the right way makes customers willing to pay more for their banking services, because they appreciate the value they deliver.
It is expected that the next generations of customers will be tech-savvy; the banks will have to meet their needs in order to build the customer base of the future, while retaining those “traditional” customers who still gener-ate a significant share of their profits.
Growing competition from non-financial companies is another issue. If they take no action, the banks may become mere cash and liquidity providers while other areas will be served by external companies.
10 The Banking Sector in Central Europe Performance Overview
Central Europe
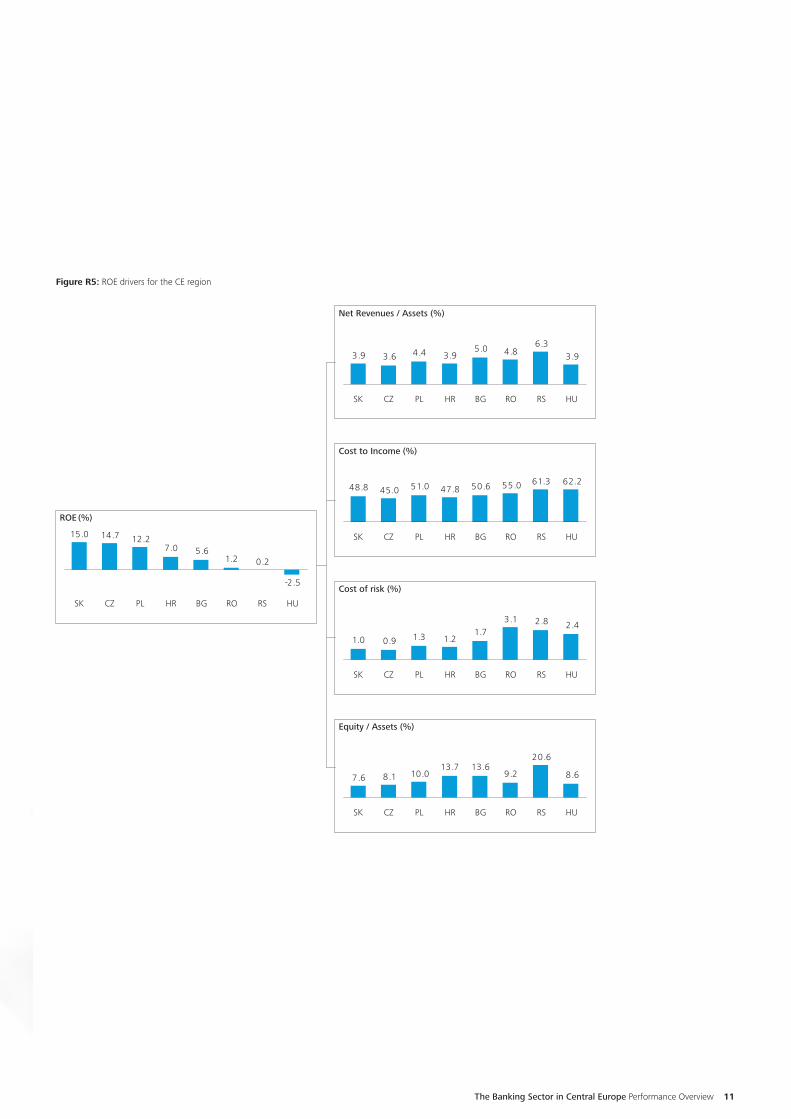
Figure R5: ROE drivers for the CE region
ROE (%)
Net Revenues / Assets (%)
Cost to Income (%)
Cost of risk (%)
Equity / Assets (%)
-2.5
0.21.25.67.0
12.214.715.0
HURSROBGHRPLCZSK
8.6
20.6
9.213.613.7
10.08.17.6
HURSROBGHRPLCZSK
3.96.3
4.85.03.94.43.63.9
HURSROBGHRPLCZSK
62.261.355.050.647.851.045.048.8
HURSROBGHRPLCZSK
2.42.83.11.7
1.21.30.91.0
HURSROBGHRPLCZSK
The Banking Sector in Central Europe Performance Overview 11

Romania
Contacts
12 The Banking Sector in Central Europe Performance Overview
Oana Petrescu Partner Financial Services Industry Country Leader in Romania [email protected]

Economic outlookIn 2009 and 2010 years, the Romanian economy underwent a painful readjustment due to a sharp correction in domestic demand. Romania’s GDP decreased by 7.1% in 2009 and in 2010 by 1.3%. Although recovery flickered the following year, this was export-driven leaving other sectors of the economy still under stress. As a result, the pace of growth stayed below its potential and was unevenly distributed between sectors. The resulting economic woes can also be felt on a wider scale as the same pattern of under-performance may also be observed among neighbour-ing countries. An interesting point comes from an analysis of unemployment. Despite a decrease of GDP in 2010, the unemployment rate decreased from 7.8% in 2009 to 7.0% in 2010 and 5.1% in 2011.
The statistics for Romania put the number of households at 8.5M, making the Romanian market quite large compa- red to other CE countries, with the potential to achieve attractive economies of scale. Customers in the second and fourth quintiles had monthly incomes of EUR 1.7K and EUR 3.3K respectively, meaning the Romanian population is relatively poor compared to other CE countries The Gini coefficient stood at 33.3, the highest level among CE countries. This shows that there are large
differences in income between customer segments, meaning that banks need to tailor their approach to the differing needs of different customer groups
A closer look at the profitability of banks operating in Romania illustrates the impact of the soaring cost of risk, which jumped to 3.1% in 2011 and showed an annual growth rate of 26% from 2008 to 2011. This is the main reason behind the negative profitability of 2011. Other elements of the equation showed much greater stability – yields on assets expanded slightly, while the cost to income ratio remained flat.
The Romanian population totals 21.4M, one of the largest in the region. This group includes non-adults, however, meaning that banks’ total addressable market is 17.3M - but the penetration of banking services is very low and stands at just 40%. Two key issues affect banking penetration in Romania. The first is connected with the geographical distribution of the population, given that 44% of people live in non-urban areas. Second, the relative lateness of Romania’s economic transformation and access to the EU mean that the Romanian banking sector is at an earlier stage of development than most.
Romania
201020092008 20112009 201120102008 2009 20102008 2011
GDP(Real Growth, %)
HCPI (annual avg. index, base=2005)
Unemployment rate (national method., annual avg., %)
Figure RO1: Macroeconomic indicators
143
135
127121
80
90
100
110
120
130
140
150
160
170
0
2
4
6
87.8%
4.4%
5.1%
7.0%
-8
-6
-4
-2
0
2
4
6
8
10
-6.6%
7.3%
2.5%
-1.6%
The Banking Sector in Central Europe Performance Overview 13
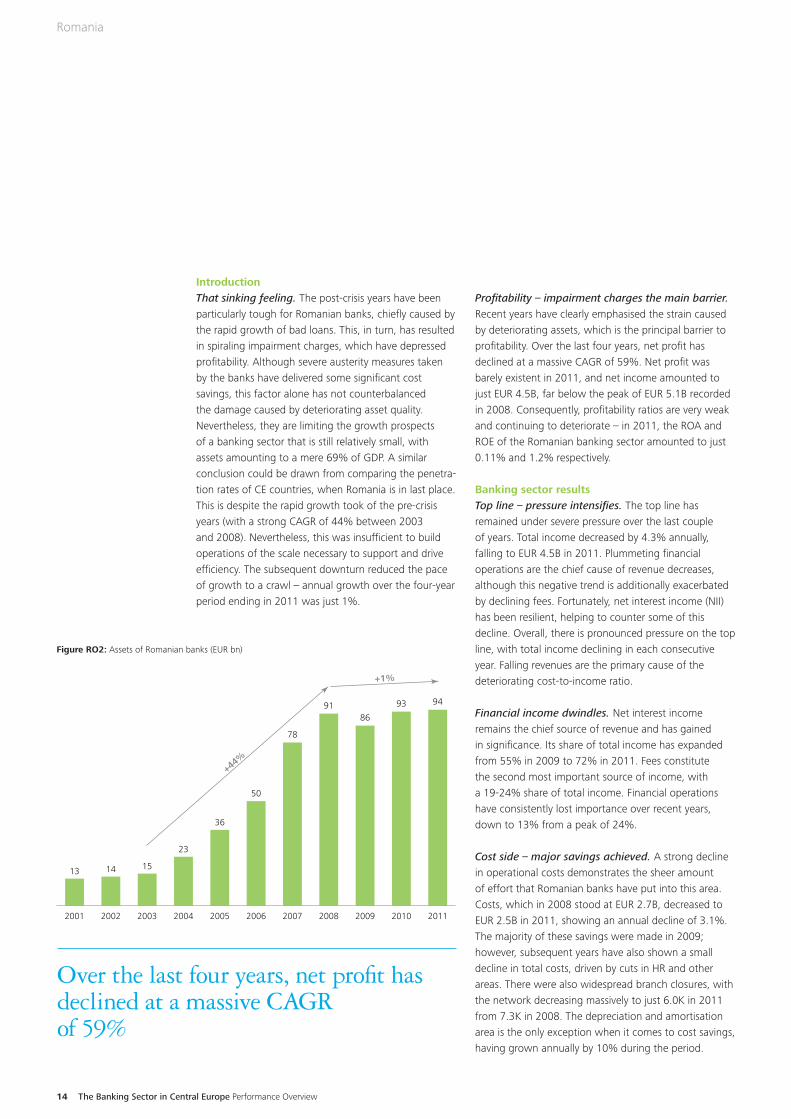
IntroductionThat sinking feeling. The post-crisis years have been particularly tough for Romanian banks, chiefly caused by the rapid growth of bad loans. This, in turn, has resulted in spiraling impairment charges, which have depressed profitability. Although severe austerity measures taken by the banks have delivered some significant cost savings, this factor alone has not counterbalanced the damage caused by deteriorating asset quality. Nevertheless, they are limiting the growth prospects of a banking sector that is still relatively small, with assets amounting to a mere 69% of GDP. A similar conclusion could be drawn from comparing the penetra-tion rates of CE countries, when Romania is in last place. This is despite the rapid growth took of the pre-crisis years (with a strong CAGR of 44% between 2003 and 2008). Nevertheless, this was insufficient to build operations of the scale necessary to support and drive efficiency. The subsequent downturn reduced the pace of growth to a crawl – annual growth over the four-year period ending in 2011 was just 1%.
Profitability – impairment charges the main barrier. Recent years have clearly emphasised the strain caused by deteriorating assets, which is the principal barrier to profitability. Over the last four years, net profit has declined at a massive CAGR of 59%. Net profit was barely existent in 2011, and net income amounted to just EUR 4.5B, far below the peak of EUR 5.1B recorded in 2008. Consequently, profitability ratios are very weak and continuing to deteriorate – in 2011, the ROA and ROE of the Romanian banking sector amounted to just 0.11% and 1.2% respectively.
Banking sector resultsTop line – pressure intensifies. The top line has remained under severe pressure over the last couple of years. Total income decreased by 4.3% annually, falling to EUR 4.5B in 2011. Plummeting financial operations are the chief cause of revenue decreases, although this negative trend is additionally exacerbated by declining fees. Fortunately, net interest income (NII) has been resilient, helping to counter some of this decline. Overall, there is pronounced pressure on the top line, with total income declining in each consecutive year. Falling revenues are the primary cause of the deteriorating cost-to-income ratio.
Financial income dwindles. Net interest income remains the chief source of revenue and has gained in significance. Its share of total income has expanded from 55% in 2009 to 72% in 2011. Fees constitute the second most important source of income, with a 19-24% share of total income. Financial operations have consistently lost importance over recent years, down to 13% from a peak of 24%.
Cost side – major savings achieved. A strong decline in operational costs demonstrates the sheer amount of effort that Romanian banks have put into this area. Costs, which in 2008 stood at EUR 2.7B, decreased to EUR 2.5B in 2011, showing an annual decline of 3.1%. The majority of these savings were made in 2009; however, subsequent years have also shown a small decline in total costs, driven by cuts in HR and other areas. There were also widespread branch closures, with the network decreasing massively to just 6.0K in 2011 from 7.3K in 2008. The depreciation and amortisation area is the only exception when it comes to cost savings, having grown annually by 10% during the period.
20092008 201120102007200620052004200320022001
+44%
+1%
9493
8691
78
50
36
23
151413
Figure RO2: Assets of Romanian banks (EUR bn)
Romania
Over the last four years, net profit has declined at a massive CAGR of 59%
14 The Banking Sector in Central Europe Performance Overview

4.85.25.85.6
55.051.651.252.9
344
2
17171615
9101110
7,3756,0466,1706,425
49494948 37.437.237.437.7
136
17
1. Return on end period equity2. Including depreciation
20092008 2010 2011
20112008 2009 2010
2008 20102009 2011
2008 2009 2010 2011
20092008 20112010
2008 2009 2010 2011
20102008 2009 2011
2008 2009 2010 20112008 20102009 2011
-5%
-4%
-6%
+0%+1% +1%
-59%
+26%
+2%
ROE1 (%) Cost to Income2 (%)
Cost of Risk/Loans (%)
Equity/Loans (%)
Net revenue/Assets (%)
Personal exp./Op. costs (%)
# of branch
Revenues/Loans (%)
Operating costs/FTE (EURk)
Revenues
Costs
Equity
Figure RO3: ROE drivers
The Banking Sector in Central Europe Performance Overview 15

Above average density. Despite a decrease in terms of number of branches, the banking network in Romania remains quite well-developed compared to other countries in the region. Romania is among a group of countries (including Bulgaria, Latvia and Poland) where the number of bank branches per 100K inhabitants is between 30 and 40. This is mostly caused by the demographic profile of Romania, which necessitates building branches close to many people living in non-urban areas. ATM statistics are somewhat less advantageous, although the country is in the middle of the CE pack. Overall, Romanian customers enjoy relatively good proximity to banking services, which is partially the result of the country’s lower-than-average market consolidation.
For 93% of Romanian customers, branches are still a major channel for building the banking relationship, although they also use the Internet or a mix of branch- based and Internet services. This accounts for the high emphasis customers place on all aspects of direct
interaction with their bank at branch level, and the low impact on satisfaction that stems from Internet, mobile and call centre services. Despite a significant overall reduction in branch numbers in 2010-11, the top three Romanian banks by number of customers opened new branches in 2011, highlighting direct interaction as the primary channel for the customer relationship. 68% of customers who use Internet banking services, either exclusively or in parallel with the branches, are aged between 15 and 35, sending a clear signal that once a new technology-literate younger generation enters the potential pool of banking customers, on-line services will become increasingly important in terms both of usage frequency and quality expectations.
A closer look at operational cost structures shows that the primary cost category is personnel, contributing a hefty 49% of the total. General and administrative expenses come second, with a 40% share of total expenses in 2011. The remaining 11% of the cost base is attributable to depreciation and amortisation. Recent years (2008 – 2011) showed a similar share of HR expenses within the total.
Operational efficiency – recent decline. At best, the overall balance in terms of cost efficiency remains mixed. Despite improvements resulting from the over-haul of the cost side, the sector’s weak top line has not allowed improvements in efficiency. After some initial gains, falling revenues in 2011 have pushed the cost to income ratio up to 55.0%.
Comparing Romania’s banking sector to other CE countries reveals a smaller overall scale of business. Mediocre productivity is highlighted by such metrics as assets or net revenues per employee, which at EUR 1.4M and EUR 68K per employee respectively are both below average for the region. Personnel costs per head are close to average for the region, highlighting the sector’s weak productivity despite the decreasing headcount and wage deflation.
A look at the individual players indicates the substantial gains that arise from economies of scale. BCR and BRD, by far the two biggest players, both demonstrate superior efficiency as measured by their cost-to-income ratio. Additionally, there is a clear tendency for economies of scale to disappear with reducing size, as smaller players have a substantially smaller revenue pool to exploit.
Romania
Financial operations
Other
Interests
Fees and commissions
Figure RO4: Income structure (EUR bn)
4.5
72%
21%
13%
4.8
71%
19%
15%
5.0
61%
21%
22%
5.1
55%
24%
24%
201020092008 2011
-4.3%
16 The Banking Sector in Central Europe Performance Overview
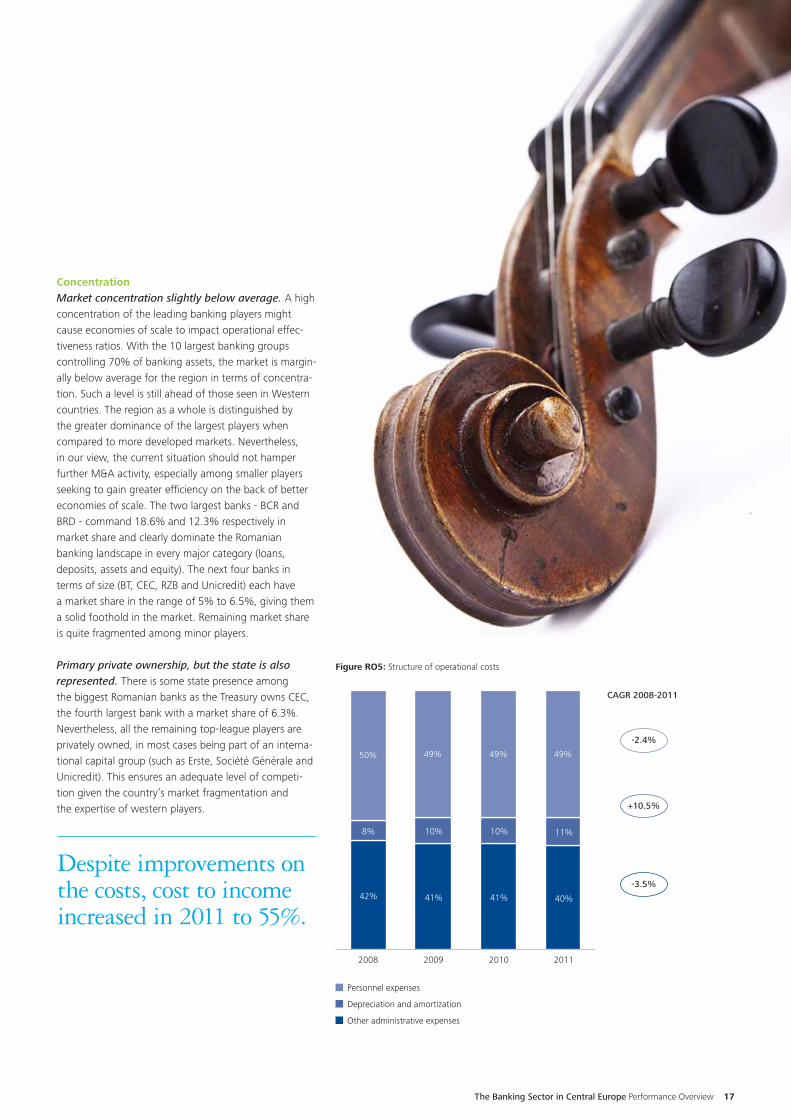
ConcentrationMarket concentration slightly below average. A high concentration of the leading banking players might cause economies of scale to impact operational effec-tiveness ratios. With the 10 largest banking groups controlling 70% of banking assets, the market is margin-ally below average for the region in terms of concentra-tion. Such a level is still ahead of those seen in Western countries. The region as a whole is distinguished by the greater dominance of the largest players when compared to more developed markets. Nevertheless, in our view, the current situation should not hamper further M&A activity, especially among smaller players seeking to gain greater efficiency on the back of better economies of scale. The two largest banks - BCR and BRD - command 18.6% and 12.3% respectively in market share and clearly dominate the Romanian banking landscape in every major category (loans, deposits, assets and equity). The next four banks in terms of size (BT, CEC, RZB and Unicredit) each have a market share in the range of 5% to 6.5%, giving them a solid foothold in the market. Remaining market share is quite fragmented among minor players.
Primary private ownership, but the state is also represented. There is some state presence among the biggest Romanian banks as the Treasury owns CEC, the fourth largest bank with a market share of 6.3%. Nevertheless, all the remaining top-league players are privately owned, in most cases being part of an interna-tional capital group (such as Erste, Société Générale and Unicredit). This ensures an adequate level of competi-tion given the country’s market fragmentation and the expertise of western players.
50% 49% 49% 49%
40%
11%
41%
10%
41%
10%
42%
8%
Figure RO5: Structure of operational costs
2011201020092008
Personnel expenses
Other administrative expenses
Depreciation and amortization
+10.5%
-3.5%
-2.4%
CAGR 2008-2011
Despite improvements on the costs, cost to income increased in 2011 to 55%.
The Banking Sector in Central Europe Performance Overview 17

Asset qualityTroubled assets on the rise. The quality of loans showed a rapid deterioration from 2009 to 2011. The ratio of loans overdue for more than 90 days increased to 11.4% in 2011, a sharp rise on the 5.8% recorded only two years earlier. Although impairment charges have not changed significantly in recent years, they have nevertheless stabilised at a consistently high level. In Romania, provisions for loans overdue for 90+ days constitute 59.9% of the stock. Compared to other CE countries, such a level seems quite comfortable for Romanian banks - the ratio stands out as the second highest in the region.
Impairment charges – the main barrier to profitabil-ity. A deteriorating macroeconomic backdrop and slower growth in the loanbook have brought about a jump in provisions. The cost of risk in 2011 remained at an eye-watering 3.1%, the highest in the region. This is also confirmed by looking at the proportion of impair-ment charges to assets – at 1.9%, again the highest among CE countries. The flip side is that despite a major increase in non-performing loans, these high impairment charges have helped to keep the coverage ratio at a good level. The sheer scale of this growth is highlighted when comparing the 2011 provision level with what has gone before; loan-loss provisions totaled EUR -1.8 in 2011, more than two times the level of 2008.
FundingThe funding gap. Romanian banks have historically been among the least dependent in the region on deposit funding, illustrated by the low share of their liabilities that is represented by deposit funding (a little over 50%). This is noticeably less than the CE average. This is particularly concerning, as since the Lehman collapse, liquidity and stability have been the watch-words for every bank from the smallest local player to the largest global financial institution. Customer deposits score high on both scales, being one of the most solid and reliable sources of funds. Although there is a slight upward trend in the share of deposits in overall funding in Romania, it is barely discernible as household savings remain under pressure to make taking deposits quite difficult. Such circumstances leave the issue of overreli-ance on foreign funding still unresolved.
External funding still indispensable. The Romanian loan to deposit ratio, which in 2011 stood at 125%, is among the highest in the region. Such an elevated level is the legacy of the rapid growth seen from 2005 to 2008. Before 2007, the sector was abundant with liquidity and parent companies pumped in funding without limits. Such a favourable situation allowed the loanbook to grow at a faster rate than deposits. Consequently, the ratio rocketed ahead in the run-up to the financial crisis. The financial turbulence then felt in 2008 accelerated this tendency further, pushing the loan-to-deposit ratio to its peak of 136% that year. It subsequently declined slightly, stabilising at around 125%. Current levels still suggest a lingering need for further rebalancing in the sector.
Romania
201020092008 2011
Impairment costs
Net profit
Figure RO6: Net profit and impairment costs (EUR bn)
-1.8
0.1
-1.8
0.2
-1.6
0.5
-0.9
1.4
High cost of risk decreased net profit of Romanian banking sector.
18 The Banking Sector in Central Europe Performance Overview
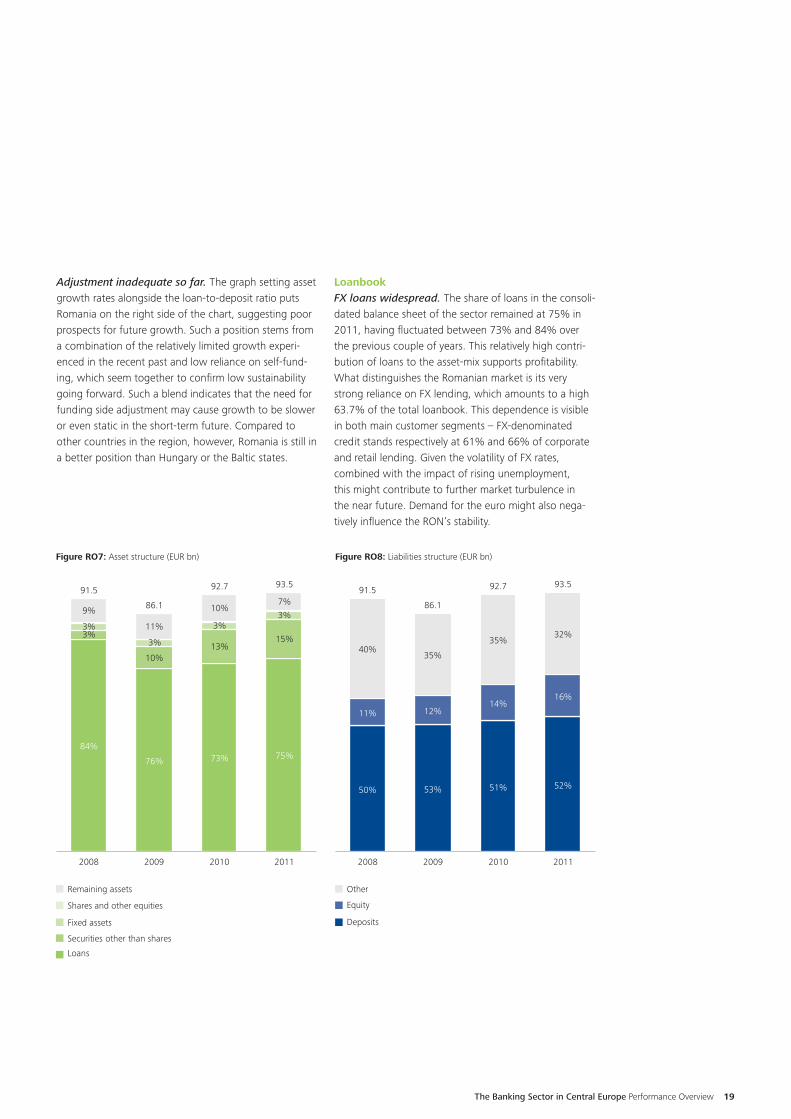
Adjustment inadequate so far. The graph setting asset growth rates alongside the loan-to-deposit ratio puts Romania on the right side of the chart, suggesting poor prospects for future growth. Such a position stems from a combination of the relatively limited growth experi-enced in the recent past and low reliance on self-fund-ing, which seem together to confirm low sustainability going forward. Such a blend indicates that the need for funding side adjustment may cause growth to be slower or even static in the short-term future. Compared to other countries in the region, however, Romania is still in a better position than Hungary or the Baltic states.
LoanbookFX loans widespread. The share of loans in the consoli-dated balance sheet of the sector remained at 75% in 2011, having fluctuated between 73% and 84% over the previous couple of years. This relatively high contri-bution of loans to the asset-mix supports profitability. What distinguishes the Romanian market is its very strong reliance on FX lending, which amounts to a high 63.7% of the total loanbook. This dependence is visible in both main customer segments – FX-denominated credit stands respectively at 61% and 66% of corporate and retail lending. Given the volatility of FX rates, combined with the impact of rising unemployment, this might contribute to further market turbulence in the near future. Demand for the euro might also nega-tively influence the RON’s stability.
2011201020092008
Other
Deposits
Securities other than shares
Equity
93.5
75%
15%
3%
7%
92.7
73%
13%
3%
10%86.1
76%
10%
3%
11%
91.5
84%
3%3%
9%
93.5
52%
16%
32%
92.7
51%
14%
35%
86.1
53%
12%
35%
91.5
50%
11%
40%
201020092008 2011
Shares and other equities
Remaining assets
Loans
Fixed assets
Figure RO7: Asset structure (EUR bn) Figure RO8: Liabilities structure (EUR bn)
The Banking Sector in Central Europe Performance Overview 19
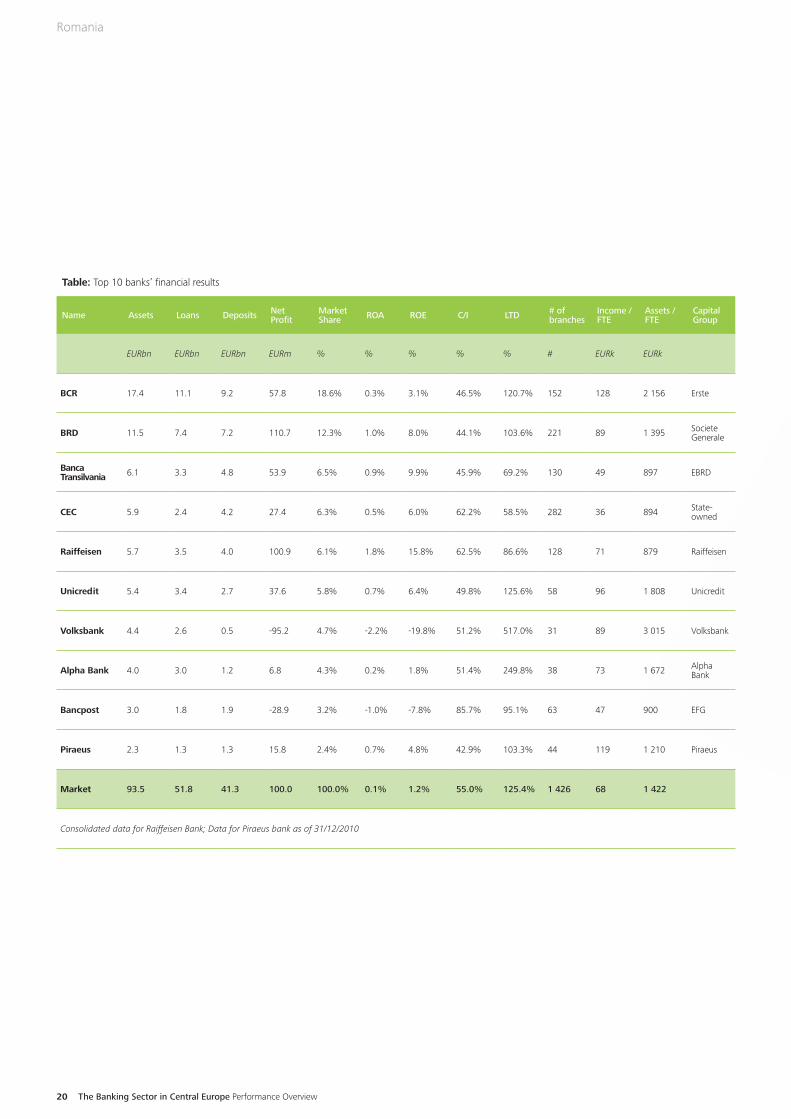
Table: Top 10 banks’ financial results
Name Assets Loans Deposits Net Profit
Market Share ROA ROE C/I LTD # of
branchesIncome / FTE
Assets / FTE
Capital Group
EURbn EURbn EURbn EURm % % % % % # EURk EURk
BCR 17.4 11.1 9.2 57.8 18.6% 0.3% 3.1% 46.5% 120.7% 152 128 2 156 Erste
BRD 11.5 7.4 7.2 110.7 12.3% 1.0% 8.0% 44.1% 103.6% 221 89 1 395 Societe Generale
Banca Transilvania 6.1 3.3 4.8 53.9 6.5% 0.9% 9.9% 45.9% 69.2% 130 49 897 EBRD
CEC 5.9 2.4 4.2 27.4 6.3% 0.5% 6.0% 62.2% 58.5% 282 36 894 State-owned
Raiffeisen 5.7 3.5 4.0 100.9 6.1% 1.8% 15.8% 62.5% 86.6% 128 71 879 Raiffeisen
Unicredit 5.4 3.4 2.7 37.6 5.8% 0.7% 6.4% 49.8% 125.6% 58 96 1 808 Unicredit
Volksbank 4.4 2.6 0.5 -95.2 4.7% -2.2% -19.8% 51.2% 517.0% 31 89 3 015 Volksbank
Alpha Bank 4.0 3.0 1.2 6.8 4.3% 0.2% 1.8% 51.4% 249.8% 38 73 1 672 Alpha Bank
Bancpost 3.0 1.8 1.9 -28.9 3.2% -1.0% -7.8% 85.7% 95.1% 63 47 900 EFG
Piraeus 2.3 1.3 1.3 15.8 2.4% 0.7% 4.8% 42.9% 103.3% 44 119 1 210 Piraeus
Market 93.5 51.8 41.3 100.0 100.0% 0.1% 1.2% 55.0% 125.4% 1 426 68 1 422
Consolidated data for Raiffeisen Bank; Data for Piraeus bank as of 31/12/2010
Romania
20 The Banking Sector in Central Europe Performance Overview

The Banking Sector in Central Europe Performance Overview 21

General•European Banking Association•Economist Intelligence Unit•European Free Trade Association•European Central Bank•Eurostat•International Monetary Fund•“Setting a new course – The Customer Experience
challenge facing Central Europe’s retail banks” report•United Nations Habitat General notes •Distribution of income and income inequalities were
analyzed based on 2010 figures.
Romania•National Bank of Romania•European Central Bank Data Warehouse•Alpha Bank Annual Report 2009, 2010, 2011•Banca Transilvania Annual Report 2009, 2010, 2011•Bancpost EFG Financial Statement 2009, 2010, 2011•BCR Financial Statement 2009, 2010, 2011•BRD Annual Report 2009, 2010, 2011•CEC Bank Financial Presentations 2009, 2010, 2011•Piraeus Annual Report 2009, 2010•Raiffeisen Bank Annual Report 2009, 2010, 2011•Unicredit Financial Statement 2009, 2010, 2011•Volksbank Annual Report 2009, 2010, 2011
22 The Banking Sector in Central Europe Performance Overview
Sources
The new regulatory realities, the demanding economic environment and the growing needs of customers are chang-ing the landscape of the financial institutions sector in a dramatic way. Outlining the real sources of competitive advantage in these rapidly changing times is of upmost importance.
How are strategies and business models changing? How to address regulatory requirements? What are the challenges facing retail banking? In which direction is corporate banking heading? What is the future of insurance business? Where to look for new sources of revenue? How to invest in new technologies wisely? How to finance the activities of financial institutions in Central Europe?
The financial sector, more than ever, needs insights, reliable recommendations, independent opinion and drawing future directions, but most importantly high quality industry data.
Assumptions In response to the growing information needs, Deloitte Central Europe has established the Deloitte Center for Financial Services as an independent research unit, a specialised center for knowledge, the aim of which is to analyse the financial sector, and publish reports and opinions on the financial institutions sector in Central Europe.
The main areas dealt with by the Center’s experts are industry trends, strategies, creating competitive advantages, the impact of regulation on banks, the use of modern technologies and the analysis of customer needs and expecta-tions. An important element of the Center’s work is to collect and present examples of innovative and practical solutions for growth in rapidly changing times. The Center will maintain databases about the market, products, customers, institutions and their financial operational benchmarks, regulations and customers.
It is also equipped with tools, methodologies and competencies to run consumer research projects, develop market sizing models for different products and customer segments, build simulations and forecasts, and run benchmarking of individual institutions against peers.
The Center’s research approach is industry focused, collaborative, and aims to bring a financial services integrated view. Through research, executive dialogue, and industry benchmarking, the Center originates and incubates leading practices surrounding core financial challenges.
www.deloitte.com/pl/cfsCE
Contacts for Deloitte Center for FInancial Services in Central EuropeZbigniew Szczerbetka Managing Director Financial Services Industry Leader in Central Europe [email protected] Michał Dubno Strategy Director [email protected] Sylwia Jackowska Business Communications Manager [email protected]
Center for Financial Services | Central Europe
The Banking Sector in Central Europe Performance Overview 23

This publication contains general information only, and none of Deloitte Touche Tohmatsu Limited, any of its member firms or any of the foregoing’s affiliates (collectively the “Deloitte Network”) are, by means of this publication, rendering accounting, business, financial, investment, legal, tax, or other professional advice or services.
This publication is not a substitute for such professional advice or services, nor should it be used as a basis for any decision or action that may affect your finances or your business. Before making any decision or taking any action that may affect your finances or your business, you should consult a qualified professional adviser. No entity in the Deloitte Network shall be responsible for any loss whatsoever sustained by any person who relies on this publication.
***
“Deloitte” is the brand under which tens of thousands of dedicated professionals in independent firms throughout the world collaborate to provide audit, consulting, financial advisory, risk management, and tax services to selected clients. These firms are members of Deloitte Touche Tohmatsu Limited (DTTL), a UK private company limited by guarantee. Each member firm provides services in a particular geographic area and is subject to the laws and professional regulations of the particular country or countries in which it operates. DTTL does not itself provide services to clients. DTTL and DTTL member firm are separate and distinct legal entities, which cannot obligate the other entities. DTTL and each DTTL member firm are only liable for their own acts or omissions, and not those of each other. Each of the member firms operates under the names “Deloitte”, “Deloitte & Touche”, “Deloitte Touche Tohmatsu”, or other related names. Each DTTL member firm is structured differently in accordance with national laws, regulations, customary practice, and other factors, and may secure the provision of professional services in their territories through subsidiaries, affiliates, and/or other entities.
Deloitte Central Europe is a regional organization of entities organized under the umbrella of Deloitte Central Europe Holdings Limited, the member firm in Central Europe of Deloitte Touche Tohmatsu Limited. Services are provided by the subsidiaries and affiliates of Deloitte Central Europe Holdings Limited, which are separate and independent legal entities. The subsidiaries and affiliates of Deloitte Central Europe Holdings Limited are among the region’s leading professional services firms, providing services through more than 3400 people in more than 30 offices in 17 countries.
Deloitte provides audit, tax, consulting, and financial advisory services to public and private clients spanning multiple industries. With a globally connected network of member firms in more than 150 countries, Deloitte brings world-class capabilities and deep local expertise to help clients succeed wherever they operate. Deloitte’s approximately 200,000 professionals are committed to becoming the standard of excellence.
© 2012 Deloitte Central Europe