
Nuclear Energy in Central Europe '98
500
SI0100149 INIS-SI—01-003 Drustvo jedrskih strokovnjakov Slovenije Nuclear Society of Slovenia V' -A 1 ; : > . / / Nuclear Energy in Central Europe '98 Proceedings Terme Catez, Slovenia 2/32 7 to 10 September 1998
-
Upload
khangminh22 -
Category
Documents
-
view
6 -
download
0
Transcript of Nuclear Energy in Central Europe '98

SI0100149
INIS-SI—01-003
Drustvo jedrskih strokovnjakov SlovenijeNuclear Society of Slovenia
V' -A 1 ; :> . / /
Nuclear Energy inCentral Europe '98
Proceedings
Terme Catez, Slovenia2 /32 7 to 10 September 1998

PLEASE BE AWARE THATALL OF THE MISSING PAGES IN THIS DOCUMENT
WERE ORIGINALLY BLANK

CIP - Katalozni zapis o publikacijiNarodna in univerzitetna knjiznica, Ljubljana
621.039(4-014)(063)(082)621.311.25(497.4 Kr§ko)(063)(082)
NUCLEAR Energy in Central Europe '98 : proceedings, Tenne Catez,Slovenia, 7 to 10 September, 1998 / [organisation] Nuclear Societyof Slovenia = [organizacija] Dru§tvo jedrskih strokovnjakovSlovenija ; [editors Matjaz Ravnik, Igor Jenöiö, Tomaz Zagar]. -Ljubljana : Nuclear Society of Slovenia, 1998
ISBN 961-6207-10-51. Ravnik, Matjaz 2. Jenöiö, Igor 3. Drustvo jedrskih strokovnjakovSlovenije. - 1 . Nuclear Society of Slovenia glej Drustvo jedrskihstrokovnjakov Slovenije
79487744
Editors:Matjaz Ravnik, Igor Jencic, Tomaz Zagar
The texts in this volume were set individually by authors.
Meetings organised by Nuclear Society of Slovenia:• First Meeting of Nuclear Society of Slovenia, Bovec, Slovenia, June 1992• Regional meeting: Nuclear Energy in Central Europe, Present and Prespectives, Portoroz,
Slovenia, June 1993• PSA-PRA and Severe Accidents '94, Ljubljana, Slovenia, April 1994• Annual Meeting ofNSS '94, Rogaska Slatina, Slovenia, September 1994• 2nd Regional Meeting: Nuclear Energy in Central Europe, Portoroz, Slovenia, September 1995• 3rd Regional Meeting: Nuclear Energy in Central Europe, Portoroz, Slovenia, September 1996• 4th Regional Meeting: Nuclear Energy in Central Europe, Bled, Slovenia, September 1997
Po mnenju Ministrstva za znanost in tehnologijo RS st. 415-01-161/98 steje ta publikacija medproizvode, za katere seplacuje 5% davek odprometa.
Nuclear Energy in Central Europe '98

ORGANISER
Nuclear Society of SloveniaJamova 39, SI-1000 Ljubljana, Slovenia
E-mail: nss(g),ijs.si.Tel :+ 386 61 1885 450Fax:+ 386 61 16123 35
SPONSORS
European Nuclear SocietyMinistry of Science and Technology of Slovenia
Institute "Jozef Stefan"American Society of Mechanical Engineers (ASME)
Nuclear Power Plant KrskoSiemens Power Generation GroupSIAP d.o.o., Pesnica pri Mariboru
ENCONET Consulting GmbH, ViennaInstitut za metalne konstrukcije, Ljubljana
''X
Slovenian Agency for Radioactive Waste (ARAO)Slovenian Nuclear Safety Administration
Nuclear Energy in Central Europe '98

PROGRAM COMMITTEE
Matjaz Ravnik, Slovenia, Chair
Helmut Bock,. Austria Josef Misak, Slovak RepublicLeon Cizelj, Slovenia Martin Novsak, Slovenia
Bruno Cvikl, Slovenia Pavel Oblozinsky, IAEAMilan Cercek, Slovenia Frantisek Pazdera, Czech Republic
Francesco D'Auria, Italy Stojan Petelin, SloveniaMilorad Dusic, IAEA Dubravko Pevec, Croatia
Danilo Feretic, Croatia Joze Rant, SloveniaBogdan Glumac, Slovenia Stane Rozman, Slovenia
Miroslav Gregoric, Slovenia Enrico Sartori, ItalyRado Die, Slovenia Mojmir Seliga. Slovak Republic
Alojz Franc Kodre, Slovenia Joze Spiler, SloveniaTeresa Kulikowska. Poland Andrej Stritar, Slovenia
Jure Marn, Slovenia Lazslo Szabados, HungaryLazslo Maroti, Hungary Andrej Trkov, SloveniaBorut Mavko. Slovenia Andrej Umek, Slovenia
Irena Mele, Slovenia Wolfgang Voikenborn, Germany
AWARD COMMITTEE
Alojz Franc Kodre, Slovenia, Chair
Francesco D'Auria, Italy Marijan Jurcevic, Croatia
ORGANISING COMMITTEE
Igor Jencic, Chair
Leon Cizelj Ivan SpilerAndrej Stritar Tomaz Zagar
http;//wwwf2.ijs.si/Mcjt/djs/catez98.html
IV Nuclear Energy in Central Europe'98

EDITORS' FOREWORD
The conference "Nuclear Energy in Central Europe" has become a well-established regularmeeting of scientists and professionals working in the field of nuclear energy in our part of theworld. This year the conference was attended by 132 participants from 16 countries.
The focus of the conference was on two aspects of nuclear energy. By selecting the site ofthe conference in Catez the program committee tried to aim the attention of the participants tothe problems related to power reactors, in particular to Krsko NPP. On the other hand, byselecting the invited speakers and by allocating ample time for the presentations, specialattention was paid to applications of nuclear energy not directly related to power production:nuclear methods in industry, application of reactors in medicine and material research, etc. Theguideline of both aspects was however the same: to give a view over present status and trends ofapplied nuclear science and technology particularly in Slovenia and in other countries of CentralEurope.
The scientific and technical program of the conference included the following subjects:• reactor physics • structural analysis• research reactors • severe accidents• nuclear methods • NPP operation• thermal hydraulics • nuclear waste disposal.
In three days of the conference 70 contributions were presented including 4 invited lectures,33 oral presentations and 33 posters. According to the main idea of the conference the invitedlectures treated two main subjects: status and perspectives of applied nuclear science and recentdevelopments and trends in power reactor technology. The invited lectures gave generalintroduction to particular subjects treated by the presentations in the sections that followed. Thepresentations treated original scientific and technical achievements mainly at high professionallevel. All contributions included in the Proceedings were reviewed by two independent referees.
To motivate young scientists the "Awardfor Young Authors" contest was organised also atthis conference. Ten young authors applied for the contest. The international award committeewhose members were three distinguished scientists and university professors awarded MarkoMaucec and Matjaz Leskovar.
Two panel discussions were organised within the scope of the conference:• Nuclear research and education in Slovenia (introduced and moderated by doc. dr.
Bogdan Glumac) and• Krsko NPP modernization (introduced by Stane Rozman, Krsko NPP general manager).
Both discussions were well attended by the participants of the conference as well as by theguests from the institutions interested in and responsible for these aspects of nuclear energy inSlovenia.
The program committee of the conference and the editors of the proceedings wish to thankagain the participants for their contributions and to the reviewers for implementing high qualitystandards in the review process.
Program Committee ChairmanDr. Matjaz Ravnik
Xuclear Energy in Central Europe '98

00h Nuclear Energy in Central Europe '98i j l l k Termc Cntci, Slovenia, 7 \o 10 September, 15)98
This
D i p l o m a
certifies that the Award for Young Authors was presented to
in the appreciation of outstanding work, effort and enthusiasm shown in the preparationand presentation of the paper
Conceptual Design of Epithermal Neutron Beam for BNCT in the Thermalizing Column of TRIGA Reactor
prof.dr. Alojz Franc KodreChair,
Awards Committee
prof. dr. Matjaz ftavnikChair,
Progarn Committee
Catez, Slovenia, September 10, 1998
/ / \ Nuclear Energy in Central Europe '98it JumcCatez. Slovenia, 7 lo lOSeplembt*, !99N
This
D i p l o m a
certifies that the Award for Young Authors was presented to
in the appreciation of outstanding work, effort and enthusiasm shown in the preparationand presentation of the paper
ESE a 2D Compressible Multiphase Flow Code Developed for MFCI Analysis - Code Description
prof .dr. Alojz Franc KodreChair,
Awards Committee
prof. dr. Matjaz RavnikChair,
Progam Committee
Catez, Slovenia, September 10, 1998
VI Nuclear Energy in Central Europe '98

TABLE OF CONTENTS
Research Reactors 1
Conceptual Design of Epithermal Neutron Beam for BNCT in the ThermalizingColumn of TRIGA ReactorMarko Maucec 3
Nuclear Engineering Aspects of Glioma BNCT Research in ItalyGiorgio Curzio. Marino Mazzini 11
Development and Test of a Miniature Gamma Thermometer to Determine theGamma Dose Rate Inside a Reactor CoreJ. Kizhakkekara, P. Katrik, Helmuth Bock 21
Recent Improvements to TRIGLAV CodeTomaz Zagar, Matjaz Ravnik. Andreja Persic 29
Burn-up TRIGA Mark II Benchmark ExperimentAndreja Persic, Matjaz Ravnik, Tomaz Zagar 35
Characterization of Neutron Flux in the Exposure Channel F19 of the TRIGA MarkII Reactor in LjubljanaEdvard S. Kristof 43
Nuclear Methods 49
Suitability Study of MCNP Monte Carlo Program for Use in Medical PhysicsRobert Jeraj 51
Research at the Tandem AcceleratorMilos Budnar, Primoz Pelicon 59
Plutonium Based Energy Amplifier Testing ConceptVladilen S. Barashenkov, J. Cetnar. Grazyna Domanska, Aleksander Polanski,Andrey N. Sosnin, S. Taczanowski 67
Plasma Response to a Positive Voltage Step Applied to an Anode Immersed in aWeakly Magnetized Discharge Plasma ColumnTomaz Gyergyek, Milan Cercek, Mladen Stanojevic 75
On Possible Contribution of Standing Wave Like Spacer Dynamics in PolymerLiquid Crystals to Quasi-elastic .Cold Neutron Scattering SpectraRenata Jecl, Bruno Cvikl 83
Nuclear Energy in Central Europe '98 VII

Reactor Physics 91
Load Follow Software Development for the Krsko NPP Process ComputerAndrej Trkov, MarjanKromar, BojanZefran 93
SCORPIO - W E R Core Surveillance SystemArne Hornaes, Terje Bodal, Svein Sunde, Karel Zalesky. Miroslav Lehmann, Marek Pecka,Jiri Svarny, Vaclav Krysl, Zdenka Juzova, Anton Sedlak, Milan Semmler 99
Investigating a Possibility to Implement 24-Month Cycle in NPP KrskoTea Bilic, Dubravko Pevec, Tomislav Smuc 107
Analysis of VENUS-3 Benchmark ExperimentIvanKodeli, Enrico Sartori 115
Evaluation of Rod Insertion Issue for NPP KrskoAles Gunstek, Bojan Kurincic 123
Application of the Reactivity Coefficient Method for the Nuclear Design CalculationsMarjanKromar, Andrej Trkov 133
Incorporation of Multi-layer Option Into QAD-CGGP CodeKresimir Trontl, Mile Bace, Tomislav Smuc 139
Thermal Hydraulics 147
RELAP5 Code Validation Using a Medium-size Break LOCA Experiment at the PMK-2 Test FacilityGy. Ézsô'l, Attila Guba, Lâszlo Perneczky, I. Szabö 149
Efficient Uncertainty Analysis Using Optimal Statistical EstimatorAndrej Prosek, BorutMavko 157
Study Supporting the Uncertainty Evaluation in WWER-1000A. Garcia, Jose L. Gago, Francesco D'Auria 165
A 1% Cold Leg SB LOCA Test Simulation on the PMK-2 FacilityIztokParzer, StojanPetelin 173
A Potential of Boiling Water Power Reactors with a Natural Circulation of a CoolantVitaly S. Osmatchkin, I. N. Sokolov 181
Experiences with RELAP5/MOD3.2.1.2 Code Version by Simulation of Loss ofResidual Heat Removal Type Experiments for VVER-440-Type NPPsLåszlo Perneczky 187
Prediction of Void Fraction in Subcooled Flow BoilingStojan Petelin, Bostjan Koncar 195
viu Nuclear Energy in Central Europe '98

Testing the Numerical Method for One-Dimensional Shock TreatmentAndrej Horvat 203
Shape and Stability of the Bubble Moving Through the Viscid Incompressible FluidGregor Cerne. Stojan Petelin, Iztok Tiselj 211
BETHSY ISP-38 Flow Behavior in Hot LegStojan Petelin. Mihael Jurkovic 219
RELAP5 New Steam Generator Model for Krsko NPPSamo Hrvatin. Stojan Petelin, Matija Tuma 227
Structural Analysis 235
Recent Improvements in the Design and Manufacture of LWR FuelMarijan Jurcevic, Dubravko Pevec 237
Trends of Degradation in Steam Generator Tubes of Krsko NPP Before the LastPlanned InspectionLeon Cizelj, Tomaz Dvorsek, Ferdo Androjna 245
Reracking of Fuel Pools, Experience with Improved Codes and Design for ReactorSites with High Seismic LoadsJoachim Banck, Klaus Wirtz 253
The Toughness Requirements for Reactor Pressure Vessel SteelDarko Korosec. Jelena Vojvodic Tuma 261
Numerical Analysis of Branched Cracks in Bi-axial Stress FieldsMarko Kovac, Leon Cizelj 269
PSA & Severe Accidnets 277
The Use of Expert Opinion for Estimation of Component UnavailabilityRomana Jordan Cizelj, Ivo Kljenak 279
Containment Phenomena During a Severe Accident with Reactor Vessel Failure atLow Pressure in a Two-Loop Pressurized Water ReactorIvo Kljenak. Iztok Parzer, Iztok Tiselj 287
Krsko NPP Containment Model using MELCOR 1.8.3.Marjan Delic, Jure Marn ; 295
Improving Software Requirements Specification for Safety-Related Systems Usingthe Fault Tree Developed by an Object-Based MethodMarko Cepin. Bomt Mavko 303
Unclear Energy/ in Central Europe '98 JX

ESE a 2D Compressible Multiphase Flow Code Developed for MFCI Analysis - CodeDescriptionMatjaz Leskovar 311
ESE a 2D Compressible Multiphase Flow Code Developed for MFCI Analysis - CodeValidationMatjaz Leskovar, BorutMavko 319
Connection Between P3 and ORAM Codes with p2o CodeRoman Kocnar, Ivica Basic, Joze Spiler 327
NPP Operation.... 333
Trends in Simulation and the Krsko Full Scope Simulator'Robert Boire, Michael Chatlani 335
EU Nuclear Policy Towards Countries in Central and Eastern EuropeLinda Gunter 345
Twenty Years of Operation of WWER 440/230 Units in Jaslovske BohuniceJozef Tomek 351
Operational and Safety Status of Krsko NPPPredrag Sirola, Darko Kavsek 359
NPP Temelin Instrumentation and Control System Upgrade and VerificationOlgaUbra, Josef Petrlik 365
NPP Krsko Full Scope Simulator ModellingBruno Glaser, Bozidar Krajnc, Joze Spiler, Martin Novsak 373
Nuclear Licensing in SloveniaMatjaz Prah, Joze Spiler, Djordje Vojnovic, Matjaz Pristavec 381
START - Glass Model of PWRJureMarn, Matjaz Ramsak 389
Public Opinion about Nuclear Energy - 1998 PollAndrej Stritar, Radko Istenic , 399
Radiation Protection Courses in the Milan Copic Nuclear Training CentreMatjaz Kozelj, Andrej Stritar 407
NPP Krsko Full Scope Simulator Verification and QualificationBozidar Krajnc, Bruno Glaser, Martin Novsak, Joze Spiler 415
Invited PaperNuclear Energy in Central Europe '98

The Simulator NEK-MFS and its Training StatusTomaz Setnikar, Oton Gortnar, Jelislav Kovacic, Franc Pribozic, Egon Srebotnjak,Andrei Stritar 423
Evaluating Human Actions for a Shutdown PSALeo Shanley, Thomas Naum, Ivica Basic, Igor Fifnja 431
Westinghouse Advanced Safety Analysis Technology for Plant Power UpratingsDidier Rombouts, D. Denil, C. Simon. C. Matthys 439
Environmental Qualification Program for Krsko NPPJanko Cerjak, Peter Klenovsek, Janez Pavsek, Kent.R.Freeland, Srdan Spalj 445
Krsko Modernization Project (introduction to panel discussion)*Stane Rozman 453
Nuclear Waste Disposal 469
A New Approach to the LILW Repository Site SelectionIrenaMele,NadjaZeleznik 471
Liquid Waste Volume Reduction by In-Drum Drying SystemBojan Volaric, MarjanZorko 479
Consolidation of Spent Fuel Rods as an Option to Increase the Capacity of Spent FuelPoolDubravko Pevec, Kresimir Trontl, Ivica Jurcevic 487
Formulation of Natural Convection around Repository for Dual ReciprocityBoundary Element SolutionLeopold Vrankar, Bozo Sarler 495
Uncertainties in Environmental Impact Assessments due to Expert Opinion; CaseStudy: Radioactive Waste in SloveniaBranko Kontic, Matjaz Ravnik 503
Concrete Spent Fuel Storage Casks Dose RatesMileBace, Radomir Jecmenica, Kresimir Trontl 511
Author rndex 519
Viewgraphs of Invited LectureNuclear Energy in Central Europe '98 xi

SI0100086
Nuclear Energy in Central Europe '98
4*1 S S k Terme Catez, September 7 to 10, 1998
Conceptual Design of Epithermal Neutron Beam for BNCT in the Thermalizing Columnof TRIGA Reactor
Marko Maucec"Jozef Stefan" Institute, Reactor Physics DivisionJamova39, POB 3000, 1001 Ljubljana, Slovenia
E-mail: [email protected]
ABSTRACT - The Monte Carlo feasibility study of development of the epithermal neutron beam forBNCT clinical trials in thermalising column (TC) of TRIGA reactor is presented. The investigation ofthe possible use of fission converter as well as the set-up of TRIGA reactor core is performed. Theoptimization of the irradiation facility components is carried out and the configuration with the mostfavorable cost/performance ratio is proposed. The results prove, that a BNCT irradiation facility withperformances, comparable to existing beams throughout the world, could be installed in TC/DC of theTRIGA reactor, quite suitable for the clinical treatments of human patients.
1 Introduction
At least twenty new patients fall ill for brain glioblastoma multiforme (GBM) in Sloveniaevery year. This is an extremely lethal cancer, with no significant advances in therapy in lasttwo decades. Almost all patients die within two years, even with the best efforts usingsurgery, external beam therapy and chemotherapy [1]. But with the prospective of selectiveconcentration and build-up of °B isotope in the tumor tissue, Boron Neutron Capture Therapy(BNCT) proves to be a state-of-the-art approach.
Therefore, the development of irradiation facility for clinical use is almost indispensablealternative to the epithermal neutron beam for "in-vitro" experiments on tumor cells orlaboratory animals, already installed in the radial channel of the "Jozef Stefan" Institute (JSI)TRIGA reactor [2]. A unique reactor configuration, with so called "dry cell" (primarilydevoted for a pool-type storage of a TRIGA reactor spent fuel elements) is an importantadvantage: a space (see Fig. 1) with approx. ground plan dimensions of 3x3 m2 and availableradiation protection, could be appropriate for the patient irradiation room, decreasingsubstantially the costs for the development of the clinical BNCT facility. This contributionpresents the Monte Carlo suitability study of the thermalising column (TC)/dry cell (DC) forepithermal neutron beam installation, with an emphasis on:
1. investigation of potential use of fission converter, as the amplifier of the neutron flux,determination of the burn-up of the fissile material and parameters of cooling system,
2. set-up of the TRIGA reactor core for the irradiation in the TC/DC and3. optimization of the BNCT facility components and recommendation the configuration
with the most favorable cost/performance ratio.The general purpose Monte Carlo code MCNP4B [3] was used for the modeling of the
TRIGA reactor, together with the continuous cross-section libraries ENDF/B-V and ENDF/B-VI and S(a,p) scattering data from ENDF/B-IV.
Nuclear Energy in Central Europe '98

thermal:::column
watef
radiaiichannel:withBNCT : gfajhitefacili^ Teflcctor
themializingcolumn (TC)
concrete
reactor coredry ceil<DC)
Fig. 1 The 3D Monte Carlo model of the TRIGA Mark II research reactor (SABRINA GUI interface)
2 Set-up of the TRIGA reactor core
To affirm a fast and efficient convergence of a fission source spatial distribution, the core(Fig. 2) was modeled as cylindrical as possible. The fuel elements (12% enriched) wereconcentrated in F ring in order to enhance the neutron flux in a TC/DC. Core with 57 freshfuel elements and keff of 1.0034±0.0007, provide very good convergence of fission neutronspatial distribution as well as kefr (see Fig. 3).
safetyrot!
rcyuJating /rtxi " J
compensatingrod 3
tnmsieutrod
fueldement
graphite
1.005
1.000
0.995
0.985
0.980
kcfr three-combined estimator
I MO uoo
Criticality calculation active cycles
Fig. 2 Radial cross-section of the TRIGAreactor core, adjusted for the BNCTin TC/DC (located above)
Fig. 3 Three-combined keff estimatoras a function of criticalitycalculation active cycles
3 Suitability study of fission converter as a neutron flux amplifier
With the small-power TRIGA reactors the recommended therapeutic limit level (>109
n/cm2s) of epithermal (0.4 eV<E<10 keV) neutron flux <X>epj is not easy to achieve withoutsubstantial refurbishment of the thermal column. But it has been proven in [4], that utilizing
Nuclear Energy in Central Europe '98

the fission converter, the satisfactory high epithermal neutron flux with treatment times lessthan 60 rain can be obtained. In my study the fission plate, already existing at US, with 1468g of total U mass, 20% enriched was encountered. It was estimated (for 250 kW reactor powerand approx. 1012 n/cm2s of thermal neutron flux), that even in the most optimistic case ofusing the fission converter for the purpose of BNCT treatments for 10 years, 200 days/yearand 8 h/day the burnup would be less than 0.01%, what is negligible.
The fission heat release in fissile material was estimated to be 2.3 kW (rel. err. <1%) withthe temperature gradient of approx. 13.5 °C/s [6], Considering the treatment time of 60 min(3600 s) the temperature in fissile material would increase for 8800°C, what is almost 10-times above the U upper limit (640°C - [4]). It's obvious that an air-cooling system wouldhave to be installed in order to keep the temperature of the fission converter within the safetylimits.
Two main calculations (with and without fission plate) with the benchmark configurationdescribed in [6] were performed. It is evident from the results in Table 2, that fission plateenhances epithermal neutron flux Ocpi for a factor of 2.4 and specific fast neutrons dose forapprox. 18%. On the other hand the specific gamma dose (Dy/Oepi) in irradiation point (seeFig. 8) is decreased for factor 2.3, since the major contribution of gamma rays comes fromreactor.
Table 2 Efficiency of fission plate as a neutron flux amplifier for BNCT irradiationsNeutronsource
TRIGA (250 kW) +f.p. (2.3 kW)TRIGA (250 kW)
3>epi
[108n/cm2s]1.80.7
[10-13Gycm7ncpi]2.62.2
Dy/Oep:[ lO^GycmViv]
2.35.2
0.620.58
Configuration: 20 cm Al (2.7 g/cm3), 30 cm A1F3 (4.0 g/cm3), 0.05 cm Cd, 15 cm Pb, Pb collimator,5.5 cm Li2CO3-poly.
4 Parametric studies of components for BNCT facility
4.1 Thermal neutron absorbers
One of the requirements characterizing the quality of the epithermal neutron beam isminimization of the thermal component of the neutron spectrum (E<0.4 eV). Cd, as a standardthermal neutron absorber is most frequently used. Due to the reason that Cd is an efficient(n,y) converter (see Fig. 5.5 in [6]), contributing to the overall gamma dose at the irradiationpoint, the alternative materials as Gd, B4C and Li2CO3-poly were studied. The results arepresented in Table 3. Average relative error of the Oepi is ±5%, of DY ±10% and of Dy/Oepi±15%.
Table 3 Comparisson between thermal neutron absorbers (foil thickness 0.5 mm)
Oepi (0.4eV-10keV) (109)O th (<0.4eV) (10s)
Oth/0)Jal(xl0-2)Dr(xl0-3Gycm2)
D7/Oeqi(xl0-13Gycm2)
Cd4.90.61.221.113.757.6
Gd4.00.651.671.492.726.8
B4C3.8
'0.71.831.612.256.0
Li2CO3-poly4.87
14.411.24.659.7
Cd and Gd present the most efficient absorbers of thermal neutrons, with the highest Oepj.But they are relatively intense gamma emitters: comparing to B4C, Cd emitts 70% and Gd
Nuclear Energy in Central Europe '98

30% higher gamma dose. Considering the attenuation of <J>epj, UbCCVpoly is comparable toCd, but with the 10-times weaker absorption of thermal neutrons. In addition, the contributionto the gamma dose is substantial, due to higher yield of (n,y) reactions in JH of polyethylene.Cd was selected as the thermal neutron absorber, also due to more reasonable cost comparingto the other materials, particularly B4C [5].
4.2 Reflector materials
It was estimated in [4], that the epithermal neutron flux can even be doubled, if theappropriate materials (Ni in that study) surrounding the filters are applied. In addition to Ni,Pb, Bi, C and PbF2 were compared in my study. The thickness of the reflector material wasaltered in the following steps: 0, 2, 4, 6, 8 and 10 cm. The average relative error of the ®epi is±4%, of Dnfast ±9% and of Dnfast/$epi ±13%.
Reflector thickness [cm]
Fig. 4 Epithermal neutron flux for differentthickness of reflector material
Reflector thickness [cm]
Fig. 5 Specific fast neutron dose for differentthickness of reflector material
As obvious from Fig. 4, the epithermal neutron flux level is the lowest when no reflectoris used. The optimum 3>epi curves with the optimum reflector thickness can be observed,except for the PbF2. Monotonic increase of <Depi with increasing thickness can easily beexplained since PbF2 was estimated as an excellent alternative to AI2O3 and AIF3,recommended as independent filter and reflector [7]. Regarding other materials, the extremefunctions of 3>epi(thickness) were expected: when increasing the reflector thickness from 0 to10 cm, the active moderating cross-section area is decreased almost for factor of 2. From theOepi and DnfastM>epi (see Fig. 5) point of view, Ni outperforms other materials. But the majordrawback is relatively high cross-section for (n,y) reactions comparing to PbF2 (see thecomparison of Ni and F on Fig. 5.9 in [6]) and unacceptably high price: comparing thematerials of equivalent purity (99.99%), Ni is almost 50-times more expensive than PbF2 [5].
4.3 Collimator materials
With the exception of graphite, the same materials as in the case of reflector study werediscussed. The tally region in a MCNP model was identified with the actual irradiation pointat the outlet of the cone collimator (see Fig. 9). The results are presented in Table 4.
Nevertheless Ni collimator provides 20% higher <3>epi then PbF2, the specific fast neutrondose Dnfast/Oepi is approx. 30% lower in the case of PbF2. Collimation properties (Jepi/OepO arecomparable.
Nuclear Energy in Central Europe '98

Table 4 Comparisson of materials for collimatorM
—PbNi
PbF2
Bi
<D,, i(108n/cm2s)
0.91.32.31.91.6
(xlO"13 Gy cm2)116.53.72.84.7
Jcpi/Oep,
0.530.650.750.710.61
Rel. err. Oepi: ±6% , rel. err. Drfast: ±9%.
4.4 Gamma shielding
The following materials were considered: Bi, Pb, PbF2 and Pb+0.05 wt% 6Li [8].Attenuation of Oepi and efficiency of gamma rays absorption (D7/<I>epi) was calculated forfollowing different thickness: 0, 5, 10 and 15 cm. Results are presented on Figs. 6 and 7. Theaverage relative errors:. <S>epi - ±9%, Dr - ±12% and DYM>epi - ±21%.
4.0x10 -S3<3
,0. 2.0x10:
5 10
Thickness [cm]
Fig. 6 Epithermal neutron flux for differentthickness of gamma shield
Thickness [cm]
Fig. 7 Specific gamma dose for differentthickness of gamma shield
Bi and PbF2 prove similar properties from the point of view of attenuation of <J>epi, as wellas absorption of gamma rays. Mainly for technical reasons, 10 cm of Bi was selected as thematerial for gamma shield as this is the value where specific gamma dose per epithermalneutron (DT/<J>epi) decreases below the recommended limit of 3-10"11 cGycm7nepj (see Fig. 7).
4.5 Epithermal neutron filters
Following materials [9] were considered in calculations: AI2O3 (with density of 2.3 and3.9 g/cm3), AIF3 (with density of 2.8 and 4.0 g/cm3), FLUENTAL™ (patented metal/ceramiccomposite, made from Al and AIF3 mixture, with added 1% of LiF as absorber of thermalneutrons), PbF2 and Teflon™(CF2). 16O and 19F in stated materials serve as elastic scatterers ofneutrons in epithermal region, with additional capability of 19F to scatter inelastically neutronswith energies above 100 keV (see Fig. 5.12 in [13]). The moderation efficiency (enhancementof Oepi with decrease of Dnfast) was probed with the MC transport of neutrons through the 50-cm thick slab of material. The results (with average relative errors: Otenn - ±7%, <J>epi - ±4%,
- ±7% and Dnfast/<I>epi - ±11%) are presented in Table 5.
Nuclear Energy in Central Europe- '98

Table 5 Moderation properties of selected epithermal neutron filter materials (Material /
density (g/cm3)A12O3 (2.3)A12O3 (3.9)AIF3(2.8)A1F3 (4.0)
FLUENTAL®(3.0)PbF2 (8.2)
Teflon® - CF2 (2.2)Therapeut. Iim. values
®tcrm
(107 n/cm2s)0.91.00.91.10.00.81.3-
(109 ii/cm2s)2.11.42.21.20.9"2.21.61.0
Drfast/Oepi
(xl0"!3 Gy cm2)174.73.50.91.82.55.25.0
slab thickness 50 cm)Specific cost
(103DEM/109nepi)117
0.518.
2103717-
10"
10'
10'
10'
10'
• A1,O, [23 g/cm']
• A l p , [3.9 g/cm']
-FLUENTAL [3.0g/cm'j
•PWj [8.2g/cm')
•CF, (Teflon) (2.2 g/cm !J
i
10* 10 10 10 10 10 10
Energy [MeV]
10" 10' 102
Fig. 8 Neutron flux / unit lethargy for different applied materials of epithermal neutron filters
FLUENTAL, PbF2 and A1F3 (p=4.0 g/cm3) outperform other applied materials, when thelevel of epithermal neutron flux as well as low fast neutron dose are considered. NeverthelessFLUENTAL provides an excellent (see Fig. 8) spectrum shifting to the epithermal energiesrange (0.4 eV<E<10 keV) with outstanding thermal neutron cutoff, A1F3 (p=4.0 g/cm3) offers50% better ratio DjWOepi, being 12-times cheaper than FLUENTAL and 50% than PbF2.
5 Proposed configurations of BNCT irradiation facility
Based on the aforementioned results of parametric studies, I propose three configurationsof epithermal neutron irradiation facilities for BNCT treatments in TC/DC of TRIGA reactor.They all have the following common characteristics: epithermal filter - 20 cm Al + 30 cmAIF3 (p=4.0 g/cm3), thermal neutron absorber - 0.05 cm Cd, gamma shield - 10 cm Bi,neutron shield - 6 cm Li2CO3-poly [10], neutron source - 250 kW TRIGA reactor and 2.3 kWfission plate. The MC model is presented on Fig. 9. The proposed configurations distinguishmainly in the cost/performance aspect and differ in following properties:
a) reflector: 2 cm Pb; collimator: Pbb) reflector: 10 cm PbF2; collimator: PbF2
c) reflector: 4 cm Ni; collimatof: NiFrom the results presented in Table 6 it is obvious that epithermal neutron fluxes from
approx. 2 to 5-times lover than therapeutic limit (109 n/cm2s) can be achieved with proposedconfigurations in TC/DC of TRIGA reactor. On the other hand the purity of neutron beam
epi and DT/Oepi) is comparable to most of the proposed or existing BNCT facilities
Nuclear Energy in Central Europe '98 .

throughout the world (see Table 5.8 in [6]). The limit value of specific gamma dose isexceeded only with version c). The high quality of the beam can be observed also from theFig. 10, presenting the neutron spectrum in the irradiation point. A very good spectrumshifting towards the epithermal energies is observed: thermal flux $>tem (E<0.4 eV) presents1.5%, epithermal Oepi (0.4 eV<E<10 keV) even 95% and fast flux Ofast (E>10 keV) 3.5% ofintegral neutron flux (0 eV<E<20 MeV).
If only the elaboration of the facility is considered (excluding the refurbishment of theirradiation room, the instrumentation for the radiological protection and monitoring, treatmentplanning system etc.) the cost for 1000 epithermal neutrons for version a) would be approx.0.1 DEM (total 20000 DEM), for version b) approx. 0.3 DEM (total 150000 DEM) and forversion c) approx. 2 DEM (total 1200000 DEM).
Li2COj-po]y
concrete
Ai
Boral
collimator:PbFj
irradiation point
AI
graphite
fission pi,-2.3 kW
reactor core - 250 kW
10*
§ io7
10s
I
Proposed versions (20 cm AI + 30 cm........ A: ref. 4cmNi,koL: Ni
B: ref. 2 cm Pb, koi.: Pb
------ C: ref. 10 cm PbF,, kol.: PbF,
1 0 ! 10' 5 10"' 10" : IO' ! 1O !
Energy [MeV]
10' 10'
Fig. 9 MCNP model of the proposed BNCT facilitiesFig. 10 Neutron flux/unit lethargy for
proposed configurations
Table 6 Properties of proposed versions of BNCT facilities in TC/DCV
abcL
(10245
8 n/cm2s).21 (3).57 (3).69 (2)>10
Dnfast
(10-5 Gy s"1)4.38 (6)7.92 (7)5.59 (9)
-
- 5 D 7
7.2 (4)7.6(3)54 (3)
-
(10123
•Jepi8 n/cm2s).33 (2).83 (1).53 (1)
-
(lO^Gycm2)1.98(9)
1.70(10)0.98(11)
<5
I(io-!
319
3 Gy cm2).26 (7).66 (6).50 (5)
<3
•* epi'
Oepi
0.600.620.62>0.5
V: version, L: therapeutical limit values, (): relative error in %
6 Conclusions
The results of Monte Carlo calculations prove that the thermalising column of the TRIGAreactor is quite appropriate for the installation of efficient irradiation facility for a clinicalBNCT treatments. When adopting the proposed version b), with the most effectivecost/performance compromise, the irradiation parameters of the epithermal neutron beamcould even be superior to the renowned facilities installed on the more powerful reactorsthrough the world. The refurbishment of the thermalising column for the purposes of BNCT
Nuclear Energy in Central Europe '98

clinical treatments would require some significant improvements on the reactor itself andaccompanying equipment:1. the raise of the power of TRIGA reactor from current 250 kW to 750 kW would almost be
mandatory. In case of version b) the recommended therapy limit of Oepi (109 n/cm2s) canbe exceeded for almost 40%, keeping the treatment times below 40 min. If the reactorretains the existing power level, the treatment times should be substantially longer (up to1.5 h), but still almost 40% below the irradiation times at the first and only EuropeanBNCT clinical center at HFR Petten, Netherlands [11].
2. the application of the fission converter for the purposes of BNCT irradiation in TC/DC,would require the installation of air based cooling system, with capacity of 500 m3/h and adiameter of an inlet tube of 30 cm. Even in the case of reactor power raise up to 750 kW,the temperature remains below 640°C.
References
[1] New radiotherapy targets malignant brain tumors, Nuclear News, ANS, July 1998, pp.62-63
[2] M. Maucec et al., Development of irradiation facility for BNCT at the JSI TRIGAResearch Reactor, Advances in Neutron Capture Therapy, Vol. I, Medicine & Physics,ELSEVIER, 1997, pp. 370-376
[3] J. Briesmeister, Ed.,MCNP -A General Monte Carlo N-Particle Transport Code, Ver.4B, LA-12625-M, March 1997
[4] H. Rief et al., Generating Epithermal Neutron Beams for BNCT at T1UGA Reactors,Pavia Workshop on New Clinical Applications and Neutron Sources for BNCT, June1991
[5] M. Maucec, Razvoj epitermalne obsevalne naprave za BNCT v termalizirajocikoloni/suhi celici raziskovalnega reaktorja TRIGA Mark II - studija izvedljivosti, IJS-DP-7868, april 1998 (in Slovene)
[6] M. Maucec, Monte Carlo preracuni transporta nevironov in fotonov v zapletenihgeometrijah, PhD Dissertation in preparation (in Slovene)
[7] H. Liu, PbF2 compared to AI2O3 andAlFs to produce an epithermal neutron beam for• radiotherapy, Med. Phys. 23(2), February 1996, pp. 279-280
[8] H. Liu et al., Enhancement of the Epithermal Neutron Beam used for BNCT, Int. J.Radiation Oncology. Biol. Phys., Vol. 28, No. 5, pp. 1149-1156, 1994
[9] I. Auterinen et al., Design of Epithermal Neutron Beam for the TRIGA Reactor inOtaniemi, Proceedings of the CLINCT BNCT Workshop, Helsinki 1993
[10] H. Liu, Design of Neutron Beams for Neutron Capture Therapy using a 300 kW SlabTRIGA Reactor, Nucl. Tech., Vol 109, 1995, pp. 314-326
[11] R. L. Moss et al., The completed Boron Neutron Capture Therapy Facility at the HFRPetten, Advances in Neutron Capture Therapy, Vol. I, Medicine & Physics,ELSEVIER, 1997, pp. 331-336
10 Nuclear Energy in Central Europe '98
SI0100087
Nuclear Energy in Central Europe '98
Terme Catez, September 7 to 10, 1998
NUCLEAR ENGINEERING ASPECTS OF GLIOMA BNCT RESEARCH IN ITALY
Giorgio CURZIO Marino MAZZINIDipartimento di Costruzioni Meccaniche e Nucleari, Via Diotisalvi,2 -56126 PISA (I)
ABSTRACT
A research project on Boron Neutron Capture Therapy (BNCT) of gliomas has been set up in Italy, with theparticipation of Departments of Oncology and Mechanical and Nuclear Construction (DCMN) of the Universityof Pisa, as well as the Neuroscience and Physics Departments of the Universities of Roma.
The specific objective of DCMN Research Unit is the study of the physical-engineering aspects related toBNCT. The paper outlines the research lines in progress at DCMN:• Monte Carlo calculations of neutron dose distribution for BNCT treatment planning;• mesurements of neutron fluxes, spectra and doses by neutron detectors specifically set up;• design of modifications to the nuclear reactors of ENEA Casaccia Center.
In particular, the paper emphasizes the most original contributions on dosimetric aspects, both frominformatic and experimental points of view.
1. INTRODUCTION
As well known, the Boron Neutron Capture Therapy (BNCT) is a radiotherapy modality ofparticular interest for the treatment of highly radioresistant tumors, like malignant high gradegliomas. The survival of patients affected by glioma is very poor: even after aggressivesurgery and radiotherapy, median survival is 6-12 months; less than 10% of patients survivelonger than 2 years.
BNCT is based on the interaction between boron 10 atoms, which should concentratemainly in the tumor tissues, and thermal neutrons. After the capture of a neutron, the boronnucleus immediately disintegrates into an alfa particle and a recoiling lithium nucleus. Therange of these particles is less than 10 microns, corresponding to the dimension of a cell. Theyrelease an energy of 100-150 keV/um (high LET). A single track crossing the nucleus of thecell has a high probability of producing an unrepairable damage, leading to the cell death. Theselective concentration of boron 10 in the tumor cells before the exposure to the neutron fluxwould result in the destruction of the tumor, without damage to the normal tissues.
The availability of boron compounds able to concentrate in the tumor cells will be the mainfactor for the success of BNCT. A large number of substances, based on different principles,have been tested in experimental animal models as possible boron vehicles. In human patientstwo boron compounds have been used in recent years: the sulfydryl-borane (BSH) and theBoro-Phenyl-Alanine (BPA). Data on pharmacokinetics, biodistribution and* toxicitycharacteristics of both compounds are available in literature. In particular, BPA concentratesselectively in the neoplastic tissues: the average boron concentration in normal brain tissueranges between 75% and 100% that in the blood, while in the tumor it reaches values 2-4times higher. No sign of intolerance or toxicity has been observed in patients receiving aninfusion of BPA complex stabilized with fructose (BPA-F). Available pharmacokinetics
Nuclear Energy in Central Europe '98 ' 11 j |

studies have shown that boron concentration reaches its maximum value between one and twohours after the infusion.
BNCT has been applied experimentally in Japan III; at present trials are in progress inUSA (at Brookhaven National Laboratory - BNL) 111 and at Petten (NL) EU Joint ResearchCenter (JRC) 131.
A feasibility study of BNCT in Italy was performed last year at Dipartimento diCostruzioni Meccaniche e Nucleari (DCMN) of the University of Pisa, in collaboration withthe chairs of Radiotherapy of the University of Brescia and Pisa 141. It indicated theadvisability of:a) addressing the research mainly to treatment of gliomas, the subject of the trials at BNL
and at Petten JRC;b) acquiring suitable knowledge and experience on instruments and methods (neutron
source, pharmacology, dosimetry, and so on) to be used in order to realize BNCT in ourcountry;
c) implementing a series of specific and up-to-date calculation tools needed to reachprevious objectives.
As a follow up of this activity, a research project was set up in which the OncologyDepartment of the University of Pisa, the Neuroscience Department of the University of Roma"Tor Vergata", the Department of Physics of the University of Roma "La Sapienza", DCMNand several scholars of other Departments and Institutions are involved.
2. DCMN RESEARCH PROGRAMME
The specific objective of DCMN Research Unit is the study of the technical-engineeringaspects related to the attainment of glioma BNCT in Italy. The practical implementation ofthis treatment requires the preliminary solution of several problems.•Physicalproblems. Neutrons need to reach the tumor volume with a sufficient flux intensity.Thermal neutrons (energy lower than 0.5 eV) have a very low penetration in human tissues.Their use is therefore limited to the treatment of superficial tumors or when surgicalprocedures permit exposure of the tumor to thermal neutron flux possible. To reach more deepseated tumors, epithermal neutrons (energy level up to 10 keV) have been recently applied.These particles are able to enter several centimers into the brain, before they are slowed downto thermal energies.•Technological problems. The neutron beam required for BNCT depends on the shape anddepth of the tumor. A flux of 10E+9 n/cm2s of energy less than 10 keV is achievable withreactors of a few MW power, using proper filters and collimators. Public acceptance problemscan be met when locating a nuclear reactor in urban areas. A possible alternative isrepresented by the use of proton accelerators with current as high as 10 mA, and a lithium orberyllium target; however this solution has to be industrially proven.•Dosimetric problems. Radiation dose in BNCT results from multiple components. The mostimportant contribution is given by the high-LET heavy particles produced by the reaction10B(n,a)7Li. Further components are due to the interaction of the neutrons with the nuclei ofelements in normal tissues (mainly, hydrogen 1 and nitrogen 14), with emission of gammarays and protons; additional components are given by photons and fast neutrons coming fromthe same neutron source. The dosimetric approach is very complex; it requires 3Dcalculations, which must be experimentally validated.
12 Nuclear Energy in Central Europe '98

Obviously the research necessary to deal with abovementioned problems will be addressedby DCMN in collaboration with the other Units participating to the project. Besides , DCMNmanages directly the activities of various researchers of other Institutions and Universities(namely at the Politechnics of Torino and Milano, and at Genova and Rome-La SapienzaUniversities) and has strong connections with the BNCT Research Unit at ENEA CasacciaCenter and the CNR Clinical Physiology Institute (IFC) in Pisa.
The program of the DCMN Research Unity can be subdivided into three parallel lines ofactivity:part I: realization of an experimental apparatus which utilizes the TAPIRO reactor of ENEA
Casaccia Center, in collaboration with the Research Units of ENEA and with Roma-La Sapienza University.
part II: setting-up the theoretical and experimental tools, necessary to BNCT realization inItaly, in collaboration with IFC of CNR-Pisa and other International Research Centers(Petten-UE, BNL-USA, etc.). In this context DCMN will collaborate for the physical-engineering aspects, to the definition of the therapeutic treatment plan of gliomas.
part III: comparative technical-economic analysis of the irradiation plant projects necessary tothe realization of BNCT in our country, like:• modifications to the nuclear reactors installed at ENEA "Casaccia" Center
(TAPIRO fast reactor and TRIGA thermal reactor), in order to make them suitablefor glioma BNCT;
• cold neutron guide to allow BNCT application of the ENEA TRIGA reactor, inthe present configuration;
» a new neutron flux amplification plant, constituted by a commercially available,heavy particle accelerator, modified for BNCT, and a subcritical nuclear array;
» a new TRIGA, commercial, high power (i.e. 5 MWt), nuclear reactor to beinstalled in a site already approved for such use;
• a new neutron source of intensity suitable for BNCT, derived from a heavyparticle accelerator (with energy around 10 MeV and current of at least 10 mA), indevelopment at several Institutions in USA and in Europe (i.e. INFN Laboratoryof Legnaro - PD).
At present research lines in progress at DCMN are related to:• setting up of the software for BNCT treatment planning;• measurements of neutron fluxes, spectra and doses by sets of neutron detectors
specifically set up;• design of modifications to the nuclear reactors of ENEA Casaccia Center.
They will be briefly outlined in next paragraphs.
3. THE "CARONTE" TREATMENT PLANNING SYSTEM
During the Seventh Symposium on Neutron Capture Therapy for Cancer, held in Zurich onSeptember 4-7, 1996, scientists of the BNCT Kyoto Center proposed the use of PositronEmission Tomography (PET) as a technique to acquire reliable information on borondistribution into the healthy and tumor regions of the patient brain I SI. To this aim, they usedBPA, labelled with 18F (positron emitter). The central transaxial slice of a glioblastomamultiforme scanned by PET (kindly sent by Kyoto scientists to DCMN) is reported in Figure1. In this image the red zone indicates the highest amount of boron. The availability of thistechnique is at the basis of a new procedure for treatment planning, different from that
Nuclear Energy in Central Europe '98 • 13

one for the tumor zone; the assumption of uniform boron concentrations in the two zonesbrings to dose distributions, with typical radially decreasing isodose curves. An example isgiven in Figure 2 161, where a transaxial slice of a Labrador dog with superimposed the boronisodose curves is represented.
Fig. 1. Centra! PET slice for the Kyotoalioblastoma multiforme case
Fig. 2. Boron isodose curves for uniformboron distribution assigned to aLabrador dog head model
Al DCMN, a new software system, named CARONTE 111, has been implemented, whichrecognizes the boron concentration and distribution information contained in PET slices andconverts them in a MCNP-4A input format. This information is inserted into a brain model,constituted by two non-concentric ellipsoids (taking into account the variable skull thickness).
After MCNP-4A calculations, CARONTE processes the output file and gives the option ofseeing the results in a bidimensional format (isodose and isofluence surfaces on PET sliceplans) or in monodimensional format (along an axis parallel to the transaxial PET slices).
Different simulations have been performed varying several parameters, like the SSD(Source-td 'Skin Distance),"the boron concentrations and the neutron spectrum. Only oneexample is reported here in Figure 3; it is related to a configuration with SSD equal to 30 cmand an epitherrhal neutron flux (like that of Petten HB11 BNCT channel) coming from the leftof figure !. The CARONTE output image represents the central PET slice of the brain modeland related boron isodose surfaces (the arrows indicate direction of the neutron flux). At theright end the color scale and related boron dose values are reported.
A complete presentation of these results is given in /8/ and 191.
RBE-REERBERBERBERBERBERBERBERBE
dose boro <=dose boro<=.dose boro<=dose boro <=dose boro <=dose boro <=dose boro <=dose boro <=dose boro <=dose too <-
2.89999-1 E-l5.799981E-18.699972E-1I.159996E-K)1.449995E-+O1.739994E+02.029994E+02.319993E+02.609992E-H32.899991E+0
Gy-eqfkGy-eq/hGy-eq/hGy-eq/hGy-eq/hGy-eq/hGy-eq/hGy-eq/hGy-eq/hGy-eq/h
Fig. 3. RBE-boron isodose surfaces in the central PET transaxial slice of the Kyotoglioblastoma multiforme case.
14 Nuclear Energy in Central Europe '9§

4. EXPERIMENTAL ACTIVITIES
As already mentioned, the assessment of all significant radiation dose componentsdelivered to the irradiated volume during BNCT treatment constitutes a complex threedimensional problem. In fact, the different dose components have different spatial distributionand Relative Biological Effectiveness (RBE). In particular, it is important that BNCT neutronbeam be designed to. minimize the fraction of primary neutrons with energies above thedesired epithermal range; it must also be ensured that an accurate estimate be provided of thespatial deposition of this dose component.
In order to assess fast neutron doses and spectra, methods based on the "Superheated DropDetector" (SDD) /I0/ were and will be utilized in our investigations. SDD consist of anuniform emulsion of microscopic, over-expanded halocarbon droplets dispersed in a tissueequivalent gel. The superheated drops are like microscopic bubble chambers: upon neutronirradiation they turn into bubbles, which can be recorded optically or acoustically / l l / .Charged recoils generated through fast neutron collisions inside or next to the droplets inducethe bubble formation. The higher the degree of superheat of the liquid, the lower the minimumenergy secondary charged panicles'—-and therefore primary neutrons—must impart to thedrops in order to nucleate their evaporation. For this reason, these detectors presenttemperature dependent threshold responses, and a fairly flat response for higher energies.
A spectrometer was developed based on this principle: it relies on two differentsuperheated emulsions, halocarbons C-318 and 114, whose detection thresholds are selectedby controlling the operating temperature (Figure 4). With their sharp detection thresholds, thetwo emulsions scan the 0.01-! MeV and the 1-10 MeV ranges, respectively. The responsematrix of the system is virtually orthogonal, which allows the use of effective few channelunfolding procedures /121. The system was employed in the determination of the fast neutronpart of the spectrum of an accelerator-based source developed at INFN Legnaro Laboratory(Figure 5). Results were analyzed by means of two unfolding codes, MSITER (using aMCNP-calculated spectrum as pre-information) and UNFANA (a maximum-entropy coderequiring no pre-information); they are illustrated in Figure 5.'With MSITER, input andoutput spectra virtually coincided. The value of the y} per degree of freedom resulted less than1, indicating complete consistency between MCNP-calculated and measured data. UNFANAgenerated a'smoother spectral distribution, which better reflects the intrinsic resolution of thespectrometer. Spectra unfolded with the two methods differed from each other by less than the
10'"
o3c
Q_
10"
10"
=3CD
-«—•UJ
i?CD
10'" 10 10" 10'Neutron Energy (MeV)
-i—i—i—i 111
_ MCNPand MSITERUNFANA
Neutron Energy (MeV)
Fig. 4. Fluerice response of halocarbonsC-318 and 114 as a function ofneutron energy and of operatingtemperature in the 25-40 °C range.
Fig. 5. Fast neutron spectrum of the INFNaccelerator source, measured withSDD and compared to MCNPsimulation.
Nuclear Energ)> in Central Europe '98 15

associated uncertainties, which confirmed the overall structure of the energy distribution.Fluence integrals over broader energy intervals were also calculated from both codes and wereaffected by much smaller uncertainties, thanks to negative correlations between adjacentgroups/13/.
If the detector droplets are sufficiently superheated and contain chlorine, they may benucleated by the products of the -^QCn.p^S reaction—mainly the !7 keV sulfur ions.Through this mechanism, halocarbon 12 emulsions are sensitive to thermal and intermediate-neutrons. Figure 6 reports some experimental and numerical (Monte Carlo) data on the SDDdetection efficiency, along with the kerma-equivalent factor curve (i.e. the ideal response for adetector intended to measure RBE-weighted absorbed doses in phantom). The excellentagreement on an energy range of over nine orders of magnitude, combined with the tissueequivalent composition of the detector; make the system extremely suitable for thedetermination of dose distributions in tissue /14/. This was employed in the determination ofthe whole body exposure of patients undergoing BNCT treatment at Brookhaven NationalLaboratory /15/.
Figure 7 reports neutron dose equivalent estimates based on values of thermal andepithermal fluence and of the fasi neutron dose generated by Rtpe, the INEL radiationtransport computer code. These refer to a patient head irradiated parallel to the beam axis. In-phantom measurements were carried out for the same irradiation geometry inside a slab waterphantom in contact with a Rando-Alderson anthropomorphic head phantom. Next to the head,measured data follow the same trend as the calculations. At higher distances, measurementsreflect the additional contribution of neutrons transmitted through the reactor wall.
•gicrloBioi0>
§101
o Halocarbon-12Monte Carlokerma-equivalent factor
10-8 10-7 10-61 a 5 10-4 10-310-210-1 100 101 102
Neutron energy (MeV)
Fig. 6. Fluence response of halocarbon 12 SDDversus kerma equivalent factor.
20 40 60 80Penetration distance (cm)
Fig. 7. Neutron dose equivalentcalculated and measured atdepth in tissue at BNL.
5. DESIGN OF THE IRRADIATION CHANNEL
The cited feasibility study IAI outlined the advisability of an epithermal neutron flux of theorder of 10E+9 n/cm2s at the exit of the irradiation channel; in this way the treatment timeshould be less than one hour.
The related R&D activities include the construction of an experimental irradiation channel,by which experiments on phantoms and laboratory animals will be carried out. This can berealized in a few months by modifying the fast reactor TAPIRO, in operation at ENEA
16 Nuclear Energy in Central Europe '98

Casaccia Center, on the basis of the design already available, thanks to BNCT Research Unitsof ENEA and the University of Bologna /16A The foreseen channel configuration is shown inFig. 8. The epithermal flux at the exit of this channel (Figure 9) should be more than 5.10E+8n/cm2s, a very important result if one takes into account that TAPIRO reactor has a power ofon!y5kW.
S l O 'i
Fig. 8. Horizontal section of TAPIROreactor irradiation channel.
Fig. 9. Neutron spectra obtained in twoMNCP calculation runs. /15/
At the same time, DCMN is undertaking the design of the modifications needed to theTRIGA reactor of the same Center, so as to make it adequate for BNCT. This work takes intoaccount the notable research carried out in the last 10 years by the BNCT Research UNIT ofENEA Casaccia, managed by A. Verri /17/, /18/. The design of the irradiation channel for theTRIGA reactor is in progress. According to the calculation results obtained by MCNP 4Bcode, using a combination of 28 cm of aluminum, and 24 cm of aluminum fluoride, with achannel collimator of lead or bismuth, the epithermal flux at. the channel exit is larger than5xlOE+9 n/cm2s /19/. This would allow very efficient arid short BNCT treatments,particularly if the attempt to design the reactor operation in pulse mode will be successful.
6. CONCLUSIONS
The research activity already carried out at DCMN has achieved important results, eventhough external financial supports has been lacking. This is demonstrated by the setting-up ofan original calculation tool (CARONTE System), prepared in order to connect the real PETboron distribution data to MCNP-4A code; in this way the calculation of neutron dose into thebrain is performed on the basis of information about the real boron distribution in healthy andtumor tissues, instead than on uniform distributions assumed in input. In the near future,CARONTE system will be modified to accept, in input, data on the tumor image and theboron distribution obtained by Nuclear Magnetic Resonance (NMR), a technique already set-up by the Group of the Physics Department of the University of Rome /20/.
From the experimental point of view, Superheated Drop Detectors (bubble detectors) wereset up for the experimental determination of the neutron field. Neutron flux determination wasalready performed in the experimental irradiation facility of Pavia University for BNCT ofskin melanoma and of explanted liver. Other patient dose measurements were done at theBNL facility for BNCT.
Finally, the modification of TAPIRO Reactor will allow the experimental verification of
Nuclear Energy in Central Europe '98 17

the design calculation performed by MCNP code. If the experimental data will confirm thecalculation results, a neutron source useful for BNCT will be available in Italy. In any case,this will make available the epithermal neutron source useful for carrying out experiments onlaboratory animals of large tail, a decisive step before the application of the therapy to man.
AKNOLOWLEDGEMENTS
The contribution of the researchers, who carried out the DCMN feasibility study and therelated research activities has to be acknowledged. Particular thanks are due to:• N. CERULLO and G. DAQUINO for the work done on setting-up CARONTE software
system;• F. D'ERRICO, for that related to experimental measurements of neutron spectra and
dosimetry;• the scientists of ENEA and University of Bologna BNCT Research Units, for the design of
TAPIRO reactor irradiation channel;• C. HARGHEL, for her thesis work on the design of .modifications to ENEA Casaccia
TRIGA reactor.
ABBREVIATIONS
BNCTBNLBSHCNRDCMNENEAEUIFCINELINFNJRCLETNLPETPDRBESDDSSDUSA
Boron Neutron Capture TherapyBrookhaven National LaboratoryBoro-Phenyl-AlanineConsiglio Nazionale delle RicercheDipartimento di Costruzioni Meccaniche e NucleariComitato Italiano per l'Energia, le Nuove Tecnqiogie e l'AmbienteEuropean UnionIstituto di Fisiologia ClinicaIdaho National Engineering LaboratoryIstituto Nazionale di Fisica NucleareJoint Research CenterLinear Energy TransferNederLandsPositron Emission TomographyPadova (Padua)Relative Biological EffectivenessSuperheated Drop DetectorSource to Skin DistanceUnited States of America
18 Nuclear Energy in Central Europe '98

REFERENCES
III Hatanaka H., Sano K. and Yasukochi H., Clinical Results of Boron Neutron CaptureTherapy, Progress in Neutron Capture Therapy for Cancer, Plenum Press, p. 561 - 568,New York (USA), 1992.
Ill Coderre J.A., et al., Boron Neutron Capture Therapy for GUoblastoma Multiforme UsingP-Borophenylalanine and Epithermal Neutrons: Trial Design and Early Clinical Results,J. Neuroncology 33 (1-2), 141-152, 1997.
131 Sauerwein W., Hideghety K., Gabel D. and Moss R., European Clinical Trials of BoronNeutron Capture Therapy for Glioblastoma, Proced. ANvS Winter Meeting, Albuquerque(N.M), Nov. 16-20, 1997.
IAI Mazzini M. et al., Studio di fattibilita in Italia della terapia dei gliomi per catturaneutronica da parte del bow 10 (BNCT), Atti DCMN dell'Universita di Pisa, RL 740,1997.
15/ Ueda S, Imahori Y., Ohmori Y., Kusuki T., Yoshino E., Takagaki M., Kobayashi T., OnoK., Fuji R., Ido T., Positron Emission Tomography - Boron Neutron Capture TherapySystem and Clinical Application to Patients with Malignant Glioma, Proceedings ofSeventh Internationa! Symposium on Neutron Capture Therapy for Cancer - Zurich (CH),September 4-7, 1996.
161 Nigg D.W., Eng D., Methods for Radiation Dose Distribution Analysis and TreatmentPlanning in Boron Neutron Capture Therapy, Int. J. on Radiation Oncology Biology andPhysics, 1994.
Ill Cerullo N., Daquino G., Tumour and Healthy Tissues Dose Calculation using MonteCarlo Code and PET Information on Boron Distribution in Tissues, Workshop on BoronNeutron Capture Therapy, Padua (I), February 24-25, 1998. INFN/TC- 98/12 Report,1998.
/8/ Cerullo N., Daquino G., Use of the Monte Carlo Code in Neutrons Behaviour Simulationin BNCT (Boron Neutorn Capture Therapy), Proceedings of International Conference"Technologies for the New Century", Nashville (TN), April 19-23, 1998.
191 Cerullo N., Daquino G., "CARONTE". A Treatment Planning System Based on RealBoron Distribution and MCNP-4A Code: Results and Discussion, Proceedings of EightSymposium on Neutron Capture Therapy for Cancer, San Diego (CA), September 1998.
110/ Apfel, R.E., The Superheated Drop Detector, J. Nuclear Instrum. Methods 162, 603-6081979.
/[\l D'Errico F., Alberts W.G. and Matzke M., Advances in Superheated Drop (Bubble)Detector Techniques, J. Radiat. Prot. Dosim. 70(1-4), 103-108, 1997.
Nuclear Energy in Central Europe '98 19 §ft

lill D'Errico F., Alberts W.G., Curzio G., Guldbakke S., Kluge H. and Matzke M., ActiveNeutron Spectrometry with Superheated Drop Detectors, J. Rad. Prot. Dosim. 61(1-3),159-162, 1995.
/13/ Agosteo S., Bodei G., Colautti P., Corrado M.G., D'Angelo G., D'Errico F, Matzke, M.Monti S., Silari M. and Tinti R., Neutron Measurement of an Accelerator-Based Sourcefor BNCT, J. Radiât. Prot. Dosim. 70(1-4), 559-566, (1997).
/14/ D'Errico F. and Apfel R.E.,- A New Method for Neutron Depth Dosimetry with theSuperheated Drop Detector, J. Radiât. Prot. Dosim. 30(2) 101-106, (1990).
/15/ D'Errico F., Nath R., Capala J., Coderre J., Fast Neutron Exposure of the BNCT Patient,Med. Phys. 25(7) A145, 1998.
/16/ Casali F., Agosteo S., Alfinito M., Burn K.W., Chirco P., Nava E., Rosi G., Rossi M. andZanarini M, Design of a Facility for Boron Neutron Capture Therapy, by MCNP, in aFast Reactor, Proceed. Int. Conf. on Nuclear Data for Science and Technology, Trieste(I), May 19-24, 1997.
/III Verri A., Sommario di un Progetto di Boroterapia, J. Ingegneria Nucleare e TecnoiogieEnergetiche, 1992.
/18/ Verri A., La Boroterapia: una Nuova Tecnica per la Cura dei Tumori, J. Ingegneria teNucleare e Tecnoiogie Energetiche, 1992.
1191 Harghel C , Progetto délie Modifiche del Reattore TRIG A dell'ENEA - CR "Casaccia"per il suo uso nella BNCT, Tesi di laurea in Ing. Nucleare, Université di Pisa, a.a. 1997-98 (in progress). ' '
/20/ Campani S., Campanella R, De Luca Fr and Maraviglia B., IOB Compounds NMRImaging for BNCT, Workshop on Boron Neutron Capture Therapy, Padua (I), February24-25, 1998. INFN/TC- 98/12 Report, 1998.
20 Nuclear Energy in Central Europe '98

SI0100088
Nuclear Energy in Central Europe '98
Terme Catez, September 7 to 10, 1998
Development and Test of a Miniature Gamma Thermometer to Determine theGamma Dose Rate Inside a Reactor Core
J. Kizhakkekara, P. Katrik, H. BockAtominstitut der Osterreichischen Universitaten, Wien, Austria
ABSTRACT - In this study various designs for different gamma thermometers tomonitor the local gamma dose rate in the core of the TRIGA Mark-ll reactor at theAtominstitut der Osterreichischen Universitaten are presented. The cylindricalgamma thermometers used here are based on the physical effect of gamma heatingin heavy materials such as lead or bismuth. The heat generated within the sensor isconducted to a heat sink along a well controlled heat path. The temperaturemeasured over the heat path is proportional to the gamma heat generated andtherefore to the local heat generation rate in the neighbouring fuel elements.
1. Introduction
The gamma thermometers used in the present development are equipped withdifferential thermocouples that have junctions in the cold and hot point of the sensor.This type of ungrounded thermocouple eliminates the need for any well controlledtemperature reference point outside the reactor. On the other hand, thesethermocouples do not convey any information about the sensor's temperature. Thesensor temperature can only be measured if the difference thermocouple wasungrounded to its sheath in the thermal junction.During the past decades variuostypes of gammathermometers have been developed mainly for nuclear power plantapplications/1-4/.
The thermometer used for this development were of 5 mm diameter and 20 mmheight, stretched by two thermocouple wires connected in the axial direction. Thewires prevent to some degree the lateral oscillations of the sample. The outer canwas made of aluminum and constitutes a cylinder of 10 mm diameter with an air gapbetween the sample and the can equal to 2.5 mm radially and also in axial direction.The whole construction was inserted into another stainless steel cylinder for furtherinsulation with the same air thickness like the one with aluminum. Measurementswere done using Chromel-Alumel thermocouples. With this construction atemperature difference up to 77 °C was measured. Experiments with thisconstruction gave a measured gamma dose rate of maximal 1.2 MGy/h using Pb, inthe center of the TRIGA core when the reactor was operated at nominal power level250 kW.
Nuclear Energy in Central Europe '98 21

2. Different types of gamma-thermometers constructed
In order to carry out the experiments in different location in the core of the TRIGAMark-ll reactor Vienna, four different types of gamma-thermometers (GT) wereconstructed. The first type (GT 1) consisted of a gamma sensitive cylinder which issurrounded by AI2O3 for thermal isolation (Fig1). It was inserted into an aluminumcontainer and a sealing top was made of aluminum through which thethermoelement wires were connected to the measuring instruments. The dimensionsof GT 1 were as follows:
Gamma-sensitive cylindrical part diameter: 10 mmGamma-sensitive cylindrical part height: 20 mmouter diameter of the container: 25 mmisolation thickness at the top and bottomof the gamma-sensitive cylinder: 7.5 mm
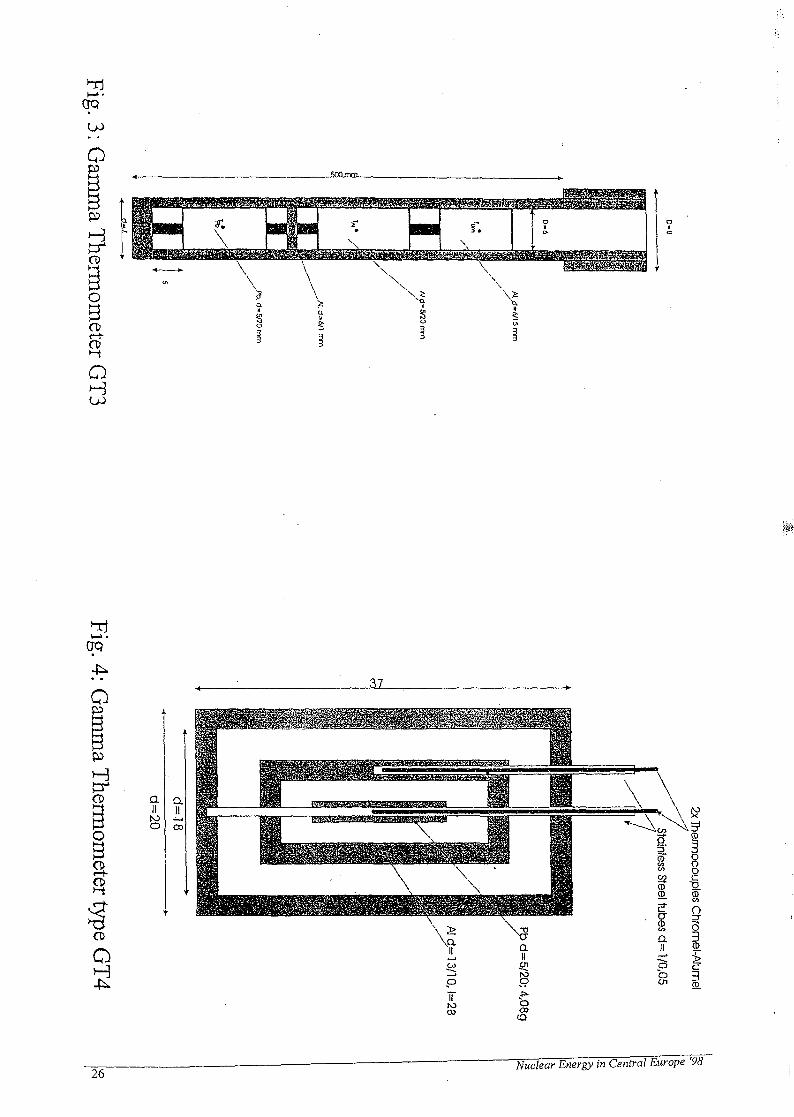
The thermoelements used are Ni-Cr-Ni, the construction is shown in Fig. 1, top left.The GT 1 showed problems with its thermal stability and the AI2O3 caused problemsto reach thermal equilibrium. Therefore the next detector type (GT 2) wasconstructed using air as insulation instead of AI2O3 and using either lead or bismuthas gamma sensitive material (Fig.2). In example the lead cylinder had a weigth of17.06 g with dimensions 10 mm diameter, 20 mm height. For this purpose acalibration thermoheater which had a resistence of 6 Q was used. With thisthermometer an absolute temperature of 147 °C could be measured. For an effectivetemperature determination a dry canal was needed . The calibration curve showedan exponential instead of a stright line because of the influence of the watertemperature. Due to the size of the sensor the incore irradiation positions could notbe measured. With the knowledge gained from the previous constructions anotherminiature type thermometer(GT 3, see Fig.3) was developed.This third type had the dimensions:
length: 20 mmdiameter: 5 mm
With this thermometer measurements at different irradiation positions in the core andalso in the central irradiation tube of the reactor were made. Because of the extremethin size several other problems were met, especially at higher temperaturesoscillations were observed, especially above 50 °C. At higher reactor power thedisturbance due to watercirculation through the core positions prevented correctmeasurements . With this experience and considering the previous problems theresent version with different modifications was constructed (GT 4) , it is shown in Fig.4.
3. Construction of the present gamma thermometer
As mentioned above the gamma thermometer (GT 4) was constructed using acentral stainless steel capillary for thermoelements with a mold form which is
22 Nuclear Energy in Centra I Europe '98

centered in a lead cylinder. Two other capillaries were made for thermoelements onthe stainless steel jacket. The whole chamber is welded with silver solder in order toattain water thightness.
4. Calibration
In order to carry out absolute measurements with thermoelements the properreference temperature has to be determined. Generally the melting, boiling or triplepoints of gases, liquids or metals are used for this purpose. In the present case anice mixture was prepared in a Dewar which surrounds a thin glass vial filled withmachine oil. The oil is used to avoid corrosion and the necessary formation ofgalvanic voltage. The voltages were measured using a voltmeter of the type MetexModel M4650 CR with a digital output connected to a PC-XT computer. Using abasic programme the data are collected and treated using Origin 4.0. An almostlinear relation between temperature and thermal voltage was found (Fig.5).
After these calibrations the thermometer was used to measure the gamma dose ratein the central irradiation tube of the TRIGA Mark-ll reactor Vienna. The location ofthe maximum gamma dose rate has been experimentally determined at about 35 cmbelow the upper grid plate (Fig.6). Due to the water flow in the central channel thegamma thermometer moved horizontally and the gamma dose rate varied between0,25 MGy/h up to 1,2 MGy/h. In the near future a flow stabilization will be provided toprevent horizontal movement of this probe and to determine the gamma dose rateaccurately in any core position. Another interesting test for the performance and timebehaviour of GT 4 was the stepwise increase of reactor power as shown in fig.7. Atnominal power of 250 kW a temperature difference of about 38° C was obtainedbetween the gamma heated center (Bi) and the detector can. As can be seen theresponse time is a few minutes and the signal is very stable at any power level. Thistype of detector is very well suited for fast gamma mapping of a reactor core.
5. Conclusions
After several prototype gamma thermometers a detector was developed which isable to determine very accurately the gamma dose rate in the core of the TRIGAreactor at nominal power. Some minor improvements in the detector materials couldstill be implemented but the present design prooves to be an accurate and reliablesensor for incore gamma measurements.
References:
hi Stuetheit J.S.: ,,Fast response gamma thermometers", Nucl. Instr.Meth. 63(1968) p. 300
121 Brixy H.: ,,Messdetektoren fur Core Messungen",Atomkernenergie-Kemtechnik41 (1982) p. 302
Nuclear Energy in Central Europe '98 23

/3/ Barbert M.,Guillery M.: ,,A new advanced fixed in-core instrumentation for aPWR Nucl.lnstr.Meth. 185 (1981) p. 377
141 Knipe A., Wonters R.: ,,Gamma-ray energy deposition measurement inheterogeneous cores and their anylysis" IAEA-SM-244/35
24 Nuclear Energy in Central Europe'98

Thermocouples
5;
S1
I
8
Heating Coils
.Thermocouples
Heating Colls
Pbd= 10/20
Pb 01=10/20/17.069
K-
Al
d-27
Fig. 1: Gamma Thermometer type GTl Fig. 2: Gamma Thermometer type GT2
i—»•
era
Op?
CD
f r.itraMj \
\
QH
OQ
QP3
CD
O
B
CD
O
_az.
26Nuclear Energy in Central Europe '98

(MG
y/h)
rate
Dos
e
1.6
1.4
1.2
1.0
0.8
0.6
0.4
0.2
0.0
calibration
for Pb and
Bi gamma-
thermometer
s ' • 1 , I—.
Bi
Pb
0 20 40 60 80 100
Temperature difference in PC!
Fig.S:Calibration curve for gamma-thermometers using Bi or Pb asdetector material
W » JO »
~f-
- •
- J —
—f—
_ j_
- f -
H
-+-
Hh-
—(—
..
-4—
•
7/
/:
- 4 -
: /• / •
/ •
—f-
V
A
-4-i
- f -
••
—1—i
-+-
-+-
s\
_\-
_ ) _
\ .\ -
V
_ ) _
\
\
—1
— f -
^ •
V
:— i —
—!—
s\
h-
—f-
-4-i
-f-
. ] ' •
• ^ ~
- 4 -
=250
i—
im r
h-
_|
........;....
..;....
..;....
..;....
..;....
-4—
o
Jl » H
Distance of the gamma-thermometer from top grid plate (cm)
Fig.6:Axial gamma-profile through the TRIGA core
Nuclear Energy in Central Europe '98 27

09:28:52 08:51:52 10:18:52
sen,S
80 -
aq
7P —
60 \~
6Q
30
Bismuth temperature
Detector cladding temperature
50 K'Temperature differenceBismuth-cladding
09:26:52 09:61:62
3.72
3.31
2.90
2.07
0.83
0.-11
0.00
1 * g
Time
Fig.7: Bi-detector in the core center without primary cooling

SI0100089
Nuclear Energy in Central Europe '98
Terme Catez, September 7 to 10, 1998
Recent Improvements to TRIGLAV Code
Tomaz Zagar, Matjaz Ravnik, Andreja Persic"Jozef Stefan" Institute, Jamova 39, Ljubljana, Slovenia
AbstractTRIGLAV code was developed for TRIGA research reactor calculations and is based on two-
dimensional diffusion equation. The main purpose of the program is calculation of the fuel elementsburn-up. Calculated core burn-up and excess reactivity results are compared with experimental values.New control rod model is introduced and tested in this paper. Calculated integral control rod worthand calculated integral reactivity curves are presented and compared with measured values.Comparison with measured fuel element worth values is presented as a test for two-dimensional fluxdistribution calculations.
Introduction
TRIGLAV [1] code was developed for TRIGA research reactor calculations. The program isbased on diffusion equation in four-group finite difference approximation and solved in cylindrical,two-dimensional r-<p geometry. The main purpose of the program is calculation of the fuel elementsburn-up. The program is written in modular form. It consists of the main program modules and inputdata files. In the first module, the homogenised effective group constants are calculated usingtransport code WIMS-D/4 [2]. The global calculation is performed in the second module, namedTRIGA2D, using four-group diffusion approximation. The results of calculation are power and fluxdistributions and multiplication factor of the system. In the last module burn-up increments for all fuelelements are calculated on the basis of power distribution and total energy produced by the reactor.
Table 1. Calculated and measured reactivity values for fresh and burned cores. Reactivity values werecalculated with TRIGLAV code. Core loading pattern 133.1 with burned fuel is identical to core
loading pattern 133 with fresh fuel. Core loading pattern 134.1 with burned fuel is identical to coreloading pattern 134 with fresh fuel. Core loading pattern 134.1 was established in six steps. In the firststep the core 133.1 was rearranged. Then five additional fuel elements were inserted in five additional
steps to establish the core 134.1.
Fresh fuel
Burned fuel
Average coreburn-up
=1.1 MWd
Corenumber
132133134
133.1step 1step 2step 3step 4step 5134.1
Measured reactivity[pcma]
-135±15266±15
2020±100-1640±400-2330±300-1640±270 '-1020±190-435±7054±15458±15
Calculated reactivityfpcm]-1192601850
-1194-1747-1300-832-35654
454
1 pcm or "per centenas millias" equals 10"5-Ak/k.
Nuclear Energy in Central Europe '98 29

The program has been thoroughly tested. Calculated burn-up and reactivity results werecompared with measured ones. Fuel element burn-up calculation error was estimated [3] in average to±0.05. Calculation error for almost all fuel elements is smaller than ±0.05. The discrepancy is biggeronly for the fuel elements close to the reflector (F ring) or near control rods, and can be up to ±0.2 [4].Good agreement with experiment was also observed in global core burn-up calculations and globalcore critical calculations. Comparison between benchmark experiment results [5] [6] and calculatedvalues is presented in Table 1.
Control Rod Model
The TRIGLAV program uses average unit cell approximation for fuel and non-fuel elements asthe geometry model. Control rods are modelled as two separate unit cells; namely absorber andfollower unit cells. These unit cells may differ in composition and dimensions for different controlrods (i.e. transient, regulating). More detailed specifications of the control rods model can be found inTable 2. Four-group cross sections for these unit cells are calculated using WIMS-D/4 lattice code.The group constants belonging to follower and absorber unit cells are homogenised by thermal fluxweighting according to control rod insertion.
Table 2. Control rod dimensions and material data.
LocationOutside diameter [cm]Cladding thickness [cm]Material absorber
density |g/cm3]followerm(U) [g]m(235U) [g]claddingdensity [g/cm3]
Transient rodC-043.1750.0711B4C2.48void
Aluminium2.7
Safety rodC-103.49250.0508B4C2.48ST12b
235.6246.89Stainless steel7.889
Regulating rodD-013.49250.0508B4C2.48ST12232.9246.35Stainless steel7.889
Shim rodD103.49250.0508B4C2.48ST12238.4547.45Stainless steel7.889
Follower and absorber weights are calculated in one-dimensional approximation usingBINODE code [7], One-dimensional axial geometry with two zones is used. Absorber and followerzone thickens is calculated according to control rod insertion. Cross sections used in one-dimensionalcalculation are calculated with WIMS-D/4 code in same unit cell approximation using super-cellapproach. Non-fuel unit cells (absorber or air-follower) are surrounded with six fuel elements andentire super-cell cross sections are used in one-dimensional calculation. Normalised thermal fluxmultiplied with control rod insertion is used as weight for each zone. Control rod cross sectionshomogenised with one-dimensional thermal flux weights are then used in two-dimensional calculationwith TRIGA2D code for global core calculations.
Control Rod Worth
Reactor core excess reactivity for particular control rod and specific insertion was calculatedwith TRIGLAV and compared with experimental results. Benchmark reactor core configuration no.134 was selected for these calculations. All calculated results are compared to experimental values,which were obtained by the rod-exchange method and rod-insertion method and are presented in Ref.[6]. For all rods of the same type equal difference between calculated and measured results wasobserved. To correct this discrepancy control rod diameter correction factor was introduced.Measured and calculated integral control rod worth values for completely inserted rods are presented
1 ST12 stands for standard 12% uranium concentration, 20% enriched fuel type.
30 Nuclear Energy in Central Europe '98

in Table 3. Calculated integral reactivity curves are presented in Figure 1 and compared toexperimental results.
Table 3. Measured and calculated integral control rod worth values for reactor core no. 134. Controlrod worth was measured by the rod-insertion method.
MeasuredCalculated no correction [pern]
with correction [pem]correction factor
Transient2270±227
129921021.3
Safety3440±344
272634381.2
Regulating2252±225
183722811.2
Shim2430±243
183422751.2
Regulating Control Rod
II ';
i
- p<A
T
Shim Control Rod
Safety Control Rod
40 60
Insertion [%]
\
I
:
V-y.
:
.
40 60
Insertion [%]
5 1000
\
/ .-4-
- ' /
CalculatedMeasuredwith rod-exch
- | - Measuredwith rod-inser ton
40 60
Insertion [%]Transient Control Rod
Ax
A
/
•
— T •• ••=
-• 1 •
: • - •
:
- ; • • • •
• 1 :
:
40 60Insertion [%]
Figure 1. Calculated and measured integral reactivity curves for all for control rods in TRIGA reactorcore no. 134. The dashed curve represents experimentally determined values by the rod-exchange
method. The cross represents the integral value (measured with rod-insertion method).
Calculated two-dimensional thermal flux distribution in core no. 134 for all-rods-out conditionis presented in Figure 2. Calculated two-dimensional thermal flux distributions for the same reactorcore with regulating control rod completely inserted is presented in Figure 3.
Fuel Element Reactivity Worth
The purpose of this calculation was to determine fuel element worth w in realistic TRIGAreactor core and to compare calculated and measured results. Experimental results were obtainedduring benchmark experiment in core no. 134 [6]. In general, fuel element worth depends on theproduct of the thermal flux tj> and its adjoint y/ at given location f in the core:
Mr)*Zf(r)-t(r)-ir(r) (l)
Nuclear Energy in Central Europe '98 31

where Z f is the macroscopic thermal fission cross section of the fuel element at F .In the case of a well-thermalized, small, compact, and uniform TRIGA core, where the adjoint
distribution at least in inner rings may be well approximated by the thermal flux itself, the fuelelement worth becomes proportional to tj>2.
In TRIGLAV Y.; are calculated for each fuel element unit cell according to core loadingpattern, fuel element enrichment and uranium content. For this reason, comparison between measuredand calculated fuel element worth is good test for calculated two-dimensional flux distribution.
20.00 -I
15.00-j
10.00-
5.00
[cm] 0.00-
-5.00-
-10.00-
-15.00
-20.00
V
10.9510.9010.850.80
I 0.7510.7010.6510.60 '10.55
0.5010.45
- \ 0.40-i0.35
— 0.30-- !0.25—!o.20i—i 0.15
Thermal flux(relative units)
-20.00 -15.00 -10.00 -5.00 0.00
[cm]
5.00 10.00 15.00 20.00
Figure 2. Calculated thermal flux for all-rods-out condition in core no. 134. Relative units. Differentrings are separated with white lines. S, C, R and T denotes position of control rods (safety, shim,
regulating and transient, respectively).
Fuel element reactivity worth was measured in core no. 134. It was determined from thedifference in critical position of the regulating rod, calibrated by the rod-exchange method before andafter the fuel element was withdrawn from the core. So all fuel element reactivity worth was measuredwith regulating rod partially inserted.
Fuel element reactivity worth calculation was performed in core no. 134 in two sets. In first setfuel element worth was calculated with regulating rod completely withdrawn. In next set fuel elementreactivity worth was calculated with regulating rod partially inserted (control rod insertion wasapproximately set to experimental control rod position). In both cases fuel element reactivity worthwas calculated from difference between calculated core excess reactivity before and after the fuelelement was withdrawn from the core. Fuel element worth calculation results are presented in Table 4and in Figure 4 together with experimental results [6].
h'tick'ar Energy in ( enlrni burope

20.00-
15.00-
10.00-
5.00-j
[cm] 0.00
-5.00-
-10.00-
-15.00-
-2O.!
rif,«
Y-t-
.00-
0.9510.90j 0.8510.80107510 70106510601055lo5O
—1040—10 35—1030
0 250.200.15
Thermal flux(relative units)
-2rl00 -15.00 -5.'00 0.00 5.03~ 1o!i)O 155)
[cm]
I
Figure 3. Calculated thermal flux for regulating control rod completely inserted in core no. 134.Relative units. Different rings are separated with white lines. S, C, R and T denotes position of control
rods (safety, shim, regulating and transient, respectively).
Table 4. Fuel element reactivity worth in different positions measured in core no. 134, together withcalculated values for two different calculation models - with control rod and without.
Experiment11
Measuringposition
A-01B-02B-04B-05C-08C-09D-llD-13E-I4
Fuel elementID number
675369457251675472177257723272707241
Regulating rodinsertion [%]
494743434649545460
Elementworth [pcm]
922 ±921040 ±1041194 ±1191163 ±1161070 ±107951 ±95729 ±73747 ±75508 ±51
CalculationAROd
Elementworth [pcm]
560867875834650633422570345
Regulating rod insertedRegulating rodinsertion [%]
505040405050505060
Elementworth [pcm]
682884965899761716520659448
c The error in fuel element worth experiment was estimated to be smaller than 0.1 [6].AU-rods-out, calculations were done without any absorber material present in the core.
Nuclear Energy in Central Europe '98

Fuel Elemet Reactivity Worth• measured
calculated ARO
calculated withregulating rod
A-01 B-02 B-04 B-05 C-08 C-09 D-11 D-13 E-14Measuring Location
Figure 4. Fuel element reactivity worth measured and calculated in core 134.
Conclusions
The main purpose of the TRIGLAV program presented in this paper is calculation of fuelelements burn-up and is not suitable for detailed control rod worth calculations. The analysispresented in this paper applies to TRIGA research reactor cores. Integral control rod worth valueswere used for calibration of modelled control rod unit cell diameter correction factor. Fuel elementreactivity worth values were used for testing calculated two-dimensional flux distributions. Calculatedtwo-dimensional flux distributions with regulating rod partially inserted give better fuel elementreactivity worth results than flux distributions calculated without control rods inserted in the core.
References
[1J A. Persic, S. Slavic, M. Ravnik and T. Zagar, "TRIGLAV - A Program Package for ResearchReactor Calculations", "Jozef Stefan" Institute Report, IJS-DP-7862, (1998)
[2] "WIMS-D/4 Program Manual", Nuclear Energy Agency Data Bank, Saclay, France[3] T. Zagar, "Dolocevanje zgorelosti gorivnih elementov raziskovalnega reaktorja TRIGA",
Diplomsko delo, Univerza v Ljubljani, Fakulteta za matematiko in fiziko, Ljubljana. (1996)[4] T. Zagar and M. Ravnik, "Determination of the Burn-up of TRIGA Fuel Elements by Calculation
with New TRIGLAV Program", 3rd Regional Meeting Nuclear Energy in Central Europe,Portoroz, Slovenia, 16 to 19 September, (1996)
[5] A. Persic, M. Ravnik and T. Zagar, "Bum-up TRIGA Mark II Benchmark Experiment", NuclearEnergy in Central Europe '98, Catez, Slovenia, 7 to 10 September, (1998)
[6] I. Mele, M. Ravnik and A. Trkov, "TRIGA Mark II Benchmark Experiment, Part I: Steady-stateOperation", Nuclear Technology, Vol. 105, pp. 37 - 51, (1994)
[7] A. Trkov, "BINODE - Multigroup 3-Dimensional Neutron Diffusion Nodal Code", "Jozef Stefan"Institute Report, IJS-DP-6178, (1991)
34 Nuclear Energy in Central Europe '98

SI0100090
Nuclear Energy in Central Europe '98
S»\ Terme Catez, September 7 to 10, 1998
Burn-up TRIGA MARK II Benchmark Experiment
A. Persic, M. Ravnik, T. Zagar"Jozef Stefan" Institute, Ljubljana, Slovenia
Abstract
Different reactor codes are used for calculations of reactor parameters. The accuracy of the programs is testedthrough comparison of the calculated values with the experimental results. Well-defined and accuratelymeasured benchmarks are required. The experimental results of reactivity measurements, fuel element reactivityworth distribution and fuel burn-up measurements are presented in this paper. The experiments were performedwith partly burnt reactor core. The experimental conditions were well defined, so that Ihe results can be used as aburn-up benchmark test case for a TRIGA Mark II reactor calculations.
1. Introduction
After the reconstruction and the modification of TRIGA MARK II reactor in Ljubljana in1991, a set of experiments on the fresh reactor fuel was made. The results were evaluated andmay be used as benchmark for fresh fuel of TRIGA MARK II reactor. Seven years later in1998 we repeated the measurements of some reactor parameters with partly burnt reactor fuelin the same core configuration. The results of the measurements will serve as the verificationof the computer program for burn-up calculations.
The scope of this paper is to present the burn-up TRIGA Mark II benchmark experiment.The goal of our TRIGA benchmark measurements was to determine the following:• the multiplication factor of two core configurations identical as in 1991 benchmark,• the fuel elements reactivity worth and• burn-up of some fuel elements.
2. Critical experiment
Well-defined, uniform and compact core with simple geometry is required for testingcriticality calculations. The reactor cores described in [1] and labelled 133 and 134 aresuitable for testing keff calculations. 40 fresh standard TRIGA fuel elements with 12 wt%uranium and 20% enrichment were used. The neutron source was in the E-12 position. Thecore 134 is similar to the core 133, but it has five additional fresh fuel elements in E ring andthe neutron source was located in E-7 position. The excess reactivity of both cores wasmeasured using digital reactivity meter DMR-043 [2]. It extends the practical range of thereactivity measurements from -20xl0"5 to 300xl0"5. During the experiments all control rodswere withdrawn. The same core configurations were used in the criticality experiment usingpartly burnt fuel elements (the core 133.1 and 134.1). The calculated burn-up data of all fuelelements from the core 134.1 are presented in Table 1.For reactivity measurements the source multiplication method was applied [3] because thesystem was deeply subcritical. A previously determined control rod reactivity 5pi wasinserted into a subcritical reactor system with unknown initial reactivity po. The value of po isdetermined as a function of three parameters: Spi, the flux signal level of the initial and of the
Nuclear Energy in Central Europe '98 3 5

final states in a subcritical transient. During the experiment, the flux level was measured withtwo independent neutron counters to check the influence of the detector position on themeasurements. BF3 neutron counter was located outside of the reactor tank and the fissioncounter was located near graphite reflector. To check the influence of the control rod positionon the measured flux signal the sequence of four independent measurements was made ateach core configuration (the reactivity was inserted into the system using the regulating,safety, shim and transient control rods).
Table 1: Burn-up and initial uranium content of fuel elements used in the experiment.
Elementnumber675365746945694772516754724872557212721372147249728272177257721972207235725672237247726872287229
Uranium(g)
272.94279.00278.74278.98281.18273.17281.18281.16277.68277.97277.44281.06277.39279.51280.78278.74278.45280.47280.11277.97279.59279.24277.97277.25
Burn-up(%)1.720.931.040.971.224.101.744.003.913.913.944.014.081.244.164.044.020.933.223.133.243.233.143.28
Elementnumber726672327233727072367225726572457218725072597254725272537258726172467241722172437234717771787179
Uranium(g)
276.50278.45278.45276.38278.45277.32277.20277.04277.20281.42275.13277.03278.98278.98274.88275.37274.77274.89276.31276.43274.48232.92235.62238.45
Burn-up(%)0.940.863.503.453.563.503.323.320.903.910.981.021.061.010.961.720.991.171.680.421.092.853.573.07
Experiments began with the core 133.1 and the reactivity of the system was measured. Thesystem was deeply subcritical. The core 134.1 was established in six steps. In the first stepthe core 133.1 was rearranged. Then fuel elements were inserted in E13, E14, E15, E2 and E3in five additional steps to establish the core 134.1. The reactivity was measured after eachstep using the source multiplication method. The system was critical when three fuel elementswere added. To determine inserted control rods reactivity, the control rod reactivity worth wasmeasured by the rod exchange [2] and by the rod insertion methods [4]. The results arepresented in the Table 2. The results obtained by rod insertion method were used in kefrmeasurements.
Some corrections of the measuring flux signal were needed to eliminate the influence of thecontrol rods position regarding to detector position [4]. The measured flux signal consists oftwo contributions: the nonhomogeneous part presents the disturbance caused by insertedcontrol rod while the homogeneous part belongs to the basic, undisturbed solution. When thetransient was performed with regulating or with shim control rods, the flux signal measuredwith fission counter was corrected. When the transient was performed with safety or transientcontrol rods, the flux signal measured with BF3 counter was corrected. The multiplicationfactors calculated with corrected flux signals are presented in Fig. 1.
36 Nuclear Energy in Central Europe '98
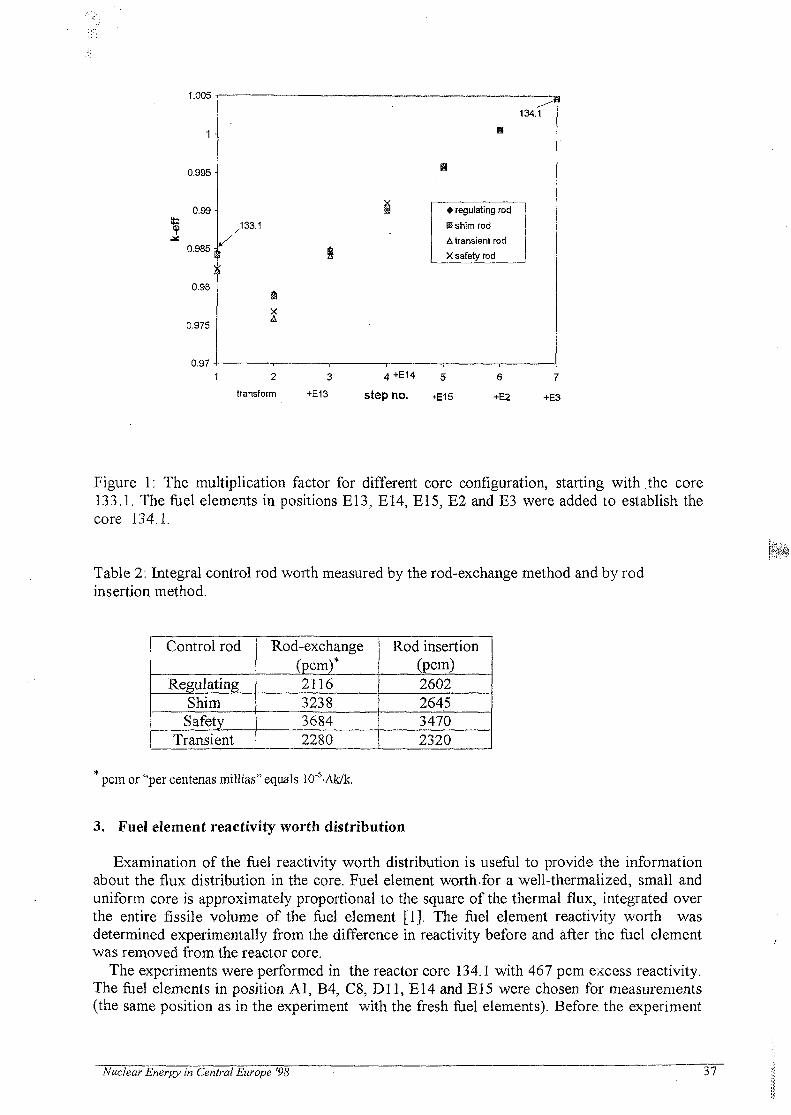
1.005
1 -
0.995 -
0.99 •
0.985:
0.98 -
0.975 -
0.97
134.1
133.1
• regulating rod j
E shim rod
A transient rod
X safety rod
XA
1 2 3
transform +E13
A +E14 5 6 7
Step no. +E15 +E2 +E3
Figure 1: The multiplication factor for different core configuration, starting with .the core133.1. The fuel elements in positions E13, E14, E15, E2 and E3 were added to establish thecore 134.1.
Table 2: Integral control rod worth measured by the rod-exchange method and by rodinsertion method.
Control rod
RegulatingShimSafety
Transient
Rod-exchange(pcm)*2116323836842280
Rod insertion(pcm)2602264534702320
pern or "per centenas millias" equals 10"5-Ak/k.
3. Fuel element reactivity worth distribution
Examination of the fuel reactivity worth distribution is useful to provide the informationabout the flux distribution in the core. Fuel element worth.for a well-thermalized, small anduniform core is approximately proportional to the square of the thermal flux, integrated overthe entire fissile volume of the fuel element [1]. The fuel element reactivity worth wasdetermined experimentally from the difference in reactivity before and after the fuel elementwas removed from the reactor core.
The experiments were performed in the reactor core 134.1 with 467 pcm excess reactivity.The fuel elements in position Al, B4, C8, Dl l , E14 and E15 were chosen for measurements(the same position as in the experiment with the fresh fuel elements). Before, the experiment
Nuclear Energy in Central Europe '98 37

the measured element was removed from the core and the the core reactivity change wasmeasured. The reactivity worth of the elements in inner rings of the core is about 1000 pcmor more so the system was subcritical when a fuel element was withdrawn from the core. Themethod of source multiplication described in the previous section was used for subcritical
>rth
(p
cm)
elem
ent w
e
1200 •
1000 •s
800 •
600 '
400 -
200 -
0 •
/ A^/] B
/ burnt fuel
A
c
.fresh fuel
VD
E
10 15
r{cm)
Figure 4: Averaged fuel element reactivity worth by rings.
measurements. The regulating or safety control rods were used to insert the negative reactivitychange in the system and flux was measured with fission chamber. The subcriticality of thecore was determined to the flux ratio when the control rod was fully inserted in the coreand when it was withdrawn. Results for fuel elements reactivity worth are presented in theTable 3 together with the measurements of the fresh fuel elements. The average elementworth in a certain ring is presented in Fig. 4.
The fuel element reactivity worth in A ring is lower than in B and C rings. This indicatesthat the flux in the centre is lower than in B or C rings. The reactivity worth of the elements inouter rings decreases with increasing radius of the core. The results were confirmed by theflux distribution measurements [5]. The difference between reactivity worth of fresh andburnt fuel depends on the burn-up history of the element. The large difference is observed forelement in A ring ( burn-up of this element is 1.76%), the smallest for element in D and Ering (0.82 and 1.19% burnt).
Table 3: Fuel element reactivity worth for different positions in the core 134.1.
Positionin the core,(element number)
Al (6753)B4(7251)C8 (7217)
Dl 1(7232)E14 (7241)El5 (7221)
Burn-up(%)
1.761.251.260.821.191.71
Element worthfresh fuel
(pcm)92211941070729508
Not measured
Element worthburnt fuel
. (pcm)6621016966665453502
38 Nuclear Energy in Central Europe '98

4. Fuel element burn-up measurements
Fuel element burn-up was measured with the reactivity method. The reactivity method [6]is based on the fact that the reactivity worth of the fuel element is a known function of burn-up. If we measure the reactivity worth of the fuel element we can calculate its burn-up. Butbecause the absolute criticality calculations are not very accurate it is better to rely only onrelative differences between reactivity worth of elements, which are proportional todifferences in burn-up. When the burn-up of at least two measured fuel elements is knownwe can determine the absolute value of burn-up for all elements.
The measurements were performed in the core 161 loaded only with standard 12 wt%uranium, 20% enriched, burnt fuel elements. The system of elements was slightlysupercritical. Location C6 was chosen for measurement position. In this location thereactivity worth of the element is high and the gradient of neutron flux is approximatelyconstant. The measurements are relative so the configuration of the reactor core was constantduring the experiment. The control rods were withdrawn during the reactivity measurementswith digital reactivity meter to eliminate the redistribution effect of the control rods.
Nine standard, 12 wt % uranium, 20% enriched TRIGA fuel elements included in the core134 were selected for measurements. Four of them ( elements 7213, 7243, 7247 and 7258)spent most of their lives in the vicinity of the control rods, near irradiation channel or in theoutermost ring. The elements 6945, 7219, 7220 and 7228 were identified to have a relativelysimple and well-defined burn-up history. The element 7215 was almost fresh (0.02 MWd) andserved as reference element for absolute burn-up determination. Measurements started withthe element with the highest burn-up value (element 7219). It was inserted into the selectedmeasuring position and the core reactivity was measured. After that the reactor was shut downand the element was replaced by the next fuel element. At the end of the measurements theelement 7219 was measured again to determine reproducibility of the reactivitymeasurements (± 1 port difference in 97 minutes interval).
The first set of the measurements was performed only 20 hours after the reactor was shutdown. Reactor worked one day at full power (250 kW) and produced 6.378 MWh energy.The strong effect of Xe on measured reactivity was observed (the variation of reactivitymeasurement of the element 7219 is 7 pcm in 132 minutes). We repeated all measurementsagain next day (40 hours after shut down of the reactor) to estimate the Xe influence onmeasured reactivity. We also estimated the effect of burn-up gradient of the fuel element torotate it around its vertical axis.
The results of measurements of nine standard TRIGA fuel elements are presented in Fig. 5.Measured burn-up values were also compared to the calculations using burn-up programTRIGLAV [7]. The whole operating history of the reactor from 1991 to today wasrecalculated. The accuracy of calculated burn-up of a particular fuel element depends on itsposition in the core and on the precision of the operational records. It is estimated to + 0.5%235U [8]. The results are presented in Table 5.
Three types of errors can occurr in the measured reactivity: the. first is the uncertainly in thefuel material composition with respect to initial uranium, zirconium, and hydrogen content inthe measured fuel elements. Reactivity correction due to difference in uranium content iscalculated for each element, assuming a linear dependence on uranium weight [8]. Wesupposed that the calculated burn-up of fuel element 6945 is too low due to uncertainty ininitial hydrogen and zirconium content (different batch of fuel elements). The second sourceof the errors is the orientation of the fuel element. When the fuel element was rotated aroundits axis, the difference in measured reactivity was observed. Measurements of elements 7228and 7258 showed that the effect contributes about ±8 pcm to reactivity measurements.The
Nuclear Energy in Central Europe '98 39 {
I

uncertainty of radial and axial location of the element and errors of the digital reactivitymeter were estimated to ±5 pern [8].
160-, x measuredburn-up 1 fit: y=146.02-15.88x
• calculatedburn-up 2 fit: y=145.97-13.51x
60
Burn-up [%]
Figure 5: Results of reactivity measurements and calculations as a function of calculatedburn-up.
Table 5: Measured and calculated reactivities. Measured burn-up 1 values were obtained byweighted linear fit of measured reactivity and measured burn-up 2 values by weighted linearfit of calculated reactivity.
Element
721972207228694572137247725872437215
Reactivitycalculation(pem)
33.432.037.565.029.141.551.367.880.9
Measuredreactivity(pem)
96.894.874.992
77.889
130.9135.8144.7
Calculatedburn-up
(%)4.504.493.641.274.603.941.100.540.02
Measuredburn-up 1
(%)3.743.804.934.04
• 4.74
4.420.590.660.03
Measuredburn-up 2
(%)4.374.465.764.725.555.170.690.770.02
40 Nuclear Energy in Central Europe '98

£3 measured 1a calculatedD measured 2
7219 7220 7228 6945 7213 7247 7258
Fuel element number
7243 7215
Figure 6: Calculated burn-up values and values measured by the reactivity method.
4. Conclusion
The results of experiments including reactivity measurements, control rods measurements,element reactivity worth distribution and burn-up measurements are presented and discussedin this paper. Reactivity was measured for two TRIGA Mark II core configurations includingburnt fuel elements. The systems were subcritical. Criticality was determined using sourcemultiplication method. Two independent flux detectors were used in the experiments todetermine the influence of the detector position. Fuel element worth was measured for sixburnt fuel elements at different location in the core. The effect of fuel element burn-up onmeasured reactivity worth was observed.The burn-up measurements of nine standard TRIGAfuel elements using reactivity method are presented. Comparison with the calculated valuesshows good agreement within ±1% burn-up for almost all investigated fuel elements. Themeasurements of reactivity show that before the experiment the reactor must be shut downfor at last 50 hours to reduce xenon effects (clean reactor condition). The orientation of fuelelement is also important for the measurements.
References
[1] I. Mele, M. Ravnik, A. Trkov: TRIGA MARK II Benchmark Experiment, Part I:Steady - State Operation, Nuclear Technology, 105, (1994), pp. 37-52.
[2] A. Trkov, M. Ravnik, M. Bock, B. Glumac: Reactivity Measurements in a Close- to-critical TRIGA Reactor Using a Digital Reactivity Meter, Kerntechnik 57 No. 5, (1992), pp.296-300.
[3] K.O. Ott: Nuclear Reactor Dynamics, American Nuclear Society, La Grange Park,Illinois, (1985).
Nuclear Energy in Central Europe '98 41

[4] A. Trkov, M. Ravnik, H. Wimmer, B. Glumac, H. Bock: Application of the Rod-Insertion Method for Control Rod Worth Measurements in Research Reactor, Kerntechnik 60,No. 5-6, (1995), pp. 255-261.
[5] J. Rant, M. Ravnik, I. Mele, V. Dimic: Measurements of Neutron Flux Distributions inthe Core of the Ljubljana TRIGA Mark II Reactor, 12th European TRIGA Users Conference,Pitesti, Romania, (1992).
[6] M. Ravnik, M. Strebl, H. Bock, A. Trkov, I. Mele: Determination of the Burn-up ofTRIGA Fuel Elements by Calculation and Reactivity Experiments, Kerntechnik 57 No.5,(1992), pp. 296-295.
[7] A. Persic, S. Slavic, M, Ravnik: TRIGLAV- A Program Package for Research ReactorCalculations, J. Stefan Report, IJS-DP-7862 (1998).
[8] M. Ravnik, T. Zagar, A. Persic: Fuel Element Burn-up Determination in Mixed TRIGACore Using Reactor Calculations, to be published.
42 Nuclear Energy in Central Europe '98

SI0100091
Nuclear Energy in Central Europe '98
Terme Catez, September 7 to 10, 1998
CHARACTERIZATION OF NEUTRON FLUX IN THEEXPOSURE CHANNEL F19 OF THE TRIGA MARK II
REACTOR IN LJUBLJANA
Edvard S. Kristof
Institut Jozef Stefan, Jamova 39, Ljubljana, Slovenia
Abstract
In this paper a description of the neutron flux in the vertical irradiation channel F19 of theLjubljana TRIGA reactor is given. In this channel small samples of materials that are wellknown in reactor metrology such as gold, indium, aluminium, etc. were irradiated. Afterirradiations gamma ray spectra were measured and from the saturation activities of suitablereactions the neutron spectrum was calculated. Also, the variation of the thermal flux aroundthe circumference of the container was determined.
Introduction
The channel F19 is one of the most used irradiation facilities of our reactor. For example, inthe last two years irradiations of minerals with the aim of determining their age, and manysemiconductor materials for studying changes in their properties due to fast neutronbombardment were carried out. Anyhow, for an evaluation of data the neutron flux spectrummust be known. For this reason the I97Au(n,y) reaction with bare diluted gold, 197Au(ryy) withdiluted gold under cadmium cover, n5In(n,y) with diluted indium under cadmium cover,58Fe(n,y) under cadmium cover, 63Cu(n,y), 63Cu(n,y) under cadmium cover and the thresholdreactions U5In(n,n5), 27Al(n,a), 59Co(n,a), 59Co(n,p) were utilized.
Irradiation set-up
A simplified cross-section through the reactor core at the half height of the fuel elements isshown in Fig.l. Letters OK, CK and PP denote vertical irradiation channels.A sample for irradiation is put in a cylindrical container of aluminium. The outer diameter ofthe container is 2.5cm, and its usable height is 8cm. Irradiation of the sample begins bylowering the container into the core, and finishes by lifting it back, or by scramming thereactor.
Nuclear Energy in Central Europe '98 43 |
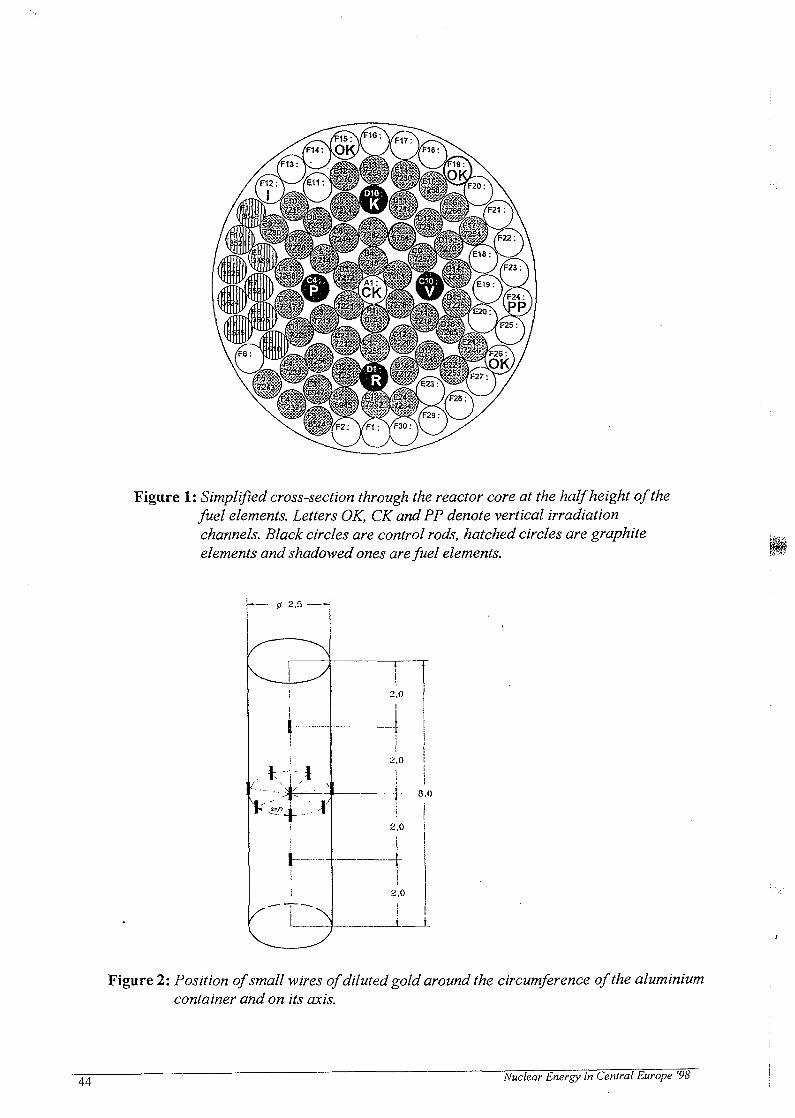
Figure 1: Simplified cross-section through the reactor core at the half height of thefuel elements. Letters OK, CK and PP denote vertical irradiationchannels. Black circles are control rods, hatched circles are graphiteelements and shadowed ones are fuel elements.
9 fi —'
I
"T2.0I
2.0
— j - 0.0
! i2,0 1
|_
2,0
i
_L L
Figure 2: Position of small wires of diluted gold around the circumference of the aluminiumcontainer and on its axis.
44 Nuclear Energy in Central Europe '98
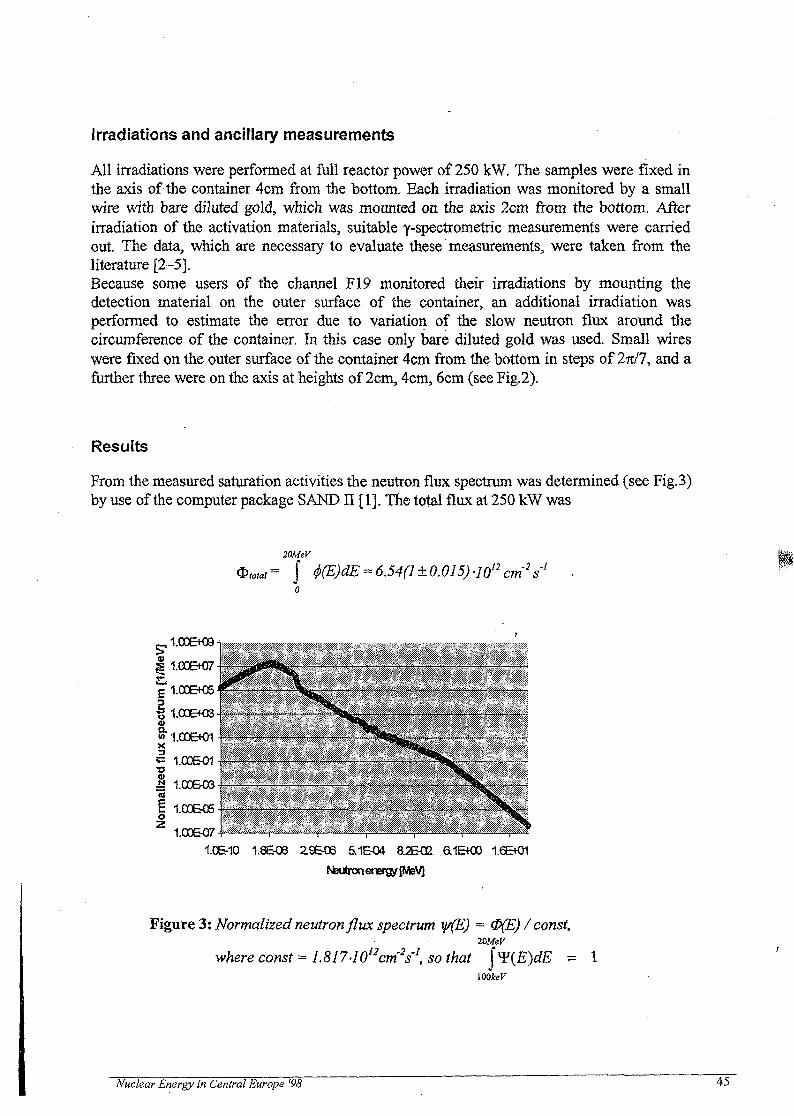
Irradiations and ancillary measurements
All irradiations were performed at full reactor power of 250 kW. The samples were fixed inthe axis of the container 4cm from the bottom. Each irradiation was monitored by a smallwire with bare diluted gold, which was mounted on the axis 2cm from the bottom. Afterirradiation of the activation materials, suitable Y-spectrometric measurements were carriedout. The data, which are necessary to evaluate these measurements, were taken from theliterature [2-5].Because some users of the channel F19 monitored their irradiations by mounting thedetection material on the outer surface of the container, an additional irradiation wasperformed to estimate the error due to variation of the slow neutron flux around thecircumference of the container. In this case only bare diluted gold was used. Small wireswere fixed on the outer surface of the container 4cm from the bottom in steps of 2TC/7, and afurther three were on the axis at heights of 2cm, 4cm, 6cm (see Fig.2).
Results
From the measured saturation activities the neutron flux spectrum was determined (see Fig. 3)by use of the computer package SAND II [1], The total flux at 250 kW was
20MeV
= J t(E)dE=6.54(1±0.015)-W12cm2'sl
1.G0EKJ7
I 1.00BO3
» 1.00BO1x£ 1.GQ&O1
1 iooe-03a
1.00BO5o
1.00BO7
1.06-10 1.8EO8 29EO3 5.1&04 a2EO2 6.1E+00 1.6B01
Neutron energy [MeV]
Figure 3: Normalizedneutron flux spectrum yrfE) = <P(E) / const,
where const = 1.817-1012cm'2s'1, so that j*F(E)d£ =lOOkeV
Nuclear Energy in Central Europe '98 45

Integrals of the neutron spectrum at the most characteristic regions are
O.SeV
<&*«»*= J (j>(E)dE -3.19(1 ±0.029)-JO12 em's'1
lOOkeV
** j 4(E)dE ==1.53(1 ±0.021)-W12cm2's1
0.5eV
20UeV
<$>fasl = | 4(E)dE =1.82(1 ±0.024)• W12cm2s!
lOOkeV
The error in these values was determined with variation of the saturation activitiesconsidering the uncertainties of all the individual y-spectrometric measurements.
The saturation activity for the reaction 197Au(n,y) at discrete values of the azimuthal angle Sis given in the Table 1. The Fourier trigonometric sum S3 = a($) with the property a(&() = ajis shown in the Fig. 4. The ratio a ^ / a ^ between the extreme values is equal to 1.10. Theaverage value of a(S) is
2n
nucleus Au
The number
r\\{a{S)-<ifd$s = _i-5 = 0 _ 0 3 0
is significant. Namely, the average value a coincides with the value % in the centre at R=0,H=4cm within its error. So s is the expected systematic error for a single irradiationwhenever the fluence is monitored on the surface of the container. This error must be addedto errors of other origin.
46 Nuclear Energy in Central Europe '98

5.30E-10 -i
g 5.20E-10
5.10E-10
4.90E-10
4.80E-10
4.70E-10
4.60E-10
4.50E-100.00 0.90 1.80 2.69 3.59 4.49
Azlmuthal Angle
5.39 6.28
197Figure 4: Aufn, y) saturation activity on the circumference of the container asfunction ofazimuthal angle &
Table 1: mAu(n, y) saturation activity of small wires. Counting errors are given inparentheses.
i
1
2
3
4
5
6
7
8
9
10
azknuthal angle &,
0
lull
Anil
6nll
Sn/7
IOTI/7
12TI/7
/
/
/
R
1.30cm
1.30cm
1.30cm
1.30cm
1.30cm
1.30cm
1.30cm
0
0
0
H
4cm
4cm
4cm
4cm
4cm
4cm
4cm
2cm
4cm
6cm
saturation activityBq/nud. m Au
0.5143-10~9
(l±0.008)
0.5200-10"9
' (l±0.009)
0.5200-10-9
(ldtO.008)
0.5193-10'9
(l±0.009)
0.5014-10'9
(l±0.010)
0.478 MO'9
(l±0.009)
0.4934-10"9
(1±0.010)
0.5128-10-y
(l±0.008)
0.5030-10-9
(l±0.008)
0.4956-10"9
(l±0.007)
Nuclear Energy in Central Europe '98 47

Acknowledgement
/ would like to thank Bojan Huzjan, Janez Jezersek, Darko Kavsek, Mitja Kozuh, BojanOman, Gvido Pregl and Marko Rosmanfor kind support, and Joze Rant for obtaining thesoftware package SAND II.
References
[1] SAND II - Neutron Flux Spectra Determination by Multiple Foil Activation, January1994, Oak Ridge National Laboratory, USA.
[2] J. H. Baard, W. L. Zijp, H. J. Noithenius,Nuclear Data Guide for Reactor Neutron Metrology, Kluwer Academic Publishers, 1989,Dordrecht, The Netherlands.
[3] JEF-PC, A personal Computer Program for Displaying Nuclear Data from the JointEvaluated File Libray, 1997, OECD Nuclear Energy Agency, Issy-les-Moulineaux, France.
[4] N. G. Gusev and P. P. Dmitriev,Quantum Radiation of Radioactive Nuclides, 1979, Pergamon Press, Kronberg - Taunus,Germany
[5] W, Seelman-Eggelbert et al, Karlsruher Nuklidkarte, Kernforschungszentrum, Karlsruhe,Germany.
- j o " ~~~~ ~~~ Nuclear Energy in Central burop

SI0100092Nuclear Energy in Central Europe '98
Terme Catez, September 7 to 10, 1998
Suitability Study of MCNP Monte Carlo Programfor Use in Medical Physics
R. Jeraj
Reactor Physics Division, Jozef Stefan Institute, Slovenia
Abstract
MCNP is widely used Monte Carlo program in reactor and nuclear physics. However, an option ofsimulating electrons was added into the code a few years ago. With this extension MCNP became a code,potentially applicable for applications in medical physics. In 1997, a new version of the code, named MCNP4Bwas released, which contains several improvements in electron transport modelling.
To test suitability of the code, several important issues were considered and examined. Defaultsampling in MCNP electron transport was found to be inappropriate, because it gives wrong depth dose curvesfor electron energies of interest in radiotherapy (MeV range). The problem can be solved if ITS-style energysampling is used instead. One of the most difficult problems in electron transport is simulation of electronbackscattering, which MCNP predicts well for all, low and high Z materials. One of the potential drawbacks, ifsomebody wanted to use MCNP for dosimetry on real patient geometries is that MCNP lattice calculation (e.g.when calculating dose distributions) becomes very slow for large number of scoring voxels. However, if just onescoring voxel is used, the number of geometry voxels only slightly affects the speed.
In the study it was found that MCNP could be reliably used for many applications in medical physics.However, the established limitations should be taken into account when MCNP is used for a particularapplication.
Introduction
MCNP is a general-purpose Monte Carlo code used for calculating the time-dependentcontinuous-energy transport of neutrons, photons and electrons in three-dimensionalgeometries. MCNP has been extensively used in reactor and nuclear physics, but with theintroduction of electron transport in 1990, use in medical physics became feasible. In 1997, anew version of the code, named MCNP4B [1] was released, which contains severalimprovements in electron transport modelling. This is very important for applications inmedical physics, which are mostly based on coupled electron/photon transport. To establishsuitability of the code for use in medical physics, several comparisons to benchmarkexperiments were performed.
To understand the obtained results it is necessary to describe some specific features ofthe MCNP electron transport model first. For the creation of secondary electrons MCNP usesa class I algorithm (for collisional energy loss), where the energy of the primary electron atthe end of each step is calculated according to the energy-loss straggling algorithm (Landaudistribution with theoretical and empirical modifications [1]), so that the energy is statisticallyconserved. In older versions of MCNP (and ITS) a problem because of inaccurate Landaudistribution sampling, which results in 5-10% underestimation of the mean energy loss,
Nuclear Energy in Central Europe '98 51

occurred [2], However, in MCNP4B the sampling of Landau energy-loss straggling wasimproved to upgrade the MCNP electron physics to the level of the ITS 3.0 [3] so thisproblem is now overcome.
It is also important to note two possible modes of electron energy indexing algorithmthat can be used in MCNP4B [1,4]. The default version uses a so-called MCNP-style energyindexing algorithm (bin-centred treatment). However, it is also possible to use a so-calledITS-style energy indexing algorithm (nearest group boundary treatment), if a special switchon DBCN card is used (DBCN 17j 1). The difference between these two modes is in whichdata (from which energy group) is used if the energy of the electron lies somewhere betweenthe group boundaries. In MCNP, the electron cross section data is tabulated on predefinedenergy grid. The MCNP-style energy indexing uses the electron data from the energy group inwhich the electron starts the step. On the other hand, the ITS-style indexing uses the data fromthe group, which boundary is closest to the energy of the electron at the beginning of the step.This is probably done to account for the electron energy losses during the step. The defaultand ITS-style energy indexing treatment in MCNP4B will be referred to as MCNP4B andMCNP(ITS), respectively.
By performing MCNP simulations both with detailed photon physics switched on, andusing just simple photon interaction model (no coherent scattering, no secondary particlesfrom photoelectric interactions and no binding corrections in Compton scattering [1]) it wasfound that photon transport modelling is adequate.
The aim of this work was to compare MCNP to a clinical example of backscattering,which is one of the most difficult problems for electron Monte Carlo simulations. Beforesimulating the backscattering experiment, electron central axis depth dose curves werecompared. In addition, a timing study was performed on a clinical example of large number ofscoring voxels. Such cases occur when dose calculations are performed on real patientgeometries.
Materials and Methods
Experiments were performed on a Varian Clinac 2100C accelerator using 6 and 18MeV electron beams. All calculations were performed on an HP 712/80 machine, usingMCNP4B version of MCNP if not stated otherwise.
Depth dose curvesDepth dose curves were measured for 6 MeV 10 xlOcm2 electron fields by the
standard technique with ionisation chamber in a water tank. Detailed description of theexperimental set-up can be found in [5]. In the Monte Carlo simulations, a point source at 100SSD was modelled. The shape of the spectrum was taken from the BEAM data [6] andadjusted to fit the experimental depth dose curve as close as possible. Monte Carlo scoringregions were water discs of 1 mm thickness with 4 cm radius. This size was found to be smallenough to cover the field, which is homogeneous within 3%.
Electron backscattering experimentThe backscattering experiments were performed in a water tank with a higher-Z
material block, placed at different depths. Materials used in the experiment, and simulatedwere air, copper and lead to cover materials with different Zs. The Attix chamber and fourdifferent TLDs (black, xtc, tc and nc) were used in the experiment. The experimental set-up isdescribed in [5]. No applicator was inserted for the measurements.
52 Nuclear Energy in Central Europe '98
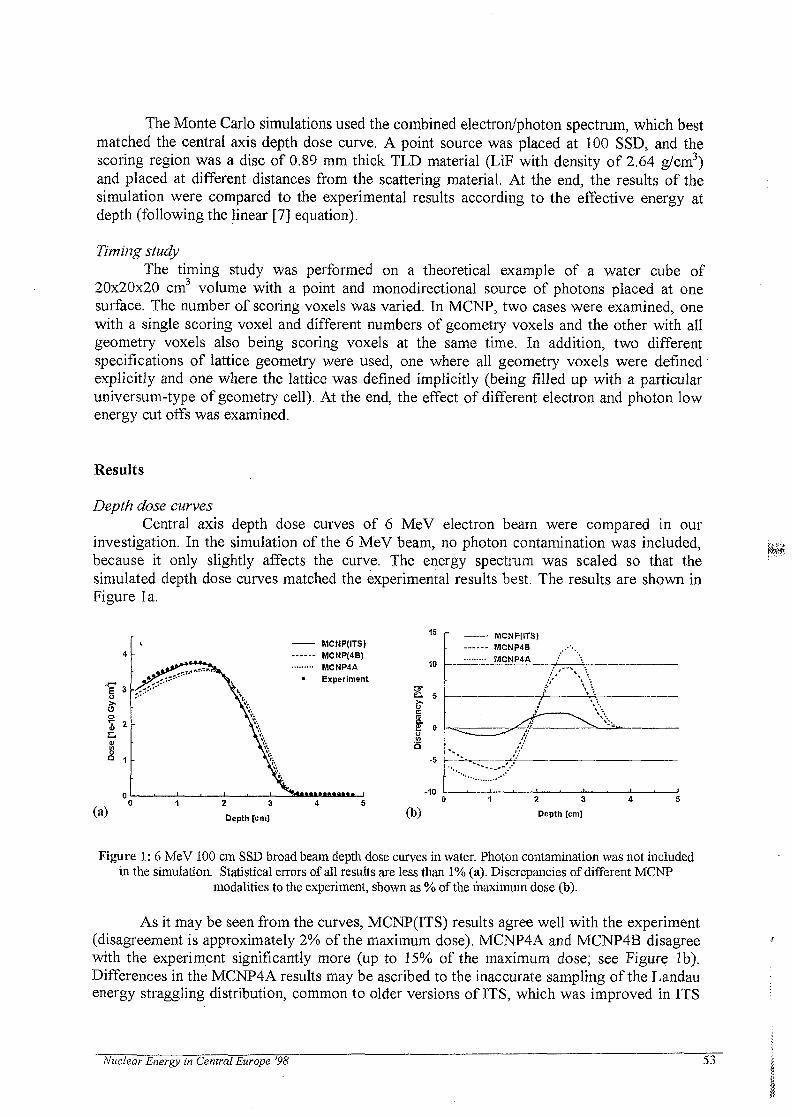
The Monte Carlo simulations used the combined electron/photon spectrum, which bestmatched the central axis depth dose curve. A point source was placed at 100 SSD, and thescoring region was a disc of 0.89 mm thick TLD material (LiF with density of 2.64 g/cm3)and placed at different distances from the scattering material. At the end, the results of thesimulation were compared to the experimental results according to the effective energy atdepth (following the linear [7] equation).
Timing studyThe timing study was performed on a theoretical example of a water cube of
20x20x20 cm3 volume with a point and monodirectional source of photons placed at onesurface. The number of scoring voxels was varied. In MCNP, two cases were examined, onewith a single scoring voxel and different numbers of geometry voxels and the other with allgeometry voxels also being scoring voxels at the same time. In addition, two differentspecifications of lattice geometry were used, one where all geometry voxels were definedexplicitly and one where the lattice was defined implicitly (being filled up with a particularuniversum-type of geometry cell). At the end, the effect of different electron and photon lowenergy cut offs was examined.
Results
Depth dose curvesCentral axis depth dose curves of 6 MeV electron beam were compared in our
investigation. In the simulation of the 6 MeV beam, no photon contamination was included,because it only slightly affects the curve. The energy spectrum was scaled so that thesimulated depth dose curves matched the experimental results best. The results are shown inFigure la.
(a)
MCNP(ITS)MCNP(4B)MCNP4A
• Experiment
2 3
Depth [cm]
15
10
-10
MCNP(ITS)MCNP4BMCNP4A
(b)2 3Depth [cm]
Figure 1: 6 MeV 100 cm SSD broad beam depth dose curves in water. Photon contamination was not includedin the simulation. Statistical errors of all results are less than 1% (a). Discrepancies of different MCNP
modalities to the experiment, shown as % of the maximum dose (b).
As it may be seen from the curves, MCNP(ITS) results agree well with the experiment(disagreement is approximately 2% of the maximum dose). MCNP4A and MCNP4B disagreewith the experiment significantly more (up to 15% of the maximum dose; see Figure 2b).Differences in the MCNP4A results may be ascribed to the inaccurate sampling of the Landauenergy straggling distribution, common to older versions of ITS, which was improved in ITS
Nuclear Energy in Central Europe '98 53

3.0 and MCNP4B. The observed problem was thoroughly described in [2]. Differences inMCNP4B results are predominantly due to the use of wrong energy indexing algorithm. Theuse of MCNP-style energy indexing causes that electrons to be on average assigned thestopping power data, which corresponds to higher energies. That means that electrons onaverage do not lose enough energy and therefore the beam has harder energy spectrum atdepth. This can be seen in Figure 2a,b. Consequently, the fall off of the depth dose curve isshifted towards larger depths and the build-up region is too low.
0.010 r
0.005 -
0.000
(a)
0.010 r
0.005 it
0.000
Energy [MeV] (b) Energy [MeV]
Figure 2: Spectra of 18 MeV electron beam at 5 cm depth in water (a) and behind the water/lead interface (b).The upper two curves correspond to forward travelling electrons and the lower three curves to backscattered
electrons. Note increase of the backscattered electrons in the case (b) compared to the case (a).
Electron backscattering studyAll electron backscattering simulations were performed using the combined
electron/photon 18 MeV spectrum, obtained so that it matches the experimental depth dosecurve best. The electron backscattering factor (EBF), as used in our comparison is defined asa ratio of doses in a detector (TLD) with and without the inhomogenetty placed at somedistance from the detector.
As indicated by the results, the photon contamination only slightly affects the totalEBF, which shows that for dosimetry purposes it may be safely neglected in the simulation,except if interested in the conditions very close to the surface (less than lmm). Note also thevery sharp rise in the EBF close to the interface (compare the results of a TLD placed at 0 and3mm from the interface).
2.01.91.81.71.81.51.41.3121.11.00.90.S0.7
MCNP(ITS)MONP4BExperiment
^-!..*-+..^
Copper
1 2 3 4 5 6 7 8 9 10 11 12 13 14 15 16 17
Energy [MeV]
Figure 3: Comparison of calculated electron backscattering factors (EBF) with the experiment. The EBF wasmeasured/calculated at the surface in lmm thick scoring voxels. Measured/calculated depths were used to
calculate the mean energies at depths according to the linear Harder equation to give rough estimation of theEBF as a function of mean electron energy. Statistical errors of simulations and experiment are less than 2%.
54 Nuclear Energy in Central Europe '98

The comparison of the EBFs for inhomogeneities placed at different depths showsgood agreement between MCNP and experiment for all three materials with different Zs. Thedefault version of MCNP4B'also agrees well with the experiment in spite of the fact that thedepth dose distribution is calculated incorrectly. This is probably because of a cancellingeffect that occurs because the doses with and without inhomogeneity are wrongapproximately by the same factor [8,9].
Timing studyTo conclude our study, a timing study was performed to establish the speed of the
codes and determine the effect of the low-energy cut off to the speed. The number ofgeometry and scoring voxels was varied and also the specification of the geometry in MCNP.The results are shown on Figure 4.
3000 r
—•— MCNP-all/explicit--*--• MCNP-one/explicit•-T— MCNP-all/implicit—•— MCNP- one /Implicit
2000 i
1000 S-
100 1000 10000 100000
Number of particles
Figure 4: Timing study, comparing different modalities of MCNP. 5 MeV monodirectional photon source wasused in the comparison and the number of scoring voxels was varied.
As it may be observed, MCNP becomes extremely slow, when the number of scoringvoxels increases above 104. On the other hand, only a slight reduction of the calculation speedwas observed when just one scoring voxel was defined and the number of geometry voxelswas increased. Further examination showed that the TALPH routine in MCNP uses most ofthe CPU time in the case of large number of scoring voxels. This is because MCNP performsa global search of the combinatorial geometry (checks every lattice element). Improvementsin MCNP calculation speed for a Cartesian (voxel based) geometry were done in [10]changing the tally scoring algorithm and sacrificing some generality of the code.
Also interesting to note is the difference in speed when the lattice geometry is definedexplicitly (each geometry voxel) or implicitly (as filling universum). Approximately a factorof 4 in speed is lost if implicit definition is used.
Sometimes raising up the low-energy cut off may significantly decrease the simulationtime. Dependence of the speed to the photon cut off (PCUT) and electron cut off (ECUT) maybe seen from the Figure 5. As expected the photon cut off has only minor effect on the speedbecause of few photons in the energy range between 10 and 500 keV. On the other hand,because of numerous" low energy electrons, rising up the electron low-energy cut offsignificantly increases the calculation speed for almost a factor of 10 going from 10 up to 500keV. Sometimes (i.e. when the required geometry resolution is coarse), these low-energyelectrons can be safely neglected because of their low range (several mm). Increasing the cutoff (and consequentially increasing the calculation speed) therefore does not effect theaccuracy of the results.
Nuclear Energy in Central Europe '98 55

15000
12000
9000
6000
3000
—•— MCNP(allJ- - * - - MCNP (one)
15000
12000
9000
8000
3000
—•— MCNP (all)- - * - - MCNP (one)
10 100
PCUT [keV]
S00 10 100
ECUT (keVI
500
Figure 5: Effect of the photon (PCUT) and electron (ECUT) low energy cut off to the calculation speed. 5 MeVmonodirectional photon source was used in the comparison.
Conclusions
In our comparison we wanted to check the suitability of MCNP for coupledelectron/photon Monte Carlo transport calculations. Most of the results were compared to theelectron backscattering experiment.
An important difference was observed when the central axis electron depth dosecurves were compared. It was found that only MCNP(ITS) (MCNP4B using ITS-style energyindexing) gives the correct electron depth dose distributions. The discrepancy of the order of10% of the maximum dose was observed when the default MCNP4B (MCNP4B usingMCNP-style energy indexing) or old, MCNP4A version of MCNP were used. Not appropriatesampling of Landau energy straggling distribution in MCNP4A. and not taking into accountenergy losses during the step in MCNP4B are reasons that electron spectra at depth are toohard and consequently the depth dose curves are incorrectly calculated.
A comparison of electron backscattering simulations and measurements showed thatMCNP calculates correct electron backscattering factors for low and high-Z materials.
A timing study on a theoretical example of varying number of scoring voxels wasperformed. It is important to note that a large number of scoring voxels dramatically slowsdown the MCNP calculation. On the other hand, large number of geometry voxels (along withsmall number of scoring voxels) has no significant effect on the speed of the calculation inMCNP. Increasing the photon low energy cut off has only minor effect to the calculationspeed, while electron low energy cut off increases the calculation speed for a factor of 10being risen up from 10 keV to 500 keV.
56 Nuclear Energy in Central Europe '98

References
[1] Briesmeister J F, editor, MCNP ~ A general Monte Carlo N-particle transport code,Version 4B, LA-12625, Los Alamos National laboratory, Los Alamos, New Mexico, 1997.
[2] Rogers D W 0 and Bielajew A F, Differences in electron depth-dose curves with EGSand ETRAN and improved energy-range relationships, Med. Phys. 13(5), 687-694, 1986.
[3] Hendricks J S and Court J D, MCNP4B verification and validation, LA-13181, LosAlamos National Laboratory, Los Alamos, New Mexico, 1997.
[4] Gierga D P and Adams K J, Electron photon verification calculations using MCNP4B,sumbitted to Med. Phys, 1998.
[5] Ostwald P M, Dose distribution of Therapeutic Electrons at Interfaces, PhD Thesissubmitted to the University of Newcastle, Australia, 1998.
[6] Rogers D W O, Faddegon B A, Ding G X, Ma C M, We J and Mackie T R, BEAM: AMonte Carlo code to simulate radiotherapy treatment units, Med. Phys. 22(5), 503-524, 1995.
[7] Harder D, Energiespectren schneller Electronen in vershiedenen Teifen, In Monteux,Zuppinger A., Poretti G. eds. Symposium on high-energy electrons. Springer-Verlag, Berlin,260-265, 1965.
[8] Jeraj R, Keall P J and Ostwald P M, Comparison between MCNP, EGS4 and SMC onelectron backscattering, Proc. of the World Congress on Medical Physics and BiomedicalEngineering, Nice, France, 1101, 1997.
[9] Jeraj R, Keall P J and Ostwald P M, Monte Carlo simulation of electron backscattering,Proc. of the Xllth international conference on the use of computers in radiation therapy, SaltLake City, Utah, USA, 486, 1997
[10] DeMarco J J, Solberg T D and Smathers J B, A CT-based Monte Carlo simulation toolfor dosime try planning and analysis, Med. Phys. 25(1), 1-11, 1998.
Nuclear Energy in Central Europe '98 57
SI0100093
Nuclear Energy in Central Europe '98
Terme Catez, September? to 10, 1998
Research at the Tandem Accelerator
M.Budnar and P.PeliconJ.Stefan Institute, SI-1001 Ljubljana, Slovenia'
ABSTRACT - In March 1997 a new Electrostatic Tandem Accelerator has been installed at J.Stefan Institute (JSI). Theup to 2 MV voltage enables the acceleration oflight and heavy ions to final energies depending on the ion charge and theselected voltage. Two of five possible exit ports from the switching magnet have been already equipped with the beam linesand the measuring chambers. The radiations excited at the interaction of ions with matter, i.e., X-rays, visible light,electrons, scattered and recoiled particles, nuclear reaction products, all of them can be used for the investigation of samplesby the so called Ion Beam Analytical (IBA) methods. The elemental concentrations, their profiles, and in some cases alsothe elemental speciations, can be determined for the studied samples. Therefore the accelerator offers an excellent researchtool for the studies in experimental atomic physics as well as in several interdisciplinary fields. So far the most often usesof the IBA methods have been in environmental research, studies of materials and material surfaces, in archeometry, etc.With the use of nuclear microbeam having dimensions bellow 1 ̂ m the biomedical samples and the microelectronical devicescan be efficiently studied.
1. Introduction
The electrostatic accelerators which have been broadly used in the nuclear physics researchin its early stage have received a new reputation nowadays with their application to atomic physicsand to many interdisciplinary scientific fields. Besides that, when redesigned , they have been foundas an excellent machines for several industrial application - modification of materials, sterilization ofgoods and equipment, treatment of wastes, etc. Many important international conferences deal withsuch accelerators and methods used there [1-3].
The installation of a new tandem accelerator at J.Stefan Institute has become realistic whenan important financial support was allocated by the UN, IAEA, as well as the Ministry of Scienceand Technology of Slovenia for 1995/98 period. The decision supporting such an investment toSlovenia was based on the new conceptual orientation at the IAEA encouraging the spread ofresearch to broader fields of peaceful use of nuclear energy and due to the support given by theIAEA to studies oriented towards the end-users.
The group at Department of Low and Medium Energy Physics at JSI, first involved in thenuclear physics research- at the Van de Graaff accelerator (VDG), started with the atomic physicsstudies and the use of IBA methods approximately twenty years ago. With the VDG machine,designed and constructed in-house and planned for studies of nuclear structure, the users metseveral drawbacks and limitations when the atomic physics problems were tackled. This situation hasbeen drastically improved recently with the installation of a new accelerator. Main research subjectsplanned to be investigated at the new machine are the studies in. experimental atomic physics,archeometry, environmental pollution, and materials characterization.
Nuclear Energy in Central Europe '98 59

In the contribution the tandem accelerator and the methods used with them are describedin short. The research subjects and plans for exploitation of the instrument are presented next. Theadvantages of having a low energy accelerator at home are discussed in the conclusions.
2. The Tandem Accelerator
The 2 MV Electrostatic Tandem Accelerator - HVEE MC4117 TANDETRON - is an excellentchoice when the accelerated ions with the energies in the MeV energy region are needed. The broadselection of ions, available ion currents, stable operation, computer control, and low radiation arethe characteristics which offer a reliable tool for work in the basic and applied research fields.
— i — i . . . . . . . : K : . J . . 1 . . 1 1—
i fi-ii-l-r—' \\ \^T=
ION SOURCE j IOH SOURCEFOR HEAVY IOHS ! FOR LIGHT IONS(Ci SpBtoiui Source) | (Dtoptumilroi)
I
Figure 1 : A schematic view of the TANDETRON
The accelerator, as schematically shown in Figure 1, is equipped with two ion sources. Theduoplasmatron with the attached Li exchange channel serves for the production of light ions (H, He).The Cs sputtering source produces ions heavier than He. The selected negatively charged ions fromthe ion sources are transported through the ion optics and the bending magnet to the entrance of theaccelerating stage. The TANDETRON has two accelerating tubes. The first one serves for theacceleration of the negatively charged ions. In the stripping channel filled with nitrogen at low
60 Nuclear Energy in Central Europe '98

pressure the ion charge changes. The positive ions are then accelerated again in the secondaccelerating tube. The final energy of the ions depends on the selected voltage at the high voltageterminal and the charge produced in the stripping channel. At the exit of the accelerator theelectrostatic quadrupole triplet lens enables the transport of the ions along the beamline. Theswitching magnet with five exit ports serves for the selection of the beamline as well as for choosingthe ions with the proper energy and charge. The accelerating voltage of up to 2 MV is obtainedthrough the Cocroft-Walton type of rectifier which smooths the 40 KHz voltage from the RF driverthrough the semiconductor diode stacks. Such a solution gives much better stability of the machine(bellow 200 V at 2 MV) regarding to the previous ones where high voltage at the terminal isachieved by the transport of charges with the charging belts.
At two of five possible exit ports the beamlines have been installed already. One of themserves for measurements of samples in vacuum what means that at the end the vacuum measuringchamber equipped with necessary detectors is installed. The second beamline is intended formeasurements in-air. For this purpose the line is equipped with a thin window allowing the passageof the ions out from the vacuum system. Therefore the samples are irradiated in-air what gives anadditional possibility of measuring large or delicate samples. The plans for the installation of twoadditional beamlines are underway where one of them will be equipped with the magnetic qudrupoletriplet lenses for focusing the ion beam to dimensions bellow one micron. The construction of theselines is scheduled for the years 1999/2000.
3. The EBA Methods
When accelerated ions with energies in the MeV region interact with matter several radiationsare produced. Due to the ionization and excitation of atoms X-rays, visible light, and electrons areliberated. The projectiles are scattered on the nuclei which can be recoiled out from the sample. Thenuclear reactions taking place at these energies give several reaction products from gamma rays tolight particles. The detection of these radiations can serve for the studies of the samples (see Figure2). The use of ions at studies of samples led to an acronym Ion Beam Analysis (IB A) for methodsmentioned.
The detection of characteristic X-ray radiation produced by ions is a basis for the PIXE(Paticle Induced X-ray Emission) method. The achieved resolution of modern energy dispersivesemiconductor detectors is good enough for resolving X-rays corresponding to nearly all elementsof the periodic system from Ne to U. For lighter elements the X-ray radiation is too soft to bedetected as it absorbs on the way from the sample to the detector. The sensitivity of the PIXEmethod depends on the atomic number and is the best for elements with Z=::20-30 when detectingK X-rays, and for Z=60-70 when measuring L X-rays. The minimum detection limits for theseelements are bellow ppm (parts per million) and small amounts of material (nig) are sufficient for theanalysis. Still much lower concentrations of the elements in the sample can be measured (bellow 1ppb) if the original sample is preconcentrated by the chemical procedures before the analysis. ThePIXE method is therefore appropriate for sensitive, multielemental analysis of the elementalconcentrations in the sample.
Nuclear Energy in Central Europe '98 61

When scattered projectiles or recoiled nuclei from the sample are detected the concentrationprofiles of the elements in the sample can be measured. The method based on the detection of thescattered projectiles is called RBS (Rutherford Backscatiering Spectrometry) for detection ofparticles in the backward direction, or RFS (Rutherford Forwardscatiering Spectrometry) if theforward direction is used. From the spectra of the scattered particles the information about the
Figure 2 : The Ion Beam Analysis (IBA) methods.
sample composition and the concentration profiles can be extracted. The methods are thereforeexcellent for the concentration profiles determination up to the depths comparable with the range ofthe projectiles in the sample. The RBS is appropriate for elements heavier than projectiles, and theRFS for lighter ones. Comparable to RFS, but much more sensitive for light element concentrationprofiles determination is the ERDA (Elastic Recoil Detection Analysis) method where the recoilednuclei from the sample are detected. This offers an excellent support for the determination ofhydrogen concentration profiles in the samples, and also others if heavier projectiles are used. Thescattering IB A methods have found a broad use in the studies of surfaces, thin iayers, andsemiconductor materials.
; The detection of the nuclear reaction products excited at the nuclear reactions between theprojectiles and the nuclei from the sample is the basis for the NRA (Nuclear Reaction Analysis)method. In the case when gamma rays from the reaction are used the method is called PIGE(Particle Induced Gamma-ray Emission) spectrometry. These methods are very sensitive for theselected projectile-target combinations when the nuclear reaction cross-sections are big, or whenthe reactions are of resonance character. For example, in the case of 15N projectiles the lH(15N, oy)I2Creaction serves for sensitive profiling of hydrogen in the samples.
62 Nuclear Energy in Central Europe '98

The RBS, RFS, ERDA, and NRA are standard-free depth profiling methods for depth rangesup to approximately a few microns with a depth resolutions 1-100 nm. They serve for severalapplicative studies in electronics, microelectronics, deposition of tribological, anti-corrosive, opticaland superconducting thin films, for controlling the ion beam and plasma surface modification ofmaterials, and in the fusion research. They are often used for dynamic in-situ diagnostics.
When visible light (IL - Ion Luminescence) or electrons (SES - Secondary ElectronSpectrometry) and Auger electrons (AES'- Auger Electron Spectrometry) excited in the sample aredetected, not only the elemental composition of the sample are deduced, but also the chemicalspeciations of the particular elements can be obtained. The use of these methods for the analysis ofmaterials and material surfaces is permanently increasing.
With the nuclear microbeam the palette of the IBA methods broaden still further. Namely,all the IBA methods applied with a macro beam ( a few mm) can work equally well also at themicron dimensions. A new information is obtained when the microbeam is scanning across thesample giving the concentration maps of the samples with the precision close or bellow 1 um. If thesample is thin enough (~ mg/cm2) the beam passes through it but its energy changes due to theinteraction with matter. This so called STIM (Scanning Transmission Ion Microscopy) is thereforeused for determination of sample structure and composition. For studying the microelectronicdevices the IBIC (Ion Beam Induced Charge) method can be used. Here, the device is wired andbiased as in the normal operation. When the microbeam with dimension of 1 um or less (and of lowcurrent density - bellow 0.1 fA/um2) scans across the device the particular contacts are triggered. Aprecise information about the device characteristics can be obtained this way.
4: Studies at J.Stefan Institute TANDETRON
Atomic PhysicsIons with energies of up to a few MeV are very useful for studies of processes in atomic inner
shells. The excitation and ionization processes in the atom are in general very complicated, and it issimilarly true for the decay of the excited states. Despite the prevalence of the processes wich areconditioned with an overwhelming central force of the atom, there are many interesting phenomenaof the multiparticle correlations. The system of the projectile and atom is in general a complicatedmultiparticle conglomerate which allow many combinations leading to the collective processes.These are of big interest for modern studies in experimental atomic physics giving an additionalinformation about the quantum behavior of the multiparticle systems. Many sophisticatedexperimental tools have been developed recently offering necessary conditions for detection of suchfaint phenomena with good enough resolution, sensitivity, and precision.
In our case the AES (Auger electron spectrometry) has been developed for the measurementsof spectra of Auger electrons from gas target. The construction of a new HRXRS (High resolutionX-ray spectrometer) is under way. The spectrometer will employ a curved crystal in Johanngeometry and CCD position sensitive detector what altogether will enable the spectrometry withresolution close to the natural width of the X-ray-lines.
Nuclear Energy in Central Europe '98 63

The orientation into fostering basic research in the laboratory is conditioned not onlybecause of physics being one of our important interests but is attractive for the Ph.D. students andpostdocs also.
Interdisciplinary studiesThe IBA methods work effectively in many interdisciplinary research fields due to their
multielemental character, undestructiveness, relatively low price, fastness, and sensitive analysis. Inour laboratory we are involved in the following subjects mostly :
Studies of archeometrical problems. Here, an exceptional interest of museums scientists,restaurateurs, and archivists have been expressed for analysis of several archeologicalartefacts, ancient documents, pottery, etc., to understand better the origins and thetechnology used at the time.Analysis of environmental samples, and especially aerosols, where the information abouttheir elemental contents serve for understanding global transport, environmental pollution,and influences on urbane and working population.
- Analysis of thin layers, hard coatings for tools, and of special technological materials (Ti forion getter pumps). Here, the concentration profiles and their changes during the technologicalprocedures are of broad interest.Composition of materials with the special emphasis on the trace element contents whichinfluence the material physical and chemical characteristics.
Common work with the researchers from other fields boundary to physics on severalinterdisciplinary subjects is necessary to solve interesting questions stemming from the challengesof modern life. Working on solution of such items is a good basis for broader general education ofpublic also. . .,.-•-*
Future plans for the interdisciplinary researchFurther research orientations of the laboratory are manly conditioned by the financial
possibilities. The full exploitation of the accelerator will be achieved when all the exit ports will beequipped with the beamlines and when they will become completely operational. The plans forinstallation of microbeamline are prepared and its construction is hoped to start soon.
The interdisciplinary research fields where we are continuing our activities and are trying tobecome still more involved are :- archeometry,- environment,- study of materials, thin layers and material surfaces,- study of micro electronical materials and components,- analysis of biomedical samples.
The study of materials and their surfaces by the IBA methods have already found largeinterest at the nuclear society community For illustration a few examples are mentioned here inshort. In the fuel cycle the production of iodine at uranium fission is high. On the other hand theiodine is one of the most fed fission products from the point of view of stress-corrosion-cracking of
Nuclear Energy in Central Europe '98

the zirconium cladding tubes. Besides it performs a problem for the waste storage (129I, xI/2 ^ 1.59.107
yr). Therefore the implantation profiles of iodine into Zr were studied ad well as its diffusion in Zrduring annealing. The formation of ZrO2 were studied also. The RBS method with 3 Mev He hasbeen found as very useful for the analysis [4]. At the JET development the plasma/wall interactionsand plasma boundary phenomena are very important. For the study of impurities in plasma thesurface/collector probes are introduced in the plasma and exposed to discharges. The probes aresubsequently analyzed in-situ by various surface analytical techniques : the IBA ones as RBS,ERDA, NRA, and PIXE, and others, as Auger Electron Spectroscopy (AES) and X-rayPhotoelectron Spectroscopy (XPS), respectively. The IBA analysis are performed with the 1.6 MVNEC tandem accelerator installed at the tokamak and dedicated just for the analysis of the collectorprobes. The concentration profiles of H, D, T, C, O, Be, and several metals are determined this way[5], The ions from the tandem accelerator are very practical for the collaboration of the trackdetectors also. Such a work was initiated recently by the group from the JSI Reactor Centre.
5. Conclusions
The review of the possibilities offered by the methods at the tandem accelerator is presented.Besides the basic research in atomic physics many interdisciplinary problems can be studiedsuccessfully. The Ion Beam Analysis (IBA) methods are very suitable for elemental concentrationsand their concentration profiles determination. The use of microbeam broadens the possibilities stillfurther. The opportunity to have a modern accelerator in-house represent an excellent basis foreducation of undergraduate&graduate students. Also it can serve for more general publicinformation about the usefulness of the low energy accelerators for several aspects connected withmodern life.
References
[1] Proceedings of the 13th International Conference on Ion Beam Analysis, Lisbon, Portugal,1997, eds. M.F. da Silva, J.C. Soares, M.Breese, NIM B136-138 (1998)
[2] Proceedings of the 15lh International Conference on Nuclear Microprobe Technology andApplications, Santa Fe, NM, USA, 1996, eds. B.L.Doyle, C.IMaggiore, G.Bench, NTM B130(1997)
[3] Proceedings of the 14th International Conference on Application of Accelerators in Researchand Industry, Denton, TX, USA, 1996, eds. J.L.Duggan, I.L.Morgan, ATP ConferenceProceedings 392, Woodbury, New York
[4] N.Chevarier, et.al., NIM B136-138 (1998) 784[5] J.C.B.Simpson, et.al., NIM B40-41 (1989) 842
h'uclear Energy in Centred Europe '98 65

SI0100094
Nuclear Energy in Central Europe '98
Terme Catez, September 7 to 10, 1998
PLUTONIUM BASED ENERGY AMPLIFIER TESTING CONCEPT
V. S. Barashenkov*, J.Cetnar**,G. Domanska**,A. Polanski***A. N. Sosnin*.,S. Taczanowski**,
*Joint Institute for Nuclear Research, Dubna, Russia.**University of Mining and Metallurgy, Cracow, Poland.
***Soltan Institute for Nuclear Studies, Otwock-Swierk, Poland.
ABSTRACT. This paper presents studies of physical parameters of a fast neutron energyamplifier which employs a plutonium subcritical assembly and a 650 MeV proton accelerator,The aim of the studies is to find the energy gain, neutron multiplication coefficient and rates ofradioactive waste transmutation for the proposed ADS setup. The plutonium isotopic mixturefrom waste of PWR reactors is proposed to be used for the core of the assembly.
1. IntroductionThe role of Accelerator Driven System (ADS) is examined in view of the energy
production and the incineration of plutonium from commercial light water reactors. The designof the experimental ADS facility is based on existing plutonium fast reactor IBR-30 that hasbeen operated in JINR in Dubna (Russia) for considerable number of years. We would like,particularly, to emphasize the importance of research on the plutonium ADS setup because offinding a safe utilization for plutonium accumulated in the course of the nuclear power plantsoperation, presenting a great danger in respect to uncontrollable nuclear weapon proliferation.The ADS technology looks quite promising for the solving of this issue. As a first step in thestudies of peculiarities of plutonium ADS it was proposed to combine the core of theplutonium fast reactor IBR-30 and 660 MeV proton cyclotron [1],[2], Now we consider asimilar setup with plutonium isotopic composition corresponding to the standard PWR fuelafter 33 GWday/t burnup.
2. Characteristics of the installationAs the estimates of the FLNP and LCTA physicists have shown, the ADS setup that is a
combination of the core of the JINR reactor IBR-30 and the 660 MeV phasotron [3] withbeam power 1 kW, can provide a way to get multiplication coefficient 0.94-0.96 The power ofsuch a setup in a extracted proton beam with 2.0 101J particles/s will be about 20-30 kW.Such a power can be removed by a gas (helium) coolant. At the same time it is sufficient tocarry out the most important neutronic investigations required for designing the full-scaleindustrial ADS setup.
The building where the phasotron is located allows one to provide safe radiation conditions.Since the multiplication coefficient does not exceed the value of 0,95 the ADS setup representsa safe subcritical system. The assembly is supposed to be installed in the main accelerator hallof the phasotron, in a closed location with limited access.
Nuclear Energy in Central Europe '98 67

As a first step in research of plutonium ADS setup we suggest [1] to fellow the designplutonium reactor similar to the IBR-30 (FLNP/JINR) operating in a subcritical mode and theLNP 660 MeV proton accelerator phasotron. The important advantage of the project is therelatively small size of the reactor and a possibility of its quick realization, as all of theequipment required is practically available. JINR is an international organization, thus a widerange of specialists can be involved in the investigations and the project has attracted interestof a series of research institutes.
To make the present conceptual design of the Plutonium Energy Amplifier we have chosena nominal unit capacity of 20 kW (thermal). This corresponds to the multiplication coefficientkeiY
=0.942 and the energetic gain about 20. The beam are protons of energy of the order of650 MeV. The current is in the range 1- 1.6 uA.
2.1 Physical aspectsThe shape of the core of the existing reactor IBR-30 is two rectangles consisting of
stainless steel clad plutonium rods with gaps to let the coolant (compressed air) pass through,central tungsten target is driven by the beam from the electron linear accelerator which makesit necessary to introduce separate from the core cooling loop with helium as the workingmedium. The proposed reactor core has a form of multi-layer cylinder with a tungsten target ofradius r=1.8 cm surrounded by a plutonium blanket of radius 7.5 and height 14 cm (Fig. 1)
Proton beam Ep=650 MeV
44cm
29cm27.5cm
15cm
Fe reflector
W target +3mm Fe layer
Pu rods zone
W reflector
1.5cm 7.5cm 22.5cm 25cm
Figure. 1. Cylindrical geometry adopted for the transport and burnup calculation
68 Nuclear Energy in Central Europe '98

The plutonium blanket contains rods (71%) and the helium as a coolant (29%).The reactor core is surrounded with a steel reflector 15 cm thick and with the tungstenreflector 2.4 cm thick. The size of the reactor main vessel is therefore relatively small (d=15cm, h= 14 cm).
The rods are shaped as a multi-layer Cylinders with metallic plutonium of radius r=4.6mm, height 140 mm surrounded by Ta (0.1 mm thick) and stainless steel (0.3 mm thick)casings. The rods contain Pu (84.5 %), with density 16 g / cm3, Ta (3.95 %) and Fe (11.55%)The mass of plutonium in the rod is 148.9 grams.The size of the rods and isotopic compositions of Pu are summarised in Tables 1.
Table 1. Main parameters of Pu rods.
Size of the rods[mm]
Pu content radius rod=4.6Ta cladding thickness=0.1Fe cladding thickness=0.3Height of the rods=140
Isotopic compositions of Pu*(density
238P u
239P u
240P u
241 P u
242P u
16g/- 2.
- 58.
- 24.
- 11.3
cm3)
4 %
4 %
0 %
3 %
9 %
* The plutonium isotopic concentrations correspond to 33 GWxday/t burnup of a
standard PWR fuel with initial 2 3 5 U enrichment to 3.3%. The real IBR-30 is fuelled withpure Pu-239, however, present research is centred on incineration of secondary fuelcomponents from operating light water reactors it's been accepted that the reactor is loadedwith the plutonium extracted from them.
The beam of the accelerated protons is directed into an axial split (16 cm depth),penetrating the facility through the vacuum system of the accelerator tube via a specialtungsten window.
Performance of the assembly has been investigated by means of computer simulationsusing particle transport codes: MCNP and for higher energy range the LAHET code andsimilar program complex CASCADE based on intranuclear cascade evaporation modeldeveloped at the JINR. The general goal of the calculations was to provide proper designassumptions, especially from the point of view of the operational safety and measurementaccuracy.
The calculated quantities were the neutron multiplication coefficient number of fissions perproton, heat generation, fuel toxicity and the energy gain of the system.
The dependence of the energy gain G on the proton energy is graphically illustrated in Fig.2.
Nuclear Energy in Central Europe '98 69

Energy Gain
Q .
LU
Qto
10 -
5 -
0 -
//4
—-—•< 1 i
0,5 1 1,5 2 2,5
Protons energy [GeV]
Figure.2. Energy gain vs. incident proton energy for neutron multiplication coefficient 0.942
As one can see the maximum (G=20) is observed for incident proton energy about lGeV.A decrease in the energy gain seen at energies less than 1 GeV results from ionization losses ofprimary protons. For the suggested 650 MeV energy of protons the energy gain is only 4% lessthan for 1 GeV.
The results of computer simulations for the proposed assembly at 650 MeV protonenergy, in terms of: number of rods, neutron multiplication keff and number of fissions perincident proton are presented in Table 2.
Table 2. The results of LAHET and MCNP calculations.Number of
rods
150
149148147146145
NeutronMultiplication Factor
Keff
0.959 /0.002/
0.952 /0.003/0.948 /0.003/0.942 /0.003/0.939 /0.002/0.929 /0.003
Low energyfissions per
proton
97.5
82.075.166.362.652.6
High energyfissions perproton
0.206
0.2050.2030.2010.1980.198
It can be seen in Table 2 that the number of fissions per proton weakly falls with thereduced number of rods. For the assumed multiplication coefficient 0.942 one should use 147plutonium rods ( 21.888 kg of plutonium).Using maximal number of rods (150) we can obtainvalue of keff equivalent to 0.96. At the same time fluctuations of the energetic gain of the ADSsetup are possible during its operation due to different accelerator regimes and changes in theof keff, as an example, it is shown, in Fig. 3 the energetic gain depends oa the value of neutronmultiplication coefficient in the system presented in Fig. 1 for the 650 MeV proton beam.
70 Nuclear Energy in Central Europe '98

Energy Gain
0 -0,92 0,93 0,94 0,95 0,96
Multiplication coefficient
0,97
Figure.3. System energy gain vs. neutron multiplication coefficient (incident proton energy 650MeV)
One can see while examining Fig.3 and Table 2 that the energetic gain for keff=0.943 isequal to 20 and energetic gain for maximal number of rods (150) is equal to 30.
The above estimates show that the data are quite stable: heat release values are slightlychanging in the range of neutron multiplication coefficient from about 0.93 to 0.96 dependingon variations of the energy and the intensity of the proton beam.
The estimations of the thermal loads of various elements of the system show that they donot exceed permissible values, besides, if necessary, can be quickly reduced by decreasing thecurrent of the accelerator. From this viewpoint, the designed set-up is safe, too.
To study the radiotoxicity of the fuel cycles for the ADS setup we calculated the neutronmultiplication coefficient, energetic gain and transmutation ability of different materials
The results of the calculations for the rods with different materials are presented in . Table
Table 3. Parameters of ADS setup for various filed materials
Materials
Pu
Pu+ActinidesPu-239
Multiplicationcoefficient
0.942/.003
0.941/.002
0.942/.003
Energy Gain
19.3
19.2
19.2.3
Low energyfissions per
proton
66.3
65.7
65.8
High energyfissions per
proton
0.201
0.214
0.183
In order to study the behavior of reactor inventory with tirrie we have calculated the systemevolution over five years of irradiation. The calculations were performed with two independentnumerical methods. In the first one the BISON-C code, that is based on deterministic approachin simplified one-dimensional geometry was applied. The second one is a very advancedmethod that combines Monte Carlo transport code MCNP4B with Transmutation TrajectoryAnalysis Method [5] to emerge as the MCB code [6 ].
Nuclear Energy in Central Europe '98 71

The results of calculations show that the main system parameters: k-eff and system power,vary a little from their initial values during the considered irradiation (Figure 4.). One couldexpect this due to very small proton beam current in the experimental reactor.Nevertheless even in the experimental reactor the emerging radioactivity will be detectable inthe experiment and will allow us to verify theoretical predictions of the system time evolutionand project this for the case of power system.The calculated burnup and transmutation rates of plutonium and fission products are shown inthe Figures 5 and 6.Minute variation of concentrations of abundant nuclides does not make possible to verify themexperimentally, thus a measurement of actinides stemming from those abundant ones will showtheir time evolution only in case of their low initial inventory. In case of mixed initial fuel thetransmutation rates can be verified only by measurements of the fission products.
0.96 100
- 60
0 1 2 3 4 5Time of Irradiation [years]
Figure 4. Total power and neutron mutiplication in the plutonium fuel.
" 1.0E-2ETO
X» «
Qo
1 1.0E-3 —
I
I O—~-£
— # — Pu-239
—A— Pu-238
— + — Pu-240
—Q— Pu-241
| A | J
3—•—0—
i ) A )—A—H^di
1.0E-5 t=
1.0E-6 ==
2I I 1.0E-7
wca>aoo
1.0E-8 ifc
1.0E-9
1.0E-100.0 1.0 2.0 3.0 4.0 5.0
Time of Irradiation [years]0..0 1.0 2.0 3.0
Time of Irradiation4.0 5.0[years]
Figures: 5, 6. Atomic density of the isotopes plutonium and fission products in the plutoniumfuel.
72 Nuclear Energy in Central Europe '98

4.Experimental programThe overall objective of the experimental program is to study the features of accelerator
driven hybrid subcritical systems from the point of view of safe energy production andtransmutation capabilities, in particular:• to provide some nuclear data for among others radioactive materials .by comparing
calculations with experiments;• to study radiotoxicity of the ADS fuel cycle.
The main goal of the experiment is to demonstrate the possibilities of construction of asafe and stable from the operation view point ADS set-up and to verify reliability of theoreticalmethods to estimate such systems. By means of theoretical calculations and measurements ofthe neutron flux and the temperature in some points inside and outside the device we willreceive estimates of the multiplication coefficient and a neutron flux as well as neutron leakageout of the assembly and the value of the energy gain. We shall study the influence of variousreflectors as well as the multiplication coefficient behaviour vs. time. Different materialcompositions of spallation target will be examined for optimizing the efficiency of neutronsource. The research on raising the system performance by using a sectioned assembly [7] ormerely spatially distanced hierarchical subcritical systems [8,9] is of a special interest since thisidea allows for a radical and safe reduction of the beam current at unchanged k-eff. Besides, weshall investigate spatial-energetic distributions of the neutron flux in the assembly, theirdependence on the design, reflector material and presence of moderators.
4.1. Basic nuclear data and data for radioactive materials.Integral neutron cross-sections of fission and radiation capture for the long-lived fission
fragments and actinide isotopes will be measured for the neutron spectrum in the assembly. Wealso plan to investigate experimentally the efficiency of the adiabatic resonance crossingmethod (ARC method) for the transmutation of several nuclides of waste in the lead cubesituated near the reactor core. After a long-term irradiation the concentrations of selectedfission products will be examined by means of gamma and X-rays. The results of themeasurements are to be compared with the results of the mathematical modeling of thecorresponding processes in order to further improve the computation methods.
4.2. Studies of the radiotoxicity of the fuelThe accelerator-driven system for LWR-waste transmutation based on fast neutron
spectrum will be investigated. Transmutation efficiency of the reprocessing technology will beexamined in order to estimate the full cycle residuals and their radiotoxicity. The samples to betransmuted will be in the form of foils subject to prolonged irradiations in the assembly. Specialattention will be paid to transmutation of plutonium and minor actinides from the LWR wastes.Radiochemical separations may prove to be indispensable in view of insufficient inducedactivities. The nuclide concentrations during the transmutation process will be measured andcalculated and possibly their time evolution too.
Acknowledgements:Partially sponsored by the Polish Committee of Scientific Research (KBN) under the
project SPR 4.2
Nuclear Energy in Central Europe '98 73

S.References1. V.S. Barashenkov, G.N.Pogodaev, A.Polanski, Yu.P. Popov, I.V. Puzynin, A.N.Sissakian,
A.N. Sosnin. Physical Aspects of an Electronuclear Set-up on the Basis of the SubcriticalZone of the IBR-30 Reactor and the 660 MeV Proton Phasotron. JINR Comm. P2-98-74,Dubna, 1998
2. V.S. Barashenkov, A. Polanski, A.N. Sosnin. Application of Low-Energy Accelerators inElectronuclear Systems. JINR Preprint E2-97-304, Dubna, 1997.
3. LNP phasotron and its beam. JINR Report, 9-96-386, 1996.4. L.N. Zaitsev et al. An introduction to the accelerator's safety. Moscow, Atomizdat, 1971,
p.182.5. J.Cetnar. A Method of Transmutation Trajectories Analysis in Accelerator-Driven Systems.
Technical Committee Meeting, Madrid, Spain. Sept. 19976. MCB- Monte Carlo Continuos Energy Burnup Code- J.Cetnar (private communications)7. V.F. Kolesov, B.Ya. Guzhovsky. On a possibility of raising the efficiency of electronuclear
transmutation devices on the basis of change-over to a multi-sectionedblanket. DSP 27-93, Arzamas-16, 1993
8. S. Taczanowski. Selected Properties of External Source Driven Subcritical Systems forTransmutation. Raport INT 270/1, Krakow 1997.
9. S.Taczanowski. Neutronic Optimization of Accelerator-Driven Subcritical Systems forTransmutation. Proc.ICENES/98, Tel-Aviv, Israel, 1998.
74 • Nuclear Energy in Central Europe '98
SI0100095
Nuclear Energy in Central Europe '98
Terme Catez, September 7 to 10, 1998
PLASMA RESPONSE TO A POSITIVE VOLTAGE STEPAPPLIED TO AN ANODE IMMERSED IN A WEAKLY
MAGNETIZED DISCHARGE PLASMA COLUMN
T. Gyergyek1'2, M. Cercek1 and M. Stanojevic1
1) Jozef Stefan Institute, Jamova 39, 1000 Ljubljana, Slovenia
2) Faculty of Electrical Engineering, University of Ljubljana, Trzaska 25,1000 Ljubljana, Slovenia
Abstract
Positive voltage steps are applied to an electrode immersed in a weaklymagnetized discharge plasma column. Time development of electron dis-tribution function is measured by a one sided plane Langmuir probe anda standard boxcar technique. When a voltage step is higher than ap-proximatelly 40 V, a firerod is created and it is measured how electronbeam from cathode plasma is gradually transformed into anode plasmapopulation.
1 Introduction
Phenomena related to positive electrodes immersed in plasmas are a subjectof intense research activity [1]. In this work response of a plasma to a posi-tive voltage step applied to a planar anode immersed in a weakly magnetizeddischarge plasma column with its surface perpendicular to the magnetic fieldlines is investigated. Temporal development of the electron distribution func-tion is measured using one sided plane Langmuir probe. The surface of theprobe is parallel to the surface of the anode and perpendicular to the magneticfield lines. The electron Larmor radius is approximatelly 0.1 mm. so a onedimensional electron distribution function is measured.
Let us denote the direction of the magnetic field by z. The correspondingone dimensional electron velocity distribution function is fez{vz). The electronprobe current lv is given by
Ip = e0Ap / , - — - fez(vz)vzdvz,
Nuclear Energy in Central Europe '98 75

BOXCARGATE
E
Figure 1: Experimental set-up. The transistor switch is turned on and off withpulses from the signal generator. These pulses are also used as a master triggerfor the experiment. In this way a good time resolution is achieved.
where Up is the probe bias, measured with respect to the plasma potential andAp is the probe surface. Differentiation of the above integral yields [2]
m e dlp
P2 A All (1)
So the one dimensional electron velocity distribution function in the energyscale can be obtained from the first derivative of the electron current collectedby a Langmuir probe. Characteristics are taken by a one sided plane probewith 3 or 5 mm diamater. First the nonisolated surface of the probe is turnedtowards the plasma source - cathode, and then towards the anode by whichthe double layer is created. In this way the electron distribution function ismeasured in positive and negative direction of z axis.
2 Experiment
Experiments are performed in a linear magnetized discharge plasma machineat the J. Stefan Institute in Ljubljana (figure 1). The experimental vesselis evacuated below 10~4 Pa.. Then argon is leaked into the vacuum system.The pressure is kept between 0.02 and 0.03 Pa. Plasma is produced by adischarge from WjTh filaments heated by direct current. Primary electronsare accelerated by a discharge voltage 40 - 50 V and plasma is created by
16 . Nuclear Energy in Central Europe '98

impact ionization. The discharge current is between 120 and 300 mA. Plasmais confined by axial magnetic field, which has the density 0.01 T. The electrontemperature is approximatelly 2 eV and ion temperature is approximatelly 0.1eV. Larmor radius for electrons is approximatelly 0.2 mm and for ions about2 cm. The plasma density is between 108 and 109 cm"3.
2,0 r
1,5
a.E 1,0CD
0,5
0,0
10 20time [ microsec. ]
30
Figure 2: Time dependence of anode current Ia after the application of apositive voltage pulse.
Positive voltage pulses are applied to a 2 cm diameter anode using a fasttransistor switch. The switch is turned on and off by rectangular pulses fromthe signal generator which are also used as a master trigger for the experiment.The switch is 2 ms on and 2 ms off. When the switch is off, the anode is at thefloating potential, which is around -20 V. When the switch is on, the anodebias is Ua and is determined by the external power supply. When the switchis turned on, the anode current increases instantaneously (figure 2). A currentovershoot can be observed.
Time resolved measurements of probe charateristics are performed usingthe standard boxcar technique. Temporal resolution is 1 ̂ as. The characteris-tics are digitized and stored in a computer for further analysis.
3 Experimental results
When anode bias Ua is varied continuously, the anode exhibits the usual current- voltage characteristics (figure 3). At strongly negative electrode bias thecurrent to the electrode is positive. This is the ion saturation current. Whenthe electrode bias becomes less negative, more and more electrons can reachthe electrode and the current in the transition region is negative. At theknee of the characteristics, electrode bias reaches the plasma potential. When
Nuclear Energy in Central Europe '98 77
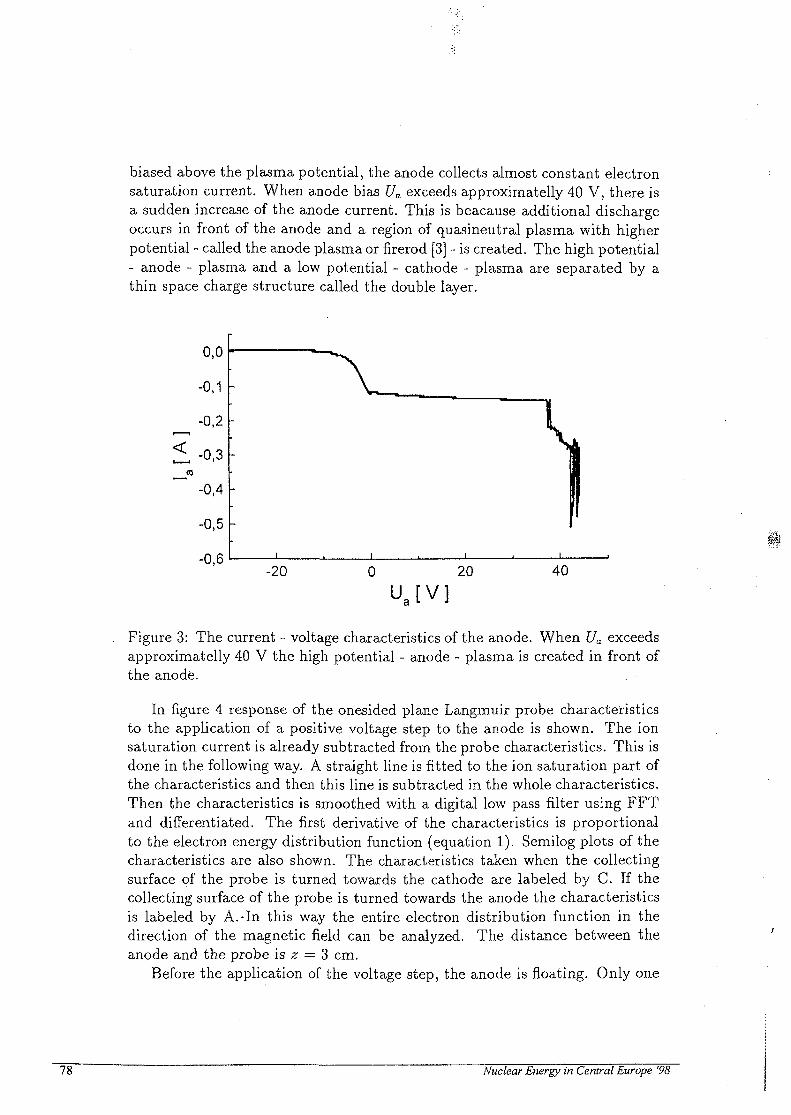
biased above the plasma potential, the anode collects almost constant electronsaturation current. When anode bias Ua exceeds approximately 40 V, there isa sudden increase of the anode current. This is beacause additional dischargeoccurs in front of the anode and a region of quasineutral plasma with higherpotential - called the anode plasma or firerod [3] - is created. The high potential- anode - plasma and a low potential - cathode - plasma are separated by athin space charge structure called the double layer.
0,0
-0,1
-0,2
"0.3
-0,4
-0,5
-0,6-20 20 40
Figure 3: The current - voltage characteristics of the anode. When Ua exceedsapproximately 40 V the high potential - anode - plasma is created in front ofthe anode.
In figure 4 response of the onesided plane Langmuir probe characteristicsto the application of a positive voltage step to the anode is shown. The ionsaturation current is already subtracted from the probe characteristics. This isdone in the following way. A straight line is fitted to the ion saturation part ofthe characteristics and then this line is subtracted in the whole characteristics.Then the characteristics is smoothed with a digital low pass filter using FFTand differentiated. The first derivative of the characteristics is proportionalto the electron energy distribution function (equation 1). Semilog plots of thecharacteristics are also shown. The characteristics taken when the collectingsurface of the probe is turned towards the cathode are labeled by C. If thecollecting surface of the probe is turned towards the anode the characteristicsis labeled by A.-In this way the entire electron distribution function in thedirection of the magnetic field can be analyzed. The distance between theanode and the probe is z = 3 cm.
Before the application of the voltage step, the anode is floating. Only one
78 Nuclear Energy in Central Europe '98

Figure 4: Characteristics of the onesided plane Langmuir probe recorded,when the anode is floating and 1 /J,S after the application of different voltagesteps, together with corresponding derivatives and semilog plots.
electron population - the cathode plasma electrons - can be observed on thederivatives (i. e. electron distribution functions) and semilog plots. From theslope of the line of the linear part of the semilog plot the electron temperaturecan be prety accuratelly determined. Temperature of the cathode plasmaelectrons is approximatelly 2 eV.
Immediatelly (I/us) after the application of the positive voltage step to theanode, a strong electron beam is accelerated towards the anode (figure 4).The energy of the beam [/& is measured as the distance between the peaksof the derivatives of the probe characteristics, i. e. the electron distributionfunctions and it increases linearly with the applied voltage step (figure 5a).Also the temperature of the electron beam kTeb can be determined from thesemilog plots. This temperature is higher than the cathode plasma electrontemperature and it increases, when the voltage step to the anode is increased(figure 5b).
In figure 6 time development of the Langmuir probe characteristics afterthe application of a high (approximatelly 45 V) positive voltage step to theanode is analyzed for first 20 /is after the step. The voltage step is so high,that the firerod is created in front of the anode. The ion current on the probecharateristics is already subtracted as described earlier. The correspondingderivatives and semilog plots are also shown. The distance between the anode
Nuclear Energy in Central Europe '98 79

25-
20-
>
15-
10-
(a) 10-
> 9"0)
8-
7-
(b)
15 20 25 30 35 15 20 25 30
U a [ V ]35
Figure 5: The energy of the electron beam Ub and the electron beam temper-ature kTeb versus the applied voltage step Ua.
and the probe is z — 1 cm. The main result are the derivatives, which areproportional to the electron energy distribution functions.
When the anode is floating, only one electron population exists - the cath-ode plasma electrons. Immediatelly after the voltage step, the electrons arestrongly drawn towards the anode. This can be seen in the form of a strongelectron beam, detected by the probe turned towards the cathode. This beamthermalizes very quickly. Approximately 3 - 4 pis after the voltage step theformation of second (anode plasma) electron population can be already veryclearly observed. These electrons have their distribution centered around amuch higher probe bias Uv than the cathode plasma electrons. Also their dis-tribution is wider because of the higher' electron temperature. The cathodeplasma electrons are also still present. It can be very well observed from thederivatives, how the cathode plasma electron population gradually vanishes,while the density of the anode plasma electrons increases. Some 15 - 16 fj,safter the voltage step the cathode plasma electrons almost disappear.
Measurements shown in figure 6 were made at z = 1 cm. At larger distancesbetween the probe and the anode results are similar, only the process of theformation of the anode plasma electron population and disapperance of thecathode plasma electron population is somewhat delayed. This indicates thatthe formation of the anode plasma starts at the anode sheath, which thenexpands into the cathode plasma. Such scenario is described in the literature[4]-
80 Nuclear Energy in Central Europe '98

Figure 6: Plane Langmuir probe characteristics, the corresponding derivatives(distribution functions) and semilog plots recorded at different times after theapplication of the voltage step to the anode. Curves labeled by C are recordedwith the collecting surface of the probe turned towards the plasma source -cathode. Curves labeled by A are taken with the probe turned towards theanode.
Nuclear Energy in Central Europe '98 81

4 Conclusions
Response of a weakly magnetized discharge plasma column to the applica-tion of a positive voltage step to an anode immersed in the plasma has beeninvestigated experimentally. Temporal development of the electron energy dis-tribution function has been measured using a onesided plane Langmuir probe.Immediatelly after the application of the voltage step, a strong electron beamis accelerated towards the anode. The energy of the beam is proportional tothe applied voltage step. The temperature of the beam increases, if the volt-age step has increased and it is 3 - 5 times of the temperature of the cathodeplasma electrons. If the voltage step is high enough, (above approximately 40V) a firerod is created. Differences between time developments of the electrondistribution function in the case when the firerod is created and in the casewhen it is not created, will have to be investigated in more detail in the future.
5 References
[1] Fourth Symposium on Double Layers and other Nonlinear Potential Struc-tures in Plasmas, Innsbruck, Austria July 6-8, 1992, R. Schrittwieser, (editor),World Scientific, (1993)[2] J. D. Swift and M. J. Schwar, Electrical probes for plasma diagnostics, IliffeBooks Ltd., (1970)[3] Tao An, R. L. Merlino and N. D'Angelo, J. Phys. D: Appl. Phys., 27,(1994), 1906-1913[4] M. Sanduloviciu, C. Borcia, G. Leu, Phys. Letters A, 208, (1995), 136-142
Nuclear Energy in Central Europe '98
SI0100096
Nuclear Energy in Central Europe '98
Terme Catez, September 7 to 10, 1998
On Possible Contribution of Standing Wave LikeSpacer Dynamics in Polymer Liquid Crystals toQuasi-elastic Cold Neutron Scattering Spectra
R. Jed, B. Cvikl
Faculty of Civil Engineering, University of Maribor, Maribor, Sloveniaand "J. Stefan" Institute, Ljubljana, Slovenia
A B S T R A C T - The quasi-elastic cold neutron incoherent scattering law, QNS, for theassumed case of transversal standing wave type of motion of the linear chain -a spacer- of thepolyacrylate polymer liquid crystal, based upon the random walk of the particle between twoperfectly reflecting potential barriers, is derived. The spacer protons are taken to vibrate (withinthe stationary plane) transversely to the line joining the oxygen atoms in a way where they are allsimultaneously displaced in the same direction with amplitudes of the standing wave fundamentalmode of the vibration excited.
The calculated relevant incoherent scattering law is found to be a non-distinct function of thescattering vector Q, in the sense that the postulated dynamical effect of the spacer protons causesthe peak value of the calculated incoherent scattering law, S(Q,co), to remain constant throughoutthe experimentally accessible range of the scattering vector Q. It appears that, when theexperimental resolution broadening effect is taken into account, the contribution of the postulateddynamical behaviour to the measured QNS spectra might be small, particularly so, if someadditional motion of the scatterers is present, and consequently the standing wave like spacerdynamics in polymer liquid crystals will be very difficult to be identified uniquely in thequasielastic neutron scattering experiments.
1. Introduction
It is a well known fact, that the polyacrylate liquid crystal, a comb-like liquid crystalpolymer, consist of a backbone of a linear polymer to which, via a small aliphatic chainscalled spacers, the mesogenic units are attached. The spacer - C6H!2 chain - is known tobe in an elongated configuration [1] and is linked to the biphenyl group [1] as depictedon Figure 1, where $ denotes the benzene ring. Here it was already taken into theaccount that the sample used for the quasi-elastic cold neutron scattering investigation,QNS, of the side chain dynamics of the polyacrylate polymer liquid crystal in theisotropic, smectic A, and re-entrant nematic phases of ref. [1] is having the backbonehydrogen atoms suitably substituted by deuterium which are, as far as cold neutrons areconcerned, "invisible".
Nuclear Energy in Central Europe '98 83

CD,
CD2
0
O -- (CH2)6 -- 0 - <J> - 0> - CN
Figure 1. Schematic presentation of the polyacrylate polymer liquid crystal.The linear chain - (CH2)6 - denotes the so called spacer, and <& is the benzene ring.
In the neutron scattering study of the backbone conformation in the nematic phase ofa side chain polymer [2], Davidson et. al, advanced a hypothesis according to which thebackbone, providing the linear chain -the spacer- which is linking the backbone to thepolymer mesogenic unit is long enough, is expected to adopt a globally prolate shape ifthe smectic fluctuations are negligible. On the other hand L. Noirez et al. [3], clearlydemonstrated that the transformation of the backbone conformation of polyacrylateliquid crystalline sample from an oblate (observed in the nematic and smectic A phases)to a prolate conformation (observed in the re-entrant nematic phase) is strictly atemperature dependent process. Benguigui et al. [1], have presented the first indirectdynamic investigation, by quasi-elastic incoherent cold neutron scattering study, of theside chain liquid crystal polyacrilate motion, however the exact nature of motion of theprotons of the spacer and of those of the benzene rings have remained unexplained. Thisquestion has been addressed by Cvikl and Peternelj [4], who have shown that themeasurements could be well interpreted in terms of the model according to which thegeometry of motion [5] of the spacer protons results as thought the protons are subjectedto the transverse oscillations of the standing wave variety with only the fundamentalmode of vibrations excited. The motion of the biphenyl group, constituting themesogenic unit, has also been appropriately accounted for on the basis of a suitableuniaxial biased reorientational model of motion [6]. However, no dynamical model forthe spacer standing wave motion effect of the neutron scattering spectra has beenpresented so far and it is the purpose of this note to investigate the possible influence ofthe postulated dynamics on also the quasi-elastic part of the measured cold neutronscattering spectra.
As mentioned above, the main objective is to obtain an additional view on the (onlythe) spacer dynamics, particularly so as the elastic incoherent structure factor, EISF,measurements [1], yielding the geometry of motion, demonstrate that the effect of thefundamental type of the standing wave motion could appreciably affect the measuredincoherent cold neutron scattering spectra [4]. However, the calculated EISF value asobtained by QNS measurements of ref. [1] could not be uniquely interpreted in terms ofthe two models employed, as there are indications that the model of the biasedreorientations of the phenyl rings could itself alone account for the measurements. This
84 Nuclear Energy in Central Europe '98

duality is a consequence of the fact that the measurements were obtained on anunoriented sample. One notes that, however, other well known models of particle motionhave been in the work of reference [1] definitely ruled out.
The problem of the internal reorientational dynamics of liquid crystalline molecules hasbeen up to now and is also in the present paper investigated on the basis of the,, for thepurpose, suitably devised models of the reorientational motion.
2. Theoretical outline
We begin by noting, that the incoherent scattering law, S(Q,o>)> is given by the timeFourier transform of the intermediate scattering function, I(Q, t), which is defined as,
1(0.0= ( e # ) ^ 0 1 ) (l)
where Q is the neutron scattering vector transfer, f (t), is the proton position vectorexpressed in the laboratory frame and the brackets denote the fact that an ensembleaverage over all the initial and final states is to be evaluated. In what follows, we will beinterested in the linear chain of spacer atoms of which an example is O - (CH2)6 - Ogroup of the polyacrylate liquid crystalline sample. For our purposes it is permissible inthe first approximation to assume that both oxygen atoms represent the nodes of thestanding wave type of vibrations of spacer protons. The proton displacements at the(equilibrium) position x as measured along the extended chain joining the oxygen atomsis vibrating transversely to it and the instantaneous transversal proton position from itsequilibrium value is denoted by s(x, i) . Here the origin of the x-axis is taken, say, at the
left oxygen and all the chain protons (see for instance ref. [3] and [4]) are taken tovibrate within the same stationary plane. Under the described conditions, the expressionto be evaluated reads,
Let the angle between vectors Q and s be denoted by © and denoting q=Q cos®, theintermediate scattering law, eq. (2), is to be evaluated for all the 12 protons in the sidechain which are situated at 6 different positions x; (i=l, 6) along the line joining the twooxygen atoms [4]. According to the basic assumption, on account of the thermallyactivated processes which is presumably causing the (synchronous) spacer vibrationaldeflections their amplitude of vibration are assumed to be described by a well knownexpression for the fundamental vibrational mode,
= l , 6, (3)
where A is a constant. Here, / is the length of the elongated chain as measured betweenthe oxygen atoms [4],
The expression to be evaluated reads,
Nuclear Energy in Central Europe '98 - 85

\{q, /)= $e-«s(l) e-^0) P(S(O)Xt)J)PMt))P2(m)ds(t)ds(O) (4)
where P(s(O); s(t),t) is the conditional probability density that the proton is going to be atthe position s(t) in time t, providing it was at s(0) at time t=0. Pi(s(t)) and P2(s(0)) aredescribing the probability densities for the final and the initial displacements distributionsrespectively of the proton at the position x; and in what follows are both taken to beuniform, i.e.,
where the amplitude of vibration of the i-th proton is defined by the eq. (3). In order tocalculate the conditional probability density P(s(0); s(t), t) for the spacer dynamics of thetwelve protons which are subjected to the transverse oscillations of the standing wavevariety with only the fundamental mode of vibrations being excited, a suitable model hasto be envisaged. Since we are interested in the fact as to what extent the transversevibrations of the 12 spacer protons possibly modify the shape of the incoherent scatteringlaw, S(q,a>), it seems that mathematically the simplest approach is offered by anextension of the model of the stochastic symmetric random walk of a particle on a linebetween two perfectly reflecting barriers. In the present case these lines are (for theparticular proton vibrating transversally at the position x along the line joining the spaceroxygen atoms) perpendicular to the O - O direction and their lengths are equal to 2 so(x),[4]. Both oxygen atoms are taken as nodes of standing wave vibrations. Evidently, thismodel requires the existence of sinhronous motion of the twelve spacer protons in thesense that each one of them is, on the average, constrained to move (on the time scale ofthe neutron experiments i.e, 10"10 s to 10'13 s) in the same direction while simultaneouslybeing subjected to the large number of (fast) small step diffusional motion of thestochastic nature characterised by the appropriate value of the correspondingtranslational rate constant denoted by the symbol D. Assuming the possibility ofoccurrence of the described type of the spacer proton motion and dropping the index i,the conditional probability (in the continuum limit) is found to be [7],
After some manipulations the final result for the scattering law reads (for the protonplaced at the position x on the line joining the vibrational nodes),
86 Nuclear Energy in Central Europe '98
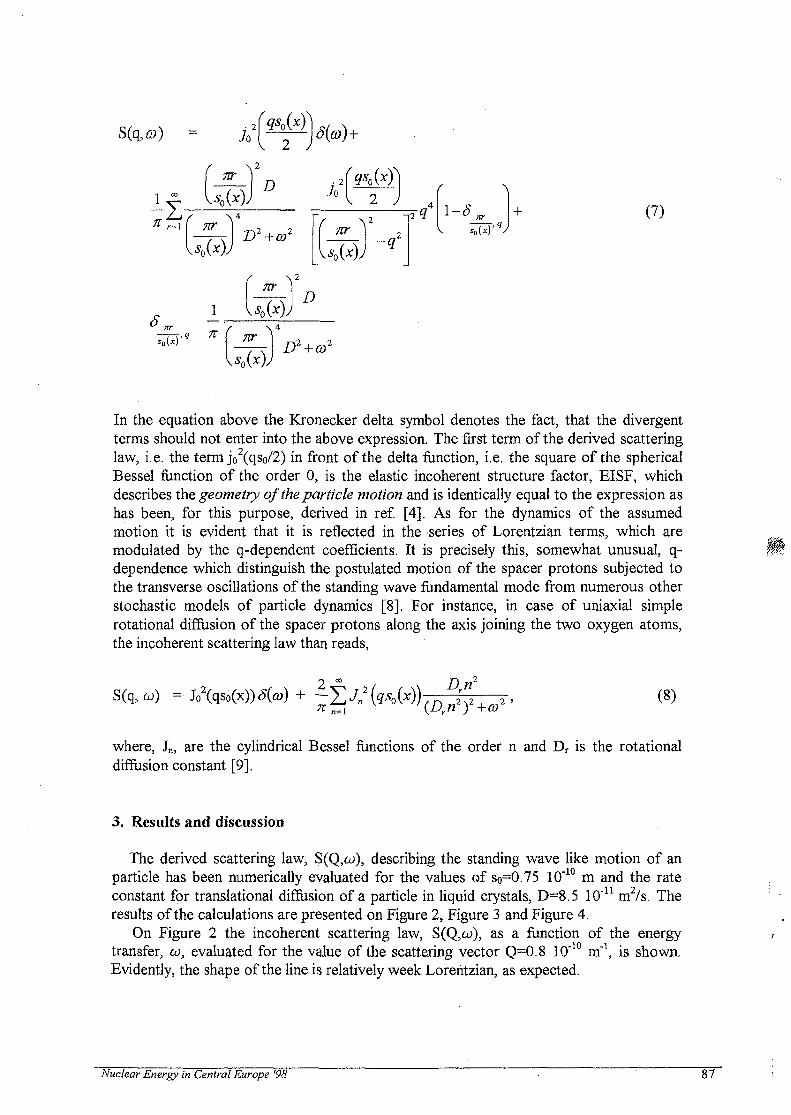
Sfeffl)
(7)
In the equation above the Kronecker delta symbol denotes the fact, that the divergentterms should not enter into the above expression. The first term of the derived scatteringlaw, i.e. the term jo
2(qso/2) in front of the delta function, i.e. the square of the sphericalBessel function of the order 0, is the elastic incoherent structure factor, EISF, whichdescribes the geometry of the particle motion and is identically equal to the expression ashas been, for this purpose, derived in ref. [4]. As for the dynamics of the assumedmotion it is evident that it is reflected in the series of Lorentzian terms, which aremodulated by the q-dependent coefficients. It is precisely this, somewhat unusual, q-dependence which distinguish the postulated motion of the spacer protons subjected tothe transverse oscillations of the standing wave fundamental mode from numerous otherstochastic models of particle dynamics [8]. For instance, in case of uniaxial simplerotational diffusion of the spacer protons along the axis joining the two oxygen atoms,the incoherent scattering law than reads,
(8)L?{q>{)) £ 2,
where, Jn, are the cylindrical Bessel functions of the order n and Dr is the rotationaldiffusion constant [9].
3. Results and discussion
The derived scattering law, S(Q,a>), describing the standing wave like motion of anparticle has been numerically evaluated for the values of So=0.75 10"10 m and the rateconstant for translational diffusion of a particle in liquid crystals, D=8.5 10"u m2/s. Theresults of the calculations are presented on Figure 2, Figure 3 and Figure 4.
On Figure 2 the incoherent scattering law, S(Q,o>), as a function of the energytransfer, OJ, evaluated for the value of the scattering vector Q=0.8 10"10 m"1, is shown.Evidently, the shape of the line is relatively week Lorentzian, as expected.
Nuclear Energy in Central Europe'98 • 87

The three dimensional plot of the scattering law, S(Q,w), is exhibited on Figure 3.Clearly, within the experimentally accessible range of wave vector transfer, Q, (e.i. up tothe limit of say 2 1010 m"1) the peak value of the Lorentzian is nearly constant, and this isobviously the main characteristics of the postulated standing wave like motion. It is to benoted, that in the limit of Q -» oo, the derived scattering law, S(Q,o>), (weakly)converges to zero. On Figure 3. exhibited satellites, originating due to the divergentterms of eq. (7), are appearing already well out of the experimentally accessible Q rangeand consequently can not be detected. Although for large amplitude of standing waveoscillations, so(x), of the spacer proton at the distance x, the satellites do move towardssmaller values of Q, the occurrence of such large amplitudes would require large amountof vibrational energy and are therefore very unlikely to occur.
On Figure 4 the peak value of the derived and on Figure 3 presented scattering law,S(Q,a>), as a function of wave vector transfer, Q, (also outside its experimentallyaccessible range), is exhibited. It is to be noted that only 5 terms of the series, as givenby the eq. (7), are taken into account, thus illustrating relatively fast convergence of theabove series. The Q independent behaviour (throughout the experimental Q-range) of theincoherent scattering law, derived for the case of the standing wave like dynamics of thescatterer, might consequently be taken as the major indication of the described motion.
vL2 -J.1-5x10" 0
co s A - l5X1011 l x lO 1 2
Figure 2. The incoherent scattering law, S(Q,w), evaluated at Q=0.8 10 m , for standingwave like particle dynamics, as a function of neutron energy transfer. The values of theparameters are given in the text.
However as evident, this effect is small and it will be with difficulty that it could beexperimentally detected. In fact, it seems that the postulated dynamics (when resolutionbroadened) of the spacer protons of backbone deuterated linear polymer polyacrylate, inclear contrast to the investigation of just the geometry of their motion [1, 4], could notbe uniquely identified by the cold neutron scattering method alone.
88 Nuclear Energy in Central Europe 98

[10A-12s]
-1x10 -• [I/A]
lxlO1
Figure 3. The three dimensional plot of the incoherent scattering law for standing wave likeparticle dynamics, S(Q,co), as a function of neutron energy transfer, co, and the wave vectortransfer, Q. The values of the parameters are given in the text. The constant Q dependence of thescattering law (within the experimentally accessible Q range approximately spanning an intervalbetween 0.1 10"10 m"1 < Q < 2.2 10"10 m"1) is clearly noted.
4. Conclusions
The quasi-elastic cold neutron incoherent scattering law, QNS, for the assumed caseof transversal standing wave type of motion of the linear chain -a spacer- of thepolyacrylate polymer liquid crystal, based upon the random walk of the particle betweentwo perfectly reflecting potential barriers, has been derived. The spacer protons are takento vibrate (within the stationary plane) transversely to the line joining the oxygen atomsin a way where they are all simultaneously displaced in the same direction withamplitudes of the standing wave fundamental mode of the vibration excited.
The main characteristics of the postulated dynamical effect of the spacer protons onthe calculated incoherent scattering law, S(Q,6J), is its almost constant value throughoutthe experimentally accessible range of the scattering vector Q. It appears that, when theexperimental resolution broadening effect is taken into account, the contribution of thepostulated dynamical behaviour to the measured QNS spectra might be small, andconsequently the standing wave like spacer dynamics in polymer liquid crystals will bevery difficult to be identified in the quasielastic neutron scattering experiments. In fact, it
Nuclear Energy in Central Europe '98 89

5xlO""iU
4xlO-10
3xlO-10
S(Q,a) [s]2xlO~10
1x10⁻¹⁰
0
j
IfJ
;
4 6Q A-\-l
10
Figure 4. An almost Q independent (within the experimentally accessible Q range) behaviour ofthe incoherent scattering law, which has been derived for the case of the standing wave likedynamics of the scatterer, represents the major characteristics of the described motion. In case oflarge amplitudes of standing wave like vibrations of the proton (from the energy point of view anunlikely event), the satellites move towards smaller values of Q.
now appears that, based upon the results of the calculations above, it is very likely, thatthe EISF measurements of ref. [1], reflect to the largest extent only the small step, withina circular segment of the temperature dependent apex angle, confined stochastic angulardisplacements, around their para axis, as has been already predicted in ref. [4].
5. References
[1] L. Benguigui, L. Noirez, R. Kahn, P. Keller, M. Lambert, E. Cohen De Lara, J.Phys. II (France) 1, 451 (1991).[2] P. Davidson, L. Noirez, J. P. Cotton, P. Keller, Liq. Crystals, 10, 111 (1991).[3] L. Noirez, P. Keller, P. Davidson, F. Hardouin, J. P. Cotton, J. Phys. (France) 49,1993 (1988).[4] B. Cvikl and J. Peternelj, J. Phys. France 2, 87 (1992).[5] F. Volino, A. Dianoux, H. Hervet, J. Phys. Colloq. France 37 C3 (1976); Mol.Cryst. Liq. Cryst. 38 125 (1977).[6] B. Cvikl and U. Dahlborg, Molec. Phys. 88 419 (1996).[7] William Feller, An Introduction to Probability Theory and Its Applications,Vol. I, 2nd Ed., John Wiley & Sons, Inc., New York (1960).[8] M. Bee, J. L. Sauvajol and J. P. Amoureux, J. Physique 43 1797 (1982).[9] A. J. Dianoux and F. Volino and H. Hervet, Molec. Phys. 30 1181 (1975).
90 Nuclear Energy in Central Europe '98

SI0100097
Nuclear Energy in Central Europe '98
Terme Catez, September 7 to 10, 1998
LOAD FOLLOW SOFTWARE DEVELOPMENT FOR THE KRSKO NPPPROCESS COMPUTER
A.Trkov, M.Kromar, B.ZefranInstitute "Jozef Stefan", Jamova 39, Ljubljana, Slovenia
Andrei ,Trkov(g>,ijs. si. Marjan.Kromar(S),iis.si, Boian.Zefranffiijs.si
Abstract
The LOADF program package was designed for the Process Information system of the Krsko NuclearPower Plant, with the objective to simulate by calculations the operation of the reactor, in order toprovide to the operators the additional information, which can not be measured directly. A three-dimensional reactor core model was selected. The power distribution is calculated by solving thediffusion equation, allowing for the thermohydraulic feedback effects on the cross sections. Predictionmode calculations can be executed with the same software on remote computers. The calculations arerepeated at fifteen-minute intervals. The operating experience of the software is very good so far,considering the computational efficiency, numerical stability and good agreement between the calculatedand the measured parameters.
1. Introduction
Accurate information on the state of the reactor core can contribute to a safe, economic and reliableoperation of a nuclear power plant. There are parameters that describe the reactor core, which are notdirectly measurable and available from the control instrumentation, but can help the operators tooptimise the operation of the plant on economic terms. Examples of such parameters are the relativeXenon concentration and its axial distribution, which are relevant for quenching Xenon oscillations(when present) and for minimising the radioactive waste production due to reactivity control throughchanging the Boron concentration in the coolant primary circuit. In addition, an accurate estimate of theXenon concentration level can improve the estimate of the shutdown margin. The LOADF softwarepackage was ordered by the Krsko Nuclear Power Plant (NEK), with the design objective to run on theProcess Information System (PIS-NEK) and to provide at least the following additional information:
• Relative concentration and axial distribution of Xenon and Iodine.• Reactivity hold-up by Xenon.• Shutdown margin in various modes of operation.• Minimum Boron concentrations to meet the shutdown margin requirements in various
modes of operation.• Expected critical Boron concentration for a given control rod configuration at criticality
after a trip.
2. Available Resources
The PIS-NEK system runs on two Digital VAX-4200 machines, which by today's standards provide arelatively modest resource of computational power. The PIS-NEK database contains detailed
Nuclear Energy in Central Europe '98 93

information on many measured parameters, which describe the reactor core. The parameters areavailable as current values, one-minute average values, ten-minute and one-hour average values. Thereliability and accuracy as input to the calculations needs to be ascertained.
The standard computational tool for design calculations at the "Jozef Stefan" Institute (US) isthe CORD-2 package [1], which is well tested for pressurised water type reactors. It is verified bydesign calculations of all cycles of the Krsko NPP. It includes the GNOME R code [2] to calculate thewhole-core power and temperature distributions, including thermohydraulic feedbacks. The generalfeatures and the ability of GNOME R to predict core behaviour during slow reactivity transients havealready been discussed [3]. With only trivial modifications this code was incorporated as acomputational module into the LOADF program. The input cross sections for the calculations aregenerated according to the standard design procedures with CORD-2. The LOADF package provides aninterface between the database of the PIS-NEK system and the GNOMER module, to retrieve therequired information about the core operating parameters and to enter the calculated results back intothe database.
3. Implementation
Considering the modest computational power of the PIS-NEK computers, a one-dimensional model ofthe reactor core would seem appropriate. However, such a model would inevitably introduceapproximations and "fudge factors" at various stages of the calculations, to force agreement betweenmeasurements and calculations. On the other hand, it has been demonstrated by the design calculationsat the US that good results can be obtained from first principles, when a three-dimensional model isused. Furthermore, the computers of the PIS-NEK system are likely to be replaced with similar butmore powerful machines. The high efficiency of the computational methods in GNOMER make theimplementation of a three-dimensional model for the calculations feasible even on the existing PIS-NEKmachines, therefore this model was selected for the LOADF package. The additional advantage of suchan approach is the flexibility for possible future extensions, when more computational power becomesavailable.
Due to the computational constraints, prediction mode calculations can not be executed inparallel with normal program operation on the process computer. Provision is made to run the samesoftware on remote computers. VAX/VMS or PC/DOS environments are supported. By transferring adump-file from PIS-NEK to the remote computer, calculations simulating various operation scenarioscan be initiated with starting conditions identical to the real situation, as it appears on the PIS-NEKsystem.
The geometrical representation of the reactor core consists of assembly-sized nodes for a coreoctant in the radial direction and ten core slices in the axial direction. Real-time operation is possiblewithout overloading the system when the calculations are repeated at fifteen-minute intervals. This isadequate to follow any Xenon transients with sufficient accuracy.
The main calculated parameters are the axial power distribution and the relative concentrationsand axial distributions of Xenon and Iodine, corresponding to core conditions, which match as closely aspossible the measured values, retrieved from the PIS-NEK database. All other quantities can be derivedfrom them and entered into the PIS-NEK database to be available to the operators, if necessary.
94 Nuclear Energy in Central Europe '98
4. Operating Experience
The LOADF program is operational for testing since January 1997. Due to the exceptionally goodoperation record of the power plant in 1997/98 there were relatively few transients that would severelytest the performance of the program. The transients included power reduction to 70% during thermalcalibration tests, inlet temperature variation during the moderator temperature coefficient measurementand reactor coast-down at the end of cycle. In the initial testing phase a few minor modifications to thecalculation flow logic were made. The prediction capability of the program turned out to be very good.The results at the start-up for the current cycle are presented as an example.
The algorithms of the program turned out to be very efficient and stable. No numericalinstabilities were encountered, in spite of the several layers of nested iterations, which are necessary inthe calculations.
To determine the accuracy of the calculated parameters, it is useful to make a systematiccomparison with the measured values. In the calculation, the power and one additional parameter mustbe fixed. This is set equal to the measured value, while the independent parameters provide an indicationof the overall performance of the calculated results. The choice of the fixed parameter depends on thepower level, the validity of the measured data and sometimes on the actual value of the measuredparameters. In addition to the power level, the fixed parameter is either the flux difference, the controlrod position or the Boron concentration. The logic, governing the choice is coded internally in LOADF.
In the top part of Figure 1 the power increase during start-up is displayed. In the bottom part ofthe same figure the calculated axial flux difference is compared to the processed signals from the topand bottom halves of the power range detectors. The comparison demonstrates very good agreementbetween measurement and calculation.
In the top part of Figure 2 the calculated and the "measured" Boron concentration arecompared. The Boron concentration retrieved from the PIS-NEK database is not actually the truemeasured value, but something that is calculated from various measured flow rates and normalisedperiodically to the true measured value, which is entered manually into the database. At present, theflow rate measurements are incomplete, hence the observed drifts in the "measured" Boronconcentration. As such, this parameter is not suitable as input for the calculations. The situation willimprove in the near future, when the true measured Boron concentration will be systematically fed intothe PIS-NEK database.
The bottom part of Figure 2 displays the comparison between the calculated and the actuallymeasured D-bank control rod position. The overall agreement is good, except at a few isolated pointswhere dips are observed. These dips coincide with those in the bottom part of Figure 1. They originatefrom the power range detector signals, which are not processed adequately for use in such calculations.Namely, the processing does not take into account situations when one of the available detector signalsis in test mode operation. The problem has been addressed and eliminated recently.
Nuclear Energy in Central Europe '98 95

fe?
u0PL.
LOADF Core MonitoringKrsko NPP
100 •—'—i—'—'—'—i—'—' '—i—i—i—i—i—i—I—|—i—r—i—i—i—i
• MeasuredMaximum Difference
0.0000%at X= 0.000+0
I- I I I I I I I I
I I P t - ^ I I I 1 I I I I I I I I I I I I 1 t • I I I I I I I 1 I 1 I I ) t I I
0Time (days)
-P
o
3OS
LOADF Core MonitoringKrsko NPP
LOADF• Measured
Maximum Difference0.0000%
T i me (days)
Figure 1.: Calculated and measured power level and axial flux difference,• ~ ' ~ ~ Nuclear Energy in Central Europe '98
96

aa,
oaooao
I
2.O
1.8
1.6
1.4
-2
LOADF Core MonitoringKrsko NPP
"i—i—i—i—i—i—I—I—i—(—I—I—i—i—r—i—I—r—i—i—i—i—i—r
2Time (days)
LOADF• Measured
In
aascqOS
o
200
100
0
LOADF Core MonitoringKrsko NPP
I . I 1 < , ! „ , ' ,
0I I I t 1 t ) ) 1I ,
Time (days)
LOADF• Measured
Figure 2.: Calculated and measured Boron concentration and D-bank control rod position.Nuclear Energy in Central Europe '98 97

5. Conclusions
The current operation experience with the LOADF package for following the operation of the reactor ofthe Krsko NPP shows that the main parameters are predicted adequately from the calculations. Acomputational cycle takes about four to six minutes of real time, leaving enough reserve in the load ofthe process computer when the calculations are repeated at fifteen minute intervals. The algorithms areinsensitive to possible excursions of this period, which might occur when the computer is very heavilyloaded with other tasks of high priority, in combination with large configuration changes, which takesomewhat longer to converge.
Some minor problems were encountered with the data retrieved from the PIS-NEK database.Namely, the signals from the power range detectors to represent the axial flux difference were notprocessed adequately for use by LOADF and the information on the actually measured Boronconcentration is missing. The first of these problems has already been solved. A systematic entry of themeasured Boron concentration data into the PIS-NEK database will be implemented in the near future.Attention will then be focused on the verification of the other parameters, which are of interest and canbe derived from the results calculated by LOADF.
References
[1] M.Ravnik, A.Trkov, M.Kromar, S.Slavic, I.Mele, B.Zefran, N.Zeleznik: CORD-2 Core DesignSystem for PWR Type Reactors, Institute Jozef Stefan, Ljubljana, Slovenia, IJS-DP-6174, 15.Dec. 1997.
[2] A.Trkov: GNOMER - Multigroup 3-Dimensiona! Neutron Diffusion Nodal Code withThermohydraulic Feedbacks, Institute Jozef Stefan, Ljubljana, Slovenia, IJS-DP-6688, Rev.l,Mar. 1994. ' ,
[3] A.Trkov, M.Kromar: Recent Improvements to the GNOMER Code for Reactor Calculations, 4th
Regional Meeting on Nuclear Energy in Central Europe, Proceedings, Eds.: B.Mavko, L.Cizelj,Bled, 7-10 Sept. 1997, Drustvo jedrskih strokovnjakov Slovenije (Nuclear Society of Slovenia),ISBN.961-6207-07-5.
98 Nuclear Energy in Central Europe '98

SI0100098
Nuclear Energy in Central Europe '98
Terme Catez, September 7 to 10, 1998
SCORPIO - WER Core Surveillance System
by
Arne Hornæs, Terje Bodal, Svein SundeInstitutt for energiteknikk
OECD Halden Research ProjectP.O.Box 173, N-1751 Halden, Norway
Karel Zalesky, Miroslav Lehmann, Marek PeckaNuclear Research Institute
NRI Rez plc25068 Rez, Czech Republic
Jiri Svarny, Vaclav Krysl, Zdenka JuzovaSkoda Nuclear Machinery Plzen, Co Ltd.
Orlik 266316 06 Plzen, Czech Republic
Anton Sedlak, Milan SemmlerChemcomex Ltd
Prazska 16102 21 Prague 10, Czech Republic
ABSTRACT
The Institutt for energiteknikk has developed the core surveillance system SCORPIO, whichhas two parallel modes of operation: the Core Follow Mode and the Predictive Mode. Themain motivation behind the development of SCORPIO is to make a practical tool for reactoroperators, which can increase the quality and quantity of information presented on corestatus and dynamic behaviour. This can first of all improve plant safety, as undesired coreconditions are detected and prevented. Secondly, more flexible and efficient plant operationis made possible. The system has been implemented on western PWRs, but the basic conceptis applicable to a wide range of reactors including VVERs: The main differences betweenWERs and typical western PWRs with respect to core surveillance requirements are outlined.The development of a WER version, of SCORPIO has been done in co-operation with the Nu-clear Research Institute Rez, and industry partners in the Czech Republic. The first system isinstalled at Dukovany NPP, where the Site Acceptance Test was completed 6. March 1998.
Nuclear Energy in Central Europe '98 99

1. INTRODUCTION
The SCORPIO system [1] has been in operation at the Ringhals PWR unit 2 in Sweden sincethe end of 1987. In addition, the system has been installed at Nuclear Electric's Sizewell BPWR in UK and all the 7 NPPs of Duke Power Co. in USA [2].The development of the VVER version of SCORPIO has been carried out in co-operation withthe Czech partners Nuclear Research Institute (NRI), Skoda and Chemcomex, with the NPPDukovany as the target plant. The goal has been to adapt the functionality of SCORPIO to ad-dress the particular needs in WERs. The project has been initiated and partly funded by theScience and Technology Agency (STA), Japan through the OECD NEA assistance program.The system specification is general covering all W E R type reactors, and the target system hasbeen prepared such that adaptation to other VVERs, including VVER-1000, can be easilyachieved.Special characteristics, which have been emphasised for VVERs, are:
• Control of radial power distribution to minimise fluence at the vessel wall may be impor-tant in VVERs due to the small diameter of the pressure vessel. In certain operating re-gimes, it might be desirable, to reduce the load on certain identified leaking fuel rods.
• In VVERs there are a number of fixed in-core neutron detectors and core exit thermocou-ples, which are used for core surveillance. One problem is to validate the correctness ofthese measurements. In Western plants one has reported problems with effective validationof the exit thermocouples. With a detailed simulator one can use the simulator to calculatethe measurements thus providing analytical redundancy. This increases the possibility ofdetecting sensor failures at an early stage. This has been demonstrated in PWRs andBWRs where the simulator is used to check the status of fixed in-core sensors and othermeasurements.
• Thermocouple measurements are more credible in a W E R reactor than in standard west-ern plants due to the shrouds surroundings of the fuel assemblies.
The major new features of the SCORPIO-VVER core surveillance system compared to exist-ing VVER core monitor systems can be summarised as follows
• Improved limit checking and thermal margin calculation• On-line 3D power distribution calculation based on the same physics model as used for
core design and safety analysis• Improved validation of plant measurements and identification of sensor failures by utilising
the core simulator as an independent means for calculation of 3D power distribution• Optimum combination of measurements and calculations to obtain more precise values of
critical parameters• Predictive capabilities and strategy planning, offering the possibility to check the conse-
quences of operational manoeuvres in advance, prediction of critical parameters, etc.• Provide interfaces to off-line analysis codes for core loading pattern design, neutron flu-
ence calculations at the reactor vessel wall, etc.• Integration of modules for monitoring fuel performance.and coolant activity as a means
for detection and identification of fuel failuresAs a consequence of these requirements it was decided that the SCORPIO-WER versionshould use the core simulator MOBY-DICK. It was also decided to continue using thePICASSO system as the MMI part of SCORPIO-WER. The old Picasso-2 system was re-placed by Picasso-3 [3] which includes much more functionalities than Picasso-2. In additiontwo new modules, a new PCI model PES [6] and a primary coolant monitoring system PEP A[7] were to be integrated with the basic SCORPIO system.
100 Nuclear Energy in Central Europe '98
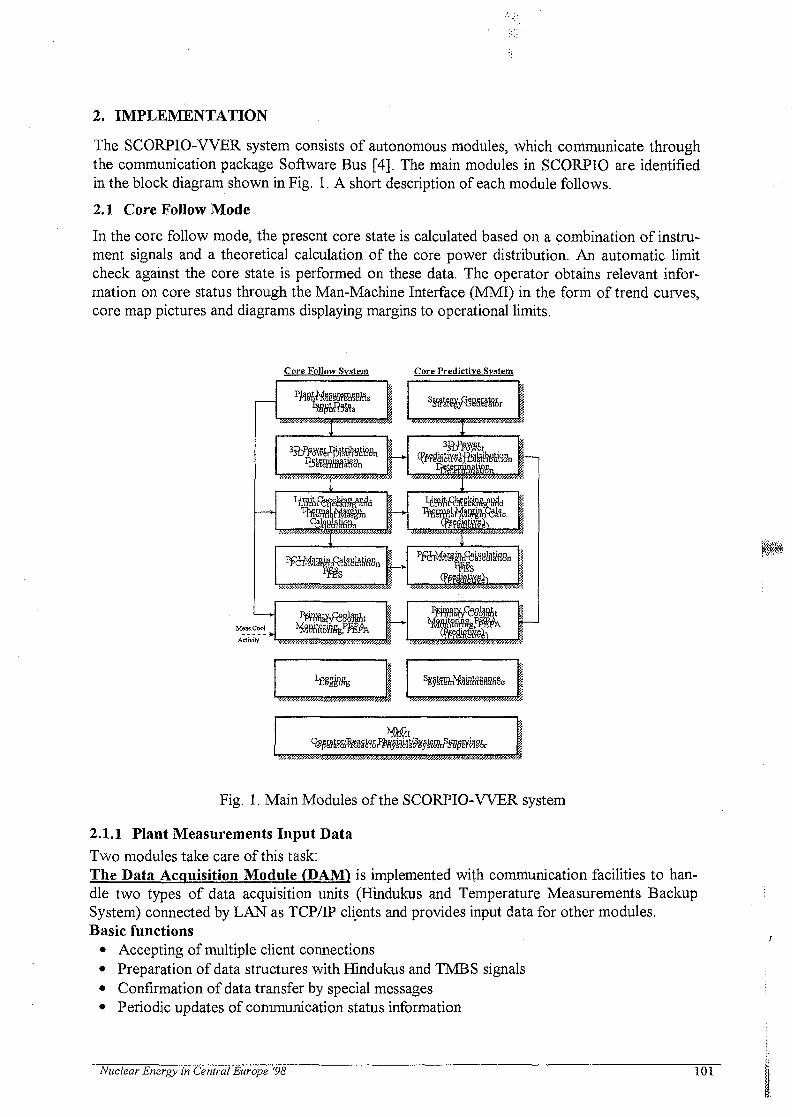
2. IMPLEMENTATION
The SCORPIO-VVER system consists of autonomous modules, which communicate throughthe communication package Software Bus [4]. The main modules in SCORPIO are identifiedin the block diagram shown in Fig. 1. A short description of each module follows.
2.1 Core Follow Mode
In the core follow mode, the present core state is calculated based on a combination of instru-ment signals and a theoretical calculation of the core power distribution. An automatic limitcheck against the core state is performed on these data. The operator obtains relevant infor-mation on core status through the Man-Machine Interface (MMI) in the form of trend curves,core map pictures and diagrams displaying margins to operational limits.
Core Follow System Core Predictive System
Fig. 1. Main Modules of the SCORPIO-WER system
2.1.1 Plant Measurements Input DataTwo modules take care of this task:The Data Acquisition Module (DAM) is implemented with communication facilities to han-dle two types of data acquisition units (Hindukus and Temperature Measurements BackupSystem) connected by LAN as TCP/IP clients and provides input data for other modules.Basic functions
• Accepting of multiple client connections• Preparation of data structures with Hindukus and TMBS signals• Confirmation of data transfer by special messages• Periodic updates of communication status information
Nuclear Energy in Central Europe '98 101

• Software Bus interface to other modules for transfer of data and status informationTechnical features
• Non-blocking communication with clients, safe in the case of client or LAN malfunction• Immediate processing of the client message not blocked by other processing (e.g. output)• A complete message with the Hindukus data processed in less than 100 milliseconds
Following characteristics are checked in a data set received from any client:• Size of data structure corresponds with predefined data format for this type of client.• Signal identifiers are in appropriate positions according to predefined data format.• Data are readable; numbers and arrays are in an appropriate format.
The Input Data Processing Module (TDATP) processes all signals from measurements col-lected by the DAM.Basic functions
• Identification of Operational Regime (number of loops in operation etc.)• Signal conditioning, stabilization, quality checking and validation• Signal transformation to physical units• Calculation of primary and secondary circuit parameters including the reactor power• Calibration of temperature sensors in isothermal reactor states
Both discrete and analogue signals from Hindukus and TMBS are processed. Most importantoutputs are temperature and pressure values in all measured locations, linear powers, state ofprimary circuit loops, control assemblies positions, boron acid concentration, mean reactor in-let and outlet temperatures, temperature rises, coolant flow rate and reactor thermal power.Input data validation is performed in two steps, Primary signal checking is based on compari-son of values from signal interpretation and maximum reasonable limits. Faulty sensorsare excluded in this step. Advanced method of signal validation is applied to thermocouple andSelf Powered Neutron Detector (SPND) measurements. Credibility factor is assigned to eachmeasurement using statistical evaluation of measured and calculated values. For thermocouplesand resistance thermometers calibration before the reactor start-up, a special procedure moni-tors the temperature stabilization process and calculates individual correction coefficients forsensors.
2.1.2 3D Power Distribution DeterminationThe main task of this functionality is to supervise calculations of 3D power distribution andcritical boron concentration performed by the core simulator MOBY-DICK on the nodal level.The 3D Power Reconstruction module (3DREC), activated each basic system cycle (15sec), provides representative 3D nodal power distribution using validated FA outlet tempera-ture and SPND linear power measurements obtained from ED ATP and the Simulator results.Basic functions
• Calculation of the reconstructed 3D power distribution by two different methods• Triggering of Simulator calculation according to changes in the reactor state.• Triggering of Simulator adaptation according to reactor state and user requests.
Two alternative methods of power reconstruction are implemented in 3DREC. "Traditional"method is similar to that applied in the VK3 monitoring system,'using "local" interpretation ofvalidated in-core measurements, with limited support from Simulator calculation. "Advanced"method, oriented more on "global" interpretation of both measurement types, uses the Simu-lator results with higher priority. This method is able to reach acceptable results with signifi-cantly less number of valid in-core sensors.The Simulator module (SIM), activated on request from the 3DREC module (usually each15 min), has been designed in accordance with the following principal requirements:
102 Nuclear Energy in Central Europe'98

• The module is based on universal finite-difference few-group program MOBY-DICK [5].A simple adaptation procedure has been added to "fit" radial and axial power shapes cal-culated by SIM to the actual "reconstructed" power distribution. A standard 2-group dif-fusion data library of off-line MOBY-DICK is utilised.
• SIM performs coarse mesh (nodal) 3D analysis of actual core states. It solves either a 60°core symmetry segment (standard mode) or the full core (360°) if an explicit perturbationof core symmetry exists, i.e. if there is a significant asymmetry of core loading or individ-ual CFAs are dropped or misaligned. Switching between symmetries is automatic, and re-turn to the 60° calculation is carried out when symmetrical power distribution is restoredand stabilised. Full core solution is performed with a little simplified core model (with 6mesh points per FA cross section, instead of 24 points used at SIM symmetrical solution).
• SIM uses standard off-line MOBY-DICK archive files as its initialisation files.• SIM provides calculated power, neutron flux and burn-up distributions for: 1) "recon-
struction" of the representative 3D nodal power distribution (performed in 3DREC); 2)power distribution "de-homogenisation" (i.e. determination of pin power peaking factorsFq and FAH, carried out in RECON); 3) signal validation (carried out in ID ATP); 4) evalua-tion of probability of fuel defects caused by PCI (performed in PES module). In addition,critical boron concentration calculated by SIM is used to determine the boron concentra-tion in primary circuit, and special input data are prepared for Strategy Generator (SG).
2.1.3 Limit checking and thermal margin calculationThe present NPP Dukovany Specification for operation, such as nodal power peaking limitsand fuel assembly (FA) temperature rise are checked on the basis of the 3D coarse mesh corefollow power distribution [8]. Detailed 3D pin-wise power distribution is produced for deter-mination of Fq and FAH power peaking factors and assessment of all margins to the safety limits(DNBR, LOCA and saturation temperature) on the basis of subchannel analysis. Detailed pin-wise power distribution is processed to provide information for PCI-margin calculation (PES).Two modules are taking care of this functionality:The Reconstruction Module (RECON) has the following functions:
• Determination of 3D pin-wise power distribution and pin-wise Fq and FAH• Transformation from 20 mesh to 7 points for FAs including SPND detectors.
The Check Module (CHECK) has the following functions:• Traditional checking of nodal power peaking factors ( kq and kv )• Traditional checking of coolant temperature rise in the fuel assemblies• New function for assessment of the margins to the safety limits (DNBR, LOCA and satu-
ration temperature )• Automatic selection of limit values depending on operational mode• Calculation of transform coefficients for SPND detectors
2.1.4 PCI -margin calculation, PESThe PES module is evaluating local fuel damage probabilities due to pellet cladding interaction.This module has the following functions:
• Calculation of the conditioned power distribution• Determination of limits for permitted reactor local and global power change
2.1.5 Primary Coolant MonitoringThe PEPA Module determines the number and type of fuel defects based on the coolant ac-tivity analyses (i.e. identification of noble gases and fission products in the coolant).
nergy in Central Europe '98 103

2.1.6 Logging of dataThe LOG Module collects output data from other modules, maintains an archive of outputsand provides output to the LAN for other systems and printed text output of selected arrays.Basic functions
• Asynchronous data capturing from DAM, IDATPD, 3DREC, SIM, CHECK and PESmodules.
• Data sorting (synchronization) in accordance with time stamps in data sets.• Temporary storage of multiple data sets in memory.• Short-term (up to 3 days) disk archivation of selected data from sets stored in memory.• TCP/IP interface for other computers of Unit LAN performing output of selected data.• Automatic calculations of main reactor state parameters mean values per hour and per
day.• Automatic recovery after the shutdown - reuse of backups and archive after new start-up.• Configurable print service for printing of selected arrays in specified time intervals.
Technical features• Non-blocking communication with clients, safe in the case of client or connection malfunc-
tion.• Input calls are processed with a higher priority than output tasks to eliminate data loss.• Memory and disk space requirements are controlled by configurable parameters.
When output structures from other modules are received, LOG checks time stamps included instructures and assembles the archive data sets. Selected data are stored in memory approx. 30minutes to enable a fast output and then a subset of data is transferred to a disk archive.Print service of the Logging Unit is able to print or save on the disk selected arrays in periodi-cal intervals or after user request from MMI. Arrays may be printed in various formats and or-ganized in predefined forms according to a specification in the configuration file.
2.2 Predictive Mode
In the predictive mode of operation, the operator can forecast the reactor behaviour during thecoming hours. As no detector signals are available in this case, the accuracy of the predictedcore state depends heavily on the quality of the physics model in the predictive core simulator.The state is checked against limits, and the predicted behaviour of the core may be analysed bythe operator through a number of dedicated pictures.
2.2.1 Strategy GeneratorThe main task of the Strategy Generator (SG) is to assist the operators and reactor physiciststo derive various operational strategies that can be verified by the predictive simulator.The strategy generator employs an extremely simplified core model to suggest control strate-gies for achieving a given power manoeuvre [9]. Power and xenon-iodine densities are calcu-lated for the upper and lower core halves without solving the neutronics and hydraulic equa-tions. The calculations are based on precalculated coefficients for the reactor's response tochanges in the inlet temperatures, control-rod movements, and boron and xenon concentra-tions. These coefficients are found by running the off-line MOBY-DICK for various reactorconditions, and correspond to multidimensional numerical expansion of reactor reactivity.
2.2.2 Predictive simulatorThe Predictive Simulator Module (PREDSIM) is based on the MOBY-DICK [5]. It is usedfor calculation of 3D power distribution and critical parameters up to 72 hours ahead of cur-rent time. The initial conditions are provided by the 3DREC module. The Strategy Generatormodule and/or the user himself prepare the necessary input data.
104 Nuclear Energy in Central Europe '98

The predictive simulator can be used to solve 5 different sorts of tasks. These are:• Solution of load-follow transient without recalculation of critical parameters.• Solution of a load-follow transient with recalculation of critical parameters• Calculation of start-up critical boron concentration and concentrations providing selected
subcriticality margins for specified three coolant temperatures and one Bank 6 insertion.• Calculation of start-up critical Bank 6 positions and positions of Banks 4 to 6 selected
subcriticality margins for specified 3 coolant temperatures and one boron concentration.• Calculation of shutdown boron concentration at one specified coolant temperature with all
rods out of core.Tasks 3 and 4 can only be performed at zero power. The predictive tasks can be started in 60°core symmetry only. To accelerate calculation, 6 mesh points per FA cross section are used.
2.2.3 Limit checking and thermal margin calculation in predictive modeThe Predictive Limit Checking Module is triggered by the PREDSIM. It produces detailed3D pin-wise power distribution for determination of Fq and FAH power peaking factors and as-sessment of all margins to the safety limits (DNBR, LOCA and saturation temperature) on thebasis of subchannel analysis.
2.2.4 PCI margin predictionThe Predictive PES module is used to find the minimum difference between limit and linearpower on the detailed pin-wise level. The result is based on initial condition from the PES CoreFollow Module and inputs coming from PREDSIM, the Predictive Limit CheckingModule.
2.2.5 Primary Coolant Activity PredictionThe Predictive PEPA module allows, based on results of the on-line module, calculation ofradioactive nuclide activities in the primary coolant in transient states of the reactor. The tran-sient is defined by using the Strategy Generator.
2.3 Man Machine Interface
The man machine interface has been designed to be used by three different user groups:© Reactor Operator © Reactor Physicist © System Supervisor
and to be used in the two operation modes:O Core Follow © Predictive
The system was designed such that is easy to use and presentation of information is easy tounderstand and read. An example of a SCORPIO-VVER screen is shown in Fig. 2. This pic-ture shows the reconstructed outlet temperatures. The colour of assembly cells has in this casebeen selected to indicate the difference between measured and reconstructed temperature rise.
3. CONCLUSIONS
The development of the SCORPIO-VVER system has been going on since the middle of Janu-ary 1996. The development process has followed a well-defined Quality Assurance Plane.Dukovany NPP staff has taken part in the requirement specification, reviews, testing and incoupling of the system to the plant instrumentation. Factory Acceptance Test (FAT) was tak-ing place in the first part of November 1997 and Site Acceptance Test (SAT) was successfullyperformed during the first week of March 1998. The system is now implemented on two of thefour units at the Dukovany NPP.
Nuclear Energy in Central Europe '98 105

R?r*s
\saiwrtFig. 2. The "RPD, Outlet Temperatures" picture
4. REFERENCES
[1] 0. Berg, T. Bodal, J. Porsmyr, K. A. Adlandsvik (OECD) Halden Reactor Project:"SCORPIO-Core Monitoring System for PWRs. Operational Experience and New Devel-opments", ANS Topical Meeting on Advances in Nuclear Fuel Management II, MyrtleBeach, South Carolina, March 23-26, 1997
[2] S. C. Balzard, S. K. Gibby (Duke Power Co.): "Implementation of the Core SurveillanceSystem SCORPIO at Duke Power Company", ANS Topical Meeting on Advances in Nu-clear Fuel Management II, Myrtle Beach, South Carolina, March 23-26, 1997
[3] K. A. Barmsnes, T. Johnsen, C. V. Sundling (OECD) Halden Reactor Project: "Imple-mentation of Graphical User Interface in Nuclear Applications", ENS Topical Meeting onVVER Instrumentation and Control, Prague, April 21-24, 1997
[4] T. Akerbaek, M. Louka: "The software Bus, an Object-oriented Data exchange System",HWR-446 (April 1996)
[5] "MOBY-DICK, Theoretical Foundations of the Macrocode System", Skoda report No.ZJS-1/91
[6] R. Svoboda, M. Valach: "The PCI Safety Margins Assessment for VVER-440 core", UJVRez, November 1993
[7] F. Pazdera, M. Valach, O. Barta, L. Novak, S. Stech: "The Application of the PES-PEPAExpert System at the Dukovany NPP", Technical committee on fuel failure in normal op-eration of water reactors, 26.5. - 29.5.1992, Dimitrovgrad, Russia
[8] "SCORPIO-VVER, Navrh algoritmu a ukolu realizace ve^SKODA JS", Ae 8771/Dok, (inCzech)
[9] S. Hval, "A description of the two-point model used as strategy generator in the core sur-veillance system Scorpio", HWR-79 (1982)
106 Nuclear Energy in Central Europe '98

SI0100099
Nuclear Energy in Central Europe '98
A S S Terme Catez, September 7 to 10, 1998
INVESTIGATING A POSSIBILITY TO IMPLEMENT24-MONTH CYCLE IN NPP KRSKO
Tea BilicKrsko Nuclear Power Plant, Vrbina 12,
SI-8270 Krsko, Slovenia
Dubravko PevecFaculty of Electrical Engineering and Computing, Unska 3,
10000 Zagreb, Croatia
Tomislav SmucRuder Boskovic Institute, Bijenicka 54, 10000 Zagreb, Croatia
Abstract
The technical feasibility of a NPP Krsko reload core for a 24-month cycle has beenshown. The equilibrium cycle core model for uprated NPP Krsko conditions using thecomputer code package FUMACS has been developed. 24-month equilibrium cycles for splitfeed enrichment batches of 68 and 72 fresh fuel assemblies were generated in that models Theanalysis of these preliminary loading patterns for 24-month equilibrium cycles showed that itis possible to design the 24-month cycle cores for the NPP Krsko from a fuel managementstandpoint.
1. INTRODUCTION
The operating cycles of nuclear power plants have been extended beyond the original12-month cycle length. At present most nuclear power plants in the United States operate on18-month cycles, and some have increased the cycle length to 24 months [1]. Modeling anddesign of reload LWR cores for ultra-long operating cycles (from 36-month cycles to 47-month cycle) have been recently performed [2].
Longer operating cycles can potentially lessen total power generation costs. Byincreasing cycle length in currently operating light water reactors, the outage frequency isreduced, and the capacity factor is improved, providing an operation and maintenance costbenefit. On the other hand, fuel with higher enrichment is required, and the fuel fabricationcosts go up. Radiation exposure to site personnel and other costs associated with reload coredesign and licensing are also reduced for longer operating cycles.
The extension of operating cycle length to 18 months for NPP Krsko was recentlyconsidered [3, 4] and equilibrium cycle loading patterns for 18-month cycle were generated[4]. Our intention was to investigate a possibility to implement 24-month cycle in NPP Krsko.
Nuclear Energy in Central Europe '98 107

The existing steam generators of Krsko Nuclear Power Plant will be replaced in therecent future and at the same time the reactor core power will be increased from current 1876MW(th) to 1994 MW(th) [3, 5]. This core power uprating will surely impact the nuclear coredesign. We have investigated the 24-month reload cycle for NPP Krsko after power uprate.
The average core burnup of 22000 MWd/tU is obtained for uprated conditions of NPPKrsko 24-month cycle with the assumption of 60 days of outage and capacity factor of 0.85.An equilibrium cycle to be determined has to satisfy safety limits, which will be valid for theNPP Krsko uprated condition. We assumed the current value for peaking factors, i.e. 2.34 fortotal peaking factor FQ, and 1.53 for enthalpy rise factor F^H. These peaking factors are givenwithout uncertainties. We also assumed the current maximum values for discharge burnup(maximum batch discharge burnup of 45000 MWd/tU, and fuel assembly maximum alloweddischarge burnup of 50000 MWd/tU). Keeping the moderator temperature coefficientnegative (the current requirement) may cause additional problems in designing the reactorcore with the outstanding number of burnable absorbers. The use of integral fuel burnableabsorber (IFBA) is supposed. The enrichment limit of 5w/o in U-235 is dictated by spent fuelpool criticality requirements [6].
The first step in determination of equilibrium cycle is to find a size of the batch (anumber of fuel assemblies). Based on our engineering judgement and taking into account themaximum discharge burnup and the desired cycle length the batch size of 68 or 72 fuelassemblies was obtained. In an automated manner, using the methodology described in theSection 2., loading patterns for NPP Krsko 24-month equilibrium cycles were generated. Ananalysis of NPP Krsko 24-month equilibrium cycles is performed is Section 3. Conclusionsare given in Section 4.
2. CALCULATIONAL TOOLS AND METHODOLOGY
The modified computer code package FUMACS V 91.1 [7] is used to model anequilibrium cycle of the NPP Krsko core for the uprated power conditions. The computercode package FUMACS encompasses computer codes PSU-LEOPARD and MCRAC. Thecomputer code PSU-LEOPARD generates group constants (two energy groups), and thecomputer code MCRAC is used for global depletion calculations. A simulation of NPP Krskocore depletion is performed in two-dimensional model with the assumption of octal coresymmetry. An equilibrium cycle is defined as a cycle for which the loading pattern and cyclelength are always the same (not changing from cycle to cycle). The critical boronconcentration curves as well as the power distributions during the cycle are identical to thosefrom the previous cycle in an ideal equilibrium cycle. The flow diagram for the calculation ofan equilibrium cycle using the computer code package FUMACS is given in Figure 1.
3. ANALYSES OF NPP KRSKO 24-MONTH CYCLE
The equilibrium cycle core model for uprated NPP Krsko conditions using thecomputer code package FUMACS has been developed. 24-month equilibrium cycle cores forbatches of 68 and 72 fresh fuel assemblies were generated in that model. It was not possible todesign loading patterns with single enrichment batch due to the power peaking factorproblems. Therefore the split feed enrichment option was introduced. The loading patternwith 68 fresh fuel assemblies (28 fuel assemblies with 4.3 w/o U-235 and 40 fuel assemblieswith 4.7 w/o U-235) is shown in Fig. 2. After one cycle in the core 15 assemblies aredischarged whereas the other 53 assemblies are partly moved to the core periphery and partly
108 • Nuclear Energy in Central Europe '98
moved to the core interior in the checkerboard manner, for a second cycle. In this way, theperiphery runs at low power, and the vessel fluence is reduced. Fig. 3 shows how criticalboron concentration and nuclear enthalpy rise peaking factor depend of core burnup. Theloading pattern contains 8288 integral fuel burnable absorbers (EFBA) rods primarily used tolower the beginning of cycle (BOC) critical boron concentration, which is still rather high(1940 ppm) and might cause positive moderator temperature reactivity coefficient. A largenumber of IFB A rods in the reactor core make a control of power peaking factor during thecycle extremely difficult. To decrease the number of IFB A rods it is recommended to increasethe boron loading, for example by using the enriched boron. The average discharge burnup for68 fresh fuel assembly batch is approximately 39000 MWd/tU.
The loading pattern with 72 fresh fuel assemblies (24 fuel assemblies with 4.3 w/o U-235 and 48 fuel assemblies with 4.7 w/o U-235 is shown in Fig. 4. After one cycle in the core23 assemblies are discharged whereas the other 49 assemblies are partly moved to the coreperiphery and partly moved to the core interior in the checkerboard manner, for a secondcycle. Fig. 5. shows how critical boron concentration and nuclear enthalpy rise peaking factordepend of core burnup. The loading pattern contains 8288 integral fuel burnable absorbers(IFBA) rods. The beginning of cycle (BOC) critical boron concentration is also rather high(2023 ppm). The average discharge burnup for 72 fresh fuel assembly batch is approximately37000 MWd/tU.
Both developed cores keep burnup below current licensing limits, and meet the basicphysics and thermal-hydraulics design criteria in the FUMACS model. These results shouldbe considered as preliminary estimates, due to the scoping nature of the FUMACS codepackage.
The economic analysis, which includes operating and maintenance savings as well asfuel costs, shows that on a yearly basis these cores are more expensive than the 18-month,three-batch core with the same operational parameters (refueling outage length andavailability factor). These cores would become economically competitive with standard 18-month cycles if SWU cost would drop, or if introduction of 24-month cycle would result inthe significant increase of availability factor.
4. CONCLUSIONS
The equilibrium cycle core model for uprated NPP Krsko conditions using thecomputer code package FUMACS has been developed. 24-month equilibrium cycles for splitfeed enrichment batches of 68 and 72 fresh fuel assemblies were generated in that model.
The analysis of these preliminary loading patterns for 24-month equilibrium cyclesshowed that it is possible to design the 24-month cycle cores for the NPP Krsko from a fuelmanagement standpoint. The burnup, power distribution, and peaking factors generated withthe preliminary low leakage loading patterns indicate that these parameters will not precludethe design and operation of 24-month cycle.
Nuclear Energy in Central Europe '98 109 |
References
[1] Garcia-Delgado L., McMahon M.V., MacLean H.J.: Design of an EconomicallyOptimum PWR Reload Core for a 36-Month Cycle, Transactions of American NuclearSociety, Vol. 78, June 1998.
[2] Rosenstein, R.G., Sipes D.E., Beall, R.H., Donovan, E.J., "24-month Fuel Cycles",Proceedings of the Topical Meeting on Advances in Fuel Management, Pinehurst,USA 1986.
[3] Krsko Nuclear Power Plant - Study of Power Uprate Feasibility Report,WENX-1-42, October 1992.
[4] Smuc T., Pevec D., Bilic T.: Equilibrium Cycles of NPP Krsko After Power Uprate,Proceedings of International Conference "Nuclear Option in Countries with Small andMedium Electricity Grids", Dubrovnik, Croatia, June 1998.
[5] Jurcevic M., Kurincic B., Krajnc B., Uprating and Modernization of Krsko NuclearPower Plant, Proceedings of International Conference "Nuclear Option in Countrieswith Small and Medium Electricity Grid", Opatija, October 1996.
[6] NEK Technical Specifications
[7] Petrovic B., Pevec D., Smuc T., Urli N., "FUMACS - Fuel Management CodeSystem", Ruder Boskovic Institute, Zagreb, 1991.
10 Nuclear Energy in Central Europe '98
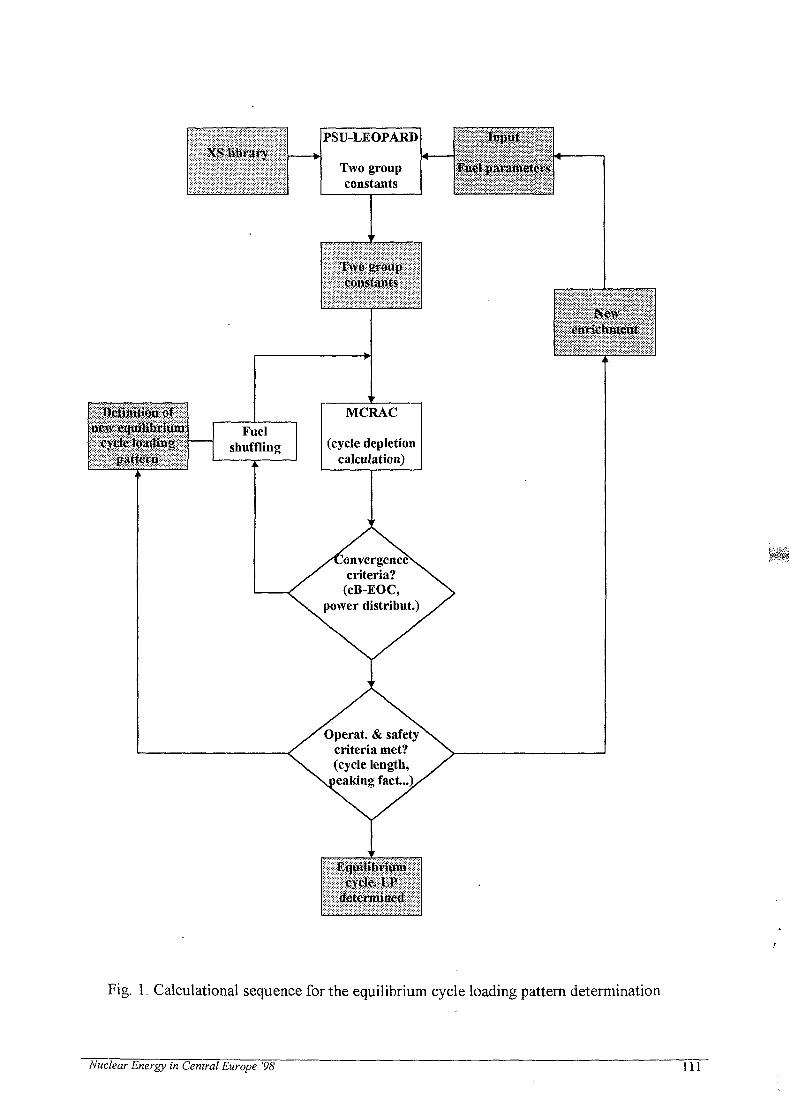
PSU-LEOPARD
Two groupconstants
loptrt
Two group
MCRAC
(cycle depletioncalculation)
onvergencecriteria?(cB-EOC,
power distribut.)
Operat, & safetycriteria met?(cycle length,caking fact..)
Equilibriumcycle. LP
determined
enrichment
Fig. 1. Calculational sequence for the equilibrium cycle loading pattern determination
Nuclear Energy in Central Europe '98 111

2740048700
2640048500
2360047900
2740050000
1st cycle inenr. 4.7 w/o
1st cycle inenr. 4.3 w/o
2nd cycle inear. 4.7 w/o
2nd cycle inenr. 4.3 w/o
22000'47500
164G0425G0
^C^*Fh'^+K*C?'K^CX
2360038300
2860038600
2820037400
: :27000:"35600:
148IFBA0
26400
No. of burnable absorbers
BOC burnup [MWd/tU]
EOC burnup [MWd/tU]
Fig. 2 Equilibrium cycle loading pattern, uprated conditions, 68 FA batch, split feed
I—1
(ppn
UO
I
£-t—>
ooooo
O
u1
2250
2000
1750
1500
1250
1000
750
500
250
0
/
o
p
5'00
o
4000 " 8000 12000 16000 20000
Burnup (MWd/tU)
Fig. 3 Soluble boron concentration and power peaking factor vs. core burnup for24-month equilibrium cycle, 68 FA batch, split feed.
.12 Nuclear Energy in Central Europe '98

MS IFBA2660047000
2660047700
MS IFBA22QG04640O
1st cycle inenr. 4.7 w/o
1st cycle inenr. 4,3 w/o
2nd cycle inenr. 4.7 w/o
2nd cycle inenr. 4.3 w/o
2530048100
196Q0
148JFBA0
28490
234G0 :
.••^84(50: 1870O"
2740036900
2280032200
148 IFBA0
25300
No. of burnable absorbers
BOC burnup [MWd/tU]
EOC burnup [MWd/tU]
Fig. 4 Equilibrium cycle loading pattern, uprated conditions, 72 FA batch, split feed
sOH
Q
ooo
o
8O
U
2250
4000 8000 12000 16000 20000
Burnup (MWd/tU)
Fig. 5 Soluble boron concentration and power peaking factor vs. core burnup for24-month equilibrium cycle, 72 FA batch, split feed
Nuclear Energy in Central Europe '98 113

SI0100100
Nuclear Energy in Central Europe '98
Terme Catez, September 7 to 10, 1998
Analysis of VENUS-3 Benchmark Experiment
I. KodeliInstitut Jozef Stefan.
Jamova 39, 1111 Ljubljana, Slovenia
E. SartoriOECD/NEA-DB,
12 Boulevard des lies, 92130 Issy-les-Moulineaux, France
ABSTRACT - The paper presents the revision and the analysis of VENUS-3 benchmarkexperiment performed at CEN/SCK, Mol (Belgium). This benchmark was found to be par-ticularly suitable for validation of current calculational tools like 3-D neutron transport codes,and in particular of the 3D sensitivity and uncertainty analysis code developed within theEFF project. The compilation of the integral experiment was integrated into the SINBADelectronic data base for storing and retrieving information about the shielding experimentsfor nuclear systems. SINBAD now includes 33 reviewed benchmark descriptions and severalcompilations waiting for the review, among them many benchmarks relevant for pressurevessel dosimetry system validation.
1. Introduction
Computational methodologies used in reactor pressure vessel neutron fiuence calcula-tions are usually checked against surveillance capsule and/or cavity dosimetry mea-surements. These measurements, although being the closest representation of the realpressure vessel neutron environment, have the inconvenience of relatively large uncer-tainties associated to the calculated neutron fiuence. These include, besides genericuncertainties (like nuclear data, radiation source), also plant specific uncertainties (e.g.material compositions, dimensions, operating conditions) which are complex and oftendifficult to establish precisely [1], [2].
The recommended way to determine the quality and merit of the data files, includingcross sections, radiation sources, etc., as well as of calculational procedures is to testthem against some well defined benchmark experiments and shield design problems.
Nuclear Energy in Central Europe '98 115
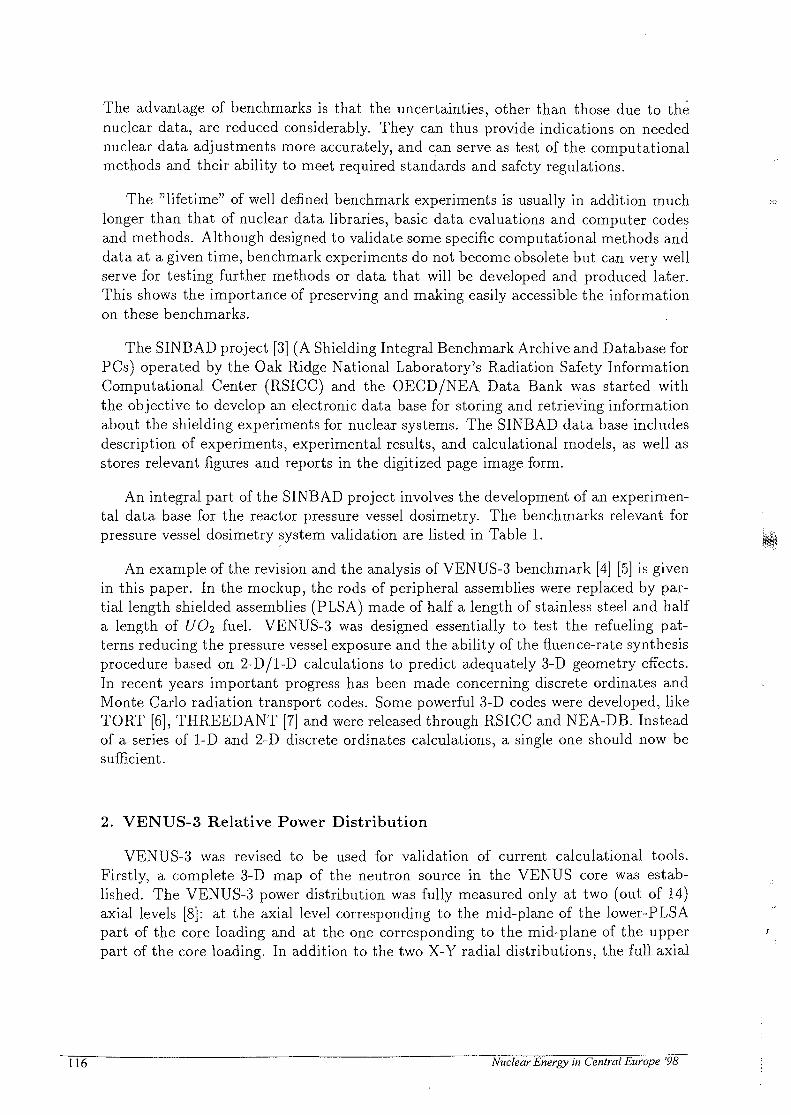
The advantage of benchmarks is that the uncertainties, other than those due to thenuclear data, are reduced considerably. They can thus provide indications on needednuclear data adjustments more accurately, and can serve as test of the computationalmethods and their ability to meet required standards and safety regulations.
The "lifetime" of well defined benchmark experiments is usually in addition muchlonger than that of nuclear data libraries, basic data evaluations and computer codesand methods. Although designed to validate some specific computational methods anddata at a given time, benchmark experiments do not become obsolete but can very wellserve for testing further methods or data that will be developed and produced later.This shows the importance of preserving and making easily accessible the informationon these benchmarks.
The SINBAD project [3] (A Shielding Integral Benchmark Archive and Database forPCs) operated by the Oak Ridge National Laboratory's Radiation Safety InformationComputational Center (RSICC) and the OECD/NEA Data Bank was started withthe objective to develop an electronic data base for storing and retrieving informationabout the shielding experiments for nuclear systems. The SINBAD data base includesdescription of experiments, experimental results, and calculational models, as well asstores relevant figures and reports in the digitized page image form.
An integral part of the SINBAD project involves the development of an experimen-tal data base for the reactor pressure vessel dosimetry. The benchmarks relevant forpressure vessel dosimetry system validation are listed in Table 1.
An example of the revision and the analysis of VENUS-3 benchmark [4] [5] is givenin this paper. In the mockup, the rods of peripheral assemblies were replaced by par-tial length shielded assemblies (PLSA) made of half a length of stainless steel and halfa length of UO2 fuel. VENUS-3 was designed essentially to test the refueling pat-terns reducing the pressure vessel exposure and the ability of the fluence-rate synthesisprocedure based on 2-D/l-D calculations to predict adequately 3-D geometry effects.In recent years important progress has been made concerning discrete ordinates andMonte Carlo radiation transport codes. Some powerful 3-D codes were developed, likeTORT [6], THREEDANT [7] and were released through RSICC and NEA-DB. Insteadof a series of 1-D and 2-D discrete ordinates calculations, a single one should now besufficient.
2. VENUS-3 Relative Power Distribution
VENUS-3 was revised to be used for validation of current calculational tools.Firstly, a complete 3-D map of the neutron source in the VENUS core was estab-lished. The VENUS-3 power distribution was fully measured only at two (out of 14)axial levels [8]: at the axial level corresponding to the mid-plane of the lower-PLSApart of the core loading and at the one corresponding to the mid-plane of the upperpart of the core loading. In addition to the two X-Y radial distributions, the full axial
16 Nuclear Energy in Central Europe '98

power distribution was measured at 374 fuel pin locations, out of the total of 639 fuelpins comprised in the 1/4 of the reactor core.
In order to establish a complete 3-D map of the power distribution in the VENUScore, an extrapolation procedure, based on the RECOG-ORNL code [9] was used.This procedure permitted at the same time to detect some suspicious or faulty values,transcription errors, as well as to give an idea of the accuracy of the neutron source.
RECOG-ORNL is a general purpose pattern recognition code. Various methods fordata analysis, preprocessing and display of data, unsupervised and supervised learningare available in the code. For our purpose basically LEAST and LLOOST supervisedlearning techniques were used. The techniques use known information about some ofthe data to generate predicted properties for an unknown set. LEAST calculates thepredicted properties from the augmented variables of the pattern set. The relationshipbetween predicted properties and augmented variables is deduced from the training set(measured set in our case), and is then applied to the nontraining set (missing powerdistributions).
LLOOST performs leave-out statistics on a pattern set. One (or more) patterns canbe left out, and the same algorithm as in LEAST is used to predict their properties.This permits to check the validity of the method and the precision of the estimations.This technique gives an insight into the precision of the nuclear source data. It per-mitted also to detect some transcription errors and inconsistencies.
The source data file was prepared in a format suitable for transport codes. Itcontains the measured values, where available, and RECOG predicted values elsewhere.Relative nuclear power distribution, normalized to the core averaged power of onefission per second per active pin, is given for each fuel pin position and for 14 axiallevels (see Figure 1).
In addition, an information on the accuracy of these values was evaluated in thefollowing way: where the measured values were available the 'uncertainties' were de-termined as the % difference between the neutron source values calculated by RECOGcode and the measured values obtained from SCK/CEN. Elsewhere the uncertainty ofthe extrapolation procedure in RECOG was estimated to +-5% [5].
3. Sensitivity/Uncertainty Analysis of VENUS-3
The transport methods are combined with sensitivity analysis; the combined ap-plication has proved very useful if not necessary in order to establish reliable safetymargins for the measured and calculated values, as well as to determine to what extentthe benchmark experiment is representative of the real nuclear reactor environment. Aprocedure which has been extensively used in uncertainty analysis for pressure vesseldosimetry is based on TWODANT, DOT, SUSD, ZOTT codes and the VITAMIN-J/COVA covariance matrix library [10], [11], [12], [2]. This system has been recently
Nuclear Energy in Central Europe '98 117

updated to include full 3-D sensitivity/uncertainty analysis [13]. The present versionof the code can thus use angular flux or flux moment files calculated by discrete or-dinates codes ANISN, DOT, TWODANT and TORT. Use of angular moment filesinstead of bulky angular flux files produced by these codes reduces considerably thesize of the files required and represents an acceptable approximation for the problemtype analysed here.
The first results of the sensitivity and uncertainty analysis are given in Table 1.The direct and adjoint transport calculations were performed using TORT code [6].To save computer space and CPU time only very basic 5V approximations were chosen(S4.Pi). Cross-sections were taken from the BUGLE-96 [14] library (47 neutron energygroups). VENUS-3 was described in rectangular (x-y-z) geometry, using variable spacemesh.
Uncertainties due to the ENDF/B-V neutron fission source spectrum used was cal-culated assuming the uncertainties of 1.2% in the parameter A of the Watt distributionfunction, and of 5.9% in the parameter B [15]. The sensitivities were therefore expressedas the product of the adjoint fluxes and the sensitivity functions (derivatives) of theWatt spectrum distribution with respect to the parameters A and B [16].
The source space distribution uncertainties depend on the location in the reactor.These amount to about 3 % in the core barrel.
Detector response function covariances used to evaluate the uncertainties in theresponse functions were taken from IRDF 90.2 evaluation [17].
4. Conclusions
Due to its 3-D complexity VENUS-3 is well suited for validating dosimetry calcu-lational methods using full geometry modelling.
The complete information including the geometry description, material composi-tion, neutron source distribution, as well as examples of the calculations were preparedand will be included into the SINBAD data base to be available worldwide. The datato be included in the VENUS-3 SINBAD compilation was already verified by using itin transport calculations. The sensitivity and uncertainty studies which were startedat the same time provide useful supplementary information on the benchmark exper-iment and measured quantities. Up to now the uncertainties due to the source spaceand energy distributions, and response functions were established. The sensitivity anduncertainty studies with respect to the transport cross-sections are still under-way.
By comparing the VENUS-3 sensitivity and uncertainty analysis with the simi-lar ones performed in the scope of the reactor pressure vessel surveillance [1], [2] therepresentativity of VENUS-3 with respect to the real reactor environment can be de-termined.
] 8 Nuclear Energy in Central Europe '98

Table 1: Results of uncertainty analysis: uncertainties due to the neutron source energyand space distributions, response functions and cross sections were taken into account.
Source ofuncertainty
Fission spectrumSource spacedistribution
Absolutepower
Response functionCross
sectionsH0Fe
Total
$ > lMeV4.4
01.90.62
~ 7
Uncertainty (%)
27Al(n,a)12
~ 1.
1.41.11.65
~ 14
5SNi(n,p)6.5
5-4
12.51.40.72.5~ 9
n5In(n,n')4.4
2.21.60.52.1~ 8
References
[1]- R. E. Maerker, B. L. Broadhead, B. A. Worley, Application of the LEPRICONUnfolding Procedure to the Arkansas Nuclear One- Unit 1 Reactor, Nucl. Sci. Eng.93,137 (1986).
[2] I. Kodeli and J .C Nimal, Assessment of Uncertainties for PWR Pressure VesselSurveillance - French Experience, Trans. Am. Nucl. Soc, Vol. 74, 1996.
[3] H. T. Hunter, D. T. Ingersoll, R. W. Roussin, C. 0 . Slater, E. Sartori, I.Kodeli,SINBAD - Shielding Integral Benchmark Archive and Database, Proc. ANS TopicalMeeting on Radiation Protection &; Shielding, Cape Cod. Massachusetts (Apr.1996)
[4] P. D'Hondt et al, Contribution of the VEN US-Engineering Mock-up Experiment tothe LWR-PV-Surveillance, Proc. 7th ASTM-EURATOM Symposium on ReactorDosimetry, Strasbourg, France, August 27-31,1990.
[5] L. Leenders, LWR-PVS Benchmark Experiment VENUS-3, FCP/VEN/01 report,Sept. 1988
[6] W. A. Rhoades, R. L. Childs, TORT-DORT: Two- and Three-DimensionalDiscrete Ordinates Transport, Version 2.7.3, RSIC-CCC-543, ORNL RadiationShielding Information Center, Oak Ridge, TN (1993)
Nuclear Energy in Central Europe 9 119

[7] R. E. Alcouffe, R. S. Baker, F. W. Brinkley, D. R. Marr, R. D. O'Dell, W. F. Wal-ters, DANTSYS 3.0 - A Diffusion-Accelerated, Neutral-Particle Transport CodeSystem, LA-12969-M, LANL (June 1995)
[8] H. Ait Abderrahim, VENUS-3 3-D Power Distribution, Private communication.
[9] C. L. Begovich, N. M. Larson. .4 User's Manual for the Pattern Recognition CodeRECOG-ORNL, ORNL/CSD/TM-21 (1977).
[10] K. Furuta, Y. Oka, S. Kondo, SUSD: A Computer Code for Cross Section Sensi-tivity and Uncertainty Analysis Including Secondary Neutron Energy and AngularDistributions, UTNL-R-0185 (1986).
[11] I. Kodeli, Modifications to SUSD Code, NEA 1151/03 computer code package(1991).
[12] I. Kodeli, Computational Package for the Sensitivity, Uncertainty and AdjustmentAnalysis, EFF-DOC-143 (1991).
[13] I. Kodeli, Progress on Computational Tools for 3D Sensitivity and UncertaintyAnalysis, OECD-NEA Seminar on 3D Deterministic Radiation Transport Com-puter Programs Features. Applications and Perspectives, Paris, 2-3 Dec. 1996.
[14] j . E. White et al.. BUGLE-96: A revised Multigroup Cross Section Library forLWR Applications Based on ENDF/B-VI Release 3, ANS Rad. Prot. & ShieldingTopical Meeting, Falmouth (April 1996).
[15] B. Duchemin, Remarques sur les spectres des neutrons de fission, RapportSERMA/S/No365(1979).
[16] I. Kodeli, Etudes des incertitudes sur la fluence dans les cuves des REP. Ajuste-ment des Donnees de base., Note CEA-N-2749 (1994)
[17] G.C. Panini, I. Kodeli, ZZ-VITA.-J/COVA/EFF - Covariance DataLibrary, NEA-DB, NEA 1264/04 package (1996).
120 Nuclear Energy in Central Europe '98

10
20
JU
25
20
15
10
5
0
iI
s
1K
J\\1
1i-,,,(•> !
j
Xf>f,
•
: :
21
1it
a :
I
tx
":f -•*
1; ̂11
11
y
-itr
11Iy
|1Ii>v
: •
1*1I•1\<«1if1
jWHHUHHBi'
HH|'ilBHBfll
•HH
0 5 10 15 20 25 30
10
20
Figure 1. X-Y radial relative power distributions at axial levels 1 (above) and 9 (below).
Nuclear Energy in Central Europe '98 121
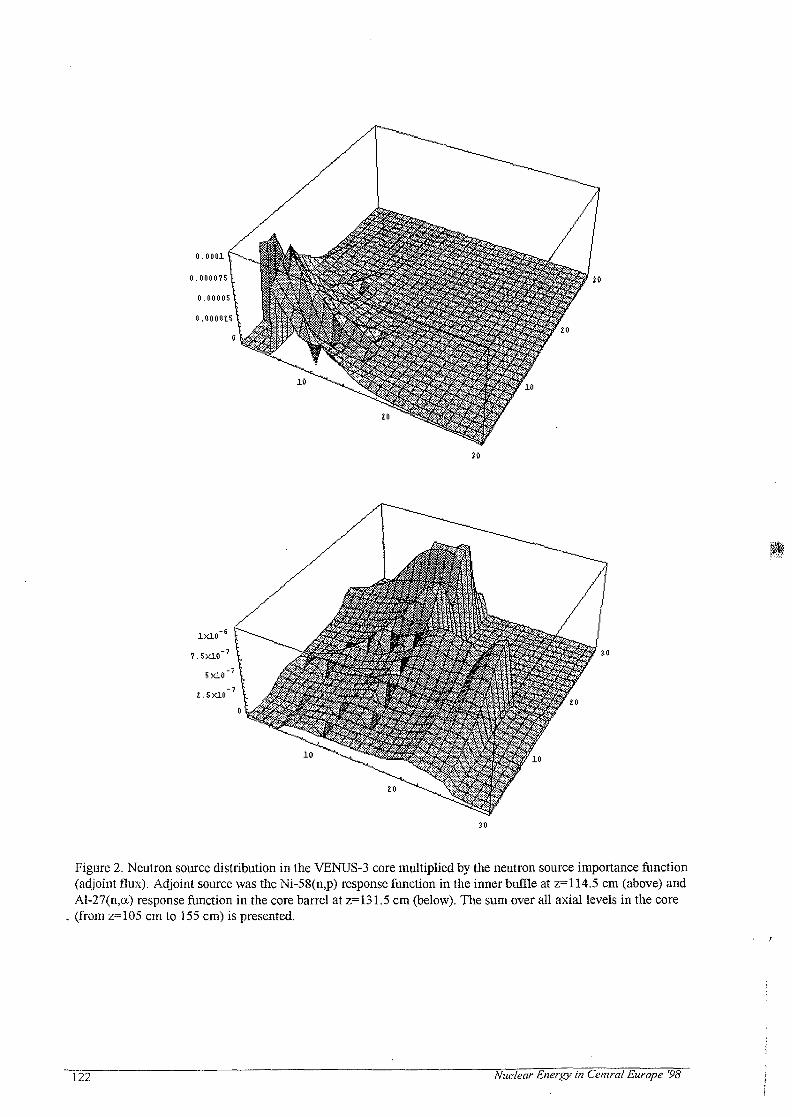
10
1X10
7.5X10
5x10
£.5X10
10
Figure 2. Neutron source distribution in the VENUS-3 core multiplied by the neutron source importance function(adjoint flux). Adjoint source was the Ni-58(n,p) response function in the inner buffle at z=l 14.5 cm (above) andAl-27(n,a) response function in the core barrel at z= 131.5 cm (below). The sum over all axial levels in the core(from z=105 cm to 155 cm) is presented.
122 Nuclear Energy in Central Europe '98

SI0100101
Nuclear Energy in Central Europe '98
Terme Catez, September 7 to 10, 1998
Evaluation of Rod Insertion Issue for NPP Krsko
Ales Gunstek, Bojan KurincicKrsko Nuclear Power Plant
Krsko, Slovenija
Abstract
The last couple of years incidents with control rods sticking in lower part of the fuel assemblies have beenreported of several reactor operators and fuel vendors throughout of the world.Several activities were initiated immediately to determine the root cause of incomplete rod insertion. Thepurpose of this activities were to collect plants trip history data and testing results, review of availableworldwide experience, review of plant operation and fuel management, detailed review of manufacturingand material property and to maintain detailed mechanical model.In this paper, we will present activities in Nuclear Power Plant KrSko which have been performed afterNRC initiated the Root Cause Process (NRC Bulletin 96-01). NPP Krsko has not experienced rod insertionanomaly yet but anyway the additional tests were carried out. Rod drop time measurements that wereperformed normally at beginning of cycle at nominal temperature and pressure (HSB mode) have beenextended also to end of cycle. Rod drop time, velocity of dropped rods and magnitudes of the initial recoilbounces vs. burnup were also analyzed. Also RCCA drag test with the upper internals in place and driveshafts attached to RCCAs has been performed since then. At last two outages (1997 and 1998) drag testwere carried out with digital scale meter to gather additional information.In addition to that, the reload core design has been performed with new constraints on rodded fuelassembly burnup as proposed by the industry.
1. Introduction
Pressurized Water Reactor design uses Rod Control Cluster Assemblies within selected fuelassemblies to compensate for reactivity changes due to variations in reactor operating conditions(power and temperature variations) and to provide shutdown capability on a reactor trip. The controlrods provide the very rapid negative reactivity insertion required under plant transient and accidentsituations. As much, their operability must be ensured under those conditions. Typically, a ControlRod Assembly used in PWRs consists of multiple, individual absorber rods joined to a commonfitting.
Number of RCCAs used is a function of the size of the reactor and core design. RCCA insertion on aplant trip is provided by gravity. RCCAs move within thimble tubes inside their respective fuelassembly and are connected to drive rods which extend upward into the Control Rod DriveMechanisms (CRDM). Stationary and Movable Grippers inside the CRDM provide RCCA movementand holding capability. When electrical power is removed from the CRDM, as in a plant Trip, theRCCAs fall into the core. RCCA position is provided by Rod Position Indicators (RPI) and, after aplant Trip, Rod Bottom Lights.During the past years, some nuclear power plants identified poor RCCAs performance that is indicatedthrough the increase of insertion time or RCCAs failing to fully insert upon demand. It means thatsome RCCAs did not fully insert on reactor trip and stopped few steps from fully inserted position.
Nuclear Energy in Central Europe'98 1 2 3

On the April 1993 to March 1994 three US plants have experienced crud deposit in the Control RodDrive Mechanism (CRMD) leading to increasing rod drop times.A total of seven of Electricite de Frances plants were affected by RCCAs either jamming near the topof the active fuel region or dropping part way into the core in 1995 and 1996. The cause is believed tobe a malfunction of the CRDM itself.Four units operated by EdF in France have experienced significant RCCAs sticking. The cause isbelieved to be excessive guide thimble tube distortion in the dashpot region due to high axialcompressive loads on the fuel assemblies.RCCAs sticking in the lower dashpot region following a reactor scram and increased drop time isappeared at two Belgium three-loop Westinghouse design plants too. Drop time degradation andsticking was a consequence of fuel assembly distortion.
The Ringhals 3 and 4 units located in Sweden are three-loop Westinghouse plants operating at 960MWe. On August 22, 1994, a control rod at Unit 4 did not fully insert when the reactor scrammedfrom 51 percent reactor power. Control Rod jammed 18 steps from the fully inserted position. Duringsubsequent hot rod-drop testing the same rod jammed 24 steps from the fully inserted position andthree other control rods jammed between 6 and 12 steps withdrawn.Subsequent investigation revealed that the affected fuel assemblies had bowed to a slightS-shape. Bowing that affected the control rod insertion was detected only in fuel with burnup greaterthan 34.000 MWD/MTU. Neutron irradiation causes fuel assemblies growth thus increasing axialforce on fuel assembly with fuel burnup. The S-shaped bowing of the fuel assemblies and control rodguide thimbles causes increase in friction.
On December 18, 1995 South Texas Unit 1 tripped for reasons unrelated to RCCA function from 100percent power. Operators noted that three of control rod assemblies did not fully insert on the trip. Allthree RCCAs stopped six steps from the bottom of core. One rod did drift into the fully inserted rodbottom position within one hour, and the other two rods were manually inserted later. All threeRCCAs were located in fuel assemblies with burnup greater than 42.880 MWD/MTU.On January 30, 1996, after a manual scram from 80 percent power at Wolf Creek, five control rodassemblies failed to fully insert. Two rods remained at six steps withdrawn, two at 12 steps, and one at18 steps. All affected rods drifted to fully inserted position within 78 minutes. All the control rods thatfailed to fully insert were in the fuel assemblies with burnup greater than 47.000 MWD/MTU on theirthird operating cycle.
2. Industry response on IRI
Westinghouse (WOG) and respective licenses are pursuing the root cause identification of SouthTexas Unit 1 and Wolf Creek evens and safety significance of the recent control rod events where rodshave not bottomed following a trip.Possible root causes are:
• fuel assembly guide tube bow• control rod degradation• debris or foreign materials• corrosion products• thimble tube distortion; fuel rod to thimble tube differential growth and thimble
tube to thimble tube differential growth• reduction in thimble tube diameter and design tolerances• excessive axial force
In March 1996 the NRC issued Bulletin 96-01; 'Control Rod Insertion Problems' with the purpose toalert utilities on problems encountered during recent events in which control rods failed to fully inserton a reactor trip signal and request utilities to prove the operability of control rods, particularly in highburnup fuel assemblies.
124 Nuclear Energy in Central Europe '98

To ensure, that the required shutdown margin is maintained during a reactor trip, all licensees ofWestinghouse designed plants were requested to take the following actions:
1. Promptly inform operators of recent IRI events and provide training as necessary2. Promptly determine the continued operability of control rods based on current information of:
- beginning of cycle rod drop testing- performance of RCCA stepping tests- recent trip data- any anomalous behavior or RCCA changeout during refueling operations- current cycle burnup in rodded locations- excess shutdown margin for current core design
3. Measure and evaluate at each outage of sufficient duration, the control rod drop times and rodrecoil data for all control rods and drag force data on rodded fuel assemblies with burnup atleast 40.000 MWD/MTU.
4. Upon a reactor trip, verify that all control rods have promptly fully inserted and obtain otheravailable information to assess the operability and the performance trend of the rods.
3. NPP Krsko activities and testing results
Krsko Nuclear Power Plant is two-loop Westinghouse design NSSS operating at 1876 MW thermalcore power, which results in approximately 632 MW of net electrical power.The reactor of NPP Krsko consists of 121 Westinghouse standard fuel assemblies with some Vantagefeatures (e.g.; Integrated Fuel Burnable Absorbers, Natural blankets, Debris Filter Bottom Nozzle,Zirlo cladding, etc.). Each fuel assembly consists of a 16x16 array composed of 235 fuel rods, 20 rodcluster control (RCC) guide thimbles, and an incore instrumentation thimble. The active fuel length is365.76 cm and the extension of the dashpot is 60.9 cm from top of bottom nozzle.
Figure 1. KRSKO Rod Cluster Control Assembly and Full Length RCC and DriveRod Assembly with interfacing components
Nuclear Energy in Central Europe'98 • 125

The material of fuel rods clad, RCC guide thimbles and instrumentation thimble is Zircaloy-4,improved Zircaloy-4 and ZIRLO™ (since cycle 14). There are 33 Rod Cluster Control Assemblies, orcontrol rods (Figure 1).The absorber material in the control rods is an alloy of 80 w/o silver, 15 w/o indium and5 w/o cadmium. The control rods are clad in type-304 stainless steel.The various Control Rods Assemblies are arranged in symmetrical located groups, or banks. Banks D,C, B and A are termed the control banks and are moved in a fixed sequential pattern to control thereactor. The remaining rods SA and SB are termed the shutdown banks. The location of all controlrods is shown in Figure 2.
M L K J I H G F E D C B A
•
A
A
SA
D
SA
C
C
SA
B
SA
A
SB
SB
A
D
B
C
B
D
A
SB
SB
A
SA
B
SA
C
C
SA
D
SA
A
A
1
2
3
4
5
6
7
8
9
10
11
12
13
Figure 2. KRSKO Control and Shutdown Rod Locations
After NRC Bulletin 96-01 issued, all necessary requested actions were implemented atNPP Krsko.At the beginning of cycle 12 (May 1995), NEK performed Hot Rod Drop Time Measurementaccording to NEK Standard operating Procedure STS-5.002 at Mode 3, HSB conditions.The purpose of this test is to measure the rod drop time prior to first criticality in new operating cycle.The maximum rodded fuel assembly burnup was 35.100 MWD/MTU. According to NEK TechnicalSpecification acceptance criteria for rod drop time to dashpot region is 2.8s. Drop time is evaluatedthrough the traces on strip chart recorder. (Figure 3).
Voltage induced in DRPI coils has been scanned to determine the velocity of the RCCA assemblies asa function of axial position. The investigation of results of the drop testing traces of all 33 RCCAsshowed that there is no deviation from a normal drop behavior. The rod accelerates quickly until thehydraulic forces start to out balance the force from gravity. Than the rod only slowly increase itsvelocity. At the dashpot entrance velocity very rapid decreases due to hydraulic resistance until thespider hub contacts and recoils from the top nozzle. The magnitude of the initial recoil bounce andquantity of subsequent bounces were almost the same for all RCC assemblies regardless fuel assemblyburnup.
126 Nuclear Energy in Central Europe '98

STATIONARY GWPP£RVO«.T*G£
Figure 3. Typical NEK Rod Drop behavior
Maximum drop time to dashpot region was 1.54 s. Results presented in Figure 4 show no correlationbetween drop times and burnup of RCCA rodded fuel assemblies.
Rod Drop Time to Dashpot vs. BurnupNEK BOL Cycle 12, May 1995
5000 10000 25000 35O0O
Bumup (MWD/MTU)
Figure 4. Rod Drop Time to Dashpot vs. Burnup; NEK BOL Cycle 12, May 1995
RCCA stepping tests results according to procedure OSP-3.4.203 'Control Rod Partial MovementMonthly Test', during cycle 12 were reviewed. There were no anomalies reported during RCCAmovement.
There were two reactor trips during cycle 12. From 'On-site Event Reports', there was not anyproblems with automatic insertion on RCCAs following reactor trip signal.No anomalous behavior on RCCA changeout during refueling operations were noticed.
Table 1 contains a major information about rodded locations for Cycle 12. Nine Fuel Assemblies havereached more than 40.000 MWD/MTU burnup at the EOC 12. All of these high burned assemblieswere in bank C and D.
Nuclear Energy in Central Europe '98 127

L31L25L30L27J28L20L15L24L29
HfJRCGA *.R2R5R7
RL6R19R22R25R30R33
^.CoreXoc.41*G-03J-04J-10C-07G-07G-llD-04D-10K-07
DCCDCDCCD
«BOOJBo.fc280823487435062282693225128232348943505628263
412374612946128412204486241223460934612841223
Table 1. Major information about rodded locations for Cycle 12
Shutdown margin is the most important safety analyses parameter relative to this issue. Once in thedashpot region the RCCAs provide only minimal additional negative reactivity and sufficientshutdown margin exist such the plant safety was not challenged. The amount of uninserted worth issmall relative to the design basis assumption of a worst stuck rod.Conservative calculation of excess shutdown margin for cycle 12 core was performed. It wasconfirmed that the conservatism in the design bases shutdown margin is sufficient to bound the eventswith sticking control rods in lower part (dashpot region) of fuel assemblies.
Many measurements on RCCA were performed within the sphere of response to request 3. of NRCBulletin 96-01. Rod drop time measurements that were performed normally at the beginning of cyciehave been extended also to end of cycle. Addition to that, RCCA drag test has been performed. NPPKrsko performed the following measurements:
• May 1996 - Rod Drop Time Measurement at EOL of cycle 12• July 1996 - Rod Drop Time Measurement at BOL of cycle 13• May 1997 - Rod Drop Time Measurement at EOL of cycle 13• June 1997 - Rod Drop Time Measurement at BOL of cycle 14
- Drag Force Measurement with Upper Internals in placeat BOL of cycle 14
• May 1998 - Drag Force Measurement with Upper Internals in placefor selected fuel assemblies at EOL of cycle 14 and BOL of cycle 15
- Rod Drop Time Measurement at BOL of cycle 15
All results of this as well as rod drop measurements at the BOL 12 are presented in Figure 5.
Rod Drop Time to Dashpot vs. BurnupNEK BOL12, EOL12, BOL13, EOL13, BOL14, BOLI5
3 (HI
2.9U
2 SI)
2.7(1
2.60
2.5(1
2.4(1
S 2.3(1
| 2.20
S 2.10
o 2.00
TS requirements
1.90
1.80
1.71)
1.60
1.50
1.40
1.30
1.211
I.Ill
1.00
.»-•«•-
2CXI0I) 25OIXI 3(H)(K, 35IIOO
Burnup (MWD/MTU)
Figure 5. Rod Drop Time to Dashpot vs. Burnup NEK BOL12 - BOL15
128 Nuclear Energy in Central Europe '98
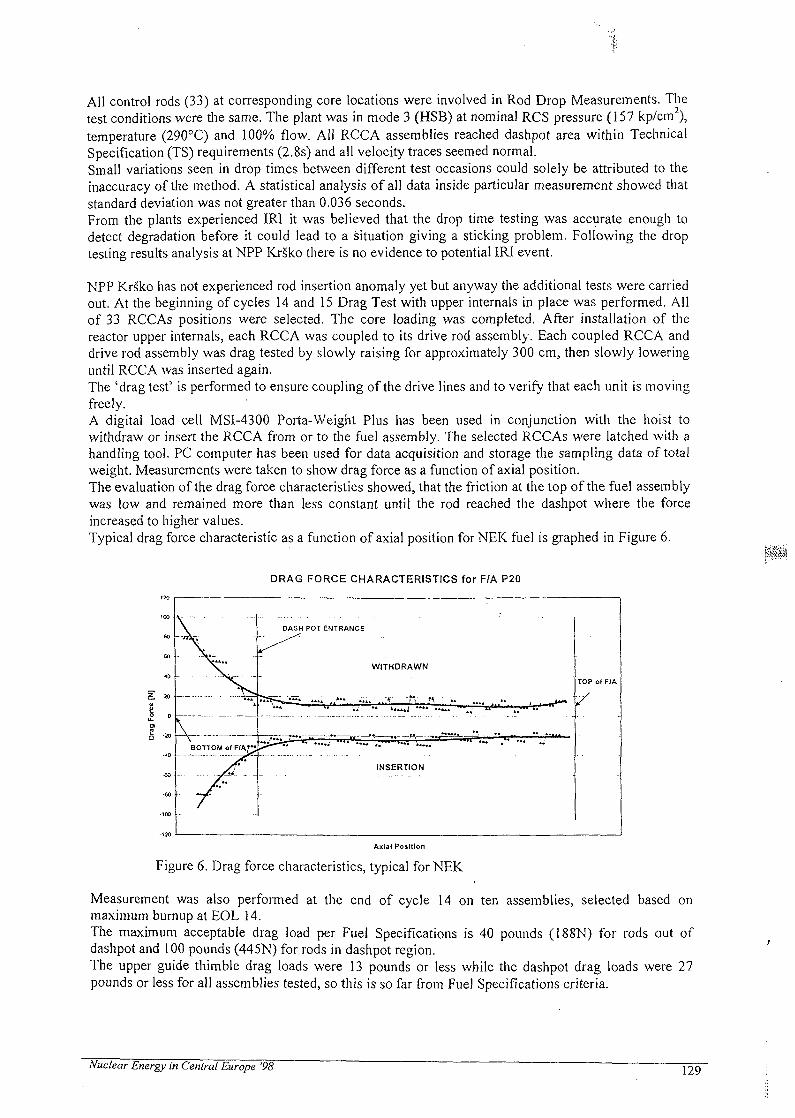
All control rods (33) at corresponding core locations were involved in Rod Drop Measurements. Thetest conditions were the same. The plant was in mode 3 (HSB) at nominal RCS pressure (157 kp/cm ),temperature (290°C) and 100% flow. All RCCA assemblies reached dashpot area within TechnicalSpecification (TS) requirements (2.8s) and all velocity traces seemed normal.Small variations seen in drop times between different test occasions could solely be attributed to theinaccuracy of the method. A statistical analysis of all data inside particular measurement showed thatstandard deviation was not greater than 0.036 seconds.From the plants experienced IRI it was believed that the drop time testing was accurate enough todetect degradation before it could lead to a situation giving a sticking problem. Following the droptesting results analysis at NPP Krsko there is no evidence to potential IRI event.
NPP Krsko has not experienced rod insertion anomaly yet but anyway the additional tests were carriedout. At the beginning of cycles 14 and 15 Drag Test with upper internals in place was performed. Allof 33 RCCAs positions were selected. The core loading was completed. After installation of thereactor upper internals, each RCCA was coupled to its drive rod assembly. Each coupled RCCA anddrive rod assembly was drag tested by slowly raising for approximately 300 cm, then slowly loweringuntil RCCA was inserted again.The 'drag test' is performed to ensure coupling of the drive lines and to verify that each unit is movingfreely.A digital load cell MSI-4300 Porta-Weight Plus has been used in conjunction with the hoist towithdraw or insert the RCCA from or to the fuel assembly. The selected RCCAs were latched with ahandling tool. PC computer has been used for data acquisition and storage the sampling data of totalweight. Measurements were taken to show drag force as a function of axial position.The evaluation of the drag force characteristics showed, that the friction at the top of the fuel assemblywas low and remained more than less constant until the rod reached the dashpot where the forceincreased to higher values.Typical drag force characteristic as a function of axial position for NEK fuel is graphed in Figure 6.
DRAG FORCE CHARACTERISTICS for F/A P20
5.I.? o
•JO
-100
-120
V—BOTTOM of F/AT*J
_ y^>.. ... _
DASH POT ENTRANCE
WITHDRAWN
INSERTION
TOP of flA
"/
Axial Position
Figure 6. Drag force characteristics, typical for NEK
Measurement was also performed at the end of cycle 14 on ten assemblies, selected based onmaximum burnup at EOL 14.The maximum acceptable drag load per Fuel Specifications is 40 pounds (188N) for rods out ofdashpot and 100 pounds (445N) for rods in dashpot region.The upper guide thimble drag loads were 13 pounds or less while the dashpot drag loads were 27pounds or less for all assemblies tested, so this is so far from Fuel Specifications criteria.
Nuclear Energy in Central Europe '98 129
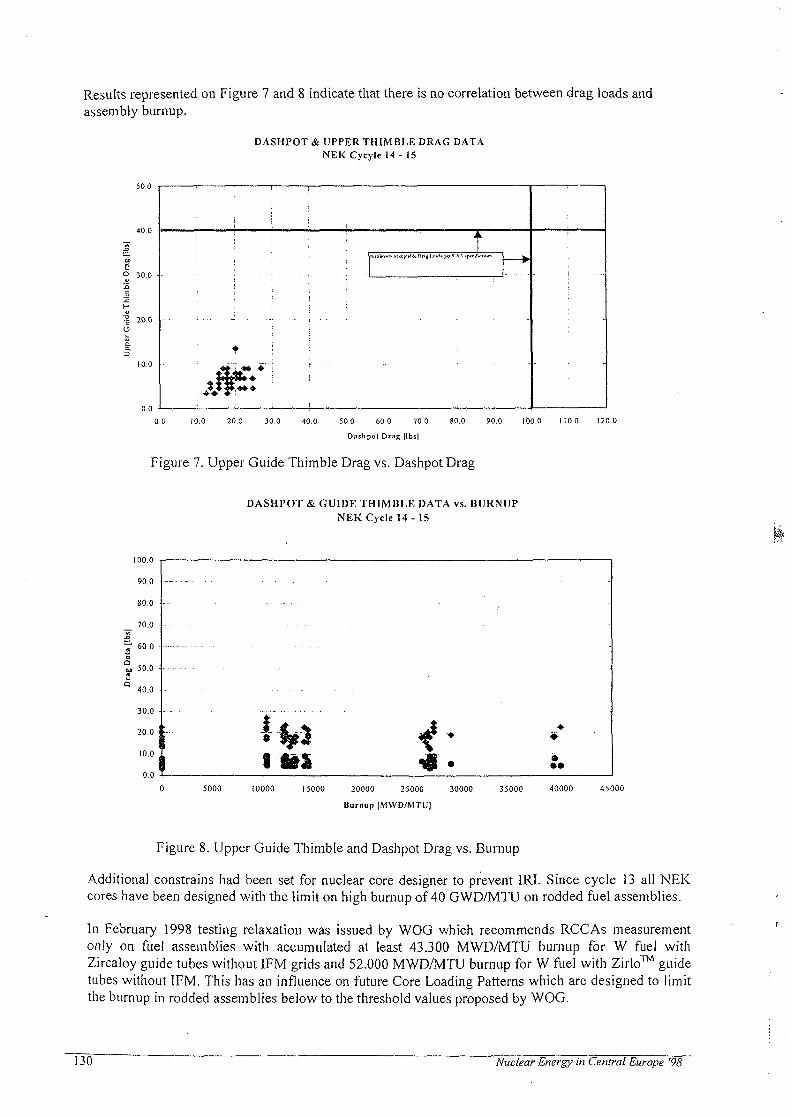
Results represented on Figure 7 and 8 indicate that there is no correlation between drag loads andassembly burnup.
° 300
E
1 20.0
6
DASHPOT & UPPER THIMBLE DRAG DATANEKCycyle 14 - 15
>
..«•"•* » •••-»
1 : ' A k.
m jx'mium tcapUb'ic l>ng 1J>.4> pa F-i.l ipmCmiiur.
|
0.0 10.0 20.0 30.0 40.0 50.0 60.0 70.0 80.0 90.0 100.0 I 10 0 120.0
Dashpol Drag [lbs|
Figure 7. Upper Guide Thimble Drag vs. Dashpot Drag
DASHPOT & GUIDE THIMBLE DATA vs. BURNUPNEK Cycle 14-15
5000 10000 15000 20000 25000 30000
Burnup |MWD/MTU|
35000 40000 45000
Figure 8. Upper Guide Thimble and Dashpot Drag vs. Burnup
Additional constrains had been set for nuclear core designer to prevent IRI. Since cycle 13 all NEKcores have been designed with the limit on high burnup of 40 GWD/MTU on rodded fuel assemblies.
In February 1998 testing relaxation was issued by WOG which recommends RCCAs measurementonly on fuel assemblies with accumulated at least 43.300 MWD/MTU burnup for W fuel withZircaloy guide tubes without IFM grids and 52.000 MWD/MTU burnup for W fuel with Zirlo™ guidetubes without IFM. This has an influence on future Core Loading Patterns which are designed to limitthe burnup in rodded assemblies below to the threshold values proposed by WOG.
130 Nuclear Energy in Central Europe '98

In the cycle 15 (current) NEK loaded modified fuel with Zirlo™ fuel rods cladding and thimble tubes.Zirlo™ has improved characteristic of creep, corrosion and growth, and therefore would result inreduced thimble tube distortion too.
4. Conclusions
Results of testing and evaluations at Nuclear Power Plant Krsko indicate that NEK fuel is notsusceptible to IRI phenomena. We did not find any degradation leading to impaired RCCAsperformance.
There is no correlation between rod drop time and burnup of fuel assembly. The shape of rod dropcurve is independent of burnup. From the current industry experiences, drop time within 120% of theminimum drop time and the presence of recoil is sufficient to show RCCA insertability. This wasreached in all rod drop measurements.
There is no correlation between drag forces in dashpot and upper guide region and burnup. Dragforces are so far from maximum acceptable drag loads per Fuel specifications.
Nuclear design is prepared to the WOG guidance that limits the burnup in rodded assemblies. Newfuel applied in NEK (Zirlo™) has even better performance and is even less susceptible to IRIphenomena.
5. References
[1] SER 1-95, Supplement 2, Control Rod Not Fully Inserted After Scram[2] NRC Information Notice 94-72, Increased Control Rod Drop Time from Crud Buildup[3] Jean-Jose Oliviera, Control Rod Cluster Drop Time anomaly, Guandong Nuclear Power
Station (Daya Bay) and Electricite de France Nuclear Power Stations[4] WOG Presentation to the NRC "Incomplete Rod Cluster Control Assembly Insertion",
February 20, 1996[5] NRC Information Notice 96-12, Control Rod Insertion Problem[6] WCAP-14782 Incomplete RCCA Insertion, Final Report, February 1997[7] Sven Jacobson, Vattenfall AB and Eric Francillon, Framatome "Incomplete Control Rod
Insertion due to Fuel Element Bow"[8] Stoller, Phase 1 Report to the Core Performance Assessment Group[9] Westinghouse Fuel Specifications, F-5.1
Nuclear Energy in Central Europe '98 ' J

SI0100102
Nuclear Energy in Central Europe '98
Terme Catez, September 7 to 10, 1998
Application of the Reactivity Coefficient Methodfor the Nuclear Design Calculations
M. Kromar, A. TrkovJozef Stefan Institute
Jamova 39, Ljubljana, SloveniaE-mail: [email protected]
andrej. [email protected]
ABSTRACT - The CORD-2 package has been extended with the possibilityof a cycle specific neutron macroscopic cross section library as an additionaloption to the standard sequence of calculation. The cross section library isgenerated with the standard calculational procedure at three specificoperating conditions (hot full power, hot zero power and cold zero power)and at several cycle burnup steps. Nodal cross sections at any otheroperating conditions are obtained by modification of the cross sections withthe reactivity coefficient method and suitable interpolation.
1. Introduction
The CORD-2 package[1] developed at our institute has been veritied tordesign calculations of PWR cores. Since the system was designed to beflexible and as accurate as possible, it does not rely on macroscopic crosssections library. Instead, the concept of an isotopic composition library wasadopted. For each problem to be solved, only cell isotopic composition isretrieved from a precomputed library. Everything else (cell cross sectionsdetermination, assembly cross section homogenization, global diffusioncalculation) is performed on case by case basis. In this standard sequenceof calculation, Xenon and power feedback effects are mainly calculated bythe WIMS[2] code. Only small local perturbations to accurately account forthermohydroulic and neutronic coupling are covered by reactivity coefficientmethod (RCM)[3] applied in the diffusion code GNQMER[4].
The concept proved to be successful for typical design calculations of reloadcores, where only relatively limited number of cases need to be examined.However, for some specific problems, such as loading pattern determination,3-D dynamic and kinetic problems, efficiency of the system is not sufficientto be practical. Since the recently refined reactivity coefficient method[3]
Nuclear Energy in Central Europe '98 133
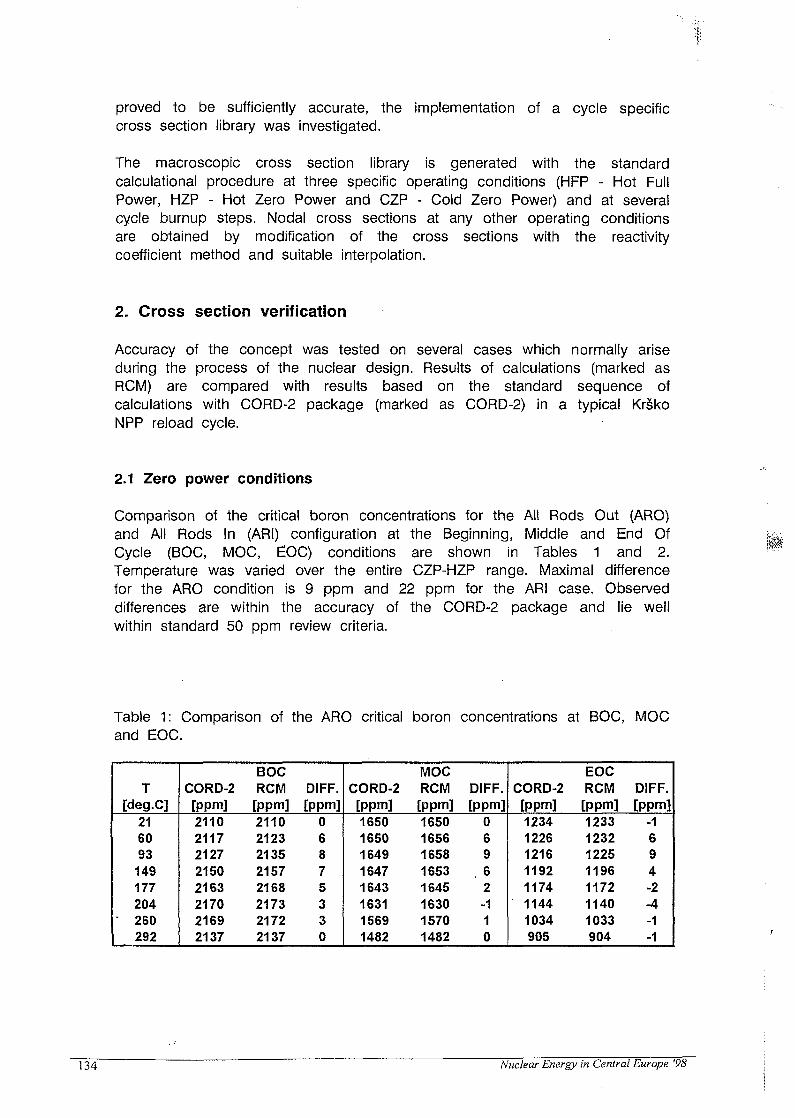
proved to be sufficiently accurate, the implementation of a cycle specificcross section library was investigated.
The macroscopic cross section library is generated with the standardcalculational procedure at three specific operating conditions (HFP - Hot FullPower, HZP - Hot Zero Power and CZP - Cold Zero Power) and at severalcycle burnup steps. Nodal cross sections at any other operating conditionsare obtained by modification of the cross sections with the reactivitycoefficient method and suitable interpolation.
2. Cross section verification
Accuracy of the concept was tested on several cases which normally ariseduring the process of the nuclear design. Results of calculations (marked asRCM) are compared with results based on the standard sequence ofcalculations with CORD-2 package (marked as CORD-2) in a typical KrskoNPP reload cycle.
2.1 Zero power conditions
Comparison of the critical boron concentrations for the Ail Rods Out (ARO)and All Rods In (ARI) configuration at the Beginning, Middle and End OfCycle (BOC, MOC, EOC) conditions are shown in Tables 1 and 2.Temperature was varied over the entire CZP-HZP range. Maximal differencefor the ARO condition is 9 ppm and 22 ppm for the ARI case. Observeddifferences are within the accuracy of the CORD-2 package and lie wellwithin standard 50 ppm review criteria.
Table 1: Comparison of the ARO critical boron concentrations at BOC, MOCand EOC.
T[deg.C]
216093
149177204
- 260292
CORD-2[ppm]21102117212721502163217021692137
BOCRCM
[ppm]21102123213521572168217321722137
DIFF.[ppm]
06875330
CORD-2[ppm]16501650164916471643163115691482
MOCRCM[ppm]16501656165816531645163015701482
DIFF.[ppm]
06962-110
CORD-2[ppm]1234122612161192117411441034905
EOCRCM[ppm]1233123212251196117211401033904
DIFF.[ppm]
-1694-2-4-1-1
134 Nuclear Energy in Central Europe '98
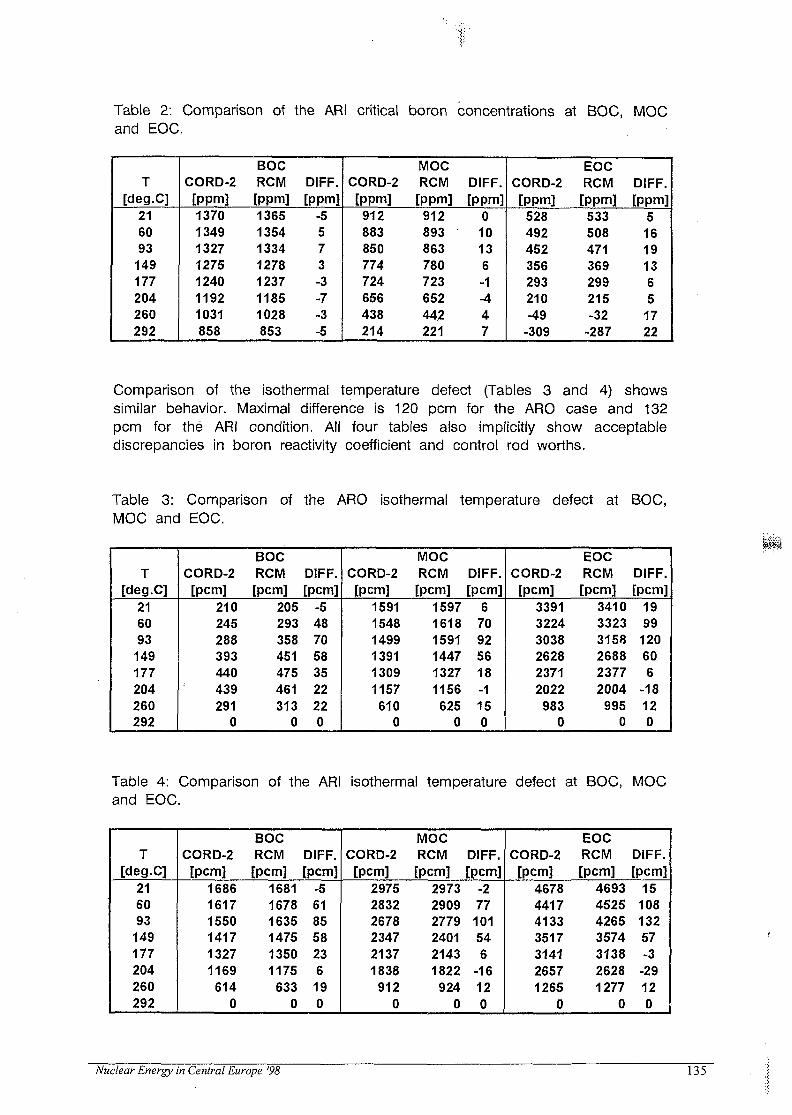
Table 2: Comparison of the ARI critical boron concentrations at BOC, MOCand EOC.
T[deg.C]
216093149177204260292
CORD-2[ppm]1370134913271275124011921031858
BOCRCM[ppm]1365135413341278123711851028853
DIFF.[ppm]
-5573-3-7-3-5
CORD-2[ppm]912883850774724656438214
MOCRCM[ppm]912893863780723652442221
DIFF.[ppm]
010136-1-447
CORD-2[ppm]
528492452356293210-49
-309
EOCRCM[ppm]533508471369299215-32
-287
DIFF.[PPm]
5161913651722
Comparison of the isothermal temperature defect (Tables 3 and 4) showssimilar behavior. Maximal difference is 120 pcm for the ARO case and 132pcm for the ARI condition. All four tables also implicitly show acceptablediscrepancies in boron reactivity coefficient and control rod worths.
Table 3: Comparison of the ARO isothermal temperature defect at BOC,MOC and EOC.
T[deg.C]
216093
149177204260292
CORD-2[pcm]
210245288393440439291
0
BOCRCM[pcm]
205293358451475461313
0
DIFF.[pcm]
-54870583522220
CORD-2[pcm]
159115481499139113091157610
0
MOCRCM[pcm]
159716181591144713271156625
0
DIFF.[pcm]
670925618-1150
CORD-2[pcm]
339132243038262823712022
9830
EOCRCM[pcm]
341033233158268823772004
9950
DIFF.[pcm]
1999
120606
-18120
Table 4: Comparison of the ARI isothermal temperature defect at BOC, MOCand EOC.
T[deg.C]
216093149177204260292
CORD-2[pcm]
168616171550141713271169
6140
BOCRCM[pcm]
168116781635147513501175633
0
DIFF.[pcm]
-5618558236190
CORD-2[pcm]
297528322678234721371838912
0
MOCRCM[pcm]
297329092779240121431822924
0
DIFF.[pcm]
-277101546
-16120
CORD-2[pcm]
4678441741333517314126571265
0
EOCRCM[pcm]
4693452542653574313826281277
0
DIFF.[pcm]
1510813257-3
-2912o
Nuclear Energy in Central Europe '98 135

2.2 At power conditions
Comparison of the total power defect is presented on Table 5. Differencesare even smaller than in no power case.
Table 5: Comparison of the total power defect at BOC, MOC and EOC.
p
E%]1007550250
CORD-2[pern]
-1953-1513-1045-544
0
BOCRCM[pem]
-1963-1522-1053-550
0
DIFF.[pem]
-10-9-8-60
CORD-2[pem]
-2402-1839-1273-667
0
MOCRCM[pem]
-2415-1855-1290-685
0
DIFF.[pern]
-13-16-17-190
CORD-2[pern]
-2971-2264-1562-823
0
EOCRCM[pern]
-3015-2308-1605
-8500
DIFF.[pern]
-44-44-43-280
Results of the HFP control rod worth calculations are shown in Table 6.Even for a such extreme case as total insertion of control rods at HFP,agreement is excellent.
Table 6: Comparison of the HFP control rod worths at BOC, MOC and EOC.
Controlbank
DCBAS
CORD-2[pern]
7531238944
15663855
BOCRCM[pern]751
123995015693872
DIFF.[pern]
-2163
17
CORD-2[pern]
7971224103018263924
MOCRCM[pern]
7961225103418283933
DIFF.[pern]
-11429
CORD-2[pern]
8171266107818604012
EOCRCM[pern]
8161266108318594002
DIFF.[pern]
-105-1
-10
Power distributions for the core at 75 % nominal power are presented inFigures 1 and 2. Differences are smaller than 0.25 % in average assemblypowers and less than 0.5 % in average axial distribution.
136 Nuclear Energy in Central Europe '98

1.0862
1.0853
-0.09
0.9538
0.9526
-0.12
1.2983
1.2982
-0.01
0.9099
0.9107
0.08
1.0885
1.0862
-0.23
1.2361
1.2364
0.03
0.3951
0.3941
-0.10
1.1578
1.1570
-0.08
1.0672
1.0668
-0.04
1.0914
1.0902
-0.12
1.2883
1.2887
0.04
1.1441
1.1445
0.04
0.3191
0.3191
0.00
1.0997
1.0995
-0.02
1.3450
1.3456
0.06
1.3036
1.3044
0.08
1.0000
1.0007
0.07
1.1358
1.1362
0.04
1.1449
1.1456
0.07
0.4229
0.4229
0.00
CORD-2
RCM
DIFF. [%]
0.4505
0.4506
0.01
Figure 1: Comparison of the assemblywise power at the 75 % core powerlevel, BOC.
Nuclear Energy in Central Europe '98 137

CORD-2 » RCM A Diff.
-0,5020 40 60
Core height [%]
80 100
Figure 2: Comparison of the relative average axial power at the 75 % corepower level, BOC.
3. Conclusion
Concept of the cycle dependent nodal macroscopic cross section library,incorporated as an option into the CORD-2 package, was found to besufficiently accurate for the design calculations. Since the cross section libraryrequires only standard sequence of calculation at three different operatingconditions, the concept enables faster core design process and offerssubstantial savings in CPU time.
References
[1] A. Trkov, M. Ravnik: CORD-2 Package for PWR Nuclear Core DesignCalculations, Proceedings of the International Conference on ReactorPhysics and Reactor Computations, Tel-Aviv, 23-26. Jan. 1994, Ben-Gurion University of the Negev Press, (1994).
[2] A. R. Askew, F. J. Fyers, P. B. Kemshell: A General Description of theCode WIMS, J. Br. Nucl. Energy Soc, 5, p. 564, (1966).
[3] M. Kromar, A. Trkov: Generation of the Reactivity Coefficient Library inthe CORD-2 System, 4th Regional Meeting Nuclear Energy in CentralEurope, Proceedings, 7-10 September 1997, Bled, Slovenia, ISBN 961-6207-07-05, p. 367, (1997).
[4] A. Trkov: GNOMER - Multigroup 3-Dimensional Neutron Diffusion NodalCode with Thermohydraulic Feedbacks, Institute Jozef Stefan, Ljubljana,Slovenia, IJS-DP-6688, Dec. 1997.
138 Nuclear Energy in Central Europe '98

SI0100103
Nuclear Energy in Central Europe '98
Terme Catez, September 7 to 10, 1998
Incorporation of multi-layer option into QAD-CGGP code
Kresimir Trontl, Mile Bace
Faculty of Electrical Engineering and ComputingDepartment of Applied Physics
University of Zagreb10000 Zagreb, Unska 3, Croatia
Tomislav Smuc
Rudter Boskovic Institute, Bijenicka 54, Zagreb, Croatia
AbstractIn order to improve the results of the OAD-CGGP gamma dose rate calculation we
have incorporated multi-layer (two-layer) shield option and a new buildup factor formula,published recently, into the code. Modified QAD has been tested by comparison to thepublished results. The improved version of the code has been used to calculate gamma doserate of a planar source and a two-layer shield and the results have been compared with theSAS4 (Monte Carlo method). Also, the improved version of the code has been used tocalculate dose rate of the RADLOK-55 low and intermediate waste drum placed inside theNPP Krsko transport (lead-iron) shield. The results of the calculation were compared withthe standard QAD-CGGP results. Incorporation of the two-layer (multi-layer) option intoQAD-CGGP point-kernel code seems to be justified, resulting in higher accuracy.
1. IntroductionQAD-CGGP [1] is a member of a well-known family of point-kernel codes, developed
by Los Alamos Scientific Laboratory, and is routinely used for engineering calculations ofneutron and gamma ray penetration through various shield configurations. CGGP versioncomprises two important additions: combinatorial geometry (CG) description option and ageometric progression (GP) fitting function for the determination of gamma-ray buildupfactor.
In spite of the great advance in the development of buildup factors for singlematerials, the buildup phenomenon in stratified shields which are the most popular shieldconfigurations appearing in nuclear facilities, can still not be correctly handled in point-kernelcodes being used up to date.
QAD-CGGP uses single-material buildup factor for multi-layered shields or forshields made up of mixtures of materials. For multi-layered structures having an outer layerthicker than 2 or 3 mean free paths (mfp) it is recommended to use the outer layer buildupfactor. For multi-layered structures in which each layer is less than 2 mean free paths no clearprocedure is recommended.
It is the aim of this paper to introduce empirical formulas for reproduction of buildupfactors for stratified shields into the existing source of QAD-CGGP code, in order to improvethe results obtained by the code.
Nuclear Energy in Central Europe '98 139

The two-layer option has been chosen as a first step of incorporation of multi-layeroption into QAD-CGGP code, for several reasons. Since the original QAD code uses onlysingle material buildup factor, the most appropriate next step is to investigate contribution ofthe second material in the shield. Furthermore, the two layer shield is usually rather goodapproximation of the actual situation, either a self-absorbing volume source is surrounded bya dominant shield, or a volume source is surrounded by two principal shields (steel-lead,steel-concrete, steel-neutron shield, etc.). In each case the absorption of the volume source istaken into account, but in the second case source buildup is approximated by the dominantbuildup factor of the shield.
2. Formula descriptionThe basic formula introduced into the QAD-CGGP code has the origins in the Kalos'
formula [2], and can be written in the following form:
-C(X2)] (1)
whereB(Xj,Xz) = transmission exposure buildup factor for a double-layered slab with X} mfp of the
first material and X2 mfp of the second material,Bj(Xj) = transmission exposure buildup factor for the material of i th layer with a thickness of
Xj mfp,K(Xi) = ratio of the scattered component transmitted through X] mfp of the first material
relative to that transmitted through Xj mfp of the second material
K(X}) = B^X^l C(X2) = correction factor.-#2(^1)-1
Burke and Beck have modified the original Kalos' correction factor. The modificationhas been based on the comparison of the results of transport calculations as well asexperimental measurements for different kinds of slab combined shields.The modified correction factor has the form
C(X2) = exV(-X2 ly) +1.5 • [l - exp(-AT2)] (2)
for high atomic number material (Z) followed by low atomic number material, and
C(X2) = expfr -X2) + (a/K)-[l- exp(-Z2)] (3)
for low atomic number material followed by high atomic number material.y represents the ratio of mass Compton cross section of the first material to that of the
second material, and a is the ratio of Compton scattering to total cross section in the first andsecond material, respectively:
a —•
The described formula is an empirical formula for synthesizing double-layeredbuildup factors from those of single-layered slabs for a plane-normal source.
Lin and Jiang proposed a different correction factor for a point isotropic source inspherical geometry. By fitting to the transmission buildup factors of double-layered shields
140 Nuclear Energy in Central Europe '98

(composed mainly of iron-water and lead-water combinations) from the M o n t e Carlocalculations using E G S 4 code, they proposed the following form for the correction factors:
(4)
for high atomic number material followed by low atomic number material, and
for low atomic number material followed by high atomic number material.Symbol (3 is the ratio of mass total cross section of second material to that of the first material
P = 4-* r2- and l(X->) represents the following expresion
3. Modification of the QAD-CGGP codeThe process of incorporation of the new formula into the original source has been
based on avoiding any unnecessary changes of the source. Although such an approach resultsin a larger number of lines added to the source, it is easier to follow the changes and it makesany additional corrections easier to implement.
QAD-CGGP represents the source volume by a number of point isotropic sources andcomputes the line of sight distance from each of them to the detector. Based on path lengthsthrough different material regions from source to detector, both material and geometryattenuation ate determined, as well as buildup factor value for the particular source. At thedetector position contributions from all the source points are summed up to give scalar flux ofthe uncollided beams for every energy group. By means of buildup and flux-dose rateconversion factors, dose rate at the detector position are calculated.
Incorporation of multi-layer (two-layer) option into the QAD-CGGP code has beendone using the basic formula (1) and correction factors proposed by Lin and Jiang(expressions 4 and 5). Buildup factors Bi and B2 of a particular shield layer are calculated bymeans of the original QAD geometric progression (GP) fitting function. Ratios a,p and y,which are necessary for the correction factor calculation are determined using speciallycreated library of Compton scattering and total cross sections as a function of photonenergies, for the most common shielding materials [5].
In order to detect any possible errors, a comparison test has been performed. Buildupfactors for a double-layered shield (low Z material, followed by a high Z material) and a pointisotropic source, have been calculated and compared with the results given by Lin andJiang[2].
The results of a buildup calculation for a point isotropic source, the source energybeing 2.75 MeV, in a double-layered shield comprised of aluminum and iron, are given inTable 1. The thickness of aluminum is 2 mean free paths, and the thickness of iron variesfrom 1 to 6 mean free paths. The values of EGS4 and Lin & Jiang calculation in the originalarticle [2] are given for the energies 0.5, 1.0 and 3.0 MeV. The values for 2.75 MeV energyline, were obtained by interpolation of the given values.
Nuclear Energy in Central Europe'98 141
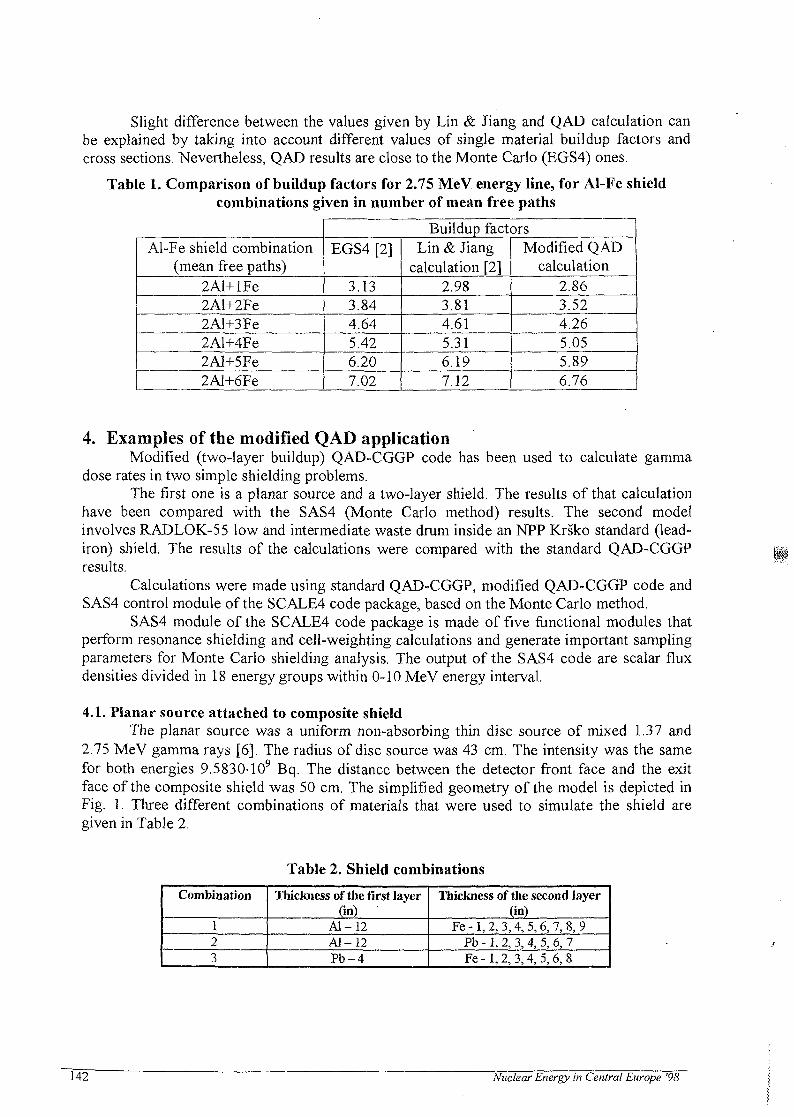
Slight difference between the values given by Lin & Jiang and QAD calculation canbe explained by taking into account different values of single material buildup factors andcross sections. Nevertheless, QAD results are close to the Monte Carlo (EGS4) ones.
Table 1. Comparison of buildup factors for 2.75 MeV energy line, for Al-Fe shieldcombinations given in number of mean free paths
Al-Fe shield combination(mean free paths)
2Al+lFe2Al+2Fe2Al+3Fe2Al+4Fe2Al+5Fe2Al+6Fe
Buildup factorsEGS4 [2]
3.133.844.645.426.207.02
Lin & Jiangcalculation [2]
2.983.814.615.316.197.12
Modified QADcalculation
2.863.524.265.055.896.76
4. Examples of the modified QAD applicationModified (two-layer buildup) QAD-CGGP code has been used to calculate gamma
dose rates in two simple shielding problems.The first one is a planar source and a two-layer shield. The results of that calculation
have been compared with the SAS4 (Monte Carlo method) results. The second modelinvolves RADLOK-55 low and intermediate waste drum inside an NPP Krsko standard (lead-iron) shield. The results of the calculations were compared with the standard QAD-CGGPresults.
Calculations were made using standard QAD-CGGP, modified QAD-CGGP code andSAS4 control module of the SCALE4 code package, based on the Monte Carlo method.
SAS4 module of the SCALE4 code package is made of five functional modules thatperform resonance shielding and cell-weighting calculations and generate important samplingparameters for Monte Carlo shielding analysis. The output of the SAS4 code are scalar fluxdensities divided in 18 energy groups within 0-10 MeV energy interval.
4.1. Planar source attached to composite shieldThe planar source was a uniform non-absorbing thin disc source of mixed 1.37 and
2.75 MeV gamma rays [6]. The radius of disc source was 43 cm. The intensity was the samefor both energies 9.5830-109 Bq. The distance between the detector front face and the exitface of the composite shield was 50 cm. The simplified geometry of the model is depicted inFig. 1. Three different combinations of materials that were used to simulate the shield aregiven in Table 2.
Table 2. Shield combinations
Combination
123
Thickness of the first layer(in)
Al-12Al-12Pb-4
Thickness of the second layer(in)
Fe-1,2, 3,4, 5,6,7, 8, 9Pb - 1 , 2, 3, 4, 5, 6, 7Fe -1,2, 3,4, 5, 6, 8
142 Nuclear Energy in Central Europe '98

Opiate
Source
2nd plate
50 cm
Detectorposition
Figure 1. Simplified geometry of the model
The testing results for a planar source, for different shield combinations are given in Table 3.The results for total buildup and dose rate are also depicted in Figures 2-7.
Table 3. Total buildup and dose rates
Shield combination(materials in inches)
AI12Fe1Al12Fe2AI12Fe3AI12Fe4AI12Fe5AI12Fe6AI12Fe7AI12Fe8AI12Fe9AI12Pb1AI12Pb2AI12Pb3AI12Pb4AI12Pb5AI12Pb6AI12Pb7Pb4Fe1Pb4Fe2Pb4Fe3Pb4Fe4Pb4Fe5Pb4Fe6Pb4Fe8
Original QAD-CGGPBuildup
4.404.995.586.186.397.037.688.369.064.855.896.958.045.065.706.363.463.784.104.464.805.165.90
Dose rate(mSv/hr)3.04E-011.51E-017.50E-023.72E-021.73E-028.61 E-034.28E-032.13E-031.06E-031.92E-015.96E-021.83E-025.55E-039.27E-042.79E-048.38E-054.14E-021.98E-029.76E-034.63E-032.27E-031.08E-032.56E-04
Modified QADBuildup
3.824.234.735.275.866.487.127.798.493.183.543.984.47
L 5.025.616.233.814.575.346.116.957.68 "9.28
Dose rate(mSv/hr)2.85E-011.28E-016.35E-023.17E-021.58E-027.94E-033.97E-031.98E-039.90E-041.26E-013.59E-021.04E-023.09E-039.19E-042.75E-048.20E-054.56E-022.40E-021.24E-026.33E-033.65E-031.61 E-034.03E-04
SAS4Dose rate(mSv/hr)2.20E-011.03E-015.29E-022.48E-021.22E-026.13E-032.83E-031.18E-037.23E-043.48E-021.89E-021.49E-025.52E-031.81 E-031.53E-035.53E-044.08E-022.07E-021.13E-024.53E-031.79E-031.09E-033.45E-04
Nuclear Energy in Central Europe '98 143

- • -QAD-CGGP
|—B— Modified QAD
1 2 3 4 5 6 7 8 9
Fe slab thickness (in)
Figure 2. Total buildup comparison for AI-Fe shield
-IT
lv/1
01
era1
sop
tal
0
1.00E+00
1.00E-01
1.00E-02
1.00E-03
1,0OE-04
• QAD-CGGP
—H— Modified QAD
—A-SAS4
1 2 3 4 5 6 7 8 9
Fe slab thickness (in)
Figure 3. Total dose rate comparison forAl-Fe shield
QAD-CGGP
-a-Modi f ied QAD
1 2 3 4 5 6
Pb slab thickness (in)
Figure 4. Total buildup comparison for Al-Pb shield
1 2 3 4 5 6 7
Pb slab thickness (in)
QAD-CGGP
Modified QAD
SAS4
Figure 5. Total dose rate comparison forAl-Pb shield
—*—QAD-CGGP
-B—Modified QAD I
1 2 3 4 5 6 8
Fe slab thickness (in)
Figure 6. Total buildup comparison forPb-Fe shield
1 2 3 4 5 6 8
Fe slab thickness (in)
QAD-CGGP
Modified QAD
SAS4
Figure 7. Total dose rate comparison forPb-Fe shield
4.2 RADLOK-55 plastic containerPlastic container RADLOK-55 has the outer dimensions similar to the dimensions of
the standard 55 gallons barrel (200 liters). Vertical cross section of the container is depicted inFig.8. The inner useful space of the container is 168.5 litters, but for the reason of simplifyingthe problem, the active space has been modeled as a cylinder with a diameter of 55 cm, and aheight of 72 cm.
The shield used in the calculations is the standard shield used at NPP Krsko, and isdepicted in Fig. 9. The inner and the outer shell are made out of steel, and the primary shield ismade out of lead. The shield has been modeled by joining the inner and the outer shell in onelayer of the combined thickness.
Calculations of the buildup factor have been made using the USAR prediction for themaximum possible value of specific activity in ion-exchange resins, in the case of extensive
144 Nuclear Energy in Central Europe '98
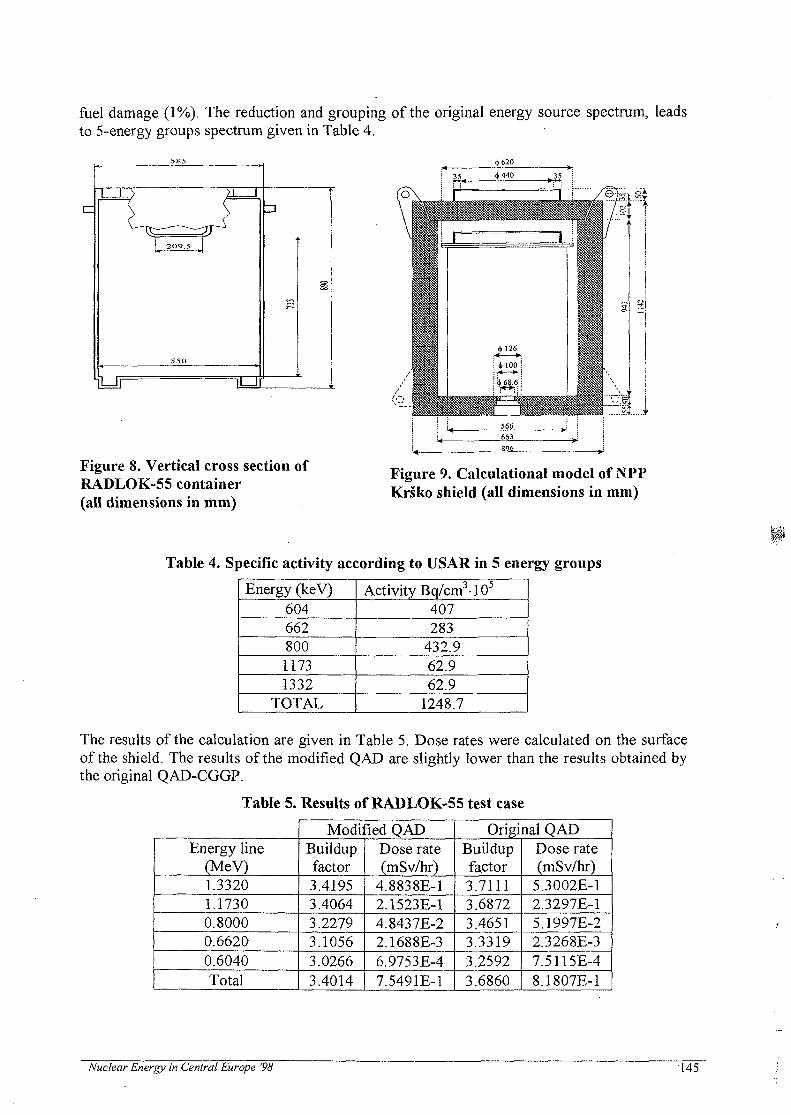
fuel damage (1%). The reduction and grouping of the original energy source spectrum, leadsto 5-energy groups spectrum given in Table 4.
$620
Figure 8. Vertical cross section ofRADLOK-55 container(all dimensions in mm)
Figure 9. Calculational model of NPPKrsko shield (all dimensions in mm)
Table 4. Specific activity according to USAR in 5 energy groups
Energy (keV)60466280011731332
TOTAL
Activity Bq/cm3-105
407283
432.962.962.9
1248.7
The results of the calculation are given in Table 5. Dose rates were calculated on the surfaceof the shield. The results of the modified QAD are slightly lower than the results obtained bythe original QAD-CGGP.
Table 5. Results of RADLOK-55 test case
Energy line(MeV)1.33201.17300.80000.66200.6040Total
Modified QADBuildupfactor3.41953.40643.22793.10563.02663.4014
Dose rate(mSv/hr)
4.8838E-12.1523E-14.8437E-22.1688E-36.9753E-47.5491E-1
Original QADBuildupfactor3.71113.68723.46513.33193.25923.6860
Dose rate(mSv/hr)
5.3002E-12.3297E-15.1997E-22.3268E-37.5115E-48.1807E-1
Nuclear Energy in Central Europe '98 145

5. ConclusionThe difference in the results of the original and modified QAD-CGGP code has its origin
in the different buildup values. The original QAD results for two-layer shield problemsdepend on the arbitrary choice - when to switch from the 1st layer buildup to the second one,resulting in their abrupt change. The buildup values of the modified QAD change smoothlywith the composite shield thickness, which is physically correct, and no arbitrary choice isneeded. This can be taken as the main quality of the modified QAD code, which justifies thetwo-layer (multi-layer) buildup incorporation. Apart from that, one would expect the results tobe closer to the correct values. In practical calculations it is customary to use buildup data forinfinite media, usually for a point isotropic source. This approach always overestimatesbuildup effect, therefore the error is always on the conservative side. Comparison to the SAS4(Monte Carlo) results, shows generally higher QAD dose rates, modified ones beingsomewhat lower, meaning closer to the correct values. The exemption is AlPb shieldcombination, where the SAS4 dose rate results for Pb slabs thicker than 4" are higher thanQAD ones. The reason for that, one can find in the fact that the existing gamma rays buildupfactor values have been derived by treating only the Compton scattering. The contributionfrom annihilation gamma rays has been neglected. As the lead pair production cross section isvery high, having both gamma ray energies above 1.02 MeV, such a neglecting for the leadshield being closer to the detector, results in an underestimation of the dose rate.
Incorporation of the two-layer (multi-layer) option into QAD-CGGP point-kernel codeseems to be justified, resulting in higher accuracy and exclusion of arbitrary decisions.Introduction of the two-layer option is the first step in improvement of QAD-CGGP code.The next step should be a multi-layer option (at least three-layer option), tested on morerealistic problems, preferably benchmarks.
References
[1] V.R. Cain, QAD-CGGPGP: A Combinatorial Geometry Version of QAD-P5A, A PointKernel Code System for Neutron and Gamma-Ray Shielding Calculations Using the GPBuildup Factor, ORNL, March 1989
[2] Uei-Tyng Lin, Shiang-Huei Jiang: A Dedicated Empirical Formula for y-ray BuildupFactors for a Point Isotropic Source in Stratified Shields, Radiat.Phys.Chem. Vol.48,No.4, pp.3 89-401, 1996
[3] Y.Harima, An Historical Review and Current Status of Buildup Factor Calculations andApplications, Radiat.Phys.Chem. Vol.41, No.4/5, pp.631-672, 1993
[4] Nuclear Power Plant Krsko Updated Safety Analyses Report (USAR)[5] Kai Siegbahn: Alpha-, Beta- and Gamma-ray Spectroscopy, Vol.1, North-Holland
Publishing Company, Amsterdam, 1968.[6] M.Bace, D.Grgic, D.Pevec: Modeling of Shielding Benchmark for Na-24 y-rays Using
SCALE Code Package and QAD-CGGP Code, 3rd Regional Meeting: Nuclear Energy inCentral Europe, Slovenia 1996.
146 Nuclear Energy in Central Europe '98

SI0100104
Nuclear Energy in Central Europe '98
Terme Catez, September 7 to 10, 1998
RELAP5 Code Validation Using a Medium-size BreakLOCA Experiment at the PMK-2 Test Facility
Gy. Ezsol, A. Guba, L. Perneczky, I. SzaboKFKIAtomic Energy Research InstituteH-1525 Budapest, Hungary, P.O.Box 49Tel: 36-1-3959041 Fax: 36-1-3959293
ABSTRACT - For the analyses of loss of coolant accidents (LOCA) the thermohydraulic computer codecapabilities for eastern-type reactors like VVER-440 must be validated by pre- and posttest calculations ofsuitable experiments. Such experiments are performed on PMK-2 integral-type test facility in KFKJ AtomicEnergy Research Institute, Budapest, which is a volume-scaled model of the primary and secondary system ofthe Paks Nuclear Power Plant. One of these experiments is the pressuriser surge line break which correspond toa 22% leak. The most important phenomena of the experiment are the behaviour of hot leg loop seal and thecore dry-out with refill-reflood. Posttest calculations were performed by use of the code versionRELAP5/mod3.2. The results of the calculation and experiment are compared. The code properly simulate theanalysed transient.
1. Introduction
An essential component of nuclear safety activities is the analysis of postulated accidentsin nuclear power plants. Such analyses are usually carried out with complex thermohydrauliccomputer codes, which must be validated through the comparison of calculated results withexperimental data. Computer codes like RELAP5 have been developed for modellingwestern-type nuclear power plants, therefore the code capabilities for modelling an eastern-type reactor must be checked by pre- and posttest calculations of suitable experiments. TheVVER-440/213-type reactors - which the Hungarian Paks Nuclear Power Plant is equippedwith - have a number of special features, e.g., horizontal steam generators and loop seals inboth hot and cold legs, so the transient behaviour should be different from the usual reactorsystems. To support getting acquainted with different type of accidents in VVER-440, PMK-2integral-type test facility have been designed and constructed by KFKI Atomic EnergyResearch Institute, Budapest, Hungary. The facility is used in the framework of national andinternational computer code validation projects for VVER-440-type reactors. One of theseexperiments on the PMK-2 test facility was with the initiating event of the pressuriser surgeline break. Post test-calculations for this test have been performed using RELAP5/mod3.2 [8].
This report gives a short description of the PMK-2 facility, presents and compares theresults of the calculation and experimental data with the discussion of the main features of thetests.
Nuclear Energy in Central Europe'98 • 149

2. Facility description
PMK-2 facility is a full-pressure scaled down model of the Paks Nuclear Power Plant. Itwas designed mainly to investigate loss of coolant accidents (LOCA) following small- andmedium-size leak in the primary circuit and to study the natural circulation behaviour ofVVER-440/213 plants [1]. LOCAs have been tested covering a break size of 1 to 22% withdifferent break locations.
The volume and power scaling is 1:2070. Transients can be started from nominaloperating conditions. The elevation ratio is kept 1:1 except for the lower plenum andpressuriser. The six loops of the plant are modelled by a single active loop. In the secondaryside of the steam generator the steam/water volume ratio is maintained.
The schematic layout of the test facility is shown in Figure 1.
STEAM
'PR21)--
FEED WATER
Figure 1. Block scheme of the PMK-2 test facility
3. Experiment description
The pressuriser surge line break accident (PH-SLB test [2,3]), is initiated by opening ofthe break valve. The break nozzle has a diameter of 6 mm and its location is at the lowest partof the hot leg loop seal (as shown in Figure 2). From the ECC systems the minimum safetyconfiguration is used as follows: 2 safety injection tanks modelled by one vessel (SIT2) to theupper plenum, 1 high-pressure injection system (HPIS) and 1 low-pressure injection system(LPIS). The transient time is 1150 s. The secondary side is isolated after starting the transient.The initial conditions and the sequence of events during the course of the transient arepresented in Tables 1 and 2, respectively.
150 Nuclear Energy in Central Europe '98

Pressure in upper plenum (PR21)Loop flow rate (FL53)Core inlet temperature (TE63)Core power (PWO 1)Coolant level in pressuriser (LE71)SIT pressure (PR92)SIT level (LE92)SIT water temperatureSecondary side pressure (PR81)Feedwater flow (FL81)Feedwater temperature (TE81)SG secondary level (LE81)
UnitMPakg/sK
kWm
MPamK
MPakg/sKm
Experiment12.574.37541.2666.49.805.979.64
293.04.690.34
495.29.02
Calculation12.574.37540.7666.49.615.979.62
293.04.700.34
495.28.05
Table 1. Measured and Calculated Initial Conditions
Break valves opensFull opening timeScram initiationPump coast down initiationFeedwater and steam valves start to closeHPIS startsSIT actuatedPump coast down endedDry-out occursSIT emptiedLPIS startsMaximum cladding temperature occursTransient time
Experiment0.0 s0.1 s0.1s0.1s3.0 s
17.0 s25.0 s
148.0 s210.0 s218.0 s304.0 s444.0 s
1150.0 s
Calculation0.0 s0.1s0.1 s0.1 s3.0 s
17.0 s25.0 s
150.0 s212.0 s217.0 s236.0 s380.0 s
1000.0 s
Table 2. Measured and Calculated Events
Figure 2. Break model
Nuclear Energy in Central Europe '98 151
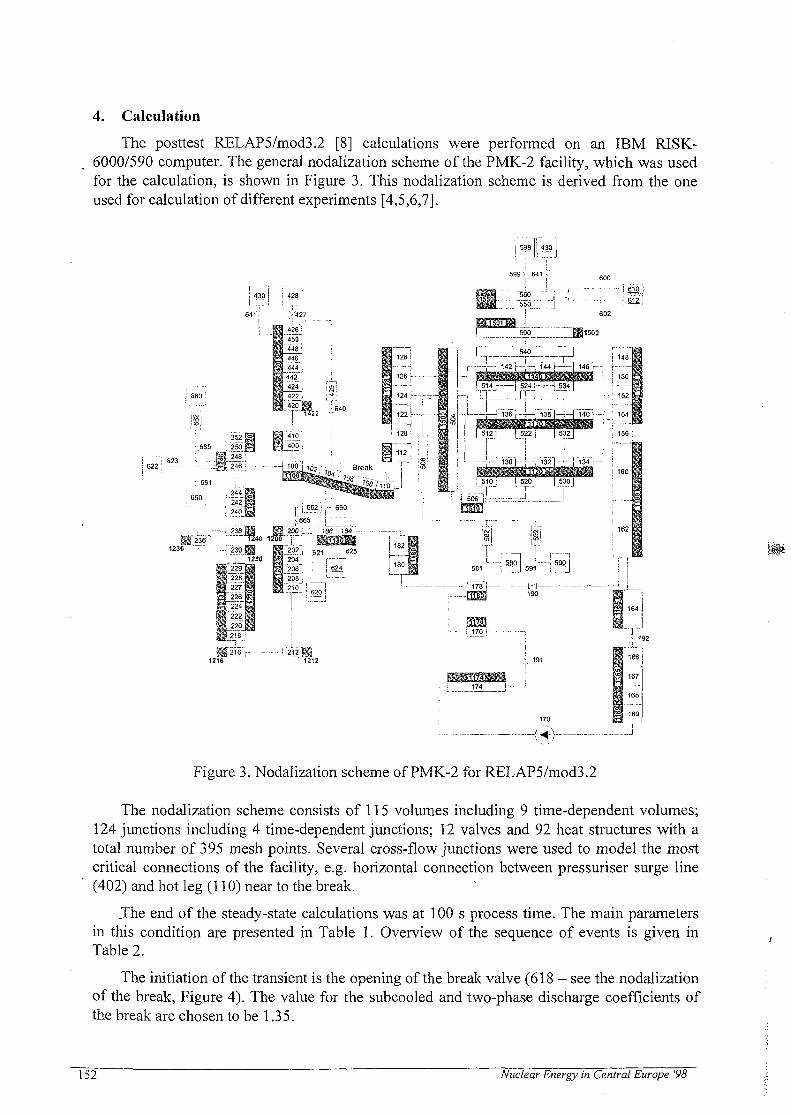
4. Calculation
The posttest RELAP5/mod3.2 [8] calculations were performed on an IBM RISK-6000/590 computer. The general nodalization scheme of the PMK-2 facility, which was usedfor the calculation, is shown in Figure 3. This nodalization scheme is derived from the oneused for calculation of different experiments [4,5,6,7].
Figure 3. Nodalization scheme of PMK-2 for RELAP5/mod3.2
The nodalization scheme consists of 115 volumes including 9 time-dependent volumes;124 junctions including 4 time-dependent junctions; 12 valves and 92 heat structures with atotal number of 395 mesh points. Several cross-flow junctions were used to model the mostcritical connections of the facility, e.g. horizontal connection between pressuriser surge line(402) and hot leg (110) near to the break.
The end of the steady-state calculations was at 100 s process time. The main parametersin this condition are presented in Table 1. Overview of the sequence of events is given inTable 2.
The initiation of the transient is the opening of the break valve (618 - see the nodalizationof the break, Figure 4). The value for the subcooled and two-phase discharge coefficients ofthe break are chosen to be 1.35.
152 Nuclear Energy in Central Europe '98
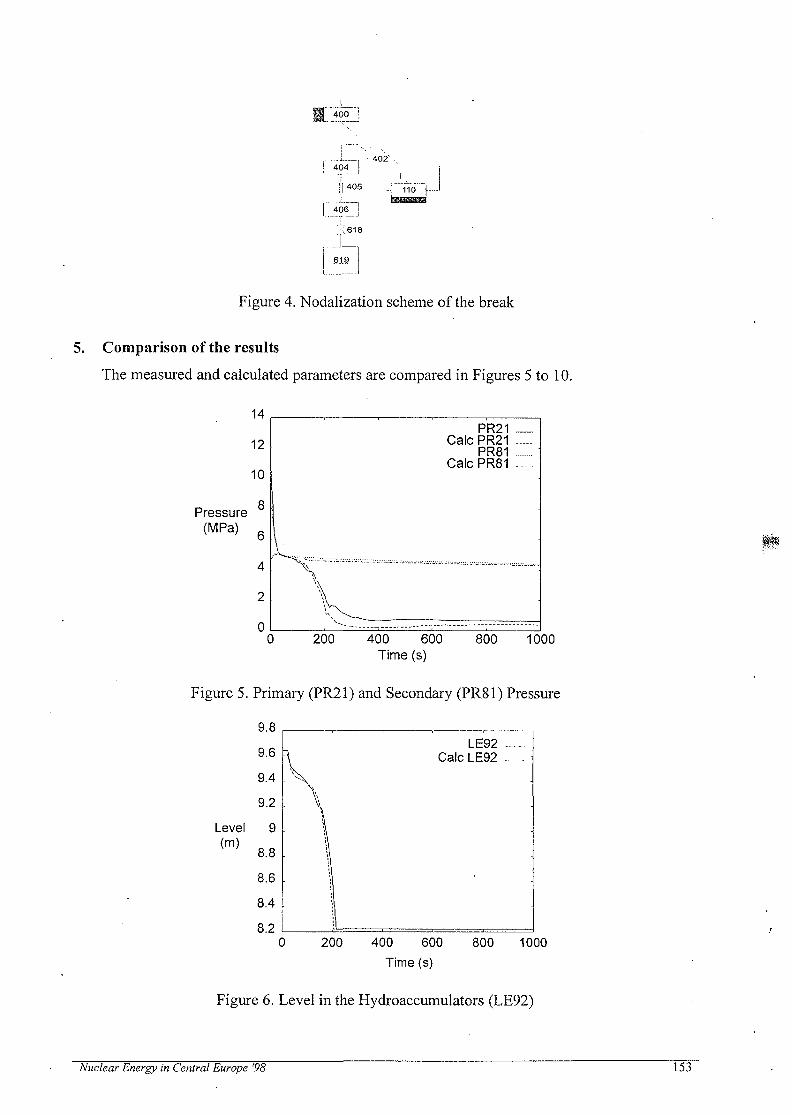
400 !
, . . .1-—. 402'! 404_ J
I 405
;618
619i
Figure 4. Nodalization scheme of the break
5. Comparison of the results
The measured and calculated parameters are compared in Figures 5 to 10.
14
Pressure(MPa)
12
10
8
6
4
2
n
PR21Calc PR21 .....
PR81Calc PR81 .......
I
\ ^ — ™— . — _ — _
200 400 600Time (s)
800 1000
Figure 5. Primary (PR21) and Secondary (PR81) Pressure
Level(m)
200 400 600
Time (s)800 1000
Figure 6. Level in the Hydroaccumulators (LE92)
Nuclear Energy in Central Europe '98 153

The time history of the primary and secondary pressure are shown in Figure 5. Theprimary is decreasing sharply until the emptying of the SIT (Figure 6). The last water packfrom the SIT is going through the hot leg (Figure 9) to the break and it stabilises the primarypressure for about 26 s. This period is much shorter in the calculation. After the stagnation ofthe primary pressure, the core dry-out occurs and the pressure drops to the set-point of theLPIS at 304 s in the experiment and at 236 s in the calculation. After the LPIS initiated thedecrease of the primary pressure stops and long term stagnation begins. This value is slightlylower in the calculation than in the measurement.
Level(m)
0 200 400 600 800 1000
Time (s)
Figure 7. Level in the Reactor Model (LEI 1)
Due to the large coolant loss the collapsed level in the reactor model (LEI 1) drops to thebottom elevation of the reactor in both of the experiment and calculation (Figure 7). Then,according to the LPIS injection, the level increases and the core is re-filled. Since the LPISstarts earlier in the calculation, the coolant collapsed level begins to increase earlier.
900
Temperature(K)
800
700
600
500
400
300
//7\'.// \ifn\ '
1 •••'' ''
/ / " v
TE11CalcTEH ......
l t TE15\\ CalcTE15 .......
\|
0 200 400 600 800 1000
Time (s)
Figure 8. Cladding Temperatures (TE11,TE15)
154 Nuclear Energy in Central Europe '98

6.4
Level(m)
6.2
6
5.8
5.6
5.4
5.2
5
48
1 F31
1i:',
tjl
j i | Calc LE31
| II
I |0 200 800 1000400 600
Time (s)Figure 9. Level in the Hot Leg Loop Seal (LE31)
As a consequence of the low mass inventory in the core extended dry-out occurs, and itcauses the increase of the temperatures in the core model as shown in Figure 8. The TE11 andTE15 are cladding temperatures along the length of the heated section (at 500 and 2450 mmheight) in the core (Figure 1). The temperature excursion is started at about the same time inthe experiment and in the calculation. For cladding temperatures the code predicts themaximum value at the top quite well. The maximum temperature at the bottom is differentbecause of the difference in timing of the LPIS.
During the injection from the hydroaccumulators (SIT) the hot leg loop seal is emptiedand filled-up as shown in Figure 9. This is repeated four times in the measurement but thecalculation shows it only once. The last clearing of the loop seal occurs after the emptying ofthe hydroaccumulators at about 220 s.
The total mass leaked through the break in 1000 s is about 195 kg. It is a high valuecompared to the nominal coolant inventory of primary system (135 kg), including the pumpby-pass (Figure 1). The minimum value of the core inventory (MI01) is 7 kg in theexperiment and 10 kg in the calculation as shown in Figure 10.
Mass
200 400 600
Time (s)
800 1000
Figure 10. Total Mass Inventory in the Primary Circuit (MI01)
Nuclear Energy in Central Europe '98 155
6. Discussion and conclusions
Generally, the relatively large break size (22% break) - which is the largest (6 mm ofdiameter) that have been applied on this test facility until now - leads to a fast coolant/energyloss in primary system. As a consequence the dry-out of the core occurs. The temperatureexcursion is started at very low core level which is comparable with the previous PMK-2 testswhere dry-out occurred. The refill-reflood is maintained by the LPIS. Then the measured massinventory of the primary system stabilises at about 27 kg at the later phases of the transient.
The hot leg loop seal behaviour is affected by coolant injection from thehydroaccumulators, because the water from the SIT flows at first to the reactor model,evaporates and flows up to the hot leg entraining the next pack of the SIT water. This effectsrepeats four times. This tendency does not occur in the calculation, because this processchallenges not only the CCFL and evaporation models, but there are 3D effects also in theupper plenum (where the core, the hot leg and the SIT injection is connected).
Due to the relatively large break size the transient is basically governed by the break flow.It means that the nodalization and modelling of the break is very important. The measuredleaked mass history is very closed to calculated one, so the nodalization scheme of the breakcan be accepted. It is worth mentioned that the used value for the subcooled and two-phasedischarge coefficients of the break was larger than 1.
It can be generally stated that the results of the calculation predicts most of the transientwell, e.g. pressure and temperature behaviour, core dry-out and refill-reflood. The calculatedtiming of the events is mostly correspond to the measurement, except the initiation of theLPIS injection which results small differences in the later phases.
References
[1] L. Szabados et al, "PMK-2 Handbook. Technical Specification of the Hungarian IntegralTest Facility for VVER-440/213 Safety Studies." KFKI Atomic Energy Research Institute,Budapest, 1996.[2] Gy. Ezsol et al, "Pressuriser Surge Line Break. The PH-SLB test." KFKI Atomic EnergyResearch Institute, Budapest, May 1997.[3] L. Szabados and Gy. Ezsol, "Safety Related Thermohydraulic Experiments for VVERReactor Systems." 6th International Conference on Nuclear Engineering, ICONE-6354,ASME, 1998.[4] IAEA-TECDOC-477, "Simulation of a Loss of Coolant Accident with HydroaccumulatorInjection. Result of the Second Standard Problem Exercise on the Simulation of a LOCA."Vienna, 1988.[5] IAEA-TECDOC-586, "Simulation of a Loss of Coolant Accident with a Leak on the HotCollector of the Steam Generator. Result of the Third Standard Problem Exercise on theSimulation of a LOCA." Vienna, 1991.[6] IAEA-TECDOC-848, "Simulation of a Loss of Coolant Accident without High PressureInjection but with Secondary Side Bleed and Feed. Result of the Fourth Standard ProblemExercise on the Simulation of a LOCA." Vienna, 1995.[7] Gy. Ezsol, A. Guba, L. Perneczky, E. Krepper, H.-M. Prasser and F. Schafer, "Simulationof a Small Cold-leg-break Experiment at the PMK-2 Test Facility Using the RELAP5 andATHLET Codes." Nuclear Technology, Vol. 118, pp. 162,1997.[8] "RELAP5/mod3 Code Manual." NUREG/CR-5535,EGG-2596, Vols. 1-5,EG&G, 1995.
156 Nuclear Energy in Central Europe '98

SI0100105
Nuclear Energy in Central Europe '98
Terme Catez, September 7 to 10, 1998
EFFICIENT UNCERTAINTY ANALYSIS USING OPTIMALSTATISTICAL ESTIMATOR
A. Prosek, B. Mavko
"Jozef Stefan" Institute, Jamova 39, 1000 Ljubljana, [email protected], [email protected]
ABSTRACT - When performing best estimate calculations uncertainty needs to be quantified. In theworld different uncertainty methods were developed for uncertainty evaluation. In the present work anoptimal statistical estimator algorithm was adapted, extended and used for response surfacegeneration. The objective of the study was to demonstrate its applicability for uncertainty evaluationof single value or continuos valued parameters. The results showed that optimal statistical estimator isefficient in predicting lower and upper uncertainty bounds. This makes possibility to apply CSAUmethod for uncertainty evaluation of any kind of transient.
1. Introduction
In the frame of Code Scaling, Applicability and Uncertainty method one way ofcombining uncertainties is response surface which together with Monte Carlo methodevaluate the uncertainty of single values from the thermalhydraulic code calculated values.Recently in the literature the inability of CSAU method to determine uncertainties forcontinuos-valued parameters was reported [1, 2, 3].
The most often utilised methods for propagating uncertainties in the inputs tothermalhydraulic computer codes are Monte Carlo sampling of a regression model developedfrom selected code runs [4, 5, 6, 7]. Although much work has been done to date, more studiesneed to be conducted for uncertainty quantification of time dependent parameters withresponse surface. The purpose of the study was to determine uncertainty bounds forcontinuous-valued output parameters using optimal statistical estimator (OSE) whereregression model due to physics of the problem is not appropriate. The topic was identified asbeing of importance to users of CSAU method in providing them tool to determineuncertainty of any single value or continues valued parameters. In this way the CSAU methodcould be used for scenarios different from loss of coolant accident where uncertainty of safetyparameters is evaluated only.
2. Optimal statistical estimator
The optimal statistical estimator (OSE) is intended to fit code calculations instead ofregression analysis. In the nuclear field the method was first time adopted in 1992 for singlevalue calculation [7]. However, in 1998 the method was further improved and developed whatwill be described in the paper. It was adapted for multi-dimensional space where the
Nuclear Energy in Central Europe '98 157

dimension is determined with the number of input uncertain parameters. For single andcontinues valued output parameters the code OSE was developed for SUN workstations.
To illustrate the concept of optimal statistical estimator, basic equations will be given. Inthe following we assume that the parameter under consideration can be characterised by afinite number of data Xj which are represented by the complete data vector X=(xi, X2,...,x0.The complete data vector is often composed of two partial data vectors: G=(xi, X2,...,XM;0)
and H=(0; XM+I, XM+2V>XO- Here the symbol 0 indicates the corresponding data, which arenot specified, and I the number of input and output parameters. The complete data vector canthen be expressed by a composition:
V" — fZ (X) £J ™ (v v V Y Y y \ (]\Si. —KJ^II {A.J,A2,...,AM,JI.M + l,J<.M+2r..,Al /. (1)
In our case, the vector G represent input data points (values of input parameters) and Hrepresent output data points (for example peak cladding temperature, minimum core level)where the number of output parameters is equal (I-M) and number of input parameters is M.
The optimal estimator is expressed as a linear combination of prototype sample vector Hn
where the coefficients Cn represent the measure of similarity between a given vector G andprototype, partial data vector Gn:
'nHn, ' (2)
where N is the number of known data vectors (number of thermalhydraulic code calculatedcases) and
The approximation of § function is Gaussian function, which is smooth, regular function:
where M is the number of input uncertain parameters and
G = (x1,x2,...,xM), (5)Gn ={xn\,xn2i...,xnM). (6)
The problem now appears how to best select the width Oj. The main purpose of smoothingis to stretch the influence of a particular input data points into its surroundings, e.g.,approximately to its neighbours. If we want to cover the volume by samples uniformly, wedefine a; for dimension i:
^="X". ' = 12,..,/; (7)
] 5 8 Nuclear Energy in Central Europe 98

where S; is the distance between minimum and maximum value of the data points xni(n=l,2,...,N) and N; is the number of intervals between data points. The corrective factor fc isto be selected by the user based on the desired and previously tested performance of theoptimal statistical estimator. The contribution of each data point to the final result estimationcan be adjusted by it.
Using the derived optimal estimator Ho the complete estimated vector can be defined as
(8)
Determination of the function Y(X) represents the main task that must be done by thecomputer code, if the estimation is to be performed. One of the most important characteristicsof this estimator is that involves the highly non-linear functions Cn in terms of the given data
G. The obtained system is thus essentially non-linear, although the estimated vector Hois
expressed as a linear combination of prototype vectors from the data base. This means that theoutput is not only influenced by the input but also by the memorised vectors.
For assessing the adequacy and predictive capability of the optimal statistical estimatortwo statistics were'used. First is the coefficient of determination, R2 defined for j-th outputparameter as
\ y v I
Z_jVesin,,/ avgj)Rj = ̂ , —J=1,2,...,I-M. (9)
~(x -x yn=l
Here xest ; is the n-th estimated value of the j-th output parameter, xavgj is the mean code
calculated value of the j-th output parameter and xnj is n-th code calculated parameter of the j -th output parameter.
The second statistic is the root mean square (RMS). The RMS is a measure of thedeviation between the code-calculated output values and estimated values of outputparameter. For sample of size N and j-th output parameter is defined:
RMSL =
N l / 2
n=\
N(10)
The predictive capability of the optimal statistical estimator assessing by the two proposedstatistics is perfect when i?j = 1 and RMSj = 0.
To produce output results values of input parameters (XI,X2,...,XM) were random sampled(or input by the user) each time and the corresponding unknown output values were estimatedby optimal statistical estimator using Eqs. (2) to (6). Each time new coefficients Cn arecalculated while values Hn are calculated points obtained by computer code. The learned dataused should give a match of estimated value with calculated data as closer as possible. To seehow good the match is, the two statistics are used. The calculated data are used for learningand testing at the same time. More learning data (computer runs) we have better is theperformance of the estimator. Good characteristic of OSE is that optimal information is
Nuclear Energy in Central Europe '98 159

obtained from the calculated data when physical behaviour of the phenomenon is not known.Additionally, no new information is added to response surface. If Monte Carlo method used isaccurate enough the optimum information is used for the probability statement. Whencomparing OSE to regression analysis, for regression analysis with polynomial the amount ofdata is prescribed to describe response surface while in OSE more data mean moreinformation that could be extracted. If less data than required are used new information(wrong since not from calculations) is added to the RS in the case of regression analysis only.
3. Preparation for the analysis
For the uncertainty quantification steps 1 through 13 of the CSAU method wereperformed [4]. The RELAP5/MOD3.2 computer code was selected for uncertainty analysisconsisting of adequate code documentation [8] required by CSAU method [4]. TheRELAP5/MOD3.2 is a one-dimensional, two-fluid six-equation simulation code. Theequations conserve mass, momentum and energy for each of two phases.
Selected scenario was small-break loss of coolant accident (SBLOCA) with a 5.08 cmbreak in the cold leg at 50. s into the transient. Based on the careful examination. of thetransient and with the help of Nuclear Plant Analyzer (NPA) [9] the scenario was divided into5 phases shown on Fig.l. More detailed is scenario described in Ref. [10].
16
14
1 2e?
£ 4
2
0
break occurrence
-subcooled blowdown
two-phase natural circulationreflux condensation
loop seal clearance, core reflooding
long term cooldown
0 1000 2000 3000 4000Time (s)
Figure 1. Subdivision of SB LOCA scenario into phases
5000
Based on the phenomena identification and ranking process (PIRT) performed for SBLOCA in a two loop PWR (NPP Krsko) as the most important were identified the followingphenomena: heat transfer, critical flow, countercurrent liquid-vapour flow, liquid-vapourseparation, decay heat, quench front propagation and interfacial friction.
To reduce uncertainty due to nodalization standard input deck was used developed atJozef Stefan Institute. The standard input deck consists of 188 volumes, 203 junctions and203 heat structures with 705 mesh points. The input model consists of all major componentsof PWR plant as reactor vessel, hot and cold legs, loop seal, pressurizer, emergency corecooling system, steam generators and secondary side.
To avoid the subjectivity [11], the standard input deck was qualified according to theprocedure determined by the UMAE method [12]. These criteria were found very useful when
160 Nuclear Energy in Central Europe '98

standard nodalization is used for analysis (instead of the iterative step 8 of CSAU method). Itconsists of two stages, steady state and transient qualification.
4. Results of uncertainty analysis with OSE
Total 59 sensitivity calculations were performed. The important parameters selected byPIRT were varied around nominal value in the range specified in Table 1 according to thegiven distribution. For these input uncertain parameters the ranges and their distributions wereavailable from the previous SB LOCA study [6]. The first safety parameter selected was peakcladding temperature (PCT). The second safety parameter was the "severity of the accident" Sas was recommended and due to time constraints not used in study described in Ref. [6]. Thethird single value parameter was the time when PCT occurs, tpcT, as this time may vary fromcalculation to calculation. The parameter severity of the accident S is defined:
M-Ppn
(11)
in which are acore void fraction in the core, P the reactor power, Po initial reactor power, H thecore height and trec time to recovery. The calculated peak cladding temperatures for 59calculations range from 975 K to 1233 K.
Phenomenon
heat transfer
critical flow
countercurrentflow
phase separation
decay heat
Table 1. UncertaintyCode parameter
heat transfercoefficient
subcooled dischargecoefficient
two phase dischargecoefficient
-
interphase dragcoefficient
fission product yieldfactor
ranges for selected parametersDistribution
uniform
normal
normal
N.A.
normal
uniform
Range
±25%
±2 a(o=0.042)
±2 a(c=0.062)
-
±2CT
(a=0.0413)±10%
Bias
-
0.083
-0.435
-
-
-
Meanvalue
1.0
0.917
1.435
-
1.0
1.0
The sensitivity calculations results were then used to build a response surface withregression models and OSE. The response surface was then used to simulate severalthousands of cases in which the sensitivity parameters vary randomly according to theirrespective uncertainty range, distribution and bias (see Table 1). The uncertainty results forsingle valued safety parameters using OSE and the following stepwise regression modelswere compared (see Table 2):
= 1082.08-323.46x,;c5 -24.97x2x3
= 22.12-13.02X,JC3 - 4 . 5 6 ; ^ -0.59x22 + 7.51*2 + 11.28*2
= 5371.5-7058.6*, -148.2x2xs -66.2x3x4 + 3060.4*2
(12)
(13)
(14)
Nuclear Energy in Central Europe '98 161

where:X] - subcooled discharge coefficient,X2 - two phase discharge coefficient,X3 - heat transfer coefficient,X4 - interphase drag coefficient,X5 - fission product yield factor.
The results of comparison are shown in Table 2. First we can see that for PCT (same istrue for S and tpcr) in the case of OSE model used maximum calculated value was the same ascode calculated value. This is characteristic of OSE that between two code calculated valuesthe function is monotonic. For regression models, for PCT and S the calculated values arelower and in the case of tpcT the maximum value is higher than code calculated value, becausefor regression model the function between two neighbour points is not necessarily monotonic.Second, the results showed that the value of coefficient of determination R2 is very low forregression models. The reason for poor fit of regression model is that problem is complex andnon-linear. The statistic R2 is significantly improved when OSE is used instead of regressionmodel. The statistic RMS showed us that RMS for PCT is around 1.5 K what is significantlyless than 9.44 K in original CSAU study [4] or 3.85 K by using fast probability integration[5]. These two characteristics make favourable to use OSE.
When comparing PCT to safety criteria margin is sufficient. However, it should be notedthat additional biases and uncertainties should be added not treated in the presented analysiswhich would reduce the safety margin. Next, it was discovered that second safety parameter,severity of the accident S, is strongly correlated to peak cladding temperature with r=0.89 tobe statistically significant. This means that severity of the accident could be used instead ofPCT for safety parameters in scenarios in which PCT does not occur.
Table2. Probability statement for single parameter values for regression model andOSE model.
Modelregression
OSE
regressionOSE
regressionOSE
peak cladding temperature, PCT (K)5( percentile
value1041.21029.1
meanvalue1079.31085.3
95m percentilevalue
1122.91157.3
maximum value
1173.61233.0
severity of accident, S (m s)5l percentile
value21.8821.63
meanvalue
24.0124.49
95m percentilevalue
26.3727.62
maximum value
29.3731.03
time of PCT occurrence, tPCT (s)51 percentile
value1127.11097.5
meanvalue1221.91215.8
95l percentilevalue
1341.71325.7
maximum value" 1579.8
1412.0
statistic
R2
0.4160.972
RMS• -
1.55 Kstatistic
R2
0.5170.971
RMS-
0.08 m s
statistic
R2
0.8800.996
RMS-
1.06 s
The major advantage of OSE is in its ability to automate uncertainty evaluation of singlevalue or continues valued parameters while regression analysis needs to be performed to findthe best fit. It is inherent to OSE to find the best fit from given information, i.e. optimalestimation. More code calculations provide more information for OSE to improve fit. This
162 Nuclear Energy in Central Europe '98

means that increased number of thermalhydraulic code calculations can increase confidencelevel of the results. This finding is common to GRS (Gesellschaft fur Anlagen- undReaktorsicherheit) uncertainty method [13]. In Figs. 2 to 5 lower and upper uncertaintybounds calculated by OSE for some safety and system parameters are shown. Correctivefactor fc=0.25 was used and 10000 Monte Carlo samples for probability statement. From Figs.2 and 3 it can be seen that uncertainties for PCT and core collapsed liquid level are related.The same is true for core inlet and core outlet temperature where after 1500 s bothuncertainties increase. The number of output parameters for which uncertainty is determinedis not limited.
1200
1000
£
s
I
800
600
4000 1000 2000 3000 4000 5000
Time (s)
Figure 2. Lower and upper uncertaintybounds for cladding temperature
1000 40002000 3000
Time (s)
Figure 3. Lower and upper uncertaintybounds for core collapsed level
5000
600
1000 40002000 3000
Time (s)
Figure 4. Lower and upper uncertaintybounds for core inlet temperature
5000
650
600
2soQ.
I
550
500
450
400
0 1000 2000 3000 4000 5000
Time (s)
Figure 5. Lower and upper uncertaintybounds for core outlet temperature
5. Conclusions
The results showed that optimal statistical estimator method is efficient in calculation theuncertainty of single value and continues valued parameters. The applicability of thedeveloped OSE tool was demonstrated for calculation of peak cladding temperature, severityof the accident and time of PCT occurrence and 9 important system and safety parametersduring SB LOCA. The number of output parameters is not limited what makes OSE moregeneral and gives possibility to use OSE for transients different from loss of coolant accident.
Advantages of OSE when compared to regression models are that OSE is not limited withcomplexity or non-linearity of the problem, monotonic function between neighbour points andachieved statistics is better in the case of OSE.
The application of OSE for small break LOCA showed that safety margin for peakcladding temperature was sufficient when uncertainty of the order of 100 K was added to the
Nuclear Energy in Central Europe '98 163

mean value. However it should be noted that biases are not included in uncertainty analysisand have to be added separately to make the analysis complete.
It should be emphasised that response surface generation with optimal statistical estimatoris consistent with the general CSAU methodology. Therefore we hope that the developedOSE tool will spread the use of CSAU method from loss of coolant accidents to othertransients.
References
[I] F. D'Auria, M. Leonardi, H. Glaeser, R. Pochard, Current status of methodologiesevaluating the uncertainty in the prediction of thermal-hydraulic phenomena in nuclearreactors, Proc. Two-Phase Flow Modeling and Experimentation 1995, Roma, Italy,October 9-11, p.501-509 (1995).
[2] H. Holmstrom, H. Glaeser, A. Wickett, G. Wilson, Status of Code UncertaintyEvaluation Methodologies, Proc. Int. Conf. on New Trends in Nuclear. SystemThermalhydraulics, Pisa, Italy, May 30 - June 2, Vol. 1, p.437-446 (1994).
[3] H. Holmstrom, H. Toumisto, Applicability of the CSAU methodology to safetyassessments, Nuclear Engineering and Design 132, 415-416 (1992).
[4] Technical Program Group: Boyack, B.E., I. Catton, R.B. Duffey, P. Griffith, K.R.Katsma, G.S. Lellouche, S. Levy, U.S. Rohatgi, G.E. Wilson, W. Wulff, N.Zuber,Quantifying Reactor Safety Margin, Parts 1 to 6, Nuclear Engineering and Design 119,1-117(1990).
[5] E.F. Haskin, B.D. Bevan, C. Ding, Efficient uncertainty analyses using fast probabilityintegration, Nuclear Engineering and Design 166, 225-248 (1996).
[6] M.G. Ortiz and L.S. Ghan, Uncertainty Analysis of Minimum Vessel Liquid InventoryDuring a Small-Break LOCA in a B&W plant - An Application of the CSAUMethodology Using the RELAP5/MOD3 Computer Code, NUREG/CR-5818, EGG-2665, Idaho National Engineering Laboratory (1992).
[7] B. Mavko, A. Stritar, A. Prosek, Application of Code Scaling, Applicability andUncertainty Methodology to Large Break LOCA Analysis of Two-Loop PWR, NuclearEngineering and Design, 143, 95-109 (1993).
[8] RELAP5 Code Development Team, RELAP5/MOD3 Code Manual, Vols. 1 to 7,NUREG/CR-5535 (1995).
[9] D.M. Snider, K.L. Wagner, W.H. Grush, K.R. Jones, Nuclear Plant Analyzer,NUREG/CR-6291, INEL-94/0123, Vols. 1 to 4, Idaho National Engineering Laboratory(1995).
[10 I. Kljenak, A. Prosek, Development of a Phenomena Identification and Ranking Tablefor a Small-Break Loss of Coolant Accident scenario, Proc. 4th Regional meeting:Nuclear Energy in Central Europe, September 7-10, 1997, Bled Slovenia, NuclearSociety of Slovenia (1997).
[II] S.N. Aksan, F. D'Auria, H. Stadtke, User effects on the thermal-hydraulic transientsystem code calculations, Nuclear Engineering and Design, 145, 159-174 (1993).
[12] F. D'Auria, N. Debrecin, G.M. Galassi, Outline of the Uncertainty Methodology Basedon Accuracy Extrapolation, Nuclear Technology, 109, 21-38 (1995).
[13] H. Glaeser, E. Hofer, E. Chonjacki, A. Qunsy, C. Renault, Mathematical techniques foruncertainty and sensitivity analysis, Proc. Int. Symp. on Validation of SystemsTransients Analysis Codes, FED-Vol. 223, pp. 75-82, ASME (1995).
164 Nuclear Energy in Central Europe '98
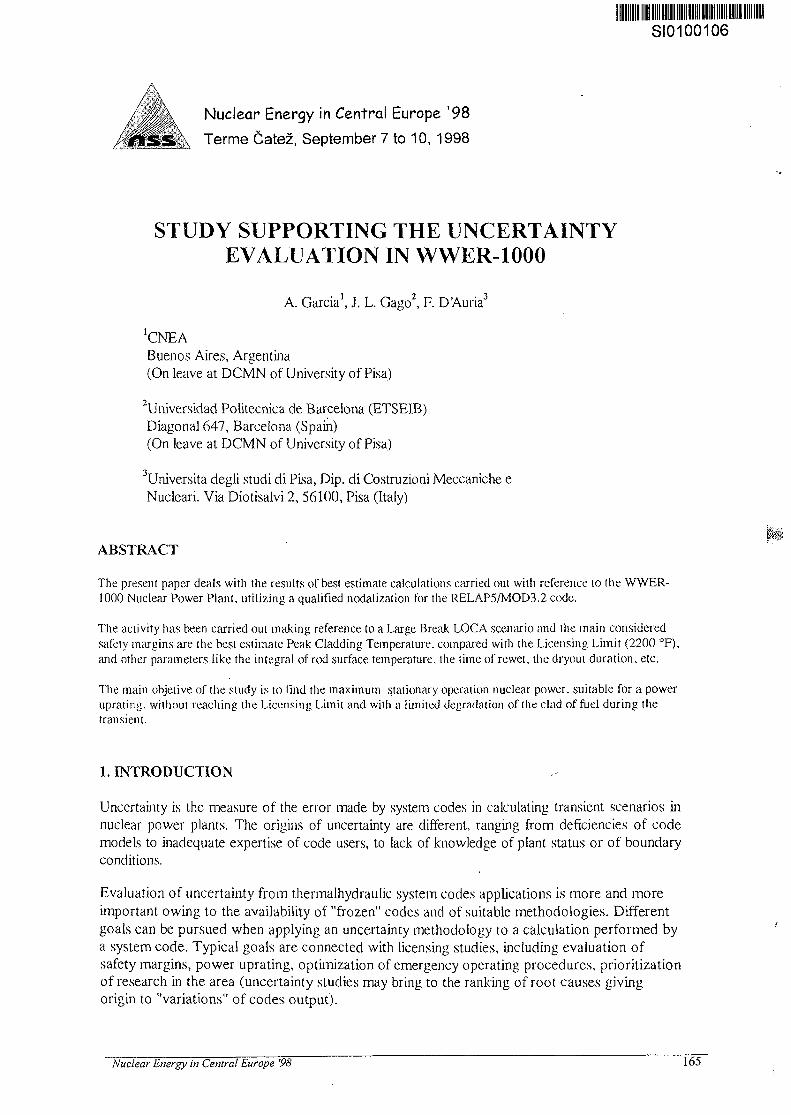
SI0100106
Nuclear Energy in Central Europe '98
Terme Catez, September 7 to 10, 1998
STUDY SUPPORTING THE UNCERTAINTYEVALUATION IN WWER-1000
A. Garcia1, J. L. Gago2, F. D'Auria3
'CNEABuenos Aires, Argentina(On leave at DCMN of University of Pisa)
2Universidad Politecnica de Barcelona (ETSEIB)Diagonal 647, Barcelona (Spain)(On leave at DCMN of University of Pisa)
3Universita degli studi di Pisa, Dip. di Costruzioni Meccaniche eNuclear! Via Diotisalvi 2, 56100, Pisa (Italy)
ABSTRACT
The present paper deals with the results of best estimate calculations carried out with reference to the WWER-1000 Nuclear Power Plant, utilizing a qualified nodalization for the RELAP5/MOD3.2 code.
The activity has been carried out making reference to a Large Break LOCA scenario and the main consideredsafety margins are the best estimate Peak Cladding Temperature, compared with the Licensing Limit (2200 °F).and other parameters like the integral of rod surface temperature, the time of rewet, the dryout duration, etc.
The main objetive of the study is to find the maximum stationary operation nuclear power, suitable for a poweruprating. without reaching the Licensing Limit and with a limited degradation of the clad of fuel during thetransient.
1. INTRODUCTION
Uncertainty is the measure of the error made by system codes in calculating transient scenarios innuclear power plants. The origins of uncertainty are different, ranging from deficiencies of codemodels to inadequate expertise of code users, to lack of knowledge of plant status or of boundaryconditions.
Evaluation of uncertainty from thermalhydraulic system codes applications is more and moreimportant owing to the availability of "frozen" codes and of suitable methodologies. Differentgoals can be pursued when applying an uncertainty methodology to a calculation performed bya system code, Typical goals are connected with licensing studies, including evaluation ofsafety margins, power uprating, optimization of emergency operating procedures, prioritizationof research in the area (uncertainty studies may bring to the ranking of root causes givingorigin to "variations" of codes output).
Nuclear Energy in Central Europe '98 165

From the industry point of view, or having in mind the feedback of research activities upon thecurrent technology, an advantage from uncertainty evaluation may outcome from the possibility ofquantifying the safety margins. On this basis, power uprating of the concerned nuclear power plantcan be proposed, thus getting an economic gain from the investments in researches finalized tocodes optimization and uncertainty methodologies development.
A critical step in the process is constituted by the demonstration of the "in-principle" existence ofsuch safety margins. In the above framework, the objective of the present paper is to show theexistence of safety margins that may justify detailed uncertainties studies finalized to the poweruprating of the plant.
Reference is made, in the present paper, to a WWER-1000 Nuclear Power Plant, Kozloduy-5installed in Bulgaria, in relation to which a qualified nodalization for the RELAP5/MOD3.2 code isavailable at Dipartimento di Costruzioni Meccaniche e Nucleari (DCMN) of University of Pisa;however, the adopted procedure can be considered as more general and extended to other reactortypes.
2. OUTLINE OF THE WWER-1000 PLANT
WWER-1000 is the Russian designed PWR. The engineered safety features are very similar to thoseavailable in a PWR of western design, including low and high pressure emergency core coolingsystems and accumulators. The Kozloduy-5 WWER-1000/320 plant basically consists of(references [1] to [4]):
• a pressurized water reactor vessel of 3000 MWt rated power with 163 hexagonal fuelassemblies, wich are open (ventilated type) to permit cross flows among the bundles. Thefuel is UO2 iii annular pellet form, clad is zirconium-niobium alloy. There are 10 banks ofcontrol rods without fuel followers, located in 61 fuel assemblies (Figs. 1-2);
• four primary loops (Fig. 3) equipped with horizontal tubes steam generators (Fig. 4) andmain circulation pumps of centrifugal type;
• one turbogenerator with 1500 rpm and l(X)0 MW electric power;
• an emergency core cooling system including three independent active systems, e.g. 3 HPIpumps, 3 LPI pumps and 4 accumulators (SIT= Safety Injection Tank);
• two independent feedwater loops include a turbine driven pump and piping connecting thefeedwater line to four different locations in each steam generator; several valves are part ofthe system.
All the elements of the primary circuit are located in a steel-lined, cylindrical, prostressed concrete •containment vessel (Fig. 5).
Almost all the components and systems including the overall layout are very similar between theWWER-IOOO and Western PWR. An important difference is represented by steam generators. Theprimary side essentially consists of a hot vertical collector and a cold vertical collector, connectedeach other by 11000 horizontal tubes. The secondary side essentially consists of a large cylindrical
Nuclear Energy in Central Europe '98

vessel (containing about 40 tons of fluid) with horizontal axis The vessel iswith a steam collector. s connected at the top
FIG 1 - Reactor Pressure Vessel
m mi
'IB
I;I i
mm
FIG 2 - Fuel Assembly
FIG 3 - Primary' System
•1-reactor pressure vessel; 2-sleam generator;3-primary coolan! pump; 4-pressurizer; 5-quench tank;
6-emergency core cooling accumulators
-k_A_-i—ii__4_k.
t
I I
FIG 4 - Steam Generator
FIG 5 - Containment
rgy m Central Europe '98167

3. RELAP5/MOD3.2 NODAUZATION
A detailed nodalization was developed in the past at DCMN for RELAP5/MOD3.2 code,considering the guidelines of the code User Manual and the criteria in reference [5]. The sketch ofthe noding scheme, joined with information about adopted code resources, can be seen in Figure 6.
RELAP5/MOD3.2 is the well known code made available by the United States Nuclear RegulatoryCommission (US NRC) and qualified on an international basis; the code is widely used at DCMN.
The adopted nodalization has been qualified considering a specific procedure including a "steady-state" and an "on-transient" step. In relation to both the steps, quantitative criteria are utilized toshow the quality level of the nodalization; in particular, operational transients and "Kv-scaled"calculations have been adopted in the frame of the "on-transient" qualification. The qualification ofthe nodalization is discussed in detail in the reference [6].
This qualified nodalization has been used in the present work, with minor modifications in the inputdeck, to simulate the state of the plant at several initial nuclear powers.
The heat structure representative of the core is divided in this model in 3 substructures: central,middle, and peripherical. The present work has used the data of the central structure due to his greatcontribution to total heat, and consequently, the higher cladding temperatures during the analizedtransient.
PARAMETER
NODESJUNCTIONSHEAT STRUCTURES
MESH POINTSCORE ACTIVESTRUCTURES
NPPKOZLODUY
1102HAS1028
559042
FIG 6 - Noding scheme for RELAPS/MOD3.2
168 Nuclear Energy in Central Europe '98

4. NODALIZATION APPLICATION. MAIN RESULTS
The activity has been carried out making reference to a Large Break LOCA originated by a doubleended break in the cold leg with emergency systems in operation at the design conditions.
The main considered safety margin is the difference between the best estimate Peak CladdingTemperature (PCT) and the licensing limit. Additional safety related parameters have beenconsidered in the analysis like:
• dryout duration,the integral of rod surface temperature during a selected time window into the transient,time of rewetting.
Several calculations have been repeated by changing the core power in a range between 50% and150% of the nominal value. The consideration of the value of the mentioned safety parameters as afunction of the core power allows the answer to the question whether a sophisticate uncertaintyevaluation is reasonable from the industry point of view: in other words, and as an example, if PCTreaches the licensing limit at initial power values, slightly larger than nominal values, then a posiblepower uprating of the plant may not be allowed and research investements finalized to this goal maybe useless. The opposite is true if PCT does not reach the licensing limit at high values of corepower.
In the Fig. 7 is shown the relation between the cladding temperature and the nuclear power insteady-state condition. The evolution of the surface cladding temperature for the central core node[the node with the higher relative power] and for several powers between 50% and 150% areshown in Fig. 8. The 2™ Peak Cladding Temperature appears only at power higher than 125%approximately. In the Fig. 7 is shown the relation between the cladding temperature and the nuclearpower in steady-state condition.
The Ist Peak Cladding Temperatures for several power values are shown in Fig. 9. The figureclearly shows that the 1st PCT is higher at highers initial powers. The time of maximum isapproximately constant with the power, and occurs approximately 5 seconds after the transientstart.
In the Fig. 10 the relation between the I9 PCT and the power is shown for three levels of the core:top, middle and bottom. The relation is practically linear in the investigated range of power.
The times of Is1 PCT and 2nd PCT, the total dryout duration and the rewet time are shown in Figs.11 and 12.
The trend as a function of power of initial cladding temperatures, worst Is1 PCT and 2n PCTcompared with two Supposed Begin of Oxidation (SBO) limits (700 °C and 800 °C) and thelicensing limit are shown in Fig. 13.
The integral of rod surface temperature is shown in Fig. 14. This value has been obtained in three
Nuclear Energy in Central Europe '98 169

ROD SURFACE TEMPERATURES - BEGINNING OF TRANSIENT
50 &0 70 80 90 100 110 120 130 140 150
FIG 7.- ROD SURFACE TEMPERATURES ATTHE START OF TRANSIENT vs POWER
1600
1400
1200
1000
BOO
600
400
ROD SURFACE TEMPERATURES (NODE 7) *:c< F-0501SEVERAL POWERS " ! ' P0601
WER-1000 L8LOCA f ^ ^ J j |AAA P090t
0 100. 200. 3O0. 400. 500. 600. 7O0. 800. 900. 1000. 1100.
Time (9)
FIG 8.-ROD SURFACE TEMPERATURES EVOLUTIONFOR SEVERAL INITIAL POWERS
ROD SURFACE TEMPERATURE - 1ST PCT
RO0 SURFACE TEMPERATURES (1ST PCT) .SEVERAL POWERSVVER-1000 LBLOCA
" • ' * • ' '
zzr
ww; J iOCOsssBBbCCCCDC
^ i >
:OGH
•-'.•.OH
I'JCM'.J(;H
TEMP
IEWP
TEMPTcM^VEWPTEMf-TEMPTEMP
cCICO?
^01007SDI007&01M7901007S01007&010079U10O7
SO.O 95.0 100.0 105.0 110.0 115.0 120.0 125.0 130.0 1JS.0 140.0 145.0 150.0
Timofs)
FIG 9.- 1" PEAK CLADDING TEMPERATUREFOR SEVERAL INITIAL POWERS
1600.0
1400.0
— 1200.0
z>< 1000.0o:o.
S 800.0
600.0
400.0
1i1 '
I
i
P—' — * * .
60 60 70 80 K> 100 '10 120 130 140 1S&
POWER (%1
FIG 10.- 1" PEAK CLADDING TEMPERATUREvs INITIAL POWER (3 AXIAL CORE LEVELS)
TIMES OF MAXIMUM PCT'S DRYOUT ANO SEWET TIME
400.0 -
250.0
200.0
1S0.0
50.0
if
i
/
/
j1
/ iS
i1
t
iSO &0 70 80 90 !00 110 120 130 140 ISO
POWER (%(
— « TIME 1ST PCT — • TIME 2ND BCT
50 60 70 80 90 120 130 140 150
POWER (XI
-ORVOV'T DURAltON
FIG 11.- TIMES OF l" AND 2nd PEAK CLADDINGTEMPERATURE FOR SEVERAL INITIAL POWERS FIG 12.- TIMES OF DRYOUT AND REWET
FOR SEVERAL INITIAL POWERS
170 Nuclear Energy in Centra! Europe '98

ABSOLUTE MAXIMUM TEMPERATUREINTEGRAL ROD SURFACE TEMPERATURE
I
600.0 |
400 0
- . _ . - - ?***
" T— 1 —
- -/
(-—•
A
/ -
1 1
i
- - !
I\i
Ul — . . _ , . _ . . —
50 60
- •
- *
70 80
—:N1TIA>.
-2NC- PCT
s a o rooc
30 100 110POWER (SI
1
-
120 130 140
H- 1ST PCr
- —LICENSING UMH
— »3 8 O 8GCC
160
looo.oo
IOO.OO
10.00
1RAMGE OF ITTEREST DrORAPOViXStrpRATX M
Tr
\i—*
60 60 70 80 90 100 110 120 130 140 150
POWER (%)
-CONT o>:-~*:<
FIG 13.-1" PEAK, 2nd PEAK AXD INITIAL TEMPERATUREvs POWER FOR SEVERAL INITIAL POWERS
FIG 14.- INTEGRAL OF CLAD TEMPERATURESvs INITIAL POWER
obtaining of the cladding temperatures evolution of all axial nodes for a given initial nuclearpower;integrating the above curves for temperatures higher than the Supposed Begin of Oxidationlimit (700 °C and 800 °C in this work);calculating the relative nondimensional value of the integral taking as base the 100% powervalue.
Those values are compared with the value obtained by the method developed in the ref [7]. Thismethod takes into account the activation energy, for the oxidation reaction, by evaluating thethickness of the oxide layer of the clad. The results indicate that the integral of claddingtemperature Ls a good indicator of the clad degradation due to the oxidation during the LBLOCAtransient.
5. CONCLUSIONS
A qualified WWER-IOOO plant nodalization suitable for RELAP5/MOD3.2 code, which wasdeveloped and qualified at Dipartimento di Costruzioni Meccaniche e Nucleari (DCMN) ofUniversity of Pisa [6], has been used to complete a study supporting the uncertainty evaluation inWWER-1000 NPP.
The selected analysis made reference to a Large Break LOCA, originated by a double ended breakin the cold leg, with emergency systems in operation at the design conditions. The main outputparameters were the evolution of cladding temperatures, the Peak Cladding Temperatures, theintegral of rod surface temperature and times of rewetting.
The analysis of this transient, at selected initial powers, led to the following main results:
achievement of the relation between nuclear power and clad surface temperature in steady-state condition;
Nuclear Energy in Central Europe '98 171
• achievement of the relation between the initial nuclear power and the worst first PeakCladding Temperature (Is1 PCT). In the figures 10 and 14 the almost linear relationbetween the two quantities can be seen. The Licensing Limit (1470 °K) is only reachedat power higher than 140% of nominal power;the second Peak Cladding Temperature, following the initial early rewetting, only appearsat power higher than 125% approximately. This second peak, and its temporal duration(long dryout), cause a higher degradation of the clad due to a higher oxidation;operating the reactor in the range between 100% to 130% only increases the oxidation ofthe clad during the transient for a factor between 2-4 relative to the oxidation at the 100%of power. This is the range for a suitable power uprating of the nuclear power plant. Atpower higher than 130% the degradation becomes very high [until 100 times the oxidationat 100%] and the cladding temperature reaches the licensing limit.
The achieved conclusions can be supported by a proper uncertainty analysis (e.g. adopting themethodology at ref. fH'j); a better knowledge of all relevant input conditions and the study of thesame transients assuming different operation configuration of the safety systems (LPI,accumulators...) would also improve the realibility of the results.
REFERENCES
[1] Kolev N.P., Tomov E., Ovchatova I., Angelov D.K."Kozloduy Nuclear Plant Analyzer. Specification of a WWER-1000 reference plant forNPA modelling Purposes"Energoproekt Report, Sofia (BG), 1992
[2] Hinovsky I."Personal communication to F. D'Auria"Sofia, March and June 1995
[3] US DOE"Overall Plant Design Descriptions WWER"DOE/NE-0084, rev. 1, Washington (US), 1987
[4] Gatta P., Mastrantonio L."Thesis in Nuclear Engineering"Universita di Roma "La Sapienza", 1995
[5] Bonuccelli M , D'Auria F., Debrecin N., Galassi G.M."A methodology for the qualification of thermalhudraulic codes nodalizations" NURETH-6Conf., Grenoble (F) - Oct. 5-8, 1993
[61 Aprile G., D'Auria R, Frogheri M., Galassi G.M."Application of a qualified WWER-1000 plant nodalization for RELAP5/MOD3.2computer code". International Conference. Opatija, Croatia, 1996
[7] "RELAP5/MOD3 Code Manual". Vol 1. NUREG/CR-5535. INEL-95/0174U.S. Nuclear Regulatory Commission.
[8] D'Auria R, Debrecin N., Galassi G.M."Outline of the Uncertainty Methodology based on Accuracy Extrapolation (UMAE)"J. Nuclear Technology - Vol 109 nr. 1, 1995, pp. 21-38
._„ Nuclear Energy in Central Europe '98

SI0100107
Nuclear Energy in Central Europe '98
S \ Terme Catez, September 7 to 10, 1998
A 1 % COLD LEG SB LOCA TEST SIMULATION ON THE PMK-2 FACILITY
I.Parzer, S.PetelinInstitute "Jozef Stefan", Nuclear Engineering Division
Jamova 39, 1000 Ljubljana, Sloveniae-mail: [email protected], [email protected]
ABSTRACT
Several SB LOCA experiments have been conducted on the PMK-NVH and its succesor PMK-2 integral testfacility in about 10 years of operation. After 1993, when the last IAEA Standard Problem Exercise no.4 (SPE-4), a 7.4 % small break LOCA scenario simulation with no high pressure injection system available, severalother tests were performed on the PMK-2 integral test facility in Budapest. Among them in 1994,another SBLOCA experiment with 1 % break opening was performed. The analyses of the PMK-2 facility response, amodel of WER-440 nuclear power plant, have been performed using the MOD3.2.1.2 version of theRELAP5thermal-hydraulic computer code, to reasses the developed model for previous IAEA-SPE tests simulations.
INTRODUCTION
In mid 1980's the PMK-NVH integral test facility, a model of Hungarian Paks NPP, VVER-440 type, was constructed in Budapest. Later the International Atomic Energy Agency(IAEA) sponsored the conduction of some experiments and started an international researchprogram on safety of VVER-440 plants. Later in 1990's the facility has been upgraded,especially on the secondary side (steam and feedwater system) and given a new name PMK-2at this occasion. Most of the experiments performed on this facility were LOCA type, with thebreak located at the top of external reactor vessel downcomer. The addressed experiment [1]simulated a 1% SB LOCA scenario. The presented work deals with RELAP5 [2] simulationof the above SB LOCA case.
After several years of the SPE experiment analyses many problems have emerged and beenstudied. Main goals of these analyses were to study the adequate modelling of the hexagonal corechannel with 19-rod bundle and the phenomena during the core level depletion and uncovering.Some influencing parameters have been identified along the way, such as proper simulation ofmain coolant pump coastdown, regardless of the throttling valve calibration data and procedure.Some concern has also been given to the horizontal steam generator modelling, since it has beenrecognized as a deficiency of the RELAP5 code. Finally, the break model and location influenceto the transient course in the PMK-2 facility has been studied. Sensitivity studies were performedanalyzing the effect of some uncertain test parameters, as core geometry, safety injection watertemperature and possible secondary leaks.
PMK-2 FACILITY DESCRIPTION
PMK-2 is a 1:2070 volumetrically scaled down, full height (except for the lower plenum andpressurizer), full pressure and full scaled power integral test facility (Figure 1). On thesecondary side the steam/water ratio is kept as in the original VVER-440 plant. The referenceplant, Hungarian Paks NPP, has 6-loops, which are represented by a single lumped active
Nuclear Energy in Central Europe '98 173
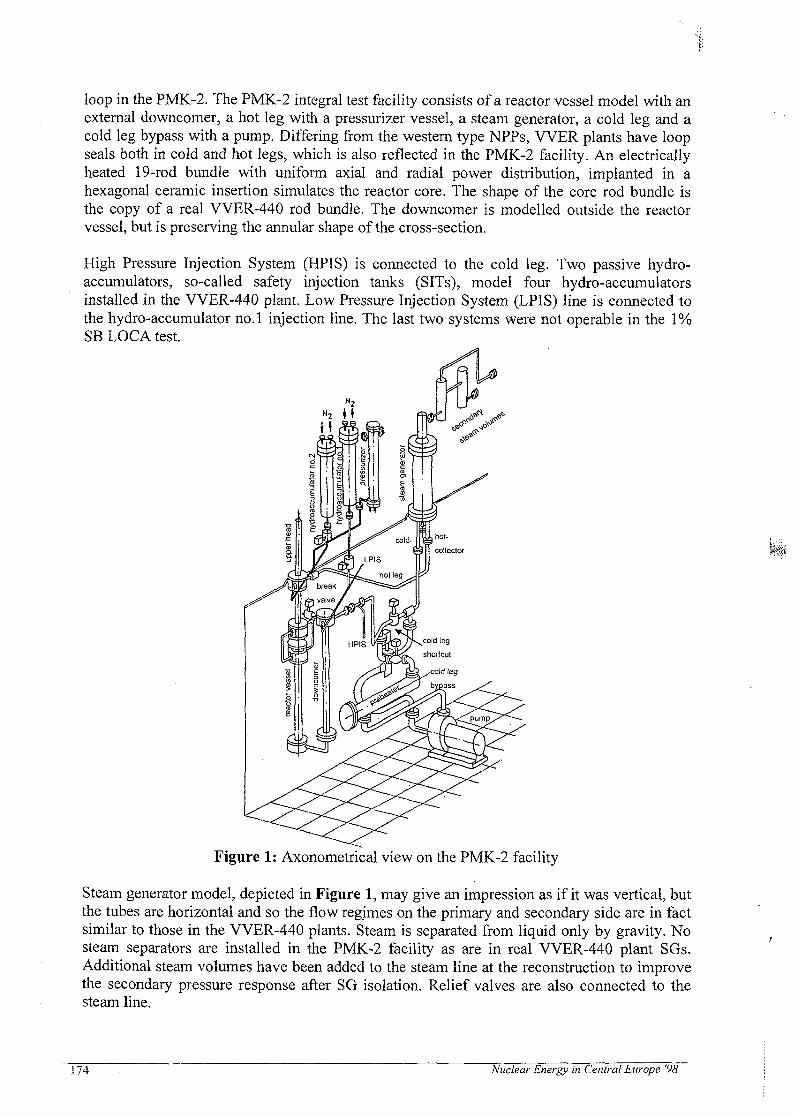
loop in the PMK-2. The PMK-2 integral test facility consists of a reactor vessel model with anexternal downcomer, a hot leg with a pressurizer vessel, a steam generator, a cold leg and acold leg bypass with a pump. Differing from the western type NPPs, VVER plants have loopseals both in cold and hot legs, which is also reflected in the PMK-2 facility. An electricallyheated 19-rod bundle with uniform axial and radial power distribution, implanted in ahexagonal ceramic insertion simulates the reactor core. The shape of the core rod bundle isthe copy of a real VVER-440 rod bundle. The downcomer is modelled outside the reactorvessel, but is preserving the annular shape of the cross-section.
High Pressure Injection System (HPIS) is connected to the cold leg. Two passive hydro-accumulators, so-called safety injection tanks (SITs), model four hydro-accumulatorsinstalled in the VVER-440 plant. Low Pressure Injection System (LPIS) line is connected tothe hydro-accumulator no.l injection line. The last two systems were not operable in the 1%SB LOCA test.
Figure 1: Axonometrical view on the PMK-2 facility
Steam generator model, depicted in Figure 1, may give an impression as if it was vertical, butthe tubes are horizontal and so the flow regimes on the primary and secondary side are in factsimilar to those in the VVER-440 plants. Steam is separated from liquid only by gravity. Nosteam separators are installed in the PMK-2 facility as are in real VVER-440 plant SGs.Additional steam volumes have been added to the steam line at the reconstruction to improvethe secondary pressure response after SG isolation. Relief valves are also connected to thesteam line.
174 Nuclear Energy in Central Europe '98

EXPERIMENT DESCRIPTION
The experiment started from full scaled-down power and primary loop flow at nominalprimary and secondary pressure. In the 1% SB LOCA test the secondary liquid level wasrelatively low, compared to other similar tests, so that the SG tubes were barely covered withsecondary liquid. The initial conditions for the test are given in Table I, where in the firstcolumn actual test conditions are presented, while values achieved after theRELAP5/MOD3.2.1.2 initialization process are listed in the second column.
All the parameters were matched closely by RELAP5, except for the primary temperatures,where certain discrepancies point at temperature measurement inaccuracy of about ± 1 K, asreported in the IAEA-SPE-4 test documentation [3].
The transient was initiated by opening the MV31 break valve at the top of the external reactorvessel downcomer. While here was an orifice with 3.2-mm diameter inserted in the break linefor the SPE-4 test, which corresponded to a 7.4% break in the original VVER-440 plant andfor the other test a 1 -mm orifice, corresponding to 1 % cold leg break. Steam generator wasisolated in the first few seconds of the transient by closing the PV22 valve. At the same timefeedwater flow to the SG was stopped closing the PV21 valve. These two actions, followingthe break opening, caused the further sequence of events, given in Table II in comparisonwith the calculated results.
Table I: Initial conditions for 1% SB LOCA
Parameter test RELAP5
Primary sidecore power (kW)primary press. (MPa)cold leg temp. (K)upp. plenum temp. (K)loop avg temp. (K)upper head temp.(K)pressurizer level (m)primary flow (kg/s)HPSI flow (kg/s)
658.12.43536.4562.549.2no data
1.075.10.014
658.12.43536.4561.3548.85534.(l>
1.075.10.014
Secondary sidesecondary pres. (MPa)FW flow (kg/s)FW temp. (K)SG level (m)
4.510.348496.21.52
4.5130.3475496.21.523
Table II: Setpoints&timings for 1% SB LOCA
Parameter
break openingsecondary sideisolationsecondary leakopening
reactor trip
HPIS start
pumpcoastdown
SG relief valveopens
SG relief valvecloses
setpoint
none
Pprim ^
11.59 MPaPprim *"-
11.59MpaPprim ^
11.07 MPaPsec<5.39 MPaPsec<4.96 MPa
timing (s)
test
0-0.1
0-4
-
65
65
74
41
150
R5
3
0-14
5
75
75
83
48
130(1) value based on previous (SPE) tests
FACILITY MODEL DEVELOPMENT
The hydrodynamic model consists of 101 volumes, connected with 104 junctions. There are102 heat structures with 408 mesh points attached to it. The 48 control variables and 14 tripsrepresent the measurement system and controls. The model has been gradually developedseveral years at US for the purpose of simulating the previous SPE experiments, especiallySPE-2, SPE-3 and SPE-4 [4, 5, 6]. System nodalization is presented in Figure 2.
Nuclear Energy in Central Europe '98 175

steam lineFW+EFW
hot legloop sealLPIS
pump
Figure 2: PMK-2 facility "base" case nodalization for RELAP5 analyses of 1% SB LOCA
RESULTS
It was previously shown in some IAEA-SPE-4 analyses [7, 8], that break vicinity nodalizationhas great impact on the transient course simulation. The main characteristics of thenodalization presented above, which was found to be the most adequate for the SPE-4modelling, is that the downcomer top volume is split into two vertical volumes. All theconnections (cold leg, accumulators and the break) are connected to the bottom volume, whilethe top part of the downcomer collects some small amount of vapor which is generated inRELAP5 calculation during the hydro-accumulator discharge period, but was not observed inthe SPE-4 experiment. This nodalization successfully prevented vapour entrainment into thebreak line before the cold leg loop seal clearing. It will further be addressed as "base" casenodalization. Meanwhile, the other nodalization, denoted here as "one vol.", could not satisfySPE-4 experiment observations and break flow was obviously not predicted very well duringthe hydroaccumulator injection period. This nodalization is characterized by only one volumeat the downcomer top region and the break valve connected directly into it without aconnection pipe.
For the SB LOCA experiments conducted on the PMK-2 facility the following crucialparameters have been identified and tuned according to the experimental data to minimize theuncertainty of the simulation. The pump coastdown simulation and secondary pressure tuningwere shown to be the most important ones. To match the secondary pressure developmentsatisfactorily, certain amount of leak was introduced into the RELAP5 input model. Thisshowed to be very helpful for matching many of the transient parameters closely.
176 Nuclear Energy in Central Europe '98

On the opposite of expectations and experience from the SB LOCA simulations, the "base"case nodalization did not bring any considerable benefit to the 1 % SB LOCA simulation. Inthis case no hydroaccumulators were available and the phenomena in the downcomer topregion were not as complicated as in the SPE-4 test. In this experiment some small amount ofvapor must have been entering the break line even before the cold leg loop seal clearing. Forthe 1 % SB LOCA test RELAP5 would even not allow any vapor to be generated at the breaklocation, which resulted in slight break flow overprediction during the whole transient, as canbe seen on Figure 3.
120
100
O)
(0
v>CO
E
80
60
40
20
1000 2000time (s)
Figure 3: Integrated break mass flow
3000 4000
Certain secondary leak, not identified after the SG isolation in the experiment, was introducedaccording to previous experience so that the secondary pressure could be matched moreclosely by RELAP5 (Figure 4). The possible cause could be incomplete closing of the mainsteam isolationn valve PV22.
5.7
5.5
CO
| 5.1
§4.72 4.5Q.
4.3
4.1
3.9
{•—EXP base -one-vol. |
0 1000 2000time (s)
Figure 4: Secondary pressure
3000 4000
Nuclear Energy in Central Europe '98 Ml

Beside the break flow development and secondary system response, loop seal phenomena arevery important in the case of any SB LOCA simulation with RELAP5. Figure 5 shows thathot leg loop seal was started emptying too early in both RELAP5 calculations, but still thedynamics of the phenomena was caught satisfactorily. Some discrepancies from experimentaldata after 150 s origin from smaller pump miss-behaviour at the end of coastdown, which isnot considered to be very important. More differences come from overprediction of reactorvessel downcomer level, which is not shown here. Experimental data show emptying ofreactor vessel downcomer already after 500 s, with short recovery interval around 1000 s,while RELAP5 could empty the downcomer only after 2000 s. This then reflected on hot legloop seal level underprediction.
8
? 7 -oI 6 '
\ x collector',|/\ side
— EXPbasecne-vol.
5
4 40
reactorside
1000 2000 3000time (s)
Figure 5: Hot leg loop seal levels
4000
The mentioned differences also reflect in cold leg loop seal prediction, but only after 2000 s,when the cold leg loop seal clearance occurred and the reactor vessel downcomer was partlycleared. While in the "base" case the cold leg loop seal was cleared very deeply, theexperimental data showed incomplete clearance and in the "one vol." calculation even lessliquid was ejected from the cold leg loop seal (Figure 6).
6collectorside
— EXPbaseone-vol.
reactorside
0 1000 2000 3000time (s)
Figure 6: Cold leg loop seal levels
4000
178 Nuclear Energy in Central Europe '98

In the case of 1 % SB LOCA where there was no cold hydro-accumulator water entering thehot leg, so loop seal clearing was predicted relatively more successfully by RELAP5 than insome other SB LOCA simulations at the PMK-2 facility. Quite surprisingly it showed that the"one vol." nodalization performed even better and the reactor vessel level was predictedalmost perfectly for this case, as can be seen on Figure 7. Experiment even showed that morevapor was entering the break before cold loop seal clearing. If this could be achieved in any ofRELAP5 calculations, primary liquid distribution would be matched even better.
9
8
7
I6
I54
3
• \
— EXP base one-vol.
\
1000 2000time (s)
Figure 7: Reactor vessel level
3000 4000
Since the lowest reactor vessel level was predicted almost at the same time in bothcalculations, the predicted core heatup, shown in Figure 8, was almost the same, but muchlower in magnitude than in the experiment. This was expected due to the known deficiency ofRELAP5 correlations for interphase drag and phase separation. It has been observed in manyother SB LOCA simulations that RELAP5 predicted core dryout occurrence at much lowercollapsed level than the measurement data have indicated.
700
600oa.
I 550
500
I — EXP
" « • .
base one vol.
1000 2000time (s)
Figure 8: Core temperature
3000 4000
Nuclear Energy in Central Europe '98 179

CONCLUSIONS
Some tuning of various parameters has been done, but all within the acceptable limits andphysically consistent assumptions. RELAP5 models for different phenomena are proven to becomplete and robust enough, that specific VVER plant features could be modelled in detail.
Hot and clod leg loop seal clearing was predicted satisfactorily in the absence ofhydroaccumulator injection, since cold water did not enter hot leg in a larger amount.
On the other hand the 1 % SB LOCA test simulation showed some other RELAP5deficiencies. It can be concluded, that the phenomena in the downcomer top region are verycomplicated during a SB LOCA process, especially if hydro-accumulator injection isactivated. With only small amount of HPSI water entering the external reactor vesseldowncomer, the simpler "one vol." break nodalization performed equally or even better thanthe more complicated "base" case one. The real phenomena at the PMK-2 facility areprobably 2-dimensional or even strictly 3-dimensional when hydro-accumulators inject theircold water in the downcomer and upper plenum. It is therefore beyond the capabilities ofRELAP5 code to predict these phenomena correctly.
Besides, opposite of the expectations, it appears that the results of this calculations do notsuffer from great user impact in choosing the proper break nodalization. On top of that thelocation of the break at the PMK-2 facility seems to give case-dependent results in RELAP5predictions, depending on whether hydro-accumulators are available in a certain SB LOCAtest or not.
REFERENCES
[1] Gy.Ezsol, A.Guba, L.Perneczky, H.M.Prasser, F.Schafer and E.Krepper: 1% Cold legbreak experiment on PMK-2, Test results and computer code analysis, FZR-76,Rossendorf, March 1995.
[2] RELAP5 Code Development Team: RELAP5/MOD3 Code Manual, NUREG/CR-5535,INEL-95/0174 (Formerly EGG-2596), June 1995.
[3] Simulation of a Loss of Coolant Accident without High Pressure Injection but withSecondary Feed and Bleed, IAEA-TECDOC-848, Vienna, 1995.
[4] I.Parzer, B.Mavko, S.Petelin: Simulation of SB LOCA in a VVER-440 Model,Transactions of ANS, 66 (1992) pp.619.
[5] I.Parzer, B.Mavko, S.Petelin: An Overview over IAEA Standard Problem ExperimentSimulations, Proceedings of NURETH-5, Vol.5, pp.1348, Salt Lake City, September1992.
[6] B.Mavko, I.Parzer, S.Petelin: A Modelling Study of the PMK-NVH Integral Test Facility,Nuclear Technology 105 (1994) 2, pp.231-252.
[7] I.Parzer, S.Petelin: RELAP5 Parametric Analysis of the PMK-2 SPE-4 Experiment,ICONE-6, San Diego, May 10-15, 1998.
[8] S.Petelin, I.Parzer: Break Nodalization Influence to IAEA-SPE-4 Test Simulation, Int.Conf. Nuclear Option in Countries with Small and Medium Electricity Grids, Dubrovnik,Croatia, June 15-18, 1998.
180 • Nuclear Energy in Central Europe'98

SI0100108
Nuclear Energy in Central Europe '98
Terme Catez, September 7 to 10, 1998
A potential of boiling water power reactorswith a natural circulation of a coolant
Osmachkin V.S., Sokolov IN.,Russian Research Center "Kurchatov Institute", Moscow
e- mail [email protected]
AbstractThe use of the natural circulation of coolant in the boiling water reactors simplifies a reactor
control and facilitates the service of the equipment components. The moderated core powerloads allow the long fuel burnup, good controll ability and large water stock set up theenhancement of safety level. That is considered to be very important for isolated regions orsmall countries.
In the paper a high safety level and effectiveness of BWRs with natural circulation arereviewed. The limitations of flow stability and protection measures are being discussed. Somerecent efforts in designing of such reactors are described.
1. Introduction
On the end of the 20th century the nuclear community is being faced with unexpecteddifficulties in the spreading of the nuclear energy. A gas industry expansion and some knownaccidents at NPPs have influenced on the progress in this area of power engineering. Asituation in a development of the NPPs could be called a stagnation. Only in the far east thereare remarkable activities on a construction of NPPs.
There is no doubt among the knowledgeable experts, that in long-term expectations nuclearpower plants are sufficiently safe, economically effective and can be considered as a sustainablepower supply. In Europe the "gas pause" could be used for detailed analyse of the alternativesand for choosing the proper reactor type for national energy supply.
The dates of latest design activities show that the Boiling Water Reactors with naturalcirculation of the coolant (BWR-NC) are reliable and economically attractive power sources. Itcould be understood that in the state with the permanent budget deficit the BWR-NC could beconsidered as possible basis for nuclear power stations. It is thought that such reactors are thebest choice among the various alternatives to get proper safety level of NPP with the moderateexpenses.
2. Boiling Water Reactors in the world
For a long time many countries are using the boiling water reactors for energy production.Comparing to the PWRs have such reactors lower operating pressure in the vessel, lowernumber of heavy components, smaller volumes of the technological premises and consequently,less capital and operational expenses.
Nuclear Energy in Central Europe '98 ' °'

In the beginning of 1997 there were 94 BWRs in operation among 433 nuclear power units.A successful operation of BWRs has proved, that the principle of the direct cycle did notcreate significant difficulties for services of the equipment, while the stability and vaporradioactivity problems are being overestimated. All these features allow constructing theBWRs with electrical power up to 1350 MWe. ABWRs successfully operate in Japan [1]. It isappropriate to mention some modern activities in Germany to design a reactor SWR 1000 [2].
Among the measures to improve the safety the recommendations considering thesimplification of the systems occupy the important place. The use of natural circulation of thewater in the reactor vessel creates a new level of the reactor control simplification. It alsofacilitates the service of the equipment components and enhances the safety of the plant. Themoderate core power loads allow the long fuel burnup. A good controll ability and large waterstock set up the improvement of safety level. That is considered as a very important feature ofNPPs for isolated regions or small countries. Current information shows a definite interest ofthe reactor designers for BWRs with natural circulation of the coolant. It is well known, thatsince 1982 a Simplified Boiling Water Reactor (SBWR) with electric capacity 670 MWe isbeing developed by "General Electric" in USA [3].
The SBWR makes extensive use of passive features and simplified systems to produce cost-saving advantages. Key design features of SBWR includes the systems for depressurization andpressure suppression, gravity driven cooling system and other features, that rely on gravity orstored energy to ensure core cooling, decay heat removal and ATWS mitigation.
On the International Conference TOPNUX-96, Paris, France this company has presentedvery detailed reports about the project of the European Simplified Boiling Water Reactor(ESBWR) [4], which was designed to meet the requirements for new NPPs to be built inEurope. The main design features of that ESBWR 1190 MWe (net) plant are as follows:
a) Simplicity achieved by use of natural circulation and passive safety systems,b) Improved plant economics - by reduction of systems and buildings, by use of
reliable systems and standard components from operating BWRs,c) Enhanced safety - by passive safety and diverse non-safety systems.
The technical characteristics of SBWR, ESBWR and ABWR are summarized in Table 1.
Table 1: Technical Data of reactorsPlantsPower [MWth]Net Electrical Output [MWe]Vessel-diameter,
height [m]Power density [kW/m]Core height [m]Equivalent diameter [m]No. control rods drivesCirculationNo. of BundlesVessel pressure, [MPa]
SBWR20006706,024,541,52,744,73177
Natural7327,17
ESBWR361311907,124,9482,745,9269
. Natural11327,17
ABWR392613567,121,1513,715,4205
Forced8727,17
182 Nuclear Energy in Central Europe '98

In Russia a development of the BWRs led to the construction of the RBMK reactors. AChernobyl accident stopped their story. The only Boiling Light- Water moderated and cooledreactor which is being successfully operated since 1965, is the VK-50, located inDimitrovgrad, Ulianovsk region [5].
A similar boiling reactor with NC was a Dodewaard reactor in Netherlands that has beenconstructed roughly same time [6], however it is now closed after 29 years of successfuloperation.
Broad experimental activities in various areas of reactor technology, good result gatheredduring the operation of these and other reactors with direct cycle have proved the prospects ofBWR-NC types. Recently the development of reactor VK-300 has been initiated in Russia [7].
Table 2: Technical Data of some reactors with natural circulationPlants
Power [MWth]Net Electrical Output [MWe]Vessel- diameter [m]Height [m]Power density [MW/1]Core height [m]Equivalent diameter [m]No. of control rod drivesCirculationNo. of BundlesVessel pressure [Mpa]
VK-50250503,811,241,52,02,831
Natural18710,0
Dodewaard163,4502,79412,0936,31,7931,78837Natural1567,15
VK-3009003004,5812,428,03,53,490Natural1517,0
3. Features of the BWRs with natural circulation
3.1 StabilityA problem of the nuclear-coupled instability has been a major concern since the early stage
of BWR development. In US Code of Federal Regulations (10 CFR 50, Appendix A) amongcriteria for protection core there is Criterion 12- "Suppression of reactor power oscillations",which has to be met during design and operation of NPPs.
An extensive program of experiments has been carried out in USA and other countries todisclose the nature of that phenomenon. Nevertheless in some cases the real instability ofevents has been observed under the operation of NPPs ( for example, power oscillations atLaSalle NPP in March 1988 [ 8 ] ) .
It was discovered that there are neutronic, thermo-hydraulic and acoustic types of theinstabilities, which resulted from lags in the feedback links between power, flowrate and liquiddensity. Those instabilities influenced on reactivity between the driving forces and flowrate.Indeed, the coolant density oscillations are creating the local disturbances in neutronmultiplication and driving forces, which influenced delayed power change and flowrates. Theconsequence is the change of coolant density.
There are two possibilities for analyzing the unstability phenomenon- the numericalinvestigation of the system models on the digital computers and semi-analytical considerationof simplified models. In the latter case a linear stability analysis is being used to determine thethreshold of oscillatory behavior of the boiling reactor [9, 10].
Nuclear Energy in Central Europe '98 183

In linear analysis interactions of the parameters are described in the terms of transferfunctions. In this case transfer function describes the response of the reactor power as afunction of small harmonic disturbances of the external reactivity. It was shown that theneutron dynamics of the reactors with feedback could be described by differential equations ofpoint neutronic kinetic,
, d N , ^ V ^ , n dCi'—,— = {p - P)h' + £ A ,<~ j —L=-X.C. + B.N
dt , dt i i H<
with reactivity calculated as
P(t) = Pin- Pfl, , pft= Sk Pftkd
Pfbk = £P^fk\N{l')Fk{t_{)dt;
where are:
Pin - external disturbances of the reactivity,Pfbk- feedback reactivity from k-th parameter (temperature of the fuel, average void fraction
and others),Fk(t)=fk (t,N)- time response of parameter fk on power changes.
After linearization and Laplace-transformation, this system can be presented as an algebraicalequation
s [1 +Sj pi/(s+Xi)]5N*/N=Spin*- Sk (3p/dfk) fk F*k(s) SN*/N , where
kFk* }8N*/N =8pin*,
where is Do= {s[l +2; p^s+Xj)]}"1 a transfer function of the reactor with zero power.
The transfer functions of the reactor with negative void-fraction feedback can be presentedby (with s=ico)
• = D ( uo ) =N Sn &P •1N o p •" 1 + D o ( ico ) -— <pF ( ico )
where is F*=(5cp*/ (p)[8N*/N]"1 a transfer function of the relative changes of the void fractionat changes of the power.
Usually function F* can be approximated by chain of three links. The condition of escapingfrom resonant instability can be approximatelly presented as
(1+ r/.v)(l + 7,5)0 + rhs)
184 Nuclear Energy in Central Europe '98

1
where are:
K=(l/f3)(dp/d(p) (p - vapor reactivity,tf - time constant of the fuel element,xs, xi, - subcooled and boiling transport times.
It is possible to show by using Routh-Hurwitz criterion, that a system will be stable, if
f Tf , b
A detailed analysis of neutronic unstability is being performed on the computers. An effectivecode for such actions has been developed in Kurchatov Institute [11].
In the VK-50 reactor an unstability threshold is determined as a point of vanishing of thedecrement of the noise correlation function.
Another problem is hydraulic instability of the natural circulation. Instability of flowrate canbe static and dynamic. It is known as "chugging" behavior of steam boilers, thermosyphons andother two- phase flow system with time lags between vapor production and flow rates.Theoretical analysis of such phenomena is presented in [9,12]. Recently a great attention isbeing paid for investigation of the nonlinear dynamics of the BWRs [13].
3.2 Radiation in the compartments.Specific feature of the direct cycle is using the steam, generated in the core, which get some
radioactivity of the oxygen. It is carrying fission products from fuel elements and somecorrosion products. A well-known measures like high quality of the fuel, cleaning up of thecoolant and degassing treatment of the steam, provide the acceptable radiation levels inworking halls of the NPPs. Radiation levels in some rooms of the VK-50 are presented in theTable 3.
Table 3: Intensity of the radiation near some equipment of the reactor VK-50Equipment Intensity of radiation, [mrem/h]
Pipeline on reactor outletStop valve of turbineLow pressure cylinderCondenser of turbineCondensate pumpFeedwater pump
during operation750-1000
35-10-4-2-15-
401567
20
on shut down9 - 131,8- 4,40,4- 0,80,7- 1,10,4- 1,10,6- 1,7
Doses of the irradiation on the personnel of VK-50 are within the permissible limits.
3.3 Purification of gas releases.On the VK-50 the very effective scheme of a burning of the hydrogen and a purification of
gas releases are developed and successfully tested during operation [14].
Nuclear Energy in Central Europe '98 185
3.4 Passive safety systemsModern trends in the development of the high safety level of the NPPs are embraced by the
simplification of the control systems, use of the natural forces for initiation of the protectionactions and by use of the passive systems for an accident control. All such ideas areimplemented in the projects of the BWR with NC. Practically new plants meet all safety criteriawith passive safety systems- passive inventory control, containment heat removal, fission
•product control and others.
3.5 In-vessel retention of the BWRs core in severe accident.Large water supply with the passive actuation in the case of emergency provides adequate
cooling of the fuel and ensures the core to be retained in the vessel. Important features of theBWR design in Russia are locations of the control rod drives on the cover of the reactor. Thismeans that on the low head of the reactor there are no connections, no nozzles, no chances forleakage. It could help to retentain the core melt in the reactor vessel in the case of severeaccident.
4. ConclusionBWRs with NC are rather good choice among the various alternatives to get acceptable
safety level of NPPs together with the moderate construction and operation expenses. Suchreactors could be considered as suitable alternative for reconstruction of the NPPs after thedecommissioning of PWRs.
5. References
1. Nuclear Europe 11-12/1989, NEW 1-2/1997 p. 43,2. Kerntechnik, v.61 (1996), N°. 5-6, p. 223-235,3. J.D. Durnan, SBWR, A simplified boiling water reactor, Nucl. Eng. Des., v. 109
(1988), p. 73-774. ESBWR- An Economic Passive Plant, Reprints of recent papers on ESBWR Design
and Technology, General Electric Nuclear Energy, September 19965. I.N.Sokolov et al, A paper N° 306 on Third UN Conference on Peaceful Uses of
Atomic Energy, Geneve, 19646. Directory of Nuclear Reactors, vol .VII, IAEA, Vienna, 19687. Atomnaia Energia (in Russian), Y.Mitjaev and oth., v.73, July 1992, (1992), p. 138. Nuclear Safety, vol 29, N° 3 July-September 1988, p.3569. Nuclear Reactor Dynamics (in Russian), Editor J.V. Shevelev, Energoizdat, Moscow,
1990,10. J.A.Thie, Dynamic Behavior of BWRs, ANL-5849, 1959,1 l.P.A. Leppick, A.A. Suslov, S.P. Pavlov, Code RUKKRETS-1,
Preprint IAE-3667/5, Moscow, 198212. P.M. Mitenkov, B.I. Motorov, E.A. Motorova, The stability of natural heat-mass
transfer (in Russian), Moscow, Atomizdat, 197613. Y.Lin, J.Lee, Chin Pan, Nucl.Eng. Design, v.179 (1998), p.31-4914. Atomic Energy Plants- 1989, (in Russian), V.M.Escherkin at all,
An Experience with UPAK on VK-50, p.97, Moscow, Energoizdat 1989
186 - Nuclear Energy in Central Europe '98

SI0100109
Nuclear Energy in Central Europe '98
Terme Catez, September 7 to 10, 1998
EXPERIENCES WITH RELAP5/MOD3.2.1.2 CODE VERSIONBY SIMULATION OF LOSS OF RESIDUAL HEAT REMOVAL
TYPE EXPERIMENTS FOR VVER-440-TYPE NPPs
L. PerneczkyKFKI Atomic Energy Research Institute
H-1525 Budapest, Hungary, P. O. Box 49Tel: +36-1-3959041 Fax: +36-1-3959293
email: [email protected]
ABSTRACT
Four different disturbances during midloop operation of VVER-440/V-213 type reactor have beensimulated by experiments in the Hungarian PMK-2 integral-type experimental facility at the KFKI-AEKI (Budapest). Main aims of this type of studies was the determination of the distribution ofcoolant and noncondensible, coolant temperatures, boiling in the core, etc.
Paper presents selected results of the computer modelling of three experiments performed by theRELAP5/MOD3.2.1.2 code. The comparison of test data and calculated results shows that with theINEL developmental code version it was possible to capture most of the important phenomena ofinterest.
1 INTRODUCTION
The loss of residual heat removal (LRHR) accident during midloop operation is one of thepressurised water reactor (PWR) accidents intensively studied in several research institutes inlast years ([1] - [5]).
In VVER-440/V-213 type NPPs during shutdown conditions two of the six loops are inoperation to remove the core fission product decay heat at reduced primary coolant level -down to 1.4 m above the centreline elevation of hot leg - in single-phase natural circulationheat transfer mode. The natural circulation is affected by the special features of the VVER-system, namely the loop seals in both the hot and cold legs, the horizontal design of the steamgenerator (SG) having vertical collectors on the primary side.
Some possible disturbances of this particular operation mode - called the midloop operation -have been simulated by experiments in the Hungarian PMK-2 integral-type experimentalfacility at the KFKI-AEKI (Budapest), a full pressure scaled down model of the primary, andpartly the secondary circuit of the Paks Nuclear Power Plant ([6] - [8]). The PMK-2 facilityhas a volume and power scaling of 1:2070, the ratio of elevations is 1:1 except for the lowerplenum and pressuriser. The six loops of the plant are modelled by a single active loop.
Main aim of this type of studies in case of different disturbances was the determination of thedistribution of coolant and noncondensible, coolant temperatures, boiling in the core, etc.
Nuclear Energy in Central Europe '98 187
• ' < • : •
Proper operator actions should be defined to prevent the possible core damage and provide thelong term cooling of the core.
In an earlier paper [9] one of the results of the PMK-2 experiments, namely the inadvertentisolation the operating SGs by closing of main isolation valves in the loop was presented withthe computer modelling performed by the RELAP5/MOD3.1 code. However, difficulties were•encountered in obtaining analytical results by RELAP5 code (numerical convergenceproblems, extremely small time-steps, very long CPU time).
In the second phase for the calculations the RELAP5/MOD3.2 [10] code was applied. Usingthe standard code version the runs failed again sooner or later caused by low pressureoscillations. Abortion first appears at the problem initiation, when low pressure low flowinitial conditions should be set up, then during the LRHR process simulation too.
After further efforts including discussion with the code developers on the code capability weget an assistance in framework of US-NRC CAMP project in form of an EMEL developmentalversion RELAP5/MOD3.2.1.2 of the code with special options, which are a collection ofmodelling improvements to minimise numerical sources of oscillations for low pressure two-phase flow simulations. The first use of this code version in the OECD-ISP38 activity ([11] -[14]) helped us to understand the main phenomena at the loss of RHRS during midloopoperation of a PWR. The gained experiences [15] were utilised at the analytical reproductionof the experiments forVVER-440 type reactor.
2 THE EXPERIMENTS
Four possible disturbances of this particular operation mode of VVER-440 reactor have beensimulated by six experiments in the Hungarian PMK-2 integral-type experimental facility. Themain information concerning the experiments is summarised in Table 1.
Initial conditions for the experiments are characterised by the data of FET test as follows:reduced reactor coolant level, 7.88 m (the centreline elevation of hot leg is 6.225 m); heaterrod power, 8.2 kW (1.2% of nominal); natural circulation flow in loop, 0.1 kg/s; temperatureincrease in the core, 18 K; feedwater temperature in SG secondary, 310 K. The reactor model,the pressuriser and the primary collectors of SG are open to keep the primary at atmosphericpressure.
After having obtained the stable natural circulation, the FET transient is initiated by closingthe model of the main isolation valve (MV11) in the loop at 1000 s of process time. Between1000 and 3000 s the temperature is increasing up to the saturation temperature and thedevelopment of pool boiling can be observed in the core. At 4500 s the MV11 valve isreopened and at about 5200 s the system is stabilising again at the initial conditions.
The GFK and GGF tests belong to closed reactor vessel, so the pressuriser was open only. Theinjection of noncondensible was fulfilled step by step until the appearance of. the naturalcirculation degradation. Before end of experiments the gas was let go.
In cases of cold water injection to hot leg (HVM) no characteristic changes of conditions wereobserved, therefore only the first tree experiments, namely the FET, GFK and GGF tests wereused for validation of RELAP5/MOD3.2.1.2.
188 • Nuclear Energy in Central Europe '98

Table 1.
LRHR TYPE EXPERIMENTS FOR WER-440-TYPE NPPs ON PMK-2
Ident. Initiating event Description Process time
FET Closing of the main Heat removal disturbance by stoppedisolation valve in cold leg natural circulation in opened reactor vessel 5200 s
GFK Nitrogen gas injection to Natural circulation disturbance by uncontrolledthe upper plenum nitrogen gas in the upper plenum after pressure test 6000 s
GGF Nitrogen gas injection to Natural circulation disturbance by presence ofthe SG collectors uncontrolled nitrogen gas in the SG collectors
injected through the air removal lines 7800 s
HVM Cold water injection in to the hot legHVM1 Cold water injection to hot leg correspond to one
HPIS pump capacity 1450 sHVM2 Cold water injection to hot leg correspond to two
HPIS pumps capacity 1400 sHVM3 Cold water injection to hot leg correspond to three
HPIS pumps capacity 1300s
LOSS OF RESIDUAL HEAT REMOVAL TYPE CALCULATIONSRELAP5 CODE VERSIONS
Table 2.
AGNES project
First PMK-2 experiment (FET)
Opened WER-440 type reactor
OECD-CNSI ISP38
Six PMK-2 experiment
1993
1994
1994
1995-19961996
REIAP5/MOD2.5/V251 S
RELAP5/MOD3.1
RELAP5/MOD3.1
RELAP5/MOD3.2RELAP5/MOD3.2.1.2
1997 RELAP5/MOD3.2.1.2
3 THE COMPUTER MODELLING
To assess the capability of the thermal hydraulic code RELAP5 for modelling the conditionsduring midloop operations different version of code were used as mentioned in theintroduction and presented in Table 2. In use of earlier versions, because of the extremely lowoperating parameters of the open system, an exhaustive work was demanded (for similarexperiences see [8] and [9]). Difficulties appeared especially in the set up of the initialcondition and when the boiling in core evokes condensation and counter-current flowconditions at the top of the core occur. For the present case, namely for RELAP5/MOD3.2.1.2application the input model and experiences were utilised.
Nuclear Energy in Central Europe '98 189

550
452
575
577454
.43.3
428434
Fig. 1 RELAP5 nodalisation of PMK-2 facility for LRHR calculations
The RELAP5 nodalisation scheme of the PMK-2 (see Fig. 1) has 109 volumes and 118junctions, the core heater rods and other component walls are modelled by 70 heat structureswith 301 nodes. It is a modified version of the earlier used ones ([6] - [9]), supplemented withspecial boundary nodes, time dependent volumes full with noncondensible
4 COMPARISON OF TEST DATA AND CALCULATED RESULTS
Figs. 2 and 3 show the progress in the simulation for FET experiment (compare [9]). la thefigures the upper plenum temperature TE22 and the heater rod surface temperature TE15 ofthe experiment are compared with the calculated results. During the calculation notermination of run was occurred due to code failure problems in pool boiling period. The mainphenomena of the experiment are well predicted by the RELAP5/MOD3.2.1.2 simulation.
190 Nuclear Energy in Central Europe '98

120 q
' 6 1000 26'6'6 3000 4000 5000 6000time (sec)
0 1000 2000 3000 4000 5000 6000time (sec)
Fig. 2 Upper plenum temperature Fig. 3 Cladding temperature
9.0 -1
0 2000 4000 6000time (sec)
ODPDB pr21 —calcpr21-exp
2000 4000time (sec)
6000
Fig. 4 Level in reactor vessel Fig. 5 Pressure in upper plenum
120!GFK
400 2000 4000
time (sec)6000
00000 tel5-calctel5-exp
402000 4000 6000
time (sec)
Fig. 6 Upper plenum temperature Fig. 7 Cladding temperature
Nuclear Energy in Central Europe '98 191
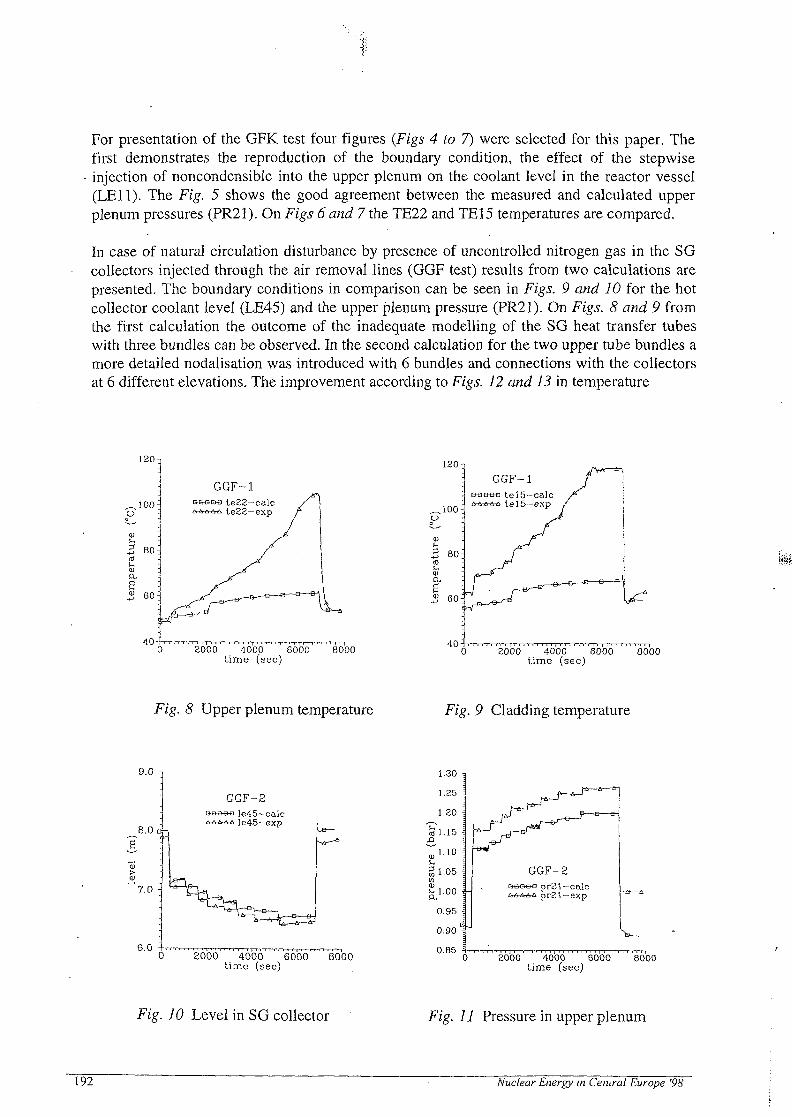
For presentation of the GFK test four figures (Figs 4 to 7) were selected for this paper. Thefirst demonstrates the reproduction of the boundary condition, the effect of the stepwiseinjection of noncondensible into the upper plenum on the coolant level in the reactor vessel(LEU). The Fig. 5 shows the good agreement between the measured and calculated upperplenum pressures (PR21). On Figs 6 and 7 the TE22 and TE15 temperatures are compared.
In case of natural circulation disturbance by presence of uncontrolled nitrogen gas in the SGcollectors injected through the air removal lines (GGF test) results from two calculations arepresented. The boundary conditions in comparison can be seen in Figs. 9 and 10 for the hotcollector coolant level (LE45) and the upper plenum pressure (PR21). On Figs. 8 and 9 fromthe first calculation the outcome of the inadequate modelling of the SG heat transfer tubeswith three bundles can be observed. In the second calculation for the two upper tube bundles amore detailed nodalisation was introduced with 6 bundles and connections with the collectorsat 6 different elevations. The improvement according to Figs. 12 and 13 in temperature
120 120-,
400 2000 4000 6000 B000
time (sec)0 2000 4000 6000 8000
time (sec)
Fig. 8 Upper plenum temperature Fig. 9 Cladding temperature
9.0 -,
3.0 a-
7.0 -
6.0
GGF-2
0 2000 4000 6000 8000time (sec)
1.30 -.
1.25 \
l.eo \
co 1.15 \
d> :
Sl.05 |M ;
£ 1.00 -I
0.95 i
0.90 1
0.B5 4
GGF-2prSl-calcpr21-exp
0 2000 4000 6000 8000time (sec)
Fig. 10 Level in SG collector Fig. 11 Pressure in upper plenum
192 Nuclear Energy in Central Europe '98

120-, 120-,
400 2000 4000 6000 8000
time (sec)
402000 4000 6000 8000
time (sec)
Fig. 12 Upper plenum temperature Fig. 13 Cladding temperature
histories TE22 and TE15, which are closed connection with natural circulation degradation,conspicuous. The trends observed in the experiment GGF are well predicted by thecalculation, however the agreement may be still better with further refinement of SGnodalisation.
5 CONCLUSIONS
As the conclusion it can be stated, that the RELAP5/MOD3.2.1.2 calculations were able tocapture most of the important phenomena of the PMK-2 experiments. Thanks to the relativelylow power density in the core and the large water inventory in the VVER-440 primary systemno core uncovery and heater rod surface temperature excursion was observed in the analysedtransients. It seems, that the time frame for the operator is large enough to make right actionsfor the prevention of core damage in the plant.
6 REFERENCES
[1] D. Dumont, G. Lavialle, B. Noel, R. Deruaz: Loss of Residual Heat Removal During Mid-loopOperation: BETHSY Experiments. CEA-CENG-DRN/DTP/STR. Proc. 6th Int. TopicalMeeting on Nuclear Reactor Thermal Hydraulics, Grenoble, 1993. Vol. 2. pp 1368-1376.
[2] H. Nakamura, Y. Kukita: PWR Thermal-hydraulic Phenomena Following Loss of ResidualHeat Removal During Mid-Loop Operation. Proc. Int. Conf. on New Trends in Nuclear SystemThermohydraulics, Pisa, Italy, 1994. Vol. 1. pp 77-86.
[3] S. Banerjee, Y.A.Hassan: RELAP5/MOD3 Simulation of the Loss of RHR System DuringMidloop Operation Experiment Conducted at the ROSA-IV Large Scale Test Facility. Proc. Int.Conf. on New Trends in Nuclear System Thermohydraulics, Pisa, Italy, 1994. Vol. 1. pp. 407-414.
Nuclear Energy in Central Europe '98 193

[4] G. S. Ha, W. S. Kim, Y. J. Chung, W. P. Chang, K. J Yoo: Analysis of the Vent Path Throughthe Pressuriser Manway under the Loss of Residual Heat Removal (RHR) System during Mid-Loop Operation in PWR, ICONE-4, New Orleans, USA, 1996. Proceedings Vol. 3. pp 537-543.
[5] B. W. Yang, W. Y. Ouyang, T. J. Dougherty: Modeling of a Natural Circulation Loop at LowPressure. ICONE-4, New Orleans, USA, 1996. Proceedings Vol. 1. Part A, pp 297-302.
[6] Simulation of a Loss of Coolant Accident with a Leak on the Hot Collector of the SteamGenerator. Results of the Third Standard Problem Exercise. IAEA-TECDOC-586. Vienna,1991.
[7] Simulation of a Loss of Coolant Accident with High Pressure Injection and Secondary SideBleed and Feed. Results of the Forth Standard Problem Exercise. IAEA-TECDOC-848. Vienna,1995.
[8] L. Szabados, G. Ezsol and L. Perneczky: Experiments in Supporting of Accident Managementfor the Paks NPP of VVER-440/213-type. 3rd World Conference on Experimental HeatTransfer, Fluid Mechanics and Thermodynamics, Honolulu, Hawaii, USA, 31 October-5November, 1993. Elsevier Proceedings Vol. 1. pp 474-480.
[9] Gy Ezsol. , L. Perneczky, L. Szabados: Simulation of Loss of Residual Heat Removal duringMidloop Operations in VVER-440 Type NPPs. Annual Meeting of the Nuclear Society ofSlovenia, Rogaska Slatina, Slovenia, September 18-21, 1994. Proceedings pp. 215-220.
[10] RELAP5/MOD3.2 Code Manual. Vol. I - VI. NUREG/CR-5535, INEL-95/0174. June 1995.
[11] G. Lavialle: BETHSY - Test 6.9c: Loss of Residual Heat Removal System during Mid-loopOperation. Pressuriser and steam generator outlet plenum manways open. Test Report. CEANote STR/LES/92-110. December 1993.
[12] G. Lavialle, G. Kimber, C. Leveque: BETHSY: International Standard Problem 38 - 1stWorkshop Report, Loss of Residual Heat Removal System during Mid-Loop Operation.Pressuriser and SG 1 outlet plenum manways open. CEA Note SETh/LES/95-244, Grenoble,October 1995.
[13] OECD/NEA/CSNIISP38, BETHSY Test 6.9c: Loss of Residual Heat Removal System duringMid Loop Operation, Pressuriser and SG 1 Outlet Plenum Manways Open. Preliminary Report.CENG-AEAT-TRACTEBEL, October 1996.
[14] ISP-38 on BETHSY Test 6.9c. Final Report. (G. Lavialle, G. Kimber, C. Leveque:OECD/NEA/CSNI International Standard Problem 38. BETHSY Test 6.9c: Loss of ResidualHeat Removal System during Mid-loop Operation, Pressuriser and SG 1 Outlet PlenumManways Open). Vol. I. and Vol. II. NEA/CSNI/R(97)38. June 1998.
[15] L. Perneczky: RELAP5 Calculation of International Standard Problem No. 38. ICONE-5 1997ASME/SFEN/JSME 5th International Conference on Nuclear Engineering, Nice, France, May25-29, 1997. Proceedings on CD, ICONE-2464.
[16] V. Bencik, T. Bajs, M. Prah: RELAP5/MOD3.2 Analysis of the Loss of RHR SystemExperiment Scaled to NPP Krsko. 2nd International Conference on Nuclear Option in Countrieswith Small and Medium Electricity Grids. Dubrovnik, Croatia, June 15-18, 1998.
194 " Nuclear Energy in Central Europe '98

I SI0100110
Nuclear Energy in Central Europe '98
Terme Catez, September 7 to 10, 1998
PREDICTION OF VOID FRACTION INSUBCOOLED FLOW BOILING
Stojan Petelin, Bostjan Koncar
"Jozef Stefan" Institute,Jamova 39, 1000 Ljubljana, Slovenia
stojan.petelin(g!i'is.si, [email protected]
Abstract
The information on heat transfer and especially on the void fraction in the reactor core under subcooledconditions is very important for the water-cooled nuclear reactors, because of its influence upon the reactivity ofthe system. This paper gives a short owerview of subcooled boiling phenomenon and indicates thesimplifications made by the RELAP5 model of subcooled boiling. RELAP5/MOD3.2 calculations werecompared with simple one-dimensional models and with high-pressure Bartolomey experiments [8].
Nomenclature Greek lettersCf- specific heat of the fluid, J/kgK p - density, kg/m3
C - constant y/_ parameter in (eq.5)d - bubble diameter /-_ volumetric mass exchange rate, kg/m3sF- convective factor from Chen's correlation AT$ai _ w a l l s u p e rheat, Tw-Tsal KG -mass flux, kg/m s ^ _ u i d s u b c o o l l T TK
kf- thermal conductivity, W/Mkh- enthalpy, J/kg Subscriptshf0 - heat transfer coefficient to the single r_ £j ^
phase liquid, W/m2K (eq.5,6) J _Nu - Nusselt number SQt
Pe-Peclet number ,«6-subcooled, « 6 sp- pressure, bar f . i n l e t
S - dissipative factor from Chen's correlation ws w a j j t 0
St - Stanton number if_ i n t e r f a c i a l
T-temperature, K
1. Phenomenological description of subcooled flow boiling
The term "subcooled boiling" is mainly associated with the simplification of the boilingphenomenon in the single dimension, since boiling in a vertical channel is typically amultidimensional phenomenon [1]. Subcooled flow boiling in a heated channel covers theregion beginning from the location where the wall temperature exceeds the local liquidsaturation temperature to the location where the thermodynamic quality reaches zero, whichcorresponds to the saturated liquid state. The thermodynamic or equilibrium quality [2] isdefined as liquid entalphy relative to the saturation state.
x_ (hf-hf,al) _ cfATsub ( i )
h
Equation (1) results in a negative equilibrium quality for the subcooled boiling region.
Nuclear Energy in Central Europe 98 195

outlet
SaturatedFlowBoiling
Figure 1: Flow regimes in subcooled flow boiling, as presented by Kandlikar [3]
Important locations and regions of subcooled boiling in the heated circular tube are illustratedin figure 1 and discussed in the furter text. Kandlikar's [3] phenomenological description ofsubcooled boiling regions is presented here:
Single phase region (A-B): Subcooled liquid enters the tube at location A. As long as the walltemperature is lower than local saturation temperature of the liquid, the heat transfer is single-phase. Wall temperature rises linearly and parallel to the bulk liquid temperature. The walltemperature reaches the saturation temperature of the liquid at location B, defining thebeginning of the subcooled boiling region. Nucleation does not occur immediately, sincecertain amount of wall superheat is required for the onset of nucleation.Partial nucleate subcooled boiling region (C-E): Location C, where the first bubbles appear, isidentified as the Onset of Nucleate Boiling (ONB). After the ONB point the wall temperaturebegins to flatten. Further downstream, as more and more bubble sites occur, the contributionto heat transfer from the nucleate boiling continues to rise and the single-phase convectivecontribution decreases. This transition region between locations C and E is referred to aspartial nucleate boiling.Fully developed subcooled boiling region (E-G): Finally the entire wall surface is covered bybubble sites at the location E, establishing the Fully Developed Boiling (FDB), where theconvective heat transfer contribution reduces to zero. As the subcooled liquid in the fullydeveloped boiling approaches to the saturation state, a location G is reached, where bubblesdetach from the wall and penetrate into the liquid core. This point is called the point of NetVapor Generation (NVG), where the void fraction begins to be significant.Significant void flow region (G-H): From NVG point onward the flow is considered as two-phase mixture. That means that two-phase heat transfer can be considered and boilingbecomes very similar to the saturated flow boiling. The conditions for the NVG location areof particular interest for the RELAP5 computer code. Saturation condition underthermodynamic equilibrium is reached at point H, where the bulk liquid temperature becomesequal to the liquid saturation temperature. However, some subcooled liquid is still locallypresent in the liquid core.
196 Nuclear Energy in Central Europe '98
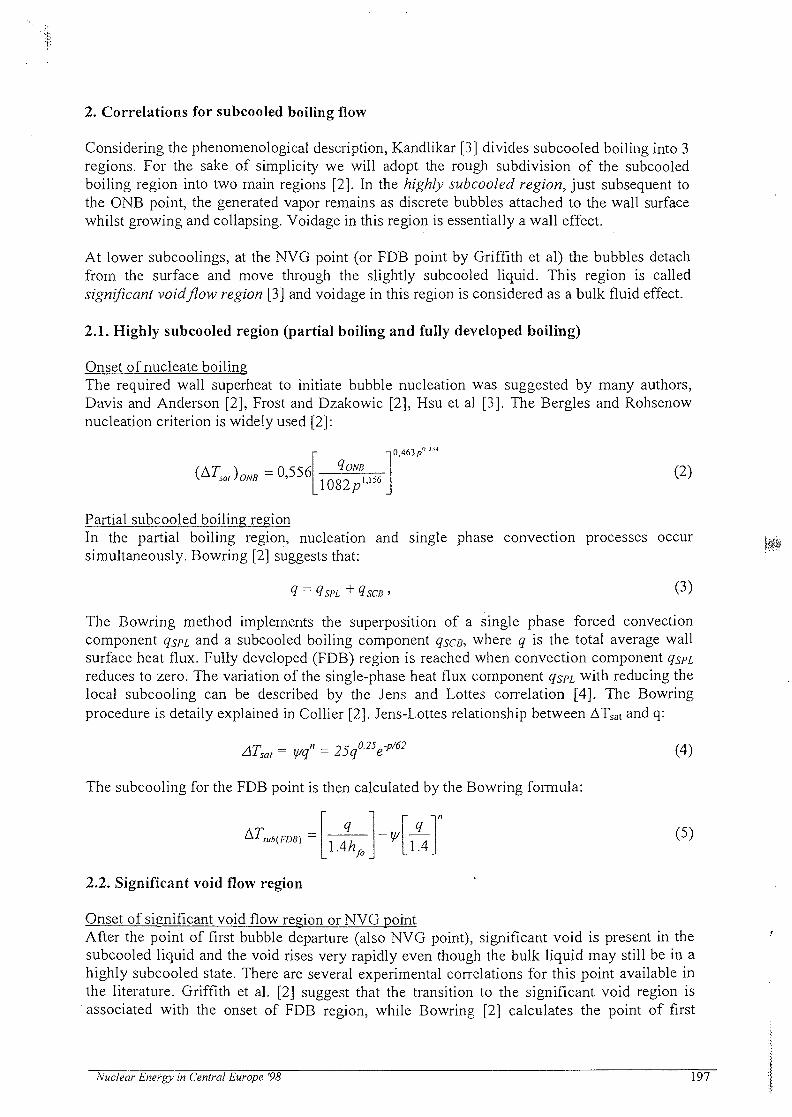
2. Correlations for subcooled boiling flow
Considering the phenomenological description, Kandlikar [3] divides subcooled boiling into 3regions. For the sake of simplicity we will adopt the rough subdivision of the subcooledboiling region into two main regions [2]. In the highly subcooled region, just subsequent tothe ONB point, the generated vapor remains as discrete bubbles attached to the wall surfacewhilst growing and collapsing. Voidage in this region is essentially a wall effect.
At lower subcoolings, at the NVG point (or FDB point by Griffith et al) the bubbles detachfrom the surface and move through the slightly subcooled liquid. This region is calledsignificant void flow region [3] and voidage in this region is considered as a bulk fluid effect.
2.1. Highly subcooled region (partial boiling and fully developed boiling)
Onset of nucleate boilingThe required wall superheat to initiate bubble nucleation was suggested by many authors,Davis and Anderson [2], Frost and Dzakowic [2], Hsu et al [3]. The Bergles and Rohsenownucleation criterion is widely used [2]:
=0,5561082/7 1,156
0,463p'u
(2)
Partial subcooled boiling regionIn the partial boiling region, nucleation and single phase convection processes occursimultaneously. Bowring [2] suggests that:
9SCB (3)
The Bowring method implements the superposition of a single phase forced convectioncomponent qspL and a subcooled boiling component qsc.B, where q is the total average wallsurface heat flux. Fully developed (FDB) region is reached when convection component qspLreduces to zero. The variation of the single-phase heat flux component q$pi with reducing thelocal subcooling can be described by the Jens and Lottes correlation [4]. The Bowringprocedure is detaily explained in Collier [2]. Jens-Lottes relationship between ATsat and q:
= ¥qn = 25q°-25ep/62
The subcooling for the FDB point is then calculated by the Bowring formula:
(4)
A77.sub(FDIl)1.4
(5)
2.2. Significant void flow region
Onset of significant void flow region or NVG pointAfter the point of first bubble departure (also NVG point), significant void is present in thesubcooled liquid and the void rises very rapidly even though the bulk liquid may still be in ahighly subcooled state. There are several experimental correlations for this point available inthe literature. Griffith et al. [2] suggest that the transition to the significant void region is
' associated with the onset of FDB region, while Bowring [2] calculates the point of first
Nuclear Energy in Central Europe '98 197

bubble detachment. A very simple method for calculating the NVG point is the Saha andZuber criterion [2], which is also used by the RELAP5. code. Griffith et al. and Bowringcriteria for subcooling are given by equations (6) and (7), respectively, while the Saha-Zubercorrelation adopted for use in RELAP5 code is listed among constitutive equations in table 1.
AT. qsub(FDB)
5h•f»
,, =(14 + 0.1/7)
(Griffith et al.) [2]
(Bowring) [2]
(6)
(7)
2.3. Void fraction estimation
There are only a few models for wall void fraction estimation in the highly subcooled boilingregion, where bubbles do not penetrate into the bulk subcooled flow. One of them is themodel proposed by Griffith et al [2]. However this model becomes incorrect at low pressuresbelow 20 bar, since the bubble diameter becomes a function of pressure as well.
In the significant void flow region, there are several methods of calculating the void fraction.Collier [2] states the model proposed by Bowring and empirical methods of Thorn, Zuber andLevy.
3. RELAP5 correlations for subcooled boiling region
RELAP5 disregards the wall voidage region between the ONB point and the NVG point.Thus the fluid flow in the upstream of the NVG point is treated as single-phase flow and two-phase flow downstream. In Table 1 RELAP5 constitutive equations for subcooled boiling arelisted [5]. Here only the main closure equations for the energy conservation equations aregiven, since we assume that the relative motion of phases is of minor importance for thesubcoooled boiling [6].
Table 1: RELAP5/MOD3.2 constitutive equations for subcooled boiling flow regionConstitutive equations Reference/Comments
• Vapor generation rate on the wall
F . = •••_ w/ " y ,
_min(h,,h/M)-hcr _ pf(h/sm -m\n(hf,hfM)')
Lahey's [5] mechanistic model is used tocapture the effect of thermal gradient in thewall boundary layer. Liquid near the wall ispreheated and flashes to vapor.
X - fraction of the wall heat flux to liquid
Net vapor generation point (NVG)StCr
, Pe > 70000h =1
fM 0.0065NuC,
h, —455
-,Pe< 70000
Nu
~Pe
GDC,
Saha-Zuber [5] correlation is used to calculatethe critical enthalpy hcr of the subcooled fluid,where RJELAP5 starts treating the fluid as two-phase flow. The correlation is valid forpressures from 1.01 to 138 bars. At low flowrates the bubble detachment occurred atconstant Nu number (thermally controlled),while at high flow rates the bubble departure ishydrodynamically induced at a fixed Stnumber. The Pe = 70000 is the switch betweenthermally or hydrodinamically controlledbubble departure.
Wall heat transfersaturated flow boiling:<? = h,,,.c (7",, - TM )F+hmk
All heat flux from the wall during subcooledboiling process is consumed to vaporgeneration and liquid heating, thus Qwg=0. Heat
198 Nuclear Energy in Central Europe '98

subcooled flow boiling:Tsa, <Tf< (Tsal -5), F• = F-0.2(TSO,-Tj)(F-1)Tf<Tsa,-5, F'=l
transfer coefficient in subcooled region iscalculated by modifying the factor F in Chen'scorrelation [5] for saturated boiling.
Interfacial heat transferinterface heat transfer coefficient (for bubbly flow):
/--> _
,v, > 0.61/n/j-
65-5.69-10-5(/?-10"5),105
Interface heat transfer coefficient for subcooledbubbly flow regime is calculated by Unalcorrelation [5], which is recommended withinthe following range:
- p = 0 . 1 - 17.7 MPa- q = 0 .47- 10.64 MW/m2
- v/= 0.8-9.15 m/s- ATsub = 3 - 86 K
dmax = 0.08 -1.24 mm
.Pa
[0.25-lO'V^'SlO6 <P<\7.7-l06Pavolumetric interface heat transfer coefficient:Hif= hyA,Aj = 3.6a/do, interface surface area
Mean bubble diameter do
do=dmj2
We a
In RELAP5 correlations for volumetricinterface heat transfer is used Jfe^lO, whilecorrelation for interface drag implementsWeer=5.
Vapor generation rate in the volume with two-phase flow
hf=hf, hg*=hg, Fg< 0, condensationhf = hf hs = hg Fs> 0, evaporation
ExampleThe RELAP5 prediction of the subcooled boiling was assessed on the example of a high-pressure circular tube with the length L=3,66m and diameter D=0,01016m. Conditions arepresented in the table 2:
Table 2: Example conditionsPressure at exit, pHeat flux, qMass flux, GInlet temperature, Tin
68,9 bar1720 kW/mf5340 kg/sm2
203°C
The RELAP5/MOD3.2 model of the vertical tube consisted of the 36 nodes with timedependend volumes at the inlet and outlet of the tube. RELAP5 wall and fluid temperaturedistributions were compared with the temperature estimations calculated by the Bowringmethod from Jens-Lottes correlation, equation (4). The wall superheat at the ONB point wasderived from equation (2). FDB subcooling was calculated by equation (5).
Table 3: ONB point calculationONB pointZONK M
ATsaliONIiCC)
Bergles-Rohsenow2.2512.21
Table 4: FDB point calculationFDB point
ATs,,b(FDB) [ QATsal(i;[)ij) ( C)
Jens-Lottes16.178.06
The comparison of temperature distributions is shown in figure 2. The wall temperaturecalculated by RELAP is continuous and exceeds the Jens-Lottes wall temperature for almost
Nuclear Energy in Central Europe '98 199
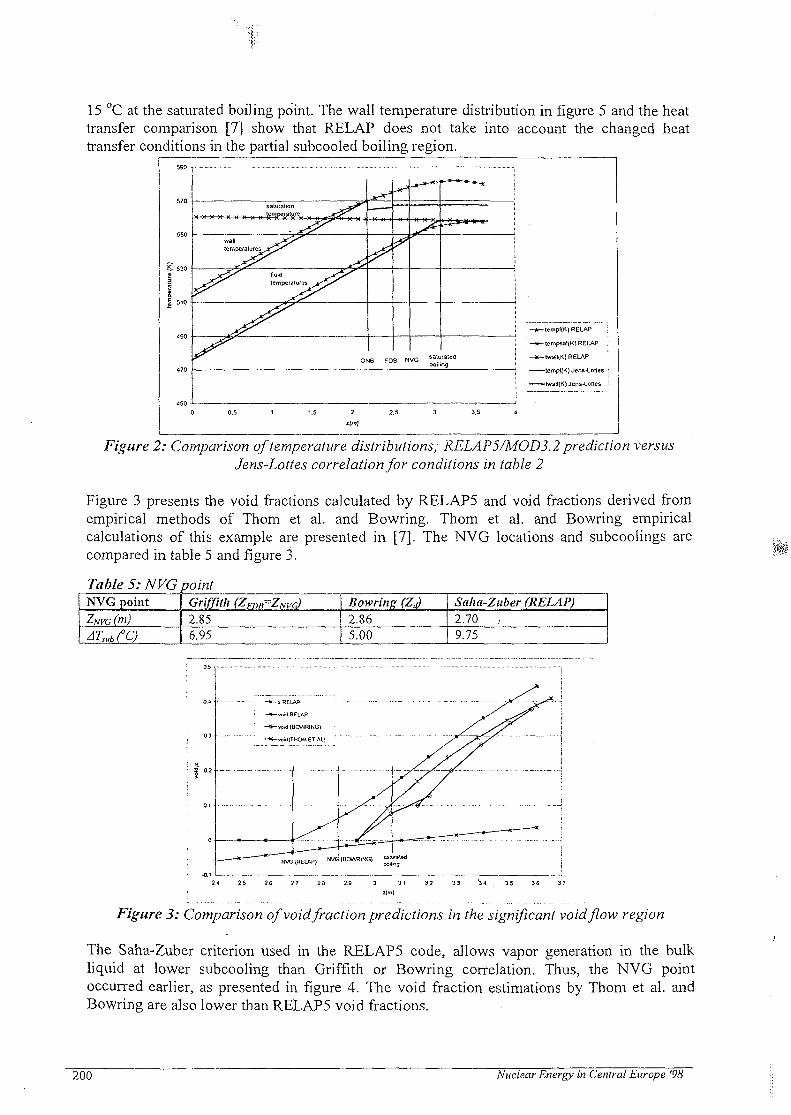
' * • '
15 °C at the saturated boiling point. The wall temperature distribution in figure 5 and the heattransfer comparison [7] show that RELAP does not take into account the changed heattransfer conditions in the partial subcooled boiling region.
-tempf{K) RELAP :
-tempsal(K) RELAP ;
-twall(K)R£LAP
—lempI{K) Jens-Lottes :
—twall(K) Jens-Lottes '
Figure 2: Comparison of temperature distributions; RELAP 5/MOD3.2 prediction versusJens-Lottes correlation for conditions in table 2
Figure 3 presents the void fractions calculated by RELAP5 and void fractions derived fromempirical methods of Thorn et al. and Bowring. Thom et al. and Bowring empiricalcalculations of this example are presented in [7]. The NVG locations and subcoolings arecompared in table 5 and figure 3.
Table 5: NVG pointNVG point
ZNVC (m)
ATs,,bt°C)
Griffith (ZFm=ZNVG)
2.856.95
Bowring (Z<i)
2.865.00
Saha-Zuber (RELAP)
2.70 ..9.75
Figure 3: Comparison of void fraction predictions in the significant void flow region
The Saha-Zuber criterion used in the RELAP5 code, allows vapor generation in the bulkliquid at lower subcooling than Griffith or Bowring correlation. Thus, the NVG pointoccurred earlier, as presented in figure 4. The void fraction estimations by Thom et al. andBowring are also lower than RELAP5 void fractions.
200 Nuclear Energy in Central Europe 98

4. Bartolomey experiments
The RELAP5/MOD3.2 model of subcooled boiling was compared to 3 high-pressureBartolomey experiments [8] with the conditions from table 6:
Table 6: Experiment conditions
Length LTube inside diameter DPressure at exit,Heatflux,Mass flux,Inlet temperature,
PqGT1 in
(m)(m)(bar)(kW/m2)(kz/stn2)(K)
Exp.l1.50.012147.511302123583
Exp.21.160.01268.97701467519
Exp.31.240.01268.9790405421
The RELAP5/MOD3.2 prediction of void fraction is compared against experimental data infigures 4 to 6. The RELAP5 nodalization model of the tube consisted of 15 nodes. Themodified nodalization density did not have a significant influence on the results [7]. Theabscissa on figures 4 to 6 is the thermodynamic quality x. The ONB and NVG pointsindicated in figures are obtained from Bergles-Rohsenow and Bowring correlations,respectively. The comparison of thermodynamic qualities x for the RELAP5 and BowringNVG points is given in table 7.
Table 7: Comparison of ONB and NVG points
XoNBX NVG
Exp.lRELAP
/-0.082
Rohsenow (ONB)Bowring (NVG)-0.265-0.072
RELAP
/-0.119
Exp.2Rohsenow (ONB)Bowring (NVG)-0.460-0.098
Exp.3RELAP
/-0.06
Rohsenow (ONB)Bowring (NVG)-0.172-0.045
Figure 5: Void fraction versusthermodynamic quality; experiment 1
Figure 6: Void fraction versusthermodynamic quality; experiment 2
Figure 7: Void fraction versusthermodynamic quality; experiment 3
Nuclear Energy in Central Europe '98 201
5. Conclusions
The subcooled boiling region can be roughly divided into two main regions: highly subcooledregion (voidage in this region represents a wall effect) and significant void flow region(voidage in this region is considered as bulk fluid effect). The subcooled boiling is at least a2D phenomenon. Thus the simplifications made by RELAP5 were assessed:
• RJELAP5 does not take into account the wall voidage in the highly subcooled region. TheRELAP5 code treats the fluid in this region (from ONB to the NVG point) as single-phase flow.
• The RJELAP5 wall temperature after the ONB point exceeds significantly the walltemperature calculated by the Jens-Lottes correlation, which considers changed heattransfer conditions after the ONB point.
The RELAP5 computer code uses the Saha-Zuber correlation to determine the location of theNVG point, where the fluid is treated as a two-phase flow. Comparison with Bowringcorrelations for NVG point on the Bartolomey experiments [8] shows earlier appearance ofRELAP5 NVG point, which also fits better to the experimental data.
Comparison of RELAP void fraction with the experimental void fraction shows slightunderprediction of RELAP5/M0D 3.2 calculations after the NVG point. We also presumethat RELAP5 does not predict the experimental wall voidage, although the location ofexperimental NVG point is not clearly evident from the available experimental data.
This study shows that there is a need for multidimensional modeling of the subcooled boilingphenomenon, especially in the highly subcooled boiling region. Our furture activities willtherefore deal with 2D modeling of the subcooled flow boiling.
References
1. N.Kurul, M.Z.Podowski, "Multidimensional effects in forced convection subcooledboiling",0-' International Heat Transfer Conference, Jerusalem, Israel, 1990
2. J.G.Collier, "Convective boiling and condensation", McGraw-Hill, 19813. S.G. Kandlikar, "Heat transfer characteristics in partial boiling, fullly developed boiling,
and significant void flow regions of subcooied flow boiling", FED-Vol. 244, ASME 97,1997
4. W.H.Jens, and P.A.Lottes, "An analysis of heat transfer bornout,pressure drop, anddensity data for high pressure water,ANL-4627,1951
5. RELAP5/MOD3 Code Manual,"Models and correlations", Vol.4, INEL, Idaho Falls, 19956. RELAP5/MOD3 Code Manual,"Code structure, system models, and solution methods",
Vol.1, INEL, Idaho Falls, 19957. B.Koncar, "One-dimensional models of subcooled flow boiling",draft seminar No.l for
the postgraduate study in Nuclear Engineering, Ljubljana, 49988. A.S.Devkin and A.S.Posedonov,"RELAP5/MOD3 subcooled boiling model
assessment"NUREG/IA-0025,1998
2Q2 Nuclear Energy in Central Europe '98

SI0100111
Nuclear Energy in Central Europe '98
i%SS Terme Catez, September 7 to 10, 1998
TESTING THE NUMERICAL METHODFOR ONE-DIMENSIONAL SHOCK TREATMENT
Andrej HorvatReactor Engineering Division
"Jozef Stefan" InstituteLjubljana, Slovenia
E-mail: [email protected]
ABSTRACT - In the early 80's the SMUP computer code was developed at the "Jozef Stefan" Institute forsimulation of two-phase flow in steam generators. It was suitable only for steady-state problems and was unableto simulate transient behaviour. In this paper, efforts are presented to find suitable numerical method to renew theold SMUP computer code. The obsolete numerical code has to be replaced with a more efficient one that wouldbe able to treat time-dependent problems. It also has to ensure accurate solution during shock propagations. One-dimensional shock propagations in a tube were studied at zero viscosity. To simplify the equation of state theideal gas was chosen as a working fluid. Stability margins in the form of transport matrix eigenvalues werecalculated. Results were found to be close to those already published.
Greek Letters% Ludolf s numberp densityy numerical cell boundaryco numerical cell volumeA finite difference
Subscripts / Superscripts1 pressure calculation positioni grid point indexiMax max number of grid pointsj grid point indexn number of iteration
NOMENCLATUREacCFLdfgIP1RtTuV
X
z
advection velocityconvection matrix termCourant-Friedrichs-Levy criteriadiameter, pressure matrix termfriction factorgravity accelerationlengthpressurevolumetric flowgas constantsimulation timetemperaturemomentum (pv)velocityhorizontal coordinatevertical coordinate
INTRODUCTIONIn the early 80's the SMUP computer code was developed at the "Jozef Stefan" Institute for
simulation of two-phase flow in steam generators, which is extensively described in Gregoric et al.(1984) and in Petelin et al. (1986). The code was written as an incompressible flow code to calculatesteady-state heat transfer and fluid flow behaviour. The code was unable to simulate transients andhad very serious stability problems. Because of these deficiencies the code applicability was verylimited.
In this paper efforts to find suitable numerical method to renew the old SMUP computer code arepresented. The obsolete numerical code has to be replaced with a more efficient one which would beable to treat time-dependent problems. It also has to ensure an accurate solution during shockpropagations. To determine the most suitable numerical scheme the accuracy and stability of differentschemes were tested. Extensive testing revealed the numerical scheme which combines accuracy andalso stability even at large time steps.
Nuclear Energy in Central Europe '98 203

MODELThe stability and accuracy of numerical schemes were tested using severe shock simulations in a
pipe. The length of the pipe was 10m and the shocks were always initiated at one half of its length.The pipe diameter was 0.1m. Because of extensive experimental and computational work already doneby others (Hirsch, 1990) the air was chosen as a working fluid. To further simplify the equation ofstate, the working fluid was considered an isothermal ideal gas. With the gas constant 287J/kgK theinitial pressure was Ibar and the initial density l.Okg/m^.
In many cases not only the Navier-Stokes equation but also the convection equation (eq. 1) and theBurger equation (eq. 2) are used to simulate transport phenomena in fluids.
a x ( 1 )
For testing convection equation (eq. 1) numerical scheme one-dimensional velocity shockpropagations were studied. On the left side of the simulation domain the velocity was 300m/s whereason the other side the velocity was zero. At the inlet (e.g. on the left boundary) the Neumann boundaryconditions were prescribed and at the outlet (e.g. on the right boundary) the second order boundaryconditions were prescribed.
a4dt dx
Also, for testing the Burger equation (eq. 2) numerical scheme one-dimensional velocity shockpropagations were studied. On the left side of simulation domain the velocity was 300m/s whereas onthe other side the velocity was zero. The boundary conditions at the inlet and outlet side where thesame as in the case of convection equation (eq. 1).
(3)
dt dx dx (P)
For testing the Navier-Stokes equation (eq. 3) numerical scheme one-dimensional pressure shockpropagations in a tube were used at zero viscosity. On the left side of the simulation domain thepressure was Ibar whereas on the other side the pressure was 0.1 bar. Because the fluid flow also hasto obey mass conservation law, the Navier-Stokes equation is coupled with the continuity equation:
A(p)+A(vp)=0 .
Basic criterion for boundary conditions was the mass conservation. At the left boundary second orderboundary conditions for velocity and the Neumann boundary conditions for pressure were prescribed.At the outlet the Neumann boundary conditions for velocity and the second order boundary conditionsfor pressure were prescribed.
NUMERICAL METHODSIn all simulated cases the numerical mesh had 101 grid points (fig. 1). The time and space
discretisations were first order accurate. For all three cases the finite volume method (Versteeg &Malalasekera, 1995) was applied with the upwind discretisation of the fluxes.
xKD x!
r1/2
V
p,rho1/2 _ }
xii)
_L
x1(i*1> xli+1) xKiMax) x(i
Fig. 1: Numerical mesh arrangement.
204 Nuclear Energy in Central Europe '98

For time integration of the convection equation the explicit Euler method was used. In matrix formthe convection equation (eq. 1) is written as:
...«+!_(„ + At ., )vn . ( ,- ;
v , ' . . . - ! n . : ' . . ' / .V • . , .
/ {rr + ,,, ( - A/
where the advection velocities are defined as:
a+ =—{a + \a) and a = — [a-a\).(6)
Also, for time integration of the Burger equation the explicit Euler method was used. In matrixform the Burger equation (eq. 2) is written as:
(7)At
where the advection velocities are defined as
CO,
(8)
- v_
- vv
They are functions of calculated velocities and they are not constant as in the case of the convectionequation (eq. 5).
In the Navier-Stokes equation, the pressure is also introduced as one of the simulated variables.Although only the staggered grid arrangement for pressure field (fig. 1) is presented here, thecollocated grid arrangement (Ferziger & Peric, 1996) was also extensively tested. A stable numericalalgorithm however, was not found. For time integration of Navier-Stokes equation the projectionmethod was used (Bell et al., 1989), where the time integration is split into separate stages:
OX
( \»+l i \M+1/2 A . 9
dx'+l (10)
The convection part was integrated explicitly with the Euler method and the continuity equation wastreated implicitly:
( I D
dx
In matrix form (eq. 9) is written as:
CO. 0)
(12)
where the advection velocities are defined as in the case of the Burger equation (eq. 7). The first stageof the Navier-Stokes equation (eq. 9) is then combined with the continuity equation (eq. 11) into thepressure equation (eq. 13) to satisfy mass conservation at time level n+1.
Nuclear Energy in Central Europe '98 205

RT dx2 ^ ' RT dxK
The pressure equation (eq. 13) in matrix form is then written as:
After pressure calculation, which was in this case done with the Gauss-Jordan elimination (Press etal., 1993), the velocity is updated with pressure gradient:
cov
STABILITYThe stability of numerical schemes for convection dominated problems was usually connected with
Courant-Friedrichs-Levy condition:
At
where v is the advection velocity. For pure convection equation (eq. 1) and most of the numericalschemes the CFL condition is easy to calculate (e.g. CFL condition for upwind discretisation is 0 <CFL < 1). This approach does not take into account the influence of boundary conditions and alsofails when it is applied to non-liriear problems such as the Burger equation (eq. 2) or the Navier-Stokes equation (eq. 3).
Another approach to stability analysis is the so-called matrix method (Hindmarsh et al., 1984),which also takes into account the boundary conditions (vector S) :
Av „ - (17)— • - Av + S.At ~
The solution of (eq. 17) stays stable when the real part of matrix^ eigenvalues is bounded:
l . (18)
When the matrix method stability criteria (eq. 18) is applied to the Euler scheme with upwinddiscretisation, the calculated stable range is twice as wide as before. This was however not proved inpractice and was strongly criticised (Hindmarsh et al., 1984).
To avoid this misunderstanding of matrix method stability conditions, a more general matrixanalysis was applied. This method can be also used for linear and non-linear convection problem inone, two or three dimensions. In general, the (eq. 5,7, 12) can be written in matrix form as:
v"+1 =C-v" .
The vector v at n+1 is calculated when vector v at n is multiplied with the transport matrix C:
Each vector v can be also decomposed into the eigenvectors e of operator C :
i=\
206 Nuclear Energy in Central Europe '98

When the vector v is repeatedly multiplied with operator C as in the case of numerical simulation, thestability of the numerical scheme depends only on operator C eigenvalues:
To ensure stable numerical iterations the eigenvalues have to be not only bounded but also the realpart of each eigenvalue has to be larger than 0:
[ Re(A.)>0
For the eigenvalues calculation the asymmetric matrices C were first balanced and then transformedinto Hessenberg form. Next, the QR decomposition was used to obtain complex eigenvalues. Themathematical and numerical procedures are well described in Golub & Van Loan (1996).
RESULTSNumerical simulations of shock propagations were performed using the convection equation, the
Burger equation and the Navier-Stokes equation. In all cases the same numerical grid and simulationtime interval 0.008s were applied. Only the number of time iterations and the timestep were changedfrom case to case to show the stability eigenvalues dependence. The simulations also revealed that inall cases eigenvalues stay real during time iterations.
For the convection equation numerical simulations with 100, 50, 25 and 23 time iterations weredone. These corresponds to timesteps of 0.00008s, 0.00016s, 0.0032s, 0.00348s and to the CFLvalues of 0.24, 0.48, 0.96, 1.043, respectively. Because of the clarity only the examples with 50 and23 time iterations are presented.
\ ;
i \
\i
neric. tmlyi. '
• \
: \
:\'• \
; \
l.SMm]
0.90.80.70.6 - - -
0.52 - -
40 50 a ™eigenvalue number SO
Fig 2. Shock propagation (50 iterations). Fig 3. Eigenvalues time distribution (50 iterations).
goo _ _ _ _
700
600
500
1 400>
200
100
f 0.5
,', i ;
.' i :
/ i / ;' 1 \U! ;!1 1! 1.5
f.
isi• 1
i j
< n
"i
numeric.ajialyi.
2.5
eigenvalue
1.0.-''
0.8 j -0.6 j -0.4
0.2 -r
-0.043 -L-
10
3
1
j i 1
»~3o"l5---^• , K60 T o ~
eigenvalue number / v 80" Jo" , ™ - - • • ' • 0.002
0.60.40.2
0-0.043
~ ~ —___^^
,.---'' 0.006
.' ' '0.004 , i m e [ s ]
Fig 4. Shock propagation (23 iterations). Fig 5. Eigenvalues time distribution (23 iterations).
Nuclear Energy in Central Europe '98 207

It can be observed on fig. 2 and 4 that the instability of numerical scheme is increased when thenumber of time iterations is reduced or when the timestep is enlarged. On fig. 3 and 5 the timedevelopments of the transport matrix eigenvalues are presented. Because the advection velocity a isconstant, the eigenvalues stays unchanged during the entire time integration. The largest eigenvalueon the left is one due to predefined velocity at the inlet boundary. As the number of time iterations isreduced (from 50 to 23) and the timestep is increased (from 0.00016s to 0.00348s) the n-1 eigenvaluesare approaching zero, which clearly indicates unstable behaviour (fig. 5).
For the Burger equation numerical simulations with 200, 100 and 57 time iterations were carriedout. This corresponds to timesteps of 0.00004s, 0.00008s, 0.000157s and to the CFL values of 0.12,0.24, 0.471, respectively. Because of the clarity only the examples with 200 and 5/ time iterations arepresented.
350 j -
)00 r̂~
250 ;•
200 -
150 -
100 -
50 -
(I - -0
; 0.951
0.008
\ \ I20 30
eigenvalue number ' u 80 an50 « r - - ^
.. • ' 0.006
„-*•"' 0.004 time[s)
'0.002
Fig 6. Shock propagation (200 iterations). Fig 7. Eigenvalues time distribution (200 iterations).
\f.. •» i
J J
0.80.60.40.2
0-0.0377
1 0 *>
" 4t "Ifeigenvalue number
^ - ' 0 . 0 0 6
' 0.004 lime [s]
0.002
Fig 8. Shock propagation (51 iterations). Fig 9. Eigenvalues time distribution (51 iterations).
Again the examples on fig. 6 and 8 show the increased instabilities when the number of timeiterations is reduced or when the timestep is enlarged. This is the case where the CFL condition failsto predict unstable behaviour. The CFL condition is 0.471 when numerical integration alreadydiverges. On the other hand, the time developments of the transport matrix eigenvalues on the fig. 7and 9 clearly show when one of the eigenvalues is approaching zero. This results in growinginstabilities.
In the case of the Navier-Stokes equation the developed numerical code was first verified bycomparing calculated and analytically obtained results of pressure shock propagation in Tiselj (1997).
208 Nuclear Energy in Central Europe '98

100000 i -r T -T-I • r i 1———
90000 j- '\ ' = * •
80000 j - i \
70000 ;- \ \
i ': \
_ 60000 j- • \
50000 r \ \
40000 |-
30000 j - • - • • - y;
20OO0 I j
-5.0 -4.0 -3.0 -2.0 -1.0 0.0 1.0 2.0 3.0 -1.0xlml
Fig 10. Pressure comparison (t = 0.0031s).
IIKXXX) :
90000 ;
80000 •
70000 |
60000 \
500OO |
40000 ;
30000 1
20000 ;
10000 ' • ' J—-5.0 -4.0 -3.0 -2.0 -1.0 0.0
numeric.analyt.
1.0 2.0 3.0 4.0 5.0
Fig 11. Pressure comparison (( = 0.0061s).
As presented on fig. 10 and 11, the numerically calculated results are close to those already published,which justifies the described approach for compressible flow treatment. The numerically calculateddensity and velocity field differ from the analytically calculated for about 20 percent due toisothermal ideal gas approximation of the working fluid.
The numerical simulation of pressure shock propagations were performed with 200,100, 50 and 45time iterations. These correspond to timesteps of 0.00004s, 0.00008s, 0.00016s, 0.000178s and to theCFL values of 0.12, 0.24, 0.48, 0.53, respectively. Because of the clarity only the examples with 200and 45 time iterations are presented.
100000 :
90000 -
80OO0 :-
70000 ;-
6O0(X) -
50000 r
40000 y
\ '• \ \
' • '•• \ \
XA\'
1; !; i
\ i
1 j\\\
V _ _ i! \ \ \ 1
1 I \. I \ \ i•S.O -4.0 -3.0 -2.0 -1.0 0.0 1.0 2.0 3.0 4.0 5.0
0.950.9
0.849
0.008
^ ' 0.006
0.004 time [s]
eigenvalue number 7 0 80 go"""*"—-*•' 0.002100
Fig 12. Shock propagation (200 iterations) Fig 13. Eigenvalues time distribution (200 iterations).
80000
70000
60CO0
50000
40000
30000
20000
IOOOO r
j0
\V\\I eigenvalue ( l
' • o r -0.8 r
0.6 }-0.4r
0.2 |-
-0.11 L
0.008
-5.0 -1.0 -3.0 -2.0 -1.0 0.0 1.0 2.0 3.0 4.0 5.010 20 30
50
. •*' 0.006
' 0.004 time [s]
60beigenvalue number / u 80 m""^-—••" 0.002
9 0 100
Fig 14. Shock propagation (45 iterations) Fig 15. Eigenvalues time distribution (45 iterations).
Again, the examples on fig. 12 and 14 show the increased instabilities when the number of timeiterations is reduced or when the timestep is enlarged. The stability analysis of Navier-Stokes
Nuclear Energy in Central Europe '98 209

equation is more complicated because of the pressure field that forces the mass conservation. In spiteof fact that a complete stability analysis of the Navier-Stokes equation should also include pressure,the instabilities are principally governed by the size of the transport matrix eigenvalues. As fig. 13 and15 show, the instabilities occur immediately when one of the eigenvalues becomes negative.
CONCLUSIONSThe stability of first order accurate schemes for convection problems were analysed in order to
find a suitable numerical algorithm for the old SMUP code. For this purpose velocity shocks weresimulated using the convection equation and the Burger equation. The compressible form of Navier-Stokes equation was applied for pressure shock testing. Results of code verification justify theselected numerical algorithm.
For stability analysis the matrix method was modified and the new stability criteria weredeveloped. These criteria are based on calculated eigenvalues of the so-called transport matrix.Results of eigenvalue computations during simulations, when the convection equation or the Burgerequation was applied, prove the accuracy of the introduced stability criteria. The same criteria werealso applied to the Navier-Stokes equation during pressure shock calculation. Although theeigenvalues calculation of the convection part of the Navier-Stokes equation is inadequate as precisestability criteria, the simulations showed that instabilities are principally governed by the size ofeigenvalues.
In the future the stability of the Navier-Stokes equation will be further investigated to clarify thestability conditions and ensure a solid base for time dependent flow modelling.
REFERENCESBell, J. B., Colella, P., Glaz, H. M., 1989, "A Second Order Projection Method for the
Incompressible Navier-Stokes Equation", J. Comp. Phys., 2, 1989, pp. 257-283.Ferziger, J. H., Peric, M., 1996, "Computational Method for Fluid Dynamics", Springer Verlag,
Berlin, pp. 184-188.Golub, G. H., Van Loan, C. F., 1996, "Matrix Computations", 3rd Edition, John Hopkins,
Baltimore, pp. 308-391.Gregoric, M., Peterlin, G., Petelin, S., Mavko, B., Radovic, M., Zeljko, M., 1984, "Spremljanje
problematike uparjalnikov", IJS-DP-3501, Ljubljana.Hindmarsh, A. C, Gresho, P. M., Griffits, D. F., 1984, "The Stability of Explicit Euler Time-
Integration for Certain Finite Difference Approximations of the Multi-Dimensional Advection-Diffusion Equations", Int. J. Num. Meth. in Fluids, 1984, Vol. 4, pp. 853-897.
Hirsch, C , 1990, "Numerical Computation of Internal and External Flows", John Willey & Sons,Chichester.
Petelin, S., Mavko, B., Gregoric, M., Kostadinov, V., 1986, "Toplotna in hidravlicna analizarazmer v uparjalniku z upostevanjem cepljenja", IJS-DP-4374, Ljubljana,.
Press, W. P., Flannery, B. P., Teukolsky, S. A., Vetterling, W. T., 1993, "Numerical Recipes in C",Cambridge Press, Cambridge, pp. 36-41.
Tiselj, I., 1997, "Second Order Accurate Schemes for Two-Fluid Models of Two-Phase Flow",Ph.D. Thesis, Ljubljana, p. 52.
Versteeg, H. K., Malalasekera, W., 1995, "An Introduction to Computational Fluid Dynamics, TheFinite Volume Method", Longman Scientific & Technical, England, pp. 103-133 .
210 Nuclear Energy in Central Europe '98

SI0100112
Nuclear Energy in Central Europe '98
Terme Catez, September 7 to 10, 1998
Shape and Stability of the Bubble Moving Through the ViscidIncompressible Fluid
G. Cerne, S. Petelin, I. Tiselj
Reactor Engineering Division, "Jozef Stefan" Institute, Jamova 39, 1000 Ljubljana, [email protected] stoian.petelin(a),iis.su iztok.tiseli(a>iis.si
AbstractInterface tracking algorithm called Volume of Fluid (VOF) [6] method is used for the
simulation of the single bubble motion through the viscid incompressible fluid due tobuoyancy force. The shape of the bubble is examined at several Reynolds and Webernumbers. The results of the simulations are qualitatively compared to the experimental datafrom the literature [2]. The numerical calculation of the size of the maximal stable bubble isgiven as an example. The result is compared to the RELAP5 empirical correlation [5].
Introduction
Two-phase flow is a very complex phenomenon and its simulations play important role innuclear power safety. The complications are mostly connected with interfaces between fluids.During their motion caused by instabilities and turbulence the position of the interfacechanges, deforms or splits into several smaller pieces. Many physical phenomena like phasetransition, heat and mass transfer, ... depend on the position and shape of the interface,therefore the accuracy of the numerical simulations of the two-phase flow phenomenasignificantly depends on the way of the interface modeling.
The first models of the two-phase flow were so the called "two-fluid models". They arebased on simplified equations [3] where the interface is not calculated explicitly. Thesemodels, which are still in use today, enable ID modeling of the two-fluid transients. Suchsimulations are very fast and can be applied to a very wide range of problems. The shortage of"two-fluid models" is that they use a lot of empirical correlation to simplify the two-fluid flowcalculation. Since these correlations are obtained from experimental measurement, they havelimited accuracy and are the major source of errors in the calculation.
The aspiration of the computer code developers was to make a useful two-fluid algorithmindependent from the empirical correlation. The progress of computer performance andnumerical techniques in last decades enabled the use of interface tracking models in the two-fluid flow simulations. These algorithms are based on fundamental Navier-Stokes equationsand therefore their accuracy depends more on the numerical scheme than on the accuracy ofthe mathematical model. Their main characteristic is explicit tracking of the interface andpreserving its sharpness all the time of the calculation. A sharp interface is needed foraccurate location of the fluids and for the direct simulation of the surface phenomena such as
Nuclear Energy in Central Europe '98 211

surface tension. Development of the interface tracking algorithms is still in progressworldwide and currently they are mostly applied to fundamental two-fluid flow problems likelaminar stratified flow, motion of a single bubble..., [7], [8], [9].
Volume of Fluid method (VOF) [6] is one of the well examined and established interfacetracking algorithms and successfully handles the problems with the surface topologicalchanges like separation or unification of several parts of the surface. VOF method was appliedfor the simulation of a single bubble motion without heat transfer in this paper.
Bubbly flow is an important regime of the two-phase flow in nuclear power safety. "Two-fluid models" in use do not calculate the shape and motion of every bubble separately in thebubbly flow. They treat the whole population of bubbles by considering their commoncharacteristics. But some characteristics depend on the single bubble properties. "Two-fluidmodel" computer codes like RELAP5 [5] determine these properties on the base of empiricalcorrelations. The VOF method may help determining the correlations numerically.
Equations
The two-fluid flow is described by the Navier-Stokes system of a continuity, momentumand energy equation. In this paper dealing with the single bubble dynamics the energyequation is omitted since the phase transition and heat transfer were neglected. For the two-dimensional incompressible system of fluids the following continuity and momentumequation are used:
V - M - 0 , (1)
p-^- + p{u -V)w = pg-Vp + V-(juD} + a/cd(fXx,z))n, (2)
where ii - (w, v) is velocity of the fluid, p is its density, p is pressure field, p is fluidviscosity and D is viscous, stress tensor and g is gravity. A surface tension is important inthe two-fluid system. Since this singular force acts only on the interface it is included in themomentum equation (2) in the form of Dirac delta d{fs) function. This force is representedby last term on the right hand side of the equation (2), where, cr is surface tension coefficient,*: is curvature of the surface, n is the unity vector perpendicular to the surface andfs{x,z)~ 0 is equation of the surface. The system of equations (1) and (2) is discretized intwo dimensions with the second-order spatial and first-order accurate temporal discretizationscheme and solved numerically with the projection method [4].
Volume of Fluid (VOF) method
In order to mitigate the numerical diffusion at the fluid interface, the interface trackingalgorithm is applied for the simulation. Such algorithm explicitly calculates, the position of theinterface and keeps it sharp during the simulation. Among variety of algorithms VOF methodwas shown to be suitable for simulations of complex interface shapes [9], [10]. This algorithmintroduces a space dependent variable F , which assigns the volume portion one of the fluidsthat occupies particular point with the following values:
212 Nuclear Energy in Central Europe '98

discretization cell occupied by the first fluid,
= <j 0, discretization cell occupied by the second fluid, (3)
[0 < F < 1, discr. cell occupied by both fluids, F is the portion of the first fluid.
An example of two-dimensional two-fluid area is shown in Figure 1. The gray area isoccupied by first fluid and the white area by the second one. The discretization mesh is putover the observed field and the appropriate values of F - volume portion of the first fluid -are written in each cell. The interface crosses the cells with volume portion 0 < F < 1. Thevalues of F are used for the interface reconstruction which is necessary for the interfacetracking. The reconstruction process is not unique. There are several kinds of algorithmswhich differ in accuracy and complexity.
Interface reconstruction
0.4
, , 1.0 , •
" ' 1.0
0.07
-;• a o "*
0.0
• \
0.7 \
Figure 1: Two-fluid area covered with discretizationmesh
Figure 2: The numerical reconstruction of the interface
The FLAIR algorithm [1] is used for the reconstruction of interface. An example of thisalgorithm is shown in Figure 2 where interface of two-fluid area from Figure 1 isreconstructed. The FLAIR algorithm puts the interface segments over the cell boundaries(thick black lines in Figure 2).
Calculation of the interface motion
The shape of interface is changing with the evolution of the field F . The time dependenceof F is governed by the conservative equationdF
V-(vF)=0 . (4)
To reduce the numerical diffusion of F and therefore to preserve the sharpness of thesurface the discretized equation (4) is written in the form
(5)
Nuclear Energy in Central Europe '98 213

Ax
uAt
0-u) 0'.*)
", -Ax
Figure 3: Transmitted portion of the first fluid over the cellboundary
where hXJ_y2k is a flux of the first fluid
volume portion across the boundarybetween cells (j-\,k) and (j,k)(Figure 3). Figure 3 represents a pairof cells with reconstructed interface,where the gray area signs the first fluidand the white area the second one. Thedarkest area signs the volume of thefirst fluid, which will cross the cellboundary in the next time step. It iscalculated after the surfacereconstruction
(6)
where a and b are calculated by interface reconstruction algorithm FLAIR [1].The interface reconstruction is used also for the modeling of the surface tension forcedescribed in [11].
Results
A bubble motion is simulated in the section of a vertical channel. The fluid flows throughthe channel. Bubble is accelerated upwards by the constant pressure drop. The velocity of thesurrounding fluid is regulated by the gravitational force in the way that the bubble stays on thespot and the stationary state is reached.
The state of the bubble in the two-fluid system is described with Reynolds and Webernumbers:
Re =
We =
2RUpf
2Rpf U2
a
(7)
(8)
where R is the equivalent radius of the bubble, U its velocity, a is the surface tensioncoefficient, pf and juf are density and viscosity of the surrounding fluid respectively. Thevelocity of the bubble was determined from the velocity of the surrounding fluid at the outletof the channel.
For determination of the system state the fluid to bubble density ratio PffPb = 50 a ndfluid to bubble viscosity ratio Mf/^b = 50 w e r e applied for all calculations.
The shapes of rising bubbles in viscous liquids have been determined for a wide range ofReynolds numbers. The flow field around a rising bubble is visualized with streamlines. Thesurface is drawn with a thick line.
In Figures 4 and 5 the stationary streamlines and pressure field of a bubble at smallReynolds and Weber number is presented. The shape of the bubble is nearly circular and thepressure in its interior is higher due to the surface tension. Two vortices appear inside thebubble.
214 Nuclear Energy in Central Europe '98
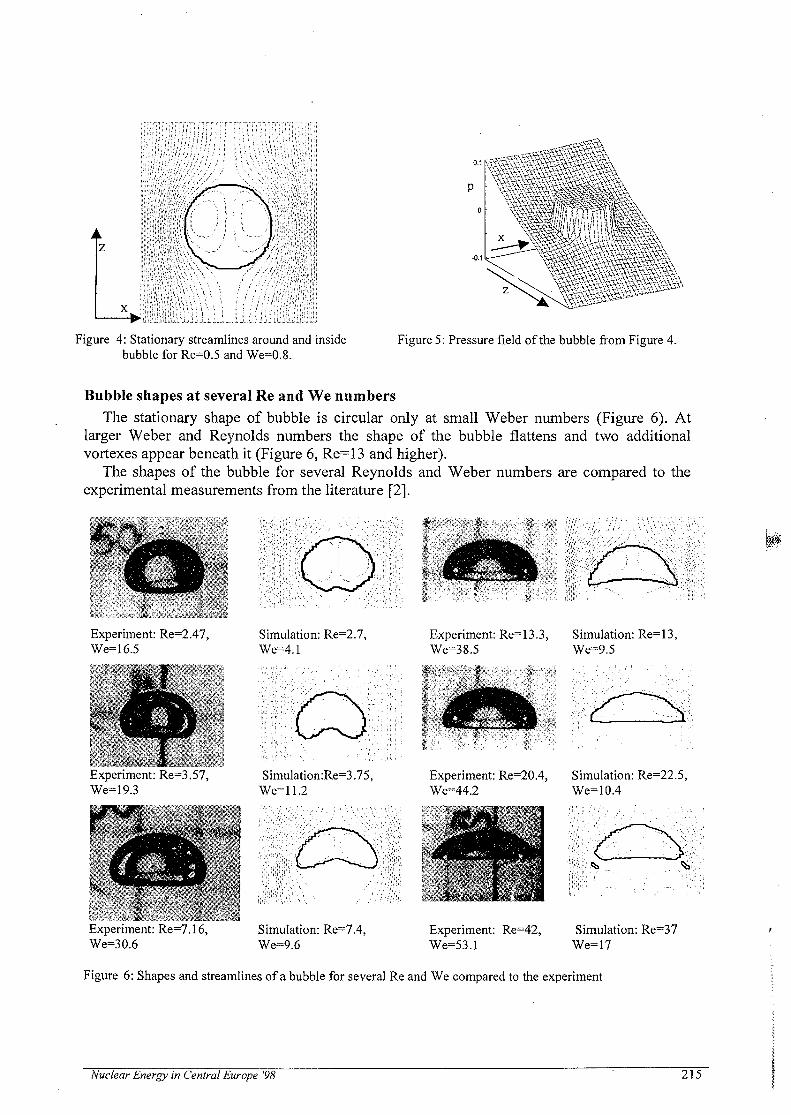
,v
Figure 4: Stationary streamlines around and insidebubble for Re=0.5 and We=0.8.
Figure 5: Pressure field of the bubble from Figure 4.
Bubble shapes at several Re and We numbersThe stationary shape of bubble is circular only at small Weber numbers (Figure 6). At
larger Weber and Reynolds numbers the shape of the bubble flattens and two additionalvortexes appear beneath it (Figure 6, Re=13 and higher).
The shapes of the bubble for several Reynolds and Weber numbers are compared to theexperimental measurements from the literature [2].
Experiment: Re=2.47,We=16.5
Experiment: Re=3.57,We=19.3
Simulation: Re=2.7,We=4.1
Simulation:Re=3.75,We=11.2
Experiment: Re=13.3,We-38.5
Simulation: Re=13,We=9.5
Experiment: Re=20.4, Simulation: Re=22.5,We=44.2 We=10.4
Experiment: Re=7.16,We=30.6
Simulation: Re=7.4,We=9.6
Experiment: Re=42, Simulation: Re=37We=53.1 We=17
Figure 6: Shapes and streamlines of a bubble for several Re and We compared to the experiment
Nuclear Energy in Central Europe '98 215

Shapes and terminal rise velocities have been correlated. At smaller values of Reynoldsnumber the bottom part of the bubble first curves into the interior of the bubble, then with theincrease of the Reynolds number its shape flattens. The concavity appears in experiment too,but it is not seen clearly on the photos due to the spherical shape.
The stable state for Re=42, We=53.1 (last example in Figure 6) could not be achieved,because the simulated bubble broke up into several smaller and stable bubbles.
The shape of the bubble in the simulation is similar to the experimental one at smallerWeber number, since at the simulation the bubble is cylindrical and surface tension hassmaller effect than in the experiment.
Despite the fact that the simulation has been modeled in two-dimensional Cartesiansystem, while on the other hand the experimental bubble is three dimensional, the comparisonshowed up to be reasonable and gave good agreement.
Bubble breakupAt large Reynolds and Weber number the bubble is not stable and breaks up into several
smaller and stable bubbles. Time sequences of a bubble break up with no surface tension(We~<x>, Re = 29) are presented in Figure 7. When neglecting surface tension the bubble isstable only at zero velocity. Since there is no force to keep the bubble together, small parts ofthe bubble start to fragment. Since the Reynolds number is very large, the bubble during thetransient at time t=1.8 separates into the two parts and then continues to decay.
Figure 7: Bubble break up when neglecting surface tension phenomena (We = °o, Re = 29)
In Figure 8 the bubble breakup for surface tension larger then zero (We=61, Re=29) ispresented. At the beginning of the simulation the bottom part of the bubble becomes concavethen the edges branch off the bubble. The resulting bubbles are stable and do no decay anymore.
For the unstable states the Reynolds and Weber numbers of the bubble cannot bedetermined, because the bubble velocity is not constant. Those values are given only fororientation and are calculated from the bubble size at the beginning of the calculation and thebubble velocity at the end of the calculation.
216 Nuclear Energy in Central Europe '98

Figure 8: Bubble break up for Re=29, We=61
Calculation the bubble stabilityThe simulation of the bubble break up using the VOF method can be applied for
calculating the size of the maximal stable bubble. The size of the maximal stable bubble isvery important in "two-fluid model" computer codes like RELAP5. From this parameter thesize of the interfacial area is calculated. And then further the heat transfer correlations and therate of phase-transition depends on the interfacial area.
A simple example of such calculation is shown in Figure 9 where calculated stable andunstable states are put in the We-Re diagram.
80'• stable states
O unstable statesWe
60-
40-
20-
o -We=10 i
o
o o oo 0
10 20 30 40 Re 50 60
Figure 9: Stable and unstable bubble states in We-Re diagram
The results of the numerical simulation show that there is no stable state for the We > 15.For 8<We<\5 stable and unstable states of the bubble exist and for We < 8 the bubbles arestable. This result is compared to the RELAP5 corresponding correlation which states thatonly bubbles with We < 10 exists.
The RELAP5 correlation is very simple and not very accurate but good enough for thesimulation of wide range phenomena in two-phase flow. The VOF method can be used fordetermining the accuracy and the improvement of such correlation.
Nuclear Energy in Central Europe '98 O T 7

Conclusions
The paper deals with the simulation of a two-fluid flow with the interface tracking methodcalled VOF. This method was shown to be very efficient for modeling of two-fluid problems,where the components are clearly separated by the interface. An example of such problem ismotion of the single bubble through the denser fluid due to the buoyancy force. Thedependence of the bubble shape on its velocity and surface tension is examined and the resultsare compared to the experiments. The comparison showed good agreement despite the factthat the simulation was performed in two Cartesian dimensions while real case is three-dimensional spherical bubble.
The simulation of the bubble break up at large velocity demonstrated the ability of theVOF method to handle the problems with topological changes of the surface. The bubblestability is tested for a wide range of Reynolds numbers and the result is compared to theempirical correlation used by the RELAP5 computer code. The comparison shows a certaindisagreement. Despite the fact that the simulation is only two-dimensional, it shows existenceof the bubbles at higher Weber numbers then they are allowed by the RELAP5 correlation.
The interface tracking algorithms are very slow and currently cannot be used for thegeneral two-fluid problems. However they can be used in the cooperation'with the "two-fluidmodel" computer codes for testing the accuracy of the empirical correlation and theirimprovement. In the future with the computer hardware development more and wider range ofthe two-fluid flow problems will be carried out by the interface tracking algorithms.
References[I] N. Ashgriz, J. Y. Poo, FLAIR: Flux Line-Segment Model for Advection and Interface
Reconstruction, J. Comp. Phys. 93 (1990), 449-468[2] D. Bhaga, M. E. Webwe, Bubbles in viscous liquids: shapes, wakes and velocities, J.
Fluid Mech. 105 (1981), 61-85[3] M. Bottoni, W. Sengpiel, Review of Mathematical and Physical Basis of Two-Phase
Flow Modelling, Institut fur Reaktorsicherheit, Kernforschungszentrum, Karlsruhe,1992
[4] C. A. J. Fletcher, Computational Techniques for Fluid Dynamics, Vol. I-II, SpringerFerlag Berlin Heidelberg 1988
[5] The RELAP5 Code Development Team, RELAP5/MOD3 Code Manual, Vol. IV:Models and Correlations, Idaho National Engineering Laboratory, June 1995
[6] C. W. Hirt, B. D. Nichols, Volume of Fluid (VOF) Method for the Dynamics of FreeBoundaries, J. Comp. Phys. 39 (1981), 201-225
[7] M. Sussman, P. Smereka, S. Osher, A Level Set Approach for Computing Solutions toIncompressible Two-Phase Flow, J. Comp. Phys. 114 (1994), 146-159
[8] J. U. Brackbill, D. B. Kothe, H. M. Ruppel, FLIP: A Low-Dissipation, Particle-in-CellMethod for Fluid Flow, Comp. Phys. Comm. 48 (1988), 25-38
[9] E. G. Puckett, A. S. Almgren, J. B. Bell, D. L. Marcus, W. J. Rider, A High OrderProjection Method for Tracking Fluid Interfaces in Variable Density IncompressibleFlows, J. Comp. Phys. 130 (1997), 269-282
[10] B. Lafaurie, C. Nardone, R. Scardovelli, S. Zaleski, G. Zanetti, Modelling MergingFragmentation in Multiphase Flows with SURFER, J. Comp. Phys. 113 (1994), 134-147 ̂
[II] G. Cerne, Modelling of two-fluid flow with interface, M.Sc. Thesys, Faculty ofMathematics and Physics, University of Ljubljana, 1998
218 Nuclear Energy in Central Europe '98

SI0100113
Nuclear Energy in Central Europe '98
Terme Catez, September 7 to 10, 1998
BETHSY ISP-38 FLOW BEHAVIOUR IN HOT LEGStojan Petelin Mihael Jurkovic
Institute Jozef Stefan, Reactor Engineering DivisionJamova 39, pp. 3000
1000 Ljubljana, SloveniaPhone: 386-61-1885-450; Fax: 386-61-161-22-58
[email protected]. Mihael,[email protected]
1. ABSTRACTBETHSY Test 6.9c OECD ISP-38 RELAP5/MOD3.2 input model was developed and simulationperformed for loss of RHR system during mid-loop operation. Initial liquid level in RCS was athorizontal axis of the hot legs. Pressurizer and steam generator manways were opened 1 s after thetransient was initiated. Secondary side is full of air and isolated. Results of calculations were satisfiedexcept in surge line and in pressurizer where larger amount of water is presented. Liquid wasentrained in that part of the system during bubbly or varies stratified flow in the hot leg. Due to non-physical results in hot leg pipe with connected surge line and pressurizer, RELAP5 horizontalstratification model deficiencies was studied and possible improvements investigated.
2. BETHSY FACILITY AND RELAP5 RESULTS OF THE TEST OECD ISP-38BETHSY facility is located at Centre D'Etudes Nucleaires de Grenoble (France). It is a
1/100 scaled down model of 2775 MWt Framatome PWR power plant with full plantelevation temperature and pressures preserved. BETHSY is designed to simulate most ofaccidents, which may occur in PWR, and to study the accident management procedures. It isrelatively large facility and well equipped with sophisticated measurement system.
Initial masses, temperatures and pressures in the system for the Test 6.9c and RELAP5model are presented in Table 1. Coolant was symmetrical distributed in each loop and levelwas at the horizontal axis of the hot leg. Temperatures were around 100°C and pressure wasapproximately 1 bar in primary system. RCS was opened with two manways: above thepressurizer and under steam generator 1. Decay heat in the core was which corresponds to 0.5% or 138 kW of nominal 27.75 MW. Secondary side were full of air and isolated.
Initial conditions of the test calculated with RELAP5/MOD3.2 are presented withNuclear Plant Analyser (NPA) graphical postprocessor on Figure 1.
i% liquid
tima
two phase , |
I I steam.
Figure 1. Initial Conditions from Test ISP OECD-38 based on calculation with RELAP5/MOD3.2
Nuclear Energy in Central Europe '98 219

Table 1: Initial masses, voids, temperatures and pressures for Test 6.9c: experimental values and REL4P5model
upper plenum pressurecore power
primary mass inventoryvessel mass inventory
hot leg void fractioncold leg void fraction
loop mass inventory [kg]intermediate leg level [m]
upper plenumupper headpressurizer
lower plenumcore heated length
downcomer
hot legintermediate leg
cold legSG U-tubes
TEST j1.04 bar0.0 W
1085.0 kg700.0 kg
loop 10.590.
127-0.031
loop 20.55
0.129
0.004
Fluid temp. [°C]
10210410110110299
;io6-iwall?'10510494104
$M
1029993-
loo
10510995102
loop 30.52
0.129
0.004
Wall temp. [°C]
109103104104
-101
v.Wfluid10110393-
WMl;1041059799
p3fluid;9910293-
RELAP5 model1.0244 bar
0.0 W1090 kg674 kg
loop 10.66
0.137
-0.015
loop 20.520.
1360.005
loop 30.500.
1420.005
Fluid and wall temp.
rci100101100102102101
10010093100
ii>pl!KiKiKlS
10010193100
ttftii!991009099
Figures 3 to 6 show some variables from the calculations in comparison withexperimental values. Most of them show satisfactory agreement.
Core Cladding Temperature at 3.600m [K] TCM28 Primary Coolant System Mass [kg] MCP
-1000 0 1000 2000 3000 4000 5000 6000 7000 8000 9000 10000
Time (5J1000 2000 3000 4O0O 5000 6O00 7000 8000 9000 10000
Time [s{
Figure 2: Core cladding temperature TCM28 Figure 3: Primary coolant system mass MCP
The core cladding temperature at 3.600m height is presented in the Figure 2. The peaktemperature is delayed for approximately 300 seconds and the highest temperature is 15°Clower than in experiment. The primary coolant inventory is predicted very similar to theexperiment. In general the agreement is satisfactory. The timing "of gravity feed (Figure 3)initiating was also delayed as core temperature (Figure 2).
220 Nuclear Energy in Central Europe '98

Time integrated SG manway total mass flowrateMSGMT
< • • 7 0 O - ,
Pressurizer and Surge line mass MPRZ
• 1000 0 1000 2000 3000 4000 5000 6000 7000 80CO 9000 10000 -1000 0 1000 2000 3000 4000 5000 6000 7000 8000 9O0O 10000
Figure 4: Time integrated SG manway total mass Figure 5: Pressurizer and Surge line mass AAPRZflow rate AAS&MT
Figure 4 shows time integrated SG manway total mass flow rate in comparison with theexperiment. Agreement between both curves is satisfied especially in the first 6000 seconds.Underprediction of SG manway flow after 6000 seconds of transient time comes fromdisagreement in liquid level in vertical part of the cold leg.
Figure 5 presents main problem of our calculation. Pressurizer mass of liquid shows tohigher value after 1500 seconds of transient. We are satisfied with differential pressure insurge line and pressurizer until 1200 seconds of transient. But last peak is to high and remainsto high for next 6000 seconds. Pressurizer mass decreasing between 1200 and 6000 secondsof transient is too slow comparing to the experiment. Almost the same phenomena showpressurizer and surge line differential pressure.
Figure 6 presents flow regime in volume 603-05 withpressurizer and surge line mass for the first 2500 seconds oftransient. Flow regime presents black curve and is calculated withRELAP5/MOD3.2 in the volume connected to the surge line(V603-05). Value 12 is horizontal stratified flow; value 5 means slugflow and value 4 is bubbly flow. Grey curve is pressurizer and surge line mass. It is shownthat entrainment into the surge line happened when the flow regime in hot leg is bubbly orslug (Flow regime 4 and 5).
Value:
12
54
Flow regimeHorizontalstratified
SlugBubbly
Flow regime in V603-05 and MPRZ
80.0
-- 70.0
-- 60.0
- FloregMPRZ-R5
•MPRZ-EXP
a0.0 S-10.0
-500 0 500 1 0 0 0Time[s] 1 5 0 0 2 0 0 0 2 5 0 0
Figure 6: Flow regime in hot leg (V603-05) and coolant mass of pressurizer and surge line (AAPRZ)
Nuclear Energy in Central Europe '98 221

Figure 7 shows void in hot leg 1 at experiment and RELAP5 calculation in first 2500seconds. Average calculation values are gradually under experimental data.
Hot leg voids
HL void EXP~HLvoidR5
0.0 500.0 1000.0 1500.0Time [s]
2000.0 2500.0
Figure 7: Hot leg voids for "BETHSY" mid loop operation test
It was suspected that wrong predicted phenomenon of large amount of water liquidcoolant in surge line comes from too high level of coolant in the hot leg or incorrectstratification model. According to Figure 7 RELAP5 simulation shows lower void fraction inhot leg. In spite of lower void fraction liquid entrained the surge line and pressurizer. Thusonly hot leg model was excluded from the whole BETHSY facility model to analysephenomena in detail.
3. RELAP5 MODEL OF HOT LEG WITH SURGE LINE AND PRESSURIZERModel of the hot leg contains the horizontal part of the hot leg, surge line, pressurizer
and pressurizer manway. Nodalization of the hot leg No. 1 model is presented in Figure 8.surge line
01 02 04 05 01 02 03 04 05
TDV500 V603 V602 TDV700
Figure 8: Nodalization of separated hot leg model
RELAP5 transient run was divided in the following steps:> reach right steady state conditions (vapour void fractions around 0.58 in hot leg)
with pressure equal in both sides of the hot leg (TDV500 and TDV700) from 0 to1000 seconds
^ slowly linearly increase of differential pressure between both time dependentvolumes (0.5 Pa in 1 second) and keeping initial void fraction in volumes 602 and603 the same from 1000 to 1500 seconds
> void fraction linearly increase from 0.58 to 0.99 from 1500 to 4500 seconds atconstant differential pressure
222 Nuclear Energy in Central Europe '98

> experimental data of void fraction was used as boundary and initial condition involumes TDV500 and TDV700 as linear increasing of void and pressuredifference
There were huge problems with RELAP5 calculation of the initial steady state conditionin the hot leg. System becomes unstable at the start of second phase as can be seen from thediagrams (Figure 9 and Figure 10). Bubbly flow appears in few calculations time steps.
non physicalinstabilities
Void in hot leg at Ap=250 Pa
603-01603-02
---603-03— 603-04
603-05
Start of the1. phase (0 s)
Start of the2. phase (1000 s)
Start of the3. phase (1500s)
4500
[s]
Figure 9: Void fractions in the hot leg with differential pressure 250 Pa
eI
10 -
8-
6-
2 -
0-
-4-—'
Flow regime
.—-—-~, •
in V603-05!i
i1
i
bubblyflow
I
S
—dp=250Pa|
1000 1500 2000 2500 3000Time [s]
3500 4000 4500
Figure 10: Flow regime in V603-05 at Ap=25O Pa
Nuclear Energy in Central Europe '98 223

Vapour void fraction was stabilised close to value 0.58 in all five volumes as was inexperiment. Horizontal stratification model in RELAP5 computer code or criterion betweenthe horizontal stratified and bubbly is [3]:
vg~
vf > Vcn,
1Y crit ,*.
\(P,
Vcn< IS
-P.\pt-D-
calculated as
g-ag-A
sin©
1/2
( 1 - cost
(1)
(2)
Vapour area =
Liquid area = CCf- A
+ a'f'Pf [kg/m2s\.Average mixture mass flux satisfies the
condition Gm < 3000 kg jm2s calculated as Gm -ag- pg
Model of Taitel/Dukler [3] is used in RELAP5 computer code. RELAP5 model has twodeficiencies [7]:
> model does not include phenomena influence by surface tensions
> phenomena in non-linear region are not considered (such as wave breakshappened before the wave reach the top of the pipe)
Those two deficiencies could have influence on stratification model in horizontal pipe.Unstable area on Figure 11 and Figure 12 means that flow can not be stratified any more andsmall disturbances of the flow can induce Kelvin-Helmholtz instability.
No surface tension
Stable area
Figure 11: Unstable disturbance area without surface tension taken into account [9]
a means surface tension, k is wave vector, v, is velocity of each component, p isdensity and g is gravity constant. Wave vector [9] should have values described as
k>a.
with a, = and a2 -•P\ + P2 P\ + P2
where p is angle between the direction of k and velocity v. Minimum of wave vectorshould be
> •• or when the wave vector has the same direction as velocity v.
Figure 11 shows unstable disturbances area without included surface tension. Unstablestratified flow is possible at any (g • Ap)/\p • (v - vf f j if the k is adequate-. System is moreunstable at larger k or when the wavy length limits to zero. System becomes more stable withlarger density difference (p, - p 2 ) or smaller velocity difference \yg -vf).
224 Nuclear Energy in Central Europe '98

With surface tension
| Stable area~|
• ^ ^ '
| Unsfeible area
aAp-g
- = 0.01
I
i
Figure 12: Unstable disturbance area with surface tension taken into account [9]
Figure 12 shows example when surface tension is included in the model. It is connectedwith factor cr/{Ap • g). Dashed line means lower surface tension and filled line means biggerone. If the surface tension is included, system could be stable and factor
(g • &p)/\p • \vg - Vj f J could reach value where is no unstable area.Both are not considered in the RELAP5 criterion, but in some regions of two-phase
flow it might have significant effect on transition from stratified to bubbly flow.Curves for four different models are presented on Figure 13. The models are
Taitel/Dukler [3], Mandhane [4], Baker [5] and Weisman [6].OAOr-r-T-r-r-r-r-r-r < , -r-r-T-r-r-r-r -[—r-
Vf
[m/s]
0.35
0.30 -
0.25u
Model of Taitel/DuklerModel of MandhaneModel of BakerMode! of Weisman
O.OOJ-10 20 25
vg [m/s]30 35 40
Figure 13: Comparison of calculated transit ion curves fo r air-water mixtures at 1 bar and 20°C f o r a 50 mmpipe with the models of Taitel /Dukler [3 ] , Mandhane [4 ] , Baker [5 ] and Weisman [6 ] ( f rom Ref. [2]).
On the Figure 13 are presented three curves for each model. Curves are betweenpartially wetting (stratified flow) and complete wetting (intermittent flow and annular flow)regions. All curves came together in the point TMOdei. Deviation between different models inth'e point of same meaning is more than 200%. That is the main reason why we can not easilychose one model and calculate.
Horizontal stratification criterion in RELAP5 the velocities of each phases are not themost important. Absolute value of difference between single-phase velocities (1) should belower than vcrit (2) for horizontal stratified flow.
Nuclear Energy in Central Europe '98 225
4. CONCLUSIONSA horizontal stratification at lower pressure close to atmospheric has to be further
investigated what is confirmed with large uncertainty of different authors results. RELAP5model seems to be to simple for calculation complicated interacting phenomena in horizontaltwo-phase flows. It is suspected that inappropriate RELAP5 stratification model causedproblems at our calculation of "BETHSY" mid loop operation.
Figure 9 and Figure 10 shows instabilities in calculations at the beginning of secondphase increasing differential pressure in the hot leg pipe using extracted model of it. Theinstabilities have not been physically explained in RELAP5/MOD3.2 code.
The influence of consideration surface tension of stratified flow on stability is shown inFigure 11 and Figure 12. Correction of RELAP5 stratification model in this direction maysignificantly improve the calculation results.
Four models of different author of horizontal stratification are presented in Figure 13.The viewed differences between them are too huge to choose anyone easily for ourapplication. It should be carefully investigate which is the most appropriate for hot legstratification mid loop operation problem.
5. REFERENCES
[1] ISP 38 Comparison Report (Draft version 1.2), Vols. 1 & 2.; safety and Performance Services,AEA Technology pic, A32, Winfrith, Dorchester, Dorset DT2 8DH, U.
[2] Geskes P.: Flow Pattern Map for Air-Water Mixtures and High Pressure Steam Water Mixtures inHorizontal Annular Geometry; 3rd International Conference on Multiphase Flow, ICMF '98; Lyon,France, June 8-12, 1998
[3] Taitel Y. and A.E. Dukler: A Model for Predicting Flow Regime Transition in Horizontal and nearHorizontal Gas-Liquid Flow; AlChE J., 22(1): 47-55, 1976
[4] Mandhane J.M., G.A. Gregory and K. Aziz: A Flow Pattern Map for Gas-Liquid Flow in HorizontalPipes; Physico Chemical Hydrodynamics, 6(1): 197-206, 1985
[5] BakerO.: Simultaneous Flow of Oil and Gas; Oil Gas J., 53:185-195, 1954
[6] Weisman J., D. Duncan, J. Gibson and T. Crawford: Effect of Fluid Properties and Pipe diameteron Two Phase Flow Pattern in Horizontal Lines; Int. J. Multiphase Flow, 5:437-462, 1979
[7] Cerne G: Modeling of two-fluid flow with interface, M. Sc. Thesis (in Slovene), University ofLjubljana, Slovenia, 1998
[8] Mavko B., S. Petelin, B. Koncar: "BETHSY" Analysis of the Upper Head Bypass During LowForced Circulation, 6th international Conference on Nuclear Engineering - ICONE-6465; May 10-14 1998, San Diego, California, USA
[9] Chandrasekhar S.: Hydrodynamics and Hydromagnetic Stability, Oxford at the Cladrendon Press,1961
226 Nuclear Energy in Central Europe '98

SI0100114
Nuclear Energy in Central Europe '98
Terme Catez, September 7 to 10, 1998
RELAP5 New Steam Generator Model for Krsko NPP
Samo Hrvatin, Stojan Petelin, Matija Tuma*»Jozef Stefan« Institute, Ljubljana, Slovenia
* University of Ljubljana, Faculty of Mechanical Engineering
Abstract
The model of the new Siemens steam generator for Krsko NPP is described. The existentsteam generators at Krsko NPP will be replaced because of degradation and relatively hightube plugging. The new RELAP5 model has been developed to verify the influence of thenew steam generator on plant safety. The modelling of the new steam generator is describedfirst. The description of performed calculations and conclusion follows. Observed is relativelylarge discrepancy of various results.
1. Introduction
Tube plugging in Krsko nuclear power plant approached close to 18 % which represents aBOP limit, although the licensing limit for safe operation of the power plant is 24 %. For thisreason, the existent steam generators will be replaced. The replacement will be used also forincreasing the power of the plant for approximately 6 %. Outside dimensions of steamgenerators will remain the same, but the internal geometry and arrangement will be changed.Whenever the changes are made on nuclear power plant systems their influences on plantsafety must be verified. Therefore, we have developed the model for new Siemens' steamgenerator for the computer code RELAP5.
2. Steam generator modelling
All necessary data from Siemens' documentation has been collected and database has beenestablished. The model has been developed in three versions and that as the basic model andtwo improved more detailed models. Nodalizations for all three models are shown on figures1, 2 and 3 respectively.The inlet and outlet chamber are modelled each with one single volume (308, 312) and Utubes with one PIPE component (310). All U tubes are joined into one tube whose cross areais equal to the cross area of all tubes. The temperature gradient in each volume of U tubes issuggested to be around 2 K [5]. U tubes' volume borders coincide with volume borders ofriser channel volumes (volume borders are support plates).
Nuclear Energy in Central Europe '98 227

Riser channel is modelled as one PIPE component (330) at model A and B, and two PIPEcomponents at model C (330, 331) respectively.Separators above riser channel are joined into one SEPARATR component (332), whose areais equal to all 48 vertical separator tubes. Considering an ideal separator, which means that allwater from separator returns to the downcomer channel and all steam flows to steam dome,steam dryers are not included in the model. Water from separator flows to volumes 334 and336 and mix itself with the feed water in volume 340.01, and one part of water flows tovolume 350 respectively. The volumes 350 and 352 represent by-pass of separator.Downcomer channel has an annular shape and is modelled as one ANNULUS component(340).Steam dome is modelled as two single volumes (354, 356). The feed water inlet is alsomodelled with two single volumes (322, 324). An artificial feeding is added to the model forthe steam generator water level setting. Heat transfer and accumulation are modelled withheat structures, which are connected on volumes.
'06 07^/
/
/{////
05
04
03
02
01
310
08
09
10
11
12
•
311 j ,
LEGEND
[ | single wjtune
a ims dependentwhjms
>• single junctionlime dependent
— -1 iuncfoi
—X— crossjuncSon
!//A heslsttuclure
Figure 1: Model A - basic model
3. Calculations with RELAP5 computer code
Steady state RELAP5/MOD3.2 calculations have been performed using all three models.Siemens' and Westinghouse's new steady state data have been applied as boundary conditions(primary coolant flow and pressure, hot leg temperature, feedwater inlet temperature andsteam pressure). As primary coolant flow we used thermal design flow at Siemens' data andbest estimate flow at Westinghouse's data. Fouling factors were 0,0000088 m2 K/W and
228 Nuclear Energy in Central Europe '98
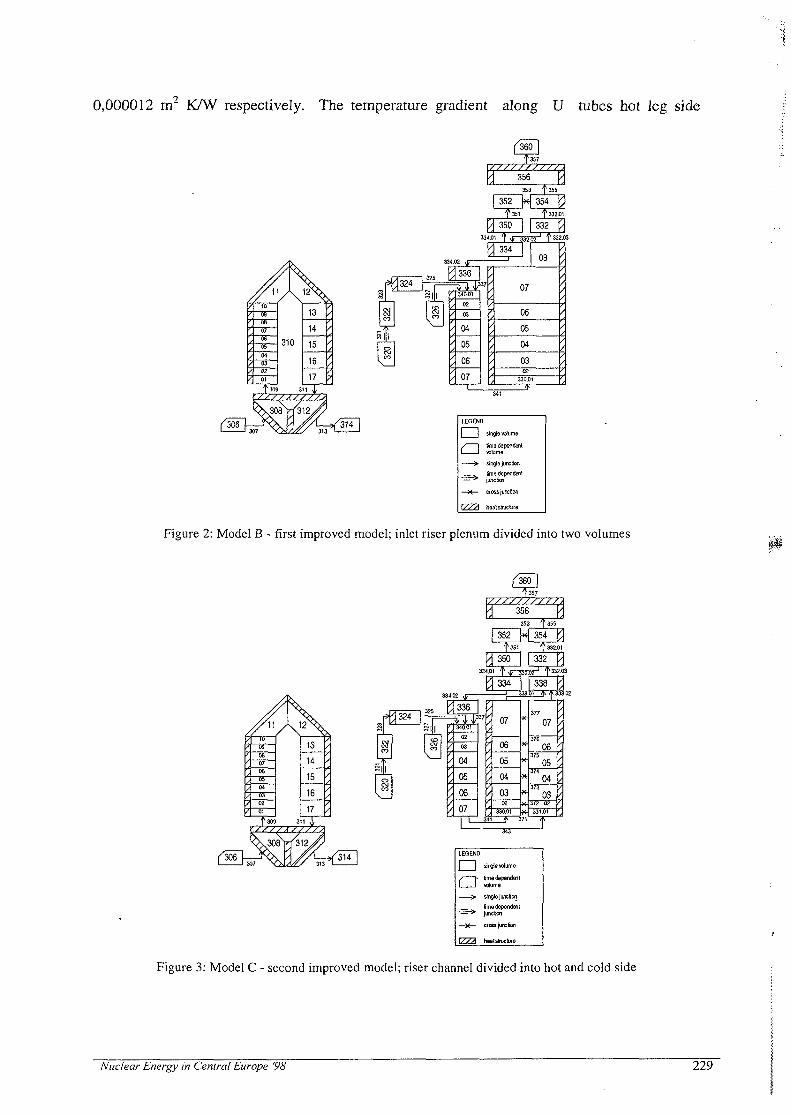
0,000012 m2 K/W respectively. The temperature gradient along U tubes hot leg side
354
332
///
1009OtS07OSOb04030201
310
13
14
15
16
17
///
/////7
311 j,
334.02 j ; I\\ 336 |
-—U 1 1337
340.01
03
04
05
; 06
- 07
\ 334 |oa ^
', 07 ',
06
; 05 J
/ 04 ^
' 03 /02 ^
/ 330.011 *
LEGEND
•a time dependent
wlume> single juris don^ fima depentJent
— -* juncticn
— X — cross jure Son
Figure 2: Model B - first improved model; inlet riser plenum divided into two volumes
12
//
to090807060&04VA0201
13
14
15
16
17
/
//////
LEGEND
•a—>
T777
sing!e\dume
time dependentvolume
single junction
ima dependentjunction
cross jurcfion
teat structure
Figure 3: Model C - second improved model; riser channel divided into hot and cold side
Nuclear Energy in Central Europe '98 229
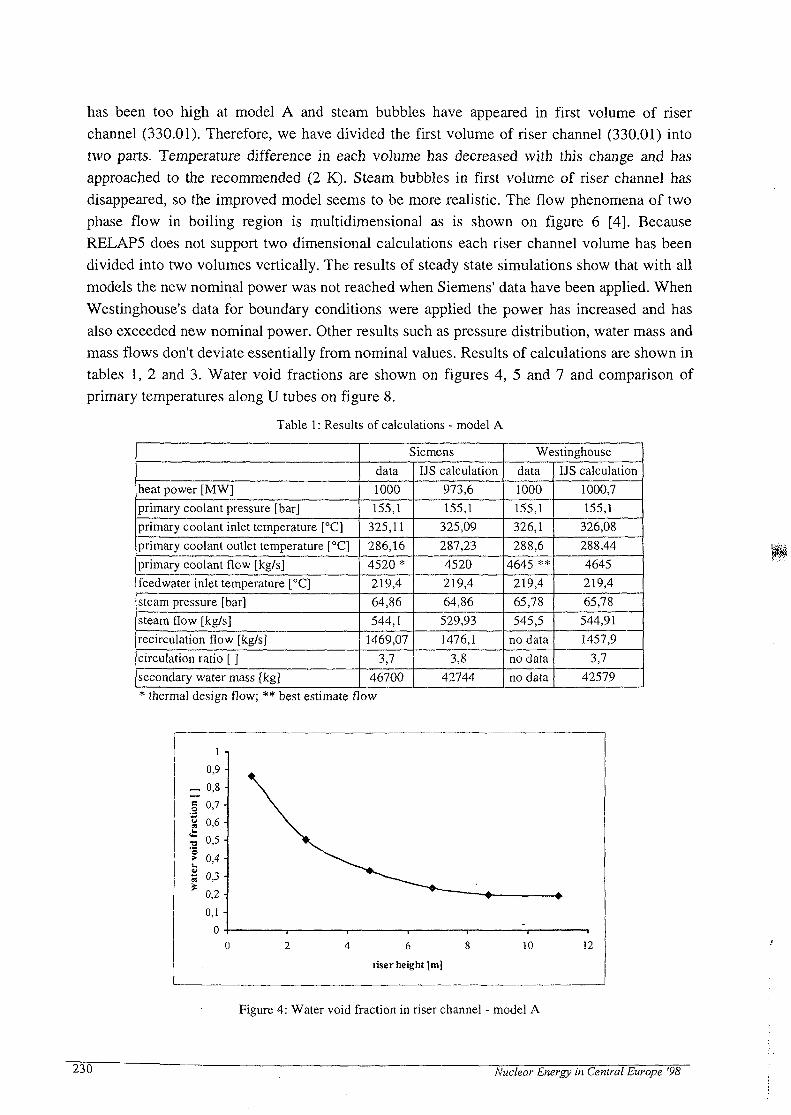
has been too high at model A and steam bubbles have appeared in first volume of riserchannel (330.01). Therefore, we have divided the first volume of riser channel (330.01) intotwo parts. Temperature difference in each volume has decreased with this change and hasapproached to the recommended (2 K). Steam bubbles in first volume of riser channel hasdisappeared, so the improved model seems to be more realistic. The flow phenomena of twophase flow in boiling region is multidimensional as is shown on figure 6 [4]. BecauseRELAP5 does not support two dimensional calculations each riser channel volume has beendivided into two volumes vertically. The results of steady state simulations show that with allmodels the new nominal power was not reached when Siemens' data have been applied. WhenWestinghouse's data for boundary conditions were applied the power has increased and hasalso exceeded new nominal power. Other results such as pressure distribution, water mass andmass flows don't deviate essentially from nominal values. Results of calculations are shown intables 1, 2 and 3. Water void fractions are shown on figures 4, 5 and 7 and comparison ofprimary temperatures along U tubes on figure 8.
Table 1: Results of calculations - model A
heat power [MW]
primary coolant pressure [bar]
primary coolant inlet temperature [°C]
primary coolant outlet temperature f°C]
primary coolant flow [kg/s]
feedwater inlet temperature [°C]steam pressure [bar]steam flow [kg/s]
recirculation flow [kg/s]
circulation ratio [ ]
secondary water mass [kg]
Siemens
data1000155,1
325,11
286,16
4520*219,4
64,86544,1
1469,07
3,7
46700
US calculation973,6155,1
325,09
287,23
4520219,4
64,86
529,931476,1
3,842744
Westinghouse
data1000
155,1
326,1288,6
4645 **219,4
65,78
545,5
no data
no data
no data
US calculation
1000,7155,1
326,08
288,44
4645219,4
65,78544,91
1457,93,7
42579
* thermal design flow; ** best estimate flow
Figure 4: Water void fraction in riser channel - model A
230 Nuclear Energy in Central Europe '98

Table 2: Results of calculations - model B
heat power [MW]
primary, coolant pressure [bar]
primary coolant inlet temperature [°C]
primary coolant outlet temperature [°C]
primary coolant flow [kg/s]
feedwater inlet temperature [°C]
steam pressure [bar]
steam flow [kg/s]
recirculation flow [kg/s]
circulation ratio [ ]
secondary water mass [kg]
Siemensdata
1000
155,1
325,11
286,16
4520*
219,4
64,86
544,1
1469,07
3,7
46700
US calculation
982,82
155,1
325,09
286,864520
219,4
64,86
536,17
1469,4
3,74
47210
Westinghouse
data
1000
155,1
326,1
288,6
4645 **
219,4
65,78
545,5
no data
no data
no data
US calculation
1010,5
155,1
326,08288,04
4645219,4
65,78
548,34
1473,6
3,68
46877* thermal design flow; ** best estimate flow
Figure 5: Water void fraction in riser channel - model B
Table 3: Results of calculations - model C
heat power [MW]
primary coolant pressure [bar]
primary coolant inlet temperature [°C]
primary coolant outlet temperature [°C]
primary coolant flow [kg/s]
feedwater inlet temperature [°C]
steam pressure [bar]
steam flow [kg/s]
recirculation flow [kg/s]circulation ratio [ ]
secondary water mass [kg]
Siemens
data
1000
155,1
325,11
286,16
4520*
219,4
64,86
544,11469,07
3,746700
US calculation
989,11
155,1
325,09
286,59
4520
219,4
64,86
541,41
1489,5
3,75
46797
Westinghouse
data
1000
155,1
326,1
288,6
4645 **
219,4
65,78
545,5
no datano data
no data
US calculation
1017,35
155,1
326,08
287,8
4645219,4
65,78
549,28
1470,1
3,6746732
* thermal design flow; ** best estimate flow
Nuclear Energy in Central Europe '98 231

\ l t l » . , , / J / ' /
W i n III
"milli i n t i
M U M
t i l t !
I l l l t
urnI I / '
e g .
0.00 1-00 2.00T t H )
0.00 8.03VCM/5J
Figure 6: Velocity profile in riser channel [3]
-leftside
-right side
4 6
riser height [m]
10 12
Figure 7: Water void fraction in riser channel - model C
4. Conclusion
Database and RELAP5 computer model for the new Siemens steam generator for Krskonuclear power plant has been developed. Siemens' and Westinghouse's data have been appliedas boundary conditions and simulations of steady state have been performed. The model canbe adapted to simulate different transients and accidents.
The primary side geometry is modelled satisfactory. There are some deviations from nominalvalues on secondary side because of complicated flow paths of two-phase flow. In addition,
232 Nuclear Energy in Central Europe '98

we did not have all necessary geometric data, so we had to assess some dimensions from
"model A
"model B
"model C
12 16
U tubes length [m]
20 24 28
Figure 8: Comparison of primary temperatures along U tubes
technical drawings (example is separator). The difference between nominal and modelledsteam generator heat structure mass is about 30 t or 13 %, which is a result of neglecting somenozzles and connections in the model. Nevertheless, this difference has no influence on steamgenerator steady state operation.The difference between calculated power in Siemens' and Westinghouse's reports depends oftheir steam generator computer model. The nodalization of the steam generator is alsoimportant and influences on results of calculations. Thus we got different water void fractionin riser channel, but the temperature difference on primary side has remained close to thesame. With riser channel dividing we got different velocities of water and steam in hot andcold side of riser channel what confirm multidimensional two-phase flow phenomena.
5. References
[1] RELAP5/MOD3 Code Manual, Vol. 1: Code Structure, System Models And Solution
Methods, Vol. 5: User's Guidelines; Idaho National Engineering Laboratory, 1995[2] ASME Boiler And Pressure Code, Section 3, Division 1, ASME, 1986[?] Siemens Work Reports: NDM2/97/E001: Tube Plan for the Krsko Replacement Steam
Generator, E006: Primary Side Volume of the Krsko Replacement Steam Generators,E036: Shell Side Net Volume of the Krsko Replacement Steam Generators, E037:Replacement Steam Generator RELAP5 Model Input and Nodalization Data, E051:
Nuclear Energy in Central Europe 98 233

Water Level Recommendations and Calibration Data for the Krsko Replacement SteamGenerators, E054: Steady State Secondary Side Circulation Behaviour of the Kr§koReplacement Steam Generator
[4] Kr§ko Modernization - UPR, Operating Window, SSR - NEK - 2.0 Revision 1,Westinghouse Energy Systems Europe S. A., August 1998
[5] S. Petelin, L. Cizelj, B. Mavko, L. Fabjan, O. Gortnar, M. Kozuh, I. Parzer, A.Prosek, V.Planinc: Krsko NPP database for simulation with computer code RELAP5 (in Slovene);Institut Jozef Stefan, 1994
[6] Samo Hrvatin: Computer Model for New Steam Generator in NPP Krsko, B. Sc. Thesis(in Slovene), University of Ljubljana, Faculty of Mechanical Engineering, 1998
234 Nuclear Energy in Central Europe'98

I SI0100115
Nuclear Energy in Central Europe '98
Terme Catez, September 7 to 10, 1998
RECENT IMPROVEMENTS IN THE DESIGN ANDMANUFACTURE OF LWR FUEL
Marijan Jurcevic, Dubravko PevecFaculty of Electrical Engineering and Computing
University of Zagreb10000 Zagreb, Unska 3, Croatia
ABSTRACT - Strong competition among the nuclear fuel vendors on the LWR fuel market is the main drivingforce for improvements in the design and manufacture of the LWR fuel. Nuclear utilities are requesting moreadvanced fuel, which will increase the fuel availability and lower fuel cycle cost. The fuel vendors' answer to thisrequest has been an introduction of several improvements in the design and manufacture of their fuel. In this articlethe current trends in advanced fuel designs and development of improved materials, which have improved the fuelutilization and availability, are discussed in more detail. Also, the impact of these improved features on the safetyanalyses has been evaluated.
1. INTRODUCTION
Nuclear fuel reliability, lower fuel cycle cost, operational flexibility and safe operationare natural goals for utilities operating LWRs. Reliability of the fuel is the most importantrequirement and prerequisite for providing cost-competitive electricity. Reliable fuelperformance minimizes the risk to the health and safety of the public as well as to the plant staff.Fuel failures can cause considerable problems for the operation of the plant resulting in costlylosses of plant availability, prolonged or unplanned outages, and increased personnel exposure.
The most efficient way to reduce fuel cycle cost is to increase the discharge burnup. Theburnup increase could be only achieved by improving the capability of the fuel assemblies towithstand the effects of higher irradiation: increased fission gas release, waterside corrosion andhydrogen pickup, increased fuel rod and fuel assembly growth, etc. Also, PWR fuel assemblybow and twist and bow of BWR fuel channels become a more serious problem at higher burnup.In the next section we will discuss which improved design and manufacturing features wereintroduced by fuel vendors to overcome the above mentioned burnup dependent effects whichcould cause the fuel failure.
2. IMPROVEMENTS IN THE DESIGN AND MANUFACTURE
2.1 PWR Fuel DesignsIn the last few years a number of new PWR designs have been developed along with
new advanced zirconium alloys for fuel rod cladding and structural components. Generallyspeaking, all of the PWR fuel designs seem to be converging to the common set ofcharacteristics: increased burnup, larger diameter guide tubes with thicker walls and newdashpot configuration which increases stiffness and reduces operating stress and creepdeformation, removable top nozzle (RTN), multiple levels of debris defense, mixing vane grids,and advanced burnable absorbers. As an option fuel vendors could offer axial blankets and
Nuclear Energy in Central Europe '98 237

intermediate flow mixers (IFM). These features were designed to enhance performance or toincrease margins, but also to address some performance problems associated with high dutyextended burnup operation.
Westinghouse PERFORMANCE+ fuel assembly [1] is designed for discharge burnupsexceeding 50 GWd/tU and has evolved from VANTAGE 5, VANTAGE 5H, and VANTAGE+fuel designs. The major features are:• Corrosion resistant ZIRLO, Zr-Nb alloy, has demonstrated an increase in corrosion
resistance, reduction in rod irradiation growth and reduced creep rates when directlycompared to standard Zr-4. Hydrogen pick-up (and consequently embrittlement) is reduced,whilst maintaining high-temperature strength and ductility under postulated Loss of CoolantAccident (LOCA) conditions. It is used in fuel rod cladding, guide tubes and instrumenttubes, structural intermediate and IFM grids. With ZIRLO as guide and instrumentationtube material, growth is reduced and dimensional stability of the fuel assembly is enhanced.Corrosion resistance of ZIRLO provides margin to limits in high power (temperature) andhigh lithium environments.
• Axial blankets on the top and bottom of fuel rods are made from slightly enriched uranium(~2.6 w/o U-235). They represent an optimal compromise between axial leakage ofneutrons from the core and axial power peaking. In addition to standard solid pellets,Westinghouse offers annular pellets, which provide increased plenum volume toaccommodate increased fission gas release at higher burnup.
• IFM grids enhance the margin for departure from nucleate boiling (DNB) by increasing theflow mixing and turbulence in upper spans of the fuel assembly in order to provide betterheat transfer. Testing has demonstrated that use of IFM grids typically increase DNBmargin by 20 to 25 percent. However, when alternating grids were rotated 90 degrees forthe VANTAGE 5H design to minimize the grid-to-rod fretting caused by flow inducedvibration, it was discovered that part of the DNB margin was lost.
• Integral Fuel Burnable Absorbers (IFBA) design combines fuel and burnable absorbermaterial in a single fuel rod. The objective of IFBA is to enhance the power distributioncontrol and moderator temperature coefficient (MTC) control capability. The design isbased on applying a thin coating (<100 \im) of ZrB2 to pellets in selected rods. Naturalboron and boron enriched in B-10 is used as absorbing material. IFBA rods are loaded intothe fuel assembly in specific patterns. However, the use of boron as neutron absorberaffects the fuel rod internal pressure and must be considered during fuel rod designverification.
• Defense-in-Depth Debris Protection utilizes a set of features designed to provide for debrisfailure protection. These features include a Debris Filter Bottom Nozzle (DFBN), long fuelrod end plug in a protective bottom grid, and coated cladding. These features provideprotection against debris-induced fuel damage, which translates to increased fuel reliability.
Siemens offers two advanced fuel designs, the Fuel assembly with Optimized Claddingand Upgraded Structure (FOCUS) design and High Thermal Performance (HTP) design [2]. Thecommercial implementation of FOCUS fuel assemblies started as reload regions in 1992 inEurope in PWR plants with 15x15, 16*16 and 18x18 arrays. The implementation of HTP fuelassemblies with 14x14, 15x15, 16x16, 17x17 and 18x18 arrays is offered as an option inEurope and as a standard elsewhere in the world. The average discharge burnup of FOCUS andHTP fuel assemblies are about 50 GWd/tU and maximum assembly burnup is 60 GWd/tU.
The common technical features of FOCUS and HTP fuel assemblies are:• Corrosion resistant cladding using a Prime Candidate Alloy (PCA) and DUPLEX tubes.
PCA are optimized low-tin Zr-4 cladding tubes featuring enhanced corrosion resistance,
238 • Nuclear Energy in Central Europe'98

based on more narrowly defined tolerances for chemical composition and impurities and ona more rigidly controlled manufacturing process, mainly relating to heat treatmentprocesses. PCA cladding tubes were still not sufficiently corrosion-resistant for "hot" plants(plants with a higher coolant temperature). This led to the development of the DUPLEXcladding tube which consists of a thin outer layer of an Extra Low Sn (ELS) ZrSnFeCrhighly corrosion resistant alloy co-extruded on a Zr-4 inner layer that constitutes the bulk ofthe cladding.
• Integrated gadolinia burnable neutron absorber is used to flatten the axial power shape atbeginning of cycle (BOC) and to minimize end of cycle (EOC) gadolinia residual reactivity.Axial natural uranium blankets being used as an option to increase the neutron utilization bydecreasing axial neutron leakage.
• Improved debris-retention capability is provided which protects against debris entering thebottom of fuel assembly and thereby causing debris-induced fuel failure. Removable topand bottom nozzles for ease of fuel rod inspection and repair.
Special features of FOCUS fuel assemblies are:• Improved spacer design to enhance DNB margins and operating flexibility. This has been
achieved by the implementation of Zircalloy spacer grids whose strip intersections are fittedwith split vanes, thus resulting in horizontal coolant mixing between the subchannelsdelimited by adjacent fuel rods and/or guide tubes. The FOCUS fuel assembly can alsoinclude IFM grids for additional DNB improvements.
The special features of HTP fuel assemblies are:• High thermal performance spacers and IFM grids that utilize flow-channels within the
spacers positioned at an optimum angle to the axis of the fuel rods. These flow channelsprovide better coolant mixing. More uniform enthalpy distribution thereby improves theDNB ratio, while maintaining low-pressure drop.
• FUELGUARD™ debris resistant bottom nozzle which uses curved blades to effectivelycapture debris; longer end plugs which prevent fretting failure at the lower end of the fuelrods.
Fragema latest fuel assembly design is the AFA-3G that has evolved from the AFA-2Gdesign [3]. The AFA-2G was developed to replace the AFA (Advanced Fuel Assembly) in theearly 1990's and has been widely employed in France and elsewhere. The AFA-2G is availablein designs covering 14x14 to 17x17 arrays. The average discharge burnups are around 50GWd/tU.
The AFA-3G design contains design features to improve corrosion resistance, assemblystiffness, debris protection, and thermal margin. The major features are:• Advanced M5 Fuel Cladding, the Zr-lNb alloy in the recrystallized annealed state exhibits
very low rates of corrosion and irradiation growth and reduced hydrogen uptake incomparison to standard Zr-4. The diametral creep strength is also greater which allows anopen pellet-clad gap to be maintained beyond a second fuel cycle and improves the marginto Pellet-Clad Interaction (PCI). The reduced creep-down rate increases the fuel rodtemperature, and therefore the fission gas release, which imposes a penalty on End-of-Life(EOL) rod internal pressure. A larger plenum volume (longer rod) in the AFA-3G comparedwith AFA-2G design compensates this for. At present, M5 is now being supplied in fuelreload quantities. However, it should be noted that only limited performance data exist forburnup beyond 55 GWd/tU.
• A new modified anti-debris bottom nozzle; thicker guide tubes with larger inner diameter.
Nuclear Energy in Central Europe '98 239

• Reduced height top nozzles providing more clearances with the fuel rods; longer fuel rodswith more plenum volume.
• Deflection limiters in the spacer grids to protect grid springs against excessive deformation.
ABB provides nuclear fuel to PWR's plants in United States and Europe. In the last fewyears ABB introduced several improvements into their fuel design [4]:• Advanced laser-welded GUARDIAN™ Inconel grid for improved debris retention and
resistance to grid-to-rod fretting.• Optimized low-tin Zr-4, Zr-2P or DUPLEX is used as fuel rod cladding. Testing has shown
that these alloys possess enhanced corrosion resistance allowing to achieve the averageregion discharge burnup in excess of 48 GWd/tU which corresponds to lead rod averageburnups up to 60 GWd/tU.
• Structural and IFM Zr-4 spacer grids with improved DNB performance and strength whileminimizing pressure drop have been developed and introduced. The improved spacer griddesign employs high-performance, split-vane mixing features to create a strong swirl andturbulence to increase thermal margin. Extensive DNB testing showed a substantialimprovement in thermal margin.
• Urania-gadolinia (UO2-Gd2C>3) has been optimized (axially graded) as a burnable absorberfor shorter cycles (12-18 months) and urania-erbia (UCVEraOs) is used in reloads for long(18-24 months) high bumup fuel cycles.
• Reduced height top and bottom nozzles, which enabled longer fuel rods and longer plenumlength. Removable top nozzle is provided for easier fuel rods inspection and repair.
2.2 BWR Fuel DesignThe major change in the BWR fuel are the introduction of advanced 9X9 and 10x 10 fuel
lattice designs, replacing "standard" 8x8 lattices. These advanced fuels with large central waterrods or water cross design, have resulted in improved nuclear performance, i.e. improvedneutron flux distribution, increased reactivity and reduced local power peaking. Consequently,the average assembly enrichment can be reduced and the average discharge burnup increased.The larger number of fuel rods reduces the rod average linear heat generation rate (LHGR)which results in reduced fuel temperatures, fission gas release, and in lower cladding corrosionrates. Reduced LHGR provides greater thermal margin, as measured by the critical power ratio(CPR), and increased LOCA margin. BWR fuel vendors have developed fuel rod claddingdesigns that are resistant to both nodular and uniform corrosion in a variety of plant waterchemistries. The improved fuel designs have incorporated debris-resistant features and designfeatures to protect against creep collapse of fuel rods and to prohibit cladding failures due tohydriding. Enhanced fuel channel designs have been introduced to improve fuel assembly flowcharacteristics and to reduce channel bulge and bow during irradiation.
The short description of various advanced BWR fuel designs offered by ABB, Siemensand GE follows.
ABB has developed the basic SVEA fuel assembly, design in the early 1980's. TheSVEA-64 design had already been verified for use to region average burnups of around 40GWd/tU. Since 1988, SVEA-96/100 design[4] has replaced. SVEA-64 in most reactors. ForSVEA-96/100 the average discharge region burnup is around 48 GWd/tU.
The new feature of SVEA fuel design is a cross-shaped internal gap with non-boilingwater at the center of the assembly, dividing the assembly into four 16-rod bundles (SVEA-64),and four 24/25-rod bundles for SVEA-96/100 design. The most advanced is the SVEA-96+ fueldesign with the improved low-pressure drop spacer grids. SVEA-96+ includes seven of the highperformance spacer grids in place of six standard grids used for SVEA-96/100. The reduced
240 . Nuclear Energy in Central Europe '98

LHGR also eliminates the need for liner fuel rods since the operation stays below the PCIthreshold level. Dryout performance is improved substantially, thereby the fuel rod integrity.The additional improved features are a high-efficiency debris trap incorporated into the fuelassembly channel, and Zr-2 channels with the oxidation resistance superior to that of the Zr-4channels.
Siemens latest BWR fuel design is the ATRIUM (Advanced Technology for Reload fuelwith Internal Upgraded Moderation) family of fuel assemblies [2], The ATRIUM 9 andATRIUM 10 families of fuel assemblies with 9><9 and 10x10 rod arrays, respectively, have thefollowing improved design features:• An internal square water channel, replacing a 3x3 array of central fuel rods. The additional
moderator volume in the internal region of fuel assembly results in increased and moreuniform moderation (increased reactivity), reduced power peaking, improved shutdownmargin. It also has a less negative void fraction coefficient, which improves both transientand steady state core behaviors.
• ULTRAFLOW™ spacer equipped with swirl vanes at the spacer strip intersections toimprove CPR margin for about 20% compared with the earlier designs.
• Eight part-length fuel rods in the ATRIUM 10 design, which reduce the two-phase pressureloss and ensure increased resistance to instability. Natural uranium axial blankets, axialgadolinium loading and enrichment zoning are options to improve fuel utilization.
• Inner iron-enhanced zirconium liner (barrier) cladding (optimized Zr-2 alloy) to increasePCI resistance while protecting cladding performance in the event of cladding perforationand water ingress. Debris-resistant lower tie plate is designed to avoid fuel rod failures byfretting corrosion.
The average discharge burnup is 40-45 GWd/tU for ATRIUM 9 and around 50 GWd/tUfor ATRIUM 10. Maximum assembly burnup is 48 GWd/tU (ATRIUM 9) and 53 GWd/tU(ATRIUM 10).
GE offers the advanced fuel designs in the following lattices geometry: 9><9 lattices (GE11/13) and 10x10 lattices (GE 12/14) [5]. The maximum assembly burnups are in the range of50 to 54 GWd/tU. The first reload of GE12 was inserted in 1995, and GEM will shortly becomethe new standard. The main advanced feature of GE12/14 designs is the two central water rods,which displaces eight fuel rods. The introduction of central water rods has resulted in improvednuclear performance, i.e. flattened neutron flux distribution, increased reactivity and reducedlocal power peaking. GE is working on improved Zr-2 cladding through further optimization ofthe manufacturing processes. The additional advanced features of these designs are part lengthfuel rods to ensure resistance to instability, and U-235 enrichment and gadolinia axial zoning tocontrol power distribution.
3. OPERATIONAL ISSUES
The thermal conductivity of UO2 decreases with increasing burnup due to accumulationof soluble fission products, radiation damage and porosity in matrix. This degradation inconductivity of the pellet results in the increase in fuel temperature, which strongly affects fuelbehavior such as fission gas release and PCI. Typically, at a burnup of ~55GWd/tU, theconductivity decreases by 60-70% (Figure 1) [6], resulting in an increase in fuel centertemperature around 150 K. The greatest impact of this is on the EOL rod internal pressure andlicensing. Prediction of thermal behavior of the fuel, FGR and microstructural changes at highburnup, together with PCI, is of prime importance to allow operation at increased burnup in
Nuclear Energy in Central Europe '98 241

commercial reactors. Therefore, this requires of all fuel vendors to validate their fuelperformance code by comparison of code predictions against power reactor data, in-pileexperimental data and results of post-irradiation examinations to check the code ability toreliably predict in-reactor fuel performance.
^ 8
M 7"s
i5
•a 4o
2 3
0 GWd/t
30 GWd/t
60 GWd/t
• Exp. data
(Heat-up)
0 200 400 600 800 1000 1200 1400 1600 1800 2000
Temperature (K)
Figure 1: Measured thermal conductivity of high burnup UO2 pellet
With increasing burnup, the fuel pellet periphery starts to become porous. The onset ofthese microstructural changes, known as the "rim effect," begins as the average burnup exceeds40 GWd/tU. The rim has a width of about 100 to 250 um. There is a number of studies currentlyunderway to better characterize the rim effect and its contribution to FGR at extended burnup.The performed tests indicate that the increased porosity does contribute to an insulating effectwithin the pellet thus increase the fuel temperature and therefore enhancing the FGR. But, thecurrent opinion on the rim effect is that it does not provide a significant contribution to the fuelrod integral FGR, at least under steady-state conditions. Therefore, the rim effect does notappear to be a significant operational issue.
4. LICENSING AND SAFETY ISSUES
The utilities tend to consider operation as safe if the fuel meets operating/safety limitsapproved by the regulatory agencies. Such limits are set for a maximum permissible statisticalprobability of fuel failures during hypothetical transients and accidents. Utilities requirement forimproved design features increases reliability, and it will in most cases increase the plant safetymargins as well.
242 Nuclear Energy in Central Europe '98

In the last few years the largest concern of regulatory agencies and fuel vendors has beenpaid to fuel damage criteria for Reactivity Insertion Accidents (RIA) and Incomplete Control rodInsertion (IRI) for PWRs.
Since fuel damage following an RIA event, such as the rod ejection accident in PWRs, isstrongly dependent on the amount of reactivity insertion, the initial cladding condition(corrosion, spalling, hydrogen content, etc.) and plutonium buildup and redistribution, thisaccident must be considered carefully. Regulatory agencies require that for advanced fueldesigns proposed for extended burnup operation, the RIA criteria must address fuelfragmentation, dispersal, and core coolability concerns. The proposed interim RIA acceptancecriteria for extended burnups are more restrictive, and include the following:
Clad failure is prevented for fuel pellet enthalpy < 100 cal/gCore coolability is maintained for fuel pellet enthalpy < 280 cal/g (for 0 - 4 0 GWd/tU) and< 100 cal/g (above 40 GWd/tU)
- Oxide thickness must be kept below 100 urn- Dose must be limited to < 25% of 10 CFR100.
For the extended burnup applications, the fuel vendors must address the effects ofincreased burnup operation on fuel and cladding materials, i.e.:- Provide acceptable mechanical properties with respect to clad corrosion, oxidation, spalling
and hydriding, showing that the 100 um limit is met at burnup design limit,- Demonstrate applicability of the RIA criteria to the proposed design and burnup limit, taking
into account the fuel rod internal pressure, degradation of fuel thermal conductivity withburnup, control rod insertion characteristics, etc.,
- Address adequacy of the ECCS acceptance criteria (peak-clad temperature, oxidation limit,burst/blockage behavior, etc.).
Most of fuel vendors have received operating license for maximum burnup up to 60GWd/tU lead rod average burnup. Additional work remains to be done, on the part of fuelvendors as well as the regulatory agencies, to justify burnup extension programs beyond 60GWd/tU.
The IRI problem is primarily a concern for the selected PWR's 17x]7 fuel designs(Westinghouse, Fragema). Investigations have shown that fuel assemblies with large mid gridspans (without IFM's) and with relatively small diameter guide tubes, and high assembly hold-down forces, are susceptible for assembly bowing causing RCCA stacking in the dashpot region.
Affected fuel vendors have implemented the advanced design features and fuel assemblymodifications to mitigate IRI events:
Advanced materials for guide tubes-decreases corrosion and hydriding (reduce RCCA dragforce), enhanced radiation growth and creep resistance (reduces fuel assembly bow),Optimized hold-down spring loads (reduce axial loading on guide tubes),
- Larger inner/outer diameter guide tubes with thicker walls (increase stiffness and reduceoperating stresses and creep deformation),
- New dashpot configuration with constant outer diameter and reinforced, thicker lowersection (increased skeleton lateral stiffness and dashpot strength).
Utilities have also implemented operational remedies to minimize IRI:- _ Limiting burnup of rodded fuel assemblies below 25-40 GWd/tU,
Restricting assemblies with degraded control rod drop times to non-rodded positions,Surveillance of control rods drop times at BOC and EOC to assess RCCA operability.
With the above mentioned design improvements implemented for increased burnup fueldesigns, the IRI events would be probably significantly reduced. The surveillance activities
Nuclear Energy in Central Europe '98 243

performed by the utilities will assure that the performance of these advanced fuel designs ismonitored throughout their design burnup.
5. CONCLUSION
A number of high burnup LWR fuel designs have reached maturity since theirintroduction in the early 1990's. PWR fuel vendors have introduced debris-resistant features,along with new advanced Zr alloys for structural components, as well as fuel rod cladding toimprove corrosion resistance performance, and have developed more efficient and flexibleburnable absorbers, including integral absorbers of boron, gadolinium and erbium. Theintroduction of advanced 9x9 and 10x10 lattice designs with large central water rods or watercross design for BWRs have resulted in improved nuclear performance through greater thermalmargin and increased LOCA margin. All three BWR fuel vendors have developed debris-resistant features and the improved Zr-2 cladding materials that are resistant to both nodular anduniform corrosion in a variety of plant water chemistry. Barrier cladding designs with zirconiuminner liners or barriers provide resistance to PCI and can be resistant to secondary hydriding.The reduction of LHGR of advanced 10x10 lattice designs would probably eliminate theoperating restrictions related to PCI. Improved BWR fuel channel designs have been introducedto improve bundle flow characteristics. With these advanced features, the LWR fuel reliability,operational flexibility and fuel economy have been markedly improved.
REFERENCES
[1] H.W. Wilson, H.F. Menke, H. Kunishi, R.S. Miller, L.R. Scherpereel, Westinghouse Fuel Performance inToday's Aggressive Plant Operating Environment, Proceedings of International Topical Meeting on LWR FuelPerformance, Portland, Oregon, pp. 23-30,1997.
[2] IN. Morgan, R. Holzer, W.D. Krebs, Performance Experience and Design Improvements of Siemens FuelAssemblies, Proceedings of International Topical Meeting On LWR Fuel Performance, West Palm Beach,Florida, April 17-21,1994.
[3] G. Ravier, G.Masuy, J.T. Willse, Framatome and FCF Recent Operating Experience and Advanced Features toIncrease Performance and Reliability, Proceedings of International Topical Meeting on LWR Fuel Performance,Portland, Oregon, pp. 31-36, 1997.
[4] G. Vesterlund, L.V. Corsetti, Recent ABB Fuel Design and Performance Experience, Proceedings ofInternational Topical Meeting On LWR Fuel Performance, West Palm Beach, Florida, April 17-21, 1994. pp.62-70.
[5] G.A. Potts, Recent GE BWR Fuel Experience, Proceedings of International Topical Meeting on LWR FuelPerformance, Portland, Oregon, pp. 261-271,1997.
[6] K. Ohira, N.Itagaki, Thermal Conductivity Measurements of High Burnup UCb Pellet and a BenchmarkCalculation of Fuel Centre Temperature, Proceedings of International Topical Meeting on LWR FuelPerformance, Portland, Oregon, pp. 541-549,1997.
244 Nuclear Energy in Central Europe '98
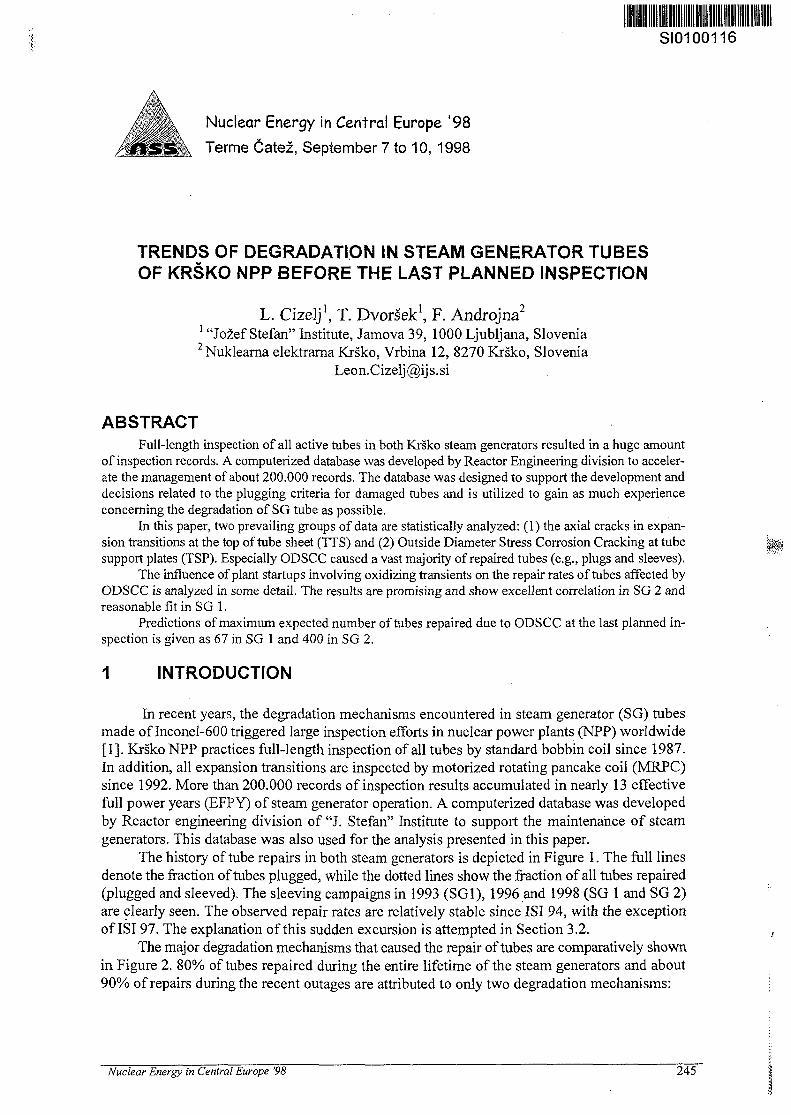
% SI0100116
Nuclear Energy in Central Europe '98
Terme Catez, September 7 to 10, 1998
TRENDS OF DEGRADATION IN STEAM GENERATOR TUBESOF KRSKO NPP BEFORE THE LAST PLANNED INSPECTION
L. Cizelj1, T. Dvorsek1, F. Androjna2
1 "Jozef Stefan" Institute, Jamova 39, 1000 Ljubljana, Slovenia2Nuklearna elektrarna Krsko, Vrbina 12, 8270 Krsko, Slovenia
ABSTRACTFull-length inspection of all active tubes in both Krsko steam generators resulted in a huge amount
of inspection records. A computerized database was developed by Reactor Engineering division to acceler-ate the management of about 200.000 records. The database was designed to support the development anddecisions related to the plugging criteria for damaged tubes and is utilized to gain as much experienceconcerning the degradation of SG tube as possible.
In this paper, two prevailing groups of data are statistically analyzed: (1) the axial cracks in expan-sion transitions at the top of tube sheet (TTS) and (2) Outside Diameter Stress Corrosion Cracking at tubesupport plates (TSP). Especially ODSCC caused a vast majority of repaired tubes (e.g., plugs and sleeves).
The influence of plant startups involving oxidizing transients on the repair rates of tubes affected byODSCC is analyzed in some detail. The results are promising and show excellent correlation in SG 2 andreasonable fit in SG 1.
Predictions of maximum expected number of tubes repaired due to ODSCC at the last planned in-spection is given as 67 in SG 1 and 400 in SG 2.
1 INTRODUCTION
In recent years, the degradation mechanisms encountered in steam generator (SG) tubesmade of Inconel-600 triggered large inspection efforts in nuclear power plants (NPP) worldwide[1]. Krsko NPP practices full-length inspection of all tubes by standard bobbin coil since 1987.In addition, all expansion transitions are inspected by motorized rotating pancake coil (MRPC)since 1992. More than 200.000 records of inspection results accumulated in nearly 13 effectivefull power years (EFP Y) of steam generator operation. A computerized database was developedby Reactor engineering division of "J. Stefan" Institute to support the maintenance of steamgenerators. This database was also used for the analysis presented in this paper.
The history of tube repairs in both steam generators is depicted in Figure 1. The full linesdenote the fraction of tubes plugged, while the dotted lines show the fraction of all tubes repaired(plugged and sleeved). The sleeving campaigns in 1993 (SGI), 1996 and 1998 (SG 1 and SG 2)are clearly seen. The observed repair rates are relatively stable since ISI 94, with the exceptionof ISI 97. The explanation of this sudden excursion is attempted in Section 3.2.
The major degradation mechanisms that caused the repair of tubes are comparatively shownin Figure 2. 80% of tubes repaired during the entire lifetime of the steam generators and about90% of repairs during the recent outages are attributed to only two degradation mechanisms:
Nuclear Energy in Central Europe '98 245

TTS: axial stress corrosion cracking at the expansion transitions at the top of the tube sheet(TTS) caused 24% and 17% of repaired tubes in SGI and SG2, respectively, andTSP: outside diameter stress corrosion cracking (ODSCC) at the tube support plate inter-sections (TSP), caused about 56% and 63% of repaired tubes in SGI and SG2, respectively.Multiple TSP defects per tube or tubes with both TSP and any other defects are responsiblefor about 10% of repairs.
30,00% 1 . . r 1
25,00%
V)ID
3 20,00%
[—•— SG 1 pluggedI M SG 2 plugged
& ji—O -SG 2 plugged & sleeved |
0,00%
T'Jftf i
82 84
Figure 1 History of tube repair (plugging & sleeving)
SG1 SG2
TSP single44%
OTHER19%
TSP multiple8%
TSPcombined
4%
TSP single54%
TSP multiple6%
TSPcombined
3%
TSP single Repaired because of a single ODSCC defect on the tubeTSP multiple Repaired because of multiple ODSCC defects on the tubeTSP combined Repaired because of any number of ODSCC defects and any other type of defects present on the
tubePS Repaired because of defects in the tube sheet (P* region)TTS Repaired because of axial crack at expansion transitionsOther Repaired because of any cause not mentioned above
Figure 2 Causes of tube repair: Status after ISI98
246 Nuclear Energy in Central Europe '98

The quantity of tubes repaired because of ODSCC varied significantly during the recentoutages [2]. Special attention is therefore devoted to TSP defects, aiming at reasonable predictionof repair rates following the last planned inspection.
It is therefore assumed that the TSP defects will govern the status of the steam generatorsafter the last planned inspection. Nevertheless, information related to TTS defects [3] is updatedbelow. Other degradation mechanisms are expected to cause a negligible number of repaired tubesand are therefore not discussed further.
2 AXIAL CRACKS IN EXPANSION TRANSITIONS
Axial cracks in expansion transitions are mainly caused by joint effects of high residualstresses and chemical influence by either primary/secondary coolant or deposits in crevices,especially between sludge on the top of the tube sheet and tubes. A criterion for the repair ofdegraded tubes is based on the allowable length of an axial crack.
2.1 History of Detected Cracks
Since 1992, a routine measurement of crack lengths using Motorized Rotating PancakeCoil (MRPC) is performed in Krsko nuclear power plant (NPP) to verify the structural integrityof cracked tubes. A stable and moderate increase in the number of known cracks is observed insubsequent inspections (see Table 1). The vast majority of cracks detected and measured in 1998already had a history of recorded crack lengths. In average, until ISI 98 the cracks survived morethan 4 inspections. The oldest known crack still in operation (SGI R33 C82) was first timedetected in 1987 and measured to be 3 mm long in 1998.
This confirms that currently implemented inspection methods (MRPC) reliably detect andmeasure the cracks, which are shorter than the longest allowable through-wall crack of 6.4 mm.
2.2 Measured Crack Lengths
Selected statistical parameters of measured crack lengths are given in Table 1. A moderateincrease in number of cracked tubes during recent years is observed, which is consistent with thefact that the population of cracks is growing older. Maxima of observed crack lengths recordedare in the range 8-11 mm. It should be however noted that less than 4% of cracks exceed 5 mmin length since 1994 when inspection technology remained virtually unchanged.
Table 1 Selected Statistical Parameters of Measured Crack Lengths (SG 1 and SG 2)
Inspection
Year
1998199719961995199419931992
CumulativeEFPY
12.4711.6710.869.949.398.457.75
#ofCracked
Tubes
509534513488465413427
Measured [mm]
Min*
0.0.0.0.0.0.0.
Max
10.Q
8.11.10.8.
11.
Average
3.133.062.922.392.553.233.48
StandardDeviation
1.631.631.621.491.621.791.80
Sum ofCrack
Lenghts[mm]
1593.1636.1500.1167.1187.1336.1484.
Resolution of measurement method causes that all cracks shorter than 0.5 mm appear with length O.mm
Nuclear Energy in Central Europe '98 247

Occasionally, more than one crack per tube is detected. The statistics in Table 1 is basedon the longest crack per tube. In the average, about 62% of cracked tubes contain only one crack,about 23% two cracks, and 10% three cracks. More than three cracks are detected in about 5%of cracked tubes [10].
2.3 Propagation of Axial Cracks
Table 2 shows selected statistical parameters on crack growth between consecutive inspec-tions. The number of available data points moderately increases. Accumulated data confirmedconservativity of predictions concerning crack growth ([5] and [6]).
In the 1997/98 only about 1.7% of cracks propagated more than 2 mm. Only 4 cracks (0.9% of all cracks with recorded growth) grew 4 mm or more.
Table 2 Selected Statistical Parameters of Observed Crack Growth (SG 1 and SG 2)
Inspection
Period
97/9896/9795/9694/9593/9492/93
EFPY
0.850.810.920.550.940.70
#*ofRecordedGrowths
389(458)414(487)403(460)315(419)204(327)243(319)
Measured [mm]
Min
-3.-3.-2.-3.-4.-4.
Max
6.4.6.3.6.6.
Average
0.370.360.640.09
-0.190.28
StandardDeviation
1.020.971.100.931.150.91
Sum ofAH
Growths[mm]
168.177.295.
38.-63.91.
cracks with recorded positive growth (all cracks with recorded growth)
2.4 Future Behavior of Axial Cracks
The Weibull fit used in predictions of future behavior of axial cracks in [3] was updatedwith data from 1998 inspection. The 1998 data confirmed the trends estimated from previousyears. The expected repair rates are in the order of 20 tubes per inspection and steam generator.
3 ODSCC AT TUBE SUPPORT PLATES
Outside diameter stress corrosion cracking (ODSCC) at tube support plates (TSP) is causedby aggressive sediments that concentrate in the crevice between tube and tube support plate andseems to be accelerated by high temperature and oxidizing conditions. It is currently the majorcause of tube repair in Krsko steam generators. More than 90% of tubes repaired during recentoutages are attributed to ODSCC at TSP.
3.1 Distribution of defects among tube support plates
The ODSCC defects are detected at different TSPs on the hot leg side of the steam genera-tors. Further, two or more defects per tube (denoted as multiple) were detected in about 15% oftubes. The distribution of all defects detected during ISI 98 is shown in Figure 3. The dominantlocation of single defects is TSP 5 in SG 1 and TSP 3 in SG2. Most multiple defects per tubeinvolve TSP 3 and TSP 5 in SG2, whereas no dominant location is observed in SG 1.
248 Nuclear Energy in Central Europe '98

SG1 (ODSCCatTSP) SG2 (ODSCCatTSP)
~~~"~ -::ngte (O(her)- . - • . : . " . - " - - " " " • * - . 1 6 %
multiple (Othi i. _ _.5%
multiple (5 & 7) _3%
multiple (3 & 7)1%
combined
- multiple (3 & 5)4%
__ single (Other)
multiple (O1
1% i Jltiple (3 & 5) , c o m b i n e di 6% 5 %
multiple (5 & 7) :
1% ' multiple (3 & 7)
Figure 3 Distribution of ODSCC defects among tube support plates (detected duringISI 98)
In general, the ODSCC tends to concentrate considerably lower in SG 2 than in SG 1. Sincethe temperature of the tube is higher at lower TSP, the Arrhenius type of temperature dependenceof ODSCC may lead to faster defect initiation and growth of defects in SG 2. Indeed, the analysesof inspection results show somewhat higher initiation and considerably higher growth rates in SG2 [2].
The enumeration of TSP's used in this paper is consistent with the Krsko enumerationscheme with TSP #11 being the uppermost TSP.
3.2 Observed repair rates
In the following, the discussion and analysis are limited to the observed repair rates oftubes affected by ODSCC at TSP in the time period between ISI 95 and ISI 98.
As shown in Figure 1 and Figure 4, an increase of repair rates is observed during the ISI97 in both SG 1 and SG 2. In SG 1, the repair rate of 0.5% observed in ISI 96 increased to 1.5%in ISI 97 and remained constant in ISI 98. In SG 2, the repair rate of about 1.6% observed in ISI96 increased to about 5% in ISI 97 and then decreased again to 1.8% in ISI 98.
There is no evidence of any changes in operational and maintenance procedures, whichcould be correlated with the increased repair rates in ISI 97. Nevertheless, two forced outagesinvolving ingress of air in the steam generator (leak at the flange of SG 2 inspection opening) andsteam line (failure of the steam line isolation valve; SG 2) were recorded between ISI 96 and 97.
Some preliminary evidence exists in the literature, that the development of the IGA/SCCcould be influenced by the startup oxidizing transients [7]. A startup oxidizing event would ingeneral need ingress of the oxygen in the secondary system before the startup of the plant. Suchconditions occur always after the refueling of the plant, but are relatively rare during forcedoutages.
The number of openings of the secondary side was therefore chosen as a preliminarymeasure for the tube repair rate. Each refueling outage is assumed to be equivalent of one open-ing. Also, the two unplanned outages between ISI 96 and 1997 are preliminary assumed to beequally important and attributed value of one opening each. The plot of repair rates against thenumber of opening of the secondary side is shown in Figure 5.
An excellent correlation between openings of the SG secondary side and the tube repairrates is found for SG 2 (Figure 5). Thus, the explanation of the increased repair rate in SG 2/ISI97 seems to be given by the startup oxidizing transients [7]. Of course, detailed analysis of actionsperformed during both forced outages is underway, aiming at better understanding of processesleading to the increased repair rates. For example, the preliminary analyses of inspection results
Nuclear Energy in Central Europe '98 249

show that the incerased repair rates are dominated by growth of defects, since the number of newdefects (ISI 97) seems to be of the same magnitude as in ISI 96 and 98.
12,00%
EFTY
Figure 4 Fraction of tubes repaired due to ODSCC as a function of EFTY
12,00%
10,00%
tubes
red
repai
"5o
Fra
cti
8,00%
6,00%
4,00%
2,00% -
0,00% —0
Cycle 121995-1996
r
JF-1 '>——"—'
Cycle 131996-1997
. — • —
Cycle 141997-1998
, — ^
I
r
i
SG23 !
> S G 1
_
Figure 5
1 2 3 4 5 6 7
Openings of secondary side
Fraction of tubes repaired due to ODSCC as a function of openings of secon-dary side
250 Nuclear Energy in Central Europe '98

On the other hand, the behavior of SG 1 (Figure 5) can be explained by the startup oxi-dizing transients [7] only for the periods until ISI 97. The repair rate observed in 1998 is namelyequivalent to the repair rate in 1997. Preliminary results of the distribution of defects among TSPshow, that new defects are found more frequently at lower TSP (e.g., 3, followed by 5). SinceODSCC is a thermally activated process, such relocation alone may lead to faster defect growth.Detailed analysis will be performed to characterize this phenomenon further when data on small(non-reportable) ODSCC defects become available.
3.3 Future repair rates
The prediction of the future tube repair rates was traditionally based on the Weibull distri-bution. Thus, it was assumed that the fraction of failed tubes is distributed in time (effective fullpower years or effective full thermal year) according to Weibull distribution. Such approach iswell known in literature (e.g., [8]) and allows for variable failure rates during the useful lifetimeof the steam generator. The parameters of the Weibull distribution are obtained from the field datausing standard fitting procedure "minimum least squares" [9]. Further details on the method aregiven elsewhere [8].
The essential conditions for selecting appropriate sets of field data include the comparableinspection methods and plugging criteria used and comparable operating conditions. More de-tailed description is given elsewhere [4], [9]. Nevertheless, the discussion in Section 3.2 revealsadditional parameters to be considered while predicting future repair rates.
The following approach was adopted until the results of more detailed analyses becomeavailable. In the first step, the future repair rates were estimated using the traditional Weibulldistribution of tube failures in time (EFTY, see [2] for details). In the second step, an estimate ofnecessary tube repairs per opening of steam generator was derived by simply using the repair ratesper opening observed in ISI 98 (see also Figure 5). Results of both steps are listed independentlyin Table 3
Table 3 Predicted number tubes repaired due to ODSCC in the last planned inspec-tion (1999)
Period
0,8 EFTY
1 opening
SGI37(0,8%)
Minimum
37 (0,8%)
Best estimate
67(1,5%)
Maximum
68(1.5%)
SG2134(2,9%)
Minimum
148 (3,3%)
Best estimate
400 (8,8%)
Maximum
85 (1,9%)
An example of the interpretation of Table 3 is as follows. If it is reasonable to assume thatthe repair rates of tubes affected by ODSCC is governed by Effective full thermal year (e.g.,normalized time at maximum temperature), then number of tubes repaired in SG 2 will be be-tween 134 and 400. If, on the other hand, the ODSCC is governed by the openings of thesecondary side, only about 85 tubes will be repaired for each opening of the secondary system.Thus, about 85 tubes will be repaired if there is a continuous plant operation until ISI 99 or about170, if there is one unplanned outage involving ingress of air in the secondary system. Theinformation available at the present time is in favor of the "opening" approach; nevertheless, thereis no enough evidence available to reliably support this approach. Use of maximum expectedvalues is therefore recommended while planning the tube repair activities.
Nuclear Energy in Central Europe '98 251

4 CONCLUSIONS
The degradation mechanisms that cause most of repaired tubes are statistically analyzed in thispaper. These degradation mechanisms are axial stress corrosion cracking in expansion transitions(TTS) and outside diameter stress corrosion cracking at tube support plates (TSP). Other degradationmechanisms are considered to have negligible influence on the remaining life of steam generators.
The influence of plant startups involving oxidizing transients on the repair rates of tubes af-fected by ODSCC is analyzed. The preliminary results show excellent correlation in SG 2. Reasonablefit in SG 1 is however assumed to be cause by relocation of the defects towards the lower supportplates.
The future repair rates were predicted both using Weibull distribution and simple extrapolationof observed repair rates based on a number of openings of the secondary system between two inspec-tions. The second approach seems to fit better with the observed data. Nevertheless, the use ofmaximum expected repair rates is recommended in the planning of the repair activities,. It is estimatedthat the full power of the plant can not be maintained without extensive sleeving campaign or relaxa-tion in repair criteria.
More detailed analysis of the influence of plant startups involving oxidizing transients on therepair rates of tubes affected by ODSCC should be performed to clarify somewhat different behaviorof both steam generators.
5 REFERENCES
[1] MacDonald, P.E. etai., Assessment and Management of Ageing of Major'Nuclear Power Plant Components: SteamGenerators, Safety Series, International Atomic Energy Agency (1996), Vienna, Austria, in printing.
[2] L.Cizelj, J.Bevk, T.Dvorsek, M.Koyac', B.Mavko, Handbook of the Degradation of Steam Generator Tubes in KrSkoNPP, Vol. 3: Outside Diameter Stress Corrosion Cracking at Tube Support Plates, IJS-DP-7767 Rev.l (1997, Pro-prietary), Institut "Jozef Stefan", Ljubljana, Slovenia.
[3] L.Cizelj, T. Dvorsek, F.Androjna, Degradation of Steam Generator Tubes in Krsko NPP: Recent Status and Trends,Proceedings 4rd Regional Meeting Nuclear Energy in Central Europe (1997), Sept. 7-10, 1997, Bled, Slovenia, 82-90.
[4] L.Cizelj, T. Dvorsek, Degradation of Steam Generator Tubes in Krsko NPP: Recent Status and Trends, Proceedings3rd Regional Meeting Nuclear Energy in Central Europe (1996), Sept. 16-19, 1996, Portoroz, Slovenia, 473-481.
[5] L. Cizelj, T. Dvorsek, B. Mavko, Propagation of Cracks in the Transition Zone of Krsko NPP Steam GeneratorTubes (in Slovene), Report IJS-DP-6405, Rev.O (1992), "Jozef Stefan" Institute, Ljubljana, Slovenia.
[6] L. Cizelj, T. Dvorsek, B. Mavko, Propagation of Cracks in the Transition Zone of KrSko NPP Steam GeneratorTubes (Based on Results of In-Service Inspections in 1990,1992 and 1993) (in Slovene), Report IJS-DP-6988, Rev.l(1994), "Jozef Stefan" Institute, Ljubljana, Slovenia.
[7] J.A.Gorman, A.R.McIlree, T.Gaudreau, L.Bjornquist, P.-O.Andersson, Influence of Startup Oxidizing Transients onIGA/SCC in PWR Steam Generetaors. 3rd International Steam Generator and Heat Exchanger Conference, June 20-24,1998, Toronto, Canada (in print 1998).
[8] P. Pitner, Statistical Analysis of Steam Generator Tube Lifetime and Probabilistic Method for Tube BundleInspection, Reliability Engineering and System Safety 21 (1988) 271-292.
[9] L.Cizelj, J.Bevk, T.Dvorsek, M.KovaC, B.Mavko, Handbook of the Degradation of Steam Generator Tubes in KrskoNPP, Vol. 1: Data Base, Current Status and Trends, IJS-DP-7765 Rev.O (1997, Proprietary), Institut "Jozef Stefan",Ljubljana, Slovenia.
[ 10] L.Cizelj, J.Bevk, T.Dvorsek, M.KovaC, B.Mavko, Handbook of the Degradation of Steam Generator Tubes in KrSkoNPP, Vol. 2: Axial Cracks in Expansion Transition, IJS-DP-7766 Rev.O (1997, Proprietary), Institut "Jozef Stefan",Ljubljana, Slovenia.
252 Nuclear Energy in Central Europe '98

SI0100117
Nuclear Energy in Central Europe '98
' S , \ Terme Catez, September 7 to 10, 1998
Reracking of Fuel Pools, Experience with improvedCodes and Design for Reactor Sites with High Seismic Loads
Dr. Joachim Banck, Klaus WirtzSiemens AG, Power Generation Group (KWU), Germany
Abstract:Reracking of existing pools to the maximum extent is desirable from the economical point ofview. Although the load onto the storage rack structure and the fuel pool bottom will beincreased, new improved codes, optimized structural qualification procedures and advanceddesign enable to demonstrate the structural integrity for all normal and accident conditions sothat the design provides a safe compact storage of spent fuel under any condition.
1. Back End StrategyFrom the technical and economical point of view, the best place to store spent fuelassemblies are the fuel pools of the nuclear power plants. Therefore, it is advantageous touse the capacity of the pools to the maximum extent.
Storage of spent fuel in the water pools over many decades gives rise to no problems.Assessment of the ability of fuel assemblies to be safely held has been base on evaluationof corrosion mechanisms and creep behavior under the internal pressure of the fuel rods. InGerman NPP's Siemens has a set of exactly measured spent fuel rods, some of which arecontaining fuel with incipient and cladding wall penetration defects which have been storedand periodically inspected over the past 20 years [1].
On the other hand, the increase of storage capacity inside existing pools is by far the mosteconomical solution and therefore different techniques have been developed. In the pastfew years Siemens has planned and installed storage racks in 13 NPP with two regionarrangement. Together with intensive use of the available space in the pool the capacity canbe more than doubled. Above all, for many of the about 40 reracking projects, the storageracks were designed to hold consolidated fuel. In this case, the fuel canister contains twoassemblies consolidated within the outer dimension of a single fuel assembly. By this thecapacity of the storage locations can be nearly doubled.
All these measures are increasing the load onto the storage racks and the fuel pool bottomespecially in the case of external events (e.g. earthquake). Consequently, advanced designand new codes have been developed to enable storage of spent fuel also at reactor sites withhigh seismic loads.
2. Design of the two Region Storage RacksIn the past, all the storage racks were designed to store fresh fuel assemblies in alllocations. In case of the two region concept only region 1 serves for storage of fresh fuelassemblies with maximum reactivity. Each storage position is surrounded by a neutronabsorber to ensure subcriticality. The capacity of region 1 is for the full core reserve and asurplus for one reload batch. Region 2 serves for storage of spent fuel assemblies with aminimum burn-up. In region 2 there is a checkerboard arrangement of the neutron absorberto ensure subcriticality (Fig. 1).
Nuclear Energy in Central Europe '98 253

Upper endpiece olfuel assembly
8oron steelabsorber channel
I-4--J
L'fj
-;-4-;
T
Spent fuel storage rackwith double neutron absorberdesigned for fresh fuelof specified enrichment
- ! + • !•+•-I.4-.I
: • + • '
i'_"•"'' Spent fuel storage rack with single- X- neutron absorber designed for fuel• - | - -J- of specified minimum burnup
as illustrated in diagram at bottom left
Region I:Square absorber channel enclosingeach fuel assembly (flux trap arrangement),with double absorber wall between fuel assemblies
Region II:Square absorber channels in checkerboard arrangement,resulting in single absorber channel side wall between fuel assemblies
Figure 1: Two Region Storage Arrangement
The neutron absorbers which are used by Siemens are made of borated stainless steel.Borated stainless steel has successfully resided in spent fuel pools for 25 years without anyproblems. All of them have been licensed to be operated for the entire life of the plantwithout any need of in-service inspection. This is not the case for other neutron absorbingmaterials.
The channels are assembled onto massive support structures of different sizes foroptimized arrangement in the pool.
For installation the modules can be handled remotely by an auxiliary crane and installedunderwater. The dead weight of an empty module is about 7 tons. It covers about 6.5square meters of the pool bottom and has a load carrying capacity of up to 160 metric tonsof consolidated fuel canisters. For this load careful analysis is required.
254 Nuclear Energy in Central Europe '98

3. Structural Qualification3.1 Objective
The high density fuel storage racks are free standing racks supported by the pool flooronly. The design for the increased loads due to consolidated fuel storage requiresextensive structural evaluation to prove satisfaction of the requirements. The objective ofthe structural evaluation is to demonstrate that the rack design satisfies the structuralrequirements and show that the following safety objectives to protect personnel and thegeneral public are met by the fuel storage system:
• ability to cool the fuel assemblies• maintain the fuel in subcritical condition• prevent leakage from the pool to keep radiation exposure within limits• maintain the capability to remove and insert fuel assemblies
Therefore, structural analyses must be performed for the fuel storage racks, the liner ofthe pool and the concrete floor of the pool. This summary only deals with theinvestigations in the fuel racks.
The common design criteria, standards and regulations for spent fuel racks are describedin 111, 131 and IAI. Beside the general design criteria for safety related structures, theregulations give recommendations and guidance for the structural evaluation related toclassification, seismic design parameters, damping values, etc.
The high density storage racks are designed according to the limits of ASME151 forClass 3 component supports to maintain the structural integrity and to fulfill the safetyobjectives. •
3.2 Loading ConditionsThe design and analysis of fuel racks must consider all different weight situations like• empty rack• partialy loaded rack with fuel assemblies, control rods or consolidated canisters• fully loaded rack with fuel assemblies, control rods or consolidated canistersThe weight is considered under normal operating, handling conditions (installation) andfor external events like earthquake etc.
Two cases of thermal loads are usually investigated:• loss of cooling - increase of the total pool temperature• single hot cell - loss of cooling at a single storage locationThe first thermal case generates thermal expansion of the rack and the related frictionforces for the free standing rack. The second thermal case produces local thermal stresses.
In addition some other cases of external loads are usually analyzed for fuel racks, e.g.stuck fuel uplift force, load drop by accident, etc.
Nuclear Energy in Central Europe '98 255

3.3 Structural Evaluation of fuel racksThe structural evaluation of fuel racks is done in 2 steps• dynamic analyses to simulate the dynamic behaviour of a single rack and the racks in
the whole pool• detailed static structural analyses for all load cases to confirm the structural criteria
3.3.1 Nonlinear Dynamic AnalysesFor the free standing high density fuel storage racks the dynamic load cases are thelimiting cases for the rack design. That means that a realistic simulation of thedynamic behaviour is the most important aspect.
All the nonlinear dynamic analyses are performed using specially developed codes totake specific effects into consideration. These are, for example:• Fluid-Structure-Interaction (FSI)• Impact and Friction
FSIThe fuel storage racks are submerged in water, are free standing on the bottom ofthe spent fuel pool and are only separated by small water gaps. During a seismicevent the racks can lift, slide and twist in the water pool. It is obvious that themotions of the racks are highly influenced by the motion of fluid near the racks andvice versa. This Fluid Structure Interaction (FSI) must be considered in the dynamicanalysis of fuel storage racks to determine the realistic displacements and loads onthe rack.A FSI-theory was developed for fuel storage racks on the basis of potential flowtheory for incompressible fluid. This theory has been implemented in the codes andextensively verified by- comparison with analytical result of a simplified 2D-rack model- comparison with fluid forces obtained by a 3D numerical simulation of the
moving rack in a water pool using the CFD code STAR-CD.- comparison with natural frequencies of analytical results of submerged cylinders
and squares applying the added mass theory whereby the added mass coefficientsare in good agreement with experimental data.
Impact and FrictionThe coupling between the rack feet and the bottom of the pool is described byimpact friction elements accounting for the dissipated energy by impact.The coupling between the racks themself, between the racks and the walls of thepool as well as the coupling between the rack structure and the fuel assemblies isdescribed by means of gap elements.In the mathematical model friction between rack feet and pool bottom is consideredas Coulomb friction. The calculations are performed for coefficients of friction inthe range of- u >.0.2 and n <.0.8.
Nonlinear dynamic analyses are performed for 3-D Single Rack models and for 2-D (or 3-D) Multi-Rack models using displacement time histories as simultaneous excitation. Theartificial absolute displacement time histories are generated for'both orthogonal horizontal
256 Nuclear Energy in Central Europe'98 }'{

directions and for the vertical direction on the basisof response spectra at the pool floor level.The 3D single rack finite element model of the thinwalled cellular structure is modeled out ofequivalent elastic beams, rigid beams and couplingelements as described above (Fig. 2). This model isintended to simulate the dynamic behavior for the
study of all parameters, such as:• variation of coefficient of friction• variation of occupancy of the rack• variation of level of seismic input
The main purpose of the 2D (or 3D) multi rackfinite element model is to simulate thedisplacement behavior of the whole pool. For theanalyses the most unfavorable directions areselected; highest uplift, highest displacements. Themodeling is similar to the 3D model that means allthe specific aspects are introduced in thisanalyses too.
The results of the nonlinear dynamic analyses areused for the pool liner and pool floor investigationas well as for the structural rack analyses. Typical
shown in Fig. 3 and Fig. 4.
Top view
.....it,.i i
H I - .
_ == =J
_ Jn
_
Figure 2: 3D single rack model
Figure 3: Vertical force at one rack footTIME *
Nuclear Energy in Central Europe '9 257

TIME
Figure 4: Horizontal displacement at one rack foot
3.3.2 Structural AnalysesAll loads specified by the applicable regulations are considered in the structuralanalyses. For the dynamic events the loads are input in such a way that the mostunfavorable distribution of forces resulting from the nonlinear dynamic analyses arecovered. The stability of a channel is of great importance during dynamic events, sospecial buckling investigation is performed for the channel in the vicinity of a rackfoot. In addition, forces due to fuel assembly / rack interaction and hydrodynamicpressure is taken into account.
Figure 5: 3D Finite Element Mode]
258 Nuclear Energy in Central Europe '98

Accident events are defined for postulated load drop onto the storage rack. In thiscase, it is demonstrated that no severe damage occurs to the rack and the pool liner andthat the rack keeps its functional capability.
The total structural analysis consists of various investigations to accomplish thedifferent requirements. The most important one is the global model of one rackwhich is a 3D finite element model of up to 50 000 plate elements, approx. 3000spring elements and some beam elements (Fig. 5).
To check the stability of the channels, especially in the neighborhood of the rack feet, aseparate FE-model is used for the buckling analysis. Other separate models are used toanalyze the food pad and the limit loads due to FSI pressure for the outer walls.
Typical results of the structural analyses are shown in Fig. 6 and Fig. 7.
AN SYS 6.4AUO 1* 199917:09:36PLOT NO. 1NODAL SOLUTION£TEP*3999SINT (AVG)MIDDLEDMX M.BiBSMN ".123375SMX "10B.2T1^ ^ .123378
2 12-251
72.H8866.01697.H3
Figure 6: SSE stresses in the lower grid
1 FIR5T LOAD STEPFZ = 50 KN
SSI
it
LAST LOAD STEPFZ « 356.65 KN
•
HIm
AHSYS 9.4MAY 27 1)9SQI:tT:ISPLOT HO. 2
ECtSE HIO0EN
Figure 7: Stability of the channels (nonlinear buckling)
Nuclear Energy in Central Europe '98 259

3.4 Acceptance Criteria for fuel racksThe acceptance criteria for storage racks are in accordance with the limits of ASME151. For each analysis result and for the different service levels an assessment ismade as shown in the following table.
Limits for Service Level A and B ASME Sect. Ill Subsection NFLimits for Service Level D ASME Sect. Ill Appendix F
type of assessment
• primary stress(plate and shell)
• primary stress(linear type)
• weld stress
• stability
• limit load
• primery plus secondary stress
ServiceLevel A
Pm
tensionshearbearingbolting
Pm, PL + Pb, etc.
1/2 of crit.buckling stress
stress range
| ServiceI Level B
; tension; sheari bearingi bolting
j 1/2 of crit.j buckling stress
!. 2/3 of collapse load
ij
ServiceLevel D
tensionshearbearingbolting
2/3 of crit.buckling stress
collapse load
The assessment of the structural analysis results of the new high density storage rackdesign confirms the structural criteria and shows that the design provides a safecompact storage of spent fuel under normal and accident conditions.
References:
[1] M. Peeks, J. Banck. Spent Fuel Storage: A Reliable Technology in the Back End of theFuel Cycle.ASME, Praque Sept. 1993.
[2] Federal Regulation 10 CFR 50General Design Criteria
[3] U.S. NRC Regulatory Guidese.g. 1.13
[4] U.S. NRC Standard Review PlanSRP NUREG-0800
[5] ASME Section IIISubsection NF and Appendix F
260 Nuclear Energy in Central Europe '98

SI0100118
Nuclear Energy in Central Europe "98
Terme Catez, September 7 to 10, 1998
THE TOUGHNESS REQUIREMENTS FOR REACTOR
PRESSURE VESSEL STEEL
Darko Korosec, dipl.ing.Slovenian Nuclear Safety Administration
Vojkova 59,1000 Ljubljana, Slovenia
Doc. dr. Jelena Vojvodic TumaInstitute of Metals and Technology
Lepi Pot 11,1001 Ljubljana, Slovenia
Abstract
The nuclear industry world-wide has developed different design procedures to prevent the occurrence ofunexpected and sudden failures in reactor pressure vessels of nuclear power plants. The standards and codes onthe nuclear safety field in different countries contain many of the specific requests regarding the behavior of theflaws and defects in the reactor pressure vessel, during the fabrication, preoperational tests and specially duringthe exploitation.The presence of the flaws and other sources of the high stress concentration in the reactor pressure vessel candecrease its load - carrying capability. The reactor pressure vessel flaws are affected by the service loadings andthe general observation must be made quantitative. What should include such observation is described andcommented.In the paper, the implementation of the fracture mechanics concept as a fracture control of the reactor pressurevessel is described. The reactor vessel material toughness properties are discussed in the light of someparameters affecting them.
1. Introduction
For the nuclear power plant Pressurized Water Reactor type, the reactor pressure vesselintegrity is the most important in the light of safe operation. Different operational conditions,mainly emergency and faulted, could have strong impact on the structural integrity of reactorpressure vessel. This component represents one of the most important barriers to preventrelease of radioactive products into the containment. Due to the physical effects, like neutroninduced irradiation, the permanent degradation of the thermomechanical properties of thereactor pressure vessel is present during the operational phase.One of the most important parameters in reactor pressure vessel integrity studies is thetoughness of its material. Fracture mechanic criteria and procedures deal primarly with theeffect of toughness degradation and influence on the existing crack propagation in the case of
Nuclear Energy in Central Europe '98 261

unallowed operational conditions .
2. Main Principles of Fracture Control Procedures
Worldwide intensive activity on design procedures to prevent the occurrence of unexpected,sudden failures in the reactor pressure vessel is under progress. In the past years, many of thefactors which need to be considered for reliable assessment are now known.For the engineering design and operational control purposes, the following quantitativeobservation must be made [1]:
• all important material properties of the reactor pressure vessel, which determine themagnitude of the strength reduction
• the relation between strength reduction and geometry of the flaw
• the influence of reactor pressure vessel geometry (critical locations) to the stress statewith the rate and kind of applied loads
• the presence of nonapplied loads such as residual stresses from welding
3. Fracture Mechanics Concept
The basic analysis assumes elastic behavior of the stresses in the reactor pressure vessel,including the region around the crack tip. The stress distribution near the crack tip is alwaysthe same and the stress magnitudes all depend on a single quantity termed the "StressIntensity Factor"; Kj. All equations has the identical form:
K ^ C o C i t a ) * , . (1)
where : a = nominal tensile stress perpendicular to the plane of the cracka = characteristic crack dimension, such as crack depth for surface cracksC = nondimensional constant whose value depends on the crack geometry, theratio of the crack size to the size of the structural member and the type ofloading.
The basic premise of linear elastic fracture mechanics concept is that unstable propagation ofan existing flaw will occur when the value of K, attains a critical value designated as K,c .K,c is generally called the fracture toughness of the material. It is a temperature dependentmaterial property.The implementation of the fracture mechanics concept for the reactor pressure vessel fractureintegrity assessment consists of two essential steps:
• determination of the K]C properties of the reactor pressure vessel material usingsuitable test specimens and conditions
v determination of the actual or anticipated flaw size in the structural component andthen calculation of the limiting value of stress which will keep the value of K,in the component less than K1C . The conservatism with applying a safety factor forthe stress and flaw size may be used.
Nuclear Energy in Central Europe '98

4. Reactor Pressure Vessel Analysis
For the Pressurized Water Reactor (PWR) type, an ASME Code in section III Appendix Gprescribe the analysis methods for normal, upset and test conditions of reactor pressurevessel. The analysis methods are applied to four locations in the reactor pressure vessel(Fig.l):• closure head to flange region• nozzle to shell course region• beltline region• bottom closure head to shell course region
Control rod drivemechanisms
Closure headthicknesstransition
Closure headregion
Closure flange
Outlet. ,nozzle \ J
Reactorcore
Radius
-Vssse! watlthicknesstransition
-Thickness
-Vessel wall tolower headthicknesstransition
In-coreinstrumentationpenetrations
Nozzleshell-courseregion
Beltline /region \
Lower headregion
Figure 1 Reactor Vessel Critical Areas
The reactor pressure vessel beltline region is adjacent to the reactor core and is of the majorinterest because of the neutron flux in this area. High energy neutrons(> lMeV) cause damage to the metal's crystalline lattice structure and causes increase in thetemperature at which brittle fracture occurs.
Nuclear Energy in Central Europe '98 263

5. Temperature Influence
Brittle fracture is the most severe type of fracture, which can occur in reactor pressure vesselunder specific circumstances. Brittle fracture occurs at low temperatures with very littleexpenditure of energy and is characterized by very fast crack propagation. Brittle fractureusually occurs with very little plastic deformation.The temperature below which the metals fails by brittle fracture is called the nil-ductilitytransition temperature (NDTT). It is very important to know reactor pressure vessel materialNDTT, in order to avoid brittle fracture.The determination of NDTT involves the testing of reactor pressure vessel samples. Thetesting of these samples is a part of reactor pressure vessel surveillance program [2].Code of Federal Regulations (CFR) in chapter 10CFR50 Appendix H contains requirementsfor periodic testing of specimens. The testing will determine the change in NDTT caused bythe expository to high energy neutrons.The testing methods are Drop Weight Test and Charpy V- Notch Test, which is usually used,due to the form of pre-prepared test samples, that are in specimen holders, which are locatedon the inside of the reactor pressure vessel. These specimens are exposed to a neutron fluencefrom the reactor core that is proportional to that of the beltline.The purpose of these tests is to determine the temperature where plastic failures start toappear.Article NB-2331 of ASME Code, Section III gives the acceptance criteria for the Charpy V-Notch Test:• at a temperature not greater than NDTT + 60° F, each specimen shall exhibit at least
35 mils lateral expansion and not less than 50 ft-lb absorbed energyCrack arrest intensity as a function of reference NDTT (RTNDT) is called the reference stressintensity factor Km. The recommended values of the reference stress intensity factors areshown on Figure 2.
150
140
120
100
sf
60
20
R"
6.78 -1.233 exp [0.0145 (T-RTNDT + 160)]. whe
K(p —reference stress Intensity factor, klav
T = temperature at which K]R is permittee
I~NDT = reference nil ductility temperature
•in — . — —
re
/in.i. °F
J/
/
If\zzzr1
-240 -200 -160 -120 - 8 0 -40 0 40 80 120 160 200 240
TEMPERATURE RELATIVE TO RTN 0 T ((T-RTNDT)). °F
Figure 2 Temperature relative to RTNDT
264 Nuclear Energy in Central Europe '98

The relationship between stress intensity factor K,R and
K1R = 26,78+1,233 e°-0 1 4 5 { T-R \ + 160>
is:
NDT
Any point on the line or below represents a stress/temperature combination where the crackwill not propagate. Values of stress must be limited to values that are less than or equal toallowable values of KIR .
6. Neutron Fluence Influence and Impurities in Material
In the past research work, mainly done in USA, it was established, that copper (Cu) andphosphorus (P) content in reactor pressure vessel material has strong influence on irradiationinduced damage in the crystalline material lattice [3]. These two materials are treated as mostundesirable impurities in reactor pressure vessel material. The weight percentage content forthese two elements is strictly limited by the nuclear regulation in the countries producingreactor pressure vessels. Due to the neutron fluence, these two elements form ultra fineprecipitates on the material grain boundaries with the embrittlement and toughness loweringas direct consequences.Neutron fluence has the effect on increase of RTNDT . This relation is shown on fig. 3, fordifferent contents of Cu in reactor pressure vessel material.
ART N D T400
300
200
100
50
Upper Limit
Upper Limit
0.35 0.30 0.25 0.20%Cu O.t5%Cu 0.1C%Cu= 0.012
02x10
I I I I MM17
M i l l INI
Lower Limit% Cu = 0.0896 P = 0.008
J I I I6 8 10'° 2 4 6 8 10iy
Fluence, n/cm2(E>1MeV)6
Figure 3 The Effect of Neutron Irradiation on RTNDT
Nuclear Energy in Central Europe '98 265

7. Conclusions
The importance of detailed reactor vessel integrity assessment is in countries with operatingnuclear facilities strongly present. For an effective assessment it is necessary to made:
• detailed stress analysis for different operational conditions, taking into accounttemperature gradients
• surveillance program with reliable results of reactor pressure vessel samples• in service inspection of reactor pressure vessel boundaries, using ultrasonic and eddy
current testing methods, to establish the presence of flaws*• fracture mechanics analysis by ASME Code
Using all these data, the pressure - temperature limit curves ( Fig.4) could be verified and if itis necessary, recalculated. It is essential to ensure that the reactor pressure vessel is notsubjected to pressure transients due to reactor operation which would cause the pressure andtemperature stress limits to be exceeded. With the presence of flaws in critical vessellocations, such situation could have severe consequences.
o
(PS
lP
RE
SS
UR
E
i-z
CO
OL
CT
OR
3000
2800
2600
2400
2200
2000
1800
1600
1400
1200
1000
800
..-L^-L-,..i
4 0 0
2 0 0
— HEATUP RATESUP TO fOO°F/HR
..:.. . j..:.; .. CRITICALITY .L .i • • LIMIT
1 ; ir
STEAM GENERATORDIFFERENTIAL PRESSURELIMITATIONS
MAXIMUM RESIDUAL HEATREMOVAL LOOP OPERATINGPRESSURE
RCP NPSHREQUIREMENT 1
C00L00WN RATE °F/HR -j600
100 2OO 300 400 500
REACTOR COOLANT TEMPERATURE (°F)600
Figure 4 Typical Heatup/Cooldown Curve
266 Nuclear Energy in Central Europe '98

8. References
1. PVRC Recommendations on Toughness Requirements for Ferritic Materials, WRCBulletin, 175, August 1972.
2. Westinghouse technology Advanced Manual, US NRC Tech. Training Center, 1995 Ed.
3. Ageing Management of PWR, M.Erwe, Siemens/KWU, Erlangen, 1996.
4. US NRC Research on Reactor Pressure Vessel Steel Embritlement, Effects of Radiation onMaterials, 16. Int. Symposium, 1994.
Nuclear Energy in Central Europe '98 267

SI0100119
Nuclear Energy in Central Europe '98
Terme Catez, September 7 to 10, 1998
NUMERICAL ANALYSIS OF BRANCHED CRACKS IN BI-AXIALSTRESS FIELDS
M. Kovac, L. Cizelj"Jozef Stefan" Institute, Jamova 39,1000 Ljubljana, Slovenia
ABSTRACT
The stress corrosion cracks as seen for example in PWR steam generator tubing made ofInconel 600 are usually found to be of highly irregular kinked and branched shapes.
Numerical analysis of kinked and branched cracks in bi-axial plane stress fields usingmethods such as finite or boundary element method may provide useful and cost effectivesolutions. However, accurate analysis of complex shaped cracks requires very fine meshesand, consequently, excessively high computational efforts.
This paper discusses some possible strategies of numerical modeling of kinked and branchedcracks in general bi-axial stress field using the general-purpose finite element code ABAQUS.The strategies discussed include J-integral and stress intensity factor solutions with differentmesh densities. The accuracy of the numerical results obtained is compared with referencesolutions from the literature.
The main result of the paper is an optimal numerical strategy, which maximizes the accuracyof the results at as low computational efforts as feasible. The selected optimal strategy isexpected to be used in the future simulations of large networks of inter-granular stresscorrosion cracks at the grain-size scale using incomplete random tessellation.
1. INTRODUCTION
The inter-granular stress corrosion cracks are one of the main causes for early retirement oftubes in steam generators of PWR nuclear power plants [1.]. Combined influence ofmechanical loads and aggressive environment causes the development of random cracknetworks. Typical pattern obtained by numerical simulation of inter-granular crackpropagation, which is in agreement with metalographical analyses of pulled out tubes fromthe steam generators [2.], is presented in Figure 1. .
Nuclear Energy in Central Europe '98 269
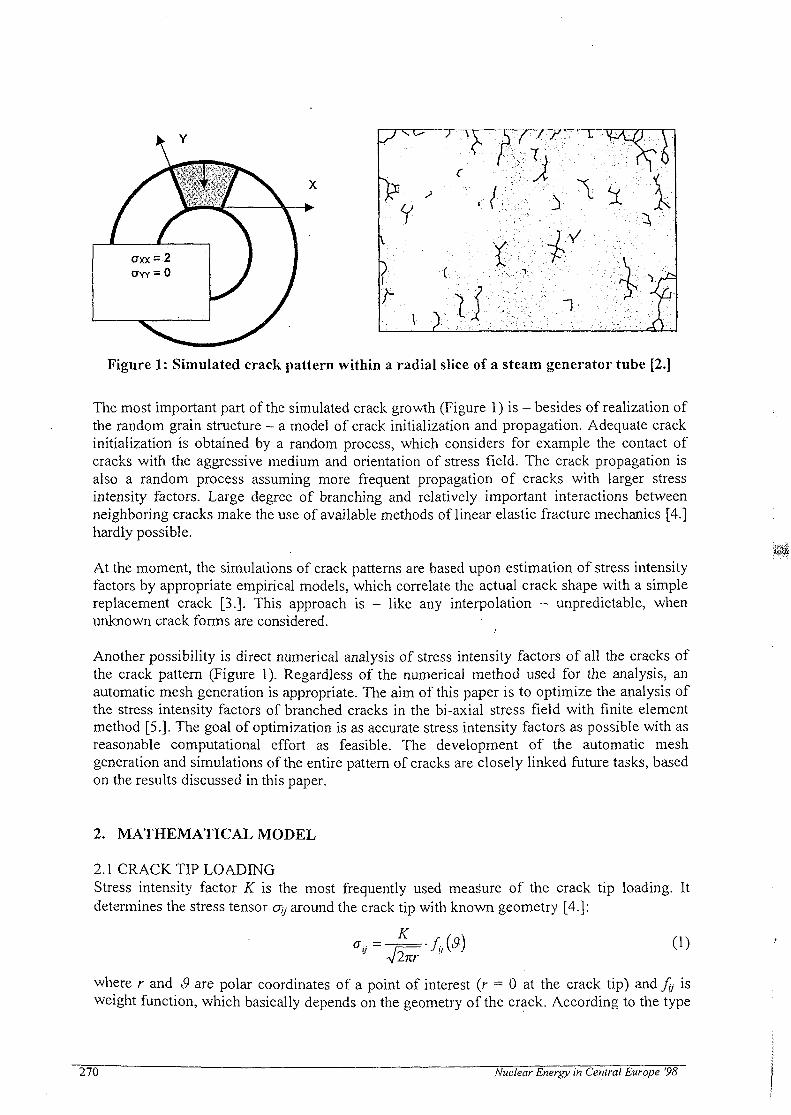
Figure 1: Simulated crack pattern within a radial slice of a steam generator tube [2.]
The most important part of the simulated crack growth (Figure 1) is - besides of realization ofthe random grain structure - a model of crack initialization and propagation. Adequate crackinitialization is obtained by a random process, which considers for example the contact ofcracks with the aggressive medium and orientation of stress field. The crack propagation isalso a random process assuming more frequent propagation of cracks with larger stressintensity factors. Large degree of branching and relatively important interactions betweenneighboring cracks make the use of available methods of linear elastic fracture mechanics [4.]hardly possible.
At the moment, the simulations of crack patterns are based upon estimation of stress intensityfactors by appropriate empirical models, which correlate the actual crack shape with a simplereplacement crack [3.]. This approach is - like any interpolation - unpredictable, whenunknown crack forms are considered.
Another possibility is direct numerical analysis of stress intensity factors of all the cracks ofthe crack pattern (Figure 1). Regardless of the numerical method used for the analysis, anautomatic mesh generation is appropriate. The aim of this paper is to optimize the analysis ofthe stress intensity factors of branched cracks in the bi-axial stress field with finite elementmethod [5.]. The goal of optimization is as accurate stress intensity factors as possible with asreasonable computational effort as feasible. The development of the automatic meshgeneration and simulations of the entire pattern of cracks are closely linked future tasks, basedon the results discussed in this paper.
2. MATHEMATICAL MODEL
2.1 CRACK TIP LOADINGStress intensity factor K is the most frequently used measure of the crack tip loading. Itdetermines the stress tensor ay around the crack tip with known geometry [4.]:
where r and & are polar coordinates of a point of interest (r = 0 at the crack tip) and fy isweight function, which basically depends on the geometry of the crack. According to the type
270 Nuclear Energy in Central Europe '98

of the crack loading, two independent stress intensity factors K\ (opening) and K\\ (shear) [4.,6.1 are used in planar problems.
Stresses or deformations in at least one point should be known to determine stress intensityfactors K\ and K\\. However, the singularity of the stress tensor around crack tip (Eq. 1) makesnumerical determination of the stress intensity factor with finite element method ratherdifficult. The estimates of stress intensity factors A'I and K\\ must be extrapolated towards thecrack tip. Therefore models with large numbers of elements are needed to support theextrapolation.
2.2 J- INTEGRALBetter numerical stability of the results could be obtained using energy quantities, such as J-integral [4., 6.]:
J-(wdy-As)A dx ) (2)
where F is an arbitrary closed integration contour around crack tip, Tt is stress vectorperpendicular to curve F.
T.-W (3)
u is displacement within direction x and Wis deformation energy given by:
W = W(x,y)=W(s)=)alld£iJ
(4)
Sy is the deformation tensor.State-of-the-art techniques for numerical evaluation of J-integral value are based uponintegration over area (or volume for three-dimensional cases) instead of integration along thecurve (Green's theorem). Additional dimension of integration contributes to the stability ofresults obtained using coarse meshes and therefore less computational efforts.
2.3 DECOMPOSITION OFJ-INTEGRAL TO STRESS INTENSITY FACTORS K{ AND Kn
In elastic fracture mechanics the J-integral and stress intensity factors are related as:
JE
Exact procedures for decomposition of J-integral into the stress intensity factors K\ and K\\ aregiven in the literature [7.]. In general, the stress field should be divided into symmetrical andanti-symmetrical part, resulting in symmetrical and anti-symmetrical part of J-integral. In ourcase (Figure 1), such procedure should be repeated for every crack tip. This would exceedavailable computational capacity. Therefore, we developed and tested the method, which isdescribed below.
Finite element method enables calculations of displacements around the crack tip.Displacements u at point T (r, 3) are given as:
,\(L K, + /,„ Kn); uv ^ J[ f v , , /v// n) (6)
Nuclear Energy in Central Europe '98 111

where vis Poisson number, E is Young's module and/is weight factor with index denotingthe coordinate and the loading type of the crack. Stress intensity factors K\ and K\\ dependupon the displacement field, the size and the geometry of the crack. Values of stress intensityfactors K\ and K\\ can be calculated using:
_ fyll
J.xl ' J yll Jxll ' Jyl i + ^ V f J xl • J yii J x/i • J y!
Numerical values of stress intensity factors K\ and K\\ depend strongly on position of thechosen point with respect to the crack tip. Therefore the ratio of both stress intensity factorswas introduced:
^1 fyll ' Ux - fxll ' Uy (g)
Ratio k was found to be reasonably stable, especially at nodes, which are collinear withobserved crack tips. Hence there is no need for extrapolation of stress intensity factors K\ andK\\ towards the crack tip. Apart from k ratio, the value of ./-integral, which is a sum ofcontributions of K\ and K\\ (Eq. 5), is needed for decomposition. Stress intensity factors K\ andK\\ are:
Ku =k-Kl
at which Jmm is a numerically obtained value of J-integral.
3. NUMERICAL EXAMPLES
Two numerical examples will be presented here. The first is kinked crack shown in Figure 2,and the second is branched crack shown in Figure 3. An analytical result of the first exampleis known from literature [9.] within 3%. This result is used as a reference value. Uni-axialstress is - due to the assumed elastic behavior of material (principle of superposition) -enough to verify the results in a bi-axial stress field. Reference results for branched crack inan equi-bi-axial stress field were obtained by calculation with boundary element method [3.].
272 Nuclear Energy in Central Europe. '98

Figure 2: Coarse (left) and fine (right) finite element mesh of a kinked crack
Figure 3: Coarse (left) and fine (right) finite element mesh of a branched crack.
The cracks were modeled with meshes of different densities. The finest and the coarsestmeshes used in calculations are shown in Figures 2 and 3. As a measure of the mesh densitytypical length of element at the crack tip was used as shown in Figure 4. Therefore the finestmesh has a relative size of a typical element equal to 12.5% and the coarsest mesh has arelative size of a typical element equal to 100% of the crack length.
size of atypical element
crack tip
mesh
Figure 4: Size of a typical element
The calculation was performed using finite element code ABAQUS/Standard. Meshes aroundcrack tips were modeled using collapsed singular elements. Singular elements describe the
Nuclear Energy in Central Europe '98 273
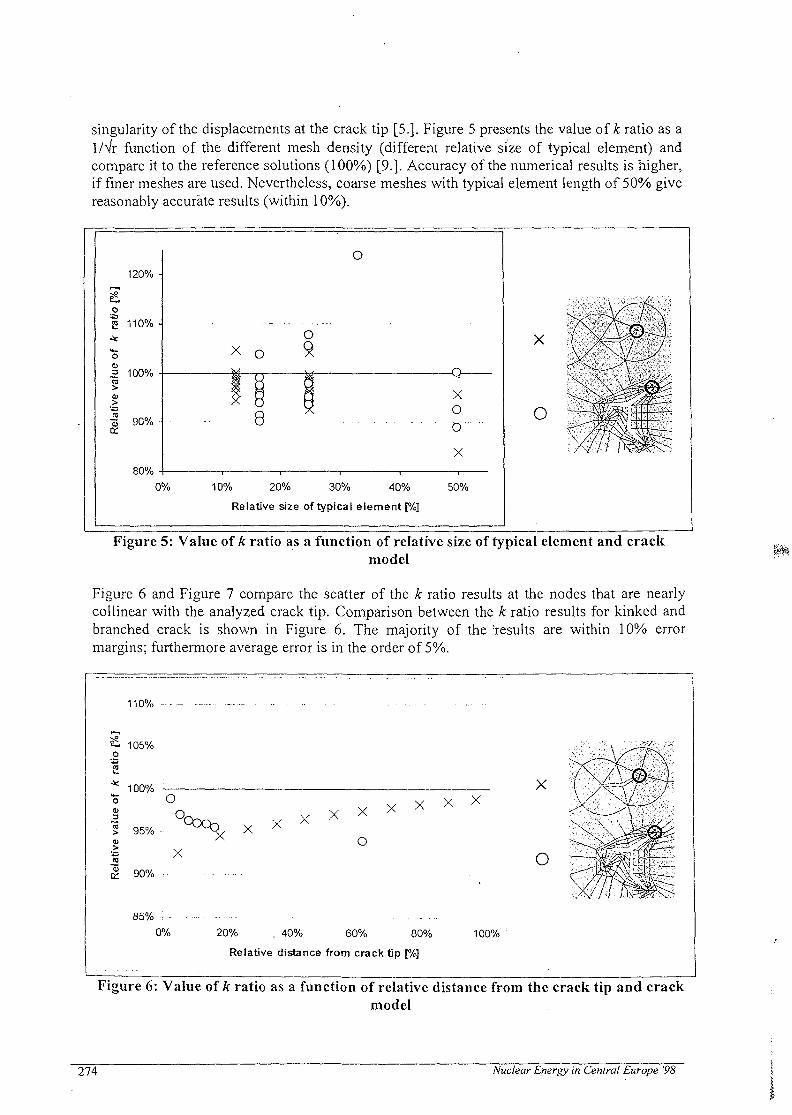
singularity of the displacements at the crack tip [5.]. Figure 5 presents the value of k ratio as a1/Vr function of the different mesh density (different relative size of typical element) andcompare it to the reference solutions (100%) [9.]. Accuracy of the numerical results is higher,if finer meshes are used. Nevertheless, coarse meshes with typical element length of 50% givereasonably accurate results (within 10%).
10% 20% 30% 40%
Relative size of typical element [%]
Figure 5: Value of k ratio as a function of relative size of typical element and crackmodel
Figure 6 and Figure 7 compare the scatter of the k ratio results at the nodes that are nearlycollinear with the analyzed crack tip. Comparison between the k ratio results for kinked andbranched crack is shown in Figure 6. The majority of the results are within 10% errormargins; furthermore average error is in the order of 5%.
110%
105%
100%o OS o,
X
90% •
85% ;
o%
X X X x x x
o
xX
o
20% . 40% 60% 80%
Relative distance from crack tip [%]
100%
Figure 6: Value of k ratio as a function of relative distance from the crack tip and crackmodel
274 Nuclear Energy in Central Europe '98

E
ratio
e va
lue
of
kat
iv
o
110% -
105% -
100% -
95% -
90% -
X
0%
Ox o
X
• - • - - -
5%
Relative
A
oX
OX
10%
distance from
QXA
crack
y
" A '
15%
tip [%]
20%
typical element size
o s lXWJM
X
—iA ^iV/
mmm0.167
0.25
=•." ) • ' / . .
ml0.5
Figure 7: Value of A: ratio as a function of relative distance to the crack tip and relativesize of typical element (branched crack)
Comparison of the k ratio results as a function of the relative distance to the crack tip anddifferent mesh densities is shown in Figure 7. The finest mesh provides the best results.However, even the coarsest mesh can provide results within averaged errors in the order of6%.
4. SUMMARY
The paper discusses optimized analysis of stress intensity factors of kinked and branchedcracks in bi-axial stress field using finite element method. Analyses were made by simpledecomposition of ./-integrals, which were obtained by computer code ABAQUS. Thefollowing actions are recommended for more accurate results:• Use of singular elements to model the crack tip.• Meshes with typical element length of 50% of a crack length should be used for
reasonable accurate results (within 10%).• Decomposition of ./-integral should be performed at nodes that are nearly collinear with
analyzed crack tip.• Decomposition of/-integral should be performed at nodes within 50 % relative distance
from the crack tip.The averaged estimates of stress intensity factors are then expected to be within 6% errormargin.
Future work will focus on simulations of large networks of inter-granular stress corrosioncracks at the grain-size scale using incomplete random tessellation. The optimal strategydiscussed in this paper will be used as a basis.
Nuclear Energy in Central Europe '98 275
5. ACKNOWLEDGMENT
Authors wish to thank to Ministry of Science and Technology of Slovenia for financialsupport and to Dr. Heinz Riesch-Oppermann (Forschungszentrum Karlsruhe) for numerousfruitful discussions.
6. LITERATURE
[1.] Banic, M.J., Bros, J., Cizelj, L., et al, Assessment and Management of Ageing of MajorNuclear Power Plant Components Important to Safety: Steam Generators, IAEA-TECDOC-981, International Agency for Atomic Energy. Wien, Austria, 1997.
[2.] Cizelj, L., Oppermann, R. H., Modelling the Early Development of Secondary StressCorrosion Cracks in Steam Generator Tubes Using Incomplete Random Tesselations,Proc. Of International Symposium on Contribution of Materials Investigation to theResolution of Problems Encountered in Pressurized Water Reactors, Fontevraud,France, 14-18.9.1998, in print.
[3.] Kullig, E., Johansson, T., Briickner-Foit, A., Riesch-Oppermann, H., Munz, D.,Winkler, T., Michel, B., Ermittlung der Lebensdauerverteilung bei Thermoermudungmit der Methoden der stochastischen Geometrie, Report FZKA 5692,Forschungszentrum Karlsruhe, Germany, 1996.
[4.] Broek, David: Elementary Engineering Fracture Mechanics, Martinus NijhoffPublishers, USA, 1987.
[5.] ABAQUS/Standard, User's Manual, Version 5.7, Hibbit, Karlsson & Sorensen, Inc,USA, 1997.
[6.] Aliabadi, M. H., Rooke, D. P.: Numerical Fracture Mechanics, Computer MechanicsPublications, Kluwer Academic Publishers, Dordrecht, Netherlands, 1991.
[7.] Rigby, R. H., Aliabadi, M. H.: Decomposition of The Mixed-Mode J-Integral -Revisited, International Journal of Solids Structures Vol. 35, No. 17. pp. 2073-2099,USA, 1998.
[8.] Mainnay, Dominique. P.: Fracture Mechanics, Springer-Verlag New York, Inc., USA,1998.
[9.] Murakami, Y. et al.: Stress Intensity Factors Handbook, Volume I, Committee onFracture Mechanics, The Society of Material Science, Pergamon Press, Japan, 1987.
276 Nuclear Energy in Central Europe '98

SI0100120
Nuclear Energy in Central Europe '98
Terme Catez, September 7 to 10, 1998
THE USE OF EXPERT OPINION FOR ESTIMATION OFCOMPONENT UNAVAILABILITY
R. Jordan Cizelj, I. Kljenak"Jozef Stefan" Institute, Jamova 39, 1000 Ljubljana, Slovenia
romana,[email protected]@ijs.si
A B S T R A C T - When evaluating system safety with Probabilistic Safety Assessment (PSA), data ofcomponent reliability are necessary input data. Despite a significant effort which has been devoted to thecollection and processing of reliability data during the last ten years, the quality of data available is still notsatisfactory. In the present paper, a method for a suitable failure rate estimation with the help of expertjudgement of maintenance people is proposed. Expert judgement about component state is combined withinformation gathered from a classical reliability database. With the proposed method, generic data are adapted tospecific components with combination of probability and fuzzy logic theory.
1 Introduction
Probabilistic Safety Assessment (PSA) is a widely used tool for evaluation of safety ofcomplex technologies, since it enables processing large amounts of information. However,precise information, necessary for modeling, is often limited or even missing. The mainsources of uncertainty in PSA are:
limited knowledge of physical phenomena:at some stage in evaluating the probabilities of events, models of relevant physicalprocesses must be used (e.g. does molten fuel- coolant interaction occur).
probabilistic modeling of systems:a system model may be imprecise due to assumptions, predictions or because of analyst'slimited knowledge about the system.
input reliability data:three main components of input reliability data uncertainty are stochastic uncertainty,subjective treatment of data and non-specific databases. The so-called stochasticuncertainty of input reliability data is related to the stochastic nature of random processes.The second source of uncertainties is introduced by subjective treatment of data, whichdepends on analysts, for instance, whether assumptions were adequately taken intoaccount when estimating failure rates. The third type of uncertainty is due to non-specificdatabases. A lot of events have a low frequency of occurrence, so the use of non-specificdata is unavoidable.
Despite a significant effort which has been devoted to the collection and processing ofreliability data during the last ten years, the quality of data available is still not satisfactory
Nuclear Energy in Central Europe .'98 279

[3]. The component reliability is significantly dependent on environmental and operationalfactors, materials used, design, maintenance, etc. The parameter which is normally generatedfor a PSA database is the failure rate, whereas other factors with high impact on componentreliability and on its failure rate are usually not explicitly given. Furthermore, data in databases are often gathered from different sources under the assumption that all the data comefrom a homogenous sample with a common constant failure rate, which is usually not thecase.
PSA applications for Technical Specification improvements, the development of PSA toLiving PSA and the use of PSA to represent actual plant safety status reveal that the presentmodels are not sufficient [8]. A major limitation is the uncertainty of parameter data, forexample uncertain failure rates [10].
Maintenance people often develop their own opinion, so-called expert judgement, about thestate of system components. They may identify some indications of deterioration incomponents during overhaul, for example the grease or lubrication may be dirty, traces ofcorrosion may be found, etc. [1]'. Although this opinion could be helpful for a moretrustworthy selection of the component failure rate, it is usually not included in PSA analyses.In the present paper, an approach for expert judgement integration into an existing componentprobabilistic model is proposed. Because expert judgement is of linguistic nature, fuzzy logictheory was used to evaluate this type of information.
2 Fuzzy Logic
In traditional mathematical modeling, based on "classical" mathematics, often the assumptionthat precise data or data with precise error bounds are available is used. The sets of objects(numerical data, frequencies) are named crisp sets and are uniquely characterized: an object isor is not a member of a crisp set. However, in real life, it seems quite often that the transitionbetween membership and non-membership is gradual (e.g. unhealthiness of radiation levels)[4]. Fuzzy sets are designed to realize the gradual transition from membership to non-membership.
Mathematically, the membership of element a to fuzzy set A is realized by a characteristicfunction, called membership function JUA(CI). It is a translation over a universe of discourse X,associated with the base variable %, to membership degrees between 0 and 1 (Equation 2.1).
jUA (x): X -» [0,l] Equation 2.1
Two basic examples of fuzzy sets are the empty fuzzy set ^(Equation 2.2) and the universalfuzzy set X (Equation 2.3).
Vx e X: jil0 (x) = 0 Equation 2.2
Vx e X: jUx (x) = 1 Equation 2.3
Fuzzy variables are such variables, which have fuzzy subsets of some suitable universe ofdiscourse X as their values [4]. It is often additionally assumed, that these fuzzy valuesvaguely indicate "true" values of these variables, which are points of the universe X. Alinguistic variable is a variable, which takes fuzzy variables as its values [9]. Selected fuzzyvariables constitute a term set of the linguistic variable. For example, the linguistic variable
280 Nuclear Energy in Central Europe '98
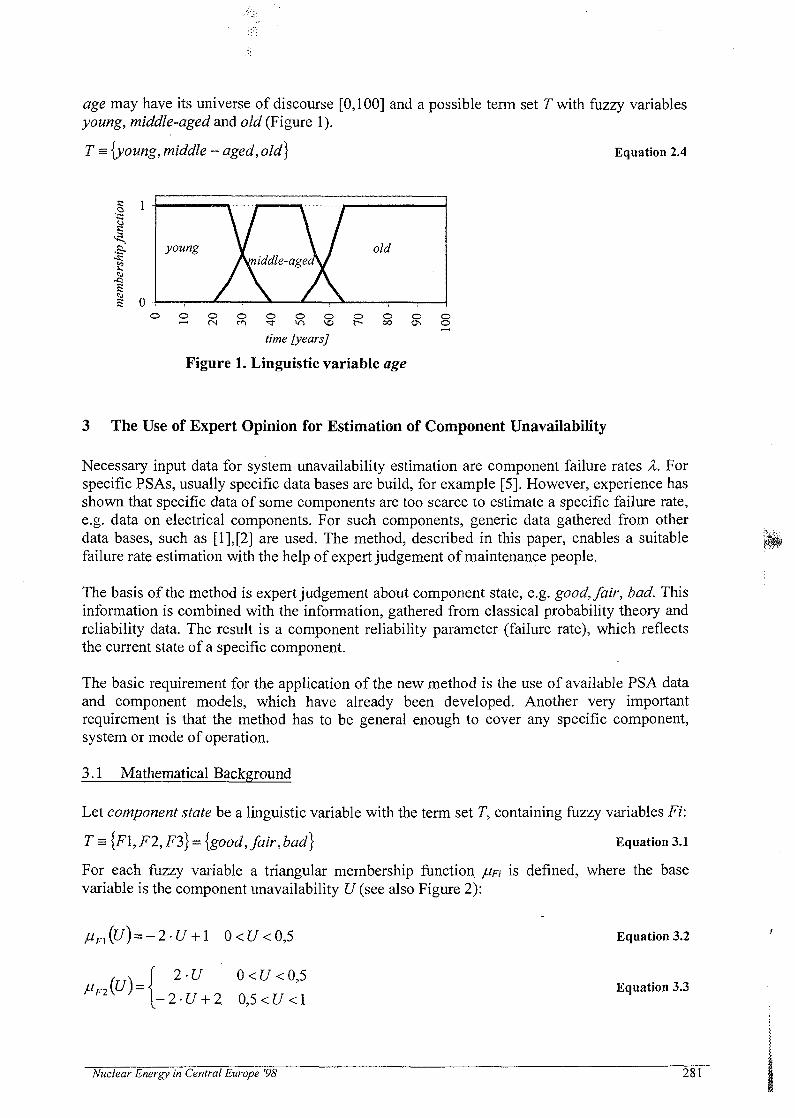
age may have its universe of discourse [0,100] and a possible term set T with fuzzy variablesyoung, middle-aged and old (Figure 1).
T = {young, middle - aged, old] Equation 2.4
on
•S--s:
-o
o o o o o o o o o o o
time [years]
Figure 1. Linguistic variable age
3 The Use of Expert Opinion for Estimation of Component Unavailability
Necessary input data for system unavailability estimation are component failure rates X. Forspecific PSAs, usually specific data bases are build, for example [5]. However, experience hasshown that specific data of some components are too scarce to estimate a specific failure rate,e.g. data on electrical components. For such components, generic data gathered from otherdata bases, such as [1],[2] are used. The method, described in this paper, enables a suitablefailure rate estimation with the help of expert judgement of maintenance people.
The basis of the method is expert judgement about component state, e.g. good, fair, bad. Thisinformation is combined with the information, gathered from classical probability theory andreliability data. The result is a component reliability parameter (failure rate), which reflectsthe current state of a specific component.
The basic requirement for the application of the new method is the use of available PSA dataand component models, which have already been developed. Another very importantrequirement is that the method has to be general enough to cover any specific component,system or mode of operation.
3.1 Mathematical Background
Let component state be a linguistic variable with the term set T, containing fuzzy variables Fi:
T s {Fl, F2, F3} = {good, fair,bad] Equation 3.1
For each fuzzy variable a triangular membership function JUFI is defined, where the basevariable is the component unavailability U (see also Figure 2):
l-U + l 0<U<0,5
2-U 0 <U <0,5
•2-U + 2 0,5<U<l
Equation 3.2
Equation 3.3
Nuclear Energy in Central Europe '98 281
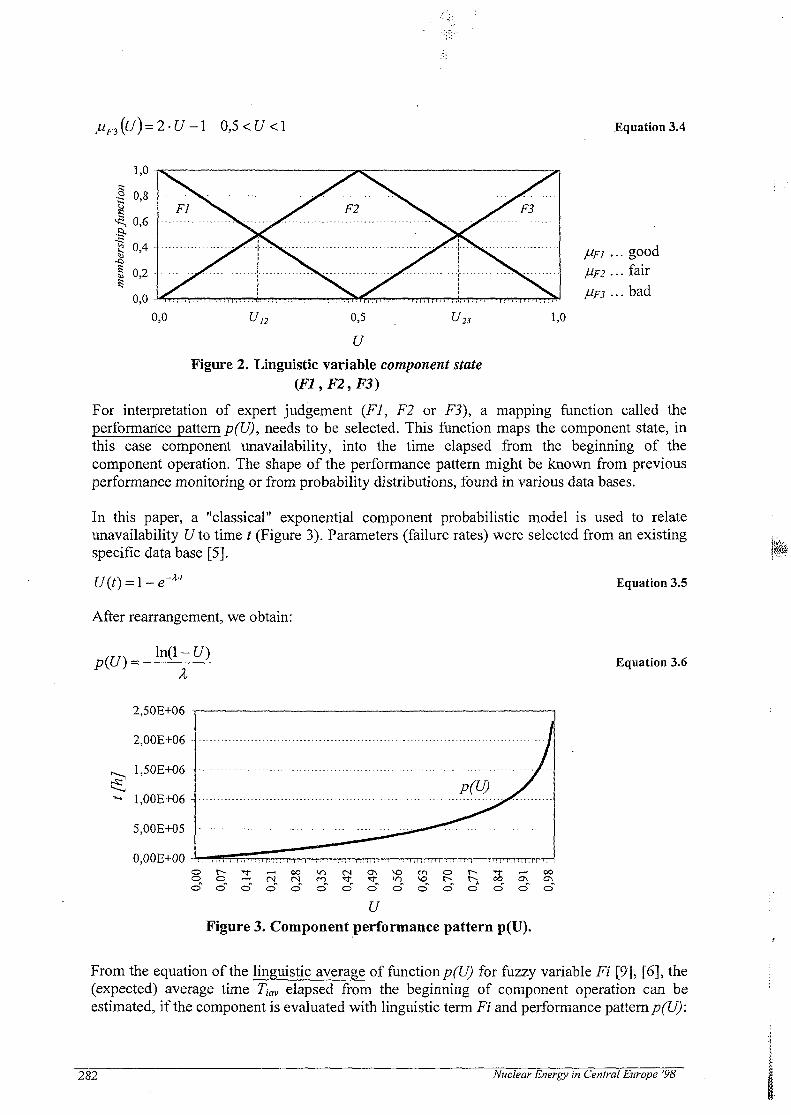
J*F3(U)=2-U-1 0,5 < t/ < 1 Equation 3.4
MF2
MF3
... good
... fair
...bad
Figure 2. Linguistic variable component state(F1,F2,F3)
For interpretation of expert judgement (FI, F2 or F3), a mapping function called theperformance pattern p(U), needs to be selected. This function maps the component state, inthis case component unavailability, into the time elapsed from the beginning of thecomponent operation. The shape of the performance pattern might be known from previousperformance monitoring or from probability distributions, found in various data bases.
In this paper, a "classical" exponential component probabilistic model is used to relateunavailability Uto time t (Figure 3). Parameters (failure rates) were selected from an existingspecific data base [5].
= 1 — e~ ' Equation 3.5
After rearrangement, we obtain:
XEquation 3.6
2.50E+06
o o o o o o o o o o o o o o o
uFigure 3. Component performance pattern p(U).
From the equation of the linguistic average of function p(U) for fuzzy variable Fi [9], [6], the(expected) average time Tiav elapsed from the beginning of component operation can beestimated, if the component is evaluated with linguistic term Fi and performance pattern p(U):
282 Nuclear Energy in Central Europe '98

Tiar = Av(p; Fi) = -. Equation 3.7\(jj)du
V
If the component is evaluated with linguistic term Fi, the unavailability Ufi(Tiav) is:
UFi(Tiay)^U(Tiav) Equation 3.8
The unavailability, concerning the selected component state term Fi, is compared with thecomponent unavailability, calculated with the classical probabilistic approach. The differencebetween unavailabilities based on probabilistic and combined probabilistic-fuzzy approach isused to estimate the new mean value of the component failure rate.
Eq»ation3.9
where:
To ... observation time: time, at which the component was linguistically evaluated
3.2 Procedure
1. Select the linguistic variable and its term set.
T(component state) = {F\, F2, F3\ = {good, fair, bad]
2. Determine membership functions JUFJ(U).
See Equations 3.2-3.4 and Figure 2.
3. Select component unavailability model U(t) and its probability parameters.
X ... probability parameter, selected from appropriate data base
4. Calculate component unavailability U(TO) with classical probabilistic approach.
5. Estimate, if the component unavailability, calculated with classical probabilistic approach,agrees with the unavailability interval of the selected fuzzy variable Fi.
The criterion of maximal membership function (See Figure 2) is:
0 < U(T) <Ul2 .. .component estimated with FI .. .classical model suitable... component estimated with F2, F3 ... estimation of Xnew needed
Un <U(T)< U23 .. .component estimated with FI .. .estimation of Xnew needed
Nuclear Energy in Central Europe '98 283

.. .component estimated with F2 .. .classical model suitable
... component estimated with F3 ... estimation of Anew needed
U23<U(T)<\ ... component estimated with F1,F2 .. .estimation of Xnew needed.. .component estimated with F3 .. .classical model suitable
6. Calculate average time Tiav elapsed from the beginning of component operation, if thecomponent is evaluated with linguistic term Fi.
See Equation 3.7.
7. Calculate component unavailability UFI, if the component is evaluated with linguistic termFi.
See Equation 3.8.
8. Calculate XneWj, taking into account the linguistic data of the component.
See Equation 3.10.
3.3 Example
Let the failure rate of a reviewed component be lognormally distributed with parameters:
A = 2E-6 1/hEF= 10
We estimate the component state at time T= 105.216 hours (« 12 years).
From Equations 3.7 and 3.8, we obtain:
Tlav« 96.574 h» 11 yearsT2av* 403.426 h « 46 yearsT3av « 1.096.574 h * 125,5 years
0,55
If the component state is Fi, then the corresponding, linguistically evaluated failure rate XneW
is (Equation 3.10):
ew2 ~ 7,7E-6
284 Nuclear Energy in Central Europe '98

On Figure 4, the resulting probability densities for component failure rate are shown, after thecomponent was evaluated with combined probabilistic-fuzzy approach. It was assumed, thatthe new failure rates are also lognormally distributed with error factor EF= 10.
0,006
.^ 0,005 -
| 0,004 -
^ 0,003
"I 0,002 -|
| 0,001
0oo
Wo
toaO
oUjv \
, r
oaoof
o(h
ow©CO
Afl/hJ
Figure 4. Possible probability densities after linguisticevaluation
The probability density of the generic failure rate is the lognormal distribution f(AgenenC).Using the linguistic variable component state, the shape of the probability density distributionis modified. If the selected fuzzy variable is good, then the mean of the component failure rateassumes a lower value; on the other hand, if the selected fuzzy variable is fair or bad, themean of the component failure rate assumes a higher value. The modification of the meanvalue of the failure rate depends on the observation time and the selected fuzzy variable.
In our case, the failure rate can change for a factor of 10 if the component state is bad. Forcomponents with high importance factors, calculated during system or power plant analysis,this increase in failure rate is not negligible and should be included in further assessment. Ifthe component is continually linguistically evaluated, then the method can be used as a basisfor plant specific data base building, failure data trending programme (ageing) or TSoptimization.
4 Conclusions
A method for estimating the component failure rate, and consequently componentunavailability, with the help of fuzzy logic methods, was proposed. With this method, thefailure rate reflects the knowledge of probability and fuzzy theory, generic information fromclassical reliability database and expert judgement of maintenance people about a specificcomponent.
The method is still in the phase of development and has two main weaknesses:
1. The result of the method is a point estimation of the failure rate. For a probabilitydistribution of the new failure rate to be obtained, some additional assumptions arenecessary.
Nuclear Energy in Central Europe '98 285

2. In the present paper, the linguistic variable component state has only three elementaryfuzzy variables: good, fair, bad. The selection of fuzzy variables, the shape of theirmembership functions, and the appropriate time of observation should be studiedseparately for specific components or groups of similar components in the plant.
However, the concept of combining probability and fuzzy logic theory seems to beappropriate for transformation of generic to specific data.
5 References
[1] IEEE Std 500-1984, IEEE Guide to the Collection and Presentation of Electrical,Electronic, Sensing Component, and Mechanical Equipment Reliability Datafor Nuclear- Power Generating Stations. New York: The Institute of Electricaland Electronics Engineers, Inc; 1983 Dec 13; ISBN: 83-082816.
[2] NUREG/CR-4550, Analysis of Core Damage Frequency: Internal EventsMethodology. Albuquerque: Sandia National Laboratories; 1990 Jan.
[3] Arnljot Hoyland, Marvin Rausand. System Reliability Theory, Models and StatisticalMethods. USA: John Wiley & Sons, Inc.; 1994; ISBN: 0-471-59397-4.
[4] Hans Bandemer, Siegfried Gottwald. Fuzzy Sets, Fuzzy Logic, Fuzzy Methods withApplications. Great Britain: John Wiley & Sons Ltd.; 1995; ISBN: 0 47195636 8.
[5] Ivan Kosutic. NEK PSA Plant Specific Data Base. Krsko: Nuclear Power Plant Krsko;1996 Dec; NEK ESDTR 14/96, Rev. 0.
[6] Jyh-Hone Wang, John M. Liittschwager Tzvi Raz. Censored Life-Data Analysis UsingLinguistic Variables. IEEE Transactions on Reliability. 1988; 37(1): 111-116;ISSN: 0018-9529.
[7] Knut 0ien. Improved Quality of Input Data for Maintenance Optimization UsingExpert Judgement. Reliability Engineering and System Safety. 1998; 6093-101; ISSN: 0951-8320.
[8] Lennart Carlsson, G. J. J. H. Problems and Benefits of Living PSA. Proceedings of 4thTUV Workshop on Living PSA Application; 1994 May 2-1994 May 3;Hamburg.
[9] Lofti A. Zadeh. The Concept of a Linguistic Variable and its Application toApproximate Reasoning-II. Information Sciences. 1975; 8:301-357.
[10] Marko Cepin, Borut Mavko. Probabilistic Safety Assessment Improves SurveillanceRequirements in Technical Specifications. Reliability Engineering and SystemSafety. 1997; (56):69-77; ISSN: 0951 -8320.
286 Nuclear Energy in Central Europe '98

SI0100121
Nuclear Energy in Central Europe '98
Terme Catez, September 7 to 10, 1998
CONTAINMENT PHENOMENA DURING A SEVERE ACCIDENT WITHREACTOR VESSEL FAILURE AT LOW PRESSURE IN A TWO-LOOP
PRESSURIZED WATER REACTOR
Ivo Kljenak, Iztok Parzer, Iztok TiseljReactor Engineering Division
"Jozef Stefan" InstituteJamova 39, Ljubljana, Slovenia
E-mail: [email protected]
ABSTRACT - The containment response during the first 24 hours of a low-pressure severe accident scenario ina nuclear power plant with a two-loop Westinghouse-type pressurized water reactor was simulated with theCONTAIN 1.2 computer code. The accident is caused by a large-break loss-of-coolant accident which is notsuccessfully mitigated by the action of safety systems. The analysis includes pressure and temperature responses,as well as analysis of the influence of condensation and gas generation due to molten core - concrete interaction.Convective mixing between the reactor cavity and the containment main compartment is also considered.
1. INTRODUCTION
In the event of a large-break loss-of-coolant accident (LB LOCA) in a pressurized waterreactor (PWR), coolant mass and energy are first released from the reactor coolant system tothe containment through the break. If the accident is not successfully mitigated by the actionof safety systems, core meltdown, relocation and release of radioactive material to thecontainment through the break followed by reactor vessel failure and debris ejection willeventually occur.
The containment response during the first 24 hours of such a cold leg LB LOCA in a nuclearpower plant (NPP) with a two-loop Westinghouse PWR was simulated with the CONTAIN1.2 computer code [2], which was developed by Sandia National Laboratories under USNuclear Regulatory Commission sponsorship. Initial and boundary conditions, which resultfrom processes not modelled by CONTAIN, were obtained from a simulation with theMELCOR code. Core-concrete interaction, including the attack of the basemat concrete bymolten core material, was modeled with the CORCON code, which is included in CONTAIN.
The analysis is focused on the thermal-hydraulic aspect of the containment response. Pressureand temperature responses as well as the influence of condensation and gas generation due tomolten core - concrete interaction are analyzed. Convective mixing between the reactor cavityand the containment main compartment is also considered.
2. INPUT MODEL
Containment Compartments - The geometry of the containment input model is based on[1]. The containment is subdivided into the following compartments (Fig. 1): main
Nuclear Energy in Central Europe '98 287

compartment with dome (two cells), annulus, reactor cavity, north steam generator (SG)compartment, south SG compartment and pressurizer compartment. The containment maincompartment is divided into two cells A and B by a vertical divide to model natural circulationfrom the reactor cavity.
Flow Paths and Engineering Vents - Five flow paths and 16 engineering vents are modeled.Connections between compartments are shown schematically on Fig. 1 (each connection mayrepresent several flow paths or engineering vents). Flows between compartments are modeledby applying the recently developed hybrid flow solver [3], except for the flow between thereactor cavity and the containment main compartment.
Heat Structures - The following heat structures are taken into account: containment vesselcylinder and dome, shield building cylinder and dome, polar crane, electrical andmiscellaneous equipment, piping, HVAC (heating, ventilation and air-conditioning systems),platforms, embedments, refueling canal and interior concrete [1].
Engineered Safety Systems - Four fan coolers and 2 spray systems are modeled. Sprays areinitiated when the containment pressure reaches 2.06 bar.
Physical Models - Among the many modeling options offered by the CONTAIN code, thefollowing are most relevant to the present work:
flowrates between compartments are calculated with the inertial flow model,default natural convection correlations (heat transfer between atmosphere andstructures) are used,
- liquid coolant may remain dispersed in the containment atmosphere (it does not dropinstantly to the floor),aerosol particles which exceed the maximum size are deposited in so-calledcompartment lower cells,
- molten core - concrete interaction is modeled with the CORCON code,energy generation in the core melt is taken into account by applying the CONTAINimplementation of the ANSI-standard decay power curve; in this work, 10% of thedecay heat was applied to the cavity atmosphere, whereas the rest was applied to theconcrete layer and the intermediate layer between the concrete and the coolant pool,burning of combustible gases is not considered.
Boundary Conditions : Coolant, Gas and Aerosol Releases and Melt Ejection - TheCONTAIN code does not model phenomena which take place in the reactor coolant system.To obtain time-dependent sources of coolant, gases, aerosols and molten core material whichcould be included in the CONTAIN input, a LB LOCA with no safety injection actuated wassimulated with the severe accident code MELCOR 1.8.3, as in [4]. The following sourceswere obtained:
liquid and vapor coolant,- gases: N2, O2, H2, CO2, CO,- aerosols: Ba, Ce, Cs, Csl, Mo, U, Xe,
molten core material: the majority of the core inventory is released to the cavity at lowpressure after vessel creep rupture at about 5500 s.
288 Nuclear Energy in Central Europe '98

Initial Conditions - The initial time (t = Os) is defined by the occurrence of the large break.The initial pressure in the containment was assumed to be 1.15 bar. The initial temperature ofthe containment atmosphere and heat structures was 322 K, except for the reactor pressurevessel, steam generators and pressurizer, whose initial surface temperature was 342 K.
3. RESULTS AND DISCUSSION
Three different simulations were performed:- base case,- case with no coolant condensation on heat structures,- case with no coolant condensation on aerosols.
The pressure response is very similar in all three cases. The pressure in the containment maincompartment-cell A (Fig. 2) first increases sharply due to coolant release from the primarysystem and then decreases as coolant condenses on heat structures or aerosols. The long-termpressurization is mostly due to generation of non-condensable gases (H2, CO, CO2) caused bymolten core-concrete interaction. This is illustrated on Fig. 3, which shows the evolution ofgas mole fractions in cell A of the main compartment for the base case. The small differencein the pressure if condensation on heat structures is not modeled suggests that condensationon aerosols is perhaps overestimated.
Figure 4 depicts the atmosphere temperature in cell A. Again, the shape is similar in all threecases. The temperature behaves inversely than the pressure: it is lower in cases where thepressure is higher. This suggests that the absence of latent heat released by condensationprevails over the larger amount of coolant vapor present in the containment atmosphere. Thelong-term temperature behavior shows that, with the present distribution of the decay heatover the reactor cavity lower cell and atmosphere, energy generation in the core melt does nothave a strong influence on long-term pressurization.
Figures 5 and 6 show the coolant distribution in the entire containment for the first two cases,respectively, when the pressure begins to fall after having reached its maximum value (t =150 s) and at the end of the simulation. It may be observed that the final coolant distribution issimilar in both cases. The main difference is the large amount of liquid on structures in thebase case-at t = 150 s. This shows that condensation on heat structures does not play animportant role in the long-term coolant distribution.
Figure 7 shows the total aerosol deposited mass in the first two cases. In the case with nocondensation on heat structures, much more vapor coolant condenses on aerosols, causing alarger deposited mass. Besides, a much higher deposition rate is observed in the initial stageof the same case, as particles exceed faster the maximum size after which they are depositedin compartment lower cells.
Figure 8 illustrates the hydrogen distribution in the containment (base case simulation). It maybe observed that most of the hydrogen generated by molten core - concrete interaction in thereactor cavity is entrained into the main compartment via natural circulation.
Decay heat and molten core - concrete interaction cause the gas temperature in the cavity toincrease to values up to 1500 K. The temperature difference between the cavity and the maincompartment causes intensive natural circulation through the opening around the reactorpressure vessel. To model the ensuing convective mixing, the reactor cavity is connected
Nuclear Energy in Central Europe '98 289

separately to cells A and B of the main compartment with a vertical engineering vent. Cell A isconnected to the SG compartment in which sources of coolant, gases and aerosols are placed(fig. 1), whereas cell B is connected to the other SG compartment. The initial temperatureincrease in cell A, which is mainly due to coolant release, creates an imbalance which initiatesnatural circulation flow from the cavity into cell A and from cell B into the cavity. Without thesubdivision of the main compartment, both vent junctions from the cavity would experienceidentical boundary conditions, which would inhibit any countercurrent flow. During thesimulation, the pressure difference between cells A and B remains negligible.
Figure 9 shows that, owing to the" modeling of natural circulation between the reactor cavityand the main compartment cells (base case simulation), mole fractions of generated gases maybe higher in one of the cells. Local concentrations of flammable and non-condensable gasesmay thus attain artificially high values. This may perhaps unrealistically influence themodeling of combustion and condensation processes. If gas generation in the cavity ceases,mole fractions evolve towards a common equilibrium value.
4. CONCLUSIONS
Containment phenomena during a LB LOCA with low-pressure vessel failure in a two-loopWestinghouse PWR were simulated with the CONTAIN code. The following conclusions canbe drawn:
- with the decay heat distribution prescribed in this work, short-term containmentpressurization is due to coolant release, whereas long term pressurization is determinedmostly by gas generation due to molten core - concrete interaction,
- condensation on heat structures does not have an appreciable effect on long-term coolantdistribution,
- most of the hydrogen generated by molten core - concrete interaction is entrained into thecontainment main compartment via natural circulation,
- modeling of convective mixing with the CONTAIN code may temporarily cause artificiallyhigh local concentrations of flammable and non-condensable gases.
5. REFERENCES
1. Krsko NPP Updated Safety Analysis Report (USAR), Westinghouse ProprietaryInformation, 1995.
2. Murata K.K., Carroll D.E., Washington K.E., Gelbard F., Valdez G.D., Williams D.C.,Bergeron K.D., User's Manual for CONTAIN 1.1: A Computer Code for Severe NuclearReactor Accident Containment Analysis, NUREG/CR-5026, SAND87-2309, Sandia NationalLaboratories, with additions, 1989.
3. Murata K.K., Stamps D.W., Development and Assessment of the CONTAIN Hybrid FlowSolver, SAND96-2792, Sandia National Laboratories, 1996.
4. Parzer, I., Possibilities for Animation of Severe Accident Phenomena by NPA, Proceedingsof the 4th Regional Meeting "Nuclear Energy in Central Europe", Bled, Slovenia, 1997.
290 Nuclear Energy in Central Europe '98

Environment
Annulus
A B
Main Compartment
Press.Comp.
South SGComp.
Break
ReactorCavity
North SGComp.
Figure 1. Containment Compartments and Flow Paths.
3.0 .
§2.00)
1.5
1.0
-
-
-
1 I
Peak[bar]o 373.052.77
i
i
• i * i
press.
Race caseNo condensation onNo condensation on
i . i
i
-
structuresaerosols
i
0.0 2.0X.104 4.0x10⁴ 6.0x10⁴ 8.0x10⁴ 1.0x10⁵
Time [s]
Figure 2. Pressure in Containment Main Compartment (Cell A)
Nuclear Energy in Central Europe '98 291
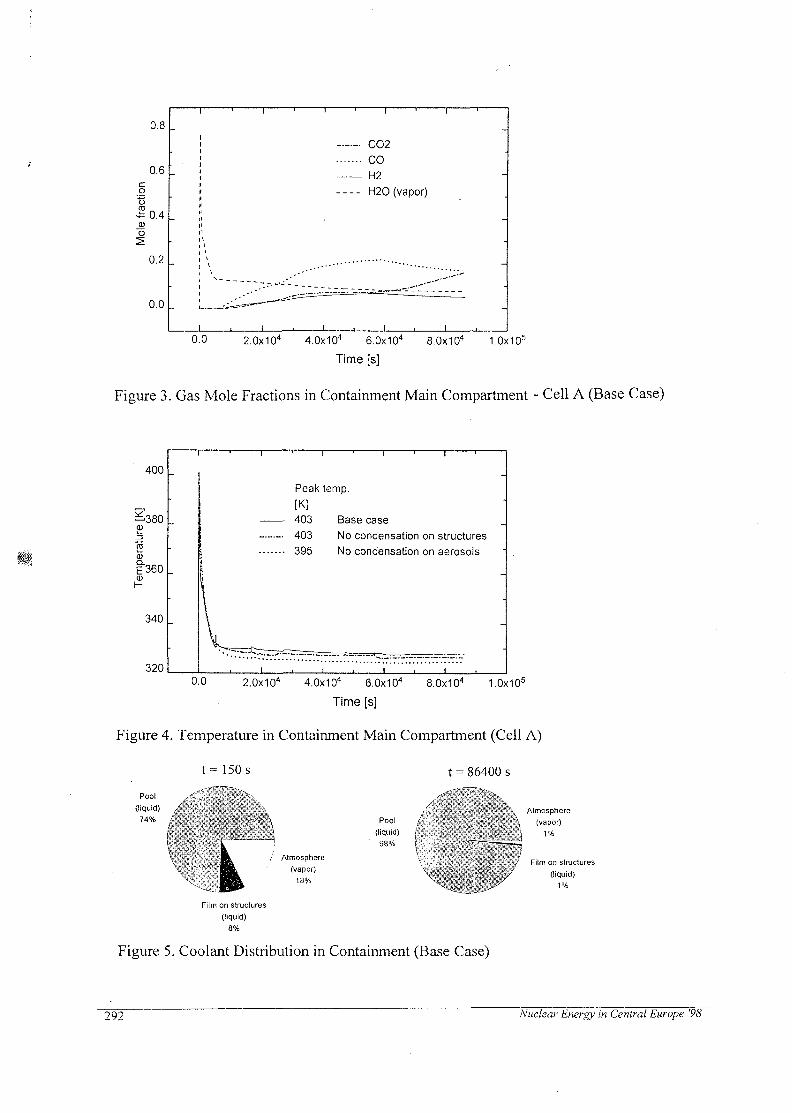
0.8
0.6ao
0.4JO)
o
0.2
0.0 .
CO2
CO
f_12
H2O (vapor)
0.0 2.0x10⁴ 4.0x10⁴ 6.0x10⁴ 8.0x10⁴ 1.0x10⁵
Time [s]
Figure 3. Gas Mole Fractions in Containment Main Compartment - Cell A (Base Case)
400
—380CO
era
£3600)
I—
340
320
1 1 '
-
-
-
Peak
[K]'103403
i 395
ii
\
i
1 ' 1 —•"
temp.
Base case
No condensation
No condensation
i '
on structures
on aerosols
-
-
0.0 2.0x10⁴ 4.0x10⁴ 6.0x10⁴ 8.0x10⁴ 1.0x10⁵
Time [s]
Figure 4. Temperature in Containment Main Compartment (Cell A)
t = 150 s t = 86400 sPool
(liquid)74%
" \i
Ik
Film on structures
(liquid)
Atmosphere(vapor)
18%
Pool(liquid)
98%
\ Atmosphere'* (vapor)I 1%
Film on structures/ (liquid)
1%
Figure 5. Coolant Distribution in Containment (Base Case)
292 Nuclear Energy in Central Europe '98

Pool(liquid)74%
t = 150 s
-- .-ilm on structures
(liquid)
0.5%
Atmosphere(vapor)
26%
Pool
(liquid)QQO/
yy /o
t = 86400 s
\
- -:„ -ji
, ' i
Atmosphere
(vapor)
1%
Film on structures
(liquid)
0.5%
Figure 6. Coolant Distribution in Containment (No Condensation on Heat Structures)
1.2x10⁵
1.0x10⁵
8.0x10⁴
c
g6.0x104
>
4.0x10⁴
2.0x10⁴ .
0.0
' r
Base caseNo condensation on structures
0.0 2.0x10⁴ 4.0x10⁴ 6.0x10" 8.0x10⁴ 1.0x10⁵
Time [s]
Figure 7. Total Aerosol Cumulative Deposited Mass
400 .
300
200
100
H2 generated by core-concrete int.H2 in main comp. (cells A and B)H2 in other compartments
0| u0.0 2.0x10⁴ 4.0x10⁴ 6.0x10⁴ B.0x104 1.0x10⁵
Time [s]
Figure 8. Hydrogen Distribution in Containment (Base Case)
Nuclear Energy in Central Europe '98 293

0.24
0.20
0.16
0.12
0.08
0.04
0.00 .
H2 cell AH2 cell BCO cell ACO cell B
0.0 2.0x10⁴ 4.0x10⁴ 6.0x10⁴ 8.0x10⁴ 1.0x10⁵
Time [s]
Figure 9. Mole Fractions of H2 and CO in Containment Main Compartment (Base Case)
294 Nuclear Energy in Central Europe '

SI0100122
Nuclear Energy in Central Europe "98
Terme Catez, September 7 to 10, 1998
Krsko NPP Containment Model using
MELCOR 1.8.3
Marjan Delic and Jure Marn
Faculty of Mechanical EngineeringSmetanova 172000 Maribor
Abstract
The severe accident including loss of coolant scenario using computer program MELCOR1.8.3 was modeled. There have been number of analysis using other integral computerpackages performed in the past including MAAP and STCP programs as well as mecha-nistic computer packages such as RELAP5.
MELCOR is state of the art program maintained by United States Nuclear RegulatoryCommission and is currently used at University of Maribor to assess some of the accidentsequences.
Advantages and shortcomings of the nodalization are discussed and future plans are pre-sented, accompanied by test run results applied to NPP Krsko geometry.
Introduction
At the University of Maribor the database describing Krsko Nuclear Power Plant wasdeveloped to be used with MELCOR 1.8.3 computer code. The database was developedusing mainly Updated Safety Analysis Report, and other available documentation col-lected both through Slovenian Nuclear Safety Administration and Krsko nuclear powerplant. This database optimization and further development is subject of this work.
The special attention was given to containment nodalization. Also, the database is cur-rently modified for loss of coolant accident scenario used as benchmark as it has beenstudied previously using MAAP integral code so several assumptions embedded thereinwere contemplated.
Nuclear Energy in Central Europe '98 • 295

Several thermodynamics parameters were followed: time for the core to uncover, time tocore starts to relocate, time to open accumulators valves, time to reactor vessel failure,time to containment failure and time to shield building failure.
For melting criteria, the temperature of Zircalloy cladding at different levels in core andthe temperature of the melted material in the cavity
Division into nodes
The model consists of mainly two types of elements: control volumes and flow paths. Theprimary side is modeled with 35 control volumes and 40 flow paths, the secondary side ismodeled with 18 control volumes and 20 flow paths and containment is modeled with 5control volumes and 9 flow paths. Together for all mesh the 35 heat structures were used.On the figure 1 the nodalization of primary side without steam generators is shown.
CV900
STEAM
GENERATOR
\FL901
ContainmentFL1H
STEAM
GENERATOR
Figure 1: The nodalization of primary side without steam generators
On the figure 2 the nodalization of steam generators is presented. Figure 3 shows thenodalizations of containment to which the special attention was given, where CV701presents upper compartment, CV702 lower compartment, CV703 volume around steamgenerators and pressurizer, CV704 cavity and CF705 annular compartment.
Among engineered safety features, only accumulators are modelled. Neither pressurizersprays nor low/high pressure injection are used during loss of off-site power sequence thusomitted in the current version.
The program solves the continuity equation in control volumes, and momentum equationin flow paths. For solving energy equation heat structures were used. The turbine is notmodelled, because it has no influence on solved scenario.
296 Nuclear Energy in Central Europe '98

CV901
FLS95t
FL375
CV304FL303 FLS04,
CV303 CV305
FL302 FL305,
CV302 CV306
JFL301 FL3(M_
CV301 CV307
\FL102 FL307\
FL355
CV355
JPL354CV354
JFL373
CV373
JFL363
CV363
JFL353
CV353
JFL352
CV352
JFL351
CV351
XPUMP
CV503
CV705
CV701
FL721
FL731
CV703 -FL70P
FL732
FL705
]-FL70,CV702
-FL712-CV704
FL722
Figure 2: Steam generator Figure 3: Containment
The core consists of three main segments: a reactor vessel wall, a lower plenum and alower head, and an active core. It is'modeled with seven radial nodes and fourteen axiallevels, the first two modeling the reactor vessel wall, the second two the lower head andthe lower plenum, and the remaining ten the active core. The active core nodes are linkedto the three control volumes and ten heat structures, in accordance with MELCOR re-quirements for dT/dz model.
Scenario
As stated previously, loss of off-site power was chosen as the benchmark, with rathersimple scenario consisting of the following assumptions:
Nuclear Energy in Central Europe '98 191

0-100 s . . . full power, normal operating conditions100 s . . . loss of off-site power100 s . . . reactor scram, all pumps start the coastdown
1900 5 . . . seal leak developed on one leg (FL157, d = 0.75 inch )
There are no other assumptions, the plant is left to simulation.
Results
There were roughly 60 thousand seconds simulated with the following summary of impor-tant events:
core uncovering 2 hr 34 mincore starts to relocate 3 hr 28 mindebris refreezes in lower third of active core 4 hr 04 minreactor vessel fails 11 hr 47 min
Containment and shield building did not fail in the simulated time.
Figure 4 shows the containment pressure, showing the vessel breach as the rapid changeof presure. Increasing of containment pressure before vessel fail is mainly consequece ofseal leak, and pressure growing in shield building is consequence of heat transfer.
700
650
600
550
500
"o" 4 5 0CL
~Z 4 0 °I 35°£ 300
250
200
150
t o o
5 0
WELCOR KRSKO SB03
-
-
-
- /- y• /
0 10 20SANDIA
NSS98 - REV 1.0MQDISPN 9/08/98 16:33:08
r i i i 1—
Jy/
3 0 4 0
TIKE (103s)
MELCOR HP
f
-
-
C-701C-702
— — C-705C-70*
— C-705
Figure 4: Pressure in containment and shield building
In the figure 5, pressure on primary and secondary side is presented. Both the effects ofsteam generator boil-off and accumulator discharge are shown. Acuumulators are openfirst time at 18432 s.
Figure 6 shows the discharge through the seal leak, where the mass flow is decreasing withdecreasing pressure in primary side . It is evident that when lower head became open,the mass flow rate through seal leak became zero.
298 Nuclear Energy in Central Europe '98

SANWA
NSS98 - REV 1.0
1H100LSPN 9 / 0 8 / 9 8 16:39:06 MELCOR W>
Figure 5: Pressure on primary and secondary side
2 7 . 5
25 . 0
2 2 . 5
20 . 0
~S; i 7 . s
2 1 5 . 0
I ' 2 - 5
s I O . O -o
7 . 5 -
5 . 0 -
2 . 5 -
0 . 0
SANOIA
fl.-MR0W.1S7
10 20 30 40
TIME (W3s)NSS98 - REV 1.0MO01SPN 9/08/98 16:39:08 WELCOfi HP
Figure 6: Seal leak discharge
Figures 7 shows containment volumes vapour temperature where is clearly evident increas-ing of temperature in annular compartment because of heat transfer from the containmentvolumes.
On the figure 8 the temperature of debris in the cavity is presented.
Figures 9, 10, and 11 show the temperatures of the cladding on the top, middle, andbottom of the core, respectively. An interesting phenomenon is shown. The core startsto slump in the center of the bundle in the upper third of the active core, however, theouter layers of the core are first melted in the middle third of the active core.
Nuclear Energy in Central Europe '98 299

3 . 00
2 . 7 5
2 . 5 0
o 2. 00
1.75
— 1 .
s
I o-0 .
0 .
25
00
75
50
252 0 3 0
NSS9S - REV 1.0IHBOLSPN 9 / 0 8 / 9 6 16:39:08 MELCOR HP
CV-701CV-702
— — CV-703CV-7O4
CV-705
Figure 7: Containment vapour temperatures
3
2
2
^ 2
1 2I '| 1
J ':= 1
" 0
0
0
n
. 0 0
. 75
. 50
. 2S
. 00
. 75
.50
. 2 5
. 00
. 75
. 5 0
. 25
n n
CAV-T.IMX.01i i .
h
T ! 1 i ~1 ' 1 ' ' '
-
•
-1 1 1 1 1 LJ 1 1 J -
0 10 20 30S A N 0 I A TIME (1NSS96 - REV 1.0M00LSPN 9 / 0 8 / 9 8 16:39:08 MELCOR B
Figure 8: Cavity temperature
2 . 7 5
2 . 5 0
2 . 2 5
2 . 0 0
S" 1.75o
e t . 25
II 1 . 0 0
0 . 7 5
0 . 5 0
0 . 2 5
0 . 0 0
SANOIA
MELCOR KRSKO SB03
• / i r• fh
.J jijiii
. i : , i i i i t
T(Zlrooloy cloiidlns 1W)
— — T(Ztrco!oy clodding AH)
T(ZIrcoloy cladding 71*)
-
-
. i i i I I i
10 20 30 40
TIME (10Js) '
50 60
NSS98 - REV 1.0IHISOZTPN 9 / 0 8 / 9 8 18:45:17 MELCOR HP
Figure 9: Zircalloy cladding temperature on the top of the core
300 Nuclear Energy in Central Europe '98

2. 75
2 . 5 0
2 . 2 5
2 . 0 0
1 . 75
1 .50
1 ,25
1 . 00
0 . 7 5
0. 50
0 . 2 5
0 . 0 0
SANDIA
T(Zlrcaloy ctaddinj 110)
— — T(Zlrcdoy doddlno 410)T(Zlrcdoy cloddlnj 710)
jnr
jj\
10 20
NSS98 - REV 1.0IHISDZTPN 9/08/98 18:45:17
30 40
TIME (10 5s)
MELCOR HP
50 60
Figure 10: Zircalloy cladding temperature on the middle of the core
2 . 7 5
2 . 5 0
2 . 2 5
2 . 0 0
? 1.75o
? 1-50
1 125Q.
I 1 . 0 0
0 . 75
0 . 50
0 . 2 5
0 , 00
^ j /
t i t r
/I
1//'I
!111
, 1: i
T(Zlrcoloy clodding 105)
— — T(Zlreoloy cladding 405)
T(Z!rcoloy clcddlng 705)
1 , , l 1 .
10 20 30 40
TIME (105s)
50 60
NSS98 - REV 1.0IHISDZTPN 9 / 0 8 / 9 8 18:45:17 MELCOR HP
Figure 11: Zircalloy cladding temperature on the bottom of the core
2 .
2 .
2 .
2 .
B 1 .
Jem
p
0 .
0 .
0 .
0 .
7 5
50
25
0 0
50
2 5
00
7 5
5 0
2 5
00
TtPoclle. debrlj 103)T(Porlic. d«brU 403)T(Porllc. debrU 705)
\k i
SANDIA'10 20 30 40
TIME (103s)
60
NSS98 - REV 1.0IHISOZTPN 9 / 0 8 / 9 8 18:45:17 WELCOR HP
Figure 12: Particulate debris temperature on the bottom of the vessel
Nuclear Energy in Central Europe '98 301

After the debris has been relocated to the support plate the melt refreezes, and reheats.Several hours later the lower vessel fails and the melt is ejected into the cavity. Figure12 shows the temperature of the particulate debris on the bottom of the lower head withnicely shown step function after the debris has actually been formed.
Conclusion
In the present paper the sucessful nodalization of the containment is presented.
For the evaluation of the problem MELCOR 1.8.3. computer code, which enables beyonddesign analysis of nuclear power plant, was used.
According to the results of the described work it is advisable that the guide lines of thefuture research should be more detailed description of the source term.
References:
[1] M. Delic, J. Marn: Modeliranje tezke nezgode s programom MELCOR 1.8.3,Kuhljevi dnevi 1996, Gozd Martuljek, str. 177-184
[2] J. Marn, M. Delic: Inicializacija, pretalitev in nodalizacijska studija modelaNE Krsko za uporabo v Programskem paketu MELCOR 1.8.3., porocilo, Mari-bor 1996.
[3] J. Marn, M. Delic: Modelling of Krsko NPP Using MELCOR, 3 r d Reg. Meet.Nuclear Energy in-Central Europe, Sept. 16-19, pp.229-236, Portoroz 1996.
[4] J. Marn, M. Delic: Optimization of Nodalization for Krsko NPP Using MEL-COR, Ard Reg. Meet. Nuclear Energy in Central Europe, Sept. 7-10, pp.29-36, Bled 1997.
[5] J. Marn, R.P. Prior: Determination methodology of LOCA break sizes clas-sifying small, medium, and Large Breaks International Conference on "New Trendsin Nuclear System Thermohydraulics", May 30 - June 2, pp. 593-600, Pisa 1994, Italy
[6] MELCOR Computer Code Manual
[7] Nuclear Power Plant Krsko Updated Safety Analysis Report - Revision 2,Nuclear Power Plant Krsko, 1995
302 Nuclear Energy in Central Europe '98
SI0100123Nuclear Energy in Central Europe '98
/ 1 S S Terme Catez, September 7 to 10, 1998
Improving Software Requirements Specification for Safety-Related SystemsUsing the Fault Tree Developed by an Object-Based Method
M. Cepin, B. Mavko
"Jozef Stefan" Institute, Reactor Engineering Division,Jamova 39, Ljubljana, Slovenia
marko. cepin@ijs. si, http://www2. ijs. si/~cepin/index. htmlborut. [email protected], http://www2. ijs. si/~r4ww\v/mavko. html
Abstract - A modification of the fault tree analysis is presented. The new fault tree integratesstructural and behavioural models of a system. Information on the system structure is capturedin the name of each gate and basic event of the fault tree. Information on the systembehaviour is captured in their description. Behaviour is expressed using the axiomaticnotation based on first order predicate logic. The new fault tree is a useful model for analysisand improvement of software requirements specification. The benefit of such improvement isreduced probability of failures in specification, which in turn results in increased reliability ofthe software.
1 Introduction
Software in computerised systems has been recognised as that element, which largelydefines the overall system reliability. Because the software executes exactly as it is written,the causes of its faults are hidden in the entire process of software life cycle. Investigation ofthe software life cycle identified the requirements specification, as one of its most importantphases when assuring high level of software reliability and safety. The traditional safetyanalysis techniques, which successfully evaluate and improve safety and reliability oftraditional safety-related systems, are not suitable for the analysis of software requirementsspecification. So, they have to be modified or new ones have to be developed.
In this paper a modification of the fault tree analysis is presented. The new fault treeintegrates structural and behavioural models of a system from the side of possible failurepropagation. Creation of structural and behavioural models of the system is defined by theobject-based method '. The structural model shows the static structure of the system. A classdiagram represents it, because system is composed of classes. Classes are groups of objectswith similar properties, common behaviour, and common relationships to other objects andcommon semantics. Behavioural model of the system represents the behaviour of all classesidentified in structural model. The behaviour of each class is modelled with an interactor. Theinteractor is a set of declarations and predicates written in a structured table using the formalaxiomatic notation.
Nuclear Energy in Central Europe '98 303

2 Review of Applications of the Fault Tree to Software Improvement
Fault tree analysis is an analytical top down technique, whereby an undesired state of thesystem is specified 2'3. Then the system is analysed in the context of its environment andoperation to find all the credible ways in which undesired event can occur. Undesired state ofthe system is defined as top event in the fault tree.
Fault trees have already been used for analysis of software. Leveson & Harvey 4 andLeveson, Cha & Shimeall 5 developed software fault trees which were used qualitatively inlater phases of software life cycle as a debugging technique intending to prove that thesoftware will never reach an unsafe state. Dugan extended the fault tree analysis to thesystem including N-version programming software on redundant hardware using both:qualitative and quantitative analysis of the fault tree combined with Markov models. Thesoftware deviation analysis by Leveson et al. 7 and by Reese includes fault trees for findingpotential hazards based on formal requirements specification.
To better address timing in originally static fault tree analysis, two main methods weredeveloped: Dynamic Flowgraph Methodology (DFM) 9 and Formal Fault Tree Analysis 1O'H.Garrett, Guarro & Apostolakis 9 in DFM included timing into the fault tree analysis byintegrating into sequence of static fault trees. Each static fault tree corresponded to a discretetime point. Within fault trees, the logic of the system was expressed in terms of causalrelationship between physical and software variables. Nevertheless, one may argue, as Yih,Fan & Shirazi 12 did, that not all of the program variables were taken into the consideration,this approach, which is under further development B , have shown promising practical results.
Cepin & Wardzinski and Gorski & Wardzinski extended the traditional fault treeanalysis with a formal model using the Vienna Development Method (VDM) 14. With thisapproach two important conclusions are identified 15. First, the timing requirements aresuccessfully incorporated into the formalised fault tree: top event occurs if basic events incertain minimal cut set occur and if they overlap in time. Second, the use of formal methodsremoves the ambiguities in the specification using the natural language and provides betterprecision in the system specification.
3 Modification of the Fault Tree
Modified fault tree as the original one consists primarily of logic gates including topevent and basic events. Instead of description of possible fault propagation in natural languagefor gates and basic events the formal axiomatic notation is used. It is the same notation as it isused for the specification of behavioural model within the object-based method '. Such faulttree identifies the causal relations and possible ways of failure propagation through the classesof the system. Information on the system structure is captured in the name of each gate andbasic event of the fault tree (e.g. class named "A.B" means that class "A" is assembly classfor its part class "B"; in other words class "B" is subclass of class "A"). Information on thesystem behaviour is captured in description of each gate or basic event. Behaviour isexpressed using the axiomatic notation based on first order predicate logic 16.
Development of a fault tree proceeds by following these steps:Identification of the top class according to the selected undesired state or event. If existsmore than one, more than one fault tree is to be developed.Identification of the top event (the most important logic gate of the fault tree). Top eventrepresents the undesired event. That is the undesired operation of the top class. The nameof the top class and the formal notation of the undesired event identify it.
304 Nuclear Energy in Central Europe '98

Development of the portion of the fault tree connected with the class under investigationaccording to the following steps:
- Investigation of the behaviour (its inputs and its behaviour) of the class underinvestigation. Formal axiomatic notation of the class behaviour bases on first orderpredicate logic. Basic events describing the class failure behaviour are connectedto the gates with the solid line. They are of primary importance in the fault tree.Examination of the data transformation between the class under investigation andother classes. Basic events describing possible failures in the assignmentstatements are connected to the gates with dotted line. They are of secondaryimportance in the fault tree, because the consistency check is not the primary goalof the fault tree. They are included in the fault tree to show the fault tree as capableto model the data transformation through the system. They are not considered infault tree analysis.
Investigation and determination of the logical causal connections between the classunder investigation and other classes which impact it. With the identification ofcausal connections to classes, which impact the class under investigation, they(one after another) become the class under investigation.
Repeat the examination in the last three steps for all the classes.
3.1 Fault tree analysis for improvement of functional requirements specification
Qualitative fault tree analysis identifies the minimal cut sets. Those are the smallestcombinations of basic events, which cause the occurrence of the top event in the fault tree.The minimal cut sets are then qualitatively ranked by number of basic events in each minimalcut set. The most important and the most critical are single minimal cut sets, which consists ofsingle basic event (as this is true for traditional systems, the ranking itself may not be veryeffective for software). Occurrence of such single basic event (representing a behavioural
()/li, failure of certain object) causes the top event to occur.
Logical notation of the top event represents the top event as a sum of minimal cut sets:
TE =
where:TE ... top eventMCSi ... minimal cut set in ... number of minimal cut sets
Notation of minimal cut set represents it as a product of included basic events (underassumption that the basic events are independent):
rm
where:Oj ... basic event jmi.. . number of basic events included in minimal cut set i
In the application domain, identified minimal cut sets are the basis for system designchanges to increase their reliability. E.g. to add redundant equipment to avoid the most criticalminimal cut sets.
Nuclear Energy in Central Europe '98 305

In the software domain, one may consider that avoiding the most important minimal cutsets may be accomplished by improving the functional requirements specification. Avoidanceof the minimal cut sets is necessary, if the interpretation of the results of fault tree analysisconcludes that they are of high importance or critical. By defining additional functionalrequirements specification the occurrence of identified critical minimal cut sets can beprevented. Logical notation for additional requirements is the following (using de Morgantheorems of Boolean logic there are two equal notations for RSFT):
RSFT = f[ -^MCSi = -• J MCSi
where:RSFT • • • additional requirements specification based on fault tree analysisMCSi • • • minimal cut set inc ... number of considered minimal cut sets (nc<n)n ... total number of minimal cut sets
The number of considered minimal cut sets might be equal or smaller than the totalnumber of minimal cut sets. This condition allows skipping some of minimal cut sets frommathematical expression to prevent too complex requirements specification. The reason forthis condition is in the nature of fault tree itself: the number of its minimal cut sets mayincrease significantly due to increase of number of basic events. Usually we are the mostinterested in the most important minimal cut sets numbered from 1 to nc, if they are ranked bytheir importance.
Example: in reactor protection systems in nuclear power plants the manual actuation isintended in parallel to the automatic actuation. If the same class is defining the transfer (orcertain mathematical operation) of the manual and automatic signal, its failure may fail both:automatic and manual actuation. Such class is identified by the fault tree analysis as (themost) important minimal cut set. One may be satisfied with such results (additionalverification confirms the correctness of the class behaviour), one may direct the changes inthe model, or one may require that such condition should not occur anywhere (additionalrequirement).
One should be aware that introduction of new requirements might: change the results ofthe fault tree analysis, cause the change in user specifications or at worse introduceinconsistency in the requirements. So, a new iteration of models and the fault tree is to beperformed in such case.
4 Fault Tree Analysis and Results
Figure 1 shows the fault tree of the simplified case study (Engineered Safety FeaturesActuation System in a nuclear power plant) described in ref. '. Class "ESFAS_SI_SMALL" isidentified as one which failure may fail the system. The top event represents the failure ofsystem output actuation (-i esfas_out) if the inputs to the system required its actuation.Abstraction of any of the inputs to the system, which requires system actuation, is presentedby fictitious variable: requirement_from_environment. The formal notation is the following:
-i esfas_out A requirement__from_environmentExamination of the class "ESFAS_SI_SMALL" shows, that its behaviour is defined by
its subclasses. It only couples its subclasses. Examination of data transformation identifiesbasic event determining possible failures in assignment statements. The basic event describingthe possible failures of assignment statements consist of five such statements: one representsclass output as system output, other four represent connections with class "CHANNEL". The
306 Nuclear Energy in Central Europe '98

investigation of causal relations shows only connection to class "TRAIN". At this point theclass "TRAIN" becomes the class under investigation.
-i esfas_out Arequirement_from_environment
ESFAS SI SMALL
m.Failure in assignment statements:Vie{l.. 4} •esfas_in(i)=channel(i). readingesfas out=trairi:actuation
ESFAS SI SMALL
Contribution of connectionswith other classes
ESFAS SI SMALL
o (man_vote v auto_vote) A-i actuation
ESFAS SI SMALL.TRAIN
Failure in assignment statements:auto_vote=automatic_actuation.voteman_vote=manual_actuation.manual_signal
ESFAS SI SMALL.TRAIN
TJ
Failure in behaviour:(man_vote v auto_vote) A-i actuation
ESFAS SI SMALL.TRAIN
TJ
Contribution of connectionswith other classes
ESFAS SI SMALL.TRAIN
(3 ije{1..4}»(i*j) A(ch_signal(i) A(ch_signal(j))))A -> vote
TRAIN.AUTOMATIC ACTUATION
manual_input_l A manual_input_2 A-I manual_signal
TRAIN.MANUAL ACTUATION
h\
Contribution of connectionswith other classes
TRAIN.AUTOMATIC ACTUATION
(reading > setpoint) A-i channel_signal
ESFAS SI SMALL .CHANNEL
Failure in behaviour:manual_input_I A manual_jnput_2 A-1 manual_signal
TRAIN.MANUAL ACTUATION
TJFailure in assignment statement:Yie{1..4}«train.automatic_actuation.ch_signal(i)==channel(i).channel signal
ESFAS SI SMALL .CHANNEL
TJFailure in behaviour:(3 ije{1..4W<*J) A (ch_signal(i)(ch_signal(j)))) A -. vote
TRAIN.AUTOMATIC ACTUATION
Failure in behaviour:(reading > setpoint) A-1 channe!_signal
ESFAS SI SMALL CHANNEL
TJ
O
Figure 1: Fault tree of the simplified case study
Investigation of formal notation of undesired event associated with class "TRAIN"specifies the logic gate. The logic gate represents the failure of class "TRAIN" output signal
Nuclear Energy in Central Europe '98 307

actuation (-1 actuation) if one of two: automatic actuation (auto_vote) or manual actuation(man_vote), is directed from its subclasses. Such failure of class "TRAIN" behaviour isspecified in the basic event describing the class failure behaviour. Examination of datatransformation between class "TRAIN" and other classes identifies basic event with possiblefailures in two assignment statements. Investigation of the causal connections with otherclasses identifies the causal connections to two classes: "AUTOMATIC_ACTUATION" and"MANUAL_ACTUATION". They are logically connected with AND gate (2 out of 2 gate).Both have to fail to provide their outputs for class "TRAIN" to fail. At this point, one of bothidentified classes becomes the class under the investigation.
Let it be "MANUAL_ACTUATION" the first one and "AUTOMATIC_ACTUATION"the second one.
Investigation of formal notation of undesired event associated with class"MANUAL_ACTUATION" specifies the logic gate. The logic gate represents the failure ofclass "MANUAL_ACTUATION" output operator signal (-1 manual_signal) if both manualoperator controls (manual_input_l A manual_input_2) are directed from the operator.Operator inputs are treated as the inputs from environment. Operator represents theenvironment and is not included in the model. Failure of class behaviour is specified in basicevent specifying the class failure behaviour:
manual_input_l A manual_input_2 A -1 manual_signalClass "MANUAL_ACTUATION" is not impacted from any other class. So with the
basic event on its failure behaviour this part of the fault tree ends.Investigation of formal notation of undesired event associated with class
"AUTOMATIC_ACTUATION" specifies the logic gate. The logic gate represents the failureof class "AUTOMATIC_ACTUATION" output actuation signal (-, vote) if at least two of theinput signals (3 i,je{1..4}- (i*j) A (ch_signal(i ) A (ch_signal(j)))) are directed from instancesof class "CHANNEL". Failure behaviour of class "AUTOMATIC_ACTUATION" isspecified in basic event specifying the class failure behaviour:
3 ij G {1 ..4}• (i^j) A (ch_signal(i) A (ch_signal(j))) A -, voteExamination of data transformation between class "AUTOMATIC_ACTUATION" and
other classes identifies basic event with possible failure in four assignment statements.Outputs from instances of class "CHANNEL" are inputs to class"AUTOMATIC_ACTUATION". Investigation of the causal connections with other classesidentifies the causal connections to class "CHANNEL".
Investigation of formal notation of undesired event associated with class "CHANNEL"specifies the logic gate. The logic gate represents failure of class "CHANNEL" output signal(—1 channel_signal) if the input signal (reading) exceeds the setpoint value "setpoint". Failureof class behaviour is specified in basic event specifying the class failure behaviour:
reading > setpoint A -1 channel_signalAny other class does not causally connect class "CHANNEL". So with the basic event
about its failure behaviour this part of the fault tree ends. Class "CHANNEL" is the lastexamined class. With investigation of class "CHANNEL" the fault tree is developed.
Three minimal cut sets were identified by the fault tree analysis of the simplified casestudy. One minimal cut set is single and consists on one basic event. Two minimal cut sets aredouble and consist of two basic events. The list of minimal cut sets is the following:
1. TRAIN: failure in behaviour: (manjvote v auto_vote) A -1 actuation2. MANUAL_ACTUATION: failure in behaviour: manual_input_l A manual_input_2 A
-1 manual_signal
308 Nuclear Energy in Central Europe '98

AUTOMATIC _ACTUATION: failure in behaviour: (3 i,je{1..4}- (i*j) A (ch_signal(i ) A(ch_signal(j)))) A -I vote
3. MANUAL_ACTUATION: failure in behaviour: manual_input_l A manual_input_2 A-i manual_signalCHANNEL: failure in behaviour: (reading > setpoint) A -I channel_signalThe most important class identified from results is "TRAIN", whose single failure causes
the top event. Identification of such class directs its further examination. Earlier iterations ofthe simplified case study, the qualitative results identified the class "TRAIN" as the mostimportant. Its further examination revealed inconsistency in the models and directed thechange in the behavioural model. Behaviour of the logic two out of four modelled in the class"AUTOMATIC_ACTUATION" was repeated in class "TRAIN".
Obtained results are reported to the system level (system is integrating at least software,hardware and man-machine interface), where they are taken into account when dealing withthe requirements at the system level (single failure criterion, common cause failures).
5 Conclusions
In practise the design of safety-related software systems requires elaboration andcertification of sets of methods and tools for their development. Modified fault tree its figureintegrates both: information on structural and information on behavioural aspect of the systemfrom its negative side, describing possible faults.
Fault tree construction contributes to the following:Process of the fault tree development represents the guideline for verification of thestructural and behavioural models themselves against the criteria (e.g completeness,consistency, precision). This provides additional assurance that the software specificationsagree with the desired concept.
Identification of combinations of failures (minimal cut sets), which could lead to asoftware failure. Their elimination is accomplished either by changing the system modelsor by adding new requirements. Those requirements are based on negation of qualitativefault tree analysis results i.e. minimal cut sets.
In general, the difficulty of fault tree is that it is not oriented to identify all possiblefailures of the system portions and their connections, but is limited only to those, which mayjeopardise the system failure as specified at the top event. With the appropriate definition ofthe top event this difficulty may be minimised.
Such fault tree reduces the probability of failures in the process of analysing therequirements specification for safety-related software system. Failures in requirementsspecification are highly undesired, because they easily propagate through other phases in thesoftware life cycle and may result in faulty software. Reducing the probability of failures inrequirements specification phase increases the reliability of the software, however it does notconfirm this in a quantitative manner.
To compare the developed method with other closely related methods is a difficult issue.Namely, one has not to repeat the problem of software reliability identified by Littlewood inchapter 4 of ref. 17 edited by Lyu: relatively poor take-up of software reliability modellingtechniques has been a result of certain models being sold as universal panaceas. So whencomparing the methods for improvement of requirements specification one has not only tocompare the methods but has also to take into account the systems to which they aredeveloped for.
Nuclear Energy in Central Europe '98 309

We compared the developed object-based method with statecharts and with blockdiagrams. Detailed results of the comparison are documented in ref. 18. The comparisonconcludes that for specific purpose of developing actuation systems in a nuclear power plantthe proposed method could suit the best. Its main attribute, which prevailed, is the clearness ofthe method for all involved: software users to order and obtain, software developers todevelop, safety analysts to evaluate and assess and regulators to examine and approve theresulted models.
6 References
1 M. Cepin, B. Mavko, Fault Tree Developed by an Object-Based Method Improves RequirementsSpecification for Safety-Related Systems, Reliability Engineering and System Safety, accepted forpublication, 1998
2 N. H. Roberts, W. E. Vesely, D. F. Haasl, F. F. Goldberg, Fault Tree Handbook, NUREG-0492, US NRC,Washington, 1981
3 M. Cepin, B. Mavko, Probabilistic Safety Assessment Improves Surveillance Requirements in TechnicalSpecifications, Reliability Engineering and System Safety, 1997, Vol. 56, pp. 69-77
4 N. G. Leveson, P. R. Harvey, Analyzing Software Safety, IEEE Transactions on Software Engineering,Vol. SE-9, No. 5, September 1983
5 N. G. Leveson, S. C. Cha. T. J. Shimeall, Safety Verification of ADA Programs Using Software Fault Trees,IEEE Transactions Software Engineering, July 1991, pp. 48-59
6 J. B. Dugan, M. R. Lyu, System Reliability Analysis of an N-Version Programming Application, IEEETransactions on Reliability, 1994, Vol. 43, No. 4, pp. 513-519
7 N. G. Leveson, M. P. E. Heimdahl, H. Hildreth, J. D. Reese, Requirements Specification for ProcessControl Systems, IEEE Transactions on Software Engineering, September 1994, SE-20 (9)
8 J. D. Reese, Software Deviation Analysis, Ph.D. Dissertation, University of California, Irvine, 19969 J. Garrett, S. B. Guarro, G. E. Apostolakis, The Dynamic Flowgraph Methodology for Assessing the
Dependability of Embedded Software Systems, IEEE Transactions on Systems, Man and Cybernetics, May1995, Vol. 25, No. 5, pp. 824-840
10 M. Cepin, A. Wardzinski, On Integration of Probabilistic and Deterministic Safety Analysis, 3rd RegionalMeeting: Nuclear Energy in Central Europe, Portoroz, September 16-19, 1996, Proceedings, pp. 188-196J. Gorski, A. Wardzinski, Timing Aspects of Fault Tree Analysis of Safety Critical Systems, Proceedings of
fl the Safety Critical Systems Symposium, Brighton, UK, February 1997, pp. 231-24412 S. Yih, C. Fan, B. Shirazi, Anatomy of Safety-Critical Computing Problems, Reliability Engineering and
System Safety, 1995, Vol. 50, pp. 69-78b M. Yau, S. Guarro, Quantifying Software Reliability with the Dynamic Flow-Graph Methodology,
Transactions of ANS, 1997, Vol. 77, pp. 261-26214 C. B. Jones, Systematic Software Development Using VDM, Prentice Hall, 199015 A. Wardzinski, M. Cepin, Fault Tree Analysis (in Polish), Informatyka, 1997, No. 6, pp. 28-3216 M. Cepin, R. de Lemos, B. Mavko, S. Riddle, A. Saeed, An Object-Based Approach to Modelling and
Analysis of Failure Properties, SAFECOMP'97, York, UK, September 1997, Proceedings, pp. 281-29417 M. R. Lyu, editor, (et al), Handbook of Software Reliability Engineering, IEEE Computer Society Press,
McGraw-Hill, 19961 S. Riddle, M. Cepin, Object Modelling and Safety Analysis of Engineered Safety Features Actuation
System, TR-ISAT-96/11, December 1996
> 10 Nuclear Energy in Central Europe '98

Nuclear Energy in Central Europe '98
Terme Catez, September 7 to 10, 1998
SI0100124
ESE a 2D Compressible Multiphase Flow CodeDeveloped for MFCI Analysis - Code Description
Matjaz Leskovar"Jozef Stefan " Institute
Jamova 39, 1000 Ljubljana, SloveniaE-mail: matjaz. [email protected], http://www2. ijs.si/~mleskovar/
ABSTRACT - The ESE (Evaluation of Steam Explosions) computer code has been developed to model theinteraction of molten core debris with water during the first premixing stage of a steam explosion. A steamexplosion is a physical event, which may occur during a severe reactor accident following core meltdown whenthe molten fuel comes into contact with the coolant water.
In this paper the numerical treatment of probabilistic multiphase flow equations on which ESE is based isdescribed. ESE is a general two-dimensional compressible multiphase flow computer code. Each phase in themultiphase flow - usually water, steam, melt and air - is represented by one flow field with its own localconcentration and temperature and is described with its own set of partial differential mass, momentum andenergy equations. These transport equations are solved on a staggered grid in a 2D rectangular or cylindricalcoordinate system using a high-resolution finite difference method. The pressure equation is solved using thestabilized squared conjugate gradient method (CGSTAB), which converges fast also for high density ratios.
The numerical methods used in ESE were precisely tested on a number of carefully chosen cases where theanalytical solutions are known. All results are presented in form of graphs and they clearly show that the appliedhigh-resolution method most exactly reproduces the analytical behavior.
Nomenclature
CP
E
Fr0
ih
AhI
MMa
PPe0
Re0
tAtV
Av
specific heatheat transfer
Froude number vo/^[golo
gravityenthalpyinterphase enthalpy differencelength
frictionMach number v0 /(cv0) = \/c
pressurePeclet number voIocpOpo/A.o
Reynolds number vo/opo///o
timetime stepvelocityinterphase velocity difference
V volume
x, r, z spatial coordinates
Greeka
PXX
M
rp
Lettersphase presence probabilitythermal dilatationcompressibilitythermal conductivity
dynamic viscosityvapor generationdensity
Subscripts / Superscripts0hi
n
P
characteristic valueconstant enthalpymesh pointtime stepphase or pressure
Nuclear Energy in Central Europe '98

1. Introduction
The paper describes the numerical treatment of the probabilistic multiphase flow equations onwhich the computer code ESE (Evaluation of Steam Explosions) is based. ESE has beendeveloped to model the interaction of molten core debris with water during the first premixingstage of a steam explosion [1]. A steam explosion is a physical event, which may occur duringa severe reactor accident following core meltdown when the molten fuel comes into contactwith the coolant water.
Many other premixing codes exist in the literature, e.g. CHYMES [2], IFCI [3], PM-ALPHA [4], MC3D [5], IVA3 [6] and COMETA [7]. The common feature of these codes isthat they are based on first order accurate numerical methods, whereas ESE uses the secondorder accurate high-resolution method. High-resolution methods combine first and secondorder accurate numerical schemes in such a way that the weaknesses of both schemes, thepoor numerical accuracy and large amount of numerical dissipation of first order accuratenumerical schemes and the oscillations of second order accurate numerical schemes occurringin the vicinity of non-smooth solutions, are suppressed and the method still remains secondorder accurate [8].
2. Numerical Treatment of Multiphase Flow Equations
Each phase in the multiphase flow
at
momentumav | ^ w^_
y dt rx 'and energy equations
dhP dt f
is described using
ap) + V • (apv) = I
1 1F ro F ro
Perc0
the probabilistic mass
r i A - T i
Re0 a
AkTa
(1)
(2)
(3)
obtained by ensemble averaging [9]. The mass equation (1) is solved in conservative form toachieve mass conservation, whereas the momentum (2) and energy equations (3) are solved innonconservative form since the numerical solution of the conservative form of the momentumand energy equations did not give the correct results at non-smooth distributions of the phasepresence probability a occurring at phase interfaces.
The discretised multiphase flow equations (1-3) are solved in 2D cartesian orcylindrical coordinate system on a staggered grid using a high-resolution finite differencemethod. High-resolution methods assure second order accuracy and give well resolved,nonoscillatory discontinuities. The applied high-resolution method is based on the first ordertime and space accurate upwind scheme and the second order time and space accurate Lax-Wendroff scheme. The total variation diminishing (TVD) condition for the convective termswas satisfied by choosing the smooth van Leer flux-limiter function.
To allow also the treatment of shock waves, the discretisation of the convective termin the nonconservative momentum equation (2) had to be carried out in a special way
[(v • V)v],. = max(v,_,, v,., v;+1) (4)
since otherwise the shock would not propagate if the velocity in front of the shock would bezero. For better clarity the discretisation was presented only for positive velocities and in onlyone dimension.
Nuclear Energy in Central Europe '98

The pressure equation for the assumed common pressure field p was derived from thesum of the conservative form of the compressible flow continuity equation (1) over all phasesusing the projection method
V 1 (p" -p"+])Ma
Pn+l/2 n+1/2
PP
Ma'
F1 l
(5)
where
« + l =
(6)
and
Despite the similarity in appearance to the pressure equation for incompressible flows,there are important differences. The incompressible pressure equation is a Poisson equation,i.e. the coefficients in the discretised form represent an approximation to the Laplacianoperator. In the compressible case, there are contributions that represent the fact that theequation for the pressure in a compressible flow contains beside diffusive terms alsoconvective and unsteady terms. At low Mach numbers, the Laplacian term dominates and werecover the Poisson equation. On the other hand, at high Mach numbers, the convective termdominates, reflecting the hyperbolic nature of the flow. Thus this compressible flow pressureequation (5) automatically adjusts to the local nature of the flow and therefore can be appliedto all types of flow including also the treatment of temperature expansion.
The pressure equation is solved using the stabilized squared conjugate gradientmethod (CGSTAB) [10], which was chosen since it converges fast also for high densityratios. The convergence rate of the CGSTAB method was tested for different density ratios ofa two phase flow (rise of a big bubble) and was compared with other proposed pressureequation solvers - the Alternate Direction Implicit solver (ADI) and the Stones StronglyImplicit Procedure (SIP). As seen on Fig.l, it was found out that the used CGSTAB methodhas the fastest convergence rate, which is nearly independent on the density ratio, whereas theADI and SIP methods become useless if the density ratio is greater than about 1000.
c
1
;rof
E
100000
10000
1000
100
10
|—•—ADI •, ' . . » . . S l P |._ __! - , » - - CGSTAB j
^ * ^ = /
10 100
Density ratio
- -*- *
1000 10000 10 100 1000 10000 |
Density ratio
Figure 1: Convergence rate of pressure equation solvers for different density ratios.
Nuclear Energy in Central Europe '98

3. Results of Basic Test Calculations
The numerical methods used in ESE were precisely tested on a number of carefully chosenproblematic basic cases where the analytical solutions are known. These test-cases includephase presence probability shock propagation and velocity shock propagation in cylindricalcoordinate system in different directions regarding to the coordinate axes, jet free fall in avacuum in the absence of any pressure forces, phase generation, compression and expansionunder temperature and pressure changes, etc. For each calculation the conservation of massand momentum was checked and a convergence analysis was performed. The results werecompared with the known analytical solutions and the calculations, which were performedusing the first order accurate upwind method and the second order accurate Lax-Wendroffmethod. All test calculations clearly show that the used high-resolution method most exactlyreproduces the analytical behavior. In the following we will present some of these results inform of graphs.
3.1 Phase presence probability shock propagation
A phase presence probability shock in the form of a box with phase presence probabilitya = 1 for ( r e [0.1,0.3]) A (Z e [0.1,0.3]) and a - 0 otherwise has been moved with constantvelocity v = 1 (movement of a big bubble) parallel (Fig.2, Fig.3) and diagonal (Fig.4) to the zand r axis on a mesh 160x160 grid points. The Courant number was 0.5. The convergenceanalysis, which was performed on meshes 20x20, 40x40, 80x80 and 160x160 grid points,showed that the results obtained with the high-resolution method are approaching to theanalytical solution. As expected the upwind method had the highest numerical diffusion andthe Lax-Wendroff method produced spurious oscillations and gave unphysical results sincethe phase presence probability was also negative. The mass has been conserved perfectly byall three numerical methods.
S 0.65£ 0.4
| 0.2
j — UW ]! anal i
1 nV N0.4 0.6 0.8
Distance
Figure 2: Phase presence probability shock convection in z direction calculated withthe upwind, Lax-Wendroff and high-resolution method for different times.
Figure 3: Phase presence probability shock convection in r direction calculated with theupwind, Lax-Wendroff and high-resolution method for different times.
314 Nuclear Energy in Central Europe '98

Figure 4: Phase presence probability shock convection diagonal to the r and z axiscalculated with the upwind, Lax-Wendroff and high-resolution method.
3.2 Velocity shock propagation
The propagation of a ID velocity shock in the form of a step has been studied. This situationappears in multiphase flow when for example a molten fuel jet of low phase presenceprobability moves through resting air. Since the jet velocity is defined only in the jet it isassumed that the jet velocity is equal to the air velocity v jel = vajr « 0 in the region where the
jet phase presence probability is zero: a = 0. The convergence analysis, which wasperformed on meshes 20, 40, 80 and 160 grid points, showed that the results obtained do notapproach to the analytical solution. The velocity shock did not propagate with the jet speed(Fig.5) despite the improvement (4) and therefore the jet phase presence probability achievedvery high unphysical values at the front (Fig.6) also for the high-resolution method. None ofthe numerical methods conserved the jet momentum either (Fig.7).
' 1 ' '1
1
1
I
iI
1 j
1 1
I I
1 : _ . — -anal j
1 1
0.4 0.6
Distance
1 . 4 •
1.2
1
0,8 •
nfi
0.4
0.2 •
i iiI
- /Ii 11
1
l ii 1 it
! !n—"iax |
0.4 0.6
Distance
I
t I
1
1
1
1
I
1
~l
1
i
| anal|
1
0.4 0.6
Distance
Figure 5: ID velocity shock propagation calculated with the upwind, Lax-Wendroff and high-resolution method for different times. Courant number = 0.5. Mesh: 160 grid points.
Figure 6: Jet phase presence probability calculated with the upwind, Lax-Wendroff and high-resolution method for different times. Courant number = 0.5. Mesh: 160 grid points.
Since these results are not satisfactory the numerical model was significantly improved with asimple but physically correct prescription that the velocity at the mesh point next to the frontwhere the phase presence probability is zero and therefore the velocity is not defined is equalto the front velocity. With this improvement the convergence analysis showed that thevelocity and phase presence probability correctly approach to the analytical solution (Fig.8)and that the mass and momentum are conserved well.
Nuclear Energy in Central Europe '98 315

1E 0,8 •
• 0,6EI 0,4
0.2
C
.
0,2 0.4
Time
y
,__ !j - anal \
0,6 0,8
0.80.7
E 0.6
1 0.5
£ 0.30.20 . 1 •
0.2 0.4
Time
\ anal;
0.6 0.8
Figure 7: Jet momentum at calculations with the upwind, Lax-Wendroff and high-resolution method. Courant number = 0.5. Mesh: 160 grid points.
\
',' ' ' Ij a n a i •
KV V V1 1 1IV iV IV
0.4 j
0.4 0.6
Distance
Figure 8: Jet phase presence probability calculated with the improved model fordifferent times. Courant number = 0.5. Mesh: 160 grid points.
3.3 Jet free fall
To check the numerical model on a problem with an ununiform velocity field occurringtogether with a shock in the jet phase presence probability field and the velocity field, the jetfree fall (particles falling in a vacuum in the absence of any pressure forces) has beensimulated. The jet phase presence probability and the jet velocity at the inlet boundary werea = 1 and v = 1. The convergence analysis, which was performed on meshes 20, 40, 80 and160 grid points, showed that the results obtained using the upwind and high-resolutionmethod approach to the analytical solution (Fig.9), whereas the Lax-Wendroff methodproduced highly oscillating and divergent results.
&3 i[0.8
\ 0.6
I 0.4Q.
3 0.2;
*• o
\ \ 1\;
\ \
;—-^71[— - - -anal j
\
0.4 0.6 0.8 1
Distance
Figure 9: Jet free fall phase presence probability for different times. Courant number = 0.5Mesh: 160 grid points.
3.4 Phase generation
The correct numerical treatment of the vapor generation term F appearing in the mass (1) andpressure (5) equations was established on the following combined artificial test case. An openvessel was filled with two liquids - liquid A occupied the lower part of the vessel and theother liquid B with equal density occupied the upper part. In the middle of the lower part ofthe vessel liquid A was generated with the generation rate F^ = VresselpA /Isec. The
316 Nuclear Energy in Central Europe '98

calculation was performed on mesh sizes 10x15, 20x30, 40x60 and 80x120 grid points in thecylindrical coordinate system. The results of the convergence analysis showed that the upwindand high-resolution methods correctly predicted the phase volume, whereas the Lax-Wendroffmethod underestimated the phase generation since the phase interface did not move with theright velocity.
0.90.80.7 _O.S0.50.40.3 ~0.20.1
0 —
_ _ _ _ _ - — — —
hrj anal I
" — — — —~ ^ - _ _ _
—-—-
Figure 10: Phase volume of liquid A and B during phase generation of A. Mesh: 10x15 grid points.
3.5 Pressure compression and temperature expansion
The ability of ESE to correctly consider the compressibility {dp/dp)h and the temperature
dependency of density p"+]n = p[h"+l ,p") was also proved. An open vessel was again filled
with two liquids - this time a compressible liquid A with^f = lbar"' and temperature
dilatation J3 — 0.005 K"1 occupied the lower part of the vessel and an incompressible liquid B
with % ~ 0 bar"' and /?=0K~' occupied the upper part. The following artificial test cases
were simulated:the pressure was risen with a speed dp/dt = lbar/s (Fig.l 1) at constant temperature,the temperature was risen with a speed dT/dt = 100 K/s (Fig. 12) at constant pressure,the vessel was closed and the temperature was risen with a speed dT/dt = 100 K/s(Fig.13).
Figure 11: Phase volume of liquid A and B during the pressure rise Mesh: 10x15 grid points.
Figure 12: Phase volume of phase A and B during the temperature rise. Mesh: 10x15 grid points.
Nuclear Energy in Central Europe '98 317

12
£ 1-8
3
w 1.6
°- 1.4
1.2
1C
1E-2!
0.2 0.4 0.6
Time
0.8 1
The convergence analysis which was performedon meshes 10x15, 20x30, 40x60 and 80x120 gridpoints showed that the results of all threemethods approach to the analytical solution. Thebest results, however, were obtained with thehigh-resolution method.
The results of the third -test case, thetemperature rise in the closed vessel, areidentical for all three methods, since there is noconvection. Here the time step of the calculation
was altered (At = 1E-1, 1E-2, 1E-3) and it was shown that the pressure rise is correctlypredicted if the time step is small enough (Fig. 13).
4. Conclusions
Figure 13: Vessel pressure during the temperaturerise. Mesh: 10x15 grid points.
The numerical treatment of the probabilistic multiphase flow equations on which ESE is basedhas been described. ESE (Evaluation of Steam Explosions) is a general two-dimensionalcompressible multiphase flow code, which has been developed to model the interaction ofmolten core debris with water during the first premixing stage of a steam explosion.
The mass, momentum and energy equations are solved on a staggered grid in a 2Drectangular or cylindrical coordinate system using a second order accurate high-resolution finitedifference method. The pressure equation is solved using the CGSTAB method, whichconverges fast also for high density ratios.
The numerical methods used in ESE were precisely tested on a number of carefullychosen basic cases where the analytical solutions are known. All test calculations clearly showthat the applied high-resolution method most exactly reproduces the analytical behavior.
5. References
[1] J. Marn and M. Leskovar: Simulation of Steam Explosion Premixing Phase Using ProbabilisticMultiphase Flow Equations. Fluid Mechanics Research. Scripta Technica, inc., 1996. ISSN 1064-2285/93/0001-0044, 22 (1), pp. 44-55.
[2] D.F. Fletcher and M.K. Denham: Validation of the CHYMES Mixing Model. Nuclear Engineering andDesign 155, 1995, pp. 85-96.
[3]- F.J. Davies, M.F. Young: Integrated Fuel-Coolant Interaction (IFCI 6.0) Code: User's Manual. SandiaNational Laboratories report SAND94-0406, NUREG/CR/-6211 (1994).
[4] W.H. Amarasooriya, T.G. Theofanous: Premixing of Steam Explosions: A Three-Fluid Model. Nucl. Eng.&Design, 126,23-39,(1991).
[5] G. Berthoud, M. Valette: Calculations of the Premixing Phase of an FCI with the TRIO MC Code. Proc.CSNI Specialist Meeting on Fuel Coolant Interactions, Santa Barbara, January 5-8, 1993, NUREG/CP-0127,27-36(1993).
[6] H. Jacobs, M. Lummer, L. Meyer, B. Stehle, K. Thurnay, L. Vaeth: Multifield Simulations of PremixingExperiments. Proc. CSNI Specialist Meeting on Fuel Coolant Interactions, Santa Barbara, January 5-8,1993, NUREG/CP-0127, 204-217 (1993).
[7] A. Annunziato, C. Addabbo: COMETA (Core Melt Thermal-Hydraulic Analysis) a Computer Code forMelt Quenching Analysis. Proceedings of the International Conference on New Trends in Nuclear SystemThermohydraulics, Pisa, June 1994 (1994).
[8] R.J. LeVeque: Numerical Methods for Conservation Laws. Lectures in Mathematics ETH Zurich,Birkhauser Verlag, Basel, 1992, ISBN 3-7643-2723-5.
[9] J. Marn and M. Leskovar: Probabilistic Multiphase Flow Equations: Simulation of Three PhaseMixture. ASME FED Summer Meeting, Proceedings (1996), FED-Vol.236, Vol.1, pp. 161-165.
[10] J.H. Ferziger, M. Peric: Computational Methods for Fluid Dynamics. Springer-Verlag Berlin Heidelberg1996.
Nuclear Energy in Central Europe '98

SI0100125Nuclear Energy in Central Europe '98
, / I S S Terme Catez, September 7 to 10, 1998
ESE a 2D Compressible Multiphase Flow CodeDeveloped for MFCI Analysis - Code Validation
Matjaz Leskovar, Borut Mavko"Jozef Stefan " Institute
Jamova 39, 1000 Ljubljana, SloveniaE-mail: matjaz. leskovar@ijs. si, http://www2. ijs. si/~mleskovar/
ABSTRACT - ESE (Evaluation of Steam Explosions) is a general second order accurate two-dimensionalcompressible multiphase flow computer code. It has been developed to model the interaction of molten coredebris with water during the first premixing stage of a steam explosion. A steam explosion is a physical event,which may occur during a severe reactor accident following core meltdown when the molten fuel comes intocontact with the coolant water. Since the interfacial exchanges of mass, momentum and energy are regimedependent, different exchange laws have been incorporated in ESE for the major flow regimes.
With ESE a number of premixing experiments performed at the Oxford University and at the QUEOSfacility at Forschungszentrum Karlsruhe has been simulated. In these premixing experiments different jets ofspheres were injected in a water pool. The ESE validation plan was carefully chosen, starting from very simple,well-defined problems, and gradually working up to more complicated ones.
The results of ESE simulations, which were compared to experimental data and also to first orderaccurate calculations, are presented in form of graphs. Most of the ESE results agree qualitatively asquantitatively reasonably well with experimental data and they are in general better than the results obtainedwith the first order accurate calculation.
Nomenclature
CDfFhnPr
QReTvWe
specific heat at constant pressuredrag coefficientlength scale (diameter)function
interfacial forceheat transfer coefficientnumber of drops per unit volumePrandtl number
enthalpy of evaporation
interfacial heat transferReynolds numbertemperaturevelocity
critical Weber number for bubble/dropbreakup
Greek Lettersa phase presence probability
s emissivity
<f> area concentration factory surface tensionA thermal conductivity
/u dynamic viscosity'•9- phase presence probability
fractionp densitya Stefan-Boltzmann coefficient
Subscripts / Superscriptsc,d continuous, dispersed/ , w, v fuel, water, vapor phaselam,turb laminar, turbulent
r,c radiation, convections saturationvm,l virtual mass, lift force
Nuclear Energy in Central Europe '98 319

1. Introduction
The ESE (Evaluation of Steam Explosions) computer code has been developed to model theinteraction of molten core debris with water during the first premixing stage of a steamexplosion [1]. A steam explosion is a physical event, which may occur during a severe reactoraccident following core meltdown when the molten fuel comes into contact with the coolantwater.
ESE is a general second order accurate two-dimensional compressible multiphase flowcomputer code. It takes into account the violent steam generation when melt pours into water,the thermal-hydraulic interaction between the melt, water, steam and air phases, and theresulting fragmentation and cooling of the melt. Since the interfacial exchanges of mass,momentum and energy are regime dependent, different exchange laws, which were takenmainly from the PM-ALPHA computer code [2], have been incorporated in ESE for the majorflow regimes. The flow regimes considered in characterizing interface transfers are bubblyflow, churn-turbulent flow, droplet flow and flow through a porous bed of fuel particles.These flow regimes are identified by simple phase probability criteria. In the calculation ofinterfacial momentum coupling and interfacial heat transfer special phenomena like the addedmass effect, lift forces and radiation are also considered.
With ESE a number of premixing experiments performed at the Oxford University [3]and at the QUEOS facility [4] at Forschungszentrum Karlsruhe has been simulated. In thesepremixing experiments different jets of spheres were injected in a water pool. The sphereproperties like density, size, temperature, impact velocity and also the number of spheres weresystematically changed between these experiments. The ESE validation plan was carefullychosen, starting from very simple, well-defined problems, and gradually working up to morecomplicated ones. The hydrodynamic part of ESE could be tested separately using resultsfrom the Gilbertson experiments performed in rectangular geometry and the isothermalQUEOS experiments performed in axial-symmetric cylindrical geometry. The completebehavior of ESE was validated using results from the hot integral QUEOS experiments. Toget a better understanding of ESE's numerical behavior all calculations were performed,beside using ESE's second order accurate high-resolution method, also using a first orderaccurate upwind method and a convergence analysis has been done.
2. The Exchange Laws
The interfacial exchanges of mass, momentum and energy are clearly regime dependent, anduncertainties remain even for two-phase flows. For now, our approach aims to incorporatefirst-order physics that accounts for the major flow and heat transfer regimes as identified bysimple criteria of fuel presence probability a f and vapor presence probability fraction
®v = avl{av +aw)• The flow regimes are shown in Fig.l. For af < 0.3 we consider the fuelparticles immersed in a two-phase gas-liquid flow, whose own flow regimes are defined bythe value of the vapor presence probability fraction: &r < 0.3 (bubbly), 0.3 < #,, < 0.7 (churn-turbulent), and &v > 0.7 (droplet). For a f > 0.3, as the fuel particles are densely packed, weconsider a flow of gas and liquid through a porous bed of fuel particles.
We use the. exchange laws available for two-phase systems after making suitablemodifications to account for, as a first approximation, the effect of a third phase. Incalculating interfacial momentum exchange, one needs to know the projected areaconcentration of the dispersed phase. Also, in calculating interfacial heat exchange, one needsto know the interfacial area concentration. In a two-phase system, these area concentrations
320 Nuclear Energy in Central Europe '98

Flow over Immersed Fuel Particlesaf <0.3
Bubbly Flow9V < 0.3
Churn-TurbulentFlow
0.3 < 3 < 0.7
Droplet Flow0.7 < A.
Flow Through aPorous Bed ofFuel Particles
0.3 < af
Fuel
Vapor
Water
Figure 1: Schematic diagram of flow regimes considered in characterising interface transfers.
can be estimated from the length scale and the presence probability of the dispersed phase.However, the presence of a third phase reduces the area concentration as the third phase mustalso share the same area. Therefore, we modify the area concentration by a factor(pjj = a i I [a i +ock), which represents the effect of the phase k on the area concentration ofphase i for its interaction with phase j .
2.1 Interfacial momentum couplingThe interfacial momentum coupling is primarily due to drag. For the bubbly flow regime(&v < 0.3) we have also included the added mass effect
(1)
(2)
(3)
Dt
c - vrf|(vc - v d ) ,
" r i T 1 " \ Dtand lift forces
For a f < 0.3 the drag force is calculated from
- _ 3 C
"-^adPcdcTdwhere the drag coefficient for churn flow (0.3 < 9V < 0.7) is defined by
r - 8
-v,c-w, ~ 3
and for dispersed flow by
9r< 0.3, d = v,c = w, f = (l-9v)
9 >0 .7 , <i = w,c = v, f = 9^ ,1.5
C = 0.4517 .67 / / 7
18.67/
(4)
(5)
The length scale (diameter) Dr/ is obtained from- 2 ^
Pc - = We,.,8 d = v
y [12 d = w
For the "dense fuel regime" ( « / >0.3) we use laminar and turbulentpermeabilities
(6)
(V)F~~ —
df -7 mrh
where
Nuclear Energy in Central Europe '98 321

and
with
r?lam 150- a,l_
,a f
aMd (- - )
P D2 •
o,. Re',
Re',
<1000
>1000
*df -
11.75adaf adpd
0,
(8)
(9)
(10)
2.2 Interfacial heat transferThe distinction of the fuel-to-coolant heat transfer mechanisms is made again on the basis ofthe flow regimes. The key distinction is whether or not there is sufficient water in the coolantphase to completely engulf the fuel particles, thus a vapor presence probability fractioncriterion is used.
For i9, < 0.7, heat transfer to water is estimated by superposition of radiation and filmboiling heat fluxes
(11)
The emissivity value ef - 0.7 is selected for the calculations of typical interest. Heat transferfrom fuel to vapor in this regime need not to be accounted for separately.
For 9r > 0.7, we assume a vapor-continuous regime in which heat is transferred toliquid drops by irradiation and to the gas by convection. The gas is allowed to superheat andconvert heat to the liquid drops, which boil at saturation. Thus
(12)
where for a f < 0.3
v,. Dt
A..
and for a f > 0.3
K=0.9\cpfavPv
K =°-v.. - v ,
V,, - V
Re ,,-0.51 p - XPr,./3 , Re" < 50
_2/ ' K e v -
Pr,, ̂ , Re: > 50
v v - V /D,
6a,
(13)
(14)
Similarly, for vapor-to-water heat transfer we have, for 9V < 0.7 with vapor as thedispersed phase
322 Nuclear Energy in Central Europe '98

Q,, = nJm,7iDvA/2p r /3 V71 f "I
(15)
while for #,, > 0.7 , with liquid as the dispersed phase
/Ofo -Tv),7 (16)
3. Description of the Premixing Experiments
3.1 Isothermal experiments at the University of OxfordIsothermal premixing experiments have been performed at the University of Oxford [3], inwhich a two-dimensional array of 6 mm diameter balls, initially held at predeterminedspacing by perforated belts, was projected downwards into a tank of water 475 mm wide, 925mm deep and 7.8 mm thick. The planar two-dimensional geometry provided a goodvisualization of conditions within the jet. Most of the experiments were performed withstainless steel balls and a few with aluminium balls. In the experiment considered stainlesssteel balls were projected in a jet 10 columns (87 mm) wide and entered the water at avelocity of 1.7 m/s and a phase presence probability of 0.10.
3.2 Experiments at the QUEOS facilityIn these QUEOS experiments [4] up to 20 kg of spheres, made of steel, zirconia ormolybdenum, were heated to temperatures up to 2300°C and discharged into 0.5 m3 ofsaturated water (Table 1). The water level in the vessel with an inner cross section of 70 cm x70 cm and a height of 138 cm was 100 cm. In all experiments the jet diameter was 9 cm andthe spheres entered the water at a velocity of 5.12 m/s and a phase presence probability of0.17. The following QUEOS experiments were simulated:
Experiment
Q01Q02
Q05Q09Q06Q07Q08Q04Q l lQ12
Material
steelsteelZrO2
ZrO2
ZrO2
ZrO2
MoMoMoMo
Diameter[mm]4.74.7
5.05.0
10.010.04.24.24.2
4.2
Mass[kg]2010
7.07.0
7.07.010105.76.9
Volume[cm3]4440222018301880190019001800180010251183
Number ofspheres460002300018000180002340234024000240001370016600
Temperature[K]300300
30013003001300300130018002300
Table 1: Conditions of simulated QUEOS premixing experiments.
4. Results of the Simulation
4.1 Isothermal experiments at the University of OxfordThe simulation of the Gilbertson experiment [3] has been performed in the rectangularcoordinate system on meshes 14x37, 26x72 and 50x142 grid points. Since the analysis of video
Nuclear Energy in Central Europe '98 323

data from the experiments showed that the drag coefficient was 0.76, this increase above thestandard value 0.44 presumably being caused by the presence of the tank walls, the correcthigher drag coefficient was taken for the calculations. The results of the simulations arepresented on Fig. 2 where they are compared to experimental data and also to the first orderaccurate upwind calculations. The convergence analysis showed that the ESE results calculatedwith the second order accurate high-resolution method don't depend much on the grid density.On the largest mesh 50x142 grid points also the upwind method produces nearly perfect results.
E -0.1
H -0.2
g -0.3
I J .n«=
-ESE i
exp
mesh: 14 x 37
Figure 2: Comparison of Penetration depth and Plume half width between ESE, experiment and upwind methodcalculations.
4.2 Experiments at the QUEOS facilityThe simulation of the QUEOS experiments has been performed in the cylindrical coordinatesystem on a mesh 41x120 grid points. For the cold experiments the penetration depth and theplume half width have been compared to experimental data and to the first order accurateupwind calculation (Fig. 3), whereas for the hot experiments also the comparison of the steamflow rate and the total steam volume is presented (Fig. 4, 5).
4.2.1 Cold experimentsThe first spheres touch the water surface with a velocity of about 5 m/s and are decelerated toapproximately 3 m/s. The succeeding spheres push the spheres which are already in the watersideways and downward, thereby opening a gas channel twice as wide as the original diameterof the sphere jet. Since the later spheres fall within the gas channel they still accelerate and meetthe sphere front at a higher velocity and the front velocity increases again.
The results of the ESEsimulation agree qualitativelyas quantitatively relatively wellwith the experimentalmeasurements (Fig. 3). Thecalculation with the upwindmethod produced a slightly
Figure3: Comparison of Penetration depth and Plume half width between faster front propagation as aESE, experiment and upwind method calculations. consequence of the artificial
numerical diffusion and less
324 Nuclear Energy in Central Europe '98

spreading since the inverted mushroom structure did not develop completely. The describeddecelerating-accelerating-decelerating front velocity behavior was reproduced only with theESE simulation.
4.2.2 Hot experimentsIn the tests with hot spheres an effect occurs which breaks up the front of the sphere cloud.While the spheres are resting upon the middle valve in the radiation furnace the pressureincreases due to the heat up of the gas in the closed space between the upper and the lowervalve. When the lower valve is opened a gas burst, which disturbs the water surface, can beobserved. When the middle valve opens, there is still some overpressure above the spheres andgas is forced through the spheres accelerating the front spheres. In these tests always a smallnumber of spheres is ahead the bulk. Therefore a pressure relief valve was installed above themiddle sliding door which opens together with the lower sliding door valve. This reduced thiseffect somewhat (starting with Ql 1).
The comparison of the penetration depth and the plume half width between the secondorder accurate ESE simulation, the experiment measurements and the simulation performedwith the first order accurate upwind method is presented on Fig. 4. The results of the ESEsimulation are in relatively good agreement with the experimental data.
Figure4: Comparison of Penetration depth and Plume half width betweenESE, experiment and upwind method calculations.
It is interesting that for theQ04 experiment, where thedescribed spreading effectcaused by the gas burst issignificant, the upwind methodgives better results than thehigh-resolution method appliedin the ESE code. The reasonmay be that the numericaldiffusion of the first order
accurate upwind method produces similar spreading of the spheres than the not modeled gasburst.
On Fig. 5 the comparison of the steam flow rate and the total steam volume between theESE simulation, the experiment and the simulation performed with the upwind method ispresented. The results of the ESE simulation show qualitatively the correct dynamics of thesteam production, but there are some deviations in the absolute value of the steam flow rate. Inall simulation the steam flow rate is zero till the first hot spheres enter the water, whereas in theexperiments there is significant steam flow also before. The reason is the heating of the steamatmosphere above the water during the hot spheres free fall, which was not simulated, andmaybe also little evaporation of the water surface due to radiation. Radiation was taken intoaccount in ESE only with an intracell model not considering the intercell radiation influence. Inthe first part of the premixing phase the upwind method and the high-resolution method appliedin ESE give similar results for the steam flow rate, whereas in the second part the steamgeneration is higher for the upwind method. The main reason for that behavior is the high
Nuclear Energy in Central Europe '98 325

0.05 D.i 0.15 0.2 0.25
—
£
2j
<=
1
0
900 . , - - -800 J ' —700 -!! —600 -|!—500 -j400 -\300 4200 j100 K ^
0 ••
0
0.05 0.1
ESEJ— Q12 /;
uw y r
IS/
is'0.05 0.1
0.15 02
Time (s)
L_
^ ^
— ,0.15 0 2
Time (s)
0.25 0.3
r 180j- 160
-Jfl-140
fv^^^wj- 100\ W U 80
^"*v^-j 60-I 40-| 20
— . , L o0.25
1E
o
vertical spreading of the hotspheres cloud caused by thenumerical diffusion of the firstorder accurate upwind methodand therefore a greater heattransfer surface area in lesssubcooled water. The water
Figure 5: Comparison of Steam flow rate and Total steam volume between s u b c o o I i n g i s caused by theESE, experiment and upwind method calculations. hydrostatic pressure and the
pressure increase due toevaporation.
5. Conclusions
ESE the general second order accurate two-dimensional compressible multiphase flow computercode has been validated against a number of premixing experiments performed at the Universityof Oxford and at the QUEOS facility at Forschungszentrum Karlsruhe. In these premixingexperiments different jets of spheres were injected in a water pool. The ESE validation plan wascarefully chosen, starting from very simple, well-defined problems, and gradually working up tomore complicated ones. The hydrodynamic part of ESE could be tested separately using resultsfrom the Gilbertson experiments performed in rectangular geometry and the isothermal QUEOSexperiments performed in axial-symmetric cylindrical geometry. The complete behavior of ESEwas validated using results from the hot integral QUEOS experiments. To get a betterunderstanding of ESE's numerical behavior all calculations were performed, beside using ESE'ssecond order accurate high-resolution method, also using a first order accurate upwind method.
Most of the ESE results agree qualitatively as quantitatively reasonably well withexperimental data and they are in general better than the results obtained with the first orderaccurate upwind calculation. The greatest deviation between the simulation and theexperimental measurements appeared for the steam flow rate most likely because of theunrealistic determined initial conditions (gas burst spreading, ...) in combination withuncomplete modeling (steam atmosphere heating, intercell radiation, ...).
6. References
[1] M. Leskovar, J. Marn: Simulation of High Temperature Molten Fuel Coolant Mixing. ASMEInternational Mechanical Engineering Congress, Atlanta, Proceedings (1996), pp. 99-101.
[2] W.H. Amarasooriya, T.G. Theofanous: Premixing of Steam Explosions: A Three-Fluid Model. Nucl Eng &Design, 126,23-39,(1991).
[3] M.A. Gilbertson, D.B.R. Kenning, D.F. Fletcher: Small-scale Coarse Mixing Experiments: Problems ofComparison with Multiphase Flow models. Proc. Int. Conf. on New Trends in Nuclear SystemThermohydrauiics (1994), Vol.2, pp. 247-255.
[4] L. Meyer, G. Schumacher: QUEOS, a Simulation-Experiment of the Premixing Phase of a SteamExplosion with Hot Spheres in Water, Base Case Experiments. FZKA Report 5612, ForschungszentrumKarlsruhe, (1996).
326 Nuclear Energy in Central Europe '98

SI0100126Nuclear Energy in Central Europe '98
Terme Catez, September 7 to 10, 1998
Connection between P3 and ORAM codes with p2o code
Roman Kocnar, Ivica Basic, Joze SpilerKrsko Nuclear Power Plant, Vrbina 12, Krsko, Slovenia
Abstract
The Outage Risk Assesment and Management (ORAM) Package is a software tool developed byERIN Engineering and Research, Inc. for the Electric Power Research Institute (EPRI) to aid to themanagement of nuclear power plant outages from a safety and risk perspective. Primavera ProjectPlanner is a software tool (planing tool) developed by Primavera Systems, Inc. used by Krsko NPP foroutage planing.
Since there is no electronic connection between P3 (Primavera Project Planner code) and ORAM,NEK developed a p2o code. In this article the process of planning in P3 and the use ofp2o code, isdescribed.
1.0 Introduction
There are two major modulees within the ORAM software:i) Probabilistic Shutdown Safety Assessment (PSSA) andii) Risk Management Guidelines (RMG)Each module accomplishes different objectives, and can be developed and used separately.Within the ORAM RMG model, the following key Safety Functions are evaluated:
Containment Integrity and CoolingDecay Heat RemovalElectrical Power AvailabilityInventory ControlReactivity ControlSpent Fuel Pit CoolingCooling Water and Other Vital Support System
In addition to the above Safety Functions, elements of Shutdown Fire and Shutdown Floodingvulnerabilities are also included in the ORAM RMG model.
ORAM is able to receive equipment unavailability information from outage/maintenanceplanning schedules (Krsko NPP uses the Primavera Project Planner (P3)). For this purposep2o code (Primavera to ORAM code) is connected to Primavera Project Planner for Windows(P3 version 2.0 for Windows, Primavera Systems, Inc.) and Outage Risk Assessment andManagement (ORAM version 2.1 for Windows, Electric Power Research Institute).
Nuclear Energy in Central Europe '98 327

There is no possibility of direct connection between those two codes. In handwritten notesmistakes are most likely to occur. Having this problem in mind, the Krsko NPP saw apossibility developing a new code as a solution that will fullfill the following requirements:
1. Easy and fast connection2. Error free connection3. Simple usage of anew code
The steps to get connected are:1. Preparing data in P3, which shall be used in ORAM (using P3)2. Data input to P3 (using P3)3. Data export from P3 (using P3)4. Data Conversion (using p2o)5. Data import to ORAM (using ORAM)
2.0 Preparing data in P3, which shall be used in ORAM
In P3 project for planning an outage, new Scheduling Software System Code named ORAMshall be added (refered to as ORAM Activity System Code). With those additional charactersORAM code can be assign for every one activity in outage plan (figure 1.). If an outageactivity does not recognize the ORAM code, the input would be code zero (00).
7 Activity M1ORAM-A1F Activity M2ORAM-A2
7 Activity 083ORAM-A3 :
^ Activity M40RAM-A4
hi I <LCodat I Comb I Cotl ; Cimon j Dal«» •• Loa ; Plod i Rei | Suce '. W8S
IDJ M'!3s,i; 'JActivitf 003
ao| TT Pet | 5T Caifi r ES |I7SEP98
RD| i f W i a *
Ptevioutl Netl 1 Help |
EEJ09OCT38 [.j TF:2
I F I13O CT 38
JA3 |Oram WBS
Oassfc Schsdue UyoU
J f MtaosoflWad. IheOuta,. iveta Project Pla... I 10-12AM
Figure 1. Coding activities in Primavera Project Planner
328 Nuclear Energy in Central Europe '98

3.0 Export data from P3
Because P3 can not prepare data to be readable in ORAM, we need export data (figure 2)from P3 to ASCII file which can be readable by p2o code. The information ORAM needs to isas follows: Early Start, Early Finish, Activity Codes and Activity Description. P3 does notexport data with ORAM Activity Codes with value 00.
[ACTOO
[ACTQQ
_EX-01 Export Date File _Lolu» - Schedule Data~-Xl°.?~ "!ClcP?rt_P*t?-(f|l'>-" P > « e -"Schedule Data
EX-Q4 " ~Eitport Data f i le - Lolut - RetowcejiataEXi.05_ -Export^Data'File -"dBASE~-"B«oufce D«N>_"FX06 " 'Export Data'FJIs'ASCIIs Rasource DataEX 0 7 ' "Export Data"FiIe_- Lotus - Cot* Data"EX-G8 Export Data File^dBASE • Cott j)_*ta__l><jJ9 *EMOrt"Datsf"ita_AS_CII - Coit DaiaEX-10 "Export Schedule Data with Constraint*
" E X 1 1 " " ' C ^ t " S h ^ V b I " ' ^ " " C ' > D t l T i "EX-12 'Export Succettor Infotmatron
its D I M ) • Succe«0t
-i+l-i- Description j
Earijxtaitf-orly finishActivity codesActivity desciiplHin
trffttiomhtp*
Schedule j
Cutienl _*_
CutrentCuuenl
H«.cnptTO,!oni)h: ( 7 i ] S ASCII Pie i«Mi: 72
: O Contsitt (- ieloction
H l B l p
I lU«: |EKp«t fiom P3 lo ORAM
' Output Me
Noa«|D:\P3\r30UT'iP3
t»>e- j I PRN ] - ASCII
ID
!jA3
Actual Vakxn
T Peiiod fx •
" - * " -fle«iurcs/Coit Pato-1
Older I C Su«»«iiie G, [
" j ASQt Output (meatmed m
Field xqwalicKi j T[5
Activity Code* '.>c»tiA^ ^>/ L f i j ^ u i M t '
p j Urn I«noe: i ' ^ !--,«.• i«.a- j 1(4- ,..*»«.•»• | 1 \y. I i j f High lange: j 201* K; .f> , u - . j
C Content C £mws!
Title JEKPOII from P3 lo GRAM
I t » l muit meet & B of the (oikminarnteria:1 ™"a C Anx
Ot»a WBS •
High Value
Figure 2. Export ORAM codes from Primavera Project Planner
4.0 Conversion Data
p2o code was written in C language for DOS environment, and can be executed in Windows95 Microsoft Operating System. p20 starts with the next command:
p2o < source_file > destination_file
As a source_file we use p3.out that comes from the export operation from P3. As adestination_file, we take the file with name which ORAM uses: psdbfile.dat. If the abovecommand is used without destination_file, output data will be directed to the screen (thisoption is usefull for testing before the final conversion).
Nuclear Energy in Central Europe '98 329
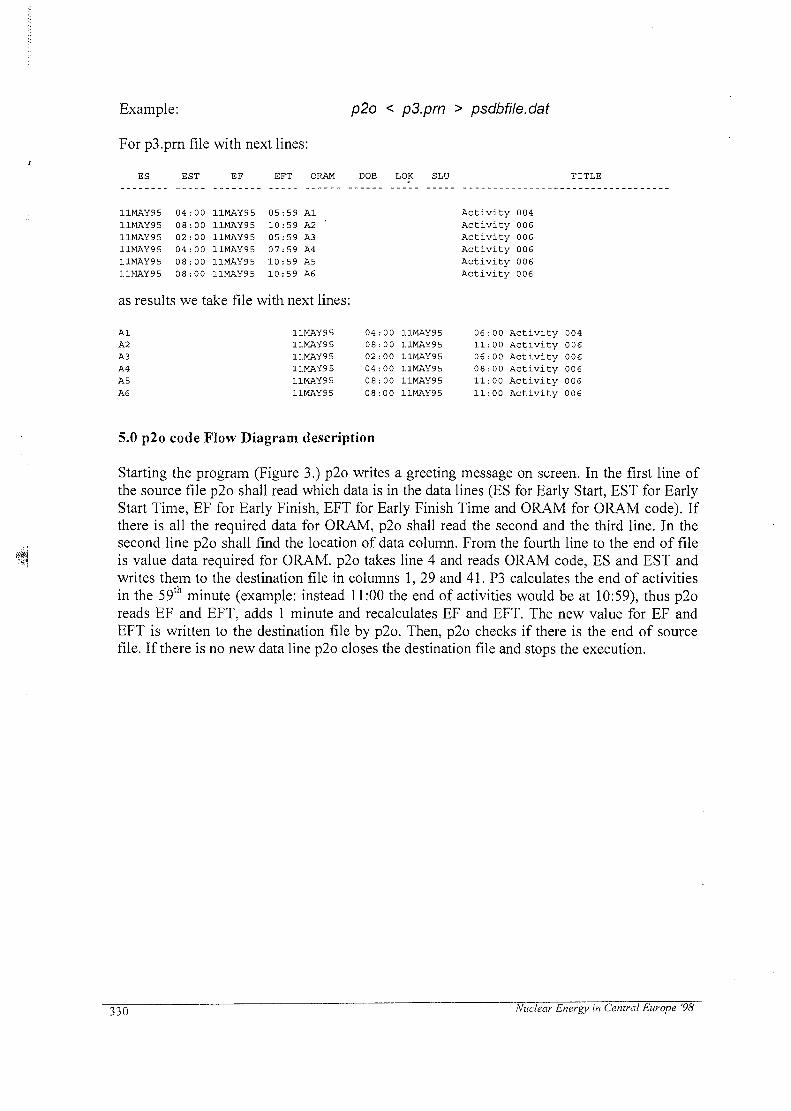
Example: p2o < p3.prn > psdbfile.dat
For p3.prn file with next lines:
ES EST EF EFT ORAM DOB LOK SLU TITLE
11MAY9511MAY9511MAY9511MAY9511MAY9 511MAY95
04080204
0808
00000000
0000
11MAY9511MAY9 511MAY9511MAY9511MAY9511MAY95
05:5910:5905:5907:5910:5910:59
AlA2A3A4A5A6
as results we take file with next lines:
AlA2A3A4A5A6
11MAY9S11MAY9S11MAY9 511MAY9511MAY9511MAY95
04:00 11MAY9508:00 11MAY9502:00 11MAY9504:00 11MAY9508:00 11MAY9508:00 11MAY95
Activity 004Activity 006Activity 006Activity 006Activity 006Activity 006
061106081111
004006
0 0 Activity0 0 Activity00 Activity 00600 Activity
ActivityActivity
006006006
5.0 p2o code Flow Diagram description
Starting the program (Figure 3.) p2o writes a greeting message on screen. In the first line ofthe source file p2o shall read which data is in the data lines (ES for Early Start, EST for EarlyStart Time, EF for Early Finish, EFT for Early Finish Time and ORAM for ORAM code). Ifthere is all the required data for ORAM, p2o shall read the second and the third line. In thesecond line p2o shall find the location of data column. From the fourth line to the end of fileis value data required for ORAM. p2o takes line 4 and reads ORAM code, ES and EST andwrites them to the destination file in columns 1, 29 and 41. P3 calculates the end of activitiesin the 59th minute (example: instead 11:00 the end of activities would be at 10:59), thus p2oreads EF and EFT. adds 1 minute and recalculates EF and EFT. The new value for EF andEFT is written to the destination file by p2o. Then, p2o checks if there is the end of sourcefile. If there is no new data line p2o closes the destination file and stops the execution.
Nuclear Energy in Central Europe '98

p2o < p3.prn > psdbfile.dat
Write greetings massage onscreen
Read 1. line of source file
Write missing data on screen
Exit
Read 2. line of source file
Read 3. line of source file
Find data position in source file
•
Read 4. line of source file
Yes
Read ORAM code and write todestination file
Read ES code and write todestination file
Read EST code and write todestination file
Read EF and EFT
Add 1 minute
Write EF and EFT todestination file
Read Title and write todestination file
Read next line of source file
Figure 3. p2o Flow Diagram
Nuclear Energy in Central Europe '98 331

6.0 Conclusion
Semiautomatic connection between both P3 and ORAM codes reduces the possibilities ofmaking typographical errors and reduces time of performing "what i f analysis.
7.0 Reference
[1] Electric Power Research Institute, Scheduling Software System Code, ORAMUser's Manual, 5-10
[2] Primavera Systems, Inc., Primavera Project Planner - Reference Manual,version 2.0
332 Nuclear Energy in Central Europe '98

SI0100127Nuclear Energy in Central Europe '98
Terme Catez, September 7 to 10, 1998
TRENDS IN SIMULATION AND THE KRSKO FULL SCOPE SIMULATOR 'Robert Boire, Michael Chatlani
CAE Electronics Ltd.
Montreal, Canada
ABSTRACT - The nuclear power plant simulation industry is a fast-paced industry yieldingcontinual development as a result of innovations in technology and customer requirements. Thispaper will discuss the current trends in simulator requirements, the status of simulation technologyand the expected future developments, particularly in the context of the NPP Krsko full scopesimulator.
CAE Electronics has been awarded the contract for the design, construction, integration, testing andcommissioning of the NPP Krsko full scope simulator (KFSS) by Nuklearna elektrarna Krsko (NEK).KFSS, as an integral part of the NPP Krsko Modernization plan, has been the subject of an extensiveprocurement process. KFSS will also take into account the steam generator replacement and plantuprate projects which will be delivered to provide initial training in the modernized plantconfiguration. As a result, the completed KFSS will meet NEK's goals for reliable training in safeplant operation as well as the licensing requirements of the Slovenian Nuclear Safety Administration.
KFSS will be a state-of-the-art facility featuring high fidelity process and control models, proventechnology and superior maintainability that will push the envelope of traditional simulator uses. Inaddition to serving its role as a high quality training vehicle, KFSS will be used for engineeringpurposes including procedure development and validation, optimization of plant operation and studyand validation of plant modifications.
KFSS models will be built for the most part with CAE's ROSE™ toolset. ROSE, is a component-based, visual programming environment for the creation, calibration, testing, integration andmanagement of simulator models and supporting virtual panels. The NSSS will be simulated usingthe ANTHEM two-phase drift flux model, while reactor kinetics will be simulated using the COMETtwo-group, three-dimensional model. Software design and testing will be supported by an extensiveseries of quality procedures throughout the software design process.
1. Introduction
CAE Electronics was awarded the contract for the Krsko Full Scope Simulator (KFSS) projectin 1998 following an extensive procurement process undertaken by NEK. The procurementprocess ensured that KFSS would be a state-of-the-art facility. As one of the most recentlyawarded full scope nuclear power plant simulator projects, KFSS thus represents a convenientcontext in which to discuss current trends in simulator requirements and technology.
f Invited Paper
Nuclear Energy in Central Europe '98 335

2. Simulator Technology Today
2.1 Background
This summer marked the 30th anniversary of the delivery of the first power plant simulator.The simulator was originally designed as a partial replacement for performing startup andshutdown training on the actual, plant [1]. However, it was following the TMI accident in1979, which highlighted the importance of operator training in safe plant operation andtransient mitigation, that the role of simulators in nuclear power plants became so important.Since that time simulator technology has been paced as much by the evolution of computerhardware and software technology as by the evolution of training requirements. Hence it isconvenient to classify the evolution of simulators according to the dominant technology at thetime.
Simulators can be grouped into the following generations:
• first generation: assembler based programming; limited scope of operations; primitiveinstructor stations.
• second generation: computer platforms dominated by Gould/SEL/Encore line of minicomputers with proprietary operating systems and limited address space, emergence ofFORTRAN- based programming for modeling applications, emergence of two-phasethermal hydraulic models and limited nodalization 3-D neutronic models, training inmalfunctions and transients; component-based malfunctions; emergence of the firstsimulator standards.
• third generation: first RISC/UNIX-based 32-bit multi-processor applications (CAE1989), emergence of the graphical user interface for instructor stations and high qualitymimic panels; improved fidelity for BOP models.
• fourth generation: introduction of large scale graphical modeling tools (CAE 1991); highnodalization thermal-hydraulic and neutronics models; 64-bit RISC processors, UNIXand Windows NT operating systems, PC-based platforms.
The most important trends to discuss in the current generation of simulators includes:
• model development tools• low cost, high performance computer platforms• modeling fidelity• glass simulators• pre-commisioning delivery• standards
2.2 Model Development Tools
The introduction of graphical model development tools is the most significant recentdevelopment in the power plant simulation industry and has quickly become an essentialrequirement for most new simulators. The development of these tools has been a cause ofmajor investment for most simulator vendors. The scope, depending on the vendor, typicallyincludes varying degrees of thermal-hydraulic, instrumentation and control and electricsmodeling and varies from initial model definition to integrated testing and configurationcontrol environments. More advanced systems enhance flexibility through object-oriented
336 Nuclear Energy in Central Europe '98

programming techniques. The quality and flexibility of graphical model development toolsremains one of the major technology discriminators between simulator vendors.
The advantages sought through model development tools include:
• standardized models• automated code generation• intuitive visualization• reduced life cycle cost
Model development tools are, changing both the process of simulator development bysimulator vendors and the long term expectations for maintenance by simulator owners.
2.3 Computer Platforms
Interest in Windows NT and PC-based platforms is currently very high. The combination ofWindows NT and PC's is poised to fulfil the long sought goal of low cost, off-the-shelf, opensystems. Several Windows NT-based platforms have been deployed in the past two years.However, these platforms have all exclusively been rehosts from second generation simulatorswith modest computational requirements. To date, no fourth generation Windows NTsimulators have been delivered, though one was awarded in 1996 and another major upgradewas recently awarded. Up until very recently, only RISC/UNIX-based processors have beenable to provide an affordable combination of raw computer power, bandwidth, processorscalability, graphics engine and real-time operating system control to meet the computationalrequirements of CAE's fourth generation full scope simulators.
The recent introduction of the 400Mhz Xeon processor with the 100MHz system bus and450NX chipset, which will support 4- or 8-processor servers, will remove all purelycomputational restrictions to using PC-based solutions for fourth generation simulators.
Windows NT is not a real-time operating system, hence there have been concerns over real-time and repeatability. Nevertheless, it is generally believed that real-time and repeatabilitycan be guaranteed by using a dedicated server for running the simulator modeling applicationsand blocking all other applications, including (and especially) graphics from this serverduring execution.
Up until the current generation, modeling fidelity has been as strongly influenced bycomputational cost as by technique and compromises have been necessary. Computationalcost now typically accounts for less than 5% of the overall simulator cost. Thus one of themost significant features of the current generation of computers, from a modeling point ofview, is the virtual decoupling of modeling fidelity from computational cost.
2.4 Modeling Fidelity
Modeling fidelity includes both the scope of simulation and model scope and performance.The scope of simulation systems refers to the scope of modeled systems, components, flowpaths, controls and malfunctions and the simulated plant operations that they support. Modelscope includes issues such as two-phase thermal-hydraulic models and nodalization andsupport for cycle-specific core data upgrades.
Nuclear Energy in Central Europe '98 337

The scope of simulated systems is typically a trade off between the customer's trainingrequirements, which is in turn sometimes strongly influenced by the local regulators, andbudget. Simulation cost is directly related to scope. Historically plant systems have been fullysimulated, partially simulated or functionally simulated. In a fully simulated system allcomponents and flow paths are modeled whereas in a partially simulated system, redundantequipment trains, components and flow paths may be physically lumped or simply ignored. Ineither case modeling is based on physical principles. Functional simulation, in which aspecific response is pre-programmed, is typically reserved for unimportant systems with littlecontrol or interaction with other plant systems.
In general, most plant systems that interact with the main control room are either fully orpartially simulated. In this aspect, the current trend is not very different from that of thirdgeneration simulators. However the availability of efficient graphical development tools hasdrastically reduced the cost differential between fully and partially simulated systems andhence the general trend is to provide full simulation for virtually all systems. While somethird generation simulators did include generic malfunctions, the availability of modeldevelopment tools has facilitated the introduction of generic, component-based malfunctionswithout increasing modeling effort. Component-based malfunctions allow instructors tocreate virtually a limitless number of training scenarios.
In terms of the scope of operations, virtually all plant operations and postulated transients arewithin scope, with the exception of pipe draining and filling outside of the NSSS. Drainingand filling of the RCS and steam generators and training at mid-loop (including LOCA's) is aparticular challenge for some two-phase models and consequently many third (and perhapseven fourth) generation simulators do not support these operations at all or switch to vastlysimplified models or nodalizations. The simplified models have limited scope and switchingis often a source of stability problems. These operations have been the focus of increasedregulatory attention in recent years and support for them are now standard requirements inmany new simulator specifications. Simulation of severe accidents (fuel melting and beyond)has been a requirement for some European simulators but has generated little interest in NorthAmerica. Draining, filling, mid loop operations and severe accident modeling is not requiredby the ANSI/ANS 3.5 standard.
In terms of two-phase models, the de facto minimum requirement is a five-equation drift fluxmodel and all full scope simulator vendors offer some manner of drift flux model (thoughperhaps through subcontract to other vendors). Providing detailed comparisons is difficult,given the highly proprietary nature of these models, however it is known that they differwidely in the use of graphics and tools, time step, computational burden, numerical schemeand in the density of nodalization. Sensitivity to the Courant limit is a serious considerationfor some models.
There is an emerging trend towards expanding model fidelity and training possibilities byincorporating full two-phase modeling capability in traditionally single phase systems such asfeedwater, steam systems and cooling systems. Some vendors have chosen to enhance theirtraditional models, some have developed entirely new models and some have chosen simply toextend the NSSS models into these areas. The latter method is particularly tempting from afidelity point of view, though it may in fact limit simulator flexibility, if the NSSS model isnot supported by graphic model development tools.
For core neutronics calculations, two-group models are the norm with typical axialnodalizations of 8 to 16 nodes and one node per fuel assembly for PWR's or 4 nodes perassembly for BWR's. Separation of variables is still used by some vendors to solve the
338 Nuclear Energy in Central Europe '98

neutron diffusion equation while others use more sophisticated finite difference approaches.A report by the Institute for Nuclear Power Operations (Significant Operating ExperienceReport (SOER) 96-02, Recommendation 6) has recently underlined the importance of cycle-specific simulator models. Thus, an important consideration is not only the model itself, butthe availability of user friendly tools that allow the end user to easily update simulator modelsto reflect current fuel cycles.
Finally, while hardly a trend, it is important to mention the emergence of the six-equation bestestimate thermal-hydraulic codes originally developed for transient analysis, such asCATHARE and RELAP5, for NSSS simulation. These codes have been modified for real-time applications and are maintained by their parent organizations. They are available fromthird parties under license from the parent organizations. It is debatable if these codes add adistinct fidelity advantage over their five-equation counterparts for training applications.Recent comparisons of simulated transients show very similar results for some five-equationand six-equation models [2], [3] and have pointed out that a judicious choice of nodalizationprobably plays a more important role than the number of equations. At least until recently,simulation of non-condensables at very low pressure during LOCA's and mid loop operationsare known within the user community to be problems for RELAP5 [4]. In addition, licensescosts and computational requirements make these models considerably more expensive thantheir five-equation counterparts.
2.5 Glass Simulators
We define a glass simulator as a simulator with full scope plant simulation and a graphicaluser interface (GUI) instead of a replica control panels. The GUI typically consists of aninstructor station and operator workstations consisting of mimic (soft) panels, P&ED and logicdisplays and other visualization aids.
The most important applications of glass simulators are as a supplement to traditional fullscope simulators and as engineering simulators. In the case of the former, the simulatorowner can significantly reduce the training time burden on his full scope simulator. In thecase of the latter, the full scope simulator owner can have a second simulator for engineeringuses at a fraction of the cost of the original simulator. The engineering simulator presupposeshigh fidelity models for all plant systems. The engineering simulator can be used inoptimizing plant operations, procedure development and validation and carrying out what-ifstudies. Coupled with model development tools, it can be used to quickly simulate and pre-test proposed plant modifications. Of course, it can also be used as an additional trainingtool.
2.6 Pre-Commissioning Delivery
This trend refers to the availability of simulator prior to plant startup or commissioning of amajor upgrade. Early plant-specific training is an important tool in safe and economic plantoperation. In this case the simulator design is based almost entirely on design data, ratherthan a combination of design and operational data. High fidelity models with reasonablepredictive capability are clearly a requirement. Successful implementations require innovativesimulator development plans and schedules that take into account the plant constraints such asconstruction schedule, data availability, and post-commissioning tuning as operational databecomes available.
Nuclear Energy in Central Europe '98 339

2.7 Standards
The ANSI/ANS 3.5 standard [5] establishes the functional requirements for full scope nuclearpower plant simulators in the United States. ANSI/ANS 3.5 stipulates the minimum standardfor scope and performance criteria of simulated operations and malfunctions, testing andmaintenance. Simulator regulation elsewhere is determined by each country's internalpolicies. However ANSFANS 3.5 has become a de facto international standard for full scopetraining simulators.
The newly issued 1998 revision includes new requirements, particularly for stimulateddevices and the validation and verification tests required to demonstrate simulator operability.The impact of these new requirements will depend on current utility practices and qualityprocedures and the application of the standard by regulators. It is likely though that thestandard will place an extra burden on simulator owners in order to maintain a clear audit trailfor all aspects of simulator maintenance.
The ANSI/ANS 3.5 standard does not attempt to regulate non-full scope simulators, such asglass simulators and engineering simulators. However it does for the first time address them,by trying to provide guidance with respect to which sections of the standard may apply. AnIAEA technical document on selection, specification, design and use of various types oftraining simulators, including glass simulators and engineering simulators, has recently beenpublished [6].
3. The Krsko Full Scope Simulator (KFSS)
3.1 Simulator Hardware
KFSS will be delivered in two configurations. The full scope simulator complex will consistof a four-processor Silicon Graphics (SGI) Origin 2000 host computer featuring the MIPSRISC R10000 196MHz RISC chip, two RIOOOO-based SGI 02 workstations as instructorstations, and one 02 workstation and one Pentium II PC as engineering development stations.The control room scope includes four local emergency shutdown panels, integrated sound andaudio visual systems and a stimulated plant process computer, the Process Information System(PIS) supplied by ABB Power Oy. The second simulator is a glass engineering simulatorconsisting of an Origin 2000 host computer, an 02 instructor station and three PC's asoperator stations. The second simulator host computer also acts as a spare to the full scopesimulator. All interprocessor communication will take place via Ethernet.
3.2 ROSE Modeling Tool Set
All KFSS modeling software, with the exception of the containment process and the reactorkinetics models, will be developed using the ROSE tool set [7]. ROSE, an acronym for Real-time Object-oriented Simulation Environment, is a visual programming environment for thedevelopment of simulation models. ROSE is used for the entire simulator life cycle, frommodel design through to testing, documentation and long-term maintenance. ROSE was firstintroduced by CAE in 1991.
ROSE has specifically been designed to support desktop applications and large scale simulatordevelopment in a work group environment. The ROSE tool set consists of editors, codegenerators, a test environment and configuration management tools.
340 Nuclear Energy in Central Europe'98

m
ROSE editing tools allow users to create icons, objects and object libraries, to graphicallybuild models using these objects and to define testable configurations. A ROSE user creates asimulation model by drawing a graphical representation of the system. The graphicalrepresentation, referred to as a schematic, consists of object instances, selected from librariesrepresenting the applied discipline. Library objects are the lowest level building blocks usedin the design of models and are specified by an object definition. The object definitionconsists of model variables, their description, dataflow and connect point definition, objectdocumentation and object code. Connect points specify the dataflow between objects whenthey are connected. Multiple connect points with independent variable lists are supported.The model code can be implemented using a language independent pseudo code and/or ascalls to external subroutines. The latter facilitates encapsulation of legacy or validated codeinto ROSE objects.
The builder or configuration editor allows the user to graphically group schematics togetherinto testable configurations by extracting the desired schematics from the ROSE database. Inthe test environment, referred to as Runtime, the user can graphically control the simulation,browse between schematics, manipulate, observe and plot variables and visualize resultsthrough object dynamics. An important feature is the ability of the user to control thesimulation through whatever soft panels are relevant to his system. The user can easilybrowse back and forth between the modeling schematic and the soft panels. On the Krskoproject CAE engineers will be using runtime and soft panels to test and integrate models priorto on-site integration with the physical simulator control room panels.
Schematics can be designed to resemble very closely the plant P&ED's and other drawings.ROSE schematics can be displayed at the instructor station and engineering simulatorworkstations. ROSE schematics are used by the instructor to insert malfunctions, localoperation actions, panel overrides and to monitor the progress of the simulation.
3.3 Advanced Models
The Krsko simulator will use ANTHEM [8] to simulate the two-phase thermal-hydraulics ofthe NSSS and COMET to simulate the core neutronics. ANTHEM is a five-equation drift fluxmodel. As on other third generation CAE simulators, draining, filling and mid loopoperations are in scope and a single model is used without switching. The nodalization forKFSS will be about 80 nodes and 100 links. COMET [9, 10] is a multi-nodal model based onhomogenization techniques. Both models are generalized, data driven models that have beenused on many previous simulators and have received wide acceptance.
What is unique about KFSS are the graphical tools associated with these models. TheANTHEM model for KFSS will be created in ROSE using the newly developedANTHEM2000 code generator [11]. The ROSE environment will provide superior datatraceability, testing and visualization to the ANTHEM model. In the case of COMET, aWindows NT GUI, referred to as CHORUS, which is used to define the model and performthe offline cycle specific data calculations, is being provided. Both tools should greatlyenhance long term maintainability for these models.
KFSS will also include severe accident modeling. The MAAP4 code will be used to simulateNSSS, core and containment response. CAE will rehost the MAAP4 code to the simulationcomputers, integrate MAAP4 with the simulator database, executive and other modelingmodifications
Nuclear Energy in Central Europe '98 341

3.4 Steam Generator Replacement and Plant Uprate
The KFSS project is a good example of pre-commissioning delivery and innovative projectplanning. KFSS is being developed in parallel with the other projects of the overall KrskoModernization program: Replacement Steam Generation (RSG) (design, manufacturing anddelivery of new steam generators), Software Services(SS) (performance of required safetyanalysis and plant operation justification at higher power and Steam Generator Replacement(SGR) (actual steam generation replacement and implementation of power uprate relatedmodifications). The RSG project is expected to be complete only in October 1999 while SSproject completion is scheduled for December 1999, far too close to the January 2000deadline imposed by the Slovenian Nuclear Safety Administration (SNSA) for the availabilityof plant-specific full scope simulator. Hence, initial simulator development is based on theexisting design. As detailed design data becomes available a second configuration based onthe design data for the upgrade will be created. In order to ensure a reliable benchmark,acceptance testing will be based on the existing design. However selected tests will berepeated using the RSG configuration and transient simulation data from a new RELAP5 inputdeck prepared as part of the RSG project. Training will be based on the RSG configuration.The project includes a post delivery update, approximately one year after simulator delivery,to take into account actual operational data from the RSG.
4. Future Trends
What does the future hold for power plant simulation ? What quantum leap will mark the startof the fifth generation ? We are expect to see the following trends:
• Computer platforms and operating systems:
We believe that the choice of UNIX vs Windows NT, and RISC vs PC-based architectures fornew fourth generation simulators is a question of the buyer's preference and cost. It is tooearly to decide if Windows NT will ultimately supplant UNIX. We expect, nevertheless, thatthe traditional RISC processor vendors will be forced to provide Windows NT options andpossibly INTEL-based products in order to be competitive.
• Best Estimate Codes:
As stated earlier, the case for the use of best-estimate codes in training simulators has notbeen made as yet. Nevertheless, we expect to see more applications of best estimate models tosimulators as computer costs come down. Parent organizations will provide Windows NTversions of the real time codes.
• Pre-commissioning delivery:
Delivery of simulators before plant commissioning is expected to become more common asnew plants are developed. Regulatory, safety and economic requirements will make thisinevitable.
342 Nuclear Energy in Central Europe '98

• Intelligent control rooms:
Up until now, developers of microprocessor-controlled control room equipment, plant processcomputers and automation systems have for the most part ignored the special requirements ofinterfacing their equipment to simulators. This has resulted in expensive custom solutions,difficulty maintaining concurrency with the actual plant equipment and sometimes loss offidelity. As these devices become more common and more complex, we expect more andmore utilities to consider simulator requirements as part of equipment selection criteria. Thuswe expect major equipment vendors will include the necessary simulator capabilities as part ofthe overall design.
With over 25 years experience in the power plant simulation industry, CAE remainscommitted to staying on top of emerging trends to ensure that the most innovative solutionsare available to its customers.
5. References
[I] Mills, D., "Nostalgia: The First Full Scope Simulator, Dresden II", Simulators IX, Volume 24, No4, Society For Computer Simulation, 1992
[2] Miettinen, J. et al "Evaluation of Two-Fluid and Drift Flux Thermohydraulics in APROS CodeEnvironment" , presented at 2nd CSNI Specialist Meeting on Simulators and Plant Analyzers, (29 Sept-2 Oct,1997,Espoo, Finland
[3] Pusta E. et al "APROS BWR Model for Transient Analysis", presented at ICONE 5, 5th
International Conference on Nuclear Engineering (26-30 May, 1997, Nice, France)
[4] Krajnc, B., Pribozic F., Novsak, M, "Plant Specific Basic Principle Simulator As A First Step ToPlant Specific Full Scope Simulator", presented at 3rd Regional Meeting Nuclear Energy in CentralEurope, (16-19 Sept 1996, Portoroz, Slovenia)
[5] American Nuclear Society, "Nuclear Power Plant Simulators For Use In Operator Training",ANSI/ANS-3.5-1998, U.S.A.
[6] International Atomic Energy Agency, "Selection, Specification, Design and Use of VariousNuclear Power Plant Training Simulators", IAEA-TECDOC, IAEA, Vienna, 1997
[7] Boire, R. "ROSE™: Nuclear Power Plant Simulation Made Easy", to be presented at InternationalNuclear Congress ENC'98, (25-28 Oct, 1998, Nice, France)
[8] Boire, R. and Salim, J. " ANTHEM: Advanced Thermal Hydraulic Model for Power PlantSimulation", CSNI Specialist Meeting on Simulators and Plant Analyzers, (Lappeenranta, Finland)Technical Research Centre of Finland, Espoo 1994
[9] Paquette, C.,Tran-Duc, H. and Friedman, F. "COMET: Reactor Core Model based on EquivalenceTheory", CSNI Specialist Meeting on Simulators and Plant Analyzers, (Lappeenranta, Finland)Technical Research Centre of Finland, Espoo 1994
[10] Paquette, C , Vivier, P., Friedman F., Koclas, J. "Real Time Advanced Nuclear Reactor CoreModel", Proceedings of the 1991 Simulation MultiConference (April 1991, New Orleans, Louisiana)Society for Computer Simulation
[II] Boire, R., Salim, G., Nguyen, M. "ANTHEM2000™: Integration of the ANTHEM Thermal-Hydraulic Model in the ROSE™ Environment", Proceedings of the 1998 Western MultiConference(January 1998, San Diego)
Nuclear Energy in Central Europe '98 343

SI0100128Nuclear Energy in Central Europe '98
4 1 S S Terme Catez, September 7 to 10, 1998
EU Nuclear Policy Towards Countries in Central and Eastern Europe
Linda GUNTER, Communications Officer
FORATOM
The European Union has undergone many changes over the last decade as a result of
both internal and external pressures. Two successive enlargements have raised the number of
Member States to fifteen. Two major Treaty reforms - the Single Act and the Treaty on
European Union - have radically modified the EU's institutional and political framework.
It was the 1993 Copenhagen European Ministers Council meeting which began the
discussion on enlargement of the EU by including as members the countries of Central and
Eastern Europe. The Madrid Council in December 1995 called on the European Commission
to submit a paper on enlargement, which includes a communication on the future financial
framework of the Union beyond 2000.
As a result, the European Commission produced a communication, "Agenda 2000: For
a Stronger and Wider Union", which outlines in a single framework the broad perspectives for
the development of the Union and its policies beyond the turn of the century. Agenda 2000
identifies political and economic factors as the main criteria for accession to the EU. Other
obligations of membership are associated with the adoption of the so-called "acquis
communautaire" or existing body of rules and legislation and it is under this obligation that
energy and nuclear safety criteria are found.
European Union energy policy rests on three pillars: competitiveness, security of
supply and environment. The energy legislation includes competition and state subsidies, the
internal energy market, nuclear energy, energy efficiency and environmental rules. The
development of Trans European Energy networks, support for energy R&D and the
Nuclear Energy in Central Europe '98 345

liberalisation of the gas market are other important elements of the Union's energy policy. In
the field of nuclear energy, the original treaty (EURATOM Treaty) has evolved into a
substantial framework of legal and political tools, including international agreements. For
example, one of these agreements is the EU-US agreement for nuclear co-operation, which
establishes a framework for trade in nuclear materials under safeguards and for scientific co-
operation on nuclear projects between the parties.
The European Union believes that enlargement will benefit the energy sector by
ensuring stability of energy supplies, research and energy efficiency on a continental scale,
and therefore make a positive impact on security and peace in the region. However the
European Union also recognises that important investments will be required to ensure that all
countries conform with EU legislation. The Energy Charter Treaty which establishes an
investment framework for the energy industry in both east and western Europe is another
important part of plans to improve the situation. The energy policy of an enlarged Union will
also need to take into account increased dependency on Russian energy resources, especially
natural gas. The economic and social consequences of mine restructuring is another sensitive
issue which will no doubt influence the establishment of an internal energy market.
Nuclear energy and safety is a topic which causes many heated debates within the
European Union institutions and especially the Parliament. The treaty which covers nuclear
energy, is the Euratom Treaty. It addresses issues of health and safety, including radiation
protection, safety of nuclear installations, management of radioactive waste; investment,
including EURATOM financial instruments, promotion of research, nuclear common market,
supplies, safeguards, and international relations. A long but somewhat misleading list, as most
Member States retain the right to set their own energy policy. A fact for which we, as the
nuclear industry, are extremely grateful. However the EU legislation is helpful in funding
common research into specific areas of reactor safety and radioactive waste programmes.
FORATOM intends to support the continued enforcement of the EURATOM Treaty because
without it, to be an economically viable industry in an EU political framework, which
includes formally anti-nuclear countries like Austria and Ireland, would be difficult if not
impossible.
How is the nuclear question and enlargement seen by EU officials?
345 Nuclear Energy in Central Europe '98

Nuclear safety in some candidate countries cause serious concern to the EU, even
independently of enlargement. The western European nuclear industry shares these concerns
and we are actively working so that safety issues at some eastern nuclear plants are urgently
and effectively addressed. The European Union's stance is that, in co operation with accession
countries, solutions should be found to these issues in accordance with the Community
nuclear legislation. We want a "nuclear safety culture", similar to that in the West, is
established as soon as possible, irrespective of EU membership negotiations. Public opinion is
likely to be increasingly sensitive to nuclear safety as a consequence of some nuclear power
plants in candidate countries, and this could affect major EU policy developments in this area.
Our recent experience with Austrian opposition to the Mochovce nuclear plant entering
operation, which involved a public hearing in the European Parliament followed by passage
of a resolution is only one example.
What does the European Union propose?
The G7 Munich summit in 1992 recommended that closure of older generation nuclear
power plants should follow the upgrade of more recent designs. This approach is reinforced in
the Commission's categorisation of plants into upgradeable and non-upgradeable reactors.
It is recognised that long-term strategies will need to be endorsed to achieve nuclear
energy legislation, exemplified by a strong safety culture and independent regulatory bodies.
The economic, security of supply and energy independence brought about by nuclear power
will need to be balanced with the existing EU legislation. And here, many issues need to be
resolved.
Environmental legislation also influences to a certain extent the debate on nuclear
energy and more specifically radioactive waste management. Given the present environmental
problems and the need for investments in the Central and Eastern European Countries, none
of the ten candidate countries is expected to fully comply in the near future. Major differences
in environmental protection between Member States and new members would significantly
affect the development of a common European environmental policy.
A number of true tasks have to be considered
Nuclear Energy in Central Europe '98 . 347

on Energy legislation :
" No applicant has its energy legislation in line with the European Union acquis
communautaire".
on Nuclear legislation :
Internationally recognised safety standards will have to be met, with the establishment
of independent safety authorities and international conventions on waste and spent fuel
must be ratified. Decommissioning costs will also have to be met in the pricing of
electricity. Adequate waste management policies will need to be implemented.
on Environmental legislation :
The European Commission warns that the environmental dimension of the next stage
of the accession negotiations will represent the greatest challenge yet. The
Commission estimates that upwards of US$135 billion will be needed to enable East
European countries to meet EU environmental standards.
The message is clear: The task at hand are immense, complex and difficult. Neither
the European Union nor the candidate countries are ready yet to move towards the goal of
enlargement. The European Union must restructure its institutions and its finances in order to
embrace enlargement and accommodate an extra 100 million new citizens. The candidate
countries may restructure their political institutions, economy, judicial system amongst other
areas in order to adopt the rules and legislation in order to become a Member State of the
Union. The nuclear industry, both in the Union and the CEECs, has an inescapable duty to
fully participate in and assist with this process.
Co-operation and communication are the key words and actions the nuclear industry
should have as underlying principles during this time of change. The nuclear industry in the
European Union has followed European Union legislation for most of its life. Through
enlargement, the nuclear industry of the central and east European countries can become part
of the European Union nuclear industry and as such, your interests will be the same as those
of the current Member States.
FORATOM is the trade association of the European nuclear industry and is based in
Brussels with a staff of 7 people. FORATOM's members are the 12 national nuclear Fora
348 Nuclear Energy in Central Europe '98

from EU Members States, Switzerland and the Czech Republic. We hope that in the near
future other central and eastern countries will join our association.
The objectives of FORATOM are:
* To organise the views of the European nuclear industry and represent them towards
European institutions such as the European Parliament and the Commission
* To act as the voice of the nuclear industry in European debates
* To communicate information back to its members
* To act as an adviser to the international institutions, like the OECD/NEA and the IAEA
In this context one of the primary roles of FORATOM is to improve perceptions of the
industry in the Institutions of the European Union, especially the European Parliament and the
European Commission. A further role is to act as the voice of the industry in European policy
debates which may affect the industry. The main mechanism to accomplish these tasks is
through Working Groups. The four current working groups have representatives from a
variety of industrial sectors, who are nominated by their national Fora. These are Strategy,
Transport, Civil Liability and Quality Assurance working groups.
These working groups are formed by nominations of corporate representatives from
the national Fora. The working groups are currently covering a variety of different subjects
like the role of nuclear energy for sustainable development, the enlargement of the European
Union to include central and eastern European countries and how this may affect nuclear
safety assistance programmes, to topics within the 5th Framework Programme on Research
and Development, which is the only EU financed programme for nuclear R&D.
FORATOM publishes position papers on these issues and distributes them widely
within the Institutions of the European Union. Recent position papers include subjects like
* the views of the nuclear industry on renewable energy sources
* the role of nuclear energy in helping prevent greenhouse gas emissions
* harmonisation of transportation safety standards
Nuclear Energy in Central Europe '98 349

* nuclear safety cooperative programmes in CEECs regarding the TACIS and Phare
programmes
FORATOM also publishes a newsletter for Members of Parliament and officials of the
European Commission on current events in the industry, a monthly bulletin on the work of the
Secretariat, and a yearly Almanac which surveys the entire industry, and occasional Fact
Sheets and briefing notes. The trade association of the European nuclear industry also has an
internet site where information about the European industry and recent press releases can be
consulted.
Despite all activity, much more effort is necessary. FORATOM's limited resources,
mean that we can not be in contact with every Member of the European Parliament and we are
unable to issue our publications in more than three languages. FORATOM hosts dinner-
debates three times a year on a variety of subjects such as advanced technologies for nuclear
energy R&D, and nuclear safety in eastern European plants. This later event, which
FORATOM hosted last year involved a joint invitation to Members of the European
Parliament and the Council of Europe, which includes many representatives from Parliaments
of Central and Eastern European countries.
To conclude, FORATOM is working to help the institutions of the EU understand the
situation of nuclear energy in each of the candidate countries and welcomes parties to join us
in this effort.
350 • Nuclear Energy in Central Europe'98

SI0100129
Nuclear Energy in Central Europe '98
Terme Catez, September 7 to 10, 1998
Twenty years of operation of WWER 440/230 Units inJaslovske Bohunice.
Jozef TomekSlovenske elektrarne a.s., 919 31 Jaslovske Bohunice
Slovak RepublicE-mail: [email protected]
Phone: +421 805/591 501, Fax: +421 805/591 527
ABSTRACTIt is twenty years this year since the first unit WWER 440 of Slovak Nuclear Power Plant Jaslovske
Bohunice was commissioned. There are four units WWER 440 in operation at Jaslovske Bohunice site. Firsttwo units of older soviet PWR design V-230 (also known as V-1) and other two units of newer V-213 type (alsoknown as V-2). The goal of this presentation is to summarize and evaluate the operation of Unit 1 and 2 forthis period of time and mainly to describe what has been done and what is planned to be done to increase thenuclear safety and operational reliability of both units. The operating organization and regulatory authorityassume that an internationally acceptable level of safety will be reached by accomplishing of the upgradingprogramme.
1. General overview
The Slovenske elektrarne, joint stock company (SE) is the dominant electricity generatorin the Slovak Republic (SR) with a total installed generating capacity of 6,147 MW at the endof 1997, which represents approximately 86% of the total installed capacity of power plants inthe SR [Fig.l]. In the year 1997 SE generated in their own sources 21,170 GWh, from which51 % at nuclear, 29 % at thermal and 20 % at hydro-electric power plants. The import ofelectricity represented 14% of total electricity consumption of Slovak Republic.
Figure 2 shows the power sources of SR including two NPP sites:
• four WWER 440 units in operation at Jaslovske Bohunice site. First two units of oldersoviet PWR design V-230 (also known as V-1) and other two units of newer V-213 type(also known as V-2).
• one unit in trial operation (full power reached in August 1998), one unit to be commissionednext year and two units under construction at Mochovce site (4 units WWER 440/V213),
Nuclear Energy in Central Europe '98

Total Instated Capacity in Slovakia7147MW
Sources of Distribution
SE, as. - Hydro PP2369 MW
SE, as.-Nuclear PP
SE, i •>. rhemiai PP2018 MrV
a u <••*' •
Majwibsffl
HMOvsk^Uar^n nCfc'nvVifl
"mermal Power Plant n Hydro pcwr plant
Hearing Plant O Dispatching Centre
Nuclear povwr plant ^ SE Headquarters
NPP undercommlssjonnlng
Rachwste treatment Facility
Fig. 1 Share of power sources in Slovakia Fig. 2 Power sources of SR
1.1 Main goals of Slovenske elektrarne a.s.Management of Slovenske elektrarne, aware of dominant position of company on
Slovak energy market, declared the main company goals, which include following targets :
® safe, ecological, reliable and economical operation of electric and heat energysources and power system
® ensure - in accordance with governmental program of economy development -balanced consumption and production of energy (do not exceed 15 % share ofelectricity import)
© increase safety of nuclear sources and keep them on an internationally acceptablelevel of nuclear safety
a apply Least Cost Planning methods in development plans and design energy sourceswith reasonable costs for future
« decrease long term ecological impact in according with international commitments ofSR
® intensify co-operation between UCPTE and CENTREL countries and graduallyintegrate power system of EU and Slovak Republic
Among the most important power sources of SE, a.s. belong the WWER 440/230 units inJaslovske Bohunice. In Table 1 the information of their commissioning schedule and the totalelectricity produced till 1997 is given.
Table 11- * J
*" L
Unitl
Unit 2
17.12.1978
01.04.1980
26.03.1980 . 52 335
01.01.1981 50 348
The operation of these units has been safe and reliable since their commissioning. Theyprovided by now a reliable contribution to the country's power supply without any accident oroff-site impact (all reported operational events were reviewed by IAEA ASSET mission in1990 and ranked according to the INES scale). This statement can be supported by the fact
352 Nuclear Energy in Central Europe '98

that since 1990, when the ASSET operational event investigating methodology was adoptedby the plant staff, no INES level 2 and above happened. Figure 3 shows the total number ofoperational events at both units evaluated as INES 1 for this period of time. Site managementalso adopted this parameter among its main safety and operational indicators. The target forthis year is not to exceed the value one INES level 1 event per unit which corresponds with thedecreasing tendency clearly visible on Fig. 3.
V)
•£>
HiJQ
Number of INES 1 events on unit 1 and 2
1990 1991 1992 1993 1994
year
1995 1996 1997
Fig. 3 Total number of operational events evaluated as INES level 1 on unit 1 and 2.
2. Bohunice V-1 Units Nuclear Safety Upgrading
Management and staff of the Bohunice NPP were always aware of their responsibility forthe safe operation and understand the nuclear safety as a continuous process. Out of thisreasons, safety improvements and equipment modifications have been performed just since theplant commissioning. More than 1200 minor or major modifications were implemented.Increased effort for safety upgrading of Unit 1 and 2 started in middle 80-ties, when the firstbackfitting programme, focused mainly on the RPV irradiation embrittlement decrease(installation of shielding assemblies around the core, using of so-called low-neutron-leakagefuel loading, measures to reduce thermal stress of the reactor pressure vessel duringoperational transients, etc.) and on improvements in fire protection area, was developed andexecuted.
After the political changes in former Czechoslovakia in 1989 the country opened for thecooperation with foreign bodies. Since 1990 twenty specific safety missions reviewed thestatus of the NPP both in the design and operational area. In 1990 IAEA initiated a programmeto assist the countries of central and eastern Europe in evaluating the safety of the firstgeneration WWER-440/230 NPP's. Major design and operational safety issues were identifiedand gathered in the document TECDOC-640 ,,Ranking of safety issues for WWER-440/230
Nuclear Energy in Central Europe '98

NPP's". As a result of findings, recommendations and suggestions for further safety upgradingprogrammes were adopted.
According to decision No. 5/91 issued by the regulatory authority of formerCzechoslovakia, so called ,,Small reconstruction programme" was performed at Unit 1 and 2between 1991 and 1993 with total investment of USD 67 million eighty-one improvementswere performed within this programme both in design and operational field and considerablyimproved the safety of both units. The programme included:
• annealing of reactor pressure vessels of both units,
• validity verification of the LBB (Leak Before Break) method including the seismicupgrading of the equipment,
• improvement of confinement leaktightness,
• installation of fast-closing isolation valves at the steam generator steamlines,
• installation of diagnostic systems at the primary and secondary circuit equipment,
• reconstruction of the containment spray system delivery lines,
• interconnection of emergency core cooling systems of both units,
• reconstruction of pressurizer safety valves and installation of pressurizer relief valve,
• installation of emergency control room panels,
• reconstruction of the self consumption electric system including the installation of anadditional diesel generator and an accumulator battery,
• replacement of the fire signalization system, extension of the stable fire extinguisher systemand fire resistance upgrade - replacement of cables with fire-proof ones, covering of the fireprotective walls and cables with non-flammable material,
• emergency operating procedures and surveillance programmes development,
• development of level 1 probabilistic safety assessment study,
Slovak regulatory authority issued decisions No. 1/1994 and 110/1994 based on theSafety Analysis Report elaborated in the frame of the ,,Small reconstruction programme" andother technical sources listed below:
• Preliminary Safety Analyses Report for Gradual Reconstruction,
• "Ranking of Safety Issues for WWER 440 model V-230NPPV IAEA - TECDOC 640,
• "Bohunice V-l Major Safety Upgrading" IAEA consultant's meeting report,
• IAEA report - "A common basis on which the safety of all operating nuclear power plantsbuilt to earlier standards can be judged",
• Report of IAEA consultant's meeting "On containment and confinement performance inNPP^s with WWER 440/213 and 440/230",
• Report of the IAEA consultant's meeting "Major improvements for WWER 440/230NPFs",
• PSA level 1.
354 Nuclear Energy in Central Europe '98

In decisions No. 1/1994 and 110/1994 requirements for further improving wereexpressed and the future operation of both units was conditioned by fulfillment of prescribedrequirements. Only in case when they are met, the regulatory authority issues the license foroperation which is valid one year. Basic Engineering for major reconstruction was preparedand so called ^Gradual reconstruction programme" started in 1996 and should by finished in1999. The REKON consortium formed by Siemens KWU Group and the Slovak researchinstitute VUJE a.s. is the main supplier of this reconstruction programme with total estimatedcost of approximately USD 180 million. The Bohunice NPP intends to meat the followingtargets by the realization of this programme:
a) deterministic targets:
• to cope with the newly defined maximum Design Bases Accident LOCA 2 x § 200 mm by aconservative approach and coping with Beyond Design Bases Accident LOCA 2 x (j) 500mm by best estimate method,
• the confinement leaktightness and accident localization systems must assure that the doseequivalent is less then 50 mSv for the whole body and 500 mSv for the thyroid in case ofDBA and the dose equivalent is less then 250 mSv for the whole body and 1500 mSv forthe thyroid in case of BDBA in the controlled area,
to finish the seismic upgrading of all safety and safety related systems and constructions towithstand 8°MSK-64 scale with horizontal acceleration 250 cms"2 and vertical acceleration 130cms'2.
b) probabilistic targets:
• the failure probability of safety systems 1 0 ° / per demand or less
• the failure probability of automatic reactor trip system 10 "5 / per demand or less
• severe core damage probability (CDF) 10 "4 / reactor year or less
The V-l units safety upgrading process is carried out gradually during extended outagesand general overhauls within 1996-1999 (this is why it is called ,,Gradual Reconstruction"),and includes, among others, the following safety improvements:
• increasing of reactor coolant system integrity,
• confinement leaktightness improvement and installation of isolation valves at the hermeticzone boundary pipes (the improvement brought about so far is evident from Fig. 4),
6000 Last results:April '96 Unit 1 • 59
07 Unit 2 - 5 1
V) < t£O 3 WQ. Ifi X
1991 1993
Fig. 4 Confinement of the Bohunice V-1 unitsleaktightness improvement
strength improvement of the hermeticzone structures to withstand maximumoverpressure during LOCA 2 x O 500mm, backfitting of the accidentlocalisation system to cope withaccidents within the confinement,
modifications of the emergency corecooling system including residual heatremoval in case of a seismic event andprovisions for a sufficient boric acidconcentration in the reactor coolant
Nuclear Energy in Central Europe '98

system (separation to 2 x 100% ) and possibility of primary side Bleed and Feed heatremoval,
spray systems modifications (separation to 2 x 100 %),
secondary side Bleed and Feed introduction (improvements of emergency feed-watersystems and installation of the steam generators steam dump stations),
building up the essential service water system for safety related systems,
installation of digital RTS, ESFAS, reactor power control and power limitation system,replacement of in-core temperature and neutron flux measurements,
hydrogen detection system and hydrogen recombinators installation,
implementation of safety improvements on electrical systems - motor generatorsreplacement, diesel generators control and excitation system upgrading, emergency ACpower supply possibility from Hydro plant Madunice (third grid)
significant seismic upgrading of key safety equipment,
implementation of measures in the fire protection area
ventilation systems modifications and installation of new ones
Fig. 5 shows results of PSA Level 1 studies for the individual safety improvements stagesof the initial project of V-l units. After the gradual reconstruction including theimplementation of symptom-oriented emergency procedures (SOEP), the CDF calculated valueis 5,39 E-05 per reactoryear.
Initial level After Small Basic Upgraded BE SOEP•12/1991 RECO Engineering Implemented
12/1993 12/1999
Fig. 5 Results of the PSA Level 1 studies of Bohunice V-1 units and
reconstruction objectives
Certain projects have a general effect on the entire Bohunice site, as evident from thefollowing implemented projects:
• Quality Assurance Program and Personal Training Program - in co-operation with theNuclear Electric Pic. and funded by the UK government
356 Nuclear Energy in Central Europe '98
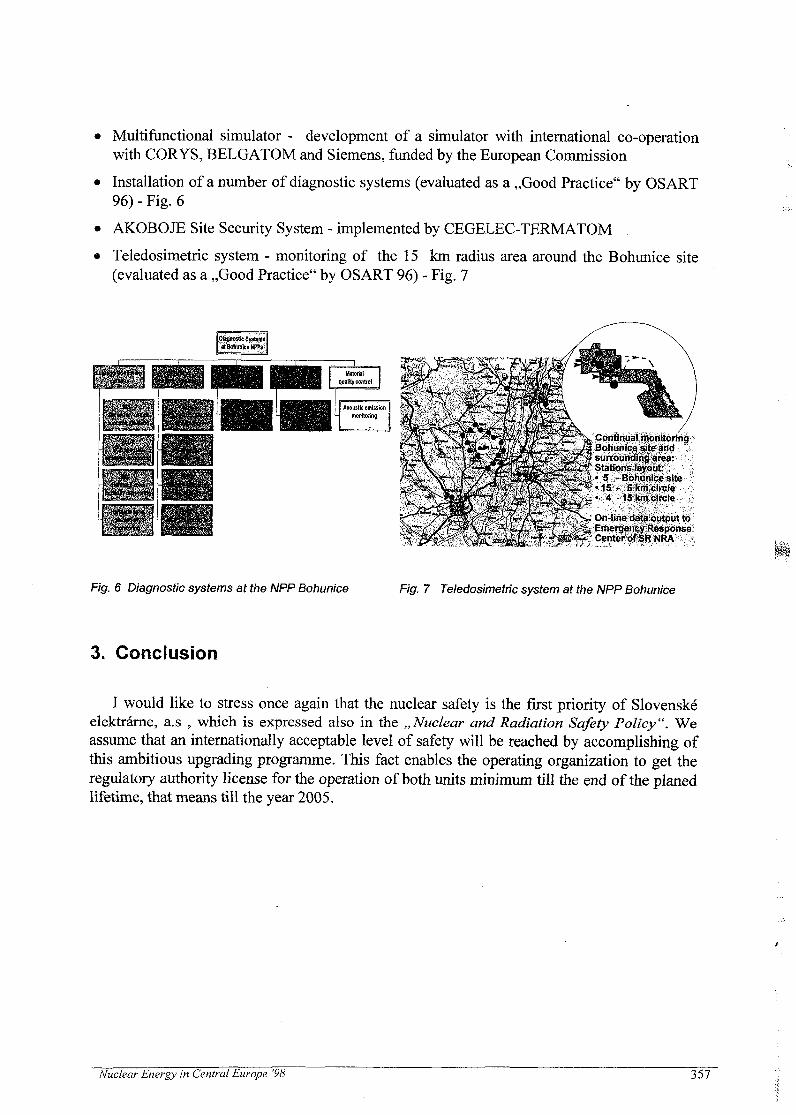
Multifunctional simulator - development of a simulator with international co-operationwith CORYS, BELGATOM and Siemens, funded by the European Commission
Installation of a number of diagnostic systems (evaluated as a ,,Good Practice" by OS ART96) - Fig. 6
AKOBOJE Site Security System - implemented by CEGELEC-TERMATOM .
Teledosimetric system - monitoring of the 15 km radius area around the Bohunice site(evaluated as a ,,Good Practice" by OSART 96) - Fig. 7
Continual monitoringBohunice site andsurrounding area;Stations layout:• 5 - Bohunice site•15 <• 6 km circle• 4 -15 km circle
: On-line data output toEmergency ResponseCenter of SR NRA
Fig. 6 Diagnostic systems at the NPP Bohunice Fig. 7 Teledosimetric system at the NPP Bohunice
3. Conclusion
I would like to stress once again that the nuclear safety is the first priority of Slovenskeelektrarne, a.s , which is expressed also in the „Nuclear and Radiation Safety Policy". Weassume that an internationally acceptable level of safety will be reached by accomplishing ofthis ambitious upgrading programme. This fact enables the operating organization to get theregulatory authority license for the operation of both units minimum till the end of the planedlifetime, that means till the year 2005.
Nuclear Energy in Central Europe '98 357
SI0100130
Nuclear Energy in Central Europe '98
Terme Catez, September 7 to 10, 1998
Operational and Safety Status of Krsko NPP
Predrag Sirola, Darko KavsekNukleama elektrarna Krsko
Vrbina 12, 8270 Krsko
ABSTRACT
Nuclear Power Plant Krsko (NEK) is producing electricity with the high level ofreliability, safety and at acceptable price for 17 years. Energy is shared between bothSlovenian and Croatian grid.
The specifics of sharing the initial investment costs, later covering the operations costsand energy supply between Croatia and Slovenia is causing specific decision makingproblems about energy cost and future investments, however not influencing the plant safety,by now.
NEK is continuously following the international nuclear technology practices,standards' changes and improvements and introducing them into the processes and equipmentupgrades. As the member of the most important international integrations, NEK is having thepossibility of sharing its experience with others.
Slovenian Energy Consumption and Supply Strategy is recognizing the NEK as a longterm supply of energy in Slovenia being a strong decision making base for the future.
According to the above mentioned Slovenian Energy Consumption and SupplyStrategy the plant is obliged to keep all the radioactive waste, produced during the plant life,on site. The extensive efforts are taking place to reduce the radioactive waste production andsave the area available for temporary waste deposition.
The plant is licensed for the period of 40 years of commercial operation which startedin 1983, so the Life Time Management is getting more and more important, including theperformance tracing of the essential components, their maintenance and surveillanceprograms and also replacement plans of critical equipment.
The major problems the NEK is confronted with at the moment are the SteamGenerators which are reaching their end of life, and a very limited radioactive waste storagearea. They are excerting influence on the plant availability and operations and maintenancecosts.
At the moment the process of Modernization is in progress, covering the SteamGenerators replacement and a Plant Specific Simulator supply. Those are the investments thatare driven by the strategy of the long term operation until the end of the plant's life.
Nuclear Energy in Central Europe '98 359

INTRODUCTION
NPP Krsko (NEK) is running its 15th fuel cycle and during the 17 years of operationhas supplied over 68 TWh of energy to the electrical power grids of Slovenia and Croatia asthe biggest energy supplier to those systems.
The latest period of operation has been recognized as a very stable. Obviously theplant has reached operational and organizational maturity, which guarantees a reliable sourceof energy also for the times coming. The initial years of operation have brought the extensiveexperience and knowledge. Most of the problems from the first phase of operation have beenovercome and prerequisites for stable plant operation have been reached. The organizationalstructure and work processes have developed in accordance with standards and practices usedin countries with advanced nuclear technology. It is now our duty to look for furtherimprovements. The plant has entered the second third of its lifetime and preparations for thefinal phase of operation have to be started.
The construction of the plant began on 1 February 1975. The plant became a nuclearfacility in May 1981, when the initial core was loaded. The first criticality was achieved inSeptember 1981. On 2 October 1981, the generator was synchronized to the grid for the firsttime. In August 1982 the plant reached the 100% power level. On 1 January 1983, the plantstarted its commercial operation. The average availability factor since the start of commercialoperation is above 81%, while the load factor is above 77%. The cumulative forced outagerate is only 1.6%.
The specifics of sharing the initial investment costs, later covering the operationalcosts, and sharing the energy produced between Slovenia and Croatia is causing specificdecision making problems about ownership, energy cost, business decisions and futureinvestments, but has however not been influencing the plant safety by now.
Slovenian Energy Consumption and Supply Strategy, recognizing the NEK as a long-term source of energy in Slovenia, has been a strong decision making base for the plant'sfuture. It requires that prerequisites to Krsko shutdown be adopted at least 10 years inadvance.
PRIORITY TO SAFETY
NPP Krsko's policy is that all individuals concerned shall constantly be alert toopportunities to reduce risks to the lowest practicable level and to achieve excellence in plantsafety. One of the most important objectives is to protect individuals, society and theenvironment by establishing and maintaining in the nuclear power plant an effective defensemechanisms against radiological hazard. Accident prevention is the primary safety priority ofNPP Krsko. It is achieved through the use of reliable structures, components, and systems,well-defined processes supported by procedures and plant personnel committed to a strongsafety culture.
In order to justify the current levels of safety of the plant by comparing it with currentsafety standards and practices and to confirm that the plant is at least as safe as originallyintended, we performed systematic compliance review with United States regulatoryrequirements issued since 1975. As a result of the compliance review more than 80% ofoverall items evaluated have been resolved and additional 10% is under implementation.
During plant operations no. event with a significant off-site or on-site impact hasoccurred. According to the International Nuclear Event Scale (levels from 0 to 7) NPP Krskohas never experienced events above level 1. This means that sufficient defense in depth todeal with additional failures has remained and the plant remains fully safe.
Nuclear Energy in Central Europe '98

A nuclear safety overview is achieved through the functioning of various committeesand departments such as Krsko Operating Committee, Krsko Safety Committee, IndependentSafety Engineering Group and Radiation and Environmental Protection Committee.
PERFORMANCE INDICATORS
In order to enhance positive competition and comparability with other operating unitsin the world, NPP Krsko is using a standard set of World Association of Nuclear Operators(WANO) performance indicators and, in addition to those, some established internally to givea better quantitative overview of the plant performance.
The WANO performance indicators are intended principally for plant management toenable it to better trend performance and progress, to set challenging goals for improvement,to gain additional perspective on performance relative to other plants, and to provide anindication of the potential need to adjust priorities and resources to achieve improved overallplant performance.
Operating results and performance indicators achieved confirm that the plant isproducing electricity with a high level of reliability, safety and at an acceptable price, inaccordance with nuclear regulations and positive industry practices. In 1997 we exceeded theWANO goal which is set for each indicator by six out often WANO performance indicators:unit capability factor, unplanned capability loss factor, unplanned auto scrams per 7000 hourscritical, collective radiation exposure, safety system performance (high pressure safety systemperformance, auxiliary feedwater system performance, emergency AC power systemperformance), and chemistry index.
Conservatively estimated dose burden received by a member of the reference (critical)population group as the result of NEK emission is less than 1% of the annual dose received onaverage from natural and artificial sources by a member of the general public in normalenvironment.
EXPERIENCE EXCHANGE
NEK is continuously following the international nuclear technology practices,standards changes and improvements, and introducing them into processes and equipmentupgrades. As a member of the most important international integrations, NEK has enjoyed thepossibility of sharing its experience with others (World Association of Nuclear Operators -WANO, Institute of Nuclear Power Operations - INPO, International Atomic Energy Agency- IAEA, Nuclear Operations Maintenance Information Service - NOMIS, NuclearMaintenance Experience Exchange - NUMEX, Electric Power Research Institute - EPRI,Westinghouse Owners Group - WOG, etc.).
Voluntary activities and good practices related to safety are achieved by internationalmissions (IAEA Assessment of Safety Significant Events Team - ASSET, IAEA OperationalSafety Review Team - OSART, WANO Peer Review, International Commission forIndependent Safety Analysis - ICISA) and operating experience exchange programs throughinternational organizations.
Those missions are promoting the highest levels of excellence in nuclear power plantoperation, maintenance and support. Following each mission a written report of strengths andareas of improvement noted by the visiting team is provided to the management staff in orderto help define further safety goal improvement.
Nuclear Energy in Central Europe '98 361

PROCESSES
All the activities going on in the plant are defined through processes, which integratedifferent organizational units with the main goal to support a safe and reliable plant operation.
The most important one, running well, is the operation process. It is the mostdeveloped process, historically carefully conducted, upgraded and supported by training withmuch of experience exchange information. Nowadays, during the long periods of stableoperation, it is getting more and more important but also very hard to keep the operators ingood condition, and ready to act in delicate situations requiring proper decisions andresponses in a short time. It will become possible by the introduction of a specific plantsimulator, a replica of an existing control room. That will be the tool which will help theoperators train how to act, communicate and use the procedures in different normal andoffnormal situations, plant operating evolutions and transients.
The maintenance process was improved in previous years with clear goals to bereached in the near future. Well-organized maintenance with high quality performance,experience and attention to details resulted in reliable operation with high plant availability.Great efforts are devoted to good component condition and area cleanliness positivelyaffecting the professional attitude of all the personnel performing the activities in the plant.Shortening of outages to less then 35 days has been possible by performing a part ofmaintenance and other activities on-line, during plant operation. Even shorter outages can beachieved after the Steam Generators replacement, when tube inspections and correctiveactions will be significantly shorter.
The modification process is continuously, step by step, implementing improvements inplant technological processes and systems, introducing new industry practices into NEK.Better solutions coming also from in-house experience are additionally improving the plantsafety and reliability.
The procurement process is getting more and more challenging because of changes inthe market and the disappearance of the initial and qualified vendors for plant componentsand spare parts.
Significant improvement was made with the erection of the new warehouse buildingand the transfer of spare parts and materials from the old one. Thereby some very importantachievements were obtained. Every moved item was checked by users from maintenance,which provided an opportunity to discard inadequate pieces. New software for the warehousestatus control has been developed giving a better overview of the warehouse stocks.Conditions for keeping sensitive items and chemicals have been established and storage areaconditions and layout of the shelves have been generally improved, which makes the dailyactivities more accurate and easy.
The operating experience program has been in effect for five years, and was recentlyvery extensively promoted and supported by international organizations.
The plant goal for operating experience is to effectively and efficiently use lessonslearned from industry and plant operating experience to improve station safety and reliability.Learning and applying lessons from operating experience is,an integral part of plant cultureand is encouraged by managers throughout the organization. Through the operatingexperience process an in-depth analysis of nuclear operating experience is provided, whichallows applying lessons learned in the industry for NPP Krsko's benefit as regards nuclearsafety and reliability improvement.
In response to licensing Amendment issued by Slovenian Nuclear regulatory body in1991, NPP Krsko performed a Probabilistic Safety Analysis (PSA) study. The PSA studycontains Internal Initiating Events Level 1 and Level 2, Seismic Level 1 and Level 2, Internal
362 . Nuclear Energy in Central Europe'98

Fire Level 1 and Level 2, PSA for internal flooding and other external events as well as PSAfor shutdown modes based on the EPRI Outage Risk Assessment and Management (ORAM)methodology. ORAM is being effectively applied as a decision making tool to help evaluateequipment outages both at shutdown and during power operation (on-line maintenance). Thedeterministic portion of ORAM is used to model the NPP Krsko Shutdown TechnicalSpecification and administrative considerations. The probabilistic portion of ORAM usesindustry and NEK specific initiating events and other risk elements pertaining to shutdown toderive a quantitative risk assessment for various end states, including core damage and RCSboiling.
PROBLEMS
The status between the original founders of NPP Krsko has not been finally defined,which has a negative influence on the public acceptance of the plant and on employee feelingsat a time when the plant is operating very well and stably. It is expected that an agreementbetween all the parties involved must be reached in the near future to support safe and reliableplant operation.
The major technical problems NEK is confronted with at the moment are the SteamGenerators reaching their end of life, and a very limited radioactive waste storage area. Theyare influencing the plant availability and operations and maintenance costs.
Steam generators replacement planned for the year 2000 is going to solve some highlyimportant issues affecting long term operation. Maintenance costs will be significantlyreduced, availability of the plant will be higher because of shorter outages, plant output willbe increased, collective doses of the workers will be reduced, and the probability of tube leakwill be minimized.
According to the above mentioned Slovenian Energy Consumption and SupplyStrategy, the plant is obliged to keep all the radioactive waste produced during the plant lifeon site. Extensive efforts are being made to reduce radioactive waste production and save thearea available for temporary deposition of low and intermediate level waste. An action plan isbeing prepared to increase employee awareness of the waste storage area problem. The plantis looking for work practices that lead to waste reduction. Waste processing technology is alsobeing improved by the construction of In Drum Drying System that is significantly reducingthe volume of evaporator concentrate waste and spent resins. Also the existing wasteprocessing equipment is being improved. All of this, in conjunction with campaigns forreduction of already existing waste, is expected to enable plant operation with the samecapacity of the waste storage area.
The Spent Fuel Capacity is sufficient (operation at full power) up to year 2002.Activities have already started to increase the capacity of the Spent Fuel Pool to get enougharea for spent fuel storage for the plant lifetime.
PUBLIC RELATIONS
NPP Krsko has established a public information program to build up confidencebetween the public and those involved in nuclear power generation. We set up permanentexhibition in visitor center in Krsko. In addition we organize tours of the NPP for particulargroups. Our nuclear professionals introduce approximately 4500 visitors per year (65% ofthem are school children and students) to nuclear activities and specifics. In the local
Nuclear Energy in Central Europe '98 363

community we are presented by a cable TV channel with essential nuclear power plant datasuch as radiological effluents, status in radioactive waste storage, thermal pollution data, etc.By all those activities we build up high confidence and acceptance in the public.
FUTURE PLANS AND GOALS
At the moment a process of Modernization is in progress, covering Steam Generatorsreplacement and a Plant Specific Simulator delivery. Those are investments driven by thestrategy of long-term operation until the end of the plant's life.
The plant is licensed for the period of 40 years of commercial operation, so the LifeTime Management is getting more and more important, including performance tracking of theessential components, their maintenance and surveillance programs and also replacementplans for critical equipment.
Another issue is the knowledge conservation or its transfer from experienced workersto new ones, supporting the fluctuation of the plant staff and making the processes lessvulnerable to the retirement of the personnel. This is accomplished through the developmentof programs for different areas of plant activities, and writing implementation procedures forall plant processes. Additionally, training for the entire key personnel affecting the plantoperation has to be improved in the near future.
CONCLUSIONS
The plant is operating in a safe and reliable way, and is ready to deliver energy untilthe end of projected life.
Modernization is necessary and it is additionally improving long term and profitableplant operation.
It is expected that an agreement between the original founders of NPP Krsko must bereached in the near future to support safe and reliable plant operation.
With the plans and goals established, NPP Krsko is ready to operate in accordancewith the highest technology standards at least until the year 2023.
References:
1. Performance Indicators for the year 1997, Krsko NPP2. Resolucija o strategy i rabe in oskrbe Slovenije z energijo
354 Nuclear Energy in Central Europe '98

SI0100131
Nuclear Energy in Central Europe '98
A S S ^ Terme Catez, September 7 to 10, 1998
NPP TEMELIN INSTRUMENTATION AND CONTROL SYSTEMUPGRADE AND VERIFICATION
OLGA UBRASKODA PRAHA.a.s.Milady Horakove 109
160 41 Prague 6
JOSEF PETRLIKENERGOPROJEKT PRAHA
Bubenska 1170 05 Prague 7
CZECH REPUBLIC
ABSTRACTTwo units of WER 1000 type of the Czech nuclear power plant Temelin, which are under constructionare being upgraded with the latest digital instrumentation and control system delivered by WEC. Toconfirm that the functional design of the new Reactor Control and Limitation System, Turbine ControlSystem and Plant Control System are in compliance with the Czech customer requirements and thatthese requirements are compatible with NPP Temelin upgraded technology, the verification of the controlsystems has been performed. The method of transient analysis has been applied. Some details of theNPP Temelin Reactor Control and Limitation System verification are presented.
1. INTRODUCTION
There are four pressurised water reactors of the VVER 440 type under operation and twopressurised water reactors of the VVER 1000 type under construction in the Czech Republic atpresent. Nuclear generated electricity represents about 20% of total production and this sharewill grow up to 40% after two 1000 MW units of Temelin NPP start to operate.Construction of the NPP Temelin VVER 1000 units has continued with the upgrading of theoriginal design. The Temelin upgrading program includes the modernisation of all parts of theNPP, which could negatively influence the future license issue. The following innovations havebeen implemented:• Modernisation and upgrading of the instrumentation and control systems including the
reactor protection system and engineering safeguard features,• Fuel replacement and modification of the reactor core,• New diagnostic system,• Innovations of some components and subsystems of the primary and the secondary
systems,• Design and construction of a full scope simulator,• The improvement of safety documentation.The US company Westinghouse Electric Corporation (WEC) was selected for the delivery ofthe instrumentation and control system, primary side diagnostic system and nuclear fuel.
The instrumentation and control system upgrade includes:• Primary Reactor Protection System (PRPS) and Diverse Protection System (DPS),
Nuclear Energy in Central Europe '98 365

• Reactor Control and Limitation System (RCLS),• Plant Control System (PCS) and Turbine Control System (TCS),• Post Accident Monitoring System (PAMS),• Incore Instrumentation System (IIS),• . Unit Information System (UIS),• Main Control Room (MCR), Emergency Control Room (ECR) and Technical Support Center
(TSC).The WEC Eagle Family microprocessor based system is applied for the safety related systems(PRPS, RCLS, PAMS) and for the systems that are non-safety related (PCS, TCS, IIS, UIS,MCR, ECR, TSC) the Westinghouse Distributed Processing Family microprocessor basedsystem is used. All instrumentation and control systems are interconnected by a network ofcommunication data interface highways WESTNET II, WESTNET III .
The detailed requirements on the functional design of the RCLS, TCS and PCS have beenspecified by the Czech specialists. To confirm that these functional requirements arecompatible with existing plant systems, components and technology and that RCLS, TCS andPCS are in compliance with customer requirements, the Czech experts apply the method ofdynamic simulation and transient analysis.Using both full scale simulator and the dynamic plant model of EGP the specialists of the CEZ,SKODA and EGP companies have evaluated the performance of RCLS, TCS and PCS duringthe normal operation and anticipated transients. A brief outline of the Temelin control systemphilosophy and functional design and some details of its verification follows, next.
2. REACTOR CONTROL AND LIMITATION SYSTEM
Reactor Control and Limitation System is a high integrity system that must automaticallymaintain key process variables within a normal operating region well below the safety limits.The RCLS consists of three major functional parts with the following priorities:
• the limitation functions (Limitation System),• the coordination functions (Control Coordinator),• the reactor control functions (Reactor Control System which includes main safety related
control systems and subsystems).
Limitation System (LS)
The main objectives of the LS are the enhancement of defense in depth and the prevention ofprotection system actuation in the event of a series of upsets specified by Czech customer.The LS directs the action of the Reactor Control System in response to a specified set of plantcomponent failures or electrical grid upsets. This response is characterised by one or more ofthe following actuations:• Actuation ,,b"- the LS logic blocks automatic or manual withdrawal of the control rods,• Actuation ,,a"- the LS logic actuates a control rod bank insertion at the maximum controlled
speed,• Actuation ,,c"- the LS logic actuates a full trip of one bank of control rods,• Actuation ,,d"- the LS logic actuates a full trip of several banks of control rods (in the early
operation period the full trip of all control banks is assumed)All Limitation System actuations override manual rod control.The LS contains more than sixty limitation functions and each of them is specified by logicalalgorithms. Many of LS functions resulting in actuation ,,a", "c", ,,d" are interlocked, so that theyare active only above a specified reactor power. The remaining LS functions requiring control
3(56 Nuclear Energy in Central Europe '98

rod insertion do not require reactor power interlock and remain active until initiating conditionclears.Detailed functional requirements (logical algorithms) for the Temelin limitation system as well asthe list of anticipated upsets were specified by the Czech customer. Recently all LS functionshave been simulated by the Czech analysts and compatibility with plant technology has beenanalysed.
Control Coordinator (CC)
The Control Coordinator represents a quite new approach in the NPP control philosophy andtherefore it will bee discussed in more details.The CC provides system management and coordination. It identifies the requirements of thevarious systems and subsystems and links the systems together to obtain appropriateoperation of the plant from shutdown conditions to full power. It generates signals that modifyoperation of plant systems in response to the plant conditions and to the requirements of theelectrical grid.The CC manages the reactor and turbine control modes and provides interfaces between theReactor Control System, Steam Dump Control System and the Turbine Control System. Itinitiates the transition between system statuses as required during transients and for the startup and shut down.There are 6 possible reactor modes and 6 possible turbine modes, as follows:Reactor modes:• Manual control on control rod position RUR
• Automatic control on reactor power NR
• Automatic control on main steam collector pressure PR
• Automatic control on primary coolant average temperature TR
• Limitation system (automatic and manual control is not possible)• Reactor trip (reactor trip breakers open, rod control is not possible)Turbine modes:• Manual control RUT
• Automatic control on turbine power NT• Automatic control on main steam collector pressure PT
• Automatic control on turbine speed ST
• Fast Valve Control RRV• Island operating mode OSTEach control mode combination in conjunction with other plant operating conditions defines aunique system status. The transition allowed between the system statuses are defined in thetransition matrix. Using the system status transition matrix, the Control Coordinator is able toprovide systems management in the events of the change of plant operating conditions,operator input and in the event of the actuation of the LS. The LS actuations ,,a", ,,c", ,,d" willblock the selection of all reactor power control modes until the reactor power level has beenreduced to a defined safe power level.
The Control Coordinator is the central location for three main unit set point controllers and unitpower set point calculations. These include:• Main Steam Collector Pressure Set Point Controller which provides the main steam collector
pressure reference set point used by the Reactor Control System, Turbine Control System,and Steam Dump Control system,
• Reactor Power Set Point Controller which provides reactor power reference set point usedby the Reactor Control System,
• Primary Coolant Temperature Set Point Controller which provides the primary coolanttemperature reference set point used by the Reactor Control System.
Nuclear Energy in Central Europe '98 367

The turbine power reference set point is calculated in the TCS but the Control Coordinatorprovides interfaces to the Turbine Power Set Point Controller in the TCS.
There are still some additional functions performed by the Control Coordinator.• Management of the remote dispatching interface in the TCS, while the turbine is in mode NT.
The remote dispatching interface allows a dispatcher to change the target load referenceand to coordinate the operation of NPP Temelin with other production facilities on theelectrical grid.
• Management of the cooldown mode control. This mode is designed for unit operationbetween hot standby and cold shutdown to set up the proper operating modes in the SteamDump System.
Although the Control Coordinator acts as direct interface only between Reactor Power ControlSystem, Turbine Control System and Steam Dump System, in consequence of its actions theoperation of other control systems and subsystems is affected.
RCLS Control Functions.
The RCLS control functions are performed by the following control systems:• Reactor Power and Rod Speed Control System.• Pressurizer Pressure and Water Level Control System.• Feedwater Control System (Steam Generator Water Level Control, Feedwater Pump Speed
demand Control)..• Auxiliary Feedwater Control System• Steam Dump Control System.• Feedwater Tank Pressure and Water Level Control System.• Condenser Hotwell Level Control System
Implementation of the control systems listed above is accomplished using the WEC EagleFamily microprocessor based system. This system is manufactured from the high qualityhardware modules that are housed in cabinets designed to withstand seismic events and toreject interference from outside noise sources. But if any functional deficiency is identifiedduring or after control system installation on the Temelin site, it will be difficult to carry out anycorrections and changes. Therefore substantial verification of all arts of the RCLS before itsinstallation is very important.
3. REACTOR CONTROL AND LIMITATION SYSTEM VERIFICATION:
The program for Temelin Control and Instrumentation System verification was prepared by thespecialists of SKODA , CEZ and EGP two years ago. The main objectives of this programhave been:• To confirm that functional requirements on RCLS, TCS and PCS defined by the Czech
customer are compatible with NPP Temelin technology.• To confirm with a high degree of confidence that RCLS, TCS and PCS functional design are
in compliance with Czech customer requirements.• To obtain evidence that the new main control systems can control the Temelin power unit
with acceptable performan'ce for all specified normal operating conditions and events.• To identify deficiencies and required changes, if necessary.The method of transient analysis has been selected for the verification. Two analytical toolshave been used:• Full scale plant simulator• The detailed dynamic model designed by the Temelin general designer EGP
36g Nuclear Energy in Central Europe '98

Both computer codes contain complete technology (all systems of the primary and secondarysides of the Temelin NPP and full scale of the RCLS, TCS and PCS in compliance with WECdocumentation for the Temelin Unit 1.) They can cover the full scope of normal and anticipatedtransients for which the RCLS is designed.The verification program has been divided into two stages. During the first stage the testing ofthe individual (separated) control systems without respecting interfaces between main controlsystems have been carried out. The second stage of the verification program has beenconcentrated on the RCLS and TCS full verification. The verification of the Control Coordinatorin cooperation with Limitation System and reactor and turbine control systems has beenperformed by transient analysis.
The following events have been analysed:• Loss of one reactor coolant pump at reactor powers: 100% Nnom (LS(a+c) actuation), 88%
Nnom (LSa actuation) and 68% NnOm (without LS actuation- stabilisation only by means ofcontrol system)
• Simultaneous loss of two opposing reactor coolant pumps at reactor powers: 100% NnOm(LS(a+e) actuation), 72% Nnom (LSa actuation), and 50% Nhom (without LS actuation)
• Simultaneous loss of two adjacent reactor coolant pumps at reactor powers: 100% Nnom
(LS{a+e) actuation), 72% Nnom (LSa actuation), and 40% Nnom (without LS actuation)• Step load changes and full load rejections• Reactor trip• turbine or generator trip without reactor trip from the powers: 100% NnOm (LS(a+c)
actuation), 73%Nnom (LSa actuation), and 38% Nnom (without LS actuation)• Loss of a 400kV transformer from the same power levels as turbine trip• Loss of one turbine driven feedwater pump at reactor powers: 100% Nnom (LS(a+c)
actuation) and 73% Nnom (LSa actuation)• Loss of both operating turbine driven feedwater pumps at reactor powers: 100% Nnom (LSd
actuation) and 38% Nnom (LSa actuation)• Loss of one circulating water pump at reactor full power (LSa actuation )• Loss, of both operating circulating water pumps at reactor powers: 100% Nnom (LSd
actuation), and 38% Nnom(LSa actuation)• Loss of one or two operating condensate pumps (without stand-by) at turbine full power
(LSa actuation)• Loss of all three operating condensate pumps (without stand-by) at turbine full power (LSd
actuation) and at 38% of full power (LSa actuation)• Loss of low pressure feedwater heaters. The LSa initiated by the loss of feedwater heater
reduces reactor power to such a level that a required feedwater flow corresponds to theavailable condensate flow. Ten different scenarios related to the loss of feedwater heatersor the heater bypass line have been simulated and functional algorithm and system logichave been confirmed.
• Loss of high pressure feedwater heaters- changes in feedwater temperature• Island Mode event and Fast valving event• Evaluation of performance of the control system during remotely dispatched control and load
regulation and during power unit shut down to cold conditions and power unit heatupPartial evaluation of protection system actuation has been performed. The following eventshave been analysed:• coolant pipe breaks (different size of break)• main steam line breaks and main feedwater line breaks• steam generator tube rupture (one and more tubes)
For illustration, some results of transients caused by two of the above listed plant anticipatedincidents are presented.
Nuclear Energy in Central Europe '98 369

A. Loss of the two adjacent main coolant pumps at full reactor power.
The design of the plant is such that plant operation is allowed to continue with up to two maincoolant pumps idle. A simple trip of 1 or 2 main coolant pump must not, therefore, cause thereactor to trip when the RCLS operates as designed. The promptly initiated LS must bring theplant to power condition maintainable for a long period of time, if needed.The test started from the initial steady state at nominal reactor power and pressure in the mainsteam collector of 6.2 MPa. The trip of two coolant pumps caused LS actuation (c+a).Maximum allowed reactor power of 41% was established as the reactor power setpoint. Themajor calculated parameters of the primary and secondary system are provided in Figures 1 to8. Dynamic behaviour of the plant in response to the limitation actuation has been analysed.The Limitation System, Control Coordinator and all reactor and turbine control, systemsactuated properly. Non of the plant parameters resulted in a reactor trip.
B. Loss of one of the two operating turbine- driven feedwater pumps at full reactor power
Two turbine- driven feedwater pumps are designed for NPP full power operation. One feedwater pump was manually tripped. The LS received neutron flux information from PRPS andstatus information indicated that the feedwater pump is out of service. This status information isgenerated in the Plant Control System. The Control Coordinator analysed the information andinitiated actuation LS (c+a) which caused a rapid reactor power reduction to 50%. This quicklyreduced the demand on feedwater flow to avoid potential reactor trip. The major plantparameters are illustrated in Figures 9 to 16.Upon tripping one of the main feed water pumps the total feedwater flow to steam generatorsdecreased instantaneously. The steam generator pressure increased and SG level decreasedrapidly mainly due to the decrease in feedwater flow rate and level collapse caused bypressure increase. The SG level decrease initiated the start up of one of the auxiliary feedwater pumps. The Feedwater Control System restored the water level to the nominal waterlevel in 10 minutes.The turbine- generator power decreased simultaneously with the reactor power, but at thebeginning of the transient the rate of decrease of generator power was less than that of reactorpower. This difference was primarily the consequence of the large energy content stored in theMoisture Separator and Reheaters, which are located between the high and low pressureturbines. .
4. CONCLUSION
The NPP Temelin control system is being upgraded with the new digital technology deliveredby WEC. To confirm that the functional design of the RCLS, TCS and PCS is in compliancewith the Czech customer requirements and that these requirements are compatible with NPPTemelin upgraded technology, the verification of the control system has been performed. Themethod of transient analysis has been applied. The evaluation has not yet been completed, butthe preliminary results of analyses demonstrate that the new control system can ensureacceptable operation of the Temelin units in normal operating conditions as well as duringanticipated transients.
370 Nuclear Energy in Central Europe '98
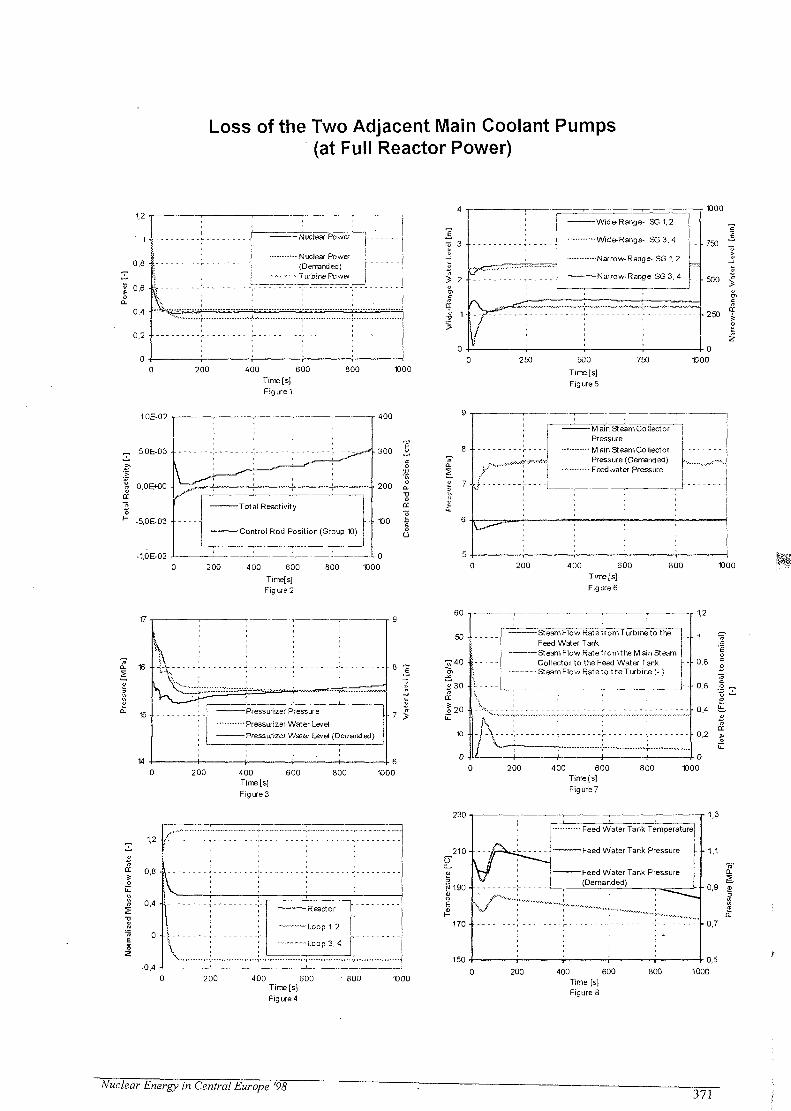
Loss of the Two Adjacent Main Coolant Pumps(at Full Reactor Power)
1,2 •
0,8 •[
0,6 •
0,4 • "
0,2 ••
200
-Nuclear Power
—- Nuclear Power '(Demanded) \ 'Turbine Power )
400 600Time [S]Figure 1
800 1000
> 2 •
250
3 •
2 •
1 •
0 •¥
Wide-Range- SG 1, 2
Wide-Range- SG3.4
Narrow-Range- SG 1, 2
Narrow-Ranae SG 3, 4rrr.
500Tirre[s]Figure 5
750
1000
£
•750 1
• 500
•250
1000
1.0E-02
„ 5.0E-03 •
-5.0E-03 •
•1.0E-02
-Total Reactivity
-Control Rod Position (Group 10)
200 S.
O
rx
100 §
0200 400 600 800 1000
Timefs]Figure 2
T 7y --
Main Steam CollectorPressureM ain Steam CollectorPressure (Oemanded)
•—-"— Feedwater Pressure•1. w . . . . - " \ .
400 600TJmefs]Figure 6
1000
• £ • •-Pressurizer Pressure
•- Pressurizer Water Level
"Pressurizer Water Levef (Derranded)
200 400 600Time[s]Figure 3
800 1000
Reactor
—~~-Loop 1, 2
- Loop 3,4
400 600Tims [s]Fig ure 4
5 0 •>Steam Flow RatefromTurbineto the 1Feed Water TankSteam Flow Rate from the Main SteamCollector to the Feed Water Tank
----- -Steam Flow Rate to tneTurbinef-}
230
150
1
0,8
0,6
0.4
0,2
200 400 600Timefs]Figure 7
800
Feed Water Tank Temperature
Feed Water Tank Pressure l-
200 400 600Time [s]Figure 8
800 1000
central Europe y 371

Loss of one Turbine- driven Feedwater Pump(at full Reactor Power)
1,2 - i —
Nuclear Power
Nuclear Power (Demanded)
Turbine Power
400 600Time[s]Figure 9
t 7 J-7:
Main Steam Co Hector Pressure(Demanded)Feedwater Pressure
400 600Time[s]Figure 13
800
1.0E-02 -i r
5.0E-03 •
ia O,OE+OO •
-5.0E-03 -
-1.0E-02-1
0
Total Reactivity
Control Rod Position (Group 10)
200
400 600Time [s]Figure 10
60
50 •
I 30 •
.§20..
10 ••
0 -j-
-Steam Flow Rate from Turbine to the FeedWater Tank
Steam Fiow Rate from the Main SteamCollector to the Feed Water TankSteam Fiow Rate to the Turbine (-)
200 400 600
Time[s]Figure 14
(• 1 c
£
0,8 t
0,6 | 2
0,4 irx
— Pressurizer Pressure
•-' Pressurizer Water Level
—- Pressurtzer Water Level (Demanded)
260
200 400 600Time[s]Figure 11
•1,4
400 600Time[s]Figure 15
800 1000
2000
400 600
Time[s]Figure 12
1500 - • J;
•S 1000 -LL
Lv--...
200
—- Condensate Flow Rate from theCondenser Hotwell
•—- -Feed Water FlowRatefromtheFeed Water Tank
—Condenser Hotweil Level
-Feed Water Tank Level
400 600TimeJsJFigure 16
- + 2 tr
372 Nuclear Energy in Central Europe '98

SI0100132
Nuclear Energy in Central Europe 98
\ Terme Catez, September 7 to 10, 1998
NPP KRSKO FULL SCOPE SIMULATOR MODELLING
Bruno Glaser, Bozidar Krajnc, Joze Spiler, Martin NovsakNPP Krsko Engineering Services Division
Krsko, [email protected], [email protected], [email protected], [email protected]
ABSTRACT - The paper describes the purpose and modeling approach of theKrsko Full Scope Simulator. The main architecture of the simulator and basic theoryof applications for thermohydraulic calculations within Rose™ environment gives anidea how the simulation is accomplished. The example of Service Water Systemmodel demonstrates the simplicity and user-friendly use of Rose™ tools that havebeen used to develop majority of the models. Fine tuning of the models based on NEKspecific data gives realistic, plant specific response in normal, abnormal, accidentaland severe accidental operation. NEK participation is significant in a way to acquireknowledge for development, support and later maintenance of the simulator.
1. INTRODUCTION
NPP Krsko (NEK) will, as a part of the Modernization plan, obtain also Krsko Full ScopeSimulator (KFSS). Contract has been awarded to CAE Electronics for the design,construction and integration.NEK requested a state of the art plant specific simulator, which will represent exact copyof NEK systems. NEK requested involvement in the phase of simulator development,integration and testing to acquire knowledge about the tools and models.CAE has developed ROSE™, the Real-time Object-oriented Software Environment.ROSE™ is a state of the art, object-oriented, graphical/icon-based suite of tools.ROSE™ allows a user to describe a system by drawing schematics using componentslocated in object libraries. Application specific code generators create software modelsbased on the schematics. The models generated can be tested and the schematics can beedited iteratively during development.Typical NEK systems consists of different parts: hydraulic, I&C and electrical part. Allthis parts are modeled within ROSE™ as separate portions, which can be developed andtested separately and optionally integrated. The final result is integrated system with fullfunctionality, which can be cross-connected, and integrated into bigger system at the endinto the whole plant model.This paper is focused on presentation of Essential Service Water (ESW) System model.The main aspects that will be presented are the state of the art user friendly modelingapproach and simplicity of maintenance and later modifications.In the paper we will present detail models of different hydraulic, electric and I&C portionsof NEK systems as well as possibilities for later plant modifications upgrades and featuresthat are accessed to the models.
Nuclear Energy in Central Europe '98 373

.2. SIMULATOR DESCRIPTION AND SYSTEM MODELING
The simulator consists of five hardware elements,1) The simulated control room will be a full scale replica of the Nuclear Power Plant Krskocontrol room. All control panels, cabinets, consoles, tables, and devices located in thecontrol room will be exactly duplicated in appearance, feel and apparent function. Allinstrumentation and controls located on the front, back and selected inside surfaces of thepanels will be provided with identical appearance and operation.2) The remote shutdown panels room will house three remote shutdown panels and reactortrip switchgear panel. The panel will in appearance and operation duplicate the operationof the remote shutdown panels.3) The simulator instructor station provides for the instructor to operate the simulator andset up, control, and monitor the training session. The Instructor Station will consist of aseparate console, which houses all necessary equipment. The instructor remote control willbe a wireless "hand-held device" which will allow the instructor to enter selected controlcommands from anywhere within the simulator complex.4) The computer complex consists of a state-of-the-art real time digital processor withappropriate capacities and peripherals and the software necessary to simulate the physicalplant processes, including control and support software, and5) The Process Information System a stand alone replica of the NPP Krsko processinformation system will be provided. Simulator PIS will be stimulated by input signalsfrom simulator models.
PLANT SYSTEMS SIMULATION
The systems simulated will be modeled with all necessary components, piping,instrumentation and controls fully dynamic to enable appropriate interface among alldirectly and indirectly connected systems. The systems will adequately respond to thestatus of connected systems including state of applicable parameters like temperature,flow, pressure, moisture content, time, inventory (level, mass, concentration...) with allassociated interlocks and arming signals, control and protective functions. Instrumentationoutput shall provide accurate replication of control and protection logic, and indicationsand alarms available to the operator in main control room and on remote shutdown panelshardware. All parameters (indications, positions, etc) which are available on PIS, will besimulated. The following high fidelity performance criteria will be used:(a) Models of the simulated systems will be based on first principles: conservation of
mass, momentum and energy.(b) Models will be designed based on NEK specific data. All relevant system components
(valves, pumps, tanks, heat exchangers, etc.) will be modeled as individual entities.(c) Dynamic characteristics of the systems will be reproduced by the incorporation of the
actual dynamic characteristics of pumps, motors and valves as provided from thereference plant station data. The reference plant steady-state thermal-hydraulic data(heat balances, flows, pressures) are used to derive system parameters (pipingresistances, heat transfer coefficients, valve admittance's).
(d) All the systems models will be extensively tested using CAE testing utilities. The testswill be performed against reference data, whereve'r available, and calibration ofimportant parameters will be fine-tuned accordingly. Tests will be performed onindividual modules (programs) and on integrated modules comprising entire systems.The testing utilities will include all the functions necessary to perform the requiredoperations within the same environment as the simulator. Particular attention will begiven to the critical parameters to ensure they conform to the specified tolerances.
3-74 Nuclear Energy in Central Europe '98

SYSTEM MODELING
To simulate Reactor Coolant System two type of simulation tools are used. First primarycore is simulated by COMET. This is a real-time program to calculate time dependentneutron diffusion equations, using concepts of equivalence theory to enable finitedifferences as the discretization to deal with large, multi assembly size clusters.Second, for RCS thermohydraulic simulation ANTHEM is used. This is a five-equationnon-equilibrium, non-homogeneous drift flux model based on the following equations:• liquid mass conservation• vapour (steam + n-c) mass conservation• non-condensable mass fraction conservation• liquid energy conservation• vapour (steam + n-c) energy conservation• mixture (liquid + vapour) momentum conservationThese equations are solved every time step. Other transport equations are used for thetransport of boron, impurities, radioactive species and non-condensables.To simulate hydraulic network within ROSE™ environment admittance method is used.The bases for this approach are described in the following section.
ADMITTANCE MATRIX
In admittance methods, the hydraulic network is solved by applying a linearization of thesteady state solution of the conservation of momentum equation to the conservation ofmass equation. By applying conservation of mass at each control volume within a network,a set of linearized equations with pressures as unknowns is derived. This matrix is thenexplicitly solved by the standard Cholesky LU method for linear systems.The implicit assumption in the admittance method is that the transient response of theconservation of momentum equation within the node is rapid with time constants muchsmaller than the iteration time, and that the dominant transient response is determined bythe transient response of the flow elements, the capacitance of the control volumesthemselves, and the transient response of the external pressure and flow sources acting asforcing functions. In the following section the derivation of the generalized form of thematrix will be performed.Consider the following control volume j shown in Figure 1:
• Flows Wy (i e Nl, i * j) are inflows to j fromcontrol volume I, whose pressure is unknown.
• Flows WJk (k € N2, k * j) are outflows from j
to control volume k, whose pressure isunknown.
• Flow JFB!/(meMl)is an unknown flow froma known source pressure Pm to j . Pm is apressure calculated outside the network ofinterest.
• Flow Wjn (n e M2) is an unknown flow to aknown source pressure Pm from volume j .
• Flow Wsj(s e SI) is a known flow source fromstoj .
• Flow Wj, (t e S2) is a known flow source fromj tot.
Figure 1: Typical Control Volume
Nuclear Energy in Central Europe '98 375

By applying conservation of mass at this node we obtain:
v-i v-i v-i x-i x-i t-iIX+ I X + I X -1w* - IX» - 2X =dM
meMl keNl neM2 leS2
Eq. [1]
where:Wab = mass flow rate from volume a to bMj = volume j masspj = volume j densityVj = node j volume
isN
where:meM SGS *̂*
N = N\ u N2M = M\S = S\yj
KJM2
S2
Eq. [2]
The prime indicates the value of the pressure at j from the previous iteration and dt is theiteration time step.Writing equation [2] in matrix form:
__ A
— A
•• - A J PX
— A A"ii ~AjJ s,
Eq. [3]
The general steps to calculate an admittance matrix solution of a hydraulic network are asfollows:1. Calculate the admittance using admittance equations for all links within the network
including those links connected to known pressure sources.2. Set up the off-diagonal elements of the matrix Ay.3. Set up the diagonal elements Ajj.4. Set up the source vectors for each node Sj.5. Solve the matrix for the node pressures Pj.6. Determine the flows Wij.
376 Nuclear Energy in Central Europe '98

ADMITTANCE EQUATIONS
Having reviewed the admittance matrix solution, the actual admittance equations used inthe hydraulic process simulation are given below, for the various types of fluids, which aresimulated.
The Single Phaseequation is as follows:
A =
where:A=link admittancec=Iink conductivityPi=upstream pressureP2=downstream pressurePei=pressure rise (decrease) across link(normally due to an elevation change)
Usage: liquid phase,homogeneous hydraulicsystems (i.e., water, oil).
The Compressibleequation is as follows:
where:A=link admittancec=link conductivityPi=upstream pressureP2=downstream pressure
Usage: Homogeneousgases (i.e., air, H2, N2).
Two PhaseAdmittance Equation:
JPr-P2+Pel
where:A=link admittancec=link conductivityPi=upstream pressure^downstream pressure3ei=pressure rise (decrease) across link
(normally due to an elevation change)D=average nodal density
Usage: Homogeneousmixture (steam and water)
3. EXAMPLE OF SW SYSTEM MODEL
PROCESS SCHEMATIC
The basis for process modeling representsdrawing and tuning of the system as describedin the following steps.1. Nodalization of the process schematics.2. Determination of nodal steady state
pressures and flows using plant specificdata and documentation (eg. flow diagrams,PIS data)
3. Device (eg. pumps, valves, heatexchangers) parameter tuning using plantspecific device manuals, measuredparameters etc.
4. Conductivity tuning of pipes between nodesusing rose Calibrator or "paper and pencil"approach using appropriate formula.
5. Testing: localy, comprising optionalnumber of nodes and/or other objects(setting surrounding nodes capacity to verylarge values). Overall, after localy testingwhole system behaviour must be tested.
node3( ) node2 HEX
pump
tank fnode2
Figure 2: Nodalization Schematics
Nuclear Energy in Central Europe '98 377

Figure 3: Typical ROSE™ Hydraulics Process Diagram
Figure 3 shows typical schematics created by ROSE™. The ESW system is considered asa single-phase thermodynamic system. Development and simulation are performed withobjects from NEK specific library. These libraries were developed especially for NEKsimulator and base on NEK specific data and device features. Using this plant specificlibrary schematic represents similar system layout as on original D-3 02-251 flow diagram.Interconnections to other systems are made via external nodes (Fnodes) and connectionsto analog/binary or relay logic diagrams are made using interconnections (Offcons).Tuning can be performed in developing phase or simulation mode through the info matrixwhere all variables are accessed. A special tool called calibrator is used to tune certainparameters with calculation of predetermined input variables (example: pipe conductivitycan be tuned using calibrator, where downstream and upstream pressure, flow and otherneeded parameters are entered to calculate conductivity, pump curve can be entered as anarray of flow vs. head etc.). During simulation all input parameters can be online changedand monitored to see the impact of them to the entire model or using them to re-tune thesystem. To tune the systems NEK specific data is used (isometric drawings, devicemanuals, process diagrams, calibration lists etc.). Very important step in tuning and/orverifying transient responses as well as steady state operation is NEK process informationsystem (PIS) data. This will play significant part during testing the simulator. In thefollowing example a relay logic diagram is presented.
378 Nuclear Energy in Central Europe '98
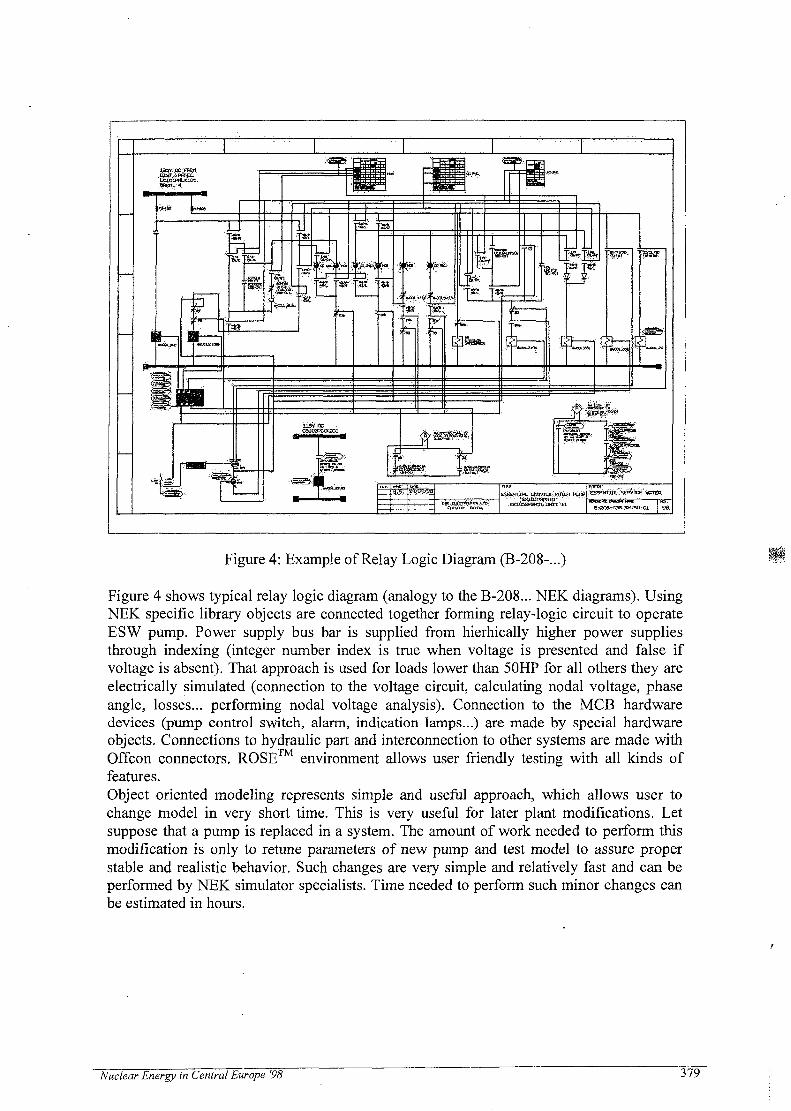
\ 15a ) (tK
:#r-
J"F T
•«r
TJU
fig
Figure 4: Example of Relay Logic Diagram (B-208-...)
Figure 4 shows typical relay logic diagram (analogy to the B-208... NEK diagrams). UsingNEK specific library objects are connected together forming relay-logic circuit to operateESW pump. Power supply bus bar is supplied from hierhically higher power suppliesthrough indexing (integer number index is true when voltage is presented and false ifvoltage is absent). That approach is used for loads lower than 50HP for all others they areelectrically simulated (connection to the voltage circuit, calculating nodal voltage, phaseangle, losses... performing nodal voltage analysis). Connection to the MCB hardwaredevices (pump control switch, alarm, indication lamps...) are made by special hardwareobjects. Connections to hydraulic part and interconnection to other systems are made withOffcon connectors. ROSE™ environment allows user friendly testing with all kinds offeatures.Object oriented modeling represents simple and useful approach, which allows user tochange model in very short time. This is very useful for later plant modifications. Letsuppose that a pump is replaced in a system. The amount of work needed to perform thismodification is only to retune parameters of new pump and test model to assure properstable and realistic behavior. Such changes are very simple and relatively fast and can beperformed by NEK simulator specialists. Time needed to perform such minor changes canbe estimated in hours.
Nuclear Energy in Central Europe '98 379

SIMULATION IN REAL TIME
Figure 5, Simulation in real time (Autograph)
The example on Figure 5 represents Autograph display during real time simulationtransient. The example was recorded during clogging ESW supply pump A line and afterthat, automatic start of the B ESW pump occurred. This tool allows user to define any onevariable from any object info matrix and display it on the graph. The other useful propertyis dynamic Rose™ display, which changes colors dependent on different flow/temperatureconditions and displays typical values at nodes, switches, meters or info matrices.
4. CONCLUSION
The KFSS models based on ROSE represents high quality accurate coded programsrunning in real time. The application is very user friendly and allows one to incorporateplant specific equipment data or detail system features. Interface between different systemsand subsystems allows user to develop, test and integrate optional parts together as well asto integrate smaller systems into complex bigger ones.Using such tools simulator can be developed in a very short time with small probability oferrors to occur. Low time consuming represents also short factory acceptance tests anddeficiency abolishment. Tuning and later maintenance is thus simple, fast and fairlyreduces costs.
5. REFERENCES
[1] CAE Rose™ Hydraulics Application Theory Manuals[2] Procurement Specification of Services, SP ES-504, Plant Specific Full Scope
Simulator for Krsko NPP[3] CAE Rose™ Basic 2.4a Documentation
380 Nuclear Energy in Central Europe '98

SI0100133
Nuclear Energy in Central Europe '98
Terme Catez, September 7 to 10, 1998
Nuclear Licensing in Slovenia
Matjaz Prah, Joze SpilerKrsko NPP, Vrbina 12, 8270 Krsko, Slovenia
Djordje Vojnovic, Matjaz PristavecSlovenian Nuclear Safety Administration, Vojkova 59, SI-1113 Ljubljana, Slovenia
Abstract
The article presents the approach to nuclear licensing in Slovenia. The paper describes, theinitialization, internal authorization and review process in the Krsko NPP. The overall processincludes preparation, internal independent evaluation, the Krsko Operating Committee and theKrsko Safety Committee review and internal approval.
In addition, the continuation of the licensing process is discussed which includes independentevaluation by an authorized institution and a regulatory body approval process. This regulatorybody approval process includes official hearing of the licensee, communication with thelicensee, and final issuance of a license amendment.
The internal evaluation, which follows the methodology of US NRC (defined in 10 CFR 50.59and NUMARC 125) is described. This concept is partially implemented in domestic legisltion.
1.0 Introduction
Slovenian utility operates only one nuclear power plant that is the Krsko NPP. The plantcostruction was started in seventies and commissioned in early eighties. The basic licensingdocument is the Safety Analysis Report (SAR) which has 17 chapters. Those plantmodifictions (design and procedure changes or test and experiments) which have implicationson the SAR are subject to a safety evaluation. The level and extent of the safety evaluationdepends on safety implications which should be assessed at the very beginning of the process.Responsibility for all initiatives related to the SAR changes and safety assessment are primarilyon the licensee side which is in accordance with the premise that the licensee has the primeresponsibility for nuclear safety.
By definition the SAR contains information which is important for the plant safety.
Nuclear Energy in Central Europe '98 381

Having that in mind, SAR has a role also as an information source during the licensing process.Therefore, it is natural that the SAR represents a starting point of safety assessment of anychange or plant modernization program during the licensing process. This paper concentrateson the licensing and regulatory review of the SAR of the Krsko NPP.
2.0 Legislation Framework for Safety Analysis Report and other licensingdocuments
At present the Slovenian regulatory system is mainly based on laws and regulations issued inthe past by the former Yugoslavia and maintained in force in the Republic of Sloveniafollowing its independence. With regard to the licensing of the NPP design modifications andconsequently the SAR changes, the following laws and regulations are applicable:
1. Act on Radiation Protection and the Safe Use of Nuclear Energy (Off. Gaz. SFRY,62/84)The law requires Preliminary SAR for construction permit and final SAR for operatingpermit. The law provides general statements on the safe operation of the plant. Morespecifically it states that national regulations and technical standards may be appliedand, when not available, regulations and technical standards of the country of origincan be applied, subject to the approval of a regulatory organization.
2. Regulation on Safety Analysis Reports (Off. Gaz. SFRY, 68/88)This regulation provides detailed statements that the SAR is the basic licensingdocument for nuclear installation with respect to nuclear safety. The SAR shall besupplemented during the plant life with data and analyses on all changes, which weredone at a nuclear plant. This regulation establishes 3 categories of changes to the SAR.The first category requires a notification to the SNSA after the completion ofmodifications. The second category requires a notification to the SNSA beforeimplementation. The third category requires an approval by the SNSA beforeimplementation.
3. Regulation on Siting and Construction and Operation of Nuclear Facilities (Off. Gaz.SFRY, 52/88)This regulation requires that licensee monitors and analyzes the level of nuclear safety,whereby he must take into account the experience of other nuclear facilities and newtechnological developments. This regulation establishes, beside others, that forTechnical Specification (TS) changes a third part independent evaluation, performed byorganizations authorized by the SNSA, is mandatory. The arrangements to performthis independent evaluation are implicitly under the responsibility of the licensee.
4. Act on Administrative Procedures (Off. Gaz. SFRY, 47/86)This regulation establishes the general licensing procedure adopted in Slovenia and alsoestablishes the procedure to manage appeals of the licensee against the Regulatorybody.
382 Nuclear Energy in Central Europe '98

3.0 Krsko NPP Internal Process for Licensing
The internal licensing process is divided into several steps:
a Preparation of Proposed Change (plant modification, Safety Analysis Report (SAR)Change, Technical Specifications Change)
a Safety Evaluation Screening preparation and internal independent review
a Safety Evaluation preparation and internal independent review
a Krsko Operating Committee Review
a Krsko Safety Committee Review
a Approval of Engineering and Nuclear Oversight Director
a Licensing package preparation
After the package is sent to the licensing and analysis department, and independent review ofSafety Evaluation Screening and Safety Evaluation is done, the package is sent to the KrskoOperating Committee. After positive review of KOC the package is sent to the Krsko SafetyCommittee. If the package fulfilled all necessary requirements, the Director of Engineeringand Nuclear Oversight internally approves the package.
Since there are no criteria for categorisation of plant changes, the Krsko NPP implemented the 10CFR 50.59 rule. For that purpose, the new procedure ESP-2.303, AUTHORIZATION OFCHANGES, TESTS AND EXPERIMENTS (10 CFR 50.59 REVIEWS) was developed. Theadoption of that rule in the specific case of the SAR changes is shown on the flow chart (Figure 1.)in the Safety Evaluation Screening and the Safety Evaluation preparation step.
The current practice is: if an unreviewed safety question appears, the whole external licensingprocess starts; if there are no unreviewed safety questions, the regulatory body is informed aboutthe modification or other activities which involve the SAR change, and the SAR Change Package issent to the Regulatory Body (SNSA) for review before the SAR change is implemented. TheRegulatory Body may by its discretion request licensing process even if there is no unreviewedsafety question.
4.0 Licensing Process and Practice
At present more detailed requirements for the licensee on the management of the SAR changesand plant modifications (i.e. criteria to categorize them, content of application document,independent review, documents updating etc.) are not established neither in regulations nor inthe operating licence. Therefore, on the basis of the legal framework mentioned above, theNPP Krsko follows the criteria established in the regulation (i.e. 10 CFR 50.59) of the vendorcountry (USA) and notifies all design modifications to the SNSA.
Nuclear Energy in Central Europe '98 3 83

Technical specifications determine that the plant is obliged to submit the report on plannedmodifications, tests and experiments on the plant 45 days prior issuing a licence by the SNSA.
The NPP Krsko submits to the SNSA for approval every change of the plant TechnicalSpecifications. The plant is obliged to submit also the report, independent expert opinion aboutthe change, written by Technical Support Organization (TSO). TSO's have to be authorized bythe SNSA. Therefore, the SNSA approval process is thus supported by independent third partyassessment.TSO's have developed QA procedures for the area of expertise for which they are authorized.Joint (SNSA and NPP Krsko) QA audits are carried out on approximately two year periodbasis.
As mentioned before the Krsko NPP provides to the SNSA all safety evaluations of plantchanges which have impact on SAR. On the request NPP Krsko submits to the SNSA thesafety evaluation screening of plant changes which have no impact on SAR, based on thescreening results. The Krsko Operating Committee and the Krsko Safety Committee approvethe safety evaluation change before it is sent to the SNSA for approval.
The formal administrative procedures (according to the Act on Administrative Procedure) areobeyed in the following cases:
• major modifications,a when safety assessment shows the elements of unreviewed safety question,a changes in the organization structure (organizational chart, definition of responsibilities,
communication lines, etc),a technical specification changes,a changes of important programmes and procedures (such as ISI Programme, Fire
Protection Programme, Radiation Monitoring Programme, etc.) which are defined in theSAR, but are not a part of the SAR.
Typical submittal documentation of the SAR change for approval should involve: proposedSAR change, licensee's safety assessment report, licensee's safety analysis or safety analysisjustification report (if necessary), technical/working report packages, and the TSO report -positive independent expert opinion about the change. During the process of regulatoryreview, safety evaluation and decision making at least one hearing takes place where bothsides, the plant representatives and the SNSA representatives, consider and discuss openissues. The process concludes with the SNSA's formal decision on the changes of the SAR andother licensing conditions.
At the end of licensing process, the SNSA issues the Licensing Amendment.
5.0 SAR Regulatory Review Concept
The SAR regulatory review for operating plant is carried out as a part of the licensing processwhich is related mainly to the following typical situations:
• SAR changes due to plant design or procedure changes,
3 84 Nuclear Energy in Central Europe '98

a SAR existing content evaluation due to gained new knowledge based on experience orresearch,
a SAR existing content evaluation due to changes in the plant which are not explicitlydescribed in the SAR but may have impact on nuclear safety.
From the above it is clear that the regulatory review of the SAR is connected to the licensingprocess, but sometimes it could be part of the relicensing safety assessment and analysis due tosome change or due to some new information which may have impact on plant safety asdescribed in the SAR.The review of the SAR and associated supporting documents requires from the regulatorybody the competence of integrated approach of the safety assessment review.
The main objectives of adopting such safety assessment are:
a to maintain an up-to-date view of the overall safety of the plant,a to promote a balanced implementation of the "defense in depth" principle,• to assure the correct exploitation of interfaces (i.e. among plant systems during different
plant conditions, among different competencies during the design and review process),• to assign priority to safety issues, assessment and inspection activities, etc.
Table 1. shows some most important assessment elements of licensing process and the SARreview, organized on a hierarchical manner. Not all levels and details are described.Furthermore, all elements are not always applicable. Therefore the table should be understoodas an indicative guidance.
Beside the integrating competence for licensing and SAR review other competence is alsoimportant especially in the areas of safety analysis and evaluation such as: neutron and thermalhydraulic analysis, structural and mechanical analysis, PRA analysis, power supply and I&Cevaluation, severe accident analysis, etc.
Nuclear Energy in Central Europe'98 385

Table 1.; Safety assessment framework during licensing and SAR review
- to maintain an up-to-date view of theoverall safety of the plant,- to promote a balanced implementation ofthe "defense in depth" principle,- to assure the correct exploitation ofinterfaces,- to prioritize safety issues, assessment andinspection activities.
- evaluation of plant design basis and its compliancewith safety objectives and design limits in differentplant conditions,- verification of correct liaison between safetyobjectives, general design criteria and designrequirements at system and components level,- evaluation of the integrated plant response to normaland abnormal events,- evaluation of correct exploitation of technicalinterfaces among different competencies during reviewprocess
- inherently questioning attitude,- top bottom thinking approach,- r&luctance to get lost in not relevantdetails,- prone to catch priorities,- proactive character,- prominent attitude to synthesis,
Identification and evaluation of applicablerules and standards,
First level regulations and standards - national laws and regulations,- USA regulations,- selected international rules and guides(IAEA), etc.
Second level regulation - USNRC regulatory guides,- ANS/ANSI standards- IEEE criteria, etc.
Third level rules - ASME code,- NFPA codes, etc.
i l l
Plant design basis evaluation, Definition of plant safety objectives, - radioprotection criteria,- risk criteria in different levels,
Identification of plant reference conditions and designlimits,
- definition of four conditions and internalevents grouping into defined plantconditions,- functional requirements for each plantconditions,- dose limits for each plant conditions,- safety limits for each plant conditions,- design codes and standards for SSC-s
Identification and classification of design basis events, - internal events (main basis is RG 1.70)- external events (natural and man madeevents),- area events,
Identification of safety functions, - reactor subcriticality,- core cooling,- heat sink,- integrity of pressure boundary,- inventory,- containment,
Design requirements for plant structures, systems andcomponents,
- Safety classification and quality groups,- Seismic classification,- QA classification,- Design load combination,- Redundancy, independency, separation,diversity and qualification requirements,- Protection against area events,
Design basis compliance assessment System analysis and interfaces evaluation - safety function assigned to the system,- applicable regulations to the systemdesign,- system and components classification
Transient and accident analysis review:- transient and analysis objectives,- analysis methodology,- adequacy of adopted assumptions
- netronic and thermal hydraulic analysis,- PRA analysis,- Instrumentation and control,- mechanical and structural analysis,- radiological consequence evaluations,
Identification of major safety issues Information sources:- analysis of operating experience,-results of systematic evaluations programs,- inspection findings,
Major interfaces in the safety assessmentprocess
• PRA analysis• power supply and I&C evaluation• neutronic and thermal hydraulic analysis,• SSC structural analysis,- radiological consequence evaluation,• reactor safety research,- Inspection
386 Nuclear Energy in Central Europe '98

Figure 1. shows the flow chart of entire licensing process.
Licensing processin discharge ofOfficial Duty
started byRegulatory Body
(SNSA)
Independent ExpertEvaluation
(Authorised Institution)
Safety EvaluationScreening
Safety Evaluation(ESP-2.303)
Package Development(BSP-2.301)(ESP-2.302)
Safety EvaluationScreening
Safety Evaluation(ESP-2.303)
Licensing and AnalysisDepartment Review Licensing and Analysis
Department Review
ENOD DirectorApproval ENOD Director
Approval
Send to SNSAfor review
SNSA ApprovalLicensing Amendment
Distribution toDocumentation
Department
Nuclear Energy in Central Europe '98 387
6.0 Conclusion
The review of licensing documents and the review of associated safety evaluations and analysesrepresent the key part of licensing process. It is important to develop the adequate competenceat both levels, integrated safety assessment and specific areas of safety analyses. Technicalsupport organizations could provide the capabilities in areas of safety analysesFor the correct regulatory management of plant modifications and S AR reviews it is necessaryto establish more precise regulation on requirements to the licensee and to develop internalwritten procedures related to the assessment of the documentation presented by the licensee.To assure a high quality and effective process, the experience shows that it is worth respectingas much as possible the following premises of safety culture:
a open communication channel at different levels between licensee and regulator,a early involvement of regulator in open issue resolution process including the presence of
regulatory representatives on routine in-plant meetings related to the matter in question,a follow the rules of reporting with slight tendency of "over-reporting",a maintain good documentation,a discuss reports and resolve open issues early.
7.0 References
[1] »Act on Radiation Protection and the Safe Use of Nuclear Energy«, Off. Gaz. SFRY62/84,
[2] »Regulation on Safety Analysis Reports«, Off. Gaz. SFRY 68/88;
[3] »Regulatory Review of Safety Analysis Report«, paper presented by Miroslav Gregric,Director of SNSA at the CONCERT Group Meeting in Ljubljana on June 18, 1998;
[4] »Regulation on Siting and Construction and Operation of Nuclear Facilities«, Off. Gaz.SFRY, 52/88;
[5] ESP-2.303 "Authorisation of changes, tests and experiments (10 CFR 50.59 reviews)";
[6] ESP-2.301 "Technical Specification Changes and Licence Amendment";
[7] ESP-2.302 "Administration of changes to the USAR";
[8] Regulatory Guide 1.70, Rev. 1 and Rev.3;
[9] Title 10 Code of Federal Regulations;
Nuclear Energy in Central Europe '98

SI0100134
Nuclear Energy in Central Europe '98
Terme Catez, September 7 to 10, 1998
START - Glass Model of PWR
Jure Marn, Matjaz RamsakUniversity of Maribor
Faculty of Mechanical EngineeringSmetanova 172000 Maribor
Abstract
Recognizing the importance of nuclear engineering in the area of process engineering theUniversity of Maribor, Faculty of Mechanical Engineering has invested in procuring anderecting glass model of pressurized water reactor. This paper deals with description of themodel, its capabilities, and plans for its use within nuclear engineering community ofSlovenia.
The model, made primarily of glass, serves three purposes:(a) educational:(b) professional development;(c) research.
As an example, medium break loss of coolant accident is presented in the paper.Temperatures within primary and secondary side, and pressure on primary side of reactorcoolant system are followed. The characteristic points are emphasized, and commented.
Introduction
The experimental apparatus described in this contribution was obtained by University ofMaribor as a donation from Paul Scherrer Institute of Switzerland where it operated undername of GLAMOUR (see Hudina and Skerget, 1994, Muelli, 1985).
The paper first discusses geometrical characteristics of the setup. Then it moves to possibleuses of the setup with an emphasis on its research capabilities. It concludes with descriptionof three sets of results obtained during test runs simulating medium loss of coolant accidents.
Geometrical characteristics
Figure 1 shows the schematics of experimental setup used to simulate the transients in PWR.It is made primarily of glass, with maximum allowable pressure of 1.5 bar(g) and 35 kW ofnominal power. It consists of
Nuclear Energy in Central Europe '98 389

(a) primary circuit with the following components:- reactor vessel containing heating elements connected to transformer;- hot and cold leg,- steam generator comprised of U tubes,- primary pump,- pressurizer containing spray and heater;
(b) secondary circuit comprising the following components:- condenser,- system for secondary water;
(c) auxiliary components such as:- system of regulation and control,- water treatment system,- vacuum and spray pump,- data acquisition system.
Figures 2 through 5 show most important parts of the experimental setup.
Possible uses
There are three main areas in which the experiment can be used, as follows:
(a) educational:
Faculty of mechanical engineering teaches future mechanical engineers, among them thosewho will be specializing in process engineering among which issues of nuclear engineeringare of particular interest. Within the scope of their education they need to be subjected toexperimental as well as general simulations to deepen their understanding of the processesencoutered in real world applications.
START offers various issues which can be both measured and discussed. Among those theissues connected to two phase flow such as flashing, instability, flow regimes, inception ofboiling are significant, and easily visible in the experimental apparatus.
In addition, START features state of the art data acquisition system through the control panelwhich permits simultaneous observation of data values on the control panel as well as onattached computer display via applicable software. The students can learn how to use thesefeatures and modify them for their needs and purposes.
(b) professional development:
While there is no doubt of how the operators of nuclear facilities perform their tasks usingestablished routines it is also interesting to subject their actions to immediate feedback of thesystem. In addition, certain responses of the system such as seal loop clearance can be seen aswell as behavior of system for control of pressure (pressurizer spray and heaters).
390 Nuclear Energy in Central Europe '98

(c) research:
The research which is going to be performed on the experimental apparatus in mainlytwofold: curiosity driven, and research for computer program validation and verification.
The curiosity driven research consists of scaling experiments needed for various answers tobehaviour of primary and secondary loop during midloop operation such as during refueling.The main problem of the experimental apparatus is in pressure limitation which issignificantly different from actual pressure in the PWR. To succesfully overcome thisproblem either the fluids with appropriate critical pressure ratio should be employed (which isnot feasible), or accident sequence portraying actual accident conditions at low (i.e.atmosphere) pressure is foreseen.
The validation and verification program consists of following and developing themethodology well established in other types of mechanical engineering, e.g. for compressibleflows as depicted in available literature (see Aechliman and Oberkampf, 1998). Thismethodology adapted for use in nuclear energy can then be used to sucesfully answer, orattempt to answer the questions arising from verification and validation efforts.
Medium break loss of coolant accident simulation
To show possible uses of the system, and its drawbacks, medium LOCA was simulated. In thebeginning the system is stabilized at operating temperature and pressure. The secondary sideis slightly below ambient pressure (-0.3 bar (g)), and primary side around 0.55 bar (g). Attime = 0 the break in cold leg is opened. As soon as the level in the pressurizer drops belowpreset value the power is reduced to approximately 30% of nominal power. While the targetvalue is 7% (to simulate the decay heat) significant consideration is given to heat losses ofuninsulated glass model compared to very well insulated reactor coolant system of PWR.Also, no safety system (e.g. emergency core cooling) engages in order to faster achieve thecore uncovery.
Three sets of experiments were performed, see Figs. 6 through 8. Temperature of pressurizer,cold leg, and steam generator, pressure in primary and secondary systems, and reactor powerare plotted as a function of time.
The temperatures of pressurizer varies significantly, depending on its status. First, thetemperature is higher than in the cold leg, which is understandable and predicatble. Followingthe initiation of the accident, the temperature drops until it reaches the saturation conditions inthe primary system, to drop below the value due to high cooling of the pressurizer vessel inthe experimental setup.
In all three cases significant drop in reactor coolant system pressure is seen, followed bycoasting toward the steady state, ended by core uncovery. After the liquid level falls bellowcold leg rupture level, and after some boil-off period (approximately 900 seconds after theinitiation of the accident) the seal loop clears which is indicated by sharp rise in pressurizerpressure as the pressures in the code leg off-sets the pressure difference in hot leg. After thatthe accident progresses untill the pressure starts to rise again.
Nuclear Energy in Central Europe '98 391

The power is not uniformly distributed in time which is due to control of the transformer bypulses. The integral of power peaks, however, can be assumed to be essentially constant.
Conclusions
This paper deals with overview of capabilities and plans for use of existing experimentalfacility START at University of Maribor. First, the experimental facility is discussed from thegeometrical characteristics point of view. Then, the foreseen uses are described, and brieflycommented. Lastly, three test runs of medium loss of coolant accident are presented, andbriefly discussed.
To conclude, the experimental facility is believed to offer a lot of possiblities to nuclearengineering in Slovenia, and it should be used as much as possible. Its research capabilitiesare limited due to its glass composition, but the transparency on the other hand givestremendous educational and professional opportunities.
Literature
Aeschliman, D.P., Oberkampf, W. L., "Experimental Methodology for Computational FluidDynamics Code Validation", AIAA Journal, Vol. 36, pp. 733-740, 1998.
Hudina, M., Skerget, L., Glass model of pressurized light water reactor/ Stekleni modeltlacnovodnega reaktorja, Strojniski vestnik, Vol. 40, St. 7/8, str. 283-285, 1994.
Muelli, R., "GLAMOUR - Ein Glassmodell eines Druckwasser-Reaktors", EIR Bericht Nr.571, Wuerenlingen, 1985.
Oberkampf, W. L., Blottner, F.G., "Issues in Computational Fluid Dynamics CodeVerification and Validation", AIAA Journal, Vol. 36, pp. 687-695, 1998.
292 Nuclear Energy in Central Europe '98

1 RooktorRoactor
2 DampferzaugsrStoom ganerotor
3 DruckhalterPrcasurizor
4 PrimorkuhlmlttelpumpoPrimory coolant pump
5 PrlmiirkuhlmlttoivorratPrimary water storage
8 VokuumbehaiterVacuum tonk
7 WaooarrlngpumpeVacuum pump
8 KondonaatorCondensar
9 Sokundarkuhlmlttol AuDglolchobohaltarFaadwatar "atorogo tank '
10 SokundarkuhlmlttelpumpaCondart3<sr cooling water
11 KondonaatorkQhlungCondcnsor cooltng pump
12 SokundarkOhlmlttol ElnapolaungSecondary moka—up watar volva
tlj_ LockvontlleLaak valvaa
Figure 1. The schematics of START (from Muelli, 1985).
Figure 2. The START. Figure 3. The pressurizer.
Nuclear Energy in Central Europe '98 393

Figure 4. The control panel and data acquisition system.
-i .
Figure 5. The detail of the cold leg break.
394 Nuclear Energy in Central Europe '98

140
ou
•atu
QL
E
120
100
80
60
40
20
-400
•steam generator
cold leg
• pressurizer
400 800 1200
time [s]
1600 2000
0.4
0.3
¥ 02
& 0.1
I os-o.ia -0.2 ^
-0.3-0.4
sr
— — , — — 1 . — . ,—i
-400
- pressurizer
•steam generator
400 800 1200
time [s]
1600 2000
400 800 1200 1600 2000
Figure 6. The results for test #1.
Nuclear Energy in Central Europe '98 395
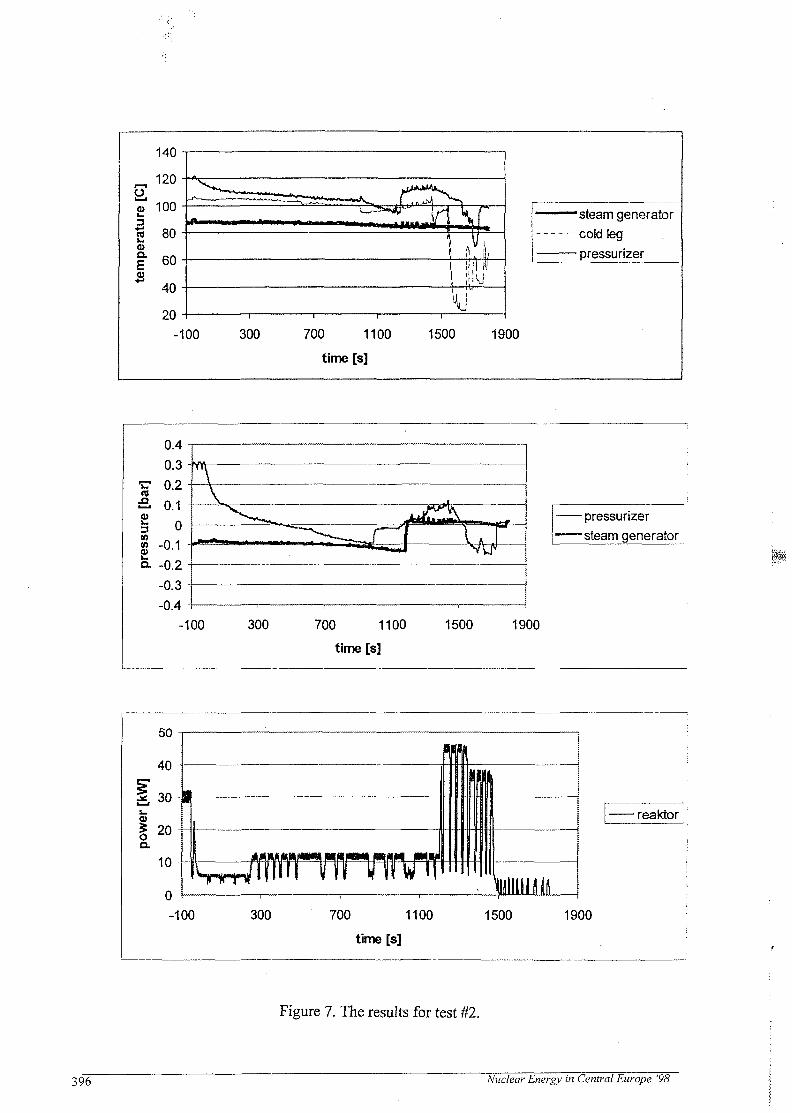
140
120
-100 300 700 1100
time [s]
•steam generator
cold leg
- pressurizer
1500 1900
Tre
o3
•ess
Q.
0.40.3
0.2
0.1
0-0.1
-0.2
-0.3
-0.4
V
- pressurizer
•steam generator
-100 300 700 1100 1500 1900
time [s]
er[t
iQ.
40 -
on _ _M
20 -
10-
.
U-100 300
9
m»mmmmm*m mad
FTrwrP
11
TTTTT
n
mm700 1100 1500
time [s]
u1900
rtjciktor
Figure 7. The results for test #2.
396 Nuclear Energy in Central Europe '98

140
_ 120o
V 100
« 80
| 60&
4020
-300
•steam generator
- cold leg
- pressurizer
300 600
time [s]
900 1200
Figure 8. The.results for test #3.
Nuclear Energy in Central Europe '98 397

SI0100135
Nuclear Energy in Central Europe '98
Terme Catez, September 7 to 10, 1998
Public Opinion about Nuclear Energy - 1998 Poll
Andrej Stritar, Radko Istenic"Jozef Stefan " Institute
Nuclear Training CentreJamova 39
Ljubljana, Sloveniaandrej. stritar@ijs. si
Abstract
In the Nuclear Training centre in Ljubljana we are polling our visitors on ayearly basis. The visitors are elementary and high school students. They arepolled before they listen to the lecture and visit the permanent exhibition. Thisyear we can observe some improved attitude towards nuclear energy. Thiscould be influence of the absence of open attacks against the nuclear powerplant Krsko in the media in last two years.
Introduction
Nuclear Training Centre Milan Copic at the Jozef Stefan Institute in Ljubljana isperforming extensive public information activities. All the elementary and high schools inSlovenia are invited to visit our permanent exhibition and attend the lecture about thenuclear energy or radioactive waste disposal. We receive about 7000 visitors per year.Most of them are from the 7th and 8th grade of elementary school, age 14 to 15.
Every year in the spring we ask several hundred of visitors the same set of questions abouttheir knowledge and opinion about nuclear energy. They are polled before they listen to thelecture or visit the exhibition. In that way we are trying to obtain their opinion based on theknowledge they obtain in everyday life.
Result of the 1998 Poll
In the following graphs we will present the results of the poll, that was performed in thespring 1998. Results are compared with the similar polls in the previous years.
Nuclear Energy in Central Europe '98 399

Demography
In the spring 1998 1409 visitors were polled. Most groups were from the high schools,while the others were from 7th and 8th grades of elementary schools. This year there weremore girls than boys:
8 0 /o ~i ™" ~ '"•
60%
40%
20%
0%
LZ5JSB
1998 1997 1993
D Elementary school • High school
80%
60% --
40%
20% -
0%
T*« [55454 i7,73°/tj
1998 1997 1993
• Boys H Girls
Their age distribution can be seen from the following graph:
3 55,40%
0% 10% 20% 30% 40% 50% 60%
a 1993 E 1997 • 1998
400 Nuclear Energy in Central Europe '98

Questions about the nuclear energy
With this set of questions we are trying to evaluate understanding and opinion about thenuclear energy. They were defined already some years ago, when there was substantiallystronger anti-nuclear movement in our country. Therefore some of them are becomingobsolete and will have to be reformulated in the future.
Lower price
Energyindependence
Cleanliness of thisenergy source
Lack of other energyresources
-SI don't know and No j
answer I
0%
23,06%1 24,07%
^ 1I 21,30%
-*• - r 13,68%20,37%
5,b87o
\ / : < < ?Twi 22,33%
16,04%
io,or/0
f224,29%
10% 20% 30%
D1998 D1997 E1993
40%
From the answers to the question What are the reasons for the use of nuclear energy?we can conclude that more work should be done on education about the environmentalharmlessness of this kind of energy production. There was one answer allowed.
From the answers to the similar question about the reasons against the use of nuclearenergy we can see that the disposal of the waste is loosing on importance, while radiationfrom NPPs is still considered important problem. There was one answer allowed.
Nuclear Energy in Central Europe '98 401

Possibility of anaccident
Disposal of fuel
Enough of otherenergy sources
Radiation from NPP
I don't know and Noanswer
T\ 30,37%25,46%
|p3,49%
T^xZM^^M 44'06°/
ft%10,50%
a 2,46%
K
13,19%|
U 15,35%
1 18,74%W ,,
8,74%
0% 10% 20% 30% 40% 50%
• 1998 0 1997 m 1993
Next question was What will be stored in the low-level radioactive waste repository? Itis obvious from the answers that there is considerable misunderstanding of facts present.There were several answers possible.
m
Spent fuel
Reactor coolant water
Used dresses and tools
RWfrom hospitals andindustry
RWfrom Zirovskivrhuranium mine
Radioactive ash fromfossil power plants
Nothing from that
I don't know
6,8)1%
1,62%| 3,70%T,56%
0% 10%
3 30,88%
J 37 54%[ 17,30%~ ~ 1 21,76%
••!& I*< ili< ili !'.>
j j
!4,29°y25,00
33,39%1,25%
31,23%
[ 48,58%
%49,77%" 50,75%
20% 30% 40% 50%—r60%
1998 Q1997 1993
402 Nuclear Energy in Central Europe '98

The last question in this group is the one that is becoming most obsolete. In the beginningof nineties there was serious threat from green government to shut down NPP Krsko innext 5 years. Since there is no such threat anymore, the question is becoming irrelevant.However, there is an impressive increase of people that support the operation of NPPKrsko until the end of its planned lifetime.
r w T ^ -12,28'Immediately • _ _ i 11 '57%
•i.23%
In five years i
At the end of its lifetime
j 66J0O% j65,28% i
¥.93%
I don't know and No Ianswer
10,11%i 15,51%
7,81%
0% 10% 20% 30% 40% 50% 60% 70% 80%
• 1998 D1997 H1993
Questions about the environment and personal values
With these three questions we are trying to determine what is the relationship of the persontowards the general environmental issues.
From the answer to the question What is most harmful to the environment? we can see,how media are influencing perception about importance of environmental problems.Several years ago everybody was talking about ozone holes, so this problem has attractedmore concerns. Today ozone holes are not discussed so much anymore in the media,therefore they have lost on importance among the polled population. Similar developmentcan be observed also for the other issues. There were 3 answers allowed.
Nuclear Energy in Central Europe '98 403

30%
25%-
# ' J? f f J- #' ^ -j> jr K» <®£
/
D1998
D1997
• 1993
<? &
The answers to the question How should place where you live look like? were strait: byfar most of people would like to live in the nice, turistically interesting place, which isquite understandable.
0% 10% 20% 30% 40% 50% 60% 70%
Nice, clean, turistically interesting place
Industrially developed place with no unemployment
Place with high income per capita
Place with no industry and a lot of agriculture
I don't know and No answer
• 1998 0 19S7M 1993
404 Nuclear Energy in Central Europe '98

Finally, we are asking every year our visitors about their acceptance to live close to someindustrial or otherwise disturbing facility. This year it is encouraging, that for the first timemore people are afraid to live close to an operating nuclear power plant than close to theradioactive waste repository. Maybe it is the influence of our permanent information aboutthe low environmental impact of the passive repository.
1
Nuclear power plant ,[ 8,7% 20 7%
-.761 3 A I 9,3%
Mine repository f -5°4 2 2 3ya I
\
)0,8c/» " * 12 3V U60,8
Animal farm +•** 1 7 . 7% ! 69,8=,.
l ^ l j i O ^ ' flOO D/ j T O O ' / l O O 3/ 1*1
Pulp factory ' _ „ __L —111' I . _ _ ' _ _" P
_ " i " ~_J_ " "_ _"_"_" ~Highway ^*T «^T J ^ I^7- ' 14.8,'. "J
17 O'n .7 1°/ j j
B acceptable
S partlyacceptable
n notacceptable
n I don't knowand Noanswer
Low and intermediate RW •repository
46,0%
Fossil power plant ' 7 8
f ^
36,3%
\ • f
f ' 47~3\ ~
.—^ f. ,—f— ^
i 8,5% f]
—f—f—r0% 10% 20% 30% 40% 50% 60% 70% 80% 90% 100%
Conclusions
Comparison of the results with previous years shows improving public acceptance ofnuclear energy in Slovenia. The following conclusions can be obtained:
" Cleanliness of nuclear power is not well understood and should be stressed ininformation activities
• Radioactive waste is loosing on importance as the major negative aspect of nuclearenergy
" About one third of population still believes, that the radioactive ash from thermalpower plants will be stored in the low level waste repository
• Percentage of people believing that NPP Krsko should operate until the end of itslifetime has increased from 66 to 84%. Absence of major anti-campaigns and betterunderstanding is evident.
Nuclear Energy in Central Europe '98 405

These results are one of the main indicators how are we going to improve our informationactivities in the coming season.
Relatively favourable public acceptance can change over night. Therefore a permanentinformation activity is essential.
References:
1. Skupina avtorjev: Slovensko javno mnenje 1986. Univerza v Ljubljani, Fakulteta za sociologijo,politicne vede in novinarstvo, Center za raziskovanje javnega mnenja in mnozicnihkomunikacij. Ljubljana, 1986.
2. Skupina avtorjev: Slovensko javno mnenje 1987. Delavska enotnost, Ljubljana, 1987.3. Skupina avtorjev: Slovensko javno mnenje 1990. Univerza v Ljubljani, Fakulteta za sociologijo,
politicne vede in novinarstvo, Center za raziskovanje javnega mnenja in mnozicnihkomunikacij. Ljubljana, 1990.
4. Izvedljivost zapiranja NE Krsko. Ministrstvo za energetiko Republike Slovenije, Ljubljana,Maribor, junij 1993.
5. Tomaz Kukovica, Irena Mele, Andrej Stritar: Development and Implementation of PublicRelations Strategy. Nuclear Society of Slovenia: 2nd Regional Meeting: Nuclear Energy inCentral Europe, Portoroz, 1995, p. 363-367.
6. Andrej Stritar: Public Acceptance, a Key Issue of Nuclear Energy. Nuclear Society of Croatia:Nuclear Option in Countries with Small and Medium Electricity Grid, Opatija, 1996, (1996), p134-140
7. Andrej Stritar, Radko Istenic: Public Debates about Nuclear Energy in Slovenia During1995/96. International Workshop on Nuclear Public Information in Practice, Brugge, 1997,Transactions, (1996), p. 32
8. Andrej Stritar: Lessons Learned from Public Debates about Nuclear Energy in Slovenia During1995/96. Nuclear Energy in Central Europe, Porotoroz, 3996, Proceedings, (1996), p. 546-552
9. Andrej Stritar: Informing Public about Nuclear in Slovenia. Pacific Basin Nuclear Conference1998, Banff, 1998.
10.Andrej Stritar, Radko Istenifi: Changing perception about nuclear power in Slovenia in thechanging political climate. International Workshop on Nuclear Public Information, Maastricht,1998, Transactions, (1998).
406 Nuclear Energy in Central Europe '98

SI0100136
Nuclear Energy in Central Europe '98
I 1 S S Terme Catez, September 7 to 10, 1998
Radiation Protection Courses in the Milan Copic Nuclear TrainingCentre
Matjaz Kozelj, Andrej StritarMilan Copic Nuclear Training Centre
"Jozef Stefan" Institute, Ljubljana, SloveniaE-mail: matjaz,kozelj(a)ijs.si
AbstractWe have briefly described the legal framework for the radiation protectiontraining in Slovenia. The history of that activity at the Milan Copic NuclearTraining Centre in Ljubljana is than described with the detailed description andsummary of all performed courses.
Introduction
The beginning of the radiation protection education and training in the Milan Copic NuclearTraining Centre has been connected with courses on nuclear technology organised for KrskoNPP and supporting organisations. These courses, organised for more than two decades,include radiation protection as one of the principal subjects requested for licensing byRegulatory Authority. Training in the field of radiation protection is also basic requirementfor other persons permitted to work in Controlled Area of Krsko NPP. The scope and theapproach to the radiation protection were therefore adjusted to the Authority demands andcombined with other subjects on nuclear technology thus presenting a part strongly connectedwith the rest of the course. The organisation of the nuclear technology courses was originallyresult of co-operation of different Departments of "Jozef Stefan" Institute, but since 1989 thecourses are performed on regular basis in the Milan Copic Nuclear Training Centre.
Four years ago we decided to expand our activities in the field of radiation protection trainingand education to other workers with occupational exposure to ionising radiation and also toothers concerned with public exposure. Apart from nuclear technology the field ofoccupational exposures covers various practices in medicine, research, industry and evensome activities in tourist organisations. Activities in some public services and emergencyorganisations are also qualified as practice with occasional or potential exposure to ionisingradiation. The main characteristic of all these practices is diversity and variety regardingsources, exposure pathways and doses. Therefore it was necessary to develop and implementdifferent courses for different groups within the framework of current legislation. We copedwith this challenge involving radiation protection experts from our Institute and also fromother research, professional and educational organisations. With their help, we have managedto implement courses for well-defined groups of professional workers and also to develop anumber of custom-made courses for groups with specific demands.
Nuclear Energy in Central Europe '98 407

Legal framework
In 1981 "Jozef Stefan" Institute was authorised by Ministry of Health for different activitiesrelated to radiation protection and safety of radiation sources. This authorisation also includededucation and training in the field of radiation protection. At that time also the Regulations(Ref. 1) related to this field were approved. All these steps were done in support of initialoperation of Krsko NPP.
Regulations divided occupationally exposed workers to the nuclear and non-nuclear groupwith radiation protection professionals as a special third group that requires extensive trainingin this field. Short Syllabus (with addendum for nuclear workers) has been given and minimalduration of the course for each group has been defined. The shortest required courses (4hours) are for occasionally exposed workers in non-nuclear organisations, and the longestrequired course (200 hours) is for radiation protection workers in nuclear power plant.Different courses and their duration are presented on Fig. 1.
Required Course Duration According to 1981 Regulations
Radiation protection in Ni |
Radiation protection in other nuclear obje
Radiation protection in all other organisatu
Regularly exposed workers in NPP
Occasionally exposed workers in NPP
Medical/veterinary workers with university'
Medical/veterinary workers w/o university
Medical/veterinary workers occasionally exposed
Nondestructive exam, in industry - no radiography
Radiography and other sources
Miners in uranium mi ne
Other workers exposed occasionuly
Oh 50 h—r—100 h 150h 200 h
Figure 1
These Regulations have also established requirement of periodical verification of radiationprotection knowledge based on two years period for radiation protection workers and fiveyears period for all others.
Apart from these Regulations, there was additional requirement for nuclear workers imposedby Slovenian Nuclear Safety Administration. According to this requirement INPOrecommendations related to training of nuclear workers should be followed.
408 Nuclear Energy in Central Europe '98

In 1984 and in 1987 all aspects of radiation protection were legally covered when the federalLaw for Protection Against Ionising Radiation (Ref. 2) and related Regulations (also relatedto training - Ref. 3) were approved.
This Law and related Regulations are still in force, as well as Regulations from 1981. Withtime it became obvious that these Regulations were outgrown. Therefore the Ministry ofHealth appointed the special Commission in 1994. The assignment of this Commission was toreview current status and propose update for training in the field of radiation protection. TheCommission found the status in the field of nuclear training satisfactory and issuedrecommendations for radiation protection training of non-nuclear workers only. Theserecommendations should become part of new radiation protection legislation that is currentlybeing developed.
The Commission recommended that the course should consist of two parts: first part shouldbe fundamental and general and the second part should be specialised for different groups.The duration of general and special part of a course should be 10 hours each, i.e. the courseshould consist of 20 hours of lecturing and practical exercises and should be concluded withthe written exam. Course approach should be adjusted to participants with secondary schoolor academic education. The Commission also presented Programme for general part and forfive special parts aimed at five different target groups of participants: those working withunsealed sources, therapeutical sources, industrial sources, for miners and radiologists.
Although not yet obligatory, these recommendations serve us as a framework for our courses.We use them also as a starting point for other courses, organised for people not workingprofessionally with sources of ionising radiation. Their occupational exposure is connectedwith higher concentration of natural radioactivity or it is potential exposure for thoseparticipating in possible emergency response to nuclear accidents. There is no mandatoryprogramme for these groups so we have created our own with approval from competentauthority. These custom-made courses are therefore recognised to be in harmony with ourlegislation.
Nuclear Technology Courses
Since 1975 there have been 25 Nuclear Technology Courses in "Jozef Stefan" Institute. At thebeginning these courses were oriented toward introduction of technology and knowledgeindispensable for construction of Krsko NPP, but later they evolved into introductory coursesof nuclear technology for licensed personnel and technical staff. Course programmes werecompiled according to international recommendations with obligatory inclusion of radiationprotection training and education.
In mid-eighties two forms of Nuclear Technology Courses were developed together with theTraining department of NPP Krsko. The more extensive one is intended as introductorycourse for potential licensed personnel and for members of engineering staff. The duration ofthis course is 30-35 weeks with very demanding and condensed schedule with regular weeklyexamination. Practical exercises and site visits are also part of the course. This form of thecourse retained the name Nuclear Technology Course.
The shorter, less extensive course is now called Basic Nuclear Technology Course. Theduration of this course is approximately 10 weeks and is intended for technical staff of KrskoNPP and also for others who need an overview of nuclear technology. This course is slightly
Nuclear Energy in Central Europe '98 . 409

less demanding for participants than the longer one, but not less condensed and also withregular weekly examination, practical exercises and site visits.
The extent of radiation protection and relevant contents is very similar for NuclearTechnology and Basic Nuclear Technology Course. In both cases it is well above the levelrequired by the legislation. On Fig. 2 the comparison between legally required number ofhours, radiation protection with related contents number of hours and course duration is givenfor both courses.
Up to now there were 21 Basic Nuclear Technology Courses and 7 Nuclear TechnologyCourses (one is in progress now) with 309 and 113 participants respectively. On Fig. 3, Fig. 4and Fig. 5 the number of courses, the number of course participants and participant-weeks arepresented on annual basis.
Duration of Nuclear Technology Courses
Nuclear Tecnology
Basic Nuclear t - - —*"*""""270 h'Tecnology I" " ^ " 3 ^ 8 8 hf
656 hi
Oh 100 h 200h 300 h 400h 500h 600h 700 h
• Relevant to Radiology Protection B Course Duration • Required by Regulations
Figure 2
Number of Nuclear Technology Basis and Nuclear Technology Coursesper Year
Fi J
J,1 1
11
t J
1
1
1
-
75 76 77 78 T) 81) 8J 82 83 84 85 86 87 89 90 n 92 93 94 95 96 97
0 Basic Nuclear Technology S Nuclear Technology
Figure 3
410 Nuclear Energy in Central Europe '98
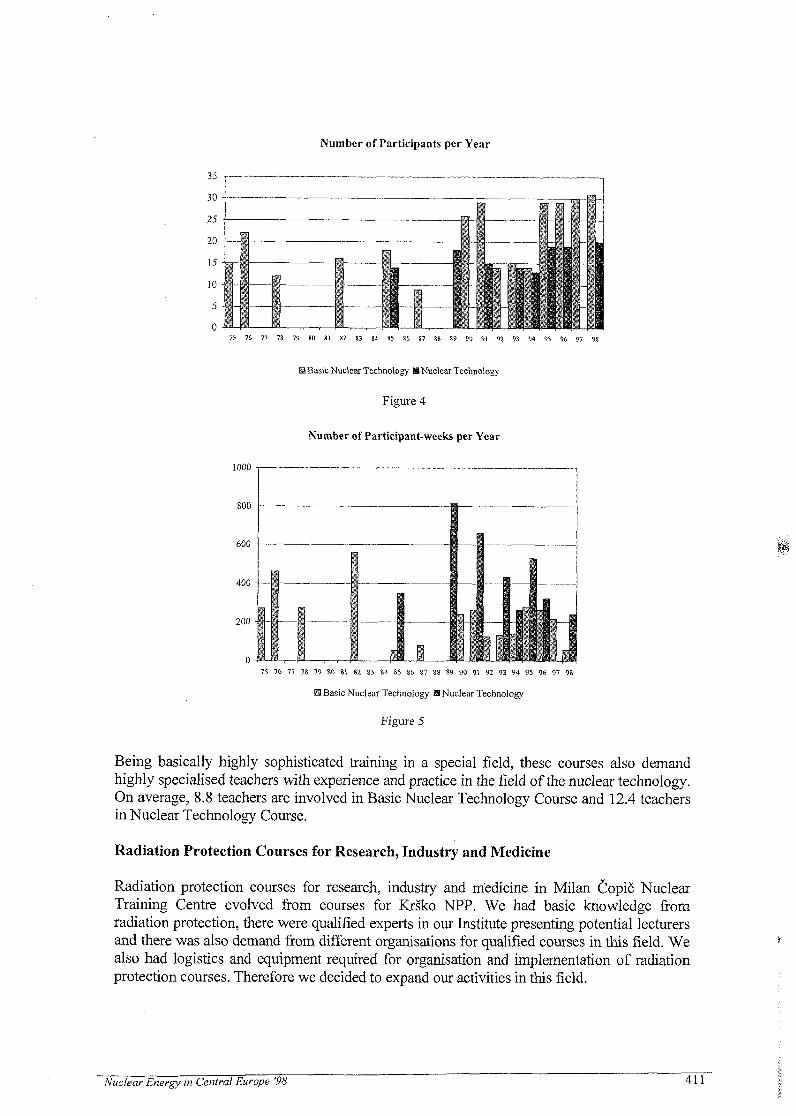
Number of Participants per Year
75 76 77 78 79 81) 8] 82 83 84 85 86 87 88 89 90 9] 92 93 94 95 96 97 98
• Basic Nuclear Technology HI Nuclear Technology
Figure 4
Number of Participant-weeks per Year
1000 -r
600
400
200 -
JL75 76 77 78 79 80 81 82 83 84 85 86 87 88 89 90 91 92 93 94 95 96 97 98
H Basic Nuclear Technology II Nuclear Technology
Figure 5
Being basically highly sophisticated training in a special field, these courses also demandhighly specialised teachers with experience and practice in the field of the nuclear technology.On average, 8.8 teachers are involved in Basic Nuclear Technology Course and 12.4 teachersin Nuclear Technology Course.
Radiation Protection Courses for Research, Industry and Medicine
Radiation protection courses for research, industry and medicine in Milan Copic NuclearTraining Centre evolved from courses for Krsko NPP. We had basic knowledge fromradiation protection, there were qualified experts in our Institute presenting potential lecturersand there was also demand from different organisations for qualified courses in this field. Wealso had logistics and equipment required for organisation and implementation of radiationprotection courses. Therefore we decided to expand our activities in this field.
Nuclear Energy in Central Europe '98 411

In 1994 we organised two courses, one for officers of Slovenian army and one for miningengineers. These two courses were aimed at special target groups and course programmeswere "job oriented" toward their particular needs.
Courses we have organised since could be divided in two groups. First groups are coursesorganised for particular professionals from different organisations. These professionals usesources in their work on regular basis. Second group are courses for members of differentorganisations and services involved with potential exposure or exposure to higherconcentration of naturally occurring radioisotopes. This second group of custom-madecourses we are going to discuss later.
We co-ordinated our efforts in course preparation with Health Inspectorate in order to meettheir requests and also for adjusting to recommendations of the Commission, as mentionedbefore. According to the needs and our resources, we decided for courses related to unsealedsources, industrial sources and elevated natural radioactivity, found in certain mines.
The course for unsealed sources covers medical research application of these sources. Thecourse for industrial sources covers radiography sources, detectors and measurementequipment. The course for miners covers the problem of radon in mines, caves and alsodwellings to some extent.
For members of our Institute we prepared the course oriented toward research applications ofionising radiation originating from sealed and unsealed sources like nuclear reactor oraccelerator. This course is also suitable for other research organisations.
All these courses comply with our current legislation (Ref. 1) also regarding the requiredduration (see Legal Framework). The radiation protection Course is obligatory for beginners,but we came to the conclusion that it is very useful to have shorter "refreshment" courses forthose who have to be re-examined. These courses are usually shorter (one day typically withexam) and they are abbreviated versions of standard courses.
In both cases, for standard and for refreshment course, we try to adapt the course content andpresentations to participants. This is done with course content readjustment and with properselection of lecturers. The discussion on these subjects and other aspects of courseproblematic can be found elsewhere (Ref. 4).
Once developed, courses are organised on regular basis. Since 1994, there were 12 standardcourses covering industrial, unsealed and research sources with 176 participants and 5refreshment courses with 168 participants. The average number of lecturers per course is 5.4for standard course 4.8 for refreshment course. Number of courses per year, number ofparticipants per year and number of participant-weeks could be found on Fig. 6, Fig. 7 andFig. 8 respectively. On these figures also the custom-made courses are represented.
Custom-made Radiation Protection Courses
This last group of courses were prepared to satisfy the particular needs of particularorganisations or public services whose members are either potentially exposed or are exposedto elevated levels of natural radioactivity. Courses were organised for police officers involvedwith possible emergency response to nuclear accident in Krsko NPP, health inspectorsresponsible for assessment of the consequences to food chain and environment in case of such
~AVJ. ~~ ~ • Nuclear Energy in Central Europe '98

accident, custom officers controlling the international transport of various goods, workers inorganisation with technologically elevated concentration of naturally occurring radionuclidesand people working in environment with elevated radon concentration. These groups ofpeople are homogeneous regarding education, knowledge and required approach.
For each of these courses we had to prepare special programme to cover their particular needsand also to compensate for their lack of knowledge on radiation sources and effects.Preparations were demanding and also extensive with freshly developed written material andpractical exercise as result.
The number of participants at these courses was higher and the number of teachers involvedper course was lower then on other courses. We organised 8 courses with 493 participants andwith 3.9 teachers per course on average.
Number of Courses per Year
96 97
9 Standard O Refresher O Custom-made
Figure 6
Number of Participants per Year
98
300
200
100
94
29
HI
90
153
ru266
24
Hi12
92
48
HJ47
6HBN
88
95 96
H Standard D Refresher S Custom-made
Figure 7
97 98
Nuclear Energy in Central Europe '98 413

Number of Participant-weeks per Year
150 -r- -
94 97 98
I Standard H Refresher • Custom-made
Figure 8
Conclusion
Since 1975, when the activities connected with Krsko NPP started at our Institute, there were28 courses of Nuclear Technology with 422 participants. All these participants were properlytrained in the field of radiation protection. These activities were widely enhanced since 1989,when Milan Copic Nuclear Training Centre was founded. In 1994 we decided to participatealso in the training of other professionals and people connected with radiation sources. 26courses for 856 participants were organised for that purpose. 60% of participants were peoplenot using radiation sources professionally.
For the future we predict that the number of Nuclear Technology Courses per year and thenumber of introductory radiation protection courses per year would stay constant, coveringyoung workers employed by different organisations. The number of refresher courses wouldincrease periodically due to legal demands. The number of courses for non-professionals ishard to predict, but there is no reason for pessimism as the permanent education and repetitivetraining are obligatory for all professions we have met on our courses.
References
1. Regulation on Required Education, Working Experience and Obligatory Training of Workers Using Sourcesof Ionising Radiation or Working in Radiation Protection Services, and on Verification of TheirCompetence, Off. Gaz. SRS, 9/81.
2. Act on Radiation Protection and the Safe Use of Nuclear Energy, Off. Gaz. SFRY, 62/84.3. Regulations on Conditions for Radiation Workers, Off. Gaz. SFRY, 40/86.4. Matjaz Kozelj and Andrej Stritar, Contribution to the Practical Experience in the Field of the Radiation
Protection Education, Nuclear Energy in Central Europe, Portoroz, Slovenia, 16-19 September 1996, 524,1996.
414 Nuclear Energy in Central Europe '98

SI0100137
Nuclear Energy in Central Europe '98
Terme Catez, September 7 to 10, 1998
NPP KRSKO FULL SCOPE SIMULATOR VERIFICATION ANDQULIFICATION
B.Krajnc, B.GIaser, M.Novsak, J.SpilerNPP Krsko Engineering Services Division
Krsko, [email protected], [email protected],[email protected], [email protected]
Abstract
NPP Kr§ko (NEK) will, as a part of the Modernization plan, obtain also KrSko Full Scope Simulator(KFSS). Contract has been awarded to CAE Electronics for the design, construction and integration. KFSSwill support in real time, the trainning for the complete range of operation which can be performed from themain control room and some selected plant areas (remote shutdown panels, etc). Based on the lessons learnedon development of NPP KrSko Basic Principle Simulator we decided for active approach. That means thatNPP KrSko personnel will be heavily involved into all phases of KFSS development and testing. Since NPPKrSko is going to replace the existing steam generators, raise the nominal power and perform necessarymodifications to support the power uprate, it was decided that the development of the KFSS will beconducted in two steps:
1. Development of the models as well as all the hardware interface in the MCR for the existingplant -Cycle 15 and then
2. Models and hardware will be modified, added or replaced as needed to take into account thesteam generator replacement and plant uprate projects.
In spite of the fact that the simulator will be used for the training of the plant operators for theuprated conditions and with new steam generators, the upper described approach was selected since we wantto be sure that the models will at the beginning adequately simulate the existing plant. For the existingconditions we have available reference data for different plant conditions, as well as data for different planttransients. By verifying that simulator will be able adequately simulate the existing conditions the level ofconfidence for the "uprated" simulator will be much higher. This is of special importance since it will supportinitial training for modernized plant conditions.
In this paper the plan for verification and qualification of KFSS as well as the amount of the workneeded on NPP KrSko side to develop the test acceptance criteria will be presented.
1.0 Intoduction
As part of the modernization plant NPP Krsko will obtain full scope plant specificsimulator. Significant test plan will be developed and performed to verify as much aspossible that the models adequately simulate the behavior* of the real plant during its allpossible states (normal, abnormal and accident conditions). To be able to support datarequirements for the existing plant configurations tests and uprated plant tests, significanteffort is needed. Due to that NPP Krsko started the program of development andverification of the RELAP5/mod2 plant specific model, which should assure data - bestestimate analysis results, for the major design bases accidents and transients. Similarly theeffort started on collection of process information system records of different planttransients and steady state data at different plant configurations and power levels.
Nuclear Energy in Central Europe '98 415

2.0 Licensing requirements
Regarding the licensing requirements it was clear from the beginning of the project that theANSI/ANS 3.5 standard [1] will be used in the licensing process. This standard establishes
the functional requirements for full scope nuclear power plant simulators in the UnitedStates but became an international'standard used throughout the world. It stipulates theminimum standard for scope and performance criteria of simulated operations andmalfunctions, testing and maintenance. Slovenian Nuclear Administration (SNA) acceptedthis standard as a basis for the licensing of NPP Krsko specific full Scope Simulator.
3.0 NEK requirements - scope of simulation
For the NPP Krsko specific full scope simulator it was decided to implement it in twoconfigurations. First simulator models - configuration development will be based onexisting design, while second will incorporate all changes due to steam generatorreplacement and power uprate. This approach was selected due to the fact that thesimulator will be developed in parallel with other projects of the Modernization program(Replacement Steam Generator (RSG) - design, manufacturing and delivery of new steamgenerators, Software Services (SS) - performance of required safety analysis and plantoperation justification at higher power and Steam Generator Replacement (SGR) - actualsteam generator replacement and implementation of power uprate related modifications).Regarding the scope of simulation it was requested that KFSS shall be capable to simulateplant behavior in all its possible states:
• plant normal operation including draining of the primary system and mid loopoperation with and without nozzle dams installed;
• abnormal plant operation during any of the normal operation states;• accident operation:
• design bases accidents as well as• beyond design bases accidents
In order to ensure a reliable benchmark, acceptance testing and verification will be dividedinto several phases. First the acceptance tests will be performed for the existing plantconfiguration - models. In next phase the second KFSS model - uprated plant with newsteam generators will be verified - tested.
4.0 KFSS test plan
Verification and testing of NPP Krsko plant specific full scope simulator can be dividedinto five phases:
1) Factory Acceptance Tests (FAT) for the existing plant configurationmodels.The purpose of this testing is to verify that the plant specific simulator iscapable to simulate all requested states and that the simulation meets the criteriaestablished in ANSI/ANS 3.5 standard [1]. For this scope of testing thesimulator vendor will develop Test Plan which shall per NPP KrskoSpecification [1] (contractual document) contain the following sections:
• Hardware Inspection and Verification
4 ] 6 Nuclear Energy in Central Europe '98

••• Computer Systems Tests including Stimulated Process Information System• Simulator Control Systems Tests• Simulator Performance Tests
• Initial Conditions Verification at different modes and core cycleconditions
• Continuous Plant OperationCold Shutdown to 100% Power to Cold Shutdown in ContinuousOperation by Plant Procedures
• Induced Transient Tests• Malfunction Tests
• All Malfunctions Individually• Selected Multiple Malfunction Tests
• Remote Shutdown Panels Tests• Core Performance Tests• Systems Tests
Verification of Any Systems Not Tested by Above Procedures• Establishment of Deliverable Initial Conditions
Discrepancies identified during the testing will be analyzed and corrected beforeshipment to the site.
2) Factory Acceptance Tests (FAT) for the uprated plant configuration -modelsWithin this scope of testing all the tests affected by plant uprate and steamgenerator replacement will be repeated. This mean that mainly Simulatorperformance tests will be performed - repeated. Again, the purpose of thosetests will be to prove that the simulator is capable to meet the requirements -criteria established in ANSI/ANS 3.5 standard [1],Discrepancies identified during the testing will be analyzed and correctedbefore shipment to the site.
3) Free testing by purchaser - NPP KrskoFor this phase of testing NPP Krsko will develop its own test plan which will befocused mainly on the areas not covered by tests described above. Those are:
• Simulation of some abnormal and accident conditions during mid loopoperation as well accident conditions during operation in Mode 6 (forexample loss of RHR cooling with Rx vessel open and containmentclosed).
• Simulation of some plant specific transients induced by balance of plantsystems - instrumentation malfunctions, outside reasons. Transients testare not included in FAT test plant in phase 1 due to either time or datalimitation (for example low pressure and high pressure feedwaterreheaters isolation and turbine runback operation or transmission linesfault, etc.).
• Simulation of severe accidents including containment response onreactor vessel failure and molten core concrete interaction.
Discrepancies identified during the testing will be analyzed and corrected beforeshipment to the site.
Nuclear Energy in Central Europe '98 417

4) Site Acceptance Tests (SAT) - Phase 1The purpose of this set of testing is to repeat the limited number of tests alreadyperformed in the scope of Factory Acceptance Testing phase and to show thatthe simulator does function properly after transportation and reassembling it atthe site.Discrepancies identified during the testing will be analyzed and correctedbefore Ready for Training status will be declared.
5) Site Acceptance Tests (SAT) - Phase 2 (testing at the end of warrantyperiod)Since NPP Krsko will not have any real plant data for conditions after steamgenerator replacement and power uprate (pre-commissioning delivery of thesimulator) it will be necessary to verify simulator performance after completecycle of plant operation. During that time significant amount of plant data willbe obtained - recorded and archived through Plant Process System (PIS). Datawill be collected during steady state power operations (including transients ifexperienced) at different power levels and plant modes as well as duringwarranty tests for replacement steam generators and performance of somestartup tests (repeated due to power uprate).Discrepancies identified during the testing will be analyzed and correctedbefore the warranty period ends.
5.0 Acceptance Procedures Reference data
5.1 Industry practice
For the reference data for the acceptance testing of the simulator the following list of datasources could be used:
• recorded plant transients and steady state data;• best estimate analysis of transients and design basis accidents;• operator experience, expectations;• engineering judgement;• conservative analysis (USAR type of analysis);
As the simulator models are becoming better, it is becoming more important against whatthe results of simulation are compared. Lately the first two sources of data listed above arepreferred sources of data for the simulator acceptance testing.
5.2 NPP Krsko reference data5.2.1 Best Estimate Analysis
NPP Krsko as a plant operator is aware that only simulator that will go under schematicand detailed testing program will meet requirements and expectations. This is of specialimportance in such approach - precommisioning delivery, since the operators will first betrained at the simulator and then they will experience real plant behavior and response ontheir actions. That is why we decided that first the existing plant shall be modeled andtested first. After we will verify that the simulator is capable to simulate adequately theexisting plant, the required changes in the models due to power increase for 6.3% andsteam generator replacement will be implemented. After that the second set of tests will beperformed.
4 ] g Nuclear Energy in Central Europe '98

To be able to support data requirements for the existing plant configurations tests as wellas uprated plant tests, significant effort is needed. Due to that NPP Krsko started severalyears ago the program of development and verification of the RELAP5/mod2 plant specificmodel, which should assure data - best estimate analysis results for the major design basesaccidents and transients. Effort started in 1995 and was finalized this year. The updatedbest estimate RELAP5/mod2 nodalization includes all important components'of the NEKprimary and secondary side, simplified best estimate model of ECCS, protection systemtrips, and real plant control systems. The model is documented in two NEK TechnicalReports:
• NEK ESD TR 12/97" NEK RELAP5/mod2 Nodalization Notebook, June 1998[3] AND
• NEK ESD TR 13/97 "NEK RELAP5/mod2 Steady State and On TransientQualification Technical Report", June 1998 [4]
The model described within this documents has been developed with necessary fidelity ofgeometrical and operating parameters. It is verified against NEK steady state referencedata and data from selected transients.The described model [3] is suitable for calculation of all transients and accidents for whichRELAP5/mod2 can give reasonable predictions. The model as prepared can not be used forlarge LOCA beyond end of blowdown. In [4] additional data related to input preparation,verification of the model and restriction on model usage is available. In particular in [4]there is also a section on dynamic qualification of the model on four selected planttransients (reactor trip, closure of mains steam isolation valve (MSIV) on nominal power,closure of main feedwater isolation valve (MFWIV) on nominal power and opening ofpressurizer spray valve at nominal power).The model was subject to intensive and comprehensive review process (both internal andexternal), results of which are incorporated within [3] and [4].
For the Containment analysis computer program GOTHIC was selected. First GOTHICNPP Krsko Containment model (including containment heat removal systems) wasdeveloped in 1995. The analysis of Containment pressure increase after loss of RHR inMode 6 was documented in [5]. The Containment response analysis was done for selectednumber of transients where containment response analysis is applicable - Main Steam LineBreak [9], Loss of Coolant Accidents [10],..
For verification of the simulator response on design bases accidents the following analysishave been performed for the existing plant and will be repeated for the uprated plant:
• Partial (case a) and Total loss of main feedwater with (case b) and without AFWflow available (case c) documented in [6].
• Partial (case a locked rotor) and total loss of reactor coolant flow (trip of both RCP- case b) - (one train of ECCS available) documented in [7].
• Steam line rupture inside the Containment documented in [8].'• Stuck open PRZ PORV with emergency core cooling system inhibited documented
in [9.]• SB LOCA - 1 (case a) ,2(case b), 3 (case c) and 8 inch (case d) 4 CL break
(one/two trains of ECCS available) documented in [10].
Nuclear Energy in Central Europe '98 419

• ATWS with loss of main feedwater and AMSAC unavailable (case a) and AMSACavailable (case b) documented in [11].
• SGTR - double ended SG tube rupture documented in [12]• Manual Rx trip from 100% power documented in [13]
For each of the above selected transient analysis Technical Report was/will be prepared. Inthe report all the initial and boundary conditions are defined. This include operator actionsand equipment availability and status (for example one train of Emergency Cooling Systemunavailable and Rod Control System in Manual control). Each Technical report contain thegraphical presentation of all major parameters available in the MCR. For each of theparameters presented the table of data was also added (time, value of the parameter) in thesoft form - 3.5 inch diskette). This will assure easier data manipulation during testprocedure preparation and acceptance criteria verification. Usage of reference data indifferent testing phases is shown on Figure 1.
5.2.2 Recorded Data
NPP Krsko has since 1992 a modern Process Information System (PIS) capable to supportdata archiving either triggered manually or automatically (by status of selected variable).
Due to that the majority of selected transients is from the period between 1992 - 1998. InPIS archive we do have a records of different plant transients as well as steady state datafor different power levels (Cycle 15) and plant configurations.For normal power evolution and steady state point verification data was collected at thefollowing points, plant evolutions (Cycle 15 pant stratup after refueling):
• plant heatup• power escalation from 0% to full power• mid loop operation• hot standby• power 6% - conditions before generator synchronization on the grid• 25% power• 50% power• 75% power• 100% power
Recorded data for the following plant transients are available:• failure of PRZ spray valve at full power• inadvertent closure of MSI V at full power• inadvertent closure of FWIV at full power• OPAT turbine runback operation due to secondary side induced transient
(isolation of feedwater reheaters)
6.0 Conclusions
NPP Krsko is aware that even the KFSS will be state of the art product it has to go throughsystematic and detailed testing program to prove that it is cable to reproduce the real plantbehavior during its all possible states. Such simulator will significantly contribute toreliable and safe plant operation in the future. At the same time this will provide solidbases for licensing of the simulator according to US and domestic regulations.
420 Nuclear Energy in Central Europe '98

Figure 1. Phases of KFSS Performance Tests and usage of different reference datasource
KFSS Performance Tests
PIS recorded dataSteady state and
tranzient dataUp to CYCLE 15
Design BasesAccidents andtransients Best
Estimate Analysis- existing plant
Design BasesAccidents andtransients Best
Estimate Anlysis- uprated plant
Operationexperience
(experiencedoperators input)
Severa accidentsMAAP analysis
Factory AcceptanceTests (FAT) for the
existing plantconfiguration models
CYCLE 15
IFactory AcceptanceTests (FAT) for the
uprated plantconfiguration - modelsj
IAdditional testing by
purchaser - NPPKrsko
ISite Acceptance Tests
(SAT) - Phase 1Repetition of selected
FAT tests (mainlyrelated to hardware
testing
PIS recorded dataSteady state and
tranzient dataCYCLE 17, 18
Licensing processcompleted - Ready
for Training
Site AcceptanceTests (SAT) - Phase 2(testing at the end of
warranty period)
Verification and Qualification ofKFSS completed
End of warrant period
Nuclear Energy in Central Europe '98 421

7.0 References
[I] American Nuclear Society, "Nuclear Power Plant Simulators For Use In OperatorTraining", ANSI/ANS-3.5-1993, U.S.A;[2] NPP Krsko Procurement Specification of Services, SP ES-504, Plant Specific Full ScopeSimulator;[2] NEK ESD TR 12/97 "NEK RELAP5/mod2 Nodalization Notebook", Krsko 1998;[3] NEK ESD TR 13/97 "NEK RELAP5/mod2 Steady State and On TransientQualification Technical Report", Krsko 1998;[5] NEK ESD TR 07 /95 GOTHIC Analysis of Containment Pressure Increase After lossof RHR in Mode 6, Krsko, 1995[6] NEK ESD TR 14 /98 Analysis of Partial and Total Loss of Main Feedwater with andwithout AFW Flow Available, Krsko Avgust 1998;[7] NEK ESD TR 16 /98 Analysis of Partial and Total Loss of Reactor Coolant Flow,Krsko Avgust 1998;[8] NEK ESD TR 17 /98 Analysis of Steam Line Rupture Inside Containment, KrskoAvgust 1998;[9] NEK ESD TR 18 /98 Analysis of Stuck Open PRZ PORV With Emergency CoreCooling System Inhibited, Krsko Avgust 1998;[10] NEK ESD TR 19 /98 Analysis of Small Break LOCA (1, 2, 3 and 8 inch Cold LegBreaks), Krsko Avgust 1998;II1] NEK ESD TR 20 /98 Analysis of ATWS with Loss of Main Feedwater with andwithout AMSAC Available, Krsko Avgust 1998;[12] NEK ESD TR 21 /98 Analysis of Double Ended Steam Generator Tube Rupture,Krsko Avgust 1998;[13] NEK ESD TR 22 /98 Analysis of Manual Reactor Trip From 100% Power, KrskoAvgust 1998;
422 Nuclear Energy in Central Europe '98

SI0100138
Nuclear Energy in Central Europe '98
Terme Catez, September 7 to 10, 1998
The simulator NEK-MFS and its training status
Tomaz Setnikar, Oton Gortnar, Jelislav Kovacic, Franc Pribozic, Egon Srebotnjak, Andrej Stritar
Nuclear Training Centre, Jamova 39,1001 Ljubljana, SloveniaKrsko Nuclear Power Plant, Vrbina 12, 8270 Krsko, Slovenia
ABSTRACT - This paper presents the status and training possibilities on Krsko NPP Multi-Functional Simulator (NEK-MFS). Since spring 1997 it serves as a training facility in NuclearTraining Centre. During first year of operation the simulator NEK-MFS was found to be a very usefulKrsko NPP specific tool which is capable to support both the initial operator training program andlicensed operator retraining activities.
1 Introduction
In year 1995 the decision was made at Krsko NPP to start the development of Basic PrincipleSimulator (BPS) aiming to enhance the quality of plant training activities. The Frenchcompany CORYS was selected and a team of engineers was formed in Krsko NPP to preparenecessary input data, to cooperate with CORYS team during development process and toperform final tests of the simulator facility [1].
The first development phase started in spring 1996 by preparing input data for neutron-kinetics and thermal-hydraulic part of simulator models, and for electrical and reactorprotection systems. The development continued by building models of individual plantsystems. In a close cooperation with CORYS the Krsko NPP's team of engineers developedquite an important part of input models, especially those associated with plant controlsystems, reactor protection and electrical systems. The integration of individual systems intothe full simulator model was performed in January 1997.
Immediately after systems were integrated and the full model response was appropriatelytuned, the simulator was delivered to the training department of Krsko NPP. During twomonths of on-site testing period most evident model deficiencies were identified andsuccessfully eliminated. Thus, the delivery process was finished and in April 1997 the facilitywas moved to the Nuclear Training Centre (ICJT). The training group started withdevelopment of training materials and performing first training courses. In further cooperationwith CORYS several additional simulator deficiencies were eliminated and some modelresponses were improved. Altogether approximately 120 observation forms were solved andin March 1998 the warranty period ended with model revision 6.
During initial training activities the simulator was found to be a relatively complex and a veryKrsko NPP specific tool, which capabilities even surpassed the initially intended scope.Following the established simulator standards the device was decided to be characterized asthe Multi-Functional Simulator (MFS) instead as the Basic Principle Simulator (BPS).
Nuclear Energy in Central Europe '98 423

2 Configuration of the simulator NEK-MFS
The hardware configuration of the simulator NEK-MFS is mainly based on three Unixoperated SUN Sparc stations (two Sparc-20 and one Sparc-5), five large monitors, laserprinter and some other hardware components. The simulator software configuration isrelatively complex [2]. If simplified: the first Sparc-20 station performs numericalcalculations associated with the simulation of physical processes, the Sparc-5 station supportsthe graphics interface while the second Sparc-20 enables the simulator integration and servesas the instructor station.
reactor operator BOP operator
instructorposition
Figure 1: The simulator NEK-MFS environment (front view)
In NEK-MFS there are two trainees working places, the first one for reactor operator (RO)and the second one for balance of plant (BOP) operator. Each operator position has its ownkeyboard with mouse and two large displays (Figure 1). The man-machine interface is basedon approximately seventy "soft panels". These are easy to operate interactive images whichrepresents either soft copies of real plant panels or synoptic images of simulated systems(Figure 2). All the synoptic images are the same as used in real Krsko NPP ProcessInformation System (PIS). In addition, plant processes can be also explained using didacticalimages and analyzed on displays with trend curves.
2.1 Scope of the simulator NEK-MFS
The simulator NEK-MFS can perform real-time simulations covering wide range of plantoperating condition:
I. normal plant operation from depressurized cold shutdown with reactor vessel open to fullpower operation (and vice versa), e.g. mid-loop operation, solid reactor coolant systemoperation, reactor startup, plant heatup/cooldown, generator synchronization and poweroperation
424 Nuclear Energy in Central Europe '98

II. incidental and accidental situations, e.g. primary leaks, secondary leaks, steam generatortube ruptures, wide spectra of instrument failures and component malfunctions.
MFS display with real plant panel typical synoptic image
J•DDBanaaD iaqaaa aaa DDBIQDi aa a a g
aaa
J. L I . .
..Pi
example of didactical image display with MFS trend curves
Figure 2: Illustration of MFS man-machine interface (4 examples out of 70 panels)
There are several standard initial states available, which enable the initiation of exercise atdifferent power levels (from full power to cold shutdown) and different core ages (BOL,MOL and EOL). Instructors can also develop exercise specific initial states. Since during theexercise a periodic snapshot is taken every minute, it is possible to select any of recordedsnapshots and to repeat the simulation by changing or correcting the operator actions.
Instructor can insert any combination of malfunctions and change its status during thesimulation. Activation and value of each malfunction can also be associated with time elapsedor any selected plant parameter. Malfunctions can be divided into two groups:
• standard malfunctions of generic system components, e.g. pumps, valves, instrumentationchannels, electrical breakers, protection relays, etc.
• specific malfunctions, e.g. loss of coolant accidents up to 8 inch diameter, pressurizersteam space breaks, steam generator tube ruptures, steam line breaks, loss of heat sinkaccidents, anticipated transient without SCRAM, etc.
Nuclear Energy in Central Europe '98 425

2.2 NEK-MFS modeling tools
NEK-MFS is based on CORYS codes for modeling and calculation of plant physicalprocesses. The construction and modification of input decks representing real plant systemsare supported by CAD-type graphical modeling tools.
• Neutron kinetics calculations are performed by code DINOSOR ID, which considers twoenergy neutron groups and six precursor groups. Krsko NPP specific input model includes10 axial zones and is able to simulate the spatial Xe-oscillations.
• The simulation of thermal-hydraulic processes in reactor coolant system and part ofsecondary system is powered by nonequilibrium two-phase flow model DRAC. Thermalhydraulic processes in other plant systems are modeled and calculated by HYDRAULIXcomponent, which is based on equilibrium model of two-phase flow also containingnoncondensible gases.
• The NEK-MFS component ELECTRIX describes generators, plant electrical network andits consumers. In connection with models of plant control systems it enables the realisticsynchronization of main generator and both diesel generators.
• A component of special importance is CONTROLIX. It simulates components associatedwith plant instrumentation, control systems and protection system. Approximately 550input decks with plant specific logic diagrams were developed realistically implementingthe system of interlocks, channel redundancy and coincidence logic.
• The DRO component is a graphic tool which supports the man-machine interface. Itenables the construction and modification of all NEK-MFS "soft panels".
There are also some other CORYS tools included into NEK-MFS code package to support themaintenance and simulator configuration.
3 Basic NEK-MFS training approach
As a plant specific tool, the simulator NEK-MFS can support both the initial operator trainingprogram (Phases I and II) and the experienced operator retraining.
initiitrain
lling
incidentaloperation
NPPsystems
reactorkinetics
man-m.nterface
thermaJ-hydraulics
combinedevents
instrum. &control
opret
AOP
lessonplans
GOP
eire
atorlining
EOP
initialstates
trainingscenarios
0
instructorknowledge
simulatormaintenance &development
Figure 3: A schematic overview of NEK-MFS training application
426 Nuclear Energy in Central Europe '98

When implemented in initial training NEK-MFS contributes to understanding of physicalphenomena and system operation during normal or accidental plant operation, while inoperator retraining it enables the consolidation of operator skills associated with Krsko NPPspecific General Operating Procedures (GOP), Abnormal Operating Procedures (AOP) andEmergency Operating Procedures (EOP). All training activities must be supported byqualified instructor knowledge, well prepared training materials and good maintenance of thefacility (Figure 3).
3.1 Application of NEK-MFS for initial training
The simulator NEK-MFS has been included into initial training program in form of SimulatorExercises. They supplement lectures in following areas:
area of initial training
reactor physics
thermal-hydraulicprocesses
plant systemspresentation
instrumentation andcontrol
man-machine interfacesolutions
incidental plantoperation
contents of associated NEK-MFS exercises
• neutron cycle and subcritical multiplication• achieving reactor criticality• reactor power operation• Xe-poisoning effects• phenomenological description of plant processes using NEK-
MFS didactical images• analysis of energy and mass balances in pressurizer, steam
generator, reactor coolant system and turbine• description of plant systems using NEK-MFS synoptic images• practical demonstration of system operation, e.g. CVCS and SI
lineup• load reduction transient and comprehension of basic plant
control principles• analysis of RCS heat accumulation and need for feed-forward
control of average coolant temperature• analysis of SG level swell/shrink and need feed-forward control
of SG liquid levels• sensitivity study of RCS pressure control• reactor control panel• nuclear instrumentation panels• turbine control panel• diesel generator panels• annunciator panels• instrument failures• initial emergency operating procedures training
After being delivered to Nuclear Training Centre the simulator NEK-MFS was used forfollowing initial training activities:
• In year 1997 it was first involved into two eight-week courses Basics of Power ReactorTechnology which were intended for personnel not working in main control room.
• Currently (during 1998) it is regularly implemented in a nine-month course Power ReactorTechnology, which represents the initial phase of operator licensing program.
Simulator Exercises were supported by instructor lesson plans, training materials to bedistributed to trainees and necessary MFS initial states.
Nuclear Energy in Central Europe '98 All

3.2 NEK-MFS and operator retraining
During first year of the NEK-MFS simulator application five modules have been formed foroperator retraining purposes:
I. General Operating Procedures (GOP)II. Instrumentation failures and Abnormal Operating Procedures (AOP)III. Accidents and Emergency Operating Procedures (EOP)IV. Analysis of normal plant transientsV. Analysis of abnormal plant transients.
3.2.1 Module I: General Operating Procedures (GOP)
This module is divided into classroom lectures and simulator exercises. It covers proceduresto bring the plant from cold shutdown to full power operation and vice versa. Somecharacteristic operations are written down to illustrate NEK-MFS training capabilities:
• solid reactor coolant system operation• pressurizer heatup and steam bubble formation• maintaining hot standby condition and coordination of reactor- and BOP-operator actions• main steam line heatup, turbine rolling and generator synchronization• load changes• plant cooldown using steam dumps or power operated relief valves• putting residual heat removal in operation• pressurizer cooldown and filling up to solid operation.
The GOP-module was the first operator retraining module fully covered by training materials:all necessary MFS initial conditions were prepared and lesson plans were written fortransients from cold shutdown to full power operation. The simulator specific version ofGOPs was printed in which all non-MFS-applicable steps were shadowed.
3.2.2 Module II: Instrumentation failures and Abnormal Operating Procedures (AOP)
Second operator retraining module covers instrument failures which may influence plantcontrol systems response. In these cases, appropriate operator actions are required byAbnormal Operating Procedures (AOP) and Technical Specifications (TS). The module dealswith instrument failures associated with following control systems: rod control, pressurizerpressure and level controls, steam dump control and steam generator level control system.
3.2.3 Module III: Accidents and Emergency Operating Procedures (EOP)
EOP-module is associated with accidental plant operation.. First, it includes the classroomcomprehension of basic physical phenomena and basis of emergency operating procedures.Classroom lessons continue with simulator exercises in which operators are requested tomanage simulated accidental situations using both EOPs and critical safety function statustrees. Until now basic events like loss of reactor coolant accidents, steam generator tuberuptures, steam line breaks and loss of heat sink were included into operator retrainingprogram. Lesson plans for combined and more complex accident scenarios are beingprepared.
423 Nuclear Energy in Central Europe '98

3.2.4 Module IV: Analysis of normal plant transients
This module was developed to improve the understanding of reactor kinetics phenomenafollowing reactivity changes at different reactor power levels: source range operation, poweroperation below point of adding heat and power operation with temperature feedback effects.Exercises include classroom calculations of power responses following reactivity insertionsand practical simulator exercises checking previously calculated curves. Following exerciseswere developed:
• subcritical multiplication and source range detector response• 1/M plot while approaching reactor criticality• power response following the step reactivity change below point of adding heat• power transient based determination of startup rate (SUR) and doubling time• determination of startup rate based on reactivity insertion using the INHOUR equation• SUR based calculation and simulation of reactor power transient• power changes and temperature feedback effects• achieving P-6 condition after reactor trip.
3.2.5 Module V: Analysis of abnormal plant transients
Calculation exercises and transient analyses of following abnormal plant events are includedinto fifth operator retraining module:
• uncontrolled closure of main steam valve at different power levels considering eitherautomatic or manual operation of rod control system
• increased secondary site steam demand by relief valves failure at power operation or atpower levels below point of adding heat (POAH)
• small rod withdrawal or insertion at power operation or below POAH• emergency boration at power operation or below POAH.
4 Development of training materials
The development of written training materials started simultaneously with preparation of firstsimulator training courses. The approach was similar to methods on full scope simulators:each simulator exercise had to be supported by training scenario and associated instructorlesson plan.
Training scenario defines objectives and critical tasks of simulator exercise. It also containsinformation necessary to start the simulation, e.g. description of selected initial state andchosen combination of initial events (Figure 4).
Since instructors must be satisfactorily prepared to guide and supervise trainees activities,they have to write lesson plans. Typical lesson plan mainly consists of comments of ongoingactions and processes, which should be presented to trainees during the exercise. In addition,there are also short notices about where to find the most interesting information and access tothe simulation - note that there are approximately 70 interactive displays available in thesimulator NEK-MFS.
Nuclear Energy in Central Europe '98 429
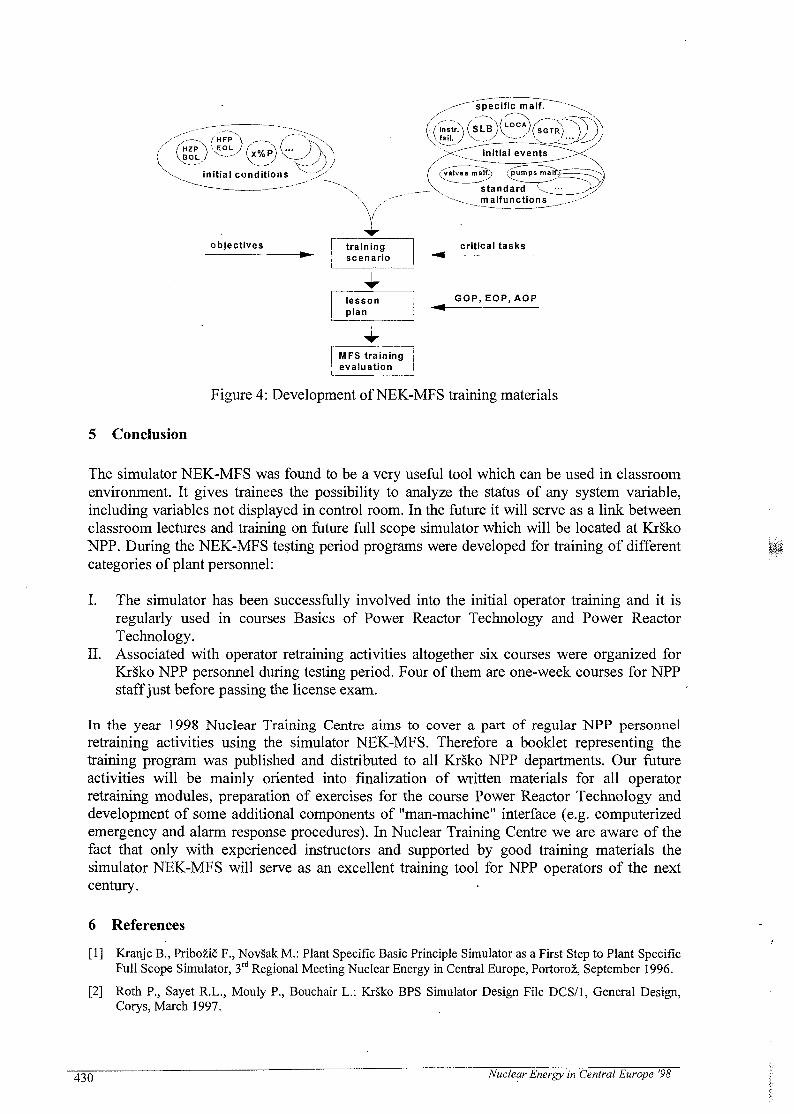
specific malf.
Dlessonplan
GOP, EOP, AOP
MFS trainingevaluation
Figure 4: Development of NEK-MFS training materials
5 Conclusion
The simulator NEK-MFS was found to be a very useful tool which can be used in classroomenvironment. It gives trainees the possibility to analyze the status of any system variable,including variables not displayed in control room. In the future it will serve as a link betweenclassroom lectures and training on future full scope simulator which will be located at KrskoNPP. During the NEK-MFS testing period programs were developed for training of differentcategories of plant personnel:
I. The simulator has been successfully involved into the initial operator training and it isregularly used in courses Basics of Power Reactor Technology and Power ReactorTechnology.
II. Associated with operator retraining activities altogether six courses were organized forKrsko NPP personnel during testing period. Four of them are one-week courses for NPPstaff just before passing the license exam.
In the year 1998 Nuclear Training Centre aims to cover a part of regular NPP personnelretraining activities using the simulator NEK-MFS. Therefore a booklet representing thetraining program was published and distributed to all Krsko NPP departments. Our futureactivities will be mainly oriented into fmalization of written materials for all operatorretraining modules, preparation of exercises for the course Power Reactor Technology anddevelopment of some additional components of "man-machine" interface (e.g. computerizedemergency and alarm response procedures). In Nuclear Training Centre we are aware of thefact that only with experienced instructors and supported by good training materials thesimulator NEK-MFS will serve as an excellent training tool for NPP operators of the nextcentury.
6 References
[1] Kranjc B., PriboziS F., Novsak M.: Plant Specific Basic Principle Simulator as a First Step to Plant SpecificFull Scope Simulator, 3rd Regional Meeting Nuclear Energy in Central Europe, Portoroz, September 1996.
[2] Roth P., Sayet R.L., Mouly P., Bouchair L.: Krsko BPS Simulator Design File DCS/1, General Design,Corys, March 1997.
43 0 Nuclear Energy in Central Europe '98
SI0100139
Nuclear Energy in Central Europe '98
Terme Catez, September 7 to 10, 1998
Evaluating Human Actions for a Shutdown PSA
Leo Shanley and Thomas Naum Ivica Basic and Igor FifnjaERIN Engineering and Research, Inc. Nuklearna Elektrarna Krsko740 Springdale Drive, Suite 110 8270 KrskoExton, PA 19341 Vrbina 12USA Slovenia
ABSTRACT
The Nuclear Power Plant Krsko Probabilistic Shutdown Safety Assessment (PSSA) was recentlyenhanced to refine the modeling and quantification of human errors during shutdown operations. Theuse of EPRI's ORAM software allows for human error probabilities to be~ calculated based on thetime available to perform an action, which varies considerably during shutdown operations andtypically has a significant impact on human error probabilities. The enhanced human actionmodeling uses a cause-based methodology for most response times. For short times, such as early inan outage with reduced inventory, the human error probability calculation is based on an empirical,time-based analysis. Operator interviews provided a basis for calculations in both methodologies.An analysis was performed to determine the impact of human actions on the quantified core damagerisk and the factors contributing to important human actions.
ORAM PSSA METHODOLOGY
ORAM is a software tool developed by EPRI for evaluating outage risk using deterministicand probabilistic evaluations. The Probabilistic Shutdown Safety Assessment (PSSA)module of ORAM allows for a plant specific model to be developed and used to calculateoutage risk (e.g., Core Damage Frequency - CDF) based on the actual configurations presentduring an outage. Event trees are used to calculate CDF using sequences that initiate from aloss of decay heat removal event. Each unique configuration is evaluated separately, so thefactors that significantly affect the CDF quantification are explicitly evaluated. In this way,ORAM differs from traditional shutdown PSA analyses and provides greater insights into thesignificant contributors to calculated risk during an outage. Configuration information, suchas decay heat level, RCS configuration, equipment status and risk significant activities aretracked throughout the outage. Each unique configuration is evaluated using time- andconfiguration-dependent variables, which are based on component availability, decay heatlevel and RCS status.
THE ROLE OF HUMAN ACTIONS IN THE ORAM PSSA
Human action failures play a major role in the evaluation of shutdown risk. In general,recovery from most adverse events while in the shutdown condition requires significanthuman recovery actions to prevent core damage. During at power operations, automaticsafety system actuations are important in preventing undesirable end states (e.g. core
Nuclear Energy in Central Europe '98 . 431

damage). Human intervention is typically needed to recover from system failures or toperform long term actions. However, the shutdown condition is very different. Following aloss of decay heat removal, the operator attempts to recover the normal mode of decay heatremoval. If that mode fails, the operator must initiate alternate means to remove heat fromthe reactor. Nearly all the steps involved in these recovery strategies require operator action,since very few automatic actuation systems are available in the shutdown mode to assist theoperator.
For example, following a loss of offsite power (LOOP) event, the emergency dieselgenerators will automatically start and energize the safety related electrical buses. However,the Residual Heat Removal (RHR) pumps must be restarted by the operator, since the pumpsdo not restart automatically. If the RHR pumps fail to restart or subsequently fail, theoperator must evaluate the situation and determine how to re-establish decay heat removal. Inthis example, the two human actions that must be explicitly evaluated are failure of theoperator to restart the RHR pump(s) and failure of the operator to establish alternate decayheat removal (ADHR). The operator's failure probability is based on different factors, manyof which are determined by the • configuration of the plant (e.g., is the RCS full or atmidloop?) and the decay heat level, which sets the bounds on the time available for theoperator to respond. These factors are tracked in the ORAM software and the humanreliability analysis (HRA) takes them into account.
The ORAM analysis also considers human action failures implicitly. The failure probabilityof the operator, for certain recovery actions, is not explicitly quantified using an HRAmethodology. Rather, industry data collected over several hundred shutdown years is used todetermine the probability of recovery from certain initiating events. For example, data hasbeen collected to determine the time required recovering from a loss of shutdown cooling dueto inadvertent RHR system isolation. This data is used to develop a time-based probability ofnon-recovery from the initiator. This data is strictly empirical and includes the potential forequipment failure; it is not included in the scope of this paper.
Most human actions evaluated in the ORAM PSSA are complex, multi-step actions. In theexample of the LOOP event described earlier, two human actions are discussed. The firstaction involves a simple procedural step, that is, to restart an RHR pump following a loss ofoffsite power. However, the second action, establishing an alternate mode of decay heatremoval involves many steps in more than one procedure. The HRA methodologiesdescribed in the following sections are used for both simple and complex actions. Complexactions are broken down into discrete steps for analysis, but the failure probability of theentire action (e.g., establish alternate decay heat removal) is quantified to obtain a singlehuman error probability (HEP)
METHODOLOGY
Two methods of quantifying human action failure probabilities are used in the NPP KrskoPSSA model. They are the time-based Human Cognitive Reliability / Operator ReliabilityExperiments (HCR/ORE) Correlation and the Supplementary Cause-Based Approach bothdeveloped by EPRI [1]. The use of the cause-based methodology is an enhancement to theoriginal Krsko PSSA model, in which only the HCR/ORE method was utilized.
422 ~~~~ ~~ Nuclear Energy in Central Europe '98

The PSSA model uses the time-based approach during periods when the excess time is short(e.g., less than 15 minutes). Excess time is the difference between the time available to theoperator and the time required to diagnose and perform the action. The cause-based approachis used during periods when the excess time is longer.
HCR/ORE Correlation
The time-based approach relies on simulator exercises, operator interviews and analysis ofoperating procedures to determine the mean crew response time for various actions. To calculatethe human error probability, the ORAM software compares the response time with the timeavailable to perform the action.
hi the case of the NPP Krsko model, simulator exercises were not available to use asbenchmarks for crew response time. Instead, operator interviews were conducted, in which theoperators were requested to provide time estimates for each step of the procedure beingmodeled. This data was used as the basis for the median crew response time (T1/2). In order tocalculate the HEP, a formula is used in the ORAM event tree to compare the mean responsetime with the actual time available (e.g., time to core damage) for each configuration in theoutage. The formula used is provided by the EPRI HCR/ORE analysis [1]:
P c = Prob (Tr > T) = 1 - <j> [ (In (T/T1/2))/CT]
where:Pc Crew non-response probabilityTr Crew's actual response timeT Time available for successful response (total time available minus time
required to perform task)T[/2 Median crew response time
a Logarithmic standard deviation of normalized response time<j) Standard normal cumulative distribution
The experimental data indicates that the curve fit formula should be limited to normalizedtime values (T/ T1/2) below 10. For high-normalized time values, the formula leads toextremely low estimates of non-response probabilities. Because of this, the PSSA uses abounding minimum Pc of 1E-3. Additionally, if the normalized time values are less than 1.0,the PSSA uses an operator failure probability of 1.0 (guaranteed failure). In the PSSA modelthe <() function is represented by a third order polynomial.
Supplementary Cause-Based Approach
The cause-based method uses an analytic approach rather than an empirical correlationmethod. This method decomposes the operator actions into error-causing mechanisms andevaluates each mechanism for its affect on the failure probability of the operator to diagnoseand respond to the situation. This methodology is similar to the various methods used tocalculate HEPs for at-power PSAs. Two general failure modes are considered in determiningthe failure of the operator to diagnose and perform the action.
Nuclear Energy in Central Europe '98 433

Failure Mode 1: Failures of the Plant Information-Operator Interface
The four mechanisms evaluated for this failure mode are:• The required data are physically not available to the control room operators.• The data are available, but are not attended to.• The data are available, but are misread or mis-communicated.• The available information is misleading.
Failure Mode 2: Failure in the Procedure-Crew Interface
The three mechanisms evaluated for this failure mode are:• The relevant step in the procedure is skipped.• The error is made in interpreting the instructions or diagnostic logic.• The crew decides to deliberately violate the procedure.
In the cause-based approach, a decision tree is constructed which incorporates questionsconcerning the principal factors that influence each failure mechanism. An example .of thedecision tree used to model the first failure mechanism is provided as Figure 1. This decisiontree consists of four yes/no questions which are asked. Based on the responses to thequestions, a path through the event tree is taken and each endstate has a value associated withit. The values are defined in the EPRI report [1].
Indication Availablein Control Room?
Control RoomIndication Accurate?
Warning inProcedure?
Training onIndication?
YesNo
Figure 1 - Decision Tree for Failure Mechanism: Data Not Available
Time is factored into the cause-based HEPs by applying recovery factors, which reduce thebase failure probabilities calculated in the decision trees. As the time available for theoperator increases, the HEP decreases. This accounts for changes in crew personnel and theavailability of additional technical support resources. For the NPP Krsko study, differentrecovery factors were considered for three time frames: 15 m'in to 6 hours, 6 to 14 hours and14 - 24 hours. Recovery factors are only applied to applicable failure mechanisms. The finalprobability of non-performance is equal to the sum of the failure mechanisms multiplied bythe recovery values.
Another failure probability that must be considered is the failure to properly operate theequipment. The error probability is estimated based on the ease of selecting the proper
434 Nuclear Energy in Central Europe '98

control equipment and operating the equipment in the proper manner. Constant values forthese error probabilities were selected from industry data sources [2].
HUMAN ACTION SELECTION
The PSSA considers operator actions that are necessary to manually initiate alternate orbackup systems following a loss of decay heat removal or loss of coolant inventory from theRCS. During shutdown operations, a significant amount of time may be available foroperator response. Hence, operator actions modeled in the NPP Krsko PSSA may include anumber of options. Five human action groups are modeled in the NPP Krsko PSSA.
1. Operator Restores RHR Following a Loss of Offsite Power Event - The operator isrequired to manually start the standby RHR Pump, or restart the tripped RHR pump aftera loss of the running train has occurred due to a LOOP. The RHR Pump does notautomatically restart after power has been restored, either from offsite or the emergencydiesel generators. Separate HEPs are calculated for RCS at midloop and non-midloopconditions.
2. Operator Implements Alternate Decay Heat Removal - Following a loss of normalshutdown cooling via the RHR system, the operator must establish ADHR. The methodsof ADHR are detailed in the NPP Krsko Loss of Residual Heat Removal CoolingProcedure [3]; they include Steam Generator Heat Removal (SGHR) and Feed and BleedCooling. The NPP Krsko PSSA model only allows one of these methods to be credited ineach sequence, depending on the status of the RCS. If the RCS is intact, SGHR is used,otherwise Feed and Bleed is used. A separate HEP is quantified for each method,depending on the scenario (LOOP or non-LOOP) and whether or not the RCS is in amidloop condition.
3. Operator Initiates Gravity Feed from the RWST to the RCS System - If other methods ofADHR are not available to the operator, then the operator is directed to attempt decay heatremoval using this method. This action is only credited in configurations when themethod is viable (i.e., RCS is open with a sufficient vent path).
4. Operator Isolates RHR or RCS System Leak - In the event of a loss of inventory from theRCS or RHR systems, the operator is directed to attempt to stop or isolate the leak.
5. Operator Re-establishes RCS Inventory - Following a loss of inventory event, the operatoris directed to re-establish and maintain sufficient RCS inventory to prevent core uncovery.
HUMAN ERROR PROBABILITY EVALUATION
Several operators, having various levels of experience, were interviewed. The results of theseinterviews, investigation into operational procedures and a review of industry data were usedas inputs into the human error probability calculations. The HEPs are expressed as time-varying formulas, which are used in the ORAM event tree calculations.
Nuclear Energy in Central Europe '98 435
For the time-based correlation, 10 operators were interviewed and asked to estimate the timerequired completing each action. The operators were given the necessary procedures andwere to estimate how long each step or functional group of steps would take. In this way, theoperator is not challenged to estimate the time required performing a complex series ofprocedural steps, which would lead to a greater range in the estimates and thus higher levelsof uncertainty. Significant correlation was obtained in the times estimated, even though theoperator responses were given independently. Any outlier responses were investigated andnoted.
For the cause-based method, several methods were used to determine the value to use foreach of the failure mechanisms. As described previously, a decision tree is developed tocalculate the probability of failure due to a given mechanism. A set of questions with 2 or 3possible responses was developed to determine the path through the event tree that ultimatelyprovides an answer. This series of questions was provided to four operators of varyingexperience levels. It was initially intended to interview 10 operators, but the responses to thequestions were almost identical between the first four operators interviewed. Additionally,the PRA analysts conducted a review of the procedures and a walk-down of the control roomto ascertain their judgments on the failure mechanisms. Based on the results of the interviewsand using the judgment of the analysts, the failure mechanism values were calculated.
INSIGHTS ON HUMAN ACTION FAILURES
The cause-based approach allows for analyses to be performed so that an understanding of thefailure probability mechanisms can be developed. For each important human actionevaluated, the most significant barriers to the operator's successful action are identified bydetermining the contribution of each failure mechanism to the overall failure probability. Thefailure mechanism can in turn be decomposed to determine the most significant factorscontributing to the value of the failure probability (i.e., the nodes in the event tree which havethe most impact). This provides the plant staff with useful insights into areas forimprovement, in order to reduce the operator's contribution to risk.
As an example, the action "Operator Restores RHR Following a Loss of Offsite PowerEvent" during midloop was evaluated. The failure mechanism, which contributes nearly 80%to the overall failure probability of the human action, is that an error is made in interpretingthe instructions or diagnostic logic. This failure mechanism is affected mostly by thecomplicated procedural logic and relative inexperience of the operators in using thisprocedure.
Although the cause-based method is not used for very short available times (less than 15minutes), the insights gained from the cause-based evaluation are still applicable, since eachoperator action is evaluated using this method.
The NPP Krsko ORAM model was constructed to allow JFor easy evaluation of the impact ofhuman error probabilities on calculated risk. Risk levels during various configurations werecompared, with and without operator failures considered. Times during an outage whenhuman actions play the most significant role can be identified to allow plant personnel to takeany compensatory actions necessary to minimize risk.
436 Nuclear Energy in Central Europe '98

The results of the overall impact on the quantified risk in the NPP Krsko PSSA are shown inTable 1. This table lists the Initiating Event, the reduction in the initiating events'contribution to CDF, and the overall Risk Reduction Worth (RRW). It is clear from this tablethat human action failures have the most impact during LOOP events, from both an initiatingevent perspective and with respect to the overall CDF. However, while the impact of humanactions on a rapid draindown sequence is significant, the overall impact on CDF is minor.This is due to the relatively low importance of the rapid draindown scenario on overallquantified risk.
Initiating EventRAPID DRAINDOWNSMALL LEAKLOSS OF OFFSITE POWERRHR ISOLATIONLOSS OF ESW/CCWLOSS OF AC BUSRHR PUMP FAILURE
TOTAL CDF
% Reduction31%39%89%26%0.2%
1%7%
CDF RRW0.9%
13.3%33.2%0.03%0.03%0.02%0.04%
48%
Table 1 - Impact of Human Errors on CDF
The applicability of these insights is to make operators aware of those times during the outagewhere human errors are most critical, so that additional awareness and training may be usedto reduce the impact on risk associated with the human errors.
CONCLUSIONS
The NPP Krsko Shutdown PSA model has been enhanced in the area of Human ReliabilityAnalysis. The ORAM software provides an excellent framework with which to evaluate thecomplex interaction of human actions on the various plant configurations present duringshutdown operations. By incorporating two methodologies for determining HEPs, the newNPP Krsko PSSA better estimates the impact of human actions during shutdown. Duringperiods where time is critical, a time-based method is used. Each action is also evaluatedusing a cause-based approach, which allows a decomposition of the failure mechanisms andimportant insights into the mechanisms that mostly affect the failure probability of operatorsduring shutdown events.
REFERENCES
[1] EPRI TR-100259, An Approach to the Analysis of Operator Actions in Probabilistic RiskAssessment, Final Report, June 1992.
[2] NUREG/CR-1278, Handbook of Human Reliability Analysis with Emphasis on NuclearPower Plant Applications, Final Report, August 1983.
[3] NPP Krsko AOP PRI-5, Loss of RHR Cooling, Revision 3.
Nuclear Energy in Central Europe '9 437

SI0100140
Nuclear Energy in Central Europe '98
Terme Catez, September 7 to 10, 1998
Westinghouse Advanced Safety Analysis Technology for Plant Power Upratings
D. Rombouts, D. Denil, C. Simon, C. MatthysWestinghouse Energy Systems Europe S.A.
Boulevard Paepsem, 20 - B-1070 Brussels (Belgium)
ABSTRACT - Westinghouse is developing advanced safety analysis technologies for both LOCA andNon-LOCA events. The Best-Estimate LOCA (BELOCA) technologies for cold leg injection and directvessel injection have been licensed to support plant modifications which require significant PCT margin.The development of a BELOCA methodology for Upper Plenum Injection (UPI) plants has been completedand submitted to the USNRC. A Best-Estimate Small Break technology is also being developed. ForReactivity Insertion Accidents (RIA) and DNB limited events, Westinghouse is developing a threedimensional core kinetics methodology based on the extremely flexible EPRI codes, RETRAN and VIPRE.Studies have been completed to demonstrate the applicability of Westinghouse's existing methodologies tothe developed RETRAN models. These advanced technologies will significantly enhance the reliability ofthe safety margin evaluations which are required to improve the plant operation economics.
1. Introduction
Operating nuclear power plants were initially analyzed and licensed for a single set ofplant parameters at the nominal design operating conditions. The systems, the safety analysesand the Technical Specifications were developed on the basis of the safety analysis andhardware technologies available at the time of the design. As the commercial nuclear powerindustry progresses, the need to change the originally assumed parameters develops atnumerous plants.
Power uprating is one of the most timely and cost effective means to maximize thenominal electrical power of the plant. Other operating condition modifications include steamgenerator tube plugging, steam generator replacement, hot leg temperature reduction, highercore peaking factors, operating parameters window concept, relaxation of TechnicalSpecifications requirements which prove difficult or expansive to support over time (likeemergency diesel generator start-up delay time, safety injection flow rates degradation, longersurveillance intervals, increased instrument uncertainties), longer fuel cycles, advanced fuelassembly designs, higher fuel discharge burnup, reduced reactor vessel neutron exposure.
The list of modifications, which positively impact the economics of the plant operation, isso long that there is never enough margin available to accommodate all the potentialenhancements. It is therefore essential on one hand to increase the available operational andsafety margins and on another hand to strategize the management of the allocation of themargin available.
Nuclear Energy in Central Europe '98 439
So far Westinghouse has produced the safety analyses supporting power upratingprograms for thirty-six reactors in Europe and the USA. The considerable experienceaccumulated in Nuclear Steam Supply System (NSSS) design, operation and licensing,enables Westinghouse to pursue the development of major improvements of all its nuclearsafety technologies with the objective to help plants to become more competitive and improvethe reliability in the evaluation of their safety margins.
The status of the developments and the main axes of the future developments aredescribed in the following sections for respectively the Large Break Loss-Of-CoolantAccident technology, the Small Break Loss-Of-Coolant Accident technology and the Non-LOCA accident technology.
2. Best-Estimate Large Break LOCA Technology
The Large Break Loss-Of-Coolant Accident (LBLOCA) scenario is one of the mostlimiting transients for nuclear power plant design and operation. When the Final AcceptanceCriteria (FAC) governing the LOCA for light water reactors was issued in Appendix K of 10CFR 50.46 in 1973, both the USNRC and the nuclear industry recognized that the rule washighly conservative. Using the then accepted analysis methods, the performance of theEmergency Core Cooling System (ECCS) would be conservatively underestimated. At thattime however the degree of conservatism in the analyses could not be quantified.
In 1988, as a result of the improved understanding of LOCA thermal-hydraulicphenomena gained by extensive research programs sponsored by the USNRC and the nuclearindustry, the USNRC amended the requirements of 10 CFR 50.46 and Appendix K, so that arealistic evaluation model may be used to analyze the performance of the ECCS during ahypothetical LOCA [l]. The revised regulation also requires however, as part of the analysis,an assessment of the uncertainty of the Best-Estimate calculations.
Prior to this revision, the regulations were a prescriptive set of rules defining theassumptions to be made about the plant initial conditions and how various physicalphenomena should be modeled. Because of the conservatism in the prediction of theperformance of the ECCS, those regulations result in placing tight constraints on the plantoperation : maximum core rated power, core power distributions, ECCS setpoints andfunctional requirements, and surveillance and testing. For operating plants, using Best-Estimate models and assumptions to predict a realistic response generally shows that thecurrent operating limits are overly restrictive.
Shortly after the rule revision, the USNRC issued a regulatory guide [2], and sponsored aprogram to develop a structured method for evaluating the uncertainties affecting the PeakClad Temperature (PCT). The Code Scaling, Applicability, and Uncertainty (CSAU)evaluation methodology was developed [3] and was used by Westinghouse as a guide todevelop its Best-Estimate LOCA (BELOCA) technology.
The CSAU approach is a discipline methodology requiring a thorough documentation ofthe code and its models, a rigorous assessment against test data, the determination of the codeuncertainty, assessment of the scalability of the code results and its component models.
440 Nuclear Energy in Central Europe '98

In addition, thorough plant analyses and sensitivity studies are performed to determine theresulting PCT for the plant with all uncertainties identified and addressed. The CSAUapproach has set the licensing standard which BELOCA technologies and their licensingsubmittals must achieve.
Westinghouse has selected the COBRA/TRAC code [4] as the base code for theBELOCA methodology. Further improvements to the code were made to conform to therevised 10CFR50.46 and Regulatory Guide 1.157. WCOBRA/TRAC uses a two-fluid, three-field representation of flow in the vessel component. The three fields are a vapor field, acontinuous liquid field and an entrained liquid drop field. Each field in the vessel uses a set ofthree dimensional continuity, momentum, and energy equations with one exception.A common energy equation is used by both the continuous liquid and the entrained liquiddrop field. The one-dimensional components consist of all the major components in theprimary system, such as pipes, pumps, valves, steam generators and the pressurizer. The one-dimensional components are represented by a two-phase, five-equation drift flux model.
The methodology has been approved by the USNRC in July 1996 for applications to threeand four loop PWRs with cold leg injection. This culminates 10 years of development andcode assessment working in partnership with EPRI and several utility customers, includingfive years of licensing review. Since then more than ten US and European plants have appliedthis advanced technology to support a large range of plant modifications requiring significantPCT margin. These modifications include power upratings, FQ and FAH peaking factorsincrease, 24-month fuel cycle management, plant operation relaxation, and TechnicalSpecifications relaxation.
The objective is to pursue the development of the BELOCA technology for all types ofsafety injection systems. A generic topical report documenting the methodology for the UpperPlenum Injection (UPI) plants was submitted to the USNRC in August 1996. Moreover, theUSNRC has recently approved the Westinghouse BELOCA methodology for the AP600reactor which has a Direct Vessel Injection (DVI). Test simulations provide justification forgeneric capability of WCOBRA/TRAC to predict vessel downcomer injection.
3. Best-Estimate Small Break LOCA Technology
The use of the Large Break BELOCA technology may result in that the Small BreakLoss-Of-Coolant Accident (SBLOCA) scenario becomes the limiting PCT in the future andprohibits an optimal use of the margin made available from the LB BELOCA. Also becauseof the more rigorous and reliable PCT evaluation generated by a BELOCA study with itsassociated PCT uncertainty analysis, the trend in the licensing requirements is expected tophase out the prescriptive Appendix K methods. Westinghouse is developing aWCOBRA/TRAC Small Break LOCA Best-Estimate methodology. The methodologyvalidation based on integral effects and separate effects tests will be pursued in 1998. Asignificant SBLOCA PCT margin is. anticipated with the application of the future SBBELOCA technology.
Nuclear Energy in Central Europe '98 441

4. Non-LOCA Nuclear Safety Technology
Over the last 25 years Westinghouse has used LOFTRAN and FACTRAN extensively forNon-LOCA accident evaluations for Safety Analysis Reports (SARs) as well as for controlsystem performance and equipment sizing studies.
The LOFTRAN reactor core model uses a lumped fuel heat transfer model and pointneutron kinetics and includes the reactivity effects of variations in moderator density, fueltemperature, boron concentration, and control rod insertion and withdrawal. The secondaryside of each steam generator is represented by a single volume model (water and steamphase) with a homogeneous, saturated mixture for thermal transients. The pressurizer modelaccounts for the effects of pressurizer heaters, spray, and relief and safety valve operation. TheLOFTRAN code also includes a detailed model of the reactor protection and control systems.LOFTRAN has the capability to estimate a conservatively low transient value of theDeparture from Nucleate Boiling Ratio (DNBR) based upon the input of defined core limits.
The FACTRAN code calculates the local fuel rod heat transfer from the fuel pellet to thecoolant at the hot spot.
Non-LOCA events like the Loss of Flow, the Locked Rotor, the Feedline Break, the RodEjection and the Main Steam Line Break events may be severely limiting depending upon thespecific design configurations and the specific licensing requirements, challenging thecurrently licensed methodologies.
For instance more stringent requirements for the Reactivity Insertion Accident (RIA)events with high burnup fuel or with new fuel rod design may require the use of advancedthree-dimensional space core kinetics and fuel rod heat transfer codes and methodologies toanalyze the Rod Ejection Accident. In some plants due to the specific configuration and sizingof the feedwater system, the Feedline Break Accident may require additional safety marginwhich could be generated by the relaxation of the restrictive "no bulk boiling" criterion to aless restrictive criterion acceptable for a condition IV event. The current licensedmethodologies are also expected to be very conservative for events where asymmetric powerdistributions occur such as during a post-reactor-trip main steamline break event or a droppedRod Cluster Control Assembly (RCCA) event. Specific licensing requirements for this kind ofevents may require the use of advanced technology which integrates three-dimensional corekinetics, three-dimensional core thermal-hydraulics and primary system thermal-hydraulictransients.
Westinghouse is now transitioning from LOFTRAN/FACTRAN to the EPRI developedRETRAN [5] and VIPRE codes.
RETRAN is an extremely flexible one-dimensional, best-estimate, two-phase flowthermal-hydraulic transient analysis computer code, which uses generalized geometry andcomponent models. The RETRAN code is a variable nodalization code. The user builds thedesired plant model by defining the control volumes and flow paths with heat slabs to accountfor heat transfer in both the primary and secondary system elements. The RETRAN codeallows either point kinetics or one-dimensional space time kinetics.
442 Nuclear Energy in Central Europe '98

Generic Westinghouse PWR plant models have been developed for use in analyzing Non-LOCA transients with RETRAN and studies have been completed to demonstrate theapplicability of Westinghouse's existing Non-LOCA safety analysis methodologies to thedeveloped W RETRAN models to perform licensing basis safety analyses. Indeed providedthe code capabilities and the models are appropriate the existing non-LOCA accident analysismethodologies are essentially independent of the thermal-hydraulic code with which they areused. The reason is that the accident analysis methodology focuses on identifying theconservative assumptions for key parameters to ensure that a conservative bounding analysisis performed.
The VIPRE computer code is an extremely flexible Thermal-Hydraulic (T/H), subchannelanalysis code, which can be used to model and analyze all types of PWR fuel rod design. TheVIPRE code has already been used by Westinghouse for the Temelin fuel development, coreT/H design and safety analyses.
Both the RETRAN and the VIPRE codes were approved by the USNRC for use inanalyzing the Non-LOCA events. In 1997, Westinghouse submitted VIPRE and RETRANtopical reports to the USNRC documenting the use of these codes with the Westinghousenuclear safety methodologies. Safety analyses for Safety Analysis Report (SAR) are currentlybeing performed with RETRAN and VIPRE for two nuclear power plants.
In the last years, Westinghouse has produced, for the USNRC, analyses of core transientswith three-dimensional core kinetics computer code in the frame of Westinghouse OwnersGroup (WOG) sponsored programs aimed at evaluating the impact of a more stringent fuelfailure criterion for high burnup fuel in the Reactivity Insertion Accidents (RIA). Theseanalyses have shown that the current licensed analyses for RIA are considerably conservative.Developments of the three-dimensional core kinetics and fuel heat transfer computer code andmethodology for licensing applications of RIA are being finalized with a submittal to theUSNRC planned this year. The full integration with the system transient capabilities ofRETRAN is planned to be completed next year.
5. Conclusions
Several years ago, Westinghouse embarked on major programs to develop the integratedadvanced nuclear safety technologies which are required to support the numerous potentialplant modifications which positively impact the economics of the plant operation and toimprove the reliability of the safety evaluations.
The WCOBRA/TRAC BELOCA technology for cold leg injection has been licensed inboth the USA and in Europe to support the licensing of a wide range of plant modificationsrequiring significant PCT margin like power uprating and core peaking factor increase.USNRC approval for WCOBRA/TRAC model for Direct Vessel Injection has also beenobtained in the licensing process of the AP600 reactor model while the BELOCAmethodology for Upper Plenum Injection plants has been submitted to the USNRC and isexpected to be approved soon.
Nuclear Energy in Central Europe '98 443

Westinghouse is now transitioning to an advanced Non-LOCA technology, which willintegrate three-dimensional core space kinetics and thermal-hydraulics with the systemtransient code RETRAN. As a first important step the W RETRAN with point kinetics and theW VIPRE topical reports have already been submitted to the USNRC and safety analyses forlicensing applications are being carried out with these two codes applying the Westinghouse-developed methodologies. The three-dimensional core space kinetics methodology forReactivity Insertion Accident will be submitted to the USNRC later this year. The integrationof the three-dimensional space core kinetics with the system transient capability of RETRANfor analyzing the DNB limited events is planned to be submitted next year.
Together the BELOCA and the Non-LOCA three-dimensional integrated technologieswill provide the best nuclear safety tools to optimize the allocations of operational and safetymargins in the plant uprating projects and more generally in any plant modifications whichimpact the plant safety.
6. References
[1] U.S. Nuclear Regulatory Commission, "Emergency Core Cooling Systems : Revisions toAcceptance Criteria", Federal Register V53, N180, Sept. 16, 1988.
[2] U.S. Nuclear Regulatory Commission, "Best-Estimate Calculations of Emergency CoreCooling System Performance", Regulatory Guide 1.157, May 1989.
[3] Wilson, G., et al., 1989, "Quantifying Reactor Safety Margins", NUREG/CR-5249.
[4] Thurgood, M.J., et al., 1983, "COBRAVTRAC - A Thermal-Hydraulics Code forTransient Analysis of Nuclear Reactor Vessels and Primary Coolant Systems",NUREG/CR-3046.
[5] McFadden, J.H., et al., "RETRAN-02 — A Program for Transient Thermal-HydraulicAnalysis of Complex Fluid Flow Systems", EPRI NP-1850-CCMA.
444 Nuclear Energy in Central Europe '98

SI0100141
Nuclear Energy in Central Europe '98
J 1 S S Terme Catez, September 7 to 10, 1998
Environmental Qualification Program for Krsko NPP
Janko Cerjak, Peter KlenovsekNuclear Power Plant KrSko, Vrbina 12, Krsko, SLOVENIA
Janez PavsekElektroinstitut Milan Vidmar, Hajdrihova 2, Ljubljana, SLOVENIA
KentR. FreelandIndustrial Analysts Incorporated, San Diego, California, USA
Srdan SpaljFaculty of Electrical Engineering and Computing, Unska 3, 10000 Zagreb, CROATIA
Abstract
NEK plant components, including those critical to safe plant operation, deteriorate and wear overservice life due to the effects of aging and harsh environmental conditions. Since the plantenvironment is a source of common-cause failures, an Environmental Qualification (EQ) programis required to ensure and demonstrate the ability of safety-related equipment to perform its designsafety function during a design-basis event (DBE), even after aging over its service life in the plantEQ is a requirement for plants licensed by the USNRC, in accordance with 10 CFR 50.49,Regulatory Guide 1.89, NUREG-0588, and IEEE-323. This paper presents the current EQProgram status at Krsko NPP.
Environmental Qualification Basics
Requirements for implementing EQ in nuclear power plants are prescribed by various national andinternational standards, codes and guides. Domestic EQ regulations and standards do not exist, so theUnited States regulations, guides and standards are applicable to NPP Krsko. The principalreferences for EQ are described below.
The general regulations applicable to the nuclear power plants addressing general equipmentqualification are found in the General Design Criteria in 10 CFR 50, Appendices A and B, and 10CFR 50.49, the latter being known as the EQ Rule. The EQ Rule was first issued in 1983 and appliesto the environmental qualification of Class IE (electrical equipment important to safety) componentslocated in potentially harsh environmental areas in the plant.
The EQ Rule divides eligible components into three categories:• Safety-Related equipment required to remain functional during and following design-basis events
(DBE).• Non-Safety Related equipment whose failure during a postulated DBE could prevent satisfactory
accomplished of safety functions.• Certain post-accident monitoring equipment.
The principal NRC documents providing guidance "on equipment qualification are:
• Division of Operating Reactors (DOR) Guidelines• NUREG0588• Regulatory Guide 1.89• Standard Review Plan (SRP) Sections 3.10 and 3,11
Nuclear Energy in Central Europe '98 445 \

The criteria in these documents differ and may overlap. Determining which document applies to thequalification of a particular item is a function of the plant's age, whether the equipment is presentlyinstalled or being replaced, and the licensee's specific qualification commitments. The DORGuidelines generally apply to installed equipment in plants that became operational prior to 1980.The Category II criteria of NUREG-0588 apply to the plants that became operational after 1980 andoriginally committed to the requirements of IEEE 323-1971. Compliance with the criteria containedin either the DOR Guidelines or NUREG-0588 does not necessarily mean the equipment is qualifiedto the criteria of 10 CFR 50.49. The Category I of NUREG-0588, the regulatory guide, and theStandard Review Committee Plan meet the intent of 10 CFR 50.49 and principally apply the plantscommitted to the requirements of IEEE 323-1974 and replacement equipment in all plants.
In November 1977, the Union of Concerned Scientists petitioned the NRC commissioners to theupgrade the current standard for environmental qualification of safety-related equipment in operatingplants, so the NRC Division of Operating Reactors (DOR) issued IE Bulletin 79-0 IB in June of 1979.Enclosure 4 of this bulletin contained the Guidelines for Evaluating Environmental Qualification ofClass IE Electrical Equipment in Operating Reactors, commonly referred to as the DOR Guidelines.The DOR Guidelines were originally intended for use by the NRC to evaluate qualification of existingequipment in reactors operating prior to May 23, 1980. However, the DOR Guidelines soon becamethe qualification criteria applicable to these facilities as well.
NUREG-0588, "Interim Staff Position on Environmental Qualification of Safety-Related ElectricalEquipment" was issued in 1979 to provide guidelines to the NRC staff for qualification of Class IEelectrical equipment for new plants and plants under construction. Like the DOR Guidelines, theNUREG addressed only environmental qualification; seismic qualification is not discussed. NUREG-0588 established two environmental qualification categories based upon the 1974 and 1971 versionsof IEEE 323, and clarifies their criteria. Category I applies to the equipment whose qualification isbased upon IEEE 323-1974, and Category II applies to equipment qualified to the earlier version,IEEE 323-1971. Per 10 CFR 50.49, qualification must be established for new and replacementequipment using the Category I guidance.
The NRC Issues Regulatory Guides to provide clarifications and suggested compliance methods forthe requirements established by applicable regulations (e.g., 10 CFR 50). Regulatory Guide 1.89,Revision 1, should be considered as the NRC's formal guidelines regarding compliance with the EQRule (10 CFR 50.49). The regulatory guide develops the clarifications and guidelines based on IEEE323-1974. Most of the information provided by the guide in extracted from NUREG-0588 forCategory I plants, with one significant difference: consistent with the EQ Rule, the NUREG permitsongoing qualification and revisions of qualified life based on the results of surveillance and testingprograms.
The Standard Review Plan (SRP), Chapter 3.11, addresses qualification of electrical and mechanicalequipment for both harsh and mild environments, according to the information and methodologypresented in IEEE 323-1974 and NUREG-0588. Chapter 3,.1O on seismic and dynamic qualificationaddresses mechanical and electrical equipment and their supports.
Industry standards applicable to equipment qualification may be classified into these three categories:
• General technical guidance for seismic and environmental qualification and replacement parts.• Specific technical guidance on environmental qualification of specific equipment types.• Quality assurance guidance
IEEE 279, issued in 1971, was the first nuclear standard developed by the IEEE. The standardcontains requirements for design, qualification, manufacture, and installation of reactor protectionsystems. In paragraph 4.4, Equipment Qualification, IEEE 279 calls for verification of system designcapabilities through tests of analysis. This requirement initiated the development of generic standardson environmental and seismic qualification (IEEE 323, IEE 344, and IEEE 627), and the "daughter"standards addressing qualification of specific equipment items.
IEEE 323 is commonly known as the definitive standard for electrical equipment. The standard wasoriginally issued in 1971, and it specified that qualification may be achieved through analysis, typetesting, operational experience, or a combination of these methods. The 1974 standard expandedtechnical requirements, including the concept of aging. IEEE 627, as a result of joint ASME/IEEEagreement, covers the qualification of both mechanical and electrical safety system equipment. Thestandard was intended to be the generic industry qualification while IEEE 323 would apply
446 Nuclear Energy in Central Europe '98

specifically to electrical equipment. As a generic standard, IEEE 627 provides broad conceptsapplicable to qualification. IEEE 344 provides specific guidance on seismic qualification of electricalequipment.
According to the regulatory documents, EQ requirements can be summarized as follows:
• Each NPP shall establish a program for qualifying electrical equipment important to safety,• All electrical equipment which must be qualified is classified in three classes according to 10
CFR 50.49,• Each NPP licensee shall prepare and maintain a list of equipment important to safety• Each equipment classified as important to safety shall be qualified by testing an identical item
under accident conditions with supporting analysis to show that the testing demonstrates thequalification of the equipment or is otherwise acceptable,
• A record of qualification, including supporting documentation, must be maintained in a suitableform for the life of the component's installation and plant service,
• Replacement equipment must be qualified in accordance with 10 CFR 50.49.
To achieve EQ, each NPP must determine equipment operating requirements and associatedenvironments, and use this data to establish qualification requirements as well as qualify equipmentby test and analysis.
The qualification process alone depends upon the type of equipment, its location, the serviceconditions under which the equipment must perform its safety function, and the duration of the harshenvironment to be qualified to. The first two of these are determined during the EQ MasterEquipment list preparation, while the latter two are determined by EQ conditions.
The following parameters must be identified and analyzed for Environmental Qualification:
Operating TimeTemperaturePressureRelative HumidityChemical SprayRadiationAgingSubmergence
One of the requirements stated in 10 CFR 50.49 is to produce EQ documentation which is used todescribe the qualification status of equipment in the NPP during the component's life. The format andorganization of EQ documentation is not specifically prescribed in regulatory and industry standards,but should generally include:
• EQ Master List (or EQMEL). Contains safety-related electrical equipment (Class IE) locatedwithin plant areas potentially subject to a harsh environment during a postulated accidentscenario.
• EQ Worksheets: contain detailed information on equipment specifications and operationalrequirements.
• EQ Diagrams: Provide "as-built" record of qualified equipment and associated equipmentinstalled within harsh environment zones, including the effect and interrelationship ofsubcomponents supporting safety related components. EQ diagrams are prepared for each pieceof equipment subject to 10 CFR 50.49 requirements.
• Qualification Documentation Review Package (QDR): provide a detailed review of the EQdocumentation for each type of 10 CFR 50.49 equipment which includes necessary informationabout the status of the equipment. QDR's should be maintained and updated periodically.
Nuclear Energy in Central Europe '98 . 447

Krsko NPPEO Program
NEK is committed to establishing a comprehensive EQ program bases upon the requirementsdescribed here and, in fact, many NEK activities have already prepared the plant to implement andsupport an NEK EQ program. The first element is the Master Equipment Component List (MECL)database, which tracks all plant equipment components by component number, type, location, safetyclass, function and other relevant parameters, including EQ status.
The NEK EQ project staff has completed a draft EQ Program Manual, containing a detaileddescription and procedures for implementing and maintaining Equipment Qualification. An EQ zonemap has also been prepared by the Faculty of Electrical Engineering and Computing in Zagreb,Croatia (FER) and reviewed by Parsons and the NEK staff. The zone map defines the environmentalparameters (temperature, pressure, humidity, submergence, radiation dose) in the plant. The zonesare established by locations where Loss of Coolant Accident (LOCA), High Energy Line Breaks(HELB) and other Design Basis Accidents (DBA) can affect plant components.
These three documents, along with EQ staff training from EPRI, form the basis for development ofthe EQ NEK Equipment Qualification Program. NEK has designed the EQ program to takemaximum advantage of existing resources (such as generic EQ documents and EPRI/PSE EQdatabase software), as well as like-plant programs from Kewaunee, Ginna, and Indian Point 3.
Scope
The scope of plant equipment to be included in the EQ Program is determined from the requirementsof 10 CFR 50.49, which states the "EQ Rule":
Safety Related Equipment: Safety Class IE equipment that NEK directly relies upon during andfollowing a DBA.
Non-Safety Related Equipment: Supporting equipment which is not essential to safety, but failure ofwhich could prevent safety-related components from performing their function.
Post-Accident Monitoring: Certain instrumentation equipment required for Post-AccidentMonitoring in accordance with USNRC Reg Guide 1.97
Based upon this generic scope and the environmental parameters from the NEK EQ zone map, theactual NEK equipment to be included in the EQ List is extracted from the MECL. A logic diagramfor the process of determining the equipment items to be included in the EQ Program is shown inFigure 1.
NEK EO Documentation
Once EQ equipment and environments have been determined, the basic element of EQ documentationis the EQ Documentation Package (EQDP).
The structure of the packages consists of:
• Equipment Qualification Assessment Report (EQAR)
• System Component Evaluation Worksheet
• Exhibits (Certifications, Test Reports, other supporting documentation)
448 Nuclear Energy in Central Europe '98

Determining EQ EquipmentSTART QUALIFICATION?
IS THE COMPONENT CLASS IE S No
YES
yes
WCkUDE GQMPQHSK7 tHSOmiAND PERFORM WAUFICAWOti
A HARSH ENVIRONMENT ZONE?
NO
w
NO
Figure 1: Determining EQ Components
EQ Assessment Report (EQAR) includes:
relates similar equipment items to applicable environmental parameterscompares EQ Zone requirements with Test Report parameterscompare installed equipment to sample test equipmenttest results assuring that equipment is capable of performing its safety function followingexposure to harsh environment(s) and agingdescribes requirements for installation (orientation, location and configuration) of EQ equipmentand for checking installation of existing EQ componentsdefines qualified lifetime of equipment and sub-componentsprovides maintenance requirements (surveillance, PM and subcomponent replacement)defines EQ requirements for procurement, purchasing and storage of components
System Component Evaluation Worksheet (SCEW) describes the details for each component fromthe EQ List, including test and ambient environment parameters as well as other information, such asinstallation/replacement dates, make/model, etc.
Exhibits and Other Supporting Documents that are not directly part of the EQAR or SCEW, such astest reports, evaluations, analyses and graphs, vendor/utility communications and memos, catalogues,purchase orders and relevant NRC documents.
NEK EQ Data Base
The EQ Database is one of the principle elements for tracking data acquired during the initial EQprocess. The database was created by selecting those components from the EQ List contained in theMECL along with selected data elements. These data were imported into a new, PC-based file. EQzone information and parameters were then entered, and each EQ component matched by locationcode to its LOCA, HVAC and Radiation EQ Zone.
Nuclear Energy in Central Europe '98 449

At this point, the static EQ data from this database could be linked to the GLS PQE/GQE databasewhich contains generic and EPRI-member plant-supplied EQ data. SCEW sheets could then becreated and/or updated and printed as required on a component basis. EQ Zone Parameters and/orEQAR's may also be created from the database on demand, following a "similarity analysis". TheGQE/PQE software then permits tracking of supporting EQ data at the component level, such as testreports, communication, procurement documents and analytical media. The EQ database will alsointegrate with several existing NEK Management Information Systems (MIS) to support NEK-wideEQ interfaces.
The database structure used for the EQ Database is shown in Figure 2.
EQOstRoom ID(SOH1D «Purchase Order Ho,
Procurement
Purchase Order No.
Test Data
OQEID
Figure 2: EQ Database Structure
Impact ofEO on other NEK Processes
Maintenance
EQ maintenance requirements for component procurement, installation, surveillance, maintenance andoverhaul, and eventual replacement will be defined in EQ Packages. These EQ requirements will alsobe included in appropriate NEK maintenance procedures. EQ procedures will include themechanisms to ensure that changes to any EQ package will trigger the appropriate review andmodification, as necessary, of any maintenance procedures, as well as a review of high-levelmaintenance procedures to ensure EQ requirements are adequately addressed. Principal data elementsrelating to maintenance intervals and history will also be maintained in the EQ database. The EQsoftware will interface with the NEK Work Order System (WOS).
Procurement
Purchase orders for plant equipment components contain basic configuration management data for thecomponent, such as manufacturer/model, vendor, qualification standards, and other data important toEQ. EQ components also require procurement specifications related to EQ qualification and testing,as well as supporting documentation, for the operating and accident conditions that apply to thecomponent location and function. These include test data, material analyses and results, installationand maintenance instructions, and any certificates of compliance or other vendor documents. This alsoextends to procurement of qualified replacement parts for EQ components. This becomes more
450 Nuclear Energy in Central Europe '98

important for an EQ category II plant such as NEK, where EQ components are required forinstallation as original components are replaced through normal service.
Modifications
Modification engineers will verify EQ status for all components involved in plant modificationsthrough the MECL. New components must be evaluated for EQ eligibility through location and theEQ zone maps and related parameters. The modification must also be reviewed for impact on currentEQ zones and parameters. All modification packages will be reviewed by the EQ staff when theengineer identifies an EQ requirement for the modification.
Krsko Operating Committee (KOC)
Safety evaluations and decisions for EQ component replacement must be reviewed, evaluated andapproved by the KOC.
Future NEK EQ Activities
In addition, these activities are planned to continue the development and maintenance of acomprehensive NEK EQ program:
• Review and revision of EQ Zones as requireda Reduction in size of EQ List• Continue use of the EPRI/PSE and GLS software, eventually transferring data to the NEK EQ
MIS application• Continuous review and revision, as required, of the NEK EQ Manual and Program Plan• Design and utilize EQ plant walkdown checklists for physical verification activities• Conduct walkdowns to gather EQ data and verify MECLa Research and acquire any missing test reports from NEK archives, component manufacturers and
vendors, and/or other plants• Completing the NEK EQ database from documentation and walkdown resultsH Review Maintenance, Procurement, Design Modification and other applicable NEK Plant
Procedures for EQ interfaces and requirements.H Conduct EQ training and presentations to increase plant awareness of EQ requirements
Conclusions
Generally, a reasonable EQ List should consist of between 200 and 600 plant components based uponthe experience of plants similar to NEK. In addition, parameters such as Operating Time and SafetyFunction should be included for each EQ Component. NEK EQ Zones are currently too conservative(large), creating a large EQ List, and will be reviewed. Category II plant rules permit some oldercomponents to be replaced with new, qualified models when appropriate, avoiding qualification ofselected older equipment. Although minimal in number, any EQ components for which no otherqualification method or documentation may be utilized must be tested and qualified.
The NEK EQ program will realize a considerable economy of scale by utilizing industry experience,like-plant programs and the EPRI/PSE EQ support program, software, and test report repositories.NEK has already establish liaison with several plant similar to it in the USA for informationexchange, and NEK's EPRI membership entitles it to full EQ support through the EQDB andGQE/PQE programs.
The NEK EQ program will demonstrate NEK's recognized attention to safe operation and plantbetterment programs by bringing NEK into compliance with regulatory requirements and industrystandards for EQ.
Nuclear Energy in Central Europe '98 451

References
[1] 10 CFR 50.49, EQ Rule, "Environmental Qualification of Electric Equipment Important toSafety of Nuclear Power Plants"
[2] 10 CFR 50, Appendix A, "General Design Criteria for Nuclear Power Plants"
[3] 10 CFR 50, Appendix B, "Quality Assurance Criteria for Nuclear Power Plants and FuelReprocessing Plants"
[4] Regulatory Guide 1.89, "Environmental Qualification of Certain Electrical EquipmentImportant to Safety for Nuclear Power Plants"
[5] Regulatory Guide 1.97, "Instrumentation for Light Water-Cooled Nuclear Power Plants toAssess Plant and Environs Conditions During and Following an Accident"
[6] NUREG-0588, "Interim Staff Position on Environmental Qualification of Safety-RelatedElectrical Equipment"
[7] IEEE Standard 323 (1971, 1974), "IEEE Standard for Qualifying Class IE Equipment forNuclear Power Generating Stations"; "IEEE Trial Use Standard: General Guide for QualifyingClass IE Equipment for Nuclear Power Generating Stations"
[8] IEEE Standard 627-1980, IEEE Standard for Design Qualification of Safety System EquipmentUsed in Nuclear Power Generating Stations"
[9] Nuclear Power Plant Equipment Qualification Reference Manual, TR-100516, Project RP1707,EPRI, November 1992
452 Nuclear Energy in Central Europe '98

SI0100142
Nuclear Energy in Central Europe '98
\ Terme Catez, September 7 to 10, 1998
KRSKO MODERNIZATIONPROJECT %
STATUS REPORT
ROZMAN STANE
SCOPE OF PRESENTATION
INTRODUCTIONPROJECT STATUSKEY ISSUESFUTURE ACTIVITIES
% Viewgraphs of Invited Lecture
Nuclear Energy in Central Europe '98 453

i
3-
3. INTRODUCTION - history
NEK in 1991792 based on evaluation ofSG status initiated and proposed SG
-replacement in 1995.NEK supervisory board discussed theissue in1995 and proposed thereplacement in 1998.In^September199& the[Sloveniangovernment reviewed and supported theSG replacement project
INTRODUCTION - history
The parliament in January1996 approvedthe document "Strategy for consumptionand supply of energy in Slovenia"assuming the SG replacement project.December 1996- RSG contractFebruary 1998- SScontractFebruary 1998 -SGR contractMarch 1998 -SIM contract
454 Nuclear Energy in Central Europe '98

INTRODUCTION - goals andobjectives
^Stabilise long term plant operation^increase net electrical output by 6,3%^Reduce annual outage duration to 30^40
daysa?- increase availability to 85% (unit forced
outage rate < 2%)3° Increase annual energy production
by~1 TWh^ Safety improvements (simulator, IGGM)
INTRODUCTION - scope ofthe project
Supply of 2 steam generatorsReplacement activities and associatedmodifications for replacement and powerincreaseAn a lyses necessary for SGr(ep|aCen-jentand power increase + LQCMSu jp ply an d i hsta I latio n of pi a nt s pec if icsimulator
Nuclear Energy in Central Europe '98 455

INTRODUCTION - scope ofthe project
•«-Other activities:s MPB and SIM buildingss Transport of 2 SG'ss Licensing
PROJECT STATUS - overall
*• Project orga nization and project team forthe preparation and implementation ofthe project are established
p All subprojects and activities are definedand under implementation
p Licensing process n^uclear an:dl_cjassicaIis defined
456 Nuclear Energy in Central Europe '98

Organization Chart
GeneralDirector NEKStane Rozrnan
ModernizationProject
ManagerMartin Novsak
RSGKresimirNemcic
SteeringCommittee
Stane RozmanPredrag Sirola
Josip DrcecMartin Novsak
isorymittee |
AdvisoCommittee
SGRJankoCerjak
SafetyAnalyses
Joze Spiler
SimulatorFranc
Pribozic
FinancingRudolf Mlinaric
Commercial ILidija Vuksic
LegalDarinka Kordelc
QA,QCFranc Pribac
TransportationJoze Kerin
PROJECT STATUS -RSG - Replacement Steam Generators•*** SG'sare currently being in the 21st
month of manufacturing schedule of 33months altogether
^ Man ufactu ri n g of fqrg i n gs in JSW iscompleted
^ Tube manufacturing in Sandyik iscompleted
Nuclear Energy in Central Europe '98 457

PROJECT STATUS -RSG - Replacement Steam Generators
^ Activitiesin Ansaldo: secondary partsmanufacturing are close to completion
^Activities; in ENSA : steam generators areready for activities in the clean room
NEK Steam Generator
:•r.7
I
\\\i ~Z. .1 t} , ii
458 Nuclear Energy in Central Europe '98

•
Hoaf transfer"'Heat transfer areaTube MaterialNo oT tubesDia. of U-tubes
SG Basic Data"D4
" ~ " " 941MWT " " • "4487 m'
Inconel 600 MA" 4578
19.05 mm
Tubo Wall Thickness ' 109 mm
Steam pressure 6.3S MPaFeocJwaler Temperature "" 221 -C""Steam mass flow • - • 515kg/sPrimary design pressure " "" 17.13 MPa
Secondary designpressureSG HeightWeight of SGHax. moisture
Circulation ratio
3 17 IBPa
Z0 6 m330 t0.252 OS
72W-D4721000'MWt '""7177 m'
Inccnei 690 TT5428
19 05 mm1 (19 mm6.50 MPa
219.4'C544 kg/s"
17 13 MPd ~8 17 BlPa
20 6 m3451"0.103 07
PROJECT STATUSSGR - Steam Generator Replacement
^ Co n ceptua I Des i g npackages f or systemand equipment modifications will becompleted by 15/09/1998
^ MPB design well in progress^Snubbe f feductionprogfam
i m p I e m e ntatip n p h as e is u n de r ey a I u ati o n
Nuclear Energy in Central Europe '98 459

PROJECT STATUSSGR - Steam Generator Replacement
^Additional subcontracts (rigging,handling etc.) are being prepared
^ Engineermhas been initiated
PROJECT STATUSUPR - Analyses for replacement and power
increase<** Work report on the operating window is
developed and under review^ Verification analyses based on prepared
operating window parameters are inprogress
^ Seismic
460 Nuclear Energy in Central Europe '98

PROJECT STATUSUPR - Analyses for replacement and power
increase^Functionalrequirements for equipment
and systems modifications due to powerincrease are developed, reviewed andapproved
PROJECT STATUSSIM - Simulator
Modelling is in progress. NEK completedits part of participation in modellingFactory acceptance tests are reviewed byN E K : : : : : • • • • - : : _ - - ^ • • • : • •
Work is initiated for control panelmanufacturing and installation ofinstrumentationBid invitation was issued for theconstruction of the simulator building
Nuclear Energy in Central Europe '98 461
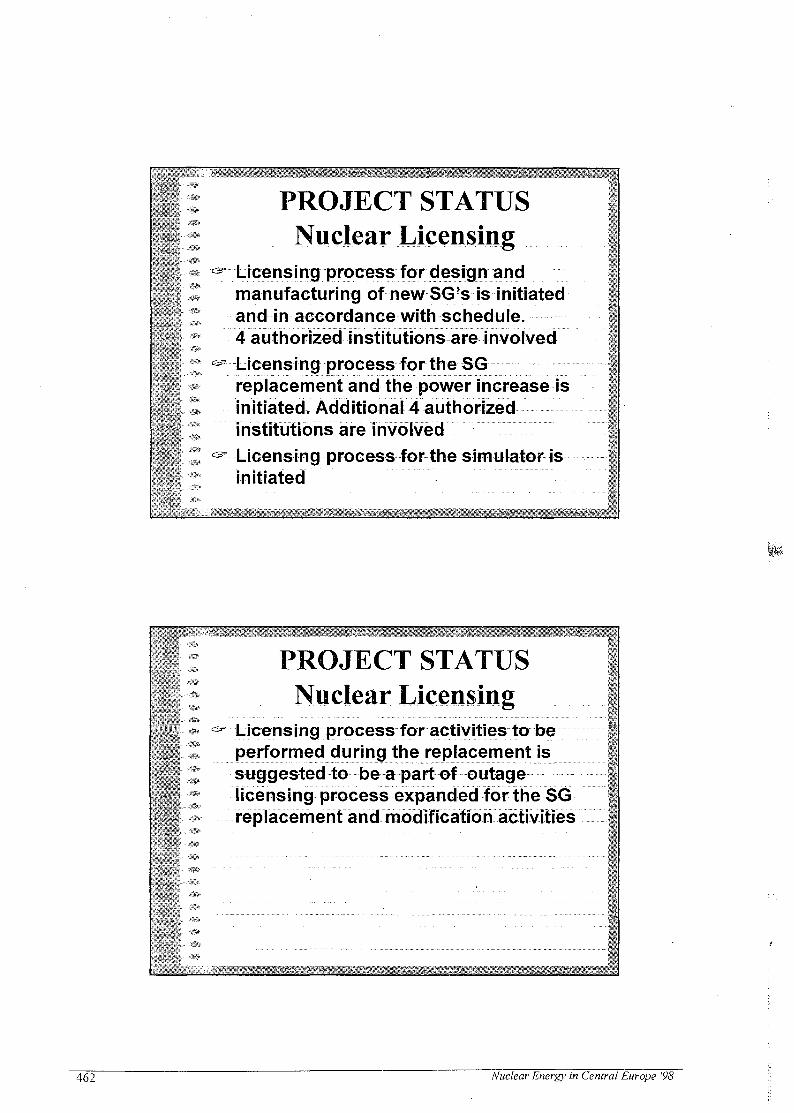
PROJECT STATUSNuclear Licensing
Licensing process for design andmanufacturing of new SG's is initiatedand in accordance with schedule.4 authorized institutions are involvedLicensing process for the SGreplacement and the power increase isinitiated. Additional 4 authorizedinstitutions are "mvdlvecT"Licensing process for the simulator isinitiated
PROJECT STATUSNuclear Licensing
Licensing process for activities to beperformed during the replacement issuggested to be a part of outagelicensing process expanded for the SGreplacement and iriodificatibh activ'ties
462 Nuclear Energy in Central Europe '98

PROJECT STATUSClassical Licensing
Licensing process for new buildings iswell in progress
^ Mottrguiggse building::;v Simulator building
Licensing process for SG replacementand temporary activities is defined asNPP rejcoristriiction and willprocessed accordingly
- • " - - ' •
- - .
- s - ~ ' -
- « - ' •
•v-
- .
Simplified Licensing ProcessProject Announcement to Regulatory Body
Application for formal initiation of licensing process with project description and specification submittal
Step by step review of project documentation and safety analysis from Authorized Institution and regulatory body
j Incorporation and resolution of comments from review process and approval/acceptance of reports J
Formal application for approval of proposed changes and associated safety analysis/evaluations j
| Final regulatory body review and approval of project and safety analysis |
j Implementation
• •
-
t
Nuclear Energy in Centra! Europe '98 463

Authorized institutionsSJei\
1. Institut Jozef Stefan2. Fakultet za elektrotehniku 1
racunarstvo - Zagreb
3. Gradbcna fakulteta
4. Enconet - Dunaj
Rjpl .lament Sic tni (
I Strojna Fakulteta
_ Institut za varilstvo1 Institut za kovinske materiale in
tehnologijo1 Institut za metalne konstrakcije* Aditional support to NEK
review process is provided byUS
Additional authorized institution will participate in replacementactivities review process and classical licensing
Project Status - FinancingFinaneial Sourees for
Modernization Projectv 000 DEM
1.2.L2.2.
TotalOwn Source*Loan
Planed265,310
• 75,825' 12!M8f
Used
52,63052,630
0
realiz.26%69%0%
Planed per yearlUttlU
28,2556,194
22,060
1999
44,1807,353
36,826
2000
76,640. 12,508
64,133
2001
113454.8806,465
4 6 4 • Nuclear Energy in Central Europe '98

Project Status - FinancingBASIC DATA ON CREDIT
FACILITIESLoan Amount:
Bank Consortium:
Interest Rate:
Paying of Interest:
Loan Availability:
Repayment Schedule:
130,0 m io D EM
Helaba Landesbank Hessen-ThuringenKreditanstalt fur Wiederaufbau inBayerische Landesbank
variable LIBOR (DEM) plus a margin "of0,65 % p.a.
semiannua'tly during the repay mentperiod prior to overdue capital, after therepayment period simultaneously withthe overdue capital
until December 30, 2001
20 equ a I cons ecu ti v e s e rri ia h fiu'a Iinstalments, the first installment to borepayed 6 months after the date of thelast disbursement.
Project Status - FinancingPayment Status
Subproject
I.H.III.IV.
V.
RSGSafety AnalysisSGRSimulator
Additional CostTOTAL
Planed
. 53,053, 25.9S2
70,890• 23,197
3118$!
205310
USED
26,5265,4243,5528,1911,835
52,630
realiz.50%21%5%
35%6%
26%
v 000 DEMPlaned per year
5,3056,2107,0823,408
5,61227,617
199910,6116,303
10,6349,2797,353
* 44,180
20005,3058,044
4^6231,160
12,508
76,64(1
2001• 5.305
00
' U60•4,880
11345
Nuclear Energy in Central Europe '98 465

KEY ISSUES FOR PROJECTSUCCESS
,3° Early involvement in the design andplanning phases of the project by the keyplant organizations and personnel
^ Teamwork and open communicationesta b I is h ed ea rlya n d contin u o us lythroughout the project between thediverse organisations inside NEK and thecontractors " '.
KEY ISSUES FOR PROJECTSUCCESS
^ Implementations of lessons learned frompast SGR's by both NEK and maincontractors
^ Commitment to safety and ALARA& Use of ex pe"t\e n ced co ntractors and
subcontractors
466 Nuclear Energy in Central Europe '98

KEY ISSUES FOR PROJECTSUCCESS
& |\jf[anagement support from within theparticipating companies
^ Theeverybody's; goal to complete theproject in a
s safe;v- quality ands efficient manner
FUTURE ACTIVITIES
Follow overall project with attention to:
. v quality of the worky interfaces between different projectsf controland follow project schedule
Nuclear Energy in Central Europe '98 467

SI0100143
Nuclear Energy in Central Europe '98
Terme Catez, September 7 to 10, 1998
A new approach to the LILW repository siteselection
Irena Mele, Nadja ZeleznikAgencija za radioaktivne odpadke
Ljubljana, Slovenija
AbstractAfter the failure of site selection, which was performed between 1990-1993, the Agency forRadwaste Management was urged to start a new site selection process for low andintermediate level waste (LILW). Since this is the most sensitive and delicate phase of thewhole disposal project extensive analyses of foreign and domestic experiences in siting wereperformed. Tliree different models were studied and discussed at a workshop on preparationof the siting procedure for LILW repository. The participants invited to the workshopsupported the combined approach to the site selection, which is presented in this paper.
If
Introduction
As a radioactive waste producer Slovenia needs a permanent solution for differenttypes of radioactive waste. In the first step a repository for low and intermediate levelwaste (LILW) should be constructed. At present the operational waste from thenuclear power plant is stored in LILW storage at the Krsko site, while low andintermediate level waste from all other producers is stored at the Research ReactorCenter near Ljubljana. These storage capacities are limited and will soon run out,which is specially true for the LILW storage at Krsko. Although by waste volumereduction, improvements in waste treatment and reduction of waste production theoperation of the storage in Krsko can be prolonged, it can not be a substitute for thefinal solution.
Unfortunately previous attempts to locate a disposal facility in Slovenia wereunsuccessful. The siting process for LILW repository, performed between 1990 -1993, was suspended in its final phase. The project continuation was estimated as notfeasible.
Therefore, the RAO Agency, with the assignment of providing conditions for finaldisposal of radioactive waste, was urged to start a new site selection process for theLILW repository. Since this is the most sensitive and delicate phase of the whole 'disposal project good preparations based on foreign and domestic experiences are veryimportant and can significantly contribute to the final result.
Nuclear Energy in Central Europe '98 471

Experiences in previous LILW repository siting project
The first preliminary studies concerning the LILW repository started before thenuclear power plant went into operation but the siting process actually started in 1990.Mainly due to economic and technical reasons it was limited only to surface and nearsurface type of repository.
The technical part of the project, based on systematic technical screening of theterritory to identify the most suitable areas/locations, was concluded in 1993. As aresult five most suitable locations were identified. The presentation of the results tothe public was unsuccessful and has provoked strong disapproval within the localcommunities where the locations were identified. Because of the extremely negativereactions from local municipalities, the public acceptance criterion at these locationswas not met, therefore in 1993 the siting process was suspended. All activitiesconnected to this siting were stopped.
The later analyses of this siting process were more or less unique in judgement thatthe main reason for the failure of the siting project was insufficient and inadequateprovision of information to the public. Information on the project was poor, publicparticipation in the site selection process was not established and the representativesof local communities were not involved in the process.
The analyses also agree that the site selection process did not have sufficient politicalsupport. A waste management policy that could have provided the needed linkbetween the politicians and the investor, did not exist. In fact, the period of the siteselection process coincided with the time of tremendous changes that occurred in ourcountry in the late eighties and early nineties. The changes in the political, social andeconomic system, in combination with the growing opposition to the peaceful use ofnuclear energy, would require a different approach to the problem. The siting project,based on the technical screening method should have adapted to all changes and newcircumstances, but due to its long-term nature it was practically impossible.
From lessons given in the previous project the Agency learnt that public acceptance isthe crucial element in the whole siting procedure. Therefore public involvement andparticipation in new siting project are the imperative and have to be studied andprepared very carefully.
Alternatives to the site selection
For this reason, before starting the new siting project, the Agency for RadwasteManagement made an extensive analysis on possible approaches to the site selection.Following foreign experiences, three different approaches were studied: besides the"technical" approach, which was used in the previous siting process, the volunteersiting, based primarily on voluntary participation of the local community in the sitingprocess, and the combined approach - a mixture of the first two approaches, wereexamined.
472 Nuclear Energy in Central Europe 98 \

Technical screening
The technical screening is a process of filtering or sifting of large areas with relativelyhigh potential technical suitability for a given facility by applying a rigid set of criteriaagainst which regions, areas and sites can be judged.
In the case of the site selection process that was performed in Slovenia between 1990 -1993, 43 different criteria were used. The procedure was divided into four steps. Inthe first step the unsuitable areas were excluded by taking into consideration the roughexclusion criteria, such as: national parks, urban zones, ground water resources,presence of active faults, geothermal areas, flood areas, presence of natural resources,etc.
In the second step potential sites were identified by applying preference criteria suchas seismicity and geology, land use and water resources. In the third step potentialsites were reduced to candidate sites by comparing potential locations using thecriteria on population, economical feasibility, transport and ecology. In the fourth,final step, the most suitable location should have been confirmed by fieldinvestigations. Due to public unacceptability the siting process was stopped beforethis step was performed.
Technical screening represents a directed siting methodology also known as Decide-Announce-Defend approach. In the past it has been applied in different countries.
Volunteer siting
As the complete opposite to technical screening we have volunteer siting. Thisassumes voluntary participation of local communities in a siting process. Theproponent of a particular facility, e.g. radioactive waste repository, invitescommunities to volunteer their locality as a potential site. All bids must be evaluatedaccording to the prescribed criteria and all necessary investigations must be performedto confirm the suitability of potential locations. Only if the site characterization issuccessful and all safety criteria are met, can the location be confirmed as suitable.
Voluntarism must be respected throughout the whole project. The decision toparticipate, or withdraw at any stage, rests wholly with the community. Therefore it isvery important to stimulate the local communities by financial compensations, rentsor other benefits to participate in the siting process and finally if the suitability of thelocation in their community is confirmed to host a repository.
In our country, volunteer siting became more feasible when the EnvironmentalProtection Act was issued in 1993. By this act financial stimulations and othercompensations to the local community, which would host the project of generalimportance, are foreseen. This possibility could be applied in the case of volunteersiting of a radioactive waste repository in our country.
Nuclear Energy in Central Europe '98 473

Combined approach
Another approach to site selection is the combined approach, sometimes also calledmixed mode siting. It is practically a mixture of the first two approaches. Besidesrough technical screening the combined approach incorporates negotiations with thehost area/community and some other elements characteristic of volunteer siting whichguarantee high public involvement.
The combined approach exists in many variations. Since it is very flexible can beeasily adapted to specific conditions and circumstances. But it is common to allvariations that, in first phase, cabinet investigations and rough technical screening ofthe territory are performed. How detailed the screening is depends on the selectedvariation of the combined approach and varies from country to country, but usuallythe tendency is to retain a larger number of potential sites. This phase is then followedby the negotiation phase with the local communities identified in previous, pre-selection phase. Only if the negotiations are successful and further steps agreed withthe local community, is the first phase followed by more detailed research includingfield investigations to assess the suitability of the potential location.
Workshop on preparation of the siting procedure for a LILWrepository
All three approaches to the site selection were presented at a workshop on"Preparation of siting procedure for a LILW repository", which was organized by theRAO Agency in autumn last year. Experts from different fields of work (technical,natural and human sciences) were invited to participate in the workshop and to discussthe most appropriate site selection approach for Slovenia. The majority of theparticipants supported the combined approach. In their opinion, the advantage of thecombined approach is flexibility, transparency and public involvement from the earlystage.
The RAO Agency was recommended to continue with further preparations of thismixed mode siting. It was also concluded that site selection should be limited to short-lived LILW repository only, including a surface and underground type of disposalfacility, and that cost assessment of site selection should be prepared as soon aspossible.
Discussion at the workshop also opens some other questions connected to preparationof the site selection process and LILW repository construction. Participants of theworkshop were united in their opinion that Slovenia needs an overall strategy ofLILW management. The LILW management strategy should include all elements ofwaste management: production, storing, treatment and conditioning, site selectionprocedure, repository construction and post-closure activities.
They also agree that it is necessary to stimulate research activities in wastemanagement. The competent ministries and other institutions can significantlycontribute towards increasing the research activities in this field.
474 Nuclear Energy in Central Europe '98

A summary of the workshop's conclusions has been prepared and distributed tocompetent ministries, representatives of the political parties and others. Therecommendations were immediately incorporated into the working plan of the RAOAgency and the proposal for site selection process has been prepared.
The proposed site selection procedure
The proposed combined site selection process should meet two main criteria:- the location together with the repository should provide a safe disposal solution
which must be proved by the safety assessment,- the site selection must be performed in agreement with the local host community.
By considering also the IAEA recommendations for site selection the proposedcombined procedure can be divided into four stages, which are schematicallypresented in Fig. 1.
1st stage
2nd stage
3rd stage
4th stage
Stage
Conceptual and planning stage•
Area survey stage•
Site characterization stage•
Site confirmation stage
Time
1999
2001
depends on negotiations
depends on negotiations
Fig.l: Scheme of combined site selection process.
The first stage is very important since the preparations must be extensive. Differentaspects must be respected and all elements that may influence the siting proceduremust be included. At this stage, the forms of public participation and involvementmust be defined and planned.
In second stage first the suitability of the Slovenian territory for a surface orunderground repository of LILW will be examined by cabinet investigations. Then atthe areas of interest the contacts with local communities and municipalities will beestablished as it is seen in Fig.2.
Nuclear Energy in Central Europe '98 475

Identification of potentially suitable areas
Invitation to local communities to volunteer
Decision of localcommunity
potentiallysuitable locations
withdrawalfrom the
procedure
Fig. 2: Scheme of the second stage of the site selection process.
The communication with the local community/-ies can be established in manydifferent ways. Roughly they can be grouped as follows:- agreement of local community to participate in the site selection process is
obtained by inviting tenders for participation or- the local community is invited to participate in the site selection process through
an independent mediator who conducts the negotiations between the communityand the investor. The mediator represents the link between the two parties andfacilitates the communication and negotiations between the investor and the localcommunity. He (or she) should be completely independent, respected and withhigh public credibility, and with sufficient authorization to run the negotiations.
The idea of a mediator was strongly supported by the participants of the workshop. Itis believed that such an institution can significantly contribute to the successfulconclusion of the site selection process, especially if he were to have sufficient publiccredibility and adequate authorization for negotiation. Therefore the RAO Agencygives preference to the mediator in carrying out the most demanding negotiationphase.
Based on these principles the siting procedure is non tentatively prepared. Therecommendations of the workshop were already incorporated and some new elementswere added. Cabinet investigations have already started in order to conclude the areasurvey by 2001.
476 Nuclear Energy in Central Europe '98
Conclusions
Because of the unsuccessful siting process in 1990-1993 the RAO Agency has starteda new site selection procedure. Extensive preparations including detailed analysis offoreign experience were performed before the new approach was proposed. Amongthree different models for site selection the RAO Agency gives preference to themixed mode siting which combines technical screening with volunteer principle andnegotiations. Such an approach was also given full support by experts from differentworking fields participating in the workshop on preparation of the siting procedure forthe LILW repository, which was organized by the RAO Agency last year.
This year the work on the siting programme is being continued with the selection ofadequate siting methods and some other studies in order to complete the combinedprocedure. The second stage of the site selection process is already under preparation,and according to the schedule, by the year 2001 the area survey should be concluded.The third and fourth stages of the site selection programme are more distant, andstrongly depend on how successfully the negotiations will be conducted. According tothe optimistic scenario, the site selection can be accomplished by 2003 and theconstruction of a repository by 2007. However, in the negotiation phase some delaysmay occur, which may also affect the planned timing for a repository.
References
1. Zasnova postopka pridobivanja lokacije odlagalisca NSRAO z zbiranjem ponudbnapodlagi javnega razpisa, IBE, 1995, Ljubljana
2. Priprava postopka za izbor lokacij odlagalisca NSRAO, I.del, IBE, 1997,Ljubljana
3. Priprava postopka za izbor lokacije odlagalisca nizko in srednje radioaktivnihodpadkov, Zakljucki delavnice, Agencija RAO, Ljubljana, 1998
4. Analiza izkusenj v predhodnem postopku izbora lokacije za odlagalisce NSRAO -Sinteza, Agencija RAO, 1998
5. Final disposal of LILW in Slovenia - present and future activities, I.Mele,A.Loose, Agencija RAO, Tuscon, Waste management conference, ZDA, 1995
6. Public relations and siting project in Slovenia, I.Mele, Agencija RAO,7. The geological aspects for LILW repository site selection in Slovenia,
B.Petkovsek, ZAG Slovenije, D.Marc, Agencija RAO, I.Osojnik, URSJV, 1996,8. P.J. Richardson, An Overview of International Siting Programmes for Radioactive
Waste Dipsosal Facilities, SSI-rapport 94-15
Nuclear Energy in Central Europe '98 All

SI0100144
Nuclear Energy in Central Europe '98
Terme Catez, September 7 to 10, 1998
LIQUIDE WASTE VOLUME REDUCTIONBY
IN-DRUM DRYING SYSTEM
Mag. Bojan Volaric, dipl. ing.Marjan Zorko, prof.
The Krsko NPPVrbina 12, Krsko
Slovenia
ABSTRACT
The disposal of radioactive waste is becoming increasingly difficult because of the lack of availablevolume on site, the rising disposal costs and the lack of ultimate disposal sites. Optimizedtreatment and volume reduction of concentrates and spent resins prior to interim storage, finaldisposal, and solidification processes are major step to counteract the situation.
Concentrate volume reduction - The drying and volume reduction process converts the collectedconcentrate into a dry solid waste product with nearly no residual moisture and no free-standingwater. The homogenized and chemically pretreated concentrate is pumped from Waste EvaporatorPackage into the Concentrate Buffer Tank. Chemical post-treatment is possible by adding of acid,caustic, or anti-foamant. The 200 1 drums are located at two drying stations. After the drum isfilled with concentrate, the drum is set under vacuum and heated to about 70 °C. Boiling beginsand the solids precipitate in the drum. Heat is applied to the drum from the electrical heating unitsthroughout the process. The average boiling rate is about 4 liters per hour during evaporationprocess. When the system controls have indicated that the drying process is finished the drum istransferred to the roller conveyor for being further transported to the drum capping device. Aftercapping the drum is picked up from the roller conveyor and placed on an electrically driven drumtransport cart for being further transported to the intermediate drum storage on-site.Spent resin volume reduction - The drying and volume reduction process for spent resinsconverts it into a dry, free flowing bead resin condition. The homogenized spent resins are flushedfrom an existing spent resin storage tank as water/resin suspension into the spent resin drying tank.After the drying tank is filled with a certain amount of resins the resin flushing process is stoppedand the remaining water in the drying tank is discharged. By heating up the tank contents andevacuating the tank, the water of the wet resins is evaporated until the resins are dried to a residualmoisture contents less than 30 w/o minimum. When the system controls have indicated that thedrying process is finished, the dry and free flowing bead resins are discharged by the force ofgravity directly into a 200 1 drum. The filled drum is afterwards transferred by use of the rollerconveyor to the drum capping device and further transported to the intermediate drum storage on-site.
By the In-Drum Drying System a significant volume reduction will be developed. The yearlyproduction of 550 drums of concentrate will be reduced to 30 drums and the production of 80
Nuclear Energy in Central Europe '98 . 479

drums per year of spent resin will be reduced to 24 drums. These numbers of drums are estimatedconservatively for the years in the future operation.
INTRODUCTION
The Nuclear Power Plant Krsko is in commercial operation from the 1983. At that time it wasassumed that the ultimate disposal place would be defined and erected in nineties. An InterimStorage Area for low and mid rad-waste was built for temporary storage. It is divided in sixsections and it enables to store drums with the volume of 200 1 NPP Krsko yearly production oflow and mid-waste is shown in Table 1:
19901991199219931994199519961997
CompressibleWaste
(No. drums )
18094207192132409242142
EvaporatorBottom
(No. drums)
522279382213133400145139
OtherWaste
(No. drums)
3000036949
SpentResin
(No. drums)
650398204300
Filters(No.
drums)
21.01191926200
TOTAL(No.
drums)
791373629506284881476330
Table 1: Interim Storage of Rad-waste in NPP Krsko
The ultimate disposal facility wasn't erected and in 1988 and 1989 NEK was forced to use super-compaction campaign for rad-waste volume reduction. By the existing technology of volumereduction and super-compaction campaign NEK couldn't enable enough volume in the interimstorage building until the planned end of plant operation ( in 2023 ). 4,5 sections are filled withdrums at the moment and the storage is expected to be completely filled with drums in the next3 - 5 years. At the beginning of nineties we lunched an investigation into a technology by whicha significant volume reduction could be managed in the area of liquid waste production. Thelimitations were:
no additional building on site- storage of wastes in 200 1 drums- use of existent storage system for temporary storage of the drums.
In 1994 NEK signed a contract with the Siemens KWU company, by which a new In-Drum DryingSystem ( IDDS ) technology will be used for significant volume reduction of new producedEvaporated Bottoms ( EB ) and Spent Resin ( SR ). By this technology the EB with approximately20% of solids will be dried to a monolithic block with no freestanding water and SR will be driedto less than 30% of residual moisture. The expected drum volume reduction factor in the InterimStorage Area was foreseen for EB 22 and for SR 4 - 5. It was decided that this technology wouldbe installed into the Drumming Room ( DR) area where from original design and construction the
480 Nuclear Energy in Central Europe '98

technology for filling the drums with liquid wastes is already installed. The area for temporarystorage of drums behind the shielding wall will be used for IDDS technology. In case of amalfunction of the IDDS, an old system for filling the drum with slurry directly into the drumsmust be prepared for operation without any special installation work.
FUNCTIONAL REQUIREMENTS AND SYSTEM LAY-OUT
Resin Suspension Cooiir-o Wote
Cxhoust Air
!N-0 fum Drying Slotion (2*)for 200 I Drums
Figure 1: IDDS system diagram
The existing liquid rad-waste system consists of two evaporators ( waste and boron recycleevaporator ) and a system for primary and blow down spent resin. The evaporators generate theconcentrate, which is transferred from the evaporator room into the drumming room by thecentrifugal pump for further treatment. The spent resin is discharged after the depletion into theblow down or primary spent resin tank. Afterward the resin is transferred into a mixture of spentresin and water into the drumming room for processing.
The new drying and volume reduction process will convert this type of rad-waste into a dry wasteproduct which is packed into 200 1 drums ( Figure 1: IDDS system diagram ). The new rad-wastetreatment system consists mainly of the following sections:
- Spent Resin-Drying Tank with Drum Filling Station- Concentrate Buffer Tank with Recirculation Loop- Skid Mounted In-Drum Drying Stations 1 and 2 for 200 1 Drums- Skid Mounted Main Processing Unit with Condensers and Vacuum Unit
Drum Handling Equipment- Local Control Panels and TV Cameras- Sampling device for EB and SR
Additional shielding for new equipment.
The components/skids are installed behind shielding walls and the system is operated in a batch-
Nuclear Energy in Central Europe '98 481

wise mode. The system controls are automatic, semi-automatic, and/or manually. They areinitiated from a local control panel in DR behind the shielding wall ( Figure 2: Control Panel ) andfrom a special container. The system should be connected to the plant information system. Processcan be controlled through the two lead windows on the shield wall, a monitor on the control paneland through two cameras.
Figure 2: Control Panel
Radiation dose levels are a function of the specific activity ( Bq/m3) which increases during thedrying process and the main nuclide composition C06O, Csl37, Csl34, Mn54, etc. of the feedstreams. The new system wouldn't change the licensed working areas but it would cause adecrease of the exposure to the operators attending the process. '
The process is designed in accordance with the ALARA principle in order to minimize radiationimpact on the equipment and significantly reduce the necessary maintenance and inspectionactivities as well as to prevent human exposure. Besides, additional shielding structures wereinstalled for system components, piping, waste drums handling and transport. The shielding designis such to allow entering the processing area for a short time for maintenance and inspection.
During the drying process, all necessary drum manipulations are done remotely. Remotelycontrolled activities include transport of drums, capping, lifting and inserting the drums in a shieldcontainer. A special equipment is designed to support remote manipulations, such as TVmonitoring, transport crane device, capping device, roller conveyers, shielding cask on anelectrically driven drum transport cart, etc.
A wide range of area monitoring systems is also provided to monitor the gamma dose rates inspecified areas. Two radiation monitors are installed in the process area. These monitors areconnected to the computer units for continuous monitoring.
CONCENTRATE DRYING
482 Nuclear bnergy m Central turope Vo

The drying and volume reduction process described converts the collected/stored concentrate (evaporator bottoms ) into a dry solid waste product ( monolithic salt block ) with nearly noresidual moisture and no free-standing water - Figure 3: Dried Concentrate.
I - * > '
Figure 3: Dried Concentrate
The homogenized and chemically pretreated ( pH adjusted ) concentrate is pumped from theWaste Evaporator Package into the Concentrate Buffer Tank. This tank has an agitator whichcontinuously stirs up the tank contents for good homogenization. Chemical post-treatment ispossible by adding of acid, caustic, or anti-foamant and controlled by a new sampling device closeto the Concentrate Buffer Tank. For proportioning of the concentrate into the in-drum dryingstations a recirculation loop driven by the concentrate pump is established. The 200 1 drums,located at each of the two drying stations, are initially filled and replenished as needed ( processcontrol) from the recirculation loop.
The 200 1 drum is placed by the existing crane, which is equipped with a special drum grab,.ontodrying stations, shell heaters are closed around the sides of the drum and the drum is lifted againstthe hood. The insulated hood contains a level instrument to determine the drum fill level. After thedrum is filled with concentrate, the drum is set under vacuum by use of the vacuum pump and isheated to about 70 °C. Boiling begins and the solids precipitate in the drum. Heat is applied to thedrum from the electrical heating units throughout the process. Initial boiling rates are about 5 litersper hour tapering off during the process as the drum begins to fill with solids to less than half aliter per hour. The average boiling rate is about 4 liters per hour during the evaporation process.The process continues until the drum is filled with solids. As a final step, the heating is continuedfor about 72 hours to eliminate the remaining water from the salt block.
The vapor generated during the drying process is routed to the process skid. Air and non-condensible gases entering the system exit the condenser directly to the scrubber tank. The gasesbubble up through the scrubber tank to permit dissolving of the impurities carried over and otherwater soluble gases. Wet air is exhausted from the scrubber by a liquid ring vacuum pump thatincludes a water separator and a cooler.
Nuclear Energy in Central Europe '98 483

The final exhaust is directly routed to the plant ventilation system. Water overflow from thescrubber tank is collected in a Condensate Buffer Tank. When the Condensate Buffer Tank isemptied, a level switch isolates it from these systems, the vacuum is replaced allowing to receiveadditional flow from the scrubber tank which is maintained under vacuum as long as the processis in operation - see Figure 4: IDDS in NE Krsko.
rFigure 4: IDDS in NE Krsko
When the system controls have indicated that the drying process is finished the drum is lowered,moved back and then lifted up by the crane and placed on the roller conveyor for being furthertransported to the drum capping device. After capping the drum is picked up from the rollerconveyor by the existing crane, which is equipped with a special drum grab, and placed on anelectrically (battery) driven drum transport cart for being further transported to the intermediatedrum storage on-site. For this drum transport the use of a shielding cask has to be considered. Thereason for this is that the concentration degree of the concentrate is constantly increased duringprocessing and the radioactivity/dose rate will increase by the same factor accordingly. Thus,shielding of the in-drum drying stations and the filled drum during non-remote handling isessential.
SPENT RESIN DRYING
The drying and volume reduction process described converts the accumulated wet/slurry like spentresins into a dry, free flowing bead resin condition. The dried resins are discharged by the forceof gravity via a filling hood directly into a 200 1 drum. The IDDS can process primary and blow-down spent resin.
484 Nuclear Energy in Central Europe '98
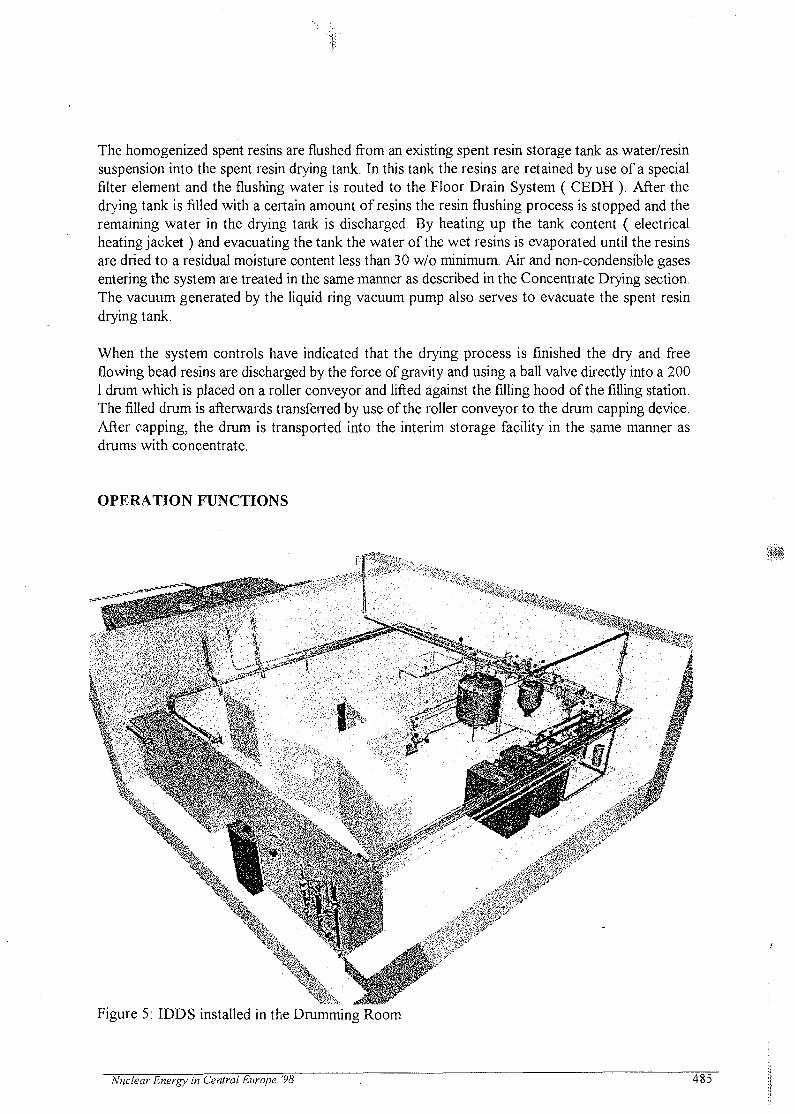
The homogenized spent resins are flushed from an existing spent resin storage tank as water/resinsuspension into the spent resin drying tank. In this tank the resins are retained by use of a specialfilter element and the flushing water is routed to the Floor Drain System ( CEDH ). After thedrying tank is filled with a certain amount of resins the resin flushing process is stopped and theremaining water in the drying tank is discharged. By heating up the tank content ( electricalheating jacket) and evacuating the tank the water of the wet resins is evaporated until the resinsare dried to a residual moisture content less than 30 w/o minimum. Air and non-condensible gasesentering the system are treated in the same manner as described in the Concentrate Drying section.The vacuum generated by the liquid ring vacuum pump also serves to evacuate the spent resindrying tank.
When the system controls have indicated that the drying process is finished the dry and freeflowing bead resins are discharged by the force of gravity and using a ball valve directly into a 2001 drum which is placed on a roller conveyor and lifted against the filling hood of the filling station.The filled drum is afterwards transferred by use of the roller conveyor to the drum capping device.After capping, the drum is transported into the interim storage facility in the same manner asdrums with concentrate.
OPERATION FUNCTIONS
Figure 5: IDDS installed in the Drumming Room
Nuclear Energy in Central Europe '98 485

Concentrate is fed into the 200 1 drums placed into the drying stations as long as a solid block isformed inside the drums. Spent resins are processed in batches, the spent resin drying tank is filled,the flushing water volume removed, the remaining resin volume dried, and the dry resins directlydischarged into a 200 1 drum. The remaining resin in the water/resin feed line can be flushed backto its origin by using demineralized water.
A proven system design and experienced long-term operation system components as well as acustomized process application are provided. The systems are designed to minimize operatorinterface by automating the system where possible. The equipment is skid mounted whereapplicable, to promote transportability, and easy of installation. The systems are supported by thefollowing plant services available: Make-up Water System, Component Cooling System,Compressed Air/Instrument Air System, the Auxiliary Building HEPA Ventilation System, FloorDrain System, Liquid Waste Processing System and electrical power supply.
The EDDS is controlled by Programmable Logic Control ( PLC ) and can work in automatic, semi-automatic and manual mode. The basic function of the PLC is to control the process in order toassure that the process fulfils the requirements of technology as well as the requirements regardinghuman radiation protection. For that purpose two radiation monitors in the drumming room areused to enable continuous measurement of gamma ambient doses.
CONCLUSION
Today we have approximately 3000 locations left for drums in the NPP interim storage area.NEK's goal for the next years of plant operation is to reduce the total low and mid-wastegeneration to less than 100 drums per year. The results of the IDDS technology will help ussignificantly reduce the low and mid liquid waste in the future years of operation from almost 700drums of liquid waste per year to approx. 50 drums per year. Considering further activities on thewaste reduction program we believe that the available ( of free ) 3000 locations in the InterimStorage Area will be enough to the end of plant operation in 2023.
REFERENCES
1. Program gospodarjenja z radioaktivnimi odpadki, NE Krsko, June 19962. Gospodarjenje z radioaktivnimi odpadki v NE Krsko, NE Krsko, April 19973. Design Modification Package 102 - WP - L - In-Drum Drying System, Siemens BRD, March
19974. Operation Manual for IDDS, Siemens BRD, September 1997
Nuclear Energy in Central Europe '98
f SI0100145
Nuclear Energy in Central Europe "98
4 l l S S Terme Catez, September 7 to 10, 1998
CONSOLIDATION OF SPENT FUEL RODS AS AN OPTION TO
INCREASE THE CAPACITY OF SPENT FUEL POOL
Dubravko Pevec, Kresimir Trontl, Ivica JurcevicFaculty of Electrical Engineering and Computing
University of Zagreb10000 Zagreb, Unska 3, Croatia
Abstract
Using the SCALE-4 code package we have analyzed consolidation possibilitiesof the NPP Krsko spent fuel pool. We considered an approach to capacity increase of theNPP Krsko spent fuel pool in which additional racks with consolidated fuel have to bedesigned and installed in the free space of the spent fuel pool. Two case were analyzed: thefirst case assuming that old fuel (fuel that is already in the spent fuel pool) would beconsolidated and the second case assuming that new fuel (fuel that will be used in the future)would be consolidated. We have showed that it is possible to design the additional canisters(with consolidated fuel) in free space of the spent fuel pool with the sufficient total capacity tostore all the spent fuel generated during the 40 years lifetime of the plant.
1. INTRODUCTION
Most of the nuclear industry's spent fuel is now being stored in water pools at the
reactor sites [1]. As the ultimate disposition of spent fuel, either by direct disposal or
reprocessing, is postponed in most countries (including United States), utilities in these
countries are running out of storage capacity in their spent fuel storage pools. The most
widely used technique to extend the spent fuel pool capacity is reracking. In the recent paper
[2] we analyzed reracking possibilities of the NPP Krsko spent fuel pool. Consolidation of
spent fuel rods is another technique, which could be used to increase capacity of spent fuel
pool.
Spent fuel rod consolidation [3] is the process by which the fuel rods of spent LWR
fuel assemblies are removed from the non-fuel bearing components (skeleton), such as end
fittings, guide tubes, and spacer grids. The fuel rods are then placed into canisters for storage
Nuclear Energy in Central Europe '98 487

purposes. Fuel compaction ratios of 2 to 1 can be achieved, thus the rods from two fuel
assemblies can be stored in the space required for one assembly. Skeleton compaction ratios
of 8 or 10 to 1 can be achieved, thus the skeletons from 8 or 10 fuel assemblies can be stored
in the space required for a single fuel assembly. The result of the rod consolidation is a
decrease in the space requirements for the interim storage and final disposal of the spent fuel.
The spent fuel pool of the NPP Krsko [4] contains 12 racks for spent fuel assemblies
with 12 inches center-to-center spacing of storage cells. The capacity of the NPP Krsko spent
fuel pool is 828 spent fuel assemblies. There is free space in the spent fuel pool, which could
be used for additional installation of spent fuel racks. Currently 526 spent fuel assemblies are
stored in the spent fuel pool. Apparently, the existing spent fuel pool capacity is not sufficient
to store all fuel discharged during the NPP Krsko lifetime.
We investigated how would the consolidation option affect a need to increase the
capacity of the NPP Krsko spent fuel pool. Our ultimate goal was to find out whether it is
possible by consolidation technique store all spent fuel accumulated during lifetime of the
NPP Krsko (40 years) in the existent spent fuel pool.
Calculational tools and methodology used to analyze consolidation of spent fuel rods
in the NPP Krsko spent fuel po6l are described in Section 2. Results of analysis are presented
in Section 3. Conclusions are given in Section 4.
2. CALCULATIONAL TOOLS AND METHODOLOGY
The SCALE code system [5] developed at Oak Ridge National Laboratory has been
used as the computational tool to investigate the consolidation possibilities of NPP Krsko
spent fuel pool. Criticality safety analyses are performed via the criticality safety analyses
sequences (CSAS), and ORIGEN module is used for the depletion calculations. The SCALE
27-group burnup library containing ENDF/B-IV (actinides) and ENDF/B-V (fission products)
data have been used for all calculations.
We considered an approach to capacity increase of the NPP Krsko spent fuel pool in
which additional racks with consolidated fuel have tc be designed and installed in the free
space of the spent fuel pool.
We analyzed two options: a) an option in which old fuel (fuel that is already in the
spent fuel pool) would be consolidated and b) an option in which new fuel (fuel that will be
used in the future) would be consolidated.
488 Nuclear Energy in Central Europe'98 \

WaterStainless steelFuel assembly
Figure 1. Storage cell for a spent fuel assembly
ii1u
i H<
U-.
0
Q_0
1
8191583566
94996
,2319
cm
cm
cm
cm
> ; ;
• • i |
Figure 2: Fuel rod unit cell
Nuclear Energy in Central Europe '98 489

A computational model assumed that existing fuel racks consist of the storage cells
depicted in Fig. 1. The spent fuel assembly consists of unit cells given in Fig. 2. The spent
fuel rods from two spent fuel assemblies are put into specially designed canister. The cross
sectional view of the canister is given in Fig. 3. The canisters are put in the free space of the
NPP Krsko spent fuel pool.
20,9 cmH - • - — • - - • - :
21,9 cm• - < • - - • - - • -v
Figure 3. Cross-section of consolidation canister
3. IMPACT OF CONSOLIDATION OPTION ON THE NPP KRSKO
SPENT FUEL POOL CAPACITY
Total number of spent fuel assemblies accumulated during the NPP Krsko lifetime has
been estimated. We assumed 12-months cycle till the year 2003 (one cycle with 28 fuel
assemblies discharged and 4 cycles with a 36 fuel assemblies, discharged after power uprate).
A transition to 18-month cycle is foreseen, for the period from the year 2003 to the end of
operation in the year 2023. 48 fresh fuel assemblies of enrichment 4.85 w/o in U-235 are
needed for a 18-month cycle of the NPP Krsko for uprated conditions. On the yearly basis it
would correspond to 32 spent fuel assemblies, so 19x32 spent fuel assemblies would be
490 Nuclear Energy in Central Europe '98

discharged in that period. After the last cycle the full core (121 fuel assemblies) has to be
discharged. Taking into account that 526 spent fuel assemblies are currently stored in the
spent fuel pool the total number of spent fuel assemblies accumulated during the 4o years
lifetime is 526+1x28+4x36+19x32+121=1427. As the capacity of the existing spent fuel
racks is 828, a storage place for additional 599 spent fuel assemblies has to be provided.
There is a free space in the NPP Krsko spent fuel pool, which could be used to store these 599
spent fuel assemblies. We assumed that 599 spent fuel assemblies would be consolidated,
placed into canisters and stored in the free space of the spent fuel pool. The consolidation
canister dimensions are 21.9 cm x 21.9 cm. The NPP Krsko spent fuel pool configuration
including the consolidation canisters is given in Figure 4.
canisters with consolidated fuel
oCD
OCD
existing fuel racks
1082.5 cm
1653.5 cm
306.6 cm
Figure 4. NPP Krsko spent fuel pool configuration with consolidated fuel canisters
For the spent fuel assemblies which are already in the spent fuel pool we used in our
analysis the actual enrichments, burnups, and cooling times, and for the fuel assemblies which
will be used in the 18-month cycles in the future we assumed uniform enrichment (4.85 w/o
U-235), uniform burnup (45 GWd/tU) and uniform cooling time (2 years). The ORIGEN code
is used to calculate the isotopic composition of the fuel, but in our analysis only major
actinides (U-235, U-236, U-238, Pu-239, Pu-240, and Pu-241) are taken into account. The
effective multiplication factor for the whole-spent fuel pool is calculated by CSAS25
Nuclear Energy in Central Europe '98 491

'•>{;
sequence of SCALE code system. For the case in which old fuel is consolidated without any
boron in the spent fuel pool water we obtained the value of 0.7196±0.0033. For the same case
with 2325 ppm boron in the spent fuel pool water we obtained the value of 0.6824+0.0028 for
the spent fuel pool effective multiplication factor. For the option in which new fuel is
consolidated without any boron in the spent fuel pool water we obtained the value of
0.7156+0.0029 for the spent fuel pool effective multiplication factor. For the same option
with 2325 ppm boron in the spent fuel pool water we obtained the value of 0.6800±0.0034 for
the spent fuel pool effective multiplication factor. All these values are quite below the value
required by ANSI criticality safety standard (0.95) [6]. We may conclude that the
consolidation option offers the possibility to safely store all the spent fuel generated during
the lifetime of the NPP Krsko plant in the existing spent fuel pool.
It must be emphasized that consolidation designs described above are solely based on
criticality analysis of the spent fuel pool, and these designs have to additionally checked by
seismic and thermal-hydraulic analyses.
4. CONCLUSIONS
Using the SCALE-4 code package we have analyzed consolidation possibilities of the
NPP Krsko spent fuel pool. We considered an approach to capacity increase of the NPP Krsko
spent fuel pool in which additional racks with consolidated fuel have to be designed and
installed in the free space of the spent fuel pool. Two case were analyzed: the first case
assuming that old fuel (fuel that is already in the spent fuel pool) would be consolidated and
the second case assuming that new fuel (fuel that will be used in the future) would be
consolidated. We have showed that it is possible to design the additional canisters (with
consolidated fuel) in free space of the spent fuel pool with the sufficient total capacity to store
all the spent fuel generated during the 40 years lifetime of the plant.
It must be emphasized that consolidation designs described above are solely based on
criticality analysis of the spent fuel pool, and these designs have to be additionally checked by
seismic and thermal-hydraulic analyses
492 Nuclear Energy in Central Europe '98

References
[1] Kromar M., Kurincic B.: Options for the Interim Storage of Spent Fuel, Proceedings of 2nd
Regional Meeting "Nuclear Energy in Central Europe", Portoroz, Slovenia, September1995.
[2] Bade M., Pevec D., Smuc T.: Reracking Possibilities of the NPP Krsko Spent Fuel Pool,Proceedings of International Conference "Nuclear Option in Countries with Small andMedium Electricity Grids", Dubrovnik, Croatia, June 1998.
[3] Consolidation of spent fuel rods from LWRs, IAEA-TECDOC-679, IAEA, Vienna,(1992).
[4] Nuclear Power Plant Krsko - Updated Safety Analysis Report.
[5] SCALE-A Modular Code System for Performing Standardized Computer Analyses forLicensing Evaluation, NUREG/CR-0200, Version 4.1, RSIC at Oak Ridge NationalLaboratory (1994).
[6] "American National Standard Design Requirements for Light Water Reactor Spent FuelStorage Facilities atNuclear Power Plants", ANSI/ANS-57.2-1983, American NuclearSociety (1983).
Nuclear Energy in Central Europe '98 493

SI0100146
Nuclear Energy in Central Europe '98
Terme Catez, September 7 to 10, 1998
Formulation of Natural Convection around Repository for DualReciprocity Boundary Element Solution
L. VrankarSNSA, Slovenian Nuclear Safety Administration, Vojkova 59, SI-1000 Ljubljana, Slovenia
B. SarlerLaboratory for Fluid Dynamics and Thermodynamics, Faculty of Mechanical Engineering,
University of Ljubljana, Askerceva 6,SI-1000 Ljubljana, Slovenia
AbstractThe disposal of high-level radioactive wastes in deep geological formations is of pronouncedtechnological importance for nuclear safety. The understanding of related fluid flow, heat and masstransport in geological systems is of great interest. This article prepares necessary physical,mathematical and numerical fundamentals for computational modelling of related phenomena. Theporous media is described by the simple Darcy law and momentum-energy coupling is due toBoussinesq approximation. The Dual Reciprocity Boundary Element Method (DRBEM) is used forsolving coupled mass, momentum and energy equations in two-dimensions for the steady buoyancy-induced convection problem in an semi-infinite porous media. It is structured by weighting with thefundamental solution of the Laplace equation. The inverse multiquadrics are used in the DRBEMtransformation. The solution is obtained in an iterative way.
1. Introduction
The understanding of transport phenomena in porous media [1] is of great importance. Forexample, this class of phenomena are encountered in hydrology, petroleum geology,underground disposal of nuclear wastes, etc.The disposal of high-level radioactive wastes in deep geological formations (e. g. clay, saltand granite) are of pronounced technological importance for nuclear safety. The aim ofdisposal is to prevent the radionuclides to return to the biosphere (soil, surface waters). Toassess a long term safety of such radioactive waste disposal system, mathematical models areused to describe the complicated groundwater flow, chemistry and potential radionuclidemigration through these formations [2]. Recommendatibns for this analytical safetyassessment work for underground disposal have been prepared by the IAEA as a publicationin their Safety Series. Agency differentiates the safety assessment into two major components:scenario analysis (involving identification and definition of phenomena which could initiateand/or influence the release and transport of radionuclide from the source to men) andconsequence analysis.
Nuclear Energy in Central Europe '98 495

The ability to define acceptability criteria against which a disposal facility design can be put totest may only leave the 'as low as reasonably achievable' principle for developing as overalldisposal system with a minimum of detriments on the long-term.However, it is necessary for the safety assessment to understand the complex behaviour offlow and species transfer in the vicinity of a repository. These phenomena are being studiedwith relevance to disposal of wastes in several countries. Until now stochastic approaches,hydrologic modelling, laboratory research, computational modelling, etc. were used. The'transport phenomena in spectra of geological systems could be described as equivalent porousmedia with respect to fluid flow and solute transfer.Shortly after disposal the temperature near the repository will increase and thermal stresseswill occur, which may have an influence on the permeability of rock mass. Furthermore, thebuoyancy induced fluid flow will occur in the rock mass around the repository due to thetemperature differences.This paper discusses the solution of steady natural convection problem in semi-infinite porousmedia by the Dual Reciprocity Boundary Element Method [3]. Its main goal is in preparingthe necessary physical, mathematical and computational fundamentals for development ofrelated computer programme. Computer programme will make possible a simulation of steadynatural convection in unbounded media. This physical situation represents simple first step incomputational modelling of the repository-soil system.
2. Physical Model
The porous medium is assumed to be rigid, homogeneous, isotropic, with both, the porousmedia matrix and the saturated fluid incompressible. It is also assumed that the fluid and thematrix are in thermal equilibrium ( Tsoiid = Tfluid = T) and the fluid motion can be described byDarcy's law. Permeability, viscosity, effective thermal diffusivity, and coefficient of thermalexpansion are assumed constant.The equations describing the conservation of mass (1), Darcy's law (2) and energy (3) are:
(1)
= -VP-Jiv + fJv
pocpV.(vT) = kV2T + q (3)
where v = (u, v), K, p., g, P, k, q, cp are seepage velocity vector, permeability of the medium,dynamic viscosity of the fluid, acceleration vector due to gravity, pressure, thermalconductivity of the medium, internal heat generation per unit volume and specific heat atconstant pressure of the fluid.The change of density with temperature is in present physical model included only in bodyforce term f (gravitational force per unit volume of the fluid) through Boussinesqapproximation (4):
f=gPp[l-P(T-T0)] ' (4)
In equation (4) p0 is density of the fluid, T is temperature, p is the volumetric coefficient ofthermal expansion, and the subscript 0 refers to the reference values.
496 Nuclear Energy in Central Europe '98

Boundary Conditions:The coupled set of equations can be solved only if the conditions are specified along theentire boundary (around repository and at infinite region) that bounds the flow field:
1. Around the source region (repository) T the impermeable and slip velocity boundaryconditions are assumed (the normal component of the seepage velocity v = (u,v) must vanishand other components of the seepage velocity can have arbitrary values):
v - n r = 0 (5)where n r stands for the normal on the boundary T directed into repository.
2. At semi-infinite region:v => 0; T => To; when r => QO
= 0 when r => <x> • (6)9n r
The solution of the equations (1,2) is constructed by assuming the impermeable velocityboundary conditions on the whole boundary T. The solution of the equation (3) is constructedby assuming the division of the boundary T into necessarily parts FD and FN with the Dirichletand Neumann boundary conditions, respectively
- £ ^ - = b r N ;T = TrD (7)d
with Tp and br representing known functions. The solution of the posed natural convectionproblem represents the velocity, pressure, and temperature distribution over domain Q. andboundary F.The above mentioned equations are solved numerically by DRBEM which is relatively novelnumerical procedure. It is particularly suitable for semi-infinite domains, typical for therepository-environment system.
3. Solution Procedure3.1 Overview
The boundary element method is a weighted residual technique for solving partial differentialequations, characterized by choosing an appropriate fundamental solution as a weightingfunction and by using the generalized Green's formula for complete transfer of one or morepartial differential operators on the weighting function. The main comparative advantage ofthe boundary element method over other discrete approximate methods is demonstrated incases where all of the resultant domain integrals could be represented by the boundaryintegrals. This turns out to be possible only for some partial differential equations. Whendealing with the boundary element method for the transport, equation structured by weightingwith the fundamental solution of Laplace equation, domain integrals appear at least from thetransience, convective, and source terms.The Dual Reciprocity Boundary Element Method represents one of the possibilities fortransforming the resultant domain integrals into a finite series of boundary integrals. The keypoint of the DRBEM is approximation of the field in the domain by a set of globalapproximation functions and subsequent representation of the domain integrals of these globalapproximation functions by the boundary integrals.
Nuclear Energy in Central Europe '98

3.2 Integral Equations
The construction of the solution is represented in two steps. Only basic elements arerepresented. The details can be found in [4]. The first step involves the conversion of thepartial differential equations into integral equations as well basic elements of the iterativeprocedure [5]. The second step focuses on the discretization and solution of the algebraicsystems of equations.The momentum equation is coupled with the energy equation through the body force. Theenergy equation is coupled with the momentum equation through the velocity field.Respectively, the solution inherently involves iterations.Let us assume the velocity, pressure and temperature fields are all known at iteration level m.The discussion of iteration cycle that follows explains how the velocity, pressure andtemperature field are calculated at the next iteration level m+1.The solution of the momentum equation at the iteration level m+1 is constructed in thefollowing way:The Pressure Poison Equation (PPE) is constructed by taking the divergence of the Darcy'slaw (2):
V2pm+1 = V . ( _ J L v m + f m ) (g)K
The PPE is simplified into:
by taking into account the mass conservation (1). The Neumann pressure boundary conditionscan be defined on the whole boundary F by taking the scalar product of the Darcy's equationwith the normal on the boundary. This gives:
V P m + 1 - n r = ( — t vr a + f m ) - n r (10)
K
Since the impermeable velocity boundary conditions (5) are valid, upper equation reduces to :
VP m + 1 -n r =f m -n r (11)The PPE together with the boundary conditions (11) is solved by weighting the equation (9)with the fundamental solution of the Laplace equation T* (p;s) (where s stands for the sourceposition vector and p stands for the position vector) over the domain Q. The relatedboundary-domain integral expression for the calculation of the pressure field is (afterapplication of the Green's second identity):
\——T*dr- fpm+I^-L_ dF-c*Pra+I - fV-f™ T*dQ (12)r 5 n r r dnr * a
Superscript s denotes evaluation of a quantity at the source point s. Coefficient cs equals 0 forpoint s outside Q., lA for s on the smooth boundary, and 1 for s in the domain. In this case:
2 ^ (13)2:t r
is two dimensional fundamental solution of Laplace equation, where ro represents reference0 0 0
radius and r = (px — sx) + (py - sy) .
498Nuclear Energy in Central Europe '98

Equation (12) is first used for determining the pressure distribution on the boundary T andsubsequently explicitly in the domain Q. The pressure gradients in interior points areexplicitly calculated from the Pressure Gradient Poisson Equation (PGPE [4]):
VT'dT- fpm+!V— dr + V(c;Psm+I)= fvfmVT*dfi (14)
3n ^r 8nr r 3n r ^obtained by taking the gradient of the PPE acting on the Fundamental solution source point.
After calculating the pressure gradient field the velocity field at iteration level m+1 could beexplicitly calculated from the Darcy's equation:
vm+1=.£.(-VPm+1+f111) (15)
The iteration cycle is completed by calculating the temperature field at iteration level m+1(and with this also f"*1). This is accomplished by weighting the energy conservation equationby the fundamental solution of the Laplace equation and by using the Green's second identity:
dr-cXm + 1 = f-V-(v'n+1Tm+1)T*dQ+ f^-T'dQ (16)r ^ T d r - | T — d r - c X = f - V - ( v T ) T d Q + f̂ -
with a = k/(pocp) denoting thermal diffusivity.
Equation (16) is used to simultaneously solve the unknown temperature distribution in theNeumann part of the boundary, the unknown temperature derivative in the normal boundarydirection in the Dirichlet part of the boundary and unknown temperatures in the domain.
The iteration cycle is completed with calculation of the updated body force fm+1. The iterationsare stopped when conditions: |Tm+1| -| Tm|<T6, |vm+1| -|vm|<vE are satisfied, with vE and Tsrepresenting the velocity and pressure convergence tolerances.
When the above iteration conditions are not satisfied, new iteration cycle starts with therelaxed value of body force:
f^fM-Cre^'-n (17)with crei representing the heuristic relaxation factor.
The detailed information of discretization of the involved boundary-domain integralequations and respective formation of the algebraic equation systems for the solution of theunknowns can be found in [4].
3.3 Conversions of Domain Integrals into Boundary Integrals
As was mentioned in chapter introduction the key point of the DRBEM [3] is approximationof the field in the domain by a set of global approximation functions and subsequentrepresentation of the domain integrals of these global approximation functions by theboundary integrals. This discussion is limited to the involved domain integrals:
/, = /F(p)T*(p;s)dQ; I2 = jV-G (p)T'(p;s)dQ;/3 = Jv2F(p)T*(p;s)dfi! (18)
Nuclear Energy in Central Europe '98 499

The integral type Ii arises when weighting the transience and source terms, I2 whenweighting the convective term, and I3 when weighting the diffusive term. Arbitrary scalar andvector valued functions are denoted with F(p) (scalar valued function) and G(p) (body forcein equation (12))respectively.Boundary geometry is approximated by Nr straight line segments and spatial variation of thefields on each of the boundary segments is represented by constant interpolation functionswith meshpoints coinciding with the geometrical centers of the straight line segments (seeFigure 1).Spatial variation of the fields in Q is represented by the Nip global interpolation functions [3]of the form:
F(P) = V n (PK 09)
The coefficients of the global shape functions could be expressed from the values of functionF at points n = 1,2, ... Nr+N« where the first Nr points n coincide with the nodes of theboundary elements and the last NQ points n are distributed in the domain Q.Coefficient qn are calculated by constructing a system of Nv algebraic equations:
V « = F (20)
F represents vector of collocation points pn. Coefficients <;„ follow by inverting the system ofalgebraic equations:
? = V"'F (21)
Usually, for the global interpolation function \\in in a two dimensional case (closed region)conical functions and augmented thin plate splines [6], are chosen.
For unbounded problems, however, it is not appropriate to chose the same functions. In thisway, the boundary element mesh is limited to internal boundary of the semi-infinite domainwhich encloses the repository. So it is suitable to use the interpolation function (inversemultiquadrics) which has to be employed in order to make negligible the contribution ofpoints far away from the region of the interest (infinity).
These functions have a special decay and form :
v.(p) = rr—r (22)
where rn is distance between field point p and collocation point pn, C is an arbitrary constant.The first two integrals (18) are calculated by defining the harmonic functions <pn :
V) (23)
obtained after solving the equation:
2 (24)
500 Nuclear Energy in Central Europe yd

4. Typical Input Parameters
Performance of the resulting method is compared with the results in reference [7] and [8]. Asnecessary condition for getting good results is to propose good real input data. The goal ofthis chapter is performed what kind of data can be included in the programme. Figure 1shows a circular cavity embedded in an infinite medium as an example of undergroundrepository geometry.
SOIL
Border between boundary elements
Figure 1. Cavity in infinite medium
The following typical data have been extracted from sources (thermal characteristics for tuff)[9,10]:• Thermal conductivity k [W/(mK)]: 1.875• Bulk density p0 [kg/m3]: 2297• Thermal capacitance [J/(m3K)]: 3358 at 114 °C• Specific heat at constant pressure cp[J/(kgK)]: 1460• Reference temperature To [°C] at repository depth: 26• Coefficient of thermal expansion p [°C"']: 6.8.10"6
• Static pressure P [MPa] at repository depth 300m : 6.6• Waste package data (initial area power) [W/m2] : 18.8• Permeability of the medium K [m2]: clay: 1.10'9, Sandstone: 1.10"5, Granite: 1.10"7
Nuclear Energy in Central Europe '98 501

The calculations will be performed at generic depth where source region (repository) issubject to Dirichlet conditions. It is proposed that the surface maintains approximately atemperature of 50 [°C] .
5. Conclusions
This preliminary study gives basic elements for computational modelling of the naturalconvection around repository. It is based on simplest Darcy porous media physical concept.The numerical solution, based on the Dual Reciprocity Method, has been already successfullytested in standard differentially heated rectangular cavity benchmark situation [4]. It isparticularly suitable for use in the present semi-infinite domain context due to trivialdiscretization. Next steps will include the buildup of the specific models and computer runs ingeometry's, relevant for the possible repositories. The geometry data will be provided by theSNSA. For this purpose, an axisymmetric version of the code is in development. One of themain difficulties represents the analytical integration (see [6]) of the inverse multiquadricfunctions i|/n and cpn which are currently not known.
References
[1] M. Kaviany, Principles of heat transfer in porous media, second edition, Springer-Verlag, 1995.
[2] Validation of geosphere flow and transport models (Geoval), Proceedings of aNEA/SKI Symposium, Stockholm, May 1990.
[3] P. W. Partridge, C. A. Brebbia and L. C. Wrobel, The Dual Reciprocity BoundaryElement Method, Computational Mechanics Publications, 1992.
[4] B. Sarler, D. Gobin, B. Goyeau and H. Power, Dual Reciprocity Boundary ElementMethod Solution of Darcy natural convection in porous media, Int. J. Numer. MethodFluids (submitted).
[5] B. Sarler, Solid - liquid phase change in porous media: solution by Boundary IntegralMethod, IABEM Symposium on Boundary Integral Methods for Nonlinear Problems,pp. 185-190, 1997.
[6] B. Sarler , Axisymmetric augmented thin plate splines, Eng. Anal., Vol. 21, pp. 81-85,1998.
[7] C. F. Loeffler and W. J. Mansur, Dual Reciprocity Boundary Element Formulation forpotential problems in infinite domains, Proceedings of Tenth International Conferenceon Boundary Element Methods in Engineering (Ed. Brebbia, C.A.), Sauthhampton,England, pp. 155-163, 1988.
[8] A. Bejan, Natural Convection in an infinite porous medium with a concentrated heatsource, J. Fluid. Mech., Vol. 89, pp. 97-107,1978.
[9] K.I. Johnson, D.J. Sherwood and C. F. Voss, A sensitivity study of near - fieldthermomechanical conditions in tuff, Proceedings Nuclear Waste Isolation in theUnsaturated Zone Focus '89, pp. 10-19, Las Vegas, USA.
[10] The Febex project: An in-situ full scale engineered barrier test, ProceedingsInternational Topical Meeting on Nuclear and Hazardous Waste Management, pp.2167-2173, 1996.
Acknowledgements
The authors would like to acknowledge Slovenian Nuclear Safety Administration and the ECINCO-Copernicus project ULTRA WAT for financial support.
502 Nuclear Energy in Central Europe '98

SI0100147
Nuclear Energy in Central Europe '98
S1SS Terme Catez, September 7 to 10, 1998
Uncertainties in Environmental Impact Assessments due to Expert Opinion;Case Study: Radioactive Waste in Slovenia
Branko Kontic, Jozef Stefan Institute, Jamova 39, 1000 LjubljanaMatjaz Ravnik, Jozef Stefan Institute, Jamova 39, 1000 Ljubljana
ABSTRACT - A comprehensive study was done at the J. Stefan Institute in Ljubljana andthe School of Environmental Sciences in Nova Gorica in relation to sources of uncertaintiesin long-term environmental impact assessment (ElA). Under the research two maincomponents were examined: first, methodology of the preparation of an El A, and second,validity of an expert opinion. Following the findings of the research a survey was performedin relation to assessing acceptability of radioactive waste repository by the regulators. Thecomponents of dose evaluation in different time frames were examined in terms ofsusceptibility to uncertainty. Uncertainty associated to human exposure in the far future is solarge that dose and risk, as individual numerical indicators of safety, by our opinion, shouldnot be used in compliance assessment for radioactive waste repository. On the other hand,results of the calculations on the amount and activity of low and intermediate level waste andthe spent fuel from the Krsko NPP show that expert's understanding of the treated questionscan be expressed in transparent way giving credible output of the models used.
1. Introduction
A problem of validity of environmental long-term predictions [1,2,3] associated withradioactive waste disposal and regulatory decision making in the presence of uncertainty is asubject of thorough analysis in recent time. In this connection a predictive modelling of thequantity, radionuclide inventory, and activity of the radioactive waste in Slovenia was made.Screening of doses due to waste disposal was also made. The issue in these predictions isaccuracy, i.e. validity: on one side accuracy of predictions of waste characteristics by the year2023 when the nuclear power plant Krsko (NPP Krsko) is planned to be closed down, andvalidity of exposure evaluations for the far future (more than hundred years from now) on theother. The assumption before doing calculations was that given accurate figures of thequantity, radionuclide inventory, and activity of the radioactive waste in the year 2023, thecalculation of changes of activity during time (afterwards) is relatively accurate. We usedcomputer code Origen2 for the calculations associated with spent fuel [4,5] and developed acode for calculations connected to low and intermediate level waste to test the aboveassumption. Based on results of calculations the influence of uncertainties in thesepredictions on the strategy for waste management is discussed. Another assumption, or betterexpectation was, that predictions about human exposure to disposed radioactive waste may beso uncertain, that use of dose evaluation in the licensing procedure may be questioned alsofrom technical point of view. Preliminary dose evaluations were made using computer codeAmber 3.3.
Nuclear Energy in Central Europe '98 503

2. Sources of uncertainty in EIAs and methodology of research
The research on credibility/validity of EIAs made in the past was directed as toexplore methodological sources of uncertainty of the predictions in regard to long-termenvironmental impacts. The ways of how to avoid or minimize these uncertainties (what ismeant here by uncertainty is not the so-called "statistical" uncertainty, which is connected todispersion (distribution) of information, but rather conceptual or phenomenologicaluncertainty, which is connected to understanding of phenomena [6,7]) were also investigated.One should note that there is no possibility to check (verify) long-term predictions by anykind of monitoring or empirical data at present and that in such cases expert opinion playseven a stronger role than otherwise. Even post-audits of the models are impossible in the caseof predictions for thousands of years.
In the research a set of 350 environmental reports was selected for the initial review.Purpose of this review was to gather information on how many objections by the clients,authorities, the public and others were given to these evaluations. This was the first level ofevaluating credibility and validity of environmental evaluations. The second level wasthrough special questionnaires and interviews of the experts, which were most often involvedin these evaluations.
The following main entities of the EIA process were investigated:
• Information about characteristics of a proposed activity• Characteristics of environmental setting where the proposed activity is planned to be
realized• Changes in the environment due to interactions between the proposed activity and the
environmental setting• Valuation of environmental changes (interpretation of environmental changes in terms of
values - identification of impacts)• Conclusions in terms of acceptability of environmental impacts.
The results of these investigations are:
• The evaluation of the necessity of the project for the overall society and especially forlocal people, where the project is planned to be realized, is a key starting point inassessing its acceptability. Thorough investigation of alternatives (site alternatives,transport alternatives, technological changes, etc.) makes significant support in thisevaluation. These kinds of assessments should be integrated with the evaluation ofacceptability of environmental impacts, i.e. with criteria of acceptability. Recently this isdone by integrating environmental assessment techniques with methods of economicappraisal and social impact assessment on the strategic planning level. In connection toradioactive waste repository an assessment of its necessity on national level is inevitable.
• The core of environmental impact assessment is not environmental elements as such (air,water, soil, flora, fauna, e t c . ) , but rather our relation to, and interest about theparticular element. In this sense it is more appropriate to integrally analyze why we thinkthat particular environmental element should be protected than to solely investigate itsecological importance (biological approach, nature conservation), or potentials for itspollution (pollution prevention), or the consequence of the pollution for human health.Such evaluation is much more in the context of the theory of EIA, which relies onvaluation of impacts. Connected to radioactive waste disposal this would mean that
504 Nuclear Energy in Central Europe '98

humans' interest about environmental elements, i.e. interest about potentials and the waysof using the environment determine their relation to different alternatives of its usage.Since one of the alternatives is waste disposal, the acceptability and priority of this optioncan appropriately be assessed only based on comparison with other potential uses of aparticular environment. This is usually done by using land-use comparison as a basis.
• The underlying components in any EIA are, therefore, the following relations:
=> We and Elementary (why we think that protection of nature in its original, i.e. elementarystate is appropriate? This is usually articulated by Nature Conservation).
=> We and Pollution (why we think that we need to prevent pollution? Usually articulated asPollution Prevention, Health Protection).
=> We and Future Generations (why we think that we have responsibilities to protect futuregenerations? Usually articulated through ethical considerations or as Natural ResourcesProtection).
Only when all the three are integrally analyzed in a proper way we may say that EIA hasbeen done completely, comprehensively and appropriately (holistic approach). In thisway, the evaluation of acceptability of a project, especially such sensible project asradioactive waste disposal, can not be considered as appropriate if only a limitedperspective is applied. It seems that more and more different audiences understand thatsuch a limited perspective is applied when only dose and/or risk are used as indicators forsuch an evaluation. Appropriate selection and distinction between indicators ofenvironmental change and impacts reduce uncertainties in such evaluations in the firstplace. Another important feature is clear presentation of social interests (goals) whenevaluating acceptability of environmental changes. The transparency of evaluationmethods used by experts is the key element in achieving overall validity of the evaluationresults, as well as the evaluation procedure itself.
3. Predictive modelling of the quantity, radionuclide inventory, and activity of thewaste from the NPP Krsko
Low and Intermediate Level Waste
Based on available data on the amounts and activity of low and intermediate levelradioactive waste from the Krsko NPP [8,9,10] the following compilation of specificactivity data was made, see Table 1:
Specific activity of selected radionuclides in the waste collected in one year (Bq/m")Waste Type
SRT"Co-58
2.3*10'Co-60 Cs-134
2.7*10K 9.5*10'Cs-137
1.4*10'Cr-51
0.0
cw 1.9*108 2.3*108 8.6*10° 2.3*10' 7.2*10'~\A*W 8.5*10s
EB 1.7*105 5.8*105 0.01.8*10' 2.1*10' 7.4*10' 1.1*10' 0.0
U I 3.9*10' 1 2.5*10" | 6.2*10' | \.9*\<fSR— spent resins, CW — compressible waste, EB - evaporator bottom, F — filters, O - other waste
O 0.0
Table 1: Specific activity of selected radionuclides in LILW of the NPP Krsko
The anticipated decomissionning waste was evaluated separately. Emphasis in theseevaluations was given to the content of long-lived radionuclides in the waste. The evaluatedtotal activity of long-lived radionuclides in the year 2023 is summarised in Table 2.
Nuclear Energy in Central Europe '98 505

IsotopeC-14Ni-59Ni-63Mo-93Nb-94
Half-life (years)5730
7500096
350020300
Total activity (Bq)8.1*10"4.4* 10u
6.6*10°2.1*10'"2.6*10"
Anticipated volume of these waste is 200 mJ
Table 2: Aticipated total activity of selected long-lived radionuclides in LILW [9]
Based on these figures and data in [8] the adopted variation in Cs-137 specific activityin spent resins is within a factor of ten. This gives a variation in time in which the activitywill drop below the prescribed level of 102 MBq [Slovenian regulation] of about hundredyears, which will happen in approximately 350 ±100 years.
Spent Fuel
Prediction of the quantity of the spent fuel from the NPP Krsko after 35 cycles ispretty accurate: each year approximately one third of the fuel is replaced in the reactor. Thisgives about 16 tons of spent fuel per cycle, or about 560 tons in total lifetime. However,prediction of the quantity of spent fuel is not an issue but rather its activity, radionuclideinventory, and decay heat, at least in the first decades after irradiation. We used computercode Origen2 for these predictions [4,5].
Calibration of the prediction model for the NPP Krsko was done on the basis of thepast 13 fuel cycles. The assumptions used, the process of calibration, and results achieved arepresented in detail in [11].
Integrally, the model represents the past thirteen cycles adequately (with acceptablelevel of uncertainty, see Table 3). The analysis of eventual changes in the activity of spentfuel due to different fuel enrichment is given in Figure 1. Adopted variation was one percentabove and below the value presently applied, i.e. 4% of U-235 in the fuel. The calculations ofdifference if the activity of spent fuel if the plant operates five years longer or shorter thanplanned were also made. These differences are presented in Figure 2.
Reference [12]Reference [13]Model predictionDifference (%),rounded
Activity after 7.cycle (Bq)7,5*10'°9,2* 1015
9,9* 10'8
9-33
Cooling period(days)
454545
Activity after13.cycle(Bq)
N.A.2,5*10'*l,2*10ly
208
Cooling period(days)N.A.
3245
Table 3: Comparison of the calculated results (model vs. operational data)
506 Nuclear Energy in Central Europe '98

cr
E 1.00E+10
i> 1.00E+09
1.00E+08
1.00E+071.00E+06
ACT3 ACT5
1.00E+00 1.00E+01 1.00E+02 1.00E+03
Time (years)
1.00E+04 1.00E+05 1.00E+06
Figure 1: Influence of fuel enrichment on activity of actinides (ACT3, ACT4, ACT5stands for activity of actinides at enrichment of 3, 4, and 5% of U-235, respectively. The
results are for one model-batch of fuel)
Activity after 30, 35 and 40 years of operation
1.00E+14
1.00E+13
1.00E+07 +
1.00E+00 1.00E+01 1 .OOE+03
Time (years)
1.00E+04 1.00E+05 1 .OOE+06
Figure 2: Influence of extended (Act40) or shortened (Act3.0) operation of the Krsko planton the activity of actinides in the complete spent fuel (basic estimate is that the plant will
operate 35 cycles - Act35. One cycle lasts for one year according to the used model)
Nuclear Energy in Central Europe '98 507

4. Conclusion
The research on credibility/validity of EIAs made in Slovenia in the past showed thattrust into expert opinion about future environmental impacts has its roots in multiple factors.One of the most important elements is transparency of expert opinion. Possibility ofsubsequent review and verification (auditing) of evaluations is a key factor of credibility.
Uncertainty evaluation in terms of scenario analysis for Krsko NPP revealed thatdifferent fuel enrichment, or longer vs. shorter period of the plant operation does notinfluence the basic characteristics of the waste in such a scope that this would haveconsequences for the radiactive waste management strategy.
5. References
[I] Bredehoeft, J.D., Konikow, L.F. (1993) Ground-Water Models: Validate or Invalidate,Ground Water, 31,2, pp. 178-179.
[2] McCombie, C, McKinley, I. (1993) Validation - Another Perspective, Ground Water, 31,4, pp. 530-531.
[3] Schnoor, J.L. (1996) Environmental Modeling, Fate and Transport of Pollutants in Water,Air, and Soil, Environmental Science and Technology: A Wiley-Interscience Series of Textsand Monographs (J.L.Schnoor and A.Zehnder, Series Editors), (Toronto, Wiley), pp. 9-11,259-267.
[4] ORNL (1987) Oak Ridge National Laboratory, RSIC Computer Code Collection, Origen2Isotope Generation and Depletion Code (Radiation Shielding Information Center, OakRidge).
[5] Croff, A.C. (1983) Origen2: A versatile computer code for calculating the nuclidecompositions and characteristics of nuclear materials, Nuclear Technology, 62, pp. 335-352.
[6] Chhibber, S (1992) The Practical Use of Expert Judgements in Probabilistic SafetyStudies - A Case Study Approach (Los Angeles, University of California), pp. 5-22.
[7] Carmines, E., Zeller, R. (1979) Reliability and Validity Assessment (Beverly Hills, SageUniversity Press), pp. 9-27.
[8] ARAO (1998) Radioactive Waste in the NPP Krsko, Matjaz Stepisnik 27.1.1998 (inSlovene, available at the Agency RAO)
[9] IBE (1997) Long-lived radioactive Waste in Slovenia, B 052/23, (Ljubljana, Inzenirskibiro Elektroprojekt) (in Slovene, available at Inzenirski biro Elektroprojekt)
[10] NPP Krsko (1997) A Report on Packed Waste in May 1997, KM-11/97/8772 (inSlovene, available at NPP Krsko and SNSA)
[II] US (1998) Time Dependence of the Activity of Spent Fuel from the NPP Krsko andLLW/ILW in Slovenia, IJS-DP-7858 (Ljubljana, Jozef Stefan Institute) (in Slovene, availableat the Jozef Stefan Institute)
5Q§ Nuclear Energy in Central Europe '98

[12] Ravnik M., Zeleznik N. (1990) Izracun izotopske sestave in aktivnosti goriva JE Krsko,IJS-DP-5851, Ljubljana (transl.: Calculation of radionuclide inventory and activity of theNPP Krsko spent fuel; available at the J.Stefan Institute)
[13] Bozic M. (1998): Izracun aktivnosti in zakasnele toplote goriva NE Krsko, Seminar-podiplomski studij jedrske tehnike, Ljubljana (transl.: Calculation of activity and decay heatof the NPP Krsko spent fuel; available at the J.Stefan Institute)
Nuclear Energy in Central Europe '98 509

SI0100148
Nuclear Energy in Central Europe '98
Terme Catez, September 7 to 10, 1998
Concrete spent fuel storage casks dose rates
Mile Bade, Radomir Jecmenica, Kresimir Trontl
Faculty of Electrical Engineering and Computing
Department of Applied Physics
University of Zagreb
10000 Zagreb, Unska 3, Croatia
AbstractOur intention was to model a series of concrete storage casks based on TranStor
system storage cask VSC-24, and calculate the dose rates at the surface of the casks as afunction of extended burnup and a prolonged cooling time. All of the modeled casks havebeen filled with the original multi-assembly sealed basket. The thickness of the concrete shieldhas been varied. A series of dose rate calculations for different burnup and cooling timevalues have been performed. The results of the calculations show rather conservative originaldesign of the VSC-24 system, considering only the dose rate values, and appropriate designconsidering heat rejection.
1. Introduction
Although existing storage locations for spent fuel are mainly spent fuel pools innuclear power plants, dry disposal option dominates the plans and projects for the future.Main reasons are larger flexibility, low cost, and possibility of passive cooling and low levelof supervision needed. Among different existing intermediate dry spent fuel storage systems,storage in concrete casks provides a safe and economical method for the dry storage ofirradiated fuel at an independent spent fuel storage location. The TranStor Ventilated StorageCask (VSC) System [1] is a good representative of such a system.
The system includes ventilated concrete cask, multi-assembly sealed basket and atransfer cask. The concrete cask provides structural support, shielding and natural convectioncooling for a loaded multi-assembly sealed basket.
TranStor system storage cask VSC-24 is a vertical concrete ventilated storage caskdesigned for 24 PWR spent fuel assemblies with a maximum burnup of 35 GWd/tU and aminimum cooling time of 5 years. Considering the fact that recently achieved burnup of fuelassemblies is considerably higher (up to 50 GWd/tU) than the TranStor VSC-24 maximumallowed burnup, resulting in higher thermal and dose rate values, the use of the cask for theassemblies with extended burnup, without further investigation is not recommendable.
A series of concrete storage casks based on TranStor system storage cask VSC-24 hasbeen modeled, and the dose rates at the surface of the casks as a function of extended burnupand a prolonged cooling time have been calculated. All of the modeled casks have been filledwith the original multi-assembly sealed basket and the thickness of the concrete shield hasbeen varied.
Nuclear Energy in Central Europe '98 511

SCALE 4.2 code package [2] has been used for all calculations. The ORIGEN module[3] has been used for isotope depletion, heat production and neutron and gamma energyspectrum calculations. The SAS4 control module (Monte Carlo method) has performedsimulations of gamma and neutron transport as well as dose rate calculations.
2. VSC-24 main parameters and calculational model
The original TranStor system storage cask [1] is a vertical concrete storage cask,composed out of a multi-purpose sealed basket (MSB) and a ventilated concrete storage cask(Figure 1.).
AIR OUTLET
MULTI-ASSEMBLYSEALED BASKET(MSB)
CONCRETE
CASK LID
CONCRETE
CONCRETECASK LINER
AIR INLETDUCT
AIR ENTRANCE
Figure 1. TranStor Ventilated Storage Cask-24 System
The MSB is capable of handling PWR as well as BWR spent fuel assemblies, and thecapacity is 24 and 61 assemblies, respectively. The loaded MSB weights 39 (PWR) or 42(BWR) tons and the operating temperature is 380 °C. The basic shape of the MSB iscylindrical with the following main dimensions: overall length is variable from 3200 mm to4880 mm (the length taken for our calculation is 4000 mm); diameter 1676.4 mm; wallthickness 19 mm; lid thickness 165 mm; bottom thickness 19 mm. Whole MSB is made out ofstainless steel. Cavity is filled with He at the pressure of 152 kPa (1.52 bar).
512 Nuclear bnergy in Central Europe
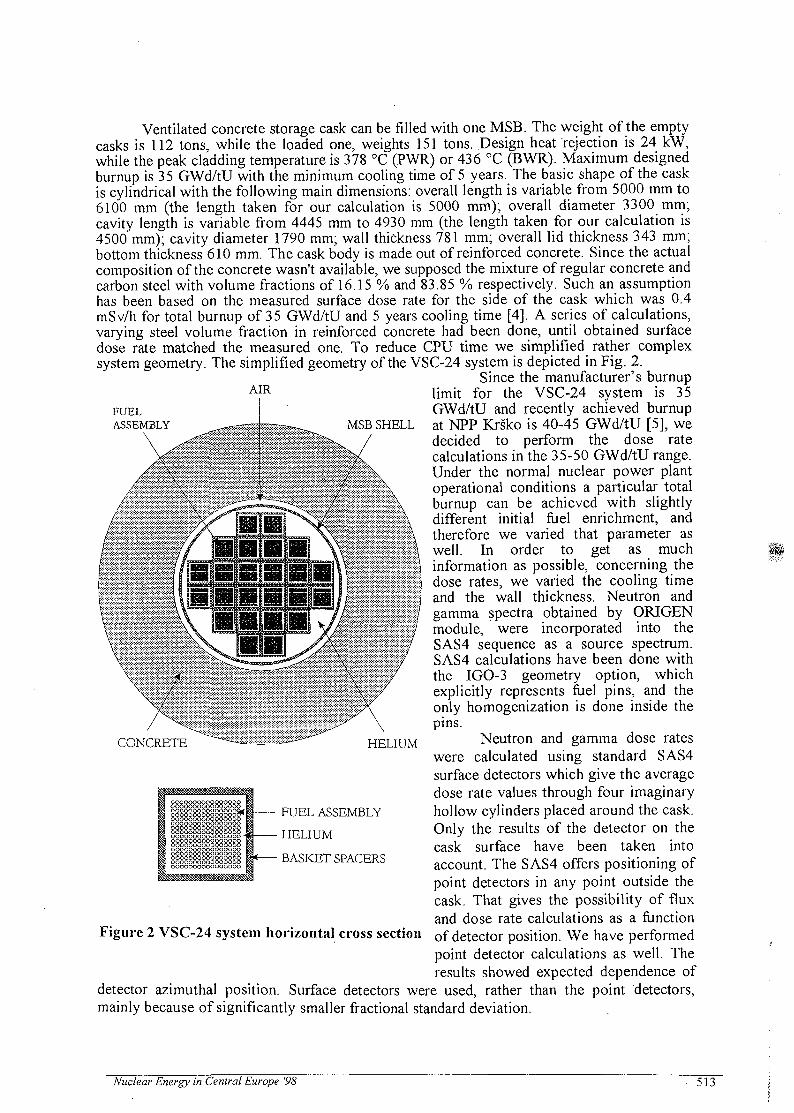
FUELASSEMBLY MSB SHELL
Ventilated concrete storage cask can be filled with one MSB. The weight of the emptycasks is 112 tons, while the loaded one, weights 151 tons. Design heat rejection is 24 kW,while the peak cladding temperature is 378 °C (PWR) or 436 °C (BWR). Maximum designedburnup is 35 GWd/tU with the minimum cooling time of 5 years. The basic shape of the caskis cylindrical with the following main dimensions: overall length is variable from 5000 mm to6100 mm (the length taken for our calculation is 5000 mm); overall diameter 3300 mm;cavity length is variable from 4445 mm to 4930 mm (the length taken for our calculation is4500 mm); cavity diameter 1790 mm; wall thickness 781 mm; overall lid thickness 343 mm;bottom thickness 610 mm. The cask body is made out of reinforced concrete. Since the actualcomposition of the concrete wasn't available, we supposed the mixture of regular concrete andcarbon steel with volume fractions of 16.15 % and 83.85 % respectively. Such an assumptionhas been based on the measured surface dose rate for the side of the cask which was 0.4mSv/h for total burnup of 35 GWd/tU and 5 years cooling time [4]. A series of calculations,varying steel volume fraction in reinforced concrete had been done, until obtained surfacedose rate matched the measured one. To reduce CPU time we simplified rather complexsystem geometry. The simplified geometry of the VSC-24 system is depicted in Fig. 2.
Since the manufacturer's burnupA I R limit for the VSC-24 system is 35
GWd/tU and recently achieved burnupat NPP Krsko is 40-45 GWd/tU [5], wedecided to perform the dose ratecalculations in the 35-50 GWd/tU range.Under the normal nuclear power plantoperational conditions a particular totalburnup can be achieved with slightlydifferent initial fuel enrichment, andtherefore we varied that parameter aswell. In order to get as muchinformation as possible, concerning thedose rates, we varied the cooling timeand the wall thickness. Neutron andgamma spectra obtained by ORIGENmodule, were incorporated into theSAS4 sequence as a source spectrum.SAS4 calculations have been done withthe IGO-3 geometry option, whichexplicitly represents fuel pins, and theonly homogenization is done inside thepins.
Neutron and gamma dose rateswere calculated using standard SAS4surface detectors which give the averagedose rate values through four imaginaryhollow cylinders placed around the cask.Only the results of the detector on thecask surface have been taken intoaccount. The SAS4 offers positioning ofpoint detectors in any point outside thecask. That gives the possibility of fluxand dose rate calculations as a function
Figure 2 VSC-24 system horizontal cross section o f detector position. We have performedpoint detector calculations as well. Theresults showed expected dependence of
detector azimuthal position. Surface detectors were used, rather than the point detectors,mainly because of significantly smaller fractional standard deviation.
IB!
CONCRETE HELIUM
FUEL ASSEMBLY
HELIUM
BASKET SPACERS
Nuclear Energy in Central Europe '98 - 513

3. Results of the calculations
Results of the SAS4 calculations for gamma (total) dose rates at cask surface for theoriginal VSC-24 system (the thickness of the shield is 78.1 cm) and for a series of casks witha reduced shield thickness, as well as ORIGEN calculation of total thermal power for everycase, are given in Table 1.
The design dose rate limit of 0.2 mSv/h isn't reached in any of the cases for theoriginal VSC-24 system. In the worst case (50 GWd/tU burnup and 5 years cooling time) thedose rate is roughly one third of the design value. On the other hand, the design heat rejectionhas been surpassed for 41, 44, 47 and 50 GWd/tU burnup and 5 years cooling time (shadowedfields in Table 1.). More then 5 year cooling time period is necessary for 41, 44 and 47GWd/tU burnup, and more than 7 years for 50 GWd/tU burnup. The conservative design ofthe original system, considering only dose rates, suggested a series of systems with a reducedshield thickness to be modeled. The results of the calculations for all cases are given in Table1. and depicted in Figures 3-6. The dose rate values obtained for the modified systems with areduced shield thickness are also below the original design values. The only exception is theshield of 68.1 cm (10 cm reduced original thickness). In that case more than a five yearcooling period is necessary (shadowed fields in Table 1.).
Table 1. Surface dose rates and heat rejection for the original and modified VSC-24systems, as a function of starting enrichment, burnup and cooling time
Enr.(%)
3.43.43.43.43.83.83.83.83.83.83.83.84.34.34.34.34.34.34.34.3
Burnup(MWd/tU)
38000380003800038000410004100041000410004400044000440004400047000470004700047000500005000050000
-50000
CoolingTime (y)
5791157911579115791157911
Heat(kW)
22.417.214.913 6# U18.616.214 826 320.417.716217921.719.017 43 0 223.620.618.9
A=78.1 cm4.38E-022.65E-021.87E-021.41E-024.66E-022.67E-021.91E-021.45E-025.02E-022.96E-022.05E-021.57E-025.08E-023.07E-022.18E-021.63E-025.59E-023.29E-022.30E-021.77E-02
Surface Dose
£>2=73.1 cm9.55E-025.94E-024.18E-023.25E-02-1.05E-016.49E-025.27E-023.34E-021.14E-016.86E-024.83E-023.62E-021.15E-016.83E-024.90E-023.77E-021.23E-01-7.41E-025.31E-024.25E-02
Rate (mSv/h)
£>3=70.6 cm1.45E-019.14E-026.53E-024.94E-021.61E-019.76E-028.42E-025.22E-021.62E-011.03E-017.25E-025.69E-021.78E-011.04E-017.48E-025.83E-021.88E-011.16E-017.94E-025.97E-02
D4=68.1 cm2 29B-011.39E-019.79E-027.38E-02237B-011.46E-011.24E-017 97E-022.565-011.59E-011.09E-018 50E-02
1.65E-011.18E-018.72E-022 64B-011.78E-011.21E-019.56E-02
Fractional standard deviation (FSD) for the neutron calculations was 3-4%, and forgamma calculations 1.9 - 2.7%. Since gamma dose rate is much larger than neutron dose rate(10-100 times), total FSD is roughly equal to gamma FSD. For the same reason, total dose
514 Nuclear Energy in Central Europe '98

rates are similar to gamma dose rates. The uncertainties of the results are much larger than thetotal FSD. Main causes for this are:• Activities of irradiated (spent) fuel and neutron and gamma spectrum have been
calculated using the assumption of spatially and timely constant neutron flux in reactorduring the whole irradiation period.
• The axial homogeneous distribution of activity in fuel rods.• Surface detectors give the average dose rate as a result of integration of neutron and
gamma flux over a large cylinder surface. Because of the axially unsymmetrical positionof the fuel assemblies in the cask there are regions outside the cask with different doserate values [6].
4. Conclusion
The results of the calculations given in Table 1., and depicted in Figure 3., show thatthe design of the original TranStor VSC-24 system is rather conservative, when consideringonly the dose rate values. Manufacturer's design limit of 0.2 mSv/h isn't exceeded in any ofthe cases of the original design. The dose rate values obtained for the modified systems with areduced shield thickness are also below the original design values. The only exception is theshield of 68.1 cm (10 cm reduced original thickness). In that case more than a five yearcooling period is necessary (shadowed fields in Table 1.).
The design heat rejection has been surpassed for 41, 44, 47 and 50 GWd/tU burnupand 5 years cooling time. More than 5 year cooling time period is necessary for 41, 44 and 47GWd/tU burnup, and more than 7 years for 50 GWd/tU burnup.
References:
[1] Shipping and Storage Cask Data for Commercial Spent Nuclear Fuel, JAI Corporation,Fairfax, Virginia, 1996
[2] SCALE-4.2, Modular Code System for Performing Standardized Computer Analyses forLicensing Evaluation, RSIC, ORNL, Oak Ridge, Tennessee, November 1993
[3] ORJGEN 2.1 Isotope Generation and Depletion Code, Matrix Exponential Method, RSIC,ORNL, Oak Ridge, Tennessee, 1991
[4] W.J.Lee, J.V.Massey, W.J.McConaghy: Design and Initial Operational Experience of theVentilated Storage Cask (VSC) System, International Symposium on Spent Fuel Storage-Safety, Engineering and Environmental Aspects, Vienna, Austria, October 1994
[5] The Nuclear Design and Core Management of the Krsko Nuclear Power Plant: Cycles 3to 13
[6] M. Bade, R. Jecmenica, K. Trontl: Extended Burnup Impact on the TN24 Spent FuelStorage Cask Main Parameters, International Conference: Nuclear Option in Countrieswith Small and Medium Electricity Grids, Dubrovnik, Croatia, June 1998.
Nuclear Energy in Central Europe '98 515

0,0200,0250,030
H I 0,035H I 0,040H I 0,045
0,0500,055
I 0,0600,065above
Figure 3. Surface dose rates of the original VSC-24 system (shield thickness is 78.1 cm)as a function of burnup and cooling time
<£*>*
0,0430,0530,064
EZ3 0,075C H 0,085r~"l 0,096EZ3 0,107
0,1180,1280,139above
Figure 4. Surface dose rates of the modified VSC-24 system (shield thickness is 73.1 cm)as a function of burnup and cooling time
516 Nuclear Energy in Central Europe '98

0,0690,085
I 0,1010,117
I I 0,1330,1490,165
! 0,1810,1980,214above
Figure 5. Surface dose rates of the modified VSC-24 system (shield thickness is 70.6 cm)as a function of burnup and cooling time
0,0960,1190,142
H I 0,165H I 0,188EH 0,212I H 0,235H i 0,258
0,281: 0,304
above
Figure 6. Surface dose rates of the modified VSC-24 system (shield thickness is 68.1 cm)as'a function of burnup and cooling time
Nuclear Energy in Central Europe '98 5\: