Platelets contribute to postnatal occlusion of the ductus arteriosus
Upload
independentCategory
view
0download
0
This content has been downloaded from IOPscience. Please scroll down to see the full text.
Download details:
IP Address: 202.120.49.65
This content was downloaded on 08/01/2015 at 07:11
Please note that terms and conditions apply.
Processable 3-nm thick graphene platelets of high electrical conductivity and their epoxy
composites
View the table of contents for this issue, or go to the journal homepage for more
2014 Nanotechnology 25 125707
(http://iopscience.iop.org/0957-4484/25/12/125707)
Home Search Collections Journals About Contact us My IOPscience

Nanotechnology
Nanotechnology 25 (2014) 125707 (12pp) doi:10.1088/0957-4484/25/12/125707
Processable 3-nm thick graphene plateletsof high electrical conductivity and theirepoxy compositesQingshi Meng1,2, Jian Jin3, Ruoyu Wang1, Hsu-Chiang Kuan4, Jun Ma1,2,7,Nobuyuki Kawashima2, Andrew Michelmore2, Shenmin Zhu5 and Chun H Wang6,8
1 School of Engineering, University of South Australia, Mawson Lakes, SA5095, Australia2 Mawson Institute, University of South Australia, SA5095, Australia3 Suzhou Institute of Nano-Tech and Nano-Bionics, Chinese Academy of Sciences, Suzhou 215123,People’s Republic of China4 Department of Energy Application Engineering, Far East University, Tainan city 744, Taiwan5 State Key Laboratory of Metal Matrix Composites, Shanghai Jiao Tong University, 200240,People’s Republic of China6 Sir Lawrence Wackett Aerospace Research Centre, School of Aerospace, Mechanical and Manufacturing Engineering,RMIT University, GPO box 2476, Melbourne, VIC 3001, Australia
E-mail: [email protected] and [email protected]
Received 30 October 2013, revised 15 January 2014Accepted for publication 20 January 2014Published 27 February 2014
AbstractGraphene platelets (GnPs) are a class of novel 2D nanomaterials owing to their very small thickness(∼3 nm), high mechanical strength and electric conductivity (1460 S cm−1), and good compatibility withmost polymers as well as cost-effectiveness. In this paper we present a low-cost processing technique forproducing modified GnPs and an investigation of the electrical and mechanical properties of the resultingcomposites. After dispersing GnPs in solvent N -methyl-2-pyrrolidone, a long-chain surfactant (Jeffamine D2000, denoted J2000) was added to covalently modify GnPs, yielding J2000-GnPs. By adjusting the ratio ofGnPs to the solvent, the modified GnPs show different average thickness and thus electrical conductivityranging from 694 to 1200 S cm−1. To promote the exfoliation and dispersion of J2000-GnPs in a polymericmatrix, they were dispersed in the solvent again and further modified using diglycidyl ether of bisphenol A(DGEBA) producing m-GnPs, which were then compounded with an epoxy resin for the development ofepoxy/m-GnP composites. A percolation threshold of electrical volume resistivity for the resultingcomposites was observed at 0.31 vol%. It was found that epoxy/m-GnP composites demonstrated far bettermechanical properties than those of unmodified GnPs of the same volume fraction. For example, m-GnPs at0.25 vol% increased the fracture energy release rate G1c from 0.204 ± 0.03 to 1.422± 0.24 kJ m−2, whilethe same fraction of unmodified GnPs increased G1c to 1.01± 0.24 kJ m−2. The interface modification alsoenhanced the glass transition temperature of neat epoxy from 58.9 to 73.8 ◦C.
Keywords: composites, graphene, epoxy, electrical conductivity; fracture mechanism
S Online supplementary data available from stacks.iop.org/Nano/25/125707/mmedia
(Some figures may appear in colour only in the online journal)
1. Introduction
Since Novoselov and Geim reported their ground-breakingdiscovery in 2004, graphene has attracted increasing attention
7 http://people.unisa.edu.au/jun.ma.8 www.rmit.edu.au/staff/chun-wang.
from both academia and industry [1]. The long-range π -conjugation of graphene yields extraordinary mechanical andother functional properties [2–4]. Pristine graphene is usuallyfabricated by either micromechanical exfoliation from graphiteor chemical vapour deposition (CVD), both of which arenot suitable for manufacturing polymer composites due to
0957-4484/14/125707+12$33.00 1 c© 2014 IOP Publishing Ltd Printed in the UK

Nanotechnology 25 (2014) 125707 Q Meng et al
the high costs, inert surface and large lateral dimensions[5, 6]. As a result, graphene oxide (GnO) has been developedfrom graphite oxide by heavy oxidation. To improve itsstructural integrity and thus electrical conductivity, GnO isoften reduced by either chemical or thermal treatment [7–12].Although thermal reduction can effectively remove mostof the oxygen atoms, a great number of defects remainwithin the reduced GnO, leading to orders of magnitudelower electrical conductivity and nearly 75% of reduction instiffness [13, 14].
Graphite (nano) platelets are a class of well-known addi-tive for polymer composites; they are fabricated by expandingacidified graphite or a graphite intercalation compound (GIC),and usually have an average thickness over 10 nm. Recently,the authors have developed graphene platelets (GnPs) of 1–4 nm in thickness by combining rapid thermal shock and ul-trasonication [15–17]. The advantages of GnPs over grapheneoxide include (i) that they have low defect concentrationcorresponding to high electrical conductivity at 1460 S cm−1
and thus no reduction is needed at all, (ii) that each plateletis only 3 nm in thickness, which provides sufficient interfacefor transferring stress and electrons, (iii) that epoxide groupsexisting on GnPs’ surface can react with the end-amine groupsof organic molecules forming stable suspension to build upa robust interface for the composites, and (iv) that they arecost-effective (∼$20 per kg). Graphene is well known for highin-plane electrical and thermal conductivities but graphite is asemiconductor due to its the poor through-plane conductivity.As the thickness of GnPs decreases, a more uniform dispersioncan be achieved for a given fraction and volume of poly-mer/GnP composite, leading to lower percolation thresholdsfor both electrical and thermal conductivities. According to ageometrical model [18], in a 10 µm3 volume of composite(1 vol%), the total number and the surface area of 3-nm thickGnPs are calculated to be 10 and 20 µm2, respectively; bycontrast, these two values for 10-nm thick GnPs increase to33 and 67µm2, respectively. In addition, the total number ofGnPs and their surface area in a given fraction and volumeof a composite dramatically increase with reduction in thethickness (see figure 3 in [18]). Therefore, it is vital to keepGnPs as thin as possible.
However, it is a daunting challenge to prevent grapheneand GnPs from stacking in polymer matrixes—an inherentproblem for polymer/nanosheet composites. In the context ofgraphene oxide, the interface modification was extensivelystudied by taking advantage of its rich functional groupsthat react with a vast class of surfactants [19–22]. The in-terface between matrix and dispersed fillers acts as a bridgetransferring mechanical stress, electrons and phonons, so therole of interface is crucial for functional polymer/graphenecomposites [23, 24]. All these previous efforts start with highlyoxidized graphite and short-chain surfactants, and this impliesthe necessity for chemical or thermal reduction, inappropriatefor the mass production of functional graphene-based ma-terials. To address this problem, we in this study proposea two-step processing technique to modify GnPs. Firstly,GnPs were surface functionalised using J2000. Secondly, thesurface-modified GnPs were grafted with an epoxy oligomer to
promote adhesion with polymer matrices. The effects of thesegrafted long-chain molecules on the electrical conductivityof GnPs and the interface modification on the morphology,structure, mechanical properties, fracture toughness, electricaland thermal properties of the composites were investigated.
2. Experimental details
2.1. Materials
The graphite intercalation compound (GIC, Asbury 3494)was kindly provided by Asbury Carbons, Asbury, NJ, USA.Tetrahydrofuran (THF), N -methyl-2-pyrrolidone 99% (NMP),triisopropanolamine (TIPA) were purchased from SigmaAldrich. Jeffamine D 2000 (J2000), Jeffamine D 400 (J400)and polyoxyalkyleneamine B200 were provided by Hunts-man (figure S1, available at stacks.iop.org/Nano/25/125707/mmedia). Epoxy resin, diglycidyl ether of bisphenolA (DGEBA, Araldite-F) with epoxide equivalent weight182–196 g per equiv., was purchased from Ciba-Geigy,Australia.
2.2. Fabrication of graphene platelets
Graphene platelets (GnPs) were fabricated according to areported procedure [15]. In brief, 0.1 g GIC was thermallyshocked by transferring it into a crucible preheated at 700 ◦Cin a furnace and being treated for 1 min; once the expandedproduct was cooled, it was suspended in acetone and ultrason-ciated for 1 h below 20 ◦C—low temperature would promotethe exfoliation of graphite [25]. This produced GnPs.
2.3. Modification of graphene platelets
To surface functionalise GnPs, 0.1 g GnPs were suspended in20–60 g N -methyl-2-pyrrolidone (NMP) through 30-min son-ication, followed by addition of 1.6 g J2000 whose molecularstructure is shown in figure 1(a) and 1.38 g catalyst TIPA. Themixture was sonicated again for 1 h under 20 ◦C to promotethe intercalation of J2000 and catalyst molecules into thespacing between adjacent GnPs. It was then transferred into around-bottom flask equipped with a condenser and a magneticstirrer, followed by mixing and heating at 150 ◦C for 8 h with anoil bath, to produce J2000-functionalised GnPs (J2000-GnPs).The mixture was then washed by acetone at least three timesto remove excessive J2000 and any remaining catalyst.
Further modification of J2000-GnPs was carried out bysuspending them in NMP (∼0.1 wt%) using a metal containerfollowed by sonication for 30 min below 20 ◦C. After adding1.6 g DGEBA, the mixture was subjected to mechanicalstirring and sonication for 30 min. The mixture then wastransferred into a round-bottom flask with a condenser andkept reacting at 150 ◦C overnight with an oil bath. Finally, theproducts were washed again using acetone to remove excessiveDGEBA. This furnishes the two-step process for modifyingGnPs; the resultant product was denoted as m-GnPs.
2

Nanotechnology 25 (2014) 125707 Q Meng et al
Figure 1. FTIR spectra of GIC, graphene platelets (GnPs) andJ2000-functionalised GnPs (J2000-GnPs).
2.4. Fabrication of epoxy/graphene composites
Weighed quantities of m-GnPs were suspended at 0.1 wt% intetrahydrofuran (THF) using a metal container followed bystirring for 10 min using a magnetic bar. The container wasthen covered and treated in an ultrasonic bath for 30 min below20 ◦C to obtain a homogenous suspension of m-GnPs. DGEBAwas added into the mixture and then stirred by a magneticbar for 10 min to reach a complete dissolution, followed bysonication under 20 ◦C for 1 h. After sonication THF wasevaporated at 120 ◦C using a mechanical mixer, followedby vacuum-oven degassing at 120 ◦C to remove bubbles andtraces of THF. The mixture was then cooled down to 40 ◦C,followed by addition of hardener–J400 (figure S1, available atstacks.iop.org/Nano/25/125707/mmedia)—and mixing man-ually for two minutes. After degassing again, the mixturewas used to produce mechanical testing specimens by pouringinto a number of preheated and greased rubber moulds. Thisis followed by curing at 120 ◦C for 12 h. The unmodifiedcomposites were similarly prepared
2.5. Characterizations
All the powder samples were pressed to produce the sheetsof below 0.5 mm in thickness by a bench top press YP-2(Shanghai Shanyue Scientific Instrument Ltd), under a certain
pressure to produce smooth surface. The sheet thickness wasmeasured by a digital micrometre. The electrical conductivityof the sheets was examined with a Hall effect measurementsystem with four probes, which was tailor-made by thePlatform for characterization and testing, Suzhou Institute ofNano-Tech and Nano-Bionics, Chinese Academy of Sciences.In brief, four probes were located with intimate surfacecontact with a test piece, exactly at the four points of asquare. After four current–voltage curves were measured toconfirm the good contact between the probes and test couponsurface, resistivity testing was carried out under a resistancemodel. With the thickness value entered, the relevant electricalconductivity was calculated.
The surface functionalised GnPs (J2000-GnPs) was char-acterized using a Perkin-Elmer 65 FTIR spectrometer with aMIRacle single-reflection attenuated total reflectance (ATR).Raman spectra were recorded on a Renishaw inVia Ramanmicro spectrometer with a 633 nm laser excitation. Thermo-gravimetric analysis (TGA) was performed on a TGA Q500(TA instruments) at a heating rate of 10 ◦C min−1 in nitrogen.
AFM images were taken of GnPs by a NT-MDT NTE-GRA SPM instrument with NSG03 non-contact ‘golden’ can-tilevers. The magnitude of oscillation was 15 nm and thescan rate for 2 µm× 2 µm images was typically 0.5 Hz. Thesamples were prepared by suspending GnPs in N -methyl-2-pyrrolidone (NMP) at 0.0004 wt% by 30-min ultrasonicationbelow 30 ◦C and then dropping the solution on a silicon waferfollowed by drying. The scanner used was a 100 µm scannercalibrated using 1.5 µm grids with a height of 22 nm. Ramanspectra were recorded at room temperature by a RenishawinVia Raman microspectrometer with 633 nm laser excitationand notch filters cutting at ∼100 cm−1. Extreme care wastaken to avoid sample damage or laser induced heating. Mea-surements were performed from ∼4 to ∼0.04 mW incidentpower.
X-ray diffraction (XRD) was performed using a diffrac-tion technology mini-materials analyser (MMA) with a diffrac-tometer, equipped with curved graphite monochromators,tuned to Cu Kα radiation (λ:1.5419 Å). The diffraction spectrawere collected in a reflection mode at 2θ = 2◦–50◦ at ascanning rate of 1◦ min−1.
Glass transition temperatures were obtained using a dy-namic mechanical analyser (DMA 2980, TA Instruments, Inc.,USA) at 1 Hz with a single cantilever clamp of a supportingspan 20 mm. A rectangular specimen with a thickness of 4 mmand a width of 12 mm was tightened on the clamp using atorque of 1 Nm. Specimens were scanned from 40 to 140 ◦Cwith data recorded at 2 s/point.
Micrographs of transmission electron microscopy (TEM)were obtained with a Philips CM200 at an acceleratingvoltage of 200 kV. TEM sections of 50 nm in thickness weremicrotomed using Leica Ultracut S microtome equipped with adiamond knife, and these sections were collected on 200-meshcopper grids. The fracture surface morphology of specimenswas observed by a Philips 505 scanning electron microscope(SEM) at 10 kV. The specimens were surface-coated with athin layer of platinum prior to observation.
Tensile testing was performed at 0.5 mm min−1 at roomtemperature using an Instron 5567. An Instron extensometer
3

Nanotechnology 25 (2014) 125707 Q Meng et al
2630-100 (25 mm in gauge length) was used to collect accuratedisplacement data for moduli which were calculated using0.005–0.2% strain. Fracture toughness testing was carried outusing an instantly propagated crack which was introducedto each sample by a razor blade tapping method [26, 27].At least five specimens were tested for each set of data at0.5 mm min−1. The plane-strain fracture toughness (K1c)and critical strain fracture energy release rate (G1c) of CTspecimens were calculated and verified according to ASTMD-5045.
Electrical volume resistivity of the composites was mea-sured by an Agilent 4339B high-resistivity meter equippedwith a 16008B resistivity cell (two-point-probe) at room tem-perature (25 ◦C). The testing was conducted on the samplesof 5 ± 1.1 mm in thickness and 26 ± 0.5 mm in diameter inaccordance with ASTM D257-99, and each average was takenwith at least three measurements.
3. Results and discussion
3.1. Long-chain functionalised graphene platelets
Figure 1 presents the FTIR spectra of the graphite intercala-tion compound (GIC), graphene platelets (GnPs) and J2000functionalised GnPs (J2000-GnPs); all these samples prior tomeasurement were properly washed to remove impurity, cata-lyst and unreacted molecules. GIC shows a broad absorption at3300 cm−1 in figure 1(a) due to –OH and –COOH stretching,but this absorption intensity reduces significantly for GnPs(figure 1(b))—thermal expansion removed most hydroxyl andcarboxylic groups. Upon functionalisation using J2000, newabsorptions are observed at 2850 and 2980 cm−1 in figure 1(c),relating to C–H stretching vibration of J2000 molecules graftedwith GnPs [28]; The absorption at 1604 cm−1 corresponds toN–H groups. These results prove that the long-chain surfactantJ2000 has grafted into GnPs via the reaction between J2000end-amine groups and GnP epoxide groups.
By using a four-probe method (see details in the experi-ment), the conductivity of GnPs was measured as 1460 S cm−1
in table 1. Although multi-walled carbon nanotubes (MWC-NTs) have been extensively studied for polymer compositesover the past decades, their conductivity is at 21.4 S cm−1;this may imply that GnPs are a class of promising fillerfor polymers. The most promising feature of graphene liesin its electric conductivity—6000 S cm−1 [29]. In practice,graphene made by chemical vapor deposition (CVD) showsan electric conductivity of 2000 S cm−1 in table 1. Theconductivity of graphene oxide is as low as 0.05 S cm−1,and it increases to 5 S cm−1 through chemical reduction andto 350 S cm−1 through thermal reduction [30]; all of thesevalues are significantly lower than the CVD-grown graphenewhich unfortunately is not suitable for polymer composites.
Through functionalization by J2000, the conductivity ofGnPs reduces to 694 S cm−1. This is explained by the increasein GnP thickness, which may cause a damaging effect tothe conductivity due to the graphene’s poor through-planeconductivity. Atomic force microscopy (AFM) is employedto examine the thickness of GnPs, J2000-GnPs and B200
Table 1. Electric conductivities of nanomaterials and theirapproximate cost.
Material
Electricconductivity(S cm−1) Cost (USD per kg)
CVD-growngraphene
2000 [31] unknown
As-prepared grapheneoxide
0.05 [30] 20–30 [32]
Chemically reducedgraphene oxide
5 [30] 20–30
Thermally reducedgraphene oxide
350 [30] 20–30
Multi-walled carbonnanotubes (VGCF-X)
21.4 ∼300
Graphene platelets(GnPs)
1460 10–20
J2000-GnPs, over50 nm thick
694 20–30
J2000-GnPs, ∼5 nmthick
972 30–40
B200-GnPs 1220 20–30
functionalised GnPs (B200-GnPs) [16] in this study. For eachsample, 20 randomly selected platelets were measured andtheir representative measurement is shown in figures 2(a)–(c).Each J2000 molecule has two end-amine groups, while a B200molecule contains only one end-amine group (figure S1b,available at stacks.iop.org/Nano/25/125707/mmedia). In anideal situation, one amine group from J2000 would graftwith GnPs and another react with DGEBA. However, thesetwo amine groups in real situation could both react with theepoxide groups of GnPs; that is, it leads to either formationof overpass on a GnP or linkage of adjacent platelets or both,leading to an increase in thickness. While the GnP thicknessis measured as 3.0 ± 0.5 nm in figure 2(a), these J2000-GnPsare actually thicker than 50 nm. To further identify the effectof thickness, the quantity of N -methyl-2-pyrrolidone (NMP)was increased from 20 to 60 g for suspending 0.1 g GnPs,in order to produce thinner J2000-GnPs. The J2000-GnPsshow three types of morphology in figure 2(b). (1) Thickplatelets, as shown by an exceptionally large white platelet,and its thickness was measured as∼20 nm; these platelets arerare; (2) platelets of ∼9 nm in thickness, as shown by a greenarrow; and (3) platelets of ∼5 nm in thickness, as shown bya white arrow. Since the type-2 and -3 platelets are far morepopular, at least 20 platelets of these types were randomlyselected and their thickness was measured to be 4.9± 2.5 nm.These thinner J2000-GnPs produced a markedly improvedconductivity of 972 S m−1 in table 1. We also replaced J2000with B200 (figure S1b), in that B200 has similar molecularstructure and weight but each B200 molecule has only oneend-amine group so that a B200 molecule cannot bridgeadjacent GnPs. The B200-functionalised GnPs were expectedto have a lower thickness but higher conductivity. Both wereconfirmed—the thickness was measured as 3.7 ± 1.0 nm infigure 2(c) and the conductivity as 1220 S m−1 in table 1.The functionalization obviously improved the suspension of
4

Nanotechnology 25 (2014) 125707 Q Meng et al
Figure 2. Representative AFM micrographs and profiles and thickness statistics of (a) GnPs, (b) J2000- modified GnPs and (c)B200-modified GnPs.
GnPs in solvent. The B200-functionalised GnPs were able tosuspend in tetrahydrofuran (THF) at 0.1 wt% for seven dayswhile GnPs only remained suspending for 3–4 h.
Figure 3 shows Raman spectra of properly washed sam-ples of GnPs and J2000-GnPs. The adsorptions at 1340, 1585and 2690 cm−1 corresponding to D-band, G-band and 2D-bandwere observed. D-band relates to the presence of substitu-tionally in-plane hetero-atoms, vacancies, grain boundaries orother defects, which might be associated with the quantityof impurity or oxidation degree, while G-band refers to thequantity of ordered structures of the sp2-hybridized carbon.The ratio of the D/G band intensity (peak height) representsthe structural integrity of graphene. A 2-h thermal reductionof graphene oxide at 900 ◦C removed oxygen completely, butits ID/IG ratio remains at 1.01 [33], in comparison with thepristine graphene’s ID/IG approaching 0. The functionaliza-tion of GnPs changes the ratio from 0.07 for GnPs to 0.09for J2000-GnPs in figure 2(b), indicating the existence ofJ2000 molecules on the graphene surface—J2000 moleculeswould not contribute to the structural integrity of GnPs—andthis phenomenon matches well with our FTIR analysis. Littlechange can be observed from each 2D1 bands (shoulder-likestructures), because we measured all samples in the powderform.
3.2. Epoxy modified GnPs
The J2000-functionalised GnPs (J2000-GnPs) should havebetter compatibility with epoxy resins than unmodified, inor-ganic GnPs. As elaborated in the analysis of electrical conduc-tivity and Raman spectra, GnPs have low defect concentrationand this implies the J2000-grafting ratio not high. Since thehighest degree of the exfoliation and dispersion of GnPs in a
Figure 3. Raman spectra of GnPs and J2000-GnPs.
polymeric matrix is always desired, we dispersed J2000-GnPsin the solvent NMP and had DGEBA reacted with the graftedJ2000 to produce m-GnPs. In figure 4(a), m-GnPs demonstratenew intensive absorptions, similar to those of neat epoxy(refer to figure 2 in [34]). These results clarified the role ofJ2000 bridging GnPs with the matrix, and this leads to thestrong adhesion and mechanical interlocking between GnPsand matrix macromolecules.
TGA was employed to investigate the fraction of or-ganic molecules grafted with GnPs. Figure 4(b) shows anobvious mass loss from 100 to 200 ◦C, which attributes tothe deintercalation of H2O, while an obvious loss was seenfrom 200 to 600 ◦C. The loss of m-GnPs is far more obvious,which may be caused by the grafted organic molecules. Fromroom temperature to 600 ◦C, the mass loss values of GnPsand m-GnPs were 2.69 wt% and 7.53 wt%, respectively. The
5

Nanotechnology 25 (2014) 125707 Q Meng et al
Figure 4. FTIR of further modified GnPs and TGA of modified and unmodified GnPs.
Figure 5. XRD spectra of (a) epoxy/m-GnP composites at various fractions and (b) unmodified composites.
difference in these values yields 4.84 wt%—the minimumfraction of the grafted molecules.
Compounding polymers with additives to produce com-posites is one of the major means to utilize polymer inindustries [35–41]. Figure 5 shows XRD patterns of neat epoxyand its composites with modified and unmodified GnPs. Awide diffraction from 11◦ to 28◦ is observed in all curves,which represents the scattering of cured epoxy molecules. Thecomposites containing 0.5–1 vol% m-GnPs show diffractionsat 26.5◦ in figure 5(a), corresponding to an interlayer distanceof 3.35 Å associated with the graphitic plane, since the layeredstructure in each GnP would retain throughout the functional-ization and compounding processes. The significant diffractionof epoxy molecules may cover some of the m-GnP diffractionpattern at 26.5◦ in the 0.25 vol% composite. By contrast,all the unmodified composites demonstrate higher diffractionintensity at 26.5◦ in figure 5(b) than the epoxy/m-GnP com-posites, implying a higher degree of dispersion and exfoliationof GnPs through interface modification. Therefore the surfacemodification of GnPs by long-chain molecules builds up acovalently bonded interface with the matrix, promoting thedispersion and delamination of GnPs.
3.3. Electrical property of composites
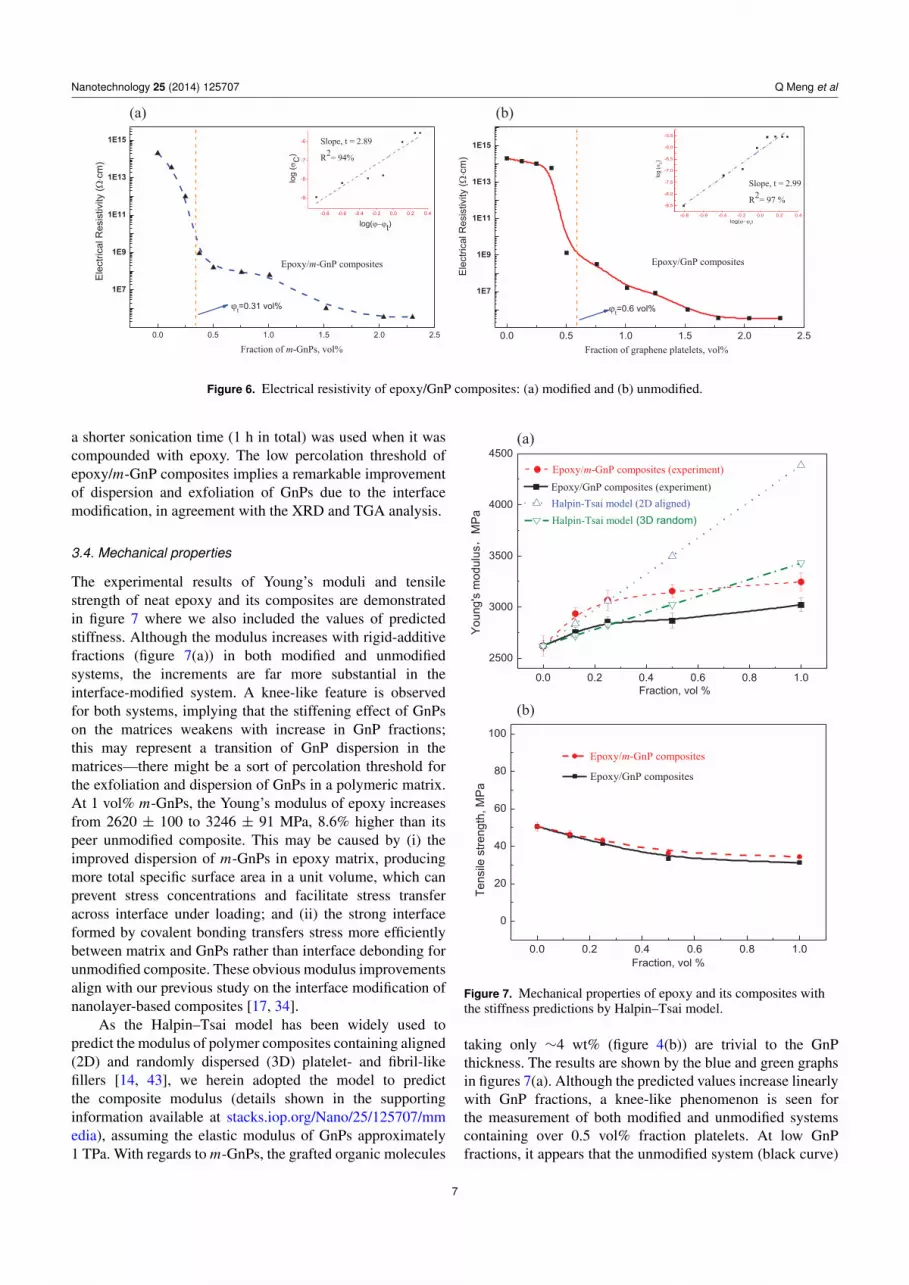
Polymer composites with an electrical volume resistivity lowerthan 1010 � cm are valued in many engineering applications,such as electrically conductive adhesives, antistatic coatingsand films, electromagnetic interference shielding materialsfor electronic devices, thermal interface materials, etc. Theformation of electrically conductive threshold for a compositeis not only dependent on the GnP thickness, but also on theconnectivity and the structure of the fillers [42]. Epoxy resinsare heavily used in aerospace and electronic industries. Infigures 6(a) and (b) the epoxy resistivity reduces by ordersof magnitude upon compounding with GnPs—-both modifiedand unmodified GnPs at 2.3 vol% reduce the epoxy resistivityfrom 1015 to 105 � cm. By fitting the experimental data intothe Power law equation as shown in the top right corners offigures 6(a) and (b), the percolation thresholds (the formationof pathways for electron transfer) were calculated to be0.31 vol% and 0.6 vol% for the modified and unmodifiedcomposites, respectively. The percolation threshold for theunmodified system is lower than a previous study [15] where
6
Nanotechnology 25 (2014) 125707 Q Meng et al
Figure 6. Electrical resistivity of epoxy/GnP composites: (a) modified and (b) unmodified.
a shorter sonication time (1 h in total) was used when it wascompounded with epoxy. The low percolation threshold ofepoxy/m-GnP composites implies a remarkable improvementof dispersion and exfoliation of GnPs due to the interfacemodification, in agreement with the XRD and TGA analysis.
3.4. Mechanical properties
The experimental results of Young’s moduli and tensilestrength of neat epoxy and its composites are demonstratedin figure 7 where we also included the values of predictedstiffness. Although the modulus increases with rigid-additivefractions (figure 7(a)) in both modified and unmodifiedsystems, the increments are far more substantial in theinterface-modified system. A knee-like feature is observedfor both systems, implying that the stiffening effect of GnPson the matrices weakens with increase in GnP fractions;this may represent a transition of GnP dispersion in thematrices—there might be a sort of percolation threshold forthe exfoliation and dispersion of GnPs in a polymeric matrix.At 1 vol% m-GnPs, the Young’s modulus of epoxy increasesfrom 2620 ± 100 to 3246 ± 91 MPa, 8.6% higher than itspeer unmodified composite. This may be caused by (i) theimproved dispersion of m-GnPs in epoxy matrix, producingmore total specific surface area in a unit volume, which canprevent stress concentrations and facilitate stress transferacross interface under loading; and (ii) the strong interfaceformed by covalent bonding transfers stress more efficientlybetween matrix and GnPs rather than interface debonding forunmodified composite. These obvious modulus improvementsalign with our previous study on the interface modification ofnanolayer-based composites [17, 34].
As the Halpin–Tsai model has been widely used topredict the modulus of polymer composites containing aligned(2D) and randomly dispersed (3D) platelet- and fibril-likefillers [14, 43], we herein adopted the model to predictthe composite modulus (details shown in the supportinginformation available at stacks.iop.org/Nano/25/125707/mmedia), assuming the elastic modulus of GnPs approximately1 TPa. With regards to m-GnPs, the grafted organic molecules
Figure 7. Mechanical properties of epoxy and its composites withthe stiffness predictions by Halpin–Tsai model.
taking only ∼4 wt% (figure 4(b)) are trivial to the GnPthickness. The results are shown by the blue and green graphsin figures 7(a). Although the predicted values increase linearlywith GnP fractions, a knee-like phenomenon is seen forthe measurement of both modified and unmodified systemscontaining over 0.5 vol% fraction platelets. At low GnPfractions, it appears that the unmodified system (black curve)
7

Nanotechnology 25 (2014) 125707 Q Meng et al
Figure 8. Fracture toughness (a) and energy release rate (b) of epoxy and its interface-modified and unmodified composites.
fits into the 3D model prediction, but the modified systemmatches the predictions by the 2D model. Nevertheless theplatelets in both systems are not aligned, since no externalelectric/magnetic field was during fabrication applied on thesamples which are at least 3 mm thick. This means that the3D model should fit into the measurement. The differencebetween the measured values and the prediction is gettinglarger with increase in GnPs. At low fractions, the stiffnessof the modified composites is far higher than the prediction,and this implies that the interface modification plays a vitalrole in transferring stress from the matrix and the dispersionphase and restraining the matrix molecular deformation nearthe interface, as supported by a previous research [44]. Thelower measurement at high fractions than the prediction maybe caused by either the stacking of GnPs or the insufficientcompatibility between GnPs and matrix or both. It is worthnoting that the composite containing 100 vol% GnPs shouldhave a stiffness of ∼1 TPa based on the 2D model, but usingthe 3D model leads to a stiffness of 0.1 TPa. Further researchis required to clarify these phenomena.
Figure 7(b) shows that tensile strength slightly decreaseswith increase in GnPs in both systems. The matrix stiffnessplays a crucial role in determining the effect of nanosheetson the tensile strength of composites [45]: tensile strength isoften improved by introducing nanosheets in a relative ductilematrix [18, 46], but it is usually reduced in a rigid matrix suchas brittle epoxy resin [15, 17, 47]. On account of interfacemodification, tensile strength demonstrates smaller reductionin comparison with the unmodified system. At 0.25 vol%GnPs, the modified system shows 14.5% reduction in tensilestrength in comparison with 18.2% for the unmodified one.This obvious difference in the stiffness and strength betweenthese two systems confirms that the formation of interfacialbonding may enhance the mechanical properties of polymermatrix.
3.5. Fracture toughness
Figures 8(a) and (b) show fracture toughness K1c and criticalstrain energy release rate G1c of neat epoxy and its composites.
Both fracture toughness and energy release rate steadilyincrease with GnP content until reaching peak values at0.25–0.50 vol%, and then start to decline gradually, likely dueto the filler-filler network reaching a saturation point whereGnPs may start to stack themselves or form agglomeration. Thetoughening effect at low graphene fraction can be generallyexplained as: (i) under loading, rigid GnPs promoting stressconcentrations in epoxy matrix and effectively absorbingfracture energy by debonding with the matrix or fracturingthemselves, (ii) GnPs acting as obstacles, preventing crackgrowth and propagation to release energy under critical loadingand post-critical loading conditions, and (iii) the fracture ofGnPs absorbing fracture energy.
By introducing merely 0.25 vol% GnPs, K1c in fig-ure 8(a) increases from 0.77 ± 0.07 to 1.82± 0.19 MPa m−2
for the unmodified system, while in the modified systemit increases to 2.22± 0.12 MPa m−2. G1c increases from0.204± 0.03 kJ m−2 for neat epoxy to 1.01± 0.24 kJ m−2
for the 0.25 vol% unmodified composites. In figure 8(b),m-GnPs at 0.25 vol% increases G1c to 1.422± 0.24 kJ m−2.The highest toughness reported by using GnPs is only 0.557±0.02 kJ m−2 at 0.489 vol% [16]. It is also worth to compare ourimprovements with those made by spherical nanoparticles. The4.4 vol% silica nanoparticles of∼25 nm in diameter produceda G1c merely 0.368± 0.039 kJ m−2 for J230-cured epoxy [48];and at same fraction 2.5 vol% soft rubber particles of∼55 nmin diameter produced a similar improvement, but they madeno contribution to modulus [49].
These comparisons are explained below: (i) selection of amore ductile matrix. The molecule weight of J400 hardener isnearly 100% greater than J230. Upon crosslinking by J400, amore ductile matrix under loading would assist nanosheets toproduce more deformation; (ii) GnPs as layered additives uponexfoliation can contribute more total interface surface area thanother spherical or tube particles, thus promoting more energyabsorption under loading than rigid silica particles; (iii) thelong-chain molecules upon covalent bonding can bridge epoxymatrix with GnPs to form a strong interface, which cansignificantly improve the dispersion of GnPs in the matrix
8

Nanotechnology 25 (2014) 125707 Q Meng et al
Figure 9. TEM micrographs of the 0.25 vol% epoxy/m-GnP composite.
and effectively facilitate the fracture energy transferring formmatrix to dispersion phase. More details for the tougheningmechanisms will be discussed in the SEM section.
3.6. Transmission electron microscopy (TEM)
The exfoliation and dispersion of GnPs are two critical fac-tors determining the mechanical and functional performanceof their polymer composites. Since the morphology of anunmodified epoxy/GnP composite has been reported in ourprevious research [15], it is not mentioned here. In general, theunmodified GnPs appear as obviously aggregated or clusteredstructures with over a few microns in size in the matrix(refer to figures 4(a) and (b) in [15]). Figure 9 presents TEMmicrographs of the 0.25 vol% epoxy/m-GnP composite. Thedispersion of m-GnPs in the matrix appears to be relativelyuniform as indicated in figure 9(a), where inconspicuous lightbands from right top to left bottom are the defects produced bymicrotoming. We randomly selected two platelets as indicatedby red rectangles in figure 9(a), and observed these at highermagnifications in figures 9(b) and (c), respectively. The plateletin figure 9(b) appears to contain at least two graphene sheets asindicated at the edge area of flake (see the enlarged region at theright top corner of figure 9(b)). Many platelets in figure 9(a)appear semi-transparent, implying a low thickness. When arandomly selected platelet is magnified in figure 9(c), itslower part appears lighter than the upper area. It is knownthat the numbers of graphene layers can be roughly estimated
by the distinguishable edges of exfoliated graphene in TEMimages [50]. But we in this study adopted electron diffraction(ED) to identify the exact number of graphene layers ina platelet. Firstly the lower area as indicated by the bluerectangle in figure 10(c) was examined. Its ED pattern shows atypical six-fold symmetry expected for graphene in figure 9(d)and its diffraction illustrates a stronger inner intensity thanouter (I(0−110)/I(1−210) is greater than 1), confirming thisarea contains graphene [51, 52]. Then the middle area of theplatelet was examined; its ED pattern (figure 9(e)) illustratesa well-crystallized structure containing 2 layers of graphene.These measurements are in agreement with the AFM resultsdiscussed in previous section.
3.7. Fractography analysis by SEM
Figures 10(a)–(f) contain SEM micrographs of the fracturedcompact tension (CT) surface of the 0.25 vol% epoxy/GnPcomposite cured by J400. Since neat epoxy fracture-surface iswell known for being relatively smooth and mirror-like [49,53, 54], their results are not included in this section. Fig-ure 10(a) shows an overview of the fractography of theepoxy/unmodified GnP composite including notched region,crack tip and propagation region (deformation zone). Crackpropagation directions in all figures are from top to bottom.Figure 10(a) shows a typically rough surface with an obviousdeformation zone of ∼1.7 mm in length, indicating energyabsorbed during crack propagation. In figure 10(b), a few
9

Nanotechnology 25 (2014) 125707 Q Meng et al
Figure 10. Fracture surface of the 0.25 vol% epoxy/GnP composite.
Figure 11. Fracture surface of the 0.5 vol% epoxy/m-GnP composite.
pull-outs are observed as indicated by white arrows, and thismeans GnPs likely forming either aggregates or clusters inthe matrix as a result of imperfect dispersion of GnPs incomposites due to lack of interface modification. Figure 10(c)shows a further magnified region around the crack tip. Anumber of river-lines (indicated by red arrows), which wereproduced by loading and are usually observed on insufficientlytoughened fracture-surfaces, are found in front of plasticdeformation zone [55]. Figure 10(d) illustrates a magnifiedregion of plastic deformation zone. The broad whitening bandindicated by red arrows shows significant plastic deformationunder loading. Whitening bands and lines refer to the stressedmatrix corrresponding to reduction in density, which are moresensitive to electrons and thus appear white; this proves theexistence of stress concentration and unbalanced consumption
of fracture energies. In figure 10(e) some layered structures(indicated by a blue circle) and clustered structures (red circle)are found, and figure 10(f) confirms the structure of a typicalcluster.
Figures 11(a)–(f) show SEM micrographs of the fracturesurface the 0.25 vol% epoxy/m-GnP composite. Figure 11(a)demonstrates the following features different to the unmodifiedcomposite (figure 10(a)). Frist, a longer prorogation zone(plastic deformation zone) of ∼16.6 mm in length is seen infront of a crack tip, implying a higher level of energy release.Second, no obvious whitening bands and clustered structuresare found in figure 11, although these two phenomena domi-nate in figure 10; only thin whitening lines can be observed,implying better stress distribution under loading. Therefore,the crack under loading propagates far more uniformly and
10

Nanotechnology 25 (2014) 125707 Q Meng et al
steadily. Finally, highly deformed or fractured graphene sheetsare observed as circles by red dash-line in figure 11(f). Insummary, interface modification promoted far more plasticdeformation in front of a sharp crack under loading, becausethe functionalization would facilitate stress transfer acrossinterface and restrain the matrix molecular deformation in thevicinity of dispersion phase. This explains why only 0.25 vol%m-GnPs increased the energy release rate G1c significantly.
3.8. Thermal properties
Dynamic mechanical analysis (DMA) was employed todetect the interface effect on the dynamic thermal propertiesof epoxy/GnP composites, as it provides comprehensioninformation on the interaction between filler and matrixmacromolecules. DMA identifies glass transition temperature(Tg)—a temperature at which sufficient vibration energy hasbeen accumulated in molecules—also known as relaxationbehaviour [56, 57]. Figures S2(a) and (b) show the tan deltacurves as a function of temperature for neat epoxy and itscomposites with modified and unmodified GnPs, respectively.
Neat epoxy shows a Tg at 58.9 ◦C due to the hardenerJ400 used. With 0.25 vol% unmodified graphene platelets, itincreases to 66.9 ◦C, but the same fraction of modified GnPsincreases Tg to 73.8 ◦C. This obviously different improvementin Tg indicates a prominent effect of interface modificationon the thermal properties of the epoxy/GnP composite. Theincrement of Tg refers to the reduction of matrix chain mobilityby presence of GnPs. During fabrication, J2000 moleculesgrafted to GnPs and the grafted molecules then reacted withmatrix to create a strong interface. The interface confines thevibration of chains at Tg, contributing to the increment of Tg.When unmodified and modified GnPs increase to 0.5 vol%,the Tgs slightly reduce to 60.1 ◦C and 64.8 ◦C respectively, andthese values remain quite similar at 1 vol%. This phenomenonwas likely caused by the filler contents reached a saturationthreshold.
4. Conclusions
By dispersing GnPs in solvent N -methyl-2-pyrrolidone andreacting these with long-chain surfactant (Jeffamine D 2000,denoted J2000), we produced J2000-GnPs, which featureexceptional electrical conductivity ranging between 694 and1200 S cm−1. The surface functionalization of grapheneplatelets (GnPs) by long-chain molecules has been found tomarkedly improve their dispersion and exfoliation in polymermatrixes, but this would inevitably lead to somewhat reducedelectrical conductivity—a trade-off in the development ofpolymer/graphene composites.
To further promote the exfoliation and dispersion of func-tionalized GnPs in a polymeric matrix, we dispersed J2000-GnPs in the solvent and further modified it using diglycidylether of bisphenol A (DGEBA) to produce m-GnPs, whichwas then compounded with epoxy for the development ofepoxy/m-GnP composites. This two-step modification processis essential to achieve a low electrical conductivity perco-lation threshold of 0.31 vol% for epoxy/GnP composites.
This new interface modification significantly promoted themechanical properties and other functional performance ofepoxy/graphene composites in comparison with the unmodi-fied systems. Compared to the unmodified GnPs, the modifi-cation by J2000 (m-GnPs) has been found to
• Increased the fracture energy release rate G1c from0.204 ± 0.03 to 1.422± 0.24 kJ m−2, representing afurther 202% improvement over the unmodified com-posites at the same fraction.• Improved the glass transition temperature of neat epoxy
from 58.9 to 73.8 ◦C.• Reduced the percolation threshold of electrical volume
resistivity.
Acknowledgments
JM and QM appreciate assistance and help from Yawen Gaoand also thank Animesh Basak, Angus Netting and John Terletfor technical support at Adelaide Microscopy. JM thanksAsbury and Huntsman (Melbourne) for providing the GICand J400, J2000 and B200, respectively. CW would like toacknowledge the support by an Australian Research CouncilDiscovery project (DP140100778).
References
[1] Geim A K and Novoselov K S 2007 Nature Mater. 6 183[2] Zalalutdinov M K, Robinson J T, Junkermeier C E,
Culbertson J C, Reinecke T L, Stine R, Sheehan P E,Houston B H and Snow E S 2012 Nano Lett. 12 4212
[3] Wei D, Liu Y, Wang Y, Zhang H, Huang L and Yu G 2009Nano Lett. 9 1752
[4] Kim K S, Zhao Y, Jang H, Lee S Y, Kim J M, Kim K S,Ahn J-H, Kim P, Choi J-Y and Hong B H 2009 Nature457 706
[5] Banhart F, Kotakoski J and Krasheninnikov A V 2011 ACSNano 5 26
[6] Shao Q, Liu G, Teweldebrhan D and Balandin A 2008 Appl.Phys. Lett. 92 202108
[7] Lu G, Ocola L E and Chen J 2009 Nanotechnology 20 445502[8] Ren P G, Yan D X, Ji X, Chen T and Li Z M 2011
Nanotechnology 22 055705[9] Cai D, Yusoh K and Song M 2009 Nanotechnology 20 085712
[10] Ding Y H, Zhang P, Zhuo Q, Ren H M, Yang Z M and Jiang Y2011 Nanotechnology 22 215601
[11] Joung D, Chunder A, Zhai L and Khondaker S I 2010Nanotechnology 21 165202
[12] Xu Z and Xue K 2010 Nanotechnology 21 045704[13] Kauffman D R and Star A 2010 Analyst 135 2790[14] Gomez-Navarro C, Burghard M and Kern K 2008 Nano Lett.
8 2045[15] Zaman I, Kuan H-C, Ma J, Dai J, Kawashima N,
Michelmore A, Sovi A, Dong S and Luong L 2012Nanoscale 4 4578
[16] Zaman I, Kuan H-C, Ma J, Meng Q, Michelmore A,Kawashima N, Pitt T, Zhang L, Gouda S and Luong L 2012Adv. Funct. Mater. 22 2735
[17] Ma J, Meng Q, Michelmore A, Kawashima N, Izzuddin Z,Bengtsson C and Kuan H-C 2013 J. Mater. Chem. A 1 4255
11

Nanotechnology 25 (2014) 125707 Q Meng et al
[18] Araby S, Zaman I, Meng Q, Kawashima N, Michelmore A,Kuan H C, Majewski P, Ma J and Zhang L 2013Nanotechnology 24 165601
[19] Huang X, Qi X, Boey F and Zhang H 2012 Chem. Soc. Rev.41 666
[20] Kuilla T, Bhadra S, Yao D, Kim N H, Bose S and Lee J H2010 Prog. Polym. Sci. 35 1350
[21] Mo M-S, Wang D, Du X, Ma J, Qian X, Chen D and Qian Y2008 Cryst. Growth Des. 9 797
[22] Jia B P and Zou L D 2012 Carbon 50 2315[23] Du F P, Wang J J, Tang C Y, Tsui C P, Zhou X P, Xie X L and
Liao Y G 2012 Nanotechnology 23 475704[24] Yu C, Ji W, Wang Y, Bao N and Gu H 2013 Nanotechnology
24 115502[25] Zaman I, Phan T T, Ma J, Kuan H-C, Meng Q, La L T B,
Luong L and Youssf O 2011 Polymer 52 1603[26] Ma J, Qi Q, Bayley J, Du X-S, Mo M-S and Zhang L-Q 2007
Polym. Test. 26 445[27] Meng Q, Zaman I, Hannam J R, Kapota S, Luong L, Youssf O
and Ma J 2011 Polym. Test. 30 243[28] Pretsch E, Buhlmann P and Affolter C 2009 Structure
Determination of Organic Compounds: Tables of SpectralData 4th edn (Berlin: Springer) p 269
[29] Du X, Skachko I, Barker A and Andrei E Y 2008 NatureNanotechnol. 3 491
[30] Marcano D C, Kosynkin D V, Berlin J M, Sinitskii A, Sun Z,Slesarev A, Alemany L B, Lu W and Tour J M 2010 ACSNano 4 4806
[31] Wu Z S, Ren W, Gao L, Zhao J, Chen Z, Liu B, Tang D, Yu B,Jiang C and Cheng H M 2009 ACS Nano 3 411
[32] Kim H, Abdala A A and Macosko C W 2010 Macromolecules43 6515
[33] Zhao B, Liu P, Jiang Y, Pan D Y, Tao H H, Song J S, Fang Tand Xu W W 2012 J. Power Sources 198 423
[34] Zaman I, Le Q H, Kuan H C, Kawashima N, Luong L,Gerson A and Ma J 2011 Polymer 52 497
[35] Yu S, Hu H, Ma J and Yin J 2008 Tribol. Int. 41 1205[36] Jun M, Changchun L, Yuxing F and Yujun Z 2000 China
Synth. Rubber Indust. 23 186[37] Li B Y, Ma J, Liu H Y, Guo X L, Zhang X L and Xu J 2006 J.
Appl. Polym. Sci. 100 3974
[38] Zhu S, Zhu C, Ma J, Meng Q, Guo Z, Yu Z, Lu T, Li Y,Zhang D and Lau W M 2013 RSC Adv. 3 6141
[39] Kang H L, Qiao B, Wang R G, Wang Z, Zhang L Q, Ma J andCoates P 2013 Polymer 54 2450
[40] Li F, Lu Y L, Liu L, Zhang L Q, Dai J B and Ma J 2013Polymer 54 2158
[41] Li Y, Zhu C, Lu T, Guo Z, Zhang D, Ma J and Zhu S 2012Carbon 52 565
[42] Al-Saleh M H and Sundararaj U 2009 Carbon 47 1738[43] Liang J, Huang Y, Zhang L, Wang Y, Ma Y, Guo T and
Chen Y 2009 Adv. Funct. Mater. 19 2297[44] Ren P-G, Yan D-X, Chen T, Zeng B-Q and Li Z-M 2011 J.
Appl. Polym. Sci. 121 3167[45] Dai J-B, Kuan H-C, Du X-S, Dai S-C and Ma J 2009 Polym.
Int. 58 838[46] Araby S, Zhang L Q, Kuan H C, Dai J B, Majewski P and
Ma J 2013 Polymer 54 3663[47] Ma J, Shi L, Yang M, Li B, Liu H and Xu J 2002 J. Appl.
Polym. Sci. 86 3708[48] Ma J, Mo M S, Du X S, Rosso P, Friedrich K and Kuan H C
2008 Polymer 49 3510[49] Le Q-H, Kuan H-C, Dai J-B, Zaman I, Luong L and Ma J
2010 Polymer 51 4867[50] Khan U, O’Neill A, Lotya M, De S and Coleman J N 2010
Small 6 864[51] Valles C, Drummond C, Saadaoui H, Furtado C A, He M,
Roubeau O, Ortolani L, Monthioux M and Penicaud A2008 J. Am. Chem. Soc. 130 15802
[52] Hernandez Y et al 2008 Nature Nanotechnol. 3 563[53] Ma J, Mo M-S, Du X-S, Dai S-R and Luck I 2008 J. Appl.
Polym. Sci. 110 304[54] Kuan H C, Dai J B and Ma J 2010 J. Appl. Polym. Sci.
115 3265[55] Hull D 1999 Fractography: Observing, Measuring and
Interpreting Fracture Surface Topography (Cambridge:Cambridge University Press)
[56] Tang H, Qi Q, Wu Y, Liang G, Zhang L and Ma J 2006Macromol. Mater. Eng. 291 629
[57] Liu H, Xu J, Li Y, Li B, Ma J and Zhang X 2006 Macromol.Rapid Commun. 27 1603
12
Copyright © 2022 FDOKUMEN