Process simulation, economic analysis and synthesis of ...
146
Process simulation, economic analysis and synthesis of biodiesel from waste vegetable oil using supercritical methanol by Soo Jin Lee B.Eng., Korea University, 2008 A THESIS SUBMITTED IN PARTIAL FULFILLMENT OF THE REQUIREMENTS FOR THE DEGREE OF MASTER OF APPLIED SCIENCE in The Faculty of Graduate Studies (Chemical and Biological Engineering) THE UNIVERSITY OF BRITISH COLUMBIA (Vancouver) August 2010 © Soo Jin Lee, 2010
-
Upload
khangminh22 -
Category
Documents
-
view
0 -
download
0
Transcript of Process simulation, economic analysis and synthesis of ...
Process simulation, economic analysis and synthesis of
biodiesel from waste vegetable oil using supercritical methanol
by
Soo Jin Lee
B.Eng., Korea University, 2008
A THESIS SUBMITTED IN PARTIAL FULFILLMENT OF THE
REQUIREMENTS FOR THE DEGREE OF
MASTER OF APPLIED SCIENCE
in
The Faculty of Graduate Studies
(Chemical and Biological Engineering)
THE UNIVERSITY OF BRITISH COLUMBIA
(Vancouver)
August 2010
© Soo Jin Lee, 2010
ii
Abstract
Biodiesel production using supercritical methanol received attention as an alternative method to
replace the conventional alkali-catalyzed method being practiced in industry. Due to its flexibility to
feedstock compared to the conventional method, the supercritical method for waste vegetable oil
conversion appears to be promising in environmental and economical points of views.
Four industrial-scale biodiesel production processes were simulated using Hysys. Each process used
either the conventional or the supercritical method. The first model simulated the alkali-catalyzed
process using fresh vegetable oil. The second process model resembled the first one as it uses sodium
hydroxide catalyst in transesterification, but pre-treatment process of waste vegetable oil was included.
The third and fourth models were supercritical biodiesel production processes using waste vegetable
oil. Fourth model had differences from the third one in terms of the amount of methanol being
introduced to a plug flow reactor and the way of recovering methanol from reaction products, both of
which can reduce energy consumption of the process. To improve the accuracy of the process
simulations, properties of a model compound (triolein) of the vegetable oils were examined via
thermogravimetric analysis, and the experimental data were incorporated into the simulation models.
Economical aspects of the developed simulation models were then assessed using Aspen Icarus
Process Evaluator.
The economic assessment revealed that supercritical processes using waste vegetable oil were
competitive to the conventional process based on their better profitability indicators such as discounted
payback period and net present value. The net present value prediction formulas were derived for the
four processes via statistical analysis of the vegetable oil price, biodiesel selling price, by-product
selling price and interest rate that were found to most strongly affect the profitability of the biodiesel
production processes by sensitive analysis.
Experiments of biodiesel synthesis from waste canola oil were conducted using supercritical methanol.
High methyl ester yields over 96% were achieved after 45 min of reaction time at 270°C/10 MPa with
methanol to oil ratios of 1:1 and 2:1. Side reactions such as glycerol decomposition and glycerol
methanolysis were confirmed by water content measurement using Karl-Fischer titration and Gas
chromatography-mass spectrometry (GC-MS) analysis.
iii
Table of Contents
Abstract ....................................................................................................................................................ii
Table of Contents .................................................................................................................................... iii
List of Tables . ......................................................................................................................................... vi
List of Figures ....................................................................................................................................... viii
List of Abbreviations ................................................................................................................................ x
List of Notations ..................................................................................................................................... xii
Glossary.......... ....................................................................................................................................... xiii
Acknowledgements ............................................................................................................................... xiv
Co-authorship Statement ........................................................................................................................ xv
1. Introduction .......................................................................................................................................... 1
1.1. Feedstocks: vegetable oils ............................................................................................................. 2
1.2. Catalysis in transesterification ...................................................................................................... 4
1.2.1. Homogeneous alkali-catalyzed transesterification ............................................................ 4
1.2.2. Homogeneous acid-catalyzed transesterification .............................................................. 5
1.2.3. Heterogeneous catalyzed transesterification ..................................................................... 5
1.2.4. Supercritical transesterification ......................................................................................... 6
1.3. Process simulation and economic assessment ............................................................................... 8
1.4. Thesis objectives ........................................................................................................................... 9
Bibliography ....................................................................................................................................... 10
2. Simulation of four continuous biodiesel production processes .......................................................... 12
2.1. Introduction ................................................................................................................................. 12
2.2. Thermogravimetric analysis of triolein ....................................................................................... 13
2.2.1. Method............................................................................................................................. 13
2.2.2. Results and discussion ..................................................................................................... 14
2.3. Process simulation ....................................................................................................................... 18
2.3.1. Alkali-FVO process ......................................................................................................... 19
2.3.2. Alkali-WVO process ....................................................................................................... 22
2.3.3. SC-WVO process ............................................................................................................ 26
2.3.4. SC-LowE process ............................................................................................................ 31
2.3.5. Energy consumption ........................................................................................................ 33
2.4. Conclusion ................................................................................................................................... 34

iv
Bibliography ....................................................................................................................................... 36
3. Economic assessment of biodiesel production processes ................................................................... 39
3.1. Introduction ................................................................................................................................. 39
3.2. General specifications for economic analysis in IPE .................................................................. 43
3.2.1. General specifications for capital costs ........................................................................... 43
3.2.2. Utility, raw material and product specifications .............................................................. 45
3.3. Mapping and sizing ..................................................................................................................... 47
3.4. Investment parameters................................................................................................................. 57
3.5. Project evaluation ........................................................................................................................ 59
3.5.1. Total capital investment .................................................................................................. 59
3.5.2. Total manufacturing cost ................................................................................................. 61
3.5.3. Profitability analysis ........................................................................................................ 64
3.6. Sensitivity analysis on net present value ..................................................................................... 67
3.6.1. Single parameter analysis ................................................................................................ 67
3.6.2. Multiple parameters ......................................................................................................... 73
Bibliography ....................................................................................................................................... 78
4. Biodiesel production from used canola oil using supercritical methanol ........................................... 80
4.1. Background ................................................................................................................................. 80
4.2. Experimental ............................................................................................................................... 84
4.2.1. Materials and apparatus ................................................................................................... 84
4.2.2. Procedures ....................................................................................................................... 85
4.2.3. Analytical procedure ....................................................................................................... 86
4.2.4. Statistical analysis ........................................................................................................... 89
4.3. Results and discussion ................................................................................................................. 90
4.3.1. FFA and water contents of waste canola oil .................................................................... 90
4.3.2. Supercritical transesterification of waste canola oil ........................................................ 92
4.3.3. Interaction effects on the FAME yield ............................................................................ 95
4.3.4. Glycerol reactions ............................................................................................................ 97
4.4. Conclusion ................................................................................................................................. 102
Bibliography ..................................................................................................................................... 103
5. General discussion, conclusions and recommendations ................................................................... 105
5.1. General discussion..................................................................................................................... 105
5.2. Conclusions ............................................................................................................................... 109
v
5.3. Recommendations ..................................................................................................................... 110
Bibliography ..................................................................................................................................... 112
Appendix A: Economic assessments for the biodiesel plant capacities of 8,000 and 160,000 tonnes/yr
biodiesel ........................................................................................................................ 114
Appendix B: Water content measurement by Karl Fischer volumetric titration .................................. 117
Appendix C: Sample calculations of FAME yields ............................................................................. 121
Appendix D: Calculations of the amount of water produced from esterification reaction of FFA ...... 122
Appendix E: Gas chromatography-mass spectrometry (GC-MS) ........................................................ 123
vi
List of Tables
Table 1.1. Fatty acid composition (wt%) of various vegetable oils ......................................................... 3
Table 2.1. Comparison of available properties of triolein ...................................................................... 13
Table 2.2. Parameters for Equation (2.1) ............................................................................................... 17
Table 2.3. Comparison of the boiling point of tripalmitin and triolein obtained from TGA, DSC and
group contribution method ................................................................................................... 17
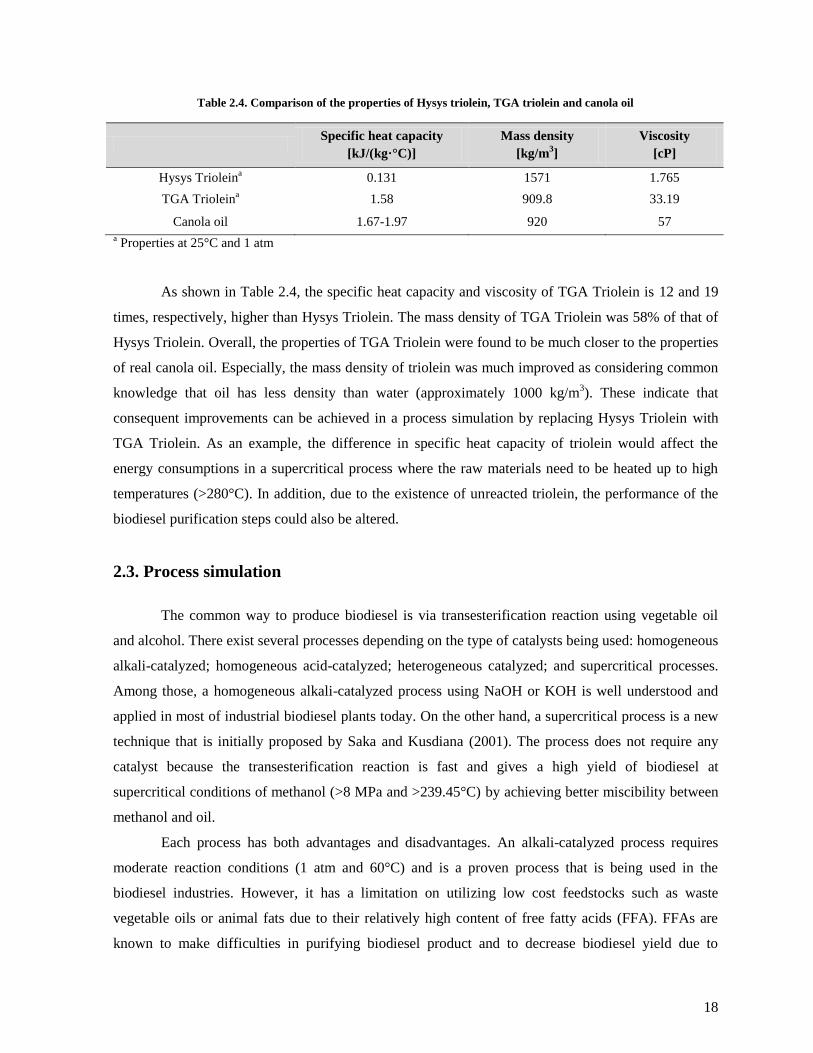
Table 2.4. Comparison of the properties of Hysys triolein, TGA triolein and canola oil ...................... 18
Table 2.5. Raw materials, reaction conditions, yields and reactor types for supercritical biodiesel
production ............................................................................................................................ 27
Table 2.6. Summary of reactions involved in simulation models .......................................................... 28
Table 2.7. Energy consumption of the four process simulation models ................................................ 33
Table 3.1. The freights (domestic and ocean) and taxes as the percentages of material costs in different
locations ............................................................................................................................... 44
Table 3.2. The general specifications for capital costs of the four biodiesel production processes ....... 45
Table 3.3. The prices of utilities used in this study ................................................................................ 46
Table 3.4. The prices of raw materials and products used in this study ................................................. 47
Table 3.5. HETP values for a packed column ........................................................................................ 51
Table 3.6. Equipment summary for Alkali-FVO process ...................................................................... 53
Table 3.7. Equipment summary for Alkali-WVO process ..................................................................... 54
Table 3.8. Equipment summary for SC-WVO process .......................................................................... 55
Table 3.9. Equipment summary for SC-LowE process .......................................................................... 56
Table 3.10. Investment analysis parameter for the four biodiesel production processes ....................... 58
Table 3.11. Total capital investment for biodiesel production processes ............................................... 60
Table 3.12. Total manufacturing cost, glycerol credit and revenues from biodiesel sales in the four
processes .............................................................................................................................. 63
Table 3.13. The profitability measures and the break-even price of biodiesel ....................................... 65
Table 3.14. Renewable fuel volume requirements for renewable fuel standard (RFS2) from 2009 to
2015 for the U.S. .................................................................................................................. 71
Table 3.15. The four parameters in central composite design to investigate NPVs of Alkali-FVO,
Alkali-WVO, SC-WVO and SC-LowE processes ............................................................... 74
Table 3.16. Analysis of variance and effect tests for each parameter of Alkali-FVO process ............... 74
Table 4.1. The summary of the reported experiment data of biodiesel production using supercritical
methanol ............................................................................................................................... 82
vii
Table 4.2. Profile of fatty acid methyl esters in biodiesel from different feedstocks ............................. 89
Table 4.3. Experimental conditions and the yields of methyl esters from the waste canola oil ............. 90
Table 4.4. Comparison of the yield of methyl esters from used frying oil, waste palm oil and waste
canola oil .............................................................................................................................. 91
Table 4.5. The results of ANOVA for the supercritical biodiesel production experiments ................... 93
Table 4.6. Identified glycerol reaction products by GC-MS .................................................................. 99
Table 4.7. Water contents in the reactants and a product of supercritical reaction .............................. 100
Table 4.8. Peak identification of the components in Figure 4.13 ......................................................... 102
Table A.1. Total capital cost for the four processes ............................................................................. 114
Table A.2. Total manufacturing cost, glycerol credit and revenues from biodiesel sales of the four
processes ............................................................................................................................ 115
Table A.3. Experimental tables of central composite design and the responses (NPV) of Alkali-FVO
process ................................................................................................................................ 116
viii
List of Figures
Figure 1.1. Schematic processes of biodiesel fuel production from rapeseed oil by the conventional
(left) and supercritical (right) methods ................................................................................ 7
Figure 2.1. Weight loss curve of triolein (C18:1) measured in TGA ..................................................... 15
Figure 2.2. Weight loss curve of tripalmitin (C16:0) measured in TGA ............................................... 16
Figure 2.3. Flow diagram and properties of main streams of Alkali-FVO process ............................... 20
Figure 2.4a. Flow diagram and properties of main streams of pre-treatment in Alkali-WVO process .. 23
Figure 2.4b. Flow diagram and properties of main streams of Alkali-WVO process after pre-treatment
........................................................................................................................................... 25
Figure 2.5. Flow diagram and properties of main streams of SC-WVO process ................................... 30
Figure 2.6. Flow diagram and properties of main streams of SC-LowE process ................................... 32
Figure 3.1. The prices of vegetable oils from Oct 2000 to Jan 2010 ..................................................... 40
Figure 3.2. The proportions of subitems in the total production cost for biodiesel of the four processes
........................................................................................................................................... 64
Figure 3.3. The diesel retail prices in United States from January 1995 to April 2010 ......................... 66
Figure 3.4. Sensitivities of the NPVs of the four processes to the price of oil feeds ............................. 68
Figure 3.5. Sensitivities of the NPVs of the four processes to the price of glycerol by-product ........... 68
Figure 3.6. Sensitivities of the NPVs of the four processes to the price of biodiesel product ............... 69
Figure 3.7. Sensitivities of the NPVs of the four processes to interest rates .......................................... 70
Figure 3.8. Sensitivities of the NPVs of the four processes to the life of projects ................................. 70
Figure 3.9. Comparison of total capital cost, NPV and break-even price of each process .................... 72
Figure 3.10. A comparative plot of NPV values calculated by the prediction formula to the actual
values ................................................................................................................................. 76
Figure 4.1. Fresh canola oil (left) and waste canola oil (right) from UBC Place Vanier residence ....... 84
Figure 4.2. The experimental setup for supercritical biodiesel production ............................................ 85
Figure 4.3. Karl Fisher volumetric titration apparatus for measurement of water content .................... 87
Figure 4.4. Gas chromatogram of the standard sample for peak identification of methyl esters ........... 88
Figure 4.5. Gas chromatogram of a product sample from the waste canola oil ..................................... 88
Figure 4.6. Thermogravimetric analysis of waste canola oil used in the supercritical experiments ...... 91
Figure 4.7. Effect of molar ratio on methyl ester yield from supercritical transesterification of
Jatroopha oil ......................................................................................................................... 94
Figure 4.8. A plot for comparison of the actual yields and predicted yields .......................................... 95
ix
Figure 4.9. a) Two-dimensional and b) response surface plots of FAME yield against reaction time and
temperature as predicted by Equation (4.4).......................................................................... 96
Figure 4.10. FAME yields against reaction time and weight ratio predicted by Equation (4.4) ............ 97
Figure 4.11. FAME yields against reaction temperature and weight ratio predicted by Equation (4.4) 97
Figure 4.12. The comparison of products with a single phase and with two phases .............................. 98
Figure 4.13. Gas chromatography−mass spectroscopy (GC-MS) chromatogram of the product from
supercritical reaction at 270°C/10 MPa for 45 min ............................................................ 101
Figure E.1. GC-MS chromatogram of the single phase biodiesel product in Table 4.7....................... 123
Figure E.2. Identification of methanol in the biodiesel sample (green) by comparing retention time
with pure methanol ............................................................................................................. 124
Figure E.3. Identification of 1,3-dimethoxy-2-propanol in the biodiesel sample by GC-MS .............. 125
Figure E.4. Identification of 3-dimethoxy-1,2-propandiol in the biodiesel sample by GC-MS ........... 126
Figure E.5. Identification of hexanoic methyl ester in the biodiesel sample by GC-MS ..................... 127
Figure E.6. Identification of 1,2,4-butanetriol in the biodiesel sample by GC-MS ............................. 128
Figure E.7. Identification of glycerol in the biodiesel sample by GC-MS ........................................... 129
Figure E.8. Identification of diglycerol in the biodiesel sample by GC-MS ........................................ 130
Figure E.9. Identification octanoic methyl ester in the biodiesel sample by GC-MS .......................... 131
x
List of Abbreviations
316SS 316 Stainless steel
ANOVA Analysis of variance
ASME American society of mechanical engineering
B100 100% pure biodiesel fuel
CCD Central composite design
CS Carbon steel
CSTR Continuous stirred tank reactor
cwt Centum weight (=100 pounds)
DCFROR Discounted cash flow rate of return
DF Degree of freedom
DPP Discounted payback period
DSC Differential scanning calorimeter
EAV Equivalent annual value
EOS Equation of state
EPA Energy policy act
FAME Fatty acid methyl ester
FFA Free fatty acid
FID Flame ionized detector
FVO Fresh vegetable oil
G&A General & administrative
GC Gas chromatography
GC-MS Gas chromatography-mass spectrometry
HETP Height equivalent to a theoretical plate
IPE Icarus process evaluator
IRR Internal rate of return
KF Karl-Fischer
L-L separator Liquid-liquid separator
MARR Minimum acceptable rate of return
MeOH Methanol
MOC Material of construction
NPV Net present value
NRTL Non-random two liquid model
PFR Plug flow reactor
Prob Probability
R&D Research & development
RFS Renewable fuels standards
RSM Response surface model
SOx Sulphur oxide
TGA Thermogravimetric analysis
TG-MS Thermogravimetry and mass spectrometry

xi
UBC The University of British Columbia
UNIFAC Universal functional activity coefficient
US EIA U.S. Energy information administration
US EPA U.S. Environmental protection agency
USDA U.S. Department of agriculture
WEC World energy council
WVO Waste vegetable oil
xii
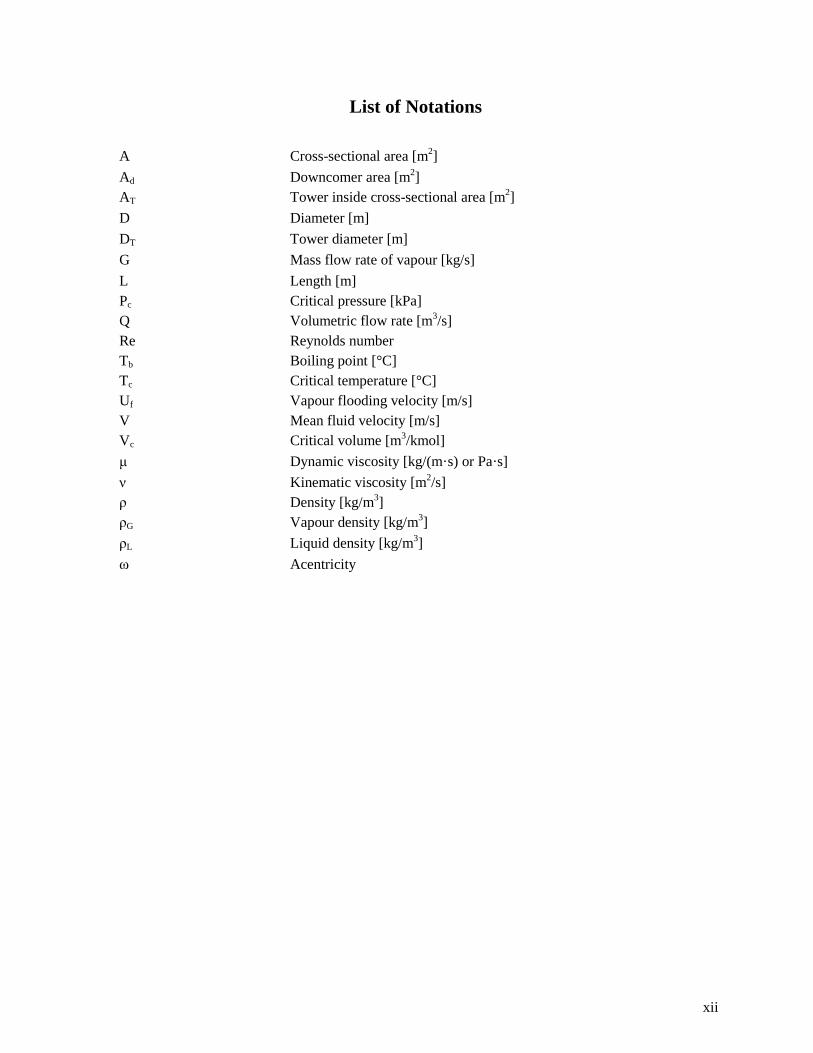
List of Notations
A Cross-sectional area [m2]
Ad Downcomer area [m2]
AT Tower inside cross-sectional area [m2]
D Diameter [m]
DT Tower diameter [m]
G Mass flow rate of vapour [kg/s]
L Length [m]
Pc Critical pressure [kPa]
Q Volumetric flow rate [m3/s]
Re Reynolds number
Tb Boiling point [°C]
Tc Critical temperature [°C]
Uf Vapour flooding velocity [m/s]
V Mean fluid velocity [m/s]
Vc Critical volume [m3/kmol]
μ Dynamic viscosity [kg/(m·s) or Pa·s]
ν Kinematic viscosity [m2/s]
ρ Density [kg/m3]
ρG Vapour density [kg/m3]
ρL Liquid density [kg/m3]
ω Acentricity
xiii
Glossary
ASTM D5555-95 Standard test method for determination of free Fatty acids
contained in animal, marine, and vegetable fats and oils used in
fat liquors and stuffing compounds
ASTM D6751 Standard specification for biodiesel fuel blend stock (B100) for
middle distillate fuels
EN14214 EU biodiesel fuel standard

xiv
Acknowledgements
I would like to specially thank my supervisors Dr. Naoko Ellis and Dr. Dusko Posarac for their great
support, advices and encouragement through the course of this degree that inspired me to have great
interests in this field. Pursuing this Master‘s degree in UBC has contributed much to improve myself in
many ways, I am very grateful for them to give the opportunity. I would also like to thank committee
members for giving their time to be a part of my thesis defence.
I would like to acknowledge the financial support of the National Science and Engineering Research
Council (NSERC). Without this funding the research would not have been possible.
I am also very grateful for my colleagues Jidon, Amir, Thomas, Steve, Joyleene, Masa and Dan to
share their experiences and support me to finish my experimental works. I would like to thank Mr.
Timothy Ma for giving me great help to analyse biodiesel samples with gas chromatography. An
acknowledgement to UBC Place Vanier Residence and Chin-Ho restaurants to provide me their waste
oils for this project. CHBE Staffs, Ivan Leversage, Doug Yuen, Qi Chen, Richard Zhang, Gordon
Cheng, Richard Ryoo, Helsa Leong, Amber Lee and Lori Tanaka also helped me much to complete my
degree in chemical and engineering department. Also, a special thank to my fellow graduate students,
who were kindly offer their peer support and friendship to me.
And last but not least, thank you to my family who has cared and supported me from Korea, and to my
friends in Canada and Korea for their support.

xv
Co-authorship Statement
Chapter 2 will be revised into a manuscript co-authored with Dr. Dusko Posarac and Dr.
Naoko Ellis at the University of British Columbia. As the first author, I was in charge of the
thermogravimetric analysis of triolein and tripalmitin and the development of four biodiesel production
process simulations incorporated with the thermogravimetric analysis result of triolein.
Chapter 3 will be revised into a manuscript co-authored with Dr. Dusko Posarac and Dr.
Naoko Ellis at the University of British Columbia. My contribution to this manuscript includes
assessment of the four processes from an economic perspective. I was in charge of evaluation of
profitability, identification of essential elements of biodiesel costs and sensitivity analysis of net
present values of the four processes.
Chapter 4 will be revised into a manuscript co-authored with Dr. Dusko Posarac and Dr.
Naoko Ellis at the University of British Columbia. My contribution to this manuscript includes
conducting experiments of laboratory-scale biodiesel production using a batch reactor, analyzing water
content of reactants and products using a Karl Fischer volumetric titrator and analyzing a profile of
fatty acid methyl esters in biodiesel products via gas chromatography.
All co-authors contributed to the identification and design of the research project and will
assist in the preparation and revision of the manuscripts.
1
1. Introduction
Exploitation of alternative fuels such as hydrogen, non-fossil natural gas and biofuels has been
actively conducted in recent years. Skyrocketing prices of petroleum-based fuels and growing
environmental concerns are boosting public attention to alternative fuels. Moreover, worldwide energy
demand has steadily increased, widening the gap between the supply and demand of petroleum oil,
raising concerns about the depletion of fossil fuels. According to a World Energy Council (WEC)
study, if current practice is continued, worldwide energy demand in 2020 will be 50-80% higher than
in 1990 (Omer, 2008).
Among the alternative transportation fuels on which research is in progress, biodiesel is one of
the most promising because the infrastructure for the distribution of biodiesel is well established
compared to the others. Biodiesel is distinguished from petroleum-based diesel by the fact that it is a
renewable energy. It also has lower environmental impact, reducing emissions of particulate matter,
carbon monoxide, total hydrocarbons and toxic aromatic and polyaromatic compounds (Lapuerta et al.,
2008). Therefore, promoting innovative applications of biodiesel can contribute to the achievement of
sustainable development.
Many countries have legislated the promotion of biodiesel in the forms of fuel mandates, tax
incentives and funding for capital projects or fleet upgrades (Mabee, 2007). In December 2006, the
Government of Canada announced that it would regulate the renewable content of diesel fuel to
achieve 2% biodiesel content by 2012. In the United States, The Energy Policy Act of 2005, H.R. 6,
was signed into law by President George W. Bush. This act contains renewable fuels standards (RFS)
that will raise the use of biofuels to 28.4 billion litres per year by 2012, which is effectively 5% of total
fuel sales (Mabee, 2007). The European Union set a policy target that mandates increasing the share of
biofuels from 2% to 5.75% of the total fuel supply (based on energy content) by 2010 (Mabee, 2007).
Strategic planning at the local and national levels alone, however, cannot implement a transition to
sustainable energy use patterns. Only when it is combined with technological progress of biodiesel
production, biodiesel can have sufficient market ability, thereby increasing its percentage of the fuel
market.
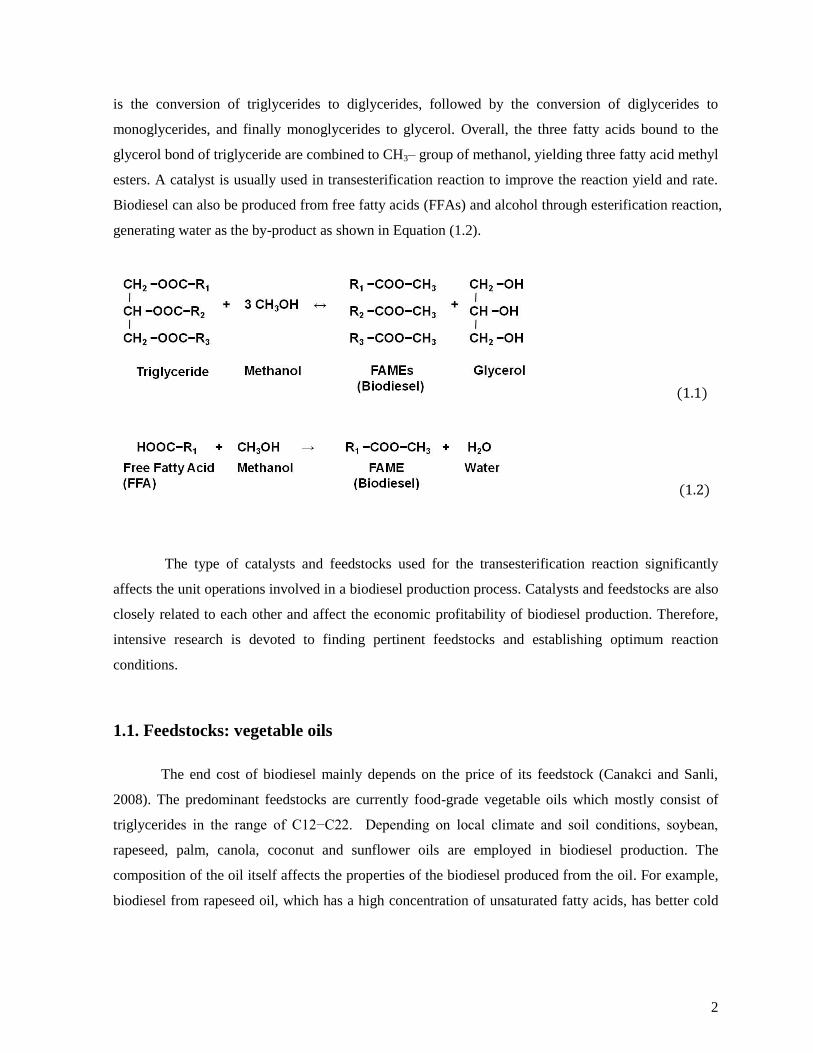
Biodiesel is defined as a mixture of fatty acid alkyl esters which are commonly produced from
triglycerides and alcohol through transesterification reaction shown in Equation (1.1). Methanol is the
most commonly used alcohol for the reaction due to its relatively low cost and high rate of conversion.
Stoichiometrically, a 3:1 molar ratio of methanol to oil is required to convert one triglyceride molecule
into three methyl ester molecules. In practice, this ratio needs to be higher to provide a maximum ester
yield. Transesterification consists of a sequence of three consecutive reversible reactions. The first step
2
is the conversion of triglycerides to diglycerides, followed by the conversion of diglycerides to
monoglycerides, and finally monoglycerides to glycerol. Overall, the three fatty acids bound to the
glycerol bond of triglyceride are combined to CH3‒ group of methanol, yielding three fatty acid methyl
esters. A catalyst is usually used in transesterification reaction to improve the reaction yield and rate.
Biodiesel can also be produced from free fatty acids (FFAs) and alcohol through esterification reaction,
generating water as the by-product as shown in Equation (1.2).
(1.1)
(1.2)
The type of catalysts and feedstocks used for the transesterification reaction significantly
affects the unit operations involved in a biodiesel production process. Catalysts and feedstocks are also
closely related to each other and affect the economic profitability of biodiesel production. Therefore,
intensive research is devoted to finding pertinent feedstocks and establishing optimum reaction
conditions.
1.1. Feedstocks: vegetable oils
The end cost of biodiesel mainly depends on the price of its feedstock (Canakci and Sanli,
2008). The predominant feedstocks are currently food-grade vegetable oils which mostly consist of
triglycerides in the range of C12−C22. Depending on local climate and soil conditions, soybean,
rapeseed, palm, canola, coconut and sunflower oils are employed in biodiesel production. The
composition of the oil itself affects the properties of the biodiesel produced from the oil. For example,
biodiesel from rapeseed oil, which has a high concentration of unsaturated fatty acids, has better cold
3
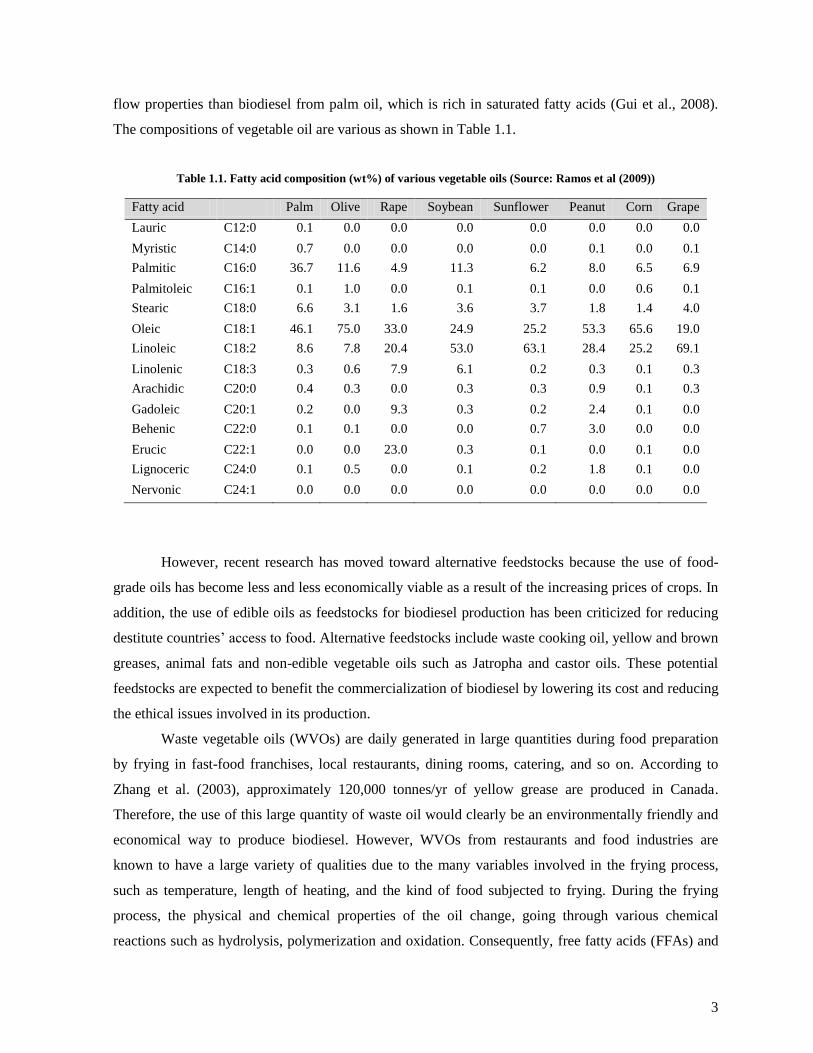
flow properties than biodiesel from palm oil, which is rich in saturated fatty acids (Gui et al., 2008).
The compositions of vegetable oil are various as shown in Table 1.1.
Table 1.1. Fatty acid composition (wt%) of various vegetable oils (Source: Ramos et al (2009))
Fatty acid Palm Olive Rape Soybean Sunflower Peanut Corn Grape
Lauric C12:0 0.1 0.0 0.0 0.0 0.0 0.0 0.0 0.0
Myristic C14:0 0.7 0.0 0.0 0.0 0.0 0.1 0.0 0.1
Palmitic C16:0 36.7 11.6 4.9 11.3 6.2 8.0 6.5 6.9
Palmitoleic C16:1 0.1 1.0 0.0 0.1 0.1 0.0 0.6 0.1
Stearic C18:0 6.6 3.1 1.6 3.6 3.7 1.8 1.4 4.0
Oleic C18:1 46.1 75.0 33.0 24.9 25.2 53.3 65.6 19.0
Linoleic C18:2 8.6 7.8 20.4 53.0 63.1 28.4 25.2 69.1
Linolenic C18:3 0.3 0.6 7.9 6.1 0.2 0.3 0.1 0.3
Arachidic C20:0 0.4 0.3 0.0 0.3 0.3 0.9 0.1 0.3
Gadoleic C20:1 0.2 0.0 9.3 0.3 0.2 2.4 0.1 0.0
Behenic C22:0 0.1 0.1 0.0 0.0 0.7 3.0 0.0 0.0
Erucic C22:1 0.0 0.0 23.0 0.3 0.1 0.0 0.1 0.0
Lignoceric C24:0 0.1 0.5 0.0 0.1 0.2 1.8 0.1 0.0
Nervonic C24:1 0.0 0.0 0.0 0.0 0.0 0.0 0.0 0.0
However, recent research has moved toward alternative feedstocks because the use of food-
grade oils has become less and less economically viable as a result of the increasing prices of crops. In
addition, the use of edible oils as feedstocks for biodiesel production has been criticized for reducing
destitute countries‘ access to food. Alternative feedstocks include waste cooking oil, yellow and brown
greases, animal fats and non-edible vegetable oils such as Jatropha and castor oils. These potential
feedstocks are expected to benefit the commercialization of biodiesel by lowering its cost and reducing
the ethical issues involved in its production.
Waste vegetable oils (WVOs) are daily generated in large quantities during food preparation
by frying in fast-food franchises, local restaurants, dining rooms, catering, and so on. According to
Zhang et al. (2003), approximately 120,000 tonnes/yr of yellow grease are produced in Canada.
Therefore, the use of this large quantity of waste oil would clearly be an environmentally friendly and
economical way to produce biodiesel. However, WVOs from restaurants and food industries are
known to have a large variety of qualities due to the many variables involved in the frying process,
such as temperature, length of heating, and the kind of food subjected to frying. During the frying
process, the physical and chemical properties of the oil change, going through various chemical
reactions such as hydrolysis, polymerization and oxidation. Consequently, free fatty acids (FFAs) and
4
moisture contents increase due to the hydrolysis of triglycerides in the presence of food moisture and
oxidation (Canakci, 2007). As an example, Tyagi and Vasishtha (1996) reported that the FFA level of
fresh soybean oil changed from 0.04% to 1.51% after 70 hrs of frying at 190°C. Increases in viscosity
were also reported due to polymerization, which resulted in the formation of compounds with higher
molecular weight (Canakci, 2007). Therefore, using waste oils, with their variance in properties, as
feedstock for biodiesel production is expected to present technical challenges.
1.2. Catalysis in transesterification
The conversion methods for producing biodiesel are divided into four categories depending on
the catalysts involved in the transesterification reaction. These are the homogeneous alkali-catalyzed,
homogeneous acid-catalyzed, heterogeneous catalyzed and supercritical methods.
1.2.1. Homogeneous alkali-catalyzed transesterification
Biodiesel is conventionally produced in industry through a batch process using homogeneous
alkali catalysts. The most commonly used alkali catalysts are sodium hydroxide (NaOH), potassium
hydroxide (KOH), and sodium methoxide (CH3ONa). Compared to using acid catalysts, alkali-
catalyzed transesterification has several advantages: a faster reaction rate, lower catalyst amount, lower
reaction temperature, and a less corrosive final product (Sanli and Canakci, 2008). The process
typically produces methyl esters with a high yield at a temperature of 60°C and atmospheric pressure
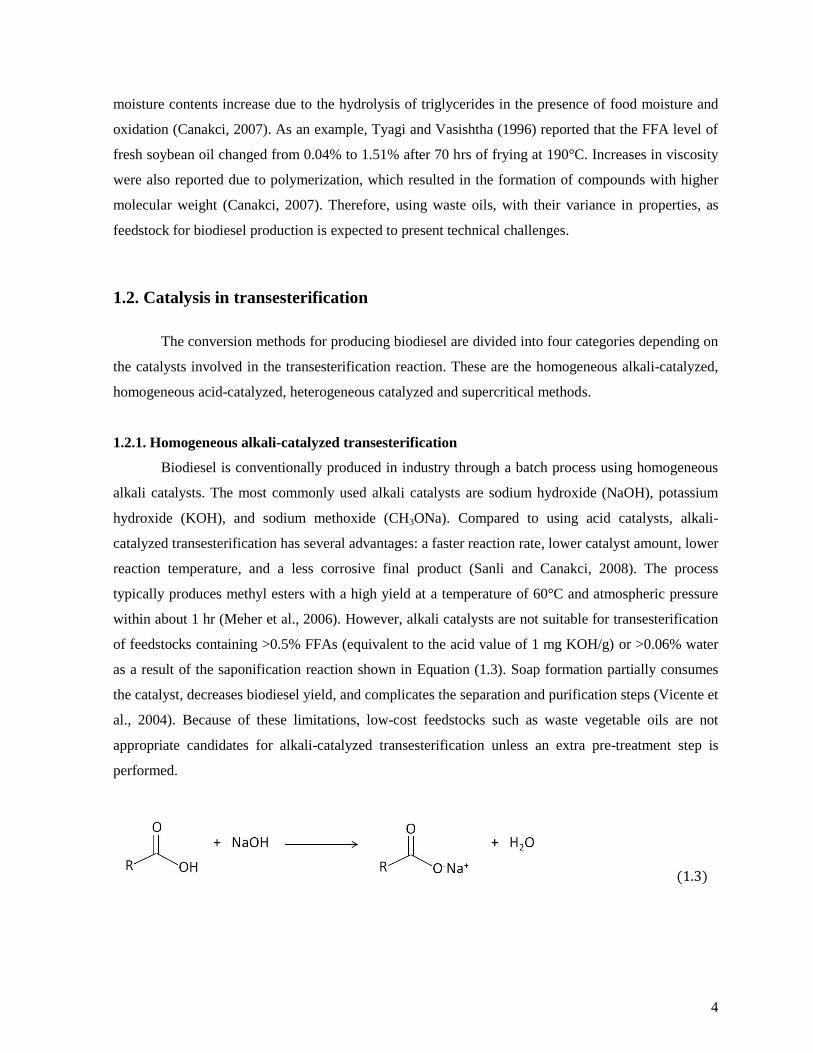
within about 1 hr (Meher et al., 2006). However, alkali catalysts are not suitable for transesterification
of feedstocks containing >0.5% FFAs (equivalent to the acid value of 1 mg KOH/g) or >0.06% water
as a result of the saponification reaction shown in Equation (1.3). Soap formation partially consumes
the catalyst, decreases biodiesel yield, and complicates the separation and purification steps (Vicente et
al., 2004). Because of these limitations, low-cost feedstocks such as waste vegetable oils are not
appropriate candidates for alkali-catalyzed transesterification unless an extra pre-treatment step is
performed.
(1.3)

5
1.2.2. Homogeneous acid-catalyzed transesterification
Sulphuric acid has been the most investigated homogeneous acid catalyst. Apart from that,
HCl, BF3 and H3PO4 may be also used in transesterification reaction. It is reported that a homogeneous
acid-catalyzed reaction is approximately 4000 times slower and achieves a lower yield than a
homogeneous alkali-catalyzed reaction (Srivastava and Prasad, 2000). However, an acid-catalyzed
process is generally believed to be more tolerant of high FFAs levels in the feedstock which makes it
suitable for low-grade oils.
Canakci and Van Gerpen (1999) examined the conversion rate to methyl esters of soybean oil
at different levels of FFAs content, using a 3% sulphuric acid catalyst. They were able to achieve 90%
conversion from soybean containing 5 wt% FFAs. The level of FFAs, however, should not exceed 5%
to achieve ester conversion over 90%. The authors also reported that the transesterification of soybean
oil was affected by as little as 0.1 wt% water and was strongly inhibited by 5 wt% water in the oil.
More recently, Kusdiana and Saka (2004) compared the effect of water content on methyl ester
formation from rapeseed oil via alkali- and acid-catalyzed transesterification reactions. Approximately
70% conversion was achieved in the alkali-catalyzed reaction, whereas the conversion was only 6% in
the acid-catalyzed reaction. The results from both of these studies indicate that an acid-catalyzed
process is very sensitive to moisture in the feedstock oils.
1.2.3. Heterogeneous catalyzed transesterification
A heterogeneous catalyzed process is expected to decrease biodiesel production cost and
reduce environmental impact by simplifying production and purification processes under mild
conditions. Heterogeneous catalysts include solid base catalysts, solid acid catalysts and enzymes.
Recent research is focused on exploring new and sustainable heterogeneous catalysts for
transesterification reaction such as metal oxides, metal complexes, active metals loaded on supports,
zeolite, resins, membranes and lipases (Kansedo et al., 2009).
Kawashima et al. (2008) investigated 13 metal oxides for transesterification reaction at 60°C
with a 6:1 molar ratio of methanol to oil and 10 hr of reaction time. Catalysts with calcium such as
CaZrO3, Ca2Fe2O5, CaMnO3 and CaO-CeO2 were found to have ester conversions of 92%, 92%, 88%,
and 89%, respectively, because of their high base strength.
Research on direct use of a solid acid catalyst for biodiesel production has not been widely
explored because of its limitation of a slow reaction rate and a knowledge gap in fundamental studies
relating to reaction pathways of triglycerides on solid acids (Lam et al., 2010). Several studies are
reported on the use of zirconium oxide (ZrO2) as a solid acid catalyst because of its strong surface
acidity. Jitputti et al. (2006) reported that methyl ester yields from palm kernel oil and crude coconut

6
oil were as high as 90.3% and 86.3%, respectively, using SO42-
/ZrO2. More recently, titanium dioxide
(TiO2) was suggested as a solid acid catalyst. Chen et al. (2007) reported that SO42-/
TiO2 with a
specific surface area of 99.5 m2/g achieved a 90% methyl ester yield from cotton seed oil.
Enzymatic transesterification reactions especially those using lipase have advantages of easy
recovery of product, mild reaction condition, insensitiveness to high FFA oil, and absence of by-
product generation (Lam et al., 2010); however, slow reaction rate, enzyme deactivation and high costs
of enzymes still remain as constraints. Currently, sources of enzymes such as Rhizopus oryzae, Mucor
miehei, Candida antarctica and Pseudomonas cepacia are also under active investigation (Lam et al.,
2010).
1.2.4. Supercritical transesterification
To overcome the problems associated with catalyzed processes, a supercritical process has
been proposed by Saka and Kusdiana (2001). In this process, transesterification reaction proceeds
under high temperature and pressure condition without use of a catalyst. Under these conditions, a
single homogeneous phase of an alcohol and oil mixture is formed, which usually exists as a
heterogeneous phase (two liquid phases) because of immiscibility of the polar and non-polar
components. Because of better miscibility, reaction time is short. Saka and Kusdiana (2001) reported
that transesterification reaction of rapeseed oil at 350°C/45 MPa gave a high ester yield >95% in 4 min
with a methanol to oil molar ratio of 42:1. As a result of high yield and absence of a catalyst, the
separating, washing, and drying processes involved in the conventional process could be eliminated in
a supercritical process. The supercritical biodiesel production scheme is shown in Figure 1.1.

7
(a) conventional (b) supercritical
Figure 1.1. Schematic processes of biodiesel fuel production from rapeseed oil by: (a) conventional; and (b)
supercritical methods (Saka and Kusdiana, 2001)
Another advantage of the supercritical transesterification reaction is that it allows relatively
high content of FFAs and water in feedstocks compared with a catalyzed transesterification reaction.
According to Kusdiana and Saka (2004), almost complete conversion was achieved for rapeseed oil
with oleic acid content of up to 30 wt% in a supercritical reaction. The yield of methyl esters was not
affected by the presence of water up to 36 wt%.
All the reported studies of supercritical transesterification reaction have shown that the
reaction temperature is one of the most critical parameters for determining conversion rate. For
instance, as temperature increases from 210 to 280°C, reaction rate constant increases approximately
7-fold at a pressure of 28.0 MPa and a methanol to oil ratio of 42 (Sawangkeaw et al., 2010). Varma
and Madras (2007) reported the effect of temperature on the conversion of castor and linseed oils. Only
55% conversion of castor oil was obtained at 200°C after 60 min of reaction, whereas nearly complete
conversion was achieved at 350°C after 40 min of reaction. Although a high temperature enhances a
reaction rate, an excessively high temperature (>350°C) is not preferable because of thermal
degradation of methyl esters (Imahara et al., 2008).
Stoichiometrically, a methanol-to-oil molar ratio of 3:1 is required in transesterification, and
increasing the ratio to 50:1 is known to benefit the reaction as a result of increased contact area
8
between methanol and triglycerides (Sawangkeaw et al., 2010). For instance, a high product yield
greater than 95% was obtained after only 4 min reaction time in a methanol to oil molar ratio of 42, but
the yield was lower than 60% at molar ratios of 6 or less.
At present, the supercritical conversion method is in the research stage, using mostly a
laboratory-scale batch or continuous reactor (up to 200 ml). To commercialize the process, there are
still several challenges remaining in research and development. In particular, high temperature and
pressure conditions as well as excessive amounts of methanol that result in high energy consumption in
a supercritical process need to be alleviated. In addition, research on behaviour of the reaction system
in large industrial plants needs to be done.
1.3. Process simulation and economic assessment
One of the best ways to conduct an economic assessment of biodiesel production is to develop
a simulation model of the process. Simulating a complete biodiesel production process allows
investigation of technological feasibility and limitations of the process before economic aspects are
examined. Furthermore, the effect of process parameters such as operating temperatures and pressures
can be studied and optimized. In this way, a reliable economic analysis of a biodiesel production
process can be conducted.
Simulating industrial-scale biodiesel production processes was first attempted by Zhang et al.
(2003) to assess economic profitability. Four different configurations of a biodiesel plant were
developed using Hysys process simulator: a homogeneous alkali-catalyzed process using pure
vegetable oil, a homogeneous alkali-catalyzed process with pre-treatment of waste vegetable oil, a
homogeneous acid-catalyzed process using waste vegetable oil and a homogeneous acid-catalyzed
process using hexane extraction to purify the final product. Subsequent economic assessments of the
four processes showed that the acid-catalyzed process without hexane extraction was the most
promising. West et al. (2008) compared homogeneous alkali-catalyzed, homogeneous acid-catalyzed,
heterogeneous catalyzed (SnO) and supercritical biodiesel production processes. The results revealed
that the heterogeneous process was the most economically feasible, followed by the supercritical
process; however, the conversion used by West et al. (2008) in the heterogeneous process was higher
than the experimental value (92.6%) provided by Abreu et al. (2005), to which the authors referred,
which might have changed the economic analysis considerably. In addition, studies regarding the
effects of FFAs and water contents in feedstock have not been conducted for the heterogeneous acid
9
catalyst, raising a question whether the technology can be practically implemented in biodiesel
production using low-cost feedstocks such as waste vegetable oil.
1.4. Thesis objectives
First, a supercritical process simulation model is developed. To improve the accuracy of the
simulation, a better understanding of the model compound of vegetable oil, triolein, is required.
Triolein has been used as a model compound in many previous studies, but some of its chemical
properties are not well known. In particular, the normal boiling point of triolein has been estimated by
a few researchers, but the estimated values are not consistent with each other. Moreover, some
estimated triolein boiling points are considerably different from the ones built into process modeling
programs. The correct value of the normal boiling point is extremely important, since many missing
properties are estimated from it. In this thesis, using thermogravimetric analysis (TGA), the normal
boiling point will be measured and compared with values from the literatures and process simulators.
Second, the technological feasibility of a supercritical biodiesel production process is
investigated. By replacing the normal boiling point in Hysys with the one from TGA measurements, a
supercritical process simulation with improved accuracy is developed. In addition, to decrease the high
energy consumption problem of a supercritical process, another supercritical process model using less
energy is developed. The two supercritical processes are then compared with conventional
homogenous alkali-catalyzed processes in terms of material flows, energy flows, and number and type
of unit operations.
Third, the economic feasibility of supercritical processes is compared with alkali-catalyzed
processes. This is done using an Aspen Icarus Process Evaluator (IPE) whose practicability has been
confirmed by engineering design and construction firms. Compared with previous researches using
Lang‘s factor method or Guthrie‘s bare-module concept, the economic assessment conducted in this
study is expected to provide more reliable results. Moreover, intensive sensitivity analysis will be
conducted on the developed process simulations.
Finally, this thesis investigates laboratory-scale biodiesel production from waste cooking oil
using supercritical methods. Compared with an alkali-catalyzed method, a supercritical method is seen
favourable in economical point of view because of its ability to use low-cost feedstocks. The effect of
three parameters, reaction time, reaction temperatures and weight ratios of methanol to waste canola
oil, will be investigated.

10
Bibliography
Abreu, F.R., Alves, M.B., Macêdo, C.C.S., Zara, L.F. and Suarez, P.A.Z., 2005. New multi-phase
catalytic systems based on tin compounds active for vegetable oil transesterificaton reaction.
Journal of Molecular Catalysis A: Chemical, 227(1-2), 263-267.
Canakci, M. and Sanli, H., 2008. Biodiesel production from various feedstocks and their effects on the
fuel properties. Journal of Industrial Microbiology & Biotechnology, 35(5), 431-441.
Canakci, M. and Van Gerpen, J., 1999. Biodiesel production via acid catalysis. Transactions of the
ASAE-American Society of Agricultural Engineers, 42(5), 1203-1210.
Canakci, M., 2007. The potential of restaurant waste lipids as biodiesel feedstocks. Bioresource
Technology, 98(1), 183-190.
Chen, H., Baoxiang, P., Dezheng, W. and Jinfu, W., 2007. Biodiesel production by the
transesterification of cottonseed oil by solid acid catalysts. Frontiers of Chemical Engineering
in China, 1(1), 11-15.
Gui, M., Lee, K. and Bhatia, S., 2008. Feasibility of edible oil vs. non-edible oil vs. waste edible oil as
biodiesel feedstock. Energy, 33(11), 1646-1653.
Imahara, H., Minami, E., Hari, S. and Saka, S., 2008. Thermal stability of biodiesel in supercritical
methanol. Fuel, 87(1), 1-6.
Jitputti, J., Kitiyanan, B., Rangsunvigit, P., Bunyakiat, K., Attanatho, L. and Jenvanitpanjakul, P., 2006.
Transesterification of crude palm kernel oil and crude coconut oil by different solid catalysts.
Chemical Engineering Journal, 116(1), 61-66.
Kansedo, J., Lee, K.T. and Bhatia, S., 2009. Biodiesel production from palm oil via heterogeneous
transesterification. Biomass and Bioenergy, 33(2), 271-276.
Kawashima, A., Matsubara, K. and Honda, K., 2008. Development of heterogeneous base catalysts for
biodiesel production. Bioresource Technology, 99(9), 3439-3443.
Kusdiana, D. and Saka, S., 2004. Effects of water on biodiesel fuel production by supercritical
methanol treatment. Bioresource Technology, 91(3), 289-295.
Lam, M.K., Lee, K.T. and Mohamed, A.R., 2010. Homogeneous, heterogeneous and enzymatic
catalysis for transesterification of high free fatty acid oil (waste cooking oil) to biodiesel: A
review. Biotechnology Advances, 28(4), 500-518.
Lapuerta, M., Armas, O. and Rodríguez-Fernández, J., 2008. Effect of biodiesel fuels on diesel engine
emissions. Progress in Energy and Combustion Science, 34(2), 198-223.
Mabee, W.E., 2007. Policy options to support biofuel production. Advances in Biochemical
Engineering/Biotechnology, 108, 329-357.
Meher, L., Dharmagadda, V.S. and Naik, S., 2006. Optimization of alkali-catalyzed transesterification
of Pongamia pinnata oil for production of biodiesel. Bioresource Technology, 97(12), 1392-

11
1397.
Omer, A.M., 2008. Energy, environment and sustainable development. Renewable and Sustainable
Energy Reviews, 12(9), 2265-2300.
Ramos, M.J., Fernández, C., Casas, A., Rodríguez, L. and Pérez, Á., 2009. Influence of fatty acid
composition of raw materials on biodiesel properties. Bioresource Technology, 100(1), 261-
268.
Saka, S. and Kusdiana, D., 2001. Biodiesel fuel from rapeseed oil as prepared in supercritical methanol.
Fuel, 80(2), 225-231.
Sanli, H. and Canakci, M., 2008. Effects of different alcohol and catalyst usage on biodiesel
production from different vegetable oils. Energy & Fuels, 22(4), 2713-2719.
Sawangkeaw, R., Bunyakiat, K. and Ngamprasertsih, S., 2010. A review of laboratory-scale research
on lipid conversion to biodiesel with supercritical methanol (2001‒2009). Journal of
supercritical fluids, doi:10.1016/j.supflu.2010.06.008.
Srivastava, A. and Prasad, R., 2000. Triglycerides-based diesel fuels. Renewable and Sustainable
Energy Reviews, 4(2), 111-133.
Tyagi, V. and Vasishtha, A., 1996. Changes in the characteristics and composition of oils during deep-
fat frying. Journal of the American Oil Chemists' Society, 73(4), 499-506.
Varma, M.N. and Madras, G., 2007. Synthesis of biodiesel from castor oil and linseed oil in
supercritical fluids. Industrial & Engineering Chemistry Research, 46(1), 1-6.
Vicente, G., Martínez, M. and Aracil, J., 2004. Integrated biodiesel production: a comparison of
different homogeneous catalysts systems. Bioresource Technology, 92(3), 297-305.
West, A.H., Posarac, D. and Ellis, N., 2008. Assessment of four biodiesel production processes using
HYSYS. Plant. Bioresource Technology, 99(14), 6587-6601.
Zhang, Y., Dubè, M.A., McLean, D.D. and Kates, M., 2003. Biodiesel production from waste cooking
oil: 1. Process design and technological assessment. Bioresource Technology, 89(1), 1-16.
12
2. Simulation of four continuous biodiesel production processes1
2.1. Introduction
Biodiesel has drawn attention as an alternative energy source, especially as a substitute to
petroleum-derived diesel. Feedstocks for biodiesel are mainly vegetable oils, yellow or brown greases,
and animal fats. Biodiesel is produced from transesterification of triglycerides in the feedstocks.
Depending on the type of feedstock, the compositions of fatty acids that compose triglycerides are
varied.
One of the important parameters in the process modeling of transesterification is to select a
model compound to represent the triglyceride which contains various compositions of fatty acids.
Triolein has been selected as a model compound of vegetable oils in many previous studies (Zhang et
al., 2003; Kasteren and Nisworo, 2007; West et al., 2008; Glisic et al., 2009; Lim et al., 2009). Triolein
is composed of three oleic acids with a glycerol bond, and oleic acid is the major fatty acid in many
types of vegetable oils. It composes around 40-80% of fatty acids in rapeseed, canola, olive, palm and
peanut oils (Pinnarat and Savage, 2008).
Despite the significance, the chemical properties of triolein have not been thoroughly
understood. The reported normal boiling point and critical properties of triolein vary significantly by
different estimation methods and process modeling programs, as shown in Table 2.1. The use of
comprehensive properties of the major component will lead to more accurate and reliable simulation
results in process modeling.
Among the properties of triolein, the normal boiling point is of interest in predicting other
properties such as a critical temperature and pressure. Goodrum and Geller (2002) applied
thermogravimetric analysis (TGA) method to measure the normal boiling point of medium- and long-
chain triglycerides, namely trilaurin (C12:0), trimyristin (C14:0), tripalmitin (C16:0) and tristearin
(C18:0). The results were in good accordance with the Clausius-Clapeyron model and with previously
published data at low pressures (Perry et al., 1949). On the other hand, Ceriani and Meirelles (2004)
proposed a group contribution method to estimate vapour pressures of fatty compounds. The
estimation model is a function of temperature with a few parameters to take account for various
molecular groups. The parameters were obtained by regressions of more than 1300 experimental
values on vapour pressures of fatty compounds (saturated and unsaturated fatty acids, fatty esters, fatty
alcohols, monoglycerides and triglycerides) gathered from published papers.
1 A version of this chapter is in preparation for submission for publication. Lee, S., Posarac, D. and Ellis, N.
(2010). Simulation of four continuous biodiesel production processes.
13
In the present work, the normal boiling point of triolein was measured using TGA method and
compared with those estimated by the group contribution method. The boiling point of triolein
obtained from TGA was further applied to UNIFAC structure in a process simulator, Hysys v.2006.5,
to estimate the best properties of triolein.
Table 2.1. Comparison of available properties of triolein
Hysys Aspen VMGsim Tang et al.
(2006)
Glisic et al.
(2007)
Weber et al.
(1999)
Tb (°C) 606.8 846.85 541.7 879.9a
- -
Tc (°C) 680.9 1367 681 954.1a 704.73
c 673.92
d
Pc (kPa) 360.2 470 360.2 360.2a
334c 468.20
d
Vc (m3/kmol) 3.09 3.09 3.09 - - -
ω 1.686 - 1.69 1.6862b 1.978
c 1.686
a Estimated by the method of Dohrn and Brunner (1991, 1994)
b Estimated according to Han and Peng (1993)
c Estimated by the method of Constantinou and Gani (1994, 1995)
d Estimated by the method of Ambrose (1978) and Reid (1987)
2.2. Thermogravimetric analysis of triolein
2.2.1. Method
Triolein (Sigma grade, ≥99%) and tripalmitin (Sigma grade, ≥99%) were purchased from
Sigma-Aldrich. 20μl of hermetic alumina pans and hermetic lids with a laser-drilled pin hole were
purchased from TA Instruments. A triolein sample of 4.5 mg (±0.5 mg) was placed at the centre of an
alumina pan and 1 mg (±0.2 mg) of alumina powder was added to assist in achieving isothermal
boiling. The alumina pan was sealed with a lid using a sample encapsulation press from TA
Instruments. The pan was completely sealed except a 0.050−0.100 mm diameter laser-drilled hole at
the centre of the lid. The hole permits pressure balance between the sample and the environmental
pressure of 1 atm. The rate of diffusion out of the pan is regarded less than the vapourization rate
inside the pan due to the very small size of the hole. In the same manner, a 3.5 mg (±1 mg) of
tripalmitin sample with 1 mg (±0.2 mg) of alumina powder was prepared.
TA Instruments Model TGA/DSC Q600 was used for the thermogravimetric analysis. At
atmospheric pressure, a flow of 50 ml/min of nitrogen gas was used. The temperature of the furnace
was programmed to ramp at 10°C/min from room temperature to 550°C and to be isothermal at 550°C
14
for 5 min. To ensure the consistency of the results, five and three replicate runs were conducted for
triolein and tripalmitin, respectively.
Universal Analysis 2000 version 4.5a, supplied by TA Instruments, was used as software to
analyze the boiling point of the samples. The boiling point was determined as an intercept of the initial
isothermal base line and the tangent of the isothermal weight loss slope as shown in Figure 2.1. The
tangent line was drawn in automatic mode based on the two onset points designated at the start point
(20°C) of initial baseline and end point (550°C) of the secondary baseline.
2.2.2. Results and discussion
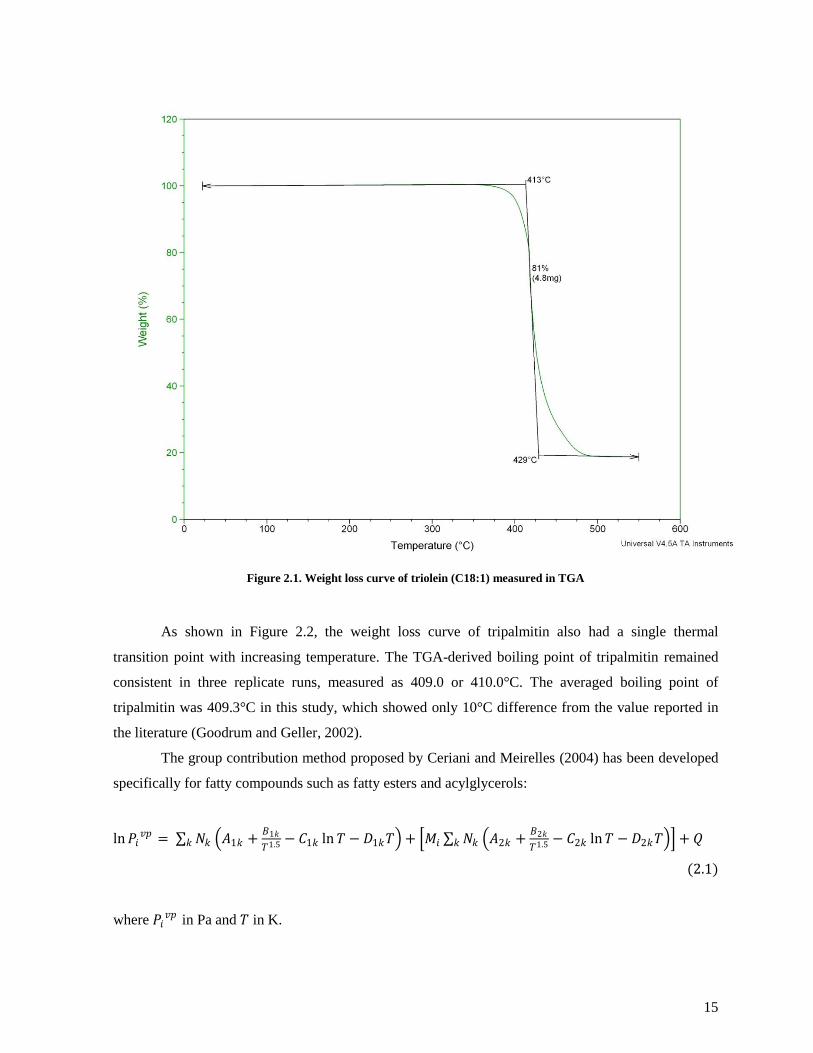
Figure 2.1 shows a weight loss curve of a sample consisted of 4.91 mg of triolein and 1.08 mg
of alumina powder. The sample weight remained constant until the temperature reached at 370°C, and
then rapidly decreased after 400°C. After the evaporation of triolein, a second constant line appeared at
the 20% of the initial sample weight, indicating that the alumina powder added to triolein only
remained in the pan. Five replicate runs all showed the same single rapid and definite weight-loss
curve without any secondary transition. This fact indicates that there was not any thermal
decomposition during heating since the weight curve would have had multiple transition points if the
analyzed material were broken into small molecules. The average normal boiling point obtained from
the replicate runs was 412.8°C with a standard deviation of 1.08°C. Except for one run where the
boiling point was measured at 410.0°C, the others gave the boiling point at 413.0 or 414.0°C.
Therefore, the final boiling point of triolein was determined as 412.8°C, which was the mean value of
the experimental results.
15
Figure 2.1. Weight loss curve of triolein (C18:1) measured in TGA
As shown in Figure 2.2, the weight loss curve of tripalmitin also had a single thermal
transition point with increasing temperature. The TGA-derived boiling point of tripalmitin remained
consistent in three replicate runs, measured as 409.0 or 410.0°C. The averaged boiling point of
tripalmitin was 409.3°C in this study, which showed only 10°C difference from the value reported in
the literature (Goodrum and Geller, 2002).
The group contribution method proposed by Ceriani and Meirelles (2004) has been developed
specifically for fatty compounds such as fatty esters and acylglycerols:
ln 𝑃𝑖𝑣𝑝 = 𝑁𝑘 𝐴1𝑘 +
𝐵1𝑘
𝑇1.5 − 𝐶1𝑘 ln 𝑇 − 𝐷1𝑘𝑇 + 𝑀𝑖 𝑁𝑘 𝐴2𝑘 +𝐵2𝑘
𝑇1.5 − 𝐶2𝑘 ln 𝑇 − 𝐷2𝑘𝑇 𝑘 𝑘 + 𝑄
(2.1)
where 𝑃𝑖𝑣𝑝 in Pa and 𝑇 in K.

16
The vapour pressure is estimated based on molecular structures and functional groups of the
compounds of interest along with several parameters (A1k , B1k , C1k , D1k , A2k , B2k , C2k and D2k )
obtained from the regression of experimental data. The correction term, Q, accounts for isomers and
the effect of functional groups. Since triolein and tripalmitin belong to acylglycerols, this term is zero.
The parameters for triolein and tripalmitin are shown in Table 2.2. The calculated normal boiling
points of triolein and tripalmitin are shown in Table 2.3.
Figure 2.2. Weight loss curve of tripalmitin (C16:0) measured in TGA

17
Table 2.2. Parameters for Equation (2.1) (Source: Ceriani and Meirelles (2004))
number of group
Group triolein tripalmitin 𝑨𝟏𝒌 𝑩𝟏𝒌 𝑪𝟏𝒌 𝑫𝟏𝒌 𝑨𝟐𝒌 𝑩𝟐𝒌 𝑪𝟐𝒌 𝑫𝟐𝒌
CH3 3 3 -117.5 7232.3 -22.7939 0.0361 0.00338 -63.3963 -0.00106 0.000015
CH2 42 42 8.4816 -10987.8 1.4067 -0.00167 -0.00091 6.7157 0.000041 -0.00000126
CH=cis 6 0 2.4317 1410.3 0.7868 -0.004 0 0 0 0
COO 3 3 7.116 49152.6 2.337 -0.00848 0.00279 10.0396 -0.00034 0.00000295
CH2-
CH-
CH2
1 1 688.3 -349293 122.5 -0.1814 -0.00145 0 0 0
Table 2.3. Comparison of boiling point of tripalmitin and triolein obtained from TGA, DSC and group contribution
method
Method TGA (°C)
(this study)
TGA (°C)
(Goodrum and
Geller, 2002)
DSC (°C)
(Goodrum and
Geller, 2002)
Group contribution (°C)
(Ceriani and Meirelles, 2004)
Tripalmitin (C16:0) 409.3 399.08 401.88 449.6
Triolein (C18:1) 412.8 N/A N/A 432.2
The boiling points of triolein and tripalmitin estimated by the group contribution method were
approximately 30−40°C higher than the experimental results. The main reason for the differences
appears to be generated from the characteristic of the group contribution method itself. Since the group
contribution method was developed to be used for a broad range of fatty compounds, obtaining the
boiling point of a particular compound may slightly deviate from the true value. Furthermore, the
parameters in Equation (2.1) were obtained from the regression of the experimental data in literatures,
which are very rare in case of the boiling point of triglycerides at atmospheric pressure. However,
compared to the values listed in Table 2.1, the group contribution method estimated the boiling point
much closer to the experimental results in this study.
The TGA boiling point obtained in this study was used along with the molar mass (885.4
g/mol), ideal liquid density (916 kg/m3) and UNIFAC structure to estimate critical and thermodynamic
properties of triolein. Temperature dependent properties such as vapour enthalpy, vapour pressure and
Gibbs free energy were simultaneously estimated. This triolein was named TGA Triolein to make
distinction from the triolein built in Hysys component library, named Hysys Triolein. There were
several changes observed between TGA and Hysys Triolein as shown in Table 2.4. The major
differences were specific heat capacity, mass density and viscosity.
18
Table 2.4. Comparison of the properties of Hysys triolein, TGA triolein and canola oil
Specific heat capacity
[kJ/(kg·°C)]
Mass density
[kg/m3]
Viscosity
[cP]
Hysys Trioleina
0.131 1571 1.765
TGA Trioleina 1.58 909.8 33.19
Canola oil 1.67-1.97 920 57
a Properties at 25°C and 1 atm
As shown in Table 2.4, the specific heat capacity and viscosity of TGA Triolein is 12 and 19
times, respectively, higher than Hysys Triolein. The mass density of TGA Triolein was 58% of that of
Hysys Triolein. Overall, the properties of TGA Triolein were found to be much closer to the properties
of real canola oil. Especially, the mass density of triolein was much improved as considering common
knowledge that oil has less density than water (approximately 1000 kg/m3). These indicate that
consequent improvements can be achieved in a process simulation by replacing Hysys Triolein with
TGA Triolein. As an example, the difference in specific heat capacity of triolein would affect the
energy consumptions in a supercritical process where the raw materials need to be heated up to high
temperatures (>280°C). In addition, due to the existence of unreacted triolein, the performance of the
biodiesel purification steps could also be altered.
2.3. Process simulation
The common way to produce biodiesel is via transesterification reaction using vegetable oil
and alcohol. There exist several processes depending on the type of catalysts being used: homogeneous
alkali-catalyzed; homogeneous acid-catalyzed; heterogeneous catalyzed; and supercritical processes.
Among those, a homogeneous alkali-catalyzed process using NaOH or KOH is well understood and
applied in most of industrial biodiesel plants today. On the other hand, a supercritical process is a new
technique that is initially proposed by Saka and Kusdiana (2001). The process does not require any
catalyst because the transesterification reaction is fast and gives a high yield of biodiesel at
supercritical conditions of methanol (>8 MPa and >239.45°C) by achieving better miscibility between
methanol and oil.
Each process has both advantages and disadvantages. An alkali-catalyzed process requires
moderate reaction conditions (1 atm and 60°C) and is a proven process that is being used in the
biodiesel industries. However, it has a limitation on utilizing low cost feedstocks such as waste
vegetable oils or animal fats due to their relatively high content of free fatty acids (FFA). FFAs are
known to make difficulties in purifying biodiesel product and to decrease biodiesel yield due to
19
saponification reaction. One of the ways to use those feedstocks is to pre-treat them through
esterification using acid-catalysts. A supercritical process, on the other hand, is not affected by the
presence of FFAs and water in the feedstocks (Kusdiana and Saka, 2004). A simpler biodiesel
purification step is another advantage of the supercritical process. However, its high energy
consumption due to high temperature and pressure conditions is a significant disadvantage. In addition,
the safety concern arising from the intense operating conditions could be an issue, and further research
on scaling up a laboratory-scale production unit still remains.
In this study, simulations of four biodiesel production processes were developed using Hysys.
The first process, named Alkali-FVO, is an alkali-catalyzed process using fresh canola oil as the
feedstock. The second process, named Alkali-WVO, is an alkali-catalyzed process with an acid-
catalyzed pre-treatment step of waste canola oil. The process flowsheet and operating conditions for
Alkali-FVO and Alkali-WVO processes referred to those reported by Zhang et al. (2003) and West et
al. (2008). The third process, named SC-WVO, is a supercritical process using waste canola oil. The
last process, named SC-LowE, is a supercritical process with slight modifications of the process
flowsheet of SC-WVO process to lower energy consumption.
TGA Triolein (C57H98O6) developed in Section 2.2 was used as a model compound to
represent canola oil. Fresh canola oil was modeled as 100% TGA Triolein, and waste canola oil was
modeled as a mixture of 94 wt% TGA Triolein and 6 wt% oleic acid (C18H34O2). Consequently, methyl
oleate (C19H36O2) was considered as biodiesel.
Non-random two liquid (NRTL) model was selected as a property package for Alkali-FVO
and Alkali-WVO processes due to the presence of polar compounds. Some interaction parameter
coefficients between components were not available in Hysys library. These parameters were
estimated using UNIFAC LLE model. Since an activity coefficient based model such as NRTL is not
recommended to be used at pressures greater than 1000 kPa, Peng-Robinson equation of state (EOS)
was used in process streams and unit operators wherever having pressures >1000 kPa.
The annual capacity of all the four processes was 40000 tonnes/year of biodiesel production
based on 8000 operating hours per year.
2.3.1. Alkali-FVO process
A flow diagram and properties of main streams of Alkali-FVO process are shown in Figure 2.3.
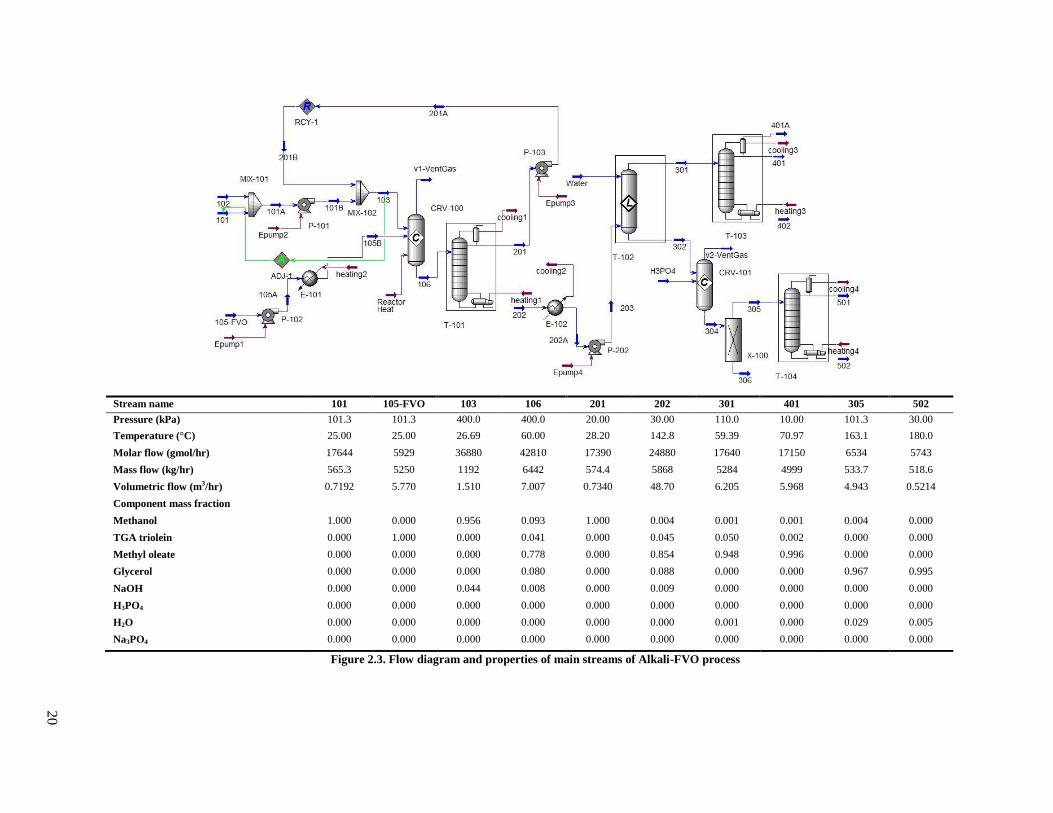
20
Stream name 101 105-FVO 103 106 201 202 301 401 305 502
Pressure (kPa) 101.3 101.3 400.0 400.0 20.00 30.00 110.0 10.00 101.3 30.00
Temperature (°C) 25.00 25.00 26.69 60.00 28.20 142.8 59.39 70.97 163.1 180.0
Molar flow (gmol/hr) 17644 5929 36880 42810 17390 24880 17640 17150 6534 5743
Mass flow (kg/hr) 565.3 5250 1192 6442 574.4 5868 5284 4999 533.7 518.6
Volumetric flow (m3/hr) 0.7192 5.770 1.510 7.007 0.7340 48.70 6.205 5.968 4.943 0.5214
Component mass fraction
Methanol 1.000 0.000 0.956 0.093 1.000 0.004 0.001 0.001 0.004 0.000
TGA triolein 0.000 1.000 0.000 0.041 0.000 0.045 0.050 0.002 0.000 0.000
Methyl oleate 0.000 0.000 0.000 0.778 0.000 0.854 0.948 0.996 0.000 0.000
Glycerol 0.000 0.000 0.000 0.080 0.000 0.088 0.000 0.000 0.967 0.995
NaOH 0.000 0.000 0.044 0.008 0.000 0.009 0.000 0.000 0.000 0.000
H3PO4 0.000 0.000 0.000 0.000 0.000 0.000 0.000 0.000 0.000 0.000
H2O 0.000 0.000 0.000 0.000 0.000 0.000 0.001 0.000 0.029 0.005
Na3PO4 0.000 0.000 0.000 0.000 0.000 0.000 0.000 0.000 0.000 0.000
Figure 2.3. Flow diagram and properties of main streams of Alkali-FVO process
21
Transesterification of fresh canola oil
The conditions for transesterification reaction were set at 400 kPa and 60°C. A conversion
reactor, CRV-100, was used with the specified triolein conversion of 95%. 5250 kg/hr (5929 mol/hr)
of fresh canola oil, 105-FVO, was pumped to 400 kPa by P-102 and heated to 60°C by E-101 before
entering the reactor. Sodium hydroxide (NaOH), stream 102, was chosen as the alkali-catalyst. The
amount of NaOH was 1 wt% of the canola oil and it was mixed with methanol before the reaction. The
necessary amount of methanol was considered to be 6:1 molar ratio of methanol to oil and the reaction
time was 1 hr (Meher et al., 2006). Since approximately 50% of the required amount of methanol was
provided from the recycled stream from T-101, only 565.3 kg/hr (17640 mol/hr) of fresh methanol
(stream 101) was fed to the process.
Methanol recovery
Due to the excess amount of methanol provided for the transesterification reaction, the product
stream from CRV-100 contains a large amount of methanol that did not participate in the reaction. This
methanol is recovered by a multi-stage distillation column and recycled back to the reactor. In the
process simulation, 96% of methanol in stream 106 was recovered by using 6 theoretical stages in the
distillation column. The pressures in the condenser and reboiler were set at 20.0 and 30.0 kPa,
respectively, to keep the operating temperature below 200°C to avoid decompositions of methyl oleate
and glycerol. As a result, the temperatures in the condenser and reboiler were 28.20 and 142.8°C,
respectively.
Water washing
In the liquid-liquid extraction column, T-102, the bottom product stream from T-101 was
washed with water at 110 kPa to get rid of glycerol and NaOH. The number of stages required for this
separation was 4. The simulation results showed that glycerol was almost completely separated from
methyl oleate using 50.0 kg/hr of water. Stream 203 also contained unreacted triolein from
transesterification reaction, and 99.7% of the triolein was separated into stream 301. Since the triolein
mass faction in stream 301 was 0.0495, a distillation column, T-103, was used for the final biodiesel
purification.
Neutralization and settler
Stream 302 from the liquid-liquid extraction column contains glycerol along with NaOH,
which needs to be neutralized before glycerol purification. Stoichiometric amount of phosphoric acid

22
(H3PO4) was used to neutralize 52.5 kg/hr of NaOH. Water and trisodium phosphate (Na3PO4) were
generated as reaction products. Na3PO4 was then separated as a precipitate in a decanter (X-100).
Biodiesel purification
Column T-103 was designed for separating biodiesel from unreacted triolein, methanol and
water. The simulated column had 6 theoretical stages in total, and the reflux ratio was 1.10. The
pressures at the condenser and reboiler were 10.0 and 15.0 kPa, respectively. As a result, 96.4% of
triolein was separated out in the bottom product stream. Stream 401 contained 99.6 wt% methyl oleate,
0.19 wt% triolein, 0.13 wt% methanol and 0.05 wt% water, which satisfied both European (EN14214)
and American (ASTM D6751) biodiesel standards.
Glycerol purification
Glycerol was purified in the column T-102 to eliminate water and methanol contained in the
feed stream. The required number of theoretical stages was 5, and the reflux ratio was 2.0. The
pressures in the condenser and reboiler were set at 20.0 and 30.0 kPa, respectively, to maintain
moderate operating temperature in the column to avoid decomposition of glycerol. The corresponding
temperatures were 50.96 and 180.0°C in the condenser and reboiler, respectively. As a result, glycerol
with high purity (99.5 wt%) was obtained as the bottom product of the distillation column.
2.3.2. Alkali-WVO process
Alkali-WVO process has additional pre-treatment steps before transesterification of waste
vegetable oil with methanol. The pre-treatment process aims to decrease high FFA contents in WVO
by esterification reaction in the presence of an acid catalyst. With the reduced amount of FFAs,
undesirable soap formation by the reaction between FFAs and alkali catalysts is minimized. A flow
diagram of the pre-treatment step is shown in Figure 2.4a.
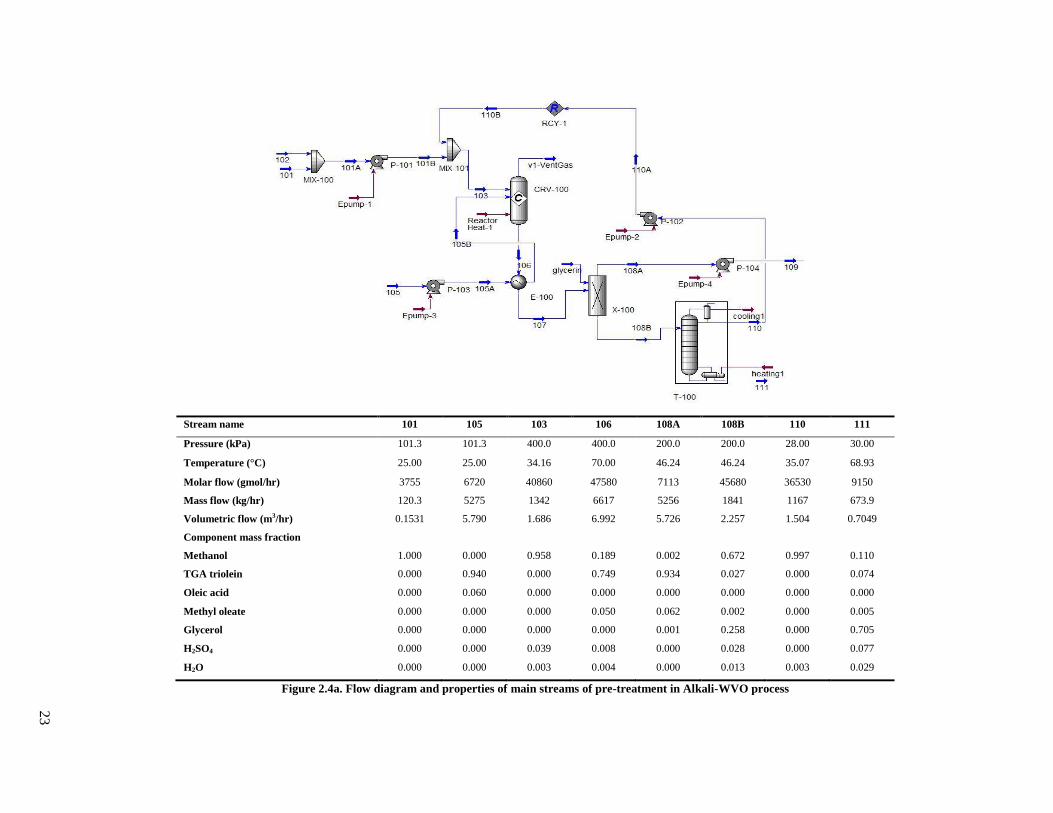
23
Stream name 101 105 103 106 108A 108B 110 111
Pressure (kPa) 101.3 101.3 400.0 400.0 200.0 200.0 28.00 30.00
Temperature (°C) 25.00 25.00 34.16 70.00 46.24 46.24 35.07 68.93
Molar flow (gmol/hr) 3755 6720 40860 47580 7113 45680 36530 9150
Mass flow (kg/hr) 120.3 5275 1342 6617 5256 1841 1167 673.9
Volumetric flow (m3/hr) 0.1531 5.790 1.686 6.992 5.726 2.257 1.504 0.7049
Component mass fraction
Methanol 1.000 0.000 0.958 0.189 0.002 0.672 0.997 0.110
TGA triolein 0.000 0.940 0.000 0.749 0.934 0.027 0.000 0.074
Oleic acid 0.000 0.060 0.000 0.000 0.000 0.000 0.000 0.000
Methyl oleate 0.000 0.000 0.000 0.050 0.062 0.002 0.000 0.005
Glycerol 0.000 0.000 0.000 0.000 0.001 0.258 0.000 0.705
H2SO4 0.000 0.000 0.039 0.008 0.000 0.028 0.000 0.077
H2O 0.000 0.000 0.003 0.004 0.000 0.013 0.003 0.029
Figure 2.4a. Flow diagram and properties of main streams of pre-treatment in Alkali-WVO process
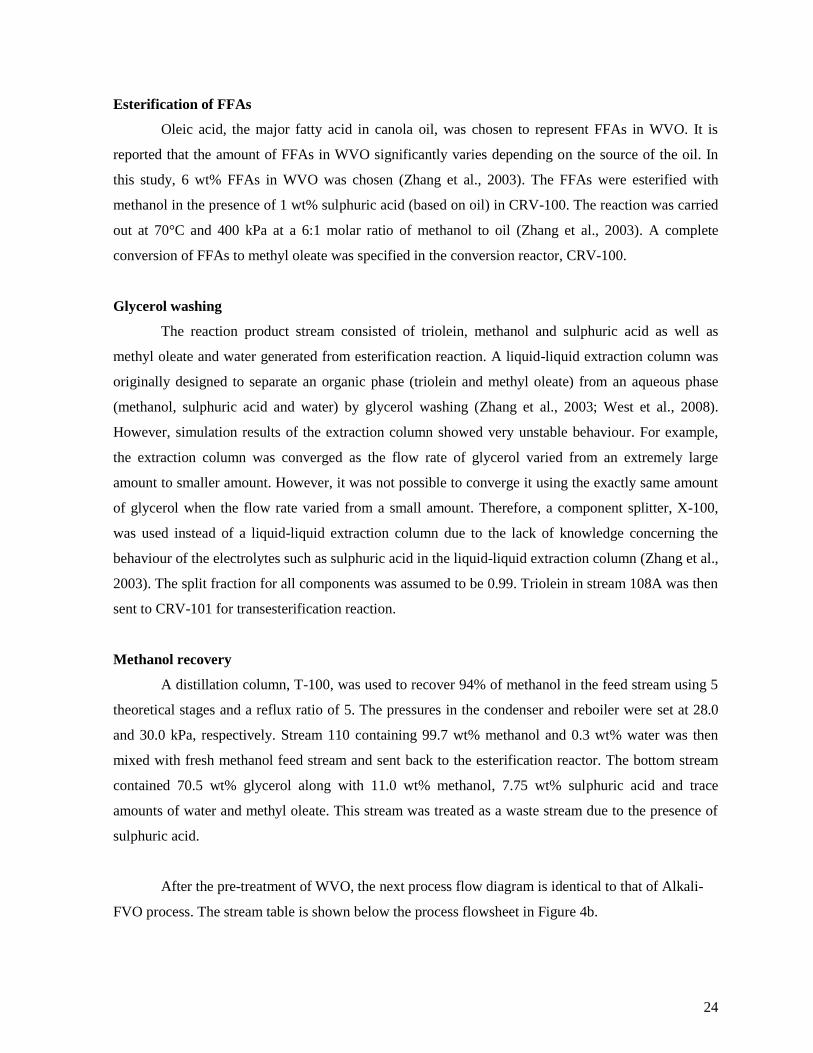
24
Esterification of FFAs
Oleic acid, the major fatty acid in canola oil, was chosen to represent FFAs in WVO. It is
reported that the amount of FFAs in WVO significantly varies depending on the source of the oil. In
this study, 6 wt% FFAs in WVO was chosen (Zhang et al., 2003). The FFAs were esterified with
methanol in the presence of 1 wt% sulphuric acid (based on oil) in CRV-100. The reaction was carried
out at 70°C and 400 kPa at a 6:1 molar ratio of methanol to oil (Zhang et al., 2003). A complete
conversion of FFAs to methyl oleate was specified in the conversion reactor, CRV-100.
Glycerol washing
The reaction product stream consisted of triolein, methanol and sulphuric acid as well as
methyl oleate and water generated from esterification reaction. A liquid-liquid extraction column was
originally designed to separate an organic phase (triolein and methyl oleate) from an aqueous phase
(methanol, sulphuric acid and water) by glycerol washing (Zhang et al., 2003; West et al., 2008).
However, simulation results of the extraction column showed very unstable behaviour. For example,
the extraction column was converged as the flow rate of glycerol varied from an extremely large
amount to smaller amount. However, it was not possible to converge it using the exactly same amount
of glycerol when the flow rate varied from a small amount. Therefore, a component splitter, X-100,
was used instead of a liquid-liquid extraction column due to the lack of knowledge concerning the
behaviour of the electrolytes such as sulphuric acid in the liquid-liquid extraction column (Zhang et al.,
2003). The split fraction for all components was assumed to be 0.99. Triolein in stream 108A was then
sent to CRV-101 for transesterification reaction.
Methanol recovery
A distillation column, T-100, was used to recover 94% of methanol in the feed stream using 5
theoretical stages and a reflux ratio of 5. The pressures in the condenser and reboiler were set at 28.0
and 30.0 kPa, respectively. Stream 110 containing 99.7 wt% methanol and 0.3 wt% water was then
mixed with fresh methanol feed stream and sent back to the esterification reactor. The bottom stream
contained 70.5 wt% glycerol along with 11.0 wt% methanol, 7.75 wt% sulphuric acid and trace
amounts of water and methyl oleate. This stream was treated as a waste stream due to the presence of
sulphuric acid.
After the pre-treatment of WVO, the next process flow diagram is identical to that of Alkali-
FVO process. The stream table is shown below the process flowsheet in Figure 4b.
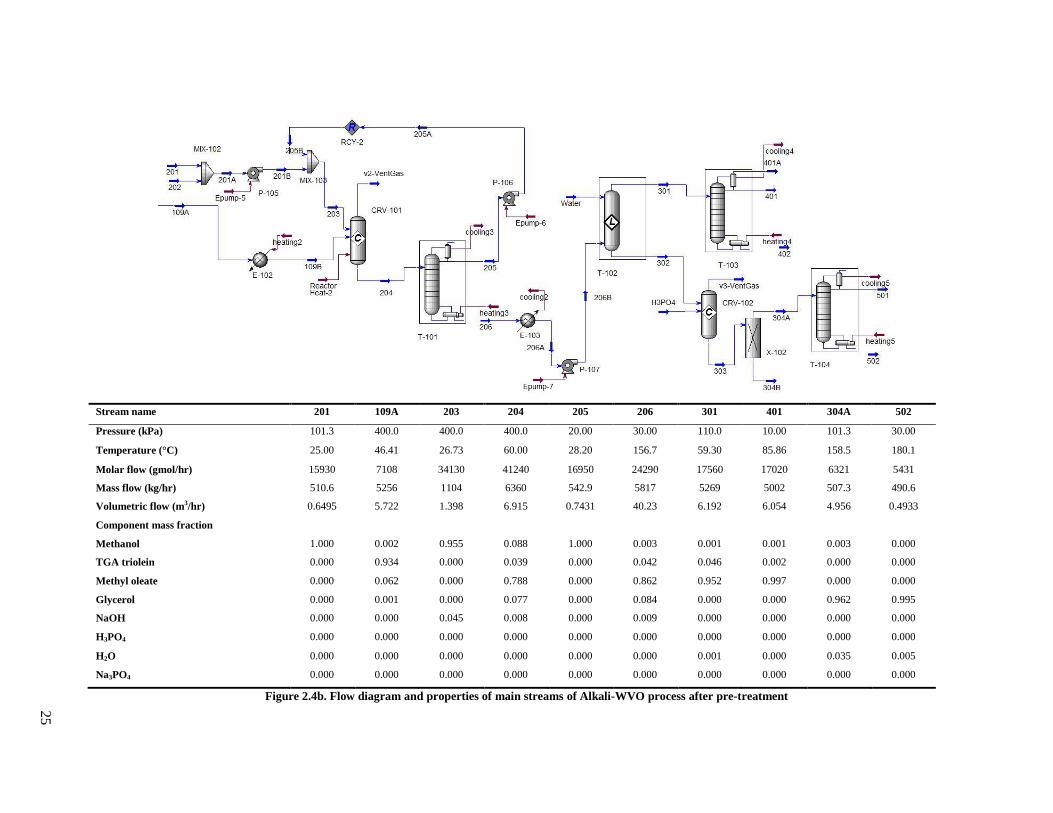
25
Stream name 201 109A 203 204 205 206 301 401 304A 502
Pressure (kPa) 101.3 400.0 400.0 400.0 20.00 30.00 110.0 10.00 101.3 30.00
Temperature (°C) 25.00 46.41 26.73 60.00 28.20 156.7 59.30 85.86 158.5 180.1
Molar flow (gmol/hr) 15930 7108 34130 41240 16950 24290 17560 17020 6321 5431
Mass flow (kg/hr) 510.6 5256 1104 6360 542.9 5817 5269 5002 507.3 490.6
Volumetric flow (m3/hr) 0.6495 5.722 1.398 6.915 0.7431 40.23 6.192 6.054 4.956 0.4933
Component mass fraction
Methanol 1.000 0.002 0.955 0.088 1.000 0.003 0.001 0.001 0.003 0.000
TGA triolein 0.000 0.934 0.000 0.039 0.000 0.042 0.046 0.002 0.000 0.000
Methyl oleate 0.000 0.062 0.000 0.788 0.000 0.862 0.952 0.997 0.000 0.000
Glycerol 0.000 0.001 0.000 0.077 0.000 0.084 0.000 0.000 0.962 0.995
NaOH 0.000 0.000 0.045 0.008 0.000 0.009 0.000 0.000 0.000 0.000
H3PO4 0.000 0.000 0.000 0.000 0.000 0.000 0.000 0.000 0.000 0.000
H2O 0.000 0.000 0.000 0.000 0.000 0.000 0.001 0.000 0.035 0.005
Na3PO4 0.000 0.000 0.000 0.000 0.000 0.000 0.000 0.000 0.000 0.000
Figure 2.4b. Flow diagram and properties of main streams of Alkali-WVO process after pre-treatment
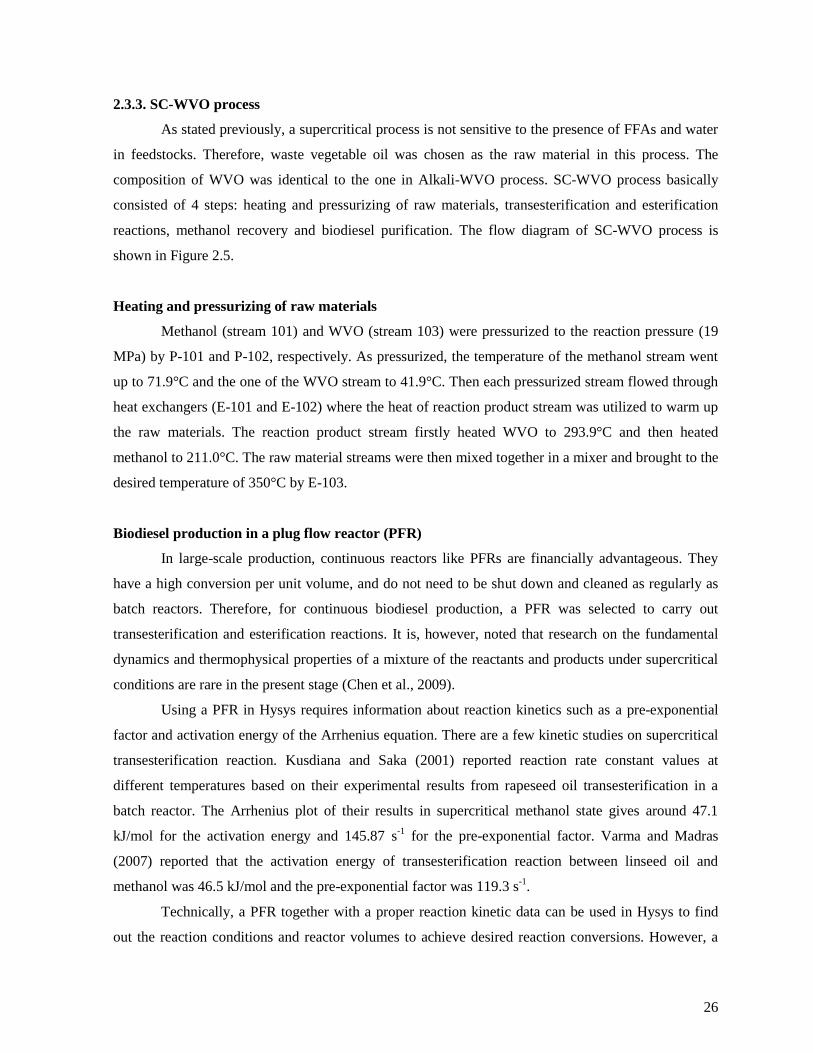
26
2.3.3. SC-WVO process
As stated previously, a supercritical process is not sensitive to the presence of FFAs and water
in feedstocks. Therefore, waste vegetable oil was chosen as the raw material in this process. The
composition of WVO was identical to the one in Alkali-WVO process. SC-WVO process basically
consisted of 4 steps: heating and pressurizing of raw materials, transesterification and esterification
reactions, methanol recovery and biodiesel purification. The flow diagram of SC-WVO process is
shown in Figure 2.5.
Heating and pressurizing of raw materials
Methanol (stream 101) and WVO (stream 103) were pressurized to the reaction pressure (19
MPa) by P-101 and P-102, respectively. As pressurized, the temperature of the methanol stream went
up to 71.9°C and the one of the WVO stream to 41.9°C. Then each pressurized stream flowed through
heat exchangers (E-101 and E-102) where the heat of reaction product stream was utilized to warm up
the raw materials. The reaction product stream firstly heated WVO to 293.9°C and then heated
methanol to 211.0°C. The raw material streams were then mixed together in a mixer and brought to the
desired temperature of 350°C by E-103.
Biodiesel production in a plug flow reactor (PFR)
In large-scale production, continuous reactors like PFRs are financially advantageous. They
have a high conversion per unit volume, and do not need to be shut down and cleaned as regularly as
batch reactors. Therefore, for continuous biodiesel production, a PFR was selected to carry out
transesterification and esterification reactions. It is, however, noted that research on the fundamental
dynamics and thermophysical properties of a mixture of the reactants and products under supercritical
conditions are rare in the present stage (Chen et al., 2009).
Using a PFR in Hysys requires information about reaction kinetics such as a pre-exponential
factor and activation energy of the Arrhenius equation. There are a few kinetic studies on supercritical
transesterification reaction. Kusdiana and Saka (2001) reported reaction rate constant values at
different temperatures based on their experimental results from rapeseed oil transesterification in a
batch reactor. The Arrhenius plot of their results in supercritical methanol state gives around 47.1
kJ/mol for the activation energy and 145.87 s-1
for the pre-exponential factor. Varma and Madras
(2007) reported that the activation energy of transesterification reaction between linseed oil and
methanol was 46.5 kJ/mol and the pre-exponential factor was 119.3 s-1
.
Technically, a PFR together with a proper reaction kinetic data can be used in Hysys to find
out the reaction conditions and reactor volumes to achieve desired reaction conversions. However, a
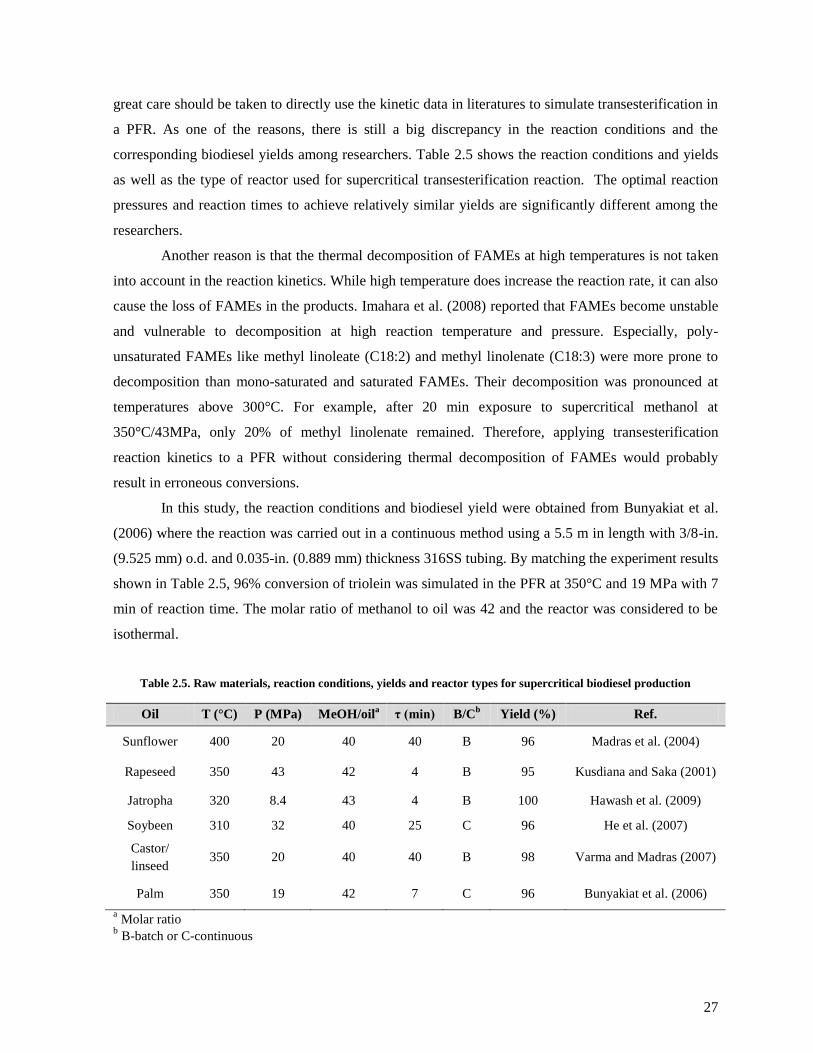
27
great care should be taken to directly use the kinetic data in literatures to simulate transesterification in
a PFR. As one of the reasons, there is still a big discrepancy in the reaction conditions and the
corresponding biodiesel yields among researchers. Table 2.5 shows the reaction conditions and yields
as well as the type of reactor used for supercritical transesterification reaction. The optimal reaction
pressures and reaction times to achieve relatively similar yields are significantly different among the
researchers.
Another reason is that the thermal decomposition of FAMEs at high temperatures is not taken
into account in the reaction kinetics. While high temperature does increase the reaction rate, it can also
cause the loss of FAMEs in the products. Imahara et al. (2008) reported that FAMEs become unstable
and vulnerable to decomposition at high reaction temperature and pressure. Especially, poly-
unsaturated FAMEs like methyl linoleate (C18:2) and methyl linolenate (C18:3) were more prone to
decomposition than mono-saturated and saturated FAMEs. Their decomposition was pronounced at
temperatures above 300°C. For example, after 20 min exposure to supercritical methanol at
350°C/43MPa, only 20% of methyl linolenate remained. Therefore, applying transesterification
reaction kinetics to a PFR without considering thermal decomposition of FAMEs would probably
result in erroneous conversions.
In this study, the reaction conditions and biodiesel yield were obtained from Bunyakiat et al.
(2006) where the reaction was carried out in a continuous method using a 5.5 m in length with 3/8-in.
(9.525 mm) o.d. and 0.035-in. (0.889 mm) thickness 316SS tubing. By matching the experiment results
shown in Table 2.5, 96% conversion of triolein was simulated in the PFR at 350°C and 19 MPa with 7
min of reaction time. The molar ratio of methanol to oil was 42 and the reactor was considered to be
isothermal.
Table 2.5. Raw materials, reaction conditions, yields and reactor types for supercritical biodiesel production
Oil T (°C) P (MPa) MeOH/oila τ (min) B/C
b Yield (%) Ref.
Sunflower 400 20 40 40 B 96 Madras et al. (2004)
Rapeseed 350 43 42 4 B 95 Kusdiana and Saka (2001)
Jatropha 320 8.4 43 4 B 100 Hawash et al. (2009)
Soybeen 310 32 40 25 C 96 He et al. (2007)
Castor/
linseed 350 20 40 40 B 98 Varma and Madras (2007)
Palm 350 19 42 7 C 96 Bunyakiat et al. (2006)
a Molar ratio
b B-batch or C-continuous
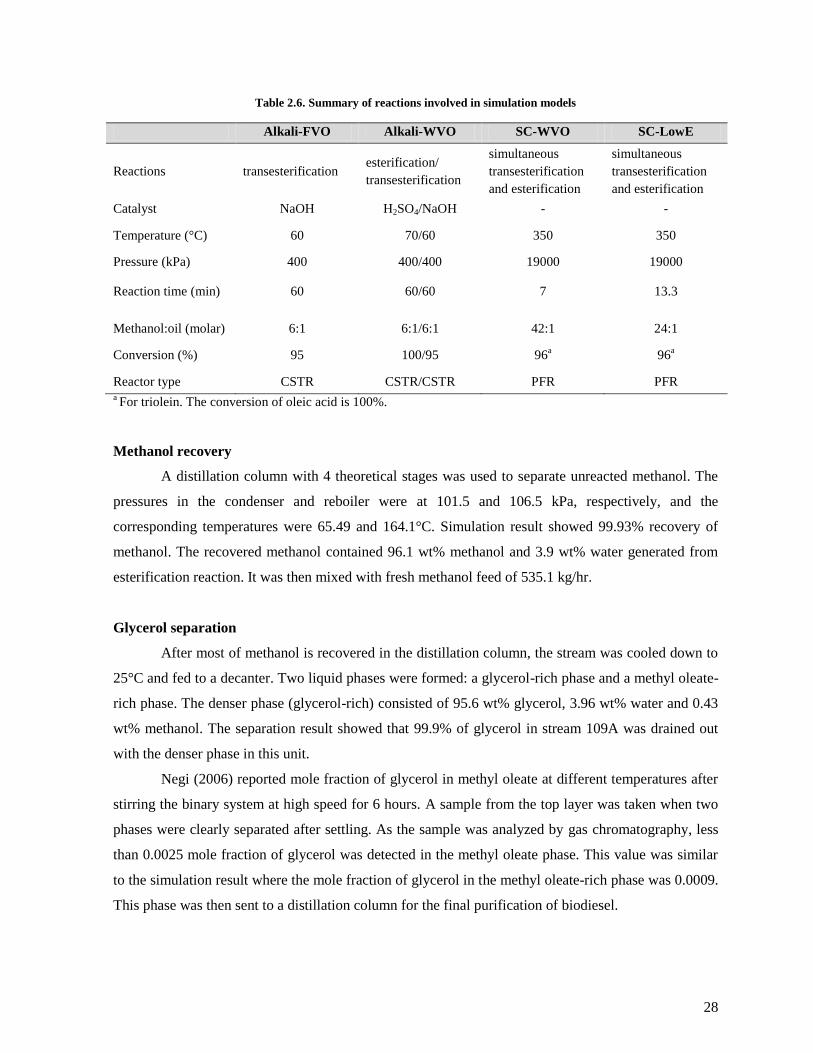
28
Table 2.6. Summary of reactions involved in simulation models
Alkali-FVO Alkali-WVO SC-WVO SC-LowE
Reactions transesterification esterification/
transesterification
simultaneous
transesterification
and esterification
simultaneous
transesterification
and esterification
Catalyst NaOH H2SO4/NaOH - -
Temperature (°C) 60 70/60 350 350
Pressure (kPa) 400 400/400 19000 19000
Reaction time (min) 60 60/60 7 13.3
Methanol:oil (molar) 6:1 6:1/6:1 42:1 24:1
Conversion (%) 95 100/95 96a
96a
Reactor type CSTR CSTR/CSTR PFR PFR a For triolein. The conversion of oleic acid is 100%.
Methanol recovery
A distillation column with 4 theoretical stages was used to separate unreacted methanol. The
pressures in the condenser and reboiler were at 101.5 and 106.5 kPa, respectively, and the
corresponding temperatures were 65.49 and 164.1°C. Simulation result showed 99.93% recovery of
methanol. The recovered methanol contained 96.1 wt% methanol and 3.9 wt% water generated from
esterification reaction. It was then mixed with fresh methanol feed of 535.1 kg/hr.
Glycerol separation
After most of methanol is recovered in the distillation column, the stream was cooled down to
25°C and fed to a decanter. Two liquid phases were formed: a glycerol-rich phase and a methyl oleate-
rich phase. The denser phase (glycerol-rich) consisted of 95.6 wt% glycerol, 3.96 wt% water and 0.43
wt% methanol. The separation result showed that 99.9% of glycerol in stream 109A was drained out
with the denser phase in this unit.
Negi (2006) reported mole fraction of glycerol in methyl oleate at different temperatures after
stirring the binary system at high speed for 6 hours. A sample from the top layer was taken when two
phases were clearly separated after settling. As the sample was analyzed by gas chromatography, less
than 0.0025 mole fraction of glycerol was detected in the methyl oleate phase. This value was similar
to the simulation result where the mole fraction of glycerol in the methyl oleate-rich phase was 0.0009.
This phase was then sent to a distillation column for the final purification of biodiesel.
29
Biodiesel purification
The feed stream consisted of 96.2 wt% methyl oleate, 3.73 wt% triolein, 0.068 wt% methanol
and 0.027 wt% glycerol. According to European (EN 14214) and American (ASTM D 6751) biodiesel
standards, the weight percent of free glycerol is limited to ≤0.02 wt%. In addition, the amount of
triglyceride in biodiesel is limited to ≤0.20 wt% in EN 14214. Therefore, further purification of the
feed stream was necessary to satisfy both EN 14214 and ASTM D 6751.
Since the boiling temperatures of glycerol and methyl oleate are over 280°C, a high operating
temperature was expected in the distillation column at atmospheric operating pressure. Therefore, the
pressure inside T-102 was set as low as 3.0–5.0 kPa in order to avoid thermal decompositions of
methyl esters. The temperatures in the condenser and reboiler were 154.8 and 264.1°C, respectively.
The number of theoretical stages was 7.
Simulation result showed that the top product stream satisfied both of the biodiesel standards.
The weight percents of methyl oleate, triolein and glycerol in stream 113 were 99.8%, 0.18% and
0.01%, respectively. Therefore, stream 113 was considered as the final product stream.
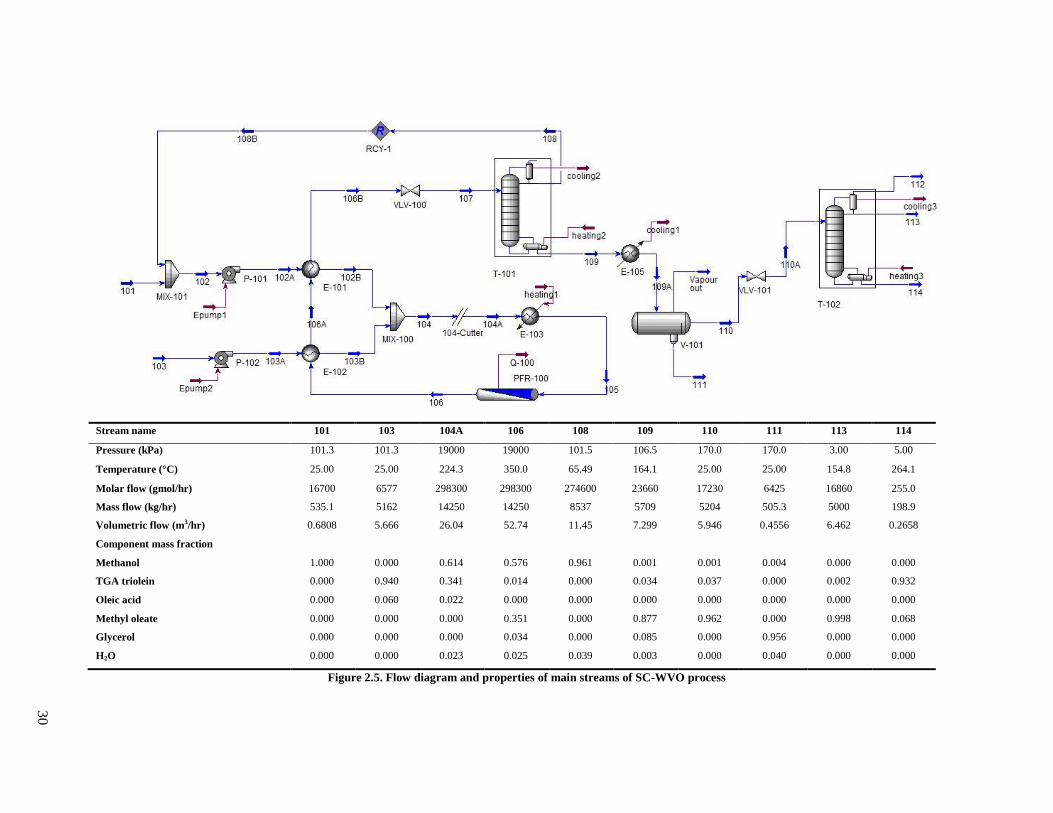
30
Stream name 101 103 104A 106 108 109 110 111 113 114
Pressure (kPa) 101.3 101.3 19000 19000 101.5 106.5 170.0 170.0 3.00 5.00
Temperature (°C) 25.00 25.00 224.3 350.0 65.49 164.1 25.00 25.00 154.8 264.1
Molar flow (gmol/hr) 16700 6577 298300 298300 274600 23660 17230 6425 16860 255.0
Mass flow (kg/hr) 535.1 5162 14250 14250 8537 5709 5204 505.3 5000 198.9
Volumetric flow (m3/hr) 0.6808 5.666 26.04 52.74 11.45 7.299 5.946 0.4556 6.462 0.2658
Component mass fraction
Methanol 1.000 0.000 0.614 0.576 0.961 0.001 0.001 0.004 0.000 0.000
TGA triolein 0.000 0.940 0.341 0.014 0.000 0.034 0.037 0.000 0.002 0.932
Oleic acid 0.000 0.060 0.022 0.000 0.000 0.000 0.000 0.000 0.000 0.000
Methyl oleate 0.000 0.000 0.000 0.351 0.000 0.877 0.962 0.000 0.998 0.068
Glycerol 0.000 0.000 0.000 0.034 0.000 0.085 0.000 0.956 0.000 0.000
H2O 0.000 0.000 0.023 0.025 0.039 0.003 0.000 0.040 0.000 0.000
Figure 2.5. Flow diagram and properties of main streams of SC-WVO process

31
2.3.4. SC-LowE process
In SC-WVO process, excess amount of methanol is used to achieve better miscibility of
methanol and vegetable oil. However, the large amount of methanol can result in high energy
consumption in pumping and heating. For example, in Figure 2.5, the flow rate of methanol affects the
energy streams of Epump1, heating 1 and heating 2. The energy consumptions are 304.5, 7501 and
24190 MJ/hr, respectively, with their sum accounting for 84.7% of the total energy consumption. In
attempt to reduce the energy consumption, two features were applied in SC-LowE process: a moderate
amount of methanol usage and initial methanol recovery in a flash evapourator, as shown in Figure 2.6.
Biodiesel production in PFR
Bunyakiat et al. (2006) reported that it was possible to obtain the same conversion (96%) using
24:1 methanol to oil molar ratio instead of 42:1. The corresponding reaction time increased from 420
second to 800 second to achieve the same conversion as the molar ratio decreased. Therefore, 96%
conversion of triolein was simulated at 350°C and 190 MPa using 24:1 methanol to oil molar ratio as
shown in Table 2.6. Using less amount methanol in the process has several advantages. It reduces the
cost of raw materials as well as necessary utilities. In addition, this would result in shorter separation
and evaporation steps compared to higher methanol to oil ratios, especially in a large industrial-scale
plant (Bunyakiat et al., 2006). In light of the facts, using smaller molar ratio seems to be favourable
despite the increased residence time.
Methanol separation in a flash evaporator
Product stream 106 consists of 41.3 wt% methanol, 48.0 wt% methyl oleate, 5 wt% glycerol
and trace amounts of unreacted triolein and water. Since the boiling point of methanol is far lower than
the rest of the components, a significant amount of methanol can be separated out as a vapour in a
flash evaporator (V-100) by adjusting the pressure or temperature. VLV-100 was used to depressurize
stream 106B from 19 to 0.2 MPa so that most of methanol evaporates whereas the other components
remain mostly in the liquid phase. Using this procedure, 89.6% of methanol in the feed stream was
separated into stream 109.
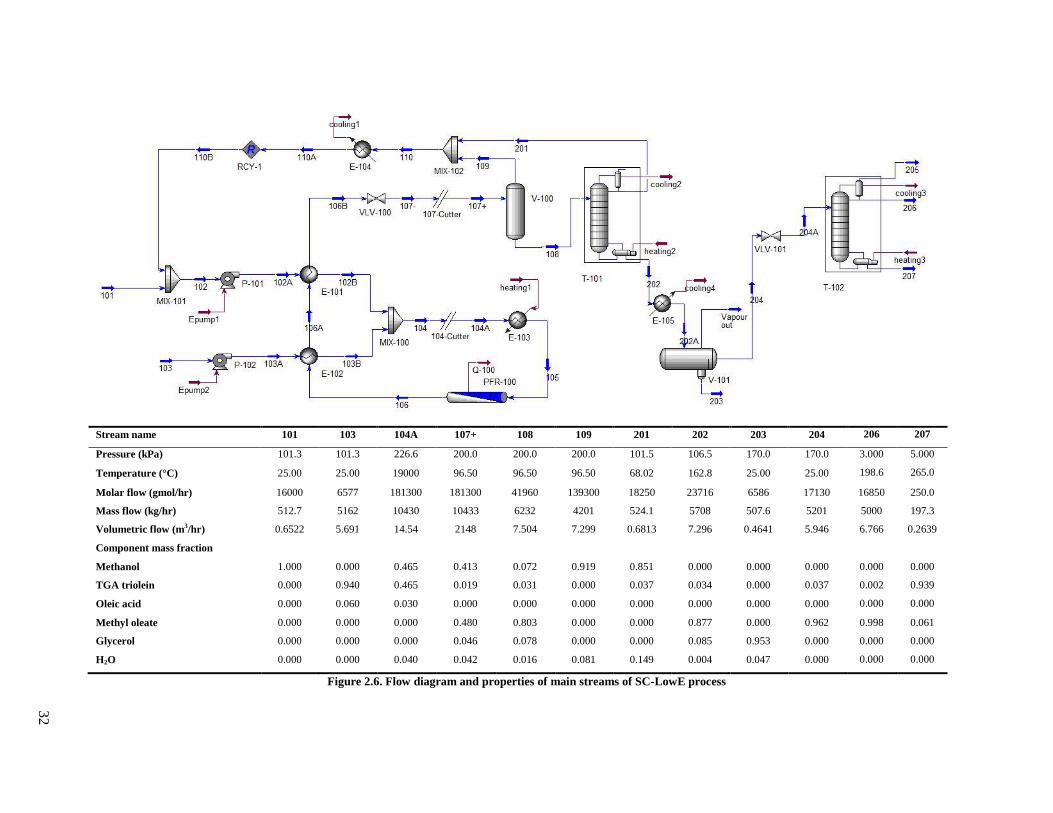
32
Stream name 101 103 104A 107+ 108 109 201 202 203 204 206 207
Pressure (kPa) 101.3 101.3 226.6 200.0 200.0 200.0 101.5 106.5 170.0 170.0 3.000 5.000
Temperature (°C) 25.00 25.00 19000 96.50 96.50 96.50 68.02 162.8 25.00 25.00 198.6 265.0
Molar flow (gmol/hr) 16000 6577 181300 181300 41960 139300 18250 23716 6586 17130 16850 250.0
Mass flow (kg/hr) 512.7 5162 10430 10433 6232 4201 524.1 5708 507.6 5201 5000 197.3
Volumetric flow (m3/hr) 0.6522 5.691 14.54 2148 7.504 7.299 0.6813 7.296 0.4641 5.946 6.766 0.2639
Component mass fraction
Methanol 1.000 0.000 0.465 0.413 0.072 0.919 0.851 0.000 0.000 0.000 0.000 0.000
TGA triolein 0.000 0.940 0.465 0.019 0.031 0.000 0.037 0.034 0.000 0.037 0.002 0.939
Oleic acid 0.000 0.060 0.030 0.000 0.000 0.000 0.000 0.000 0.000 0.000 0.000 0.000
Methyl oleate 0.000 0.000 0.000 0.480 0.803 0.000 0.000 0.877 0.000 0.962 0.998 0.061
Glycerol 0.000 0.000 0.000 0.046 0.078 0.000 0.000 0.085 0.953 0.000 0.000 0.000
H2O 0.000 0.000 0.040 0.042 0.016 0.081 0.149 0.004 0.047 0.000 0.000 0.000
Figure 2.6. Flow diagram and properties of main streams of SC-LowE process
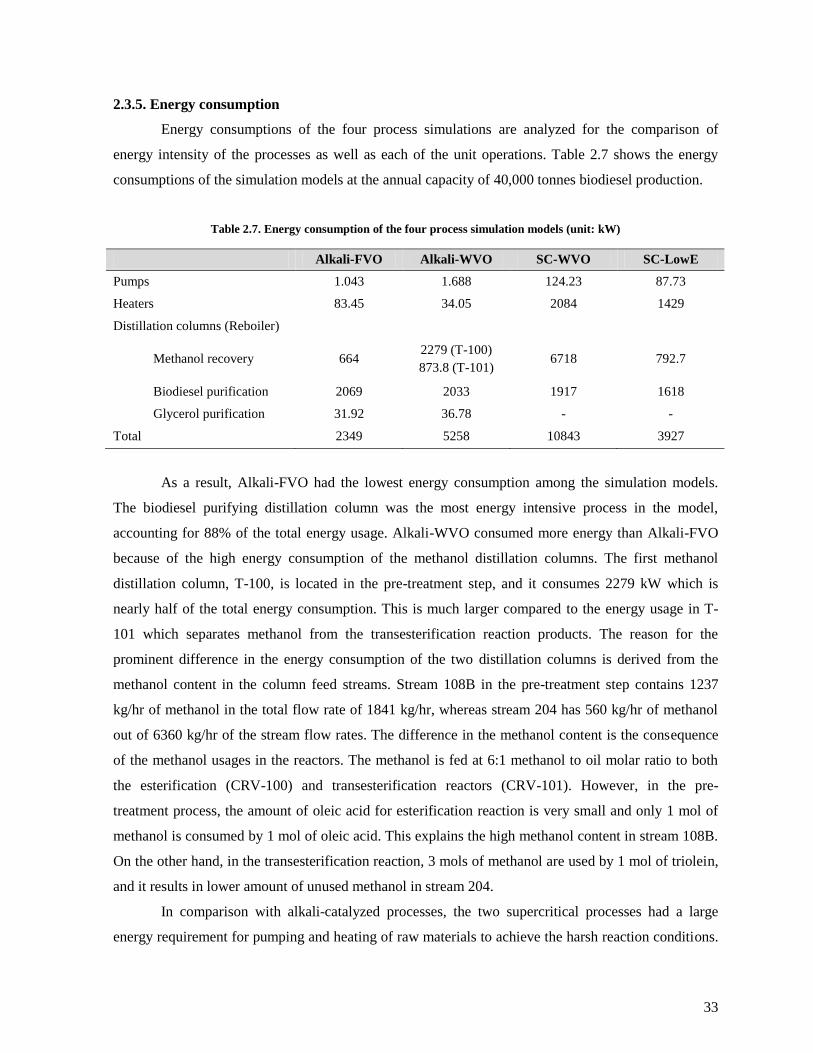
33
2.3.5. Energy consumption
Energy consumptions of the four process simulations are analyzed for the comparison of
energy intensity of the processes as well as each of the unit operations. Table 2.7 shows the energy
consumptions of the simulation models at the annual capacity of 40,000 tonnes biodiesel production.
Table 2.7. Energy consumption of the four process simulation models (unit: kW)
Alkali-FVO Alkali-WVO SC-WVO SC-LowE
Pumps 1.043 1.688 124.23 87.73
Heaters 83.45 34.05 2084 1429
Distillation columns (Reboiler)
Methanol recovery 664 2279 (T-100)
873.8 (T-101) 6718 792.7
Biodiesel purification 2069 2033 1917 1618
Glycerol purification 31.92 36.78 - -
Total 2349 5258 10843 3927
As a result, Alkali-FVO had the lowest energy consumption among the simulation models.
The biodiesel purifying distillation column was the most energy intensive process in the model,
accounting for 88% of the total energy usage. Alkali-WVO consumed more energy than Alkali-FVO
because of the high energy consumption of the methanol distillation columns. The first methanol
distillation column, T-100, is located in the pre-treatment step, and it consumes 2279 kW which is
nearly half of the total energy consumption. This is much larger compared to the energy usage in T-
101 which separates methanol from the transesterification reaction products. The reason for the
prominent difference in the energy consumption of the two distillation columns is derived from the
methanol content in the column feed streams. Stream 108B in the pre-treatment step contains 1237
kg/hr of methanol in the total flow rate of 1841 kg/hr, whereas stream 204 has 560 kg/hr of methanol
out of 6360 kg/hr of the stream flow rates. The difference in the methanol content is the consequence
of the methanol usages in the reactors. The methanol is fed at 6:1 methanol to oil molar ratio to both
the esterification (CRV-100) and transesterification reactors (CRV-101). However, in the pre-
treatment process, the amount of oleic acid for esterification reaction is very small and only 1 mol of
methanol is consumed by 1 mol of oleic acid. This explains the high methanol content in stream 108B.
On the other hand, in the transesterification reaction, 3 mols of methanol are used by 1 mol of triolein,
and it results in lower amount of unused methanol in stream 204.
In comparison with alkali-catalyzed processes, the two supercritical processes had a large
energy requirement for pumping and heating of raw materials to achieve the harsh reaction conditions.
34
Despite this fact, the energy consumption in SC-LowE process was the second lowest among the
simulation models. Comparing the two supercritical models, SC-LowE indicated much lower energy
consumption than SC-WVO. In SC-WVO process, the methanol distillation column was the most
energy intensive process, accounting for 62% of the total energy consumption. Other than the fact that
a distillation column itself is a very energy consuming operation, because of the high molar ratio of
methanol to oil in this process, the methanol column used a significant amount of energy. On the other
hand, the methanol distillation column in SC-LowE consumed 792.7 kW, which was only 11.8% of the
energy usage in the methanol column in SC-WVO. This is because, as mentioned before, a large
portion of methanol was separated in the flash evapourator. Another reason is the lower methanol to oil
molar ratio used in this process. The reduced flow rate because of the lower methanol usage also
decreased the energy consumption in pumps and heaters. Taking these into account, SC-LowE would
benefit from not only energy saving but also from the reduced sizes of the methanol distillation column,
pumps and heaters.
2.4. Conclusion
Thermogravimetric method was applied to determine the normal boiling point of triolein.
From the five TGA measurements, the average boiling point was defined as 412.8°C. The boiling point
of tripalmitin found in this study was consistent with the previously published literature. A new
component, ―TGA triolein‖, was created in Hysys using the boiling point value and UNIFAC
molecular structure. Its properties were compared with the triolein properties provided by the
component library in Hysys. The results showed significant improvements in accuracy of triolein
properties when TGA boiling point was applied.
Four simulation models were developed using TGA triolein as one of the components. Each
process had certain advantages and disadvantages. For example, the conventional alkali-catalyzed
process used fresh vegetable oil, which made it less favourable process in terms of economical and
ethical points of views. However, it used much less energy and less methanol compared to alkali-
catalyzed process using waste vegetable oil. Alkali-WVO process had moderate energy usage and used
low cost feedstock. However, the process flowsheet was the most complicated among the process
models. On the other hand, both supercritical processes used waste vegetable oils, and the processes
were less complex due to the absence of a catalyst. To decrease energy consumption involved with a
supercritical process, SC-LowE model was developed. The model featured a 24:1 methanol to oil

35
molar ratio and a flash evaporator to primarily recover methanol. These two features led to significant
decrease in energy usage in the supercritical process.
Acknowledgments
The authors acknowledge the financial support of the Natural Sciences and Engineering Research
Council of Canada.
36
Bibliography
Ambrose, D., 1978. Correlation and estimation of vapor-liquid critical properties: i. critical
temperatures of organic compounds. National Physical Laboratory, Teddington, NPL Rep.
Chem, 92.
Bunyakiat, K., Makmee, S., Sawangkeaw, R. and Ngamprasertsith, S., 2006. Continuous production of
biodiesel via transesterification from vegetable oils in supercritical methanol. Energy &
Fuels, 20(2), 812-817.
Ceriani, R. and Meirelles, A.J.A., 2004. Predicting vapor-liquid equilibria of fatty systems. Fluid
Phase Equilibria, 215(2), 227-236.
Chen, W., Wang, C., Ying, W., Wang, W., Wu, Y. and Zhang, J., 2009. Continuous production of
biodiesel via supercritical methanol transesterification in a tubular reactor. Part 1:
Thermophysical and transitive properties of supercritical methanol. Energy & Fuels, 23(1),
526-532.
Constantinou, L. and Gani, R., 1994. New group contribution method for estimating properties of pure
compounds. AIChE Journal, 40(10), 1697-1710.
Constantinou, L., Gani, R. and O'Connell, J.P., 1995. Estimation of the acentric factor and the liquid
molar volume at 298 K using a new group contribution method. Fluid Phase Equilibria,
103(1), 11-22.
Dohrn, R. and Brunner, G., 1991. Correlations of pure-component parameters of the Peng-Robinson
equation of state, Proceedings of Second International Symposium on Supercritical Fluids,
Boston, pp. 471−478.
Dohrn, R. and Brunner, G., 1994. An estimation method to calculate Tb, Tc, Pc and ω from the liquid
molar volume and the vapor pressure, Proceedings of Third International Symposium on
Supercritical Fluids, Strasbourg, France, pp. 241−248.
Glisic, S., Montoya, O., Orlovic, A. and Skala, D., 2007. Vapor–liquid equilibria of triglycerides–
methanol mixtures and their influence on the biodiesel synthesis under supercritical con-
ditions of methanol. J. Serb. Chem. Soc, 72(1), 13-27.
Glisic, S., Lukic, I. and Skala, D., 2009. Biodiesel synthesis at high pressure and temperature: Analysis
of energy consumption on industrial scale. Bioresource Technology, 100(24), 6347-6354.
Goodrum, J.W. and Geller, D.P., 2002. Rapid thermogravimetric measurements of boiling points and
vapor pressure of saturated medium-and long-chain triglycerides. Bioresource technology,
84(1), 75–80.
Han, B. and Peng, D., 1993. A group-contribution correlation for predicting the acentric factors of
organic compounds. The Canadian Journal of Chemical Engineering, 71(2), 332-334
Hawash, S., Kamal, N., Zaher, F., Kenawi, O. and Diwani, G. El., 2009. Biodiesel fuel from Jatropha
oil via non-catalytic supercritical methanol transesterification. Fuel, 88(3), 579-582.
37
He, H., Wang, T. and Zhu, S., 2007. Continuous production of biodiesel fuel from vegetable oil using
supercritical methanol process. Fuel, 86(3), 442-447.
Imahara, H., Minami, E., Gari, S. and Saka, S., 2008. Thermal stability of biodiesel in supercritical
methanol. Fuel, 87(1), 1-6.
Kasteren, J.M.N.V. and Nisworo, A.P., 2007. A process model to estimate the cost of industrial scale
biodiesel production from waste cooking oil by supercritical transesterification. Resources,
Conservation and Recycling, 50(4), 442-458.
Kusdiana, D. and Saka, S., 2001. Kinetics of transesterification in rapeseed oil to biodiesel fuel as
treated in supercritical methanol. Fuel, 80(5), 693-698.
Kusdiana, D. and Saka, S., 2004. Effects of water on biodiesel fuel production by supercritical
methanol treatment. Bioresource Technology, 91(3), 289-295.
Lim, Y. et al., 2009. Design and economic analysis of the process for biodiesel fuel production from
transesterificated rapeseed oil using supercritical methanol. Industrial & Engineering
Chemistry Research, 48(11), 5370–5378.
Madras, G., Kolluru, C. and Kumar, R., 2004. Synthesis of biodiesel in supercritical fluids. Fuel,
83(14-15), 2029-2033.
Meher, L., Dharmagadda, V.S. and Naik, S., 2006. Optimization of alkali-catalyzed transesterification
of Pongamia pinnata oil for production of biodiesel. Bioresource Technology, 97(12), 1392-
1397.
Negi, D., 2006. Base catalyzed glycerolysis of fatty acid methyl esters: investigations towards the
development of a continuous process. der Technischen Universität Berlin
Perry, E.S., Weber, W.H. and Daubert, B.F., 1949. Vapor pressures of phlegmatic liquids. I. simple
and mixed triglycerides. Journal of the American Chemical Society, 71(11), 3720-3726.
Pinnarat, T. and Savage, P.E., 2008. Assessment of noncatalytic biodiesel synthesis using supercritical
reaction conditions. Industrial & Engineering Chemistry Research, 47(18), 6801-6808.
Reid, R.C., Prausnitz, J.M. and Poling, B.E., 1987. The properties of gases and liquids. 4th edn.,
McGraw Hill, New York.
Saka, S. and Kusdiana, D., 2001. Biodiesel fuel from rapeseed oil as prepared in supercritical methanol.
Fuel, 80(2), 225-231.
Tang, Z., Du, Z., Min, E., Gao, L., Jiang, T. and Han, B., 2006. Phase equilibria of methanol-triolein
system at elevated temperature and pressure. Fluid Phase Equilibria, 239(1), 8-11.
Varma, M.N. and Madras, G., 2007. Synthesis of biodiesel from castor oil and linseed oil in
supercritical fluids. Industrial & Engineering Chemistry Research, 46(1), 1-6.
Weber, W., Petkov, S. and Brunner, G., 1999. Vapour-liquid-equilibria and calculations using the
Redlich-Kwong-Aspen-equation of state for tristearin, tripalmitin, and triolein in CO2 and
propane. Fluid Phase Equilibria, 158-160, 695-706.

38
West, A.H., Posarac, D. and Ellis, N., 2008. Assessment of four biodiesel production processes using
HYSYS. Plant. Bioresource Technology, 99(14), 6587-6601.
Zhang, Y., Dubè, M.A., McLean, D.D. and Kates, M., 2003. Biodiesel production from waste cooking
oil: 1. Process design and technological assessment. Bioresource Technology, 89(1), 1-16.
39
3. Economic assessment of biodiesel production processes2
3.1. Introduction
Over the past few decades, the world‘s energy consumption has rapidly risen due to increasing
population and industrialized economy. To meet the increasing energy demand, the world has relied
mostly on fossil fuels. One of the biggest problems of fossil fuels, however, is that they are not
renewable. It is anticipated that the global conventional oil peak is 5-10 years away from now (Bentley,
2002). Another problem is that the use of fossil fuels has caused environmentally negative effects such
as global warming. In addition, the production of fossil fuel is affected by political and economic
issues because of the locations of reservoirs and the finite quantity of oil. These drawbacks have driven
people to look for alternative energy resources.
Biodiesel has many advantages over conventional petroleum-derived diesel fuel. It is
biodegradable, thus more environmentally friendly, and renewable. Compared to the combustion of
petroleum diesel, the combustion of biodiesel emits less CO, SOx, particulate matter and unburned
hydrocarbons. According to Yee et al. (2009), utilization of palm biodiesel would generate an energy
yield ratio (output energy/input energy) of as high as 3.53, meanwhile absorbing higher amounts of
CO2 from atmosphere than the amount of CO2 emission from production and consumption. Biodiesel
has a relatively high flash point (150°C), making it less volatile and therefore safer to transport and
handle than petroleum diesel. Furthermore, it can be used directly in diesel engines with little
modifications and provides additional lubrication that can reduce engine wear and extend engine life.
Biodiesel is commonly produced from food-grade vegetable oils using an alkali-catalyzed
transesterification process. However, using food-grade oils is becoming economically not feasible due
to the increasing prices of crops. The prices of vegetable oils have been consistently rising over the last
few years as shown in Figure 3.1. As a result, low cost feedstocks such as waste vegetable oils (WVOs)
from restaurants and animal fats are receiving attentions as potential feedstocks for biodiesel
production.
2 A version of this chapter is in preparation for submission for publication. Lee, S., Posarac, D. and Ellis, N.
(2010). Economic assessment of biodiesel production processes.
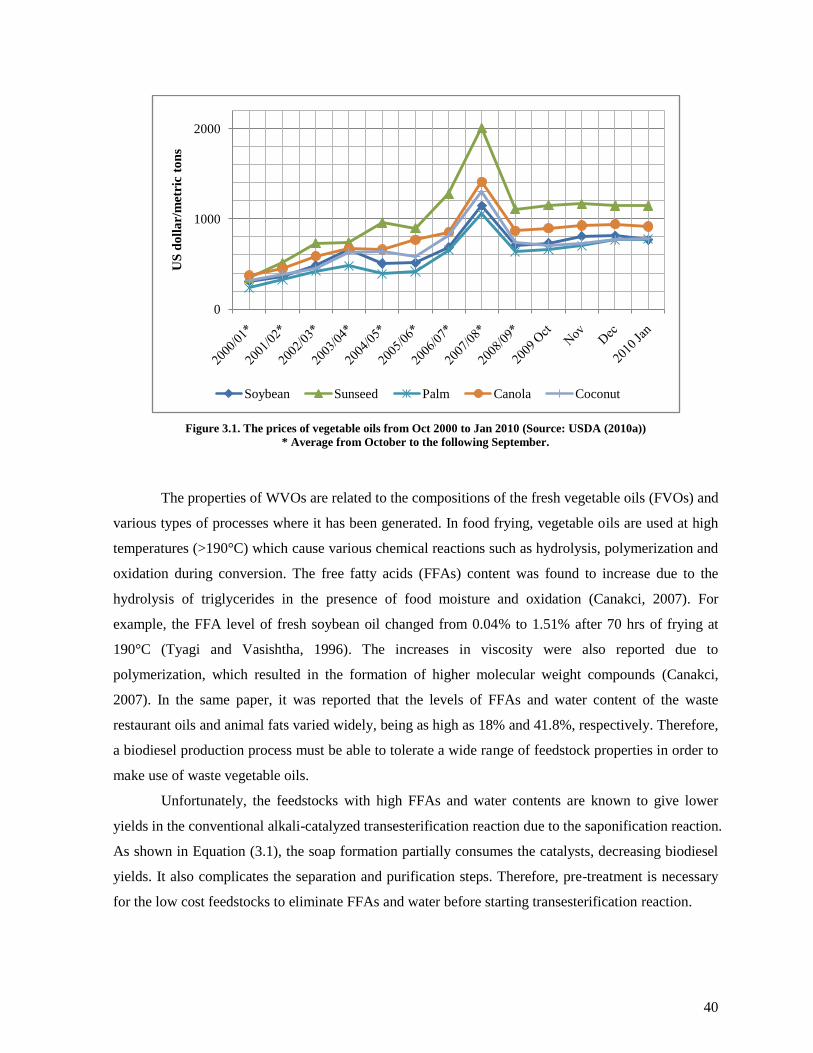
40
Figure 3.1. The prices of vegetable oils from Oct 2000 to Jan 2010 (Source: USDA (2010a))
* Average from October to the following September.
The properties of WVOs are related to the compositions of the fresh vegetable oils (FVOs) and
various types of processes where it has been generated. In food frying, vegetable oils are used at high
temperatures (>190°C) which cause various chemical reactions such as hydrolysis, polymerization and
oxidation during conversion. The free fatty acids (FFAs) content was found to increase due to the
hydrolysis of triglycerides in the presence of food moisture and oxidation (Canakci, 2007). For
example, the FFA level of fresh soybean oil changed from 0.04% to 1.51% after 70 hrs of frying at
190°C (Tyagi and Vasishtha, 1996). The increases in viscosity were also reported due to
polymerization, which resulted in the formation of higher molecular weight compounds (Canakci,
2007). In the same paper, it was reported that the levels of FFAs and water content of the waste
restaurant oils and animal fats varied widely, being as high as 18% and 41.8%, respectively. Therefore,
a biodiesel production process must be able to tolerate a wide range of feedstock properties in order to
make use of waste vegetable oils.
Unfortunately, the feedstocks with high FFAs and water contents are known to give lower
yields in the conventional alkali-catalyzed transesterification reaction due to the saponification reaction.
As shown in Equation (3.1), the soap formation partially consumes the catalysts, decreasing biodiesel
yields. It also complicates the separation and purification steps. Therefore, pre-treatment is necessary
for the low cost feedstocks to eliminate FFAs and water before starting transesterification reaction.
0
1000
2000
US
do
lla
r/m
etri
c to
ns
Soybean Sunseed Palm Canola Coconut

41
(3.1)
Supercritical methanol transesterification is one of the ways to utilize those feedstocks.
Kusdiana and Saka (2004) reported that almost complete conversion was achieved using supercritical
methanol and vegetable oil containing FFAs up to 30 wt%. In comparison with the supercritical
method, vegetable oil with 20 wt% FFAs resulted in 35% conversion in the alkali-catalyzed method. In
addition, the yield of methyl esters from the supercritical reaction was not affected by 30 vol. % water
contents in the feedstock.
There have been studies on economic feasibility of biodiesel production processes, especially
regarding the types of feedstocks and the types of catalysts in transesterification reaction. Bender
(1999) reviewed 12 economic feasibility studies for the projected biodiesel production costs involving
several feedstocks and operational scales. The author reported that the production costs ranged from
US$0.30/litre for soybean-based biodiesel to US$0.69/litre for rapeseed-based biodiesel. The rough
projected costs of biodiesel from vegetable oil and waste grease were estimated in the rage of
US$0.54−0.62/litre and US$0.34−0.42/litre, respectively, indicating the great advantage of using waste
grease.
Zhang et al. (2003) presented an economic comparison of the four continuous processes using
acid and alkali catalysts in FVOs and WVOs. Based on the after-tax rate of returns, it was determined
that the alkali treatment worked best for the fresh oil, but the acid-catalyzed process, even with much
longer process time, worked best for the WVO. The alkali transesterification process for WVO was not
cost effective, primarily because esterification pre-treatment steps were required to reduce the FFA
contents. A supercritical process, however, was not investigated in their study.
Lim et al. (2009) conducted the economic analysis of processes for supercritical biodiesel
production from rapeseed oil and compared the profitability to the alkali-catalyzed process. The results
showed that the total manufacturing cost of the supercritical process was lower than the alkali-
catalyzed process due to the absence of catalyst and higher by-product (glycerol) credit. Despite the
higher total capital cost of the supercritical process, its lower manufacturing cost resulted in shorter
payout time than the alkali-catalyzed process. The faster payout time of the supercritical processes
even without using waste vegetable oil feedstocks indicates the advantage of a supercritical process.
Further investigation on the supercritical biodiesel production from WVO was reported by
Kasteren and Nisworo (2007). In this study, propane was used as a co-solvent to alleviate harsh
42
supercritical reaction conditions. Their reaction conditions were 280°C/12.8 MPa with 24:1 methanol
to oil molar ratio. As a result, the required selling prices for biodiesel were predicted to be
US$ 0.17/litre, US$0.24/litre and US$0.52/litre at the plant capacities of 125,000, 80,000 and 8,000
tonnes biodiesel/yr, respectively. This fact indicates the plant capacity plays a significant role in
determining the profitability of the process.
This thesis deals with four kinds of continuous biodiesel production processes using fresh and
waste vegetable oils as the feedstocks have been investigated: alkali-catalyzed using FVO (Alkali-
FVO), alkali-catalyzed with pre-treatment of WVO (Alkali-WVO), supercritical using WVO (SC-
WVO) and supercritical using WVO with reduced energy consumption (SC-LowE) based on 40,000
tonnes of biodiesel production per year.
To our knowledge, no economic analysis of a biodiesel plant has been done using a software
program designed for process evaluation. Previous studies on economic estimations were based on the
overall factor method of Lang or bare-module concept introduced by Guthrie (Zhang et al., 2003;
Kasteren and Nisworo, 2007; You et al., 2008; West et al., 2008; Lim et al., 2009; Santana et al., 2010).
On the other hand, Aspen Icarus software systems have been field-tested for more than 30 years on
commercial plants and are in use worldwide by owner companies and engineering design and
construction firms (Seider et al., 2004).
The most accurate approach in estimating equipment costs would be using quotations directly
from vendors. However, particularly in the early stages of the cost estimation procedure, it is often
hard to obtain sufficient information or detailed quotes. The advantage of using Icarus Process
Evaluator (IPE) is that it provides the necessary specifications for detailed design, estimation and
economic data. The detailed design allows detailed modifications of the process equipments, which is
not possible in Lang factor or bare-module method. In addition, more accurate estimation of a total
capital investment can be achieved by the provided database of the field-tested industrial standard
design as well as cost modeling used by project evaluators.
Therefore, AspenTech‘s IPE was used in this study to provide improved accuracy of economic
analysis of a biodiesel plant by applying the accumulated data in the software systems. The scheme of
the work for the economic analysis in this study is as follows:
Loading Hysys simulation results into IPE
Setting general specifications including location and starting date of a plant, process
description and complexity, plant type (e.g., grass roots), currency, necessary utilities,
designating raw material and product streams
Relating each unit in simulation to a specific type of process equipments. For example, a
heater in Hysys simulation model is specified as a floating head heat exchanger in IPE.
43
Setting general investment parameters including the prices of raw materials, products and
utilities, tax rates, economic life of project, salvage value, depreciation method, operating
hours per period and labour costs.
Evaluation of total capital investment, total manufacturing cost and project profitability
Identification of factors greatly contributing to the costs for biodiesel and sensitivity analysis
of profitability to the factors.
3.2. General specifications for economic analysis in IPE
3.2.1. General specifications for capital costs
The general specifications defined here influence the design and cost estimate by defining
system defaults and environmental variables.
First of all, a project is to be defined as one of the five categories in Process Description: new
and unproven process, new process, redesigned process, licensed process and proven process.
Depending on which category a project belongs to, the contingency percent is adjusted accordingly.
For example, the new and unproven process makes the contingency value high compared to the proven
process. Process Description also drives the design allowances for all equipment whose material cost is
system-generated. Therefore, a higher design allowance is made for a new and unproven process
compared to a proven one. A proven process was chosen for Alkali-FVO and Alkali-WVO and a new
process was chosen for SC-WVO and SC-LowE.
Process Complexity option is used to adjust contingency percent along with Process
Description. It has five sub-categories: highly complex, slightly complex, typical, somewhat simple
and simple. Highly complex implies high temperature/pressure and also more controllers and
instrumentation. Therefore, highly complexity was chosen for the supercritical processes and typical
was chosen for the alkali-catalyzed processes.
In Project Location, the geographical location of the project site is defined and it influences
various location dependent costs such as freight (domestic and ocean), taxes, wage rates and workforce
productivities. For example, the domestic and ocean freights and taxes are specified as the different
percentages of materials costs depending on the locations as shown in Table 3.1. All the four processes
were defined to be located in North America, with the currency used in this study is in U.S. dollar.
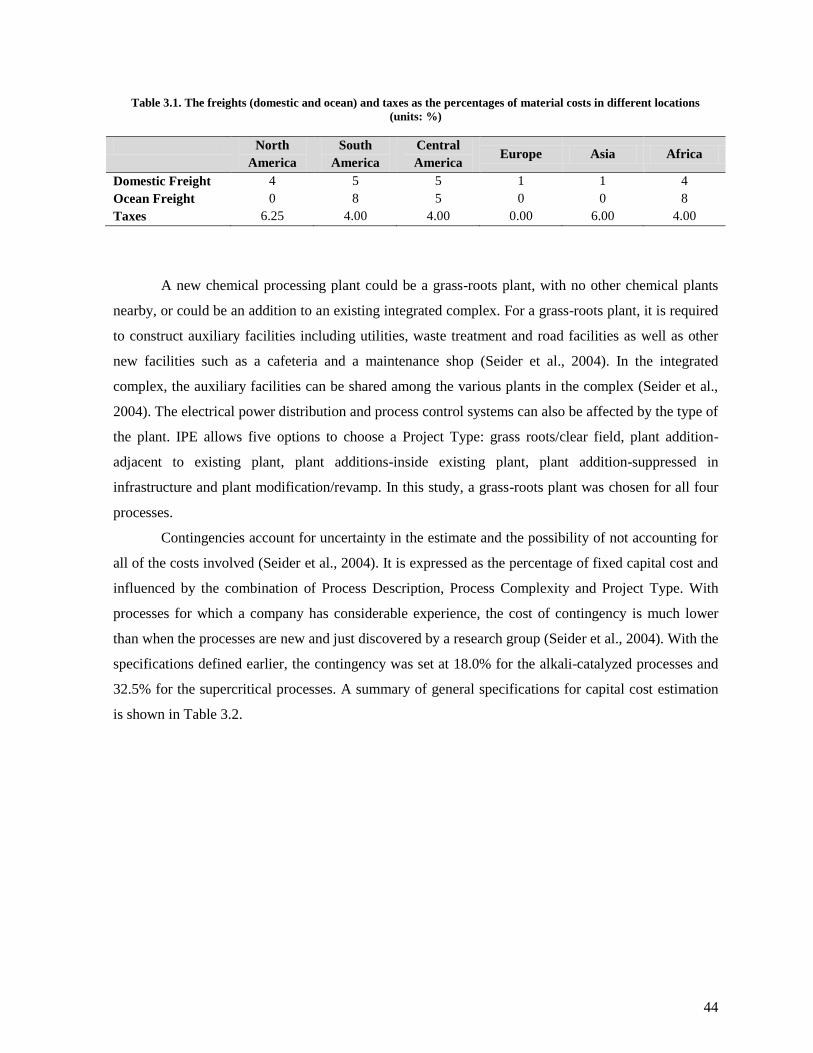
44
Table 3.1. The freights (domestic and ocean) and taxes as the percentages of material costs in different locations
(units: %)
North
America
South
America
Central
America Europe Asia Africa
Domestic Freight 4 5 5 1 1 4
Ocean Freight 0 8 5 0 0 8
Taxes 6.25 4.00 4.00 0.00 6.00 4.00
A new chemical processing plant could be a grass-roots plant, with no other chemical plants
nearby, or could be an addition to an existing integrated complex. For a grass-roots plant, it is required
to construct auxiliary facilities including utilities, waste treatment and road facilities as well as other
new facilities such as a cafeteria and a maintenance shop (Seider et al., 2004). In the integrated
complex, the auxiliary facilities can be shared among the various plants in the complex (Seider et al.,
2004). The electrical power distribution and process control systems can also be affected by the type of
the plant. IPE allows five options to choose a Project Type: grass roots/clear field, plant addition-
adjacent to existing plant, plant additions-inside existing plant, plant addition-suppressed in
infrastructure and plant modification/revamp. In this study, a grass-roots plant was chosen for all four
processes.
Contingencies account for uncertainty in the estimate and the possibility of not accounting for
all of the costs involved (Seider et al., 2004). It is expressed as the percentage of fixed capital cost and
influenced by the combination of Process Description, Process Complexity and Project Type. With
processes for which a company has considerable experience, the cost of contingency is much lower
than when the processes are new and just discovered by a research group (Seider et al., 2004). With the
specifications defined earlier, the contingency was set at 18.0% for the alkali-catalyzed processes and
32.5% for the supercritical processes. A summary of general specifications for capital cost estimation
is shown in Table 3.2.
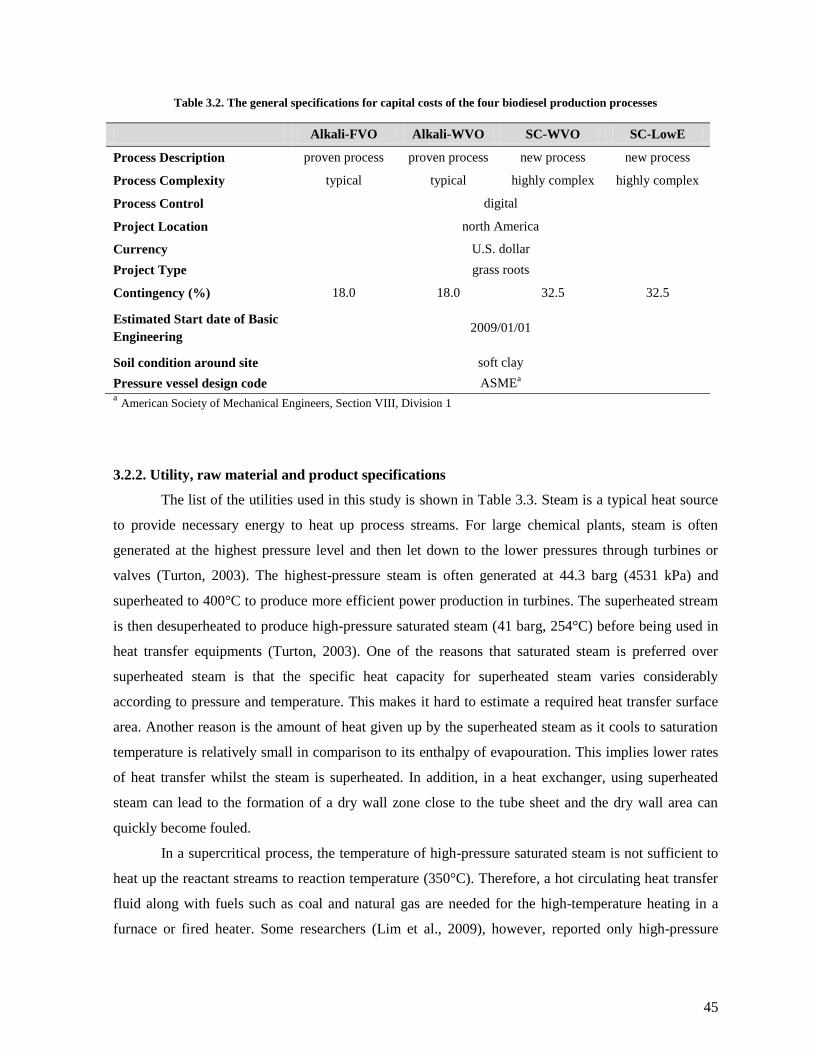
45
Table 3.2. The general specifications for capital costs of the four biodiesel production processes
Alkali-FVO Alkali-WVO SC-WVO SC-LowE
Process Description proven process proven process new process new process
Process Complexity typical typical highly complex highly complex
Process Control digital
Project Location north America
Currency U.S. dollar
Project Type grass roots
Contingency (%) 18.0 18.0 32.5 32.5
Estimated Start date of Basic
Engineering 2009/01/01
Soil condition around site soft clay
Pressure vessel design code ASMEa
a American Society of Mechanical Engineers, Section VIII, Division 1
3.2.2. Utility, raw material and product specifications
The list of the utilities used in this study is shown in Table 3.3. Steam is a typical heat source
to provide necessary energy to heat up process streams. For large chemical plants, steam is often
generated at the highest pressure level and then let down to the lower pressures through turbines or
valves (Turton, 2003). The highest-pressure steam is often generated at 44.3 barg (4531 kPa) and
superheated to 400°C to produce more efficient power production in turbines. The superheated stream
is then desuperheated to produce high-pressure saturated steam (41 barg, 254°C) before being used in
heat transfer equipments (Turton, 2003). One of the reasons that saturated steam is preferred over
superheated steam is that the specific heat capacity for superheated steam varies considerably
according to pressure and temperature. This makes it hard to estimate a required heat transfer surface
area. Another reason is the amount of heat given up by the superheated steam as it cools to saturation
temperature is relatively small in comparison to its enthalpy of evapouration. This implies lower rates
of heat transfer whilst the steam is superheated. In addition, in a heat exchanger, using superheated
steam can lead to the formation of a dry wall zone close to the tube sheet and the dry wall area can
quickly become fouled.
In a supercritical process, the temperature of high-pressure saturated steam is not sufficient to
heat up the reactant streams to reaction temperature (350°C). Therefore, a hot circulating heat transfer
fluid along with fuels such as coal and natural gas are needed for the high-temperature heating in a
furnace or fired heater. Some researchers (Lim et al., 2009), however, reported only high-pressure
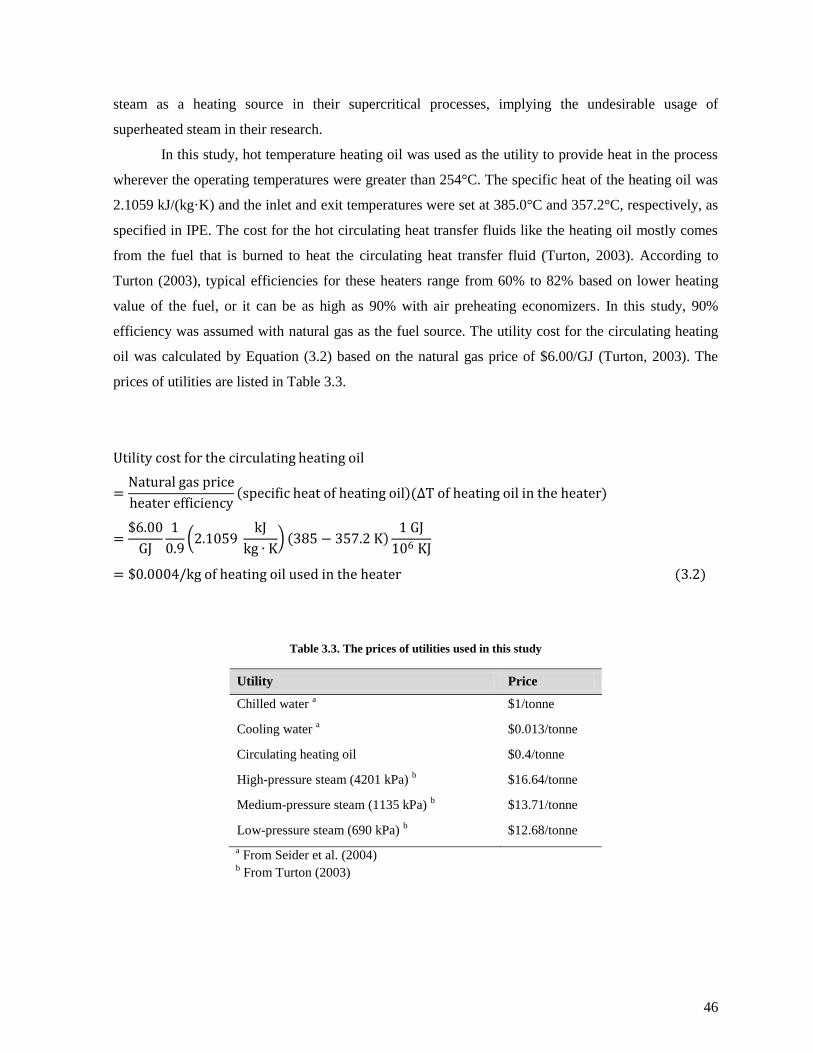
46
steam as a heating source in their supercritical processes, implying the undesirable usage of
superheated steam in their research.
In this study, hot temperature heating oil was used as the utility to provide heat in the process
wherever the operating temperatures were greater than 254°C. The specific heat of the heating oil was
2.1059 kJ/(kg·K) and the inlet and exit temperatures were set at 385.0°C and 357.2°C, respectively, as
specified in IPE. The cost for the hot circulating heat transfer fluids like the heating oil mostly comes
from the fuel that is burned to heat the circulating heat transfer fluid (Turton, 2003). According to
Turton (2003), typical efficiencies for these heaters range from 60% to 82% based on lower heating
value of the fuel, or it can be as high as 90% with air preheating economizers. In this study, 90%
efficiency was assumed with natural gas as the fuel source. The utility cost for the circulating heating
oil was calculated by Equation (3.2) based on the natural gas price of $6.00/GJ (Turton, 2003). The
prices of utilities are listed in Table 3.3.
Utility cost for the circulating heating oil
=Natural gas price
heater efficiency specific heat of heating oil (∆T of heating oil in the heater)
=$6.00
GJ
1
0.9 2.1059
kJ
kg ∙ K 385 − 357.2 K
1 GJ
106 KJ
= $0.0004/kg of heating oil used in the heater (3.2)
Table 3.3. The prices of utilities used in this study
Utility Price
Chilled water a
$1/tonne
Cooling water a $0.013/tonne
Circulating heating oil $0.4/tonne
High-pressure steam (4201 kPa) b
$16.64/tonne
Medium-pressure steam (1135 kPa) b
$13.71/tonne
Low-pressure steam (690 kPa) b
$12.68/tonne
a From Seider et al. (2004)
b From Turton (2003)

47
The price of fresh canola oil was obtained from a report released by USDA Foreign
Agricultural Service (USDA, 2010a). According to the report, the canola oil price was $916/tonnes in
January 2010, followed by soybean oil price ($769/tonne).
The prices of yellow grease and biodiesel were obtained from a national weekly summary
report released by USDA Agricultural Marketing Service (USDA, 2010b). In the report, the price of
yellow grease was recorded at $23.50-24.50/cwt (100 lb) in Central U.S. in April 2010, which is
equivalent to $530/tonne. During the same period, biodiesel (B100) price was $3.27-3.40/gallon in
Iowa, Illinois and Ohio, which is around $0.99/kg with the assumed density of 870.5 kg/m3.
The information of the prices of methanol and glycerine were obtained from the sample
reports released by ICIS Pricing. According to the reports, methanol price in US Gulf was $260.37-
277.06/tonne in October 2009 (McGinn, 2009) and the prices of pharmaceutical grade and crude
glycerine were in the range of $1212.54-1433.00/tonne and $750-970/tonne, respectively, during the
same period (Lefebvre, 2009). In this study, the averages of the reported prices were taken for
methanol, pharmaceutical grade and crude glycerine, which were $268.71/tonne, $1322.77/tonne and
$860/tonne, respectively. The prices of other chemicals are shown in Table 3.4.
Table 3.4. The prices of raw materials and products used in this study
Name Specification Price ($/tonne)
Methanol - 268.71
Fresh vegetable oil canola oil 916
Waste vegetable oil - 530
Glycerol pharmaceutical grade 1322.77
vegetable glycerine 860
Sodium hydroxide a
- 200
Sulfuric acid a
- 60
Phosphoric acid a - 340
Biodiesel (B100) qualified to meet EN 14214 and
ASTM D 6751 990
a From West et al. (2008)
3.3. Mapping and sizing
In this section, the specific types and the material of construction (MOC) of process
equipments were defined and sized according to principles outlined in the literatures (Luyben, 2002;
Seider et al., 2004; Chopey, 2004).

48
Pumps
A centrifuge pump is one of the most widely used pumps in chemical plants. It can be used
with head from 15.24 to 975.4 m and kinematic viscosity less than 100 centistrokes (Seider et al.,
2004). Therefore, it was selected for the pumps in the alkali-catalyzed processes. In the supercritical
processes, however, external rotary gear pumps were used due to the relatively high pressure
requirement (19 MPa). Driver powers for these pumps were calculated with 75% efficiency in Hysys
simulation. These values were used in IPE to calculate the cost of pumps including their motor drivers.
Heat exchangers
A wide variety of heat exchangers is available for heating and cooling system. Shell-and-tube
heat exchangers are usually considered first because their area to volume ratio is very high. Depending
on the design, a shell-and-tube exchanger is divided into floating head, fixed head, U-tube and kettle
vapourizer. In the four simulation models, fixed and floating head heat exchangers were used as the
basic heat exchangers wherever the required heat transfer areas were larger than 2 m2. The heat
exchangers with heat transfer areas smaller than 2 m2 were considered as double-pipe heat exchangers.
Sizing heat exchangers was done using Icarus Heat Exchanger Sizing Expert. For the
calculations, the information of the process streams such as inlet and exit temperature and the
components in the streams were used. Based on the primary fluid component, the stream is classified
into several categories and the following design parameters are estimated: latent heats, fouling
resistance, specific heat capacity of the fluid, liquid film resistance, overall heat transfer coefficient
and therefore heat transfer area. In addition, the detailed estimations of the number of tubes, tube
length, tube diameter, and other internal components of the heat exchangers were performed
simultaneously. The details of heat exchangers are shown in Tables 3.6 through 3.9.
Reactors
The CSTR reactors in the alkali-catalyzed processes were specified as agitated tanks. Based on
the residence time, which is 1 hr for both of the transesterification and esterification reactions, the
reactor sizes were determined. The length to diameter ratio was assumed to be 3:1.
For the PFRs in the supercritical processes, the reactor type used in the studies on continuous
biodiesel production was referred to. Most of the researchers used stainless steel tubes in their
laboratory-scale experiments (Bunyakiat et al., 2006; Silva et al., 2007; He et al., 2007; Vieitez et al.,
2008; Marulanda et al., 2010). It was considered appropriate to use a pressure vessel to represent a
continuous reactor in the industrial-scale process.
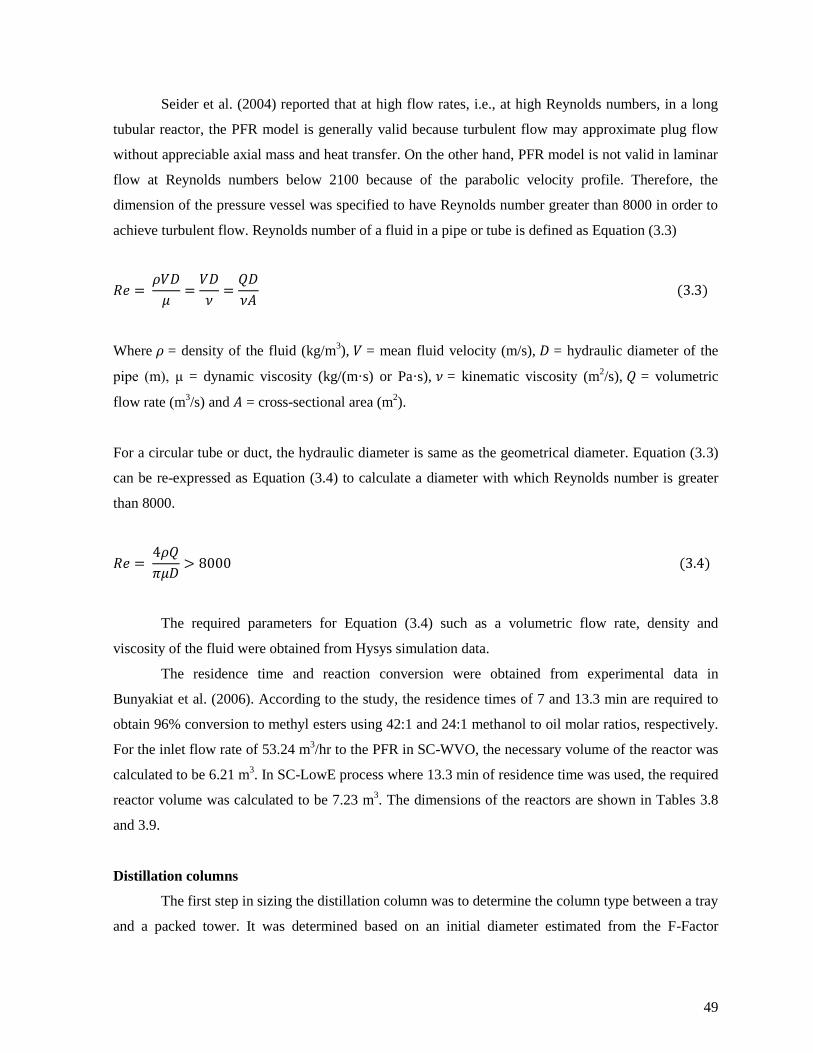
49
Seider et al. (2004) reported that at high flow rates, i.e., at high Reynolds numbers, in a long
tubular reactor, the PFR model is generally valid because turbulent flow may approximate plug flow
without appreciable axial mass and heat transfer. On the other hand, PFR model is not valid in laminar
flow at Reynolds numbers below 2100 because of the parabolic velocity profile. Therefore, the
dimension of the pressure vessel was specified to have Reynolds number greater than 8000 in order to
achieve turbulent flow. Reynolds number of a fluid in a pipe or tube is defined as Equation (3.3)
𝑅𝑒 = 𝜌𝑉𝐷
𝜇=
𝑉𝐷
𝜈=
𝑄𝐷
𝜈𝐴 (3.3)
Where 𝜌 = density of the fluid (kg/m3), 𝑉 = mean fluid velocity (m/s), 𝐷 = hydraulic diameter of the
pipe (m), μ = dynamic viscosity (kg/(m·s) or Pa·s), 𝜈 = kinematic viscosity (m2/s), 𝑄 = volumetric
flow rate (m3/s) and 𝐴 = cross-sectional area (m
2).
For a circular tube or duct, the hydraulic diameter is same as the geometrical diameter. Equation (3.3)
can be re-expressed as Equation (3.4) to calculate a diameter with which Reynolds number is greater
than 8000.
𝑅𝑒 = 4𝜌𝑄
𝜋𝜇𝐷> 8000 (3.4)
The required parameters for Equation (3.4) such as a volumetric flow rate, density and
viscosity of the fluid were obtained from Hysys simulation data.
The residence time and reaction conversion were obtained from experimental data in
Bunyakiat et al. (2006). According to the study, the residence times of 7 and 13.3 min are required to
obtain 96% conversion to methyl esters using 42:1 and 24:1 methanol to oil molar ratios, respectively.
For the inlet flow rate of 53.24 m3/hr to the PFR in SC-WVO, the necessary volume of the reactor was
calculated to be 6.21 m3. In SC-LowE process where 13.3 min of residence time was used, the required
reactor volume was calculated to be 7.23 m3. The dimensions of the reactors are shown in Tables 3.8
and 3.9.
Distillation columns
The first step in sizing the distillation column was to determine the column type between a tray
and a packed tower. It was determined based on an initial diameter estimated from the F-Factor
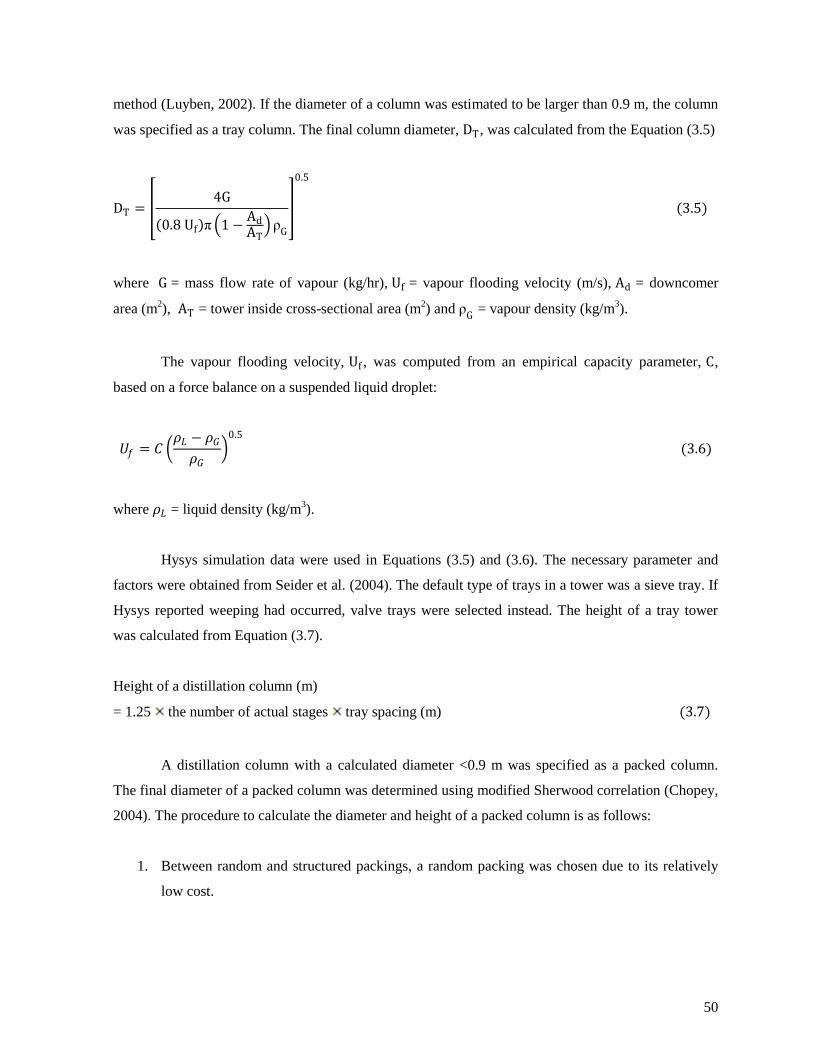
50
method (Luyben, 2002). If the diameter of a column was estimated to be larger than 0.9 m, the column
was specified as a tray column. The final column diameter, DT , was calculated from the Equation (3.5)
DT = 4G
0.8 Uf π 1 −AdAT
ρG
0.5
(3.5)
where G = mass flow rate of vapour (kg/hr), Uf = vapour flooding velocity (m/s), Ad = downcomer
area (m2), AT = tower inside cross-sectional area (m
2) and ρ
G = vapour density (kg/m
3).
The vapour flooding velocity, Uf , was computed from an empirical capacity parameter, C,
based on a force balance on a suspended liquid droplet:
𝑈𝑓 = 𝐶 𝜌𝐿 − 𝜌𝐺
𝜌𝐺
0.5
(3.6)
where 𝜌𝐿 = liquid density (kg/m3).
Hysys simulation data were used in Equations (3.5) and (3.6). The necessary parameter and
factors were obtained from Seider et al. (2004). The default type of trays in a tower was a sieve tray. If
Hysys reported weeping had occurred, valve trays were selected instead. The height of a tray tower
was calculated from Equation (3.7).
Height of a distillation column (m)
= 1.25 the number of actual stages tray spacing (m) (3.7)
A distillation column with a calculated diameter <0.9 m was specified as a packed column.
The final diameter of a packed column was determined using modified Sherwood correlation (Chopey,
2004). The procedure to calculate the diameter and height of a packed column is as follows:
1. Between random and structured packings, a random packing was chosen due to its relatively
low cost.
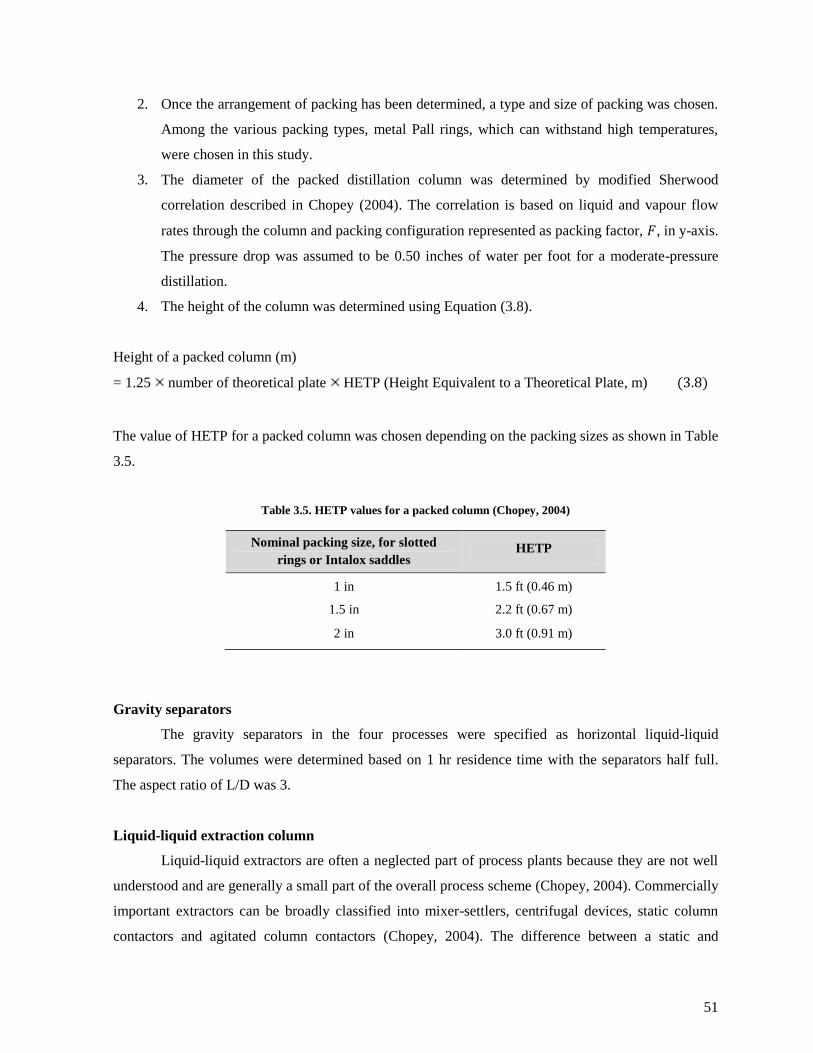
51
2. Once the arrangement of packing has been determined, a type and size of packing was chosen.
Among the various packing types, metal Pall rings, which can withstand high temperatures,
were chosen in this study.
3. The diameter of the packed distillation column was determined by modified Sherwood
correlation described in Chopey (2004). The correlation is based on liquid and vapour flow
rates through the column and packing configuration represented as packing factor, 𝐹, in y-axis.
The pressure drop was assumed to be 0.50 inches of water per foot for a moderate-pressure
distillation.
4. The height of the column was determined using Equation (3.8).
Height of a packed column (m)
= 1.25 number of theoretical plate HETP (Height Equivalent to a Theoretical Plate, m) (3.8)
The value of HETP for a packed column was chosen depending on the packing sizes as shown in Table
3.5.
Table 3.5. HETP values for a packed column (Chopey, 2004)
Nominal packing size, for slotted
rings or Intalox saddles HETP
1 in 1.5 ft (0.46 m)
1.5 in 2.2 ft (0.67 m)
2 in 3.0 ft (0.91 m)
Gravity separators
The gravity separators in the four processes were specified as horizontal liquid-liquid
separators. The volumes were determined based on 1 hr residence time with the separators half full.
The aspect ratio of L/D was 3.
Liquid-liquid extraction column
Liquid-liquid extractors are often a neglected part of process plants because they are not well
understood and are generally a small part of the overall process scheme (Chopey, 2004). Commercially
important extractors can be broadly classified into mixer-settlers, centrifugal devices, static column
contactors and agitated column contactors (Chopey, 2004). The difference between a static and

52
agitated column is that an agitated column provides a better degree of mixing of the immiscible liquids
and is used for an extraction column requiring a large number of stages. In this study, a static column
type was selected because of the moderate number of required stages as estimated in Hysys simulation.
Due to a lack of information to thoroughly size a liquid-liquid extraction column, a rather simple
method of sizing an extraction column was used as described in Seider et al. (2004).
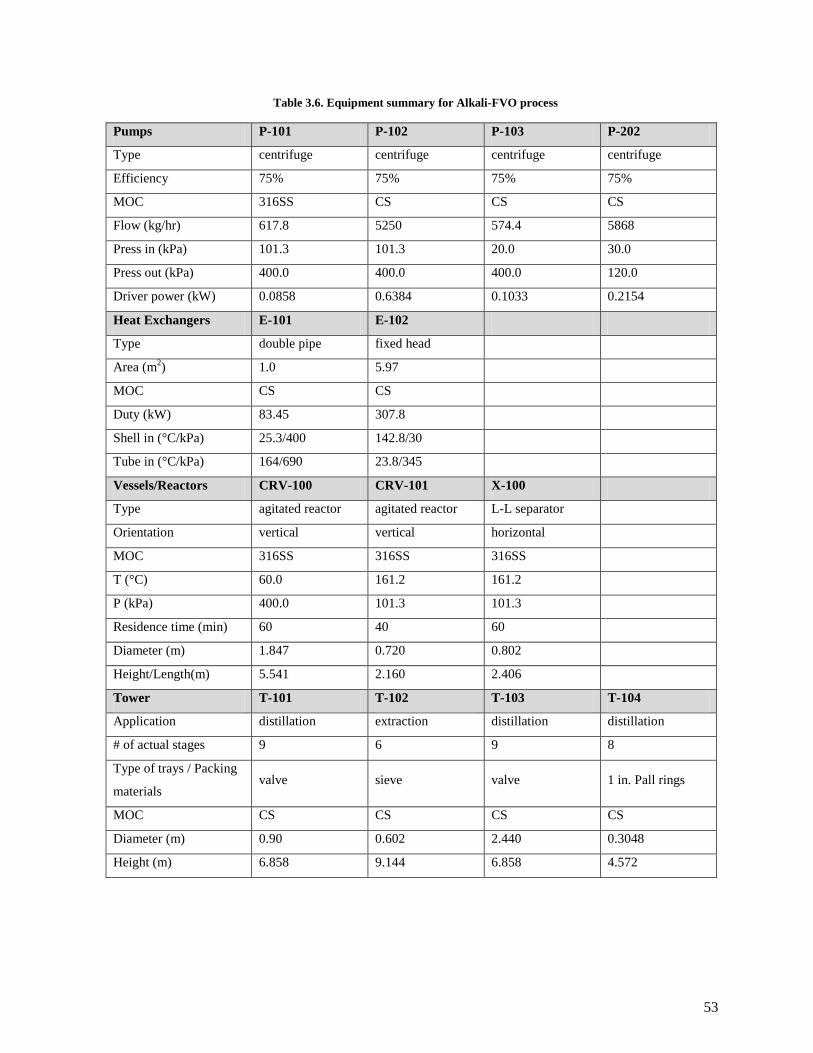
53
Table 3.6. Equipment summary for Alkali-FVO process
Pumps P-101 P-102 P-103 P-202
Type centrifuge centrifuge centrifuge centrifuge
Efficiency 75% 75% 75% 75%
MOC 316SS CS CS CS
Flow (kg/hr) 617.8 5250 574.4 5868
Press in (kPa) 101.3 101.3 20.0 30.0
Press out (kPa) 400.0 400.0 400.0 120.0
Driver power (kW) 0.0858 0.6384 0.1033 0.2154
Heat Exchangers E-101 E-102
Type double pipe fixed head
Area (m2) 1.0 5.97
MOC CS CS
Duty (kW) 83.45 307.8
Shell in (°C/kPa) 25.3/400 142.8/30
Tube in (°C/kPa) 164/690 23.8/345
Vessels/Reactors CRV-100 CRV-101 X-100
Type agitated reactor agitated reactor L-L separator
Orientation vertical vertical horizontal
MOC 316SS 316SS 316SS
T (°C) 60.0 161.2 161.2
P (kPa) 400.0 101.3 101.3
Residence time (min) 60 40 60
Diameter (m) 1.847 0.720 0.802
Height/Length(m) 5.541 2.160 2.406
Tower T-101 T-102 T-103 T-104
Application distillation extraction distillation distillation
# of actual stages 9 6 9 8
Type of trays / Packing
materials valve sieve valve 1 in. Pall rings
MOC CS CS CS CS
Diameter (m) 0.90 0.602 2.440 0.3048
Height (m) 6.858 9.144 6.858 4.572
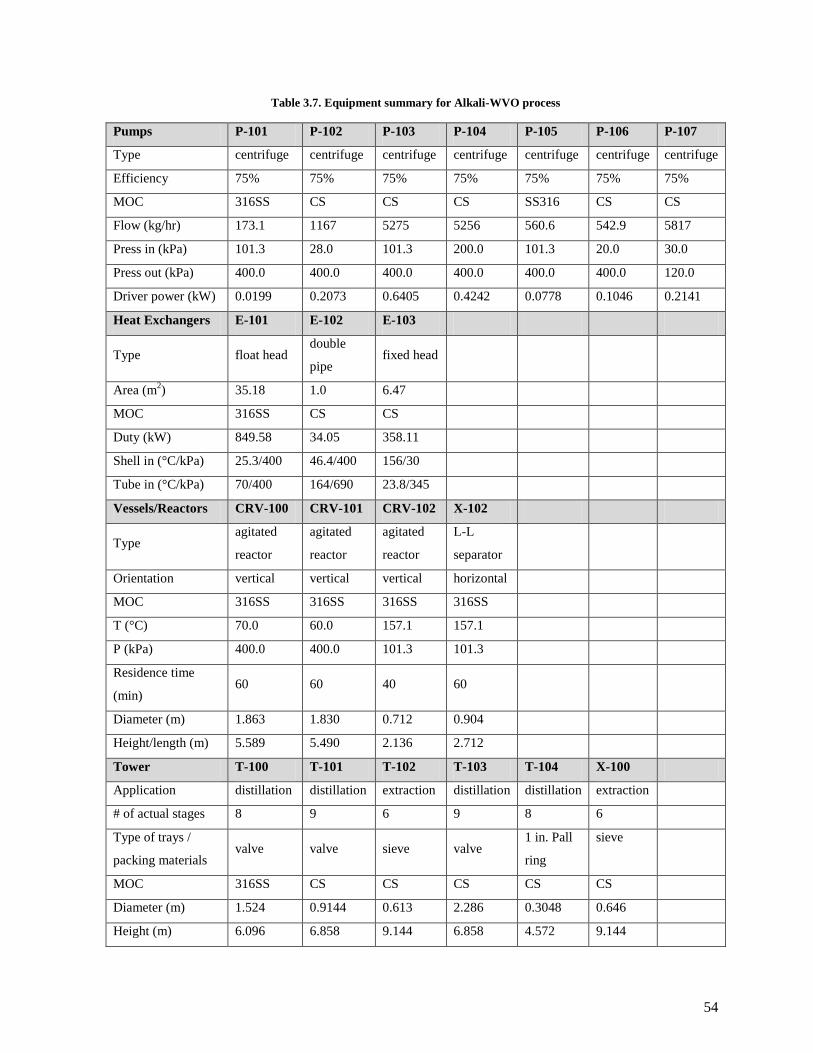
54
Table 3.7. Equipment summary for Alkali-WVO process
Pumps P-101 P-102 P-103 P-104 P-105 P-106 P-107
Type centrifuge centrifuge centrifuge centrifuge centrifuge centrifuge centrifuge
Efficiency 75% 75% 75% 75% 75% 75% 75%
MOC 316SS CS CS CS SS316 CS CS
Flow (kg/hr) 173.1 1167 5275 5256 560.6 542.9 5817
Press in (kPa) 101.3 28.0 101.3 200.0 101.3 20.0 30.0
Press out (kPa) 400.0 400.0 400.0 400.0 400.0 400.0 120.0
Driver power (kW) 0.0199 0.2073 0.6405 0.4242 0.0778 0.1046 0.2141
Heat Exchangers E-101 E-102 E-103
Type float head double
pipe fixed head
Area (m2) 35.18 1.0 6.47
MOC 316SS CS CS
Duty (kW) 849.58 34.05 358.11
Shell in (°C/kPa) 25.3/400 46.4/400 156/30
Tube in (°C/kPa) 70/400 164/690 23.8/345
Vessels/Reactors CRV-100 CRV-101 CRV-102 X-102
Type agitated
reactor
agitated
reactor
agitated
reactor
L-L
separator
Orientation vertical vertical vertical horizontal
MOC 316SS 316SS 316SS 316SS
T (°C) 70.0 60.0 157.1 157.1
P (kPa) 400.0 400.0 101.3 101.3
Residence time
(min) 60 60 40 60
Diameter (m) 1.863 1.830 0.712 0.904
Height/length (m) 5.589 5.490 2.136 2.712
Tower T-100 T-101 T-102 T-103 T-104 X-100
Application distillation distillation extraction distillation distillation extraction
# of actual stages 8 9 6 9 8 6
Type of trays /
packing materials valve valve sieve valve
1 in. Pall
ring
sieve
MOC 316SS CS CS CS CS CS
Diameter (m) 1.524 0.9144 0.613 2.286 0.3048 0.646
Height (m) 6.096 6.858 9.144 6.858 4.572 9.144

55
Table 3.8. Equipment summary for SC-WVO process
Pumps P-101 P-102
Type gear gear
Efficiency 75% 75%
MOC 316SS 316SS
Flow (kg/hr) 9084 5162
Press in (kPa) 101.3 101.3
Press out (kPa) 19000 19000
Driver power (kW) 84.57 39.66
Heat Exchangers E-101 E-102 E-103 E-104
Type float head float head float head float head
Area (m2) 40.69 14.78 92.64 37.88
MOC 316SS 316SS 316SS CS
Duty (kW) 1608.2 765.14 2083.6 489.8
Shell in (°C/kPa) 71.9/19000 41.9/19000 385/2533 164.1/106.5
Tube in (°C/kPa) 304/19000 350/19000 224/19000 23.8/345
Vessels/Reactors PFR-100 V-101
Type continuous
pressure vessel L-L separator
Orientation horizontal horizontal
MOC 316SS CS
T (°C) 350 25
P (kPa) 19000 170
Residence time (min) 7 60
Diameter (m) 0.8 1.76
Height/length (m) 12.36 5.28
Tower T-101 T-102
Application distillation distillation
# of actual stages 6 10
Type of trays /
Packing materials sieve valve
MOC CS CS
Diameter (m) 2.0 3.1
Height (m) 4.572 7.620
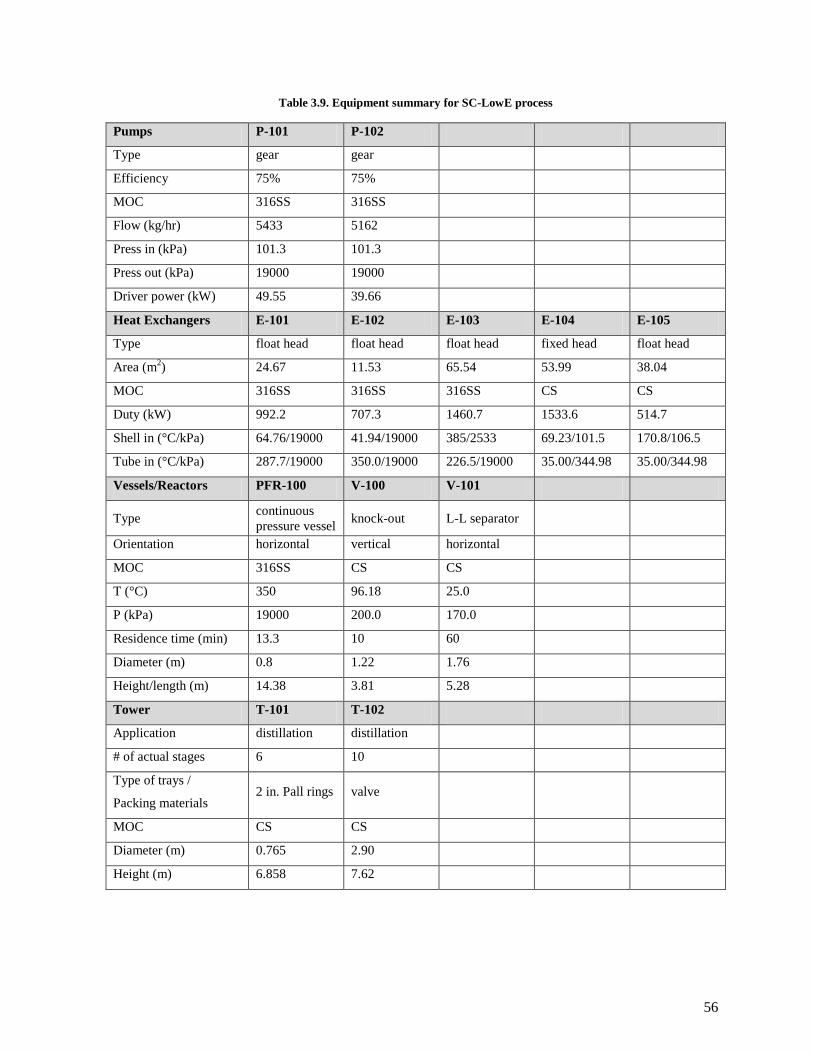
56
Table 3.9. Equipment summary for SC-LowE process
Pumps P-101 P-102
Type gear gear
Efficiency 75% 75%
MOC 316SS 316SS
Flow (kg/hr) 5433 5162
Press in (kPa) 101.3 101.3
Press out (kPa) 19000 19000
Driver power (kW) 49.55 39.66
Heat Exchangers E-101 E-102 E-103 E-104 E-105
Type float head float head float head fixed head float head
Area (m2) 24.67 11.53 65.54 53.99 38.04
MOC 316SS 316SS 316SS CS CS
Duty (kW) 992.2 707.3 1460.7 1533.6 514.7
Shell in (°C/kPa) 64.76/19000 41.94/19000 385/2533 69.23/101.5 170.8/106.5
Tube in (°C/kPa) 287.7/19000 350.0/19000 226.5/19000 35.00/344.98 35.00/344.98
Vessels/Reactors PFR-100 V-100 V-101
Type continuous
pressure vessel knock-out L-L separator
Orientation horizontal vertical horizontal
MOC 316SS CS CS
T (°C) 350 96.18 25.0
P (kPa) 19000 200.0 170.0
Residence time (min) 13.3 10 60
Diameter (m) 0.8 1.22 1.76
Height/length (m) 14.38 3.81 5.28
Tower T-101 T-102
Application distillation distillation
# of actual stages 6 10
Type of trays /
Packing materials 2 in. Pall rings valve
MOC CS CS
Diameter (m) 0.765 2.90
Height (m) 6.858 7.62
57
3.4. Investment parameters
Investment parameters to evaluate the profitability of a project were specified by including a
project life, salvage value, tax rate, depreciation method, desired rate of return, escalation rates,
working capital percentage, operating cost parameters, and facility operation parameters.
A project life is defined as a specific length of time over which the profitability of different
projects is to be compared (Turton, 2003). The lives typically used for this purpose are 10, 12 and 15
years (Turton, 2003). In this study, a ten-year analysis period was chosen. Accordingly, all the
equipment in each process was assumed to equally have ten-year of useful lives for the sake of
simplicity. Salvage value is an estimated value of fixed capital investment at the end of the project life.
It was conservatively specified to be zero. Taxation is generally very complex and frequently changes
over time. The corporate income tax in US varies from 15% to 39% depending on the net taxable
income. In addition, state, city and other local taxes are also charged. For most large corporations, the
overall taxation rate is often in the rage of 40% to 50% (Turton, 2003). In this study, the tax rate was
specified to be 40%. As a depreciation method, a straight line method most commonly used was
selected. The escalation rates for project capital, products, raw materials, operating and maintenance
labour and utilities were set at the default values of IPE as shown in Table 3.10. Working capital,
which indicates funds for the operating costs required for the early operation of the plant, was set at 15%
of fixed capital cost.
Operating cost parameters include operating charges, costs for plant overhead and General and
Administrative (G&A). Operating supplies and laboratory charges cover the cost of the miscellaneous
items required in order to run the plant and the cost of analyzing products. They were specified as 10%
of the maintenance cost, and 16.3% of the operating labour cost. Plant overhead indicates expenses
which are not directly related to plant operation such as the costs of providing the following services:
cafeteria, employment and personnel, fire protection, inspection and safety, first aid and medical,
janitorial, automotive and other transportation, and recreation (Seider et al., 2004). It was estimated as
50% of operating labour and maintenance costs. G&A expenses represent the general and
administrative costs such as administrative salaries/expenses, R&D, product distribution, financing and
selling costs. It was specified as 15% of subtotal operating costs, as shown in Table 3.10.
Facility type, operating mode, the length of start-up period and operating hours per year can be
specified in facility operation parameters category, which are shown in Table 3.10.

58
Table 3.10. Investment analysis parameter for the four biodiesel production processes
Name Value Units
Economic life of project 10 year
Tax rate 40 %/year
Desired rate of return / Interest rate 20 %/year
Salvage value 0 % of initial capital cost
Depreciation method straight line
Escalation Parameters
Project capital escalation 5 %/year
Products escalation 5 %/year
Raw material escalation 3.5 %/year
Operating and maintenance labour escalation 3 %/year
Utilities escalation 3 %/year
Project Capital Parameters
Working capital percentage 15 % of fixed capital cost
Operating Costs Parameters
Operating supplies 10 % of maintenance/year
Laboratory charges 16.3 % operating labour/year
Maintenance 6.0 % of fixed capital cost
Plant overhead 50 % of operating labour and
maintenance costs/year
G&A expenses 15 % of subtotal operating
costs/year
Facility Operation Parameters
Facility type chemical processing
facility
Operating mode continuous processing –
24 hours
Length of start-up period 20 weeks
Operating hours per period 8000 hours/year
Process fluids liquids and gases
59
3.5. Project evaluation
3.5.1. Total capital investment
Table 3.11 shows the total capital costs for the four biodiesel production processes. The cost of
the transesterification reactor was higher than any other equipment in Alkali-FVO, SC-WVO and SC-
LowE. In Alkali-WVO, the methanol distillation column in the pre-treatment had the highest cost.
Overall, the purchased equipment cost of SC-WVO and SC-LowE were higher than the other
processes. Especially, the costs of a transesterification reactor, pumps and heat exchangers of the two
supercritical processes were significantly higher than Alkali-FVO process: about 3 times higher in
reactor and pump costs; and 25 times higher in heat exchanger costs. The reasons for the high costs of
this equipment were mainly the high operating pressure and temperature. For the reactors, the material
of construction was 316SS in all of the four processes. However, the high operating temperature and
pressure in SC-WVO and SC-LowE increased the thickness of the reactors, and thereby their cost.
Operating conditions also contributed to the increases in the sizes of the pumps and heat exchangers in
SC-WVO and SC-LowE processes.
The total direct costs of Alkali-FVO, Alkali-WVO, SC-WVO and SC-Low E processes were
estimated as $3.594, $5.336, $5.592 and $5.425 million, respectively. Despite the use of an extra unit
(flash evapourator), SC-LowE process had a slightly lower total direct cost compared to SC-WVO due
to the reduced expenditure for the methanol recovery column, pumps and heat exchangers. The
reduction was brought by smaller sizes of the equipment for processing less amount of methanol. The
largest number of pieces of equipment in Alkali-WVO process generated the highest costs for
equipment setting, civil, steel, instrumentation, electrical, insulation and paint.
The total capital investment for Alkali-FVO was estimated as $11.1 million, which was the
lowest among the four processes. Alkali-WVO had the highest total capital investment estimated as
$15.6 million. As previously stated, the largest number of equipment units in this process caused the
highest indirect costs except for the contingency fees. Because the contingent fees were rated high for
the new unproven processes like the supercritical processes, the fees were estimated as $3.20 and
$3.17 million for SC-WVO and SC-LowE processes, respectively. The fees for Alkali-FVO and
Alkali-WVO processes were $1.48 and $2.08 million, respectively. The total capital investment for
SC-WVO was $15.0 million, followed by $14.8 million of SC-LowE.
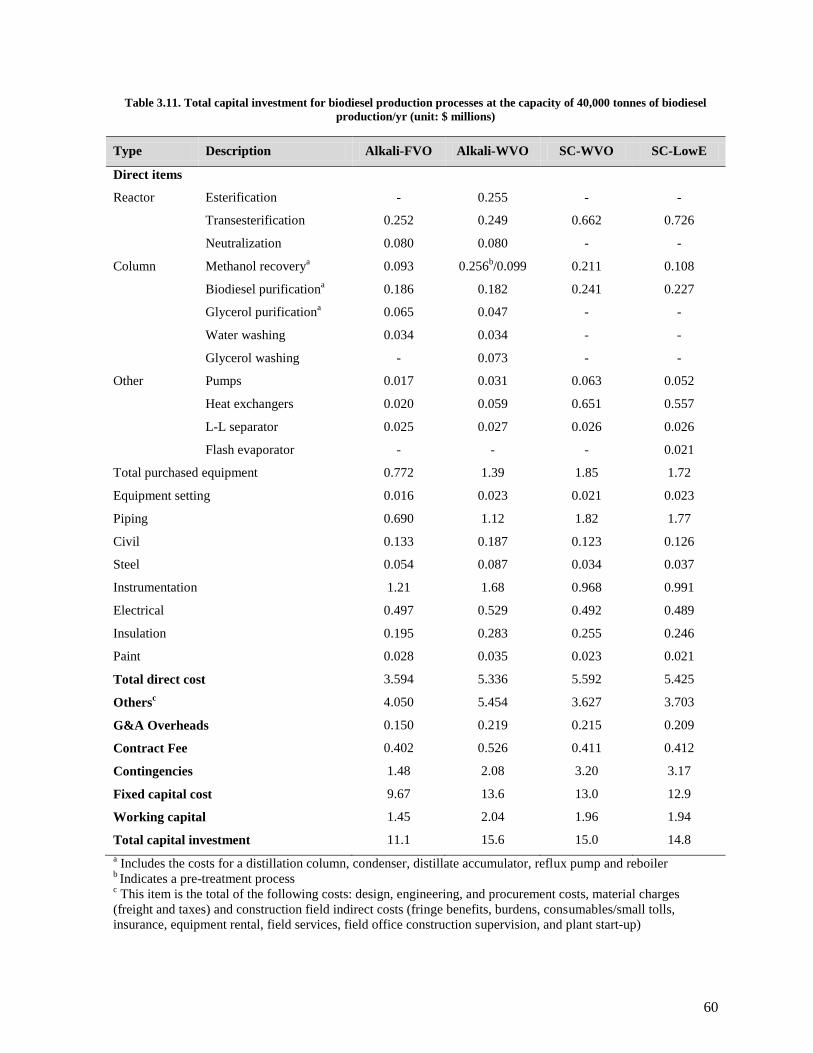
60
Table 3.11. Total capital investment for biodiesel production processes at the capacity of 40,000 tonnes of biodiesel
production/yr (unit: $ millions)
Type Description Alkali-FVO Alkali-WVO SC-WVO SC-LowE
Direct items
Reactor Esterification - 0.255 - -
Transesterification 0.252 0.249 0.662 0.726
Neutralization 0.080 0.080 - -
Column Methanol recoverya
0.093 0.256b/0.099 0.211 0.108
Biodiesel purificationa
0.186 0.182 0.241 0.227
Glycerol purificationa
0.065 0.047 - -
Water washing 0.034 0.034 - -
Glycerol washing - 0.073 - -
Other Pumps 0.017 0.031 0.063 0.052
Heat exchangers 0.020 0.059 0.651 0.557
L-L separator 0.025 0.027 0.026 0.026
Flash evaporator - - - 0.021
Total purchased equipment 0.772 1.39 1.85 1.72
Equipment setting 0.016 0.023 0.021 0.023
Piping 0.690 1.12 1.82 1.77
Civil 0.133 0.187 0.123 0.126
Steel 0.054 0.087 0.034 0.037
Instrumentation 1.21 1.68 0.968 0.991
Electrical 0.497 0.529 0.492 0.489
Insulation 0.195 0.283 0.255 0.246
Paint 0.028 0.035 0.023 0.021
Total direct cost 3.594 5.336 5.592 5.425
Othersc 4.050 5.454 3.627 3.703
G&A Overheads 0.150 0.219 0.215 0.209
Contract Fee 0.402 0.526 0.411 0.412
Contingencies 1.48 2.08 3.20 3.17
Fixed capital cost 9.67 13.6 13.0 12.9
Working capital 1.45 2.04 1.96 1.94
Total capital investment 11.1 15.6 15.0 14.8
a Includes the costs for a distillation column, condenser, distillate accumulator, reflux pump and reboiler
b Indicates a pre-treatment process
c This item is the total of the following costs: design, engineering, and procurement costs, material charges
(freight and taxes) and construction field indirect costs (fringe benefits, burdens, consumables/small tolls,
insurance, equipment rental, field services, field office construction supervision, and plant start-up)
61
3.5.2. Total manufacturing cost
The results of the total production costs of the four processes are shown in Table 3.12. The
total production cost for biodiesel in Alkali-FVO was calculated to be $50.9 million, which was the
highest among the four processes. The lowest total production cost was $25.9 million of SC-LowE
process. Figure 3.2 shows the contributions of sub-items to the total production costs for biodiesel. The
oil feed cost was found to be the major contributor to the total biodiesel production cost in all the
processes. As shown in Figure 3.2, it comprises 84.0%, 63.9%, 71.3% and 75.4% of the total
manufacturing costs of Alkali-FVO, Alkali-WVO, SC-WVO and SC-LowE processes, respectively.
Due to the usage of fresh vegetable oil feedstock, the percentage of oil feedstock was especially high
in Alkali-FVO process. However, the other processes using waste vegetable oil decreased the oil feed
costs by approximately 42% in comparison with Alkali-FVO.
The total manufacturing cost of Alkali-WVO process was $35.0 million, which was the second
highest among the four processes. Compared to Alkali-FVO, the cost for raw materials except for the
oil feed was higher because of the usage of larger amount of methanol, sulphuric acid catalyst and
glycerol for washing solution in the liquid-liquid extraction column in the pre-treatment process. The
utility, maintenance and indirect manufacturing costs of Alkali-WVO were also slightly higher than
Alkali-FVO due to the complexity of the process. However, using waste vegetable oil feedstock saved
$10.8 million per year in the total manufacturing cost of Alkali-WVO.
Both of SC-WVO and SC-LowE processes showed lower total manufacturing costs than the
alkali-catalyzed process. Because the reaction conversion in the supercritical processes was 96%,
which was slightly higher than the conversion in the alkali-catalyzed processes (95%), the oil feed cost
was decreased by $0.48 million per year in comparison with Alkali-WVO process. The costs for
methanol feed in the supercritical processes were similar to those in the alkali-catalyzed processes
despite the use of high molar ratio of methanol to oil in the reactions. As sufficient amount of methanol
required for the reaction was supplied by the recycled methanol stream from the methanol distillation
column, it resulted in similar amounts of fresh methanol feed stream in every process.
The costs of utilities in the supercritical processes were higher than the alkali-catalyzed
process due to the harsh reaction conditions. The larger amount of methanol to be evaporated in the
distillation columns also increased the utility costs in the supercritical processes. The usage of
electricity mostly came from the agitated reactors in Alkali-FVO and Alkali-WVO processes and from
the pumps in SC-WVO and SC-LowE processes. Comparing SC-LowE with SC-WVO, SC-LowE
saved approximately $1.16 million per year in the cost of steam (1135 kPa) simply because of the
application of the flash evapourator prior to the methanol distillation column. The saving on the steam
cost was much larger than the relatively small cost for purchasing and installing the flash evapourator.
62
The glycerol credits in Alkali-FVO and Alkali-WVO processes were $5.49 and $5.19 million,
respectively, which were higher than those in the supercritical processes due to the high purity of the
glycerol. The difference in the market prices of glycerol depending on its purity and the amount of the
crude glycerol to be purified are important indicators to determine on the construction of a glycerol
purifying distillation column. For example, if the crude glycerol stream in Alkali-FVO process was not
purified and sold at the lower price of $860/tonnes, the glycerol credit would have been decreased by
$1.98 million per year. In other words, by constructing the glycerol purifying distillation column at the
expense of $0.065 million, the increase of $1.98 million per year in glycerol credit was achieved. In
the same manner, Alkali-WVO process could also increase its profit by constructing the glycerol
purifying column.
The revenue from the sales of biodiesel was $39.6 million per year in each process on the
assumption that all the biodiesel products were sold in the market. Compared to the total
manufacturing costs, the revenue was large enough to make profits in Alkali-WVO, SC-WVO and SC-
LowE processes. However, the total manufacturing cost was $6.2 million dollars higher than the
earnings from the biodiesel sales in Alkali-FVO process, indicating that the process was in deficit. To
make Alkali-FVO process profitable, it seems inevitable to raise the biodiesel selling price and/or
decrease the raw material costs.
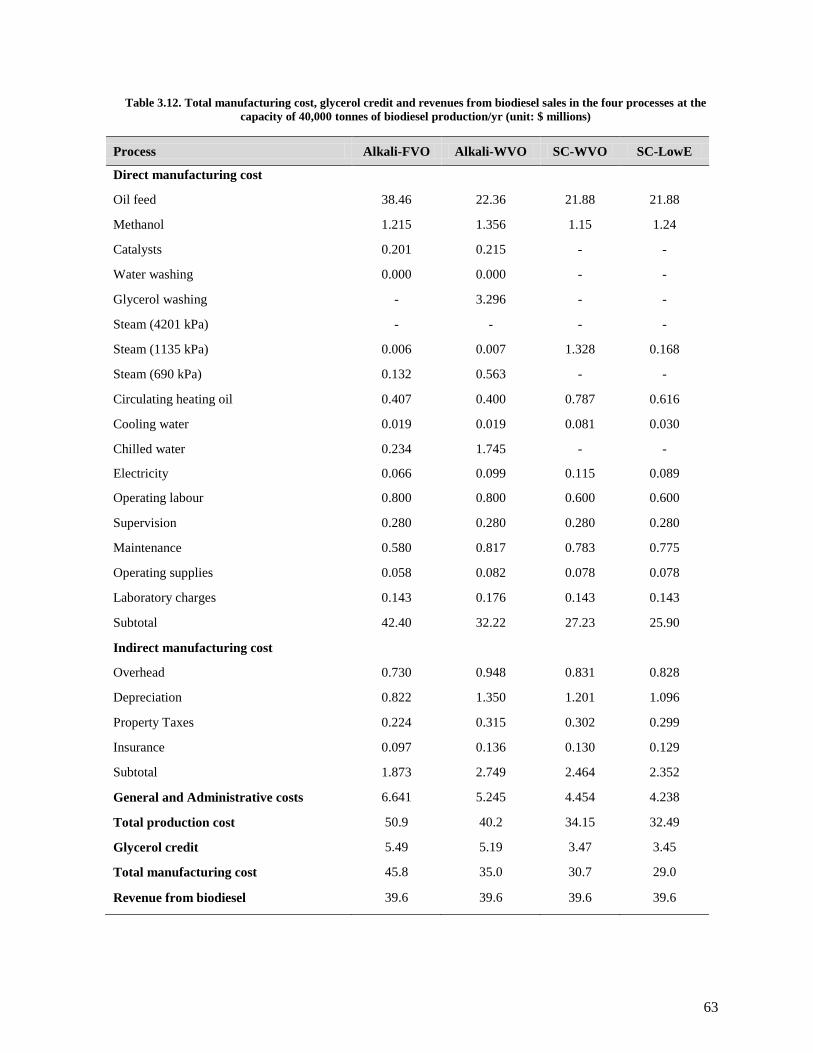
63
Table 3.12. Total manufacturing cost, glycerol credit and revenues from biodiesel sales in the four processes at the
capacity of 40,000 tonnes of biodiesel production/yr (unit: $ millions)
Process Alkali-FVO Alkali-WVO SC-WVO SC-LowE
Direct manufacturing cost
Oil feed 38.46 22.36 21.88 21.88
Methanol 1.215 1.356 1.15 1.24
Catalysts 0.201 0.215 - -
Water washing 0.000 0.000 - -
Glycerol washing - 3.296 - -
Steam (4201 kPa) - - - -
Steam (1135 kPa) 0.006 0.007 1.328 0.168
Steam (690 kPa) 0.132 0.563 - -
Circulating heating oil 0.407 0.400 0.787 0.616
Cooling water 0.019 0.019 0.081 0.030
Chilled water 0.234 1.745 - -
Electricity 0.066 0.099 0.115 0.089
Operating labour 0.800 0.800 0.600 0.600
Supervision 0.280 0.280 0.280 0.280
Maintenance 0.580 0.817 0.783 0.775
Operating supplies 0.058 0.082 0.078 0.078
Laboratory charges 0.143 0.176 0.143 0.143
Subtotal 42.40 32.22 27.23 25.90
Indirect manufacturing cost
Overhead 0.730 0.948 0.831 0.828
Depreciation 0.822 1.350 1.201 1.096
Property Taxes 0.224 0.315 0.302 0.299
Insurance 0.097 0.136 0.130 0.129
Subtotal 1.873 2.749 2.464 2.352
General and Administrative costs 6.641 5.245 4.454 4.238
Total production cost 50.9 40.2 34.15 32.49
Glycerol credit 5.49 5.19 3.47 3.45
Total manufacturing cost 45.8 35.0 30.7 29.0
Revenue from biodiesel 39.6 39.6 39.6 39.6

64
Figure 3.2. The proportions of subitems in the total production cost for biodiesel of the four processes
3.5.3. Profitability analysis
In the process of making an investment decision, the profit anticipated from an investment
must be judged relative to some profitability standards. A profitability standard is a quantitative
measure of profit with respect to the capital investment required to generate that profit. Several
methods are used for project evaluation, and the methods can be divided into discounted techniques
and non-discounted techniques. Non-discounted cash flow techniques do not consider the time value of
money and therefore are not suitable for final project evaluation. The methods include payback period
and return on investment. Discounted cash flow techniques are more rigorous profitability measures
which involve consideration of the time value of money and estimates of the cash flows throughout the
life of the process. The methods include the discounted payback period (DPP), net present value
(NPV), equivalent annual value (EAV) and discounted cash flow rate of return (DCFROR).
Discounted payback period is the time required, after start-up, to recover the fixed capital
investment as all cash flows discounted back to time zero. It corresponds to the time when the
cumulative present value crosses over from negative to positive hitting zero. The project with the
shortest time is the more favourable. However, it may lead to an economically incorrect decision, as it
does not reflect cash flows after payback. The project with the shortest DPP might not produce the
highest return at the end of the project life. Therefore, it should be only used to provide initial
screening or supplemental information in conjunction with an analysis performed using different
methods.
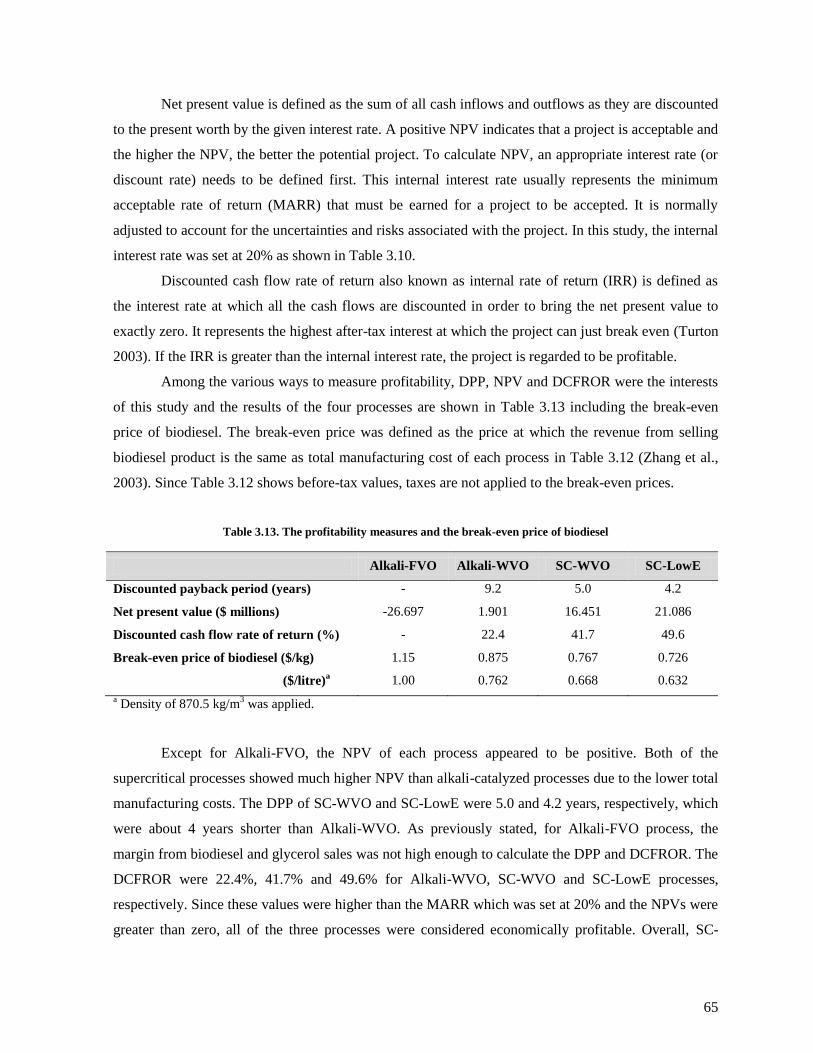
65
Net present value is defined as the sum of all cash inflows and outflows as they are discounted
to the present worth by the given interest rate. A positive NPV indicates that a project is acceptable and
the higher the NPV, the better the potential project. To calculate NPV, an appropriate interest rate (or
discount rate) needs to be defined first. This internal interest rate usually represents the minimum
acceptable rate of return (MARR) that must be earned for a project to be accepted. It is normally
adjusted to account for the uncertainties and risks associated with the project. In this study, the internal
interest rate was set at 20% as shown in Table 3.10.
Discounted cash flow rate of return also known as internal rate of return (IRR) is defined as
the interest rate at which all the cash flows are discounted in order to bring the net present value to
exactly zero. It represents the highest after-tax interest at which the project can just break even (Turton
2003). If the IRR is greater than the internal interest rate, the project is regarded to be profitable.
Among the various ways to measure profitability, DPP, NPV and DCFROR were the interests
of this study and the results of the four processes are shown in Table 3.13 including the break-even
price of biodiesel. The break-even price was defined as the price at which the revenue from selling
biodiesel product is the same as total manufacturing cost of each process in Table 3.12 (Zhang et al.,
2003). Since Table 3.12 shows before-tax values, taxes are not applied to the break-even prices.
Table 3.13. The profitability measures and the break-even price of biodiesel
Alkali-FVO Alkali-WVO SC-WVO SC-LowE
Discounted payback period (years) - 9.2 5.0 4.2
Net present value ($ millions) -26.697 1.901 16.451 21.086
Discounted cash flow rate of return (%) - 22.4 41.7 49.6
Break-even price of biodiesel ($/kg) 1.15 0.875 0.767 0.726
($/litre)a 1.00 0.762 0.668 0.632
a Density of 870.5 kg/m
3 was applied.
Except for Alkali-FVO, the NPV of each process appeared to be positive. Both of the
supercritical processes showed much higher NPV than alkali-catalyzed processes due to the lower total
manufacturing costs. The DPP of SC-WVO and SC-LowE were 5.0 and 4.2 years, respectively, which
were about 4 years shorter than Alkali-WVO. As previously stated, for Alkali-FVO process, the
margin from biodiesel and glycerol sales was not high enough to calculate the DPP and DCFROR. The
DCFROR were 22.4%, 41.7% and 49.6% for Alkali-WVO, SC-WVO and SC-LowE processes,
respectively. Since these values were higher than the MARR which was set at 20% and the NPVs were
greater than zero, all of the three processes were considered economically profitable. Overall, SC-

66
LowE was evaluated as the most favourable process, followed by SC-WVO and Alkali-WVO in order.
Alkali-FVO process was considered to be an unacceptable project.
The break-even price of biodiesel was approximately $1.00/litre for Alkali-FVO. It decreased
by 23.8% in Alkali-WVO process. This result was different from Zhang et al. (2003) where the break-
even price of Alkali-WVO ($884/tonne) was estimated to be higher than Alkali-FVO ($857/tonne).
This was due to the total manufacturing cost of Alkali-WVO being estimated to be higher than the one
of Alkali-FVO in the results of Zhang et al. (2003). In their study, the oil feed cost comprised 61.2% of
the total manufacturing cost, whereas it was 84% in Alkali-FVO process of this study. Therefore,
replacing the fresh vegetable oil with waste vegetable oil would have a greater effect in this study, thus
significantly reducing the total manufacturing cost of Alkali-WVO. The higher proportion of the oil
feed cost in this study compared to Zhang et al. (2003) appears to be derived from the larger capacity
of the plant. As the capacity of the plant increases, the indirect manufacturing cost tends to increase
relatively slower than raw material costs, resulting in a greater proportion of the raw material costs in
the total manufacturing cost.
Figure 3.3 shows the U.S. diesel retail prices including taxes from January 1995 to April 2010
(US EIA, 2010). The break-even prices of the four processes are similar to or slightly higher than the
diesel retail prices during 2009-2010. It should be noted that a plant profit and taxes were excluded and
therefore the break-even price underestimates the real commercial price of biodiesel. Thus, to make
biodiesel competitive to petroleum diesel in the fuel market, sufficient government support such as in a
form of subsidy is required.
Figure 3.3. The diesel retail prices in United States from January 1995 to April 2010 (Source: US EIA (2010))

67
3.6. Sensitivity analysis on net present value
3.6.1. Single parameter analysis
Sensitivity analysis examines the effect of positive and negative changes in project parameters
on the criteria of profitability such as NPV and DCFROR. The parameters generally examined are raw
material prices, selling prices of products, levels of capacity, project lives, interest rates, capital cost
and components, operating cost and components and salvage values.
Sensitivity analyses for the four biodiesel production processes were conducted to investigate
the sensitivity of the NPV to changes in a variety of parameters. Six parameters were investigated:
price of oil feed; glycerol credit; biodiesel selling price; capacity of a plant; interest rate; and the life of
a plant. The prices of oil feed, glycerol and biodiesel were varied by ±10, 20, 30 and 40% from the
original values as shown in Table 3.4. The capacities of the plant investigated were 8,000 and 160,000
tonnes of biodiesel production per year. The interest rate varied from 10% to 40%. Finally, the
expected life of the plant was prolonged to 15 and 20 years.
The sensitivity analysis results of the oil prices are shown in Figure 3.4. The NPVs of the four
processes were significantly changed by the prices of oil feed. The results showed that every 10%
increase in the oil price approximately decreased the NPV by $15, $6.8, $6.4 and $6.4 million in
Alkali-FVO, Alkali-WVO, SC-WVO and SC-LowE, respectively. It should be noted that the absolute
value of the percentage of the oil price in Figure 3.4 is higher in Alkali-FVO than the other processes
due to the high price of the fresh vegetable oil. Alkali-FVO process was, however, more sensitive to
the oil price than any other processes even when the same absolute values of the changes in oil price
were considered. The slopes of the trend lines of each process were evaluated and shown in Figure 3.4.
The steeper the slope, the more sensitive the process is. The sensitivity to the oil price slightly
increased in order of Alkali-WVO, SC-WVO and SC-LowE.
Figure 3.5 shows the effect of changes in glycerol price on the NPV of each process. The
results indicated that an increase of $0.92 and $0.89 million in NPV of SC-WVO and SC-LowE,
respectively, could be caused by an increase of $0.086/kg in the price of crude glycerol. An increase of
$0.132/kg in the price of pharmaceutical grade glycerol resulted in an increase of $2.1 and $1.31
million in the NPV of Alkali-FVO and Alkali-WVO, respectively. For Alkali-WVO process, the NPV
turned to negative value as the glycerol price was decreased by 15%. Overall, the influence of glycerol
credit is much less than the influence of the prices of oil feed.
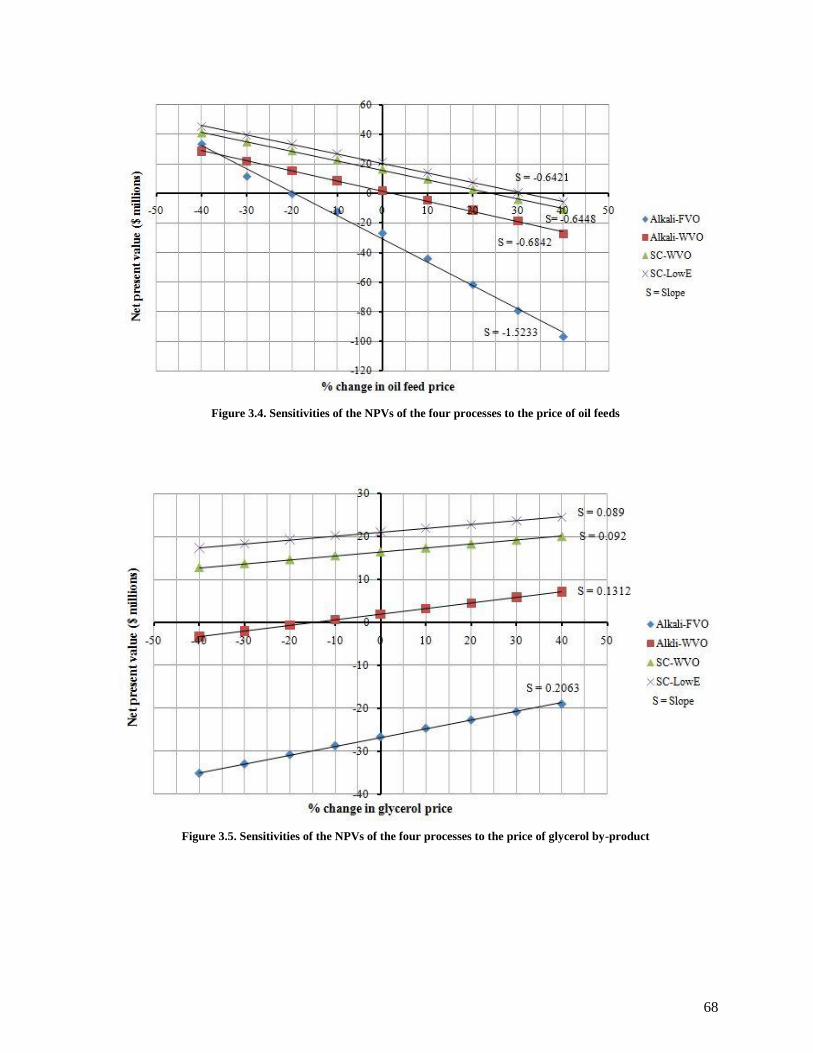
68
Figure 3.4. Sensitivities of the NPVs of the four processes to the price of oil feeds
Figure 3.5. Sensitivities of the NPVs of the four processes to the price of glycerol by-product
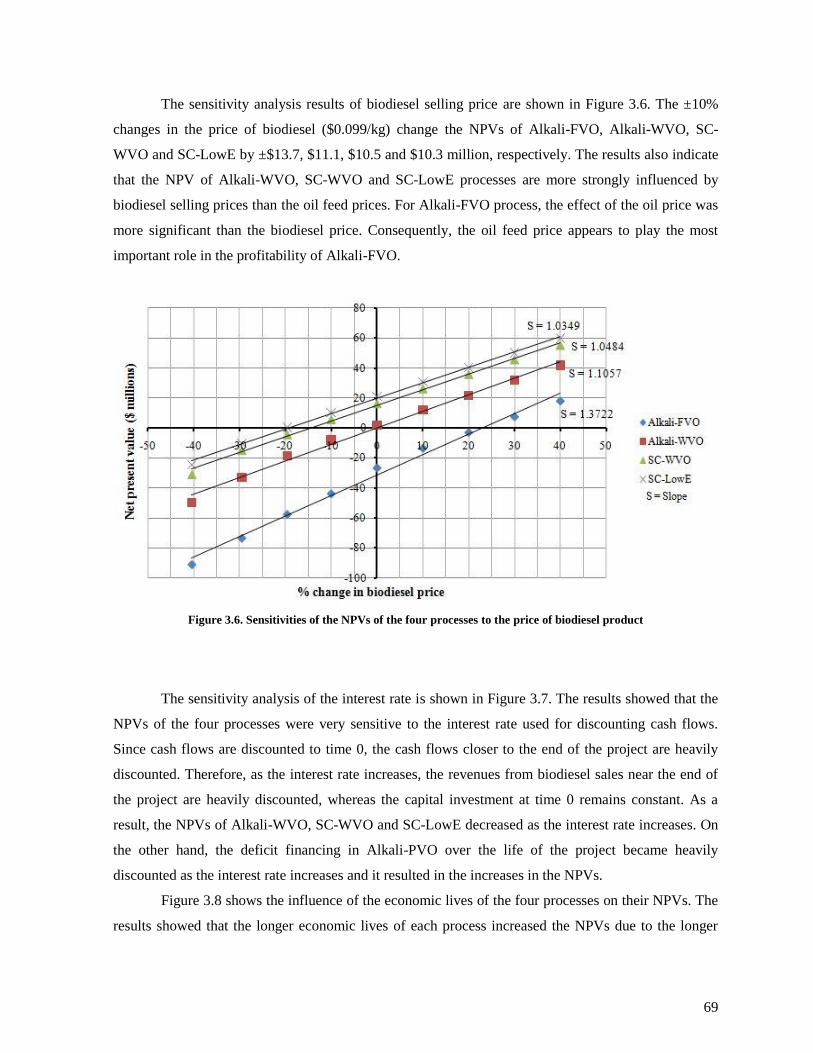
69
The sensitivity analysis results of biodiesel selling price are shown in Figure 3.6. The ±10%
changes in the price of biodiesel ($0.099/kg) change the NPVs of Alkali-FVO, Alkali-WVO, SC-
WVO and SC-LowE by ±$13.7, $11.1, $10.5 and $10.3 million, respectively. The results also indicate
that the NPV of Alkali-WVO, SC-WVO and SC-LowE processes are more strongly influenced by
biodiesel selling prices than the oil feed prices. For Alkali-FVO process, the effect of the oil price was
more significant than the biodiesel price. Consequently, the oil feed price appears to play the most
important role in the profitability of Alkali-FVO.
Figure 3.6. Sensitivities of the NPVs of the four processes to the price of biodiesel product
The sensitivity analysis of the interest rate is shown in Figure 3.7. The results showed that the
NPVs of the four processes were very sensitive to the interest rate used for discounting cash flows.
Since cash flows are discounted to time 0, the cash flows closer to the end of the project are heavily
discounted. Therefore, as the interest rate increases, the revenues from biodiesel sales near the end of
the project are heavily discounted, whereas the capital investment at time 0 remains constant. As a
result, the NPVs of Alkali-WVO, SC-WVO and SC-LowE decreased as the interest rate increases. On
the other hand, the deficit financing in Alkali-PVO over the life of the project became heavily
discounted as the interest rate increases and it resulted in the increases in the NPVs.
Figure 3.8 shows the influence of the economic lives of the four processes on their NPVs. The
results showed that the longer economic lives of each process increased the NPVs due to the longer

70
period of time to gain revenues from the biodiesel sales. As the economic life was prolonged from 10
to 20 years, the NPVs were increased by $3.51, $10.6, $13.7 and $14.6 million, respectively, in Alkali-
FVO, Alkali-WVO, SC-WVO and SC-LowE processes.
Figure 3.7. Sensitivities of the NPVs of the four processes to interest rates
Figure 3.8. Sensitivities of the NPVs of the four processes to the life of projects
A capacity of a plant is another important factor that varies profitability of a project. Due to
the growing concerns about preserving environment, many countries around the world have
encouraged to use eco-friendly energy sources such as biodiesel. As an example, in June 2008, the

71
Canadian federal government announced plans to use of biodiesel and ethanol in Canada‘s energy
supply. According to the plans, the renewable fuels standard would require 5% renewable content in
gasoline by 2010 and 2% renewable content in diesel and home heating oil by 2010. The mandated
renewable content in diesel is approximately equivalent to 435,000 tonnes per year based on 25 × 106
m3 of annual Canadian diesel fuel market. In the United States, the US Environmental Protection
Agency (EPA) released proposed revisions to the National Renewable Fuel Standard program which
was established under the Energy Policy Act of 2005 (EPA, 2009). The revised statutory requirements
establish new specific volume standards for cellulosic biofuel, biomass-based diesel, advanced biofuel,
and total renewable fuel that must be used in transportation fuel each year as shown in Table 3.14.
Table 3.14. Renewable fuel volume requirements for renewable fuel standard (RFS2) from 2009 to 2015 for the U.S.
(Source: EPA (2009)) (units: 106 m3)
Year Biomass-based diesel Cellulosic biofuel Total advanced biofuel Total renewable fuel
2009 1.9 - 2.3 42.0
2010 2.5 0.38 3.6 49.0
2011 3.0 0.95 5.1 52.8
2012 3.8 1.9 7.6 58.0
2013 3.8 3.8 10.4 62.6
2014 3.8 6.6 14.2 68.7
2015 3.8 11 21 78
Based on the expected increase in biodiesel demand, the biodiesel production capacities of the
four processes were expanded from 40,000 to 160,000 tonnes per year. In addition, a smaller scale of
8000 tonnes per year was investigated, which appears most frequently in literatures (Zhang et al., 2003;
Kasteren and Nisworo, 2007; West et al., 2008; You et al., 2008; Lim et al., 2009). The two capacities,
8,000 and 160,000 tonnes per year, were firstly simulated in Hysys for the four different processes,
namely Alkali-FVO, Alkali-WVO, SC-WVO and SC-LowE. Then each simulation was evaluated in
IPE in the manner as described in from Sections 3.2 through 3.4. The details of the total capital
investment and total manufacturing cost are shown in Tables A.1 and A.2 in Appendix A. The total
capital investments, net present values and break-even prices of biodiesel are shown in Figure 3.9.
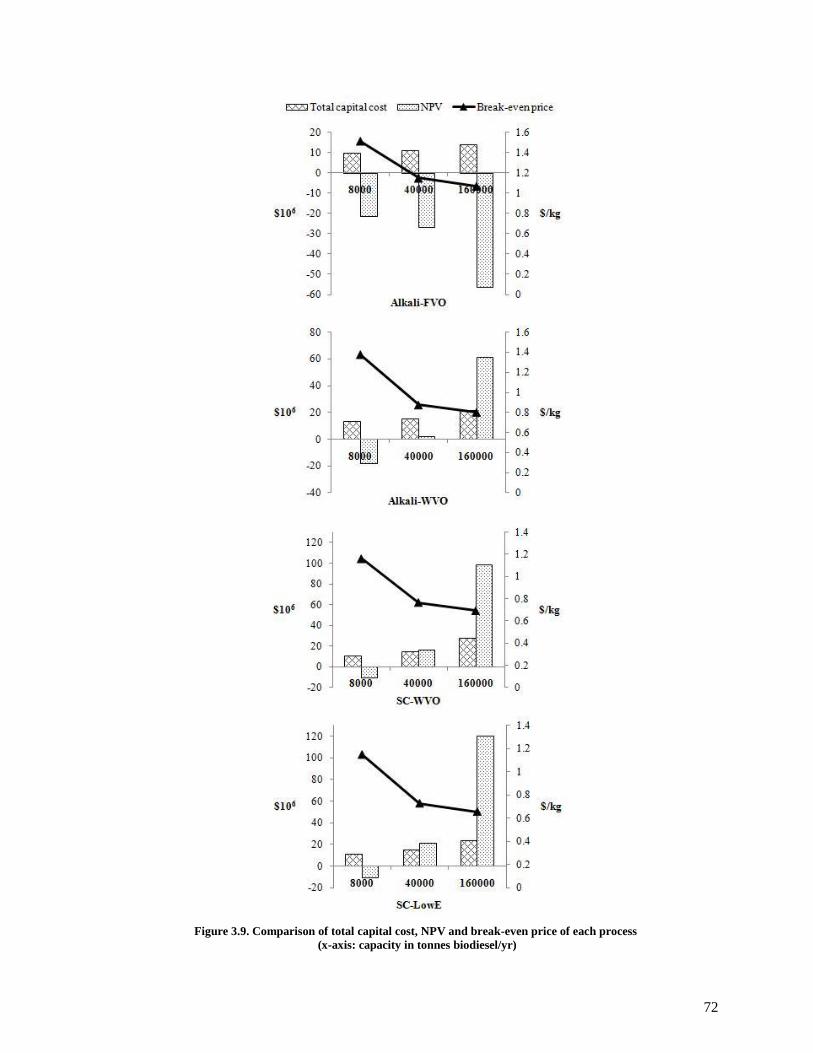
72
Figure 3.9. Comparison of total capital cost, NPV and break-even price of each process
(x-axis: capacity in tonnes biodiesel/yr)
73
As the capacity diminished to 8,000 tonnes biodiesel/yr, the NPVs of all the four processes
became negative values, indicating the production capacity was too small to make enough revenue to
recover total capital investment. At the capacity of 160,000 tonnes biodiesel/yr, every process showed
high NPVs except for Alkali-FVO process. Due to high prices of the raw materials compared to
biodiesel price in Alkali-FVO, the total manufacturing costs for biodiesel were higher than the revenue
from biodiesel sales at every capacity, resulting in a lower NPV in Alkali-FVO process as the capacity
was expanded. It is noticeable in Figure 3.9 that total capital costs are slow to increase as the
production capacity increases, implying a larger production capacity augments profitability of a
biodiesel production process because of its relatively small amount of capital costs, conforming to the
trend reported by Kasteren and Nisworo (2007). However, compared with the results in Kasteren and
Nisworo (2007), the capital costs for the capacity of 8,000 tonnes/yr of this study are thought to be
overestimated. The reason for the highly estimated total capital costs appeared to be derived from the
costs for instrumentation and indirect costs. As seen in Table A.1, for the four types of processes, the
purchased equipment costs increased 3.9‒7.7 times as the capacity increased 20 folds (from 8,000 to
160,000 tonnes/yr); whereas, the other costs such as equipment setting, piping, civil, instrumentation,
electrical, insulation, others, contract fee, and contingencies increased less than double. Furthermore,
these costs were given a great deal of weight on the total capital investments at the capacity of 8,000
tonnes/yr. In IPE, the costs for theseitems can be manipulated by changing material and man-hour
indexes for process equipment and installation bulks. Therefore, for the small capacity, the indexes for
the items seem to have to be properly adjusted in the stage of specifying general specifications.
3.6.2. Multiple parameters
In Section 3.6.1, the effects of a single parameter on the profitability of the biodiesel
production processes were studied. In reality, however, most of the parameters continuously change
over time in an irregular way and the actual values of these parameters are occasionally unknown at
the time of evaluation. In addition, the parameters are more likely to vary simultaneously. Nevertheless,
there are not sufficient research findings on the effect of multiple parameters on the profitability of
biodiesel production processes. Therefore, the objective of this section was to obtain further statistical
analysis data using the design of experiments to investigate the effects of simultaneous changes in the
parameters. The investigated processes were Alkali-FVO, Alkali-WVO, SC-WVO and SC-LowE at
the capacity of 40,000 tonnes biodiesel/year.
The design of experiment selected was Response Surface Method (RSM) coupled with Central
Composite Design (CCD) using JMP 8 software (SAS Institute Inc.). The parameters investigated were
the prices of oil feed, biodiesel and glycerol and the interest rate because the four parameters were

74
found to have the most significant effects on the NPVs in Section 3.6.1. The response was the NPV of
each process. Table 3.15 shows the four parameters at the different levels used in the design of
experiments. After experimental tables were made for each of the processes, the NPV was calculated
using IPE. The calculated NPVs of Alkali-FVO are shown in Table A.3 in Appendix A. The results of
the Analysis of Variance (ANOVA) of Alkali-FVO process are shown Table 3.16.
Table 3.15. The four parameters in central composite design to investigate NPVs of Alkali-FVO, Alkali-WVO, SC-
WVO and SC-LowE processes
Variables Specification Unit Level
a - 0 + A
Oil feed price FVO $/kg 0.1832 0.5496 0.916 1.2824 1.6488
WVO 0.106 0.318 0.53 0.742 0.954
Biodiesel price - $/kg 0.198 0.594 0.99 1.386 1.782
Glycerol price pharmaceutical $/kg 0.2646 0.7938 1.323 1.8522 2.3814
crude 0.172 0.516 0.86 1.204 1.548
Interest rate - % 0 10 20 30 40
Table 3.16. Analysis of variance and effect tests for each parameter of Alkali-FVO process
Analysis of Variance
Source Degree of
Freedom Sum of Squares Mean Square F ratio Prob >F
Model 14 207532.33 14823.7 233.3583 < 0.0001
Effect Tests
Term Estimate Sum of Squares F ratio Prob >F
Biodiesel price 57.9212 80516.909 1267.514 < 0.0001*
FVO price -63.9471 98141.507 1544.964 < 0.0001*
Glycerol price 8.4131 1698.719 26.7416 < 0.0001*
Interest rate 7.3551 1298.334 20.4386 0.0002*
Biodiesel price × FVO price 12.7501 2601.051 40.9463 < 0.0001*
Biodiesel price × Glycerol price -1.0057 16.185 0.2548 0.6190
FVO price × Glycerol price 1.0315 17.024 0.2680 0.6101
Biodiesel price × Interest rate -24.8585 9887.120 155.6451 < 0.0001*
FVO price × Interest rate 26.0840 10886.001 171.3697 < 0.0001*
Glycerol price × Interest rate -3.5249 198.796 3.1295 0.0914
Biodiesel price × Biodiesel price -5.6084 1006.531 15.8450 0.0007*
FVO price × FVO price -6.2336 1243.467 19.5749 0.0002*
Glycerol price × Glycerol price -0.6793 14.765 0.2324 0.6347
Interest rate × Interest rate -0.4300 5.917 0.0932 0.7632
75
The predicted formula of NPV was derived from the linear combination of the parameters and
the values of their corresponding estimates. The prediction formula of the NPV can be expressed with
the fourteen terms in Table 3.16 plus an intercept. The formula can be expressed in a simpler form
after eliminating insignificant parameters. Looking for a F-ratio greater than 2 in absolute value or
using the 0.05 significance level (Prob >F is lower than 0.05) is a common rule of thumb for judging
the significance of the parameter. After eliminating the insignificant terms, the NPV was finally
expressed in coded factors as shown in Equation (3.9).
𝑁𝑃𝑉 = −26.697 + 57.9212 𝐴 − 63.9471 𝐵 + 8.4131 𝐶 + 7.3551 𝐷 + 12.7501 𝐴𝐵
−24.8585 𝐴𝐷 + 26.084 𝐵𝐷 − 5.6084 𝐴2 − 6.2336 𝐵2 (3.9)
where 𝐴 = (biodiesel price($/kg) – 0.99)/0.396, 𝐵 = (FVO price ($/kg) – 0.916)/0.3664, 𝐶 = (glycerol
price ($/kg) – 1.323)/0.5292, and 𝐷 = (interest rate (%) – 20)/10.
A, B, C and D are expressed in the form of (Xi – Xi,0)/∆Xi where Xi,0 is the value at level 0 and ∆Xi is a
difference value of adjacent levels in Table 3.15. The ranges for biodiesel price, FVO price,
pharmaceutical-grade glycerol price, and interest rate are: 0.198≤ biodiesel price ($/kg) ≤1.782,
0.1832≤ FVO price ($/kg) ≤1.6488, 0.2646≤ pharmaceutical glycerol price ($/kg) ≤2.3814, and 0≤
interest rate (%) ≤40, respectively.
Figure 3.10 shows the comparison of actual NPV values and those calculated by Equation
(3.9). The solid and dotted lines represent the line of perfect fit and the 0.05 significance curve,
respectively. As a point stands close to the line of perfect fit, the error between the actual and predicted
values becomes zero. The data points in Figure 3.10 are contiguous to the line of perfect fit. The
calculated R2 was 0.99. Therefore, it is expected that the formula can be used as relatively simple
means to predict profitability of Alkali-FVO process from any of the combinations of the oil feed price,
glycerol price, biodiesel selling price and interest rate within the ranges in Table 3.15.
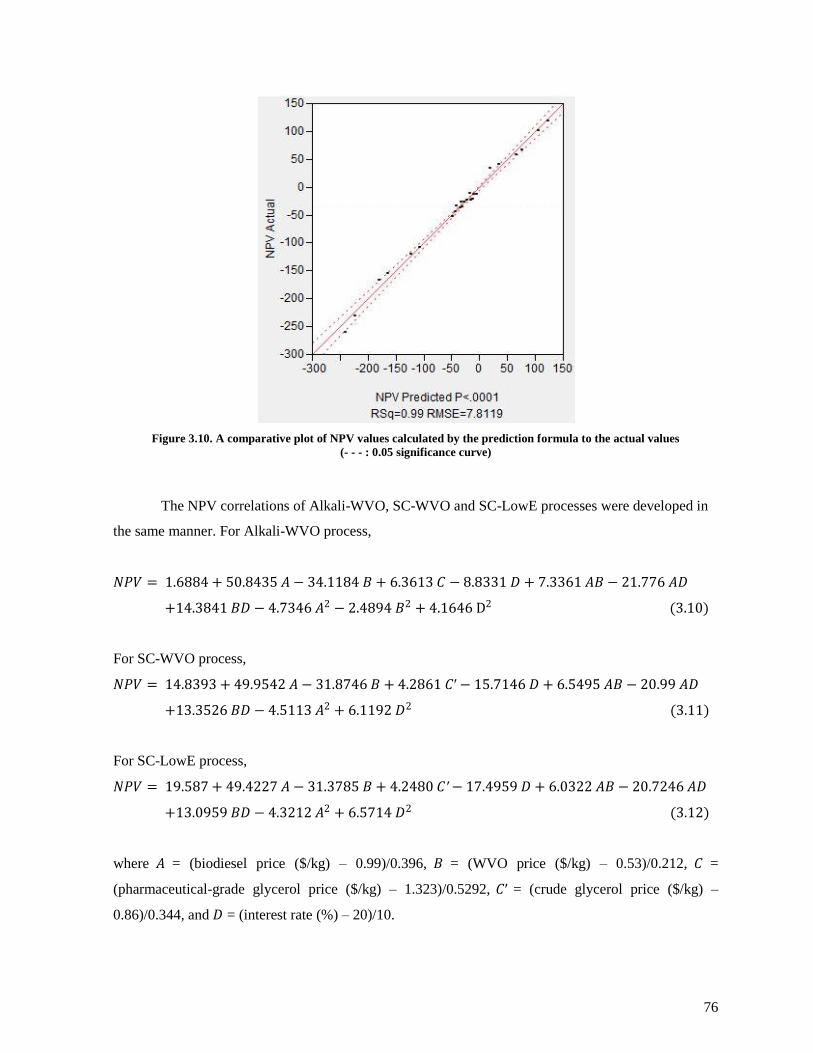
76
Figure 3.10. A comparative plot of NPV values calculated by the prediction formula to the actual values
(- - - : 0.05 significance curve)
The NPV correlations of Alkali-WVO, SC-WVO and SC-LowE processes were developed in
the same manner. For Alkali-WVO process,
𝑁𝑃𝑉 = 1.6884 + 50.8435 𝐴 − 34.1184 𝐵 + 6.3613 𝐶 − 8.8331 𝐷 + 7.3361 𝐴𝐵 − 21.776 𝐴𝐷
+14.3841 𝐵𝐷 − 4.7346 𝐴2 − 2.4894 𝐵2 + 4.1646 D2 (3.10)
For SC-WVO process,
𝑁𝑃𝑉 = 14.8393 + 49.9542 𝐴 − 31.8746 𝐵 + 4.2861 𝐶′ − 15.7146 𝐷 + 6.5495 𝐴𝐵 − 20.99 𝐴𝐷
+13.3526 𝐵𝐷 − 4.5113 𝐴2 + 6.1192 𝐷2 (3.11)
For SC-LowE process,
𝑁𝑃𝑉 = 19.587 + 49.4227 𝐴 − 31.3785 𝐵 + 4.2480 𝐶′ − 17.4959 𝐷 + 6.0322 𝐴𝐵 − 20.7246 𝐴𝐷
+13.0959 𝐵𝐷 − 4.3212 𝐴2 + 6.5714 𝐷2 (3.12)
where 𝐴 = (biodiesel price ($/kg) – 0.99)/0.396, 𝐵 = (WVO price ($/kg) – 0.53)/0.212, 𝐶 =
(pharmaceutical-grade glycerol price ($/kg) – 1.323)/0.5292, 𝐶′ = (crude glycerol price ($/kg) –
0.86)/0.344, and 𝐷 = (interest rate (%) – 20)/10.
77
The ranges for biodiesel price, WVO price, pharmaceutical-grade glycerol price, crude glycerol price,
and interest rate are: 0.198≤ biodiesel price ($/kg) ≤1.782, 0.106≤ WVO price ($/kg) ≤0.954, 0.2646≤
pharmaceutical glycerol price ($/kg) ≤2.3814, 0.172≤ crude glycerol price ($/kg) ≤1.548 and 0≤
interest rate (%) ≤40, respectively.
3.7. Conclusion
The economic assessment of the four types of biodiesel production plants: Alkali-FVO, Alkali-
WVO, SC-WVO and SC-LowE, was performed, based on the 40,000 tonnes biodiesel production per
year capacity. The assessment was done using Aspen Icarus software system which has been
successfully field-tested on worldwide commercial chemical plants, but has not been used yet in
studies on economic analysis of biodiesel plants.
The results showed that the most significant variable affecting the production cost of biodiesel
was the oil feed. It comprised 64-84% of the biodiesel manufacturing costs. The total capital cost of
Alkali-WVO process was $4.5 million higher than Alkali-FVO process due to the pre-treatment
process of waste vegetable oil, but the total production cost was around $10 million lower than Alkali-
FVO due to the low cost of the feedstock oil. The supercritical processes, SC-WVO and SC-LowE,
had similar values of total capital cost compared to Alkali-WVO. However, they had lower
manufacturing costs due to the absence of catalysts and the consequent simpler purification processes.
The estimated DPP, NPV and DCFROR indicated that SC-LowE was the most financially promising
process, followed by SC-WVO, Alkali-WVO and Alkali-FVO in order. Therefore, further research in
developing a pilot-scale continuous supercritical process is expected to be necessary.
Among the parameters investigated in the sensitivity analyses, biodiesel selling price, prices of
feedstock oil and by-product glycerol and interest rate were found to be the most significant variables
affecting the economic viability of the four processes. The four parameters were further statistically
analyzed based on the design of experiment approach using Response Surface Method coupled with
Central Composite Design. From the results, prediction formulas of the NPV were derived for each of
the four processes. The formulas can be used for various combinations of the four significant
parameter values to predict economic feasibility.
Acknowledgments
The authors acknowledge the financial support of the Natural Sciences and Engineering Research
Council of Canada.

78
Bibliography
Bender, M., 1999. Economic feasibility review for community-scale farmer cooperatives for biodiesel.
Bioresource Technology, 70, 81-87.
Bentley, R.W., 2002. Global oil & gas depletion: an overview. Energy Policy, 30(3), 189-205.
Bunyakiat, K., Makmee, S., Sawangkeaw, R. and Ngamprasertsith, S., 2006. Continuous production of
biodiesel via transesterification from vegetable oils in supercritical methanol. Energy &
Fuels, 20(2), 812-817.
Canakci, M., 2007. The potential of restaurant waste lipids as biodiesel feedstocks. Bioresource
Technology, 98(1), 183-190.
Chopey, N.P., 2004. Handbook of chemical engineering calculations, McGraw-Hill.
EPA, 2009. Regulations & Standards | Fuels and Fuels Addtives |. Available at:
http://www.epa.gov/otaq/renewablefuels/rfs2-4standards.pdf [Accessed May 21, 2010].
He, H., Wang, T. and Zhu, S., 2007. Continuous production of biodiesel fuel from vegetable oil using
supercritical methanol process. Fuel, 86(3), 442-447.
Kasteren, J.M.N.V. and Nisworo, A.P., 2007. A process model to estimate the cost of industrial scale
biodiesel production from waste cooking oil by supercritical transesterification. Resources,
Conservation and Recycling, 50(4), 442-458.
Kusdiana, D. and Saka, S., 2004. Effects of water on biodiesel fuel production by supercritical
methanol treatment. Bioresource Technology, 91(3), 289-295.
Lefebvre, B., 2009. Glycerine price sample report (US Gulf), ICIS Pricing. Available at:
http://www.icispricing.com/il_shared/Samples/SubPage170.asp [Accessed April 19, 2010].
Lim, Y., Lee, H., Lee, Y. and Han, C., 2009. Design and economic analysis of the process for biodiesel
fuel production from transesterificated rapeseed oil using supercritical methanol. Industrial
& Engineering Chemistry Research, 48(11), 5370–5378.
Luyben, W.L., 2002. Plantwide dynamic simulators in chemical processing and control, CRE Prcess
[New York].
Marulanda, V.F., Anitescu, G. and Tavlarides, L.L., 2010. Biodiesel fuels through a continuous flow
process of chicken fat supercritical transesterification. Energy & Fuels, 24(1), 253-260.
McGinn, S., 2009. Methanol price sample report (US Gulf), ICIS Pricing. Available at:
http://www.icispricing.com/il_shared/Samples/SubPage135.asp [Accessed April 19, 2010].
Santana, G.C.S., Martins, P.F., Silva, N., Batistella, C.B., Filho, R.M., Maciel, M.R.W., 2010.
Simulation and cost estimate for biodiesel production using castor oil. Chemical Engineering
Research and Design, 88(506), 626-632.
79
Seider, W.D., Seader, D. and Lewin, D.R., 2004. Product and process design principles: synthesis,
analysis, and evaluation, Wiley [New Jersey].
Silva, C., Weschenfelder, T.A., Rovani, S., Corazza, F.C., Corazza, M.L., Dariva, C. and Oliveira J.V.,
2007. Continuous production of fatty acid ethyl esters from soybean oil in compressed
ethanol. Industrial & Engineering Chemistry Research, 46(16), 5304-5309.
Turton, R., 2003. Analysis, synthesis, and design of chemical processes, Prentice Hall [New Jersey].
Tyagi, V. and Vasishtha, A., 1996. Changes in the characteristics and composition of oils during deep-
fat frying. Journal of the American Oil Chemists' Society, 73(4), 499-506.
USDA Agricultural Marketing Service, 2010b. National Weekly Ag Energy Roundup. Available at:
http://www.ams.usda.gov/mnreports/lswagenergy.pdf [Accessed April 19, 2010].
USDA Foreign Agricultural Service, 2010a. Oilseeds: World Markets and Trade. Available at:
http://www.fas.usda.gov/oilseeds/circular/2010/March/oilseedsfull03-10.pdf [Accessed April
19, 2010].
US Energy Information Administration (EIA), 2010. U.S. No 2 Diesel Retail Sales by All Sellers
Available at:
http://www.eia.doe.gov/dnav/pet/hist/LeafHandler.ashx?n=PET&s=DDR001&f=W
[Accessed May 19, 2010].
Vieitez, I., Silva, C.d., Borges, G.R., Corazza, F.C., Oliveira, J.V., Grompone, M.A. and Jachmanián I.,
2008. Continuous production of soybean biodiesel in supercritical ethanol−water mixtures.
Energy & Fuels, 22(4), 2805-2809.
West, A.H., Posarac, D. and Ellis, N., 2008. Assessment of four biodiesel production processes using
HYSYS. Plant. Bioresource Technology, 99(14), 6587-6601.
You, Y., Shie, J., Chang, C., Huang, S., Pai, C., Yu, Y. and Chang, C., 2008. Economic cost analysis
of biodiesel production: case in soybean oil. Energy & Fuels, 22(1), 182-189.
Yee, K.F., Tan, K.T., Abdullah, A.Z. and Lee, K.T., 2009. Life cycle assessment of palm biodiesel:
Revealing facts and benefits for sustainability. Applied Energy, 86(1), S189-S196.
Zhang, Y., Dubè, M.A., McLean, D.D. and Kates, M., 2003. Biodiesel production from waste cooking
oil: 2. Economic assessment and sensitivity analysis. Bioresource Technology, 90(3), 229-
240.
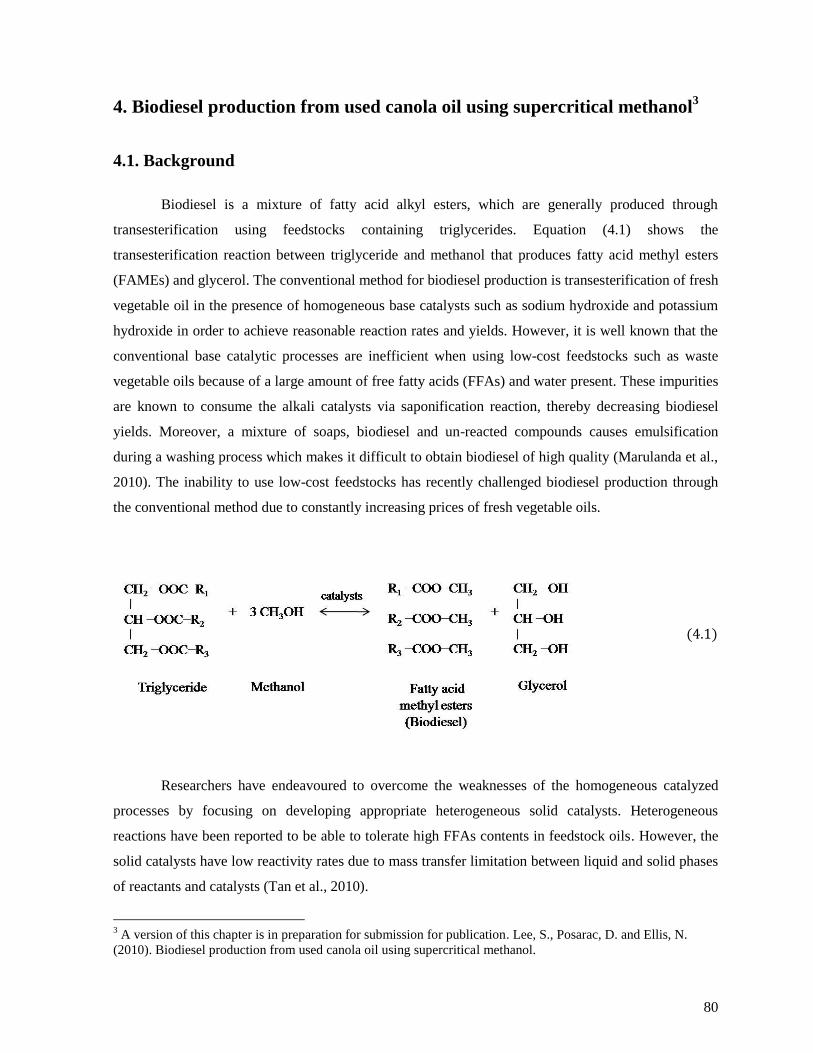
80
4. Biodiesel production from used canola oil using supercritical methanol3
4.1. Background
Biodiesel is a mixture of fatty acid alkyl esters, which are generally produced through
transesterification using feedstocks containing triglycerides. Equation (4.1) shows the
transesterification reaction between triglyceride and methanol that produces fatty acid methyl esters
(FAMEs) and glycerol. The conventional method for biodiesel production is transesterification of fresh
vegetable oil in the presence of homogeneous base catalysts such as sodium hydroxide and potassium
hydroxide in order to achieve reasonable reaction rates and yields. However, it is well known that the
conventional base catalytic processes are inefficient when using low-cost feedstocks such as waste
vegetable oils because of a large amount of free fatty acids (FFAs) and water present. These impurities
are known to consume the alkali catalysts via saponification reaction, thereby decreasing biodiesel
yields. Moreover, a mixture of soaps, biodiesel and un-reacted compounds causes emulsification
during a washing process which makes it difficult to obtain biodiesel of high quality (Marulanda et al.,
2010). The inability to use low-cost feedstocks has recently challenged biodiesel production through
the conventional method due to constantly increasing prices of fresh vegetable oils.
(4.1)
Researchers have endeavoured to overcome the weaknesses of the homogeneous catalyzed
processes by focusing on developing appropriate heterogeneous solid catalysts. Heterogeneous
reactions have been reported to be able to tolerate high FFAs contents in feedstock oils. However, the
solid catalysts have low reactivity rates due to mass transfer limitation between liquid and solid phases
of reactants and catalysts (Tan et al., 2010).
3 A version of this chapter is in preparation for submission for publication. Lee, S., Posarac, D. and Ellis, N.
(2010). Biodiesel production from used canola oil using supercritical methanol.
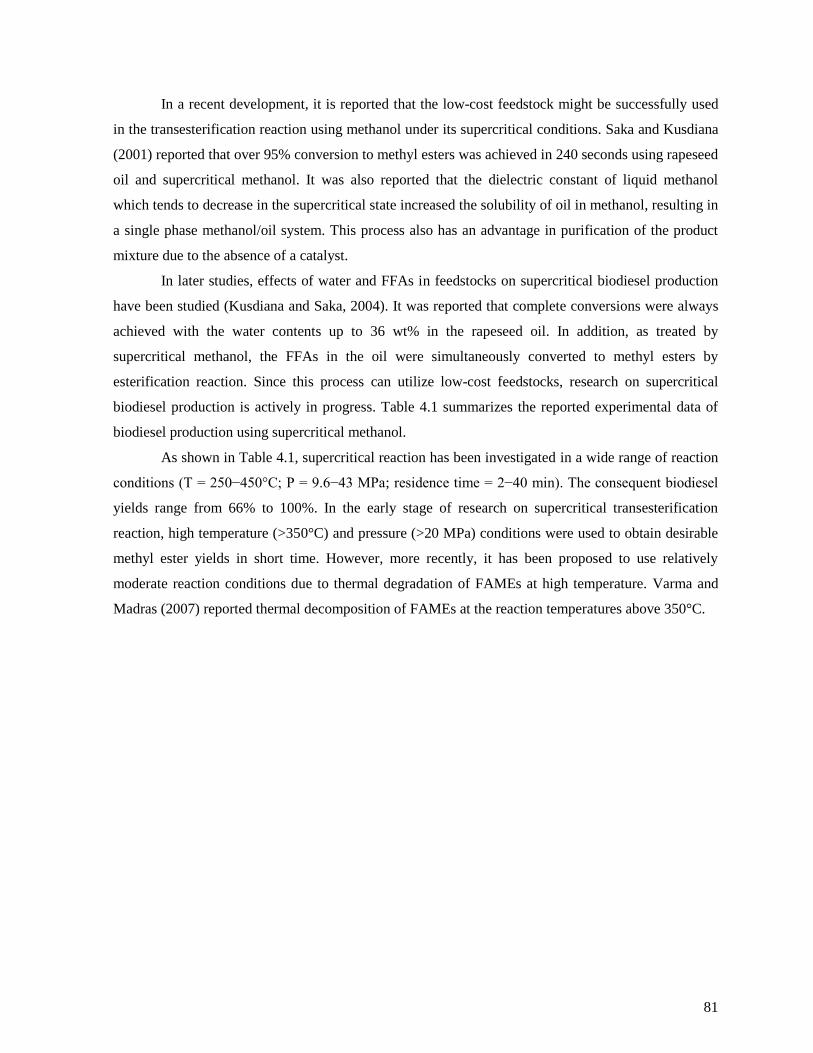
81
In a recent development, it is reported that the low-cost feedstock might be successfully used
in the transesterification reaction using methanol under its supercritical conditions. Saka and Kusdiana
(2001) reported that over 95% conversion to methyl esters was achieved in 240 seconds using rapeseed
oil and supercritical methanol. It was also reported that the dielectric constant of liquid methanol
which tends to decrease in the supercritical state increased the solubility of oil in methanol, resulting in
a single phase methanol/oil system. This process also has an advantage in purification of the product
mixture due to the absence of a catalyst.
In later studies, effects of water and FFAs in feedstocks on supercritical biodiesel production
have been studied (Kusdiana and Saka, 2004). It was reported that complete conversions were always
achieved with the water contents up to 36 wt% in the rapeseed oil. In addition, as treated by
supercritical methanol, the FFAs in the oil were simultaneously converted to methyl esters by
esterification reaction. Since this process can utilize low-cost feedstocks, research on supercritical
biodiesel production is actively in progress. Table 4.1 summarizes the reported experimental data of
biodiesel production using supercritical methanol.
As shown in Table 4.1, supercritical reaction has been investigated in a wide range of reaction
conditions (T = 250−450°C; P = 9.6−43 MPa; residence time = 2−40 min). The consequent biodiesel
yields range from 66% to 100%. In the early stage of research on supercritical transesterification
reaction, high temperature (>350°C) and pressure (>20 MPa) conditions were used to obtain desirable
methyl ester yields in short time. However, more recently, it has been proposed to use relatively
moderate reaction conditions due to thermal degradation of FAMEs at high temperature. Varma and
Madras (2007) reported thermal decomposition of FAMEs at the reaction temperatures above 350°C.
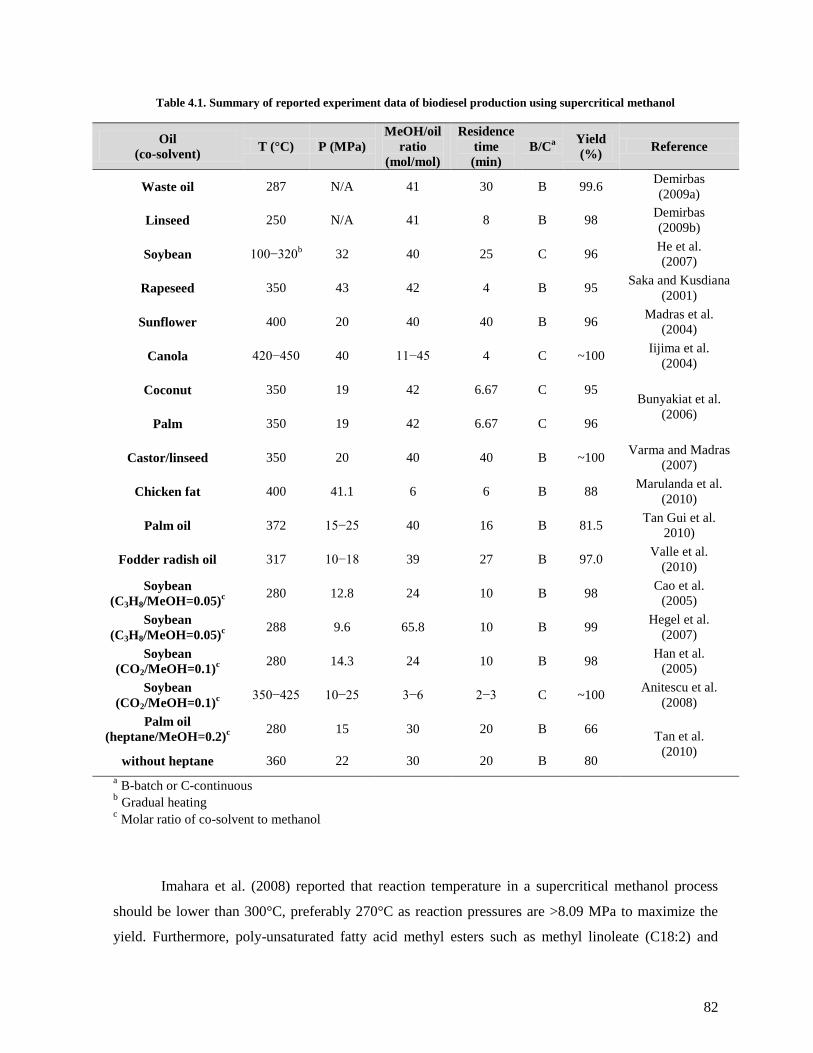
82
Table 4.1. Summary of reported experiment data of biodiesel production using supercritical methanol
Oil
(co-solvent) T (°C) P (MPa)
MeOH/oil
ratio
(mol/mol)
Residence
time
(min)
B/Ca
Yield
(%) Reference
Waste oil 287 N/A 41 30 B 99.6 Demirbas
(2009a)
Linseed 250 N/A 41 8 B 98 Demirbas
(2009b)
Soybean 100−320b 32 40 25 C 96
He et al.
(2007)
Rapeseed 350 43 42 4 B 95 Saka and Kusdiana
(2001)
Sunflower 400 20 40 40 B 96 Madras et al.
(2004)
Canola 420−450 40 11−45 4 C ~100 Iijima et al.
(2004)
Coconut 350 19 42 6.67 C 95 Bunyakiat et al.
(2006) Palm 350 19 42 6.67 C 96
Castor/linseed 350 20 40 40 B ~100 Varma and Madras
(2007)
Chicken fat 400 41.1 6 6 B 88 Marulanda et al.
(2010)
Palm oil 372 15−25 40 16 B 81.5 Tan Gui et al.
2010)
Fodder radish oil 317 10−18 39 27 B 97.0 Valle et al.
(2010)
Soybean
(C3H8/MeOH=0.05)c 280 12.8 24 10 B 98
Cao et al.
(2005)
Soybean
(C3H8/MeOH=0.05)c 288 9.6 65.8 10 B 99
Hegel et al.
(2007)
Soybean
(CO2/MeOH=0.1)c 280 14.3 24 10 B 98
Han et al.
(2005)
Soybean
(CO2/MeOH=0.1)c 350−425 10−25 3−6 2−3 C ~100
Anitescu et al.
(2008)
Palm oil
(heptane/MeOH=0.2)c
280 15 30 20 B 66 Tan et al.
(2010) without heptane 360 22 30 20 B 80
a B-batch or C-continuous
b Gradual heating
c Molar ratio of co-solvent to methanol
Imahara et al. (2008) reported that reaction temperature in a supercritical methanol process
should be lower than 300°C, preferably 270°C as reaction pressures are >8.09 MPa to maximize the
yield. Furthermore, poly-unsaturated fatty acid methyl esters such as methyl linoleate (C18:2) and
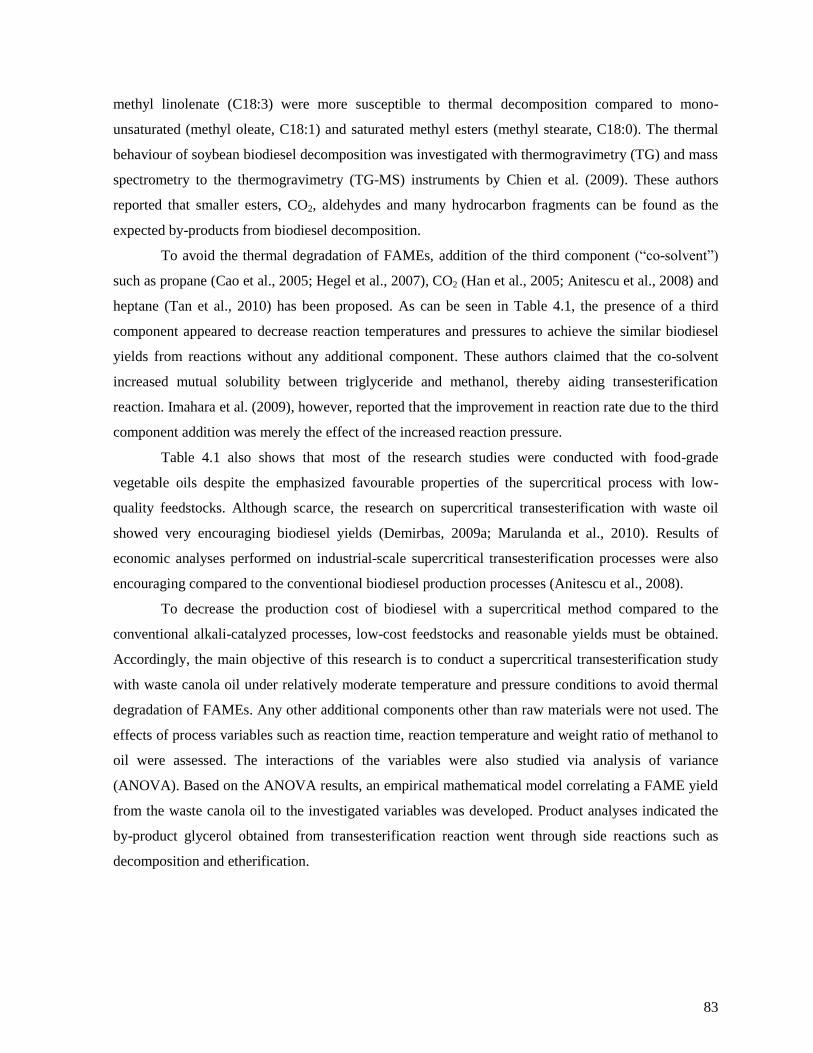
83
methyl linolenate (C18:3) were more susceptible to thermal decomposition compared to mono-
unsaturated (methyl oleate, C18:1) and saturated methyl esters (methyl stearate, C18:0). The thermal
behaviour of soybean biodiesel decomposition was investigated with thermogravimetry (TG) and mass
spectrometry to the thermogravimetry (TG-MS) instruments by Chien et al. (2009). These authors
reported that smaller esters, CO2, aldehydes and many hydrocarbon fragments can be found as the
expected by-products from biodiesel decomposition.
To avoid the thermal degradation of FAMEs, addition of the third component (―co-solvent‖)
such as propane (Cao et al., 2005; Hegel et al., 2007), CO2 (Han et al., 2005; Anitescu et al., 2008) and
heptane (Tan et al., 2010) has been proposed. As can be seen in Table 4.1, the presence of a third
component appeared to decrease reaction temperatures and pressures to achieve the similar biodiesel
yields from reactions without any additional component. These authors claimed that the co-solvent
increased mutual solubility between triglyceride and methanol, thereby aiding transesterification
reaction. Imahara et al. (2009), however, reported that the improvement in reaction rate due to the third
component addition was merely the effect of the increased reaction pressure.
Table 4.1 also shows that most of the research studies were conducted with food-grade
vegetable oils despite the emphasized favourable properties of the supercritical process with low-
quality feedstocks. Although scarce, the research on supercritical transesterification with waste oil
showed very encouraging biodiesel yields (Demirbas, 2009a; Marulanda et al., 2010). Results of
economic analyses performed on industrial-scale supercritical transesterification processes were also
encouraging compared to the conventional biodiesel production processes (Anitescu et al., 2008).
To decrease the production cost of biodiesel with a supercritical method compared to the
conventional alkali-catalyzed processes, low-cost feedstocks and reasonable yields must be obtained.
Accordingly, the main objective of this research is to conduct a supercritical transesterification study
with waste canola oil under relatively moderate temperature and pressure conditions to avoid thermal
degradation of FAMEs. Any other additional components other than raw materials were not used. The
effects of process variables such as reaction time, reaction temperature and weight ratio of methanol to
oil were assessed. The interactions of the variables were also studied via analysis of variance
(ANOVA). Based on the ANOVA results, an empirical mathematical model correlating a FAME yield
from the waste canola oil to the investigated variables was developed. Product analyses indicated the
by-product glycerol obtained from transesterification reaction went through side reactions such as
decomposition and etherification.
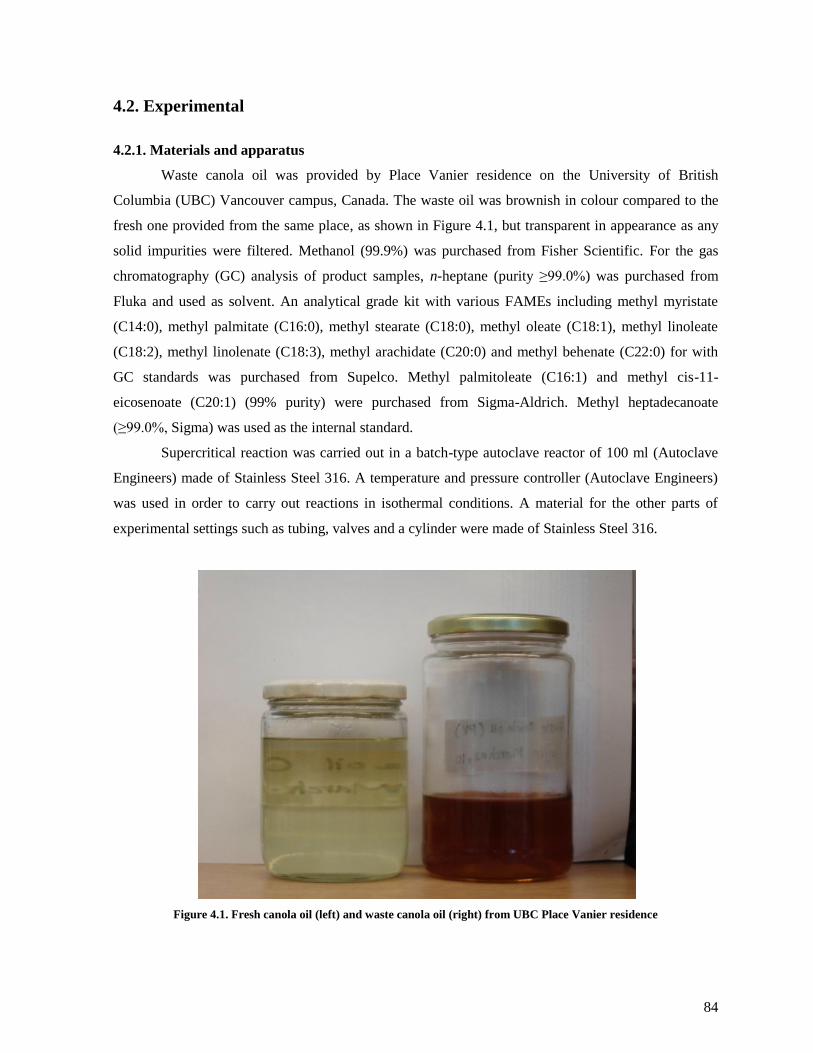
84
4.2. Experimental
4.2.1. Materials and apparatus
Waste canola oil was provided by Place Vanier residence on the University of British
Columbia (UBC) Vancouver campus, Canada. The waste oil was brownish in colour compared to the
fresh one provided from the same place, as shown in Figure 4.1, but transparent in appearance as any
solid impurities were filtered. Methanol (99.9%) was purchased from Fisher Scientific. For the gas
chromatography (GC) analysis of product samples, n-heptane (purity ≥99.0%) was purchased from
Fluka and used as solvent. An analytical grade kit with various FAMEs including methyl myristate
(C14:0), methyl palmitate (C16:0), methyl stearate (C18:0), methyl oleate (C18:1), methyl linoleate
(C18:2), methyl linolenate (C18:3), methyl arachidate (C20:0) and methyl behenate (C22:0) for with
GC standards was purchased from Supelco. Methyl palmitoleate (C16:1) and methyl cis-11-
eicosenoate (C20:1) (99% purity) were purchased from Sigma-Aldrich. Methyl heptadecanoate
(≥99.0%, Sigma) was used as the internal standard.
Supercritical reaction was carried out in a batch-type autoclave reactor of 100 ml (Autoclave
Engineers) made of Stainless Steel 316. A temperature and pressure controller (Autoclave Engineers)
was used in order to carry out reactions in isothermal conditions. A material for the other parts of
experimental settings such as tubing, valves and a cylinder were made of Stainless Steel 316.
Figure 4.1. Fresh canola oil (left) and waste canola oil (right) from UBC Place Vanier residence
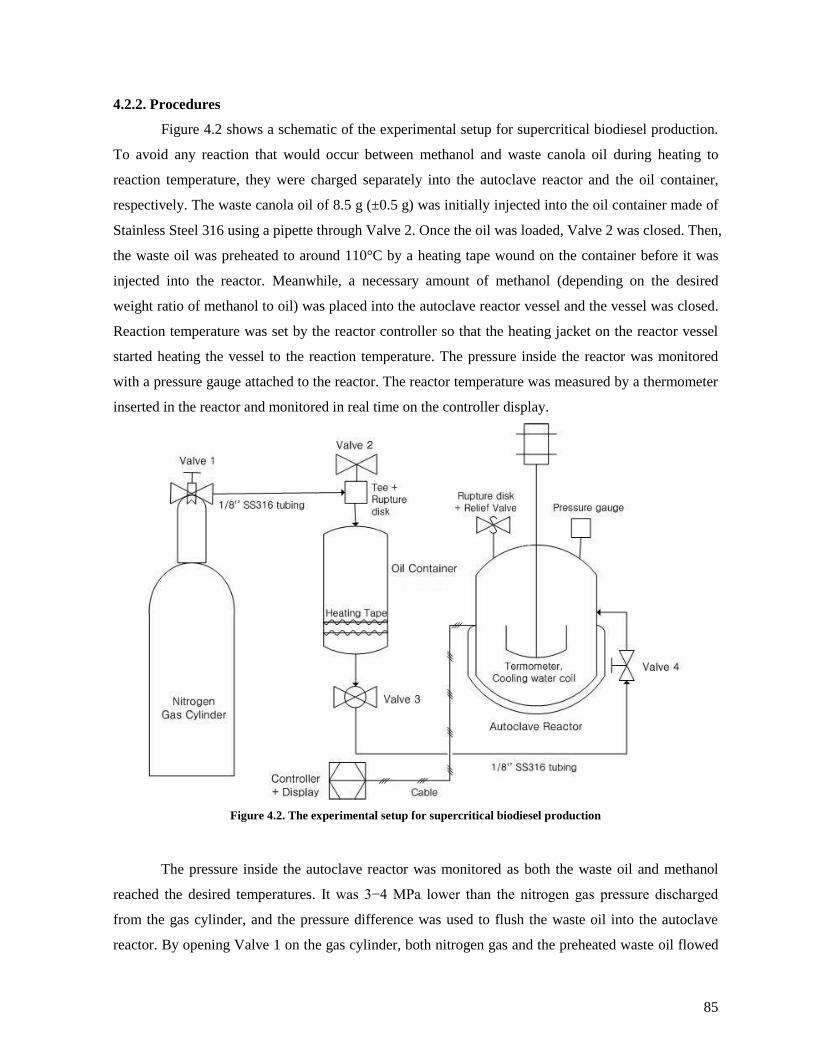
85
4.2.2. Procedures
Figure 4.2 shows a schematic of the experimental setup for supercritical biodiesel production.
To avoid any reaction that would occur between methanol and waste canola oil during heating to
reaction temperature, they were charged separately into the autoclave reactor and the oil container,
respectively. The waste canola oil of 8.5 g (±0.5 g) was initially injected into the oil container made of
Stainless Steel 316 using a pipette through Valve 2. Once the oil was loaded, Valve 2 was closed. Then,
the waste oil was preheated to around 110°C by a heating tape wound on the container before it was
injected into the reactor. Meanwhile, a necessary amount of methanol (depending on the desired
weight ratio of methanol to oil) was placed into the autoclave reactor vessel and the vessel was closed.
Reaction temperature was set by the reactor controller so that the heating jacket on the reactor vessel
started heating the vessel to the reaction temperature. The pressure inside the reactor was monitored
with a pressure gauge attached to the reactor. The reactor temperature was measured by a thermometer
inserted in the reactor and monitored in real time on the controller display.
Figure 4.2. The experimental setup for supercritical biodiesel production
The pressure inside the autoclave reactor was monitored as both the waste oil and methanol
reached the desired temperatures. It was 3−4 MPa lower than the nitrogen gas pressure discharged
from the gas cylinder, and the pressure difference was used to flush the waste oil into the autoclave
reactor. By opening Valve 1 on the gas cylinder, both nitrogen gas and the preheated waste oil flowed
86
to Valve 4. Then, the nitrogen gas and oil were injected into the autoclave as Valve 4 opened. The
reactor temperature dropped around 10°C from the original temperature with the injection of waste oil,
but increased back within a minute due to relatively small amount of the oil. Meanwhile, the autoclave
reactor was pressurized with nitrogen until the reaction pressure of 10 MPa was achieved, and then
Valve 4 was closed. Reaction time was measured from the time when the oil and nitrogen were
injected. The reactor temperature was kept at ±4°C during the reaction by the controller, while chilled
water immediately kicked in through the coil to quench the reaction after the desired reaction time. As
a result, the temperature inside the reactor dropped below 200°C within 30 seconds. Consequently the
pressure also dropped. Once the reactor temperature dropped to 20°C, the remaining pressures inside
the oil container and autoclave were released by opening Valve 2 and Relief valve. Then, the reactor
vessel was opened and the product was analyzed by gas chromatography.
4.2.3. Analytical procedure
The acid number (mg KOH/g) of the waste oil was determined by titration with potassium
hydroxide solution (0.1 wt% KOH in distilled water). 10 ml of 2-propanol was added to 1 g of the
waste canola oil in a 250 ml flask. A few drops of phenophtalein indicator were added into the flask
and it was titrated with the KOH solution until a distinct and sharp end point was noted. The solution
in the flask was kept stirred using a magnetic stirrer during titration. The procedure was repeated three
times and the averaged value was determined as the final acid number of the waste canola oil. Since
the waste canola oil contained no free acids other than fatty acids, the acid number was converted to
percent free fatty acids by a suitable factor (1.99) as described in ASTM D5555-95.
The water content for the waste oil was assessed by means of Karl Fischer (KF) volumetric
titration using 794 Basic Titrino apparatus from Metrohm shown in Figure 4.3. The KF volumetric
reagent was purchased from Fisher Scientific. Extra dry methanol (water <50 ppm) purchased from
Acros Organics was used as the solvent. Before analyzing the waste oil sample, the titer value of the
KF reagent (the amount of water titrated by 1 ml of KF reagent) was checked using distilled water as
recommended by Metrohm. Triplicate runs were performed on the water content analysis for all
samples. The details of the procedure and titration reports are included in Appendix B.
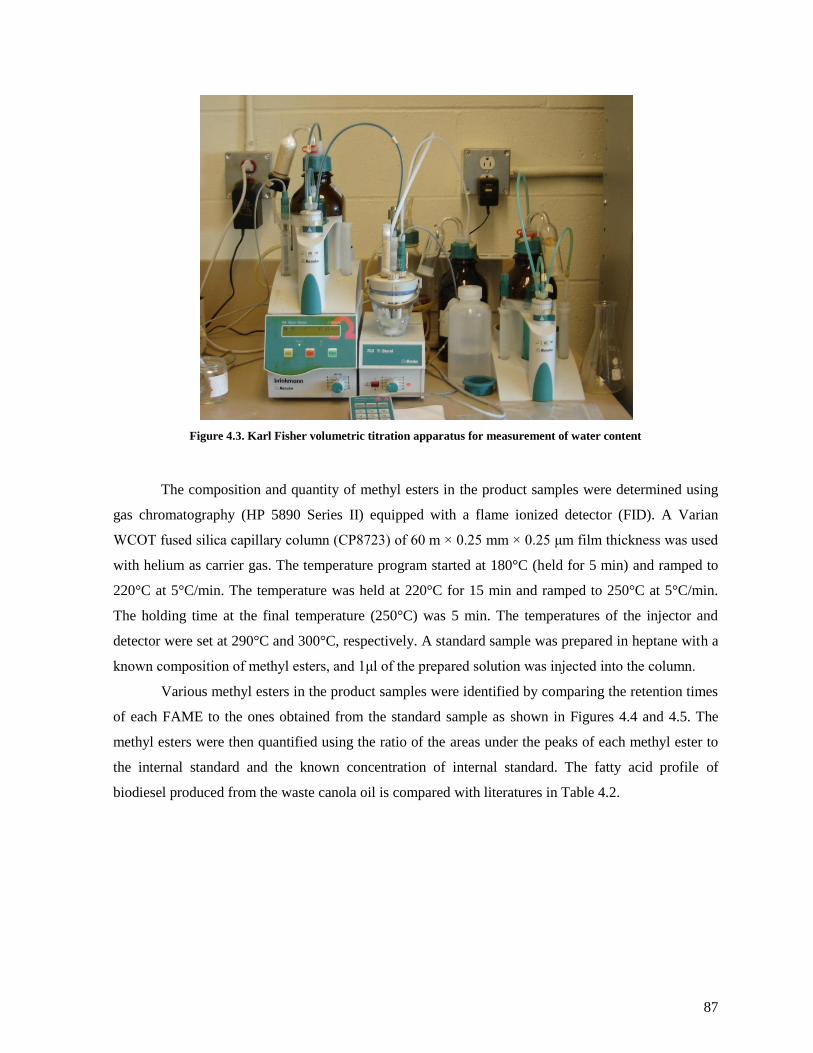
87
Figure 4.3. Karl Fisher volumetric titration apparatus for measurement of water content
The composition and quantity of methyl esters in the product samples were determined using
gas chromatography (HP 5890 Series II) equipped with a flame ionized detector (FID). A Varian
WCOT fused silica capillary column (CP8723) of 60 m × 0.25 mm × 0.25 μm film thickness was used
with helium as carrier gas. The temperature program started at 180°C (held for 5 min) and ramped to
220°C at 5°C/min. The temperature was held at 220°C for 15 min and ramped to 250°C at 5°C/min.
The holding time at the final temperature (250°C) was 5 min. The temperatures of the injector and
detector were set at 290°C and 300°C, respectively. A standard sample was prepared in heptane with a
known composition of methyl esters, and 1μl of the prepared solution was injected into the column.
Various methyl esters in the product samples were identified by comparing the retention times
of each FAME to the ones obtained from the standard sample as shown in Figures 4.4 and 4.5. The
methyl esters were then quantified using the ratio of the areas under the peaks of each methyl ester to
the internal standard and the known concentration of internal standard. The fatty acid profile of
biodiesel produced from the waste canola oil is compared with literatures in Table 4.2.
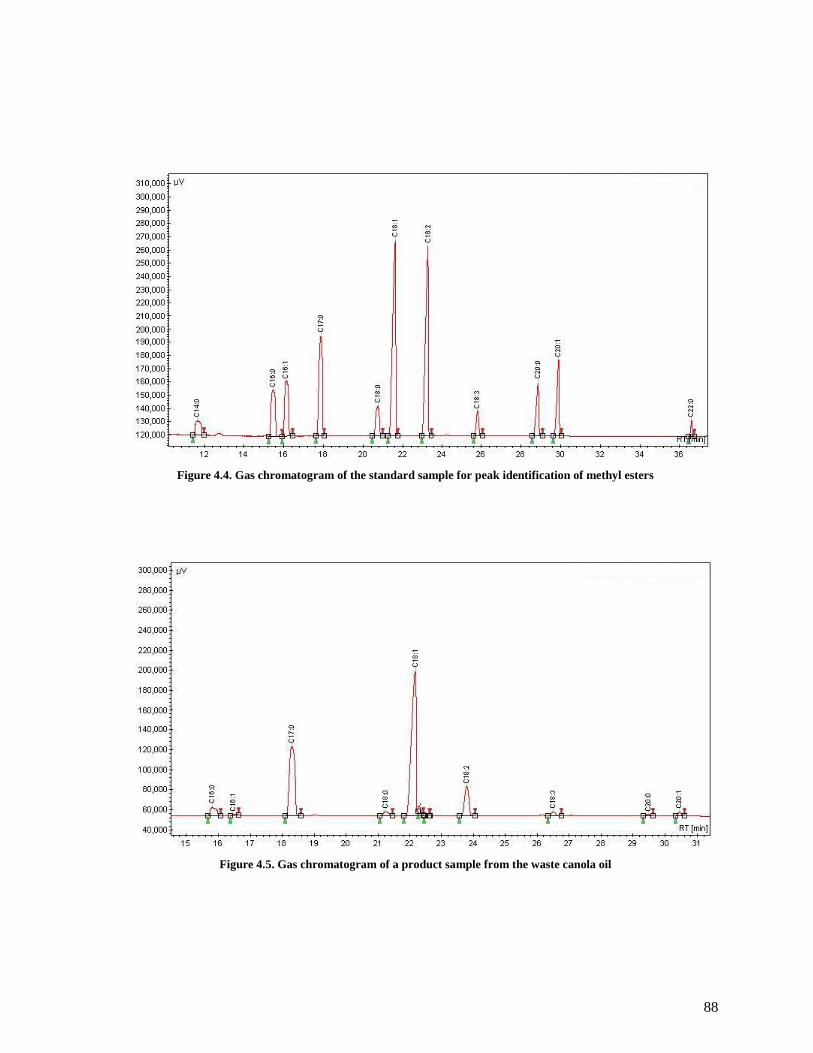
88
Figure 4.4. Gas chromatogram of the standard sample for peak identification of methyl esters
Figure 4.5. Gas chromatogram of a product sample from the waste canola oil

89
Table 4.2. Profile of fatty acid methyl esters in biodiesel from different feedstocks
Fatty acid methyl ester composition in biodiesel (wt%)
Feedstock for biodiesel C16:0 C16:1 C18:0 C18:1 C18:2 C18:3 C20:0 C20:1 C22:0
Corn oila 11.8 0.0 2.0 24.8 61.3 0.0 0.0 0.0 0.0
Safflower seed oila 7.3 0.0 1.9 13.6 77.2 0.0 0.0 0.0 0.0
Soybean oila 13.9 0.0 2.1 23.2 56.2 4.3 0.0 0.0 0.0
Jatropha oila 14.9 0.0 9.5 40.5 34.7 0.3 0.0 0.0 0.0
Rapeseed oila 3.5 0.0 0.9 64.1 22.3 8.2 0.0 0.0 0.0
Chicken fatb 24.6 5.8 8.4 46.1 2.4 0.0 0.0 0.0 0.0
Waste canola oilc 3.2 0.0 0.3 84.3 10.0 0.8 0.5 0.8 0.2
a From Gopinath et al. (2009)
b From Marulanda et al. (2010)
c From this study (run 19)
The yield of FAME was calculated by Equation (4.2).
Yield % = Total weight of methyl esters produced
Total weight of oil used for reaction × 100 (%) (4.2)
4.2.4. Statistical analysis
The process parameters used in this study are: the reaction time; reaction temperature; and
weight ratio of methanol to waste oil. The effect of the process parameters on the yield of methyl esters
was investigated by using customized design of experiments available in JMP8 (SAS institute Inc.).
Table 4.3 shows the experimental conditions along with the yields of methyl esters. The experimental
order was done randomly. Upon completion of all the experimental runs, the obtained responses (the
yield of FAMEs) were then fitted in a quadratic model using regression analysis.

90
Table 4.3. Experimental conditions and the yields of methyl esters from the waste canola oil
Run Time (min) Temperature (°C) MeOH/oil (w/w) Yield (%)
1 15 240 1 1.5
2 15 240 1.5 3.2
3 15 240 2 3.8
4 15 255 1 2.2
5 15 270 1 8.9
6 15 270 2 13.6
7 30 240 1 1.5
8 30 240 2 12.3
9* 30 255 1.5 11.4
10* 30 255 1.5 13.6
11* 30 255 1.5 12.7
12 30 255 2 18.5
13 30 270 1.5 60.9
14 45 240 1 4.4
15 45 240 1.5 16.5
16 45 240 2 24.5
17 45 255 1.5 62.8
18 45 270 1 96.4
19 45 270 2 101.6
* Triplicate runs for reproducibility
4.3. Results and discussion
4.3.1. FFA and water contents of waste canola oil
The FFA and water contents of the waste canola are shown in Table 4.4. The FFA content was
4.0 wt% and the water content was less than 0.01 wt%. Other than Karl Fischer titration,
thermogravimetric analysis (TGA) of the oil was performed to check volatile components as well as
water present in the oil. As shown in Figure 4.6, the weight loss while the oil was heated at 110°C for
an hour was 0.009%, indicating the oil contained a negligible amount of those components. Canakci
(2007) reported that the FFA levels in waste oils can vary from 0.7% to 41.8%, and moisture contents
from 0.01% to 55.38% as analyzing restaurant grease and animal fat samples from 13 different
locations. The FFA and water contents of the waste canola oil in this study were within those ranges,
but were relatively less contaminated compared to those having FFA and water contents greater than
10%.
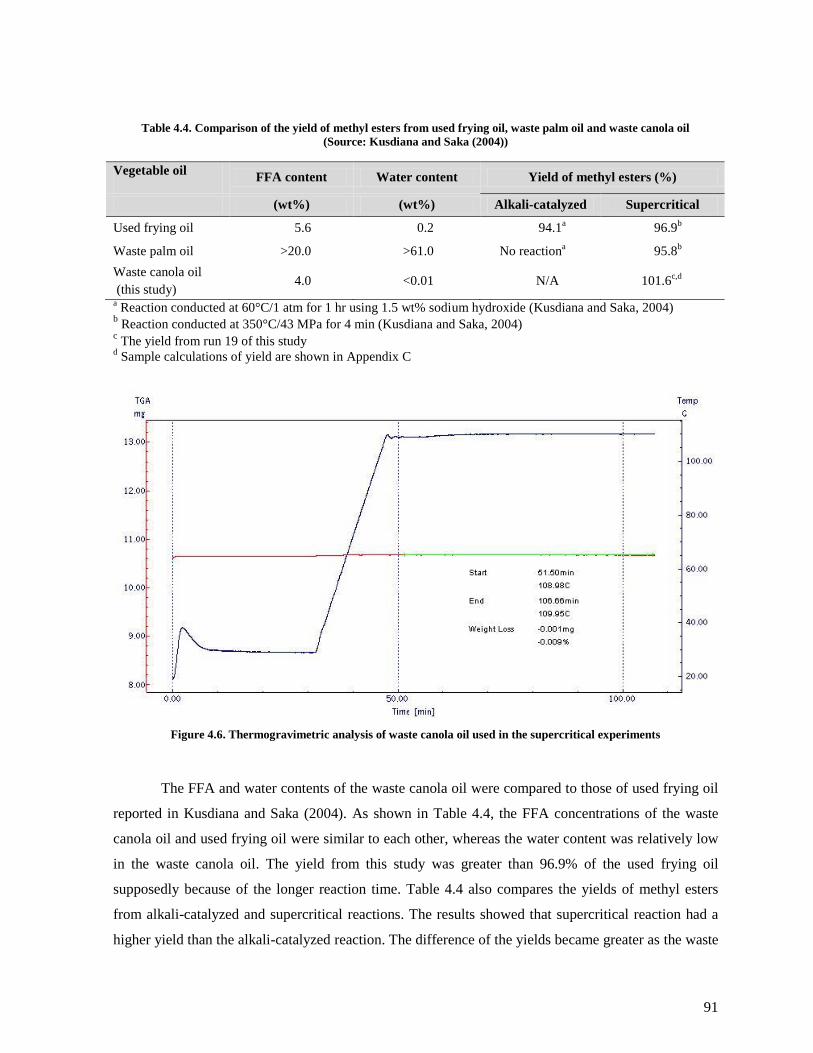
91
Table 4.4. Comparison of the yield of methyl esters from used frying oil, waste palm oil and waste canola oil
(Source: Kusdiana and Saka (2004))
Vegetable oil FFA content Water content Yield of methyl esters (%)
(wt%) (wt%) Alkali-catalyzed Supercritical
Used frying oil
5.6 0.2 94.1a
96.9b
Waste palm oil
>20.0 >61.0 No reactiona
95.8b
Waste canola oil
(this study) 4.0 <0.01 N/A 101.6
c,d
a Reaction conducted at 60°C/1 atm for 1 hr using 1.5 wt% sodium hydroxide (Kusdiana and Saka, 2004)
b Reaction conducted at 350°C/43 MPa for 4 min (Kusdiana and Saka, 2004)
c The yield from run 19 of this study
d Sample calculations of yield are shown in Appendix C
Figure 4.6. Thermogravimetric analysis of waste canola oil used in the supercritical experiments
The FFA and water contents of the waste canola oil were compared to those of used frying oil
reported in Kusdiana and Saka (2004). As shown in Table 4.4, the FFA concentrations of the waste
canola oil and used frying oil were similar to each other, whereas the water content was relatively low
in the waste canola oil. The yield from this study was greater than 96.9% of the used frying oil
supposedly because of the longer reaction time. Table 4.4 also compares the yields of methyl esters
from alkali-catalyzed and supercritical reactions. The results showed that supercritical reaction had a
higher yield than the alkali-catalyzed reaction. The difference of the yields became greater as the waste
92
palm oil was used as the feedstock. With FFA >20.0 wt% and water >61.0 wt% in the oil, the
supercritical reaction still had a yield as high as 95.8% whereas no reaction occurred in the alkali-
catalyzed reaction.
4.3.2. Supercritical transesterification of waste canola oil
Table 4.3 shows that the FAME yield is very low at the temperature of 240°C. In the
experiments 14−16, despite the reaction time was as long as 45 min, the yields were low, ranging from
4.4% to 24.5%. The result can be explained by the critical temperature of a triglyceride−methanol
mixture. The critical temperature of pure methanol is 239.45°C, and the methanol exists in the
supercritical state above the temperature. As triglycerides are added to the methanol, the critical
temperature required to achieve a single phase state of the mixture increases. Hegel et al. (2007)
reported that the lower methanol/oil ratio increased the temperature required to bring the system into a
supercritical phase. In this sense, the mixture of the waste oil and methanol will need to be at the
temperature greater than 239.45°C to be in the supercritical single phase. Therefore, the experiments
conducted at 240°C would have not reached the state, resulting in the low yields.
The high yields over 96% were obtained from the 45 min reactions at 270°C/10 MPa (runs 18
and 19). The result from run 18 was comparable to the value reported by Demirbas (2009a) in Table
4.1 where 99.6% of yield was obtained after 30 min of reaction at 287ºC.
The reaction time was also found to be an important factor to the FAME yield. When the
reaction time was as short as 15 min (runs 1−6), the FAME yields were in the range of 1.5−13.6%.
Although the temperature and weight ratio were at the highest levels of this study, the yield was only
13.6% in run 6. Comparing with the reported values in Saka and Kusdiana (2001), Marulanda et al.
(2010) and Tan et al. (2010) where 95%, 88% and 81.5% yields were obtained within 4−16 min, the
13.6% yield was very low. The reason was, as stated previously, much more moderate reaction
conditions of this study compared to the literatures as shown in Table 4.1. To achieve a reasonable
yield in the mild reaction conditions, therefore, it is unavoidable to trade off an increase in the reaction
time. Consequently, if the moderate reaction conditions are applied, it will bring a raise in the expense
for a larger size of reactor in a continuous supercritical process.
The yields from the replicate runs 9, 10 and 11 ranged from 11.4% to 13.6% with an average
value of 12.6%. The standard deviation was calculated to be 0.903%, indicating the experimental error
was small.
The experimental results shown in Table 4.3 were analyzed using analysis of variance
(ANOVA) to develop a regression model for the FAME yield. The results of ANOVA are summarized
in Table 4.5.
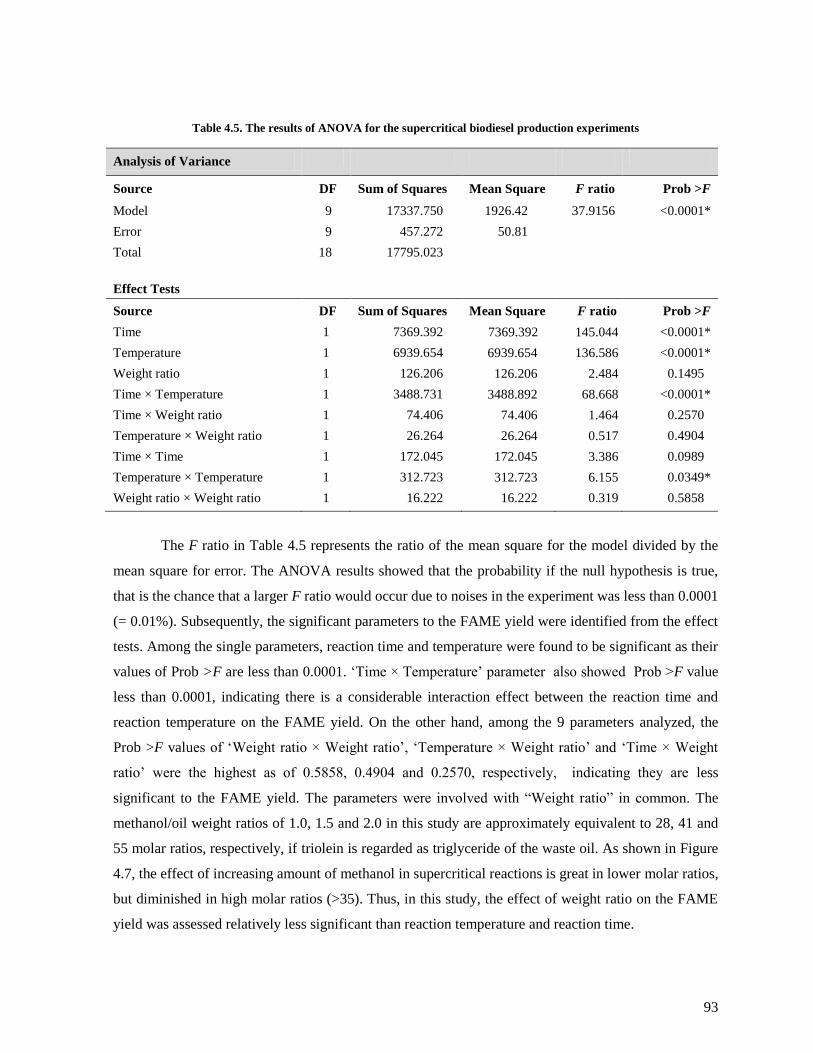
93
Table 4.5. The results of ANOVA for the supercritical biodiesel production experiments
Analysis of Variance
Source DF Sum of Squares Mean Square F ratio Prob >F
Model 9 17337.750 1926.42 37.9156 <0.0001*
Error 9 457.272 50.81
Total 18 17795.023
Effect Tests
Source DF Sum of Squares Mean Square F ratio Prob >F
Time 1 7369.392 7369.392 145.044 <0.0001*
Temperature 1 6939.654 6939.654 136.586 <0.0001*
Weight ratio 1 126.206 126.206 2.484 0.1495
Time × Temperature 1 3488.731 3488.892 68.668 <0.0001*
Time × Weight ratio 1 74.406 74.406 1.464 0.2570
Temperature × Weight ratio 1 26.264 26.264 0.517 0.4904
Time × Time 1 172.045 172.045 3.386 0.0989
Temperature × Temperature 1 312.723 312.723 6.155 0.0349*
Weight ratio × Weight ratio 1 16.222 16.222 0.319 0.5858
The F ratio in Table 4.5 represents the ratio of the mean square for the model divided by the
mean square for error. The ANOVA results showed that the probability if the null hypothesis is true,
that is the chance that a larger F ratio would occur due to noises in the experiment was less than 0.0001
(= 0.01%). Subsequently, the significant parameters to the FAME yield were identified from the effect
tests. Among the single parameters, reaction time and temperature were found to be significant as their
values of Prob >F are less than 0.0001. ‗Time × Temperature‘ parameter also showed Prob >F value
less than 0.0001, indicating there is a considerable interaction effect between the reaction time and
reaction temperature on the FAME yield. On the other hand, among the 9 parameters analyzed, the
Prob >F values of ‗Weight ratio × Weight ratio‘, ‗Temperature × Weight ratio‘ and ‗Time × Weight
ratio‘ were the highest as of 0.5858, 0.4904 and 0.2570, respectively, indicating they are less
significant to the FAME yield. The parameters were involved with ―Weight ratio‖ in common. The
methanol/oil weight ratios of 1.0, 1.5 and 2.0 in this study are approximately equivalent to 28, 41 and
55 molar ratios, respectively, if triolein is regarded as triglyceride of the waste oil. As shown in Figure
4.7, the effect of increasing amount of methanol in supercritical reactions is great in lower molar ratios,
but diminished in high molar ratios (>35). Thus, in this study, the effect of weight ratio on the FAME
yield was assessed relatively less significant than reaction temperature and reaction time.
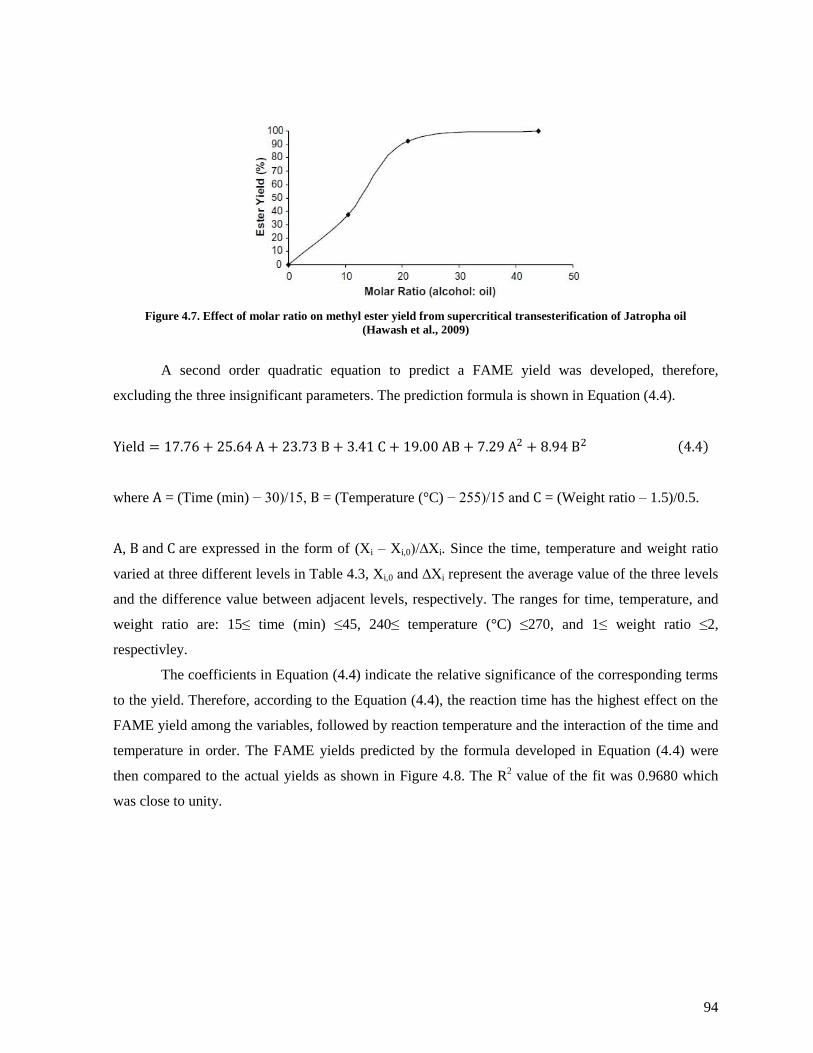
94
Figure 4.7. Effect of molar ratio on methyl ester yield from supercritical transesterification of Jatropha oil
(Hawash et al., 2009)
A second order quadratic equation to predict a FAME yield was developed, therefore,
excluding the three insignificant parameters. The prediction formula is shown in Equation (4.4).
Yield = 17.76 + 25.64 A + 23.73 B + 3.41 C + 19.00 AB + 7.29 A2 + 8.94 B2 4.4
where A = (Time (min) − 30)/15, B = (Temperature (°C) − 255)/15 and C = (Weight ratio – 1.5)/0.5.
A, B and C are expressed in the form of (Xi – Xi,0)/∆Xi. Since the time, temperature and weight ratio
varied at three different levels in Table 4.3, Xi,0 and ∆Xi represent the average value of the three levels
and the difference value between adjacent levels, respectively. The ranges for time, temperature, and
weight ratio are: 15≤ time (min) ≤45, 240≤ temperature (°C) ≤270, and 1≤ weight ratio ≤2,
respectivley.
The coefficients in Equation (4.4) indicate the relative significance of the corresponding terms
to the yield. Therefore, according to the Equation (4.4), the reaction time has the highest effect on the
FAME yield among the variables, followed by reaction temperature and the interaction of the time and
temperature in order. The FAME yields predicted by the formula developed in Equation (4.4) were
then compared to the actual yields as shown in Figure 4.8. The R2 value of the fit was 0.9680 which
was close to unity.
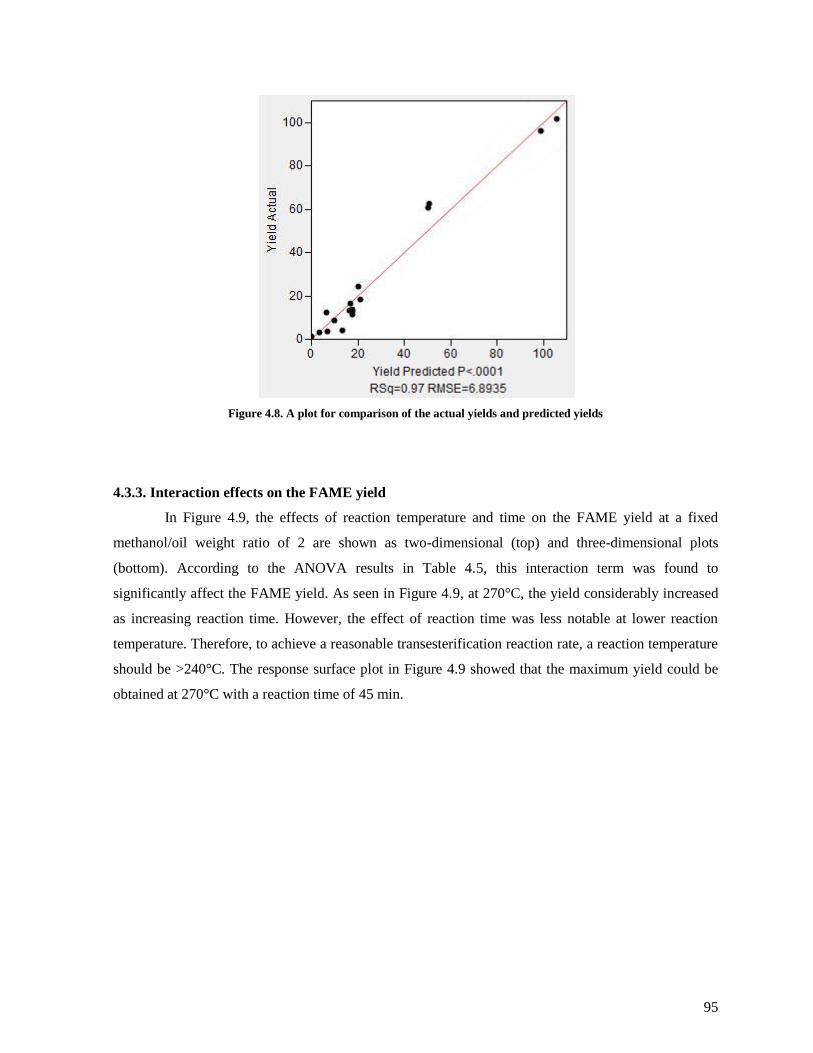
95
Figure 4.8. A plot for comparison of the actual yields and predicted yields
4.3.3. Interaction effects on the FAME yield
In Figure 4.9, the effects of reaction temperature and time on the FAME yield at a fixed
methanol/oil weight ratio of 2 are shown as two-dimensional (top) and three-dimensional plots
(bottom). According to the ANOVA results in Table 4.5, this interaction term was found to
significantly affect the FAME yield. As seen in Figure 4.9, at 270°C, the yield considerably increased
as increasing reaction time. However, the effect of reaction time was less notable at lower reaction
temperature. Therefore, to achieve a reasonable transesterification reaction rate, a reaction temperature
should be >240°C. The response surface plot in Figure 4.9 showed that the maximum yield could be
obtained at 270°C with a reaction time of 45 min.
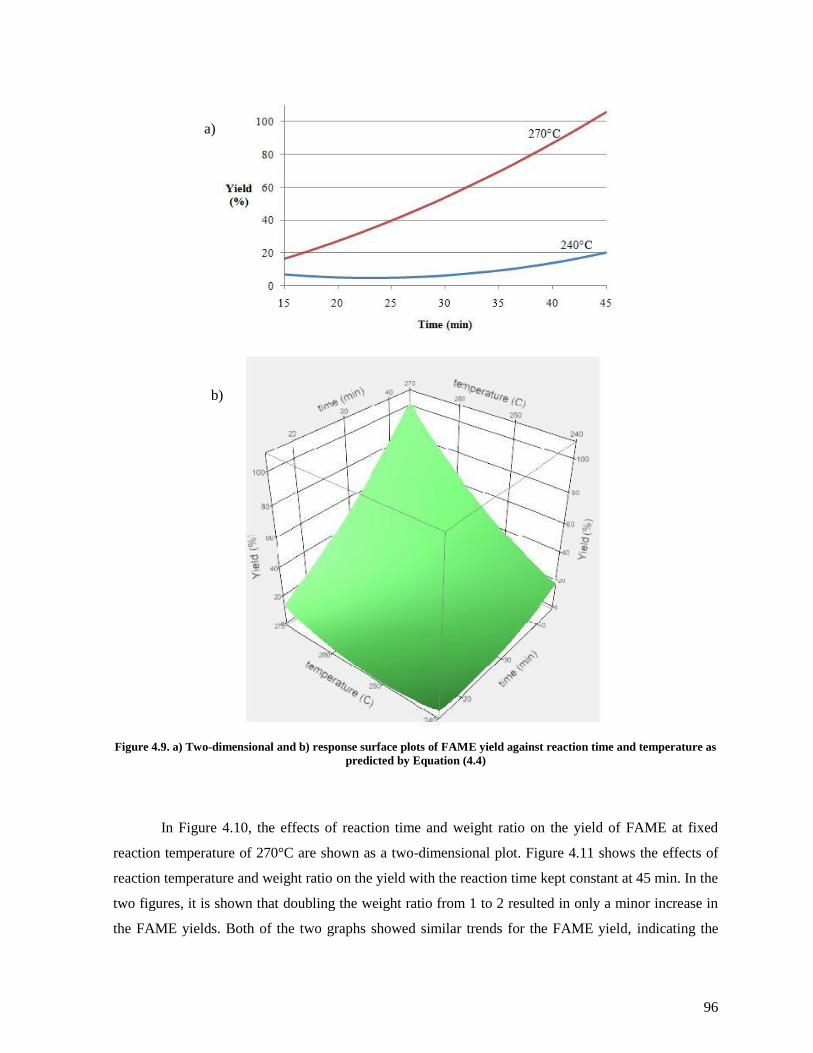
96
Figure 4.9. a) Two-dimensional and b) response surface plots of FAME yield against reaction time and temperature as
predicted by Equation (4.4)
In Figure 4.10, the effects of reaction time and weight ratio on the yield of FAME at fixed
reaction temperature of 270°C are shown as a two-dimensional plot. Figure 4.11 shows the effects of
reaction temperature and weight ratio on the yield with the reaction time kept constant at 45 min. In the
two figures, it is shown that doubling the weight ratio from 1 to 2 resulted in only a minor increase in
the FAME yields. Both of the two graphs showed similar trends for the FAME yield, indicating the
a)
b)
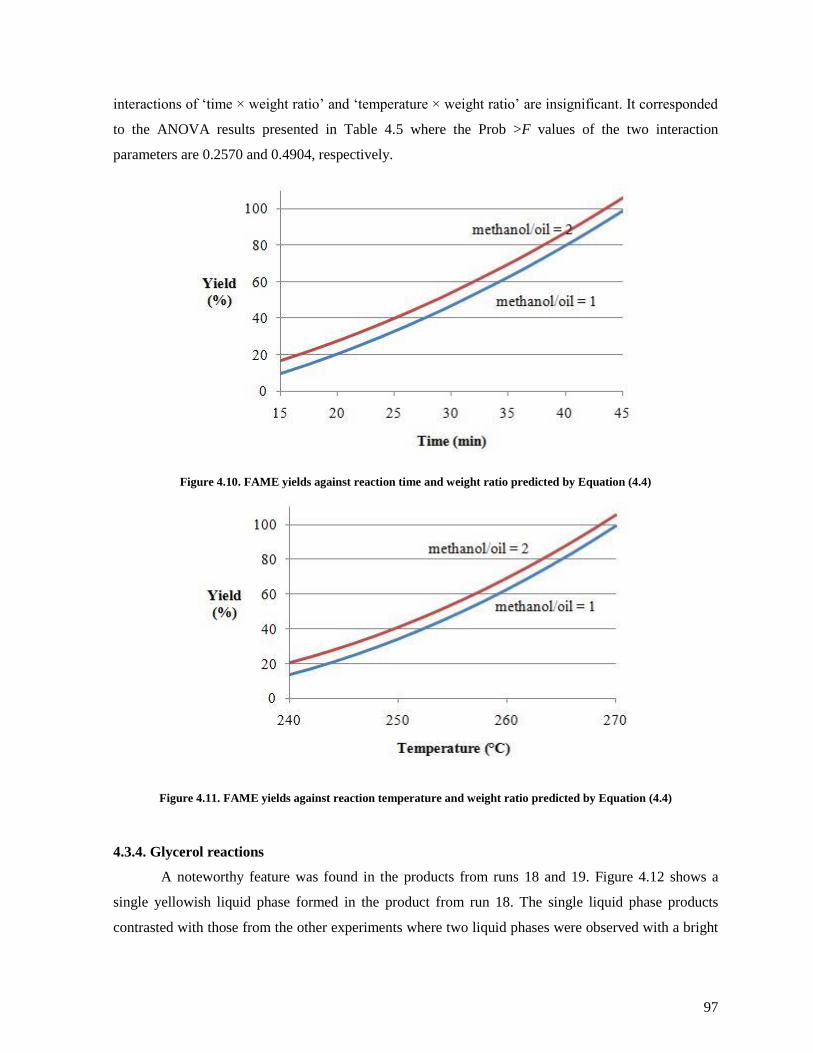
97
interactions of ‗time × weight ratio‘ and ‗temperature × weight ratio‘ are insignificant. It corresponded
to the ANOVA results presented in Table 4.5 where the Prob >F values of the two interaction
parameters are 0.2570 and 0.4904, respectively.
Figure 4.10. FAME yields against reaction time and weight ratio predicted by Equation (4.4)
Figure 4.11. FAME yields against reaction temperature and weight ratio predicted by Equation (4.4)
4.3.4. Glycerol reactions
A noteworthy feature was found in the products from runs 18 and 19. Figure 4.12 shows a
single yellowish liquid phase formed in the product from run 18. The single liquid phase products
contrasted with those from the other experiments where two liquid phases were observed with a bright
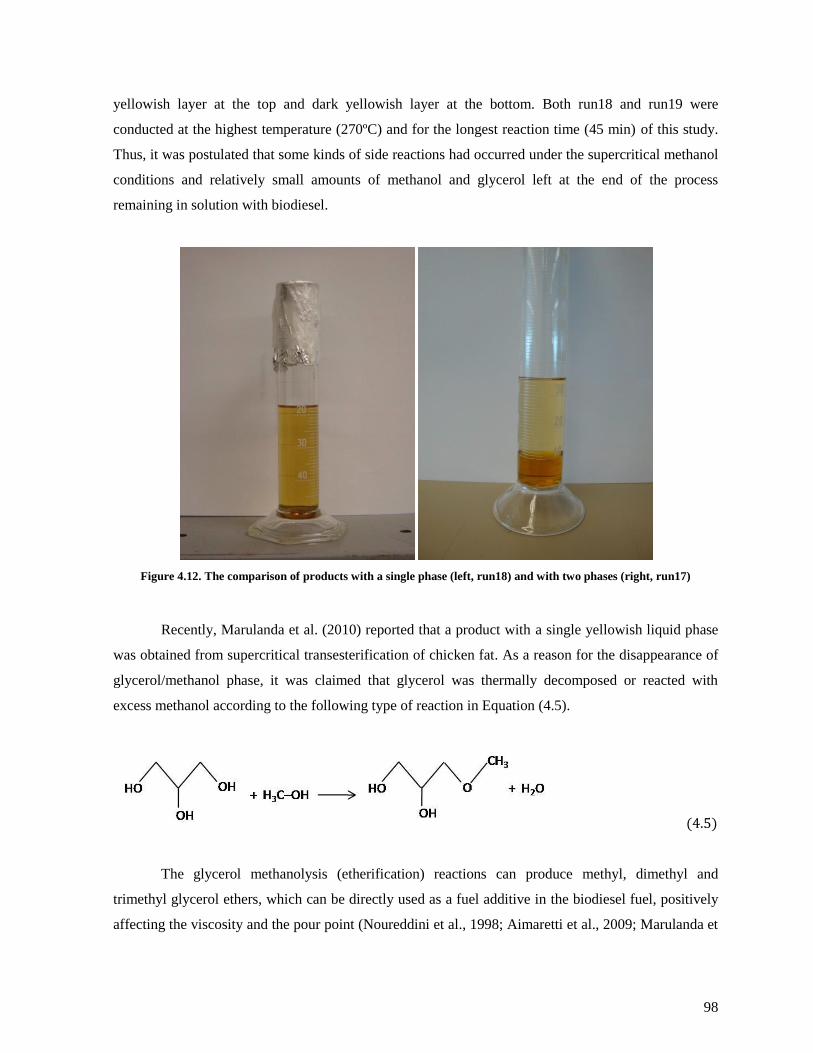
98
yellowish layer at the top and dark yellowish layer at the bottom. Both run18 and run19 were
conducted at the highest temperature (270ºC) and for the longest reaction time (45 min) of this study.
Thus, it was postulated that some kinds of side reactions had occurred under the supercritical methanol
conditions and relatively small amounts of methanol and glycerol left at the end of the process
remaining in solution with biodiesel.
Figure 4.12. The comparison of products with a single phase (left, run18) and with two phases (right, run17)
Recently, Marulanda et al. (2010) reported that a product with a single yellowish liquid phase
was obtained from supercritical transesterification of chicken fat. As a reason for the disappearance of
glycerol/methanol phase, it was claimed that glycerol was thermally decomposed or reacted with
excess methanol according to the following type of reaction in Equation (4.5).
(4.5)
The glycerol methanolysis (etherification) reactions can produce methyl, dimethyl and
trimethyl glycerol ethers, which can be directly used as a fuel additive in the biodiesel fuel, positively
affecting the viscosity and the pour point (Noureddini et al., 1998; Aimaretti et al., 2009; Marulanda et

99
al., 2010). As coupling a complete etherification reaction with the transesterification reaction, the
following global reaction equation can be written (Marulanda et al., 2010).
Etherification: C3H5(OH)3 + 3 CH3OH = C3H5(OCH3)3 + 3 H2O
Transesterification: C3H5(OCOR)3 + 3 CH3OH = 3 RCOOCH3 + C3H5(OH)3
Overall: C3H5(OCOR)3 + 6 CH3OH = 3 RC00CH3 + C3H5(OCH3)3 + 3 H2O (4.6)
Equation (4.6) shows that water present in products can be related to the disappearance of
glycerol. The authors also proposed several organic compounds as glycerol decomposition products
and identified them by gas chromatography−mass spectroscopy (GC-MS). The identified
decomposition products of glycerol are shown in Table 4.6.
Table 4.6. Identified glycerol reaction products by GC-MS (Marulanda et al., 2010)
Side reactions of glycerol and methanol were also reported by Aimaretti et al. (2009). It was
reported that, as reacting refined soy oil with supercritical methanol for 30−90 min reaction times, free
glycerol contents continuously decreased from 0.054% to 0.031%, whereas water contents in the

100
reacting mixture increased. The authors postulated that glycerol could be decomposed into smaller
molecules such as acrolein, acetaldehyde and acetic acid, generating water as a product. Another
option was etherification with methanol to produce glycerol ethers as previously shown in Equation
(4.5).
The presence of the glycerol reactions proposed by Aimaretti et al. (2009) and Marunlanda et
al. (2010) can be proven by measuring water contents in reactants and products of supercritical
methanol process. Since both thermal degradation and etherification reaction of glycerol generate
water as a product, an increase in water content will be observed if those reactions have occurred. To
verify this, waste canola oil and dry methanol were prepared and their water contents were analyzed by
Karl-Fischer titration. As reacting them under the same conditions with those of run 19, a single-phase
product was obtained. The product was kept perfectly sealed and let settled for a day. Then, the water
content of the product was measured in the same way. Details of the titration results are shown in
Appendix B. The summarized results are shown in Table 4.7.
Comparing the reactants (waste oil and methanol) with the product, water contents had
increased from being negligible to 0.23 g after the reaction. Other than glycerol reactions, another
source of water was esterification of FFAs (4 wt%) in waste oil. Calculation of the amount of water
from the esterification reaction is shown in Equation (D.1) in Appendix D. The calculation shows that
only 0.017 g water can be produced in maximum if all the FFAs (assumed as oleic acid) were
converted into methyl esters. Therefore, it was confirmed that the water appearance in the product was
mostly contributed to the glycerol reactions.
Table 4.7. Water contents in the reactants and a product of supercritical reaction
Materials Water content (g)
Waste oil 0.0002a
Dry methanol 0.0013b
Biodiesel solution 0.23c
a Standard deviation: 0.0001 g
b Standard deviation: 0.0002 g
c Standard deviation: 0.012 g
GC-MS of the biodiesel product sample was performed to identify components in the product.
Details of the GC-MS analysis chromatogram are presented in Appendix E. Results in Figure 4.13 and
Table 4.8 show that 3-methyoxy-1,2-propanediol, 1,3-dimethoxy-2-propanol and diglycerol in the
sample were identified. These components were the glycerol reaction products shown in Table 4.6

101
previously. Glycerol in the sample was also identified, indicating the by-product glycerol was not
entirely consumed by the glycerol reactions. Methanol in the product sample was also identified by
comparing its retention time (0.79 min) with the one of pure methanol. Quantification of the glycerol
and methanol was not performed in this study.
Several chromatographic peaks observed during the beginning 5 min of GC-MS analysis
verified a variety of chemical components present in the product samples. It indicated unknown side
reactions occurred during the supercritical methanol reaction. As a candidate for the side reactions,
Aimaretti et al. (2009) proposed that reaction of glycerol and supercritical methanol can result in
formic acid ethyl ester by water loss and subsequent internal molecular rearrangement. A possibility of
losing one oxygen atom and one water molecule by reaction between glycerol and supercritical
methanol was also proposed by the authors. Those components can go through further chemical
reactions particularly under high temperature conditions. It appears that chemical components
generated from the unknown reactions are dissolved in the biodiesel solution of this study, also aiding
un-reacted methanol dissolved in the single phase.
Figure 4.13. Gas chromatography−mass spectroscopy (GC-MS) chromatogram of the product from supercritical
reaction at 270°C/10 MPa for 45 min
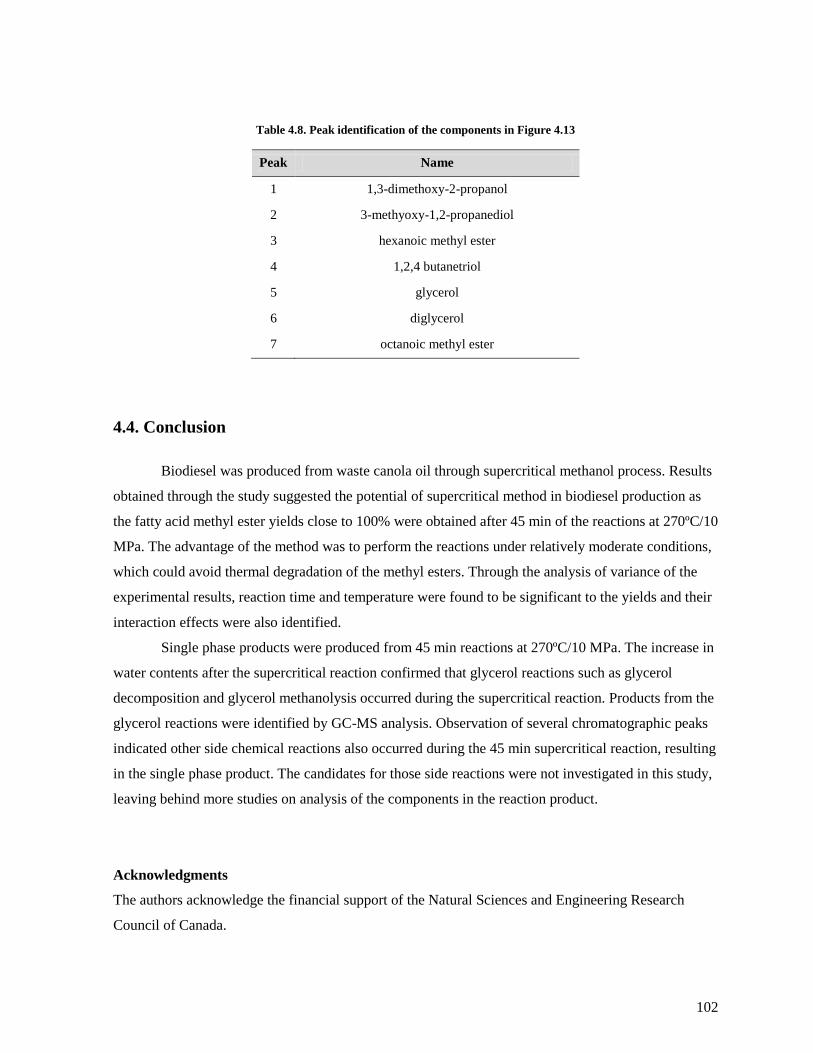
102
Table 4.8. Peak identification of the components in Figure 4.13
Peak Name
1 1,3-dimethoxy-2-propanol
2 3-methyoxy-1,2-propanediol
3 hexanoic methyl ester
4 1,2,4 butanetriol
5 glycerol
6 diglycerol
7 octanoic methyl ester
4.4. Conclusion
Biodiesel was produced from waste canola oil through supercritical methanol process. Results
obtained through the study suggested the potential of supercritical method in biodiesel production as
the fatty acid methyl ester yields close to 100% were obtained after 45 min of the reactions at 270ºC/10
MPa. The advantage of the method was to perform the reactions under relatively moderate conditions,
which could avoid thermal degradation of the methyl esters. Through the analysis of variance of the
experimental results, reaction time and temperature were found to be significant to the yields and their
interaction effects were also identified.
Single phase products were produced from 45 min reactions at 270ºC/10 MPa. The increase in
water contents after the supercritical reaction confirmed that glycerol reactions such as glycerol
decomposition and glycerol methanolysis occurred during the supercritical reaction. Products from the
glycerol reactions were identified by GC-MS analysis. Observation of several chromatographic peaks
indicated other side chemical reactions also occurred during the 45 min supercritical reaction, resulting
in the single phase product. The candidates for those side reactions were not investigated in this study,
leaving behind more studies on analysis of the components in the reaction product.
Acknowledgments
The authors acknowledge the financial support of the Natural Sciences and Engineering Research
Council of Canada.
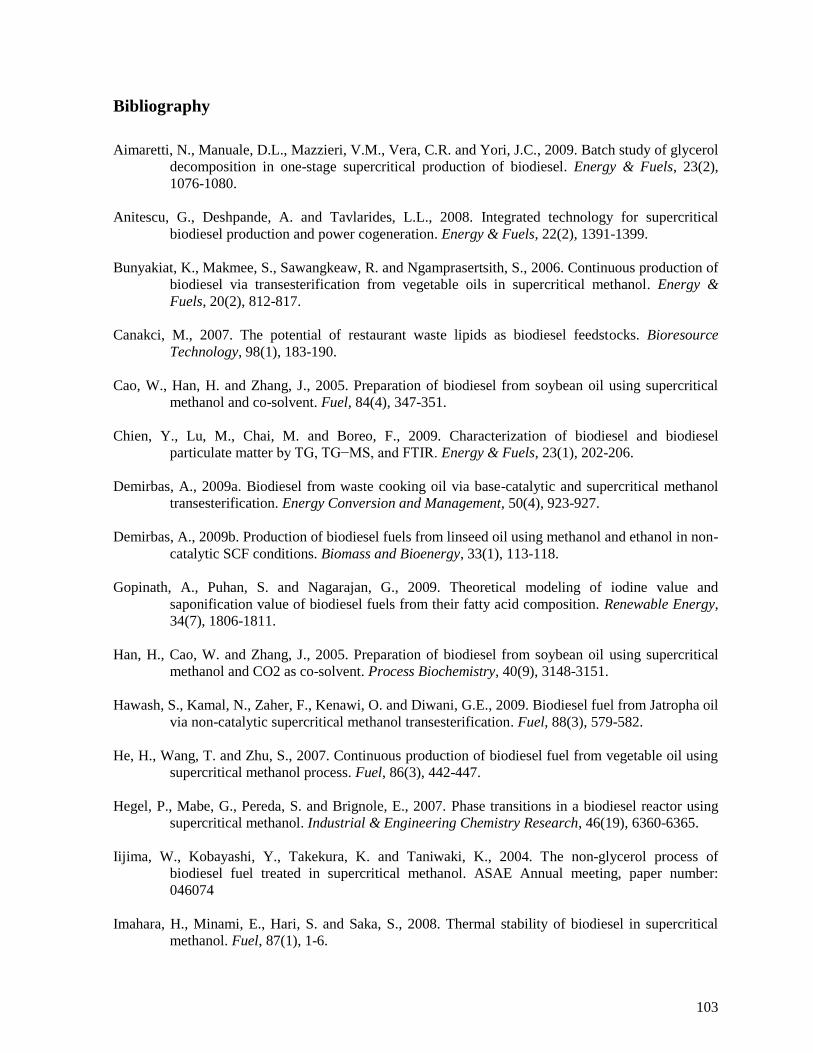
103
Bibliography
Aimaretti, N., Manuale, D.L., Mazzieri, V.M., Vera, C.R. and Yori, J.C., 2009. Batch study of glycerol
decomposition in one-stage supercritical production of biodiesel. Energy & Fuels, 23(2),
1076-1080.
Anitescu, G., Deshpande, A. and Tavlarides, L.L., 2008. Integrated technology for supercritical
biodiesel production and power cogeneration. Energy & Fuels, 22(2), 1391-1399.
Bunyakiat, K., Makmee, S., Sawangkeaw, R. and Ngamprasertsith, S., 2006. Continuous production of
biodiesel via transesterification from vegetable oils in supercritical methanol. Energy &
Fuels, 20(2), 812-817.
Canakci, M., 2007. The potential of restaurant waste lipids as biodiesel feedstocks. Bioresource
Technology, 98(1), 183-190.
Cao, W., Han, H. and Zhang, J., 2005. Preparation of biodiesel from soybean oil using supercritical
methanol and co-solvent. Fuel, 84(4), 347-351.
Chien, Y., Lu, M., Chai, M. and Boreo, F., 2009. Characterization of biodiesel and biodiesel
particulate matter by TG, TG−MS, and FTIR. Energy & Fuels, 23(1), 202-206.
Demirbas, A., 2009a. Biodiesel from waste cooking oil via base-catalytic and supercritical methanol
transesterification. Energy Conversion and Management, 50(4), 923-927.
Demirbas, A., 2009b. Production of biodiesel fuels from linseed oil using methanol and ethanol in non-
catalytic SCF conditions. Biomass and Bioenergy, 33(1), 113-118.
Gopinath, A., Puhan, S. and Nagarajan, G., 2009. Theoretical modeling of iodine value and
saponification value of biodiesel fuels from their fatty acid composition. Renewable Energy,
34(7), 1806-1811.
Han, H., Cao, W. and Zhang, J., 2005. Preparation of biodiesel from soybean oil using supercritical
methanol and CO2 as co-solvent. Process Biochemistry, 40(9), 3148-3151.
Hawash, S., Kamal, N., Zaher, F., Kenawi, O. and Diwani, G.E., 2009. Biodiesel fuel from Jatropha oil
via non-catalytic supercritical methanol transesterification. Fuel, 88(3), 579-582.
He, H., Wang, T. and Zhu, S., 2007. Continuous production of biodiesel fuel from vegetable oil using
supercritical methanol process. Fuel, 86(3), 442-447.
Hegel, P., Mabe, G., Pereda, S. and Brignole, E., 2007. Phase transitions in a biodiesel reactor using
supercritical methanol. Industrial & Engineering Chemistry Research, 46(19), 6360-6365.
Iijima, W., Kobayashi, Y., Takekura, K. and Taniwaki, K., 2004. The non-glycerol process of
biodiesel fuel treated in supercritical methanol. ASAE Annual meeting, paper number:
046074
Imahara, H., Minami, E., Hari, S. and Saka, S., 2008. Thermal stability of biodiesel in supercritical
methanol. Fuel, 87(1), 1-6.
104
Imahara, H., Minami, E. and Saka, S., 2006. Thermodynamic study on cloud point of biodiesel with its
fatty acid composition. Fuel, 85(12-13), 1666-1670.
Imahara, H., Xin, J. and Saka, S., 2009. Effect of CO2/N2 addition to supercritical methanol on
reactivities and fuel qualities in biodiesel production. Fuel, 88(7), 1329-1332.
Knothe, G., 2006. Analyzing biodiesel: standards and other methods. Journal of the American Oil
Chemists' Society, 83(10), 823–833.
Knothe, G., 2005. Dependence of biodiesel fuel properties on the structure of fatty acid alkyl esters.
Fuel Processing Technology, 86(10), 1059-1070.
Kusdiana, D. and Saka, S., 2004. Effects of water on biodiesel fuel production by supercritical
methanol treatment. Bioresource Technology, 91(3), 289-295.
Madras, G., Kolluru, C. and Kumar, R., 2004. Synthesis of biodiesel in supercritical fluids. Fuel,
83(14-15), 2029-2033.
Marulanda, V.F., Anitescu, G. and Tavlarides, L.L., 2010. Biodiesel fuels through a continuous flow
process of chicken fat supercritical transesterification. Energy & Fuels, 24(1), 253-260.
Ramos, M.J., Fernández, C., Casas, A., Rodríguez, L. and Pérez, Á., 2009. Influence of fatty acid
composition of raw materials on biodiesel properties. Bioresource Technology, 100(1), 261-
268.
Saka, S. and Kusdiana, D., 2001. Biodiesel fuel from rapeseed oil as prepared in supercritical methanol.
Fuel, 80(2), 225-231.
Tan, K.T., Gui, M.M., Lee, K.T. and Mohamed, A.R., 2010. An optimized study of methanol and
ethanol in supercritical alcohol technology for biodiesel production. The Journal of
Supercritical Fluids, 53(1-3), 82-87.
Tan, K.T., Lee, K.T. and Mohamed, A.R., 2010. Effects of free fatty acids, water content and co-
solvent on biodiesel production by supercritical methanol reaction. The Journal of
Supercritical Fluids, 53(1-3), 88-91.
Valle, P., Velez, A., Hegel, P., Mabe, G. and Brignole, E.A., 2010. Biodiesel production using
supercritical alcohols with a non-edible vegetable oil in a batch reactor. The Journal of
Supercritical Fluids, 54(1), 61-70.
Varma, M.N. and Madras, G., 2007. Synthesis of biodiesel from castor oil and linseed oil in
supercritical fluids. Industrial & Engineering Chemistry Research, 46(1), 1-6.

105
5. General discussion, conclusions and recommendations
5.1. General discussion
Chapter 2 presented simulated models of four different biodiesel production processes. While
developing the simulated models, the normal boiling point of triolein was found to be inconsistent
depending on its source. For example, Hysys reported its boiling point as 606.8°C, but another
process simulator, Aspen, reported it as 846.85ºC. As previously explained, the normal boiling point
is of importance since it is used, along with the molecular structure, to predict the other remaining
properties of the compound. The thermogravimetric measurement of the boiling points of
triglycerides, proposed by Goodrum and Geller (2002), was therefore very useful because it provided
results rapidly and with relatively simple preparation. In addition, the thermogravimetric
measurements were proven by the same authors to be valid for long-chain triglycerides such as
tristearin (C18:0) whose carbon chain length is the same as the triolein (C18:1) of our interest.
Through thermogravimetric measurement, this thesis found the normal boiling point of triolein to be
412.8ºC, slightly higher than the normal boiling point of tristearin (403.12ºC) reported by Goodrum
and Geller (2002). Technically, the normal boiling point of an unsaturated compound is lower than
for a saturated one, which suggests that the experimental result for the normal boiling point of triolein
was measured higher than was expected. The normal boiling point of triolein could be also measured
with a differential scanning calorimeter (DSC). This measurement was omitted in this thesis.
Providing the result from the DSC along with the result of thermogravimetric measurement would
provide a more solid clue as to the normal boiling point of triolein.
The heat capacity of methanol also varies between Hysys and the literatures. It is 3.604
kJ/(kg·°C) at room temperature (25°C) in Hysys, which is 1.124 kJ/(kg·°C) higher than the value of
2.48 kJ/(kg·°C) from Filatov and Afanas'ev (1992). Applying the heat capacity from the literature to
the Hysys simulation would result in lower utility costs in the models of the biodiesel production
process. The savings on utility costs would be particularly large in the supercritical processes because
the energy consumption involved with heaters and distillation columns for methanol are greater in
this process than for alkali-catalyzed processes. For example, in the SC-WVO process, the different
value for heat capacity results in an energy consumption difference of (1.124 kJ/kg-1
·°C-1
)·(8749.5
kg/hr)·(8000 hr/yr)·(350.0°C – 224.3°C)·(1 GJ/106 kJ) = 9889.5 GJ/yr in the heater (E-103) for pre-
heating methanol to the reaction temperature. However, the order of profitability for the four
biodiesel processes will not be altered by replacing the Hysys heat capacity with the value from the
literature because the utility costs are only a small part of the total manufacturing costs.
106
The general layout of Alkali-FVO and Alkali-WVO processes in Chapter 2 referred to the
process flow diagrams described in Zhang et al. (2003a) and West et al. (2008). The glycerol washing
column in the Alkali-WVO process was represented as a liquid-liquid extraction column in Hysys,
but the simulation results were not fully understood as a result of the abnormal behaviour of the
simulated liquid-liquid extraction column. As stated in Chapter 2, the simulated extraction column
had some problems in converging with the flow streams containing electrolytes, such as sulphuric
acid. As the flow rate of the glycerol stream decreased from extremely large to a certain, smaller
amount, the extraction column converged. However, it did not converge if the flow rate increased
from a small amount to the same amount at which it had previously converged. Zhang et al. (2003a)
also commented on the lack of knowledge concerning the behaviour of electrolytes in the liquid-
liquid extraction column and used two component splitters after the column to practically separate
glycerol, sulphuric acid and methanol from the rest of the components.
The amount of glycerol required for the washing process was not completely certain. Because
of the abnormal behaviour of the extraction column, the amount of glycerol required could not be
determined from the simulation results. Zhang et al. (2003a) used the glycerol washing process in
their simulation model, but they did not report how they determined the amount of glycerol required
for the washing process. Thus, in this thesis, the flow rate of glycerol in simulations was determined
based on the assumption that it is approximately proportional to the capacity of the biodiesel plant
being simulated. In Chapter 3, the cost of the glycerol washing process was found to be
approximately 10% of the direct manufacturing cost, becoming the second largest cost factor after the
cost of the waste oil feedstock. Therefore, more accurate data for the required amount of glycerol
would provide more accurate washing process costs in Alkali-WVO process.
Chapter 3 focused on an economic assessment of the four biodiesel production process
models developed in Chapter 2. The economic assessment conducted in this thesis is different than
previous studies (Zhang et al., 2003b; Kasteren and Nisworo, 2007; West et al., 2008; You et al.,
2008; Lim et al., 2009; Santana et al., 2010) because this thesis used, for the first time, a software
package designed specifically for economic process evaluations (Icarus Process Evaluator—IPE).
Alteration of the general specifications discussed in Section 3.2 can be simply made in the
early stages of the economic analysis. Alterations of this type were not included in this thesis. For
example, the biodiesel plant could be re-located in different regions in the world, allowing an
investigation into the effects of regional factors such as freight, taxes, wage rates, and workforce
productivity on the profitability of a biodiesel plant.
An economic assessment of the four biodiesel production processes revealed the significance
of the oil feedstock cost, which accounted for 63.9% to 84.0% of the total production cost. Except for

107
the Alkali-FVO process, which used expensive fresh vegetable oil, the other processes showed
positive net present values due to the use of waste vegetable oil. The results indicate that the
utilization of low-cost feedstocks would be a desirable feature for biodiesel production to become
competitive.
Another important consideration was whether a reaction conversion rate lower than
Bunyakiat et al. (2006) would result in negative profitability of the supercritical processes. The
sensitivity analysis of the SC-WVO process showed that the net present value of the process would
become negative if the biodiesel selling price decreased by around 15%. If the decrease in revenue
from biodiesel sale resulted from a decrease in the net yield of biodiesel in the process (i.e., a
decrease in the reaction conversion) instead of from a reduction in the biodiesel selling price,
negative NPV would result from approximately a 15% reduction in conversion. Moreover, if we
consider the increase in the cost of the purification processes as a result of the lowered conversion, a
reduction in the reaction conversion of less than 15% would make the profitability of the SC-WVO
process negative. Unfortunately, research on the continuous production of biodiesel in a supercritical
methanol process is scarce. Consequently, the validity of the economic assessment of the supercritical
processes in this study would be more clearly understood once more research is conducted in the
future.
The biodiesel selling price used for the economic assessment was $0.99/kg, equivalent to
$0.861/litre (given the biodiesel density of 870 kg/m3). The price was researched on April 16th, 2010.
During the same period, the average petroleum diesel price in Canada was $0.746/litre. In the urban
cities such as Vancouver and Toronto, the prices were $0.761/litre and $0.772/litre, respectively,
whereas the price was even higher in remote areas, such as Whitehorse ($0.882/litre). In the same
manner, geographically related factors, such as freight costs, will affect the biodiesel selling price.
Chapter 4 of this thesis describes the experimental work on biodiesel synthesis from waste
canola oil via a supercritical methanol process. This experiment investigated the effects of reaction
time, reaction temperature, and weight ratios of methanol to oil on the yield of fatty acid methyl
esters (FAMEs), and a yield prediction formula for FAMEs was developed. Originally, the
supercritical reactions were planned to be carried out at a higher pressure (17 MPa) with a broader
temperature range (240−315°C) than the investigated conditions reported in Chapter 4. Unfortunately,
the reaction conditions were limited by the allowable operating conditions of the autoclave o-ring,
which would be destroyed at high temperature and pressure (>11 MPa). Supercritical reactions lasting
45 min at 270°C/10 MPa resulted in 96.4% and 101.6% of FAME mass yields using methanol:oil
ratios of 1:1 and 2:1, respectively. The product from these reaction conditions appeared to be in a
108
single yellowish liquid phase, which did not separate into two phases after being kept at 19°C for 2
weeks.
The single phase product was thought to be a result of the decomposition of the glycerol from
the transesterification reaction, as well as its partial reaction with methanol. Aimaretti et al. (2009)
reported that reactions conducted at the conditions of 280°C and 6.25−7.55 MPa produced practically
no glycerol by-product. The authors reported that glycerol was transformed into products of smaller
molecular size and water, and the water reacted with the triglycerides of the reacting mixture to form
free fatty acids, which are then converted into methyl esters at longer reaction times (60−120 min).
However, as the products in this thesis were kept in a cold room (4°C) for two days, they separated
into two phases, like the products from runs 1−17, indicating that by-product glycerol was present in
the single phase. Glycerol presence was also confirmed by gas chromatography-mass spectrometry
(GC-MS), which detected a peak associated with glycerol. The presence of a single, liquid phase
raised questions concerning the adequacy of the residence time (1 hr) in the 3-phase separator used in
previous simulation models (SC-WVO and SC-LowE). In light of the fact that the reaction time was
relatively short (7−14 min) and since no single-phase product was reported by Bunyakiat et al. (2006),
the residence time used in the simulation models was considered to be adequate.

109
5.2. Conclusions
This thesis begins with the measurement of the normal boiling point of triolein through the
thermogravimetric method. The boiling point was used for later process simulations and an economic
analysis of a supercritical biodiesel production process. Based on the thermogravimetric result, the
normal boiling point of triolein was found to be 412.8°C, which was lower than the value reported by
Hysys, Aspen and VMGsim programs used by previous studies of the process simulation of biodiesel
production. Significant improvements in the specific heat capacity, mass density and viscosity were
observed as the normal boiling point found by the thermogravimetric analysis was applied to triolein
in Hysys.
Using the triolein with the improved properties, simulation models of four different kinds of
biodiesel production processes were developed: a homogeneous alkali-catalyzed process using fresh
vegetable oil as the feedstock (Alkali-FVO); a homogeneous catalyzed process using waste vegetable
oil as the feedstock (Alkali-WVO); a supercritical process using waste vegetable oil as the feedstock
(SC-WVO); and a supercritical process with slight modifications to the SC-WVO process in an
attempt to lower energy consumption. The process flowsheets and energy and material balances were
presented in Chapter 2. A comparison of the energy consumption of the four processes showed that
the supercritical process (SC-WVO) consumed 4.6 times more energy than the Alkali-FVO process
as a result of the large amount of methanol evaporated in the distillation column and the reaction
conditions of high temperature and pressure.
The economic assessment, conducted in Chapter 3, showed that the advantageous use of the
low-cost feedstock in the supercritical process compensated for the high utility cost when compared
to the conventional alkali-catalyzed process. The costs for the feedstock oil comprised 84.0%, 63.9%,
71.3% and 75.4% of the total production costs of biodiesel using Alkali-FVO, Alkali-WVO, SC-
WVO and SC-LowE processes, respectively, considerably affecting the processes‘ economics.
Based on the economic analysis, SC-LowE is the most promising process among those
investigated. The discounted payback period, net present value, discounted cash flow rate of return
and break-even price of biodiesel were 4.2 years, $21.086 million, 49.6% and $0.726/kg, respectively.
The net present values of the SC-WVO, Alkali-WVO and Alkali-FVO processes were $16.451
million, $1.901 million and -$21.697 million, respectively. These results indicate the potential of the
supercritical processes compared to the conventional alkali-catalyzed process.
Sensitivity analysis of the six parameters (biodiesel selling price, feedstock oil price, by-
product glycerol price, interest rate, life of the biodiesel plants and capacity) was conducted in order
to systematically examine the effect of positive and negative changes in project parameters on

110
profitability. From these results, biodiesel selling price, feedstock oil price, by-product glycerol price
and interest rate were found to be the significant factors contributing to the net present values of the
four processes. These were further studied through the Response Surface Method (RSM) coupled
with central composite design (CCD) using JMP software. Through the analysis of variance
(ANOVA) of the results, prediction formulas of the NPV for each of the four processes were
developed.
The significance of the usage of low-cost feedstock and the potential of a supercritical
process resulting from the economic assessment brought about the idea to conduct experiments on
synthesizing biodiesel from waste canola oil using supercritical methanol. Supercritical reactions with
the waste canola oil and methanol gave the FAME yields close to 100% at the reaction conditions of
270°C/10 MPa after 45 min of reaction time. Due to the relatively moderate reaction conditions, the
reaction time necessary to achieve a high FAME yield was longer than the time reported in literatures
(Saka and Kusdiana, 2001; Madras et al., 2004; Demirbas, 2009; Valle et al., 2010). Experiments
showed that the conversion of the waste oil increased significantly with increasing reaction time and
reaction temperature. The effect of methanol to oil weight ratio on the FAME yield was relatively
less significant. The interaction between reaction time and reaction temperature was identified by the
ANOVA of the experimental results.
5.3. Recommendations
For the future research, several recommendations are proposed based on the work conducted
for this thesis.
Experiments should be performed to verify the quantity of glycerol used for the washing
process in the liquid-liquid extraction column in Alkali-WVO process.
For the comparison with the properties of triolein estimated by Hysys, it is recommended to
apply the normal boiling point of triolein determined by the thermogravimetric analysis to
other process simulation programs.
Since the reaction conversion (96%) in the supercritical process simulation models referred to
the experimental data reported by Bunyakiat et al. (2006) where coconut and palm oils were
used instead of waste vegetable oil as the feedstocks, it is recommended to perform
experiments to verify the reaction conditions and conversions in SC-WVO and SC-LowE
processes using waste vegetable oil.
111
It is also recommended to conduct a kinetic study of thermal decomposition of methyl esters,
which can be combined with transesterification and esterification reaction kinetics. The data
would enhance the simulation of a plug flow reactor in SC-WVO and SC-LowE processes,
and could be usefully applied as scaling up the processes.
The simulated waste vegetable oil in Alkali-WVO, SC-WVO and SC-LowE processes
contains 5 wt% free fatty acid, but in practice waste vegetable oil contains diverse ranges of
free fatty acids and water as reported by Canakci (2007). Therefore, the feedstock oil to be
used in a simulation model could be expanded to include those with FFAs contents greater
than 5 wt% and water content.
The reason why the products from run 18 and run 19 in Chapter 4 formed a single phase and
took relatively long time to be separated into two phases was not fully investigated in this
thesis. Experiments need to be performed to find out in which reaction conditions single
phase products are generated by varying the key parameters such as reaction time, reaction
temperature, reaction pressure and weight ratio of methanol to oil. Verifying components in
the products could subsequently be done using GC-MS and compared to those in other
products having two phases from the beginning.
Around 99% of by-product glycerol was removed from the biodiesel in the simulated 3-phase
separators in the supercritical process models (SC-WVO and SC-LowE). Performing
experiments with a mixture of the similar composition with that of the feed stream to the 3-
phase separator are recommended to verify the simulation results.
112
Bibliography
Aimaretti, N., Manuale, D.L., Mazzieri, V.M., Vera, C.R. and Yori, J.C., 2009. Batch study of glycerol
decomposition in one-stage supercritical production of biodiesel. Energy & Fuels, 23(2),
1076-1080.
Bunyakiat, K., Makmee, S., Sawangkeaw, R. and Ngamprasertsith, S., 2006. Continuous production of
biodiesel via transesterification from vegetable oils in supercritical methanol. Energy & Fuels,
20(2), 812-817.
Canakci, M., 2007. The potential of restaurant waste lipids as biodiesel feedstocks. Bioresource
Technology, 98(1), 183-190.
Demirbas, A., 2009. Biodiesel from waste cooking oil via base-catalytic and supercritical methanol
transesterification. Energy Conversion and Management, 50(4), 923-927.
Filatov, V.A. and Afanas'ev, V.N., 1992. Differential heat-flux calorimeter. Izv. Vysshikh. Uchebn.
Zaved., Khim. Khim. Tekhnol., 35(8), 97-100.
Kasteren, J.M.N.V. and Nisworo, A.P., 2007. A process model to estimate the cost of industrial scale
biodiesel production from waste cooking oil by supercritical transesterification. Resources,
Conservation and Recycling, 50(4), 442-458.
Lim, Y., Lee, H., Lee, Y. and Han, C., 2009. Design and economic analysis of the process for biodiesel
fuel production from transesterificated rapeseed oil using supercritical methanol. Industrial &
Engineering Chemistry Research, 48(11), 5370–5378.
Madras, G., Kolluru, C. and Kumar, R., 2004. Synthesis of biodiesel in supercritical fluids. Fuel,
83(14-15), 2029-2033.
Saka, S. and Kusdiana, D., 2001. Biodiesel fuel from rapeseed oil as prepared in supercritical methanol.
Fuel, 80(2), 225-231.
Santana, G., Martins, P.F., Silva, N., Batistella, C.B., Filho, R.M. and Maciel, M.R.W., 2010.
Simulation and cost estimate for biodiesel production using castor oil. Chemical Engineering
Research and Design, 88(5-6), 626-632.
Valle, P., Velez, A., Hegel, P., Mabe, G. and Brignole, E.A., 2010. Biodiesel production using
supercritical alcohols with a non-edible vegetable oil in a batch reactor. The Journal of
Supercritical Fluids, 54(1), 61-70.
West, A.H., Posarac, D. and Ellis, N., 2008. Assessment of four biodiesel production processes using
HYSYS. Plant. Bioresource Technology, 99(14), 6587-6601.
You, Y., Shie, J., Chang, C., Huang, S., Pai, C., Yu, Y. and Chang, C., 2008. Economic cost analysis
of biodiesel production: case in soybean oil. Energy & Fuels, 22(1), 182-189.
Zhang, Y., Dube, M.A., McLean, D.D. and Kates, M., 2003a. Biodiesel production from waste
cooking oil: 1. Process design and technological assessment. Bioresource Technology, 89(1),
1-16.

113
Zhang, Y., Dube, M.A., McLean, D.D. and Kates, M., 2003b. Biodiesel production from waste
cooking oil: 2. Economic assessment and sensitivity analysis. Bioresource Technology, 90(3),
229-240.

114
Appendix A: Economic assessments for the biodiesel plant capacities of 8,000 and
160,000 tonnes/yr biodiesel
Table A.1. Total capital cost for the four processes (unit: $ millions)
Process Alkali-FVO Alkali-WVO SC-WVO SC-LowE
Capacity (tonnes/year) 8,000 160,000 8,000 160,000 8,000 160,000 8,000 160,000
Direct items
Reactor Esterification - - 0.091 0.657 - - - -
Transesterification 0.109 0.642 0.13 0.624 0.113 1.934 0.335 1.695
Neutralization 0.05 0.106 0.026 0.105 - - - -
Column Methanol recovery 0.067 0.179 0.162
a
/0.129
0.552a
/0.174 0.104 0.619 0.068 0.256
Biodiesel
purification 0.11 0.597 0.097 0.844 0.153 0.88 0.124 0.578
Glycerol
purification 0.048 0.053 0.021 0.079 - - - -
Water washing 0.021 0.050 0.024 0.046 - - - -
Glycerol washing - - 0.09 0.156 - - - -
Other Pumps 0.017 0.019 0.031 0.034 0.023 0.141 0.023 0.141
Heat exchangers 0.005 0.03 0.037 0.125 0.293 1.76 0.321 1.744
L-L separator 0.009 0.031 0.006 0.031 0.015 0.041 0.015 0.041
Flash evaporator - - - - - - 0.02 0.097
Total purchased equipment 0.437 1.71 0.844 3.43 0.701 5.37 0.908 4.55
Equipment setting 0.014 0.027 0.025 0.042 0.014 0.046 0.016 0.04
Piping 0.542 0.82 0.929 1.59 0.905 4.13 0.885 3.159
Civil 0.106 0.19 0.155 0.298 0.099 0.235 0.105 0.229
Steel 0.041 0.089 0.066 0.146 0.021 0.056 0.03 0.077
Instrumentation 1.07 1.28 1.55 1.8 0.866 1.202 0.881 1.005
Electrical 0.494 0.664 0.515 0.706 0.471 0.681 0.482 0.682
Insulation 0.153 0.273 0.226 0.429 0.173 0.452 0.169 0.356
Paint 0.019 0.031 0.033 0.045 0.015 0.036 0.015 0.028
Total direct cost 2.879 5.086 4.344 8.487 3.286 12.21 3.481 10.13
Others 3.74 4.48 5.124 6.4 3.187 5.226 3.26 4.73
G and A Overheads 0.12 0.202 0.183 0.331 0.134 0.447 0.14 0.372
Contract Fee 0.368 0.46 0.483 0.644 0.335 0.64 0.343 0.567
Contingencies 1.28 1.84 1.824 2.855 2.256 6.02 2.348 5.133
Fixed capital cost 8.39 12.1 11.96 18.72 9.2 24.54 9.57 20.93
Working capital 1.26 1.81 1.8 2.81 1.38 3.68 1.44 3.14
Total capital investment 9.65 13.9 13.8 21.53 10.58 28.22 11.01 24.07 a Indicates a pre-treatment process
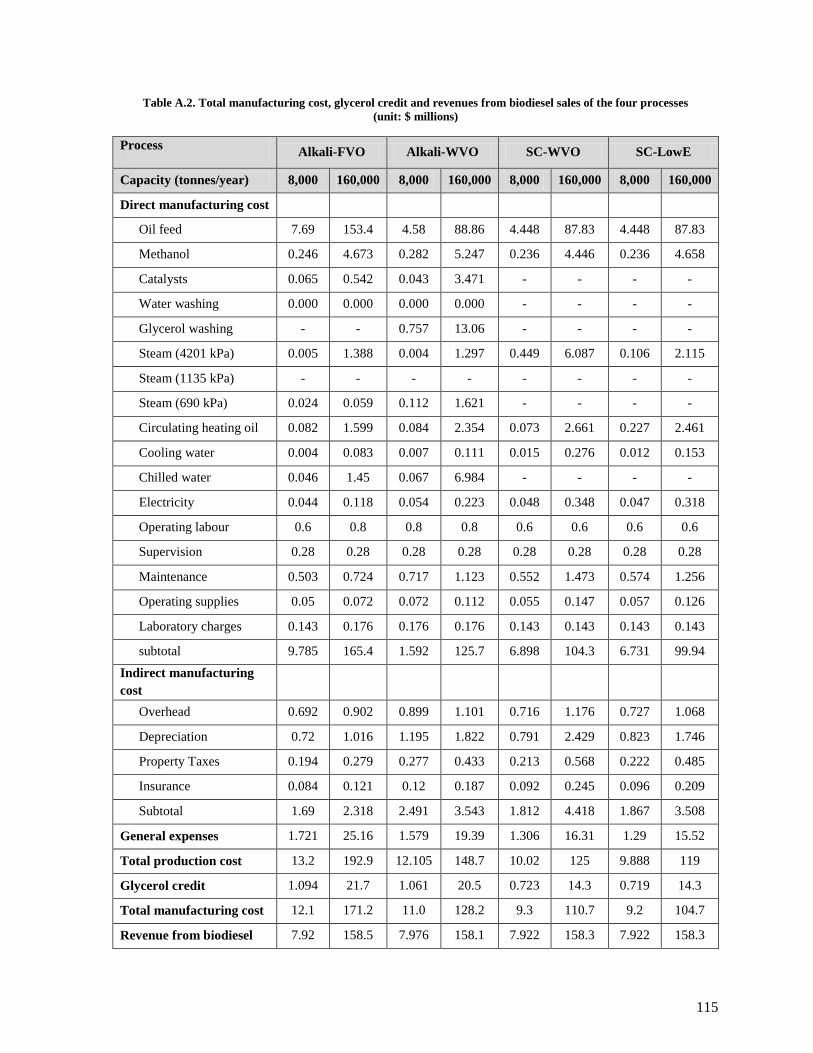
115
Table A.2. Total manufacturing cost, glycerol credit and revenues from biodiesel sales of the four processes
(unit: $ millions)
Process Alkali-FVO Alkali-WVO SC-WVO SC-LowE
Capacity (tonnes/year) 8,000 160,000 8,000 160,000 8,000 160,000 8,000 160,000
Direct manufacturing cost
Oil feed 7.69 153.4 4.58 88.86 4.448 87.83 4.448 87.83
Methanol 0.246 4.673 0.282 5.247 0.236 4.446 0.236 4.658
Catalysts 0.065 0.542 0.043 3.471 - - - -
Water washing 0.000 0.000 0.000 0.000 - - - -
Glycerol washing - - 0.757 13.06 - - - -
Steam (4201 kPa) 0.005 1.388 0.004 1.297 0.449 6.087 0.106 2.115
Steam (1135 kPa) - - - - - - - -
Steam (690 kPa) 0.024 0.059 0.112 1.621 - - - -
Circulating heating oil 0.082 1.599 0.084 2.354 0.073 2.661 0.227 2.461
Cooling water 0.004 0.083 0.007 0.111 0.015 0.276 0.012 0.153
Chilled water 0.046 1.45 0.067 6.984 - - - -
Electricity 0.044 0.118 0.054 0.223 0.048 0.348 0.047 0.318
Operating labour 0.6 0.8 0.8 0.8 0.6 0.6 0.6 0.6
Supervision 0.28 0.28 0.28 0.28 0.28 0.28 0.28 0.28
Maintenance 0.503 0.724 0.717 1.123 0.552 1.473 0.574 1.256
Operating supplies 0.05 0.072 0.072 0.112 0.055 0.147 0.057 0.126
Laboratory charges 0.143 0.176 0.176 0.176 0.143 0.143 0.143 0.143
subtotal 9.785 165.4 1.592 125.7 6.898 104.3 6.731 99.94
Indirect manufacturing
cost
Overhead 0.692 0.902 0.899 1.101 0.716 1.176 0.727 1.068
Depreciation 0.72 1.016 1.195 1.822 0.791 2.429 0.823 1.746
Property Taxes 0.194 0.279 0.277 0.433 0.213 0.568 0.222 0.485
Insurance 0.084 0.121 0.12 0.187 0.092 0.245 0.096 0.209
Subtotal 1.69 2.318 2.491 3.543 1.812 4.418 1.867 3.508
General expenses 1.721 25.16 1.579 19.39 1.306 16.31 1.29 15.52
Total production cost 13.2 192.9 12.105 148.7 10.02 125 9.888 119
Glycerol credit 1.094 21.7 1.061 20.5 0.723 14.3 0.719 14.3
Total manufacturing cost 12.1 171.2 11.0 128.2 9.3 110.7 9.2 104.7
Revenue from biodiesel 7.92 158.5 7.976 158.1 7.922 158.3 7.922 158.3
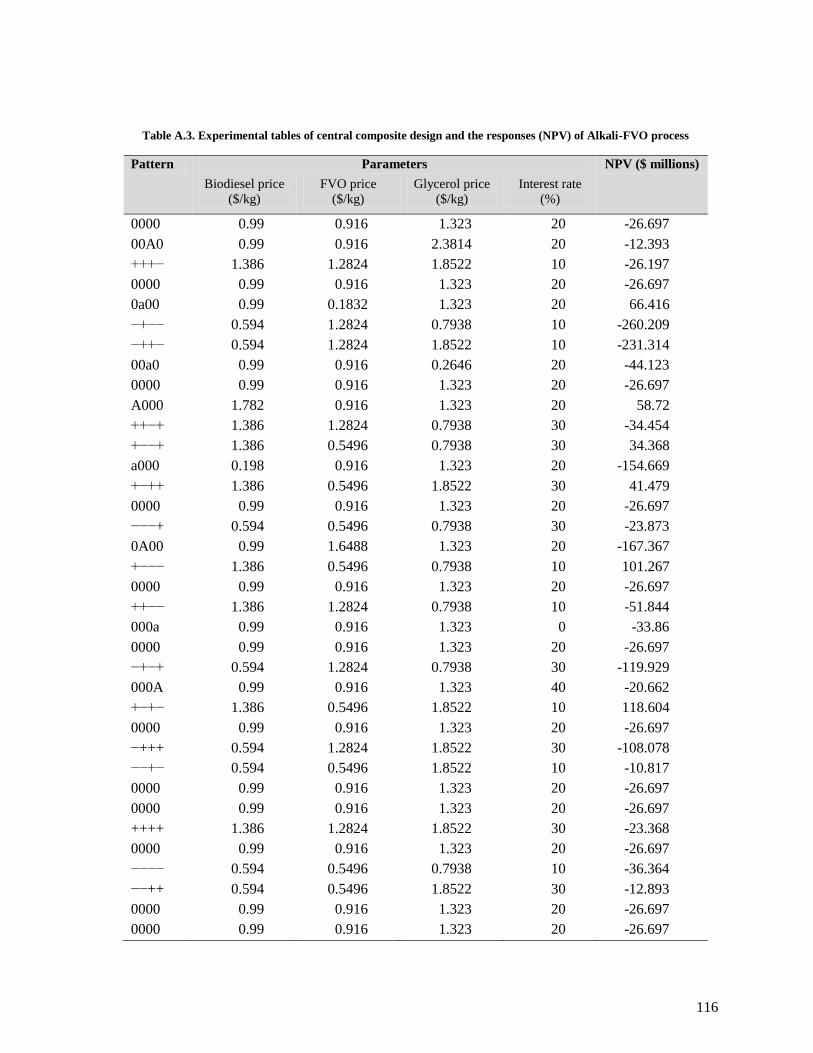
116
Table A.3. Experimental tables of central composite design and the responses (NPV) of Alkali-FVO process
Pattern Parameters NPV ($ millions)
Biodiesel price
($/kg)
FVO price
($/kg)
Glycerol price
($/kg)
Interest rate
(%)
0000 0.99 0.916 1.323 20 -26.697
00A0 0.99 0.916 2.3814 20 -12.393
+++− 1.386 1.2824 1.8522 10 -26.197
0000 0.99 0.916 1.323 20 -26.697
0a00 0.99 0.1832 1.323 20 66.416
−+−− 0.594 1.2824 0.7938 10 -260.209
−++− 0.594 1.2824 1.8522 10 -231.314
00a0 0.99 0.916 0.2646 20 -44.123
0000 0.99 0.916 1.323 20 -26.697
A000 1.782 0.916 1.323 20 58.72
++−+ 1.386 1.2824 0.7938 30 -34.454
+−−+ 1.386 0.5496 0.7938 30 34.368
a000 0.198 0.916 1.323 20 -154.669
+−++ 1.386 0.5496 1.8522 30 41.479
0000 0.99 0.916 1.323 20 -26.697
−−−+ 0.594 0.5496 0.7938 30 -23.873
0A00 0.99 1.6488 1.323 20 -167.367
+−−− 1.386 0.5496 0.7938 10 101.267
0000 0.99 0.916 1.323 20 -26.697
++−− 1.386 1.2824 0.7938 10 -51.844
000a 0.99 0.916 1.323 0 -33.86
0000 0.99 0.916 1.323 20 -26.697
−+−+ 0.594 1.2824 0.7938 30 -119.929
000A 0.99 0.916 1.323 40 -20.662
+−+− 1.386 0.5496 1.8522 10 118.604
0000 0.99 0.916 1.323 20 -26.697
−+++ 0.594 1.2824 1.8522 30 -108.078
−−+− 0.594 0.5496 1.8522 10 -10.817
0000 0.99 0.916 1.323 20 -26.697
0000 0.99 0.916 1.323 20 -26.697
++++ 1.386 1.2824 1.8522 30 -23.368
0000 0.99 0.916 1.323 20 -26.697
−−−− 0.594 0.5496 0.7938 10 -36.364
−−++ 0.594 0.5496 1.8522 30 -12.893
0000 0.99 0.916 1.323 20 -26.697
0000 0.99 0.916 1.323 20 -26.697
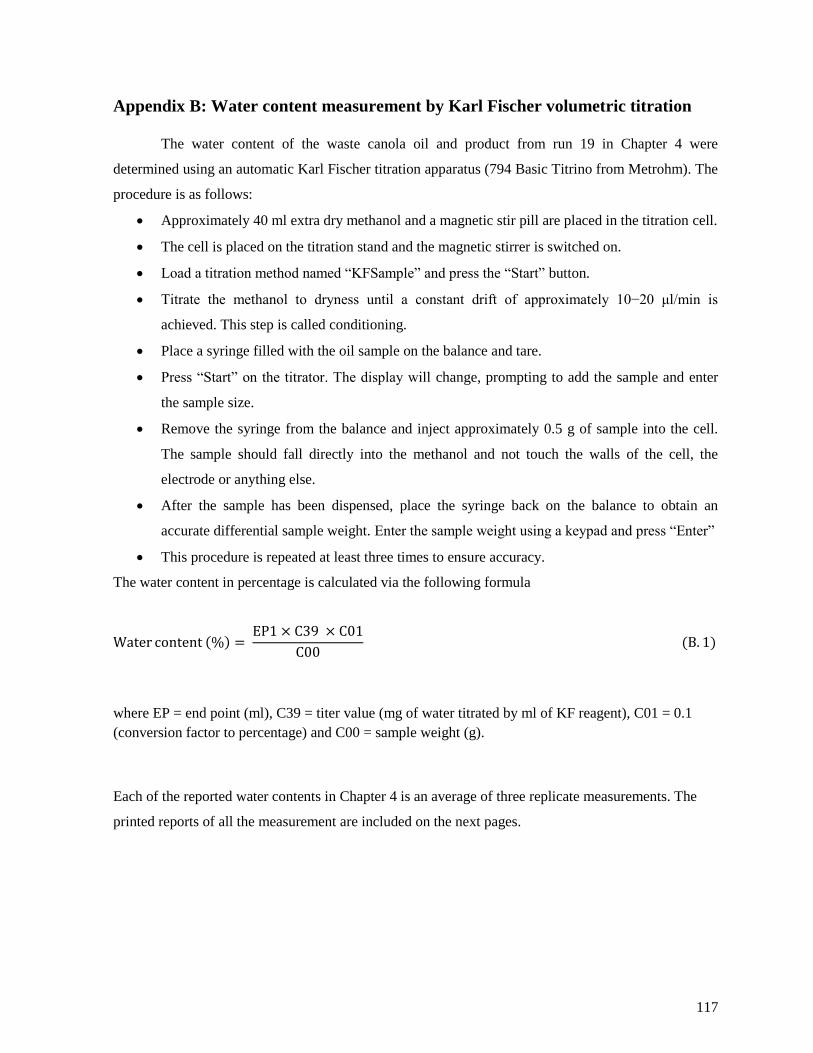
117
Appendix B: Water content measurement by Karl Fischer volumetric titration
The water content of the waste canola oil and product from run 19 in Chapter 4 were
determined using an automatic Karl Fischer titration apparatus (794 Basic Titrino from Metrohm). The
procedure is as follows:
Approximately 40 ml extra dry methanol and a magnetic stir pill are placed in the titration cell.
The cell is placed on the titration stand and the magnetic stirrer is switched on.
Load a titration method named ―KFSample‖ and press the ―Start‖ button.
Titrate the methanol to dryness until a constant drift of approximately 10−20 μl/min is
achieved. This step is called conditioning.
Place a syringe filled with the oil sample on the balance and tare.
Press ―Start‖ on the titrator. The display will change, prompting to add the sample and enter
the sample size.
Remove the syringe from the balance and inject approximately 0.5 g of sample into the cell.
The sample should fall directly into the methanol and not touch the walls of the cell, the
electrode or anything else.
After the sample has been dispensed, place the syringe back on the balance to obtain an
accurate differential sample weight. Enter the sample weight using a keypad and press ―Enter‖
This procedure is repeated at least three times to ensure accuracy.
The water content in percentage is calculated via the following formula
Water content % = EP1 × C39 × C01
C00 (B. 1)
where EP = end point (ml), C39 = titer value (mg of water titrated by ml of KF reagent), C01 = 0.1
(conversion factor to percentage) and C00 = sample weight (g).
Each of the reported water contents in Chapter 4 is an average of three replicate measurements. The
printed reports of all the measurement are included on the next pages.
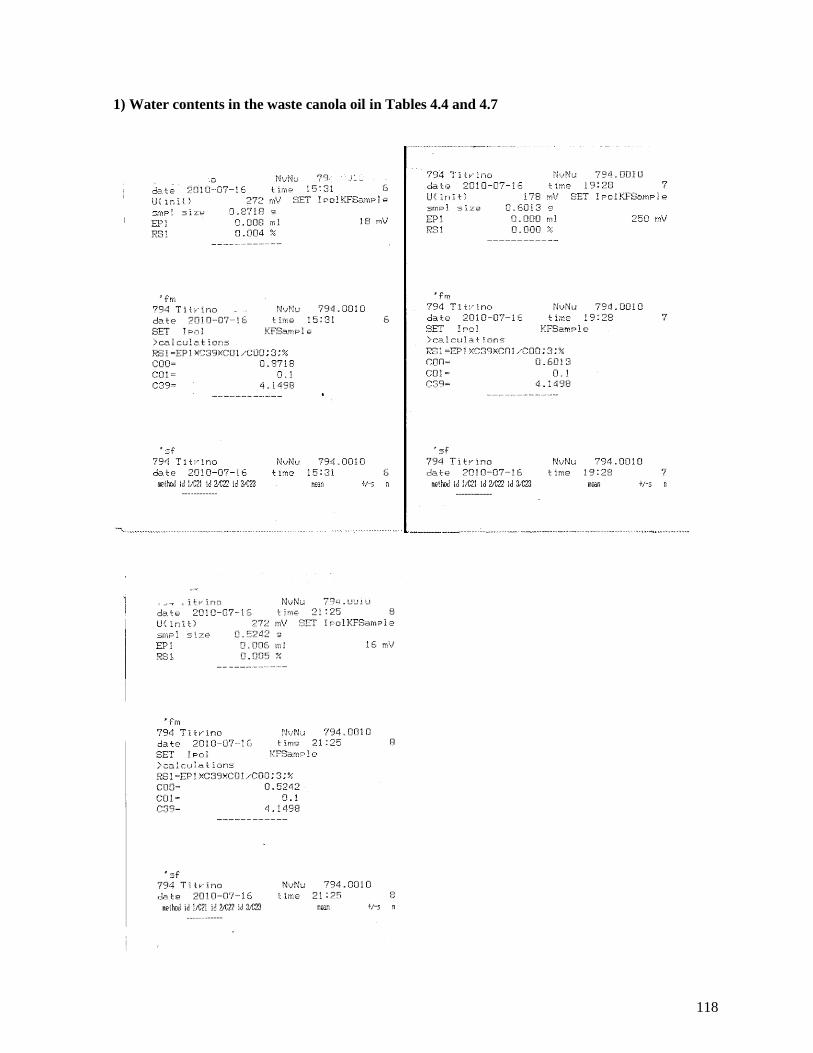
118
1) Water contents in the waste canola oil in Tables 4.4 and 4.7
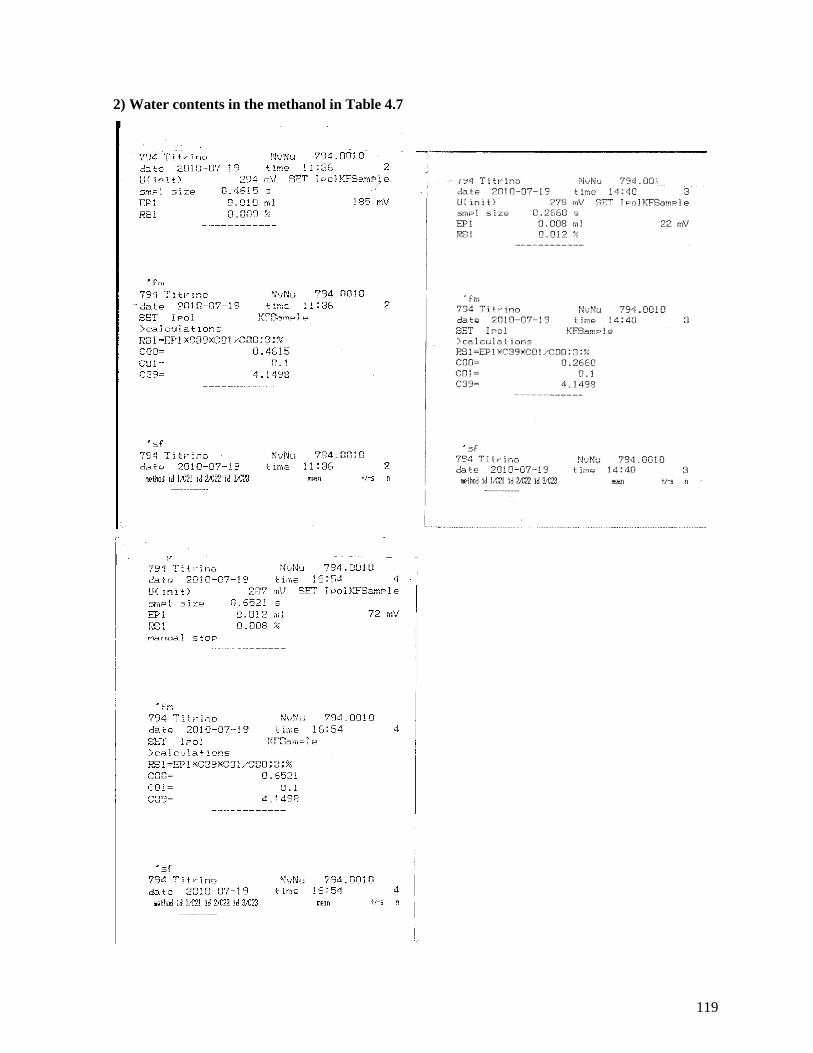
119
2) Water contents in the methanol in Table 4.7

120
3) Water contents in the biodiesel solution in Table 4.7

121
Appendix C: Sample calculations of FAME yields
The yields of FAME were calculated by Equation (C.1) in this thesis. Accordingly, the yield of
101.6% in Table 4.4 was calculated as shown in Equation (C.2). The concentrations of methyl esters
were measured by gas chromatography analysis.
Yield % = Total weight of methyl esters produced
Total weight of oil used for reaction × 100 (%) (C. 1)
Yield =Concentrations of methyl esters
gml
× Product volume (ml)
Total weight of oil used for reaction (g)× 100 (%)
=0.267 × 32.0
8.486× 100 % = 101.6% (C. 2)
The yield over 100% in the experiment 19 appears to be attributed to the FFAs contained in
the feedstock and the nature of the transesterification and esterification reactions. Simple calculations
of the yields from transesterification and esterification reactions are shown in Equation (C.3) and (C.4),
respectively. Methyl oleate was used as an example because it is the dominant component in the
biodiesel produced in this study. Assuming 100% conversion of transesterification, 3 mols of methyl
ester are produced from 1 mol of triolein. Because the mass of 3 mols of methyl oleate are slightly
heavier than the mass of 1 mol of triolein, the yield calculated based on the definition in Equation (C.1)
becomes 100.46%. In the same manner, the yield from esterification of oleic acid is calculated to be
104.97% as complete conversion of oleic acid was assumed. Thus, the theoretical FAME yield for the
waste oil containing 96 wt% triolein and 4 wt% oleic acid is 100.64%, assuming 100% conversion of
both transesterification and esterification reactions. The 101.6% yield in run 19 is 0.95% higher than
the theoretical yield, indicating almost complete conversion of fatty compounds in the waste canola oil
was achieved.
triolein 1 mol 885.4 g → methyl oleate 3 mols 889.4 g ,
∴ Yield = 889.4
885.4 × 100 % = 100.46% (C. 3)
oleic acid 1 mol 282.46 g → methyl oleate 1 mol 296.49 g
∴ Yield = 296.49
282.46 × 100 % = 104.97% (C. 4)
Waste oil triolein 96 wt% + oleic acid 4 wt% 100.00 g → methyl oleate 100.64 g
∴ Yield = 100.64
100.00 × 100 % = 100.64% (C. 5)
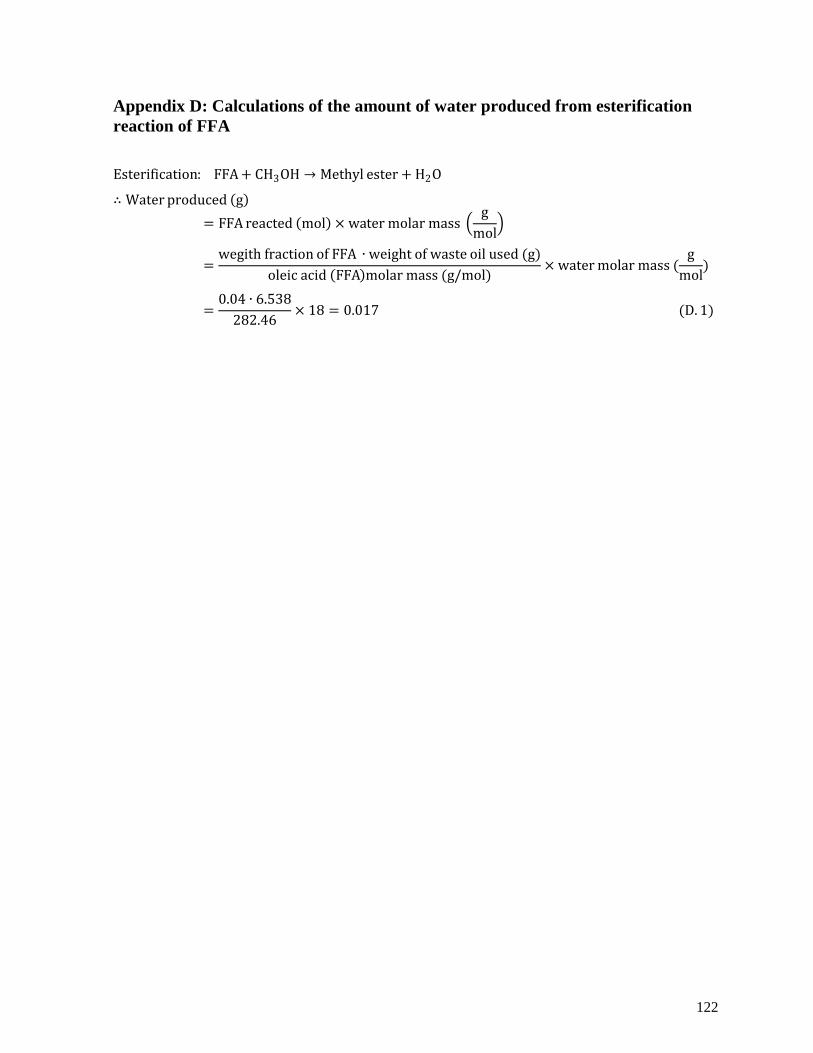
122
Appendix D: Calculations of the amount of water produced from esterification
reaction of FFA
Esterification: FFA + CH3OH → Methyl ester + H2O
∴ Water produced g
= FFA reacted mol × water molar mass g
mol
=wegith fraction of FFA ∙ weight of waste oil used (g)
oleic acid FFA molar mass (g/mol)× water molar mass (
g
mol)
=0.04 ∙ 6.538
282.46× 18 = 0.017 (D. 1)

12
3
Appendix E: Gas chromatography-mass spectrometry (GC-MS)
A Varian Factor FourTM
capillary VF-5ms column of 30 m × 0.25 mm × 0.25 μm film thickness was used with helium as carrier gas. The
temperature program started at 60°C (held for 2 min) and ramped to 270°C at 20°C/min. The holding time at the final temperature (270°C) was 2
min. The temperature of the injector was set at 270°C. A 1μl of the biodiesel sample in Table 4.7 was injected into the column. Details of peak
identifications of the components in Table 4.8 are shown on the next pages. The chromatographic peaks of methyl esters with a carbon chain
longer than C14 appeared in the retention times >10.0 min.
Figure E.1. GC-MS chromatogram of the single phase biodiesel product in Table 4.7
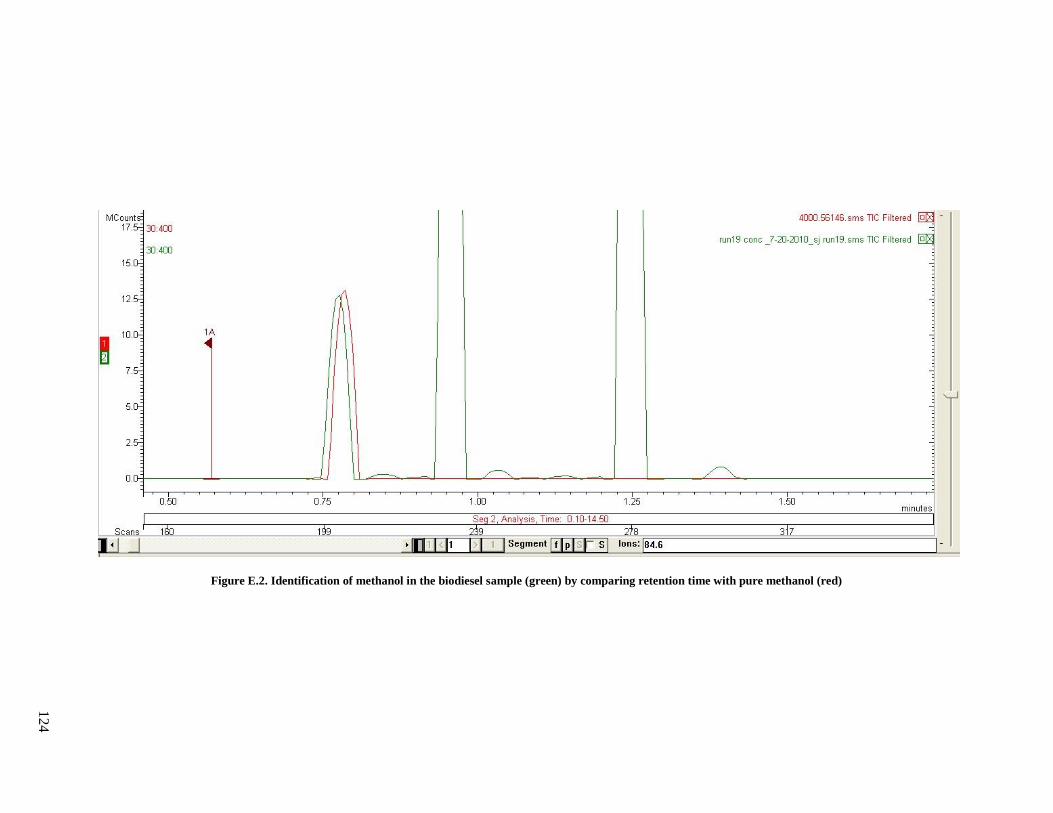
12
4
Figure E.2. Identification of methanol in the biodiesel sample (green) by comparing retention time with pure methanol (red)
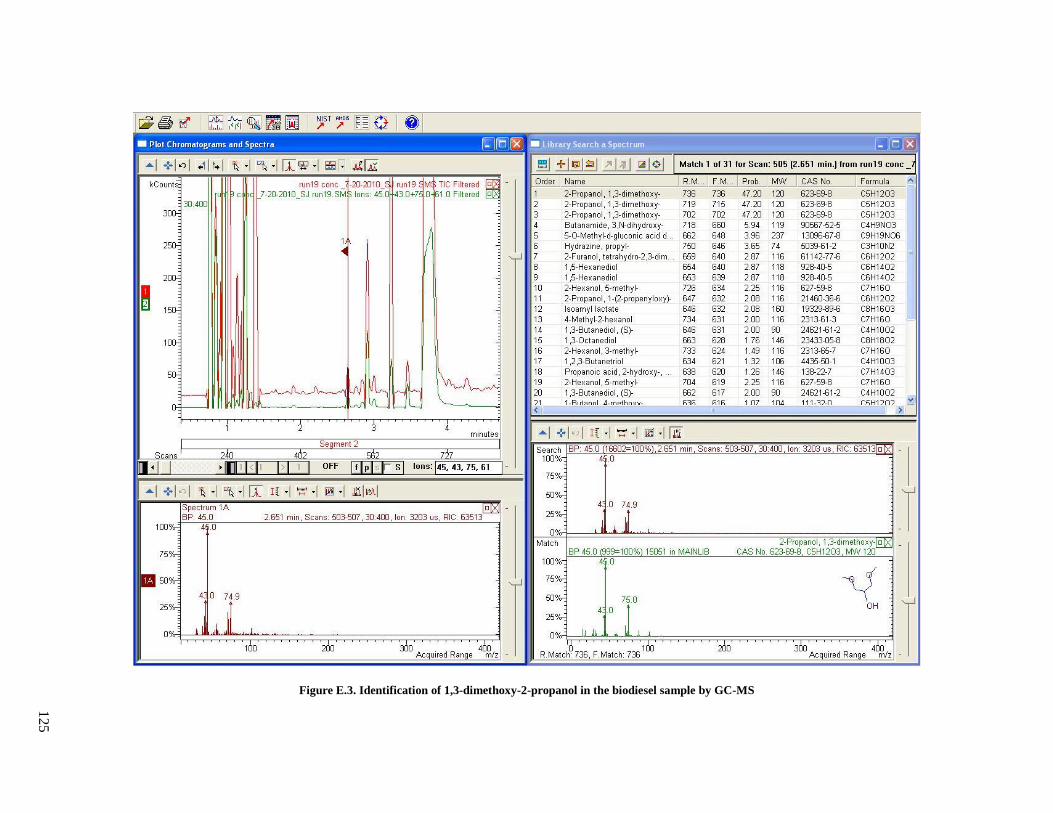
12
5
Figure E.3. Identification of 1,3-dimethoxy-2-propanol in the biodiesel sample by GC-MS

12
6
Figure E.4. Identification of 3-dimethoxy-1,2-propandiol in the biodiesel sample by GC-MS
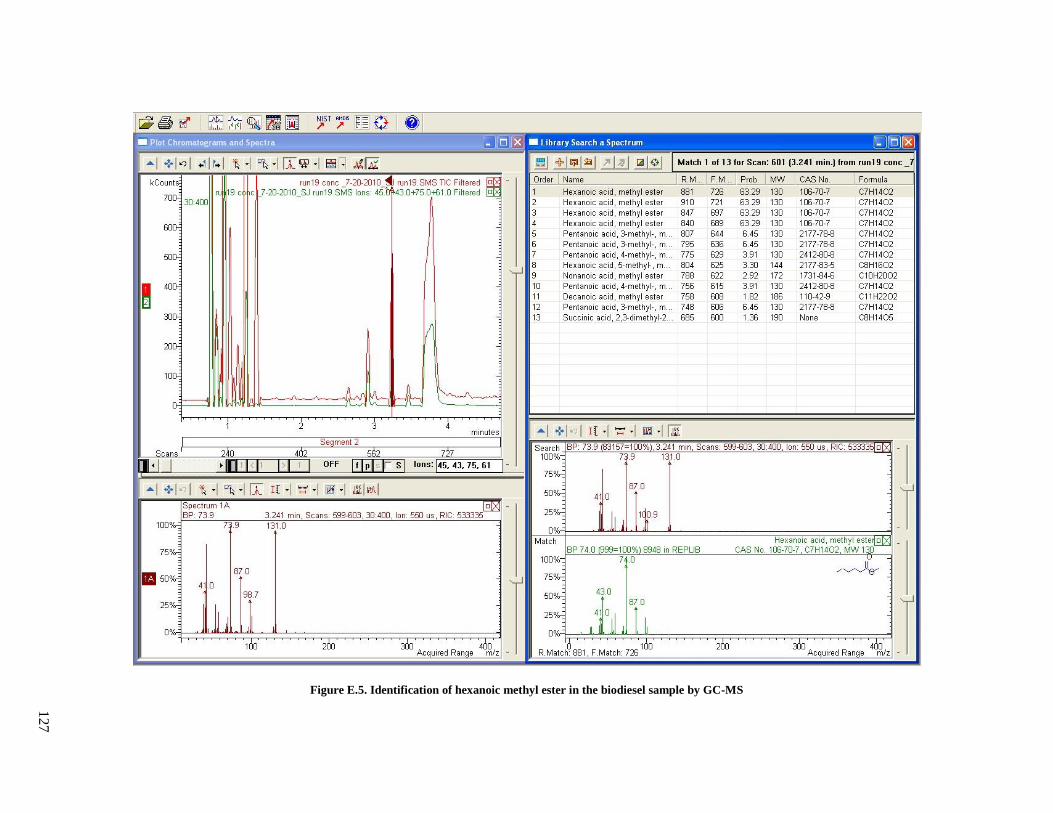
12
7
Figure E.5. Identification of hexanoic methyl ester in the biodiesel sample by GC-MS
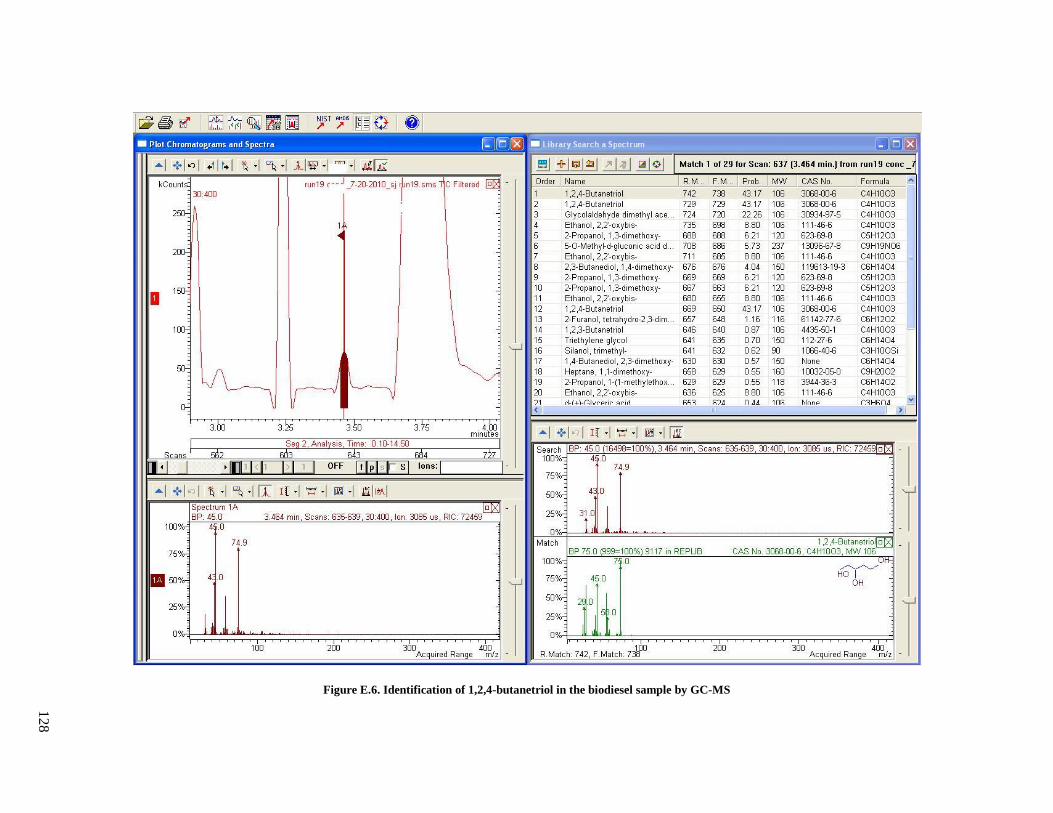
12
8
Figure E.6. Identification of 1,2,4-butanetriol in the biodiesel sample by GC-MS
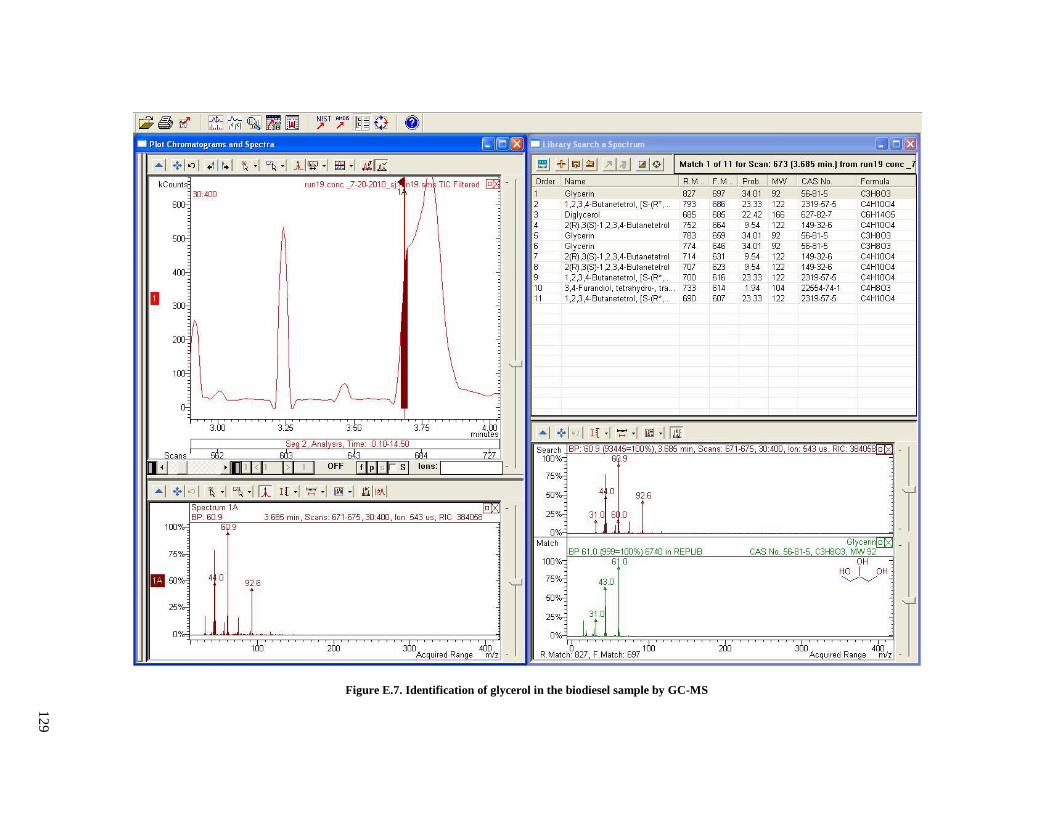
12
9
Figure E.7. Identification of glycerol in the biodiesel sample by GC-MS
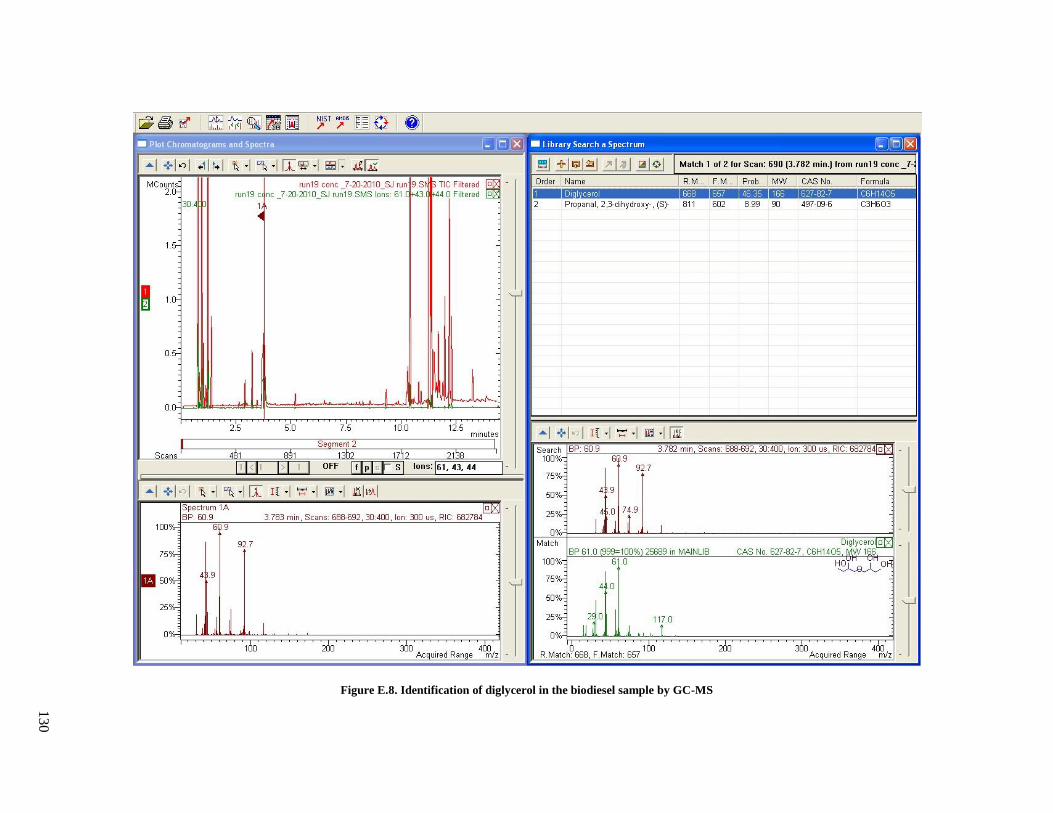
13
0
Figure E.8. Identification of diglycerol in the biodiesel sample by GC-MS

13
1
Figure E.9. Identification octanoic methyl ester in the biodiesel sample by GC-MS