Process parameters influence on mechanical strength of direct bonded surfaces for both materials:...
32
1 Process parameters influence on mechanical strength of direct bonded surfaces for both materials : Silica and Zerodur ® glasses N. Cocheteau a , A. Maurel-Pantel a , F. Lebon a , I. Rosu a , E. Prieto b , S. Ait- Zaid c , I. Savin De Larclause c , Y. Salaun d a LMA, Mechanics and Acoustics Laboratory, CNRS, UPR 7051, Aix-Marseille Univ, Centrale Marseille, 31, Chemin Joseph Aiguier, F-13402 Marseille Cedex 20, France b LAM, Marseille Astrophysics Laboratory, CNRS-INSU, UMR7326, Aix-Marseille Univ, Technopôle Château-Gombert 38, rue Frédéric Joliot-Curie 13388 Marseille cedex 13, France c CNES, National Center for Spatial Studies,18 Avenue Édouard Belin 31400 Toulouse, France d WINLIGHT OPTICS, 135 rue Benjamin Franklin, ZA Saint Martin, 84120 Pertuis, France Corresponding author: PhD Natacha Cocheteau Address: Laboratoire de Mécanique et d'Acoustique, 31 chemin J. Aiguier, 13402 Marseille cedex 20, France Tel: + 33 (0)4 91 16 42 27 Fax: + 33 (0) 4 91 16 44 81 Email: [email protected]
Transcript of Process parameters influence on mechanical strength of direct bonded surfaces for both materials:...

1
Process parameters influence on mechanical strength of direct bonded
surfaces for both materials : Silica and Zerodur® glasses
N. Cocheteau a, A. Maurel-Pantel a, F. Lebon a, I. Rosu a, E. Prieto b, S. Ait-
Zaid c, I. Savin De Larclause c, Y. Salaun d
aLMA, Mechanics and Acoustics Laboratory, CNRS, UPR 7051, Aix-Marseille Univ,
Centrale Marseille, 31, Chemin Joseph Aiguier, F-13402 Marseille Cedex 20, France
bLAM, Marseille Astrophysics Laboratory, CNRS-INSU, UMR7326, Aix-Marseille
Univ, Technopôle Château-Gombert 38, rue Frédéric Joliot-Curie 13388 Marseille
cedex 13, France
cCNES, National Center for Spatial Studies,18 Avenue Édouard Belin 31400 Toulouse,
France
d WINLIGHT OPTICS, 135 rue Benjamin Franklin, ZA Saint Martin, 84120 Pertuis,
France
Corresponding author: PhD Natacha Cocheteau
Address: Laboratoire de Mécanique et d'Acoustique, 31 chemin J. Aiguier, 13402
Marseille cedex 20, France
Tel: + 33 (0)4 91 16 42 27
Fax: + 33 (0) 4 91 16 44 81
Email: [email protected]

2
Process parameters influence on mechanical strength of direct bonded
surfaces for both materials: Silica and Zerodur® glasses
Direct bonding is of particular interest for optical system manufacturing for
spatial application. This technology is already used in terrestrial optical system
manufacturing because of the very high precision of the process and complex
geometries are able to bond. However, even if a first prototype already passed
with success space environment test, quantification and improvement of the
mechanical strength of assemblies are essential to validate the assembly’s life
expectancy and to validate the European Space Agency standards. So, this work
proposes to study the influence of process parameters, such as roughness, relative
air humidity during room temperature bonding, annealing time and temperature,
on mechanical strength of an elementary mechanical structure using a double
shear test procedure and cleavage tests. At the same time, the performances of
fused silica and Zerodur® glasses are compared. For the process considered in
this study, a parallel is made between chemical phenomena, surface roughness
and mechanical strength. In the end, cleavage tests confirm the choice of the
optimal process parameters and highlight a damaging phenomenon of bonded
interfaces with successive re-adhesion.
Keywords: Direct Bonding, Mechanical Strength, Bonding Energy, Double Shear
Test, Annealing Temperature, Roughness, Humidity, Annealing Time, silica
glasses, Zerodur® glasses.
A. Introduction
Direct bonding consists in joining two surfaces without the use of any adhesives or
additional material [1, 2]. Usually, by bringing two flats, well-polished surfaces into
contact at room temperature, they locally attracted to each other by Van der Waals or
hydrogen, bonds and adhere or bond. Direct bonding is also known as wafer bonding or
molecular bonding. Direct bonding is a process involved in micro-fabrication process
on micro-electronics. The main applications are on silicon-on-insulator devices. Silicon
based sensor and actuators, electronics substrates are other examples of wafer bonding
applications [3-5]. More recently, this process is used in the manufacturing of high

3
performance optical systems for terrestrial application such as Fabry-Perot
interferometers, prism assemblies, etc. For instance, this bonding process has been used
in the manufacture of the largest slicer ever used in the Multi Unit Spectroscopic
Explorer (MUSE) for the Very Large Telescope (VLT) [6] as related in Figure 1.
Nowadays, they are of particular interest for spatial instruments applications. Indeed,
this is a high-precision production process and assemblies obtained present a
dimensional stability due to the fact that no mechanical part or glue is required. In
addition, since no adhesive materials are used in those processes, the risks of
contamination associated with degassing are avoided, which is another advantage in
spatial context. A first prototype has already passed with success the mechanical and
thermal environment of space [7] where the constraints involved (thermal fatigue,
accelerations, vibrations, etc.) are very different from those encountered on Earth.
However, a better understanding of the assemblies’ mechanical strength behaviour is
required to validate the system life expectancy and to meet the European Space Agency
standard.
Figure 1: Slicer developed in the Multi Unit Spectroscopic Explorer (MUSE) for
the Very Large Telescope (VLT) [6].
Mechanical strength of those bonded interfaces depends on the interface defects and the
nature of bonds involved. Indeed, room temperature bonding needs flatness and
roughness perfectly controlled, and no particles contaminations on surfaces [8-12].

4
Moreover, room temperature bonding is usually relatively weak; consequently, for some
applications, the bonded assemblies undergo an annealing treatment causing changes in
the nature of bonds responsible for adhesion and thus strengthen the bond across the
interface [13, 14]. Therefore, it is necessary to quantify the bonding strength and to
improve the mechanical performance of adhesive bonds using the confidential Winlight
Optics Company process of surface preparation and without degrading optical
performances of the material used or damaging coating applied on bonded optical
system. In this study, the Winlight Optics Company process is considered. Thus, it is
proposed to improve the understanding of multi-physical couplings and multi-scale
mechanical phenomena of direct bonding, by quantifying links and close interactions
between chemical phenomena, process parameters (annealing temperature and time,
humidity level), surface roughness and mechanical strength. The final aim consists to
understand mechanisms at the interface of mechanical strength reinforcement and to
find a way to improve treatment of the assemblies in order to obtain a better structural
behaviour. So, in this work, the influence of some process parameters, such as
roughness, relative air humidity during room temperature bonding, annealing time and
temperature, on mechanical strength of an elementary mechanical structure is
investigated. First, fused silica glasses and Zerodur® glasses, which are specific
materials used for spatial optical applications, are quickly presented as well as the
sample preparation. At the beginning, the nature of both materials surfaces are
compared using wetting tests and X ray spectroscopy analysis (XPS). Then, the
mechanical strength of bonded interfaces of each kind of samples is also compared
using double shear experiments. And performances of fused silica and Zerodur® glasses
are compared. Afterwards, according to the results the choice of the optimal process
parameters is made in order to increase mechanical strength without degrading material
5
properties. Lastly, a comparison between samples with initial parameters (bonding at
ambient temperature) and optimal parameters is performed using cleavage tests.
B. Background on Direct bonding process
Surface preparation
Direct bonding is possible as long as the two surfaces have similar geometries and
requires clean surfaces free of contaminants [10, 15]. Therefore, first steps of the
Winlight Optics Company process consist in physical and chemical preparation of
surfaces. Several polishing of both surfaces to adhere were manually performed in order
to obtain the exact surface roughness (here, roughness is always less than 1 nm RMS),
flatness and deflection required. Indeed, a high level of roughness results in a weak
contact zone and thus in the occurrence of defects during the bonding process. When the
roughness is too great, bonding becomes impossible [16-19]. Then, surfaces undergo a
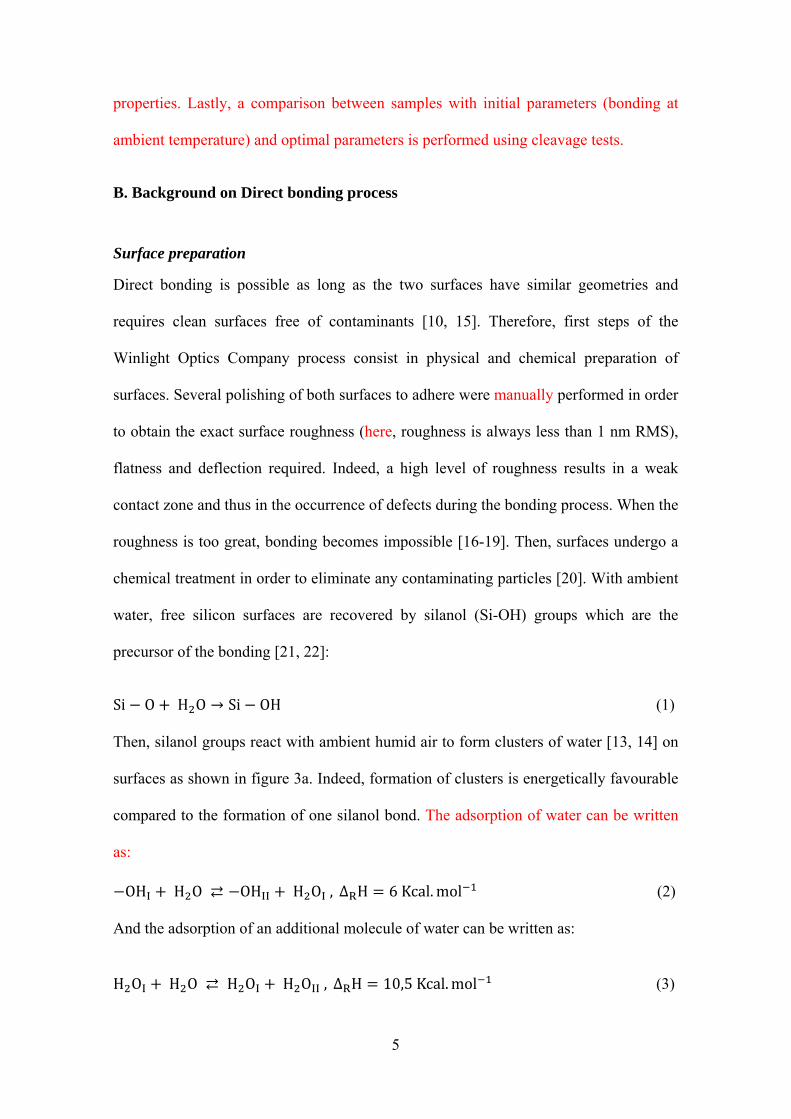
chemical treatment in order to eliminate any contaminating particles [20]. With ambient
water, free silicon surfaces are recovered by silanol (Si-OH) groups which are the
precursor of the bonding [21, 22]:
Si O H O → Si OH (1)
Then, silanol groups react with ambient humid air to form clusters of water [13, 14] on
surfaces as shown in figure 3a. Indeed, formation of clusters is energetically favourable
compared to the formation of one silanol bond. The adsorption of water can be written
as:
OH H O ⇄ OH H O , ∆ H 6Kcal.mol (2)
And the adsorption of an additional molecule of water can be written as:
H O H O ⇄ H O H O , ∆ H 10,5Kcal.mol (3)

6
Thus, the water form clusters on the surface before all the Si-OH groups have adsorbed
water molecules. With this chemical treatment, we seek to have the more silanol groups
possible on both surfaces. On figure 2, one component of the roughness is represented,
each line represents a bonding site, and obviously a lack of bonding sites causes
incomplete bonding.
Figure 2: Behaviour of surfaces during room temperature bonding according to their
hydroxylated rate (from [13]).
Room temperature bonding
Once physical preparation and surface treatment has been completed, surfaces are
brought into contact and bonding occurs between clusters of the two surfaces. A process
of capillarity occurs due to the humid air trapped between the surfaces [8]. By applying
a slight local pressure, the surfaces are brought closer together, and hydrogen bonds
developed between molecules of water present at the interface and the two surfaces. A
bonding wave propagates from the contact point through the whole sample, resulting in
the bonding of the surfaces. Molecules of water migrate from the bonding interface
and/or diffuse at the interface, bringing the surfaces even closer together and initiating
silanol-silanol covalent bonds [14, 23, 24].

7
Figure 3: Evolution of the nature of bonds at the interface during thermal treatment.
Evolution of bonded interfaces with temperature
In order to obtain a stronger or irreversible sealing by increasing the number of covalent
bonds, it is necessary to change the nature of bonds at the interface by applying for
instance a thermal treatment (figure 3). Indeed, between 25°C and 200°C, surfaces are
contacted via clusters of waters [13, 14]. When temperature is lower than 110°C,
chemical reactions at the bonded interface are the same than during room temperature
bonding i.e. formation of hydrogen bonds between molecules of water and surfaces.
Between 110°C and 150°C molecules of water start to release (Phase I).
When temperature is between 200°C and 700°C, there is formation of cyclic
tetramers of water; surfaces are directly contacted via double hydrogen bond
(Phase II) as shown in figure 3b [27].
Up to 700°C the polymerization reaction is triggered, resulting in the formation
of covalent siloxane bonds (Phase III, fig. 3c) [13, 14]:
Si OH HO Si ⇆ Si O Si H (4)

8
C. Materials and test methods
Materials
In optical applications, three materials are mainly used: fused silica glasses, Zerodur®,
and Zinc Selenide (ZnSe). In this work, we chose to study two of them the fused silica
glasses and Zerodur® glasses which are the most commonly used in spatial optical
applications with a reasonable cost.
Silica is the main constituent of glass. Crystalline silica has a tetrahedral structure
wherein each tetrahedral unit (SiO4) contains a silicon atom at the center and four
oxygen atoms occupy the vertices of the tetrahedron. However, glass is an amorphous
material, therefore, it shows major structural disorder. Fused silica glass can be seen as
an anarchistic stacking of SiO2 tetrahedra, in which, only short range order is
maintained.
Zerodur® is a glass-ceramic type invented in 1968 by optical materials producer
Schott AG™ and it is specifically designed for astronomy observations in terrestrial and
spatial fields. The special feature of this material comes from its thermal expansion
coefficient almost nil and homogeneous in all directions. So, Zerodur® offers a very
high thermal stability [28]. It is a non-porous glass ceramic composed at 78% of
nanocrystals with a quartz structure trapped in residual vitreous phase. Crystals have a
negative thermal expansion coefficient and the glass a positive thermal expansion
coefficient which offset, giving to Zerodur® its weak thermal expansion coefficient.
Zerodur® is composed of 57.2 % of silica (SiO2), 25.3 % of aluminium oxyde (Al2O3),
6,5 % of phosphorous pentoxide (P2O5), 3,4 % of lithium oxide (LiO2), 2,5 % of
titanium dioxide (TiO2), 1,8 % of zyrconium dioxide (ZrO2), 1 % of magnesium oxide
(MgO), 0,5 % of arsenic trioxide (As2O3) and 0,2 % of sodium oxide (NaO). Small
changes can occur in coefficient of thermal expansion (CTE) with the annealing

9
treatment and can affect the geometric accuracy and stability of the high precision
optical assemblies. So, it is interesting to note that for Zerodur®, there is three
temperature ranges where different behaviours of CTE are observed [28]:
When T > 700°C (ceramising range)
Between 320°C < T < 700°C steady state
Between 130°C < T < 320°C (superior relaxation range)
Between 40°C < T < 130°C steady state
Between -70°C < T < 40°C (inferior relaxation range)
For temperature above 700°C, the material ceramising continues in irreversible way,
changes in material properties appear and the CTE is irreversibly changed. Figure 4
relates limits and temperature influence on dimensional stability for samples initially
annealed at different temperatures and cooled at room temperature. Up to annealing
temperature about 130°C, there is no modification in CTE. Above this temperature,
CTE increases to a specific constant value, in order to not degrade the thermal
expansion parameter (CTE), the cooling speed has to be choosen between 1°C/h and
6°C/h (cooling procedure during Zerodur manufacturing) [28]
Figure 4 Variation of the coefficient of thermal expansion CTE (0°C; 50°C) –
first cooling at 0.1 K/min- as a function of the initial temperature of a secondary cooling
in open air to room temperature [28].
10
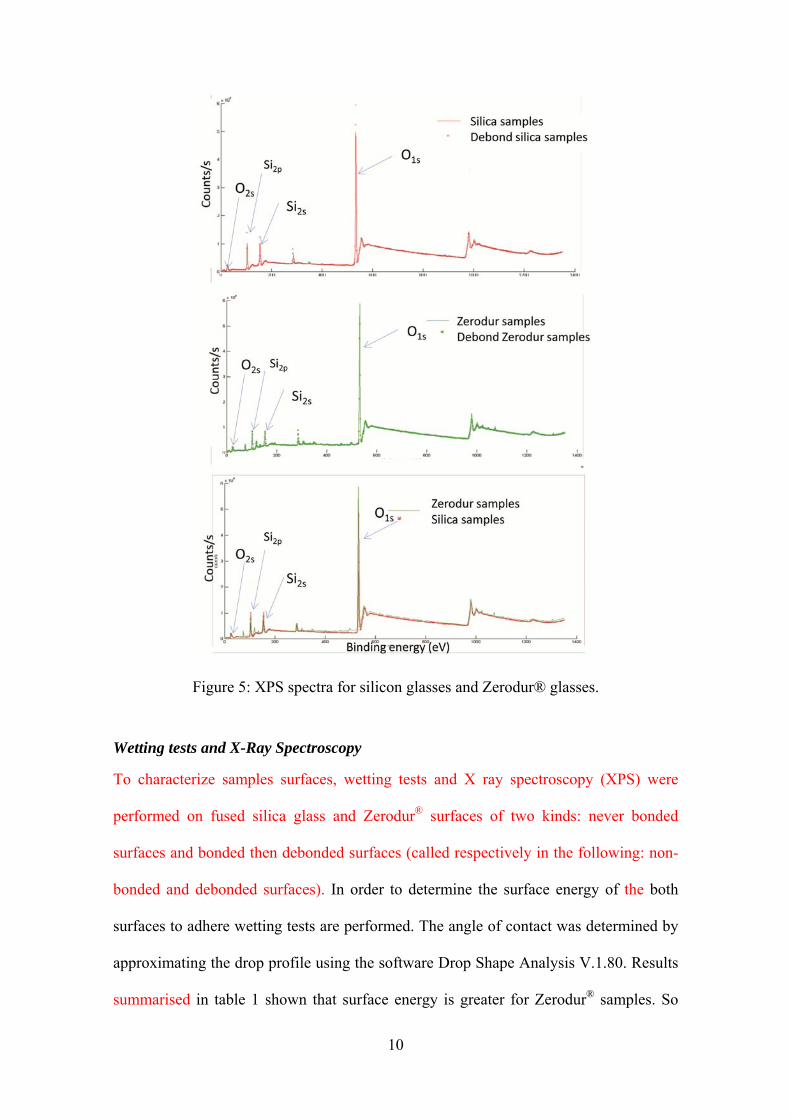
Figure 5: XPS spectra for silicon glasses and Zerodur® glasses.
Wetting tests and X-Ray Spectroscopy
To characterize samples surfaces, wetting tests and X ray spectroscopy (XPS) were
performed on fused silica glass and Zerodur® surfaces of two kinds: never bonded
surfaces and bonded then debonded surfaces (called respectively in the following: non-
bonded and debonded surfaces). In order to determine the surface energy of the both
surfaces to adhere wetting tests are performed. The angle of contact was determined by
approximating the drop profile using the software Drop Shape Analysis V.1.80. Results
summarised in table 1 shown that surface energy is greater for Zerodur® samples. So

11
this material seems to be a better candidate for direct bonding. Indeed, the bonding will
obviously be easier to perform when the surface energy of adhesion is high and
furthermore when roughness is low [9, 12]. The difference in surface energy between
non-bonded and debonded surfaces was found to be approximately 20%. The results of
the XPS tests presented in figure 5 show that the spectra of debonded and non-bonded
surfaces were identical a priori. The slight differences between fused silica and
Zerodur® are attributable to the differences in the chemical composition of the two
materials: the silicon atoms do not have the same environment in both cases. Surface
wettability and XPS results confirm the reversibility - with damaging - of the process
[26]. Indeed, one characteristic of the direct bonding process when no thermal
treatments are applied is the reversibility of the bonding [25].
Material γs (mJ/m2)
Surface energy
γsd (mJ/m2)
Dispersive
Component of
surface energy
γsp (mJ/m2)
Polar component of
surface energy
Zerodur® 51,59 27,69 23,91
Fused silica
glasses 48,57 29,49 19,19
Debond Zerodur® 40,43 23,96 16,48
Debond fused
silica glasses 41,52 26,11 15,41
Table 1: Surface energy for fused silica glasses and Zerodur® glasses.

12
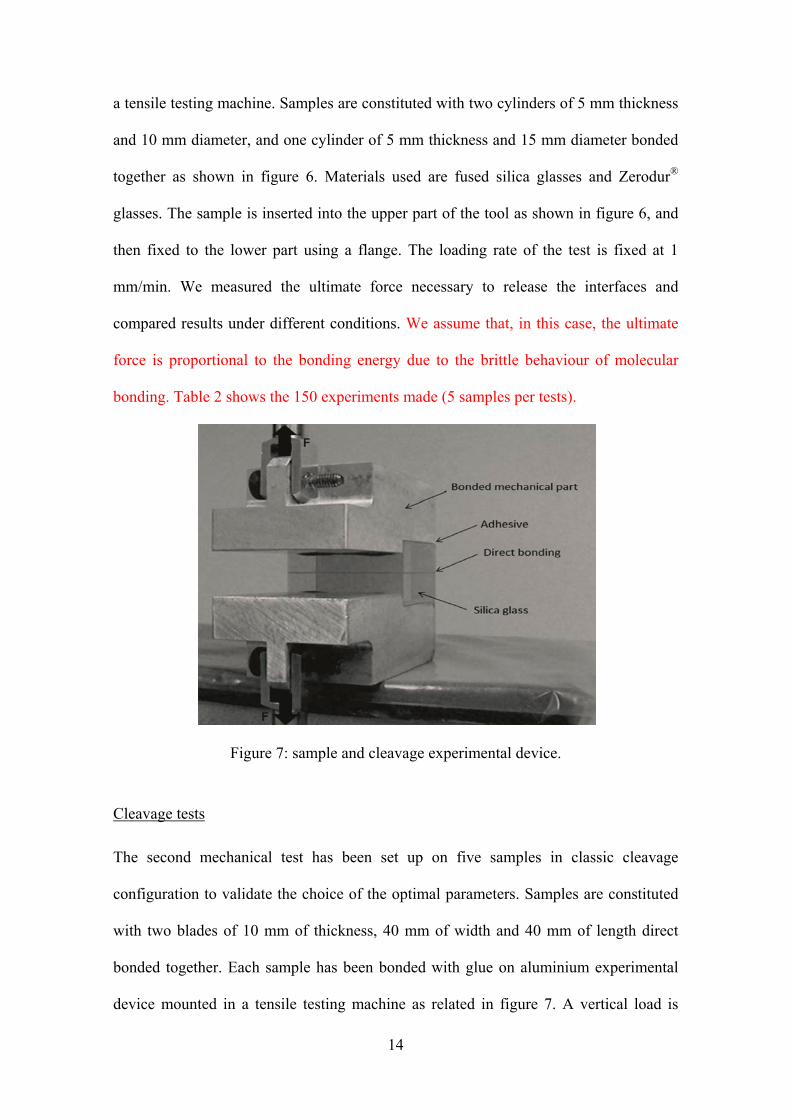
Figure 6: Sample and double shear experimental device.
Mechanical experiments
The objective of this part is to find the best candidate for direct bonding process
between fused silica glasses and Zerodur® and to find the optimal parameters of the
Winlight Optics Company process to increases mechanical strength of bonded
assemblies. Therefore we study the influence of some process parameters - roughness,
relative air humidity during room temperature bonding, annealing time and temperature
- on the mechanical strength of an elementary mechanical structure using a double shear
test procedure and a cleavage test by comparing the both materials. Double shear test
specimen was chosen for two main reasons: cylinder assemblies are classically used in
some Winlight Optics Company interferometer, and it is easier to manufacture a large
number of small cylinder (150 x 3 cylinders) in glass with low roughness on each faces.
The second test - the cleavage configuration - is the reference test for Winlight Optics
Company and French National Centre for Spatial Studies (CNES). With these two
mechanical tests, the influence of the surfaces treatment process on two failure modes (I
& II) is observed.

13
Material Annealing
temperature (°C)
Annealing time
(h)
Roughness
(nm RMS)
Humidity level
(%)
Fused silica
glass
(Reference)
20 0.4 55
Zerodur®
(Reference) 20 0.4 55
Fused silica
glass
100, 200, 400,
700, 800, 900 15 0.4 55
Zerodur® 100, 150, 200,
400, 550 15 0.4 55
Fused silica
glass 200 1, 15, 35, 120 0.4 55
Fused silica
glass 200 120 0.2, 0.4, 0.6, 1 55
Zerodur® 130 120 0.2, 0.6, 1 55
Fused silica
glass X X 0.4 32, 55, 82
Zerodur® X X 0.4 32, 55, 82
Table 2: Summary of double shear tests performed (five samples per condition).
Double shear tests
The first mechanical test has been set up on a large number (150) of samples in double
shear configuration based on cylinder shape. With this configuration, we obtain a pure
shear stress state and misalignments are controlled with a good adjustment between
steel experimental device and sample geometry. The tools were beforehand mounted on
14
a tensile testing machine. Samples are constituted with two cylinders of 5 mm thickness
and 10 mm diameter, and one cylinder of 5 mm thickness and 15 mm diameter bonded
together as shown in figure 6. Materials used are fused silica glasses and Zerodur®
glasses. The sample is inserted into the upper part of the tool as shown in figure 6, and
then fixed to the lower part using a flange. The loading rate of the test is fixed at 1
mm/min. We measured the ultimate force necessary to release the interfaces and
compared results under different conditions. We assume that, in this case, the ultimate
force is proportional to the bonding energy due to the brittle behaviour of molecular
bonding. Table 2 shows the 150 experiments made (5 samples per tests).
Figure 7: sample and cleavage experimental device.
Cleavage tests
The second mechanical test has been set up on five samples in classic cleavage
configuration to validate the choice of the optimal parameters. Samples are constituted
with two blades of 10 mm of thickness, 40 mm of width and 40 mm of length direct
bonded together. Each sample has been bonded with glue on aluminium experimental
device mounted in a tensile testing machine as related in figure 7. A vertical load is

15
applied, in the same way the loading rate of the test is fixed at 1 mm.min-1 and the
ultimate force is measured. With a finite element model considering an average stress
value on a local zone, the maximal stress value is identified. Between each experiment
on the same sample, surfaces are cleaned and re-adhered (without being polished anew).
Figure 8: Annealing temperature influence on fused silica glass tested in double
shear configuration : average values (a) and standard deviations (b) of measured
ultimate loads.
Figure 9: Annealing temperature influence on Zerodur® glass tested in double
shear configuration : average values (a) and standard deviations (b) of measured
ultimate loads.
D. Results and discussion
According to the adhesion mechanism presented in section B, parameters such as
roughness, humidity level during room temperature bonding and annealing parameters
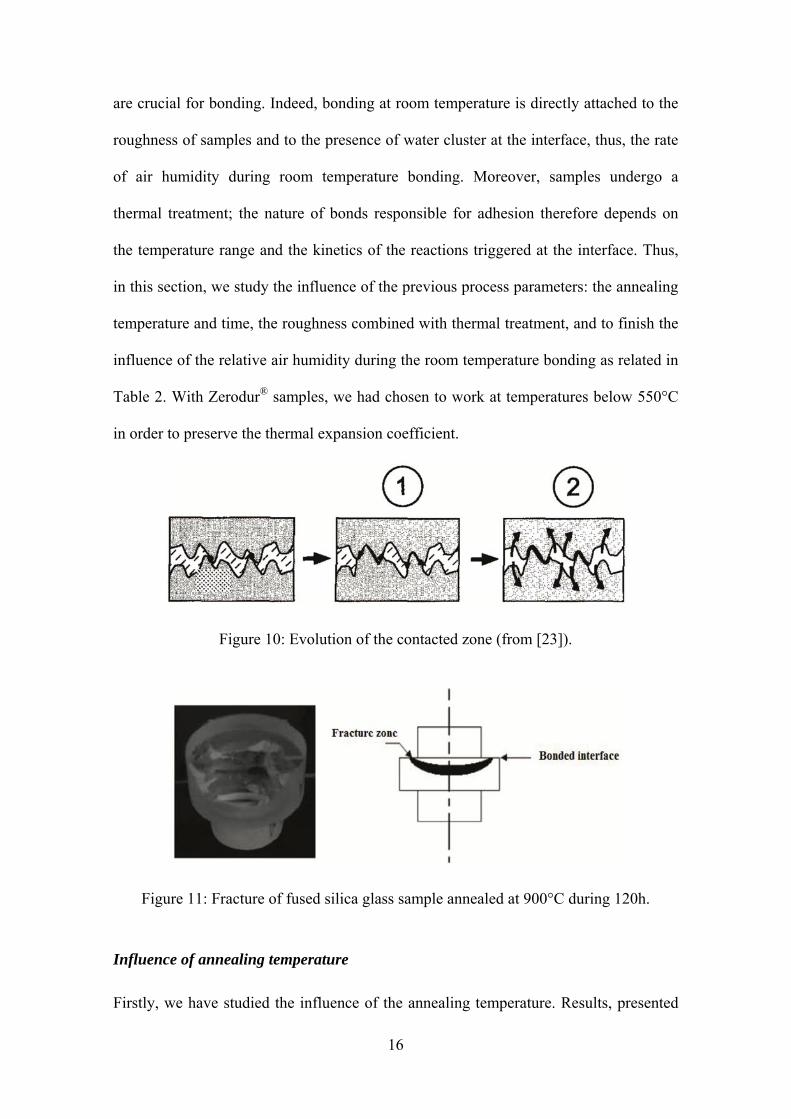
16
are crucial for bonding. Indeed, bonding at room temperature is directly attached to the
roughness of samples and to the presence of water cluster at the interface, thus, the rate
of air humidity during room temperature bonding. Moreover, samples undergo a
thermal treatment; the nature of bonds responsible for adhesion therefore depends on
the temperature range and the kinetics of the reactions triggered at the interface. Thus,
in this section, we study the influence of the previous process parameters: the annealing
temperature and time, the roughness combined with thermal treatment, and to finish the
influence of the relative air humidity during the room temperature bonding as related in
Table 2. With Zerodur® samples, we had chosen to work at temperatures below 550°C
in order to preserve the thermal expansion coefficient.
Figure 10: Evolution of the contacted zone (from [23]).
Figure 11: Fracture of fused silica glass sample annealed at 900°C during 120h.
Influence of annealing temperature
Firstly, we have studied the influence of the annealing temperature. Results, presented
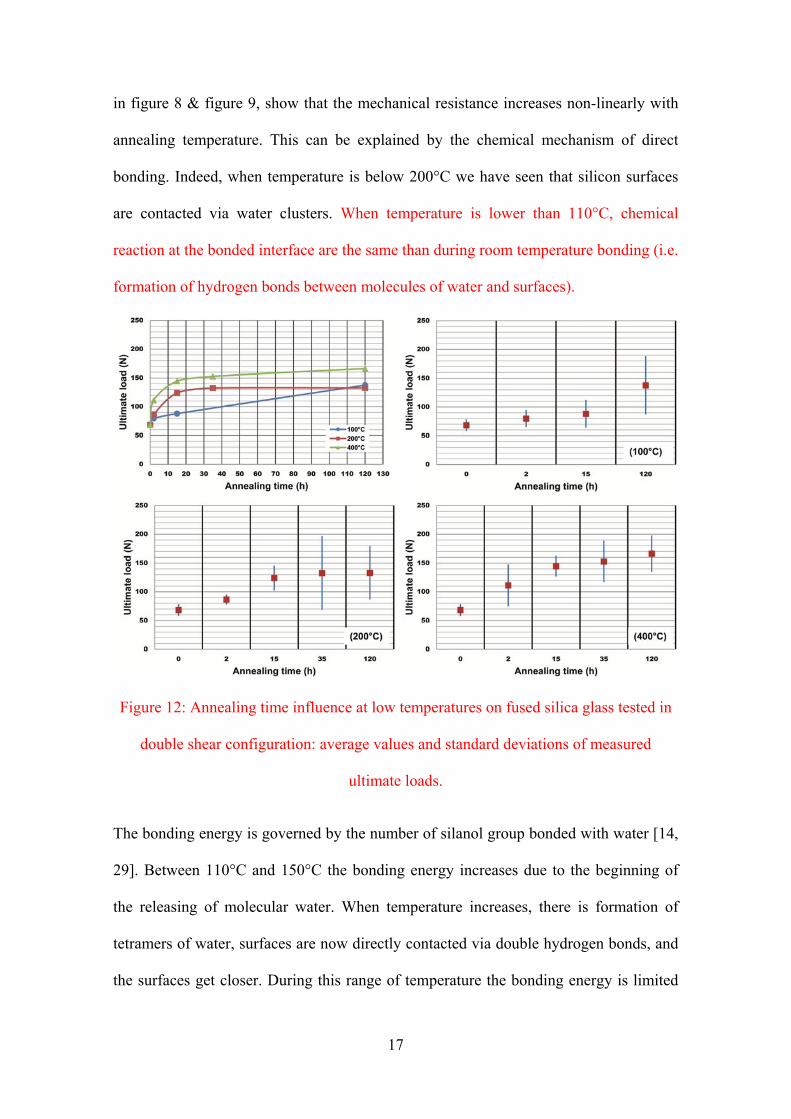
17
in figure 8 & figure 9, show that the mechanical resistance increases non-linearly with
annealing temperature. This can be explained by the chemical mechanism of direct
bonding. Indeed, when temperature is below 200°C we have seen that silicon surfaces
are contacted via water clusters. When temperature is lower than 110°C, chemical
reaction at the bonded interface are the same than during room temperature bonding (i.e.
formation of hydrogen bonds between molecules of water and surfaces).
Figure 12: Annealing time influence at low temperatures on fused silica glass tested in
double shear configuration: average values and standard deviations of measured
ultimate loads.
The bonding energy is governed by the number of silanol group bonded with water [14,
29]. Between 110°C and 150°C the bonding energy increases due to the beginning of
the releasing of molecular water. When temperature increases, there is formation of
tetramers of water, surfaces are now directly contacted via double hydrogen bonds, and
the surfaces get closer. During this range of temperature the bonding energy is limited

18
by the area of contacted zone, the bonding energy slightly increases with the increasing
of the contacted zone (figure 10). Then, when temperature is up to 700°C, there is
polymerization of covalent siloxane (Si-O-Si) bonds [13, 14, 30].
Figure 13: Annealing time influence at high temperatures on fused silica glass tested in
double shear configuration: average values and standard deviations of measured
ultimate loads.
For thermal treatment at 900°C, we do not observe a release along the interfaces but a
fracture inside material of the bonded samples. It seems that the material is fused at the
interface. Interface has the same behaviour that the pure crystal configuration and we
can suppose that a single bloc of fused silica glass or Zerodur® is obtained as related on
figure 11. Moreover, the results confirm wetting tests results: the mechanical resistance
is higher for Zerodur® samples

19
Figure 14: Annealing time influence at different temperatures on Zerodur® glass tested
in double shear configuration: average values and standard deviations of measured
ultimate loads.
Influence of annealing time
Then, we have studied the influence of annealing time. Figures 12 to 14 show an
increase of the mechanical strength and the appearance of a plateau for the long
annealing time (figure 16). For low temperature, the bonding energy only depends of
the number of hydrogen bonds. When temperature increases, the different reactions at
the interface can be modelled using a kinetically model [13, 14]. When temperature

20
increases, there are changes in the nature of bonds at the interface, at the passage
between phase I and phase II , hydrogen bonds between clusters of water break to form
tetramers of water, and a double hydrogen bond appears between surfaces. Thus,
between 200°C and 700°C the following reaction is triggered:
SiOH: OH : OH : SiOH → SiOH: SiOH H O (5)
Up to 700°C:
H O → H O H O ↑→ H O H O ↑→ 2H O (6)
SiOH: SiOH ⇄ SiOSi H O (7)
SiOH: SiOH → SiOSi H O (8)
Where k1 and k2 are the rate constants of reaction.
By supposing reaction (5) total we have:
: k SiOH: OH : OH : SiOH k n SiOH: SiOH (9)
With:
k e (10)
Where SiOH: SiOH represent the number of double hydrogen bonds between Si-OH of
the both surfaces, :
represent the reaction rate of the double hydrogen
formation. K is the Boltzmann constant, Ea1 is the activation energy of the reaction, n0
the number of adhesion site, τ the time characteristic constant and T absolute
temperature. At room temperature, the activation energy is around 50 meV, the energy
of a hydrogen bond [14]. The solution to equation (9) is:

21
SiOH: SiOHi t n 1 e ) (11)
Where t is the time. We make the assumption that the gain of surfaces energy is
proportional to the number of double hydrogen bonds Si-OH: Si-OH and we obtain the
following expression for the bonding energy W (fig. 15):
W W W 1 e W (12)
With W and W maximum specific surface energy on phase I and phase II respectively.
Figure 15: Evolution of the bonding energy modelled using equation (12) with
annealing temperature and time.
Figure 15 presents the evolution of the kinetically model for different annealing time.
Thus, in this kinetic model, the evolution of the bonding energy with annealing
parameters is exponential. The evolution of the ultimate force with thermal treatment
parameters on figure 16 also shows the same kind of exponential evolution. Moreover,
we have made the assumption that the bonding energy and the ultimate force are
proportional, the use of the kinetic model to explain the evolution of the mechanical
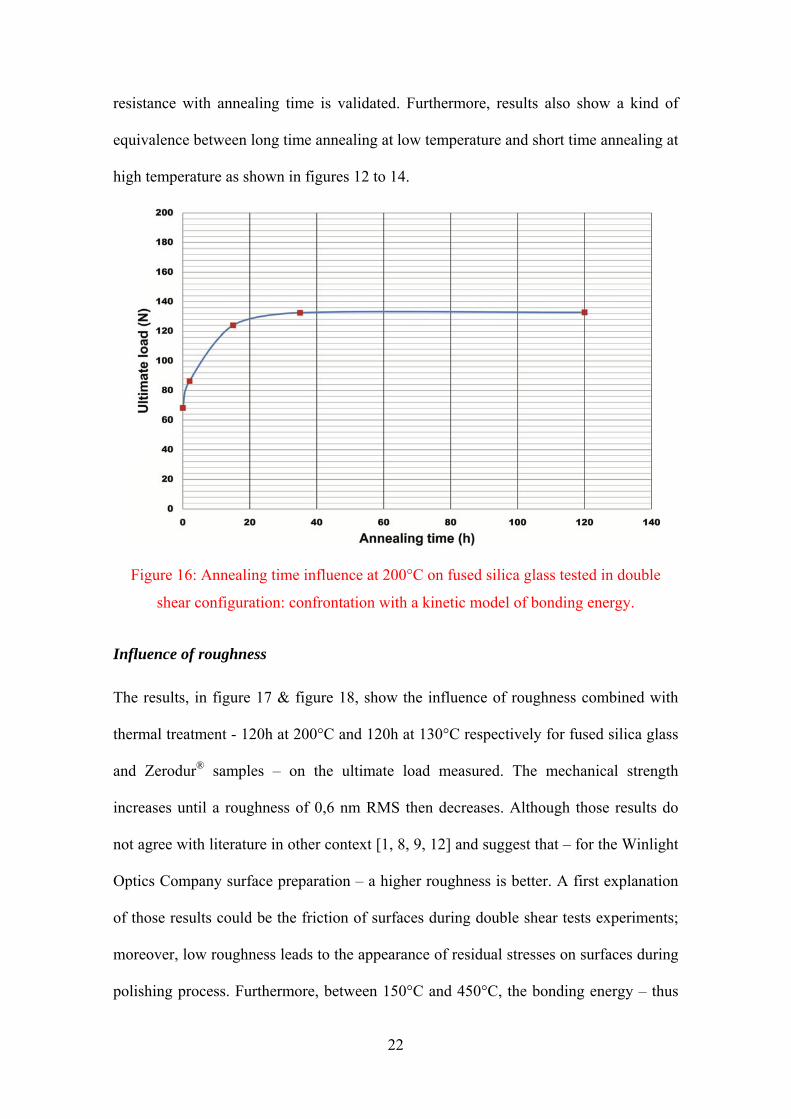
22
resistance with annealing time is validated. Furthermore, results also show a kind of
equivalence between long time annealing at low temperature and short time annealing at
high temperature as shown in figures 12 to 14.
Figure 16: Annealing time influence at 200°C on fused silica glass tested in double
shear configuration: confrontation with a kinetic model of bonding energy.
Influence of roughness
The results, in figure 17 & figure 18, show the influence of roughness combined with
thermal treatment - 120h at 200°C and 120h at 130°C respectively for fused silica glass
and Zerodur® samples – on the ultimate load measured. The mechanical strength
increases until a roughness of 0,6 nm RMS then decreases. Although those results do
not agree with literature in other context [1, 8, 9, 12] and suggest that – for the Winlight
Optics Company surface preparation – a higher roughness is better. A first explanation
of those results could be the friction of surfaces during double shear tests experiments;
moreover, low roughness leads to the appearance of residual stresses on surfaces during
polishing process. Furthermore, between 150°C and 450°C, the bonding energy – thus

23
the mechanical strength – is limited by the contacted area (figure 10) and, in case of
high roughness, contacted zone are higher explaining the results. Adhesion also depends
on the height of asperities, the radius of curvature, the wavelength, the real contact area
and the local stiffness of contact surfaces [31- 33].
Figure 17: Roughness influence combined with thermal treatment (200°C, 120h) on
fused silica glass tested in double shear configuration: average values and standard
deviations of measured ultimate loads.
Figure 18: Roughness influence combined with thermal treatment (130°C, 120h) on
Zerodur® glass tested in double shear configuration: average values and standard
deviations of measured ultimate loads.
Thus, the existence of a maximum at 0,6 nm RMS suggests that a medium roughness,
compromised between all the previous parameters, is better for the Winlight Optics
Company process. Moreover, results of Zerodur® samples are worse than fused silica
samples. This could be explained by the temperature of thermal treatment. Indeed, the

24
curve on figure 4, shows a inflection point at 130°C, characterizing surely a change in
the microstructure leading to a sharp decrease of mechanical properties.
Figure 19: Humidity level influence on fused silica glass tested in double shear
configuration: average values and standard deviations of measured ultimate loads.
Figure 20: Humidity level influence on Zerodur® glass tested in double shear
configuration: average values and standard deviations of measured ultimate loads.
Influence of humidity level
We have also studied the influence of relative air humidity, during the room
temperature contacting step. Results related in figure 19 & figure 20 show that the
mechanical strength presents a maximum for 32% for fused silica glass samples and
55% for Zerodur® samples. Those results can be explained by the size of water clusters.
Indeed, we have shown that there is formation of clusters of water at the interface. Thus,
if there is more molecular water at the interface, clusters would be higher. And then,
distance between the two surfaces would be higher resulting by a decrease of the
25
bonding energy. Moreover, when there is too much water, we could lead to think that
there is a phenomenon of glass damaging.
Dispersion of the results
All the results show lots of dispersion, which can be explained by the brittle behaviour
of the direct bonding and the heavily sensitivity of the mechanical tests to the presence
of defects along the interface. Results strongly depend of the infinitesimal defects
present in the bonded interface and depend of their location. However, due to the high
number of samples, the tests coupled with a statistical study allow us to identify highly
interesting trends in the point of view of the understanding of the interface behaviour.
Optimal parameters
Despite dispersion of the double shear test, results give a good idea of optimal
parameters to apply in order to increase the mechanical strength of bonded interfaces. In
order to not degrade optical properties of materials, annealing temperature cannot be
higher than 200°C for both types of samples. As shown in section 2, there is a kind of
equivalence between annealing time and temperature, thus in order to have stronger
bonds at 200°C, thermal treatment has to be long. Based on all the double shear tests
results, the chosen parameters are 200°C during 120h for both fused silica and Zerodur®
samples. We also have chosen 200°C for Zerodur samples due to sharp decrease of
mechanical properties at 130°C. Then, roughness chosen is 0,4 nm RMS for all the
samples – compromise between literature and experimental results, 32% of humidity for
Zerodur® samples and 55% of humidity for fused silica samples.

26
Figure 21: Comparison between initial parameters (no thermal treatment) and
optimal parameters (200°C during 120h) in cleavage test configuration: for successive
re-adhesions of fused silica samples.
E. Validation of optimal parameters
In the last section, optimal parameters have been found. In this section, to validate this
choice, those parameters are compared to the initial conditions - no thermal treatment
applied on samples - using cleavage test which is the Winlight Optics Company
validation test. Results presented on figures 21 and 22 show an increase of the
mechanical resistance with optimal parameters, thus an improvement with the new
parameters. Moreover, mechanical resistance slightly linearly decreased with successive
adhesion/cleavage test/re-adhesion highlighting a damaging phenomenon of the bonded
interfaces with successive re-adhesion made in the experiments. This phenomenon was
also observed on the wetting tests results. Results for Zerodur® samples are a little
worse than results for fused silica sample, because, samples have already undergone

27
other treatment before those experiments. The results confirm the use of optimal
parameters found to increase the mechanical resistance of samples.
Figure 22: Comparison between initial parameters (no thermal treatment) and optimal
parameters (200°C during 120h) in cleavage test configuration: for successive re-
adhesions of Zerodur® samples.
E. Conclusion
The analysis of fused silica glass and Zerodur® surfaces confirm the reversibility
(with damaging) of the process when no thermal treatments are applied i.e. when no
covalent bonds are responsible for adhesion. Moreover Zerodur® samples seem to be a
better candidate for direct bonding. This result is confirmed by double shear tests
results. Despite the dispersion of the experiments, optimal parameters of the process
have been found, annealing treatment at 200°C during 120h for fused silica glass
samples with a 0,4 nm RMS roughness and 55% of humidity, and, 200°C during 120h
with a 0,4 nm RMS roughness and 32% of humidity for Zerodur® samples. Moreover, a

28
kind of equivalence between a long thermal treatment at low temperature and a short
thermal treatment at high temperature appears. Cleavage tests performed confirm the
choice of the optimal parameters and highlight a damaging phenomenon of bonded
interfaces with successive re-adhesion. With these optimal parameters, the mechanical
strength is twice as much as the strength obtained with the initial parameters. We found
a way to increase the mechanical strength of direct bonded interfaces for the Winlight
Optics procedure.
The final aim of this work consists in the development of an interface
mechanical model of the direct bonding. The implemented law relates the bonding
energy, the mechanical critical strain energy, the process parameters and the chemical
kinetic in a multi-physic and multi-scale formalism. Soon, a wedge test will be set up to
measure the bonding energy versus process parameters in order to identify the law of
the direct bonding model and to implement it in a finite elements model. For the future,
new investigations will be lead on to find new original process in order to improve the
mechanical strength and to develop simulation of complex spatial optical assemblies.
Bibliography
[1] Tong Q.Y., Gösele U. Semiconductor wafer bonding: recent developments. Mat.
Chem. and Phys. 1994, 37:101-127.
[2] Kendall K. Molecular adhesion and its applications. Kluwer Academic Publishers;
2001.
[3] Ventosa C., Rieutord F., Libralesso L., Morales C., Fournel F., Moriceau H.
Hydrophilic low-temperature direct wafer bonding. Journal of Applied Physics 2008,
104:12:123524-123530.
29
[4] Nakanishi H., Nishimoto T., Nakamura R., Yotsumoto A., Yoshida T., Shoji S.
Studies on SiO2-SiO2 bonding with hydrofluoric acid. Room temperature and low
stress binding technique for MEMS. Sensors and Actuators A, Physical. 2000, 79:237-
244.
[5] Berthold A., Vellekoop M.J. IC-compatible silicon wafer-to-wafer bonding. Sensors
and Actuators A, Physical. 1997, 60:208-211.
[6] Laurent F., Renault E., Kosmalski J., Adjali L., Boudon D., Bacon R., Caillier P.,
Remillieux A., Salaun Y., Delabre B. MUSE Image Slicer: Test results on largest slicer
ever manufactured. Proc. SPIE 7018, Advanced Optical and Mechanical Technologies
in Telescopes and Instrumentation. 2008, 70180J. doi: 10.1117/12.789285
[7] Pamplona T., Rossin Ch., Martin L., Moreaux G., Prieto E., Laurent P., Grassi E.,
Boit J.-L., Castinel L., Garcia J., Milliard B. Three bipods slicer prototype: tests and
finite element calculations. Proc. SPIE 7018, Advanced Optical and Mechanical
Technologies in Telescopes and Instrumentation. 2008, 701828. doi:
10.1117/12.789243
[8] Plobl A., Krauter G. Wafer direct bonding: tailoring adhesion between brittle
materials. Material Science and Engineering. 1999, R25:1-88.
[9] Liao G., Shi T., Lin X., Ma Z. Effect of surface characteristic on room-temperature
silicon direct bonding, Sensor and Actuators A, Physical. 2010, 158:335-341.
[10] Yu H.H., Suo Z. A model of wafer bonding by elastic accommodation. Journal of
the Mechanics and Physics of Solids. 1998, 46(5):829-844.
[11] Gösele U., Bluhm Y., Kästner G., Kopperschmidt P., Kräuter G., Scholz R.,
Schumacher A., Senz St., Tong Q.-Y., Huang L.-J., Chao Y.-L., Lee T.H. Fundamental
issues on wafer bonding, Journal of Vacuum Science and Technology. 1999, A17:1145-
1153.

30
[12] Gui C., Elwenspoek M., Tas N., Gardeniers J.G.E. The effect of surface roughness
on direct wafer bonding, Journal of Applied Physics. 1999, 85(10):7448-7455.
[13] Kissinger G., Kissinger W. Void-free silicon-wafer-bond strengthening in the 200-
400°C range, Sensor and Actuators A, Physical. 1993, 36(2):149-156.
[14] Stengl R., Tan T., Gösele U. A model for the silicon wafer bonding process,
Japanese Journal of Applied Physics. 1989, 28(10):1735-1741.
[15] Rayssac O., Olivier M., Stoemenos I., Cartier A.M., Aspar B. Silicon-on-Insulatot
technology and devices, The electrochemical society proceedings series, Pennington NJ,
2001, X PV 03: 39
[16] Tang Z., Shi T., Liao G., Liu S. Modeling the formation of spontaneous wafer
direct bonding under low temperature, Microelectronic engineering. 2008, 85:1754-
1757.
[17] Johnson K.L. The adhesion of two elastic bodies with slightly wavy surfaces”,
International Journal of Solids and Structures. 1995, 32(3-4):423-430.
[18] Galanov B.A. Models of adhesive contact between rough elastic solids,
International Journal of Mechanical Science. 2011, 53(11):968-977.
[19] Liao G., Lin X., Nie L., Shi T. Surface roughness modeling for silicon direct
bonding, IEEE transaction on Components, Packaging and Manufacturing Technology.
2011, 1(8):1171-1178.
[20] Lai S-I., Lin H-Y., Hu C-T. Effect of surface treatment on wafer direct bonding
process, Materials Chemistry and Physics. 2004, 83(2-3):265–272.
[21] Klier K., Zettlemoyer A.C. Water at interface: Molecular structure and dynamics,
Journal of Colloid and Interface Science. 1977, 58(2):216-229.
[22] Iler R.K. The chemistry of silica. Wiley; New York, 2001.
31
[23] Ventosa C., Rieutord, F., Libralesso, L., Morales, C., Fournel, F., Moriceau, H.
Hydrophilic low-temperature direct wafer bonding, Journal of Applied Physics. 2008,
104: 123524-123526.
[24] Ventosa C., Morales C., Libralesso L., Fournel F., Papon A.M., Lafond D.,
Moriceau H., Penot J. D., Rieutord F. Mechanism of thermal silicon oxide direct wafer
bonding, Electrochemical and Solid States Letters. 2009, 12(10):375-379.
[25] Gutjahr K., Martini T., Gösele U. Concept of wafer debonding, Electrochemical
Society Proceedings. 1998, 97(36):72-74.
[26] Cocheteau N., Lebon F., Rosu I., Maurel-Pantel A., Ait Zaid S., Savin De
Larclause I. On the Modelling of the Direct Bonding of Two Silicon Surfaces,
Proceedings of the 11th International Conference on Computational Structures
Technology. Dubrovnik (Croatia); 2012.
[27] Liao G.n Shi T. Lin X. Ma Z., Effect of surface characteristic on room temperature
silicon direct bonding, Sensors and Actuators A, 2010, 158:335-341
[28] Lindig O. and Pannhorst W. Thermal expansion and length stability of Zerodur® in
dependence on temperature and time, Applied Optics, 1985, 24:3330-3334
[29] Del Bene J., Pople J.A. Theory of molecular interactions. I. Molecular orbital
studies of water polymers using a minimal slater-type basis, The Journal of Chemical
Physics, 1970, 52: 4858-4866
[30] Bertholet Y., Iker F. Raskin J.P., Pardoen T. Steady-state measurement of wafer
bonding cracking resistance, Sensors and Actuators A, 2004, 110:157-163
[31] G. Liao. Effect of surface characteristic on room-temperature silicon direct
bonding. Sensors and Actuators, A: Physical, 158 :335-341, 2010.
32
[32] C.Y. Hui, Y.Y. Lin, J.M. Baney, and E.F. Kramer, The mechanics of contact and
adhesion of periodically rough surfaces. Journal of Polymer Science: Part B: Polymer
Physics, 39: 1195-1214, 2001.
[33] Z. Tang. Modeling the formation of spontaneous wafer direct bonding under low
temperature. Microelectronic Engineering, 85: 1754-1757, 2008.