Process-based simulation library SALMO-OO for lake ecosystems. Part 2: Multi-objective parameter...
10
Process-based simulation library SALMO-OO for lake ecosystems. Part 2: Multi-objective parameter optimization by evolutionary algorithms Hongqing Cao ⁎ , Friedrich Recknagel, Lydia Cetin, Byron Zhang School of Earth and Environmental Sciences, University of Adelaide, 5005, Australia ARTICLE INFO ABSTRACT Article history: Received 29 November 2006 Received in revised form 15 January 2008 Accepted 8 February 2008 SALMO-OO represents an object-oriented simulation library for lake ecosystems that allows to determine generic model structures for certain lake categories. It is based on complex ordinary differential equations that can be assembled by alternative process equations for algal growth and grazing as well as zooplankton growth and mortality. It requires 128 constant parameters that are causally related to the metabolic, chemical and transport processes in lakes either estimated from laboratory and field experiments or adopted from the literature. An evolutionary algorithm (EA) was integrated into SALMO-OO in order to facilitate multi- objective optimization for selected parameters and to substitute them by optimum temperature and phosphate functions. The parameters were related to photosynthesis, respiration and grazing of the three algal groups diatoms, green algae and blue-green algae. The EA determined specific temperature and phosphate functions for same parameters for 3 lake categories that were validated by ecological data of six lakes from Germany and South Africa. The results of this study have demonstrated that: (1) the hybridization of ordinary differential equations by EA provide a sophisticated approach to fine-tune crucial parameters of complex ecological models, and (2) the multi-objective parameter optimization of SALMO-OO by EA has significantly improved the accuracy of simulation results for three different lake categories. © 2008 Elsevier B.V. All rights reserved. Keywords: Multi-objective parameter optimization SALMO-OO Lake categories Evolutionary algorithms Genetic programming 1. Introduction Over the past three decades numerous lake ecosystem models incorporating pelagic food webs and nutrient cycles have been developed based on complex ordinary differential equations (ODE) (e.g. Parker, 1968; Park et al., 1974; Radtke and Straškraba, 1980; Benndorf and Recknagel, 1982; Hongping and Jianyi, 2002; Arhonditsis and Brett, 2005a). Those ODE usually consist of several state and driving variables as well as numerous process equations and parameters which allow to simulate seasonal dynamics of food webs and nutrient cycles. A typical example is the lake simulation library SALMO-OO (Recknagel et al., 2008; Recknagel et al., submitted for publication) that represents an object-oriented implementation of the ODE of the model SALMO (Benndorf and Recknagel, 1982) and alternative process repre- sentations for algal growth and grazing as well as zooplank- ton growth and mortality adopted from (Park et al., 1974), Arhonditsis and Brett (2005a) and Hongping and Jianyi (2002) (see http://ecolinfo.ees.adelaide.edu.au:8080/SALMO-OO/index. html). ECOLOGICAL INFORMATICS 3 (2008) 181 – 190 ⁎ Corresponding author. E-mail address: [email protected] (H. Cao). 1574-9541/$ – see front matter © 2008 Elsevier B.V. All rights reserved. doi:10.1016/j.ecoinf.2008.02.001 available at www.sciencedirect.com www.elsevier.com/locate/ecolinf
-
Upload
independent -
Category
Documents
-
view
0 -
download
0
Transcript of Process-based simulation library SALMO-OO for lake ecosystems. Part 2: Multi-objective parameter...

E C O L O G I C A L I N F O R M A T I C S 3 ( 2 0 0 8 ) 1 8 1 – 1 9 0
ava i l ab l e a t www.sc i enced i r ec t . com
www.e l sev i e r. com/ loca te / eco l i n f
Process-based simulation library SALMO-OO forlake ecosystems. Part 2: Multi-objective parameteroptimization by evolutionary algorithms
Hongqing Cao⁎, Friedrich Recknagel, Lydia Cetin, Byron ZhangSchool of Earth and Environmental Sciences, University of Adelaide, 5005, Australia
A R T I C L E I N F O
⁎ Corresponding author.E-mail address: [email protected] (H. Cao).
1574-9541/$ – see front matter © 2008 Elsevidoi:10.1016/j.ecoinf.2008.02.001
A B S T R A C T
Article history:Received 29 November 2006Received in revised form15 January 2008Accepted 8 February 2008
SALMO-OO represents an object-oriented simulation library for lake ecosystems that allowsto determine generic model structures for certain lake categories. It is based on complexordinary differential equations that can be assembled by alternative process equations foralgal growth and grazing as well as zooplankton growth and mortality. It requires 128constant parameters that are causally related to the metabolic, chemical and transportprocesses in lakes either estimated from laboratory and field experiments or adopted fromthe literature.An evolutionary algorithm (EA) was integrated into SALMO-OO in order to facilitate multi-objective optimization for selected parameters and to substitute them by optimumtemperature and phosphate functions. The parameters were related to photosynthesis,respiration and grazing of the three algal groups diatoms, green algae and blue-green algae.The EA determined specific temperature and phosphate functions for same parameters for 3lake categories that were validated by ecological data of six lakes from Germany and SouthAfrica.The results of this study have demonstrated that: (1) the hybridization of ordinary differentialequations by EA provide a sophisticated approach to fine-tune crucial parameters of complexecologicalmodels, and (2) themulti-objective parameter optimization of SALMO-OOby EAhassignificantly improved the accuracy of simulation results for three different lake categories.
© 2008 Elsevier B.V. All rights reserved.
Keywords:Multi-objective parameteroptimizationSALMO-OOLake categoriesEvolutionary algorithmsGenetic programming
1. Introduction
Over the past three decades numerous lake ecosystem modelsincorporating pelagic food webs and nutrient cycles have beendeveloped based on complex ordinary differential equations(ODE) (e.g. Parker, 1968; Park et al., 1974; Radtke and Straškraba,1980; Benndorf and Recknagel, 1982; Hongping and Jianyi, 2002;Arhonditsis and Brett, 2005a). Those ODE usually consist ofseveral state and driving variables as well as numerous processequations and parameters which allow to simulate seasonal
er B.V. All rights reserved
dynamics of foodwebs and nutrient cycles. A typical example isthe lake simulation library SALMO-OO (Recknagel et al., 2008;Recknagel et al., submitted for publication) that represents anobject-oriented implementationof theODEof themodel SALMO(Benndorf and Recknagel, 1982) and alternative process repre-sentations for algal growth and grazing as well as zooplank-ton growth and mortality adopted from (Park et al., 1974),Arhonditsis and Brett (2005a) and Hongping and Jianyi (2002)(see http://ecolinfo.ees.adelaide.edu.au:8080/SALMO-OO/index.html).
.

182 E C O L O G I C A L I N F O R M A T I C S 3 ( 2 0 0 8 ) 1 8 1 – 1 9 0
SALMO-OO uses 128 constant parameters which are caus-ally related to ecological, chemical and transport processesin lakes either estimated from laboratory and field experi-ments or adopted from the literature (see Recknagel et al.,2008). To keep the parameter values constant for differentlake categories may impose inaccuracy and uncertainty tothe model. Therefore it is desirable to optimize and calibratecrucial parameters for specific climate and environmentalconditions of lake categories. Due to the complex interac-tions between state variables and parameters within theODE, the calibration of parameters usually has been done bytuning the parameter values within their observed literatureranges using sensitivity analysis (e.g. Recknagel, 1984;Arhonditsis and Brett, 2005b) and optimizing parame-ter values (e.g. Radtke and Straškraba, 1980; Recknagel andBenndorf, 1982).
This research applies EA for a multi-objective approachto determine optimum temperature or phosphate functionsfor selected parameters of SALMO-OO and specific forcertain lake categories. The EA have been integrated intoSALMO-OO to evolve temperature and phosphate functionsfor parameters related to optimum photosynthesis, respira-tion and zooplankton grazing for the algal groups diatoms,green algae and blue-green algae. The results have beentested by data of 6 lakes belonging to three different lakecategories (see Recknagel et al., 2008) and demonstratedthat the substitution of constant parameters by optimumfunctions significantly improved the simulation accuracyof SALMO-OO in particular with regards to seasonalbiomass dynamics of diatoms, green algae and blue-greenalgae.
Fig. 1 –Flowchart of the evolutionary algorithm for evolvi
This paper is structured as follows: Section 2 describes thedesign and integration of EA for multi-objective parameteroptimization of SALMO-OO including details of encoding(Section 2.1), fitness evaluation (Section 2.2) and genetic oper-ators (Section 2.3). Section 3documents the results for three lakecategories andSection 4 draws someconclusions andaddressessome future work.
2. Anevolutionary algorithm formulti-objectiveparameter optimization
In recent years, the study of evolutionary algorithms (EAs) hasgained much interest from many researchers in wide fields.EAs are adaptivemethods for solving computational problemsin many fields by mimicking processes of biological evolutionand the mechanisms of natural selection and genetic varia-tion. They use suitable coding to represent possible solutionsto a problem, and guide the search by using some geneticoperators and the principle of “survival of the fittest”. Due totheir merits of self-adaptation, self-organization, self-learn-ing, intrinsic parallelism and generality, EAs have succeededin solving a large number of problems in machine learning,pattern recognition, economic prediction, forecasting of algalblooms, optimization control, parallel processing and manyother domains (Bäck et al., 1997; Goldberg, 1989). In general,EAs consist of four branches, namely genetic algorithms,evolutionary strategy, evolutionary programming and geneticprogramming (GP) (Koza, 1992; Koza, 1994; Banzhaf et al., 1997;Cao et al., 2006). In this paper, we use GP as themain approachto build the parameter models as temperature and phosphate
ng parameter function models for each lake category.

Fig. 2 –An example of the representation of a singleparameter function model in GP.
Fig. 4– Illustrations of tree-level crossover of parametermodels.Notes: Parent1: cos(P)*31.6/T− ln(|P|) Parent2: sin(T)+exp(2.34−T/P). Offspring1: sin(T)/T− ln(|P|) Offspring2: cos(P)*31.6+exp(2.34−T/P).
183E C O L O G I C A L I N F O R M A T I C S 3 ( 2 0 0 8 ) 1 8 1 – 1 9 0
dependent functions. The flowchart of EA for modeling pa-rameters is shown in Fig. 1. We give the detailed descriptionsof EA in following sections.
2.1. Encoding
We extend the representation of a single tree in standard GP toa vector of binary trees denoted as (T1, T2, …, TK) where Ti
corresponds to the specific parameter model and K is the totalnumber of parameters to be optimized as functionmodels. Forexample, a parameter function model with the form of
sin Tð Þ=P⁎8:2ð Þ þ ln P=Tð Þð Þ � TÞ ð1Þ
can be represented as a binary tree illustrated in Fig. 2. Besidesthis, the maximum depth per tree is restricted by a constant Dwhich reflects the complexity of a model.
2.2. Fitness evaluation
Given an individual Pi in the parameter model populationdenoted as (T1, T2, …, TK), firstly, we replace the constantvalues of K parameters with corresponding function modelsT1~TK and get their calculated values based on input data ofthe independent variables (i.e., water temperature and phos-phate). Secondly, we integrate those parameter values into thewhole SALMO-OO lake model and calculate all the outputvariables (phosphate, nitrate, oxygen, zooplankton, phyto-plankton, detritus). As mostly we can get the measured datafor phosphate (P), total algae (A)/algal groups (diatoms (A1),green algae (A2), blue-green algae (A3)) and zooplankton (Z),our objective is to minimize all the errors of them between themeasured and calculated data which undoubtedly is regarded
Fig. 3 – Illustrations of vector-level crossover of parametermodels.
as an issue of multi-objective parameter optimization. Thetotal error (TE) function is defined as
ffiffiffiffiffiffiffiffiffiffiffiffiffiffiffiffiffiffiffiffiffiffiffiffiffiffiffiffiffiffiffiffiffiffiffiffiffiffiffiffiffiffiffiffiffiffiffiffiffiffiffiffiffiffiffiffiffiffiffiffiffiffiffiffiffiffiffiffiffiffiffiffiffiffiffiffiffiffiffiffiffiffiPmi¼1
Pi �Pi
� �2þ Ai �Ai
� �2þ Zi �Zi
� �2� �
m
vuuutð2Þ
orffiffiffiffiffiffiffiffiffiffiffiffiffiffiffiffiffiffiffiffiffiffiffiffiffiffiffiffiffiffiffiffiffiffiffiffiffiffiffiffiffiffiffiffiffiffiffiffiffiffiffiffiffiffiffiffiffiffiffiffiffiffiffiffiffiffiffiffiffiffiffiffiffiffiffiffiffiffiffiffiffiffiffiffiffiffiffiffiffiffiffiffiffiffiffiffiffiffiffiffiffiffiffiffiffiffiffiffiffiffiffiffiffiffiffiffiffiffiffiffiffiffiffiffiffiffiffiffiffiffiffiffiffiffiffiffiffiffiffiffiffiffiffiffiffiffiffiffiffiffiffiffiffiPmi¼1
Pi �Pi
� �2þ A1i � A1i� �2
þ A2i � A2i� �2
þ A3i � A3i� �2
þ Zi �Zi
� �2� �
m
vuuut
ð3Þ
where m is the total day number, Pi, Ai (A1i, A2i, A3i), Zi and Piˆ ,Aiˆ (A1iˆ ,A2iˆ ,A3iˆ ),Ziˆ are the measured values and calculatedvalues of P, A (A1, A2, A3), Z on ith day respectively.
In our experiments, in order to achieve a genetic parametermodel for each lake category, we merge the measured data ofdifferent lakes from the same category. Based on the sameparameter model, for each lake we calculate their total errors
Fig. 5 – Illustrations of tree-level mutation of parametermodels. Notes: Parent: (sin(T)/P*8.2)+ (ln(P/T)−T) Offspring:(sin(T)/P*8.2)+ (ln(T*T)−T).

Table 1 – Constant values and value ranges of the modelparameters to optimize in SALMO-OO
Parameters Definition Constantvalue
Valuerange
PHOMAX [1–3] Maximumphotosynthesisunder optimalconditions(day−1)
PHOMAX[1]=2.37 PHOMAX[1]:[1, 3]
PHOMAX[2]=3.3 PHOMAX[2]:[2, 4]
PHOMAX[3]=2.37 PHOMAX[3]:[1, 3]
RATOPT [1–3] Optimum algalrespiration(day−1)
Hartbeespoort 0.08 [0.03, 0.5]Klipvoor 0.1Bautzen 0.09Arendsee 0.24Saidenbach 0.25Weida 0.25
GMAX Maximumgrazing rate byzooplankton(day−1)
Hartbeespoort 0.45 [0.3, 1.3]Klipvoor 0.45Bautzen 0.5Arendsee 0.4Saidenbach 1.3Weida 0.65
184 E C O L O G I C A L I N F O R M A T I C S 3 ( 2 0 0 8 ) 1 8 1 – 1 9 0
by Eqs. (2) and (3) separately and use the sum as the fitnessvalue. Namely,
Fitness ¼XLi¼1
TEi ð4Þ
where L is the number of lakes considered in the same category.
2.3. Genetic operators
Since each individual is represented as a vector of trees, thereare two levels of crossover, namely vector-level crossover andtree-level crossover.
Fig. 3 illustrates the procedure of vector-level crossover.Given two parents Parent1 and Parent2, the vector-level cross-over is performed by randomly selecting one tree from themeach time until the total number of parameters K is reached.
The tree-level crossover is performed as follows betweeneach pair of Ti
(1) and Ti(2). Randomly select a node within each
tree as a crossover point, swap the subtrees rooted at thecrossover points and produce two new trees, then use either ofthem as the offspring tree on condition that its maximumdepth does not exceed D. Fig. 4 illustrates an example of doingtree-level crossover between Parent1 and Parent2.
Similarly, the tree-level mutation begins by randomly se-lecting a tree from the parent and also a node within the tree
Table 2 – Statistical results of evolving parameter function mod
Lake categories Lakeexamples
Phosphate Total algae
Warm-monomictic,hypertrophic
Hartbeespoort 48.75±5.8 29.12±3.32Klipvoor 768.42±12.67 86.97±2.2
Dimictic, eutrophic Bautzen 34.75±3.68 11.97±0.3Arendsee 72.67±4.8 13.36±0.22
Dimictic, mesotrophic Saidenbach 6.52±0.96 1.72±0.11Weida 10.34±0.36 2.3±0.33
as the mutation point, replacing the subtree rooted at themutation point with a randomly generated new subtree, thusproducing an offspring tree. Fig. 5 illustrates an example oftree-level mutation.
3. Experimental study on three lake categories
3.1. Experimental settings and measures
SALMO-OO contains 128 constant parameters that are eitherestimated from fieldwork and laboratory experiments oradopted from the literature. Typically, the most sensitive pa-rameters in phytoplankton population models are optimized inorder to give more realistic and accurate simulation results.These parameters include the maximum photosynthesis un-der optimal conditions (PHOMAX), the optimal algal respira-tion (RATOPT), and the maximum grazing rate by zooplankton(GMAX). EA can be used to determine temperature and phos-phate functions for PHOMAX and RATOPT by building differentfunctions simultaneously for diatoms, green algae and blue-green algae and also for GMAX to build a generic temperatureand phosphate function for each lake category. We used data ofthe following six lakes for this research: Hartbeespoort andKlipvoor (South Africa), Bautzen and Arendsee (Germany) andSaidenbach and Weida (Germany), belonging to the three lakecategories: warm-monomic and hypertrophic, dimictic and eu-trophic, and dimictic and mesotrophic (see Recknagel et al.,2008). The constant values and value ranges of the SALMO-OOparameters to be optimized for these lakes are listed in Table 1.In order to determine generic parameter functions for each lakecategory by conducting 20 independent runs of EA we use themerged data of two example lakes belonging to one category. Allthe experiments were performed on a Hydra supercomputer(IBMeServer 1350 Linux)with a peak speed of 1.2 TFlops by usingC programming language. Some parameter settings of EA are asfollows: MAXGEN=50, N=100, D=4, function set={ +, −, ⁎, /, sin,cos, exp, ln}.
In addition, to measure the goodness of model fitting, theRoot Mean squared Error (RMSE) for the state variable X (i.e., P,A, A1, A2, A3, Z) is calculated as follows:
RMSE Xð Þ ¼
ffiffiffiffiffiffiffiffiffiffiffiffiffiffiffiffiffiffiffiffiffiffiffiffiffiffiffiffiffiPmi¼1
Xi �Xi
� �2
m
vuuutð5Þ
where m is the total day number, Xi and Xiˆ are the measuredvalue and calculated value of X on ith day respectively.
els for three lake categories by using EA in 20 runs
RMSE (Mean±SD)
Diatoms Green algae Blue-green algae Zooplankton
1.68±0.72 5.1±0.94 22.34±2.79 –9.45±1.61 42.71±3.15 34.8±5.24 –– – – 6.93±0.65– – – –– – – 2.2±0.0890.94±0.23 1.22±0.12 0.15±0.083 1.33±0.084

Table 3 – The best-evolved parameter functions for three lake categories by using EA in 20 runs
RMSE/r2
SALMO-OO Lakes Phosphate Total algae Diatoms Greenalgae
Blue-greenalgae
Zooplankton
Before optimization parameter Hartbeespoort 58.62/0.061 22.60/0.054 2.16/0.042 8.80/0.013 20.64/0.10 –Klipvoor 768.79/0.22 77.22/0.10 5.56/0.36 44.71/0.011 41.57/0.029 –Bautzen 54.45/0.23 8.99/0.11 – – – 7.05/0.58Arendsee 110.77/0.81 11.39/0.12 – – – –Saidenbach 7.98/0.0009 1.63/0.19 – – – 2.36/0.36Weida 10.71/0.12 2.13/0.30 1.45/0.082 1.88/0.091 0.11/0.0029 1.30/0.52
After parameter optimization forwarm-monomictic hypertrophic lakes
PHOMAX[1]=ln(|T|)+sin(T/P); PHOMAX[2]=ln(|(ln(|P|)⁎(28.071−T))|); PHOMAX[3]=(cos(P)⁎31.576)/T;RATOPT[1]=T/(P−T⁎2); RATOPT[2]=sin(ln(|P|))/T; RATOPT[3]=sin(3.440/(P−T)); GMAX=ln(|P/T|)Hartbeespoort 55.18/0.074 25.23/0.24 1.21/0.15 5.04/0.15 18.98/0.38 –Klipvoor 742.39/0.23 85.76/0.051 8.06/0.30 46.07/0.013 31.63/0.21 –
After parameter optimization fordimictic eutrophic lakes
PHOMAX[1]=T⁎0.5−cos(P); PHOMAX[2]=exp(1.341−T/P); PHOMAX[3]=exp(ln(|P|)/T); RATOPT[1]=sin(P)−T; RATOPT[2]= (sin(T)/P)⁎8.15; RATOPT[3]= (36.438/sin(T))/P GMAX=T/ln(|P|)Bautzen 31.21/0.54 12.28/0.4 – – – 7.64/0.56Arendsee 79.08/0.83 13.53/0.57 – – – –
After parameter optimization fordimictic mesotrophic lakes
PHOMAX[1]=exp(P/T); PHOMAX[2]=ln(|T⁎T+P|); PHOMAX[3]=(P+1.514+T)/T; RATOPT[1]= (P⁎2)/exp(T);RATOPT[2]=T/(T+4.152+P); RATOPT[3]=sin(sin(T/P)); GMAX=(P+16.240)/TSaidenbach 7.50/0.0016 1.73/0.2 – – – 2.13/0.42Weida 9.78/0.24 1.92/0.64 0.71/0.80 1.10/0.46 0.11/0.0049 1.92/0.46
185E C O L O G I C A L I N F O R M A T I C S 3 ( 2 0 0 8 ) 1 8 1 – 1 9 0
3.2. Results and discussion
Table 2 lists the statistical results of evolving parameter func-tion models for three lake categories by using EA in 20 runs.Note that the RMSE value is calculated onlywhen the observeddata are available. Table 3 lists the best-evolved parameterfunctions for three lake categories in 20 runs and the RMSEvalues and r2 values of P, A, A1, A2, A3, Z for both models arealso shown. For each lake category three separate functionswith independent variables of phosphate (P) and water tem-perature (T) were obtained by EA for the parameters PHOMAX
Fig. 6 –Trajectories of PHOMAX, RATOPT and GMAX for two warmfunctions in Table 3.
andRATOPTrespectivelywhichcorrespondto threealgal groups(diatoms, green algae, blue-green algae). A generic function forthe parameter GMAXwas evolved for each lake category aswell.As seen from the table, the structures of those function modelsare variouswith the combination of four arithmetic operators (+,−, ⁎, /) and some elementary functions (sin, cos, exp, ln). Withregards to the resulting trajectories for each lake, EA achievesalways a lower RMSE but a higher r2 comparedwith SALMO-OO,which reflects that the improved accuracy by using EA. This isalso true for the three algal groups provided that observed datawere available for the specific lake. It is interesting that the EA
-monomictic hypertrophic lakes based on the parameter

Fig. 7 –Trajectories of PHOMAX,RATOPTandGMAX for twodimictic eutrophic lakesbasedon theparameter functions inTable 3.
186 E C O L O G I C A L I N F O R M A T I C S 3 ( 2 0 0 8 ) 1 8 1 – 1 9 0
achievedamuchhigher r2 value for eachalgal group for the lakesHartbeespoort andWeida.
Figs. 6–8 illustrate the trajectories of 7 parameter functionsfor 6 lakes from three lake categories based on the best-evolvedfunctions inTable 3. The values of each parameter are restrictedby their range predefined in Table 1 but change over time.PHOMAX[1–3] seems to bymoredynamic thanRATOPT[1–3] andGMAX. Overall green algae seem to prefer higher PHOMAX
Fig. 8 –Trajectories of PHOMAX, RATOPT and GMAX for two dimTable 3.
values than diatoms and blue-green algae. The trajectories ofPHOMAX for green algae for the lakes Bautzen and Arendsee(Fig. 7) show smooth seasonal dynamics. Similar trajectorieswere discovered for RATOPT[1] of lake Hartbeespoort (Fig. 6)and RATOPT[2] of lake Saidenbach (Fig. 8), respectively. TheGMAX parameter keeps mostly constant all the year for all thelakes with the exception of some seasonal dynamics occurringin spring and winter for lakes Klipvoor (Fig. 6), Bautzen and
ictic mesotrophic lakes based on the parameter functions in

Fig. 9 –Simulation results of SALMO-OO before and after parameter optimization for phosphate, total algal biomass,zooplankton biomass for 2 warm-monomictic hypertrophic lakes (measured data for Hartbeespoort and Klipvoor according toVan Ginkel et al., 2006).
187E C O L O G I C A L I N F O R M A T I C S 3 ( 2 0 0 8 ) 1 8 1 – 1 9 0
Arendsee (Fig. 7). This suggests that GMAX is not as sensitive tospecific lake conditions as other parameters.
Figs. 9–11 show the simulation results of SALMO-OO forphosphate, total algal biomass, zooplankton biomass beforeand after parameter optimization for 6 lakes and three lake
Fig. 10 –Simulation results of SALMO-OO before and after paramzooplankton biomass of 2 dimictic eutrophic lakes (Measured datArendsee according to Klapper (pers. comm.)).
categories. It can be observed that for the three lakes ofBautzen, Arendsee andWeida, the simulated phosphate valuesof SALMO-EAare ingoodagreementwith theobservedvalues aswell as the change trends. In comparison with SALMO-OO, thesimulation results are improved significantly.
eter optimization for phosphate, total algal biomass,a for Bautzen according to Benndorf and Recknagel (1982) and

Fig. 11 –Simulation results of SALMO-OO before and after parameter optimization for phosphate, total algal biomass,zooplankton biomass for 2 dimictic mesotrophic lakes (measured data for Saidenbach according to Benndorf and Recknagel,1982 and Weida according to Saenger, 1985).
188 E C O L O G I C A L I N F O R M A T I C S 3 ( 2 0 0 8 ) 1 8 1 – 1 9 0
It is interesting to compare the simulation results of SALMO-OO before and after parameter optimization for total algae. Forlake Klipvoor results before and after optimization look verysimilar (Fig. 9). However much better simulation results were
Fig. 12 –Simulation results of SALMO-OO before and after paramblue-green algae for two warm-monomictic hypertrophic lakes (Van Ginkel et al., 2006).
achieved after parameter optimization for the remaining 5 lakes(Figs. 9–11). With regards to the lakes Bautzen (Fig. 10) andSaidenbach and Weida (Fig. 11) SALMO-OO after parame-ter optimization simulated much more accurate the seasonal
eter optimization for the algal groups diatoms, green andmeasured data for Hartbeespoort and Klipvoor according to
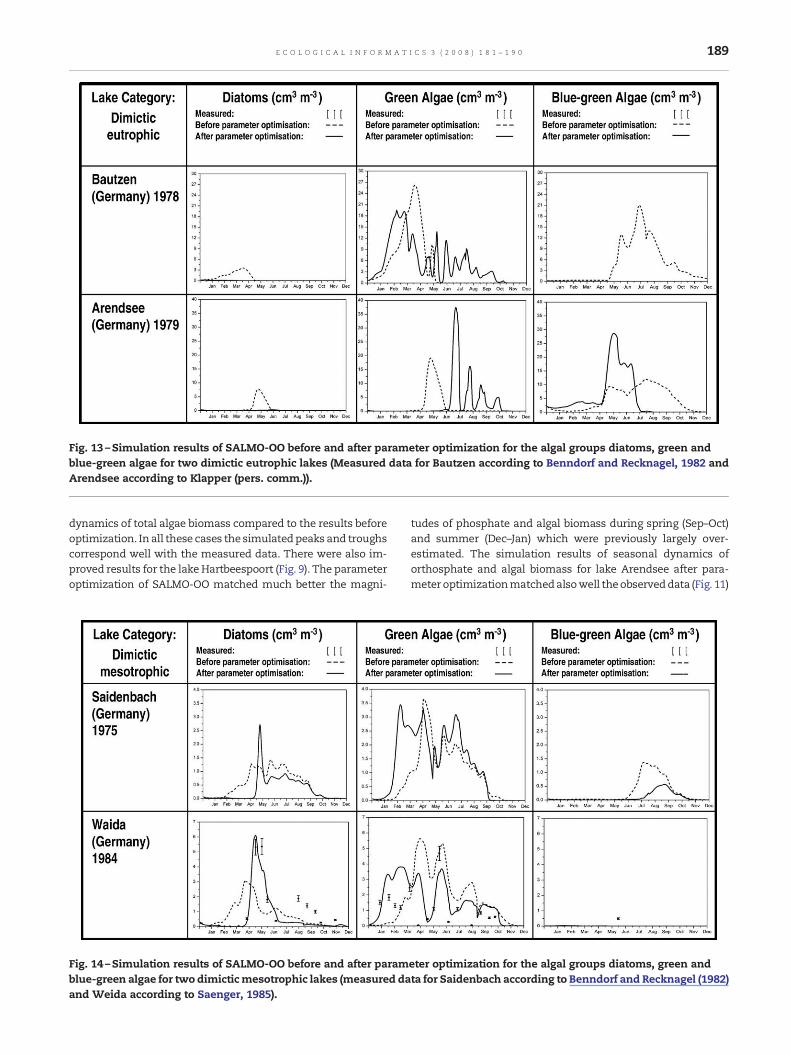
Fig. 13 –Simulation results of SALMO-OO before and after parameter optimization for the algal groups diatoms, green andblue-green algae for two dimictic eutrophic lakes (Measured data for Bautzen according to Benndorf and Recknagel, 1982 andArendsee according to Klapper (pers. comm.)).
189E C O L O G I C A L I N F O R M A T I C S 3 ( 2 0 0 8 ) 1 8 1 – 1 9 0
dynamics of total algae biomass compared to the results beforeoptimization. In all these cases the simulatedpeaks and troughscorrespond well with the measured data. There were also im-proved results for the lake Hartbeespoort (Fig. 9). The parameteroptimization of SALMO-OO matched much better the magni-
Fig. 14 –Simulation results of SALMO-OO before and after paramblue-green algae for two dimicticmesotrophic lakes (measured daand Weida according to Saenger, 1985).
tudes of phosphate and algal biomass during spring (Sep–Oct)and summer (Dec–Jan) which were previously largely over-estimated. The simulation results of seasonal dynamics oforthosphate and algal biomass for lake Arendsee after para-meter optimizationmatchedalsowell theobserveddata (Fig. 11)
eter optimization for the algal groups diatoms, green andta for Saidenbach according to Benndorf and Recknagel (1982)

190 E C O L O G I C A L I N F O R M A T I C S 3 ( 2 0 0 8 ) 1 8 1 – 1 9 0
where the algal biomass reached the right timing of theobserved summer peak. However minor improvements wereachieved by the parameter optimization regarding the simula-tion of zooplankton dynamics as the optimized parameters hadonly an indirect impact on zooplankton.
Figs. 12–14 showthe simulation results of SALMO-OObeforeand after parameter optisation for three algal groups of 6 lakesbelonging to three different lake categories. Due to restrictionsof data availability for three of the studied lakes simulationresults can only be validated for the lakes Hartbeespoort,Klipvoor and Weida (Figs. 12 and 14). SALMO-OO before pa-rameter optimization overestimated the magnitudes of thethree algal groups. However after parameter optimizationSALMO-OO achieved much lower and more realistic simula-tion results for the algal trajectories in particular during spring(Sep–Oct) and summer (Dec–Jan) (Fig. 12). An improvementwasalso achieved for lake Klipvoor by reaching exactly the springpeak (Sep.) of diatoms and also gradually decreasing themagnitudes of blue-green algae biomass (Fig. 12). Regardinggreen algae, both non-optimized and optimized results meetwell the timings of four peaks in observed data but overestimatetheir magnitudes. A satisfactory simulation result after para-meter optimization was achived for diatoms in lake Weida bynot only matching the timing and magnitude of observed dataverywell, butalso reachingexactly theearly summer (May)peak(Fig. 14). As for green algae, SALMO-OO improved after op-timization its timing and therefore seasonality.
Overall the results of this research have demonstrated thatthe substitution of constant parameters such as PHOMAX,RATOPT andGMAX by temperature and phosphate functions inSALMO-OO evolved by EA improved significantly the accuracyof timing and magnitudes of the simulated trajectories forphosphate and in particular for algae biomass. As the para-meters selected for optimization were only indirectly linked tozooplankton little improvements have been achieved regardingthe simulation results for zooplankton.
4. Conclusions and future work
A hybrid approach was presented by this paper by integratingevolutionary algorithms (EA) into the complex ordinary dif-ferential equations (ODE) of the ecological simulation librarySALMO-OO inorder to optimize some crucial parameters. Thoseparameters were related to optimum photosynthesis, respira-tion and zooplankton grazing of the algal groups diatoms, greenand blue-green algae. The results of the case study for 6 lakesclassified into threedifferent lake categorieshavedemonstratedthat the simulation accuracy of SALMO-OO improved greatly,especially for the biomass of total algae and three algal groups.One advantage of the proposed approach is that thewater tem-perature andphosphate functions change the parameter valuesdynamically within their observed ranges and adapt to specificlake conditions and seasonality.
Although promising results have been achieved during thisstudy future research needs to focus at following issues:
- To further improve the simulation accuracy and realism ofSALMO-OO additional parameters related to zooplanktonneed to be optimized by the proposed EA approach.
- Similar experiments need to be conducted for additionallakes of different lake categories.
- In addition to evolving temperature and phosphate functionsfor model parameters, this hybrid approach can also beapplied to evolve optimum representations of processequationswithin theODE such asMonodkinetics for nutrientdependencies of photosynthesis of different algal groups.
R E F E R E N C E S
Arhonditsis, G.B., Brett, M.T., 2005a. Eutrophication model for LakeWashington (USA) Part I–Model description and sensitivityanalysis. Ecological Modelling 187, 140–178.
Arhonditsis, G.B., Brett, M.T., 2005b. Eutrophication model forLake Washington (USA) Part II–model calibration and systemdynamics analysis. Ecological Modelling 187, 179–200.
Bäck, T., Hammel, U., Schwefel, H.-P., 1997. Evolutionarycomputation: comments on the history and current state.IEEE Transaction on Evolutionary Computation 1 (1), 5–16.
Banzhaf, W., Nordin, P., Keller, R.E., Francone, F.D., 1997. GeneticProgramming: An Introduction on the Automatic Evolution ofComputer Programs and its Applications. Morgan Kaufmann.
Benndorf, J., Recknagel, F., 1982. Problems of application of theecological model SALMO to lakes and reservoirs having varioustrophic states. Ecological Modeling 17, 129–145.
Cao, H., Recknagel, F., Welk, A., Kim, B., Takamura, N., 2006. Hybridevolutionary algorithm for rule set discovery in time-seriesdata to forecast and explain algal population dynamics in twolakes different in morphometry and eutrophication, In:Recknagel, F. (Ed.), Ecological Informatics, 2nd edition.Springer-Verlag, Berlin, pp. 330–342. Heidelberg, New York.
Goldberg, D.E., 1989. Genetic Algorithms in Search, Optimizationand Machine Learning. Addison Welsey, Reading, MA.
Hongping, P., Jianyi, M., 2002. Study on the algal dynamic modelfor West Lake, Hangzhou. Ecological Modelling 148, 67–77.
Koza, J.R., 1992. Genetic Programming: On the Programming of Com-puters by Means of Natural Selection. MIT Press, Cambridge, MA.
Koza, J.R., 1994. Genetic Programming II: Automatic Discovery ofReusable Programs. MIT Press, Cambridge, MA.
Radtke, E., Straškraba, M., 1980. Self-optimization in aphytoplankton model. Ecological Modelling 9, 247–268.
Recknagel, F., Benndorf, J., 1982. Validation of the ecologicalsimulation model SALMO. Internationale Revue der GesamtenHydrobiologie 67 (1), 113–125.
Recknagel, F., 1984. A comprehensive sensitivity analysis for anecological simulation model. Ecological Modelling 26, 77–96.
Recknagel, F., Cetin, L.T., Zhang, B., 2008. Process-based simulationlibrary SALMO-OO for lake ecosystems. Part 1: Object-orientedimplementation and validation. Ecological Informatics 3,170–180.
Recknagel, F., Ginkel, C., Cao, H., Cetin, L., and Zhang, B., submittedfor publication. Generic limnological models on the touchstone:testing the lake simulation library SALMO-OOand the rule-basedMicrocystis agent for warm-monomictic hypertrophic lakes inSouth Africa. Ecological Modelling (submitted).
Saenger, H., 1985. Water quality management of the Weidareservoir (in German). Honours thesis. Dresden University ofTechnology, Dresden.
Parker, R.A., 1968. Simulation of an aquatic ecosystem. Biometrics24, 803–820.
Park, R.A., et al., 1974. A generalised model for simulation lakeecosystems. Simulation 33–50.
Van Ginkel, C.E., Silberbauer, M.J., Du Plessis, S., Carelsen, C.I.C., 2006.Monitoringmicrocystin taxinandchlorophyll in fiveSouthAfricanimpoundments. Verhandlungen: Internationale Vereinigung fürTheoretische und Angewandte Limnologie 29, 1611–1616.