PRocess-based climate sIMulation - PRIMAVERA
32
PRIMAVERA (641727) Deliverable 10.1 Page 1 Call: H2020-SC5-2014-two-stage Topic: SC5-01-2014 PRIMAVERA Grant Agreement 641727 PRocess-based climate sIMulation: AdVances in high resolution modelling and European climate Risk Assessment Deliverable D10.1 Use case report
-
Upload
khangminh22 -
Category
Documents
-
view
1 -
download
0
Transcript of PRocess-based climate sIMulation - PRIMAVERA
PRIMAVERA (641727) Deliverable 10.1 Page 1
Call: H2020-SC5-2014-two-stage
Topic: SC5-01-2014
PRIMAVERA Grant Agreement 641727
PRocess-based climate sIMulation: AdVances in high resolution modelling and European climate
Risk Assessment
Deliverable D 10.1 Use case report
PRIMAVERA (641727) Deliverable 10.1 Page 2
Deliverable Title Use case report
Brief Description Translate user needs obtained in WP11 to construct use cases based on vulnerability of users to climate.
WP number WP10
Lead Beneficiary KNMI
Contributors
Eveline van der Linden, KNMI Janette Bessembinder, KNMI Gerard van der Schrier, KNMI David Brayshaw, UREAD Paula Gonzalez, UREAD Erika Palin, MET OFFICE Julia Lockwood, MET OFFICE Galia Guentchev, MET OFFICE Gustav Strandberg, SMHI Dragana Bojovic, BSC
Creation Date 12.09.2016
Version Number V1
Version Date 23.09.2016
Deliverable Due Date M12 (Oct 2016)
Actual Delivery Date
Nature of the Deliverable x R - Report
P - Prototype
D - Demonstrator
O - Other Dissemination Level/ Audience
PU - Public
x PP - Restricted to other programme participants, including the Commission services
RE - Restricted to a group specified by the consortium, including the Commission services
CO - Confidential, only for members of the consortium, including the Commission services
Version Date Modified by Comments
V1 23.09.2016 Eveline van der Linden Collaborative draft included in the PRIMAVERA template
V2 26.10.2017 Eveline van der Linden Updated draft with use cases provided by all contributors
PRIMAVERA (641727) Deliverable 10.1 Page 3
Table of Contents 1. Project Objectives ......................................................................................................... 5
2. Use cases ...................................................................................................................... 5
2.1. Vulnerability ............................................................................................................ 5
2.2. Spatial resolution ..................................................................................................... 6
2.3. Time scale ................................................................................................................ 7
3. Target sectors .............................................................................................................. 7
3.1. Sector: Energy .......................................................................................................... 7
3.1.1 Sector characterisations ................................................................................................... 7
3.1.2 Specific users and their requirements .............................................................................. 8
3.1.3 Use cases ........................................................................................................................... 8
3.1.3.1 Use case 1: the impact of extreme events on the energy system................................. 8
3.1.3.1.1 Data needs .................................................................................................................. 9
3.1.3.1.2 Process description ..................................................................................................... 9
3.1.3.1.3 Added value of global high resolution ........................................................................ 9
3.1.3.1.4 Knowledge utilisation ................................................................................................. 9
3.1.3.2 Use case 2: renewable resources and their integration – understanding the influence
of climate on power system planning and policy .......................................................... 9
3.1.3.2.1 Data needs ................................................................................................................ 10
3.1.3.2.2 Process description ................................................................................................... 10
3.1.3.2.3 Added value of global high resolution ...................................................................... 11
3.1.3.2.4 Knowledge utilisation ............................................................................................... 11
3.2. Sector: Transport ................................................................................................... 11
3.2.1 Sector characterisations ................................................................................................. 11
3.2.1.1 Road and rail; metro/subway systems ........................................................................ 12
3.2.1.2 Waterborne transport (marine/ports & inland waterways) ....................................... 12
3.2.1.3 Aviation ........................................................................................................................ 13
3.2.1.4 System-wide impacts ................................................................................................... 14
3.2.2 Specific users and their requirements ............................................................................ 14
3.2.3 Use cases ......................................................................................................................... 14
3.2.3.1 Use case 1: information to support flood hazard assessment .................................... 14
3.2.3.1.1 Data needs ................................................................................................................ 15
3.2.3.1.2 Process description ................................................................................................... 15
3.2.3.1.3 Added value of global high resolution ...................................................................... 15
3.2.3.1.4 Knowledge utilisation ............................................................................................... 16
3.2.3.2 Use case 2: managing wind hazards ............................................................................ 16
3.2.3.2.1 Data needs ................................................................................................................ 16
3.2.3.2.2 Process description ................................................................................................... 17
3.2.3.2.3 Added value of global high resolution ...................................................................... 17
3.2.3.2.4 Knowledge utilisation ............................................................................................... 17
3.2.8.3 Use case 3: transport operations during hot weather ................................................ 17
3.2.8.3.1 Data needs ................................................................................................................ 18
3.2.8.3.2 Process description ................................................................................................... 19
3.2.8.3.3 Added value of global high resolution ...................................................................... 19
3.2.8.3.4 Knowledge utilisation ............................................................................................... 19
3.3. Finance and insurance............................................................................................ 19
3.3.1 Sector characterisation ................................................................................................... 19
PRIMAVERA (641727) Deliverable 10.1 Page 4
3.3.2 Added value of global high resolution ............................................................................ 20
3.3.3 Specific users and their requirements ............................................................................ 20
3.3.4 Use cases ......................................................................................................................... 21
3.3.4.1 Use case 1: Construction of wind storm event sets .................................................... 21
3.3.4.1.1 Data needs ................................................................................................................ 21
3.3.4.1.2 Process description ................................................................................................... 21
3.3.4.1.1 Added value of high resolution ................................................................................. 22
3.3.4.1.1 Knowledge utilisation ............................................................................................... 22
3.3.4.2 Use case 2: Comparison of present day and future extra-tropical cyclones ............... 22
3.3.4.2.1 Data needs ................................................................................................................ 22
3.3.4.2.2 Process description ................................................................................................... 22
3.3.4.2.3 Added value of global high resolution ...................................................................... 22
3.3.4.2.4 Knowledge utilisation ............................................................................................... 23
3.4 Sector: Agriculture .................................................................................................. 23
3.4.1 Sector characterisation and impact of climate change .................................................. 23
3.4.2 Specific users and their requirements ............................................................................ 23
3.4.3 Use cases ......................................................................................................................... 24
3.4.3.1 Use case: Impact of heat waves and droughts on crop production ............................ 24
3.4.3.1.1 Data needs ................................................................................................................ 24
3.4.3.1.2 Process description ................................................................................................... 25
3.4.3.1.3 Added value of global high resolution ...................................................................... 25
3.4.3.1.4 Knowledge utilisation ............................................................................................... 25
3.5. Sector: Health ........................................................................................................ 25
3.5.1 Sector characterisations ................................................................................................. 25
3.5.2 Specific users and their requirements ............................................................................ 26
3.5.3 Use cases ......................................................................................................................... 26
3.5.3.1 Use case: future changes in heat waves ...................................................................... 26
3.5.3.1.1 Data needs ................................................................................................................ 27
3.5.3.1.2 Process description ................................................................................................... 27
3.5.3.1.3 Added value of global high resolution ...................................................................... 27
3.5.3.1.4 Knowledge utilisation ............................................................................................... 27
3.6 Sector: Water .......................................................................................................... 28
3.6.1 Sector characterisations ................................................................................................. 28
3.6.2 Specific users and their requirements ............................................................................ 28
3.6.3 Use cases ......................................................................................................................... 28
3.6.3.1 Use case 1: Extreme precipitation ............................................................................... 28
3.6.3.1.1 Data needs ................................................................................................................ 28
3.6.3.1.2 Process description ................................................................................................... 29
3.6.3.1.3 Added value of global high resolution ...................................................................... 29
3.6.3.1.4 Knowledge utilisation ............................................................................................... 29
3.6.3.2 Use case 2: Seasonal precipitation dynamics .............................................................. 29
3.6.3.2.1 Data needs ................................................................................................................ 29
3.6.3.2.2 Process description ................................................................................................... 29
3.6.3.2.3 Added value of global high resolution ...................................................................... 30
3.6.3.2.4 Knowledge utilisation ............................................................................................... 30
4 References .................................................................................................................. 30
PRIMAVERA (641727) Deliverable 10.1 Page 5
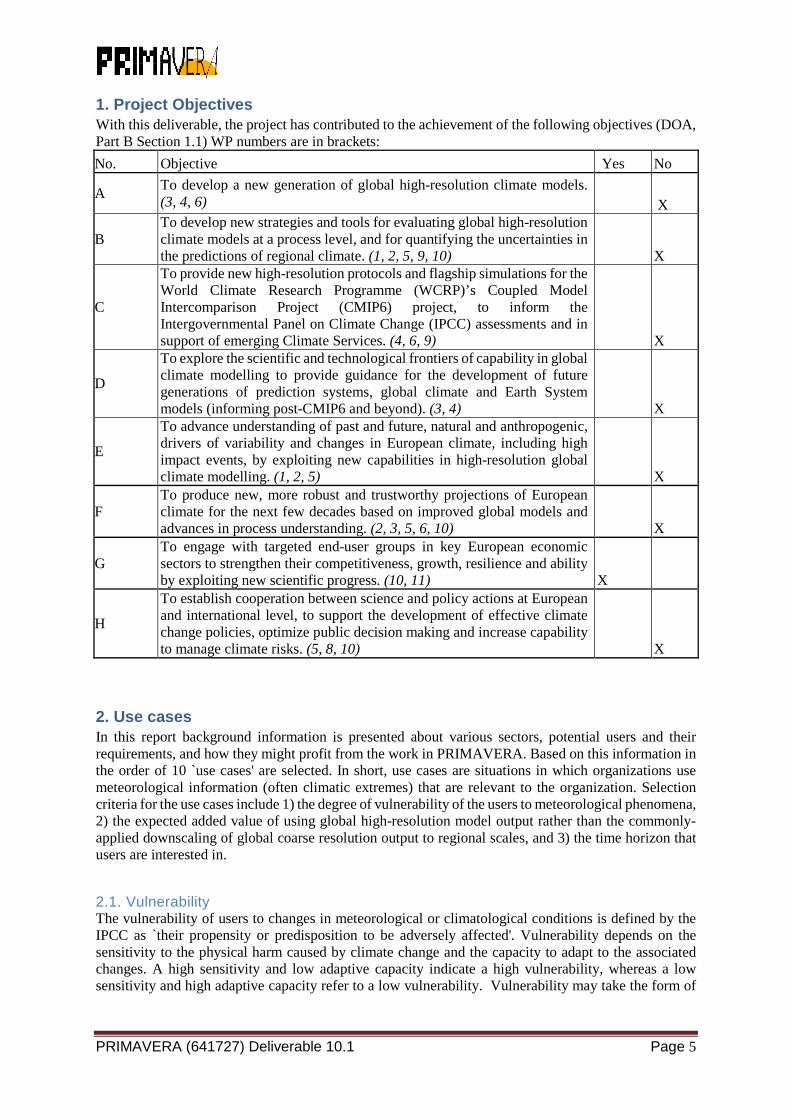
1. Project Objectives With this deliverable, the project has contributed to the achievement of the following objectives (DOA, Part B Section 1.1) WP numbers are in brackets:
No. Objective Yes No
A To develop a new generation of global high-resolution climate models. (3, 4, 6) X
B To develop new strategies and tools for evaluating global high-resolution climate models at a process level, and for quantifying the uncertainties in the predictions of regional climate. (1, 2, 5, 9, 10) X
C
To provide new high-resolution protocols and flagship simulations for the World Climate Research Programme (WCRP)’s Coupled Model Intercomparison Project (CMIP6) project, to inform the Intergovernmental Panel on Climate Change (IPCC) assessments and in support of emerging Climate Services. (4, 6, 9) X
D
To explore the scientific and technological frontiers of capability in global climate modelling to provide guidance for the development of future generations of prediction systems, global climate and Earth System models (informing post-CMIP6 and beyond). (3, 4) X
E
To advance understanding of past and future, natural and anthropogenic, drivers of variability and changes in European climate, including high impact events, by exploiting new capabilities in high-resolution global climate modelling. (1, 2, 5) X
F To produce new, more robust and trustworthy projections of European climate for the next few decades based on improved global models and advances in process understanding. (2, 3, 5, 6, 10) X
G To engage with targeted end-user groups in key European economic sectors to strengthen their competitiveness, growth, resilience and ability by exploiting new scientific progress. (10, 11) X
H
To establish cooperation between science and policy actions at European and international level, to support the development of effective climate change policies, optimize public decision making and increase capability to manage climate risks. (5, 8, 10) X
2. Use cases In this report background information is presented about various sectors, potential users and their requirements, and how they might profit from the work in PRIMAVERA. Based on this information in the order of 10 `use cases' are selected. In short, use cases are situations in which organizations use meteorological information (often climatic extremes) that are relevant to the organization. Selection criteria for the use cases include 1) the degree of vulnerability of the users to meteorological phenomena, 2) the expected added value of using global high-resolution model output rather than the commonly-applied downscaling of global coarse resolution output to regional scales, and 3) the time horizon that users are interested in.
2.1. Vulnerability The vulnerability of users to changes in meteorological or climatological conditions is defined by the IPCC as `their propensity or predisposition to be adversely affected'. Vulnerability depends on the sensitivity to the physical harm caused by climate change and the capacity to adapt to the associated changes. A high sensitivity and low adaptive capacity indicate a high vulnerability, whereas a low sensitivity and high adaptive capacity refer to a low vulnerability. Vulnerability may take the form of
PRIMAVERA (641727) Deliverable 10.1 Page 6
either `chronic' vulnerabilities to gradual changes in climate, or `acute' exposures to particular meteorological events, or a mixture of both. Typical meteorological examples include:
• Long-term changes in climate statistics (e.g., rising temperatures, shifting patterns of wind, insolation, and precipitation, and their [co-]variability in time and space).
• Persistent weather anomalies such as heat waves, droughts, storm surges, or persistently wet conditions.
• Short-time-scale events such as extreme rainfall, hail, and wind-storms.
In many cases, sectoral vulnerability is dependent on multiple meteorological drivers. These are referred to as `compound' events or changes. For example, while insurance risk to wind-damage is strongly dependent on a single variable (surface wind gusts), an important risk in the electricity sector concerns capacity adequacy (i.e., the highest instantaneous demand for power once the contribution from renewable generation is deducted). This latter quantity is typically sensitive to a complicated combination of temperature, insolation, and wind. The duration, intensity, frequency, spatial distribution, and interannual variability of meteorological properties (including extremes) may change in future climates, and thereby the likelihood of the associated risks and impacts. Improved climate projections can therefore help users to explore how much impact these changes have now and in the future, enabling users to design appropriate strategies to manage, respond, and adapt to the changing risks and opportunities.
2.2. Spatial resolution The use cases will be selected to explore and identify the added value of globally high resolution climate models (GCMs) compared to standard resolution GCMs. Two anticipated advantages are highlighted. Firstly, global high resolution GCMs compute and produce data on finer spatial scales than traditional GCMs. This is useful for establishing links to the location-specific properties necessary to understand climate impacts. For instance, smaller grid-squares enable topographic influences on local meteorology to be seen more clearly, typically reducing the discrepancy between model-grid output and point observations. The improved spatial resolution may also lead to an improved representation of high-frequency temporal variability (e.g., hour-to-hour variations), which is essential in some applications (e.g., detailed modelling of power systems). It is, however, recognised that the PRIMAVERA methodology (global high-resolution) does not provide unique opportunities in this regard: similar benefits from resolution can be achieved by other approaches such as using high-resolution regional climate models to ‘dynamically downscale’ coarse global GCMs over limited geographical domains. The second – and more fundamental – advantage of global high resolution GCMs is an improved representation of the underlying physical/dynamical processes across scales. It has been established that many of the governing mechanisms of European climate, such as the large-scale atmospheric circulation, improve as global resolution is increased. In this sense, the enhanced small-scale resolution can be expected to contribute to an improved representation of the large-scale circulation. Such improvements are unique to high-resolution global GCMs and cannot be achieved using regional high-resolution downscaling. A typical example of this is that the frequency and duration of atmospheric blockings improves when spatial resolution increases, which is associated with a better representation of the topography. Blocks remain in one place for an extended period and cause persistent weather patterns – such as heatwaves and droughts in summer, and cold snaps in winter – with profound impacts across many user-sectors. A central focus will therefore be to understand `Why does it happen?', instead of `What happens?' to achieve a better process understanding leading to improved understanding of the risks and impacts for users of climate information. The benefits of using global high resolution GCMs will be evaluated through comparison with coarse-resolution global GCMs and high-resolution regional climate models, both in terms of statistical properties and their representation of the underlying physical phenomena.
PRIMAVERA (641727) Deliverable 10.1 Page 7
2.3. Time scale The simulations of PRIMAVERA run over the period 1950 to 2050, which means that they extend into the `near' future. This time scale is shorter compared to most coarser-resolution modelling studies, in which simulations extend to the year 2100 or even longer (the `distant' future). This is generally consistent with the needs of information-users, who are often most interested in the near future (often only the next 5 to 10 years, though this will be verified in the user consultation process) but brings an extra difficulty with it. In longer century-scale simulations, external forcings, such as greenhouse gas concentrations or solar insolation, typically govern the climate response. On shorter (decadal) time scales these externally-forced signals can be strongly enhanced or damped by natural internal variability, which makes it difficult to separate human-induced climate change from natural climate fluctuations. It must also be noted that PRIMAVERA simulations are also strictly `boundary condition' simulations (unlike decadal forecasts, PRIMAVERA will not seek to initialize evolution of natural variability). In PRIMAVERA, one of the challenges is to capture the underlying processes that drive (or mediate) the natural decadal fluctuations, so that they can be separated from the longer term trends. This would improve our understanding of the risks and impacts of events that are driven by decadal fluctuations and long-term trends. It will also enable the construction of plausible scenarios of climate evolution over the coming decades (i.e., identifying multiple different climate scenarios that could occur contingent on the evolution of natural fluctuations).
3. Target sectors Each research group that contributes to WP10/WP11 will focus on different target sectors, and look for important extreme events and use cases that might be of interest for them. The sectors that are currently covered are energy, transport, finance and insurance, agriculture, health, and hydrology. In this section, the target sectors and their climate information needs are described per sector since the relevancy of the use cases might be strongly sector-specific. We will describe the general need for several sectors – partly based on existing documents from other Climate Services activities – and the possible added value that high-resolution climate models can have for these sectors or specific users within the sectors. Where possible, we add more detailed information on the needs of specific users, i.e. how they use climate information or which questions might be of interest to them. Later on, this part will be updated with new insights specifically from the PRIMAVERA project.
3.1. Sector: Energy 3.1.1 Sector characterisations In response to climate change, many European countries are sourcing an increasing fraction of their electricity from weather-sensitive renewables such as solar radiation and wind. The traditional model of power system operation – whereby the output from large power stations is directly controlled to meet electricity demand – is therefore being replaced by a situation where neither demand or supply are known in advance. The physical and economic integration of “variable” renewable generators into power networks remains a major challenge in energy policy and planning. Power systems pose several major scientific challenges in terms of climate modelling:
• Spatial localisation. Renewable generation assets (e.g., wind- and solar farms) and demand centres (e.g., cities) exist in specific geographical locations. High-resolution climate data are therefore valuable in estimating the climate-response of individual assets (e.g., the output from a particular wind-farm).
• High-frequency time dependencies. The parts of a power system with controllable output (typically coal, gas, and nuclear power plant) differ greatly in cost and response time (e.g., a typical coal power station requires several hours to `switch on' from a cold start). Many quantitative applications in the energy sector – particularly in power systems – therefore require high-frequency data outputs for surface conditions. Accurately estimating local
PRIMAVERA (641727) Deliverable 10.1 Page 8
meteorological properties at ‘short’ (~0.5-3h) time scales is therefore an important ingredient in understanding power system responses.
• Spatial connections and compound meteorological sensitivities. Transmission infrastructure connects the power system across national and continental scales. This, coupled with the requirement for near-instantaneous supply-demand balance across the network leads to complex multi-variate meteorological sensitivities spanning large geographical areas. The spatial correlations within and between meteorological variables therefore become very important for assessing impacts on power systems.
3.1.2 Specific users and their requirements Energy constitutes a diverse sector with a wide range of stakeholders and potential needs for climate information but general awareness and understanding of climate impacts on this sector remains relatively low. Specific users – and use cases – are therefore being identified and developed over the course of the PRIMAVERA project. These will collaborate with and build upon a wider body of work and existing stakeholder contact activity through previous projects and the EU COPERNICUS climate services for energy. The case studies will seek to demonstrate a mixture of both `acute' and `chronic' impacts of climate on the energy sector. Electricity (power) is recognised to be a key opportunity given the rapid growth of weather-sensitive renewable generation but other energy vectors (gas, oil) may also be explored. In addition to direct collaborations with `end-user' industrial and policy stakeholders, PRIMAVERA will also target an intermediary community in “energy-systems research”. This will include academic and industrial research organisations who are active in modelling and understanding the future evolution of the energy system. This indirect approach will enable PRIMAVERA establish firmer links between climate and energy research and will support the “translation” of PRIMAVERA science into a form relevant to the end-user energy community.
3.1.3 Use cases
3.1.3.1 Use case 1: the impact of extreme events on the energy system Extreme weather and climate conditions have profound implications for the energy sector across a wide range of technologies and energy-forms. Some examples include:
• Cold winter temperatures: icing of power lines (leading to damage) and peaks in demand (e.g., for heating and electricity, often associated with price spikes or supply shortages).
• High summer temperatures: reduction of generation efficiency, curtailment of power plants (e.g., water used for cooling may exceed environmental regulations on temperatures for river discharge), peaks in demand (for air conditioning, often associated with price spikes or supply shortages).
• Extreme precipitation: flooding of infrastructure assets. • Drought: restrictions to hydropower availability, falling river levels limiting transport of raw
fuel for electricity generation (e.g., the movement of coal on the River Rhine). • Storm surge: risk to coastal plant (particularly nuclear). • Extreme winds: infrastructure damage (e.g., power lines, wind farms, offshore oil rigs). • Various users were consulted to identify relevant hazards associated with extreme events, such
as high temperature, low winds, and the compound effect of both. Relevant users are linked to energy companies or provide consulting services to energy-related companies or government agencies. The specific hazards and extreme events depend on the research partner but two specific initial partnerships have been identified relating to hydropower and nuclear power, with a third possible case study on wind power.
PRIMAVERA (641727) Deliverable 10.1 Page 9
3.1.3.1.1 Data needs The data needs depend on the specific event and the methodology chosen to study it. In general, sub-daily to daily fields for temperature, precipitation, wind, and insolation will be considered, from the historical and future simulations. Whenever available, runs from a spectrum of models running at different resolutions will be used to assess the impact of PRIMAVERA’s enhanced spatial resolution. Extreme value theory will be considered to identify and characterize extreme events according to the hazards of interest. A key variable in the analyses is the concept of return period, and changes in this magnitude will be assessed by comparing the historical and future runs. Comparing the results that derive from different GCMs will allow to identify the most robust responses.
3.1.3.1.2 Process description The physical processes that induce extreme events depend on the specific hazard of interest. An example of particular relevance over Europe is atmospheric blocking and the storm track, due to their strong influence on wind, precipitation, and temperature. The connection between the local surface climate over the target region and large-scale atmospheric circulation (e.g., storm track variability, the midlatitude jet, teleconnections such as the NAO) will also be essential for understanding the uncertainty of estimated return periods.
3.1.3.1.3 Added value of global high resolution In this case, the benefit of the high resolution PRIMAVERA data arises from the improved representation of the underlying processes that are associated with extreme events (e.g., storms and blocking), as well as the large-scale teleconnections affecting their characteristics (e.g., NAO, ENSO).
3.1.3.1.4 Knowledge utilisation These use cases are likely to evolve as partnerships with the private sector users and scientific journal publications may not be the most appropriate route for the dissemination of results. In cases where research outputs are incorporated into analysis within the stakeholder’s organisation (and the details of this cannot be released), we will aim to generate output (reports, case studies or other summaries) that are suitable for general release on the PRIMAVERA User Interface Platform (UIP).
3.1.3.2 Use case 2: renewable resources and their i ntegration – understanding the influence of climate on power system planning and p olicy Numerical models of the energy system are widely used to inform planning and policy [e.g., e-Highway2050 (2015), NARIS (Luderer et al. 2017), Pöyry (2009, 2011)]. The use of robust high-quality climate data in power system planning has, however, been historically limited due to:
• lack of awareness or understanding of climate as a system planning risk • lack of availability of suitable climate data (typically high spatial and temporal resolution of
the required near-surface properties) • technical difficulties (e.g., climate dataset size, accessibility, and format)
Very few power system planning studies have therefore considered the impact of long-term climate change and variability on system planning (and there has been minimal use of climate model output in general) despite research suggesting that climate uncertainty may have significant consequences [Bloomfield et al. (2016)]. PRIMAVERA will address this issue, providing ‘use cases’ demonstrating the value of long-term high-resolution climate simulations for energy system planning applications. Initially, the characteristics of known power system ‘critical properties’ (elicited from end-user partners and literature) will be examined in the PRIMAVERA datasets. A typical example of this is so-called ‘capacity adequacy’: the ability of a power system to produce sufficient instantaneous supplies of power to meet demand. Given the rapid growth of renewables generation, this typically corresponds to specific weather events – for example, in the UK, low-wind-cold-snaps associated with atmospheric blocking during winter are a particular concern because of their simultaneous impact on demand (for heating)
PRIMAVERA (641727) Deliverable 10.1 Page 10
and wind-power (due to calm conditions). Other critical properties – including long term trends and variability in RE resources (particularly wind power) – will also be examined. It is expected that this analysis will be of relevance to partners in both industry and academia (e.g., estimating capacity adequacy, estimating wind resource yield for wind farms). PRIMAVERA will then seek to go further by directly coupling large volumes of high-frequency/high-resolution climate model output to the complex energy system models typically used in planning and policy. At their simplest, these models provide a tool to simulate the characteristics of the energy system under a given set of climatic, economic, and technological assumptions. These simulations allow, for example, the identification of the optimal resources to utilize (e.g., the location of wind or solar farms), or to test how different policy choices influence the resulting system design (e.g., the reinforcement of power transmission capacity). They can therefore be viewed as a means to convert PRIMAVERA’s climate data into estimates of power system properties with more direct relevance to sectoral stakeholders. In this latter part of the use case (energy system modelling), PRIMAVERA scientists will partner with one or more users to support the uptake of PRIMAVERA climate outputs. These partners are likely to initially be academics working in energy policy who can provide the capability to “translate” the climate-focussed outputs of PRIMAVERA into meaningful analyses of the energy system as a whole. It is intended that this analysis and the methodologies developed will be communicated broadly to industry and policy-makers, both directly and through targeting external activities such as EU COPERNICUS climate services and IPCC WG2.
3.1.3.2.1 Data needs The primary datasets are 3-hourly or 6-hourly fields for temperature, wind, cloud cover, and insolation. These will be exploited at the highest feasible common resolution (e.g., a 0.5o grid, hourly), initially over a European domain with a focus on the recent historical and near-future period (~1980-2030). Interpolation and calibration are likely to be essential steps in data processing and will require careful attention. For the representation of wind power generation, 3-hourly or 6-hourly data at several layers in the boundary layer are needed to estimate vertical wind profiles to adjust the wind-height to that of typical large wind turbines. In the case of solar generation, the representation of insolation and cloud cover are key. In the case of insolation, 3-hourly data is adequate to represent the diurnal cycle, but cloud cover will be more dependent on the representation of the larger scale phenomena that cause clouds and precipitation. Time ‘interpolation’ is also likely to be needed for both solar and wind (to reach the hourly or 30-minute resolution typically used in power system modelling) and care will need to be taken to ensure that this is done appropriately (e.g., is linear interpolation sufficient or should high-frequency ‘noise’ be approximated in some way?). Whenever available, data from multiple runs from various models will be compared across resolutions (e.g., low, medium, and high resolutions) to allow the assessment of both increased spatial resolution and multi-model uncertainty. Wherever possible, links between the characteristics of the surface variables (wind, solar, etc.) and large-scale dynamical drivers (jet position, blocking, storm tracks) will be explored to provide greater understanding of differences between climate simulations and climate uncertainty, drawing upon the core science developed in other PRIMAVERA deliverables and work packages.
3.1.3.2.2 Process description The impact of weather and climate on the energy system is complex and multi-scaled. At the smallest scale, the power system is composed of a specific set of localised nodes that either generate a supply of or a demand for electricity. In the context of PRIMAVERA simulations, the ability of the GCMs to credibly simulate the processes responsible for regional – and even local – surface climates is therefore important to minimize the need for statistical post-processing. This includes boundary layer wind structures, cloudiness and insolation, and surface temperature. Transmission grids, however, connect these individual nodes into larger systems (at national or continental scale). Such systems, because they connect different types of generation and demand, are sensitive to a complex mix of surface weather (e.g., wind near wind farms, cloud cover near solar plant,
PRIMAVERA (641727) Deliverable 10.1 Page 11
temperature near demand centres). This applies across a wide range of timescales from daily weather (e.g., cyclones, blocks) to seasonal (e.g., teleconnections such as the NAO) and longer (e.g., interannual variability and long term climate change effecting the position and strength of the midlatitude jet, storm track, and blocking). The ability of the PRIMAVERA GCMs to correctly represent the large-scale atmospheric patterns driving European weather – and their impact on the co-variability of surface weather conditions - is therefore a key concern.
3.1.3.2.3 Added value of global high resolution The high resolution PRIMAVERA dataset has two main advantages. Firstly, it provides an unprecedented volume of high-quality climate data for energy system modelling. In particular, the PRIMAVERA team has produced an extensive collection of high-frequency (3-hourly or 6-hourly) surface impact variables specifically targeting the issue of renewables assessment and integration. The resolution of these variables – in both time and space – will allow multi-model GCM data to be utilised in state-of-the-art energy system planning models for the first time. Secondly, it has been shown that the increased GCM resolution can lead to process-improvements in the simulation in both global and local climate. This therefore provides a crucial advantage of PRIMAVERA compared to limited-domain downscaling approaches (e.g., Euro CORDEX) which rely on relatively coarse global GCM simulations for their input boundary conditions. In PRIMAVERA the local surface climate is consistent with this globally-improved simulation (e.g., the position of the storm track, jets, and blockings), lending confidence and credibility when interpreting the impact of climate variability and change in terms of its surface impacts.
3.1.3.2.4 Knowledge utilisation This collaboration with different academic and industrial research groups is expected to lead to the publishing of scientific articles (targeting the energy community) which will be translated into user-accessible reports, fact-sheets and webinars/workshops appropriate for the PRIMAVERA UIP. The possibility of sharing a subset of processed PRIMAVERA data in the form of ‘energy system reanalyses’ and ‘energy system projections’ via third party websites (e.g., RenewablesNinja: www.renewables.ninja, EU COPERNICUS climate services demonstrators: climate.copernicus.eu/ecem) will also be explored.
3.2. Sector: Transport
3.2.1 Sector characterisations Sensitivities to weather and climate can be found across various transport modes. Key principles for the effective operation of transport include:
1. Availability: physical availability of infrastructure assets – e.g. for aviation, the availability of an airport with open runways to allow flights to arrive/depart
2. Service reliability: ability to operate a service – e.g. for a road user responsible for transporting goods, not only must the road be available and well-maintained, but a vehicle in good condition, and an appropriately-trained driver, must also be available
3. Safety: in order to ensure the safety of transport users, precautionary measures may be invoked where there is an elevated risk of impacts; such measures may in themselves affect the operation of the transport system – e.g. for railway, speed restrictions may be imposed to manage the risk of rail buckling in hot weather, which may result in delays to train services.
Examples of potential transport sensitivities are quoted per mode below. The list is not exhaustive. In general, transport is designed to cope with current weather, and – for certain longer-lived assets – future climate change. However, issues related to the age and condition of some assets, and their use in conditions that may exceed the design conditions (e.g. greater passenger numbers than anticipated), may result in additional vulnerability.
PRIMAVERA (641727) Deliverable 10.1 Page 12
Most transport stakeholders are interested in the management of various different meteorological extremes; the modeling of these and the understanding of the fundamental processes underlying them may be improved in PRIMAVERA. Of particular note is the potential for developing understanding of extratropical cyclones (see also Section 4.3 Finance and Insurance), as these can be impactful events for transport in terms of the associated winds and precipitation amounts. Recent high-impact weather events, such as the summer heatwave of 2003 (Western Europe), the very cold winter of 2009/10 (across Europe) and the very stormy winter of 2013/14 (in particular in the UK), are very much still in the minds of transport stakeholders, and any developments in our understanding of the processes and/or the statistics governing these events would be well-received by transport stakeholders.
3.2.1.1 Road and rail; metro/subway systems Road and rail transport are in general affected similarly by weather/climate. Temperature extremes affect the integrity of road surfaces and railways, with high temperatures resulting in (for example) melting of road surface and buckling of rails, and low temperatures resulting in degradation of the road surface by frost heave and cracking of rails. Heavy rainfall may lead to flooding (whether directly, as a result of surface water, or indirectly, as a result of rivers bursting their banks or groundwater levels rising to the surface) which is a common issue for road and rail infrastructure as it not only damages the infrastructure but also restricts the passage of traffic along routes. The period over which heavy rainfall occurs is an important factor with intense (usually convective) rainfall generally yielding relatively rapid surface water flooding, while moderately heavy rainfall sustained over a period of days to weeks may cause river flooding. Rainfall sustained over a period of weeks to months may result in soil saturation and hence – in locations with permeable geology – may result in groundwater flooding. Infrastructure at the coast may be affected by the sea state, with synoptic-scale storms resulting in temporarily extreme water levels which may overtop or breach local sea defences. Landslides arising from coastal erosion or from rainfall-induced slope failures are also significant for road and railway infrastructure; they may block routes and/or raise the risk of accidents/incidents, and may also take a significant time to repair. High winds are another factor; bridges may need to be partly or completely closed in high winds for safety reasons. There is also a risk of vehicle overturning (road and rail vehicles) in high winds. Wind may also affect the integrity of overhead line infrastructure on electrified railway systems. Drought can affect road and rail infrastructure built on certain substrates, such as peatland or clay soils. In drought conditions these substrates may dry out and shrink, exposing foundations or causing structural degradations or instabilities. Convective activity (thunderstorms/lightning) poses a threat to unprotected (or insufficiently protected) electric and electronic equipment, such as that used in railway signalling and air conditioning. Vegetation-related issues were also highlighted in terms of planting choices for infrastructure slopes and whether such choices would remain appropriate under a changing climate. Such vegetation can be used to stabilise slopes, as well as increasing biodiversity. This is in addition to the disruptions experienced on some countries’ railways during the annual leaf fall season. When fallen leaves becomes crushed onto the rails by passing trains, a slippery film can be created, resulting in adhesion issues between train wheels and the rails, which poses a safety risk. Metro/subway systems share some similarities with surface transport, as not all metro/subway infrastructure is underground. They also have their own specific issues, examples being the greater need for (and complexity of) cooling of underground infrastructure and underground drainage management.
3.2.1.2 Waterborne transport (marine/ports & inland waterways) Many (though not all) of the hazards affecting marine and inland waterway transport are similar. Ports additionally have some commonalities with other point-location infrastructure such as airports.
PRIMAVERA (641727) Deliverable 10.1 Page 13
High winds can disrupt port operations conducted using large cranes – these operations cannot proceed in high winds. High winds can also disrupt shipping operations, such as manoeuvring ships on and off berths. Wind direction is an important factor for approaching or leaving ports depending on their orientation. Coastal hazards are of obvious relevance for ports. Coastal assets may be damaged directly by floods. Flooding of ports can disrupt ship access to the ports, as it may not be possible to dock and secure ships properly. Flooding at the port can also affect connectivity to other transport modes (e.g. road and rail). Changes in sea level can affect the clearance under port structures, such as bridges. Coastal flooding processes can also lead to coastal erosion, which may in turn change coastal morphology and affect navigability. Rainfall and rainfall-related flooding can increase river flow, which can affect river navigation – it is more difficult to carry out ship manoeuvres, such as turning, under higher river flow conditions, and transit times may increase if travelling against an increased flow (though conversely they may decrease if travelling with the increased flow). Tidal flows/currents are also an issue for navigation, in an analogous way to that described for river flows. Snow, ice, and frost can affect the road and/or rail access to/from ports. In turn, this may lead to suspension of port operations, because goods cannot arrive or be stored. At high latitudes, sea ice also affects navigation, with icebreakers possibly being required. Lightning can be hazardous to sensitive electronic navigation systems. Drought poses a risk to inland waterways transport, as decreasing river levels can only be accommodated up to a point, depending on the under-keel clearance of the vessel. Visibility is an issue for navigation. It is possible to navigate most ships in zero visibility, but navigation and manoeuvring ships alongside an installation in zero visibility becomes more hazardous in busy shipping areas or in areas which are difficult to navigate.
3.2.1.3 Aviation Aviation is typically associated more with the mitigation agenda than that for adaptation – that is, the effect of aviation on climate has been more of a focus than the effect of weather/climate on aviation. However, aviation can be affected by weather and climate factors. Snow, ice and frost affect operations, as (for example) aircraft need to be de-iced, and runways cleared of snow. Access to airports themselves can also be affected. High winds pose operational problems, resulting in delays and diversions, and risks to construction operations at airports. Longer-term changes to wind climatology around an airport (e.g. changes to the prevailing wind direction) are a potential issue, as airport runway directions are chosen based on wind climatology information. Rainfall and rainfall-related flooding were cited as impactful for airports in tropical areas, though not especially as an issue for Europe. As for low-temperature hazards, flooding may disrupt access to airports by affecting the ground transport links. High temperatures pose a heat stress risk to personnel working on exposed parts of airports. Aircraft take-off and climb are affected at very high temperatures, as air becomes less dense and there is not as much lift. Lightning and convective storms pose a safety risk to air travel; sectors (geographic divisions of airspace) may be closed in severe convection conditions. Lightning and convective storms can also put personnel on the ground at risk unless shelters are provided. Coastal flooding – such as that which could arise from storm surges – is an issue for those airports close to the coast, of which there are several in Europe. The Northern Hemisphere polar jet stream affects transatlantic flight routing. Since the flow across the North Atlantic is from west to east, westbound flights need to avoid the jet stream where possible, while eastbound flights are able to travel with the jet stream, thereby reducing flight times and saving fuel. Flights are dynamically routed to take account of the jet stream position.
PRIMAVERA (641727) Deliverable 10.1 Page 14
3.2.1.4 System-wide impacts Though PRIMAVERA focuses on European climate risk, the global connectivity of the transport system cannot be ignored, as weather/climate impacts occurring outside Europe may have indirect impacts on Europe itself. There is strong interdependence between different transport modes, with most transport users having a choice of transport modes for making their journeys. On occasions when one mode is particularly impacted by weather/climate, people may select an alternative mode (e.g. choosing to drive rather than take the train), thereby potentially placing extra pressure on the less affected modes. For transport, there are clear links to climate change mitigation, as many transport modes seek to reduce their carbon footprints. Future transport demand will be sensitive to this.
3.2.2 Specific users and their requirements Many of the transport sector contacts were not yet sufficiently familiar with detailed climate information to be able to propose specific topics for use cases (cf. insurance sector). Therefore, in this section, we propose some areas of broad interest across the transport subsectors. Subsequent refinement of these, based on future engagement, is recommended. Such engagement is envisaged through the ongoing programme in WP11 (e.g. webinars, workshops). Categories of potential interest in transport include:
• Operational weather management: to understand the ways in which interannual variability affects the nature of extreme and/or otherwise impactful weather events, which in turn will support better year-to-year planning for the management of impactful weather events across transport networks. � This was discussed by many interview participants.
• Strategic planning: to integrate weather and climate information into longer-term planning cycles (e.g. budgeting for particular levels of disruption). � This was discussed by several interview participants.
• Asset design: to understand the ways in which design standards may need to change in future, as a result of climate change. � This was discussed by several interview participants.
• Demand: to provide potential scenarios of near-future evolution of climate which may form one input to demand models. � There was limited discussion of this during the interviews.
• Policy making: to understand the role of climate change in the transport sector as a factor in the future evolution of the European transport system. � There was limited discussion of this during the interviews.
With reference to specific hazards:
• Rainfall and related flooding was relevant (at least to some extent) for all subsectors • High winds were mainly relevant for air transport, roads, and ports • High temperatures were mainly relevant for air transport and land transport
3.2.3 Use cases 3.2.3.1 Use case 1: information to support flood ha zard assessment All transport modes are affected by flooding to some extent. However, the occurrence of flooding – and the extent of its impacts – depends on much more than just the meteorological component (e.g. land use, geology, existing risk management strategies / adaptation measures). While PRIMAVERA will not undertake the kind of detailed modelling that is needed to understand flooding, it should be possible for PRIMAVERA to provide a better understanding of some of the meteorological influences on flooding. Depending on further user engagement, it may also be possible to work with a user who would undertake the detailed modelling described above, to see how PRIMAVERA outputs could be incorporated into such modelling.
PRIMAVERA (641727) Deliverable 10.1 Page 15
3.2.3.1.1 Data needs For this use case, the primary data requirement is for precipitation variables, at the best possible spatial and temporal resolution. Useful precipitation indices should be explored further with users. Some comparison of precipitation climatology in reality and in the models would need to be undertaken, for bias correction reasons. The exact nature of the indices will depend on the user(s) involved, but could include:
• Seasonal mean precipitation (including identification of n very wet seasons for consideration as an “event set” (see Section 4.3.1)
• Number of very wet days/n-hour periods (where n is defined by what is available from the simulations) per year/season
• Wet spell duration (e.g number of n-day periods with daily rainfall exceeding the x-th percentile per year/season)
• Spatial extent of wet conditions (e.g. % of European land gridboxes with daily rainfall exceeding the x-th percentile per year/season)
The relationship between extratropical cyclones and heavy rainfall (see Section 4.2.3.1.2 below) means that more general information about the storm track would also be useful (note similarities with finance and insurance use cases, Section 4.3.3):
• Number of extratropical cyclones in a given season • Storm track position: mean and variability per season
3.2.3.1.2 Process description We may consider two main types of relevant meteorological event: (a) frontal/synoptic-scale precipitation and (b) convective-scale precipitation. Frontal/synoptic-scale precipitation generally arises from the passage of extratropical cyclones (typically driven by a strong North Atlantic jet), and can affect large areas, perhaps with a time lag between the rainfall occurrence and the flooding. The flooding is often fluvial in origin (i.e. rivers bursting their banks). Precipitation can be heavy, but may not be extreme sensu stricto. It may however be sustained over many hours or indeed days, leading to large totals over time – particularly if multiple extratropical cyclones occur in rapid succession, and/or if the ground is already saturated. Convective-scale precipitation arises from storms occurring at a smaller scale, with the associated rainfall occurring over a shorter time, and being especially heavy or even extreme. Flash flooding often results from this, i.e. with a much shorter time lag between the rainfall occurrence and the flooding. The rainfall cannot be absorbed by the ground (perhaps because of impermeable geology, or urban land-use) and the result is rapid surface runoff. The area affected is typically rather localised but the concentration of rainfall (and subsequent runoff) in small areas can have devastating impacts.
3.2.3.1.3 Added value of global high resolution For type (a), it is envisaged that PRIMAVERA will be able to add significant value, as these are large-scale events and one would expect that the representation of the relevant processes/phenomena (e.g. North Atlantic storm track) will be improved at higher spatial resolution. The higher temporal resolution at which precipitation data will be available will also be a better match to the requests from users, who are keen to obtain better-than-daily resolution data. Of additional interest is the potential for these systems to stagnate over a particular area, yielding particularly severe flooding impacts there. A greater mechanistic understanding of this phenomenon could be supported by PRIMAVERA.

PRIMAVERA (641727) Deliverable 10.1 Page 16
For type (b), the possible value added by PRIMAVERA is not yet clear. Even in the Stream 2 simulations, the resolution attained will not be convection-resolving. However, the enhanced temporal resolution of the simulations may still provide useful information.
3.2.3.1.4 Knowledge utilisation There are two possible routes here. For the more technical user, data can be provided, though most likely for a limited geographic area to keep the size manageable. It is not yet clear what processing should be conducted on these data before the technical user may receive them. For the less technical users (of whom there are more in this sector), it will be more helpful to provide processed outputs, such as:
• Maps of change between past and future rainfall • Statistics of occurrence of particular rainfall conditions • Event sets or mapped scenarios of very wet weather
Some of these materials could be supplied via the UIP, reported via workshop(s) with interested parties, or provided in written report form. As stated above, iterative discussions with users will be needed to optimise what will be provided.
3.2.3.2 Use case 2: managing wind hazards High winds can disrupt the operation of airports, roads, railways and ports. However, the nature of future wind hazard is not well known from the current generation of models: any possible climate change “signal” which may be present is usually dwarfed by the “noise” of natural variability. It can therefore be more prudent to look at the current hazard posed by wind, by exploring the natural variability aspect. Understanding this better can improve existing weather management strategies.
3.2.3.2.1 Data needs For this use case, the primary variable is wind speed and wind gust speed, but wind direction would also be useful. The spatial and temporal resolution should be as high as possible. Relevant indices would likely be related to a given decision-making threshold (e.g. “when wind speeds exceeds x km/h, take action y”). Some comparison of wind climatology in reality and in the models would need to be undertaken, for bias correction reasons. Potentially useful indices could include:
• Number of days / n-hour periods with wind speeds exceeding a given value / percentile per year/season
• Windy spell duration (e.g. number of n-day periods with mean/maximum wind speed exceeding the x-th percentile per year/season)
• Spatial extent of windy conditions (e.g. % of European land gridboxes with mean/maximum wind speed exceeding the x-th percentile per year/season) � This could also be defined in terms of user-relevant areas, such as aviation sectors
• Changes (future vs baseline) in wind climatologies (e.g. prevailing wind direction) at specific locations
Information in the vertical is also desired by aviation users, but it is not known whether this will be available from PRIMAVERA models. Measures of the intensity of extratropical cyclones should also be considered (as for the insurance use case in Section 4.3.3). Finally, some of the WP5 simulations could be useful here, if they allow the presentation of wind scenarios which relate to the phase of particular modes of variability (e.g. NAO, AMO).
PRIMAVERA (641727) Deliverable 10.1 Page 17
3.2.3.2.2 Process description Broadly speaking, high winds over Europe arise as a result of (a) extratropical cyclones, (b) local (sometimes seasonal) winds, and (c) transient smaller-scale features such as squalls and tornadoes. The contrast between (a) and (c) (spatial scale, duration of events) is similar to that discussed above for precipitation in Section 4.2.3.1.2 above. (a) has been discussed by many users, often using the term windstorm, depression, or low-pressure system. Examples of (c) were discussed only by one user from the marine sector. In the case of (b), to date, these winds have not been discussed explicitly by users. However, there are several relevant local winds in Europe, including bora (Adriatic region) and mistral (France). These winds affect particular regions of Europe, and in some cases are seasonal. Their existence relates to the common presence of particular synoptic-scale features over different parts of Europe. For example, the mistral occurs when high pressure sits over the Bay of Biscay and low pressure over the Gulf of Genoa.
3.2.3.2.3 Added value of global high resolution For (a), see the analogous description for precipitation in Section 4.2.3.1.3. For (b), it is possible that PRIMAVERA could add value, if the enhanced resolution results in the relevant synoptic-scale features being better represented in the models. For (c), it is unlikely that PRIMAVERA could add value, as these smaller-scale features will not be resolved even by the Stream 2 models.
3.2.3.2.4 Knowledge utilisation As before, what can be provided to users will depends on their level of technical capability. For the less technical user, processed outputs could include:
• An exploration of natural variability in relation to winds – e.g. wind scenarios under particular phases of modes of variability like AMO and NAO (though the concept of modes of variability may need to be explained for some)
• Changes to wind speed threshold exceedance • Changes to wind direction • Extratropical cyclone footprints (see Section 4.3.3)
Again, the UIP could be used for initial dissemination, or workshops could be used to allow iterative feedback between PRIMAVERA scientists and the relevant users. Reports could also be provided.
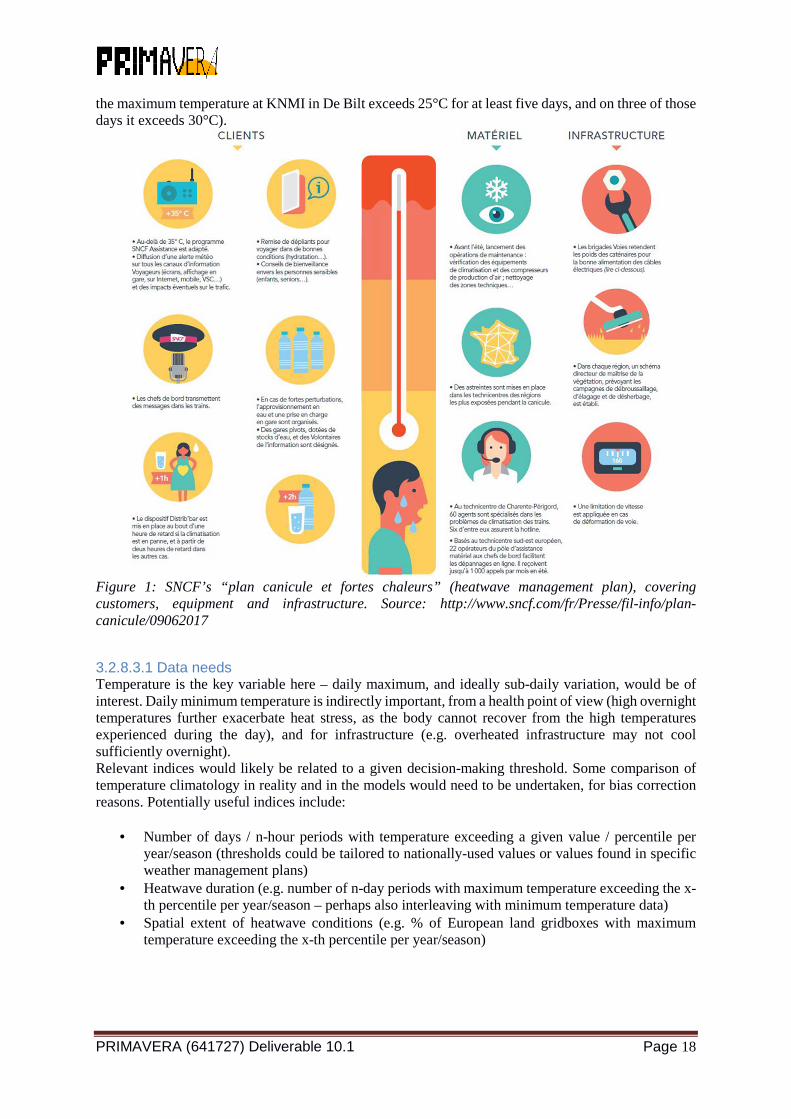
3.2.8.3 Use case 3: transport operations during hot weather High temperatures were largely discussed by aviation and land transport users; however, they are of wider relevance to transport in general, because they can put at risk the wellbeing of passengers and staff. In addition, temperature is one of the best-studied aspects of future climate change, enhancing people’s awareness of the impacts of extremes of temperature (both high and low). The urban heat island results in higher exposure to this hazard for the urban transport network: subway systems are known to become extremely hot even during ordinary summer conditions in some cities. The exposure is further increased by the high concentrations of people in urban areas. Many transport organisations have heatwave management plans (see example in Figure 1) and some of these contain particular temperature thresholds for action. Alternatively, there may be heatwave definitions that are applied regardless of the sector (e.g. in the Netherlands, a heat wave is declared if
PRIMAVERA (641727) Deliverable 10.1 Page 18
the maximum temperature at KNMI in De Bilt exceeds 25°C for at least five days, and on three of those days it exceeds 30°C).
Figure 1: SNCF’s “plan canicule et fortes chaleurs” (heatwave management plan), covering customers, equipment and infrastructure. Source: http://www.sncf.com/fr/Presse/fil-info/plan-canicule/09062017
3.2.8.3.1 Data needs Temperature is the key variable here – daily maximum, and ideally sub-daily variation, would be of interest. Daily minimum temperature is indirectly important, from a health point of view (high overnight temperatures further exacerbate heat stress, as the body cannot recover from the high temperatures experienced during the day), and for infrastructure (e.g. overheated infrastructure may not cool sufficiently overnight). Relevant indices would likely be related to a given decision-making threshold. Some comparison of temperature climatology in reality and in the models would need to be undertaken, for bias correction reasons. Potentially useful indices include:
• Number of days / n-hour periods with temperature exceeding a given value / percentile per year/season (thresholds could be tailored to nationally-used values or values found in specific weather management plans)
• Heatwave duration (e.g. number of n-day periods with maximum temperature exceeding the x-th percentile per year/season – perhaps also interleaving with minimum temperature data)
• Spatial extent of heatwave conditions (e.g. % of European land gridboxes with maximum temperature exceeding the x-th percentile per year/season)
PRIMAVERA (641727) Deliverable 10.1 Page 19
3.2.8.3.2 Process description Anticyclonic (high-pressure) conditions over Europe usually result in warmer weather in summer. They are typically associated with calm conditions (so there is no wind to provide a cooling effect), and with relatively little clouds (allowing the land to be directly heated by the sun). Additionally, the circulation pattern can drag already-warm tropical continental air northwards. All of these things contribute to elevated temperatures experienced at the surface. During the European heatwave of 2003 a high-pressure area was present over much of Western Europe, while in the 2006 European heatwave, the high was located over Northern Europe. As a result, the affected countries were slightly different in each case. Dry soils can also amplify the surface warming; this was a factor in the 2003 heatwave (Fischer et al. 2007). Anticyclones are commonly called “blocking highs” as they “block” the more usual passage of low-pressure systems associated with the North Atlantic storm track.
3.2.8.3.3 Added value of global high resolution There is evidence that increased horizontal resolution improves the representation of blocking in climate models, though studies over Europe have largely focused on the winter season (e.g. Berckmans et al. 2013). Additionally, the higher resolution (both spatial and temporal) should allow for more realistic representation of extreme temperatures – assuming the representation of the underlying processes is sufficiently enhanced with respect to pre-PRIMAVERA models.
3.2.8.3.4 Knowledge utilisation As before, what can be provided to users will depend on their level of technical capability. For the less technical user, processed outputs could include:
• Changes to temperature threshold exceedance (mapped/graphed), perhaps translated into locally-relevant information � This would require knowledge of the locally-relevant thresholds of relevance, e.g. at a
national / regional scale (like those quoted for the Netherlands above), or within a particular transport subsector
• Changes to spatial extent / duration of heatwaves (mapped) and a comparison with similar metrics in pre-PRIMAVERA models
As before, the main methods for dissemination could be reports, graphs/maps via the UIP, or workshop discussions.
3.3. Finance and insurance
3.3.1 Sector characterisation Extreme weather events are a major source of insured losses across the globe. Insurers (and re-insurers who provide insurance for primary insurers) are therefore vulnerable to having to make huge pay-outs when such an event occurs. They need to be confident that they have the capital to withstand such pay-outs, and hence analysing the risk posed by extreme weather is a very important part of their work. The participants for the interviews conducted for Deliverable 11.6 were from (re-)-insurance companies, risk modelling/consultancy companies specialising in (re-)insurance clients, and one regulatory organisation. Over Europe, by far the largest concerns for the interviewees were wind storms and flooding, since these are the highest loss hazards covered by property insurance policies. In fact, according to the Swiss Re publication, Sigma (2016), since 1970, six of the seven highest insurance loss events over Europe were due to wind storms and flooding, with the highest loss event being wind storm Vivian in February 1990 (loss of 14.5bn USD at 2016 index). The interviewees appeared to be
PRIMAVERA (641727) Deliverable 10.1 Page 20
more divided on the importance of the other weather hazards, although notable large insurance loss events for landslips and frost were mentioned. By understanding the risk posed by extreme weather, (re-)insurance companies can be better informed about how to price their policies and whether it is wise to take on new customers in certain areas. Several interviewees also mentioned the European Solvency II regulation, that requires that insurance companies hold enough capital to withstand the losses of a 1 in 200 year event. For weather events such as those mentioned above, estimating the risks and losses requires a thorough knowledge of the long term variability of the event, and how it may respond to climate change.
3.3.2 Added value of global high resolution A common technique in the (re-)insurance industry is catastrophe modelling. In such models, the insured losses due to a particular hazard are estimated by combining the hazard footprint (for example, a map of maximum gusts associated with a particular windstorm), with the clients’ exposure and policy data. The models can be run using a single event footprint (e.g. a notable past event or plausible extreme future event), which can be useful for verifying the catastrophe model or understanding the vulnerability of the insurer, or an event set – a set of thousands of event footprints – to estimate large return period losses as required by Solvency II. Due to the lack of past observational data, event set footprints must be constructed either using statistical models or climate model data. For European wind storms (which are associated with extra-tropical cyclones, ETCs), often low spatial resolution climate models are currently used due to computing constraints. These models tend to simulate ETCs which are too low in intensity, and a storm track which is too zonal, meaning that the ETCs impact Europe further south than observed (Zappa et al, 2013). Some higher resolution models, however, have been found to improve these biases. In addition, higher resolution is expected to better resolve smaller scale extreme features, such as sting jets or sting jet precursors. The high resolution PRIMAVERA models will therefore be very useful for providing a basis for creating an event set, and improving assessments of the risk posed by ETCs. Extreme frontal rainfall associated with ETCs can also be a source of flooding, so in this respect PRIMAVERA offers the same benefits for analysing larger scale flood risk as for wind storms. Another source of flooding is convection, however, which needs a spatial resolution of less than approximately 5 km to be resolved (Clark et al., 2016). Instead, in climate models researchers look at the larger scale atmospheric environments favourable to convective storm generation, such as high convective available potential energy (CAPE) (Diffenbaugh et al 2013). With the high resolution of PRIMAVERA models, it is expected that the spatial variability of these proxy measures will improve, giving a better understanding of convective storm and flood risk.
3.3.3 Specific users and their requirements As mentioned above, PRIMAVERA model data could be used to construct wind and flood event sets for use in catastrophe modelling. The interviewees were most concerned with present day risk, and by combining the Stream 1 present day realizations, there will be hundreds of years of plausible present day wind and flood events, complementing observational data over this period. The current observational data is insufficient for calculating long return period losses. Some of the interviewees mentioned that even having a set of only the top 50-100 wind/flood footprints seen in the climate models would be useful for stress testing their catastrophe models. Since hazard footprints and event sets are currently mostly made by catastrophe modelling companies who cannot publish their methods, a few interviewees mentioned that having an independent, fully documented and transparent event set would be very beneficial. Other requests from the interviewees included using the data to study whether the perceived decrease in extreme wind storms/southern shift in the storm track since the year 2000 is due to natural variability or climate change. A comparison between the multi-model present day and control simulations from PRIMAVERA would help answer this question. Also of interest was the correlation between extreme rainfall and high wind speed in the models, and using the data to look further into the statistics of the temporal clustering of wind storms.
PRIMAVERA (641727) Deliverable 10.1 Page 21
The above questions relate to present day analysis, but with regards to climate change the following analyses were requested:
• A comparison of present day and future event sets/extreme hazard footprints • A comparison of future and present day hazard maps (maps of long return period, e.g. 50-200
year, wind/gust speeds and rainfall) • Comparison of future and present day storm tracks • One company mentioned a comparison of future and present day expected number of days
below -4 C which is relevant to pipe freezing All the interviewees stated that any analysis performed would have to be fully documented, and that documentation on the PRIMAVERA models themselves, including information on their limitations and assumptions, would be needed. Many interviewees also mentioned workshops would be useful, to inform users about what information is available and in what formats, and if necessary how to convert between data formats. Overall, there was much enthusiasm for the information PRIMAVERA could provide for the (re-)insurance industry, although it will be essential to work closely with the industry to ensure the analysis performed is usable for them and that they are aware of what information will be available.
3.3.4 Use cases 3.3.4.1 Use case 1: Construction of wind storm even t sets An event set is a large number of hazard footprints (maps of maximum intensity for a particular hazard event), preferably containing enough footprints to understand variability of the hazard over hundreds to thousands of years. The PRIMAVERA simulations can be `mined' for wind storm events to generate such a database. The resulting event set can be used as inputs to insurers' catastrophe models, as well as being useful for scientific studies such as whether event set characteristics (for example mean intensity of events) change under future climate conditions. It may also be possible to construct a similar event set for flooding caused by large-scale (frontal) rainfall.
3.3.4.1.1 Data needs For wind storms, a footprint is typically defined as the maximum 3-s gust over a 72-hour period. Maximum 10 m wind speed can also be used and converted to 3-s gusts using statistical methods if necessary. Maximum gust speeds/10 m wind speeds output daily is the minimum requirement, although 6-hourly data is preferable. In order to identify the storms, a storm tracking algorithm must be applied to the data, which is being done under WP2. For flooding, the resolution of PRIMAVERA models is not yet high enough to be convection permitting, but it may be possible to make an event set for flooding due to large scale precipitation. Here daily (but preferably 6-hourly) accumulated large-scale rainfall is required. The resulting output will be a set of wind storm/flood footprints, with each footprint being a small data file containing hazard intensity as a function of position, and the 'time' the event occurred will be given in the metadata or file name. Event sets can be produced for present day and future climate.
3.3.4.1.2 Process description European wind storms and large scale flooding in winter are caused by synoptic-scale low-pressure systems known as extra-tropical cyclones (ETCs). They form by a process called cyclogenesis, growing from instabilities in zones of strong temperature contrast (baroclinic instabilities) where there is much potential energy available (Seneviratne et al. 2012). The ETCs that affect Europe generally form off the east coast of the USA and travel eastwards along the North Atlantic storm track. Intensification of ETCs can take place through latent heat release during their journey (Willison et al 2013). Models are required to realistically simulate cyclogenesis and the path of the storm track, as well as simulating realistic wind/gust speeds and rainfall associated with each cyclone.
PRIMAVERA (641727) Deliverable 10.1 Page 22
3.3.4.1.3 Added value of high resolution As mentioned in section 4.3.1, high resolution models are better able to simulate the location of the north Atlantic storm track. In addition, the frequency and timing of events must be well simulated. For this, processes such as blocking (which can change prevent ETCs reaching Europe) must be well captured, and it is known that this improves with resolution (see Section 3.2). In terms of ETC intensity, high resolution is necessary to resolve the mesoscale features that are associated intense precipitation and latent heat release which act to intensify the cyclones (Willison et al 2013).
3.3.4.1.4 Knowledge utilisation Ideally the event sets can be shared with insurance companies for input into their catastrophe models, to allow a full assessment of the insured losses expected from storms in the PRIMAVERA models. As data volumes are not expected to be too large, this could possibly be done via the PRIMAVERA UIP. If it is not possible to share all the data, even sharing the top 100 most severe events (for present and future climate) would be useful for insurers to stress test their models. Alternatively, the event sets could be shared with selected (re-)insurance companies who would be willing to test the data and share the results from their catastrophe models, and jointly write a report/fact sheet to be made available on the UIP. Summary statistics and scientific findings from the event sets (such as whether footprint intensities or areas are expected to change in the future, or comparisons of PRIMAVERA event footprints to observational ones) can be presented on the UIP either as a webpage or downloadable report. Many (re-)insurance users expressed interest in attending workshops or webinars, which would be useful for raising awareness of the event sets (if data sharing is permitted), or the results.
3.3.4.2 Use case 2: Comparison of present day and f uture extra-tropical cyclones In this use case we plan to compare several properties of extra-tropical cyclones in present day and future climate. Properties compared could include:
1. The mean location of the North Atlantic storm track. 2. The distribution of cyclone intensity over various locations in Europe, as measured by
maximum winds, maximum vorticity and minimum mean sea level pressure. 3. Temporal clustering of ETCs. 4. Large-scale rainfall associated with ETCs. 5. Maps of long return period (50-200yr) maximum wind speeds/gusts and accumulated rainfall
(hazard maps). 6.
3.3.4.2.1 Data needs Items 1-4 above all require storm tracks to be identified within the models. As part of WP2 of PRIMAVERA, all models will be tracked using the TRACK algorithm (Hodges 1995) TRACK requires a minimum of 12 hourly U and V wind components at 850hPa, but 6 hourly data is preferable. For items 2 and 4, 6 or 12 hourly mean sea level pressure, accumulated large scale rainfall and mean/maximum/instantaneous winds at the surface or a low pressure level such as 925hPa are required. For item 5, it is preferable to have maximum 6 hourly to daily wind speeds.
3.3.4.2.2 Process description See Section 3.1.3.1.2.
3.3.4.2.3 Added value of global high resolution See Section 3.1.3.1.3.
PRIMAVERA (641727) Deliverable 10.1 Page 23
3.3.4.2.4 Knowledge utilisation The results can be written up as a report/factsheet and made available through the PRIMAVERA UIP. The hazard maps can be shown on the UIP, although it will be desirable for the industry to access the actual data values behind the images. As in 4.3.3.1.4, awareness of these new results could be raised through webinars/workshops.
3.4 Sector: Agriculture
3.4.1 Sector characterisation and impact of climate change Agricultural production is intimately linked with meteorological conditions, and therefore with the state of the climate system. Growth of plants depends on temperature, radiation, water availability (precipitation), and evapotranspiration (humidity, wind speed, temperature, and radiation). Climatic change has demonstratively affected crop production in several regions of the world over the past decades. Also, non-physical elements of agricultural production are potentially affected by climate change, including food prices and food access. Climate change will impact food production directly through, for instance, rising temperatures and increased atmospheric moisture demand, changes in precipitation, increasing atmospheric carbon dioxide concentration, and flooding of coastal or river plains. Different measures of temperature have been linked to crop yields and quality, including high daytime temperatures, unusually hot nights, and frost. Also, in many regions climate change is expected to increase the interannual variability of crop yields through the year-to-year variability in precipitation, extreme temperatures, and other extreme meteorological events that may harm the yields (e.g. hail or excessive rainfall). Furthermore, the costs and benefits of climate change on food production are strongly latitude dependent. Low-latitude countries will likely experience a negative impact on crop production, while in some northern countries the climate change impact on crop production might be positive due to the higher temperatures. This will increase the potential growing season, although some crop types may have shorter actual growing seasons due to the higher temperatures.
3.4.2 Specific users and their requirements Policy makers at the national, European or international level may be interested in the impact of climate change on agriculture. They could ask questions such as: Which regions are affected more or less by climate change? What is the potential impact of climate change on production of specific crops and how may this affect food security in Europe? Specific companies (agricultural production, financing, etc.) may be interested more specifically in questions such as: When turn conditions for a specific crop/cultivar unsuitable and when should other crops/cultivars be considered? Is it profitable to move production to another region, and for how long? What are the risks of extremes and will they change substantially in the near future? Which regions will become suitable for a certain crop/cultivar with climatic change? What is the chance of consecutive years with adverse conditions for crop production and will this change in the future? Within PRIMAVERA, we aim to collaborate with research groups that work on the impacts of climate change on agriculture and food security. They often have regular contact with interest groups of e.g. farmers and they know the type of information that is of interest to users. Also, the spatial scales that are used in those studies are comparable to the output of the PRIMAVERA high-resolution simulations. In this way, we expect that our understanding of the impacts of future climate change on agriculture and food security can be improved, which could help make the agricultural sector more resilient to climate change.
PRIMAVERA (641727) Deliverable 10.1 Page 24
3.4.3 Use cases 3.4.3.1 Use case: Impact of heat waves and droughts on crop production The first use case focuses on central European heat waves and droughts in a warmer climate and their effects on crop yields. The goal is to provide a perspective on what high-resolution climate models might add to existing CMIP5-based climate change information. The information is targeted to be relevant for assessment of impacts of heat waves and droughts on crop loss. Specifically, heat wave and drought intensity, duration, spatial extent, and frequency will be focused on. This use case describes the added value of using high-resolution (typical grid spacing of 0.25 degrees) Global Climate Models over the earlier CMIP5 models which had a considerably lower spatial resolution. Because of the global character of these models, the expectation is that large-scale features in the atmospheric circulation, like persistent blockings, are modelled more robustly and trustworthy. The feedback between soils and atmosphere, typical for the development of the more extreme heat waves, should be modelled more realistically as well. A brief summary of the mechanism involved which leads to a (mega) heat wave and related drought is given and the expectation of the added-value of high-resolution modelling is formulated in par. 4.4.3.1.2 and 4.4.3.1.3. The final use case report focusses on climate indices that capture the impact of heat waves and droughts on the agricultural sector in central Europe and will include a selection of the following options:
• For the Netherlands a large number of climate indices is developed for a large number of crops that give an indication of the vulnerability of crops to climate. The indices take into account the relevant climate variables but also the timing (crops may be more vulnerable to high temperatures during flowering than during other crop stages). There are indices that are related to high temperatures but also to drought (which is often combined with heat). We are not aware of the availability of these indices for other regions in Europe, so this would be a use case for the Netherlands only.
• The exceedance of specific threshold temperatures for e.g. wheat growth could be investigated for a wider region. The following article mentions that temperatures above 40C are harmful (Iqbal et al, 2017), but more specific information on thresholds for specific cultivars can probably be obtained from the impact researchers.
• More general indices for heat and drought in the ECA&D database (http://www.ecad.eu/indicesextremes/indicesdictionary.php#3) can be used, but they are less focused on crop production. The following indices are most relevant for agriculture: maximum number of consecutive dry days (CDD), potential evapotranspiration (PET; is also clearly higher when temperature and radiation are clearly higher), and maybe also one of the standardized precipitation indexes. However, they are computed over rather long periods and therefore probably less connected to heat. Indices defined by the ECCl/CLIVAR/JCOMM Expert Team on Climate Change Detection and Indices (ETCCD) are also included in this database.
• For agricultural production it is also important to look at the timing within the year of the heat or drought stress. This timing is included already in the indices mentioned under bullet 1, but it can be included also easily in the use case under bullet 2.
• With the above indices it would be interesting to investigate the length of the heat period, the spatial extend , the intensity and the frequency, and it can be investigated whether the high resolution modelling will give added value/different projections.
3.4.3.1.1 Data needs The growth of plants depends on temperature, radiation, water availability (precipitation), and evapotranspiration (humidity, wind speed, temperature, and radiation) which are provided by the climate models at sufficiently high temporal resolution. Simulations of the set of models provided to the Primavera project are used for this study. All models span the period 1950-2050, using the historic forcing to 2015, and future forcings similar to the RCP4.5 scenario to 2050.
PRIMAVERA (641727) Deliverable 10.1 Page 25
For the models at the two resolutions, the provided variables include near surface (2m) daily maximum and minimum temperature, humidity, incoming surface solar and infrared radiation, near surface (10m) wind speed, solid and liquid precipitation, and soil moisture. The variables are used to analyse mechanisms underlying heat extremes and to produce related indices relevant for agriculture. Present-day simulations will be validated with precipitation and observations of near-surface air temperature of the ECA&D dataset.
3.4.3.1.2 Process description A heat wave is usually described as a period of abnormally and uncomfortably hot weather. Its definition is dependent on the background climate and therefore region-specific. The atmospheric circulation has a strong role in the onset and the perpetuation of a heat wave. As summertime weather patterns are generally slower to change than in winter, heat waves can develop by advecting warm air northward to usually cooler regions. Alternatively, a heat wave is triggered by an upper level high pressure system in the atmosphere which is stagnant or moves slowly. Under high pressure, the air subsides (sinks) toward the surface, warming and drying adiabatically. This warmer sinking air creates a high level inversion that acts as a dome capping the atmosphere. Under the cloudless skies that go with this phenomenon, convection is inhibited (preventing cooling of the earth surface) and trapping warm air below it. The strong radiation and the lack of rain make that the soils are depleted from moisture quickly. Once the soils start to dry, the heat balance (where incoming solar radiation is balanced mostly by outgoing latent) shifts to one where the solar radiation is balanced by the sensible heat flux. This latter flux relates directly to the temperature of the earth surface and a balance sets-in only after the surface temperature has sufficiently increased. The end result is a continual build-up of heat at the surface that people experience as a heat wave. The record-breaking 2010 Russian heat wave was related to this mechanism.
3.4.3.1.3 Added value of global high resolution As the large-scale atmospheric circulation is leading in setting-up a heat wave, a correct representation of the large-scale atmospheric circulation is relevant for a realistic estimate of changes in heat wave occurrence and duration. Especially for the so-called blocking events which are associated with the slow moving or stagnant high-pressure systems which provide the persistently dry, hot and sunny weather leading to the heat wave. The onset (and termination) of blocking events are controlled by complex processes in the atmosphere and the expectation is that a high-resolution model is better able to represent these processes, which suggests that high-resolution models may provide other estimates of the frequency and persistence of blocking events in comparison with low-resolution models. In addition, processes like the interaction between the soils and the atmosphere typically have spatial scales that are smaller than the size of the grid box. For these processes, we expect smaller grid sizes (~high-resolution) to provide more realistic estimates.
3.4.3.1.4 Knowledge utilisation A report describing the data, the methods for data production, and results with conclusions will be provided to the agricultural users through the Primavera web site (https://www.primavera-h2020.eu/).
3.5. Sector: Health
3.5.1 Sector characterisations Health is one of the basic human needs. According to the World Health Organization, climate change may bring certain benefits to temperate climates, such as less deaths related to cold temperatures in winter, but the net effect is likely to be negative (WHO/WMO, 2012). Climate change affects the social and environmental determinants of health which are clean air, safe drinking water, sufficient food, and secure shelter.
PRIMAVERA (641727) Deliverable 10.1 Page 26
Extreme heat: Very high temperatures are related to a increased mortality by cardiovascular and respiratory diseases, especially among vulnerable population like elderly people. A well-known example are the 70000 excess deaths recorded during the 2003 heatwave in Europe. Urban heat islands are a factor in many urban settlements: temperatures measured in- and outside urban areas can vary by several degrees. This effect is highest during the nights. Extreme high temperatures also affect the air quality by increasing the levels of ozone and other pollutants. Pollen and other aeroallergen effects tend also to be higher in extreme heat conditions, and can trigger asthma. Natural disasters and variations in rainfall patterns: Though the future changes of rainfall patterns are uncertain, they are very likely to affect the supply of fresh water in several regions. The lack of clean water may favor the risk of diarrhoeal disease. In extreme cases the lack of rainfall may lead to drought and famine. Sea level rise poses also threats to the population living close to the sea. In several regions, flood intensity and/or frequency may also increase, threatening freshwater supplies and increasing the risk of spreading of infectious diseases. Infectious diseases: As the world warms, the transmission and activity seasons of several diseases are likely to lengthen, and also their geographic range. This includes Anopheles and Aedes mosquitoes transmitting malaria and dengue. Waterborne diseases are also a threat in areas where water supply and security is to be affected by eventual drought.
3.5.2 Specific users and their requirements Policy makers at the national, European or international level may be interested in the relation between climate change and health. They could ask questions such as: Which regions are affected more or less by climate change? What is the potential impact of climate change on outdoor activities for leisure or employment? Which existing diseases will extend their range to areas that are currently unaffected? What is the adaptive capacity of certain regions under high levels of warming? What changes in housing and infrastructure should be made to adapt to climate change? Specific organizations, such as health agencies or companies, may be interested more specifically in questions such as: What are the risks of extremes and will they change substantially in the near future? Where and when will temperature exceed citizen’s comfort? Which temperature thresholds are likely to change human behaviour? Within PRIMAVERA, we aim to collaborate with research groups that work on the impacts of climate change on health. Research groups typically have experience with the type of information that is of interest to users, such as local health agencies. In this way, we expect that our understanding of the impacts of future climate change on health can be improved, which would make the health sector more resilient to climate change.
3.5.3 Use cases 3.5.3.1 Use case: future changes in heat waves The first use case focuses on European heat waves in a warmer climate and their effects on health. The goal is to provide a perspective on what high-resolution climate models might add to existing CMIP5-based climate change information. The information is targeted to a be relevant for assessment of impacts of heat on health (heat stress, mortality, or something similar). Specifically, heat wave intensity, duration, spatial extent, and frequency will be focused on. This use case describes the added value of using high-resolution (typical grid spacing of 0.25˚). Global Climate Models over the earlier CMIP5 models which had a considerably lower spatial resolution. Because of the global character of these models, the expectation is that large-scale features in the atmospheric circulation, like persistent blockings, are modelled more robustly and trustworthy. The feedback between soils and atmosphere, typical for the development of the more extreme heat waves,
PRIMAVERA (641727) Deliverable 10.1 Page 27
should be modelled more realistically as well. This report focusses on the impact of heat waves on health in Europe. A brief summary of the mechanism involved which lead to a (mega) heat wave is given and the expectation of the added-value of high-resolution modelling is formulated in par. 4.5.3.1.2 and 4.5.3.1.3. For the use cases the following options are available:
• In the ECA&D database the several indices are mentioned for heat. The following are probably the most interesting for looking at human heat stress: tropical nights (TR), maximum yearly maximum temperature (TXx), maximum number of consecutive summer days (CSU). Furthermore, the number of tropical days (days with Tmax of 30˚C or more) and maybe also the Cooling Degree days (cumulative degrees above a certain temperature; as a measure above which cooling is required/where people get heat stress) could be added. (indices defined by the ECCl/CLIVAR/JCOMM Expert Team on Climate Change Detection and Indices (ETCCD) are also included in this database).
• Related to health is the Tourism Comfort index. This is a variable that is a combination of at least temperature and humidity (and sometimes more). Changes in this index in several regions, and especially the frequency of uncomfortably high temperatures and the length of these periods in different regions of Europe could be investigated (Dubois et al., 2016).
• With the above indices it would be interesting to investigate the length of the heat period, the spatial extend , the intensity and the frequency, and it can be investigated whether the high resolution modelling will give added value/different projections.
3.5.3.1.1 Data needs To determine the impact of heat on health, information on maximum and minimum temperatures is needed. However the impact of high temperatures is also affected by humidity, the exposure to direct radiation and wind. High temperature with low humidity and a lot of wind, causes less heat stress than the same high temperatures combined with high humidity and/or hardly any wind. Simulations of the set of models provided to the Primavera project are used for this study. All models span the period 1950-2050, using the historic forcing to 2012, and future forcings defined by the RCP4.5 scenario (or similar) to 2050. For the models at the two resolutions, the provided variables include near surface (2m), daily maximum and minimum temperature, and humidity, incoming surface solar and infrared radiation, near surface (10m) wind speed, and solid and liquid precipitation. The variables will be used to produce indices of extremes relevant for health and related to heat (see above). These indices are defined by the ECCl/CLIVAR/JCOMM Expert Team on Climate Change Detection and Indices (ETCCD)
3.5.3.1.2 Process description See Section 4.3.3.1.3.
3.5.3.1.3 Added value of global high resolution See Section 4.3.3.1.3.
3.5.3.1.4 Knowledge utilisation A report describing the data, the methods for data production, and results with conclusions will be provided to the health users through the Primavera website (https://www.primavera-h2020.eu/). This report will include projections for future changes and related uncertainties.
PRIMAVERA (641727) Deliverable 10.1 Page 28
3.6 Sector: Water 3.6.1 Sector characterisations The hydrological sector is sensitive to many different meteorological conditions in many different ways, which could be divided in the following groups: Resource allocation, Risk management, Ecological status, and Water related industry. Resource allocation deals mainly with water availability. The important factors are the long term changes and variability of temperature, precipitation, evaporation, and snow amount. A changing climate increases the need for water management. Risk management deals with flash-floods and extreme river floods. For evaluation, rainfall time series are useful. These in combination with projections of future precipitation changes (especially extremes) can be used to calculate the risk of flooding. For river flows there is also a need for estimates of river discharge. Ecological status is both biological status and water quality. Important factors are lake temperature and stratification, ice cover, and precipitation. Lake models are used to calculate nutrient flow, stratification etc. Water related industries could be as diverse as industries with a large need of water, hydro power production and the drinking water itself. Important factors are mean and extreme precipitation and snow cover.
3.6.2 Specific users and their requirements Hydro power companies are interested in the change in average precipitation, but also how the precipitation dynamics over a year may change. For example, if the precipitation is distributed differently over the year in can have an impact on how hydro power dams are filled, even if the accumulated annual precipitation is the same. Mean temperature is also of importance since the length of the snow season and timing of snow melt effects water reservoirs. Regarding water security, long term changes in average precipitation are interesting since it affects the availability of water, in wet as well as dry periods. Extreme precipitation is also interesting since compromised water security often is connected to flooding. Water managers are especially interested in extreme precipitation, both on shorter scale (hours) and longer (days to weeks). A typical question is “how vulnerable is a region to flash floods and rising stream flows?”
3.6.3 Use cases 3.6.3.1 Use case 1: Extreme precipitation Extreme precipitation affects many parts of society (e.g. urban flooding and agriculture). Extreme precipitation is also something that we know will change in a different way than the mean precipitation (Collins et al., 2013) and something that we know is highly dependent on model resolution (e.g. Lind et al. 2016). To be able to adapt to future changes in extreme precipitation we need models that can capture these small scale features. The goal is to show if high resolution models better capture extreme precipitation and how high the resolution needs to be to give new information compared to standard resolution models; and also to investigate how extreme precipitation will change in the future.
3.6.3.1.1 Data needs We will need precipitation data with high temporal resolution (preferably sub-daily). An interesting index could be number of days with precipitation above a certain threshold, defined in mm or compared to a certain percentile. All data is needed in both standard and high horizontal resolution, to enable
PRIMAVERA (641727) Deliverable 10.1 Page 29
comparisons. To compare resolutions data from the recent period is enough, for future changes data for the future is also needed.
3.6.3.1.2 Process description A well-known source of error for the simulation of precipitation in numerical models is the parameterization of convection (e.g. Hohenegger and Stevens 2013). Individual moist convective updrafts and downdrafts have horizontal dimensions on the order of 0.1–10km. Their role in restabilizing the lower atmosphere through production of clouds and precipitation are critical for a correct and physically sound representation of weather and climate. In large-scale models with mesh-grid sizes of 100 km the statistical effects of convection on the grid scale are parameterized, but because of this, the convection scheme usually struggles to capture local and regional interactions (e.g., orographically forced convection in steep topography) as well as the detailed temporal evolution of convection at sub-daily time scales (e.g. Dai 2006).
3.6.3.1.3 Added value of global high resolution The added value of global high resolution is not entirely clear. It is clear that high horizontal resolution adds value; in that sense there is a value of high global resolution. If the global model data is used in a regional model of high resolution the added value is less clear. It is clear however that the large scale precipitation in regional models to a large degree is governed by the general circulation of the driving global model (e.g. Kjellström et al., 2011). If the global model by higher resolution has an improved circulation it will be beneficial also for the regional simulation. This effect is more important to large scale precipitation, but could potentially also affect local precipitation.
3.6.3.1.4 Knowledge utilisation Results should be reported back to the users primarily as reports answering questions on how well climate models represent extreme precipitation and what the uncertainties are in model projections for the future. Information should also be given about how this is projected to change in the future. Some data could also be delivered about precipitation changes for the users to use themselves in their own applications.
3.6.3.2 Use case 2: Seasonal precipitation dynamics For fresh water management, hydro power and agriculture amongst others, it is not only interesting to know how the accumulated precipitation will change but also if the distribution of precipitation over the year and between years will change (i.e. inter and intra annual variability). It is also interesting to know how much of the precipitation that falls as snow. Sometimes it is assumed that the mean value changes, but that the variability remains the same; this is not necessarily the case (e.g. Räisänen, 2002). The goal is to answer questions about future changes in precipitation dynamics.
3.6.3.2.1 Data needs We will need daily precipitation and temperature data; if possible also snow fall data. Interesting indices could be seven day precipitation amount, longest dry period.
3.6.3.2.2 Process description European large scale precipitation is to a large degree governed by the large scale atmospheric circulation. At the same time there are large uncertainties in how the general circulation will change over the North Atlantic in the future and how that will affect Europe (e.g. Collins et al., 2013; Kovats et al., 2014).
PRIMAVERA (641727) Deliverable 10.1 Page 30
3.6.3.2.3 Added value of global high resolution It is clear that the large scale precipitation in regional models to a large degree is governed by the general circulation of the driving global model (e.g. Kjellström et al., 2011). If the global model by higher resolution has an improved circulation it will be beneficial for the simulated precipitation; also in possible subsequent regional simulations.
3.6.3.2.4 Knowledge utilisation Results should be reported back to the users primarily as reports answering questions on how precipitation dynamics will change in the future, how well climate models represent precipitation and what the uncertainties are in model projections for the future. Some data could also be delivered about precipitation changes for the users to use themselves in their own applications. 4 References
Berckmans J., Woollings T., Demory M.-E., Vidale P.L., Roberts M. (2013) Atmospheric blocking in a high resolution climate model: influences of mean state, orography and eddy forcing. Atmospheric Science Letters 14, 34–40. doi:10.1002/asl2.412 Bloomfield, H. C., Brayshaw, D. J., Shaffrey, L. C., Coker, P. J. and Thornton, H. E. (2016) Quantifying the increasing sensitivity of power systems to climate variability. Environmental Research Letters, 11 (12). 124025. ISSN 1748-9326. https://doi.org/10.1088/1748-9326/11/12/124025 Clark, P., N. Roberts, H. Lean, S. P. Ballard, and C. Charlton-Perez, 2016: Convection-permitting models: a step-change in rainfall forecasting. Meteorol. Appl. 23: 165–181, doi:10.1002/met.1538 Collins, M., R. Knutti, J. Arblaster, J.-L. Dufresne, T. Fichefet, P. Friedlingstein, X. Gao, W.J. Gutowski, T. Johns, G. Krinner, M. Shongwe, C. Tebaldi, A.J. Weaver and M. Wehner, 2013: Long-term Climate Change: Projections, Commitments and Irreversibility. In: Climate Change 2013: The Physical Science Basis. Contribution of Working Group I to the Fifth Assessment Report of the Intergovernmental Panel on Climate Change [Stocker, T.F., D. Qin, G.-K. Plattner, M. Tignor, S.K. Allen, J. Boschung, A. Nauels, Y. Xia, V. Bex and P.M. Midgley (eds.)]. Cambridge University Press, Cambridge, United Kingdom and New York, NY, USA Dai, A., 2006: Precipitation characteristics in eighteen coupled climate models. J.Climate, 19, 4605–4630. Dubois, G., Ceron, J.P., Dubois, C. et al. Earth Perspectives (2016) 3: 2. https://doi.org/10.1186/s40322-016-0034-y e-Highway2050 (2015). D8.6a: Detailed enhanced methodology for long-term grid planning. Available at: http://www.e-highway2050.eu/results Fischer EM, Seneviratne SI, Vidale PL, Luethi D & Schaer C (2007) Soil moisture–atmosphere interactions during the 2003 European summer heat wave. Journal of Climate 20, 5081–5099. doi:10.1175/JCLI4288.1 Hodges, K. I.: Feature Tracking on the Unit Sphere, Mon. Weather Rev., 123, 3458–3465, 1995. Seneviratne, S.I., N. Nicholls, D. Easterling, C.M. Goodess, S. Kanae, J. Kossin, Y. Luo, J. Marengo, K. McInnes, M. Rahimi, M. Reichstein, A. Sorteberg, C. Vera, and X. Zhang, 2012: Changes in climate extremes and their impacts on the natural physical environment. In: Managing the Risks of Extreme Events and Disasters to Advance Climate Change Adaptation, A Special Report of Working Groups I and II of the Intergovernmental Panel on Climate Change (IPCC). Cambridge University Press, Cambridge, UK, and New York, NY, USA, pp. 109-230
PRIMAVERA (641727) Deliverable 10.1 Page 31
Hohenegger, C., and B. Stevens, 2013: Controls on and impacts of the diurnal cycle of deep convective precipitation. J. Adv.Model. Earth Syst., 5, 801–815. Iqbal M, Raja NI, Yasmeen F, Hussain M, Ejaz M, et al. (2017) Impacts of Heat Stress on Wheat: A Critical Review. Adv Crop Sci Tech 5:251. doi:10.4172/2329-8863.1000251 Kjellström, E., Nikulin, G., Hansson, U., Strandberg, G. and Ullerstig, A. 2011: 21st century changes in the European climate: uncertainties derived from an ensemble of regional climate model simulations. Tellus 63A. Kovats , R.S., R. Valentini, L.M. Bouwer, E. Georgopoulou, D. Jacob, E. Martin, M. Rounsevell, and J.-F. Soussana, 2014: Europe. In: Climate Change 2014: Impacts, Adaptation, and Vulnerability. Part B: Regional Aspects. Contribution of Working Group II to the Fifth Assessment Report of the Intergovernmental Panel on Climate Change [Barros, V.R., C.B. Field, D.J. Dokken, M.D. Mastrandrea, K.J. Mach, T.E. Bilir, M. Chatterjee, K.L. Ebi, Y.O. Estrada, R.C. Genova, B. Girma, E.S. Kissel, A.N. Levy, S. MacCracken, P.R. Mastrandrea, and L.L. White (eds.)]. Cambridge University Press, Cambridge, United Kingdom and New York, NY, USA, pp. 1267-1326. Lind, P., Lindstedt, D., Kjellström, E. and Jones, C., 2016: Spatial and Temporal Characteristics of Summer Precipitation over Central Europe in a Suite of High-Resolution Climate Models. Journal of Climate, 29, 3501-3518. Luderer, G., R. C. Pietzcker, S. Carrara, H. S. de Boer, S. Fujimori, N. Johnson, S. Mima, D.J. Arent, (2017) Assessment of wind and solar power in global low-carbon energy scenarios: An introduction. Energy Economics, Volume 64, May 2017, Pages 542-551. https://doi.org/10.1016/j.eneco.2017.03.027 Noah S. Diffenbaugh, Martin Scherer, and Robert J. Trapp, 2013: Robust increases in severe thunderstorm environments in response to greenhouse forcing, PNAS, 110 (41) 16361-16366, doi:10.1073/pnas.1307758110 Pöyry (2009) Impact of Intermittency: How Wind Variability Could Change the Shape of the British and Irish Electricity Markets. Available at: http://www.poyry.com/sites/default/files/impactofintermittencygbandi-july2009-energy.pdf Pöyry (2011) Analysing Technical Constraints to Renewable Generation to 2050. Available at: https://www.theccc.org.uk/archive/aws/Renewables%20Review/232_Report_Analysing%20the%20technical%20constraints%20on%20renewable%20generation_v8_0.pdf Räisänen, J. 2002: CO2-Induced Changes in Interannual Temperature and Precipitation Variability in 19 CMIP2 Experiments. Journal of Climate, 15, 2395-2411. Scaife, A. A., et al. (2014), Skillful long-range prediction of European and North American winters, Geophys. Res. Lett., 41, 2514–2519, doi:10.1002/2014GL059637 Sigma: No 2/2015: Natural catastrophes and man-made disasters in 2014: Convective and winter storms generate most losses, Tech. Rep., Swiss Reinsurance Company, 2015 Sigma: No 2/2017: Natural catastrophes and man-made disasters in 2016:A year of widespread damages, Tech. Rep., Swiss Reinsurance Company, 2017. Willison, J., W.A. Robinson, and G.M. Lackmann, 2013: The Importance of Resolving Mesoscale Latent Heating in the North Atlantic Storm Track. J. Atmos. Sci., 70, 2234–2250, https://doi.org/10.1175/JAS-D-12-0226.1 WHO/WMO, 2012: Atlas of health and climate. ISBN: 978 92 4 156452 6. p. 68.

PRIMAVERA (641727) Deliverable 10.1 Page 32
Zappa, G., L. C. Shaffrey, and K. I. Hodges, 2013: The Ability of CMIP5 Models to Simulate North Atlantic Extratropical Cyclones. J. Climate, 26, 5379–5396, doi: 10.1175/JCLI-D-12-00501.1