
Proceedings - Универзитет у Београду
482
Akademska misao Serbian Association for Geometry and Graphics Serbian Association for Geometry and Graphics 2016 The 5 International Scientific Conference on Geometry and Graphics The 5 International Scientific Conference on Geometry and Graphics th th Proceedings th th June 23 - 26 , Belgrade, Serbia
-
Upload
khangminh22 -
Category
Documents
-
view
2 -
download
0
Transcript of Proceedings - Универзитет у Београду

Akademska misao
Serbian Association for Geometry and GraphicsSerbian Association for Geometry and Graphics
2016
The 5 International Scientific Conference on Geometry and Graphics
The 5 International Scientific Conference on Geometry and Graphics
thth
Proceedings
th thJune 23 - 26 , Belgrade, Serbia
The 5th International Scientific Conference on Geometry and Graphics moNGeometrija 2016
PROCEEDINGS
June 23th – 26th 2016 Belgrade, Serbia
ISBN
Akademska misao Beograd 2016.
The 5th International Scientific Conference on Geometry and Graphics
MoNGeometrija 2016
Publishers Serbian Society for Geometry and Graphics (SUGIG) Faculty of Civil Engineering, University of Belgrade Akademska misao, Beograd
Title of Publication PROCEEDINGS
Editor-in-Chief Marija Obradović
Co-Editors Branislav Popkonstantinović Đorđe Đorđević
Graphic design Marijana Paunović Đorđe ĐorđevićMaja Petrović
Formatters Đorđe Đorđević Maja Petrović
Printing Akademska misao
Number of copies 100
ISBN
The 5th International scientific conference on Geometry and Graphics
MoNGeometrija 2016
Conference Organizers
Serbian Society of Geometry and Graphics (SUGIG)
Faculty of Civil Engineering, University of Belgrade
Co-organizers
Faculty of Architecture, University of Belgrade
Faculty of Mechanical Engineering, University of Belgrade
Faculty of Forestry, University of Belgrade
Faculty of Transport and Traffic Engineering, University of Belgrade
Faculty of Applied Arts, University of Arts in Belgrade
Under the auspicies of
Ministry of Education, Science and Technological Development of Republic of Serbia

Scientific Committee:
Hellmuth Stachel - Austria Gunter Weiss - Germany Milena Stavric - Austria Albert Wiltsche - Austria Sonja Gorjanc - Croatia Ema Jurkin - Croatia Laszlo Voros - Hungary Sofija Sidorenko - Macedonia Carmen Marza - Romania Dirk Huylebrouck - Belgium Naomi Ando - Japan Virgil Stanciu - Romania Emil Molnar - Hungary Marija Jevric - Montenegro Daniel Lordick - Germany Svetlana Shambina - Russia Olga Timcenko - Denmark Vera Viana - Portugal Viktor Mileikovskyi - Ukraine Risto Tashevski - Macedonia Radovan Štulić - Serbia Branislav Popkonstantinović - Serbia Ratko Obradović - Serbia Ljubica Velimirović - Serbia Ljiljana Petruševski - Serbia Biserka Marković - Serbia Marija Obradović - Serbia Branko Malešević - Serbia Aleksandar Čučaković - Serbia Vesna Stojaković - Serbia Sonja Krasić - Serbia Ljiljana Radović - Serbia Đorđe Đorđević - Serbia Slobodan Mišić - Serbia Magdalena Dragović - Serbia Gordana Đukanović - Serbia Zorana Jeli – Serbia

Organizing Committee:
Marija Obradović Branislav Popkonstantinović Slobodan Mišić Zorana Jeli Đorđe Đorđević Gordana Đukanović Ratko Obradović Aleksandar Čučaković Magdalena Dragović Maja Petrović Marijana Paunović Bojan Banjac Igor Kekeljević Miša Stojićević Emil Veg
Reviewers:
Prof. Radomir Mijailovic – Serbia Prof. Ratko Obradović – Serbia Prof. Branislav Popkonstantinović – Serbia Prof. Radovan Štulić – Serbia Associate Prof. Aleksandar Čučaković – Serbia Associate Prof. Sonja Krasić – Serbia Associate Prof. Branko Malešević – Serbia Associate Prof. Carmen Marza – Romania Associate Prof. Marija Obradović – Serbia Associate Prof. Ljiljana Radović – Serbia Ass. Prof. Magdalena Dragović – Serbia Ass. Prof. Đorđe Đorđević – Serbia Ass. Prof. Gordana Đukanović – Serbia Ass. Prof. Zorana Jeli – Serbia Ass. Prof. Slobodan Mišić – Serbia Ass. Prof. Dejana Nedučin – Serbia Ass. Prof. Milena Stavric – Austria Ass. Prof. Vesna Stojaković – Serbia Ass. Prof. Albert Wiltshe – Austria

7
TABLE OF CONTENTS
(alphabetically ordered by the Paper title)
TABLE OF CONTENTS ...................................................................................................................................... 7
LOCAL ORGANIZERS FOREWORD ............................................................................................................ 13
Zorana Jeli, Branislav Popkonstantinovic, Misa Stojicevic, Rasa Andrejevic, Ivana Cvetkovic:
3D ANALYSIS OF GEOMETRICAL FACTORS AND INFLUENCING OPPOSING AIR ARROUND SATELITE DISH ................................................................................................................................................ 14
Branislav Popkonstantinovic, Dragan Petrovic, Zorana Jeli, Misa Stojicevic:
A NEW APPROACH IN LECTURE DELIVERY AT THE COURSE ON MECHANISM DESIGN AT THE FACULTY OF MECHANICAL ENGINEERING, UNIVERSITY OF BELGRADE ........................ 23
Luka Kilibarda, Milena Đorđević, Julija Momčilović, Anastasija Martinenko, Magdalena Dragović, Mateja Korica:
A PRESENTATION METHOD OF STUDENTS’ ASSIGNMENT IN GEOMETRY-INTERSECTION OF TWO SURFACES OF SECOND ORDER ........................................................................................................ 31
Gordana Đukanović, Đorđe Đorđević, Milorad Janić, Vjačeslava Matić
APPLICATION OF ENGINEERING GRAPHICS IN FURNITURE DESIGN ........................................... 37
Jovana Maksimović, Milica Mirković, Ljiljana Brajović, Goran Todorović:
APPLICATION OF GEOMETRY IN GEODETIC INSTRUMENTS AND MEASUREMENT TECHNICS ............................................................................................................................................................................... 44
Maria Salekh, Marina Rynkovskaya:
APPLICATION OF LATTICE SHELLS WHEN SHAPING PROGRESSIVE ARCHITECTURE .......... 57
Vera Miler Jerković, Milica Janković, Bojan Banjac, Branko Malešević, Biljana Mihailović:
APPLICATIONS OF THE GENERALIZED {1, 4} INVERSE IN RESTORATION OF BLURRED IMAGES ............................................................................................................................................................... 62
Alina Duta, Ludmila Sass, Gabriel – Catalin Marinescu:
APPROACHES IN SOLVING SOME TANGENT PROBLEMS .................................................................. 69
Aleksandar Trifunović, Dragan Lazarević, Svetlana Čičević, Marjana Čubranić-Dobrodolac, Momčilo Dobrodolac:
ASSESSMENT OF SPATIAL VISUALIZATION CAPABILITY AND PRECISION IN GEOMETRICAL SHAPES DRAWING .......................................................................................................................................... 75
Dimitrije Jovanovic, Petar Pejic, Sonja Krasic:
AUGMENTED REALITY PRESENTATION OF CONCEPTUAL DESIGN OF DETACHED HOUSE INTENDED FOR INDIVIDUAL LIVING IN NIŠ .......................................................................................... 82
Naomi Ando:
AUTOMATIC CONFIGURATION OF CITYSCAPES ................................................................................. 83
THE 5TH ICGG CONFERENCE MONGEOMETRIJA 2016 PROCEEDINGS Belgrade: 23-26 June 2016
TABLE OF CONTENTS
8
Jelena Letić, Isidora Đurić:
AUTOMATIC PHOTOGRAMMETRIC APPROACH FOR 3D RECONSTRUCTION OF COMPLEX GEOMETRIC FORMS ....................................................................................................................................... 87
Nevena Radojevic:
CENTRAL PROJECTION: DIFFERENT APPLICATIONS IN ARCHITECTURAL DESIGN PROCESSES FROM DESIGN TO CONSTRUCTIVE TOOL ...................................................................... 96
Sonja Krasić, Petar Pejić, Milica Veljković:
A COMPARATIVE ANALYSIS OF CONTEMPORARY AND CLASSICAL TEACHING METHODS OF DESCRIPTIVE GEOMETRY AT THE FACULTY OF CIVIL ENGINEERING AND ARCHITECTURE IN NIS ................................................................................................................................................................. 109
Stefanita Ciunel, Bebe Tica, Gheorghe Popa-Mitroi:
COMPARATIVE STUDIES AND ANALYSIS OF THE TWO TYPES OF FRAMES DEVICES FOR THE DUMMY NECK TESTING SYSTEM..............................................................................................................118
Marija Obradović:
COMPOSITE POLYHEDRAL FORMS OBTAINED BY COMBINING CONCAVE PYRAMIDS OF THE SECOND SORT WITH ARCHIMEDEAN SOLIDS ......................................................................................124
Marko Jovanović, Marko Vučić, Radovan Štulić, Milena Stavrić:
COMPUTER AIDED CURVE AND SURFACE GENERATION IN RELATIVISTIC GEOMETRY OF HARMONIC EQUIVALENTS .........................................................................................................................132
Slavko Risteski, Risto Tashevski,Tashko Rizov:
CONCEPT DESIGN OF A SPORTS COUPE WITH ERGONOMIC ANALYSIS AND PHOTOREALISTIC RENDERING .................................................................................................................138
Petar Pejić, Sonja Krasić, Milica Veljković, Srđan Sakan:
CONTEMPORARY APPROACH IN TRADITIONAL ARCHITECTURAL PROJECT PRESENTATION - CASE STUDY OF MH PETRA ......................................................................................................................152
Maja Petrović, Bojan Banjac, Branko Malešević, Radomir Mijailović:
CURVE FITTING BY MULTIFOCAL ELLIPSES IN ARCHITECTURAL STRUCTURES GEOMETRY ..............................................................................................................................................................................160
Dimitrije Nikolić:
DETERMINATION OF THE CENTROID OF POINTED ARCHES ACCORDING TO RADIAL STEREOTOMY ..................................................................................................................................................165
Emil Veg, Mladen Regodić, Aleksandra Joksimović:
DEVELOPMENT OF THE TRANSMISSION TOWER VIRTUAL 3D MODEL FOR STRUCTURAL ANALYSIS IN ANSYS ......................................................................................................................................171
Gabriella Liva:
DIGITAL GEOMETRIES: GEOMETRICAL LOGIC IN FRANCESCO BORROMINI’S CHURCHES OF SAN CARLINO AND SANT’IVO .............................................................................................................177
Branislav Popkonstantinovic, Ljubomir Miladinovic, Zorana Jeli, Misa Stojicevic:
EVENT BASED MOTION ANALYSIS OF ESCAPEMENT MECHANISM 3D MODEL ........................186
THE 5TH ICGG CONFERENCE MONGEOMETRIJA 2016 PROCEEDINGS Belgrade: 23-26 June 2016
TABLE OF CONTENTS
9
Dinu Dragan, Srdan Mihic, Dragan Ivetic:
EXAMPLES OF RAPID DEVELOPMENT OF 3D CONTENT USING WINDOWS PRESENTATION FOUNDATION AND HELIX TOOLKIT........................................................................................................194
Milena Stavrić, Albert Wiltsche:
FROM PARAMETRIC MODELLING TO DIGITAL FABRICATION: FOLDING SPACE STRUCTURES ..................................................................................................................................................206
George Gherghina, Dragos Popa, Dragos Tutunea:
FROM THE SKETCH IN TECHNICAL DRAWING TO DMU IN ENGINEERING EDUCATION .....212
Dimitrije Nikolić, Radovan Štulić:
GEOMETRIC ANALYSIS OF ADMISSIBLE COLLAPSE MODES OF POINTED ARCHES HAVING MINIMUM THICKNESS .................................................................................................................................218
Olena Gumen, Volodymyr Dovhaliuk, Viktor Mileikovskyi, Olha Lebedieva:
GEOMETRIC ANALYSIS OF TURBULENT MACROSTRUCTURE IN JETS LAID ON FLAT SURFACES FOR TURBULENCE INTENSITY CALCULATION .............................................................225
Olga Timčenko, Katarina Jevtić-Novaković, Marija Mićović:
GEOMETRICAL FORMS IN WORKS OF ARCHITECT MARIO JOBST ..............................................231
Misa Stojićević, Miodrag Stoimenov, Zorana Jeli, Branislav Popkonstantinović:
HISTORY OF WALKING MACHINES .........................................................................................................239
Predrag Šiđanin, Marko Lazić, Ratko Obradović:
IMMERSIVE VIRTUAL REALITY COURSE AT THE DIGITAL PRODUCTION STUDIES ..............245
Ivana Marcikić, Marijana Paunović:
INVERSE PERSPECTIVE IN CÉZANNE’S ART .........................................................................................250
Agostino De Rosa:
J. F. NICERON: PERPSECTIVE AND ARTIFICIAL MAGIC ...................................................................259
Dejana Nedučin, Radovan Štulić, Dimitrije Nikolić:
LEARNING OUTCOMES AS A BASE FOR SYLLABUS ADJUSTMENT OF THE GEOMETRY AND VISUALIZATION OF 3D SPACE COURSE ..................................................................................................273
Ljiljana Petrusevski, Maja Petrovic, Mirjana Devetakovic, Jelena Ivanovic:
MODELING OF FOCAL-DIRECTORIAL SURFACES FOR APPLICATION IN ARCHITECTURE ....278
Hellmuth Stachel:
ON THE COMPUTATION OF FOLDINGS ..................................................................................................287
Ludmila Sass, Alina Duta, Iulian Popescu:
ORIGINAL APPLICATIONS FOR GEOMETRICAL EQUIVALENCE PROBLEM .............................289
Aleksandar Čučaković, Biljana Jović, Miloš Tripković:
PAPER STRIPS DRIVEN DESIGN – APPLICATION ON DOUBLY CURVED SURFACES .............. 299
THE 5TH ICGG CONFERENCE MONGEOMETRIJA 2016 PROCEEDINGS Belgrade: 23-26 June 2016
TABLE OF CONTENTS
10
Mirjana Devetakovic, Jelena Ivanovic, Ljiljana Petrusevski:
PEDAGOGIC POTENTIAL OF A PARAMETRIC SYSTEM BASED ON THE BOX PACKING CONCEPT ......................................................................................................................................................... 305
Veljko B. Petrović, Dinu Dragan, Dragan Ivetić:
PIXEL-BASED FOCUS EVALUATION ALGORITHMS WITH APPLICATIONS IN VISUAL IMPAIRMENT SIMULATION ...................................................................................................................... 320
Marija Obradović:
POLYHEDRAL FORMS OBTAINED BY COMBINIG LATERAL SHEET OF CP II-10 AND TRUNCATED DODECAHEDRON ............................................................................................................... 330
Ratko Obradović, Tihomir Vejnović, Igor Kekeljević, Aleksandra Vejnović, Nemanja Višnjevac, Mirko Raković, Stevan Milatović:
PRE PRODUCTION FOR DEVELOPMENT OF EDUCATIONAL 3D ANIMATION ACCORDING TO VEJNOVIC MODIFICATION OF THE CESAREAN SECTION TECHNIQUE ................................... 338
Ivana Bajšanski, Miloš Mandić, Bojan Tepavčević:
PROCEDURAL MODELLING TOOLS IN ARCHITECTURAL EDUCATION ..................................... 351
Marko Jovanović, Dunja Salaj, Vesna Stojaković:
REFLECTIVE METAL MATERIAL GENERATION IN ARCHITECTURAL VISUALIZATION ...... 358
Gunter Weiss, Hitotaka Ebisui:
REMARKS ON PERSPECTIVE SIMPLICES .............................................................................................. 368
Dirk Huylebrouck:
REVERSE FISHBONE PERSPECTIVE ........................................................................................................ 380
Aleksandar Čučaković, Biljana Jović, Andrea Đukin:
SHADOW SHAPES OF METHAMORPHOSES HYPERCUBE ................................................................. 387
László Vörös:
SPATIAL RECONSTRUCTION OF IMPOSSIBLE PICTURES ................................................................ 397
Carmen Mârza, Georgiana Corsiuc:
STUDY REGARDING THE GEOMETRY OF SOME CONNECTING PIECES FOR CIRCULAR DUCTS ............................................................................................................................................................................. 403
Mihajlo Kocevski, Risto Tashevski, Tashko Rizov, Marijan Gavrilovski:
THE DESIGN PROCESS OF A MODERN MINER’S HELMET WITH INTEGRATION OF SAFETY NEEDS ................................................................................................................................................................ 410
Domen Kušar, Mateja Volgemut:
THE IMPORTANCE OF A COMPREHENSIVE ANALYSIS OF STUDENTS’ CONTRIBUTIONS FOR SPATIAL CONCEPT DEVELOPMENT ....................................................................................................... 426
Aleksandar Čučaković, Magdalena Dragović, Marko Pejić, Milesa Srećković, Jelena Pandžić:
THE POSSIBILITIES OF APPLICATION OF 3D DIGITAL MODELS IN CULTURAL HERITAGE OBJECT PROTECTION AND RECONSTRUCTION ................................................................................. 434
THE 5TH ICGG CONFERENCE MONGEOMETRIJA 2016 PROCEEDINGS Belgrade: 23-26 June 2016

TABLE OF CONTENTS
11
Stefan Grcak, Stefan Djukic, Vukasin Vasic, Petar Pejic, Sonja Krasic:
THE PRESENTATION OF AN EXISTING CITY BLOCK LOCATED ON DR ZORAN DJINDJIC BOULEVARD IN NIS BY USING AR MEDIA ............................................................................................. 444
Milica Veljković, Sonja Krasić, Petar Pejić:
USE OF THE TORUS IN THE DESIGN OF MODERN ARCHITECTURAL STRUCTURES .............. 445
Alexandru Dorin Popa, Anca Mihaela Mogosanu, Dragos-Laurentiu Popa, Alina Duta, Adriana Teodorescu:
VIRTUAL AND RAPID PROTOTYPING METHODS APPLIED IN CIVIL ENGINEERING: SNOW, WIND AND EARTHQUAKE SIMULATIONS MADE ON A FIVE LEVELS BUILDING ..................... 453
Gabriel Buciu, Dragos-Laurentiu Popa, Dragos Niculescu, George Gherghina, Calin Daniel Cosmin, Dragos Tutunea:
VIRTUAL AND RAPID PROTOTYPING METHODS APPLIED IN ORTHOPAEDICS....................... 467
Emil Molnar, Benedek Schultz:
VISUALIZATION AND ANIMATION OF NIL GEOMETRY ................................................................... 479
THE 5TH ICGG CONFERENCE MONGEOMETRIJA 2016 PROCEEDINGS Belgrade: 23-26 June 2016

12 THE 5TH ICGG CONFERENCE MONGEOMETRIJA 2016 PROCEEDINGS Belgrade: 23-26 June 2016

LOCAL ORGANIZERS FOREWORD
Dear friends and colleagues, it is my honor to wish you, on behalf of the Organizing Committee of the 5th International Conference on Geometry and Graphics, "moNGeometrija 2016", a warm welcome and a pleasant stay in Belgrade. We are glad that you are taking part in the Conference, making this meeting all the more important.
MoNGeometrija is a scientific conference which biannually assembles research, professional and teaching staff, not only from Serbia and the region, but also from all over the world. It is our aim to promote and contribute to the development of various fields and aspects of geometry, from theoretical and applied to educational. Furthermore, we hope that the spoken word will establish rapport among the participants, thus forging lasting bonds among scholars pursuing similar goals in these areas. Direct exchange of experience and expertise and in-depth discussions are indispensible for scientific progress, so we are pleased that we will have another opportunity to expand our knowledge and get inspired by outstanding scholarly results of our colleagues from all corners of the world. We are equally pleased to have another chance to strengthen not only professional but also friendly relationships among the participants.
We hope that you will enjoy these motivating presentations, and we wish you much success in your future academic work.
Last, but not least, we hope you will take this opportunity to socialise, see some sights in Belgrade and explore the beauty of Serbia.
Sincerely
prof. Marija Obradović
Faculty of Civil Engineering, Belgrade, Serbia
President of Serbian Society for Geometry and Graphics
THE 5TH ICGG CONFERENCE MONGEOMETRIJA 2016 PROCEEDINGS Belgrade: 23-26 June 2016 13

Z. JELI ET AL.: 3DANALYSIS OF GEMETRICAL FACTORS AND INFLUENCING OPPOSING AIR ARROUND SATELITE DISH
THE 5TH ICGG CONFERENCE MONGEOMETRIJA 2016 PROCEEDINGS Belgrade: 23-26 June 2016 14
3D ANALYSIS OF GEOMETRICAL FACTORS AND INFLUENCING
OPPOSING AIR ARROUND SATELITE DISH
Zorana Jeli
Faculty of Mechanical Engineering-University of Belgrade, Kraljice Marije 16, Belgrade
PhD., Associate Professor, [email protected]
Branislav Pokonstantinovic
Faculty of Mechanical Engineering-University of Belgrade, Kraljice Marije 16, Belgrade
PhD., Full Professor, [email protected]
Misa Stojicevic
Faculty of Mechanical Engineering-University of Belgrade, Kraljice Marije 16, Belgrade
M.Sc., Assistant, [email protected]
Rasa Andrejevic
Faculty of Mechanical Engineering-University of Belgrade, Kraljice Marije 16, Belgrade
PhD., Associate Professor, [email protected]
Ivana Cvetkovic
Faculty of Mechanical Engineering-University of Belgrade, Kraljice Marije 16, Belgrade
B.Sc, Student of final coyrse of Master studies, [email protected]
ABSTRACT
This paper deals with the geometrical characteristics of satellite dishes the influence of these
characteristics on functionality and safety. As part of the work was done the formation of a number
of 3D models of satellite dishes. All models are established in the software program SolidWorks,
and the same software package an analysis of the air flow past the satellite antenna for the
conditions on the territory of Belgrade. The analysis of the model led to the conclusion as would be
most appropriate to adapt the geometrical characteristics of satellite dishes that the final product
meets the functional and security requirements.
The analysis is based on laboratory tests, which were conducted on satellite dishes. On that
occasion, it was concluded that the geometrical characteristics of the antenna itself greatly affect
the functionality and safety. In order to simplify and, in extreme extent, financial better approach to
designing the final product-satellite dish, a basic analysis is carried out on 3D models on which they
made the change of geometric characteristics. The models were analyzed to yield an optimal
solution, since they know they can make the final product.
The paper shows the justification of forming a 3D model, its analysis and shows the simplicity
of the product geometry changes. In a very large extent obtained a final product that has been tested
in conditions close to the real system where the product should operate.
Keywords: 3D model, fluid analysis, geometry of satellite dish, SolidWorks
1. INTRODUCTION
During long time of experience in the design leads to the inevitable conclusion that the process of design
of technical systems needs to conduct some analysis, which is often carried out at the level of mathematical
calculations. Over time it was developed a very powerful methods of mathematical modelling and design is
Z. JELI ET AL.: 3DANALYSIS OF GEMETRICAL FACTORS AND INFLUENCING OPPOSING AIR ARROUND SATELITE DISH
15 THE 5TH ICGG CONFERENCE MONGEOMETRIJA 2016 PROCEEDINGS Belgrade: 23-26 June 2016
largely based on them. Although it represents a quite successful representation of reality, the mathematical
model is not a best method of illustrating the real technical system.
Another way of illustrating the work of the technical system is the formation of the prototype and its
analysis in the laboratory. This method is one of the closest ways to check the functionality of the real technical
system, but economically very challenging-expensive.
With the development of computer and software techniques appears that the method of analysis of the 3D
model, which is economically affordable, quite close to the real system, allowing a large number of changes on
the spot, without a lot of unnecessary elements.
2. INPUT PARAMETRES FOR 3D MODELING
3D CAD model of the satellite antenna is formed by the method of reverse engineering, and it is made
Opposing air in the conditions of use of the technical system. The simulation model is based on the factor of the
speed of the airflow in the data are valid for the area in which the device is used.
Primary real model on which it was carried out laboratory testing has been questioned by several factors
[7]. Due to the volume of work in this study it was not possible to include all the iterations that have been tested
on a real model, and the simulation is performed only for some specific parameters.
Real-technical system satellite antenna was examined at the Aviation Technical Institute in Belgrade, the
fact of the wind. Antennas are made of perforated metal, calotte diameter parabolic 3m.
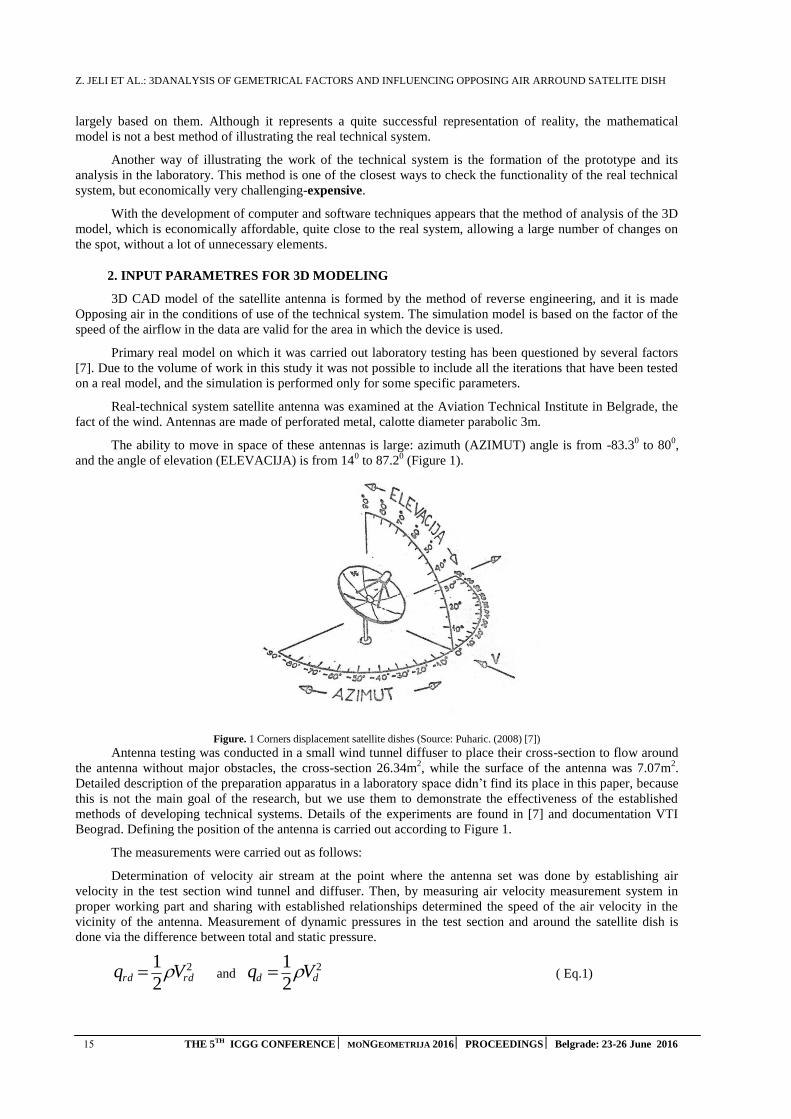
The ability to move in space of these antennas is large: azimuth (AZIMUT) angle is from -83.30 to 80
0,
and the angle of elevation (ELEVACIJA) is from 140 to 87.2
0 (Figure 1).
Figure. 1 Corners displacement satellite dishes (Source: Puharic. (2008) [7])
Antenna testing was conducted in a small wind tunnel diffuser to place their cross-section to flow around
the antenna without major obstacles, the cross-section 26.34m2, while the surface of the antenna was 7.07m
2.
Detailed description of the preparation apparatus in a laboratory space didn’t find its place in this paper, because
this is not the main goal of the research, but we use them to demonstrate the effectiveness of the established
methods of developing technical systems. Details of the experiments are found in [7] and documentation VTI
Beograd. Defining the position of the antenna is carried out according to Figure 1.
The measurements were carried out as follows:
Determination of velocity air stream at the point where the antenna set was done by establishing air
velocity in the test section wind tunnel and diffuser. Then, by measuring air velocity measurement system in
proper working part and sharing with established relationships determined the speed of the air velocity in the
vicinity of the antenna. Measurement of dynamic pressures in the test section and around the satellite dish is
done via the difference between total and static pressure.
2
2
1rdrd Vq and
2
2
1dd Vq ( Eq.1)
Z. JELI ET AL.: 3DANALYSIS OF GEMETRICAL FACTORS AND INFLUENCING OPPOSING AIR ARROUND SATELITE DISH
THE 5TH ICGG CONFERENCE MONGEOMETRIJA 2016 PROCEEDINGS Belgrade: 23-26 June 2016 16
Gives relation 2
2
d
rd
d
rd
V
V
q
q or
d
rd
d
rd
q
q
V
V ( Eq.2)
Where
qd– dynamic pressure in the diffuser around the antenna
qrd– dynamic pressure in the test section
Vd– velocity air diffuser around the antenna
Vrd– Air velocity in the test section
And for ρ=0.1212 kg/m4s
2 by measurement receives next results (table 1).
Table 1: Results for ρ=0.1212 kg/m4s2 by measurement (Source: Puharic (2008)[7])
No. measurement qrd Pa
qd Pa
Vrd m/s
Vd m/s
Vrd/Vd
1 1422 404 48,92 23,073 1,876
2 1586 451 51,66 27,548 1,875
3 1961 561 57,45 30,724 1,870
4 2370 671 63,15 33,652 1,877
Mean value of the ratio of the speed of air currents adopts Vrd/Vd= 1.8743, so that by measuring air
velocity in the test section of the tunnel aero gets:
or ( Eq.3)
Where
В– barometric pressure
Н– pressure difference at the intersection of two collectors
Т – air temperature.
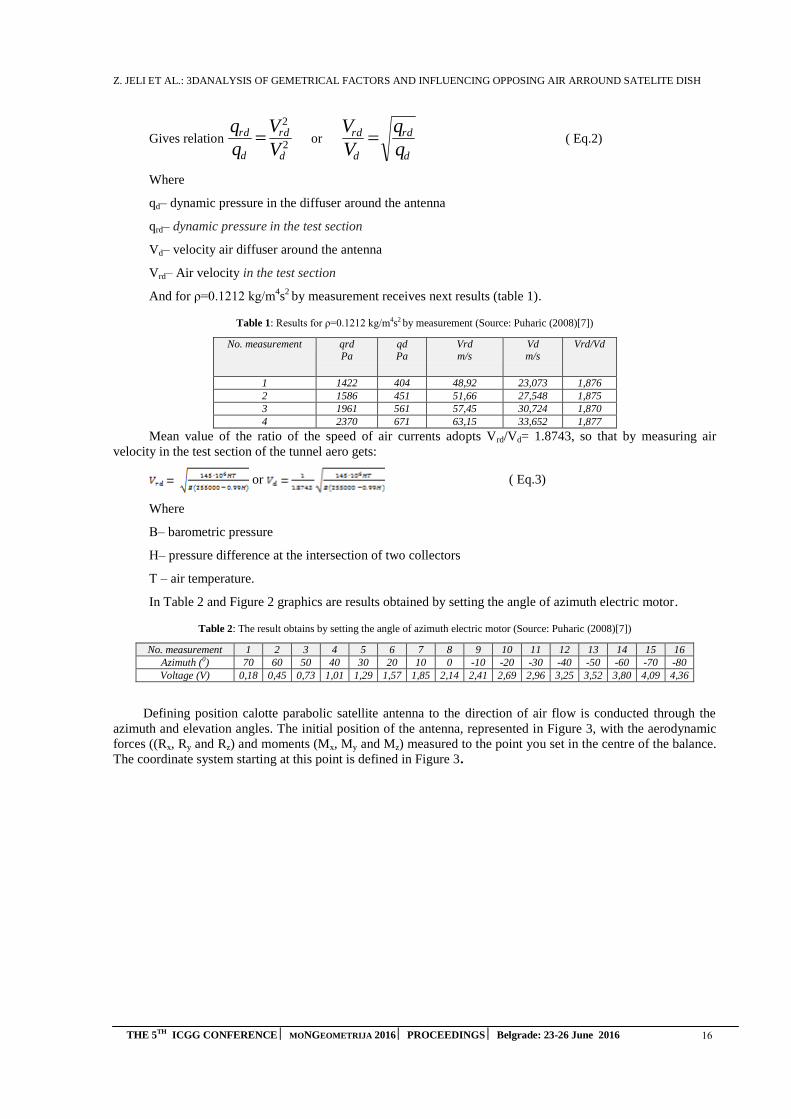
In Table 2 and Figure 2 graphics are results obtained by setting the angle of azimuth electric motor.
Table 2: The result obtains by setting the angle of azimuth electric motor (Source: Puharic (2008)[7])
No. measurement 1 2 3 4 5 6 7 8 9 10 11 12 13 14 15 16
Azimuth (0) 70 60 50 40 30 20 10 0 -10 -20 -30 -40 -50 -60 -70 -80
Voltage (V) 0,18 0,45 0,73 1,01 1,29 1,57 1,85 2,14 2,41 2,69 2,96 3,25 3,52 3,80 4,09 4,36
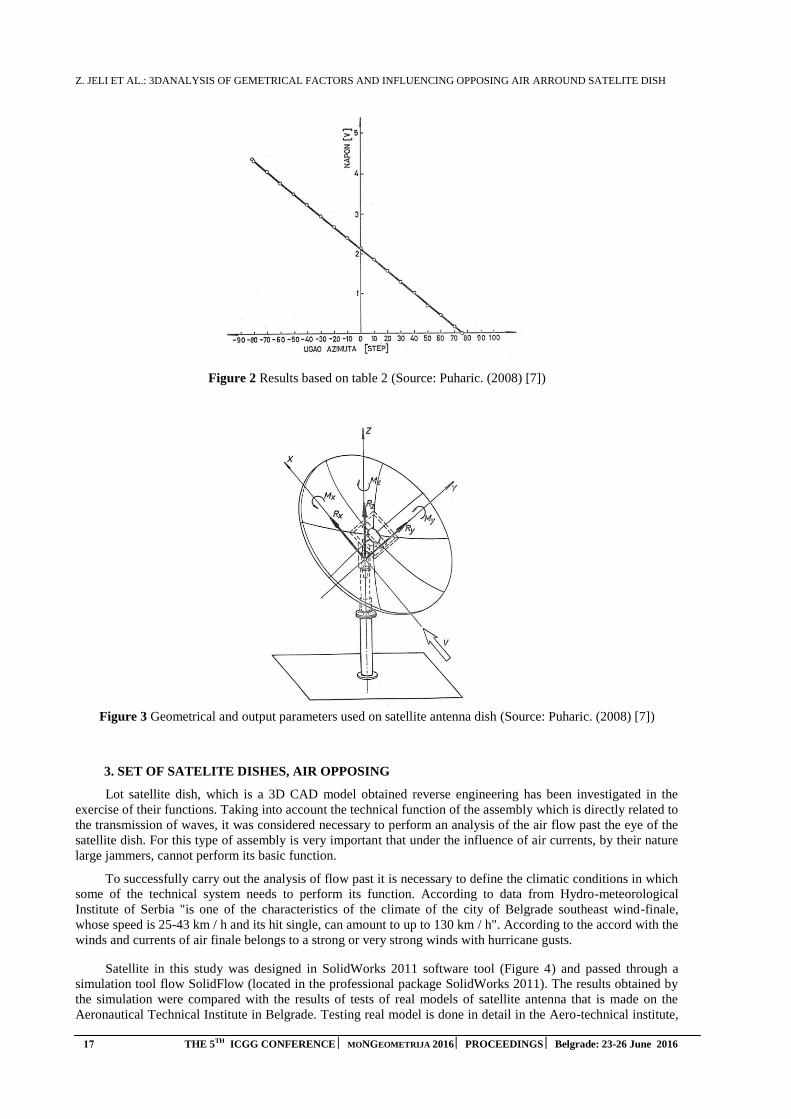
Defining position calotte parabolic satellite antenna to the direction of air flow is conducted through the
azimuth and elevation angles. The initial position of the antenna, represented in Figure 3, with the aerodynamic
forces ((Rx, Ry and Rz) and moments (Mx, My and Mz) measured to the point you set in the centre of the balance.
The coordinate system starting at this point is defined in Figure 3.
Z. JELI ET AL.: 3DANALYSIS OF GEMETRICAL FACTORS AND INFLUENCING OPPOSING AIR ARROUND SATELITE DISH
17 THE 5TH ICGG CONFERENCE MONGEOMETRIJA 2016 PROCEEDINGS Belgrade: 23-26 June 2016
Figure 2 Results based on table 2 (Source: Puharic. (2008) [7])
Figure 3 Geometrical and output parameters used on satellite antenna dish (Source: Puharic. (2008) [7])
3. SET OF SATELITE DISHES, AIR OPPOSING
Lot satellite dish, which is a 3D CAD model obtained reverse engineering has been investigated in the
exercise of their functions. Taking into account the technical function of the assembly which is directly related to
the transmission of waves, it was considered necessary to perform an analysis of the air flow past the eye of the
satellite dish. For this type of assembly is very important that under the influence of air currents, by their nature
large jammers, cannot perform its basic function.
To successfully carry out the analysis of flow past it is necessary to define the climatic conditions in which
some of the technical system needs to perform its function. According to data from Hydro-meteorological
Institute of Serbia "is one of the characteristics of the climate of the city of Belgrade southeast wind-finale,
whose speed is 25-43 km / h and its hit single, can amount to up to 130 km / h". According to the accord with the
winds and currents of air finale belongs to a strong or very strong winds with hurricane gusts.
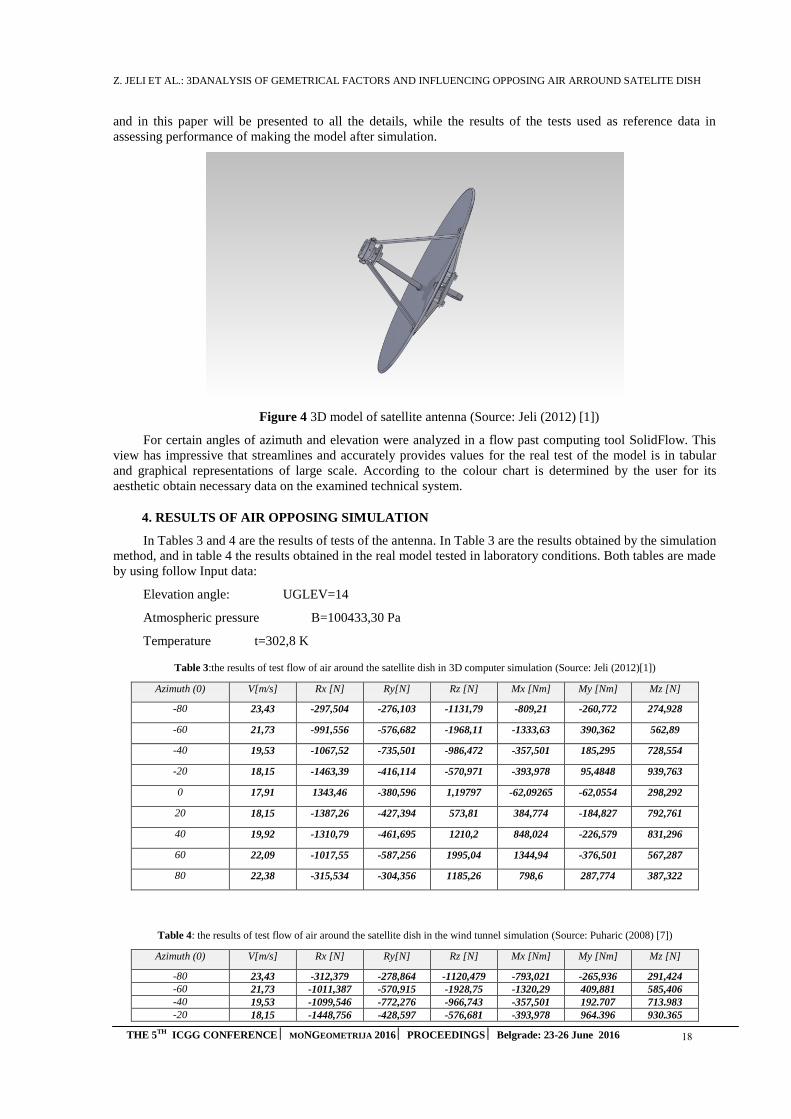
Satellite in this study was designed in SolidWorks 2011 software tool (Figure 4) and passed through a
simulation tool flow SolidFlow (located in the professional package SolidWorks 2011). The results obtained by
the simulation were compared with the results of tests of real models of satellite antenna that is made on the
Aeronautical Technical Institute in Belgrade. Testing real model is done in detail in the Aero-technical institute,
Z. JELI ET AL.: 3DANALYSIS OF GEMETRICAL FACTORS AND INFLUENCING OPPOSING AIR ARROUND SATELITE DISH
THE 5TH ICGG CONFERENCE MONGEOMETRIJA 2016 PROCEEDINGS Belgrade: 23-26 June 2016 18
and in this paper will be presented to all the details, while the results of the tests used as reference data in
assessing performance of making the model after simulation.
Figure 4 3D model of satellite antenna (Source: Jeli (2012) [1])
For certain angles of azimuth and elevation were analyzed in a flow past computing tool SolidFlow. This
view has impressive that streamlines and accurately provides values for the real test of the model is in tabular
and graphical representations of large scale. According to the colour chart is determined by the user for its
aesthetic obtain necessary data on the examined technical system.
4. RESULTS OF AIR OPPOSING SIMULATION
In Tables 3 and 4 are the results of tests of the antenna. In Table 3 are the results obtained by the simulation
method, and in table 4 the results obtained in the real model tested in laboratory conditions. Both tables are made
by using follow Input data:
Elevation angle: UGLEV=14
Atmospheric pressure B=100433,30 Pa
Temperature t=302,8 K
Table 3:the results of test flow of air around the satellite dish in 3D computer simulation (Source: Jeli (2012)[1])
Azimuth (0) V[m/s] Rx [N] Ry[N] Rz [N] Mx [Nm] My [Nm] Mz [N]
-80 23,43 -297,504 -276,103 -1131,79 -809,21 -260,772 274,928
-60 21,73 -991,556 -576,682 -1968,11 -1333,63 390,362 562,89
-40 19,53 -1067,52 -735,501 -986,472 -357,501 185,295 728,554
-20 18,15 -1463,39 -416,114 -570,971 -393,978 95,4848 939,763
0 17,91 1343,46 -380,596 1,19797 -62,09265 -62,0554 298,292
20 18,15 -1387,26 -427,394 573,81 384,774 -184,827 792,761
40 19,92 -1310,79 -461,695 1210,2 848,024 -226,579 831,296
60 22,09 -1017,55 -587,256 1995,04 1344,94 -376,501 567,287
80 22,38 -315,534 -304,356 1185,26 798,6 287,774 387,322
Table 4: the results of test flow of air around the satellite dish in the wind tunnel simulation (Source: Puharic (2008) [7])
Azimuth (0) V[m/s] Rx [N] Ry[N] Rz [N] Mx [Nm] My [Nm] Mz [N]
-80 23,43 -312,379 -278,864 -1120,479 -793,021 -265,936 291,424
-60 21,73 -1011,387 -570,915 -1928,75 -1320,29 409,881 585,406
-40 19,53 -1099,546 -772,276 -966,743 -357,501 192.707 713.983
-20 18,15 -1448,756 -428,597 -576,681 -393,978 964.396 930.365
A. Z. JELI ET AL.: 3DANALYSIS OF GEMETRICAL FACTORS AND INFLUENCING OPPOSING AIR ARROUND SATELITE DISH
19 THE 5TH ICGG CONFERENCE MONGEOMETRIJA 2016 PROCEEDINGS Belgrade: 23-26 June 2016
0 17,91 1370,329 -399,628 122,193 -63.955 -63.917 307.241
20 18,15 -1401,133 -418,846 596,762 400.001 -182.979 832.399
40 19,92 -1337,006 -452,461 1234,404 865,007 -228.845 847.922
60 22,09 -1048,077 -593,129 2094,792 1412.187 -384.031 589.978
80 22,38 -325,001 -313,487 1161,555 790.614 299.285 379.576
When the results of tables 3 and 4 and in parallel can be seen that compared to the same value of the input
data (elevation angle, azimuth angle, wind speed, temperature, atmospheric pressure) the results obtained after
disputed considering parameters (velocity, component aerodynamic force and moment after coordinates) have
large deviations. Of course, the simulation results obtained in the "ideal" conditions, while the frame of the test
flows in the wind tunnel there is no possibility that the conditions absolutely "idealize".
In this way, it is proved that the method is test flow in the virtual reality is very effective, but not too
challenging. The equipment used in real experiment is cumbersome, requires a very serious level of preparation
of the experiment and the final result set. Testing the system in SolidFlow software package only requires certain
skills that must be mastered designer who does the technical development of the system. Of course, a
prerequisite for obtaining high quality and proper test results is the proper formation of the 3D model. In this
paper, the model for the formation of the methodology of PhD dissertation, the results once again proved the
correctness of the above methodology.
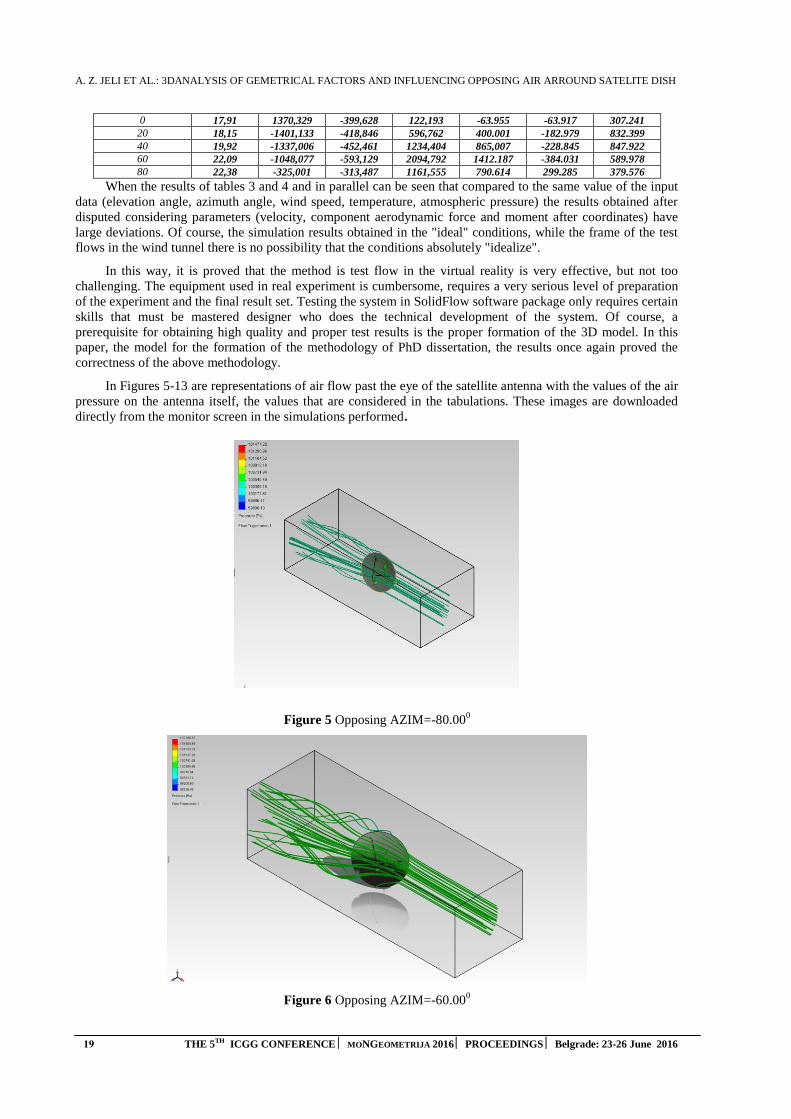
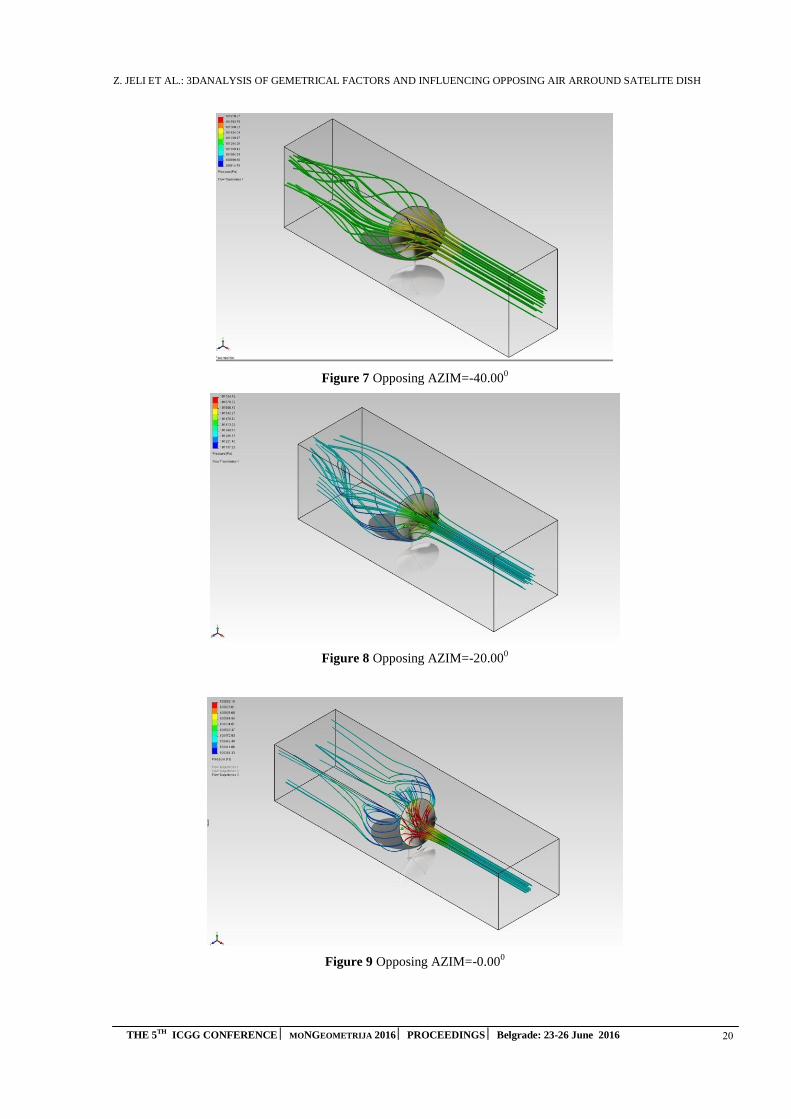
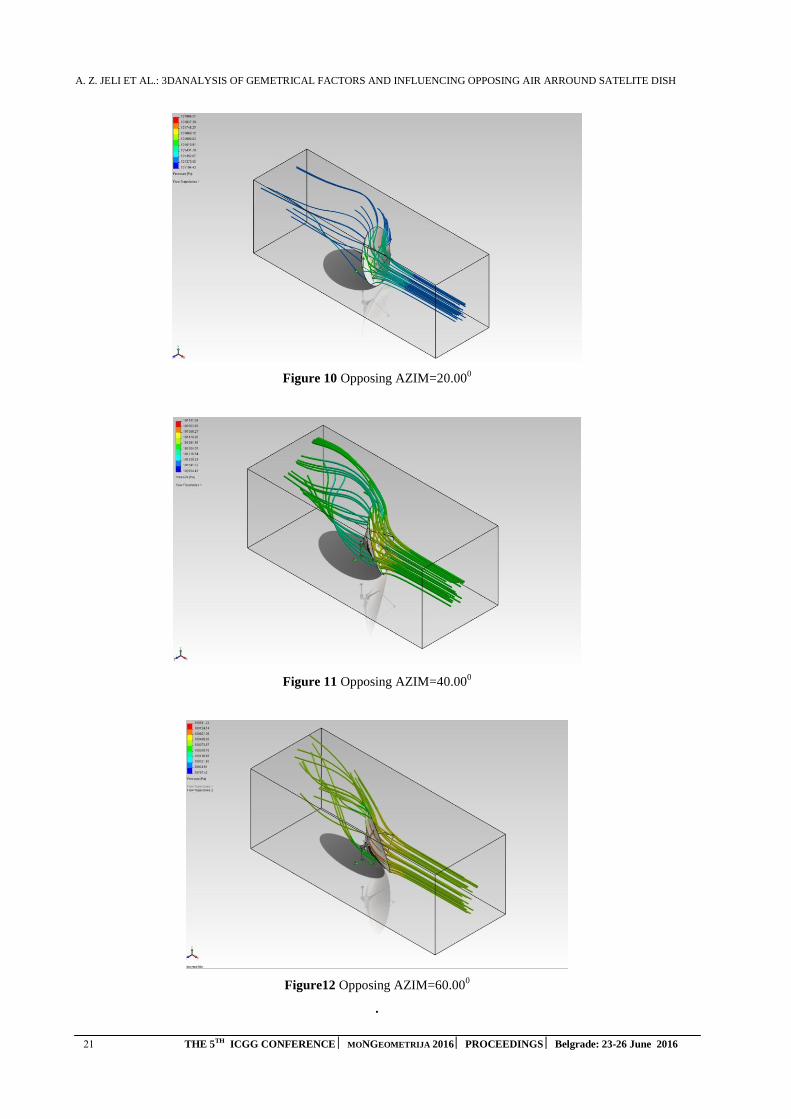
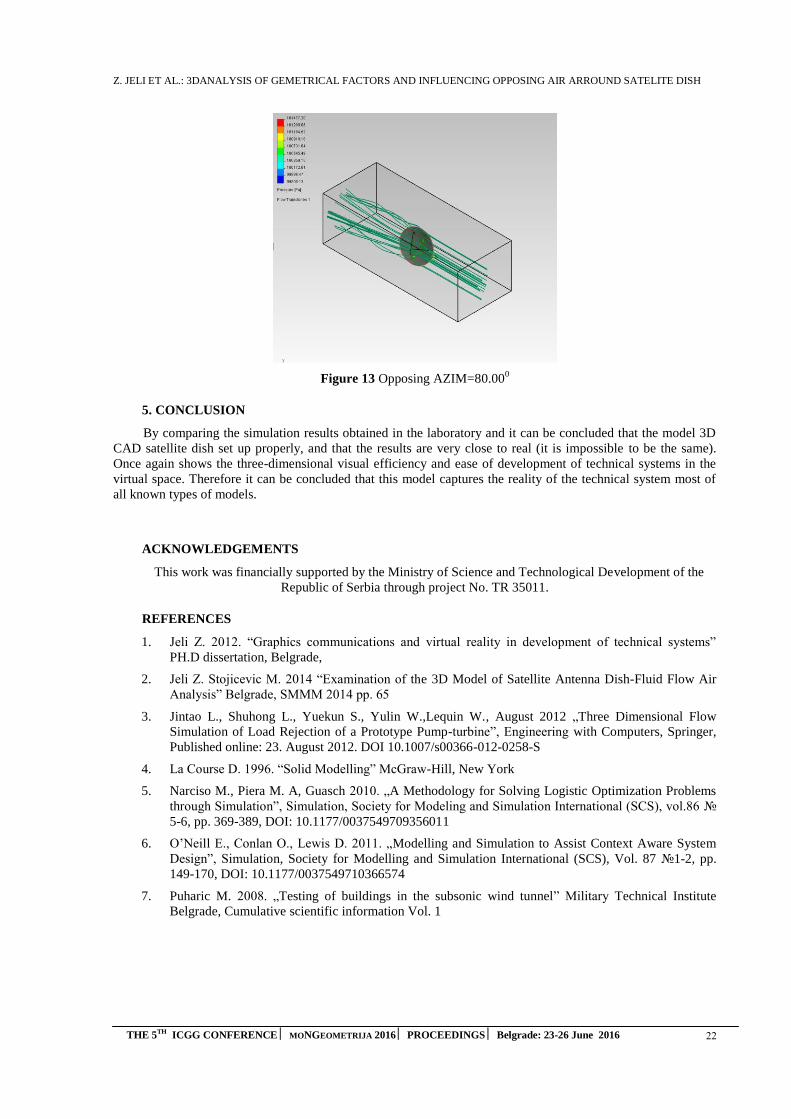
In Figures 5-13 are representations of air flow past the eye of the satellite antenna with the values of the air
pressure on the antenna itself, the values that are considered in the tabulations. These images are downloaded
directly from the monitor screen in the simulations performed.
Figure 5 Opposing AZIM=-80.000
Figure 6 Opposing AZIM=-60.000
Z. JELI ET AL.: 3DANALYSIS OF GEMETRICAL FACTORS AND INFLUENCING OPPOSING AIR ARROUND SATELITE DISH
THE 5TH ICGG CONFERENCE MONGEOMETRIJA 2016 PROCEEDINGS Belgrade: 23-26 June 2016 20
Figure 7 Opposing AZIM=-40.000
Figure 8 Opposing AZIM=-20.000
Figure 9 Opposing AZIM=-0.000
A. Z. JELI ET AL.: 3DANALYSIS OF GEMETRICAL FACTORS AND INFLUENCING OPPOSING AIR ARROUND SATELITE DISH
21 THE 5TH ICGG CONFERENCE MONGEOMETRIJA 2016 PROCEEDINGS Belgrade: 23-26 June 2016
Figure 10 Opposing AZIM=20.000
Figure 11 Opposing AZIM=40.000
Figure12 Opposing AZIM=60.000
.
Z. JELI ET AL.: 3DANALYSIS OF GEMETRICAL FACTORS AND INFLUENCING OPPOSING AIR ARROUND SATELITE DISH
THE 5TH ICGG CONFERENCE MONGEOMETRIJA 2016 PROCEEDINGS Belgrade: 23-26 June 2016 22
Figure 13 Opposing AZIM=80.000
5. CONCLUSION
By comparing the simulation results obtained in the laboratory and it can be concluded that the model 3D
CAD satellite dish set up properly, and that the results are very close to real (it is impossible to be the same).
Once again shows the three-dimensional visual efficiency and ease of development of technical systems in the
virtual space. Therefore it can be concluded that this model captures the reality of the technical system most of
all known types of models.
ACKNOWLEDGEMENTS
This work was financially supported by the Ministry of Science and Technological Development of the
Republic of Serbia through project No. TR 35011.
REFERENCES
1. Jeli Z. 2012. “Graphics communications and virtual reality in development of technical systems”
PH.D dissertation, Belgrade,
2. Jeli Z. Stojicevic M. 2014 “Examination of the 3D Model of Satellite Antenna Dish-Fluid Flow Air
Analysis” Belgrade, SMMM 2014 pp. 65
3. Jintao L., Shuhong L., Yuekun S., Yulin W.,Lequin W., August 2012 „Three Dimensional Flow
Simulation of Load Rejection of a Prototype Pump-turbine”, Engineering with Computers, Springer,
Published online: 23. August 2012. DOI 10.1007/s00366-012-0258-S
4. La Course D. 1996. “Solid Modelling” McGraw-Hill, New York
5. Narciso M., Piera M. A, Guasch 2010. „A Methodology for Solving Logistic Optimization Problems
through Simulation”, Simulation, Society for Modeling and Simulation International (SCS), vol.86 №
5-6, pp. 369-389, DOI: 10.1177/0037549709356011
6. O’Nеill E., Conlan O., Lewis D. 2011. „Modelling and Simulation to Assist Context Aware System
Design”, Simulation, Society for Modelling and Simulation International (SCS), Vol. 87 №1-2, pp.
149-170, DOI: 10.1177/0037549710366574
7. Puharic M. 2008. „Testing of buildings in the subsonic wind tunnel” Military Technical Institute
Belgrade, Cumulative scientific information Vol. 1

B. POPKONSTANTINOVIC.: A NEW APPROACH IN LECTURE DELIVERY AT THE COURSE ON MECHANISM DESIGN AT THE FACULTY OF MECHANICAL ENGINEERING, UNIVERSITY OF BELGRADE
THE 5TH ICGG CONFERENCE MONGEOMETRIJA 2016 PROCEEDINGS Belgrade: 23-26 June 2016 23
A NEW APPROACH IN LECTURE DELIVERY AT THE COURSE ON MECHANISM DESIGN AT THE FACULTY OF MECHANICAL
ENGINEERING, UNIVERSITY OF BELGRADE
Branislav Popkonstantinovic
Faculty of Mechanical Engineering, Belgrade, Republic of Serbia PhD., Full-time Professor, [email protected]
Dragan Petrovic
Faculty of Mechanical Engineering, Belgrade, Republic of Serbia PhD., Full-time Professor, [email protected]
Zorana Jeli
Faculty of Mechanical Engineering, Belgrade, Republic of Serbia Ph.D., Docent, [email protected]
Misa Stojicevic
Faculty of Mechanical Engineering, Belgrade, Republic of Serbia M.Sc., Lecturer Assistant, [email protected]
ABSTRACT
This paper exposes the new and contemporary approach in lectures delivery at the course on Mechanism Design at the Faculty of Mechanical Engineering, University of Belgrade. Since students already obtained and elaborated the analytical methods of mechanism analysis at the courses of Mechanics, we have accepted and utilized the geometrical and synthetic approach with emphasis on mechanism classifications, their kinematic characteristics, synthesis, computer 3D modelling, simulation, motion study and visualization of the mechanisms operation. As an example, this paper disclose and explain this new approach in lectures and exercises delivery on the study of planar four-bar linkage mechanisms. The complete classification of this type of mechanisms is obtained on pure geometrical criteria into following twelve classes: double cranks, crank-rockers, crank 0-rockers, crank π-rockers, rocker-cranks, double rockers, 0-rockers cranks double 0-rockers, 0-rocker π-rockers, π-rocker cranks, π-rocker 0-rockers and double π-rockers. All mentioned mechanism classes are modelled, and their operational, kinematical and dynamical characteristics are obtained and visualized by SolidWorks motion analysis. This method offers students of mechanical engineering the improvement in practical knowledge and skills in mechanism design, as well as in the use of commercially available software (SolidWorks), especially in the field of computer aided design, simulation and motion study of mechanisms.
Keywords: CAD, education, four-bar linkages, mechanisms, motion analysis, simulation
INTRODUCTION
At the Faculty of Mechanical Engineering in Belgrade, on courses of theoretical Mechanics, students obtain and elaborate the analytical methods of mechanism analysis sufficiently intensive and comprehensive. These methods offer various very useful and powerful techniques of Analytical Mechanics by which different dynamical systems can be considered, analysed and mathematically described [3], [4]. Since these techniques are founded on abstract differential and integral calculus, our opinion is that they do not offer sufficiently extensive knowledges and skill in mechanism synthesis which are less conceptual and more practical. Consequently, we
B. POPKONSTANTINOVIC.: A NEW APPROACH IN LECTURE DELIVERY AT THE COURSE ON MECHANISM DESIGN AT THE FACULTY OF MECHANICAL ENGINEERING, UNIVERSITY OF BELGRADE)
24 THE 5TH ICGG CONFERENCE MONGEOMETRIJA 2016 PROCEEDINGS Belgrade: 23-26 June 2016
have accepted and utilized the geometrical and synthetic approach with emphasis on mechanism classifications, their kinematic characteristics, synthesis, computer 3D modelling, simulation, motion study and visualization of the mechanisms operation. This new and contemporary approach in lectures delivery at the course on Mechanism Design at the Faculty of Mechanical Engineering, University of Belgrade will be exposed in this paper.
2. CRITERION FOR PLANAR FOUR-BAR 4R LINKAGE MECHANISMS CLASSIFICATION
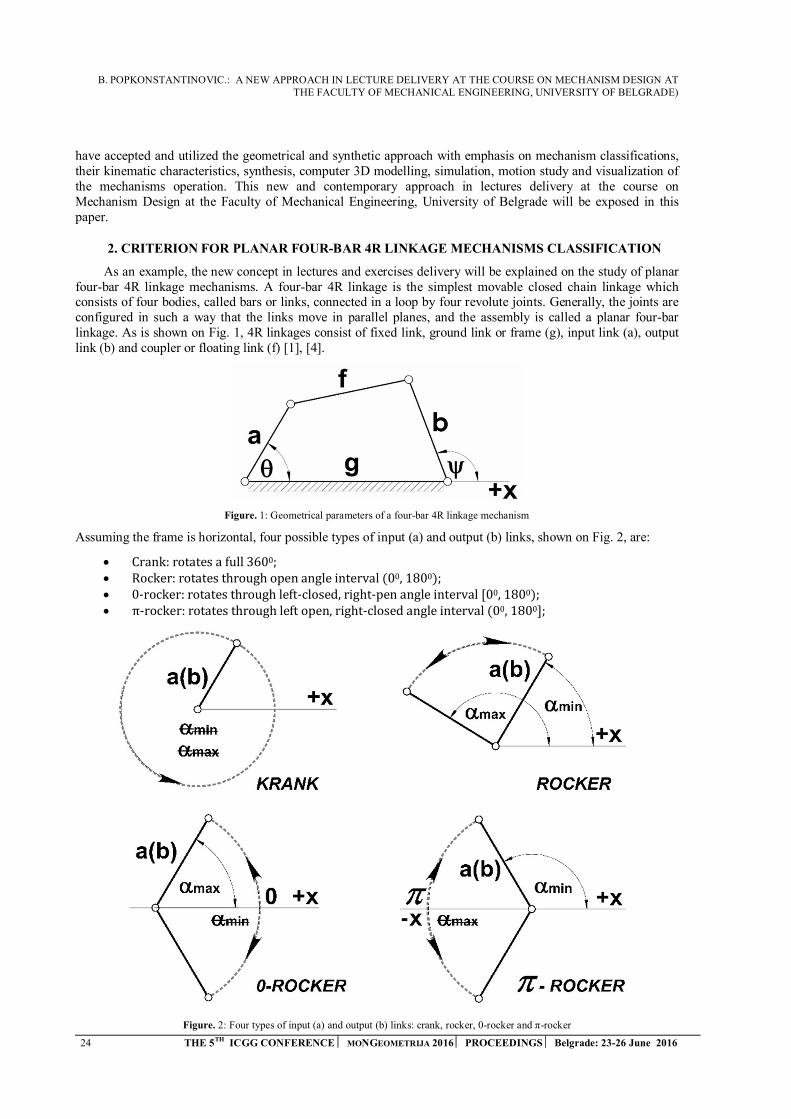
As an example, the new concept in lectures and exercises delivery will be explained on the study of planar four-bar 4R linkage mechanisms. A four-bar 4R linkage is the simplest movable closed chain linkage which consists of four bodies, called bars or links, connected in a loop by four revolute joints. Generally, the joints are configured in such a way that the links move in parallel planes, and the assembly is called a planar four-bar linkage. As is shown on Fig. 1, 4R linkages consist of fixed link, ground link or frame (g), input link (a), output link (b) and coupler or floating link (f) [1], [4].
Figure. 1: Geometrical parameters of a four-bar 4R linkage mechanism
Assuming the frame is horizontal, four possible types of input (a) and output (b) links, shown on Fig. 2, are:
Crank:rotatesafull3600; Rocker:rotatesthroughopenangleinterval(00,1800); 0-rocker:rotatesthroughleft-closed,right-penangleinterval[00,1800); π-rocker:rotatesthroughleftopen,right-closedangleinterval(00,1800];
Figure. 2: Four types of input (a) and output (b) links: crank, rocker, 0-rocker and π-rocker

B. POPKONSTANTINOVIC.: A NEW APPROACH IN LECTURE DELIVERY AT THE COURSE ON MECHANISM DESIGN AT THE FACULTY OF MECHANICAL ENGINEERING, UNIVERSITY OF BELGRADE
THE 5TH ICGG CONFERENCE MONGEOMETRIJA 2016 PROCEEDINGS Belgrade: 23-26 June 2016 25
Regarding this basic categorization of input and output links, all possible types of four-bar 4R linkages can be classified into following twelve classes: double cranks, crank-rockers, crank 0-rockers, crank π-rockers, rocker-cranks, double rockers, 0-rockers cranks double 0-rockers, 0-rocker π-rockers, π-rocker cranks, π-rocker 0-rockers and double π-rockers [2].
(a) (b)
Figure. 3: Configurations of four-bar 4R linkages for (a) ���� and ���� and for (b) y���
and y���
Since this geometrical classification of four-bar 4R linkages is founded on an existence of minimal and maximal angles between x axis, and links (a) and (b), these angles must be defined as functions of the length of mechanism linkages a, b, f and g. Angles � and y are defined by expressions (Eq.1). Configurations of four-bar 4R linkages for ���� and ���� are shown on Fig. 3(a) and for y
��� and y
��� on Fig. 3(b).
∠(�, �) = �; ∠(�, �) = y (Eq.1)
In accordance with the low of cosine, ���� and ���� can be determined from the following expressions (Eq.2) and (Eq.3).
cos ���� = (�� + �� − (� − �)�) 2ag⁄ (Eq.2)
cos ���� = (�� + �� − (� + �)�) 2ag⁄ (Eq.3)
In accordance with the low of cosine and similarly to expressions (Eq.2) and (Eq.3), y���
and y���
can be
determined from expressions (Eq.4) and (Eq.5).
cosy���
= ((� + �)� − (�� + ��)) 2bg⁄ (Eq.4)
cosy���
= ((� − �)� − (�� + ��)) 2bg⁄ (Eq.5)
Now, it is possible to accomplish the classification criteria of links (a) and (b) to cranks, rockers, 0-rockers and π-rockers.
B. POPKONSTANTINOVIC.: A NEW APPROACH IN LECTURE DELIVERY AT THE COURSE ON MECHANISM DESIGN AT THE FACULTY OF MECHANICAL ENGINEERING, UNIVERSITY OF BELGRADE)
26 THE 5TH ICGG CONFERENCE MONGEOMETRIJA 2016 PROCEEDINGS Belgrade: 23-26 June 2016
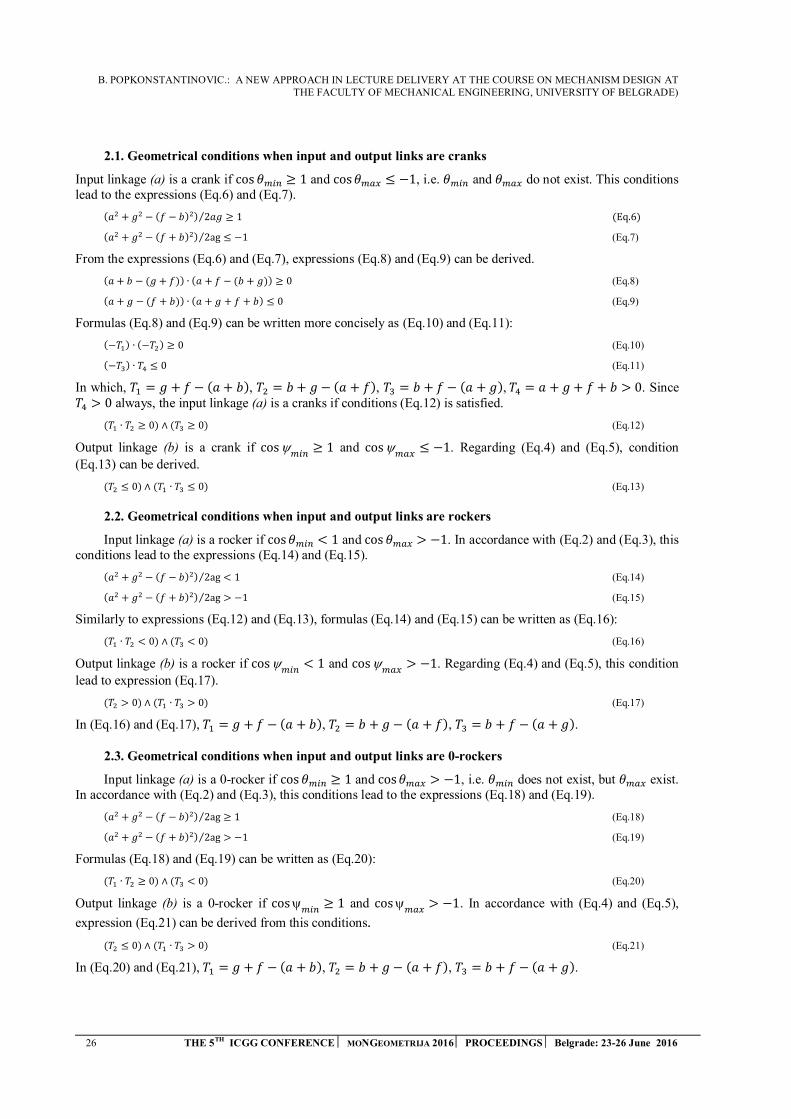
2.1. Geometrical conditions when input and output links are cranks
Input linkage (a) is a crank if cos ���� ≥ 1 and cos ���� ≤ −1, i.e. ���� and ���� do not exist. This conditions lead to the expressions (Eq.6) and (Eq.7).
(�� + �� − (� − �)�) 2��⁄ ≥ 1 (Eq.6)
(�� + �� − (� + �)�) 2ag⁄ ≤ −1 (Eq.7)
From the expressions (Eq.6) and (Eq.7), expressions (Eq.8) and (Eq.9) can be derived.
(� + � − (� + �)) ∙ (� + � − (� + �)) ≥ 0 (Eq.8)
(� + � − (� + �)) ∙ (� + � + � + �) ≤ 0 (Eq.9)
Formulas (Eq.8) and (Eq.9) can be written more concisely as (Eq.10) and (Eq.11):
(−��) ∙ (−��) ≥ 0 (Eq.10)
(−��) ∙ �� ≤ 0 (Eq.11)
In which, �� = � + � − (� + �), �� = � + � − (� + �), �� = � + � − (� + �),�� = � + � + � + � > 0. Since �� > 0 always, the input linkage (a) is a cranks if conditions (Eq.12) is satisfied.
(�� ∙ �� ≥ 0) ∧ (�� ≥ 0) (Eq.12)
Output linkage (b) is a crank if cosy���
≥ 1 and cosy���
≤ −1. Regarding (Eq.4) and (Eq.5), condition
(Eq.13) can be derived.
(�� ≤ 0) ∧ (�� ∙ �� ≤ 0) (Eq.13)
2.2. Geometrical conditions when input and output links are rockers
Input linkage (a) is a rocker if cos ���� < 1 and cos ���� > −1. In accordance with (Eq.2) and (Eq.3), this conditions lead to the expressions (Eq.14) and (Eq.15).
(�� + �� − (� − �)�) 2ag⁄ < 1 (Eq.14)
(�� + �� − (� + �)�) 2ag⁄ > −1 (Eq.15)
Similarly to expressions (Eq.12) and (Eq.13), formulas (Eq.14) and (Eq.15) can be written as (Eq.16):
(�� ∙ �� < 0) ∧ (�� < 0) (Eq.16)
Output linkage (b) is a rocker if cosy���
< 1 and cosy���
> −1. Regarding (Eq.4) and (Eq.5), this condition
lead to expression (Eq.17).
(�� > 0) ∧ (�� ∙ �� > 0) (Eq.17)
In (Eq.16) and (Eq.17), �� = � + � − (� + �), �� = � + � − (� + �), �� = � + � − (� + �).
2.3. Geometrical conditions when input and output links are 0-rockers
Input linkage (a) is a 0-rocker if cos ���� ≥ 1 and cos ���� > −1, i.e. ���� does not exist, but ���� exist. In accordance with (Eq.2) and (Eq.3), this conditions lead to the expressions (Eq.18) and (Eq.19).
(�� + �� − (� − �)�) 2ag⁄ ≥ 1 (Eq.18)
(�� + �� − (� + �)�) 2ag⁄ > −1 (Eq.19)
Formulas (Eq.18) and (Eq.19) can be written as (Eq.20):
(�� ∙ �� ≥ 0) ∧ (�� < 0) (Eq.20)
Output linkage (b) is a 0-rocker if cosy���
≥ 1 and cosy���
> −1. In accordance with (Eq.4) and (Eq.5),
expression (Eq.21) can be derived from this conditions.
(�� ≤ 0) ∧ (�� ∙ �� > 0) (Eq.21)
In (Eq.20) and (Eq.21), �� = � + � − (� + �), �� = � + � − (� + �), �� = � + � − (� + �).
B. POPKONSTANTINOVIC.: A NEW APPROACH IN LECTURE DELIVERY AT THE COURSE ON MECHANISM DESIGN AT THE FACULTY OF MECHANICAL ENGINEERING, UNIVERSITY OF BELGRADE
THE 5TH ICGG CONFERENCE MONGEOMETRIJA 2016 PROCEEDINGS Belgrade: 23-26 June 2016 27
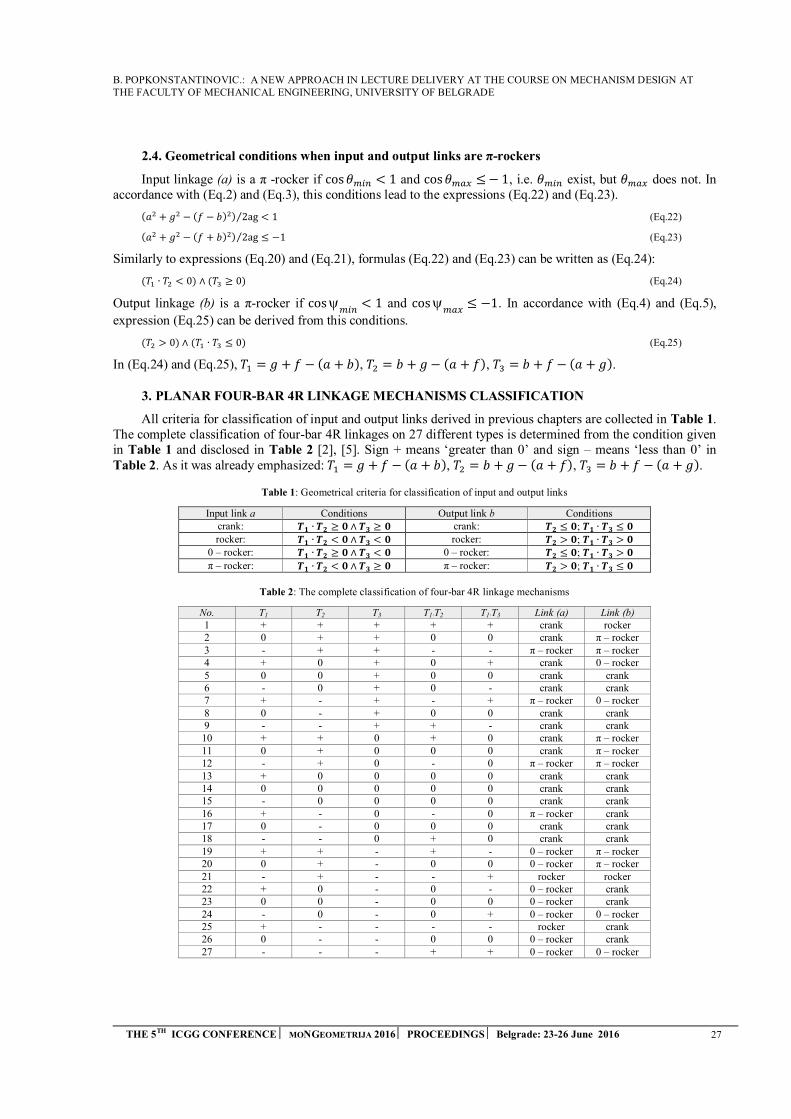
2.4. Geometrical conditions when input and output links are π-rockers
Input linkage (a) is a π -rocker if cos ���� < 1 and cos ���� ≤ − 1, i.e. ���� exist, but ���� does not. In accordance with (Eq.2) and (Eq.3), this conditions lead to the expressions (Eq.22) and (Eq.23).
(�� + �� − (� − �)�) 2ag⁄ < 1 (Eq.22)
(�� + �� − (� + �)�) 2ag⁄ ≤ −1 (Eq.23)
Similarly to expressions (Eq.20) and (Eq.21), formulas (Eq.22) and (Eq.23) can be written as (Eq.24):
(�� ∙ �� < 0) ∧ (�� ≥ 0) (Eq.24)
Output linkage (b) is a π-rocker if cosy���
< 1 and cosy���
≤ −1. In accordance with (Eq.4) and (Eq.5),
expression (Eq.25) can be derived from this conditions.
(�� > 0) ∧ (�� ∙ �� ≤ 0) (Eq.25)
In (Eq.24) and (Eq.25), �� = � + � − (� + �), �� = � + � − (� + �), �� = � + � − (� + �).
3. PLANAR FOUR-BAR 4R LINKAGE MECHANISMS CLASSIFICATION
All criteria for classification of input and output links derived in previous chapters are collected in Table 1. The complete classification of four-bar 4R linkages on 27 different types is determined from the condition given in Table 1 and disclosed in Table 2 [2], [5]. Sign + means ‘greater than 0’ and sign – means ‘less than 0’ in Table 2. As it was already emphasized: �� = � + � − (� + �), �� = � + � − (� + �), �� = � + � − (� + �).
Table 1: Geometrical criteria for classification of input and output links
Input link a Conditions Output link b Conditions crank: �� ∙ �� ≥ � ∧ ��≥ � crank: �� ≤ �; �� ∙ ��≤ � rocker: �� ∙ �� < � ∧ ��< � rocker: �� > �; �� ∙ ��> �
0 – rocker: �� ∙ �� ≥ � ∧ ��< � 0 – rocker: �� ≤ �; �� ∙ ��> � π – rocker: �� ∙ �� < � ∧ ��≥ � π – rocker: �� > �; �� ∙ ��≤ �
Table 2: The complete classification of four-bar 4R linkage mechanisms
No. T1 T2 T3 T1∙T2 T1∙T3 Link (a) Link (b) 1 + + + + + crank rocker 2 0 + + 0 0 crank π – rocker 3 - + + - - π – rocker π – rocker 4 + 0 + 0 + crank 0 – rocker 5 0 0 + 0 0 crank crank 6 - 0 + 0 - crank crank 7 + - + - + π – rocker 0 – rocker 8 0 - + 0 0 crank crank 9 - - + + - crank crank 10 + + 0 + 0 crank π – rocker 11 0 + 0 0 0 crank π – rocker 12 - + 0 - 0 π – rocker π – rocker 13 + 0 0 0 0 crank crank 14 0 0 0 0 0 crank crank 15 - 0 0 0 0 crank crank 16 + - 0 - 0 π – rocker crank 17 0 - 0 0 0 crank crank 18 - - 0 + 0 crank crank 19 + + - + - 0 – rocker π – rocker 20 0 + - 0 0 0 – rocker π – rocker 21 - + - - + rocker rocker 22 + 0 - 0 - 0 – rocker crank 23 0 0 - 0 0 0 – rocker crank 24 - 0 - 0 + 0 – rocker 0 – rocker 25 + - - - - rocker crank 26 0 - - 0 0 0 – rocker crank 27 - - - + + 0 – rocker 0 – rocker
B. POPKONSTANTINOVIC.: A NEW APPROACH IN LECTURE DELIVERY AT THE COURSE ON MECHANISM DESIGN AT THE FACULTY OF MECHANICAL ENGINEERING, UNIVERSITY OF BELGRADE)
28 THE 5TH ICGG CONFERENCE MONGEOMETRIJA 2016 PROCEEDINGS Belgrade: 23-26 June 2016
4. SYNTHESIS OF FOUR BAR 4R LINKAGE MECHANISMS
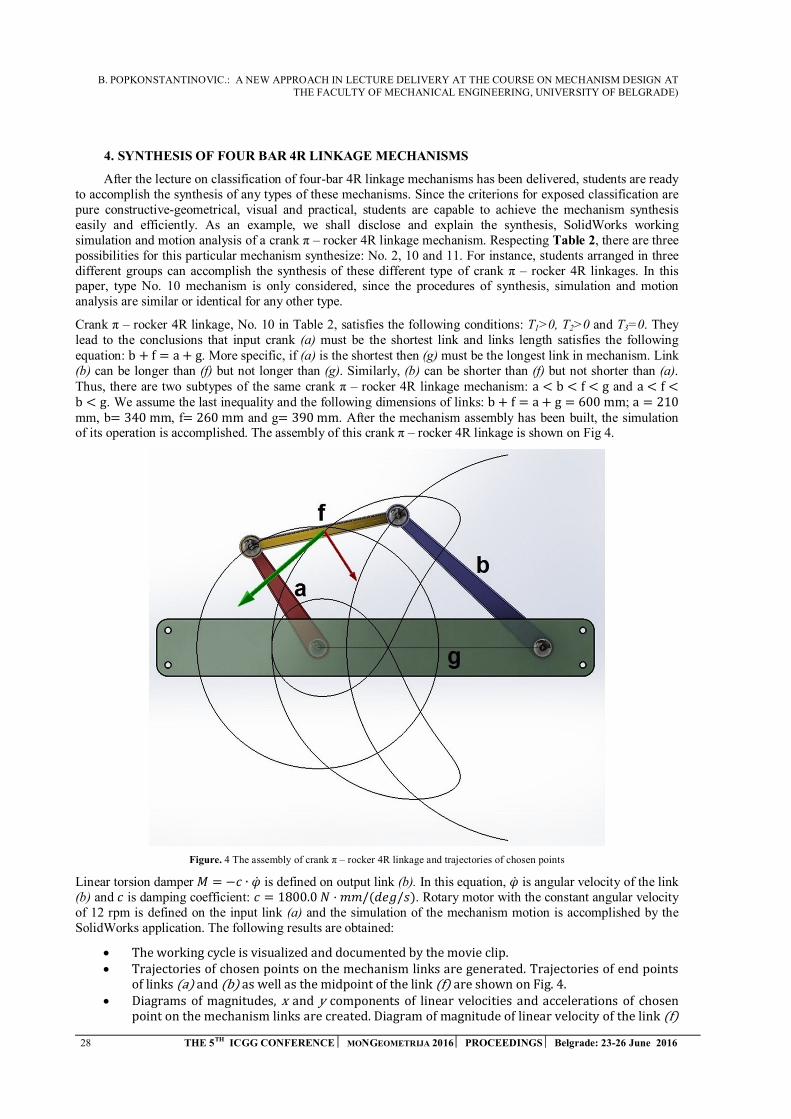
After the lecture on classification of four-bar 4R linkage mechanisms has been delivered, students are ready to accomplish the synthesis of any types of these mechanisms. Since the criterions for exposed classification are pure constructive-geometrical, visual and practical, students are capable to achieve the mechanism synthesis easily and efficiently. As an example, we shall disclose and explain the synthesis, SolidWorks working simulation and motion analysis of a crank π – rocker 4R linkage mechanism. Respecting Table 2, there are three possibilities for this particular mechanism synthesize: No. 2, 10 and 11. For instance, students arranged in three different groups can accomplish the synthesis of these different type of crank π – rocker 4R linkages. In this paper, type No. 10 mechanism is only considered, since the procedures of synthesis, simulation and motion analysis are similar or identical for any other type.
Crank π – rocker 4R linkage, No. 10 in Table 2, satisfies the following conditions: T1>0, T2>0 and T3=0. They lead to the conclusions that input crank (a) must be the shortest link and links length satisfies the following equation: b + f = a + g. More specific, if (a) is the shortest then (g) must be the longest link in mechanism. Link (b) can be longer than (f) but not longer than (g). Similarly, (b) can be shorter than (f) but not shorter than (a). Thus, there are two subtypes of the same crank π – rocker 4R linkage mechanism: a < b < f < g and a < f <b < g. We assume the last inequality and the following dimensions of links: b + f = a + g = 600mm; a = 210 mm, b= 340mm, f= 260mm and g= 390mm. After the mechanism assembly has been built, the simulation of its operation is accomplished. The assembly of this crank π – rocker 4R linkage is shown on Fig 4.
Figure. 4 The assembly of crank π – rocker 4R linkage and trajectories of chosen points
Linear torsion damper � = −� ∙ �̇ is defined on output link (b). In this equation, �̇ is angular velocity of the link (b) and � is damping coefficient: � = 1800.0� · ��/(���/�). Rotary motor with the constant angular velocity of 12 rpm is defined on the input link (a) and the simulation of the mechanism motion is accomplished by the SolidWorks application. The following results are obtained:
Theworkingcycleisvisualizedanddocumentedbythemovieclip. Trajectoriesofchosenpointsonthemechanismlinksaregenerated.Trajectoriesofendpoints
oflinks(a)and(b)aswellasthemidpointofthelink(f)areshownonFig.4. Diagrams of magnitudes, x and y components of linearvelocities and accelerations of chosen
pointonthemechanismlinksarecreated.Diagramofmagnitudeoflinearvelocityofthelink(f)
B. POPKONSTANTINOVIC.: A NEW APPROACH IN LECTURE DELIVERY AT THE COURSE ON MECHANISM DESIGN AT THE FACULTY OF MECHANICAL ENGINEERING, UNIVERSITY OF BELGRADE
THE 5TH ICGG CONFERENCE MONGEOMETRIJA 2016 PROCEEDINGS Belgrade: 23-26 June 2016 29
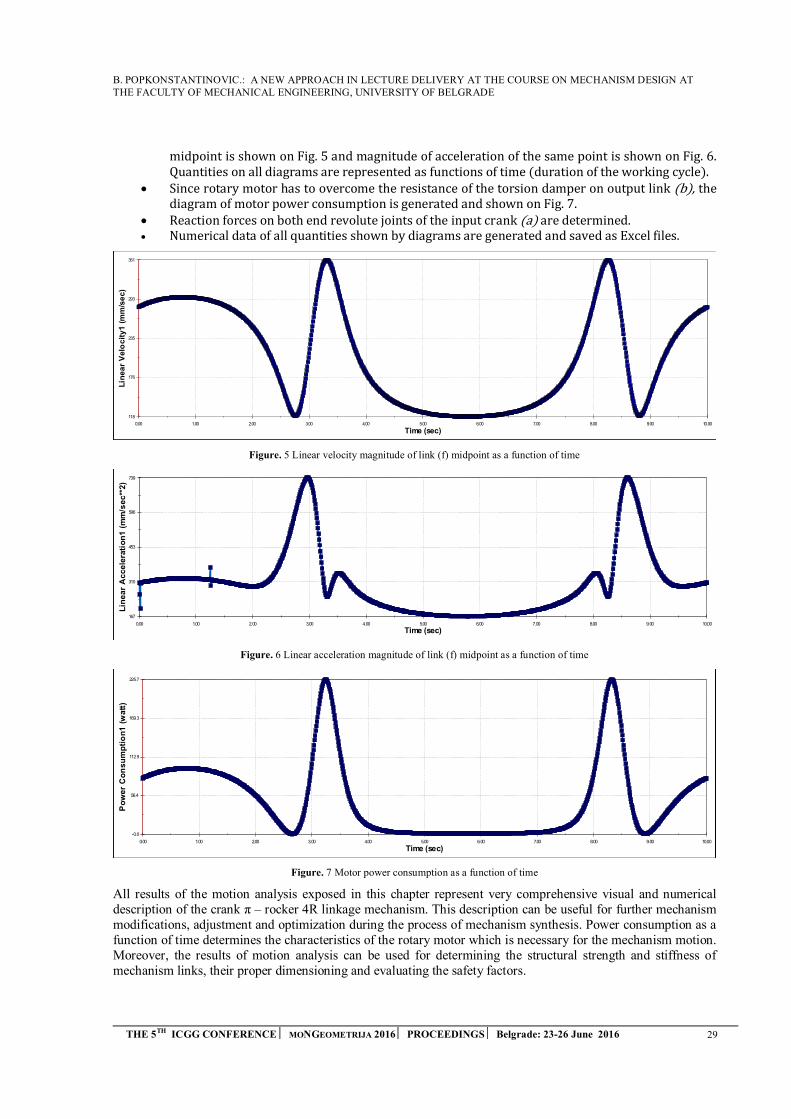
midpointisshownonFig.5andmagnitudeofaccelerationofthesamepointisshownonFig.6.Quantitiesonalldiagramsarerepresentedasfunctionsoftime(durationoftheworkingcycle).
Sincerotarymotorhastoovercometheresistanceofthetorsiondamperonoutputlink(b),thediagramofmotorpowerconsumptionisgeneratedandshownonFig.7.
Reactionforcesonbothendrevolutejointsoftheinputcrank(a)aredetermined. NumericaldataofallquantitiesshownbydiagramsaregeneratedandsavedasExcelfiles.
Figure. 5 Linear velocity magnitude of link (f) midpoint as a function of time
Figure. 6 Linear acceleration magnitude of link (f) midpoint as a function of time
Figure. 7 Motor power consumption as a function of time
All results of the motion analysis exposed in this chapter represent very comprehensive visual and numerical description of the crank π – rocker 4R linkage mechanism. This description can be useful for further mechanism modifications, adjustment and optimization during the process of mechanism synthesis. Power consumption as a function of time determines the characteristics of the rotary motor which is necessary for the mechanism motion. Moreover, the results of motion analysis can be used for determining the structural strength and stiffness of mechanism links, their proper dimensioning and evaluating the safety factors.
0.00 1.00 2.00 3.00 4.00 5.00 6.00 7.00 8.00 9.00 10.00
Time (sec)
118
176
235
293
351
Lin
ea
r V
elo
cit
y1
(m
m/s
ec
)
0.00 1.00 2.00 3.00 4.00 5.00 6.00 7.00 8.00 9.00 10.00
Time (sec)
167
310
453
596
739
Li n
ea
r A
cc
ele
rati
on
1 (
mm
/se
c**
2)
0.00 1.00 2.00 3.00 4.00 5.00 6.00 7.00 8.00 9.00 10.00
Time (sec)
-0.0
56.4
112.9
169.3
225.7
Po
we
r C
on
su
mp
tio
n1
(w
att
)
B. POPKONSTANTINOVIC.: A NEW APPROACH IN LECTURE DELIVERY AT THE COURSE ON MECHANISM DESIGN AT THE FACULTY OF MECHANICAL ENGINEERING, UNIVERSITY OF BELGRADE)
30 THE 5TH ICGG CONFERENCE MONGEOMETRIJA 2016 PROCEEDINGS Belgrade: 23-26 June 2016
5. FINAL REMARKS
This paper discloses and explains the new and contemporary approach in lectures delivery at the course on Mechanism Design at the Faculty of Mechanical Engineering in Belgrade. We have accepted and utilized the geometrical and synthetic approach with emphasis on mechanism classifications, their kinematic characteristics, synthesis, computer 3D modelling, simulation, motion study and visualization of the mechanisms operation. As the example, we have explained the classification of four-bar 4R linkage mechanism, as well as the CAD method for their synthesis, motion simulation and motion analysis. This approach proposes detailed and very comprehensive visual and numerical description of mechanisms, their motion and kinematical and dynamical characteristics in general.
Teaching method, exposed in this paper, offers students of mechanical engineering the improvement in practical knowledge and skills in mechanism design, as well as in the use of commercially available software (SolidWorks), especially in the field of computer aided design, simulation and optimization of mechanisms.
REFERENCES
1. Chronis N.P, 1965, Mechanisms, Linkages and Mechanical Controls, International student edition,McGraw-Hill, London, UK
2. McCarthy J. M. and Soh S.G., 2010, Geometric Design of Linkages, Second Edition, Springer, NewYork, USA
3. Norton R. L., 2004, Design of machinery: an introduction to the synthesis and analysis of mechanismsand machines, Third edition, McGraw-Hill Higher Education, New York, USA.
4. Raskovic D., 1964, Osnovi teorije mehanizama, prvo izdanje, Zavod za ozdavanje udzbenikaSocijalisticke Republike Srbije, Beograd, SFRJ
5. Four-bar Linkages: http://dynref.engr.illinois.edu/aml.html
L. KILIBARDA ET AL.: A PRESENTATION METHOD OF STUDENTS’ ASSIGNMENT IN GEOMETRY-INTERSECTION OF TWO SURFACES OF SECOND ORDER
31 THE 5TH ICGG CONFERENCE MONGEOMETRIJA 2016 PROCEEDINGS Belgrade: 23-26 June 2016
A PRESENTATION METHOD OF STUDENTS’ ASSIGNMENT IN GEOMETRY-INTERSECTION OF TWO SURFACES OF SECOND
ORDER
Luka Kilibarda Faculty of Civil Engineering, University of Belgrade, Belgrade, Serbia
student of Master studies, [email protected]
Milena Đorđević Faculty of Civil Engineering, University of Belgrade, Belgrade, Serbia
student, 4th year, [email protected]
Julija Momčilović Faculty of Civil Engineering, University of Belgrade, Belgrade, Serbia
student, 3rd year, [email protected]
Anastasija Martinenko Department of Geodesy, Faculty of Civil Engineering, University of Belgrade, Belgrade, Serbia
student, 2nd year, [email protected]
Magdalena Dragović Department of Mathematics, Physics and Descriptive Geometry, Faculty of Civil Engineering, University of
Belgrade, Belgrade, Serbia PhD, Assistant professor, [email protected]
Mateja Korica Department of Geodesy, Faculty of Civil Engineering, University of Belgrade, Belgrade, Serbia
student, 1st year, [email protected]
ABSTRACT
There are two courses concerning geometric topics in the freshman studies at the Faculty of Civil Engineering in Belgrade: Descriptive Geometry for civil engineers and Computational Geometry, for geodetic engineers. In the curriculum of Descriptive Geometry course students are elaborating the topic – intersections of two surfaces of second order (cone and cylinder, two cones, two cylinders, etc.) through tasks in oblique projection, drawing manually. In the other, Computational Geometry course, students are solving the same geometric tasks by applying Boolean operations on 3D solid models of geometric primitives in Auto CAD software. In this paper the combination of these two methods, i.e. drawing procedures will be presented.
The main problem in students' understanding of geometric procedures concerns visualization of 3D objects from 2D images. The authors created unconventional presentation of their geometric assignment provided in AutoCAD software in which 2D drawings (orthographic and oblique projections) and 3D models are united as tools for mastering the topic - intersections of two surfaces of second order - cone and cylinder. The consecutive "steps" of the drawing procedure i.e. geometric solution are conducted by layer control, parallel in 2D and 3D Auto CAD's environment.
The unusual task setting is in the oblique projection, in which given direction of projection ray is parallel to the axis of a cylinder. Several examples of intersection curve are presented in two variations of task settings. Elaboration of such geometric task intended to be a contribution to the collection of solved tasks available for students' use in the website of the Faculty of Civil Engineering in Belgrade.
L. KILIBARDA ET AL.: A PRESENTATION METHOD OF STUDENTS’ ASSIGNMENT IN GEOMETRY-INTERSECTION OF TWO SURFACES OF SECOND ORDER
32 THE 5TH ICGG CONFERENCE MONGEOMETRIJA 2016 PROCEEDINGS Belgrade: 23-26 June 2016
Keywords: Descriptive geometry task; intersection of cone and cylinder; 4th order curve; constructive geometric procedure; 3D models of surfaces; Boolean operations.
SUBJECT CODE: Education of Descriptive Geometry and Graphics
1. INTRODUCTION
At the Faculty of Civil Engineering in Belgrade, two courses with different teaching methodologies in geometric education exist. The first one, Descriptive geometry (DG) course, in classical terms deals with 2D drawings and 3D perception, combining orthographic and oblique projections as the methods of solving various geometric tasks. The other one, Computational Geometry (CG) course introduces 3D computer environment in solving geometric problems and offers modelling approach. Some geometric procedures (e.g. rotation, symmetry, translation, etc.) are executed by software commands. General characteristics of two mentioned courses are given in Table 1.
Table 1: Overview of the characteristics of two geometry courses in the Faculty of Civil Engineering
Course characteristics
DG COURSE CG COURSE
Goal group Civil engineers Geodetic engineers Lecturing
methodology Ex cathedra, drawings on the blackboard, Power
point presentations Ex cathedra, Power point presentations
Exercises 2D manual drawings 2D and 3D computer drawings Tools Pencil, ruler and compass Computer software – Auto CAD
Teaching materials DG handbook, book of geometric tasks with chosen solutions, collection of solved exercises (*.dwg files)
CG handbook, book of geometric tasks with solutions (*.dwg files on CD ROM)
Presentation style 2D drawings supported by 3D representations 2D drawings or 3D model solutions Presentation methodology
"step by step" drawing procedure conducted by layer control in AutoCAD
Drawing or modelling AutoCAD procedure
Both curriculums elaborate a geometric topic - intersection of two second order surfaces (two cones, two cylinders, as well as cone and cylinder). In DG course students learn geometric drawing procedures of oblique projection for the problem solving, while in CG course the intersection problem is interpreted by Boolean operations of solid models (primitives – cones and cylinders ) in Auto CAD software ( Obradović, 2010). The idea of the investigation is to combine these two existing presentation methods when solving students' assignment on given topic. Using accurate computer drawings in Auto CAD software, both 2D projections and 3D models, the authors created specific presentation in intention to emphasize the advantages of computer aided 3D geometric problem representations.
2. GEOMETRIC TASK PRESENTATION METHOD – INTERSECTION OF TWO SECONDORDER SURFACES: CONE AND CYLINDER
Chosen geometric problem, well known from classical references in Descriptive Geometry or Engineering Graphics, can be solved by several classical drawing procedures (e.g. method of cutting planes, line method, auxiliary spheres, etc. (Čučaković, 2010). The criteria for adoption of the methodology are mutual spatial relations of the two chosen surfaces. In classical DG geometric tasks this topic is commonly presented in orthographic or oblique projections. Students rather preferred oblique projection method because of better spatial perception. The experience shown if the presentation method for teaching 2D drawing procedure offers "step by step" guidance, there is a certain assurance of expecting good results in students' mastering the problem (Putz 2001).
However, contemporary methods for mastering Descriptive geometry tasks often use modern technology possibilities, i.e. interactive tools of various software solutions, such as Geogebra, MatLab, AutoCAD (Bokan, 2009; Obradović, 2010; Standiford, 2006), Cabri 3D (Gergelitzova, 2007), etc. Some curriculums even adjusted their name according to a new technology (e.g. Computational geometry). When interactive 3D model presentation added in geometry teaching, the understanding of spatial problems is more reachable goal. AutoCAD software solution was adopted as the presentation "tool" for this research regarding its 3D environment, the possibilities of grouping certain drawing "steps" into layers, as well as for hiding of sufficient overlapping lines (Bokan, 2009). The advantage which enabled manipulation of 3D model in software environment using "orbit" tool and orthographic view palette is not neglectable.
The idea of deepening the students' comprehension of connections between orthographic projections, oblique projection, and 3D computer model provoked the group of older students, authors of the paper, to make some solutions for this problem in an asignment elaborating the topic – intersection of two surfaces of second order.
L. KILIBARDA ET AL.: A PRESENTATION METHOD OF STUDENTS’ ASSIGNMENT IN GEOMETRY-INTERSECTION OF TWO SURFACES OF SECOND ORDER
33 THE 5TH ICGG CONFERENCE MONGEOMETRIJA 2016 PROCEEDINGS Belgrade: 23-26 June 2016
The science researches have shown that sometimes valuable results appear inspired by a mistake. An often mistake in students' koloquiums is wrong interpretation of the conic sections, where a drawing solution appears as a "hole" inside a cone. Elaboration of the intersection of cone and cylinder in special task setting will be the propper reaction on such nonsence and valuable replay on students' question "What to do if the oblique projection does'nt work?"
The presentation is provided inside single Auto CAD drawing file in which layer control manager had the important role. Three filters are set for separate drawing methods: 1-(R) orthographic projections, 2-(O) oblique projection and 3-(S) solid model. The drawing procedure is divided into parts, organized by the order of appearance, and adequately named. The user can turn on/turn of the layers, according to his/her needs and folow the procedure.
2.1 The task setting
If one thinks of the DG goals he/she has to have in mind the definition of its investigation: "Descriptive geometry investigates and applies mappings of three-dimensional space onto a plane drawing board. In order to carry over the constructive methods on plane geometry one gives preference to mappings that makes line in space correspond to lines on the drawing board" (Source: Gellert et al. 1975).
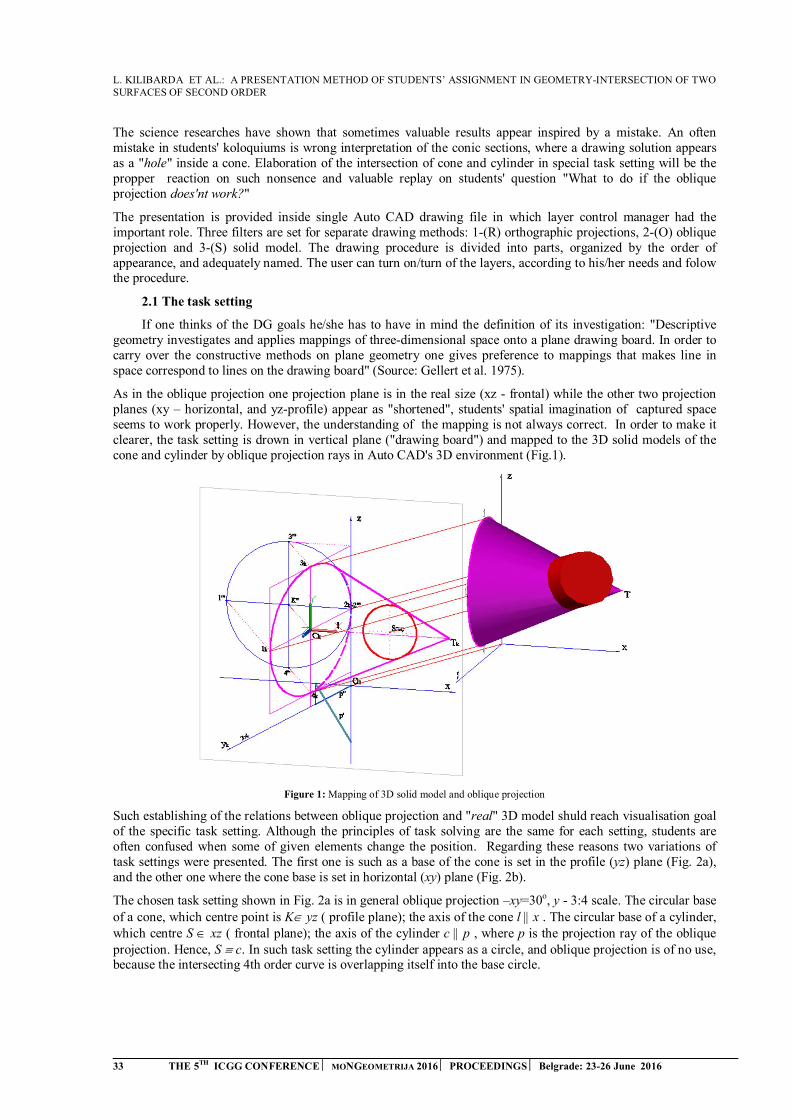
As in the oblique projection one projection plane is in the real size (xz - frontal) while the other two projection planes (xy – horizontal, and yz-profile) appear as "shortened", students' spatial imagination of captured space seems to work properly. However, the understanding of the mapping is not always correct. In order to make it clearer, the task setting is drown in vertical plane ("drawing board") and mapped to the 3D solid models of the cone and cylinder by oblique projection rays in Auto CAD's 3D environment (Fig.1).
Figure 1: Mapping of 3D solid model and oblique projection
Such establishing of the relations between oblique projection and "real" 3D model shuld reach visualisation goal of the specific task setting. Although the principles of task solving are the same for each setting, students are often confused when some of given elements change the position. Regarding these reasons two variations of task settings were presented. The first one is such as a base of the cone is set in the profile (yz) plane (Fig. 2a), and the other one where the cone base is set in horizontal (xy) plane (Fig. 2b).
The chosen task setting shown in Fig. 2a is in general oblique projection –xy=30o, y - 3:4 scale. The circular base of a cone, which centre point is K yz ( profile plane); the axis of the cone l x . The circular base of a cylinder, which centre S xz ( frontal plane); the axis of the cylinder c p , where p is the projection ray of the oblique projection. Hence, S c. In such task setting the cylinder appears as a circle, and oblique projection is of no use, because the intersecting 4th order curve is overlapping itself into the base circle.
L. KILIBARDA ET AL.: A PRESENTATION METHOD OF STUDENTS’ ASSIGNMENT IN GEOMETRY-INTERSECTION OF TWO SURFACES OF SECOND ORDER
34 THE 5TH ICGG CONFERENCE MONGEOMETRIJA 2016 PROCEEDINGS Belgrade: 23-26 June 2016
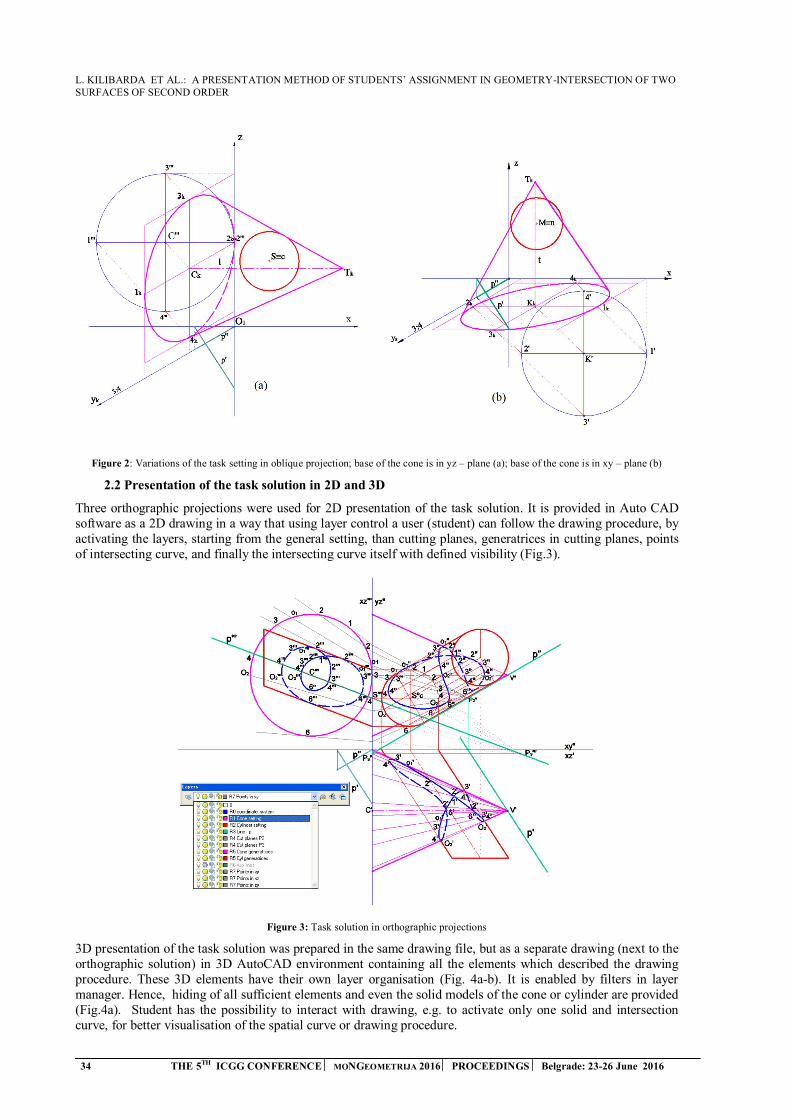
Figure 2: Variations of the task setting in oblique projection; base of the cone is in yz – plane (a); base of the cone is in xy – plane (b)
2.2 Presentation of the task solution in 2D and 3D
Three orthographic projections were used for 2D presentation of the task solution. It is provided in Auto CAD software as a 2D drawing in a way that using layer control a user (student) can follow the drawing procedure, by activating the layers, starting from the general setting, than cutting planes, generatrices in cutting planes, points of intersecting curve, and finally the intersecting curve itself with defined visibility (Fig.3).
Figure 3: Task solution in orthographic projections
3D presentation of the task solution was prepared in the same drawing file, but as a separate drawing (next to the orthographic solution) in 3D AutoCAD environment containing all the elements which described the drawing procedure. These 3D elements have their own layer organisation (Fig. 4a-b). It is enabled by filters in layer manager. Hence, hiding of all sufficient elements and even the solid models of the cone or cylinder are provided (Fig.4a). Student has the possibility to interact with drawing, e.g. to activate only one solid and intersection curve, for better visualisation of the spatial curve or drawing procedure.
L. KILIBARDA ET AL.: A PRESENTATION METHOD OF STUDENTS’ ASSIGNMENT IN GEOMETRY-INTERSECTION OF TWO SURFACES OF SECOND ORDER
35 THE 5TH ICGG CONFERENCE MONGEOMETRIJA 2016 PROCEEDINGS Belgrade: 23-26 June 2016
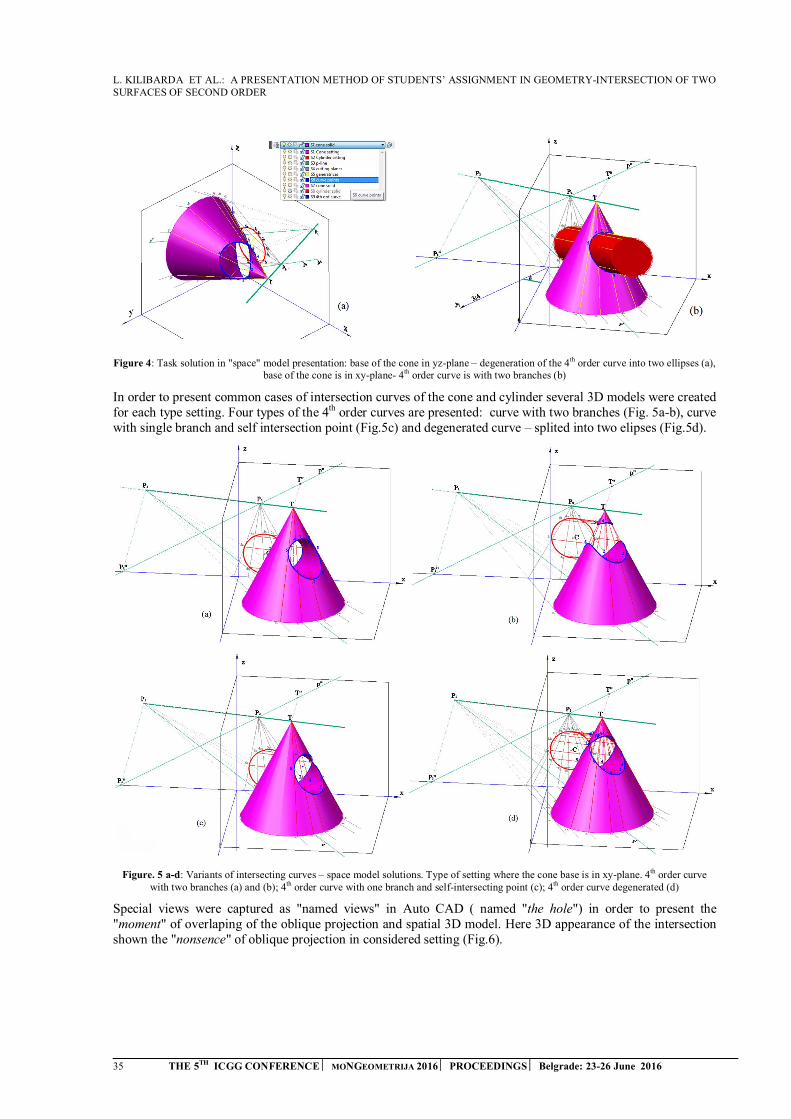
Figure 4: Task solution in "space" model presentation: base of the cone in yz-plane – degeneration of the 4th order curve into two ellipses (a), base of the cone is in xy-plane- 4th order curve is with two branches (b)
In order to present common cases of intersection curves of the cone and cylinder several 3D models were created for each type setting. Four types of the 4th order curves are presented: curve with two branches (Fig. 5a-b), curve with single branch and self intersection point (Fig.5c) and degenerated curve – splited into two elipses (Fig.5d).
Figure. 5 a-d: Variants of intersecting curves – space model solutions. Type of setting where the cone base is in xy-plane. 4th order curve with two branches (a) and (b); 4th order curve with one branch and self-intersecting point (c); 4th order curve degenerated (d)
Special views were captured as "named views" in Auto CAD ( named "the hole") in order to present the "moment" of overlaping of the oblique projection and spatial 3D model. Here 3D appearance of the intersection shown the "nonsence" of oblique projection in considered setting (Fig.6).

L. KILIBARDA ET AL.: A PRESENTATION METHOD OF STUDENTS’ ASSIGNMENT IN GEOMETRY-INTERSECTION OF TWO SURFACES OF SECOND ORDER
36 THE 5TH ICGG CONFERENCE MONGEOMETRIJA 2016 PROCEEDINGS Belgrade: 23-26 June 2016
Figure. 6: 3D model view (named view "the hole") – oblique projection overlapping 3D model.
CONCLUSION
The students' research here presented offered a presentation method of the geometric topic – intersection of two surfaces of second order (cone and cylinder). The possibilities of using AutoCAD 3D environment for teaching/learning process in Descriptive Geometry course were shown. Students, authors of the paper applied their skills gained in DG and CG courses and merged methodologies in order to present the chosen geometric topic. By combining 2D drawings in projections both oblique and orthographic with 3D models, satisfactory results were obtained in the domain of presentation methodology. Drawing procedures were presented by using layer control tool-palette in AutoCAD software, which enabled step by step guidance through the task. The mapping of the oblique projection and 3D models were presented in 3D software environment. Several variations of the resulting 4th order curve were elaborated in two types of task setting in unique drawing file.
The advantage of this presentation method lays in the possibility of a user (student) to interact with the content, i.e. activate/deactivate parts of the drawing, manipulate in 3D, capture characteristic views, etc. With proper explanation at lessons and a short users guide through AutoCAD's tool palettes, a student will be able to understand, draw and visualize geometric topic. This work made the significant contibution to the existing collections of the task solutions at the website of the Civil Engineering Faculty inside DG learning materials.
REFERENCES
Čučaković, A. 2010. Descriptive geometry, Akademska misao, Beograd (in Serbian)
Bokan, N., Ljucović, M., Vukmirović, S. 2009. Computer – aided teaching of descriptive geometry, Journal for Geometry and Graphics, vol.13 No.2, pp.221-229
Gellert, W., Gottwald, S., Hellwich, M., Kastner, H., Kustne, H. 1975. The VNR Concise Encyclopedia of Mathematics, Springer Netherlands
Gergelitsova, Š. 2007. Computer aided development of spatial abilities, WDS'07 Proceedings of contributed papers, Prague, Czechoslovakia, part I, pp. 246-250.
Haraga, G., Ghelase D. 2009. The Boolean operations with CAD systems, The annals of "Dunarea de Jos" University of Galati, fascicle XIV Mechanical Engineering, pp. 91-94
Obradović M. 2010. Computational geometry with 3D modeling, AGM book & Faculty of Civil Engineering, Belgrade (in Serbian)
Putz, K. 2001. Teaching descriptive geometry for architects: didactic principles and effective methods demonstrated by the example of Monge projection, IV International Conference on Graphic Engineering for Arts and Design, Sao Paolo, Brasil, pp.269-278.
Standiford, K., Standiford, S., 2006. Descriptive Geometry – An integrated approach using AutoCAD, Second edition, Delmar Cengage Learning, New York, USA
G. ĐUKANOVIĆ ET AL.: APPLICATION OF ENGINEERING GRAPHICS IN FURNITURE DESIGN
THE 5TH ICGG CONFERENCE MONGEOMETRIJA 2016 PROCEEDINGS Belgrade: 23-26 June 2016
APPLICATION OF ENGINEERING GRAPHICS IN FURNITURE DESIGN
Gordana Đukanović Department of Technology, Management and Design of furniture and wood products, University of Belgrade,
Faculty of Forestry, SerbiaPhD., Assistant Professor, [email protected]
Đorđe ĐorđevićDepartment of Urbanism, University of Belgrade, Faculty of Architecture, Serbia
PhD., Assistant Professor, [email protected]
Milorad JanićDepartment of Forestry, University of Belgrade, Faculty of Forestry, Serbia
PhD.,Associate Professor, [email protected]
Vjačeslava MatićDepartment of Ecological Engineering, University of Belgrade, Faculty of Forestry, Serbia
PhD.,Retired Full Professor, [email protected]
ABSTRACT
The recent expansion of computer technology has led to its introduction into classrooms. Teaching curricula have been changed and new courses that support these changes have been introduced. Following these reforms, the Faculty of Forestry in Belgrade, Department of Technology, Management and Design of furniture and wood products (TMD) introduced a new (optional) subject - Engineering Graphics in the academic 2014/15. The aim of this course is to help students develop skills of spatial organization and creative solving and modeling of furniture and improve their presentation skills and abilities to carry out practical computer tasks.
Teaching how to understand space, and how to shape and model spatial forms is carried out by applying the software package AutoCAD. By using this software for generating spatial sketches and models, students find it easier to understand the three orthogonal projections, as well as the three different views of one object and to draw it on a two-dimensional sheet of paper or two-dimensional screen and vice versa, to use several two-dimensional sketches to envisage what the object would look like in space.
Engineering Graphics is taught to second year students of the Department for TMD. In the first stage, the students performed a series of simple tasks to learn the basic AutoCAD commands. In the second stage, they modeled simple pieces of laminated furniture, such as a cabinet. They used drawing of rectangular shapes of given dimensions and command EXTRUDE. By applying Boolean operations INTERSECT and SUBTRACT they performed the folding of fiberboard on the back of the cabinet. Legs and handles were modeled using LOFT command. In the third stage, they modeled drawers, practiced their opening and integration into the walls of the cabinet. They used ROTATE command to open the cabinet door wings. In the fourth stage, they were given assignments with complex models such as beds, coffee tables with transparent glass or computer and TV desks.
Keywords: Engineering graphics; 3D modelling, laminated furniture, software tools, AutoCAD.
SUBJECT CODE: Education of Descriptive Geometry and Graphics
1. INTRODUCTION
AutoCAD is a computer program which is given preference in teaching engineering graphics. This graphics software meets the majority of needs when it comes to graphical representation of 2D and 3D space in engineering drawings. It has also proved to be convenient and effective in solving a number of geometry

G. ĐUKANOVIĆ ET AL.: APPLICATION OF ENGINEERING GRAPHICS IN FURNITURE DESIGN
THE 5TH ICGG CONFERENCE MONGEOMETRIJA 2016 PROCEEDINGS Belgrade: 23-26 June 2016
problems. Therefore, Engineering Graphics is taken as graphic interpretation of geometry problems, a method that is used in Descriptive Geometry as well. This approach provides a direct and immediate access to the work results and broadens the knowledge about spatial relations and transformations of elements and objects in space and thus develops one of the key skills of an engineer: the skill of planning three-dimensional space and representing it as a 2D projection or a 3D model, as well as interpreting objects in space based on the given projections or models.
2. MODELING DIFFERENT PIECES OF FURNITURE
The paper presents examples of different types of furniture modeled by students in engineering graphics classes.
2.1 Example I: Single Bed Model
The students` first task was to model a single bed shown in Figure 1. The bed is 2000 mm long, 960 mm wide and 685 mm tall. The legs are 40x40x685 mm, modeled using the LOFT command. The side load-bearing boards are 1920x100 mm, 18 mm thick and obtained by extruding a rectangle. They are set at a 250 mm height. The front load-bearing boards are 880x100 mm, 18 mm thick, also set at a 250 mm from the floor. The transverse posts are 240 mm tall, with a variable cross-section (Ø5-25mm). There are 17 bed base slats (to support the mattress). They are all 900x30x10 mm with a gap of ~ 82 mm (the slats are not fastened so the distance can vary). One slat is modeled and the rest of them are obtained by using the command OFFSET at the distance of 82 mm. The materials are assigned by opening the submenu RENDER in the VIEW menu, and finding a new submenu MATERIALS. Thus, we open the settings window for creating materials. A quick look at the settings table makes it obvious that material creation can be very simple (we can just choose from a selection of the offered ready-made materials and textures) or complex by using a pattern or an image from another folder (e.g. My Pictures), which is not included in the offered textures. Further adjustments are made using additional options (Adjust / Scale / Tiling / Offset) until we achieve the desired end result. The command VIEWPORTS has four windows, shown in Figure 2.
Figure 1: Modeled bed with the assigned materials and textures

G. ĐUKANOVIĆ ET AL.: APPLICATION OF ENGINEERING GRAPHICS IN FURNITURE DESIGN
THE 5TH ICGG CONFERENCE MONGEOMETRIJA 2016 PROCEEDINGS Belgrade: 23-26 June 2016
Figure 2: Three basic projections of the bed and isometric view
We can create as many new materials as we need to meet the requirements of a task. If we want the bed frame and the slatted bed base to be made of different materials, we create 2 materials. We can create even more, for the bed head, etc. Redwood is selected as the most suitable material for the load-bearing bed parts, while we select Pine-Coarse from the offered AutoCAD textures for the light-coloured slats. The mapping procedure (MAPPING) must be applied to map the material onto the body surface. There are four types of mapping: Planar, Box, Spherical and Cylindrical. We choose the type of mapping according to the type and shape of the body onto which we map the material. Once the type of mapping is selected and applied to a given body, the materialization of the body is completely achieved.
2.2 Example II: Desk Model
The given desk (Figure 3) is 117 cm tall, 117 cm wide and 55 cm deep. It has three drawers, a pull-out keyboard tray and a shelf which is on the left-hand side. All panels are 18 mm thick. We selected appropriate materials for each desk part. We used Paneling-Brown material for modeling. In the window that shows the frontal view of the desk, we drew the shape of the desk and the shape was then extruded in the y direction at 55 cm. The drawers were modeled separately and then inserted in the appropriate place. The drawer handles were modeled by drawing a circle of R=10 mm in the window FRONT. The coordinate system UCS was set in the center of the circle. Further modeling was done using the EXTRUDE command and the option PATH, by selecting a previously drawn path – knob axis. In all the views, the desk drawers are open to make the desk model as clear as possible.
Figure 3: The modeled desk
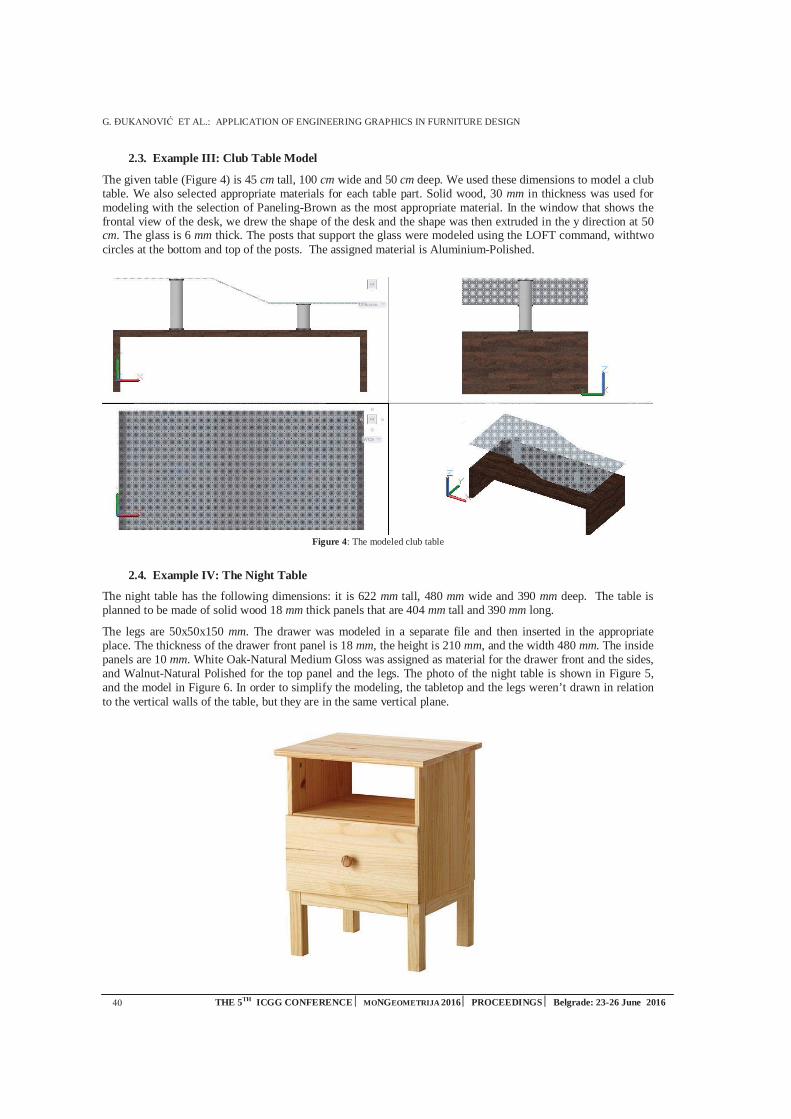
G. ĐUKANOVIĆ ET AL.: APPLICATION OF ENGINEERING GRAPHICS IN FURNITURE DESIGN
THE 5TH ICGG CONFERENCE MONGEOMETRIJA 2016 PROCEEDINGS Belgrade: 23-26 June 2016
2.3. Example III: Club Table Model
The given table (Figure 4) is 45 cm tall, 100 cm wide and 50 cm deep. We used these dimensions to model a club table. We also selected appropriate materials for each table part. Solid wood, 30 mm in thickness was used for modeling with the selection of Paneling-Brown as the most appropriate material. In the window that shows the frontal view of the desk, we drew the shape of the desk and the shape was then extruded in the y direction at 50 cm. The glass is 6 mm thick. The posts that support the glass were modeled using the LOFT command, withtwo circles at the bottom and top of the posts. The assigned material is Aluminium-Polished.
Figure 4: The modeled club table
2.4. Example IV: The Night Table
The night table has the following dimensions: it is 622 mm tall, 480 mm wide and 390 mm deep. The table is planned to be made of solid wood 18 mm thick panels that are 404 mm tall and 390 mm long.
The legs are 50x50x150 mm. The drawer was modeled in a separate file and then inserted in the appropriate place. The thickness of the drawer front panel is 18 mm, the height is 210 mm, and the width 480 mm. The inside panels are 10 mm. White Oak-Natural Medium Gloss was assigned as material for the drawer front and the sides, and Walnut-Natural Polished for the top panel and the legs. The photo of the night table is shown in Figure 5, and the model in Figure 6. In order to simplify the modeling, the tabletop and the legs weren’t drawn in relation to the vertical walls of the table, but they are in the same vertical plane.
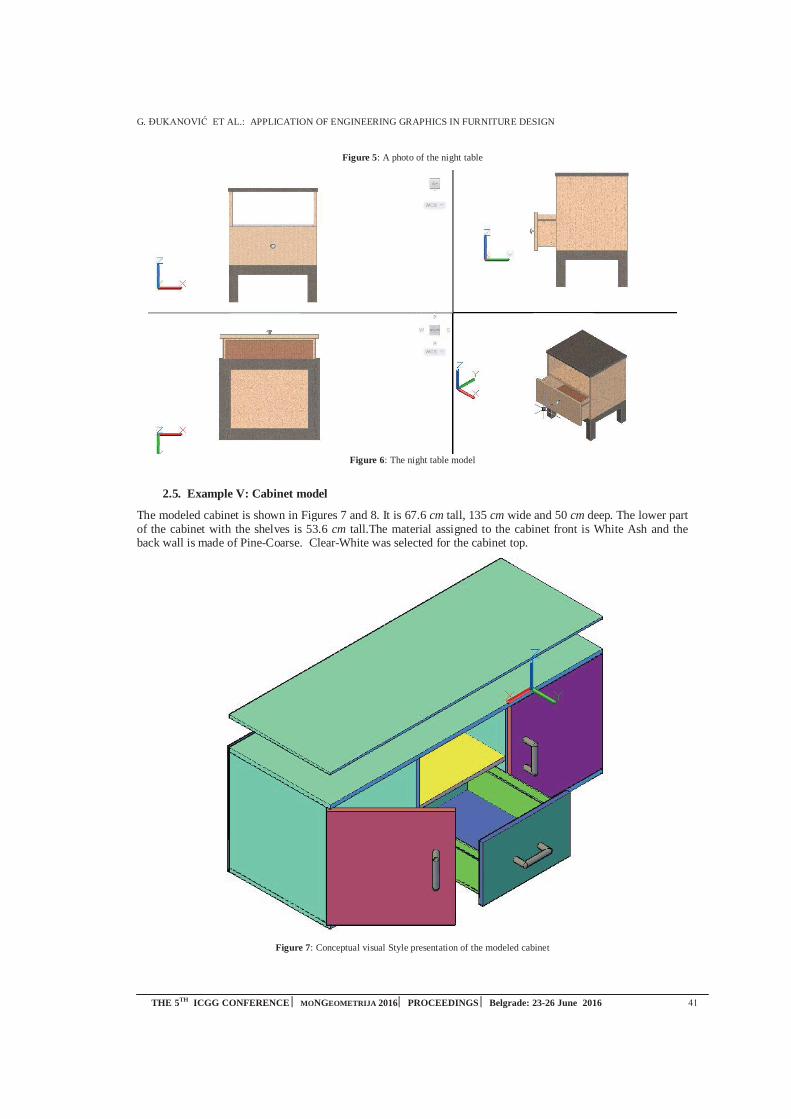
G. ĐUKANOVIĆ ET AL.: APPLICATION OF ENGINEERING GRAPHICS IN FURNITURE DESIGN
THE 5TH ICGG CONFERENCE MONGEOMETRIJA 2016 PROCEEDINGS Belgrade: 23-26 June 2016
Figure 5: A photo of the night table
Figure 6: The night table model
2.5. Example V: Cabinet model
The modeled cabinet is shown in Figures 7 and 8. It is 67.6 cm tall, 135 cm wide and 50 cm deep. The lower part of the cabinet with the shelves is 53.6 cm tall.The material assigned to the cabinet front is White Ash and the back wall is made of Pine-Coarse. Clear-White was selected for the cabinet top.
Figure 7: Conceptual visual Style presentation of the modeled cabinet
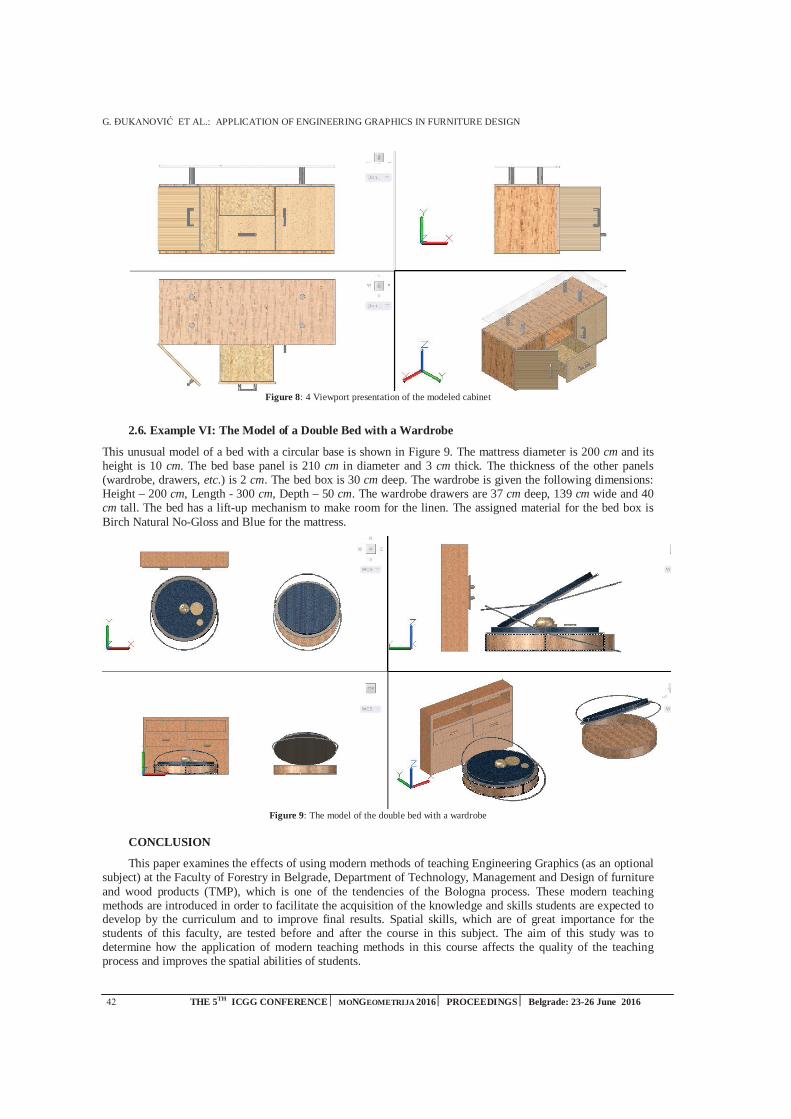
G. ĐUKANOVIĆ ET AL.: APPLICATION OF ENGINEERING GRAPHICS IN FURNITURE DESIGN
THE 5TH ICGG CONFERENCE MONGEOMETRIJA 2016 PROCEEDINGS Belgrade: 23-26 June 2016
Figure 8: 4 Viewport presentation of the modeled cabinet
2.6. Example VI: The Model of a Double Bed with a Wardrobe
This unusual model of a bed with a circular base is shown in Figure 9. The mattress diameter is 200 cm and its height is 10 cm. The bed base panel is 210 cm in diameter and 3 cm thick. The thickness of the other panels (wardrobe, drawers, etc.) is 2 cm. The bed box is 30 cm deep. The wardrobe is given the following dimensions: Height – 200 cm, Length - 300 cm, Depth – 50 cm. The wardrobe drawers are 37 cm deep, 139 cm wide and 40 cm tall. The bed has a lift-up mechanism to make room for the linen. The assigned material for the bed box is Birch Natural No-Gloss and Blue for the mattress.
Figure 9: The model of the double bed with a wardrobe
CONCLUSION
This paper examines the effects of using modern methods of teaching Engineering Graphics (as an optional subject) at the Faculty of Forestry in Belgrade, Department of Technology, Management and Design of furniture and wood products (TMP), which is one of the tendencies of the Bologna process. These modern teaching methods are introduced in order to facilitate the acquisition of the knowledge and skills students are expected to develop by the curriculum and to improve final results. Spatial skills, which are of great importance for the students of this faculty, are tested before and after the course in this subject. The aim of this study was to determine how the application of modern teaching methods in this course affects the quality of the teaching process and improves the spatial abilities of students.
G. ĐUKANOVIĆ ET AL.: APPLICATION OF ENGINEERING GRAPHICS IN FURNITURE DESIGN
THE 5TH ICGG CONFERENCE MONGEOMETRIJA 2016 PROCEEDINGS Belgrade: 23-26 June 2016
The research was aimed at defining the system of three-dimensional presentation of furniture models using the method of augmented reality. The development of digital technology has brought about modern methods of digital presentation. Nowadays, the first step in the presentation of a piece of furniture is the creation of a three-dimensional, virtual, digital model. Afterwards, it can be presented either as a photo or as a video animation. When creating these presentations our aim was to achieve a greater degree of realism, i.e. to create an illusion of real and not the virtual world presentation.
The research was conducted by analyzing various forms of furniture pieces which are used in its designing and making on the basis of specified dimensions. Since furniture has to be aesthetically pleasing, the use of various forms contributes to its beauty and uniqueness. However, if we want these forms of furniture to be applied in modern industry, we had to examine whether their application is rationale, or how the final product justified is. The furniture forms would be made of smaller of identical elements, which would make the production more rationale. The elements to be used would be made of ecologically-friendly materials which id the current trend in the industry.
ACKNOWLEDGEMENTS
The research is financially supported by Ministry of Science and Education, Republic of Serbia, under the project number: TR37002.
REFERENCES
Đukanović G., Đorđević Đ., Obradović M. and Mišić S., 2014, Application of Curves and Surfaces of Higher Orders Obtained by Inversion in the Practice of Architecture, Proceedings of the 16th
International Conference On Geometry And Graphics - ISGG 2014, Innsbruck/Austria, Vol. 1, pp. 45-53.
Janić M., Grujović D., Đukanović G., 2008. Modeling elements of landscape design, Proceedings of 1st International Scientific Conference MoNGeometrija 2008, Vrnjačka Banja, pp. 95- 103.
Janic M., Ðukanović G., Grujović D., 2011. Modeling of a Divider in the Torrents, ICEGD 2011- ”Sustainable Eco Design”, IASI, Romania, THE 4TH International Conference on Engineering Graphics and Design, BULETINUL INSTITUTULUI POLITEHNIC DIN IAŞI Publicat de UniversitateaTehnică „Gheorghe Asachi” din Iaşi Tomul LVII (LXI), Fasc. 6, 2011 Secţia CONSTRUCŢII DE MAŞINI, pp. 263-270.
Janic M., Grujović D., Ðukanović G., Matić.V., 2011. Contemporary Furniture Design, First Serbian forestry congress-Future with forests,11-13 November 2010. congress proceedings, Faculty of Forestry University of Belgrade, Belgrade, Serbia, pp.1404-1413.
Obradović M. 2010. Computational geometry with 3D modeling, AGM book & Faculty of Civil Engineering, Belgrade (in Serbian).
Obradovic M., 2015. Computational geometry with 3D modeling, Second revised edition, Akademska misao& Faculty of Civil Engineering, Belgrade (in Serbian).
Obradovic M., 2015. Collection of solved tasks for Computational geometry with 3D modeling, Second revised edition, Akademska misao, Belgrade (in Serbian).
Omura G., 2007. Introducing AutoCAD 2008, Wiley Publishing Inc. Indianapolis, Indiana.
J.MAKSIMOVIĆ ET AL.: APPLICATION OF GEOMETRY IN GEODETIC INSTRUMENTS AND MEASUREMENT TECHNICS
THE 5TH ICGG CONFERENCE MONGEOMETRIJA 2016 PROCEEDINGS Belgrade: 23-26 June 2016 44
APPLICATION OF GEOMETRY IN GEODETIC INSTRUMENTS AND MEASUREMENT TECHNICS
Jovana Maksimović
Faculty of Civil Engineering, University of Belgrade, Belgrade, Republic of Serbia BSc., MSc student, [email protected]
Milica Mirković
Faculty of Civil Engineering, University of Belgrade, Belgrade, Republic of Serbia MSc., PhD. student , [email protected]
Ljiljana Brajović
Faculty of Civil Engineering, University of Belgrade, Belgrade, Republic of Serbia PhD., Associate Professor, [email protected]
Goran Todorović
Faculty of Civil Engineering, University of Belgrade, Belgrade, Republic of Serbia PhD., Associate Professor, [email protected]
ABSTRACT
Historically, both words ”geometry” and “geodesy” refer to the measurement of land. Although geometry became part of mathematics who studies the properties and mutual relations of figures, its principles stayed grate part of geodesy through geometrical methods of measurement and working principle of geodetic instruments. The majority of geodetic instruments are optical and their principles are based on geometrical optics, which use the ray concept as foundation. There are lot of geodetic measurement methods that are based only on geometrical laws, such as cartographical and photogrammetric projections, trigonometric and geometric levelling methods, triangulation and trilateration as technics of determination position of points on Earth surface. Global Positioning System (GPS), satellite geodesy and Very Long Baseline Interferometry (VLBI) are basically geometric too. In this paper all these methods are described and explained in order to emphasize connection between these two disciplines.
Keywords: applied geometry; geometrical geodetic methods; geometrical optics; geodesy
INTRODUCTION
The very word “geometry” literally means "measurement of land" and is derived from two Greek words e (geo) - "land" and ee (metreo) - "measure". According to Herodotus, Egyptian geometry was created because of the need to measure land plots. In a further development, the geometry is gone much farther and became part of mathematics which studies the properties and mutual relations of figures. For the measurement of land Aristotle has already introduced another name - geodesy [11].
Geodesy is the science which has two main areas, “Higher Geodesy”, which studies the shape and dimensions of the planet Earth and its gravitational field, and "Practical Geodesy" or "Engineering Geodesy", which describes the measurement of land, instruments and technics of surveying, performance of various types of projected facilities and cartography. Both areas of Geodesy apply different methods based on geometrical laws, called geometrical methods.
Like methods, principles as well as the development of geodetic instruments, are based on geometry. The first geodetic instrument, utilized for astronomical observations, used the principles of stereographic projection and it has been constructed by Hipparchus in the 2th century BC, while Erastothenes used geometrical rules to measure

J.MAKSIMOVIĆ ET AL.: APPLICATION OF GEOMETRY IN GEODETIC INSTRUMENTS AND MEASUREMENT TECHNICS
45 THE 5TH ICGG CONFERENCE MONGEOMETRIJA 2016 PROCEEDINGS Belgrade: 23-26 June 2016
radius of the Earth [11]. Further development of surveying instruments was based on the laws of geometrical optics, starting from magnifying lenses to field glasses and telescopes, which have become an integral part of modern dumpy levels, theodolites, total stations and scanners.
In the next chapters the implementation of geometry in geodetic instruments and measuring methods is presented and explained.
2. RAY TRACING IN OPTICAL INSTRUMENTS
Every optical system consists of one or more reflecting and refracting surfaces, and its basic function is to transform diverging optical wavefront coming from the object points to the converging spherical wavefront towards image points and form suitable image of an object for specific application. Since the used wavelengths of light waves are much smaller than the dimensions of optical elements in the systems, the passage of wavefronts is solving using ray concept. The optical ray is a line drawn in space corresponding to the direction of flow of radiant energy. The passage of rays through an optical system may be determined by purely geometrical procedures and it is the base of geometrical optics [5].
A ray travels between two points of a homogeneous medium as a straight line and it could be presented also with
propagating vector ��⃗ � where n indikates m-th medium. If an incident ray travels towards the interface plane between two mediums of different index of refraction n1 and n2 it is partially reflected from the plane and partially transmitted to the next medium as refracted ray (Figure 1). The incident ray and the normal to the
interface in the point of incidence (represented with vector ���⃗ ) determine the plain of incidence. The incident,
reflected and refracted rays, and their corresponding propagating vectors ��⃗ � , ��⃗ � and ��⃗ � are coplanar, laying in the plane of incidence. The reflected ray obey the law of reflection and the incident angle ei between incident ray and the normal is the same as reflecting angle er, between reflecting ray and the normal. The refracted ray obeys the law of refraction, or Snell law. It can be presented in a plane with simple equation (Eq.1):
�� ∙ ����� = �� ∙ ����� (Eq.1)
or in general with vector equation (Eq.2) [5]:
�� ∙ (��⃗ � × ���⃗ ) = ��(��⃗ � × ���⃗ ). (Eq.2)
Figure. 1: The incident reflecting and refracting rays
Ray tracing and computing the passage of rays through an optical system is purely geometrical problem and is the basic tool of optical system design. The principles of ray tracing are the same for simple and complex optical systems and the geometrical construction or computer graphics can be used owing to system complexity.
Most optical instruments are completely or partially rotationally symmetrical about single axis named optical axis of a system, and are considered as centred. The usual methods of ray tracing are developed for such systems. Aspheric rotationally symmetric surfaces are difficult to produce although their application improved quality of optical systems and ray tracing methods can be applied for them, too [1]. The ray tracing from one
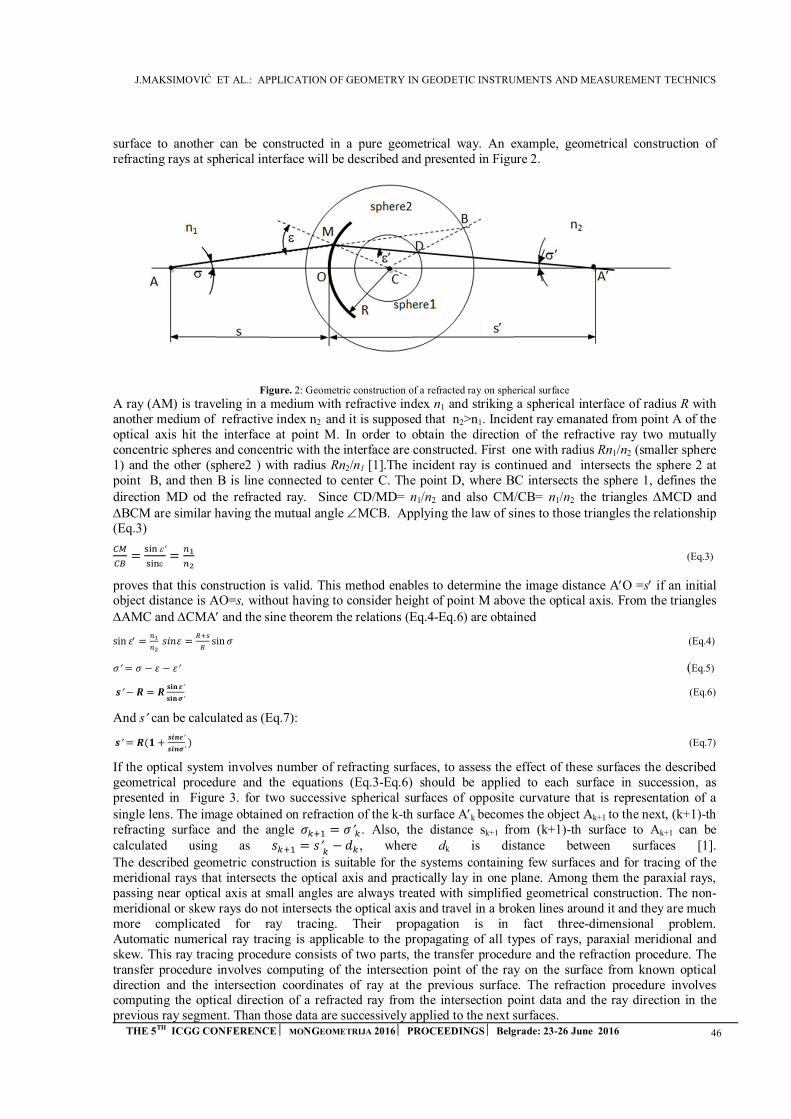
J.MAKSIMOVIĆ ET AL.: APPLICATION OF GEOMETRY IN GEODETIC INSTRUMENTS AND MEASUREMENT TECHNICS
THE 5TH ICGG CONFERENCE MONGEOMETRIJA 2016 PROCEEDINGS Belgrade: 23-26 June 2016 46
surface to another can be constructed in a pure geometrical way. An example, geometrical construction of refracting rays at spherical interface will be described and presented in Figure 2.
Figure. 2: Geometric construction of a refracted ray on spherical surface
A ray (AM) is traveling in a medium with refractive index n1 and striking a spherical interface of radius R with another medium of refractive index n2 and it is supposed that n2>n1. Incident ray emanated from point A of the optical axis hit the interface at point M. In order to obtain the direction of the refractive ray two mutually concentric spheres and concentric with the interface are constructed. First one with radius Rn1/n2 (smaller sphere 1) and the other (sphere2 ) with radius Rn2/n1 [1].The incident ray is continued and intersects the sphere 2 atpoint B, and then B is line connected to center C. The point D, where BC intersects the sphere 1, defines the direction MD od the refracted ray. Since CD/MD= n1/n2 and also CM/CB= n1/n2 the triangles MCD and BCM are similar having the mutual angle MCB. Applying the law of sines to those triangles the relationship (Eq.3)
��
��=
��� e
���e=
��
�� (Eq.3)
proves that this construction is valid. This method enables to determine the image distance AO =s if an initial object distance is AO=s, without having to consider height of point M above the optical axis. From the triangles AMC and CMA and the sine theorem the relations (Eq.4-Eq.6) are obtained
sin � =��
������ =
���
�sin � (Eq.4)
� = � − � − � (Eq.5)
�− � = ���� �
���� (Eq.6)
And s can be calculated as (Eq.7):
� = �(� +����
����) (Eq.7)
If the optical system involves number of refracting surfaces, to assess the effect of these surfaces the described geometrical procedure and the equations (Eq.3-Eq.6) should be applied to each surface in succession, as presented in Figure 3. for two successive spherical surfaces of opposite curvature that is representation of a single lens. The image obtained on refraction of the k-th surface Ak becomes the object Ak+1 to the next, (k+1)-th refracting surface and the angle ���� = �� . Also, the distance sk+1 from (k+1)-th surface to Ak+1 can be calculated using as ���� = �
�− �� , where dk is distance between surfaces [1].
The described geometric construction is suitable for the systems containing few surfaces and for tracing of the meridional rays that intersects the optical axis and practically lay in one plane. Among them the paraxial rays, passing near optical axis at small angles are always treated with simplified geometrical construction. The non-meridional or skew rays do not intersects the optical axis and travel in a broken lines around it and they are much more complicated for ray tracing. Their propagation is in fact three-dimensional problem. Automatic numerical ray tracing is applicable to the propagating of all types of rays, paraxial meridional and skew. This ray tracing procedure consists of two parts, the transfer procedure and the refraction procedure. The transfer procedure involves computing of the intersection point of the ray on the surface from known optical direction and the intersection coordinates of ray at the previous surface. The refraction procedure involves computing the optical direction of a refracted ray from the intersection point data and the ray direction in the previous ray segment. Than those data are successively applied to the next surfaces.
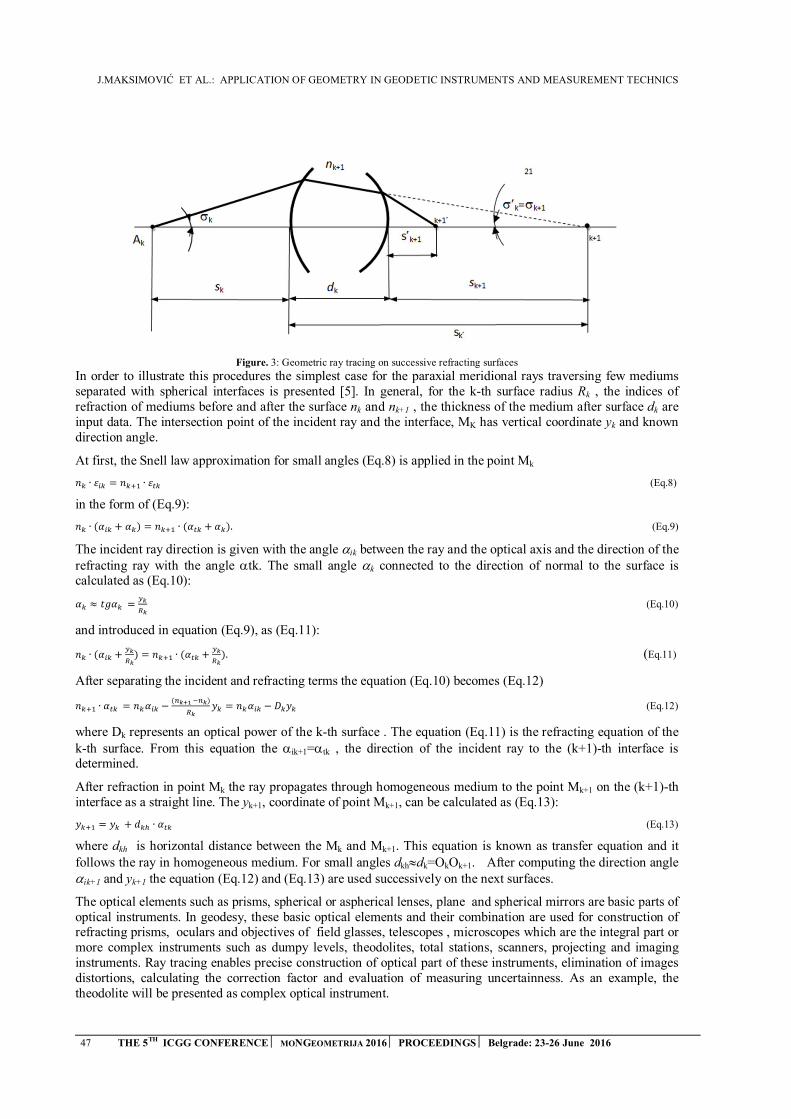
J.MAKSIMOVIĆ ET AL.: APPLICATION OF GEOMETRY IN GEODETIC INSTRUMENTS AND MEASUREMENT TECHNICS
47 THE 5TH ICGG CONFERENCE MONGEOMETRIJA 2016 PROCEEDINGS Belgrade: 23-26 June 2016
Figure. 3: Geometric ray tracing on successive refracting surfaces
In order to illustrate this procedures the simplest case for the paraxial meridional rays traversing few mediums separated with spherical interfaces is presented [5]. In general, for the k-th surface radius Rk , the indices of refraction of mediums before and after the surface nk and nk+1 , the thickness of the medium after surface dk are input data. The intersection point of the incident ray and the interface, MK has vertical coordinate yk and known direction angle.
At first, the Snell law approximation for small angles (Eq.8) is applied in the point Mk
�� ∙ ��� = ���� ∙ ��� (Eq.8)
in the form of (Eq.9):
�� ∙ (��� + ��) = ���� ∙ (��� + ��). (Eq.9)
The incident ray direction is given with the angle ik between the ray and the optical axis and the direction of the refracting ray with the angle tk. The small angle k connected to the direction of normal to the surface is calculated as (Eq.10):
�� ≈ ���� =��
�� (Eq.10)
and introduced in equation (Eq.9), as (Eq.11):
�� ∙ (��� +��
��) = ���� ∙ (��� +
��
��). (Eq.11)
After separating the incident and refracting terms the equation (Eq.10) becomes (Eq.12)
���� ∙ ��� = ����� −(�������)
���� = ����� − ���� (Eq.12)
where Dk represents an optical power of the k-th surface . The equation (Eq.11) is the refracting equation of the k-th surface. From this equation the ik+1=tk , the direction of the incident ray to the (k+1)-th interface is determined.
After refraction in point Mk the ray propagates through homogeneous medium to the point Mk+1 on the (k+1)-th interface as a straight line. The yk+1, coordinate of point Mk+1, can be calculated as (Eq.13):
���� = �� + ��� ∙ ��� (Eq.13)
where dkh is horizontal distance between the Mk and Mk+1. This equation is known as transfer equation and it follows the ray in homogeneous medium. For small angles dkhdk=OkOk+1. After computing the direction angle ik+1 and yk+1 the equation (Eq.12) and (Eq.13) are used successively on the next surfaces.
The optical elements such as prisms, spherical or aspherical lenses, plane and spherical mirrors are basic parts of optical instruments. In geodesy, these basic optical elements and their combination are used for construction of refracting prisms, oculars and objectives of field glasses, telescopes , microscopes which are the integral part or more complex instruments such as dumpy levels, theodolites, total stations, scanners, projecting and imaging instruments. Ray tracing enables precise construction of optical part of these instruments, elimination of images distortions, calculating the correction factor and evaluation of measuring uncertainness. As an example, the theodolite will be presented as complex optical instrument.
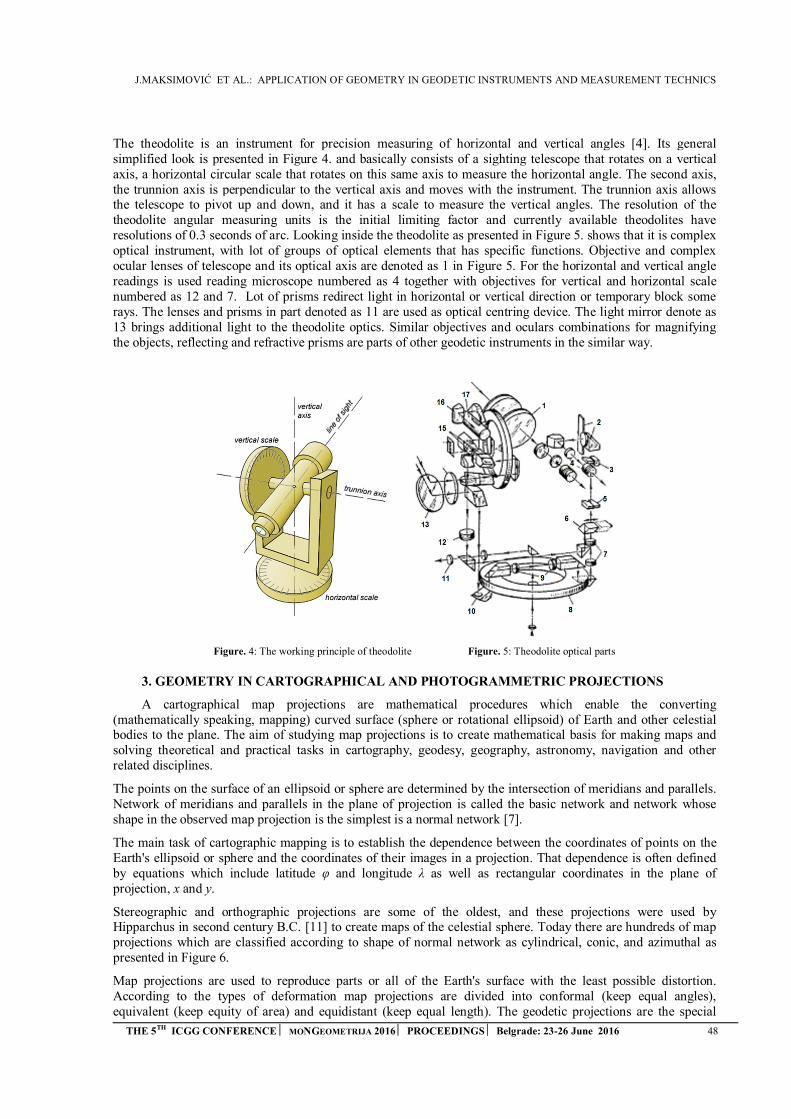
J.MAKSIMOVIĆ ET AL.: APPLICATION OF GEOMETRY IN GEODETIC INSTRUMENTS AND MEASUREMENT TECHNICS
THE 5TH ICGG CONFERENCE MONGEOMETRIJA 2016 PROCEEDINGS Belgrade: 23-26 June 2016 48
The theodolite is an instrument for precision measuring of horizontal and vertical angles [4]. Its general simplified look is presented in Figure 4. and basically consists of a sighting telescope that rotates on a vertical axis, a horizontal circular scale that rotates on this same axis to measure the horizontal angle. The second axis, the trunnion axis is perpendicular to the vertical axis and moves with the instrument. The trunnion axis allows the telescope to pivot up and down, and it has a scale to measure the vertical angles. The resolution of the theodolite angular measuring units is the initial limiting factor and currently available theodolites have resolutions of 0.3 seconds of arc. Looking inside the theodolite as presented in Figure 5. shows that it is complex optical instrument, with lot of groups of optical elements that has specific functions. Objective and complex ocular lenses of telescope and its optical axis are denoted as 1 in Figure 5. For the horizontal and vertical angle readings is used reading microscope numbered as 4 together with objectives for vertical and horizontal scale numbered as 12 and 7. Lot of prisms redirect light in horizontal or vertical direction or temporary block some rays. The lenses and prisms in part denoted as 11 are used as optical centring device. The light mirror denote as 13 brings additional light to the theodolite optics. Similar objectives and oculars combinations for magnifying the objects, reflecting and refractive prisms are parts of other geodetic instruments in the similar way.
Figure. 4: The working principle of theodolite Figure. 5: Theodolite optical parts
3. GEOMETRY IN CARTOGRAPHICAL AND PHOTOGRAMMETRIC PROJECTIONS
A cartographical map projections are mathematical procedures which enable the converting (mathematically speaking, mapping) curved surface (sphere or rotational ellipsoid) of Earth and other celestial bodies to the plane. The aim of studying map projections is to create mathematical basis for making maps and solving theoretical and practical tasks in cartography, geodesy, geography, astronomy, navigation and other related disciplines.
The points on the surface of an ellipsoid or sphere are determined by the intersection of meridians and parallels. Network of meridians and parallels in the plane of projection is called the basic network and network whose shape in the observed map projection is the simplest is a normal network [7].
The main task of cartographic mapping is to establish the dependence between the coordinates of points on the Earth's ellipsoid or sphere and the coordinates of their images in a projection. That dependence is often defined by equations which include latitude φ and longitude λ as well as rectangular coordinates in the plane of projection, x and y.
Stereographic and orthographic projections are some of the oldest, and these projections were used by Hipparchus in second century B.C. [11] to create maps of the celestial sphere. Today there are hundreds of map projections which are classified according to shape of normal network as cylindrical, conic, and azimuthal as presented in Figure 6.
Map projections are used to reproduce parts or all of the Earth's surface with the least possible distortion. According to the types of deformation map projections are divided into conformal (keep equal angles), equivalent (keep equity of area) and equidistant (keep equal length). The geodetic projections are the special
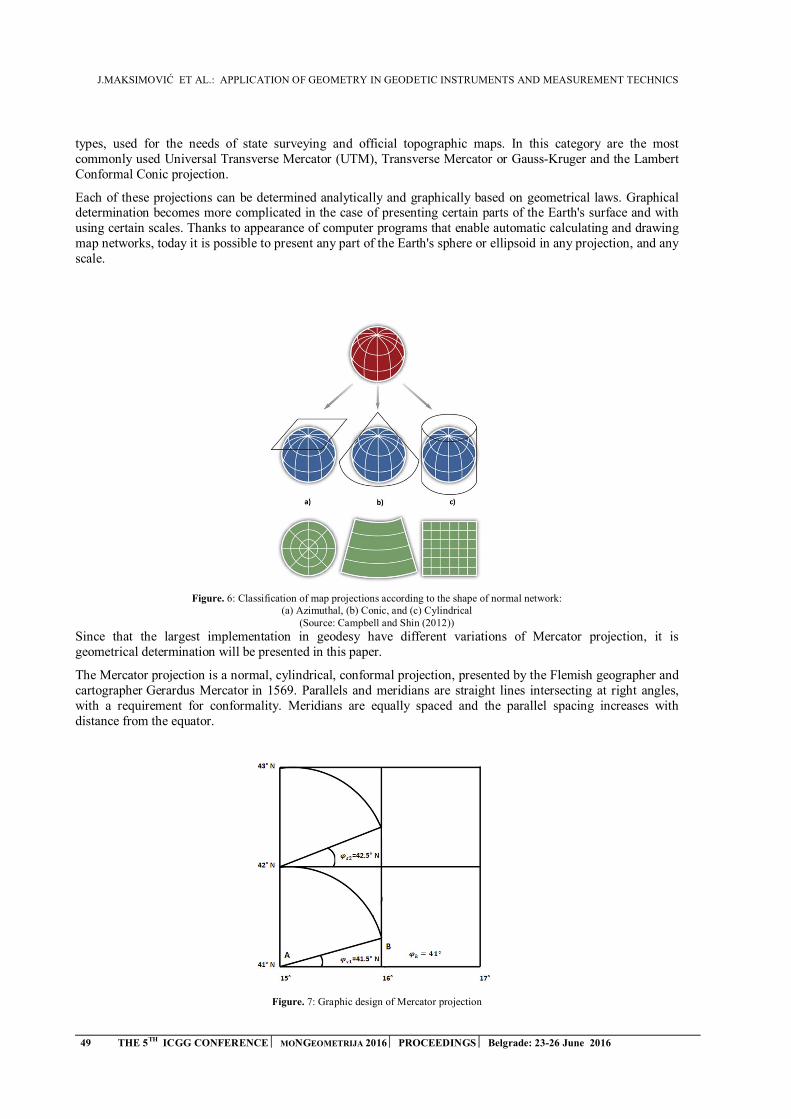
J.MAKSIMOVIĆ ET AL.: APPLICATION OF GEOMETRY IN GEODETIC INSTRUMENTS AND MEASUREMENT TECHNICS
49 THE 5TH ICGG CONFERENCE MONGEOMETRIJA 2016 PROCEEDINGS Belgrade: 23-26 June 2016
types, used for the needs of state surveying and official topographic maps. In this category are the most commonly used Universal Transverse Mercator (UTM), Transverse Mercator or Gauss-Kruger and the Lambert Conformal Conic projection.
Each of these projections can be determined analytically and graphically based on geometrical laws. Graphical determination becomes more complicated in the case of presenting certain parts of the Earth's surface and with using certain scales. Thanks to appearance of computer programs that enable automatic calculating and drawing map networks, today it is possible to present any part of the Earth's sphere or ellipsoid in any projection, and any scale.
Figure. 6: Classification of map projections according to the shape of normal network: (a) Azimuthal, (b) Conic, and (c) Cylindrical
(Source: Campbell and Shin (2012))
Since that the largest implementation in geodesy have different variations of Mercator projection, it is geometrical determination will be presented in this paper.
The Mercator projection is a normal, cylindrical, conformal projection, presented by the Flemish geographer and cartographer Gerardus Mercator in 1569. Parallels and meridians are straight lines intersecting at right angles, with a requirement for conformality. Meridians are equally spaced and the parallel spacing increases with distance from the equator.
Figure. 7: Graphic design of Mercator projection
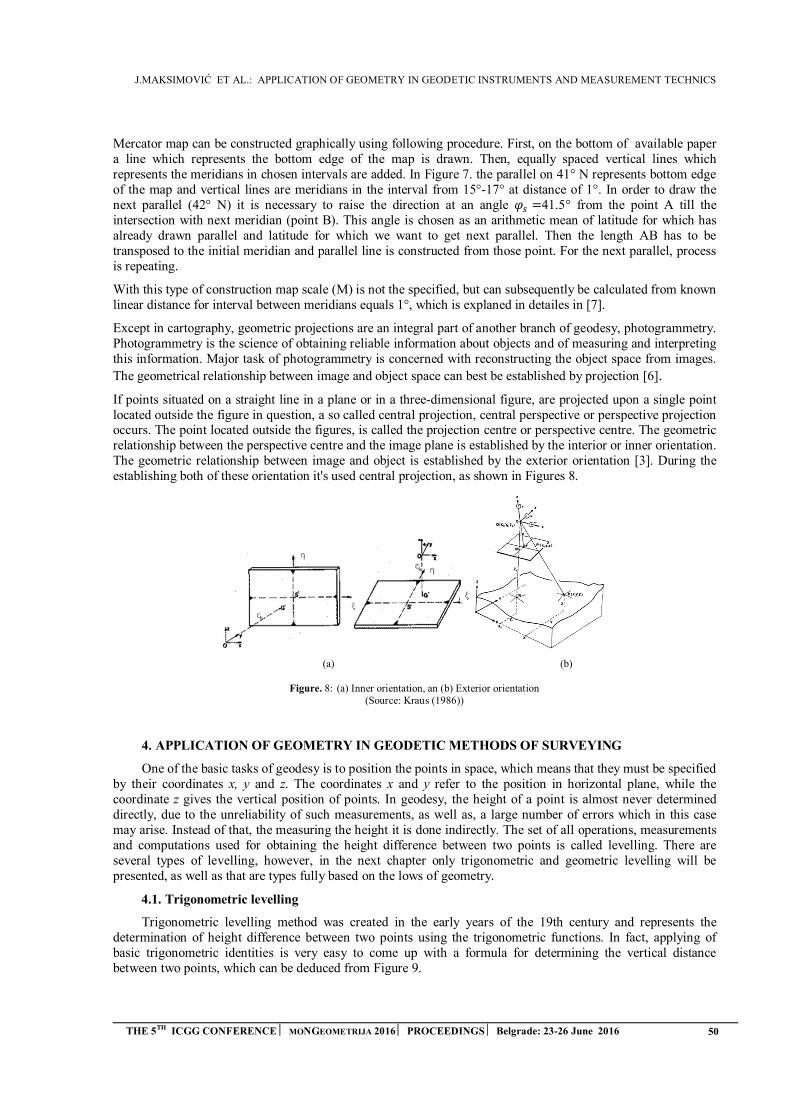
J.MAKSIMOVIĆ ET AL.: APPLICATION OF GEOMETRY IN GEODETIC INSTRUMENTS AND MEASUREMENT TECHNICS
THE 5TH ICGG CONFERENCE MONGEOMETRIJA 2016 PROCEEDINGS Belgrade: 23-26 June 2016 50
Мercator map can be constructed graphically using following procedure. First, on the bottom of available paper a line which represents the bottom edge of the map is drawn. Then, equally spaced vertical lines which represents the meridians in chosen intervals are added. In Figure 7. the parallel on 41° N represents bottom edge of the map and vertical lines are meridians in the interval from 15°-17° at distance of 1°. In order to draw the next parallel (42° N) it is necessary to raise the direction at an angle �� =41.5° from the point A till the intersection with next meridian (point B). This angle is chosen as an arithmetic mean of latitude for which has already drawn parallel and latitude for which we want to get next parallel. Then the length AB has to be transposed to the initial meridian and parallel line is constructed from those point. For the next parallel, process is repeating.
With this type of construction map scale (M) is not the specified, but can subsequently be calculated from known linear distance for interval between meridians equals 1°, which is explaned in detailes in [7].
Except in cartography, geometric projections are an integral part of another branch of geodesy, photogrammetry. Photogrammetry is the science of obtaining reliable information about objects and of measuring and interpreting this information. Major task of photogrammetry is concerned with reconstructing the object space from images.
The geometrical relationship between image and object space can best be established by projection [6].
If points situated on a straight line in a plane or in a three-dimensional figure, are projected upon a single point located outside the figure in question, a so called central projection, central perspective or perspective projection occurs. The point located outside the figures, is called the projection centre or perspective centre. The geometric relationship between the perspective centre and the image plane is established by the interior or inner orientation. The geometric relationship between image and object is established by the exterior orientation [3]. During the establishing both of these orientation it's used central projection, as shown in Figures 8.
(a) (b)
Figure. 8: (a) Inner orientation, an (b) Exterior orientation (Source: Kraus (1986))
4. APPLICATION OF GEOMETRY IN GEODETIC METHODS OF SURVEYING
One of the basic tasks of geodesy is to position the points in space, which means that they must be specified by their coordinates x, y and z. The coordinates x and y refer to the position in horizontal plane, while the coordinate z gives the vertical position of points. In geodesy, the height of a point is almost never determined directly, due to the unreliability of such measurements, as well as, a large number of errors which in this case may arise. Instead of that, the measuring the height it is done indirectly. The set of all operations, measurements and computations used for obtaining the height difference between two points is called levelling. There are several types of levelling, however, in the next chapter only trigonometric and geometric levelling will be presented, as well as that are types fully based on the lows of geometry.
4.1. Trigonometric levelling
Trigonometric levelling method was created in the early years of the 19th century and represents the determination of height difference between two points using the trigonometric functions. In fact, applying of basic trigonometric identities is very easy to come up with a formula for determining the vertical distance between two points, which can be deduced from Figure 9.
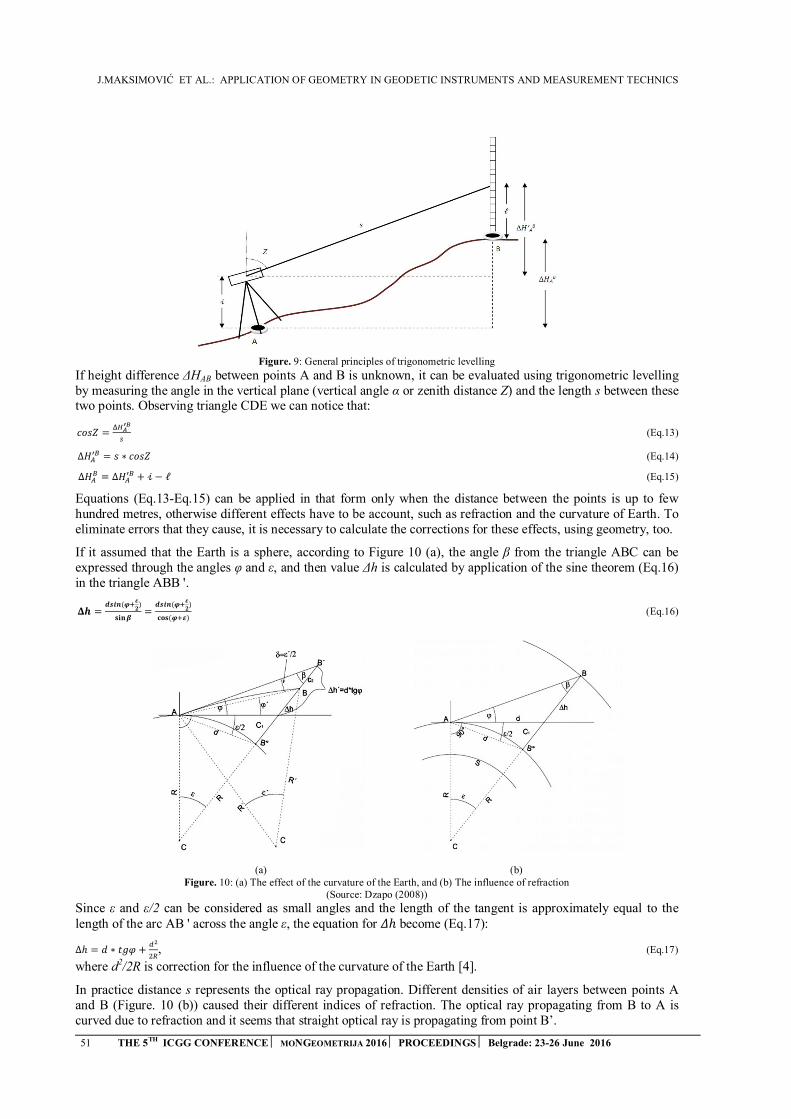
J.MAKSIMOVIĆ ET AL.: APPLICATION OF GEOMETRY IN GEODETIC INSTRUMENTS AND MEASUREMENT TECHNICS
51 THE 5TH ICGG CONFERENCE MONGEOMETRIJA 2016 PROCEEDINGS Belgrade: 23-26 June 2016
Figure. 9: General principles of trigonometric levelling
If height difference ΔHAB between points A and B is unknown, it can be evaluated using trigonometric levelling by measuring the angle in the vertical plane (vertical angle α or zenith distance Z) and the length s between these two points. Observing triangle CDE we can notice that:
���� =���
��
� (Eq.13)
Δ���� = � ∗ ���� (Eq.14)
��� = ��
�� + � − ℓ (Eq.15)
Equations (Eq.13-Eq.15) can be applied in that form only when the distance between the points is up to few hundred metres, otherwise different effects have to be account, such as refraction and the curvature of Earth. To eliminate errors that they cause, it is necessary to calculate the corrections for these effects, using geometry, too.
If it assumed that the Earth is a sphere, according to Figure 10 (a), the angle β from the triangle ABC can be expressed through the angles φ and ε, and then value Δh is calculated by application of the sine theorem (Eq.16) in the triangle ABB '.
�� =����(��
�
�)
����=
����(���
�)
���(���) (Eq.16)
(a) (b) Figure. 10: (a) The effect of the curvature of the Earth, and (b) The influence of refraction
(Source: Dzapo (2008))
Since ε and ε/2 can be considered as small angles and the length of the tangent is approximately equal to the length of the arc AB ' across the angle ε, the equation for �ℎ become (Eq.17):
Δℎ = � ∗ ��� +��
��, (Eq.17)
where d2/2R is correction for the influence of the curvature of the Earth [4].
In practice distance s represents the optical ray propagation. Different densities of air layers between points A and B (Figure. 10 (b)) caused their different indices of refraction. The optical ray propagating from B to A is curved due to refraction and it seems that straight optical ray is propagating from point B’.
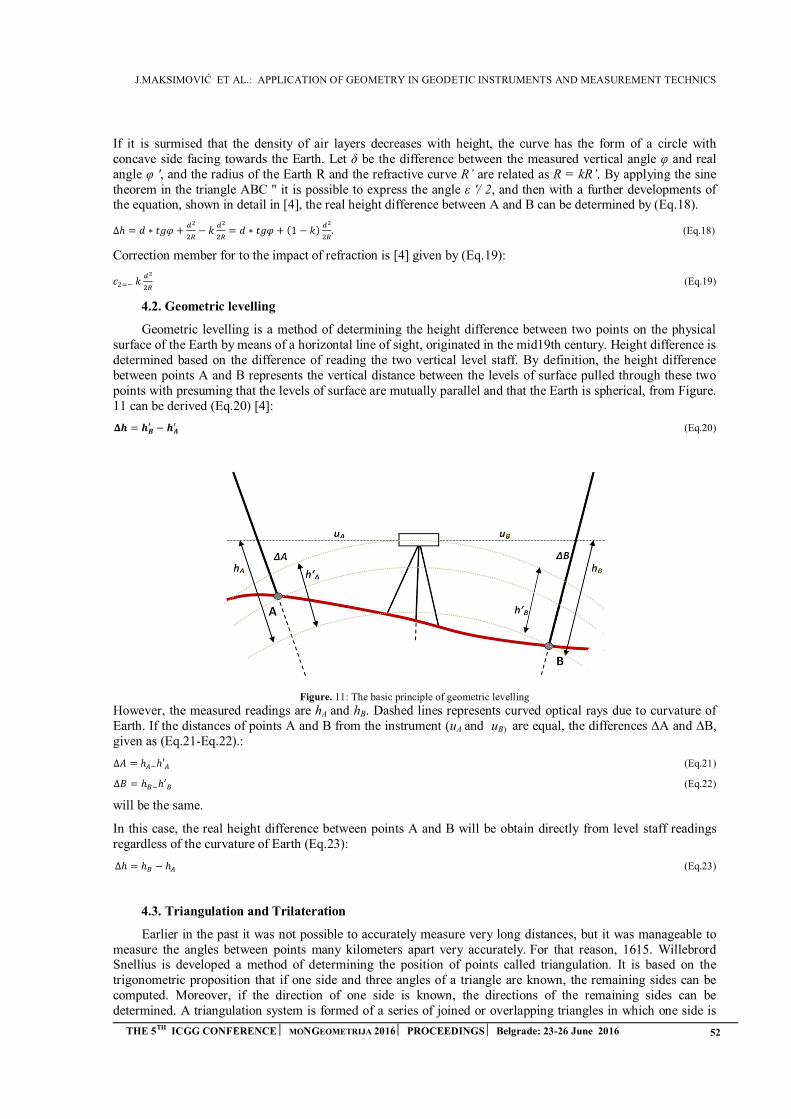
J.MAKSIMOVIĆ ET AL.: APPLICATION OF GEOMETRY IN GEODETIC INSTRUMENTS AND MEASUREMENT TECHNICS
THE 5TH ICGG CONFERENCE MONGEOMETRIJA 2016 PROCEEDINGS Belgrade: 23-26 June 2016 52
If it is surmised that the density of air layers decreases with height, the curve has the form of a circle with concave side facing towards the Earth. Let δ be the difference between the measured vertical angle φ and real angle φ ', and the radius of the Earth R and the refractive curve R’ are related as R = kR’. By applying the sine theorem in the triangle ABC '' it is possible to express the angle ε '/ 2, and then with a further developments of the equation, shown in detail in [4], the real height difference between A and B can be determined by (Eq.18).
Δℎ = � ∗ ��� +��
��− �
��
��= � ∗ ��� + (1 − �)
��
��. (Eq.18)
Correction member for to the impact of refraction is [4] given by (Eq.19):
�������
��(Eq.19)
4.2. Geometric levelling
Geometric levelling is a method of determining the height difference between two points on the physical surface of the Earth by means of a horizontal line of sight, originated in the mid19th century. Height difference is determined based on the difference of reading the two vertical level staff. By definition, the height difference between points A and B represents the vertical distance between the levels of surface pulled through these two points with presuming that the levels of surface are mutually parallel and that the Earth is spherical, from Figure. 11 can be derived (Eq.20) [4]:
�� = ��� − ��
� (Eq.20)
Figure. 11: The basic principle of geometric levelling
However, the measured readings are hA and hB. Dashed lines represents curved optical rays due to curvature of Earth. If the distances of points A and B from the instrument (uA and uB) are equal, the differences ∆A and ∆B, given as (Eq.21-Eq.22).:
Δ� = ℎ��ℎ′� (Eq.21)
Δ� = ℎ��ℎ′� (Eq.22)
will be the same.
In this case, the real height difference between points A and B will be obtain directly from level staff readings regardless of the curvature of Earth (Eq.23):
Δℎ = ℎ� − ℎ� (Eq.23)
4.3. Triangulation and Trilateration
Earlier in the past it was not possible to accurately measure very long distances, but it was manageable to measure the angles between points many kilometers apart very accurately. For that reason, 1615. Willebrord Snellius is developed a method of determining the position of points called triangulation. It is based on the trigonometric proposition that if one side and three angles of a triangle are known, the remaining sides can be computed. Moreover, if the direction of one side is known, the directions of the remaining sides can be determined. A triangulation system is formed of a series of joined or overlapping triangles in which one side is

J.MAKSIMOVIĆ ET AL.: APPLICATION OF GEOMETRY IN GEODETIC INSTRUMENTS AND MEASUREMENT TECHNICS
53 THE 5TH ICGG CONFERENCE MONGEOMETRIJA 2016 PROCEEDINGS Belgrade: 23-26 June 2016
measured and remaining sides are calculated from angles measured at the vertices of the triangles. The vertices of the triangles are termed as triangulation stations and the side of the triangle whose length is known, is called the base line.
Since the entire process of determining the coordinates uses connectivity of geometric figures, trigonometric relations and the theorems, we can see that essence of triangulation lies in geometry [2]. Forms of trigonometric networks can be numerous (chain of triangles, braced quadrilaterals, centred triangles and polygons etc.). The shape of the triangles is significant as there is a lot of inaccuracy in a long skinny triangle, but one with base angles of about 45 degrees is ideal.
The idea of triangulation is that if we know the value of a one side and all angles in a triangle, unknown sides can be computed, and then use that information to get coordinates of points. Linear measurements in triangulation are used to determine the scale of the network and to prevent deformation.
All computations in the trigonometric network are carried out mainly by the rules of spherical and planar trigonometry. Since the network is located at the physical surface of the Earth which is not an ideal surface, it is necessary to connect trigonometric network with the Earth as a celestial body. This is achieved by knowing of ellipsoidal coordinates of a one trigonometric point and azimuth θ of a one trigonometric side.
Figure. 12 : The principle of triangulation
If all the angles in triangles ABC and BCD are measured (Figure 2.), as well as the length L and the azimuth θ, and ellipsoidal coordinates of the point A are familiar, calculation of all sides of the triangles (l1, l2, etc.) can be done by applying sine theorem. Then the azimuths of every side (like θBA) are calculated and using procedure described in details in [2] the the coordinate X and Y of all points in triangle can be determined from (Eq.24-Eq.25.):
�� = �� + ����� (Eq.24)
�� = �� + ����� (Eq.25)
Than the coordinates of other points in a triangle can be obtained successively relative to a predetermined point.
When we speak about triangulation, it's unavoidable to mention a method which is, in fact, a contrast of triangulation, and is also based on the geometry of triangles.
Middle of 20th century brings us development of accurate methods of measuring long distances. Thanks to this, a new method, trilateration, is appeared. Unlike triangulation, which uses the measurement of angles to determine location, trilateration uses measured distances. The distances in a triangle could then be measured directly, and the angles can be calculated using the cosine, sine and tangent theorem [2]. The process of calculating coordinates of points through the chain of triangles is then the same as for triangulation.
It has the following advantages:
Because the fact that distances can be measured more accurately than angles, it is more accurate thanthe triangulation,
It is less expensive than triangulation.
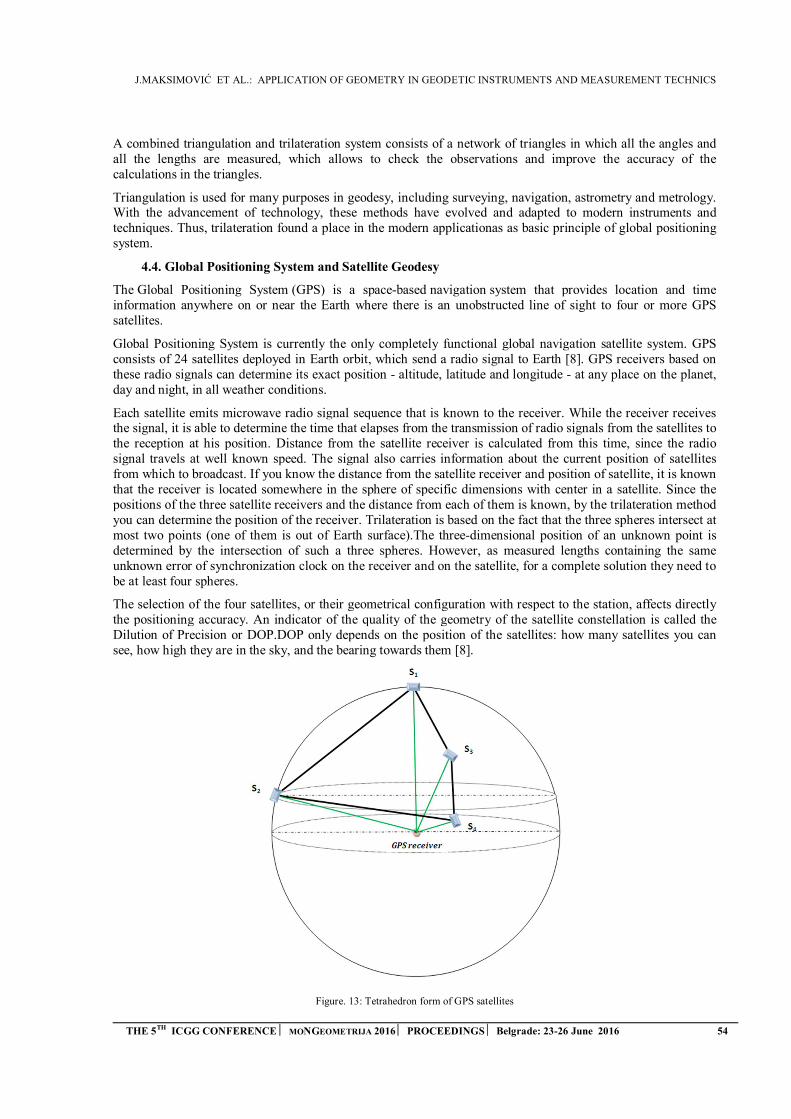
J.MAKSIMOVIĆ ET AL.: APPLICATION OF GEOMETRY IN GEODETIC INSTRUMENTS AND MEASUREMENT TECHNICS
THE 5TH ICGG CONFERENCE MONGEOMETRIJA 2016 PROCEEDINGS Belgrade: 23-26 June 2016 54
A combined triangulation and trilateration system consists of a network of triangles in which all the angles and all the lengths are measured, which allows to check the observations and improve the accuracy of the calculations in the triangles.
Triangulation is used for many purposes in geodesy, including surveying, navigation, astrometry and metrology. With the advancement of technology, these methods have evolved and adapted to modern instruments and techniques. Thus, trilateration found a place in the modern applicationas as basic principle of global positioning system.
4.4. Global Positioning System and Satellite Geodesy
The Global Positioning System (GPS) is a space-based navigation system that provides location and time information anywhere on or near the Earth where there is an unobstructed line of sight to four or more GPS satellites.
Global Positioning System is currently the only completely functional global navigation satellite system. GPS consists of 24 satellites deployed in Earth orbit, which send a radio signal to Earth [8]. GPS receivers based on these radio signals can determine its exact position - altitude, latitude and longitude - at any place on the planet, day and night, in all weather conditions.
Each satellite emits microwave radio signal sequence that is known to the receiver. While the receiver receives the signal, it is able to determine the time that elapses from the transmission of radio signals from the satellites to the reception at his position. Distance from the satellite receiver is calculated from this time, since the radio signal travels at well known speed. The signal also carries information about the current position of satellites from which to broadcast. If you know the distance from the satellite receiver and position of satellite, it is known that the receiver is located somewhere in the sphere of specific dimensions with center in a satellite. Since the positions of the three satellite receivers and the distance from each of them is known, by the trilateration method you can determine the position of the receiver. Trilateration is based on the fact that the three spheres intersect at most two points (one of them is out of Earth surface).The three-dimensional position of an unknown point is determined by the intersection of such a three spheres. However, as measured lengths containing the same unknown error of synchronization clock on the receiver and on the satellite, for a complete solution they need to be at least four spheres.
The selection of the four satellites, or their geometrical configuration with respect to the station, affects directly the positioning accuracy. An indicator of the quality of the geometry of the satellite constellation is called the Dilution of Precision or DOP.DOP only depends on the position of the satellites: how many satellites you can see, how high they are in the sky, and the bearing towards them [8].
Figure. 13: Tetrahedron form of GPS satellites
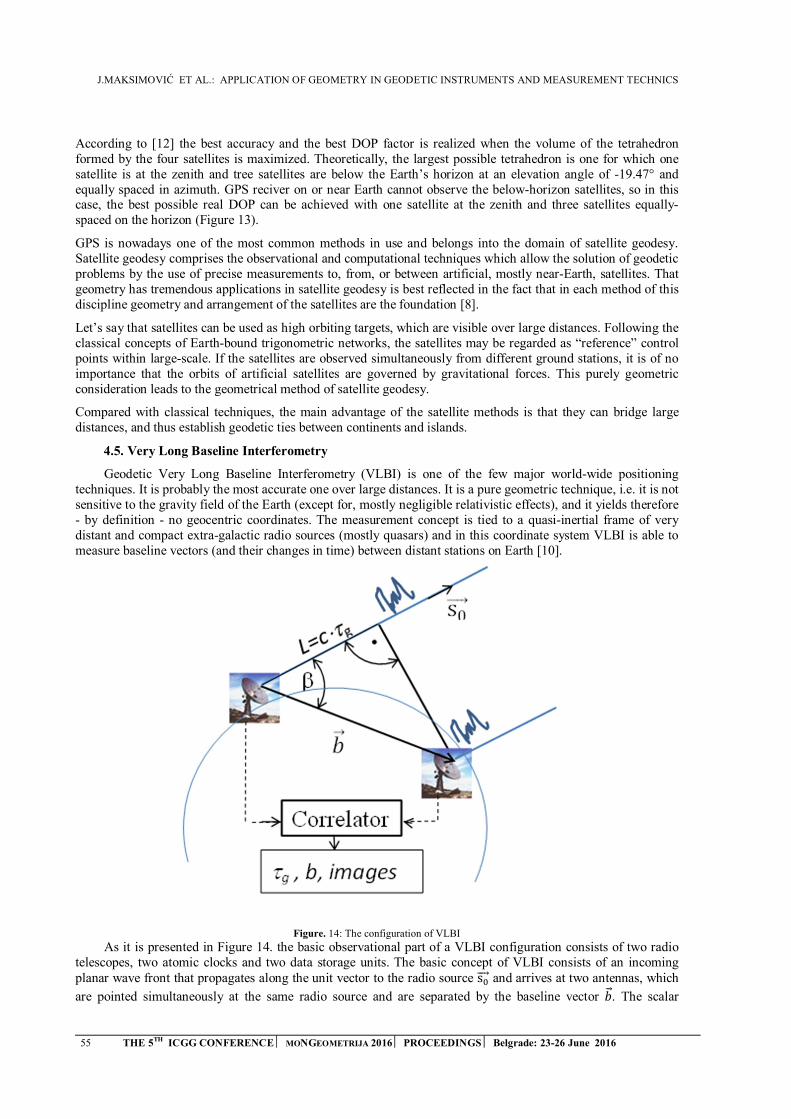
J.MAKSIMOVIĆ ET AL.: APPLICATION OF GEOMETRY IN GEODETIC INSTRUMENTS AND MEASUREMENT TECHNICS
55 THE 5TH ICGG CONFERENCE MONGEOMETRIJA 2016 PROCEEDINGS Belgrade: 23-26 June 2016
According to [12] the best accuracy and the best DOP factor is realized when the volume of the tetrahedron formed by the four satellites is maximized. Theoretically, the largest possible tetrahedron is one for which one satellite is at the zenith and tree satellites are below the Earth’s horizon at an elevation angle of -19.47° and equally spaced in azimuth. GPS reciver on or near Earth cannot observe the below-horizon satellites, so in this case, the best possible real DOP can be achieved with one satellite at the zenith and three satellites equally-spaced on the horizon (Figure 13).
GPS is nowadays one of the most common methods in use and belongs into the domain of satellite geodesy. Satellite geodesy comprises the observational and computational techniques which allow the solution of geodetic problems by the use of precise measurements to, from, or between artificial, mostly near-Earth, satellites. That geometry has tremendous applications in satellite geodesy is best reflected in the fact that in each method of this discipline geometry and arrangement of the satellites are the foundation [8].
Let’s say that satellites can be used as high orbiting targets, which are visible over large distances. Following the classical concepts of Earth-bound trigonometric networks, the satellites may be regarded as “reference” control points within large-scale. If the satellites are observed simultaneously from different ground stations, it is of no importance that the orbits of artificial satellites are governed by gravitational forces. This purely geometric consideration leads to the geometrical method of satellite geodesy.
Compared with classical techniques, the main advantage of the satellite methods is that they can bridge large distances, and thus establish geodetic ties between continents and islands.
4.5. Very Long Baseline Interferometry
Geodetic Very Long Baseline Interferometry (VLBI) is one of the few major world-wide positioning techniques. It is probably the most accurate one over large distances. It is a pure geometric technique, i.e. it is not sensitive to the gravity field of the Earth (except for, mostly negligible relativistic effects), and it yields therefore - by definition - no geocentric coordinates. The measurement concept is tied to a quasi-inertial frame of very distant and compact extra-galactic radio sources (mostly quasars) and in this coordinate system VLBI is able to measure baseline vectors (and their changes in time) between distant stations on Earth [10].
Figure. 14: The configuration of VLBI
As it is presented in Figure 14. the basic observational part of a VLBI configuration consists of two radio telescopes, two atomic clocks and two data storage units. The basic concept of VLBI consists of an incoming planar wave front that propagates along the unit vector to the radio source s����⃗ and arrives at two antennas, which
are pointed simultaneously at the same radio source and are separated by the baseline vector ��⃗ . The scalar

J.MAKSIMOVIĆ ET AL.: APPLICATION OF GEOMETRY IN GEODETIC INSTRUMENTS AND MEASUREMENT TECHNICS
THE 5TH ICGG CONFERENCE MONGEOMETRIJA 2016 PROCEEDINGS Belgrade: 23-26 June 2016 56
product of ��⃗ and �����⃗ divided by the speed of light c determines the primary geodetic observable, geometric delay τg (Eq.26) [9] :
�� = �� − �� =���⃗ ∙������⃗
�=
�����
� (Eq.26)
It contains all the information for the geodetic analysis as it is dependent on the position of the telescopes, the position of the source, etc. Also, observable only depends on fundamental physics as it is derived from a realization of the atomic second and a clock synchronization convention. The second independent observable is delay rate �̇�, the time derivative of τg. Their value for each observation is derived via a correlation process. The
correlator is located at a central institute, to which all recorded data are sent.
Using measurements from different sources the precision of 1mm for horizontal and 2-3mm in vertical direction are achieved.
Generally, radio telescope consists of radio antenna of parabolic shape (parabolic dishes) and radio receiver. One or more antennas collect the incoming waves, in the same way as a curved mirror can focus visible light to a point. The amount of incoming radiation that can be collected depends on the size of its dish , and the size of dishes are up to 70 meters.
The analysis of VLBI data for astrometric and geodetic purposes requires the estimation of source positions, station positions, Earth orientation parameters (EOP), and parameters characterizing the behaviour of the clock and atmosphere at each station.
The angular resolution achieved by this technique is presently superior to any other technique using astronomical observations. The resolution of the Earth-based VLBI is, however, limited by the physical dimension of the Earth. This limitation has now been overcome by Space Very Long Baseline Interferometry (SVLBI), in which the orbiting radio telescope is operated in conjunction with the ground-based radio telescopes. The SVLBI main observables, the delay and delay rate, contain information related to the geometry of ground station – satellite – radio source positions [9].
CONCLUSION
The described geodetic methods and instrumental principles show that geometry and geodesy are tightly connected from their first appearances till nowadays. The development of more accurate instruments and combining of different geodetic methods encourages linking and practical applications of different areas of geometry in geodesy.
REFERENCES
1. Begunov, B. N., Zakaznov N. P., Kiryushin, S. I. and Kuzichev, V. I., 1988. Optical instrumentation-
theory and design, Mir Publishers, Moskva, Union of Soviet Socialist Republics
2. Chandra, A. M., 2002. Higher surveying. New Age International, New Delhi, India
3. Derenyi, E. E., 1996. Photogrammetry: The concepts, Department of Geodesy and Geomatics
Engineering, University of New Brunswick, Canada
4. Džapo, M., 2008. Izmjera zemljišta. Faculty of Geodesy, University of Zagreb, Zagreb, Croatia
5. Hecht E., 1987. Optics. Second edition. Addison-Wesley Publishing Company, Inc., California, USA
6. Kraus, K., 1986. Fotogrametrija-Knjiga 1:Osnove i standardni postupci. Naučna knjiga, Beograd,
Serbia
7. Lušić, Z., 2006. Terestrička navigacija, Faculty of Maritime Studies, University of Split, Croatia
8. Seeber, G., 2003. Satellite Geodesy. Second edition. Walter de Gruyter, Berlin, Germany
9. Schuh, H. and Behrend, D., 2012. VLBI:a fascinating technique for geodesy and astrometry. Journal of
Geodinamics, 61. pp 68 -80.
10. Špoljarić, D. 2012. VLBI u geodetskoj astronomiji. Ekscentar, 4. pp 12-18.
11. Vanicek, P. and Krakiwsky, E. J., 1986.Geodesy: the concepts. Second edition. Amsterdam, North
Holland
12. Zheng, Z., Huang, C., Feng, C. and Zhang, F., 2003. Selection of GPS satellites for the Optimum
Geometry. Chinese Astronomy and Astrophyisics, 27. pp 80-87.
M. SALEKH, М. RYNKOVSKAYA : APPLICATION OF LATTICE SHELLS WHEN SHAPING PROGRESSIVE ARCHITECTURE
THE 5TH ICGG CONFERENCE MONGEOMETRIJA 2016 PROCEEDINGS Belgrade: 23-26 June 2016 57
Fig 1. Shopping center MyZeil in Frankfurt
APPLICATION OF LATTICE SHELLS WHEN SHAPING PROGRESSIVE ARCHITECTURE
Maria Salekh
Peoples' Friendship University of Russia, Moscow
Student, Department of Architecture and Urban Planning,
Marina Rynkovskaya
Peoples' Friendship University of Russia, Moscow
Ph.D., Associate Professor, Department of Strength of Materials and Structures,
ABSTRACT
Lattice shells are modern load-bearing structures, which allow solving a range of topical issues related to the design and construction of various buildings. This type of structure was rather widespread in the progressive architecture of the XXI century and proved an invaluable impact on the morphogenesis of modern architecture. The relevance of the topic is that the use of the grid shells persuades architects and engineers to create innovative dimensions.
Keywords: lattice shells; progressive architecture; applied geometry; biomorphic forms; BIM technologies
Introduction The construction of grid shells leads to several solutions such as the overlap of large spans of buildings (Fig 1), protection from extreme weather conditions (the creation of geodesic domes), and the creation of biomorphic forms that have a beneficial impact on human health and perception [1]. Lattice structures are usually made of bars which are connected by different types of joints and often used with cyclic surfaces [2].
The first reference of grid shells appeared in ancient Rome [3] where a variety of domes and arches were used. Common technology of the bricks construction (Fig. 2) prevented the growth of a new formation, therefore the structure of lattice shells have developed only in the mid-nineteenth century. Due to an opportunity to use

M. SALEKH, М. RYNKOVSKAYA : APPLICATION OF LATTICE SHELLS WHEN SHAPING PROGRESSIVE ARCHITECTURE
58 THE 5TH ICGG CONFERENCE MONGEOMETRIJA 2016 PROCEEDINGS Belgrade: 23-26 June 2016
Fig. 3 Tubular nozzles on the elastically flexible rods kevlar
or wire spring working on contraction, rods - tension
Fig. 2 Brick-arch lattice with longitudinal seams, Pantheon
Fig. 4. Construction of a skyscraper Mary Axe, architect Norman Foster
Fig. 6 Capital Gate in Abu Dhabi, U.A.E.
Fig. 5 Fragment of a joint of a grid shell of Japan Pavilion in
Hanover
construction materials such as steel and iron, engineers and architects began to use the domes and vaults based on a metal frame. This technology reduced the weight of the coating and the ability to make a translucent structure [2]. In 1896 V.G. Shukhov (a Russian engineer and architect) was the first scientist who used the architecture of steel lattice (in the shape of hyperboloid) shell with diamond-bearing bars which all carried roughly the same load. That is why all bars could be made from the same rolling profile and the whole coating worked as a unit.
Application and problems
The widely spread problem of most grid shells is the joints of the crossed rods. As a result, it comes out that the special design of the joints leads to considerable economic loses. Fig. 3 presents options that can develop joints and connections in the grid shells design [4]. Some other information about joints of grid shells can be found in [5].
Application of lattice shells became beneficial when shaping buildings of the "high-tech" style and skyscrapers (Fig. 4). There is a plenty of examples of grid shells in the world, but they are still actual [6], [7]. Finding the form of the shell is a very important point [8-12]. The double-layer timber gridshell can also be
used as a part of a building like this was done for the Weald &
Downland Open Air Museum in Sussex (UK) [13]. Typically, the most common material that is used for lattice shells is metal. However, the composites [14], the wood and even cardboard are used in order to save the resources, just like in the construction of the Japan Pavilion at EXPO 2000 in Hanover (Fig. 5). The engineers
from the Bureau Happold suggested using the relaxation – the property of the paper to reset (after some time) the internal stresses which arise from bending or stretching. Such innovative approach gradually helped to solve economic problems.
Along with the common construction of grid shells, there is a diagonal lattice shell, which allows reducing the thickness of the outer walls of the building. An example of this approach is the leaning tower «Capital Gate» (height - 162 meters, the slope – 18 degrees) (Fig. 6). It was built in 2011 in Abu Dhabi, United Arab Emirates. Innovative solutions in the construction of the building is the steel skeleton which consists of curved rods with diagrid interactions. The modern technology «diagrid» means that the internal steel lattice in the atrium copies the external diagonal lattice. This approach reduces the weight of the building, not allowing the structure to collapse under the load of the upper floors.
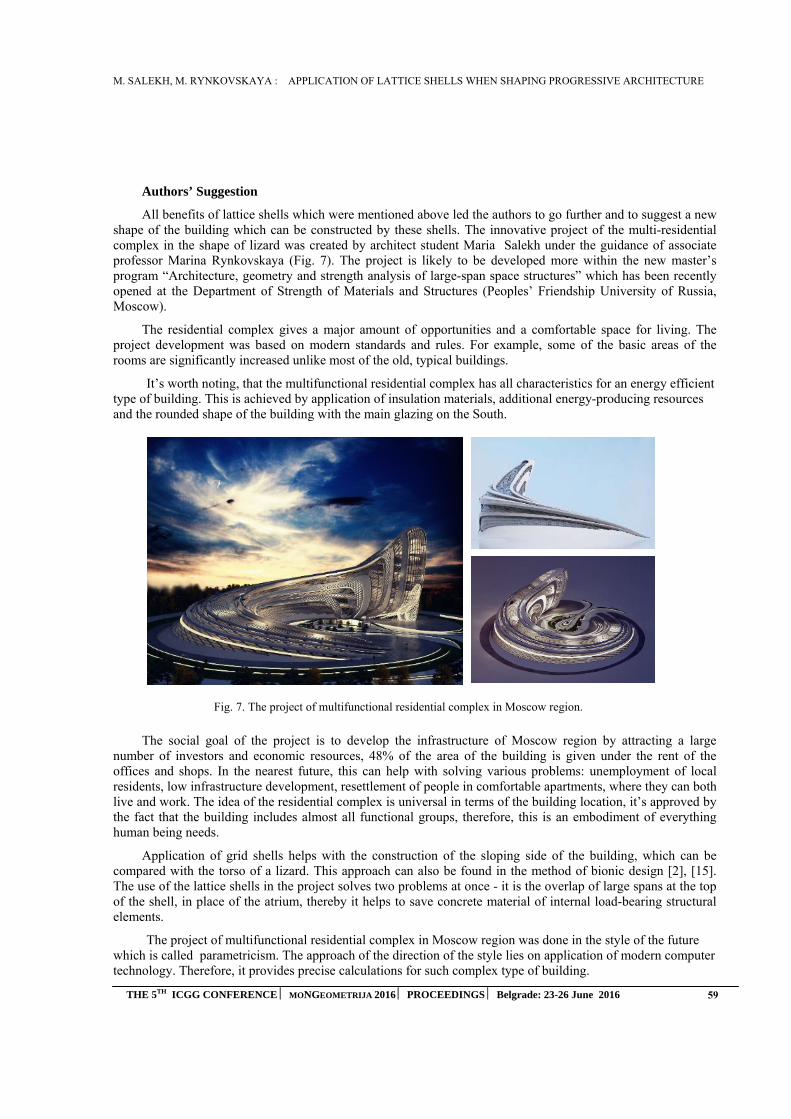
M. SALEKH, М. RYNKOVSKAYA : APPLICATION OF LATTICE SHELLS WHEN SHAPING PROGRESSIVE ARCHITECTURE
THE 5TH ICGG CONFERENCE MONGEOMETRIJA 2016 PROCEEDINGS Belgrade: 23-26 June 2016 59
Fig. 7. The project of multifunctional residential complex in Moscow region.
Authors’ Suggestion
All benefits of lattice shells which were mentioned above led the authors to go further and to suggest a new shape of the building which can be constructed by these shells. The innovative project of the multi-residential complex in the shape of lizard was created by architect student Maria Salekh under the guidance of associate professor Marina Rynkovskaya (Fig. 7). The project is likely to be developed more within the new master’s program “Architecture, geometry and strength analysis of large-span space structures” which has been recently opened at the Department of Strength of Materials and Structures (Peoples’ Friendship University of Russia, Moscow).
The residential complex gives a major amount of opportunities and a comfortable space for living. The project development was based on modern standards and rules. For example, some of the basic areas of the rooms are significantly increased unlike most of the old, typical buildings.
It’s worth noting, that the multifunctional residential complex has all characteristics for an energy efficient type of building. This is achieved by application of insulation materials, additional energy-producing resources and the rounded shape of the building with the main glazing on the South.
The social goal of the project is to develop the infrastructure of Moscow region by attracting a large number of investors and economic resources, 48% of the area of the building is given under the rent of the offices and shops. In the nearest future, this can help with solving various problems: unemployment of local residents, low infrastructure development, resettlement of people in comfortable apartments, where they can both live and work. The idea of the residential complex is universal in terms of the building location, it’s approved by the fact that the building includes almost all functional groups, therefore, this is an embodiment of everything human being needs.
Application of grid shells helps with the construction of the sloping side of the building, which can be compared with the torso of a lizard. This approach can also be found in the method of bionic design [2], [15]. The use of the lattice shells in the project solves two problems at once - it is the overlap of large spans at the top of the shell, in place of the atrium, thereby it helps to save concrete material of internal load-bearing structural elements.
The project of multifunctional residential complex in Moscow region was done in the style of the future which is called parametricism. The approach of the direction of the style lies on application of modern computer technology. Therefore, it provides precise calculations for such complex type of building.
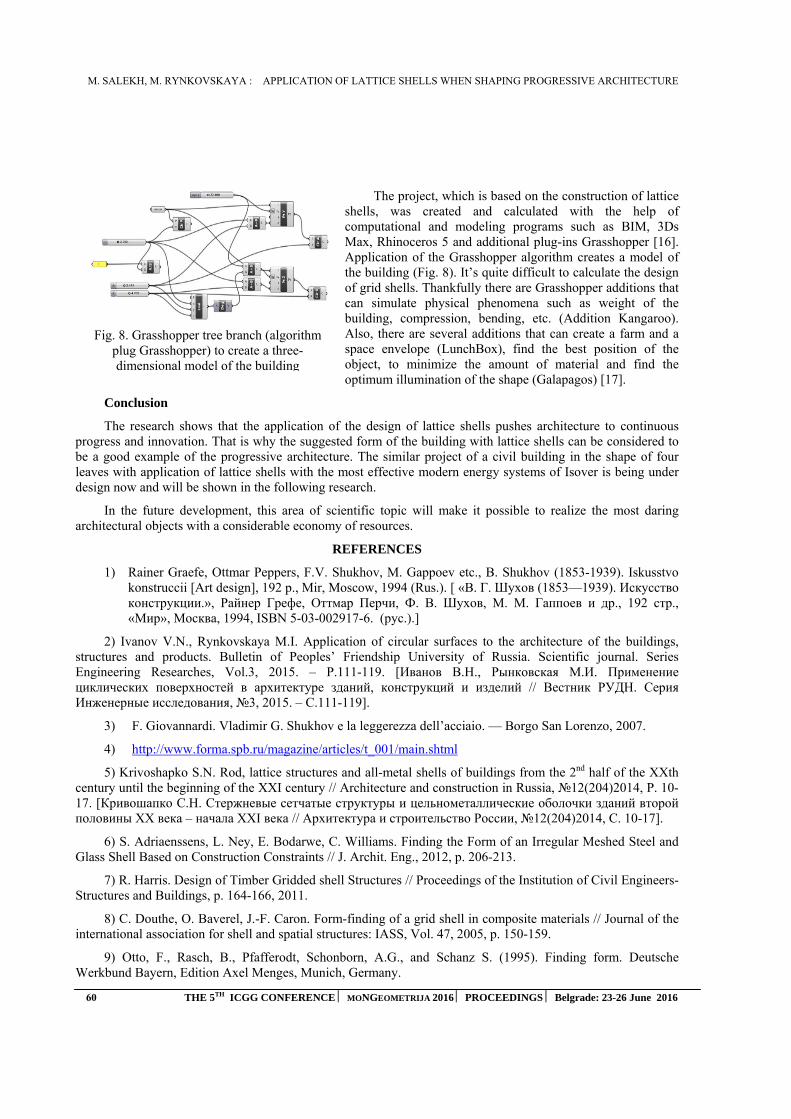
M. SALEKH, М. RYNKOVSKAYA : APPLICATION OF LATTICE SHELLS WHEN SHAPING PROGRESSIVE ARCHITECTURE
60 THE 5TH ICGG CONFERENCE MONGEOMETRIJA 2016 PROCEEDINGS Belgrade: 23-26 June 2016
Fig. 8. Grasshopper tree branch (algorithm plug Grasshopper) to create a three-dimensional model of the building
The project, which is based on the construction of lattice shells, was created and calculated with the help of computational and modeling programs such as BIM, 3Ds Max, Rhinoceros 5 and additional plug-ins Grasshopper [16]. Application of the Grasshopper algorithm creates a model of the building (Fig. 8). It’s quite difficult to calculate the design of grid shells. Thankfully there are Grasshopper additions that can simulate physical phenomena such as weight of the building, compression, bending, etc. (Addition Kangaroo). Also, there are several additions that can create a farm and a space envelope (LunchBox), find the best position of the object, to minimize the amount of material and find the optimum illumination of the shape (Galapagos) [17].
Conclusion
The research shows that the application of the design of lattice shells pushes architecture to continuous progress and innovation. That is why the suggested form of the building with lattice shells can be considered to be a good example of the progressive architecture. The similar project of a civil building in the shape of four leaves with application of lattice shells with the most effective modern energy systems of Isover is being under design now and will be shown in the following research.
In the future development, this area of scientific topic will make it possible to realize the most daring architectural objects with a considerable economy of resources.
REFERENCES
1) Rainer Graefe, Ottmar Peppers, F.V. Shukhov, M. Gappoev etc., B. Shukhov (1853-1939). Iskusstvokonstruccii [Art design], 192 p., Mir, Moscow, 1994 (Rus.). [ «В. Г. Шухов (1853—1939). Искусствоконструкции.», Райнер Грефе, Оттмар Перчи, Ф. В. Шухов, М. М. Гаппоев и др., 192 стр.,«Мир», Москва, 1994, ISBN 5-03-002917-6. (рус.).]
2) Ivanov V.N., Rynkovskaya M.I. Application of circular surfaces to the architecture of the buildings,structures and products. Bulletin of Peoples’ Friendship University of Russia. Scientific journal. Series Engineering Researches, Vol.3, 2015. – P.111-119. [Иванов В.Н., Рынковская М.И. Применение циклических поверхностей в архитектуре зданий, конструкций и изделий // Вестник РУДН. Серия Инженерные исследования, №3, 2015. – С.111-119].
3) F. Giovannardi. Vladimir G. Shukhov e la leggerezza dell’acciaio. — Borgo San Lorenzo, 2007.
4) http://www.forma.spb.ru/magazine/articles/t_001/main.shtml
5) Krivoshapko S.N. Rod, lattice structures and all-metal shells of buildings from the 2nd half of the XXthcentury until the beginning of the XXI century // Architecture and construction in Russia, №12(204)2014, P. 10-17. [Кривошапко С.Н. Стержневые сетчатые структуры и цельнометаллические оболочки зданий второйполовины XX века – начала XXI века // Архитектура и строительство России, №12(204)2014, С. 10-17].
6) S. Adriaenssens, L. Ney, E. Bodarwe, C. Williams. Finding the Form of an Irregular Meshed Steel andGlass Shell Based on Construction Constraints // J. Archit. Eng., 2012, p. 206-213.
7) R. Harris. Design of Timber Gridded shell Structures // Proceedings of the Institution of Civil Engineers-Structures and Buildings, p. 164-166, 2011.
8) C. Douthe, O. Baverel, J.-F. Caron. Form-finding of a grid shell in composite materials // Journal of theinternational association for shell and spatial structures: IASS, Vol. 47, 2005, p. 150-159.
9) Otto, F., Rasch, B., Pfafferodt, Schonborn, A.G., and Schanz S. (1995). Finding form. DeutscheWerkbund Bayern, Edition Axel Menges, Munich, Germany.
M. SALEKH, М. RYNKOVSKAYA : APPLICATION OF LATTICE SHELLS WHEN SHAPING PROGRESSIVE ARCHITECTURE
THE 5TH ICGG CONFERENCE MONGEOMETRIJA 2016 PROCEEDINGS Belgrade: 23-26 June 2016 61
10) Hennicke, J., Matsushita, K., Otto, F. et al., Gitterschalen Grid shells, Institut für LeichteFlächentragwerke (IL), (1974), p.10.
11) E. Happold, W.I. Liddell. Timber lattice roof for Mannheim Bundesgartenschau // The StructuralEngineer, 1975, vol. 53, p.3.
12) R. Harris, S. Haskins, J. Roynon. The Savill Garden Gridshell Design and construction // The StructuralEngineer, Vol. 86 (17), 2008, p. 27-34.
13) M. Dickson, R. Harris. The Downland gridshell: Innovative design in timber // The Royal Academy ofEngineering Publication, p.31-36, 2004.
14) Douthe, C., Baverel, O. and Caron J.-F., Propositions for a composite grid shell, Conception andstructural analysis, 3rd Int. Conf. for Composite in Construction, 2005, p. 1079-1086.
15) Salekh M.S. “Bionica and geometric morphogenesis in architecture of Santiago Calatrava” /Proceedings of international scientific youth conference “Strength, creep and destruction of building and mechanical materials and structures”, 18-21 November, Moscow. – M.: RUDN, 2014 – P. 288-292. [Салех М.С. “Бионика и геометрическое формообразование в архитектуре Сантьяго Калатравы”/ «Прочность, ползучесть и разрушение строительных и машиностроительных материалов и конструкций»: труды Международной молодежной научной конференции, посвященной 55-летию РУДН, Москва, 18-21 ноября 2014. – М: РУДН, 2014. – С. 288-292].
16) A. Tedeschi. AAD Algorithms-aided Design: Parametric Strategies Using Grasshopper. Le Penseur,2014, 495p.
17) http://archi.place/program/grasshopper/
V. MILER JERKOVIĆ ET AL.: APPLICATIONS OF THE GENERALIZED {1,4} INVERSE IN RESTORATION OF BLURRED
IMAGES
THE 5TH ICGG CONFERENCE MONGEOMETRIJA 2016 PROCEEDINGS Belgrade: 23-26 June 2016 62
APPLICATIONS OF THE GENERALIZED {1, 4} INVERSE IN
RESTORATION OF BLURRED IMAGES
Vera Miler Jerković
Department of Automatic Control, University of Belgrade, School of Electrical Engineering, Belgrade, Serbia
Department of Applied Mathematics, University of Novi Sad, Faculty of Technical Sciences, Novi Sad, Serbia
Research Assistant, [email protected]
Milica Janković
Department of Automatic Control, University of Belgrade, School of Electrical Engineering, Belgrade, Serbia
PhD., Assistant Professor, [email protected]
Bojan Banjac
Department of Animation in Engineering, University of Novi Sad, Faculty of Technical Sciences, Novi Sad,
Serbia
Assistant, [email protected]
Branko Malešević
Department of Applied Mathematics, University of Belgrade, School of Electrical Engineering, Belgrade, Serbia
PhD., Associate Professor, [email protected]
Biljana Mihailović
Department of Applied Mathematics, University of Novi Sad, Faculty of Technical Sciences, Novi Sad, Serbia
PhD., Associate Professor, [email protected]
ABSTRACT
The aim of this paper is to propose the generalized {1, 4} inverse as an effective tool for
removing an uniform linear motion blur from images in the horizontal direction, and useful as a
left inverse (the generalized {1, 2, 4} inverse) and the Moore Penrose inverse (the generalized {1,
2, 3, 4} inverse). In this purpose, the Rohde approach through block representations of
generalized inverses is used. The importance of this study is that generalized inverses, which
satisfy four or three matrix equations (the generalized {1, 2, 3, 4} inverse; the generalized {1, 2, 4}
inverse, respectively) can be replaced with the generalized inverse, which satisfy only two matrix
equations (the generalized {1, 4} inverse). The new method for reconstruction of blurred images
based on the generalized {1, 4} inverse is developed and compared with the method based on the
Moore Penrose inverse. The methods are implemented in the Python programming language and
an example of their application of blurred images is presented.
Keywords: computer graphics; descriptive geometry; photogrammetry; computer
science; applied geometry
1. INTRODUCTION
Image degradation results from different circumstances: unstable camera, night scene, moving objects, etc.
There are many techniques for image restoration such as inverse filter, the pseudoinverse filter, Wiener filter,
etc. The different methods of image restoration, based on the Moore Penrose inverse, have been presented in
recent papers [1-4]. In the most of them, the method of Singular Value Decomposition is used for computing the
V. MILER JERKOVIĆ ET AL.: APPLICATIONS OF
THE GENERALIZED {1, 4} INVERSE IN RESTORATION OF BLURRED IMAGES
63 THE 5TH ICGG CONFERENCE MONGEOMETRIJA 2016 PROCEEDINGS Belgrade: 23-26 June 2016
Moore Penrose inverse. This method is very accurate but time-intensive since and it requires a large amount of
computation resources [1], [4].
Moore first introduced the generalized inverse of a matrix in 1920 and later the same did Penrose in 1955 [5].
These two definitions are equivalent and that is a reason why the generalized {1, 2, 3, 4} inverse of a matrix is
called the Moore Penrose inverse.
Using the Rohde approach of generalized {1, 2, 3, 4} inverses [6-9], we presented a block representation of
generalized {1,4}, {1,2,4} and {1,2,3,4} inverses of a matrix. Hansen et al. [10] have introduced a useful
technique for removing blur based on the Moore Penrose inverses. Whereas, Chountasiset al. [1] have presented
a useful technique for removing blur based on the generalized {1, 2, 4} inverses, which are also called left
inverses.
The aim of this paper is to present that the generalized {1, 4} inverse is useful as well as the generalized {1, 2, 4}
inverse and the Moore Penrose inverse. The importance of this study is in the fact that the generalized inverses,
which satisfy four or three matrix equations (the generalized {1, 2, 3, 4} inverse; the generalized {1, 2, 4}
inverse, respectively) can be replaced with the generalized inverse, which satisfy only two matrix equations (the
generalized {1, 4} inverse).
The paper is organized as follows. In the second section, we recall the block representation of generalized
inverses and the concept of image restoration based on the Moore-Penrose inverse. In the third section, we
propose a new method for reconstruction of blurred image based on the generalized {1, 4} inverse. Finally, in
the fourth section, numerical results with Improvement in Signal-to-Noise as a ration criterion of objectivity
between two methods for image deblurring are presented.
2. GENERALIZED INVERSES MATRICES METHOD
2.1. The generalized inverse of matrix
For every matrix and unknown matrix the system of four Penrose’s equations is (for
more details, see [5, 11] ):
(Eq.1)
(Eq.2)
(Eq.3)
(Eq.4)
The generalized inverse of a matrix , which satisfy the system of matrix equations from (Eq.1) to (Eq.4) can be
defined trough a block representation as follows [6-9]:
(Eq.5)
where , , are appropriate submatrices. The regular
squared matrices and are defined with:
(Eq.6)
and products of matrices are:
(Eq.7a)
and
(Eq.7b)
with appropriate submatrices and ,
Using the block representation, let us recall the next generalized inverses [6-9]:
V. MILER JERKOVIĆ ET AL.: APPLICATIONS OF THE GENERALIZED {1,4} INVERSE IN RESTORATION OF BLURRED
IMAGES
THE 5TH ICGG CONFERENCE MONGEOMETRIJA 2016 PROCEEDINGS Belgrade: 23-26 June 2016 64
Let , and let the regular matrices and be such that
(Eq. 6) is satisfied. Let the product of matrices of square matrix be in the shape of (Eq. 7b).
The generalized {1, 4} inverse: The matrix X is a solution of the system of matrix equations (Eq.1) and (Eq.4)
if and only if:
(Eq.8)
The generalized {1, 2, 4} inverse: The matrix X is a solution of the system of matrix equations (Eq.1), (Eq. 2)
and (Eq.4) if and only if:
(Eq.9)
The Moore Penrose inverse: Let a product of matrices is in the shape of (Eq.7a). The matrix X is the
unique solution of the system of matrix equations (Eq.1), (Eq. 2), (Eq.3) and (Eq.4) if and only if:
(Eq.10)
2.2. The method of reconstruction of blurred image
The uniform linear motion in the horizontal or vertical direction can cause a blurred image. In this paper,
we consider only degradation of images caused by the uniform linear motion in the horizontal direction. Let the
original image be presented with a matrix and let degraded image be presented with a matrix . Let l be an integer number which denotes the length of the linear motion blur in pixels and .
The estimation of the index of degradation can be done in two cepstral methods [12]. In order to enlarge the
original image with boundary pixels that reflect the original scene in the best way, dimension of the matrix
will be replaced with . The degradation matrix is denoted with . The degradation
process of original images caused by the uniform linear motion in the horizontal direction, can be expressed in
the following matrix form:
(Eq.11)
In order to estimate the original image F, the restored image ( ) can be computed using the Moore Penrose
inverse of a matrix ( ) [4, 11] and expressed by:
(Eq.12)
The matrix is a non-symetric Toeplitz matrix consisting of rows and columns [4]. The
calculation of ith
row of blurred image using the ith
row of original image and the matrix trough (Eq.11) can be
defined as:
(Eq.13)
where denotes the length of blur and the elements of the matrix are defined as
.
3. THE NEW METHOD FOR RECONSTRUCTION BLUURED IMAGE
In this section, the new method for reconstruction of blurred images is designed, such that instead of a
usage of the generalized Moore Penrose inverse we will use the generalized {1, 4} inverse. First, let us
determine matrices P and Q, according to (Eq.6), using transformations by rows and columns of a matrix H.
Because the matrix H is a full rank matrix by rows, the matrix Q is a identity matrix . The matrix P is a
matrix and its form can be expressed as follows:
(Eq. 14)
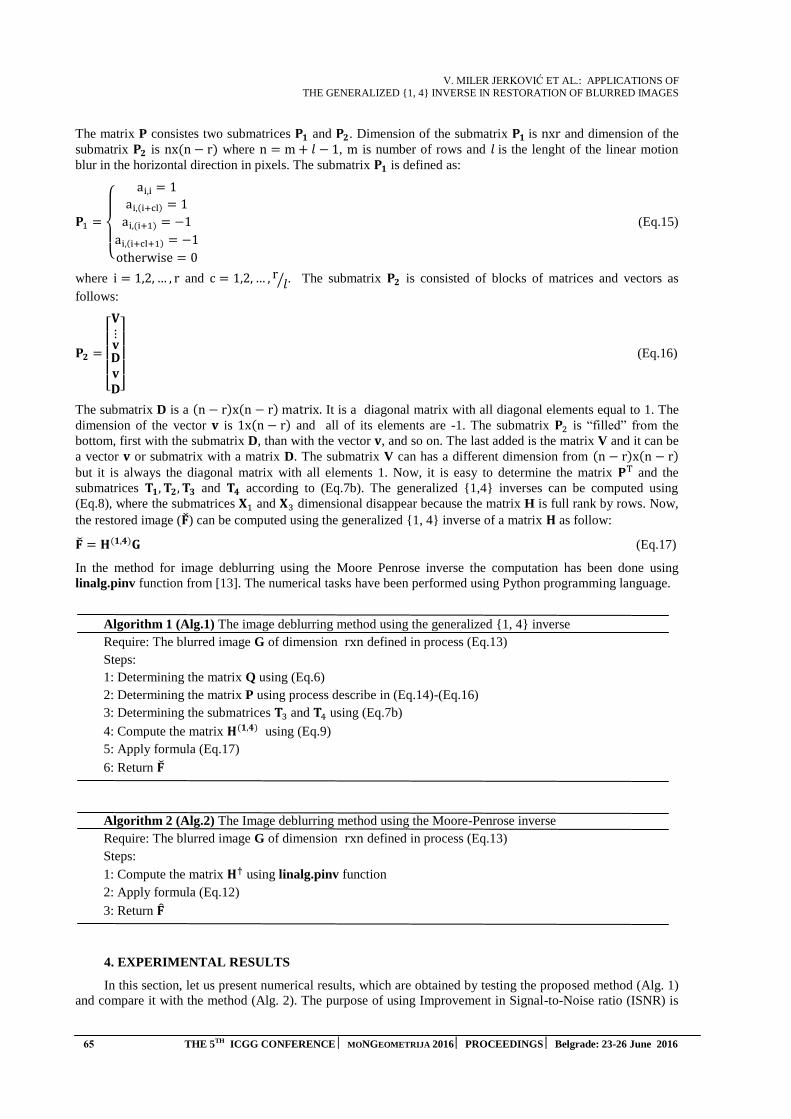
V. MILER JERKOVIĆ ET AL.: APPLICATIONS OF
THE GENERALIZED {1, 4} INVERSE IN RESTORATION OF BLURRED IMAGES
65 THE 5TH ICGG CONFERENCE MONGEOMETRIJA 2016 PROCEEDINGS Belgrade: 23-26 June 2016
The matrix P consistes two submatrices and . Dimension of the submatrix is and dimension of the
submatrix is where , is number of rows and is the lenght of the linear motion
blur in the horizontal direction in pixels. The submatrix is defined as:
(Eq.15)
where and . The submatrix is consisted of blocks of matrices and vectors as
follows:
(Eq.16)
The submatrix D is a It is a diagonal matrix with all diagonal elements equal to 1. The
dimension of the vector is and all of its elements are -1. The submatrix is “filled” from the
bottom, first with the submatrix D, than with the vector , and so on. The last added is the matrix V and it can be
a vector or submatrix with a matrix D. The submatrix V can has a different dimension from
but it is always the diagonal matrix with all elements 1. Now, it is easy to determine the matrix and the
submatrices and according to (Eq.7b). The generalized {1,4} inverses can be computed using
(Eq.8), where the submatrices and dimensional disappear because the matrix H is full rank by rows. Now,
the restored image ( ) can be computed using the generalized {1, 4} inverse of a matrix as follow:
(Eq.17)
In the method for image deblurring using the Moore Penrose inverse the computation has been done using
linalg.pinv function from [13]. The numerical tasks have been performed using Python programming language.
Algorithm 1 (Alg.1) The image deblurring method using the generalized {1, 4} inverse
Require: The blurred image G of dimension defined in process (Eq.13)
Steps:
1: Determining the matrix Q using (Eq.6)
2: Determining the matrix P using process describe in (Eq.14)-(Eq.16)
3: Determining the submatrices and using (Eq.7b)
4: Compute the matrix using (Eq.9)
5: Apply formula (Eq.17)
6: Return
Algorithm 2 (Alg.2) The Image deblurring method using the Moore-Penrose inverse
Require: The blurred image G of dimension defined in process (Eq.13)
Steps:
1: Compute the matrix using linalg.pinv function
2: Apply formula (Eq.12)
3: Return
4. EXPERIMENTAL RESULTS
In this section, let us present numerical results, which are obtained by testing the proposed method (Alg. 1)
and compare it with the method (Alg. 2). The purpose of using Improvement in Signal-to-Noise ratio (ISNR) is
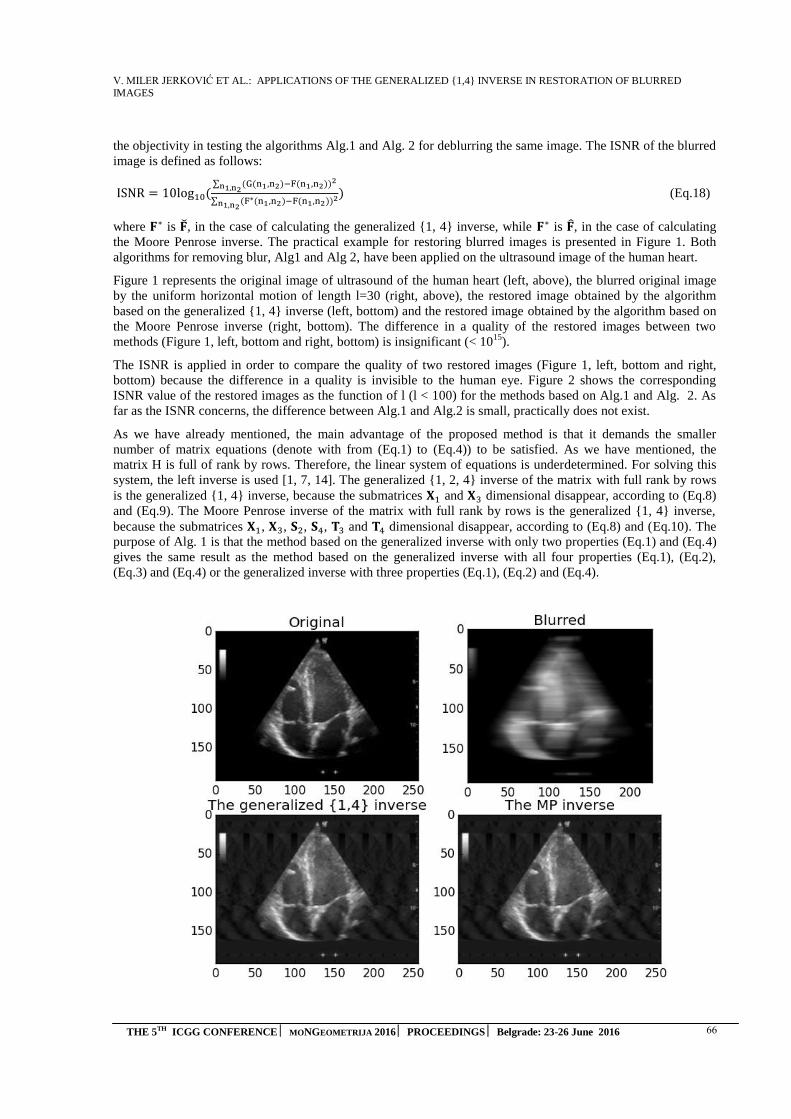
V. MILER JERKOVIĆ ET AL.: APPLICATIONS OF THE GENERALIZED {1,4} INVERSE IN RESTORATION OF BLURRED
IMAGES
THE 5TH ICGG CONFERENCE MONGEOMETRIJA 2016 PROCEEDINGS Belgrade: 23-26 June 2016 66
the objectivity in testing the algorithms Alg.1 and Alg. 2 for deblurring the same image. The ISNR of the blurred
image is defined as follows:
(Eq.18)
where is , in the case of calculating the generalized {1, 4} inverse, while is , in the case of calculating
the Moore Penrose inverse. The practical example for restoring blurred images is presented in Figure 1. Both
algorithms for removing blur, Alg1 and Alg 2, have been applied on the ultrasound image of the human heart.
Figure 1 represents the original image of ultrasound of the human heart (left, above), the blurred original image
by the uniform horizontal motion of length l=30 (right, above), the restored image obtained by the algorithm
based on the generalized {1, 4} inverse (left, bottom) and the restored image obtained by the algorithm based on
the Moore Penrose inverse (right, bottom). The difference in a quality of the restored images between two
methods (Figure 1, left, bottom and right, bottom) is insignificant (< 1015
).
The ISNR is applied in order to compare the quality of two restored images (Figure 1, left, bottom and right,
bottom) because the difference in a quality is invisible to the human eye. Figure 2 shows the corresponding
ISNR value of the restored images as the function of l (l < 100) for the methods based on Alg.1 and Alg. 2. As
far as the ISNR concerns, the difference between Alg.1 and Alg.2 is small, practically does not exist.
As we have already mentioned, the main advantage of the proposed method is that it demands the smaller
number of matrix equations (denote with from (Eq.1) to (Eq.4)) to be satisfied. As we have mentioned, the
matrix H is full of rank by rows. Therefore, the linear system of equations is underdetermined. For solving this
system, the left inverse is used [1, 7, 14]. The generalized {1, 2, 4} inverse of the matrix with full rank by rows
is the generalized {1, 4} inverse, because the submatrices and dimensional disappear, according to (Eq.8)
and (Eq.9). The Moore Penrose inverse of the matrix with full rank by rows is the generalized {1, 4} inverse,
because the submatrices , , , , and dimensional disappear, according to (Eq.8) and (Eq.10). The
purpose of Alg. 1 is that the method based on the generalized inverse with only two properties (Eq.1) and (Eq.4)
gives the same result as the method based on the generalized inverse with all four properties (Eq.1), (Eq.2),
(Eq.3) and (Eq.4) or the generalized inverse with three properties (Eq.1), (Eq.2) and (Eq.4).

V. MILER JERKOVIĆ ET AL.: APPLICATIONS OF
THE GENERALIZED {1, 4} INVERSE IN RESTORATION OF BLURRED IMAGES
67 THE 5TH ICGG CONFERENCE MONGEOMETRIJA 2016 PROCEEDINGS Belgrade: 23-26 June 2016
Figure 1. Image of ultrasound of the human heart (The removal of blur, caused by the uniform horizontal motion)
Figure 2. Improvement in signal-to-noise ratio vs. Length of blurred process
5. CONCLUSION
In this study, the new method based on the generalized inverse for restoration of images has been
introduced, with the picture blur caused by the uniform linear motion in the horizontal direction. Using the
ISNR, it has been shown that the same results have been obtained by Alg.1 and Alg.2, i.e. they have the same
success in blurred image restoration. In the case of a matrix with full rank by rows, the generalized inverse with
two properties (Eq.1) and (Eq.4) (the generalized {1, 4} inverse) is the same as the generalized inverse with
three properties (Eq.1), (Eq.2) and (Eq.4) (the left inverse) and the generalized inverse with all four properties
(Eq.1), (Eq.2), (Eq.3) and (Eq.4) (the Moore Penrose inverse). According to presented results, we conclude that
the generalized {1, 4} inverse can be used instead of the left inverse or instead the Moore Penrose inverse for
blurred image restoration.
ACKNOWLEDGEMENTS
The Ministry of Education, Science and Technological Development of the Republic of Serbia financially
supported projects (#175016; ON 174032; III 44006).
REFERENCES
1. Chountasis A., Katsikis VN. and Pappas D., 2009. Application of the Moore-Penrose Inverse in
Digital Image Restoration. Mathematical Problems in Engineering, Article ID 170724, 12 pages,
doi:10.1155/2009/170724
2. Chountasis A., Katsikis VN. and Pappas D., 2010. Digital Image Reconstruction in the Spectral
Domain Utilizing the Moore-Penrose Inverse. Mathematical Problems in Engineering, Article ID
750352, 14 pages, doi:10.1155/2010/750352
3. Chountasis A., Katsikis VN. and Pappas D., 2009. Image restoration via fast computing of the
Moore-Penrose inverse matrix. Systems, Signals and Image Processing, 2009.IWSSIP 2009. 16th
International Conference on, Chalkida, 2009. pp.1-4.
4. Miljković S., Miladinović M., Stanimirović P. and Stojanović I., 2012. Application of the
pseudoinverse computation in reconstruction of blurred images. Filomat 26(3), pp. 453-465.
5. Penrose R., 1955. A generalized inverses for matrices. Mathematical Proceedings of the Cambridge
Philosophical Society 1955, pp. 406-413.
6. Rhode CA., 1964. Contribution to the theory, computation and application of generalized inverses
(PhD dissertation). University of North Carolina at Releigh.
7. Perić V.,1982. Generalizirana reciproka matrice, Stručno-metodički časopis Matematika, Zagreb,
11(1), pp.40-57.
8. Malešević B.,1998. Grupna funkcionalna jednačina (magistarski rad). Matematički fakultet,
Univerzitet u Beogradu.

V. MILER JERKOVIĆ ET AL.: APPLICATIONS OF THE GENERALIZED {1,4} INVERSE IN RESTORATION OF BLURRED
IMAGES
THE 5TH ICGG CONFERENCE MONGEOMETRIJA 2016 PROCEEDINGS Belgrade: 23-26 June 2016 68
9. Miler Jerković V. and Malešević B., “Blok reprezentacija uopštenih inverza matrica”, Peti
simpozijum “Matematika i primene”, Vol. 1, pp. 176-185, 17-18. oktobar 2014.Beograd, Srbija.
ISBN 978-86-7589-104-8
10. Hansen C., Haqy JG. and O’Leary DP., 2006. Deblurring Images, Matrices, Spectra and Filtering.
Siam,
11. Ben-Israel A. and Greville T.N.E.,2003. Generalized Inverses, Theory and Applications. Springer,
New York.
12. Krahmer F., Lin Y., Mcadoo B., Ott K., Wang J, Widemann D. and Wohlberg B.,2006. Blind image
deconvolution: Motion blur estimation. In IMA Preprints Series 21, pp.33-35.
13. Python Software Foundation. Python Language reference, version 2.7. Available at
http://www.python.org
14. Rao CR. and Mitra SK., 1971. Generalized Inverse of Matrices and Its Applications, 2nd ed.,Wiley
Series in Probability and Mathematics Statistics: Applied Probability and Statistics, Wiley, New
York.

A. DUTA ET AL.: APPROACHES IN SOLVING SOME TANGENT PROBLEMS
THE 5TH ICGG CONFERENCE ⏐⏐ MONGEOMETRIJA 2016 ⏐ PROCEEDINGS ⏐ Belgrade: 23-26 June 2016
APPROACHES IN SOLVING SOME TANGENT PROBLEMS
Alina Duta
Department of Automotive, Transportation and Industrial Engineering, University of Craiova, RomaniaPhD., Associate Professor, [email protected]
Ludmila Sass
Department of Automotive, Transportation and Industrial Engineering, University of Craiova, RomaniaPhD., Associate Professor, [email protected]
Gabriel – Catalin Marinescu
Department of Automotive, Transportation and Industrial Engineering, University of Craiova, RomaniaPhD., Assistant, [email protected]
ABSTRACT
Tangent problems are of salient and complex importance in almost all scientific domains. Thus, the problem that rises in most fields of research, from mechanical engineering to architecture, aims at determining the contact points between different types of surfaces, i.e. the determining of the tangent point. Within this context, tangent problems can be solved both by applying descriptive geometry graphical methods as well as by means of software such as SolidWorks software and even analytically. By solving the tangent problem, we can determine the optimum in the case of volume positioning, the optimum with respect to the use of available space. The method envisaged within this present paper has proven to be relatively easy to apply and can provide the solution without resorting to other Descriptive Geometry methods. Testing the solution by means of computer-assisted graphic methods validates its accuracy.
Keywords: descriptive geometry; tangent problem; maximum conditions; geometrical homothetic transformations; Solid Works; applied geometry.
1. INTRODUCTION
Dealing with tangent issues has always been challenging, involving complex and comprehensive approaches in various fields of research, form mechanical engineering to architecture and medicine. The study and modelling of the phenomena occurring at the contact between different bones of the human skeleton is of high importance when establishing the geometry of prostheses and other medical devices used in bone reconstruction.[5]
The core problem to arise when solving such tangent issues can be sometimes reduced to the determining of the contact points between different types of surfaces, basically the determining of the tangent point. Accordingly, some of the tangent issues can be approached in terms of space-use optimization, in accordance with the restrictions imposed by the tangents.
The present paper aims at shedding light on the issue of some tangent situations, thus we put forward a homothetic-based approach of tangents. Likewise, we shall solve several types of such problems both by means of the classical descriptive geometry, i.e. through the analytical method, and by means of modelling methods via Solid Works software package. This last stage of our research aims also at validating the solution obtained based on descriptive geometry.
2. SOLVING THE TANGENT ISSUE VIA DESCRIPTIVE GEOMETRY
In general, to solve tangent problems we can apply one of the well-known methods generated by the descriptive geometry. However, in some cases their applicability may be problematic [1], [2], [3], thus we could resort to planar geometry in order to solve the problem, i.e. by means of homothety.
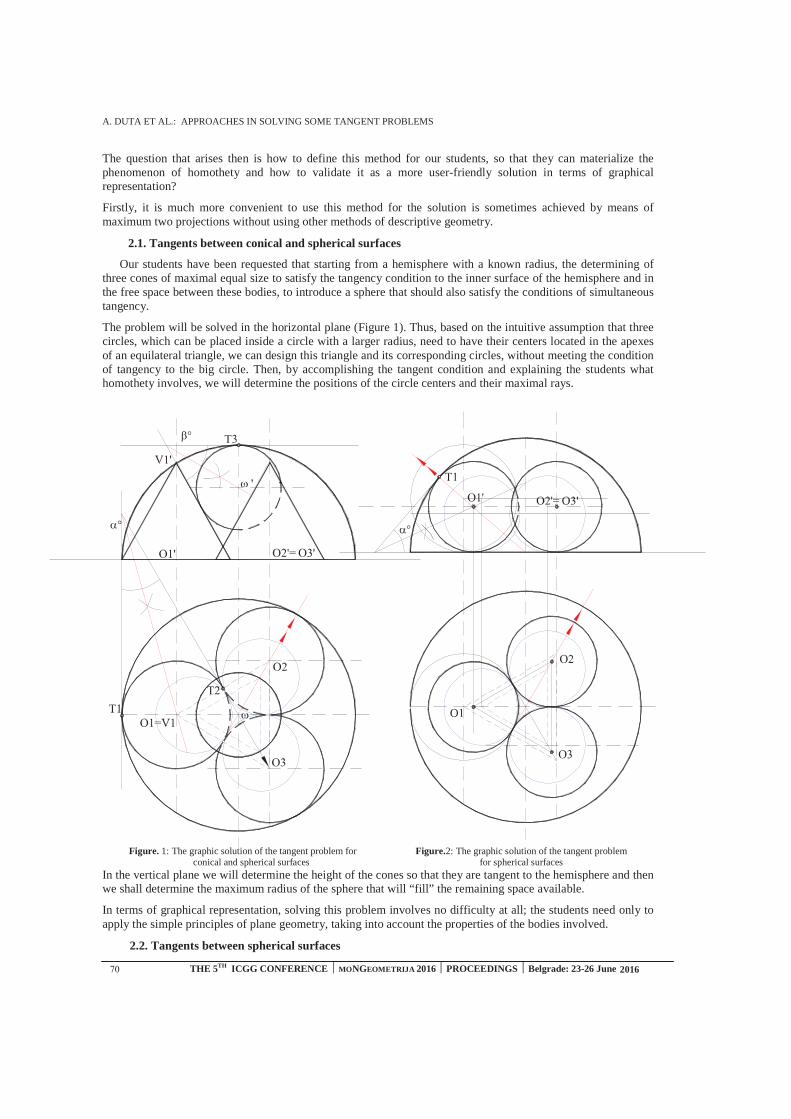
A. DUTA ET AL.: APPROACHES IN SOLVING SOME TANGENT PROBLEMS
THE 5TH ICGG CONFERENCE ⏐⏐ MONGEOMETRIJA 2016 ⏐ PROCEEDINGS ⏐ Belgrade: 23-26 June 2016
The question that arises then is how to define this method for our students, so that they can materialize the phenomenon of homothety and how to validate it as a more user-friendly solution in terms of graphical representation?
Firstly, it is much more convenient to use this method for the solution is sometimes achieved by means of maximum two projections without using other methods of descriptive geometry.
2.1. Tangents between conical and spherical surfaces
Our students have been requested that starting from a hemisphere with a known radius, the determining of three cones of maximal equal size to satisfy the tangency condition to the inner surface of the hemisphere and in the free space between these bodies, to introduce a sphere that should also satisfy the conditions of simultaneous tangency.
The problem will be solved in the horizontal plane (Figure 1). Thus, based on the intuitive assumption that three circles, which can be placed inside a circle with a larger radius, need to have their centers located in the apexes of an equilateral triangle, we can design this triangle and its corresponding circles, without meeting the condition of tangency to the big circle. Then, by accomplishing the tangent condition and explaining the students what homothety involves, we will determine the positions of the circle centers and their maximal rays.
Figure. 1: The graphic solution of the tangent problem for Figure.2: The graphic solution of the tangent problem conical and spherical surfaces for spherical surfaces
In the vertical plane we will determine the height of the cones so that they are tangent to the hemisphere and then we shall determine the maximum radius of the sphere that will “fill” the remaining space available.
In terms of graphical representation, solving this problem involves no difficulty at all; the students need only to apply the simple principles of plane geometry, taking into account the properties of the bodies involved.
2.2. Tangents between spherical surfaces

A. DUTA ET AL.: APPROACHES IN SOLVING SOME TANGENT PROBLEMS
THE 5TH ICGG CONFERENCE ⏐⏐ MONGEOMETRIJA 2016 ⏐ PROCEEDINGS ⏐ Belgrade: 23-26 June 2016
The previous problem can be converted into the determination of the three spheres having equal maximum dimensions to satisfy the tangent condition. Hence, the students have to determine these spheres starting only from the size of the spherical cap. (Figure 2)
The solving principle remains the same, starting from the initial assumption and applying homothety and the condition of tangency.
The elevational representation highlights the lines for homothety and the tangent points.
2.3. Tangents between spherical and plane surfaces
In this case we know the size and the position of a tetrahedron within which we have to determine the highest four equal spheres to simultaneously fulfill the condition of tangency to both the inner surface of the tetrahedron, and among them. (Figure .3)
The solution highlights again that homothety is an efficient and an easy method to apply.
Figure. 3: The graphic solution of the tangent problem spheres – tetrahedron Figure. 4: Geometric element of tangent bodies
3. ELEMENTARY GEOMETRY APPROACH
Within the present paper we shall put forward these calculations applied to the first tangent case, the one illustrated in section 2.1.
Starting from the initial data of the problem, knowing only the hemisphere radius, R, we will determine the computation relations for the geometrical elements of the other bodies. (Figure 4)
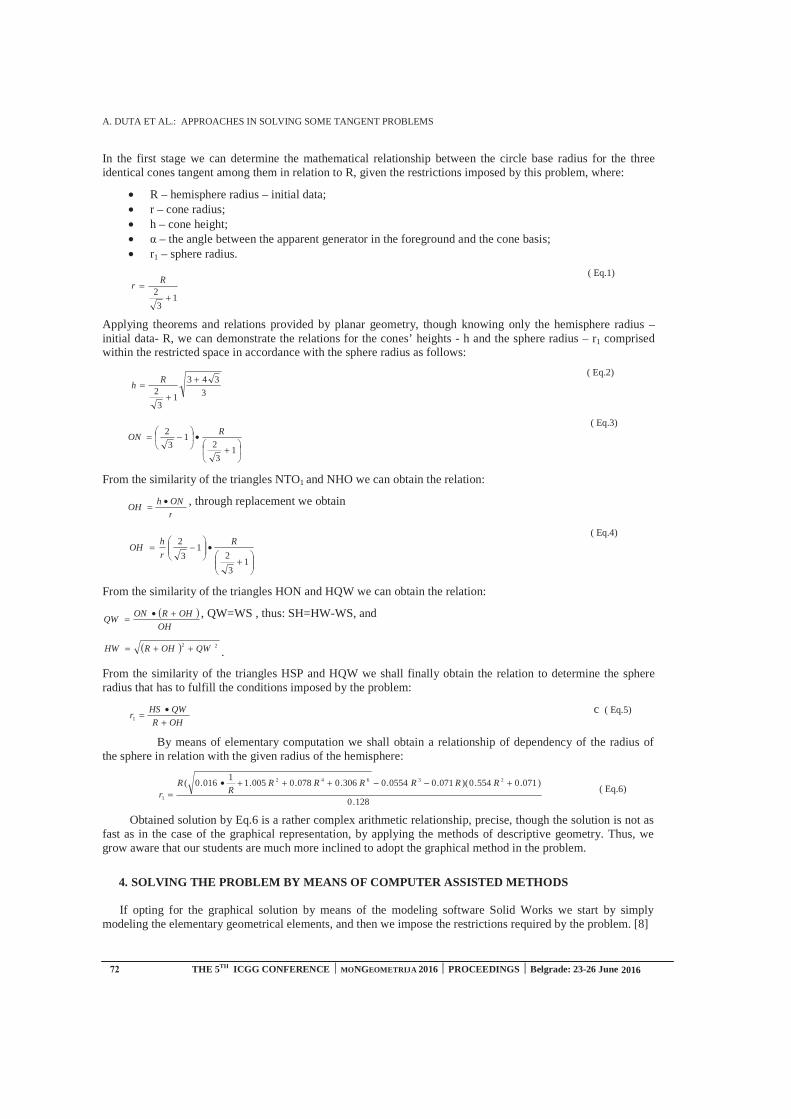
A. DUTA ET AL.: APPROACHES IN SOLVING SOME TANGENT PROBLEMS
THE 5TH ICGG CONFERENCE ⏐⏐ MONGEOMETRIJA 2016 ⏐ PROCEEDINGS ⏐ Belgrade: 23-26 June 2016
In the first stage we can determine the mathematical relationship between the circle base radius for the three identical cones tangent among them in relation to R, given the restrictions imposed by this problem, where:
• R – hemisphere radius – initial data;• r – cone radius;• h – cone height;• – the angle between the apparent generator in the foreground and the cone basis;• r1 – sphere radius.
13
2 += R
r ( Eq.1)
Applying theorems and relations provided by planar geometry, though knowing only the hemisphere radius – initial data- R, we can demonstrate the relations for the cones’ heights - h and the sphere radius – r1 comprised within the restricted space in accordance with the sphere radius as follows:
3
343
13
2+
+= R
h
( Eq.2)
+•−=
13
21
3
2 RON
( Eq.3)
From the similarity of the triangles NTO1 and NHO we can obtain the relation:
r
ONhOH
•= , through replacement we obtain
+•−=
13
21
3
2 R
r
hOH
( Eq.4)
From the similarity of the triangles HON and HQW we can obtain the relation:
( )OH
OHRONQW
+•= , QW=WS , thus: SH=HW-WS, and
( ) 22 QWOHRHW ++= .
From the similarity of the triangles HSP and HQW we shall finally obtain the relation to determine the sphere radius that has to fulfill the conditions imposed by the problem:
OHR
QWHSr
+•=1
c ( Eq.5)
By means of elementary computation we shall obtain a relationship of dependency of the radius of the sphere in relation with the given radius of the hemisphere:
128.0
)071.0554.0)(071.00554.0306.0078.0005.11
016.0( 23642
1
+−−+++•=
RRRRRRR
Rr
( Eq.6)
Obtained solution by Eq.6 is a rather complex arithmetic relationship, precise, though the solution is not as fast as in the case of the graphical representation, by applying the methods of descriptive geometry. Thus, we grow aware that our students are much more inclined to adopt the graphical method in the problem.
4. SOLVING THE PROBLEM BY MEANS OF COMPUTER ASSISTED METHODS
If opting for the graphical solution by means of the modeling software Solid Works we start by simply modeling the elementary geometrical elements, and then we impose the restrictions required by the problem. [8]
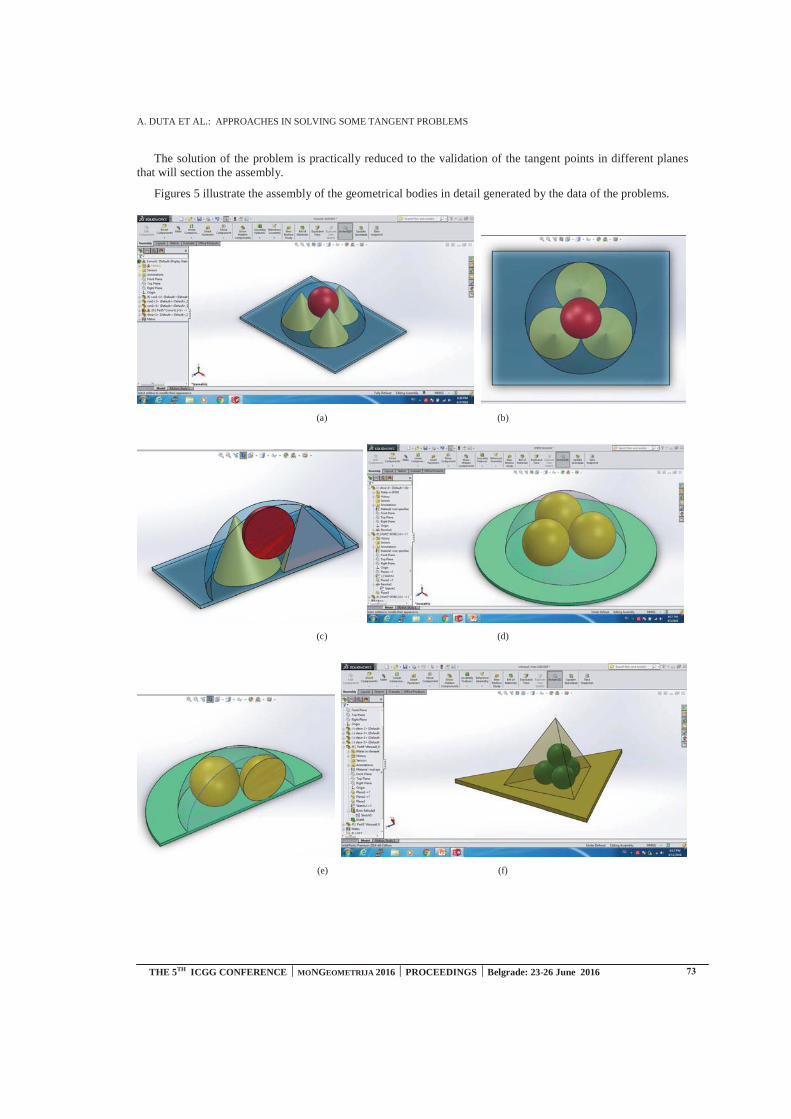
A. DUTA ET AL.: APPROACHES IN SOLVING SOME TANGENT PROBLEMS
THE 5TH ICGG CONFERENCE ⏐⏐ MONGEOMETRIJA 2016 ⏐ PROCEEDINGS ⏐ Belgrade: 23-26 June 2016
The solution of the problem is practically reduced to the validation of the tangent points in different planes that will section the assembly.
Figures 5 illustrate the assembly of the geometrical bodies in detail generated by the data of the problems.
(a) (b)
(c) (d)
(e) (f)
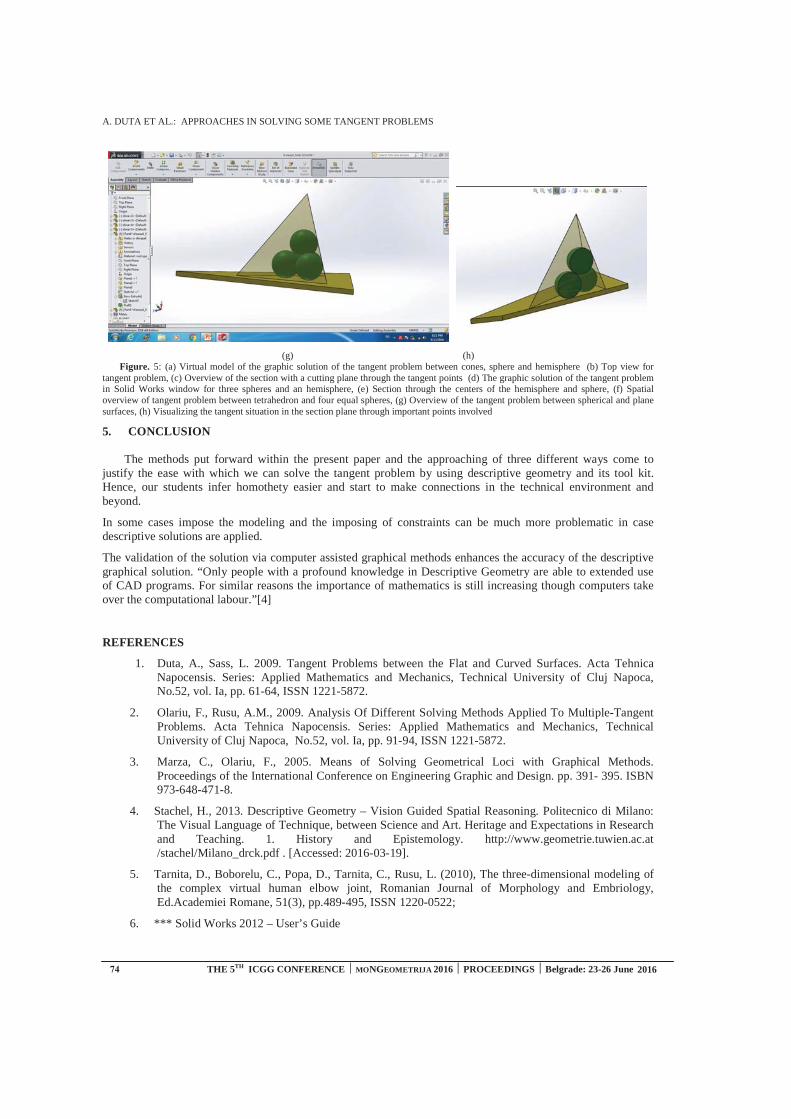
A. DUTA ET AL.: APPROACHES IN SOLVING SOME TANGENT PROBLEMS
THE 5TH ICGG CONFERENCE ⏐⏐ MONGEOMETRIJA 2016 ⏐ PROCEEDINGS ⏐ Belgrade: 23-26 June 2016
(g) (h) Figure. 5: (a) Virtual model of the graphic solution of the tangent problem between cones, sphere and hemisphere (b) Top view for
tangent problem, (c) Overview of the section with a cutting plane through the tangent points (d) The graphic solution of the tangent problem in Solid Works window for three spheres and an hemisphere, (e) Section through the centers of the hemisphere and sphere, (f) Spatial overview of tangent problem between tetrahedron and four equal spheres, (g) Overview of the tangent problem between spherical and plane surfaces, (h) Visualizing the tangent situation in the section plane through important points involved
5. CONCLUSION
The methods put forward within the present paper and the approaching of three different ways come tojustify the ease with which we can solve the tangent problem by using descriptive geometry and its tool kit. Hence, our students infer homothety easier and start to make connections in the technical environment and beyond.
In some cases impose the modeling and the imposing of constraints can be much more problematic in case descriptive solutions are applied.
The validation of the solution via computer assisted graphical methods enhances the accuracy of the descriptive graphical solution. “Only people with a profound knowledge in Descriptive Geometry are able to extended use of CAD programs. For similar reasons the importance of mathematics is still increasing though computers take over the computational labour.”[4]
REFERENCES
1. Duta, A., Sass, L. 2009. Tangent Problems between the Flat and Curved Surfaces. Acta TehnicaNapocensis. Series: Applied Mathematics and Mechanics, Technical University of Cluj Napoca,No.52, vol. Ia, pp. 61-64, ISSN 1221-5872.
2. Olariu, F., Rusu, A.M., 2009. Analysis Of Different Solving Methods Applied To Multiple-TangentProblems. Acta Tehnica Napocensis. Series: Applied Mathematics and Mechanics, TechnicalUniversity of Cluj Napoca, No.52, vol. Ia, pp. 91-94, ISSN 1221-5872.
3. Marza, C., Olariu, F., 2005. Means of Solving Geometrical Loci with Graphical Methods.Proceedings of the International Conference on Engineering Graphic and Design. pp. 391- 395. ISBN973-648-471-8.
4. Stachel, H., 2013. Descriptive Geometry – Vision Guided Spatial Reasoning. Politecnico di Milano:The Visual Language of Technique, between Science and Art. Heritage and Expectations in Researchand Teaching. 1. History and Epistemology. http://www.geometrie.tuwien.ac.at /stachel/Milano_drck.pdf . [Accessed: 2016-03-19].
5. Tarnita, D., Boborelu, C., Popa, D., Tarnita, C., Rusu, L. (2010), The three-dimensional modeling ofthe complex virtual human elbow joint, Romanian Journal of Morphology and Embriology,Ed.Academiei Romane, 51(3), pp.489-495, ISSN 1220-0522;
6. *** Solid Works 2012 – User’s Guide
A. TRIFUNOVIĆ ET AL.: ASSESSMENT OF SPATIAL VISUALIZATION CAPABILITY AND PRECISION IN GEOMETRICAL
SHAPES DRAWING
THE 5TH ICGG CONFERENCE MONGEOMETRIJA 2016 PROCEEDINGS Belgrade: 23-26 June 2016 75
ASSESSMENT OF SPATIAL VISUALIZATION CAPABILITY AND
PRECISION IN GEOMETRICAL SHAPES DRAWING
Aleksandar Trifunović
Faculty of Transport and Traffic Engineering, University of Belgrade, Belgrade, Serbia
M.Sc., Assistant, [email protected]
Dragan Lazarević
Faculty of Transport and Traffic Engineering, University of Belgrade, Belgrade, Serbia
M.Sc., Assistant, [email protected]
Svetlana Čičević
Faculty of Transport and Traffic Engineering, University of Belgrade, Belgrade, Serbia
Ph.D., Full professor, [email protected]
Marjana Čubranić-Dobrodolac
Faculty of Transport and Traffic Engineering, University of Belgrade, Belgrade, Serbia
M.Sc., Assistant, [email protected]
Momčilo Dobrodolac
Faculty of Transport and Traffic Engineering, University of Belgrade, Belgrade, Serbia
Ph.D., Assistant professor, [email protected]
ABSTRACT
In the last two decades, curricula of many teaching courses in the field of geometry were
undergone to frequent reforms, with a tendency to continue adaptation to new technologies. Soon, it
became obvious that their implementation in the education has caused a series of positive effects, but
also some problems. One of the most significant problems was the decline in the spatial visualization
ability of students, as well as, the decreased accuracy in independent drawing of geometric shapes on
a computer without assistance of software tools for precise drawing. The above skills are crucial to
successfully engage in all branches of engineering. The aim of this paper is testing and evaluation of
the (in)accuracy in perception and drawing of different geometric shapes on a computer without
precision drawing tools. The paper presents the key results relating to the drawing with the help of a
computer mouse and touch screen, as well as differences in precision of drawing in relation to the
demographic characteristics of the respondents, i.e., gender and handedness. Based on the obtained
results, some appropriate activities were proposed for improvement of spatial visualization skills
using the modern software.
Keywords: geometric shapes, geometric modeling, precision in drawing, spatial visualization.
1. INTRODUCTION
The requirements of modern business and technology development have caused the modernization of
curricula for future engineers in various fields, primarily by introducing new technologies and methods to
education. A number of educational reforms have addressed the issues of transition from traditional approaches
and working methods towards the principles based on new technologies. The success of such reforms depended
on the area of science, its flexibility, as well as the manner and scope of modernization. Success indicators are
different. They can refer to positive effects, which prove their importance and applicability in practice. But, the
consequences of curricula modernization could, also, be negative, and diverse.
The most important reforms were implemented within the curricula of subjects which contents were suitable
for the application of new technology as an additional tool. A number of them will eventually completely lose
existing traditional approaches and turn to the modern methods, which become the primary ones. We are
witnessing the mass use of numerous software packages for different purposes, without which we could not
imagine a modern training and activities of engineers. These reforms have significantly contributed to the
A. TRIFUNOVIĆ ET AL.: ASSESSMENT OF SPATIAL VISUALIZATION CAPABILITY AND PRECISION IN GEOMETRICAL
SHAPES DRAWING
76 THE 5TH ICGG CONFERENCE MONGEOMETRIJA 2016 PROCEEDINGS Belgrade: 23-26 June 2016
improvement of both the education and subsequent business activities. The negative impact is reflected in the
weakening of certain students abilities, developed through traditional methods of education. It is necessary to
undertake activities that will, along with unconditional use of new technologies, improve the these abilities.
The paper discusses the effects of application of new technologies within the courses in the field of
descriptive geometry and geometric modeling. Within these courses, the use of CAD (Computer Aided Design)
software was introduced. CAD software is a powerful tool of modern engineering, which allows easy, precise and
fast creation and modification of various drawings using a computer. The above-mentioned possibilities represent
an immense advantage over the classic working methods. This type of software is primarily characterized by a
sophisticated system of measurements and high precision that can go as accurate as millimicrons (Onstott, 2014).
High accuracy is achieved in practice through the use of software tools for precise drawing, for example when
choosing characteristic points in AutoCAD (endpoint, midpoint, center of circle...), in order to preserve accuracy,
OSNAP (Object Snaps) criteria is used, which positions the mouse cursor to the desired point with high precision
(Onstott, 2014).
Studies have shown a problem of decreasing ability of spatial visualization among students, and reduced
accuracy in a independent drawing of geometric shapes on a computer, without the assistance of software tools for
precise drawing (Štulić and Hiel, 2006). On the other hand, modern software and CAD technologies provide new
opportunities for education, graphic communication and provide significant opportunities to improve spatial
visualization (3D modeling and animation) to be used (Čučaković et al, 2006; Bertoline and Wiebe, 2005). It is
necessary to pay attention to this emerging problem, because the spatial visualization is of extreme importance for
future engineers from all areas of business (Sorby, 2005). One way is to research, analyze and improve these
abilities of students (Contero et al, 2006; Chang, 2014; Lin, 2016).
The study, presented in this paper, comprises the questionnaire through which a testing was performed by
evaluating (in)accuracy in perception and drawing of different geometric shapes, within the on-line application
“The eyeballing game” without software tools for precision drawing. The key results were presented relating to
the drawing with the help of a computer mouse and touch screen as well as differences in precision of drawing in
relation to the demographic characteristics of the respondents, i.e., gender and handedness. Furthermore,
recommendations for improving the spatial visualization ability by applying CAD software were given, through
the summary of all the mentioned facts and in accordance with the results of the research.
2. METHODOLOGY
For research purposes, the testing was performed through on-line application “The eyeballing game”, which
tests the accuracy of drawing throughout the seven different geometric tasks. All Respondents were used
computers of identical performances, with display diagonal of 22’’ and a resolution of 1920×1080 pixels (Full
HD). All participants were tested on the same computers for solving geometric tasks using a computer mouse and
using a touch screen. Distance of the respondent’s eyes from monitor during the testing was 500 mm (Shieh and
Lee, 2007). The subjects were instructed to “draw” specific geometrical task, as accurately as possible, using the
mouse or by tapping on the touch screen. Each of the seven different geometric tests was performed by the
respondents three times. For each of the tests, the application calculates the deviation from ideal geometry of the
desired task. A theoretical perfect score is zero. The error is measured in pixels, and in degrees times two for the
bisection and right angle problems. The following figures show the application environment for each of the
geometric tests. An attempt of the respondents to solve geometric task is indicated with blue color, while the exact
solution is marked in green. In the first test the respondents were instructed to draw a proper parallelogram by
moving one of the vertices of an improper quadrilateral (Figure 1). The second task included determining the mid-
point on the straight line by the respondent (Figure 2).
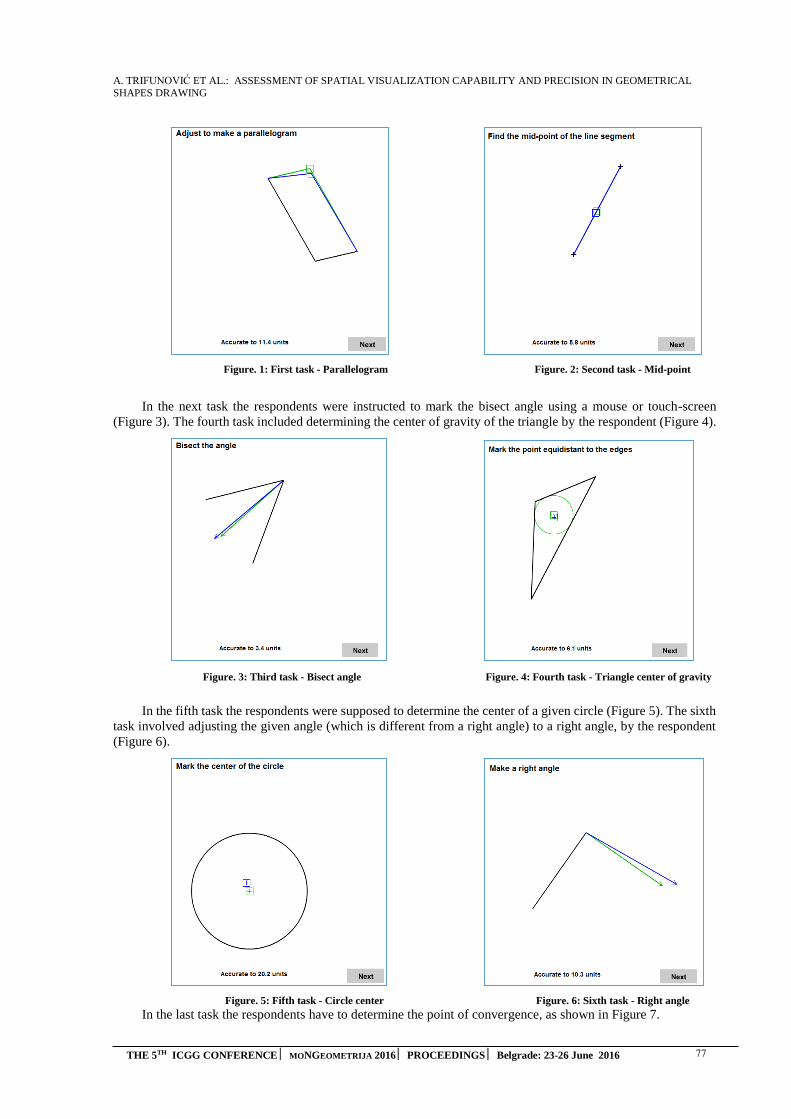
A. TRIFUNOVIĆ ET AL.: ASSESSMENT OF SPATIAL VISUALIZATION CAPABILITY AND PRECISION IN GEOMETRICAL
SHAPES DRAWING
THE 5TH ICGG CONFERENCE MONGEOMETRIJA 2016 PROCEEDINGS Belgrade: 23-26 June 2016 77
Figure. 1: First task - Parallelogram Figure. 2: Second task - Mid-point
In the next task the respondents were instructed to mark the bisect angle using a mouse or touch-screen
(Figure 3). The fourth task included determining the center of gravity of the triangle by the respondent (Figure 4).
Figure. 3: Third task - Bisect angle Figure. 4: Fourth task - Triangle center of gravity
In the fifth task the respondents were supposed to determine the center of a given circle (Figure 5). The sixth
task involved adjusting the given angle (which is different from a right angle) to a right angle, by the respondent
(Figure 6).
Figure. 5: Fifth task - Circle center Figure. 6: Sixth task - Right angle
In the last task the respondents have to determine the point of convergence, as shown in Figure 7.

A. TRIFUNOVIĆ ET AL.: ASSESSMENT OF SPATIAL VISUALIZATION CAPABILITY AND PRECISION IN GEOMETRICAL
SHAPES DRAWING
78 THE 5TH ICGG CONFERENCE MONGEOMETRIJA 2016 PROCEEDINGS Belgrade: 23-26 June 2016
Figure. 7: Seventh task – Convergence
The respondents entered their obtained results and demographic data into the survey hosted on the Google
Drive platform. Data analysis was performed using the statistical software package IBM SPSS Statistics v. 22. The
standard methods of descriptive statistics were used. On the basis of frequency distribution and cross tabulations
the detailed statistical analysis was presented, which included the correlations of the test results with the
respondents' demographic characteristics (gender, left/right-handed) and the manner of solving geometric tasks
(computer mouse or touch screen). The results of testing with the discussion are presented below.
3. RESULTS
The sample consists of 66 respondents, out of which 34.8% were females and 65.2% were males. The average
age of the respondents who participated in the testing was 21 years. Considering Figure 8. where the scores from
three attempts for each of the seven geometric tasks are displayed, it can be concluded that the respondents made
the fewest number of mistakes at third attempt. The minimal number of mistakes were recorded at the first attempt
when the respondents were supposed to determine the center of the circle and the right angle (8.12 and 9.12,
respectively), while the lowest scores were measured for convergence (19.01) and the triangle center (17.26). In
the second attempt, the respondents were most accurate in solving the Bisect angle and the Mid-point tasks (6.86
and 9.63, respectively), and also, as for the previous attempt, the lowest score was achieved for the Convergence
task (18.65). Regarding the last attempt the respondents showed the least deviation from the exact solution for the
task Bisect angle (6.51), and a maximum deviation was recorded, as in previous attempts, for the task Convergence
(14.08). Based on average scores it can be concluded that respondents recorded the least deviation from the given
geometric shapes for tasks Bisect angle and Right angle (8.58 and 9.00, respectively), followed by tasks Mid-point
and Parallelogram (9.85 and 10.33, respectively), than for the tasks that belong to the group of similar tasks, that
included determining centers, Circle center (11.4) and Triangle Centre (14.55), while the respondents recorded the
lowest results for Convergence (17.25).
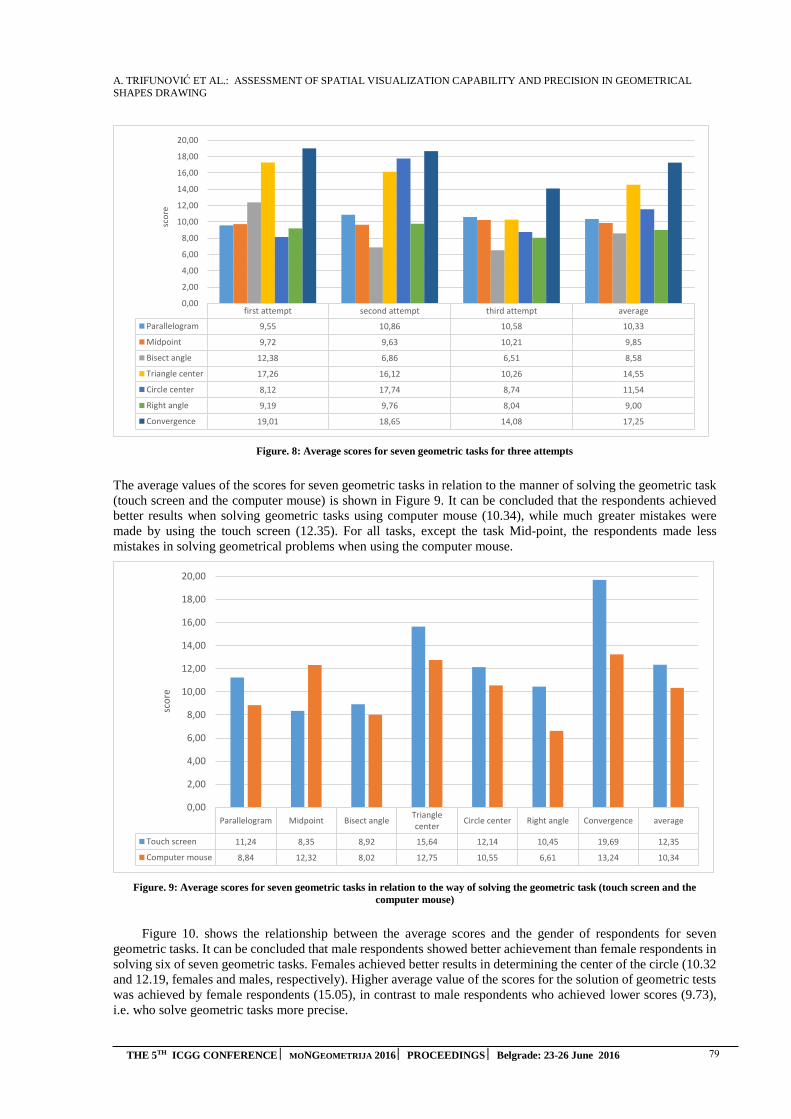
A. TRIFUNOVIĆ ET AL.: ASSESSMENT OF SPATIAL VISUALIZATION CAPABILITY AND PRECISION IN GEOMETRICAL
SHAPES DRAWING
THE 5TH ICGG CONFERENCE MONGEOMETRIJA 2016 PROCEEDINGS Belgrade: 23-26 June 2016 79
Figure. 8: Average scores for seven geometric tasks for three attempts
The average values of the scores for seven geometric tasks in relation to the manner of solving the geometric task
(touch screen and the computer mouse) is shown in Figure 9. It can be concluded that the respondents achieved
better results when solving geometric tasks using computer mouse (10.34), while much greater mistakes were
made by using the touch screen (12.35). For all tasks, except the task Mid-point, the respondents made less
mistakes in solving geometrical problems when using the computer mouse.
Figure. 9: Average scores for seven geometric tasks in relation to the way of solving the geometric task (touch screen and the
computer mouse)
Figure 10. shows the relationship between the average scores and the gender of respondents for seven
geometric tasks. It can be concluded that male respondents showed better achievement than female respondents in
solving six of seven geometric tasks. Females achieved better results in determining the center of the circle (10.32
and 12.19, females and males, respectively). Higher average value of the scores for the solution of geometric tests
was achieved by female respondents (15.05), in contrast to male respondents who achieved lower scores (9.73),
i.e. who solve geometric tasks more precise.
first attempt second attempt third attempt average
Parallelogram 9,55 10,86 10,58 10,33
Midpoint 9,72 9,63 10,21 9,85
Bisect angle 12,38 6,86 6,51 8,58
Triangle center 17,26 16,12 10,26 14,55
Circle center 8,12 17,74 8,74 11,54
Right angle 9,19 9,76 8,04 9,00
Convergence 19,01 18,65 14,08 17,25
0,00
2,00
4,00
6,00
8,00
10,00
12,00
14,00
16,00
18,00
20,00
sco
re
Parallelogram Midpoint Bisect angleTrianglecenter
Circle center Right angle Convergence average
Touch screen 11,24 8,35 8,92 15,64 12,14 10,45 19,69 12,35
Computer mouse 8,84 12,32 8,02 12,75 10,55 6,61 13,24 10,34
0,00
2,00
4,00
6,00
8,00
10,00
12,00
14,00
16,00
18,00
20,00
sco
re

A. TRIFUNOVIĆ ET AL.: ASSESSMENT OF SPATIAL VISUALIZATION CAPABILITY AND PRECISION IN GEOMETRICAL
SHAPES DRAWING
80 THE 5TH ICGG CONFERENCE MONGEOMETRIJA 2016 PROCEEDINGS Belgrade: 23-26 June 2016
Figure. 10: Average scores for seven geometric tasks in relation to the gender of respondents
Figure 11. shows the average values of the scores for seven geometric tasks in relation to the hand the
respondents were used during the experiment. In all geometric tasks left-handed respondents achieved better results
and made fewer mistakes in solving problems. Higher average value of the scores for the solution of geometric
tests were achieved by right-handers (11.73), as opposed to the left-handers who achieved lower scores (8.62), i.e.
who solve geometric tasks more precise.
Figure. 11: Average scores for seven geometric tasks in relation to the right-handed and left-handed persons
4. CONCLUSION
Based on the data collected, processed and analyzed in the experiment, we reached the following general
conclusions:
- The respondents achieved the best results in geometric tasks related to determining angles (Bisect angle and
Right angle)
- Respondents showed the poorest results for convergence;
- Respondents solved geometric tasks using a touch screen less precisely in comparison to the usage the
mouse in solving the problems;
Parallelogram Midpoint Bisect angleTrianglecenter
Circle center Right angle Convergence average
Female 13,67 14,76 13,78 16,99 10,32 13,18 22,62 15,05
Male 8,55 7,23 5,80 13,24 12,19 6,76 14,37 9,73
0,00
5,00
10,00
15,00
20,00
25,00
sco
re
Parallelogram Midpoint Bisect angleTrianglecenter
Circle center Right angle Convergence average
Right-handed 10,36 10,07 8,70 14,70 11,79 9,09 17,38 11,73
Left-handed 9,74 5,32 6,08 11,42 6,29 7,11 14,37 8,62
0,00
2,00
4,00
6,00
8,00
10,00
12,00
14,00
16,00
18,00
sco
re
A. TRIFUNOVIĆ ET AL.: ASSESSMENT OF SPATIAL VISUALIZATION CAPABILITY AND PRECISION IN GEOMETRICAL
SHAPES DRAWING
THE 5TH ICGG CONFERENCE MONGEOMETRIJA 2016 PROCEEDINGS Belgrade: 23-26 June 2016 81
- Male respondents solved geometric tasks significantly more precisely than females;
- Left-handed respondents had significantly fewer errors in solving all seven geometric tasks.
Using a number of options of CAD program, spatial visualization can be enhanced by the introduction of
appropriate activities in the curricula of the following courses:
1. Modeling in 3D space;
2. Computer animation;
3. Development of strategies for modeling of the defined and given shapes by using software tools;
4. Development of strategies for modeling free forms by using software tools;
5. Solving the problems of different mutual spatial relationships of geometric forms on two-dimensional
display;
6. Solving the problems of different mutual spatial relationships of geometric forms in three-dimensional
space;
7. Application of the concept which includes both sketches and precise modeling;
8. Using a CAD program via the touch screen.
Future directions of research should be aimed at monitoring the effects of the proposed measures for
improvement of spatial visualization in the form of testing before and after performing the proposed activities, as
well as, testing by different tasks and mutual comparison of the results obtained in such a way. Further research
should include different age groups, professions and other demographic characteristics of respondents, as well as
the use of different IT devices in testing.
REREFERENCE
1. Bertoline, G., Wiebe, E., 2006. Engineering Graphics - Fundamentals of Graphics Communication,
McGraw-Hill, 5th Edition, United States of America.
2. Chang, Y. 2014. 3D-CAD effects on creative design performance of different spatial abilities
students, Journal of Computer Assisted Learning, 30(5), 397-407.
3. Contero, M., Naya, M., Company, P., Saorin, J.L. 2006. Learning Support Tools for Developing
Spatial Abilities in Engineering Design, International Journal of Engineering Education, 22(3),
470-477.
4. Čučaković, A., Dimitrijević, M., Popkonstantinović, B. 2006. Opšti i posebni nastavni sadržaji u
edukaciji u nacrtnoj geometriji i inženjerskoj grafici, MoNGeometrija, Novi Sad.
5. Lin, H. 2016. Influence of design training and spatial solution strategies on spatial ability
performance, International Journal of Technology and Design Education, 26(1), 123-131.
6. Onstott, S. 2014. AutoCAD 2015 and AutoCAD LT 2015 Essentials, Autodesk Official Press,
Indianapolis, Indiana.
7. Shieh, K.K., Lee, D. S. 2007. Preferred viewing distance and screen angle of electronic paper
displays, Applied Ergonomics, 38(5), 601-608.
8. Sorby, S. 2005. Impact of Changes in Course Methodologies of Improving Spatial Skills, Journalfor
Geometry and Graphics, 9(1), 99-105.
9. Štulić, R., Hiel, K. 2006. Značaj sposobnosti prostorne vizuelizacije u obrazovanju arhitektonske
struke - nove tendencije u nastavi geometrije i grafike, XII skup trendovi razvoja: “Bolonjski process
i primena novog zakona”, Kopaonik, Srbija.
D. JOVANOVIC ET AL.: AUGMENTED REALITY PRESENTATION OF CONCEPTUAL DESIGN OF DETACHED HOUSE INTENDED FOR INDIVIDUAL LIVING IN NIŠ
AUGMENTED REALITY PRESENTATION OF CONCEPTUAL DESIGN OF DETACHED HOUSE INTENDED FOR INDIVIDUAL LIVING IN NIŠ
Dimitrije Jovanovic
Department of Architecture, University of Nis, Nis, Republic of Serbia 2nd year student, [email protected]
Petar Pejic
Department of Architecture, University of Nis, Nis, Republic of Serbia PhD student, [email protected]
Sonja Krasic
Department of Architecture, University of Nis, Nis, Republic of Serbia PhD, Associate Professor, [email protected]
POSTER PRESENTATION
82 THE 5TH ICGG CONFERENCE MONGEOMETRIJA 2016 PROCEEDINGS Belgrade: 23-26 June 2016

N. ANDO.: AUTOMATIC CONFIGURATION OF CITYSCAPES
THE 5TH ICGG CONFERENCE � MONGEOMETRIJA 2016 � PROCEEDINGS � Belgrade: 23-26 June 2016 83
AUTOMATIC CONFIGURATION OF CITYSCAPES Naomi Ando
Department of Architecture, Hosei University, Tokyo, Japan Doctor of Engineering, Professor, [email protected]
ABSTRACT
In this study, Japanese cityscapes in the Tokyo metropolitan district are depicted by using algorithmic computer graphic configurations.
A numerical analysis of the three-dimensional configuration is performed to grasp the characteristics of its form. The distributions of the heights of the buildings in the city blocks are observed to be similar to a normal distribution. As random numbers based on a normal distribution can be generated using the mean and variance as parameters, it is possible to generate the forms of cityscapes using computer graphics configurations.
The planar shapes of buildings are able to be extracted from map data. Map data indicating the planar forms of buildings throughout Japan are provided by the Geospatial Information Authority of Japan. However, the heights of buildings are not included in the map data. Although there are several ways to survey and determine the heights of buildings, we do not perform a survey, but rather attempt to generate cityscapes automatically. We will be able to reproduce the appearance of a cityscapes using this approach.
Keywords: computer graphics; cityscape; automatic configurations; map data
1. INTRODUCTION
The objective of this study was to create cityscapes using algorithmic computer graphic configurations.
In Japanese cities, especially in the multiple city centers of the Tokyo metropolitan district, buildings are distributed diversely. In particular, the heights of the buildings are diverse and apparently random. Such diversity and randomness are observed not only within individual city blocks, but also within entire neighborhoods, where low-rise and mid-to-high-rise buildings are densely and randomly crowded together. The mixture of these city blocks forms a three-dimensional (3D) cityscape and gives rise to its characteristics (see Figure 1).
The planar shapes of buildings can be extracted from map data. Map data containing the planar forms of buildings throughout Japan are provided by the Geospatial Information Authority of Japan2. However, the height data of buildings are not included in the map data. Although there are several ways to survey and determine the heights
Figure. 1: Cityscapes of city centers in Tokyo (Source: Ando et al. (1997)1)

N. ANDO.: AUTOMATIC CONFIGURATION OF CITYSCAPES
84 THE 5TH ICGG CONFERENCE � MONGEOMETRIJA 2016 � PROCEEDINGS � Belgrade: 23-26 June 2016
of buildings, we did not perform a survey in this study, but rather attempted to generate cityscapes automatically.
2. ANALYSIS
We performed a numerical analysis of the 3D configurations as aggregations of the building volumes in Asakusa, which is shown in Figure 2 and is one of the historical city centers of Tokyo, to confirm the characteristics of the form of the cityscape.
Figure 3 (a) shows the cityscape of Asakusa without the Senso-ji temple, which is a particular architecture. This cityscape model was generated by using digital map data, provided by the Geospatial Information Authority of Japan.
The planar shapes of buildings can be extracted from the map data. However, the heights of buildings are not included in the map data. Thus, we referred to a commercially available map (ZENRIN3), which shows the number of floors of buildings, and inferred the heights of the buildings from this information.
In this area, 2,068 buildings having 1 to 15 floors are arranged. Table 1 shows the distribution of the number of floors, the average building area, and the proportion of smaller buildings for which the building area was less than 50m2. In Asakusa, the total proportion of smaller buildings was 49.2%, as shown in Figure 3 (b). Almost half of the total number of low-rise buildings (1 to 4 floors) were in this category. Recently, in this area, mid-to-high-rise buildings had been developed. However, many small, old houses remained.
(a) (b) Figure. 2: (a) Senso-ji temple and its surroundings in Asakusa, (b) Cityscape of Tokyo near Asakusa.
Table 1: Distribution of buildings in Asakusa.
(a) (b) Figure. 3: (a) 3D configuration of Asakusa, (b) arrangement of smaller buildings (smaller buildings are coloured).
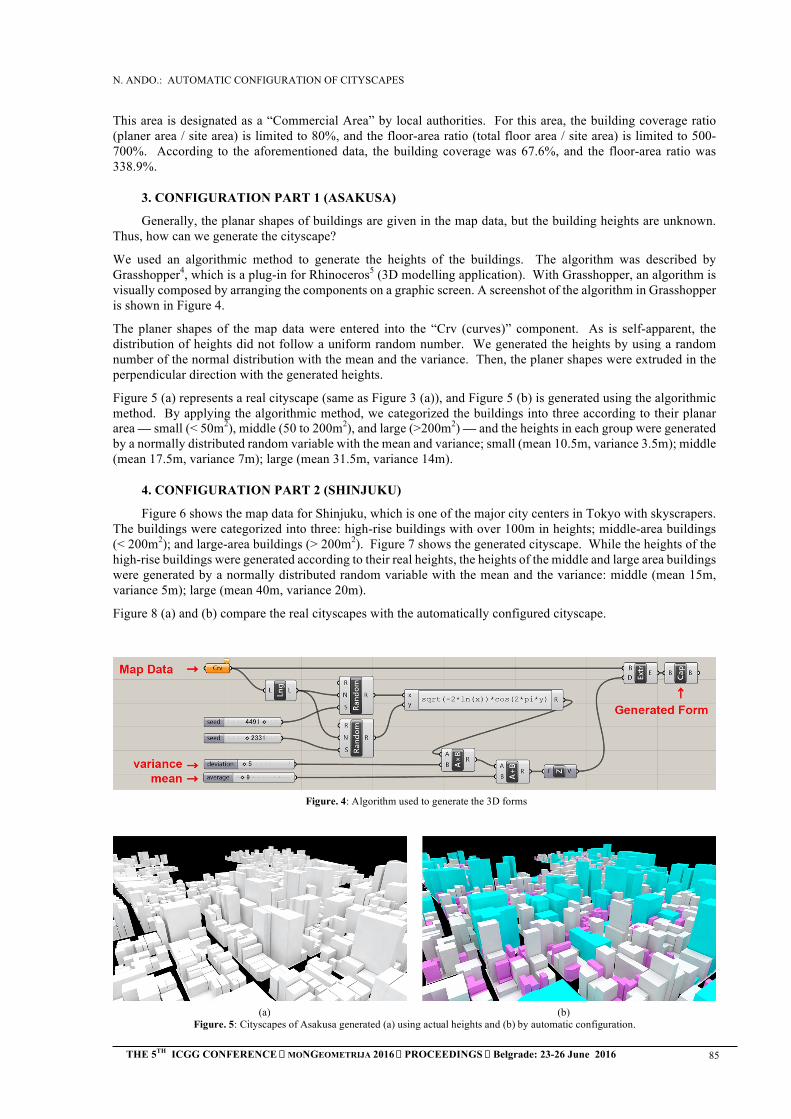
N. ANDO.: AUTOMATIC CONFIGURATION OF CITYSCAPES
THE 5TH ICGG CONFERENCE � MONGEOMETRIJA 2016 � PROCEEDINGS � Belgrade: 23-26 June 2016 85
This area is designated as a “Commercial Area” by local authorities. For this area, the building coverage ratio (planer area / site area) is limited to 80%, and the floor-area ratio (total floor area / site area) is limited to 500-700%. According to the aforementioned data, the building coverage was 67.6%, and the floor-area ratio was 338.9%.
3. CONFIGURATION PART 1 (ASAKUSA)
Generally, the planar shapes of buildings are given in the map data, but the building heights are unknown. Thus, how can we generate the cityscape?
We used an algorithmic method to generate the heights of the buildings. The algorithm was described by Grasshopper4, which is a plug-in for Rhinoceros5 (3D modelling application). With Grasshopper, an algorithm is visually composed by arranging the components on a graphic screen. A screenshot of the algorithm in Grasshopper is shown in Figure 4.
The planer shapes of the map data were entered into the “Crv (curves)” component. As is self-apparent, the distribution of heights did not follow a uniform random number. We generated the heights by using a random number of the normal distribution with the mean and the variance. Then, the planer shapes were extruded in the perpendicular direction with the generated heights.
Figure 5 (a) represents a real cityscape (same as Figure 3 (a)), and Figure 5 (b) is generated using the algorithmic method. By applying the algorithmic method, we categorized the buildings into three according to their planar area — small (< 50m2), middle (50 to 200m2), and large (>200m2) — and the heights in each group were generated by a normally distributed random variable with the mean and variance; small (mean 10.5m, variance 3.5m); middle (mean 17.5m, variance 7m); large (mean 31.5m, variance 14m).
4. CONFIGURATION PART 2 (SHINJUKU)
Figure 6 shows the map data for Shinjuku, which is one of the major city centers in Tokyo with skyscrapers. The buildings were categorized into three: high-rise buildings with over 100m in heights; middle-area buildings (< 200m2); and large-area buildings (> 200m2). Figure 7 shows the generated cityscape. While the heights of the high-rise buildings were generated according to their real heights, the heights of the middle and large area buildings were generated by a normally distributed random variable with the mean and the variance: middle (mean 15m, variance 5m); large (mean 40m, variance 20m).
Figure 8 (a) and (b) compare the real cityscapes with the automatically configured cityscape.
Figure. 4: Algorithm used to generate the 3D forms
(a) (b) Figure. 5: Cityscapes of Asakusa generated (a) using actual heights and (b) by automatic configuration.

N. ANDO.: AUTOMATIC CONFIGURATION OF CITYSCAPES
86 THE 5TH ICGG CONFERENCE � MONGEOMETRIJA 2016 � PROCEEDINGS � Belgrade: 23-26 June 2016
5. CONCLUTION
Japanese cityscapes were depicted using the automatic configuration of the building heights. Categorization of buildings by their planer areas and usage of the normal distribution for generating building heights were considered to be effective.
REFERENCES
1. Ando, N. et al, 1997. Formation of the spatialdomain and the image of mass by the solidcomposition of city blocks. Journal ofArchitecture and Planning (Transactions ofAIJ), Volume 502. pp 171–178.
2. Geospatial Information Authority of Japan.http://www.gsi.go.jp/ENGLISH/index.html[Accessed: 28th April 2016].
3. ZENRIN. http://www.zenrin.co.jp/english/ [Accessed: 28th April 2016].
4. Grasshopper, Algorithmic Modeling for Rhino.http://www.grasshopper3d.com/ [Accessed:28th April 2016].
5. Robert McNeel & Associates., Rhinoceros.http://www.rhino3d.com/ [Accessed: 28th April 2016].
(a) (b) Figure. 8: Cityscapes of Shinjuku generated (a) using actual heights, (b) by automatic configuration.
Figure. 6: Map data for Shinjuku.
Figure. 7: Cityscape of Shinjuku generated by automatic configuration.
J.LETIĆ ET AL.: AUTOMATIC PHOTOGRAMMETRIC APPROACH FOR 3D RECONSTRUCTION OF COMPLEX GEOMETRIC FORMS
THE 5TH ICGG CONFERENCE MONGEOMETRIJA 2016 PROCEEDINGS Belgrade: 23-26 June 2016 87
AUTOMATIC PHOTOGRAMMETRIC APPROACH FOR 3D RECONSTRUCTION OF COMPLEX GEOMETRIC FORMS
Jelena Letić
University of Novi Sad, Faculty of Technical Sciences, Novi Sad, Serbia PhD student, [email protected]
Isidora Đurić
University of Novi Sad, Faculty of Technical Sciences, Novi Sad, Serbia PhD student, [email protected]
ABSTRACT
Automatic photogrammetry is a close-range terrestrial photogrammetry technique and computer vision approach capable of producing detailed and accurate 3D reconstructions of objects and surfaces, which cannot be recreated by traditional CAD (computer-aided design) modeling techniques. Photo-realistic reconstruction of complex geometric forms for the purpose of documentation and preservation of cultural heritage is extremely important when the structure is altered or damaged. The goal of this work is to achieve a detailed information of the current state of the object and a good visual representation of the complex structure, in considering its specific physical features and materialization. The automatic photogrammetric approach is applied according to the workflow previously designed, and the problems occurred during the main phases of surveying and modeling are analysed. Finally, the obtained results of the 3D reconstruction are displayed. The produced 3D models demonstrate the accurate reconstruction of separated parts of the complex geometric form, while for the further application and implementation of the entire 3D reconstruction of the object, semi-automatic photogrammetric techniques can be employed. The approach is presented in the case study of the Coach of the Metropolitan of Karlovci, in the Museum of Vojvodina in Novi Sad
Keywords: automatic photogrammetry, complex geometric form, Agisoft PhotoScan software, surveying, 3D modeling
1. INTRODUCTION
Photogrammetry is a process of measuring and extracting features of a 3D object, through the analysis of overlapping 2D images. Many different photogrammetric techniques have been used over the past years [2, 3, 5, 6, 7, 8, 9, 10, 11] and they are still constantly developing. The choice of a particular technique depends mostly on the goal of the study and the purpose of the required application, but it is also influenced by the properties of an object, i.e. geometry and physical features of an object and its surrounding conditions.
The use of photogrammetry for 3D reconstruction of complex geometric forms has significant advantages over traditional CAD (computer-aided design) solid modeling techniques and drawings. The recreation of complex geometric forms and irregular structures by using traditional CAD-based techniques is a time-consuming process, and it is often extremely complicated or even impossible. In some cases, 3D reconstruction of specific materialization, physical features and structural alterations, such as cracks, breaches or damaged parts of an object cannot be created manually in CAD software. On the other hand, photogrammetric modeling is capable to produce detailed information on current state of an object, which is especially important for preservation of digital documentation of archaeological remains [2, 3, 6, 8] or objects in danger of disappearing [10], as well as of existing structures [5,10] and cultural heritage [7].
In addition, complex structures and scenes, located in restrictive or inaccessible areas, often require a large number of overlapping images for their reconstruction. In this regard, automatic photogrammetric approach has a
J.LETIĆ ET AL.: AUTOMATIC PHOTOGRAMMETRIC APPROACH FOR 3D RECONSTRUCTION OF COMPLEX GEOMETRIC FORMS
88 THE 5TH ICGG CONFERENCE MONGEOMETRIJA 2016 PROCEEDINGS Belgrade: 23-26 June 2016
central role [3, 8]. The automatic photogrammetric approach uses multiple overlapping digital images taken from a wide array of positions for reconstruction of complex dense 3D models.
This paper describes a practical approach for creating a detailed 3D reconstruction of complex geometric forms, by using automatic photogrammetry as a technique capable of producing detailed and accurate 3D models. The objective of this work was to achieve a good visual representation of a highly complex structure, considering its key features and specifics. The proposed approach is based on efficient, inexpensive and largely automated processing method that relies on low-cost (widely available) software package Agisoft PhotoScan. The method is presented in the case study of a 3D model of the Coach of the Metropolitan of Karlovci, located in the Museum of Vojvodina in Novi Sad.
2. AUTOMATIC PHOTOGRAMMETRY
Automatic photogrammetry is a relatively new, low-cost, user-friendly, close-range terrestrial photogrammetry technique and computer vision approach for obtaining accurate and realistic 3D reconstructions of objects and surfaces. In contrast to traditional photogrammetric methods that require known distance from the subject, position of the camera or other image control points to accomplish reconstruction of the subject, the automatic photogrammetric approach is capable of automatic camera calibration and reconstruction of complex geometry. It relies on computer vision-based software packages, which use multiple overlapping images taken from different positions and require minimal manual input to generate highly detailed and accurate 3D models. Automatic photogrammetry has significant advantages over traditional photogrammetric methods, and through wide range of different photogrammetric surveys that have been undertaken, usually with limited budgets, it has been proved as a rapid, effective, low-cost, user-friendly and powerful approach for creating detailed high-resolution models of both archeological and cultural heritage, as well as of complex objects [2, 8, 11].
Automatic photogrammetric software packages are constantly developing, and some of the frequently used are PhotoScan (by Agisoft), 123D Catch (by Autodesk), Smart3DCapture (by Acute3D), VisualSfM (by Changchang Wu), SFMToolkit (based on open-source software), and others. The selection of a particular photogrammetric modeling software depends mainly on a subject that is surveyed, but, regardless of which software package has been chosen, a general workflow (transformation of 2D image coordinates into 3D coordinates) is similar for all of them. The software extracts feature from multiple overlapping images taken from a wide array of positions in order to estimate camera parameters and positions, as well as the geometry of the scene. After that, the software automatically generates a 3D dense point cloud which includes the relative camera positions. The 3D point cloud is generated in a relative ‘image-space‘ coordinate system, so the known control points need to be used to coordinate model with an absolute coordinate system and to provide a scale for the final model. The end result of the 3D generation is a textured mesh of an object which contains detailed information about the materials used. The automatic photogrammetric approach and the use of Agisoft PhotoScan software are presented bellow using the case study of 3D model of the Coach of the Metropolitan of Karlovci.
3. CASE STUDY
In this section, we will represent the process of the 3D reconstruction (modeling) of the Coach of Metropolitan of Karlovci, as an example of an object of a highly complex form. The coach from the 18th century is the subject of the permanent exhibition of the Museum of Vojvodina in Novi Sad, and it represents the only preserved coach on the territory of the former Yugoslavia from that period. The coach is an enclosed, four-horse-drawn carriage that consists of several key parts - four wheels, a front and a back part of the coach, and a cabin as a central part of the coach (Figure 1). In addition, a complex form and construction, specifically the complexity of the interconnections between individual parts, and a high level of detail such as timber structure with highly detailed woodcarvings, are the main features of this coach.
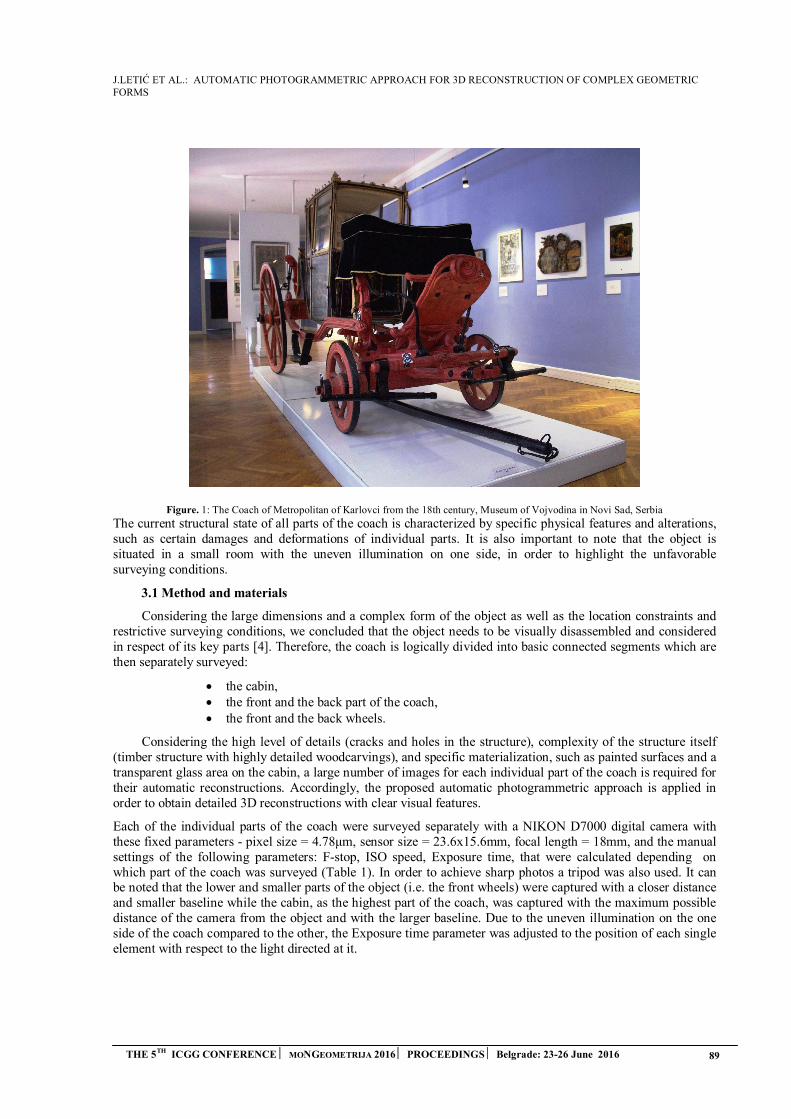
J.LETIĆ ET AL.: AUTOMATIC PHOTOGRAMMETRIC APPROACH FOR 3D RECONSTRUCTION OF COMPLEX GEOMETRIC FORMS
THE 5TH ICGG CONFERENCE MONGEOMETRIJA 2016 PROCEEDINGS Belgrade: 23-26 June 2016 89
Figure. 1: The Coach of Metropolitan of Karlovci from the 18th century, Museum of Vojvodina in Novi Sad, Serbia
The current structural state of all parts of the coach is characterized by specific physical features and alterations, such as certain damages and deformations of individual parts. It is also important to note that the object is situated in a small room with the uneven illumination on one side, in order to highlight the unfavorable surveying conditions.
3.1 Method and materials
Considering the large dimensions and a complex form of the object as well as the location constraints and restrictive surveying conditions, we concluded that the object needs to be visually disassembled and considered in respect of its key parts [4]. Therefore, the coach is logically divided into basic connected segments which are then separately surveyed:
the cabin, the front and the back part of the coach, the front and the back wheels.
Considering the high level of details (cracks and holes in the structure), complexity of the structure itself (timber structure with highly detailed woodcarvings), and specific materialization, such as painted surfaces and a transparent glass area on the cabin, a large number of images for each individual part of the coach is required for their automatic reconstructions. Accordingly, the proposed automatic photogrammetric approach is applied in order to obtain detailed 3D reconstructions with clear visual features.
Each of the individual parts of the coach were surveyed separately with a NIKON D7000 digital camera with these fixed parameters - pixel size = 4.78μm, sensor size = 23.6x15.6mm, focal length = 18mm, and the manual settings of the following parameters: F-stop, ISO speed, Exposure time, that were calculated depending on which part of the coach was surveyed (Table 1). In order to achieve sharp photos a tripod was also used. It can be noted that the lower and smaller parts of the object (i.e. the front wheels) were captured with a closer distance and smaller baseline while the cabin, as the highest part of the coach, was captured with the maximum possible distance of the camera from the object and with the larger baseline. Due to the uneven illumination on the one side of the coach compared to the other, the Exposure time parameter was adjusted to the position of each single element with respect to the light directed at it.
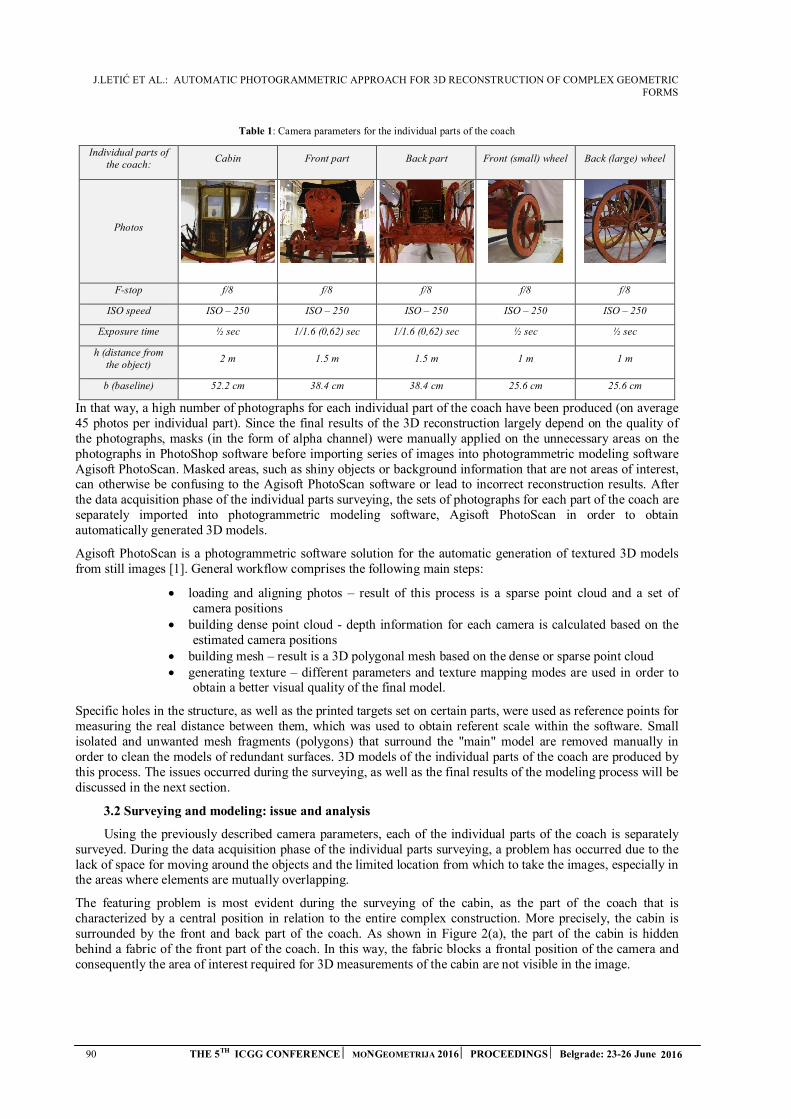
J.LETIĆ ET AL.: AUTOMATIC PHOTOGRAMMETRIC APPROACH FOR 3D RECONSTRUCTION OF COMPLEX GEOMETRIC FORMS
90 THE 5TH ICGG CONFERENCE MONGEOMETRIJA 2016 PROCEEDINGS Belgrade: 23-26 June 2016
Table 1: Camera parameters for the individual parts of the coach
Individual parts of the coach:
Cabin Front part Back part Front (small) wheel Back (large) wheel
Photos
F-stop f/8 f/8 f/8 f/8 f/8
ISO speed ISO – 250 ISO – 250 ISO – 250 ISO – 250 ISO – 250
Exposure time ½ sec 1/1.6 (0,62) sec 1/1.6 (0,62) sec ½ sec ½ sec
h (distance from the object)
2 m 1.5 m 1.5 m 1 m 1 m
b (baseline) 52.2 cm 38.4 cm 38.4 cm 25.6 cm 25.6 cm
In that way, a high number of photographs for each individual part of the coach have been produced (on average 45 photos per individual part). Since the final results of the 3D reconstruction largely depend on the quality of the photographs, masks (in the form of alpha channel) were manually applied on the unnecessary areas on the photographs in PhotoShop software before importing series of images into photogrammetric modeling software Agisoft PhotoScan. Masked areas, such as shiny objects or background information that are not areas of interest, can otherwise be confusing to the Agisoft PhotoScan software or lead to incorrect reconstruction results. After the data acquisition phase of the individual parts surveying, the sets of photographs for each part of the coach are separately imported into photogrammetric modeling software, Agisoft PhotoScan in order to obtain automatically generated 3D models.
Agisoft PhotoScan is a photogrammetric software solution for the automatic generation of textured 3D models from still images [1]. General workflow comprises the following main steps:
loading and aligning photos – result of this process is a sparse point cloud and a set ofcamera positions
building dense point cloud - depth information for each camera is calculated based on theestimated camera positions
building mesh – result is a 3D polygonal mesh based on the dense or sparse point cloud generating texture – different parameters and texture mapping modes are used in order to
obtain a better visual quality of the final model.
Specific holes in the structure, as well as the printed targets set on certain parts, were used as reference points for measuring the real distance between them, which was used to obtain referent scale within the software. Small isolated and unwanted mesh fragments (polygons) that surround the "main" model are removed manually in order to clean the models of redundant surfaces. 3D models of the individual parts of the coach are produced by this process. The issues occurred during the surveying, as well as the final results of the modeling process will be discussed in the next section.
3.2 Surveying and modeling: issue and analysis
Using the previously described camera parameters, each of the individual parts of the coach is separately surveyed. During the data acquisition phase of the individual parts surveying, a problem has occurred due to the lack of space for moving around the objects and the limited location from which to take the images, especially in the areas where elements are mutually overlapping.
The featuring problem is most evident during the surveying of the cabin, as the part of the coach that is characterized by a central position in relation to the entire complex construction. More precisely, the cabin is surrounded by the front and back part of the coach. As shown in Figure 2(a), the part of the cabin is hidden behind a fabric of the front part of the coach. In this way, the fabric blocks a frontal position of the camera and consequently the area of interest required for 3D measurements of the cabin are not visible in the image.
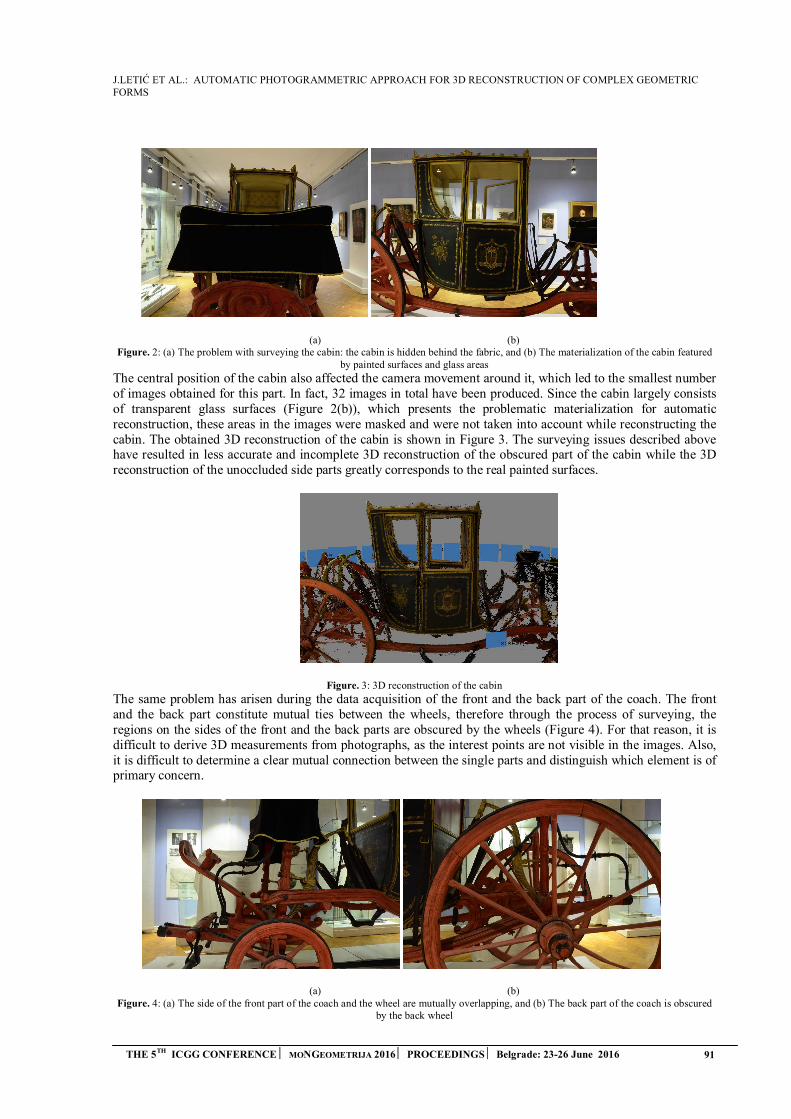
J.LETIĆ ET AL.: AUTOMATIC PHOTOGRAMMETRIC APPROACH FOR 3D RECONSTRUCTION OF COMPLEX GEOMETRIC FORMS
THE 5TH ICGG CONFERENCE MONGEOMETRIJA 2016 PROCEEDINGS Belgrade: 23-26 June 2016 91
(a) (b) Figure. 2: (a) The problem with surveying the cabin: the cabin is hidden behind the fabric, and (b) The materialization of the cabin featured
by painted surfaces and glass areas
The central position of the cabin also affected the camera movement around it, which led to the smallest number of images obtained for this part. In fact, 32 images in total have been produced. Since the cabin largely consists of transparent glass surfaces (Figure 2(b)), which presents the problematic materialization for automatic reconstruction, these areas in the images were masked and were not taken into account while reconstructing the cabin. The obtained 3D reconstruction of the cabin is shown in Figure 3. The surveying issues described above have resulted in less accurate and incomplete 3D reconstruction of the obscured part of the cabin while the 3D reconstruction of the unoccluded side parts greatly corresponds to the real painted surfaces.
Figure. 3: 3D reconstruction of the cabin
The same problem has arisen during the data acquisition of the front and the back part of the coach. The front and the back part constitute mutual ties between the wheels, therefore through the process of surveying, the regions on the sides of the front and the back parts are obscured by the wheels (Figure 4). For that reason, it is difficult to derive 3D measurements from photographs, as the interest points are not visible in the images. Also, it is difficult to determine a clear mutual connection between the single parts and distinguish which element is of primary concern.
(a) (b) Figure. 4: (a) The side of the front part of the coach and the wheel are mutually overlapping, and (b) The back part of the coach is obscured
by the back wheel

J.LETIĆ ET AL.: AUTOMATIC PHOTOGRAMMETRIC APPROACH FOR 3D RECONSTRUCTION OF COMPLEX GEOMETRIC FORMS
92 THE 5TH ICGG CONFERENCE MONGEOMETRIJA 2016 PROCEEDINGS Belgrade: 23-26 June 2016
On the other hand, the most favorable surveying conditions, such as greater distance from the object and available space to maneuver around it, contributed to the higher number of images produced, and, consequently, to the higher level of details of 3D reconstruction. The automatically generated 3D models of the front and the back part of the coach show a realistic woodcarvings (Figure 5(a)) and it is also obvious that the reconstruction of the fabric of the front part of the coach is more consistent than in the 3D model of the cabin, where it was also in focus (Figure 5(b)). That phenomenon demonstrated that the usage of different camera poses and parameters for each particular part is crucial for surveying and modeling of complex forms.
(a) (b) Figure. 5: (a) 3D reconstruction of the front part of the coach, with detailed woodcarvings, and (b) A side view of the 3D reconstruction of
the front part of the coach
The problem with overlapping between the elements is not so much present during the process of surveying the wheels, as they are the most extended parts of the coach construction, with visual features clearly visible in the images. On average 45 images per each wheel have been obtained, and 3D models of the wheels are automatically generated in Agisoft PhotoScan software. The whole geometry of the wheels was reconstructed, and details, such as damages on the structure, cracks and holes, greatly correspond to the real state of the object (Figures 6, 7). In addition, it can be observed that the most comprehensive and most accurate 3D model is obtained for the small (front) wheels. This aspect is caused by the position of the small wheels in relation to the overall structure (i.e. wheels are the most clearly defined part of the coach, with the lowest level of interweaving with other elements).
Figure. 6: 3D reconstruction of the back wheel
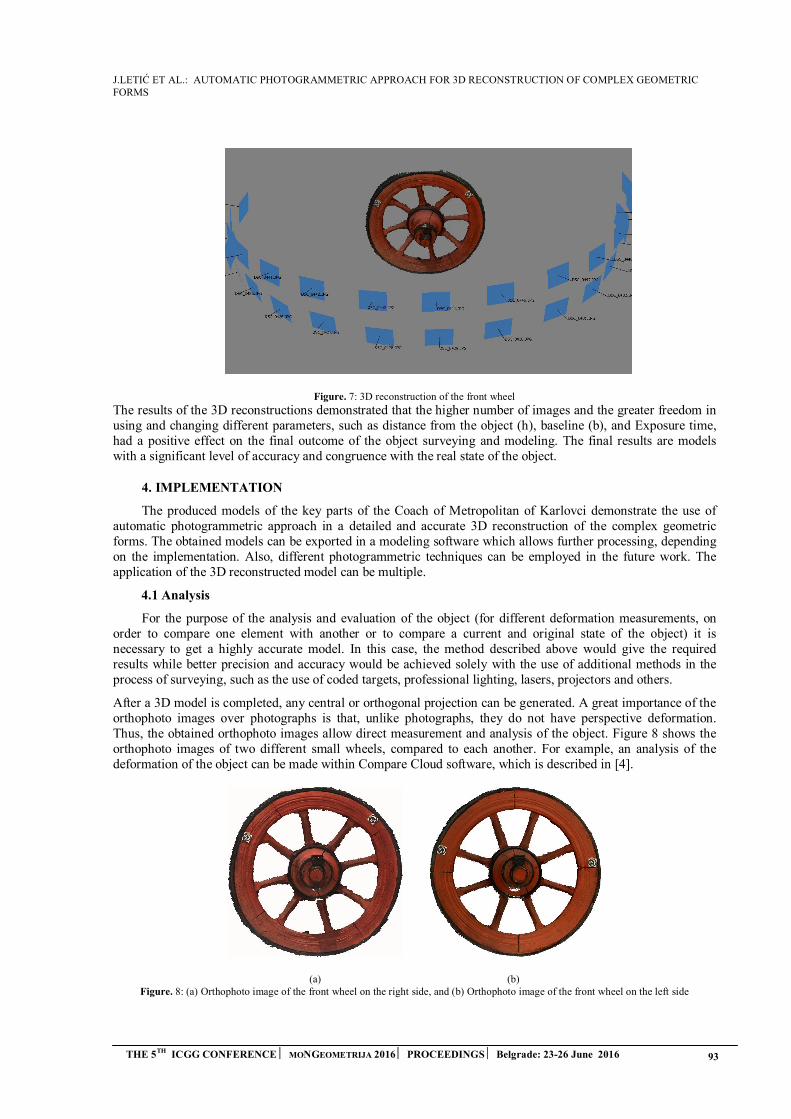
J.LETIĆ ET AL.: AUTOMATIC PHOTOGRAMMETRIC APPROACH FOR 3D RECONSTRUCTION OF COMPLEX GEOMETRIC FORMS
THE 5TH ICGG CONFERENCE MONGEOMETRIJA 2016 PROCEEDINGS Belgrade: 23-26 June 2016 93
Figure. 7: 3D reconstruction of the front wheel
The results of the 3D reconstructions demonstrated that the higher number of images and the greater freedom in using and changing different parameters, such as distance from the object (h), baseline (b), and Exposure time, had a positive effect on the final outcome of the object surveying and modeling. The final results are models with a significant level of accuracy and congruence with the real state of the object.
4. IMPLEMENTATION
The produced models of the key parts of the Coach of Metropolitan of Karlovci demonstrate the use of automatic photogrammetric approach in a detailed and accurate 3D reconstruction of the complex geometric forms. The obtained models can be exported in a modeling software which allows further processing, depending on the implementation. Also, different photogrammetric techniques can be employed in the future work. The application of the 3D reconstructed model can be multiple.
4.1 Analysis
For the purpose of the analysis and evaluation of the object (for different deformation measurements, on order to compare one element with another or to compare a current and original state of the object) it is necessary to get a highly accurate model. In this case, the method described above would give the required results while better precision and accuracy would be achieved solely with the use of additional methods in the process of surveying, such as the use of coded targets, professional lighting, lasers, projectors and others.
After a 3D model is completed, any central or orthogonal projection can be generated. A great importance of the orthophoto images over photographs is that, unlike photographs, they do not have perspective deformation. Thus, the obtained orthophoto images allow direct measurement and analysis of the object. Figure 8 shows the orthophoto images of two different small wheels, compared to each another. For example, an analysis of the deformation of the object can be made within Compare Cloud software, which is described in [4].
(a) (b) Figure. 8: (a) Orthophoto image of the front wheel on the right side, and (b) Orthophoto image of the front wheel on the left side

J.LETIĆ ET AL.: AUTOMATIC PHOTOGRAMMETRIC APPROACH FOR 3D RECONSTRUCTION OF COMPLEX GEOMETRIC FORMS
94 THE 5TH ICGG CONFERENCE MONGEOMETRIJA 2016 PROCEEDINGS Belgrade: 23-26 June 2016
4.2 3D representation
Visualization, i.e. 3D representation of an object for the purposes of preservation and promotion of cultural heritage, does not require a high level of accuracy of the reconstruction of the 3D model, in terms of precisely generated dimensions of the object. Thus, it is satisfying for the model to visually correspond to the real object. The previously explained surveying method and the obtained 3D models of the key parts of the coach meet the requirements of this application. Still, for the 3D representation of the whole coach, it is necessary to gain an entire 3D model of the whole object. For the purpose of connecting key individual parts into a whole object and creating a complete 3D representation, semi-automatic photogrammetry technique and some user`s interaction in the different steps of the modeling process are required. By using semi-automatic photogrammetric modeling software – PhotoModeler reference points that indicate accurate relative positions of the key parts of the coach can be determined, and all parts can be joined into a whole within 3D modeling software 3ds Max [4]. In that way, the complete model can be used in digital and interactive museums. An example of the possible application is shown in the photomontage below (Figure 9).
Figure. 9: Photomontage - an example of the possible application of a 3D model. (Source of background image: http://mw2013.museumsandtheweb.com)
Within the visualization, the reconstructed 3D model can also be animated. In that case, emphasis in the modeling of the object would be on the optimization of the mesh of the components which will be animated, as well as on the precise reconstruction of their compounds, in order to simulate the movement of the whole object.
4.3 Documentation and web presentation
In the purpose of preserving the heritage, storing digital data (perspective images, characteristic views, orthophoto images), unlike the classic archive material, has multiple advantages: space saving, ability to easily and quickly exchange and send, change and add data. By using automatic photogrammetry that implies a large number of images gained for each individual part surveyed, detailed and photorealistic 3D models are obtained which is especially important for documentation of the current state of cultural heritage, i.e. if the structure is altered or damaged. However, since the fully automated process and a large number of images produce the large size of final files, the 3D models of that size are not suitable for web presentations. For that purpose, the models need to be optimized which requires a specific technical expertise and a lot of manual work.
5. CONCLUSION
In this paper, a practical approach for 3D reconstruction of a complex geometric form is presented. The aim of this work was to obtain detailed 3D reconstructions of a highly complex structure with clear visual features. For that purpose, the complex form was visually segmented into its main parts, which were separately surveyed and automatically reconstructed, within Agisoft PhotoScan software. The automatic photogrammetric approach was used, as an effective, low-cost, close-range terrestrial photogrammetry technique and computer vision approach, capable of producing accurate and realistic 3D reconstruction. The problems which occurred during the surveying and modeling process are mainly caused by the position and materialization of the particular part in relation to the entire complex form, as well as by the location constraints which limit the surveying in certain cases. Regarding that, separate camera parameters and calculations for each individual part are needed for surveying of the complex form. Thus obtained 3D models of individual parts of the complex structure demonstrated that the higher number of images and the greater freedom in using and changing different parameters, such as distance from the object (h), baseline (b), and Exposure time, significantly influence the final
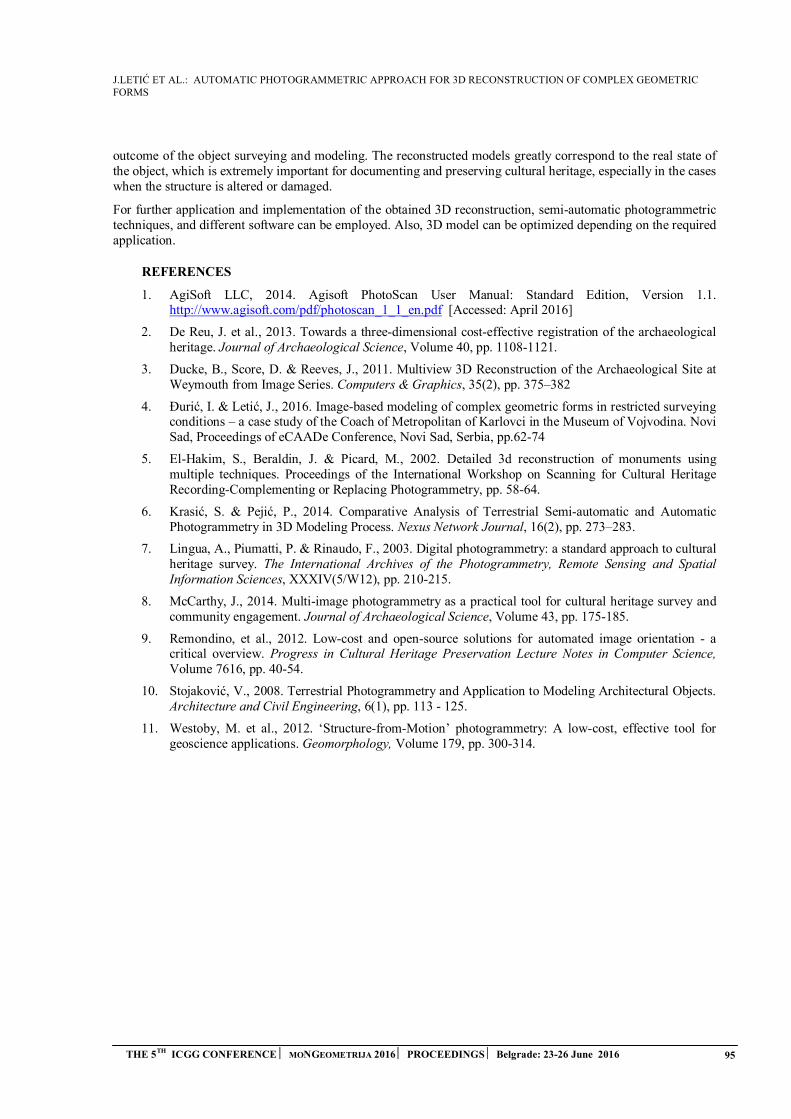
J.LETIĆ ET AL.: AUTOMATIC PHOTOGRAMMETRIC APPROACH FOR 3D RECONSTRUCTION OF COMPLEX GEOMETRIC FORMS
THE 5TH ICGG CONFERENCE MONGEOMETRIJA 2016 PROCEEDINGS Belgrade: 23-26 June 2016 95
outcome of the object surveying and modeling. The reconstructed models greatly correspond to the real state of the object, which is extremely important for documenting and preserving cultural heritage, especially in the cases when the structure is altered or damaged.
For further application and implementation of the obtained 3D reconstruction, semi-automatic photogrammetric techniques, and different software can be employed. Also, 3D model can be optimized depending on the required application.
REFERENCES
1. AgiSoft LLC, 2014. Agisoft PhotoScan User Manual: Standard Edition, Version 1.1.http://www.agisoft.com/pdf/photoscan_1_1_en.pdf [Accessed: April 2016]
2. De Reu, J. et al., 2013. Towards a three-dimensional cost-effective registration of the archaeologicalheritage. Journal of Archaeological Science, Volume 40, pp. 1108-1121.
3. Ducke, B., Score, D. & Reeves, J., 2011. Multiview 3D Reconstruction of the Archaeological Site atWeymouth from Image Series. Computers & Graphics, 35(2), pp. 375–382
4. Đurić, I. & Letić, J., 2016. Image-based modeling of complex geometric forms in restricted surveyingconditions – a case study of the Coach of Metropolitan of Karlovci in the Museum of Vojvodina. NoviSad, Proceedings of eCAADe Conference, Novi Sad, Serbia, pp.62-74
5. El-Hakim, S., Beraldin, J. & Picard, M., 2002. Detailed 3d reconstruction of monuments usingmultiple techniques. Proceedings of the International Workshop on Scanning for Cultural HeritageRecording-Complementing or Replacing Photogrammetry, pp. 58-64.
6. Krasić, S. & Pejić, P., 2014. Comparative Analysis of Terrestrial Semi-automatic and AutomaticPhotogrammetry in 3D Modeling Process. Nexus Network Journal, 16(2), pp. 273–283.
7. Lingua, A., Piumatti, P. & Rinaudo, F., 2003. Digital photogrammetry: a standard approach to culturalheritage survey. The International Archives of the Photogrammetry, Remote Sensing and SpatialInformation Sciences, XXXIV(5/W12), pp. 210-215.
8. McCarthy, J., 2014. Multi-image photogrammetry as a practical tool for cultural heritage survey andcommunity engagement. Journal of Archaeological Science, Volume 43, pp. 175-185.
9. Remondino, et al., 2012. Low-cost and open-source solutions for automated image orientation - acritical overview. Progress in Cultural Heritage Preservation Lecture Notes in Computer Science,Volume 7616, pp. 40-54.
10. Stojaković, V., 2008. Terrestrial Photogrammetry and Application to Modeling Architectural Objects.Architecture and Civil Engineering, 6(1), pp. 113 - 125.
11. Westoby, M. et al., 2012. ‘Structure-from-Motion’ photogrammetry: A low-cost, effective tool forgeoscience applications. Geomorphology, Volume 179, pp. 300-314.

N. RADOJEVIC: CENTRAL PROJECTION: DIFFERENT APPLICATIONS IN ARCHITECTURAL DESIGN PROCESSES FROM DESIGN TO CONSTRUCTIVE TOOL
THE 5TH ICGG CONFERENCE ⏐ MONGEOMETRIJA 2016 ⏐ PROCEEDINGS ⏐ Belgrade: 23-26 June 2016 96
CENTRAL PROJECTION: DIFFERENT APPLICATIONS IN ARCHITECTURAL DESIGN PROCESSES FROM DESIGN TO
CONSTRUCTIVE TOOL
Nevena Radojevic
Department of Architecture DiDA, University of Florence, Florence, Italy PhD., Assistant Professor, [email protected]
ABSTRACT
This paper aims to show some different applications of the central projection principles in architectural design processes within different historical periods. The two main examples that are going to be compared are Pantheon’s dome and the umbrella vault in Pazzi Chapel in Santa Croce church in Florence (designed by Brunelleschi). In both cases the research was done on the three-dimensional metric data bases (provided by laser scanner) and verified by overlapping the MESH model (survey based) with the NURBS one (hypothesized).
In the Pantheon’s case, the central projection was used as a design tool that can be related to Vitruvius scenography. The facts that the dome’s coffers appear as concentric circles when seen from the centre while their section is very chaotic reveal us the design process used by Pantheon’s architect, that is one particular central projection: the stereographic one. In the Pazzi Chapel’s case, the use of the central projection is even more complex and sophisticated. According to the hypotheses made by the author, the inner sail of the umbrella vault (that is double sailed) is a three-dimensional central projection of the outer one. The hypothesized outer sail is a toric surface and the inner one is a ‘conchoid of torus’ obtained in a similar manner as the Nicomedes conchoid in 2d. From any point of torus we can define the point that pertains to its conchoid with respect to the fixed point (dome’s oculus in our case) and constant length (torus radius).
The two very particular uses of the central projection in these two examples are related to different cultural paradigms. The same principles (that were very well known by the antique astronomy and cartography scholars) were applied as the design tool in the Pantheon’s case and both design and constructive tool by the Renaissance architect.
Keywords: central projection; Pantheon’s dome; Pazzi Chapel; Vitruvius scenography; design process
INTRODUCTION
If we observe the Pantheon’s coffered dome from the center of the ground-floor, we would see the 28 x 5 series of concentric squares, as if the three-dimensional design was a completely flat drawing projected on the inner sphere. The coffers are visible as a sequence of concentric squares, and we cannot even read their 3rd dimension without the presence of light and shadows. As C. Soddu noticed: ‘…before the light you don’t understand if the sequence of the frames is going toward inside or toward outside of the sphere. And something incredible can happen. With the sunlight the 3d objects reverse their position. For one moment you can understand the Pantheon as if it was in a Florenskji’s reverse perspective, and all you are seeing in the inside is the outside skin’ (Soddu 2008).
On the other hand, the curious vertical section of lacunar appears as very chaotic: while the edges of the upper parts of the profiles converge towards the center of the sphere, the lower ones have a completely irregular convergence (figs. 4, 5). This very particular occurrence which does not seem to happen on the other Pantheon inspired coffered domes, is led by very specific and sophisticated design pattern. In order to explain that pattern, we need to answer the following questions: Which is the rule that guides the degradation and the distribution of the squares in 3rd dimension? How is it possible to see the squares as if they were concentric while they are placed on the four different spheres? Which reasons and what kind of knowledge could lead to such a sophisticated project and its execution?

N. RADOJEVIC: CENTRAL PROJECTION: DIFFERENT APPLICATIONS IN ARCHITECTURAL DESIGN PROCESSES FROM DESIGN TO CONSTRUCTIVE TOOL
97 THE 5TH ICGG CONFERENCE ⏐ MONGEOMETRIJA 2016 ⏐ PROCEEDINGS ⏐ Belgrade: 23-26 June 2016
As we are going to see the Pantheon’s architect used one very particular design tool based on the central projection principles, related to Vitruvius scenography. The section, in this case, is only the consequence of the applied design process, and not the drawing that defined the project.
In the Pazzi Chapel’s case, the use of the central projection is even more complex and sophisticated. The umbrella vault of the Chapel is double sailed and only the inner sail is visible. According to the hypotheses previously made by the author, the inner sail is a three-dimensional central projection of the outer one. The hypnotized outer sail is a toric surface and the inner one is a ‘conchoid of torus’ obtained in a similar manner as the Nicomedes conchoid in 2d. From any point of torus we can define the point that pertains to its conchoid with respect to the fixed point (dome’s oculus in our case) and constant length (torus radius). This hypothesis are based on the analyses that were done by correlating detailed surveys and geometric analyses of the vault, comprising the curves, surfaces and the possible masonry texture with thus hypothesized form and the results were verified by overlapping the hypothesized inner sail’s form with the laser scanner data.
Figure. 1: Three-dimensional model of Pantheon’s dome seen from the sphere’s antipode (center of the floor).
1. METHODOLOGY
The research, in the case of the Pantheon in Rome, is based on the metric data provided by integration of few surveying campaigns, and, in part, is founded on the previous studies1. The metric sources of this study are:
• The three dimensional laser scanner data (cloud of points) that has been made available to us thanks tothe University of Rome and prof. Riccardo Migliari’s research group. This data consists of 12 separatescans of the cupola, without a topographic base.
• Snapshots obtained from point cloud of a complete Pantheon, processed by University of Bern, andavailable on an online platform2. The Bern’s University data was integrated with the first one (themetric one), in order to verify the registration process and cover the missing zones.
As we mentioned, the cloud of points has been acquired without a topographic network support and with a very tight field of grip, which has produced 12 different scans, not oriented in respect to the horizontal plane. For these reasons, it was not very reliable to do the recording of the different scans based on the physical points. Therefore, we preferred to process each separate slice (fig. 2).
1 The Pantheon section’s shape generation study is based on a previous thesis made by prof. M.T. Bartoli that hypothesized the possibility that the dome’s design was made in according to the use of Ptolemy’s stereographic projection, putting it in a close relation with Vitruvius’ scenography. In that period, being the digital surveying data not accessible, it was very difficult to describe the section’s profile in a precise manner. The further studies and verification were carried by the author in part in Ph.D. thesis, and in part for this occasion.
2 The Bern Digital Pantheon Model, http://www.digitalpantheon.ch/building/digitalmodel

N. RADOJEVIC: CENTRAL PROJECTION: DIFFERENT APPLICATIONS IN ARCHITECTURAL DESIGN PROCESSES FROM DESIGN TO CONSTRUCTIVE TOOL
THE 5TH ICGG CONFERENCE ⏐ MONGEOMETRIJA 2016 ⏐ PROCEEDINGS ⏐ Belgrade: 23-26 June 2016 98
Also in the Pazzi Chapel case, all the analyses were done by correlating detailed digital surveys and geometric analyses of the vault, comprising the curves, surfaces and the possible masonry texture with the hypothesized form. The integrated survey (terrestrial laser scanner and photogrammetry), promoted by Opera di Santa Croce was done in 2012 in a collaboration with University of Florence within the research project ‘Laboratorio di Santa Croce’. All the verification steps, in the both cases, were done by overlapping the hypothesized forms with the laser scanner data (Radojevic 2016, 2015, 2014). For this occasion we are just going to see the final results of the two case studies.
Figure. 2: Mesh model obtained from the point cloud segment overlapped with the hypothesized design
2. PANTHEON’S DOME
The coffers are cavities formed in the ceilings of the spherical, cylindrical or oval domes, arranged on a regular basis. They are characterized by the geometric shapes, among which the most common are: the circle, the square, the rectangle and the octagon. For this reason, the lacunar’s design is commonly linked with the scientific reflections on the issues of the sphere and its representation. It represents the necessary base for the celestial and terrestrial studies (astronomy and geography). The different ways to track the lacunars onto the sphere surface often reveals a particular set of cultural paradigms to which they belong.
Giovanni Rondelet, executor of the coffered vault of St. Genevieve church (also known as Paris’s Pantheon), designed by Soufflot, in one note of his famous treatise entitled ‘On the way to describe the coffers on spherical and spheroidal vaults (Rondelet 1832 pp. 190-199), explains the method he used for the realization of various lacunar types (fig. 3). According to Rondelet, the design of the coffers on the spherical vaults is solved once we have found the rays of the series of tangent circles that can be plotted, inside the unrolled spindles, between two ribs and the horizontal circle. Once the spindles are developed, using the approximate method that he described in the chapter titled ’Sviluppo dei solidi la cui superficie è a doppia curvatura’, we are able to draw the first circle tangent to the first horizontal arch and two vertical arches, the next is tangent to the first one and the two vertical arches, and so on. Subsequently, we can inscribe any other regular polygon inside the circle. Once we have chosen the polygon’s shape, we can draw a series of concentric polygons on the developed spindle and then generate the section (by transporting the distances). The three dimensional form is created by assigning the extrusion quantity of the shapes, and the side edges between the adjacent squares (for example) are perpendicular to the spindles plane, thus, oriented to the sphere center.
If we observe a vault designed in the Rondelet’s manner, although it was designed by applying the sequence of concentric squares rule, we cannot perceive the concentric squares when we look at the dome. Some of the side edges are not visible any more, and some of them are aligned with the visual rays. On the other hand, if we observe the Pantheon’s dome from the center of the ground-floor, as we mentioned, we will see a completely different image. We would see the 28 x 5 series of concentric squares, where all the edges are clearly visible, including the side ones, as if the three-dimensional design was a completely flat drawing projected on the inner sphere (fig. 1).
The great visual effect which transmits the image of the Pantheon’s dome is achieved by setting the design process in a very sophisticated manner. Such result is only possible if we start with a flat, two-dimensional

N. RADOJEVIC: CENTRAL PROJECTION: DIFFERENT APPLICATIONS IN ARCHITECTURAL DESIGN PROCESSES FROM DESIGN TO CONSTRUCTIVE TOOL
99 THE 5TH ICGG CONFERENCE ⏐ MONGEOMETRIJA 2016 ⏐ PROCEEDINGS ⏐ Belgrade: 23-26 June 2016
design (the final result that we want to see), and make a sort of a solid projection on a series of concentric spheres (figs. 4, 5). The solution refers to a particular central projection, the stereographic polar projection, described by Ptolemy in the same period of the Pantheon’s construction. The polar stereographic projection is a conformal projection, which transforms a plan drawing in a drawing onto the sphere surface and vice-versa, while maintaining unchanged angles (a circle on the plan is transformed in a circle on the sphere, a square in spherical square etc.). The center of projection is located in one of the poles of the sphere (the center of the floor in this case), while the projection plane (quadro) is given by the equatorial plane (horizontal plane passing through the dome’s base).
Figure. 3: Schema of possible choices during three generative phases. The only step that is producing two different species is the set of rules selection in shape grammar phase.
Pantheon dome’s design
In order to explain the Pantheon’s dome design we can try to divide the dome’s generation process in three phases. The first phase, or the ‘parametric design phase’ is where we define the input data parameters. The second phase is one in which the process could be divided in two different ways, but the result would be the same in any case. And the third one is the ‘language definition phase’. In this phase we need to answer the questions like: In which manner are we going to generate a 3rd lacunar’s dimension? Does its form need to be perceived in a certain manner, or its generation is ruled by some other principles? Or, once we have determined the first sequence of squares are we going to do the simple extrusion of it and then place the others in a concentric way according to their centers, or we want them to be perceived as concentric? The output data, in this phase, is divided in two big groups: the Pantheon species, and the Pantheon-like species. This phase also reveals us the procedures that have been used in the second one.
If we look for the possible algorithms, due to describe the generation of coffered dome types, we can define the three main steps (fig. 3):
1. Input data set, or parametric design phase, in which we are giving the initial input data. The variables inthis case are few input parameters, such as: the sphere’s radius, number of meridian and parallel divisions and the lacunar’s shape choice (fig. 4).
2. Mapping the inner sphere phase, in which we are defining the way to map the dome’s inner sphere. Aswe mentioned, there are two possible ways to map the sphere’s surface in a regular manner. The first, and the exact one, would be the stereographic projection (fig. 4), while the second is given as in Rondelet’s spindle
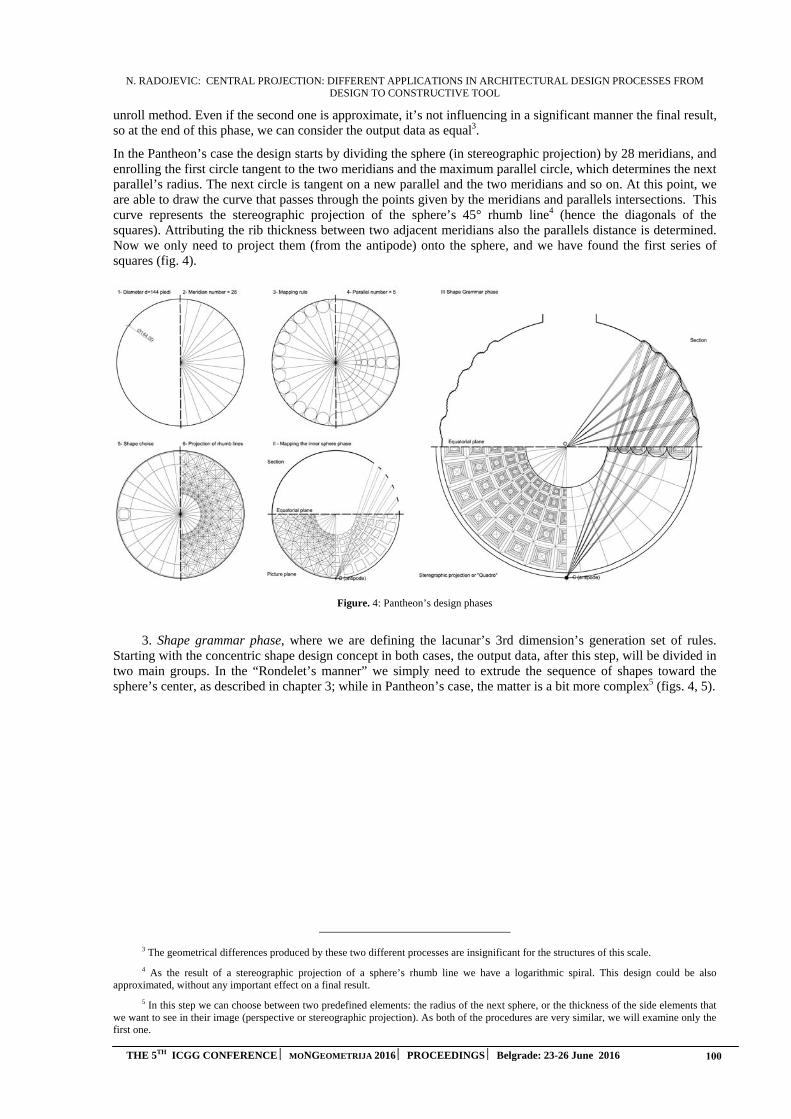
N. RADOJEVIC: CENTRAL PROJECTION: DIFFERENT APPLICATIONS IN ARCHITECTURAL DESIGN PROCESSES FROM DESIGN TO CONSTRUCTIVE TOOL
THE 5TH ICGG CONFERENCE ⏐ MONGEOMETRIJA 2016 ⏐ PROCEEDINGS ⏐ Belgrade: 23-26 June 2016 100
unroll method. Even if the second one is approximate, it’s not influencing in a significant manner the final result, so at the end of this phase, we can consider the output data as equal3.
In the Pantheon’s case the design starts by dividing the sphere (in stereographic projection) by 28 meridians, and enrolling the first circle tangent to the two meridians and the maximum parallel circle, which determines the next parallel’s radius. The next circle is tangent on a new parallel and the two meridians and so on. At this point, we are able to draw the curve that passes through the points given by the meridians and parallels intersections. This curve represents the stereographic projection of the sphere’s 45° rhumb line4 (hence the diagonals of the squares). Attributing the rib thickness between two adjacent meridians also the parallels distance is determined. Now we only need to project them (from the antipode) onto the sphere, and we have found the first series of squares (fig. 4).
Figure. 4: Pantheon’s design phases
3. Shape grammar phase, where we are defining the lacunar’s 3rd dimension’s generation set of rules.Starting with the concentric shape design concept in both cases, the output data, after this step, will be divided in two main groups. In the “Rondelet’s manner” we simply need to extrude the sequence of shapes toward the sphere’s center, as described in chapter 3; while in Pantheon’s case, the matter is a bit more complex5 (figs. 4, 5).
3 The geometrical differences produced by these two different processes are insignificant for the structures of this scale.
4 As the result of a stereographic projection of a sphere’s rhumb line we have a logarithmic spiral. This design could be also approximated, without any important effect on a final result.
5 In this step we can choose between two predefined elements: the radius of the next sphere, or the thickness of the side elements that we want to see in their image (perspective or stereographic projection). As both of the procedures are very similar, we will examine only the first one.
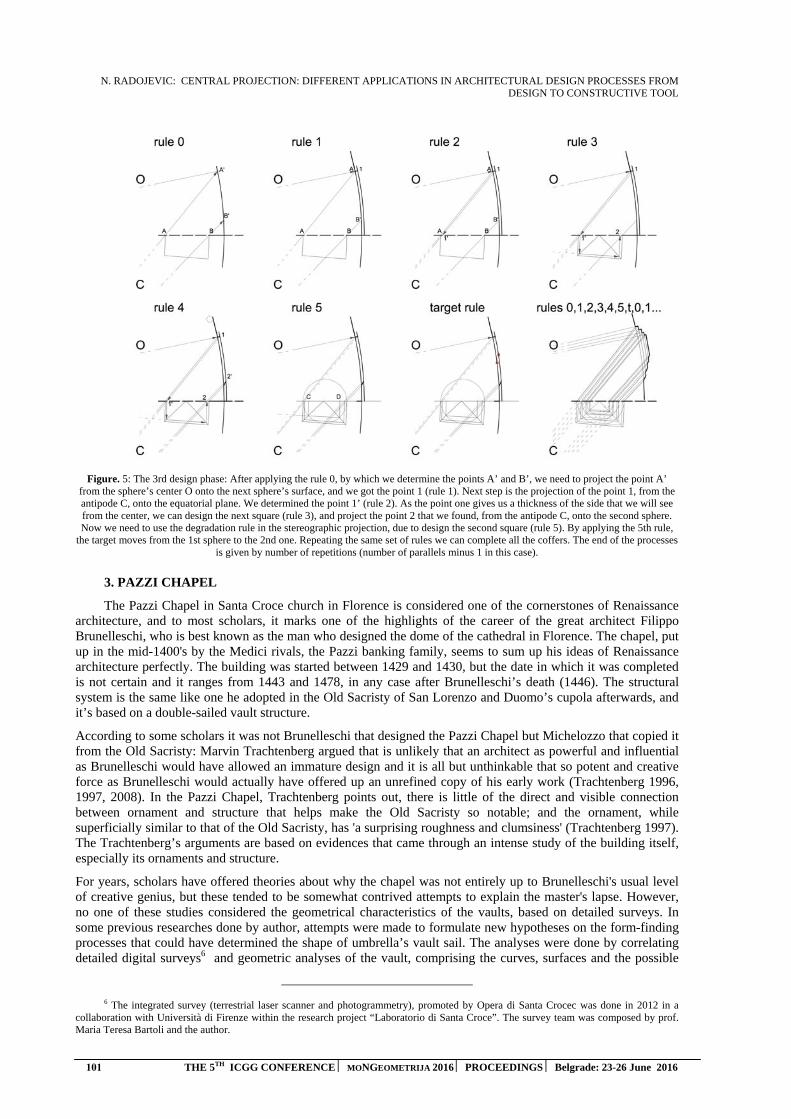
N. RADOJEVIC: CENTRAL PROJECTION: DIFFERENT APPLICATIONS IN ARCHITECTURAL DESIGN PROCESSES FROM DESIGN TO CONSTRUCTIVE TOOL
101 THE 5TH ICGG CONFERENCE ⏐ MONGEOMETRIJA 2016 ⏐ PROCEEDINGS ⏐ Belgrade: 23-26 June 2016
Figure. 5: The 3rd design phase: After applying the rule 0, by which we determine the points A’ and B’, we need to project the point A’ from the sphere’s center O onto the next sphere’s surface, and we got the point 1 (rule 1). Next step is the projection of the point 1, from the antipode C, onto the equatorial plane. We determined the point 1’ (rule 2). As the point one gives us a thickness of the side that we will see from the center, we can design the next square (rule 3), and project the point 2 that we found, from the antipode C, onto the second sphere. Now we need to use the degradation rule in the stereographic projection, due to design the second square (rule 5). By applying the 5th rule,
the target moves from the 1st sphere to the 2nd one. Repeating the same set of rules we can complete all the coffers. The end of the processes is given by number of repetitions (number of parallels minus 1 in this case).
3. PAZZI CHAPEL
The Pazzi Chapel in Santa Croce church in Florence is considered one of the cornerstones of Renaissance architecture, and to most scholars, it marks one of the highlights of the career of the great architect Filippo Brunelleschi, who is best known as the man who designed the dome of the cathedral in Florence. The chapel, put up in the mid-1400's by the Medici rivals, the Pazzi banking family, seems to sum up his ideas of Renaissance architecture perfectly. The building was started between 1429 and 1430, but the date in which it was completed is not certain and it ranges from 1443 and 1478, in any case after Brunelleschi’s death (1446). The structural system is the same like one he adopted in the Old Sacristy of San Lorenzo and Duomo’s cupola afterwards, and it’s based on a double-sailed vault structure.
According to some scholars it was not Brunelleschi that designed the Pazzi Chapel but Michelozzo that copied it from the Old Sacristy: Marvin Trachtenberg argued that is unlikely that an architect as powerful and influential as Brunelleschi would have allowed an immature design and it is all but unthinkable that so potent and creative force as Brunelleschi would actually have offered up an unrefined copy of his early work (Trachtenberg 1996, 1997, 2008). In the Pazzi Chapel, Trachtenberg points out, there is little of the direct and visible connection between ornament and structure that helps make the Old Sacristy so notable; and the ornament, while superficially similar to that of the Old Sacristy, has 'a surprising roughness and clumsiness' (Trachtenberg 1997). The Trachtenberg’s arguments are based on evidences that came through an intense study of the building itself, especially its ornaments and structure.
For years, scholars have offered theories about why the chapel was not entirely up to Brunelleschi's usual level of creative genius, but these tended to be somewhat contrived attempts to explain the master's lapse. However, no one of these studies considered the geometrical characteristics of the vaults, based on detailed surveys. In some previous researches done by author, attempts were made to formulate new hypotheses on the form-finding processes that could have determined the shape of umbrella’s vault sail. The analyses were done by correlating detailed digital surveys6 and geometric analyses of the vault, comprising the curves, surfaces and the possible
6 The integrated survey (terrestrial laser scanner and photogrammetry), promoted by Opera di Santa Crocec was done in 2012 in a collaboration with Università di Firenze within the research project “Laboratorio di Santa Croce”. The survey team was composed by prof. Maria Teresa Bartoli and the author.
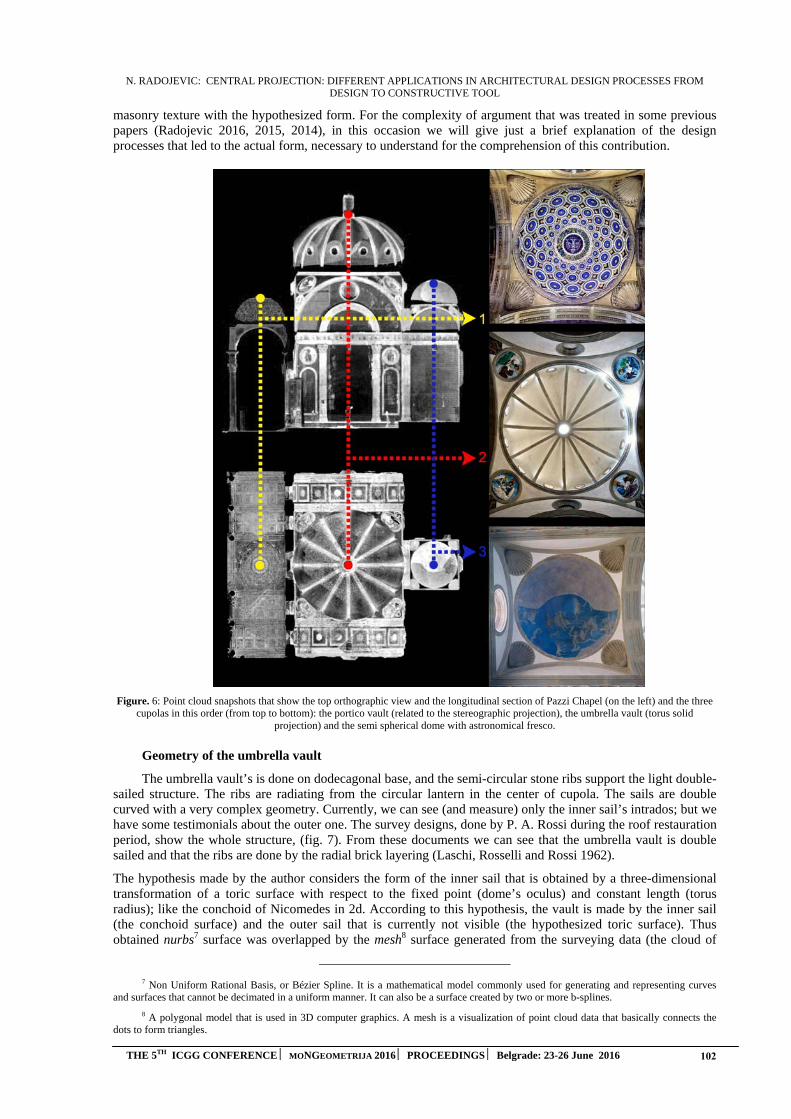
N. RADOJEVIC: CENTRAL PROJECTION: DIFFERENT APPLICATIONS IN ARCHITECTURAL DESIGN PROCESSES FROM DESIGN TO CONSTRUCTIVE TOOL
THE 5TH ICGG CONFERENCE ⏐ MONGEOMETRIJA 2016 ⏐ PROCEEDINGS ⏐ Belgrade: 23-26 June 2016 102
masonry texture with the hypothesized form. For the complexity of argument that was treated in some previous papers (Radojevic 2016, 2015, 2014), in this occasion we will give just a brief explanation of the design processes that led to the actual form, necessary to understand for the comprehension of this contribution.
Figure. 6: Point cloud snapshots that show the top orthographic view and the longitudinal section of Pazzi Chapel (on the left) and the three cupolas in this order (from top to bottom): the portico vault (related to the stereographic projection), the umbrella vault (torus solid
projection) and the semi spherical dome with astronomical fresco.
Geometry of the umbrella vault
The umbrella vault’s is done on dodecagonal base, and the semi-circular stone ribs support the light double-sailed structure. The ribs are radiating from the circular lantern in the center of cupola. The sails are double curved with a very complex geometry. Currently, we can see (and measure) only the inner sail’s intrados; but we have some testimonials about the outer one. The survey designs, done by P. A. Rossi during the roof restauration period, show the whole structure, (fig. 7). From these documents we can see that the umbrella vault is double sailed and that the ribs are done by the radial brick layering (Laschi, Rosselli and Rossi 1962).
The hypothesis made by the author considers the form of the inner sail that is obtained by a three-dimensional transformation of a toric surface with respect to the fixed point (dome’s oculus) and constant length (torus radius); like the conchoid of Nicomedes in 2d. According to this hypothesis, the vault is made by the inner sail (the conchoid surface) and the outer sail that is currently not visible (the hypothesized toric surface). Thus obtained nurbs7 surface was overlapped by the mesh8 surface generated from the surveying data (the cloud of
7 Non Uniform Rational Basis, or Bézier Spline. It is a mathematical model commonly used for generating and representing curves and surfaces that cannot be decimated in a uniform manner. It can also be a surface created by two or more b-splines.
8 A polygonal model that is used in 3D computer graphics. A mesh is a visualization of point cloud data that basically connects the dots to form triangles.
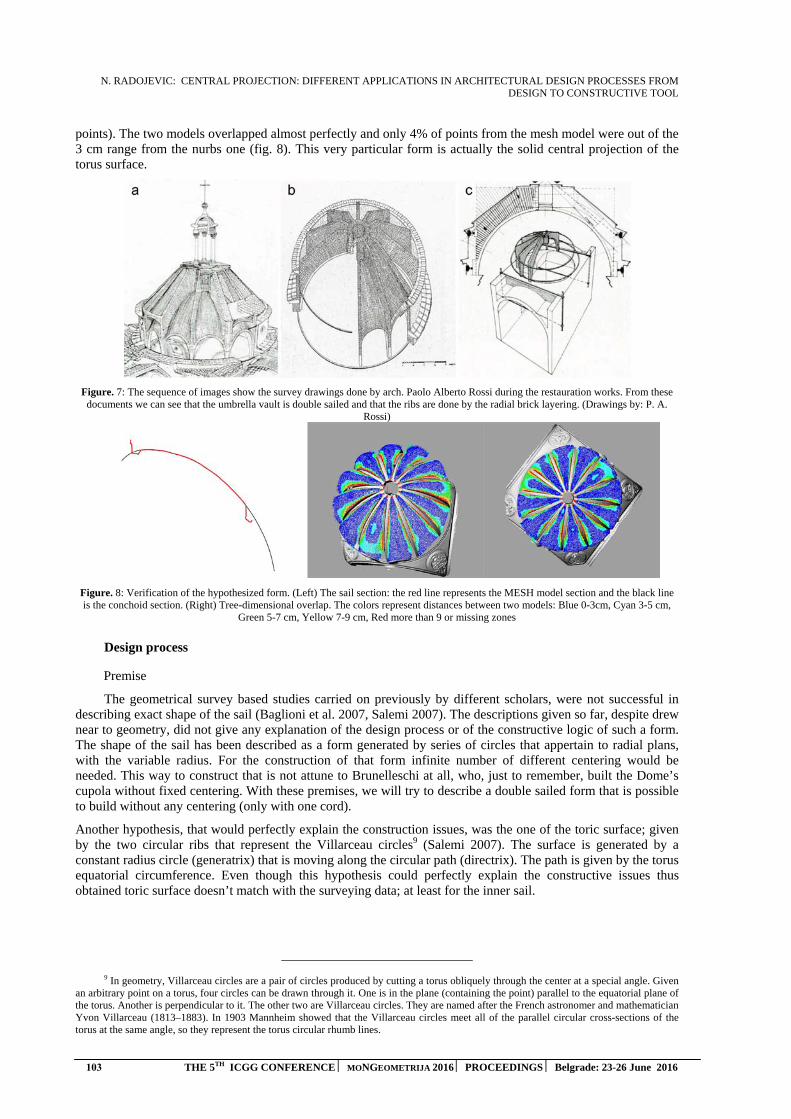
N. RADOJEVIC: CENTRAL PROJECTION: DIFFERENT APPLICATIONS IN ARCHITECTURAL DESIGN PROCESSES FROM DESIGN TO CONSTRUCTIVE TOOL
103 THE 5TH ICGG CONFERENCE ⏐ MONGEOMETRIJA 2016 ⏐ PROCEEDINGS ⏐ Belgrade: 23-26 June 2016
points). The two models overlapped almost perfectly and only 4% of points from the mesh model were out of the 3 cm range from the nurbs one (fig. 8). This very particular form is actually the solid central projection of the torus surface.
Figure. 7: The sequence of images show the survey drawings done by arch. Paolo Alberto Rossi during the restauration works. From these documents we can see that the umbrella vault is double sailed and that the ribs are done by the radial brick layering. (Drawings by: P. A.
Rossi)
Figure. 8: Verification of the hypothesized form. (Left) The sail section: the red line represents the MESH model section and the black line is the conchoid section. (Right) Tree-dimensional overlap. The colors represent distances between two models: Blue 0-3cm, Cyan 3-5 cm,
Green 5-7 cm, Yellow 7-9 cm, Red more than 9 or missing zones
Design process
Premise
The geometrical survey based studies carried on previously by different scholars, were not successful in describing exact shape of the sail (Baglioni et al. 2007, Salemi 2007). The descriptions given so far, despite drew near to geometry, did not give any explanation of the design process or of the constructive logic of such a form. The shape of the sail has been described as a form generated by series of circles that appertain to radial plans, with the variable radius. For the construction of that form infinite number of different centering would be needed. This way to construct that is not attune to Brunelleschi at all, who, just to remember, built the Dome’s cupola without fixed centering. With these premises, we will try to describe a double sailed form that is possible to build without any centering (only with one cord).
Another hypothesis, that would perfectly explain the construction issues, was the one of the toric surface; given by the two circular ribs that represent the Villarceau circles9 (Salemi 2007). The surface is generated by a constant radius circle (generatrix) that is moving along the circular path (directrix). The path is given by the torus equatorial circumference. Even though this hypothesis could perfectly explain the constructive issues thus obtained toric surface doesn’t match with the surveying data; at least for the inner sail.
9 In geometry, Villarceau circles are a pair of circles produced by cutting a torus obliquely through the center at a special angle. Given an arbitrary point on a torus, four circles can be drawn through it. One is in the plane (containing the point) parallel to the equatorial plane of the torus. Another is perpendicular to it. The other two are Villarceau circles. They are named after the French astronomer and mathematician Yvon Villarceau (1813–1883). In 1903 Mannheim showed that the Villarceau circles meet all of the parallel circular cross-sections of the torus at the same angle, so they represent the torus circular rhumb lines.

N. RADOJEVIC: CENTRAL PROJECTION: DIFFERENT APPLICATIONS IN ARCHITECTURAL DESIGN PROCESSES FROM DESIGN TO CONSTRUCTIVE TOOL
THE 5TH ICGG CONFERENCE ⏐ MONGEOMETRIJA 2016 ⏐ PROCEEDINGS ⏐ Belgrade: 23-26 June 2016 104
With these premises we will try to describe a new hypothesis for the double sailed dome’s form; that should be both possible to build without many centering (in our case only one cord is needed) and to describe in a simple and logical manner.
Outer sail – Torus
If we try to think about a possible sail’s form that has two circular directrices (given by the ribs) and a circular generatrix with a constant radius, the only solution that arises is the torus surface, where the vault ribs are the circumferences of Villarceau10 (Villarceau 1848, Schmidt 1950), as hypothesized by Salemi. Although, finding a torus from a pair of these circumferences is not easy when two symmetrical circles are given (the two ribs) the determination of torus suddenly becomes very simple (fig. 9). As the Villarceau circles represent also the rhumb lines of the torus, which can be simply obtained by placing each second brick crosswise, and their centers are distributed on a circumference that pertains to the vertical meridian plane it is theoretically possible to build a torus without any centering but only with one cord. The unique position of each brick that pertains to a given rhumb line is given by two conditions: it pertains to sphere given by the fixed length cord, the slope of the rhumb line is an integer and it corresponds to the brick’s proportion (Radojevic 2015).
Figure. 9: Construction of torus given by two Villarceau’ circles. (Left, Below) The Pazzi Chapel’s case: Given two ribs with the center in point, O, and radius, R, that represent the Villarceau circles we need to find the torus. The radius of the directrix circle of the torus is equal to the one of the given circle, R, and the radius of the generatrix circle of the torus, r, is given by the edge of the polygon (AB/2). The center of
the torus, C, is on the vertical axis of the dome below cupolas center, C, for the distance r.
Inner sail – Conchoid of torus
The toric surface doesn’t represent the inner sail in this case, as hypothesized by Salemi, but the outer one. Once that we have obtained this surface we can easily define also the inner sail’s form. The inner sail is given by simple deformation of a given torus. The transformation of this three-dimensional surface follows the same principles used by Nicomedes to construct his famous conchoid in 2d (fig. 10). The conchoid of Nicomedes is a
10 For every point on the surface of a torus, we can trace exactly 4 distinct perfect circles, on the surface of the torus, that pass through that point: one is around the hole of the torus, and the other around its circumference. The other two are Villarceau circles, that appertain to the be-tangent planes.
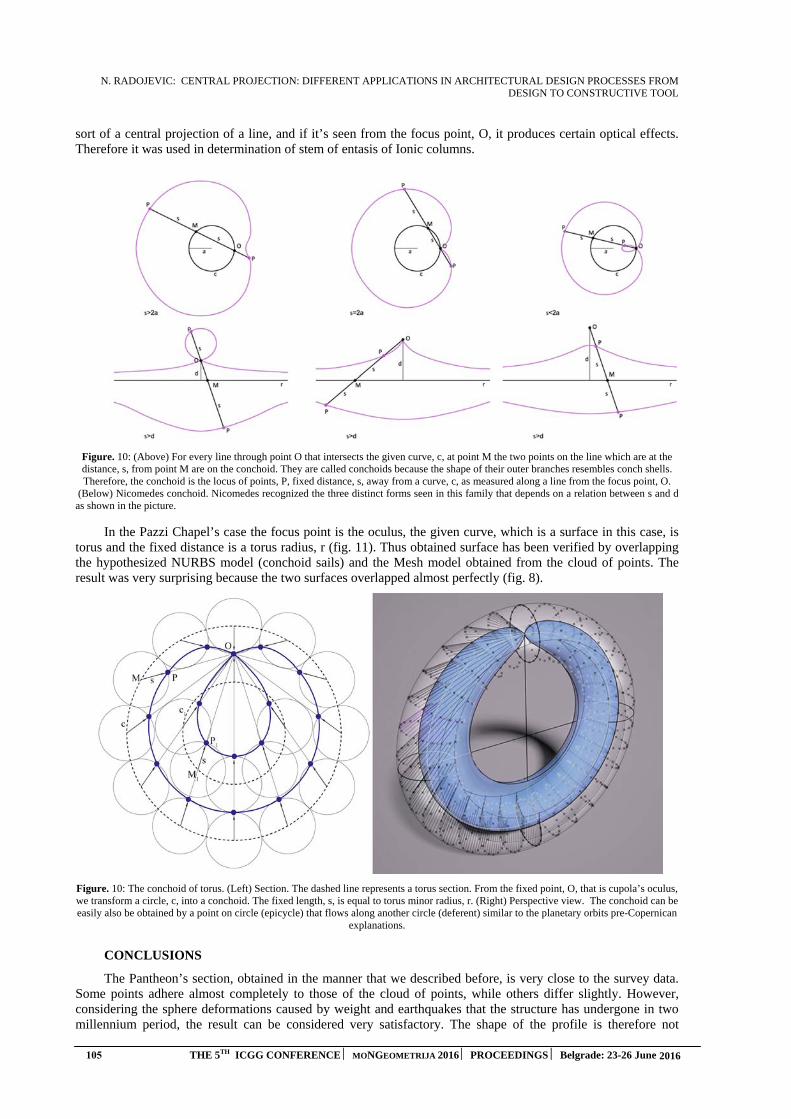
N. RADOJEVIC: CENTRAL PROJECTION: DIFFERENT APPLICATIONS IN ARCHITECTURAL DESIGN PROCESSES FROM DESIGN TO CONSTRUCTIVE TOOL
105 THE 5TH ICGG CONFERENCE ⏐ MONGEOMETRIJA 2016 ⏐ PROCEEDINGS ⏐ Belgrade: 23-26 June 2016
sort of a central projection of a line, and if it’s seen from the focus point, O, it produces certain optical effects. Therefore it was used in determination of stem of entasis of Ionic columns.
Figure. 10: (Above) For every line through point O that intersects the given curve, c, at point M the two points on the line which are at the distance, s, from point M are on the conchoid. They are called conchoids because the shape of their outer branches resembles conch shells. Therefore, the conchoid is the locus of points, P, fixed distance, s, away from a curve, c, as measured along a line from the focus point, O.
(Below) Nicomedes conchoid. Nicomedes recognized the three distinct forms seen in this family that depends on a relation between s and d as shown in the picture.
In the Pazzi Chapel’s case the focus point is the oculus, the given curve, which is a surface in this case, is torus and the fixed distance is a torus radius, r (fig. 11). Thus obtained surface has been verified by overlapping the hypothesized NURBS model (conchoid sails) and the Mesh model obtained from the cloud of points. The result was very surprising because the two surfaces overlapped almost perfectly (fig. 8).
Figure. 10: The conchoid of torus. (Left) Section. The dashed line represents a torus section. From the fixed point, O, that is cupola’s oculus, we transform a circle, c, into a conchoid. The fixed length, s, is equal to torus minor radius, r. (Right) Perspective view. The conchoid can be easily also be obtained by a point on circle (epicycle) that flows along another circle (deferent) similar to the planetary orbits pre-Copernican
explanations.
CONCLUSIONS
The Pantheon’s section, obtained in the manner that we described before, is very close to the survey data. Some points adhere almost completely to those of the cloud of points, while others differ slightly. However, considering the sphere deformations caused by weight and earthquakes that the structure has undergone in two millennium period, the result can be considered very satisfactory. The shape of the profile is therefore not
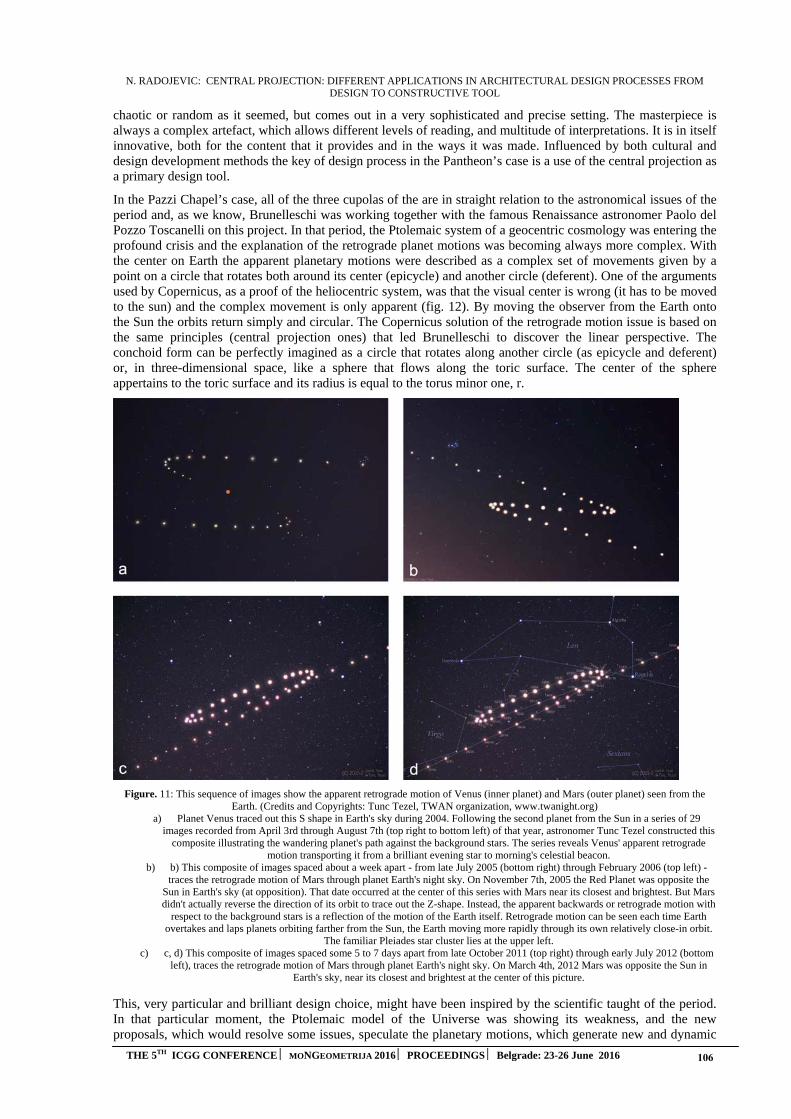
N. RADOJEVIC: CENTRAL PROJECTION: DIFFERENT APPLICATIONS IN ARCHITECTURAL DESIGN PROCESSES FROM DESIGN TO CONSTRUCTIVE TOOL
THE 5TH ICGG CONFERENCE ⏐ MONGEOMETRIJA 2016 ⏐ PROCEEDINGS ⏐ Belgrade: 23-26 June 2016 106
chaotic or random as it seemed, but comes out in a very sophisticated and precise setting. The masterpiece is always a complex artefact, which allows different levels of reading, and multitude of interpretations. It is in itself innovative, both for the content that it provides and in the ways it was made. Influenced by both cultural and design development methods the key of design process in the Pantheon’s case is a use of the central projection as a primary design tool.
In the Pazzi Chapel’s case, all of the three cupolas of the are in straight relation to the astronomical issues of the period and, as we know, Brunelleschi was working together with the famous Renaissance astronomer Paolo del Pozzo Toscanelli on this project. In that period, the Ptolemaic system of a geocentric cosmology was entering the profound crisis and the explanation of the retrograde planet motions was becoming always more complex. With the center on Earth the apparent planetary motions were described as a complex set of movements given by a point on a circle that rotates both around its center (epicycle) and another circle (deferent). One of the arguments used by Copernicus, as a proof of the heliocentric system, was that the visual center is wrong (it has to be moved to the sun) and the complex movement is only apparent (fig. 12). By moving the observer from the Earth onto the Sun the orbits return simply and circular. The Copernicus solution of the retrograde motion issue is based on the same principles (central projection ones) that led Brunelleschi to discover the linear perspective. The conchoid form can be perfectly imagined as a circle that rotates along another circle (as epicycle and deferent) or, in three-dimensional space, like a sphere that flows along the toric surface. The center of the sphere appertains to the toric surface and its radius is equal to the torus minor one, r.
Figure. 11: This sequence of images show the apparent retrograde motion of Venus (inner planet) and Mars (outer planet) seen from the Earth. (Credits and Copyrights: Tunc Tezel, TWAN organization, www.twanight.org)
a) Planet Venus traced out this S shape in Earth's sky during 2004. Following the second planet from the Sun in a series of 29 images recorded from April 3rd through August 7th (top right to bottom left) of that year, astronomer Tunc Tezel constructed this
composite illustrating the wandering planet's path against the background stars. The series reveals Venus' apparent retrograde motion transporting it from a brilliant evening star to morning's celestial beacon.
b) b) This composite of images spaced about a week apart - from late July 2005 (bottom right) through February 2006 (top left) - traces the retrograde motion of Mars through planet Earth's night sky. On November 7th, 2005 the Red Planet was opposite the
Sun in Earth's sky (at opposition). That date occurred at the center of this series with Mars near its closest and brightest. But Mars didn't actually reverse the direction of its orbit to trace out the Z-shape. Instead, the apparent backwards or retrograde motion with
respect to the background stars is a reflection of the motion of the Earth itself. Retrograde motion can be seen each time Earth overtakes and laps planets orbiting farther from the Sun, the Earth moving more rapidly through its own relatively close-in orbit.
The familiar Pleiades star cluster lies at the upper left. c) c, d) This composite of images spaced some 5 to 7 days apart from late October 2011 (top right) through early July 2012 (bottom
left), traces the retrograde motion of Mars through planet Earth's night sky. On March 4th, 2012 Mars was opposite the Sun in Earth's sky, near its closest and brightest at the center of this picture.
This, very particular and brilliant design choice, might have been inspired by the scientific taught of the period. In that particular moment, the Ptolemaic model of the Universe was showing its weakness, and the new proposals, which would resolve some issues, speculate the planetary motions, which generate new and dynamic
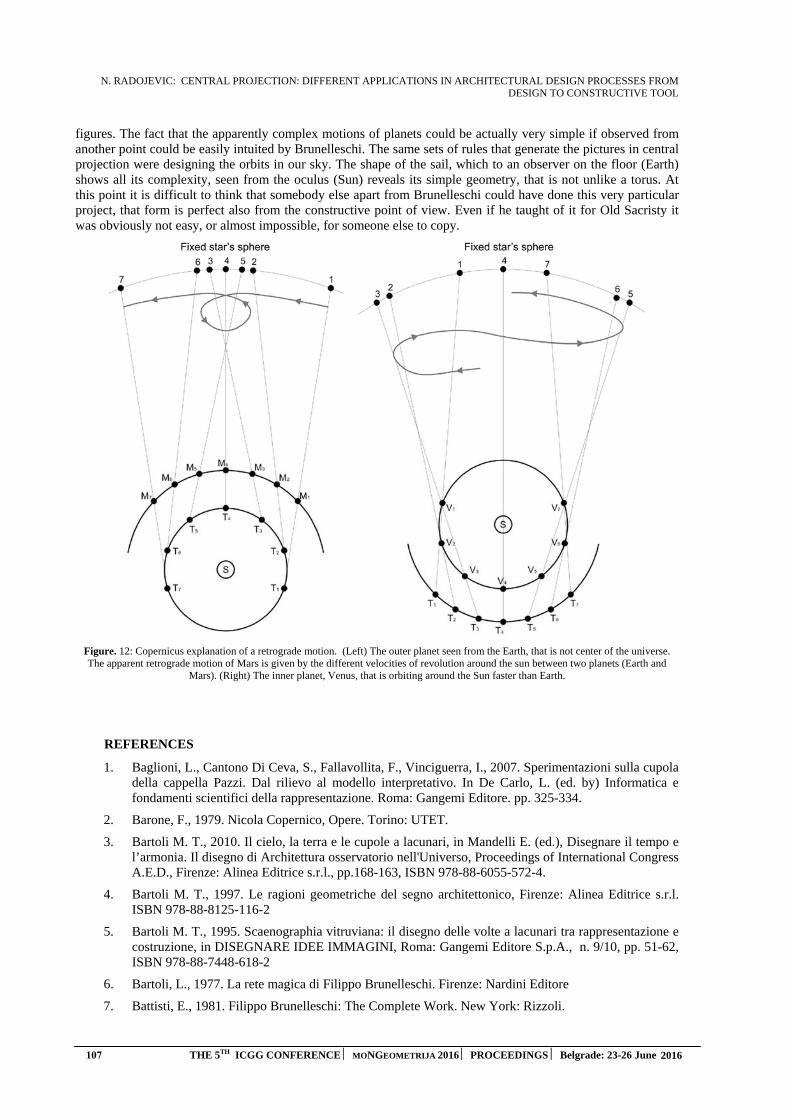
N. RADOJEVIC: CENTRAL PROJECTION: DIFFERENT APPLICATIONS IN ARCHITECTURAL DESIGN PROCESSES FROM DESIGN TO CONSTRUCTIVE TOOL
107 THE 5TH ICGG CONFERENCE ⏐ MONGEOMETRIJA 2016 ⏐ PROCEEDINGS ⏐ Belgrade: 23-26 June 2016
figures. The fact that the apparently complex motions of planets could be actually very simple if observed from another point could be easily intuited by Brunelleschi. The same sets of rules that generate the pictures in central projection were designing the orbits in our sky. The shape of the sail, which to an observer on the floor (Earth) shows all its complexity, seen from the oculus (Sun) reveals its simple geometry, that is not unlike a torus. At this point it is difficult to think that somebody else apart from Brunelleschi could have done this very particular project, that form is perfect also from the constructive point of view. Even if he taught of it for Old Sacristy it was obviously not easy, or almost impossible, for someone else to copy.
Figure. 12: Copernicus explanation of a retrograde motion. (Left) The outer planet seen from the Earth, that is not center of the universe. The apparent retrograde motion of Mars is given by the different velocities of revolution around the sun between two planets (Earth and
Mars). (Right) The inner planet, Venus, that is orbiting around the Sun faster than Earth.
REFERENCES
1. Baglioni, L., Cantono Di Ceva, S., Fallavollita, F., Vinciguerra, I., 2007. Sperimentazioni sulla cupoladella cappella Pazzi. Dal rilievo al modello interpretativo. In De Carlo, L. (ed. by) Informatica efondamenti scientifici della rappresentazione. Roma: Gangemi Editore. pp. 325-334.
2. Barone, F., 1979. Nicola Copernico, Opere. Torino: UTET.
3. Bartoli M. T., 2010. Il cielo, la terra e le cupole a lacunari, in Mandelli E. (ed.), Disegnare il tempo el’armonia. Il disegno di Architettura osservatorio nell'Universo, Proceedings of International CongressA.E.D., Firenze: Alinea Editrice s.r.l., pp.168-163, ISBN 978-88-6055-572-4.
4. Bartoli M. T., 1997. Le ragioni geometriche del segno architettonico, Firenze: Alinea Editrice s.r.l.ISBN 978-88-8125-116-2
5. Bartoli M. T., 1995. Scaenographia vitruviana: il disegno delle volte a lacunari tra rappresentazione ecostruzione, in DISEGNARE IDEE IMMAGINI, Roma: Gangemi Editore S.p.A., n. 9/10, pp. 51-62,ISBN 978-88-7448-618-2
6. Bartoli, L., 1977. La rete magica di Filippo Brunelleschi. Firenze: Nardini Editore
7. Battisti, E., 1981. Filippo Brunelleschi: The Complete Work. New York: Rizzoli.
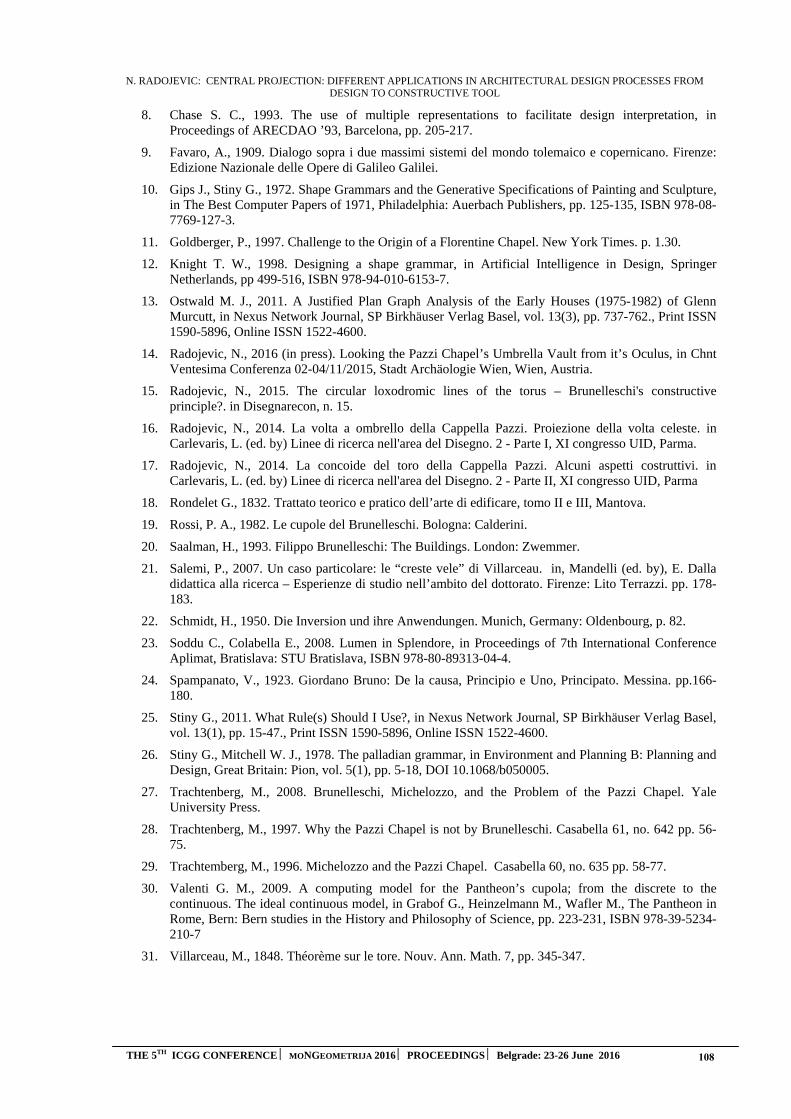
N. RADOJEVIC: CENTRAL PROJECTION: DIFFERENT APPLICATIONS IN ARCHITECTURAL DESIGN PROCESSES FROM DESIGN TO CONSTRUCTIVE TOOL
THE 5TH ICGG CONFERENCE ⏐ MONGEOMETRIJA 2016 ⏐ PROCEEDINGS ⏐ Belgrade: 23-26 June 2016 108
8. Chase S. C., 1993. The use of multiple representations to facilitate design interpretation, inProceedings of ARECDAO ’93, Barcelona, pp. 205-217.
9. Favaro, A., 1909. Dialogo sopra i due massimi sistemi del mondo tolemaico e copernicano. Firenze:Edizione Nazionale delle Opere di Galileo Galilei.
10. Gips J., Stiny G., 1972. Shape Grammars and the Generative Specifications of Painting and Sculpture,in The Best Computer Papers of 1971, Philadelphia: Auerbach Publishers, pp. 125-135, ISBN 978-08-7769-127-3.
11. Goldberger, P., 1997. Challenge to the Origin of a Florentine Chapel. New York Times. p. 1.30.
12. Knight T. W., 1998. Designing a shape grammar, in Artificial Intelligence in Design, SpringerNetherlands, pp 499-516, ISBN 978-94-010-6153-7.
13. Ostwald M. J., 2011. A Justified Plan Graph Analysis of the Early Houses (1975-1982) of GlennMurcutt, in Nexus Network Journal, SP Birkhäuser Verlag Basel, vol. 13(3), pp. 737-762., Print ISSN1590-5896, Online ISSN 1522-4600.
14. Radojevic, N., 2016 (in press). Looking the Pazzi Chapel’s Umbrella Vault from it’s Oculus, in ChntVentesima Conferenza 02-04/11/2015, Stadt Archäologie Wien, Wien, Austria.
15. Radojevic, N., 2015. The circular loxodromic lines of the torus – Brunelleschi's constructiveprinciple?. in Disegnarecon, n. 15.
16. Radojevic, N., 2014. La volta a ombrello della Cappella Pazzi. Proiezione della volta celeste. inCarlevaris, L. (ed. by) Linee di ricerca nell'area del Disegno. 2 - Parte I, XI congresso UID, Parma.
17. Radojevic, N., 2014. La concoide del toro della Cappella Pazzi. Alcuni aspetti costruttivi. inCarlevaris, L. (ed. by) Linee di ricerca nell'area del Disegno. 2 - Parte II, XI congresso UID, Parma
18. Rondelet G., 1832. Trattato teorico e pratico dell’arte di edificare, tomo II e III, Mantova.
19. Rossi, P. A., 1982. Le cupole del Brunelleschi. Bologna: Calderini.
20. Saalman, H., 1993. Filippo Brunelleschi: The Buildings. London: Zwemmer.
21. Salemi, P., 2007. Un caso particolare: le “creste vele” di Villarceau. in, Mandelli (ed. by), E. Dalladidattica alla ricerca – Esperienze di studio nell’ambito del dottorato. Firenze: Lito Terrazzi. pp. 178-183.
22. Schmidt, H., 1950. Die Inversion und ihre Anwendungen. Munich, Germany: Oldenbourg, p. 82.
23. Soddu C., Colabella E., 2008. Lumen in Splendore, in Proceedings of 7th International ConferenceAplimat, Bratislava: STU Bratislava, ISBN 978-80-89313-04-4.
24. Spampanato, V., 1923. Giordano Bruno: De la causa, Principio e Uno, Principato. Messina. pp.166-180.
25. Stiny G., 2011. What Rule(s) Should I Use?, in Nexus Network Journal, SP Birkhäuser Verlag Basel,vol. 13(1), pp. 15-47., Print ISSN 1590-5896, Online ISSN 1522-4600.
26. Stiny G., Mitchell W. J., 1978. The palladian grammar, in Environment and Planning B: Planning andDesign, Great Britain: Pion, vol. 5(1), pp. 5-18, DOI 10.1068/b050005.
27. Trachtenberg, M., 2008. Brunelleschi, Michelozzo, and the Problem of the Pazzi Chapel. YaleUniversity Press.
28. Trachtenberg, M., 1997. Why the Pazzi Chapel is not by Brunelleschi. Casabella 61, no. 642 pp. 56-75.
29. Trachtemberg, M., 1996. Michelozzo and the Pazzi Chapel. Casabella 60, no. 635 pp. 58-77.
30. Valenti G. M., 2009. A computing model for the Pantheon’s cupola; from the discrete to thecontinuous. The ideal continuous model, in Grabof G., Heinzelmann M., Wafler M., The Pantheon inRome, Bern: Bern studies in the History and Philosophy of Science, pp. 223-231, ISBN 978-39-5234-210-7
31. Villarceau, M., 1848. Théorème sur le tore. Nouv. Ann. Math. 7, pp. 345-347.
S. KRASIC ET AL.: A COMPARATIVE ANALYSIS OF CONTEMPORARY AND CLASSICAL TEACHING METHODS OF DESCRIPTIVE GEOMETRY AT THE FACULTY OF CIVIL ENGINEERING AND ARCHITECTURE IN NIS
THE 5TH ICGG CONFERENCE MONGEOMETRIJA 2016 PROCEEDINGS Belgrade: 23-26 June 2016 109
A COMPARATIVE ANALYSIS OF CONTEMPORARY AND CLASSICAL TEACHING METHODS OF DESCRIPTIVE GEOMETRY AT THE FACULTY OF CIVIL ENGINEERING AND ARCHITECTURE
IN NIS Sonja Krasić
Faculty of Civil Engineering and Architecture - University of Niš PhD., Associate Professor, [email protected]
Petar Pejić
Faculty of Civil Engineering and Architecture - University of Niš PhD student, [email protected]
Milica Veljković
Faculty of Civil Engineering and Architecture - University of Niš PhD student, [email protected]
ABSTRACT
One of the tendencies of the Bologna process is the introduction of contemporary teaching methods, to improve the final result, respectively to increase the percentage of exams. Thus, in order to make the work easier for the students and to allow better grasp of the curriculum Descriptive geometry at the study program of civil engineering at the faculty of Civil engineering and Architecture in Niš, teaching was improved: 1. lecture templates (2009), 2. graphical tasks in a "step by step" done on the computer (2012), 3. free android application for „step-by-step“ graphic tasks (2013), a school year 2014/15., half of the total number of enrolled students attended the exercises in a classical way, and the other half using the contemporary method of the „step-by-step“ graphic tasks which were projected on the screen.
In the last 10 years, the best final results (exams) of the course in percent were accomplished by the students of the generation 2014/2015, who had all the contemporary resources introduced in the teaching process. This paper presents a comparative analysis of the final results of the course program, beyond the individual results of the tests and the written part of the exam, a student group that worked on classic and a group of students who worked in a contemporary way in the 2014/15 school year. The goal of the analysis is to determine whether the contemporary way of teaching gives a better final result in the exercises case. The points the students won at the test, organized on the half semester and at written exam at the end of the semester in four examination period, in percentages are quite similar in both groups. The analysis included three consecutive examination periods and other periods as a single category in the school year when the case is listened to. Since the final results were quite equal in both groups, and the contemporary way of teaching has its advantages over the classical way, recommendation is that in the future courses of Descriptive geometry I performs with contemporary methods.
Keywords: Descriptive Geometry; modern method; the classical method; the final result
1. INTRODUCTION
Descriptive Geometry provides training for students’ intellectual capacity for spatial perception and it is therefore important for all engineers, physicists and natural scientists. “Descriptive Geometry is a method to study 3D geometry through 2D images thus offering insight into structure and metrical properties of spatial objects, processes and principles. The education in Descriptive Geometry provides a training of the students' intellectual capability of space perception. Drawings are the guide to geometry but not the main aim.” [8].

S. KRASIC ET AL.: A COMPARATIVE ANALYSIS OF CONTEMPORARY AND CLASSICAL TEACHING METHODS OF DESCRIPTIVE GEOMETRY AT THE FACULTY OF CIVIL ENGINEERING AND ARCHITECTURE IN NIS
110 THE 5TH ICGG CONFERENCE MONGEOMETRIJA 2016 PROCEEDINGS Belgrade: 23-26 June 2016
„Descriptive Geometry is unique in the way how it promotes spatial reasoning, which is so fundamental for each creative activity of engineers, and how it trains the ability to express spatial ideas graphically so that they become understandable for anybody else." [5]. The new information technologies (IT) offer novel opportunities to enhance the classic teaching approach used so far during mastering quite complicated and extensive courses, like engineering graphics. [9].
Since the foundation of the Faculty of Civil Engineering and Architecture in 1960 to the introduction of the Bologna Process in 2005 the Course program Descriptive geometry I at the study program of civil engineering remained the same. Subject was attended one semester, teaching was performed by classical methods (manual) at the lectures and exercises and the only thing that changed was the number of classes. In school year of 2005/06, the subject was reduced to a 2+2 classes a week in the 1st semester. The curriculum of the course Descriptive geometry I at the Faculty of Civil Engineering and Architecture of Niš, was made so that the students begin at the fundamental concepts, and then progress gradually to more complex tasks. The course is adapted for all the students coming from the high schools where they had already learned the subject (technical schools) and for those coming from the schools without this subject (grammar schools).
One of the tendencies of the Bologna process is introduction of contemporary methods in the teaching process in order to facilitate learning process of the students and thus improve the final result, that is, the percentage of examination passage. In this context since the 2009/10 school year, the lecture templates were introduced. Then in 2012 gradual graphical tasks in a „step-by-step“ manner on the computer were introduced, which contained the classical didactic approach principle. The electronic tools and instruments that the youth is familiarized with is an efficient instrument to create a way better accepted for training the 3D (three-dimensional) imagination. Applying these tools is a useful addition but from the didactic point of view it cannot replace the classic Descriptive Geometry [3]. The graphic tasks performed in a contemporary manner were placed on the web site of the Faculty and they were in this way available to all the students. The next year, in 2013 a free android application for the „step-by-step” graphical tasks was made. The next step in modernization of the teaching process followed in 2014/15 school year when half of the total number of enrolled students attended the exercises in a classical way, and the other half using the contemporary method of the „step-by-step“ graphic tasks which were projected on the screen. [6]
Contemporary methods were introduced gradually, and each following year saw an increase of examination passing rates in the first four examination periods, (table 1). The generation of students of 2014/15 when all the contemporary teaching resources were available to them, achieved the best final result, since 70% of the total number of enrolled students passed the examination in the first four examination periods. If the examination results from 2009/10 year, when the templates for lectures were introduced until 2014/15 are compared a considerable higher percentage of students passed the examination in the 1st examination period in this time (27,9% - 44,5%). In the earlier period from 2005/06 to 2008/09 there was a considerably lower percentage of students who passed the exams in the 1st examination period, (0,9% - 25,8%). The best results of the exams in the 1st examination period in the last 10 years were recorded in 2014/15, 44,5%. [6]
Table 1: Examination results in the last 10 years (Source: Krasic et al. (2015); Table reproduced with the Author’s permission)
Number of enrolled students
107 134 116 124 124 140 141 115 95 90
Enrolment year
2005/06 2006/07 2007/08 2008/09 2009/10 2010/11 2011/12 2012/13 2013/14 2014/15
I period 0,9% 7,5% 18,1% 25,8% 37% 27,9% 31,2% 22,6% 25,3% 44,5%
II period 9,3% 17,9% 12,1% 25% 10,5% 5% 18,6% 36,5% 12,6% 17,8%
III period 5,6% 20,1% 24,1% 8,9% 11,3% 22,1% 12% 6,1% 7,4% 4,4%
IV period 10,3% 3,7% 2,6% 2,4% 6,5% 9,3% 7% 3,5% 3,2% 3,3%
Other 3 periods
25,2% 41,7% 38,8% 36,3% 28,3% 36,4% 37,6% 46,1% 23,2% 25,5%
Total in 4 periods
26,1% 49,2% 56,9% 62,1% 65,3% 64,3% 68,8% 68,7% 48,5% 70%
Other periods 40,3% 23,2% 13,8% 14,5% 9,7% 17,1% 19,9% 11,3% 13,6% /
Not passed 33,6% 27,6% 29,3% 23,4% 25%% 18,6% 11,3% 20% 37,9% /
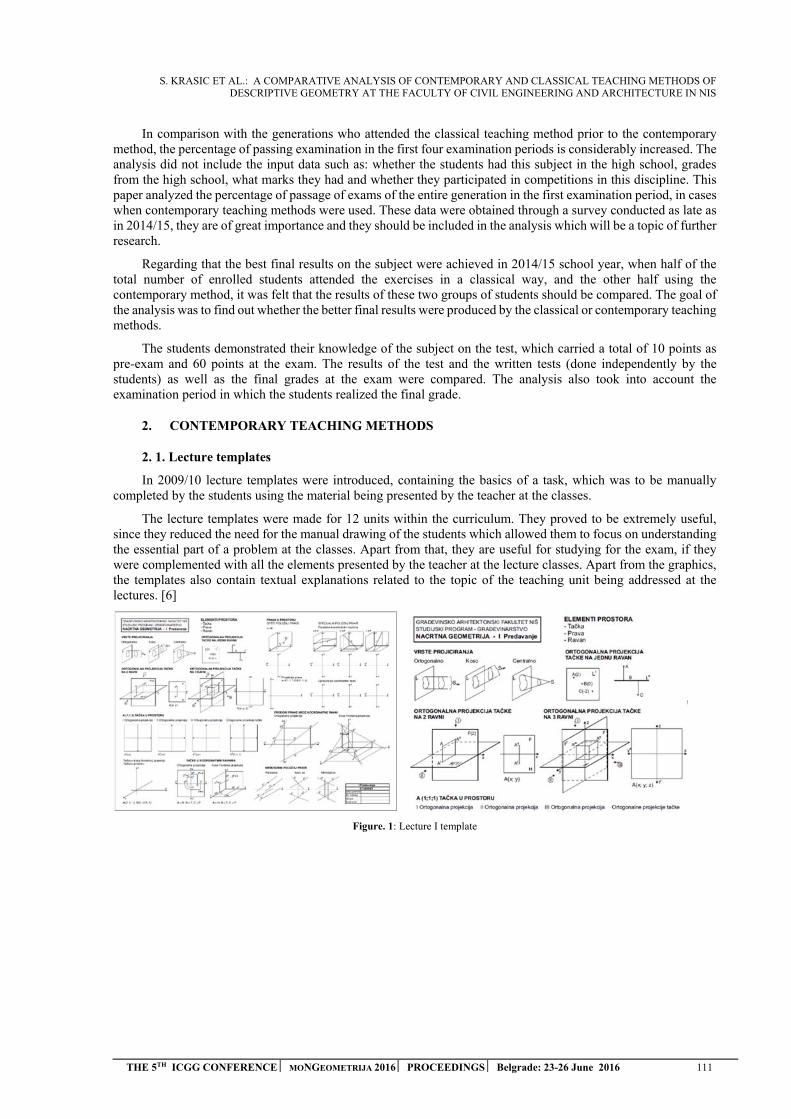
S. KRASIC ET AL.: A COMPARATIVE ANALYSIS OF CONTEMPORARY AND CLASSICAL TEACHING METHODS OF DESCRIPTIVE GEOMETRY AT THE FACULTY OF CIVIL ENGINEERING AND ARCHITECTURE IN NIS
THE 5TH ICGG CONFERENCE MONGEOMETRIJA 2016 PROCEEDINGS Belgrade: 23-26 June 2016 111
In comparison with the generations who attended the classical teaching method prior to the contemporary method, the percentage of passing examination in the first four examination periods is considerably increased. The analysis did not include the input data such as: whether the students had this subject in the high school, grades from the high school, what marks they had and whether they participated in competitions in this discipline. This paper analyzed the percentage of passage of exams of the entire generation in the first examination period, in cases when contemporary teaching methods were used. These data were obtained through a survey conducted as late as in 2014/15, they are of great importance and they should be included in the analysis which will be a topic of further research.
Regarding that the best final results on the subject were achieved in 2014/15 school year, when half of the total number of enrolled students attended the exercises in a classical way, and the other half using the contemporary method, it was felt that the results of these two groups of students should be compared. The goal of the analysis was to find out whether the better final results were produced by the classical or contemporary teaching methods.
The students demonstrated their knowledge of the subject on the test, which carried a total of 10 points as pre-exam and 60 points at the exam. The results of the test and the written tests (done independently by the students) as well as the final grades at the exam were compared. The analysis also took into account the examination period in which the students realized the final grade.
2. CONTEMPORARY TEACHING METHODS
2. 1. Lecture templates
In 2009/10 lecture templates were introduced, containing the basics of a task, which was to be manually completed by the students using the material being presented by the teacher at the classes.
The lecture templates were made for 12 units within the curriculum. They proved to be extremely useful, since they reduced the need for the manual drawing of the students which allowed them to focus on understanding the essential part of a problem at the classes. Apart from that, they are useful for studying for the exam, if they were complemented with all the elements presented by the teacher at the lecture classes. Apart from the graphics, the templates also contain textual explanations related to the topic of the teaching unit being addressed at the lectures. [6]
Figure. 1: Lecture I template
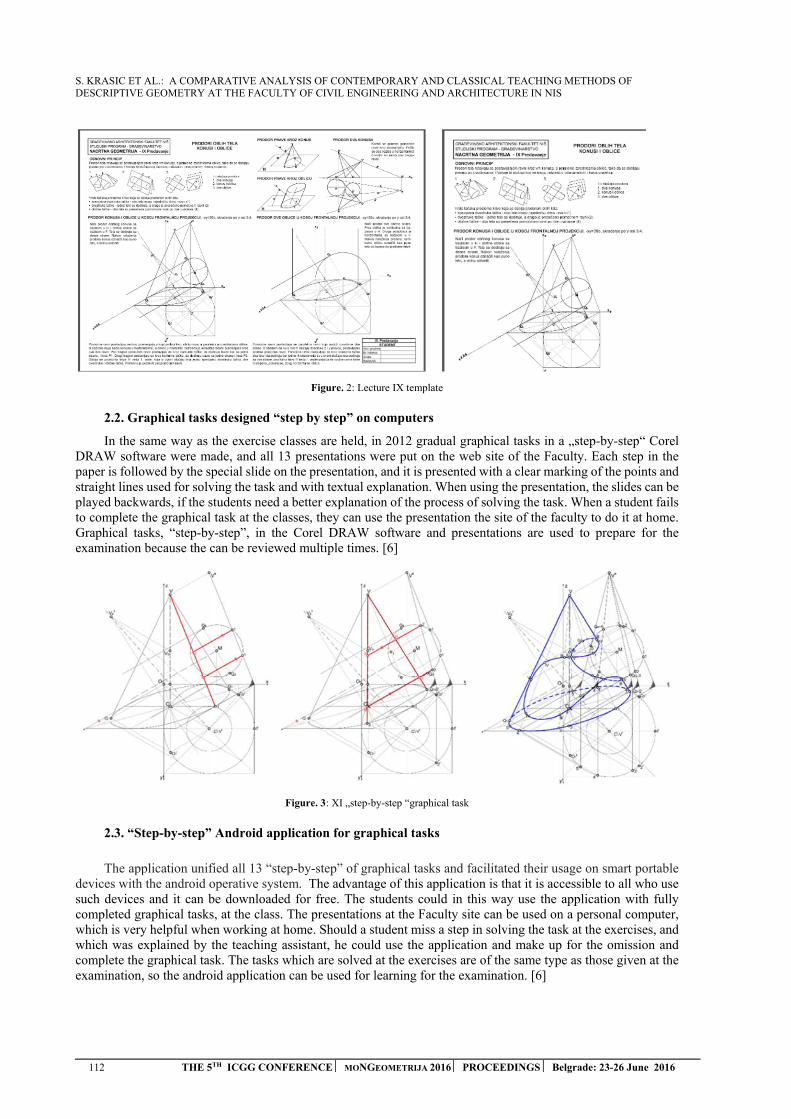
S. KRASIC ET AL.: A COMPARATIVE ANALYSIS OF CONTEMPORARY AND CLASSICAL TEACHING METHODS OF DESCRIPTIVE GEOMETRY AT THE FACULTY OF CIVIL ENGINEERING AND ARCHITECTURE IN NIS
112 THE 5TH ICGG CONFERENCE MONGEOMETRIJA 2016 PROCEEDINGS Belgrade: 23-26 June 2016
Figure. 2: Lecture IX template
2.2. Graphical tasks designed “step by step” on computers
In the same way as the exercise classes are held, in 2012 gradual graphical tasks in a „step-by-step“ Corel DRAW software were made, and all 13 presentations were put on the web site of the Faculty. Each step in the paper is followed by the special slide on the presentation, and it is presented with a clear marking of the points and straight lines used for solving the task and with textual explanation. When using the presentation, the slides can be played backwards, if the students need a better explanation of the process of solving the task. When a student fails to complete the graphical task at the classes, they can use the presentation the site of the faculty to do it at home. Graphical tasks, “step-by-step”, in the Corel DRAW software and presentations are used to prepare for the examination because the can be reviewed multiple times. [6]
Figure. 3: XI „step-by-step “graphical task
2.3. “Step-by-step” Android application for graphical tasks
The application unified all 13 “step-by-step” of graphical tasks and facilitated their usage on smart portable devices with the android operative system. The advantage of this application is that it is accessible to all who use such devices and it can be downloaded for free. The students could in this way use the application with fully completed graphical tasks, at the class. The presentations at the Faculty site can be used on a personal computer, which is very helpful when working at home. Should a student miss a step in solving the task at the exercises, and which was explained by the teaching assistant, he could use the application and make up for the omission and complete the graphical task. The tasks which are solved at the exercises are of the same type as those given at the examination, so the android application can be used for learning for the examination. [6]
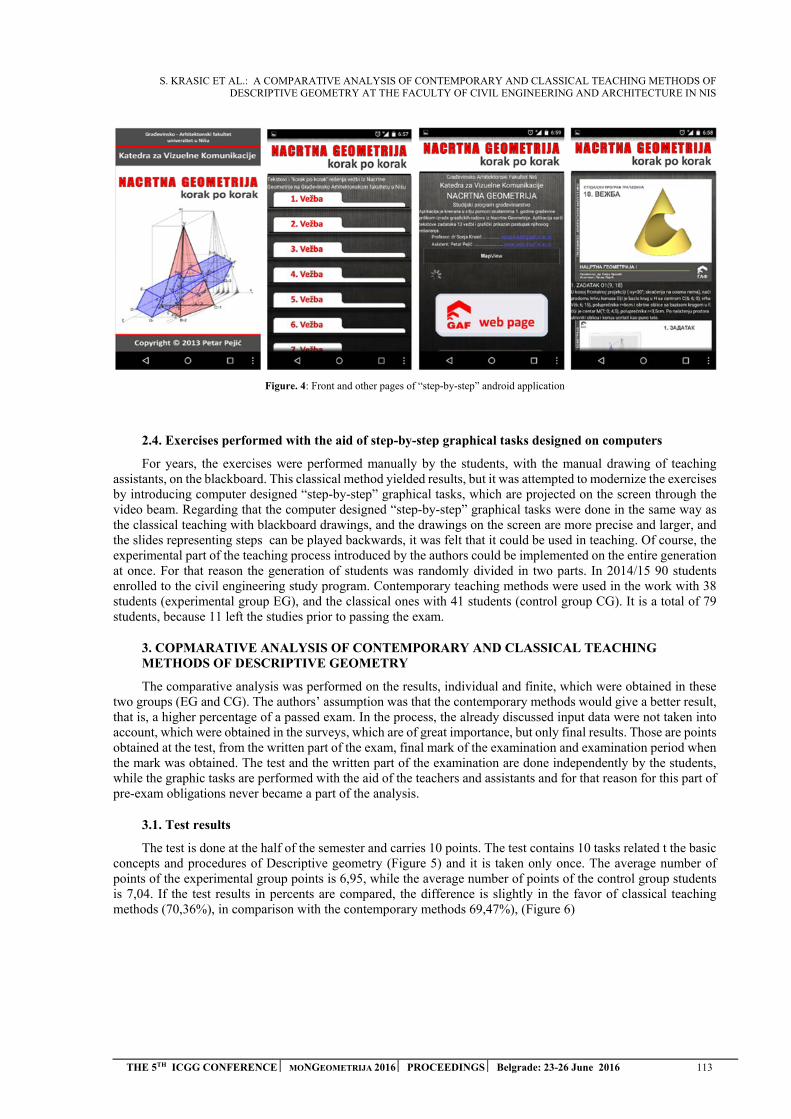
S. KRASIC ET AL.: A COMPARATIVE ANALYSIS OF CONTEMPORARY AND CLASSICAL TEACHING METHODS OF DESCRIPTIVE GEOMETRY AT THE FACULTY OF CIVIL ENGINEERING AND ARCHITECTURE IN NIS
THE 5TH ICGG CONFERENCE MONGEOMETRIJA 2016 PROCEEDINGS Belgrade: 23-26 June 2016 113
Figure. 4: Front and other pages of “step-by-step” android application
2.4. Exercises performed with the aid of step-by-step graphical tasks designed on computers
For years, the exercises were performed manually by the students, with the manual drawing of teaching assistants, on the blackboard. This classical method yielded results, but it was attempted to modernize the exercises by introducing computer designed “step-by-step” graphical tasks, which are projected on the screen through the video beam. Regarding that the computer designed “step-by-step” graphical tasks were done in the same way as the classical teaching with blackboard drawings, and the drawings on the screen are more precise and larger, and the slides representing steps can be played backwards, it was felt that it could be used in teaching. Of course, the experimental part of the teaching process introduced by the authors could be implemented on the entire generation at once. For that reason the generation of students was randomly divided in two parts. In 2014/15 90 students enrolled to the civil engineering study program. Contemporary teaching methods were used in the work with 38 students (experimental group EG), and the classical ones with 41 students (control group CG). It is a total of 79 students, because 11 left the studies prior to passing the exam.
3. COPMARATIVE ANALYSIS OF CONTEMPORARY AND CLASSICAL TEACHING METHODS OF DESCRIPTIVE GEOMETRY
The comparative analysis was performed on the results, individual and finite, which were obtained in these two groups (EG and CG). The authors’ assumption was that the contemporary methods would give a better result, that is, a higher percentage of a passed exam. In the process, the already discussed input data were not taken into account, which were obtained in the surveys, which are of great importance, but only final results. Those are points obtained at the test, from the written part of the exam, final mark of the examination and examination period when the mark was obtained. The test and the written part of the examination are done independently by the students, while the graphic tasks are performed with the aid of the teachers and assistants and for that reason for this part of pre-exam obligations never became a part of the analysis.
3.1. Test results
The test is done at the half of the semester and carries 10 points. The test contains 10 tasks related t the basic concepts and procedures of Descriptive geometry (Figure 5) and it is taken only once. The average number of points of the experimental group points is 6,95, while the average number of points of the control group students is 7,04. If the test results in percents are compared, the difference is slightly in the favor of classical teaching methods (70,36%), in comparison with the contemporary methods 69,47%), (Figure 6)
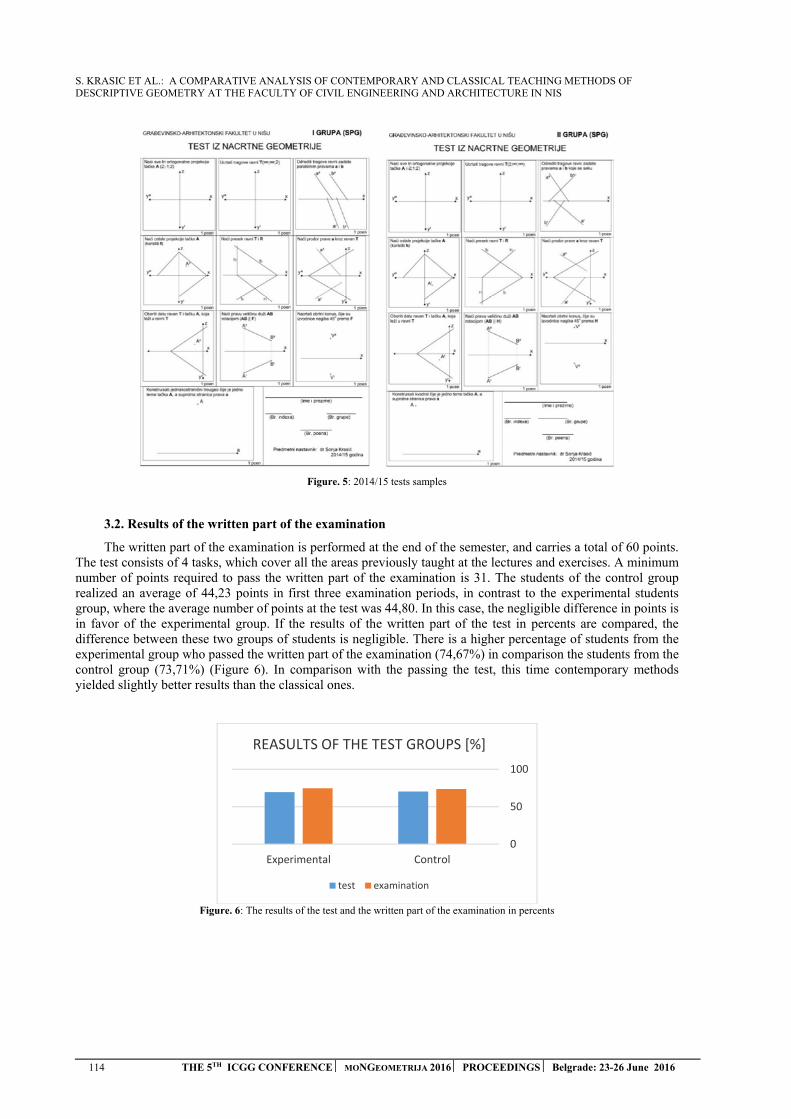
S. KRASIC ET AL.: A COMPARATIVE ANALYSIS OF CONTEMPORARY AND CLASSICAL TEACHING METHODS OF DESCRIPTIVE GEOMETRY AT THE FACULTY OF CIVIL ENGINEERING AND ARCHITECTURE IN NIS
114 THE 5TH ICGG CONFERENCE MONGEOMETRIJA 2016 PROCEEDINGS Belgrade: 23-26 June 2016
Figure. 5: 2014/15 tests samples
3.2. Results of the written part of the examination
The written part of the examination is performed at the end of the semester, and carries a total of 60 points. The test consists of 4 tasks, which cover all the areas previously taught at the lectures and exercises. A minimum number of points required to pass the written part of the examination is 31. The students of the control group realized an average of 44,23 points in first three examination periods, in contrast to the experimental students group, where the average number of points at the test was 44,80. In this case, the negligible difference in points is in favor of the experimental group. If the results of the written part of the test in percents are compared, the difference between these two groups of students is negligible. There is a higher percentage of students from the experimental group who passed the written part of the examination (74,67%) in comparison the students from the control group (73,71%) (Figure 6). In comparison with the passing the test, this time contemporary methods yielded slightly better results than the classical ones.
Figure. 6: The results of the test and the written part of the examination in percents
0
50
100
Experimental Control
REASULTS OF THE TEST GROUPS [%]
test examination
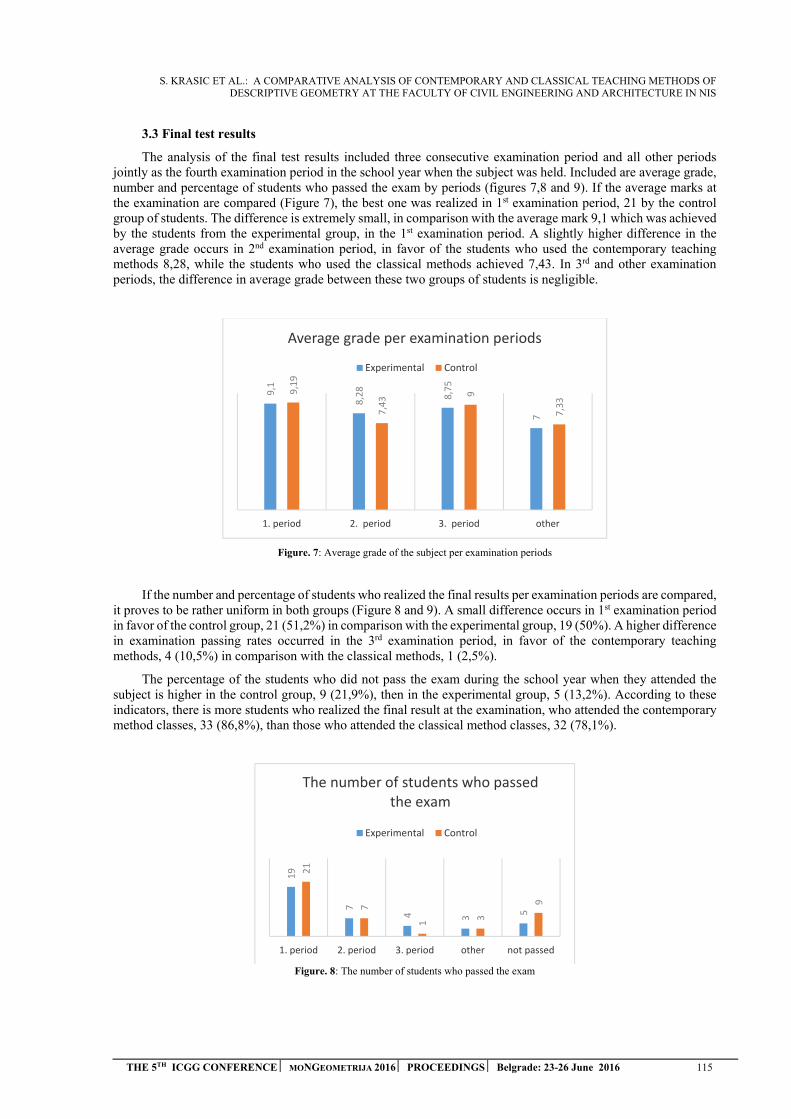
S. KRASIC ET AL.: A COMPARATIVE ANALYSIS OF CONTEMPORARY AND CLASSICAL TEACHING METHODS OF DESCRIPTIVE GEOMETRY AT THE FACULTY OF CIVIL ENGINEERING AND ARCHITECTURE IN NIS
THE 5TH ICGG CONFERENCE MONGEOMETRIJA 2016 PROCEEDINGS Belgrade: 23-26 June 2016 115
3.3 Final test results
The analysis of the final test results included three consecutive examination period and all other periods jointly as the fourth examination period in the school year when the subject was held. Included are average grade, number and percentage of students who passed the exam by periods (figures 7,8 and 9). If the average marks at the examination are compared (Figure 7), the best one was realized in 1st examination period, 21 by the control group of students. The difference is extremely small, in comparison with the average mark 9,1 which was achieved by the students from the experimental group, in the 1st examination period. A slightly higher difference in the average grade occurs in 2nd examination period, in favor of the students who used the contemporary teaching methods 8,28, while the students who used the classical methods achieved 7,43. In 3rd and other examination periods, the difference in average grade between these two groups of students is negligible.
Figure. 7: Average grade of the subject per examination periods
If the number and percentage of students who realized the final results per examination periods are compared, it proves to be rather uniform in both groups (Figure 8 and 9). A small difference occurs in 1st examination period in favor of the control group, 21 (51,2%) in comparison with the experimental group, 19 (50%). A higher difference in examination passing rates occurred in the 3rd examination period, in favor of the contemporary teaching methods, 4 (10,5%) in comparison with the classical methods, 1 (2,5%).
The percentage of the students who did not pass the exam during the school year when they attended the subject is higher in the control group, 9 (21,9%), then in the experimental group, 5 (13,2%). According to these indicators, there is more students who realized the final result at the examination, who attended the contemporary method classes, 33 (86,8%), than those who attended the classical method classes, 32 (78,1%).
Figure. 8: The number of students who passed the exam
9,1
8,28
8,75
7
9,19
7,43 9
7,33
1. period 2. period 3. period other
Average grade per examination periods
Experimental Control
19
7
4 3 5
21
7
1 3
9
1. period 2. period 3. period other not passed
The number of students who passed the exam
Experimental Control
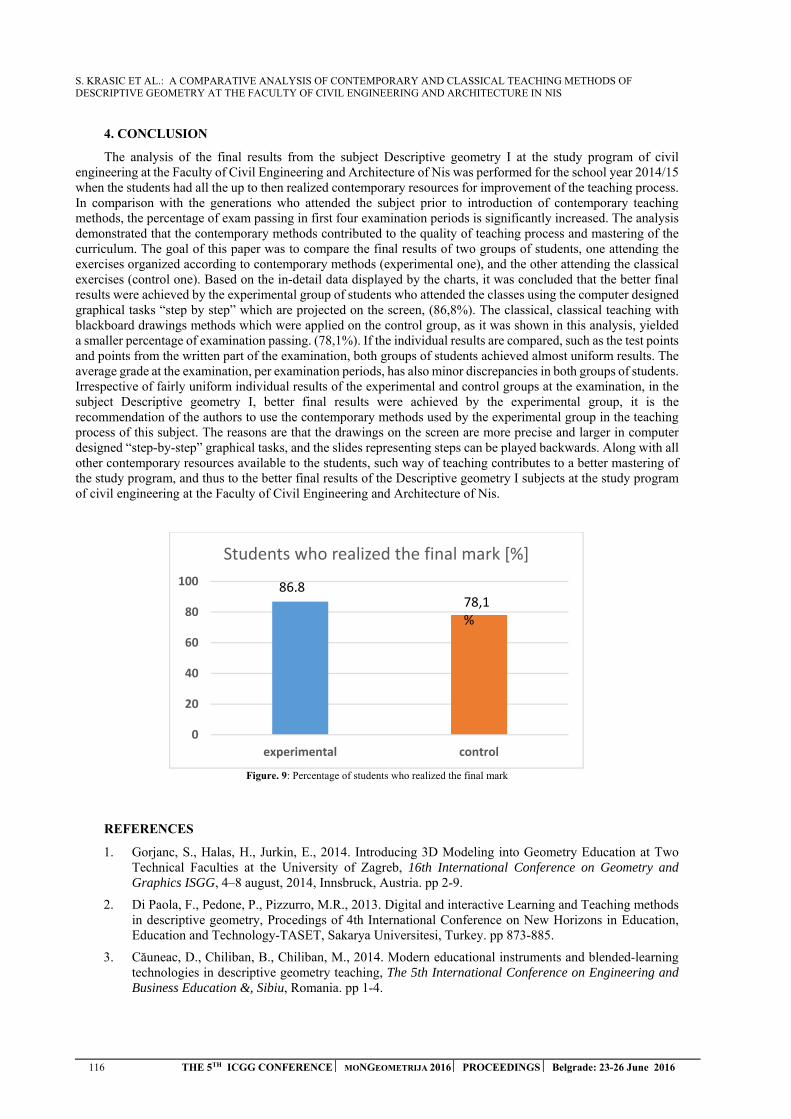
S. KRASIC ET AL.: A COMPARATIVE ANALYSIS OF CONTEMPORARY AND CLASSICAL TEACHING METHODS OF DESCRIPTIVE GEOMETRY AT THE FACULTY OF CIVIL ENGINEERING AND ARCHITECTURE IN NIS
116 THE 5TH ICGG CONFERENCE MONGEOMETRIJA 2016 PROCEEDINGS Belgrade: 23-26 June 2016
4. CONCLUSION
The analysis of the final results from the subject Descriptive geometry I at the study program of civil engineering at the Faculty of Civil Engineering and Architecture of Nis was performed for the school year 2014/15 when the students had all the up to then realized contemporary resources for improvement of the teaching process. In comparison with the generations who attended the subject prior to introduction of contemporary teaching methods, the percentage of exam passing in first four examination periods is significantly increased. The analysis demonstrated that the contemporary methods contributed to the quality of teaching process and mastering of the curriculum. The goal of this paper was to compare the final results of two groups of students, one attending the exercises organized according to contemporary methods (experimental one), and the other attending the classical exercises (control one). Based on the in-detail data displayed by the charts, it was concluded that the better final results were achieved by the experimental group of students who attended the classes using the computer designed graphical tasks “step by step” which are projected on the screen, (86,8%). The classical, classical teaching with blackboard drawings methods which were applied on the control group, as it was shown in this analysis, yielded a smaller percentage of examination passing. (78,1%). If the individual results are compared, such as the test points and points from the written part of the examination, both groups of students achieved almost uniform results. The average grade at the examination, per examination periods, has also minor discrepancies in both groups of students. Irrespective of fairly uniform individual results of the experimental and control groups at the examination, in the subject Descriptive geometry I, better final results were achieved by the experimental group, it is the recommendation of the authors to use the contemporary methods used by the experimental group in the teaching process of this subject. The reasons are that the drawings on the screen are more precise and larger in computer designed “step-by-step” graphical tasks, and the slides representing steps can be played backwards. Along with all other contemporary resources available to the students, such way of teaching contributes to a better mastering of the study program, and thus to the better final results of the Descriptive geometry I subjects at the study program of civil engineering at the Faculty of Civil Engineering and Architecture of Nis.
Figure. 9: Percentage of students who realized the final mark
REFERENCES
1. Gorjanc, S., Halas, H., Jurkin, E., 2014. Introducing 3D Modeling into Geometry Education at Two Technical Faculties at the University of Zagreb, 16th International Conference on Geometry and Graphics ISGG, 4–8 august, 2014, Innsbruck, Austria. pp 2-9.
2. Di Paola, F., Pedone, P., Pizzurro, M.R., 2013. Digital and interactive Learning and Teaching methods in descriptive geometry, Procedings of 4th International Conference on New Horizons in Education, Education and Technology-TASET, Sakarya Universitesi, Turkey. pp 873-885.
3. Căuneac, D., Chiliban, B., Chiliban, M., 2014. Modern educational instruments and blended-learning technologies in descriptive geometry teaching, The 5th International Conference on Engineering and Business Education &, Sibiu, Romania. pp 1-4.
0
20
40
60
80
100
experimental control
Students who realized the final mark [%]
86,8 78,1 %

S. KRASIC ET AL.: A COMPARATIVE ANALYSIS OF CONTEMPORARY AND CLASSICAL TEACHING METHODS OF DESCRIPTIVE GEOMETRY AT THE FACULTY OF CIVIL ENGINEERING AND ARCHITECTURE IN NIS
THE 5TH ICGG CONFERENCE MONGEOMETRIJA 2016 PROCEEDINGS Belgrade: 23-26 June 2016 117
4. Kang, Lee, C., Singh, Sidhu, M., Engineering Students Learning Preferences in UNITEN: Comparative Study and Patterns of Learning Styles, Journal of Educational Technology & Society is available under Creative Commons. pp 266-282.
5. Klix, W. D., 2001. Konstruktive Geometrie, darstellend und analytisch, Fachbuchverlag, Graphics and Descriptive Geometry, Tokyo, pp 533-535.
6. Krasic, S., Pejić, P., Krstić, H., 2015. Implementation of Contemporary Methods in Teaching Descriptive Geometry at the Faculty of Civil Engineering and Architecture of Niš, 18th Scientific-Professional Colloquium on Geometry and Graphics, Beli Manastir, Croatia. pp 21-22.
7. Pedrosa, C. M., Barbero, B. R., Miguel, A. M., 2014. Spatial Visualization Learning in Engineering: Traditional Methods vs. a Web-based Tool, Educational Technology & Society, 17 (2), pp 142–157.
8. Stachel, H., Descriptive Geometry in today’s engineering curriculum, www.geometrie.tuwien.ac.at/stachel/zagreb.pdf, pp 1-4
9. Veide, Z., Strozheva, V., Dobelis, M., 2014. Application of Augmented Reality for teaching Descriptive Geometry and Engineering Graphics Course to First-Year Students, Joint International Conference on Engineering Education & International Conference on Information Technology, ICEE/ICIT-2014, June 2 - 6, Riga, Latvia. pp 158-164.
10. Veide, Z., Strozheva, V., Veide, G., 2014. Manual Drawing in Modern Engineering education, Joint International Conference on Engineering Education & International Conference on Information Technology, ICEE/ICIT-2014, June 2 - 6, Riga, Latvia. pp 25-28.
STEFANITA CIUNEL ET AL - COMPARATIVE STUDIES AND ANALYSIS OF THE TWO TYPES OF FRAMES DEVICES FOR THE DUMMY NECK TESTING SYSTEM
118 THE 5TH ICGG CONFERENCE MONGEOMETRIJA 2016 PROCEEDINGS Belgrade: 23-26 June 2016
COMPARATIVE STUDIES AND ANALYSIS OF THE TWO TYPES OF FRAMES DEVICES FOR THE DUMMY NECK TESTING SYSTEM
Stefanita Ciunel
Department of Automotive and Industrial Engineering, Faculty of Mechanics, University of Craiova, 107 Calea Bucuresti Street, 200512, Craiova, Romania; Phone +40251–544 621,
PhD Lecturer, e-mail: [email protected]
Bebe Tica
Department of Automotive and Industrial Engineering, Faculty of Mechanics, University of Craiova, 107 Calea Bucuresti Street, 200512, Craiova, Romania; Phone +40251–544 621,
PhD, Associate Professor, e-mail: [email protected]
Gheorghe Popa-Mitroi
Department of Automotive and Industrial Engineering, Faculty of Mechanics, University of Craiova, 107 Calea Bucuresti Street, 200512, Craiova, Romania; Phone +40251–544 621,
PhD Lecturer, e-mail: [email protected]
ABSTRACT
The paper presents a complete study made on two mechanical structures. First, was made a FEA analysis on the two types of frames using a static loading. The results were not conclusive. In that case, was made a dynamic analysis. The results were organized and analyzed. In the final, the paper presents important conclusion including the reasons for the choosing of the best type of framework. In the final, the paper presents important conclusion including the reasons for the choosing and explaining the reasons that led to the selection of the best type of framework.
Keywords: dummy, dynamic simulation, frontal impact, FEA analysis, neck testing.
1. INTRODUCTION
The neck performance specifications for these tests are velocity at impact, pendulum acceleration, total rotation of the head/neck system, moment and force about the occipital condyle. According to the above mentioned devices we tried to study the first time in a virtually finalized with the practical implementation of a device for testing in a laboratory studying cranio-cervical complex behavior in situations similar to real ones [1], [2], [3], [4], [7], [8], [9].
The paper presents the virtual preliminary study of two testing devices used for car accidents. We start with the virtual design and experimental model of the cervical area of the dummies used for frontal impact as the family of Hybrid III 90%, but with the possibility to use on the dummies for lateral impact as BioSID, EuroSID-1. The cervical model was tested for both virtual testing devices for the flexion and extension movements.
The final solution was chosen after the stability test made in virtual environment statically and dynamically. The virtual behavior was verified experimentally in the study of the cervical area during the frontal impact. The verification of the testing device guarantees the stability in any work conditions and the measurements will be correct.
We mention that as a result of this study we conducted an internationally patent, device system type pendulum zones of anthropometric test devices use on road accidents tests [11].
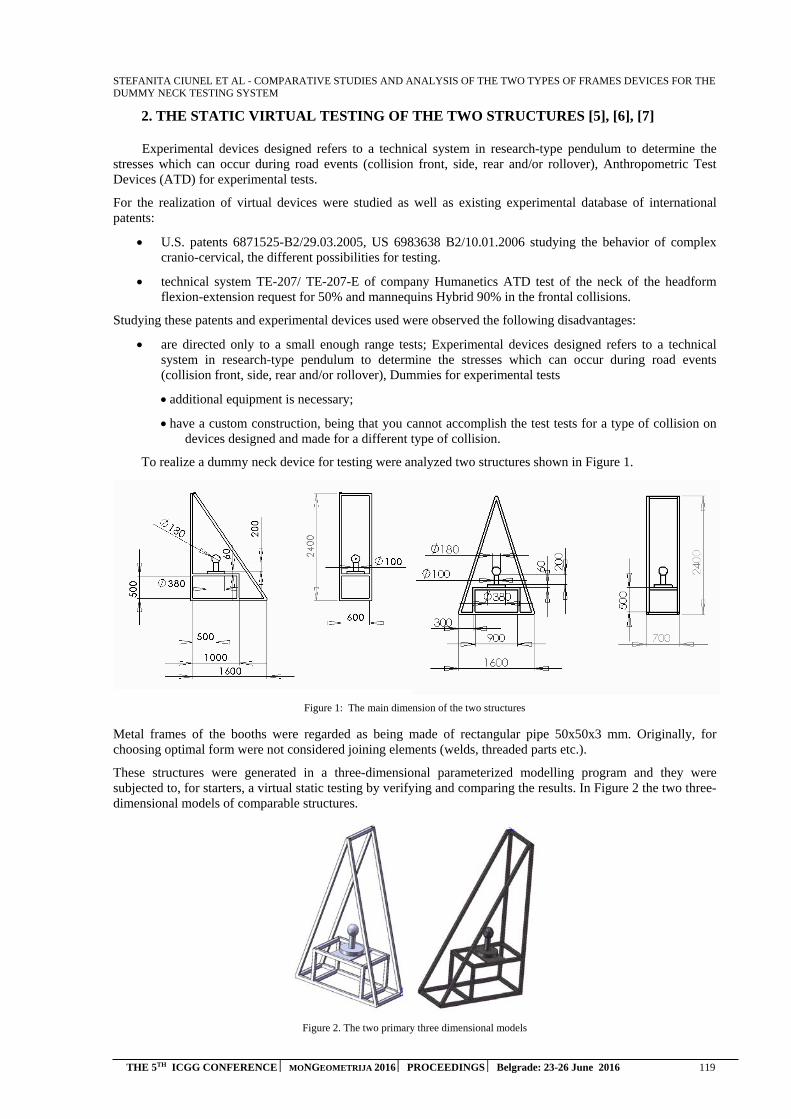
STEFANITA CIUNEL ET AL - COMPARATIVE STUDIES AND ANALYSIS OF THE TWO TYPES OF FRAMES DEVICES FOR THE DUMMY NECK TESTING SYSTEM
THE 5TH ICGG CONFERENCE MONGEOMETRIJA 2016 PROCEEDINGS Belgrade: 23-26 June 2016 119
2. THE STATIC VIRTUAL TESTING OF THE TWO STRUCTURES [5], [6], [7] Experimental devices designed refers to a technical system in research-type pendulum to determine the
stresses which can occur during road events (collision front, side, rear and/or rollover), Anthropometric Test Devices (ATD) for experimental tests.
For the realization of virtual devices were studied as well as existing experimental database of international patents:
U.S. patents 6871525-B2/29.03.2005, US 6983638 B2/10.01.2006 studying the behavior of complex cranio-cervical, the different possibilities for testing.
technical system TE-207/ TE-207-E of company Humanetics ATD test of the neck of the headform flexion-extension request for 50% and mannequins Hybrid 90% in the frontal collisions.
Studying these patents and experimental devices used were observed the following disadvantages:
are directed only to a small enough range tests; Experimental devices designed refers to a technical system in research-type pendulum to determine the stresses which can occur during road events (collision front, side, rear and/or rollover), Dummies for experimental tests
additional equipment is necessary;
have a custom construction, being that you cannot accomplish the test tests for a type of collision on devices designed and made for a different type of collision.
To realize a dummy neck device for testing were analyzed two structures shown in Figure 1.
Figure 1: The main dimension of the two structures
Metal frames of the booths were regarded as being made of rectangular pipe 50x50x3 mm. Originally, for choosing optimal form were not considered joining elements (welds, threaded parts etc.).
These structures were generated in a three-dimensional parameterized modelling program and they were subjected to, for starters, a virtual static testing by verifying and comparing the results. In Figure 2 the two three-dimensional models of comparable structures.
Figure 2. The two primary three dimensional models

STEFANITA CIUNEL ET AL - COMPARATIVE STUDIES AND ANALYSIS OF THE TWO TYPES OF FRAMES DEVICES FOR THE DUMMY NECK TESTING SYSTEM
120 THE 5TH ICGG CONFERENCE MONGEOMETRIJA 2016 PROCEEDINGS Belgrade: 23-26 June 2016
For the two models got a steel EN10162, the minimum tensile strength 37 daN/mm2. For static testing of two structures used finite element method for the simulation of loading along the way were the following steps:
calculated load (force) is similar to hitting on the sphere (mannequin head) by another sphere with a mass of 10 kg (impactor), with the throttle about 30g:
constraints were established for two fixed-type structures (Figure 2).
It was attached to a force of 3000N tensile sphere stands having normal direction to the surface (Figure 3).
at the next stage was the Division of finite element in structures using elements of type "tetrahedron".
Thus, the structure of the isosceles triangle "(presented in Figure 5) was obtained by a finite element structure with the following features:
average size of finite element solid 28.07 mm;
average tolerance of finite element solid 1.4 mm;
the total number of nodes of finite element solid 82365;
total number of finite element solid 42368;
the percentage of elements suppression 0%.
For the layout of the type "triangle" was obtained by a finite element structure density (solid) with the following features:
average size of finite element solid 30 mm;
average tolerance of finite element solid 1.5 mm;
high quality of Division in finite elements;
the total number of nodes of finite element solid 58774;
total number of finite element solid 30318;
the percentage of elements suppression 0%.
The final round results were obtained in simulation loading static maps of tensions, displacements and strains. For comparison, the results were presented in Figure 3. For a correct observation of deformations and of modes of deformation used a scale of 1 to 250.
Figure 3. Displacements maps compared to the two structures
For the analysis of these results was a comparative analysis of the maximum tensile stress, displacements and deformations. These data are extracted from the maps above and are summarized in Table 1.
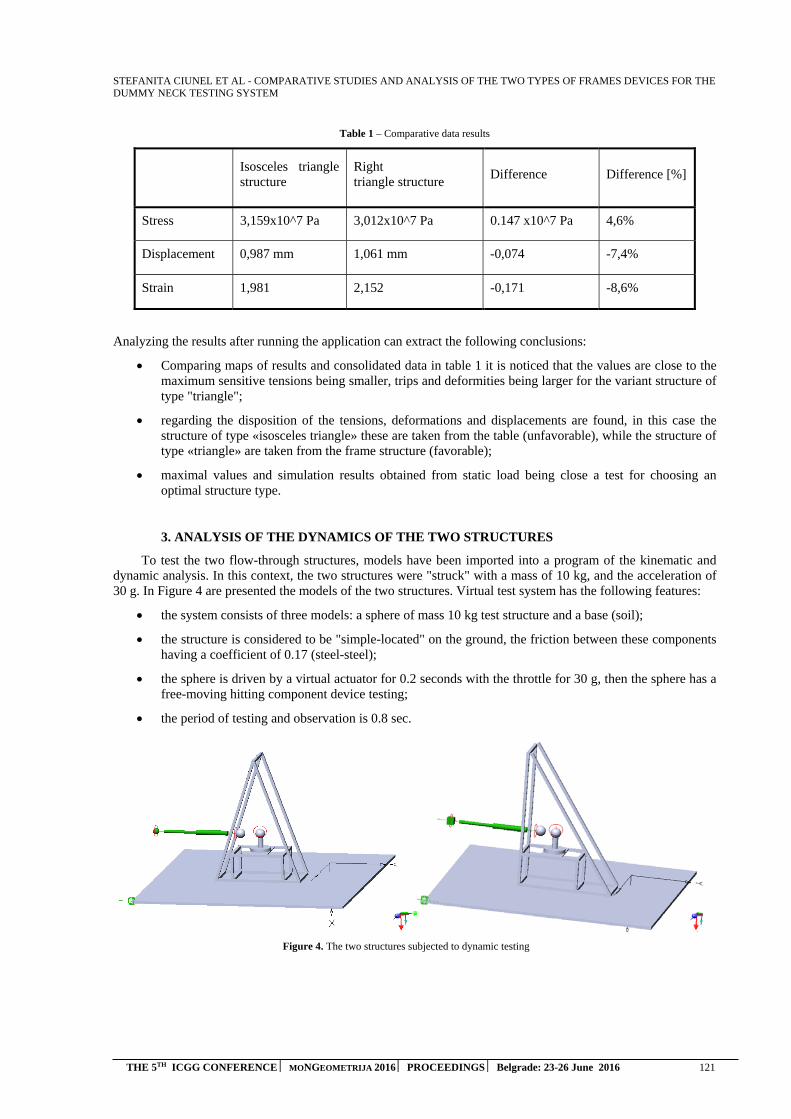
STEFANITA CIUNEL ET AL - COMPARATIVE STUDIES AND ANALYSIS OF THE TWO TYPES OF FRAMES DEVICES FOR THE DUMMY NECK TESTING SYSTEM
THE 5TH ICGG CONFERENCE MONGEOMETRIJA 2016 PROCEEDINGS Belgrade: 23-26 June 2016 121
Table 1 – Comparative data results
Isosceles triangle structure
Right triangle structure
Difference Difference [%]
Stress 3,159x10^7 Pa 3,012x10^7 Pa 0.147 x10^7 Pa 4,6%
Displacement 0,987 mm 1,061 mm -0,074 -7,4%
Strain 1,981 2,152 -0,171 -8,6%
Analyzing the results after running the application can extract the following conclusions:
Comparing maps of results and consolidated data in table 1 it is noticed that the values are close to the maximum sensitive tensions being smaller, trips and deformities being larger for the variant structure of type "triangle";
regarding the disposition of the tensions, deformations and displacements are found, in this case the structure of type «isosceles triangle» these are taken from the table (unfavorable), while the structure of type «triangle» are taken from the frame structure (favorable);
maximal values and simulation results obtained from static load being close a test for choosing an optimal structure type.
3. ANALYSIS OF THE DYNAMICS OF THE TWO STRUCTURES
To test the two flow-through structures, models have been imported into a program of the kinematic and dynamic analysis. In this context, the two structures were "struck" with a mass of 10 kg, and the acceleration of 30 g. In Figure 4 are presented the models of the two structures. Virtual test system has the following features:
the system consists of three models: a sphere of mass 10 kg test structure and a base (soil);
the structure is considered to be "simple-located" on the ground, the friction between these components having a coefficient of 0.17 (steel-steel);
the sphere is driven by a virtual actuator for 0.2 seconds with the throttle for 30 g, then the sphere has a free-moving hitting component device testing;
the period of testing and observation is 0.8 sec.
Figure 4. The two structures subjected to dynamic testing
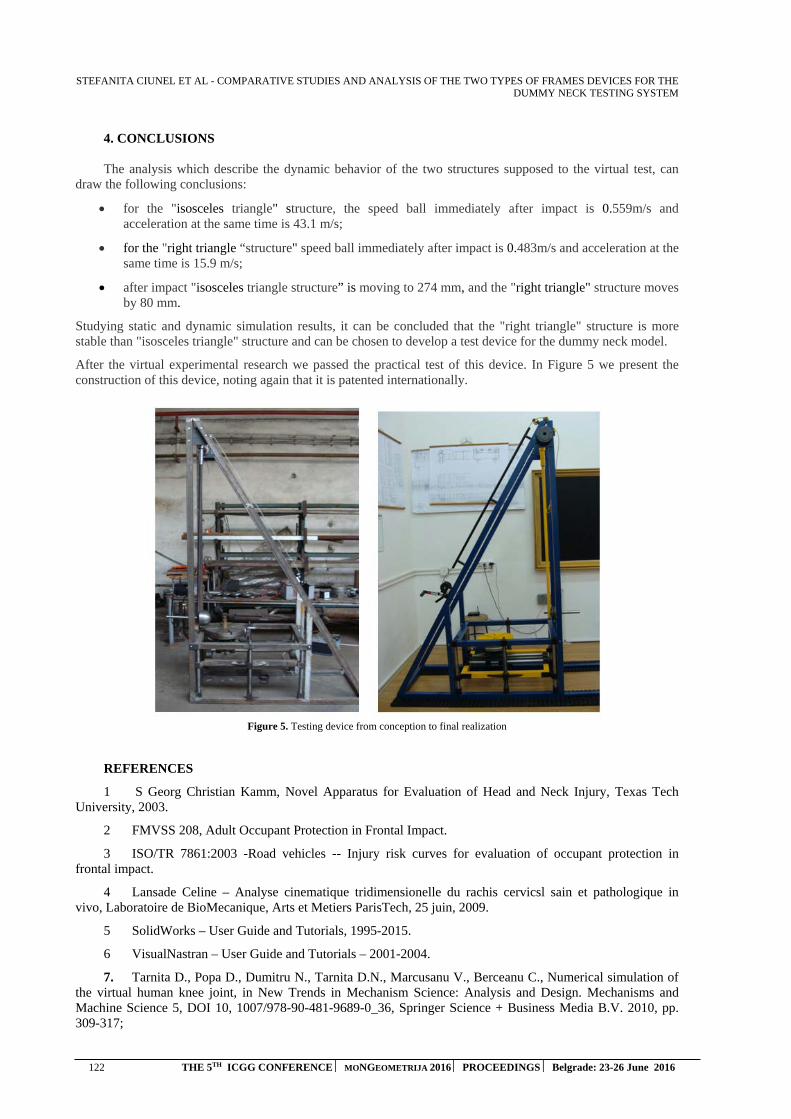
STEFANITA CIUNEL ET AL - COMPARATIVE STUDIES AND ANALYSIS OF THE TWO TYPES OF FRAMES DEVICES FOR THE DUMMY NECK TESTING SYSTEM
122 THE 5TH ICGG CONFERENCE MONGEOMETRIJA 2016 PROCEEDINGS Belgrade: 23-26 June 2016
4. CONCLUSIONS
The analysis which describe the dynamic behavior of the two structures supposed to the virtual test, can draw the following conclusions:
for the "isosceles triangle" structure, the speed ball immediately after impact is 0.559m/s and acceleration at the same time is 43.1 m/s;
for the "right triangle “structure" speed ball immediately after impact is 0.483m/s and acceleration at the same time is 15.9 m/s;
after impact "isosceles triangle structure” is moving to 274 mm, and the "right triangle" structure moves by 80 mm.
Studying static and dynamic simulation results, it can be concluded that the "right triangle" structure is more stable than "isosceles triangle" structure and can be chosen to develop a test device for the dummy neck model.
After the virtual experimental research we passed the practical test of this device. In Figure 5 we present the construction of this device, noting again that it is patented internationally.
Figure 5. Testing device from conception to final realization
REFERENCES
1 S Georg Christian Kamm, Novel Apparatus for Evaluation of Head and Neck Injury, Texas Tech University, 2003.
2 FMVSS 208, Adult Occupant Protection in Frontal Impact.
3 ISO/TR 7861:2003 -Road vehicles -- Injury risk curves for evaluation of occupant protection in frontal impact.
4 Lansade Celine – Analyse cinematique tridimensionelle du rachis cervicsl sain et pathologique in vivo, Laboratoire de BioMecanique, Arts et Metiers ParisTech, 25 juin, 2009.
5 SolidWorks – User Guide and Tutorials, 1995-2015.
6 VisualNastran – User Guide and Tutorials – 2001-2004.
7. Tarnita D., Popa D., Dumitru N., Tarnita D.N., Marcusanu V., Berceanu C., Numerical simulation of the virtual human knee joint, in New Trends in Mechanism Science: Analysis and Design. Mechanisms and Machine Science 5, DOI 10, 1007/978-90-481-9689-0_36, Springer Science + Business Media B.V. 2010, pp. 309-317;

STEFANITA CIUNEL ET AL - COMPARATIVE STUDIES AND ANALYSIS OF THE TWO TYPES OF FRAMES DEVICES FOR THE DUMMY NECK TESTING SYSTEM
THE 5TH ICGG CONFERENCE MONGEOMETRIJA 2016 PROCEEDINGS Belgrade: 23-26 June 2016 123
8 Withnall et al. - U.S. Patent, No. 6871525B2/03.29.2005, Method and apparatus for testing football Hemlet.
9 http://www.humanaeticsatd.com [Accessed: May 2016].
10 http://www.dummymodels.com [Accessed: June 2015].
11 http://www.osim.ro/publicatii/bopi13.htm [Accessed: April 2016].
M. OBRADOVIĆ, COMPOSITE POLYHEDRAL FORMS OBTAINED BY COMBINING CONCAVE PYRAMIDS OF THE SECOND SORT WITH ARCHIMEDEAN SOLIDS
THE 5TH ICGG CONFERENCE MONGEOMETRIJA 2016 PROCEEDINGS Belgrade: 23-26 June 2016 124
COMPOSITE POLYHEDRAL FORMS OBTAINED BY COMBINING CONCAVE PYRAMIDS OF THE SECOND SORT WITH
ARCHIMEDEAN SOLIDS
Marija Obradović
Department of mathematics, physics and descriptive geometry, Faculty of Civil engineering, University of Belgrade, Belgrade, Serbia, PhD., Associate Professor, [email protected]
ABSTRACT
The paper discusses a possibility of forming composite polyhedral forms using, as an outline, geometry of certain Archimedean solids, compatible with the geometry of concave pyramids of the second sort (CP II). Given that CP II as its base may have polygon from n=6 to n=9, with the possibility of forming the lateral sheet even with the decagonal base, Archimedean solids which could be taken into consideration are those which contain hexagon, octagon or decagon among their polygonal faces. These are: the truncated tetrahedron, truncated cube, truncated octahedron, truncated cuboctahedron, truncated dodecahedron, truncated icosahedron and truncated icosidodecahedron. These seven solids are augmented by adding: CP II-n-M, CP II-n- m, or CP II –n-B. In the typical case, if we adhere to the criterion that only one type of pyramid is added to one side of the body, such an augmentation would provide 21 new polyhedra. The factual number of the variations of the concave polyhedra obtained by adding different types of CP II onto the mentioned Archimedean solids is far greater, so the paper also deals with the possible number of these polyhedral shapes. In this manner, it is possible to get deltahedral concave forms, and the abundance of forms resulting from combinations of these polyhedra can serve for further research in geometry, design and structural fields.
Keywords: concave polyhedra, composite polyhedra, Archimedean solids, CP II, augmentation
SUBJECT CODE: Theoretical Geometry
INTRODUCTION
The paper examines a possibility of forming composite polyhedral forms comprised of concave pyramids of the second sort (CP II), using geometry of Archimedean solids as an outline. In this regard, it is a continuation of research in [6], [7], [9], [10] conducted on the concave cupolae of the second and higher sorts. The geometrical characteristics and the occurrence of CP II - Type A are discussed in detail in [11], [8], and the characteristics of CP II - Type B are discussed in [12], [8]. Overall, CP II arise by folding and corrugating a planar triangular net, in order to obtain spatial pentahedral cells arranged in a polar array around the normal axis through the centroid of the regular n-sided basis, forming a deltahedral lateral sheet. In this manner, the mentioned two types of CP II may occur: CP II- type A, with 5n equilateral triangles in the lateral sheet, which then may be assembled in such a way to create the lateral sheet with greater height (CP II- n-M) or with lesser height (CP II–n-m), and CP II - type B with 3n equilateral triangles in the lateral sheet, which produces only one shape and height of such a solid for the given polygonal base.
In this research we will deal with the formation of new polyhedral structures from an engineering point of view as done in [1], [5], [10], only brushing upon group theory implications in order to link this study with possible future directions of research. The focus of the research is on the possibilities of obtaining new polyhedral shapes whose versatility and geometric distinctness can serve as a starting point fortheir possible applications in fields of science, engineering or design.

M. OBRADOVIĆ, COMPOSITE POLYHEDRAL FORMS OBTAINED BY COMBINING CONCAVE PYRAMIDS OF THE SECOND SORT WITH ARCHIMEDEAN SOLIDS
125 THE 5TH ICGG CONFERENCE MONGEOMETRIJA 2016 PROCEEDINGS Belgrade: 23-26 June 2016
1. DETERMINATION OF THE POSSIBLE NUMBER OF DIFFERENT SHAPES OBTAINED BYAUGMENTATION OF ARCHIMEDEAN SOLIDS BY CP II
Given that CP II can have, as its base, a polygon from n=6 to n=9, with the possibility of forming the lateral sheet for as many as n=10, Archimedean solids that could be taken into consideration for the augmentations with CP II are those whose polygonal faces include hexagons, octagons and decagons. These solids are: truncated tetrahedron, truncated cube, truncated octahedron, truncated cuboctahedron, truncated icosahedron, truncated dodecahedron and truncated icosidodecahedron (Fig. 1).
These seven solids can be augmented by joining: CP II-n-M/m, or CP II–n-B onto their congruent polygonal faces. In the most typical case, if we adhere to the criterion that only one type of concave pyramid can be bijectively added to a single solid (i.e. K concave pyramids on K compatible polygonal faces), by such augmentations we would get 7·3 = 21 new polyhedra. They are shown in the gallery in the oncoming section of the paper. The actual number of permutations which cover all possible types and positions of CP II is far greater, so we give a brief overview of the possible number of different polyhedral shapes obtained in this manner.
a) b) c) d)
e) f) g) Fig. 1: Seven Archimedean solids that may be augmented by CP II:
a) truncated tetrahedron, b) truncated cube, c) truncated octahedron, d) truncated cuboctahedron,e) truncated icosahedron f) truncated dodecahedron g) truncated icosidodecahedron
Using this method, it is possible to obtain versatile concave deltahedral forms, and the abundance of shapes originated by combining these polyhedra may serve as a source for the further investigations beyound the scope of geometry and design.
It is possible to form a polyhedron that uses Archimedean solids as a foundation on whose polygonal faces bases of CP II can be joined, taken that the corresponding faces of these solids are congruent. We can place CP II in the external area, making augmentation of Archimedean solids, or in the interior space, making incavations. In this paper, due to limited space, we will present only the most typical examples of Archimedean solids’ augmentation using CP II.
Given that the minimal n-sided basis over which CP II may be formed is hexagon, and the maximal is decagon, we will adjoin the bases of CP II only to hexagonal, octagonal or decagonal faces of the Archimedean solids. The ones which contain hexagons in their composition are: truncated tetrahedron (Fig. 1 a), truncated octahedron (Fig. 1 c), truncated cuboctahedron (Fig. 1 d), truncated icosahedron (Fig. 1 e) and the truncated icosidodecahedron (Fig. 1 g), so they can be augmented using CP II-6-M, CP II-6-m or CP II-6-B. Archimedean solids which contain octagons are: truncated cube (Fig. 1 b) and truncated cuboctahedron (Fig. 1 d), so they can be augmented using CP II-8-M, CP II-8-m and CP II-8-B. Decagons are present in: truncated dodecahedron (Fig. 1 f) and truncated icosidodecahedron (Fig. 1 g), so they can be augmented using segments - lateral sheets: CP���� II-10-M, CP���� II-10-m and CP���� II-10-B. As shown in Fig. 1, there are two solids – truncated cuboctahedron and truncated icosidodecahedron which could be augmented using two different types of CP II: truncated
M. OBRADOVIĆ, COMPOSITE POLYHEDRAL FORMS OBTAINED BY COMBINING CONCAVE PYRAMIDS OF THE SECOND SORT WITH ARCHIMEDEAN SOLIDS
THE 5TH ICGG CONFERENCE MONGEOMETRIJA 2016 PROCEEDINGS Belgrade: 23-26 June 2016 126
cuboctahedron with CP II-6 and CP II-8, while truncated icosidodecahedron can be augmented with CP II-6 and CP���� II-10.
Let us examine the possible number of different composite polyhedra obtained by augmentation of the Archimedean solids by CP II. The actual number is obtained by taking into account all the possible permutations of the three types of CP II, plus the fourth case of blank face, which is not augmented. Thus, when cases of augmentation are concerned (without incavations), this problem can be reduced to the problem of determining the orbit of the group action on a set of sides of the chosen Archimedean solid. To simplify, the problem comes down to the problem of determining in how many ways we can paint observed polygonal faces of the given solid by using min 4 colors, i.e. in the case of the solids with two types of the basis onto which CP II can be added, using 3 + 3 + 1 = 7 colors.
This is the case of simple application of Burnside's Lemma [1], given in the following formula:
(Eq. 1)
where G is a finite group that acts on a set X, and g is an element of the group G,
Or more specifically, we use extention of Burnside's Lemma, The Pólya enumeration theorem [3], also known as the Redfield–Pólya Theorem, which allows counting of discrete combinatorial objects as a function of their ‘order’ [13].
In this paper, we will give just an example of a solution to this problem, pertaining to the truncated cube. It has six octagonal faces and belongs to octahedral point (symmetry) group (Oh), i.e. order of the rotation group is the same as for the cube, and stands at 24. So, due to the identity of the problems, it comes down to the possible ways to paint faces of the cube using m colors. For m possible colors that could be used in coloring the cube, the general formula (for cube) is:
�
��(�� + 3�� + 12�� + 8 ��) = 240 [4] (Eq. 2)
If we now replace the value and introduce m=4, the number of possible combinations is:
�
��(4� + 3 · 4� + 12 · 4� + 8 · 4�) = 240 (Eq. 3)
From the given examples, we see that the number of the new solids obtained just by augmenting one or all faces of truncated cube, amounts to 240. If we add the possible incavations to this number, i.e. denting CP II to the interior space of the truncated cube, now we would take into account 7 different 'cases', equivalent to the problem of colors by which we might paint faces of a cube, so the number would grow to 5390, according to the general formula given above.
For the remaining cases of augmented Archimedean solids onto whose faces we can add 3 types of CP II, the result can be obtained in a similar manner - by application of Pólya enumeration theorem, whose principle is shown above. Due to the lack of the space in the paper, we will not engage in more detailed explanation of each case.
Thus, the aggregate number of such permutations would far exceed the possibilities of practical systematization, so we will comply with the criterion of commonality of CP II types that augment one solid. In this case, we would obtain 3 new concave composite polyhedra for each of the listed Archimedean solids, with the criterion that every available face congruent to the CP II base is augmented with the identical type of the adequate CP II. Assumably, if we introduce the possibility that on the Archimedean solids which can be augmented by two different n-side based CP II (truncated cuboctahedron, truncated icosidodecahedron) we may combine types of both CP II used (M, m and B), the number of the new solids, as the number of variations with repetition of class k = 2, with n = 3 elements, would then increase from 3 to:
��� = 3� = 9 (Eq. 4)
Hence, we would get: 3·5+2·9= 33 new concave composite polyhedra obtained in this manner.

M. OBRADOVIĆ, COMPOSITE POLYHEDRAL FORMS OBTAINED BY COMBINING CONCAVE PYRAMIDS OF THE SECOND SORT WITH ARCHIMEDEAN SOLIDS
127 THE 5TH ICGG CONFERENCE MONGEOMETRIJA 2016 PROCEEDINGS Belgrade: 23-26 June 2016
2. TYPES OF CP II AND THEIR POTENTIAL AS BUILDING BLOCKS OF A COMPOSITEPOLYHEDRON
Considering that the properties of CP II type A are described in [11], the properties of CP II type B in [12], and both briefly recapitulated in the introduction, in this section we examine the main differences between these types and ways of their integration into the geometry of Archimedean solids. Although the key difference between these two types of CP II is that in the type CP II–n-A the base polygon (starting point for the formation of the lateral sheet) can be any polygon between n=6 and n=10, while in CP II-n-B it can be only even sided polygon, in this case this fact does not play an important role, because the only those CP II formed over the even-numbered sided polygons can be used (as shown in Table 1- blue and beige). CP II-n-A, due to the manner of forming and the number of triangles in the mantle, has 2n planes of symmetry, in contrast to the CP II-n-B (shown Table 1 - pink) which has n planes of symmetry. Therefore,) there is only one possible way of joining CP II-n-A (CP II-n-M and CP II-n-m onto the faces of Arcimedean solids, while CP II-n-B provides more opportunities, because every single CP II can rotate around the normal axis through the centroid of the basis for the angle of 0° or π /n, where once again we have an identical problem of ’painting’ faces, this time using two colors - one for each of these two positions. So, in the case of the truncated cube we get the actual number of:
�
��(2� + 3 · 2� + 12 · 2� + 8 · 2�) = 10 (Eq. 5)
possible various solids, just by augmentation of truncated cube using CP II-8-B. Thus, the total number of possible augmentations of truncated cube only by the same type of CP II-8, increases to 1 + 1 + 10 = 12. In this paper we present only those cases which imply that all the faces of a solid are augmented by the same type of CP II, and if it is CP II-n-B, that all of them are identicly oriented, for a clearer overview of typical shapes.
Table 1: types of CP II
type sides
Type A CP II-n-M
Type A CP II-n-m
Type B CP II-n-B
n=6
CP II-6-M CP II -6-m CP II-6-B n=8
CP II-8-M CP II-8-m CP II-8-B n=10
CP II-10-M CP II-10-m CP II-10-B
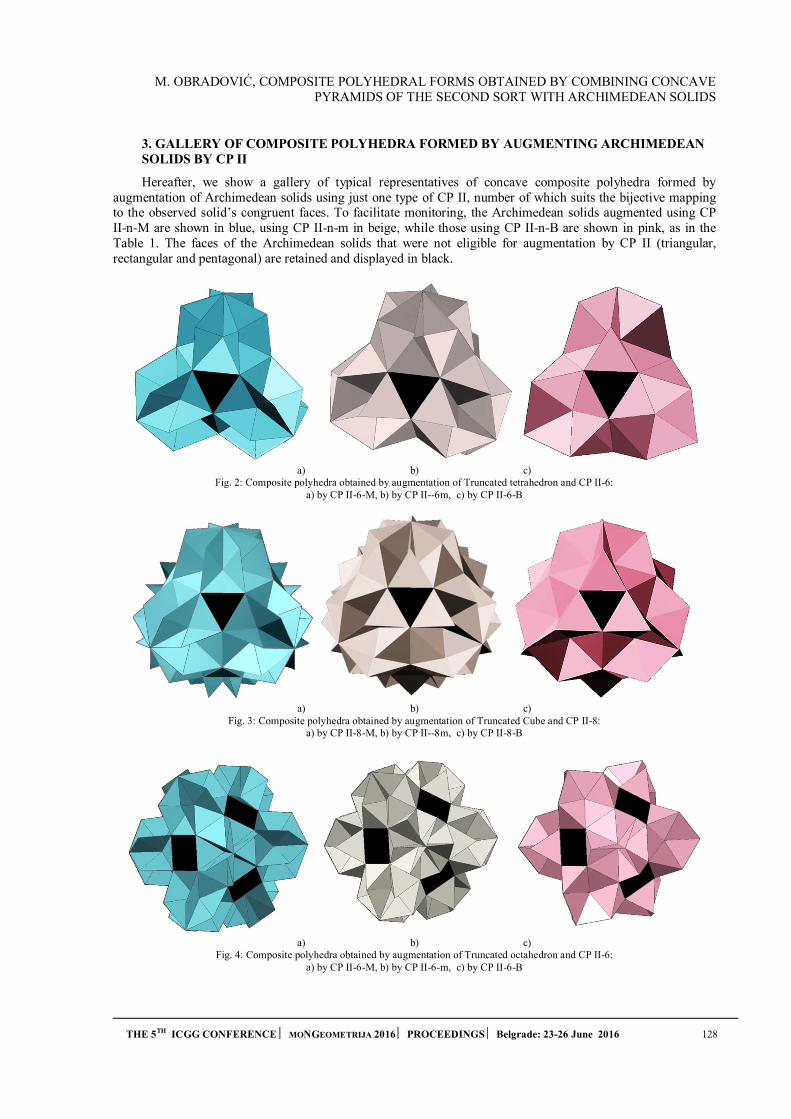
M. OBRADOVIĆ, COMPOSITE POLYHEDRAL FORMS OBTAINED BY COMBINING CONCAVE PYRAMIDS OF THE SECOND SORT WITH ARCHIMEDEAN SOLIDS
THE 5TH ICGG CONFERENCE MONGEOMETRIJA 2016 PROCEEDINGS Belgrade: 23-26 June 2016 128
3. GALLERY OF COMPOSITE POLYHEDRA FORMED BY AUGMENTING ARCHIMEDEANSOLIDS BY CP II
Hereafter, we show a gallery of typical representatives of concave composite polyhedra formed by augmentation of Archimedean solids using just one type of CP II, number of which suits the bijective mapping to the observed solid’s congruent faces. To facilitate monitoring, the Archimedean solids augmented using CP II-n-M are shown in blue, using CP II-n-m in beige, while those using CP II-n-B are shown in pink, as in the Table 1. The faces of the Archimedean solids that were not eligible for augmentation by CP II (triangular, rectangular and pentagonal) are retained and displayed in black.
a) b) c) Fig. 2: Composite polyhedra obtained by augmentation of Truncated tetrahedron and CP II-6:
a) by CP II-6-M, b) by CP II--6m, c) by CP II-6-B
a) b) c) Fig. 3: Composite polyhedra obtained by augmentation of Truncated Cube and CP II-8:
a) by CP II-8-M, b) by CP II--8m, c) by CP II-8-B
a) b) c) Fig. 4: Composite polyhedra obtained by augmentation of Truncated octahedron and CP II-6:
a) by CP II-6-M, b) by CP II-6-m, c) by CP II-6-B

M. OBRADOVIĆ, COMPOSITE POLYHEDRAL FORMS OBTAINED BY COMBINING CONCAVE PYRAMIDS OF THE SECOND SORT WITH ARCHIMEDEAN SOLIDS
129 THE 5TH ICGG CONFERENCE MONGEOMETRIJA 2016 PROCEEDINGS Belgrade: 23-26 June 2016
a) b) c) Fig. 5: Composite polyhedra obtained by augmentation of Truncated icosahedron and CP II-6:
a) by CP II-6-M, b) by CP II-6-m, c) by CP II-6-B
a) b) c) Fig. 6: Composite polyhedra obtained by augmentation of Truncated Cuboctahedron by CP II-6 and CP II-8:
a) by CP II-6-M and by CP II-8-M, b) by CP II-6-m and by CP II-8-m, c) by CP II-6-B and by CP II-8-B
a) b) c) Fig. 7: Composite polyhedra obtained by augmentation of truncated dodecahedron and CP II-10
a) by CP II-10-M, b) by CP II -10-m, c) by CP II-10-B
a) b) c) Fig. 8: Composite polyhedra obtained by augmentation of icosidodecahedron by CP II 6 and CP II-10:
a) by CP II-6-M and by CP II-10-M, b) by CP II-6-m and by CP II-10-m, c) by CP II-6-B and by CP II-10-B
M. OBRADOVIĆ, COMPOSITE POLYHEDRAL FORMS OBTAINED BY COMBINING CONCAVE PYRAMIDS OF THE SECOND SORT WITH ARCHIMEDEAN SOLIDS
THE 5TH ICGG CONFERENCE MONGEOMETRIJA 2016 PROCEEDINGS Belgrade: 23-26 June 2016 130
We will point out that among the examples given, there are deltahedra, i.e. polyhedra whose all the faces are identical equilateral triangles. These solids are created by augmentations of truncated tetrahedron (Fig. 2), truncated cube (Fig. 2) and truncated dodecahedron (Fig. 7). Given that they consist of identical elements - equilateral triangles, we might continue to explore whether and which of these solids could be assembled from a planar, unbroken net. The obtained concave composite solids consisting of regular polygons other than equilateral triangles, such as squares and pentagons can also be converted into deltahedra by additional augmentations, using four-sided and five-sided pyramids, respectively.
CONCLUSIONS
The paper describes the procedure for obtaining composite concave polyhedra by augmentations of Archimedean solids using concave pyramids of the second sort (CP II), whereby we also discussed the possible number of the newly obtained solids. The gallery of the most typical examples of such augmentation is given. The aim of the paper is, in addition to the presentation of the formation method, to provide a visual insight as the initial part of the overall analysis, in order to make comparisons and receive information on the possible shapes of the newly formed solid. Consequently, we might include some other criteria in the process of each solid’s evaluation in terms of their possible application, for example: dihedral angles’ values, area and volume ratio, photo-illumination of the solids’ faces and their relation with the total area of the body, the effective drainage methods, and the like, all of which can be starting points for the future research. Based on the forms displayed in this paper, we may also take into consideration certain fragments of these solids and examine their potential for further application.
AKNOWLEDGEMENT
We thank colleagues Ass. Prof. Zoran Pucanović (Faculty of Civil Engineering, Belgrade) and Ass. Prof. Vladimir Grujić (Faculty of Mathematics, Belgrade) for the consultations and inspirational talks.
This paper is partly supported by MPNTR grant No. III44006.
REFERENCES:
1. Burnside, W. Theory of Groups of Finite Order, Cambridge University Press, 1897.
2. Emmerich D.G. Composite polyhedra (Polyedres composites) – Topologie Strucutrale #13, 1986.
3. Harary, F. "Pólya's Enumeration Theorem." Graph Theory. Reading, MA: Addison-Wesley,pp. 180-184, 1994.
4. Howard Redfield J.: The Theory of Group-Reduced Distributions, American Journal ofMathematics, Vol. 49, No. 3 (July, 1927), pp. 433-455, Published by: The Johns HopkinsUniversity Press DOI: 10.2307/2370675
5. Huybers P.: Polyhedroids, An Anthology of Structural Morphology, World scientific PublishingCo. Pte. Ltd. 2009. pp. 49-62.
6. Mišić S., Obradović M. Đukanović G.: Composite Concave Cupolae as Geometric andArchitectural Forms, Journal for Geometry and Graphics, Copyright Heldermann Verlag 2015.Vol.19. No 1. pp 79-91. ISSN 1433-8157
7. Obradović M., A Group Of Polyhedra Arised As Variations Of Concave Bicupolae Of SecondSort, Proceedings of 3rd International Scientific Conference MoNGeometrija 2012, ISBN 978-86-7892-405-7 Novi Sad, June 21-24. 2012. pp. 95-132.
8. Obradović M., Konstruktivno – geometrijska obrada toroidnih deltaedara sa pravilnompoligonalnom osnovom, Arhitektonski fakultet Univerziteta u Beogradu, 2006.
9. Obradović M., Mišić S., Petrović M.: Investigating Composite Polyhedral forms obtained bycombining concave cupolae of II sort with Archimedean Solids, Proceedings of 3rd InternationalScientific Conference MoNGeometrija 2012, ISBN 978-86-7892-405-7 Novi Sad, June 21-24.2012. pp.109 – 123.

M. OBRADOVIĆ, COMPOSITE POLYHEDRAL FORMS OBTAINED BY COMBINING CONCAVE PYRAMIDS OF THE SECOND SORT WITH ARCHIMEDEAN SOLIDS
131 THE 5TH ICGG CONFERENCE MONGEOMETRIJA 2016 PROCEEDINGS Belgrade: 23-26 June 2016
10. Obradović M., Mišić S., Popkonstantinović B., Petrović M., Malešević B., Obradović R.,Investigation of concave cupolae based polyhedral structures and their potential application inarchitecture, TTEM Journal, Vol.8., No.3, 8/9 2013, pp. 1198-1214.
11. Obradović M., Mišić S., Popkonstantinović B.: Concave Pyramids of Second Sort -TheOccurrence, Types, Variations, 4th International Scientific Conference on Geometry and Graphics,moNGeometrija 2014, June 20-22.Vlasina, Serbia, Proceedings Vol 2. pp. 157 -168. ISBN 978-86-88601-14-6
12. Obradović M., Mišić S., Popkonstantinović B.: Variations of Concave Pyramids of Second Sortwith an Even Number of Base Sides, Journal of Industrial Design and Engineering Graphics(JIDEG) – The SORGING Journal, Volume 10, Special Issue, Fascicle 1, pp. 45-50. Brasov,Romania, June 2015.
13. Weisstein, E. W. "Pólya Enumeration Theorem." From MathWorld--A Wolfram Web Resource.http://mathworld.wolfram.com/PolyaEnumerationTheorem.html
M. JOVANOVIĆ ET AL.: COMPUTER AIDED CURVE AND SURFACE GENERATION IN RELATIVISTIC GEOMETRY OF HARMONIC EQUIVALENTS
THE 5TH ICGG CONFERENCE MONGEOMETRIJA 2016 PROCEEDINGS Belgrade: 23-26 June 2016 132
COMPUTER AIDED CURVE AND SURFACE GENERATION IN RELATIVISTIC GEOMETRY OF HARMONIC EQUIVALENTS
Marko Jovanović
University of Novi Sad, Faculty of Technical Sciences, Department of Architecture and Urban Planning, Novi Sad, Serbia
MSc., Assistant, [email protected]
Marko Vučić
University of Novi Sad, Faculty of Technical Sciences, Department of Architecture and Urban Planning, Novi Sad, Serbia
BSc., Post-graduate student, [email protected]
Radovan Štulić
University of Novi Sad, Faculty of Technical Sciences, Department of Architecture and Urban Planning, Novi Sad, Serbia
PhD., Full Professor, [email protected]
Milena Stavrić
TU Graz, Faculty of Architecture, Institute of Architecture and Media, Graz, Austria PhD., Assistant Professor, [email protected]
ABSTRACT
Contemporary architectural designs strive towards a more integrated approach between multiple areas of expertise including functionality, performance, fabrication process, exploitation period and mostly the aesthetical appearance through form’s geometrical genesis and its representation. In order to better respond to the dualities of performative necessities and aesthetical appealing designs, complex, even freeform surfaces are mostly introduced as a result. However, the necessary step is also the fabrication process which imposes geometrical approximations and surface rationalizations in order to optimize the ratio between cost and efficiency.
In this paper, we explore various geometric form designs on the foundation of geometric transformations presented in the “Relativistic Geometry of Harmonic Equivalents” by Professor Lazar Dovnikovic, through a novel workflow and algorithmic representation of the theory. We utilize a software package for generating the desired geometry and its transformed equivalents and a parametric approach to vary the solution according to user defined necessities. Resulting solutions are used as a guideline and inspiration for the future design phase.
Keywords: Computer aided graphics, geometrical genesis, geometrical transformations, parametric modelling;
1. INTRODUCTION
Contemporary architecture strives towards geometrical shapes and forms that are more complex than traditional ones and are aesthetically pleasing. The idea behind those designs is not novel. However, structurally speaking, those forms were difficult or impossible to manufacture in the past. The main problems appeared in two aspects. The first issue was the graphical depiction of the architect’s ideas. This includes the lack of adequate viewing projections, necessary for the proper understanding of the architect’s vision. The second was the technological underdevelopment and lack of fabrication tools and workflow. Hence, before the industrial revolution, most geometrical shapes and forms were confined within the boundaries of traditional surfaces such as polyhedrons, cylinders and spheres in form of vaults, domes and load-bearing walls. The choice of material
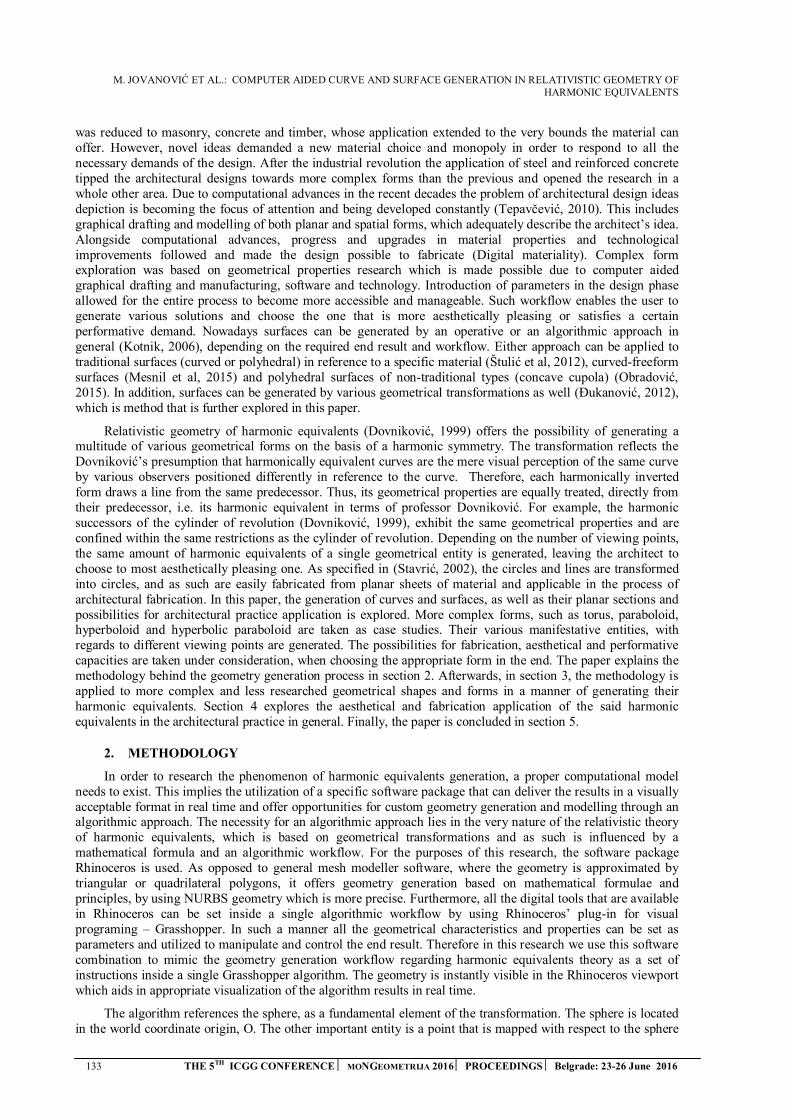
M. JOVANOVIĆ ET AL.: COMPUTER AIDED CURVE AND SURFACE GENERATION IN RELATIVISTIC GEOMETRY OF HARMONIC EQUIVALENTS
133 THE 5TH ICGG CONFERENCE MONGEOMETRIJA 2016 PROCEEDINGS Belgrade: 23-26 June 2016
was reduced to masonry, concrete and timber, whose application extended to the very bounds the material can offer. However, novel ideas demanded a new material choice and monopoly in order to respond to all the necessary demands of the design. After the industrial revolution the application of steel and reinforced concrete tipped the architectural designs towards more complex forms than the previous and opened the research in a whole other area. Due to computational advances in the recent decades the problem of architectural design ideas depiction is becoming the focus of attention and being developed constantly (Tepavčević, 2010). This includes graphical drafting and modelling of both planar and spatial forms, which adequately describe the architect’s idea. Alongside computational advances, progress and upgrades in material properties and technological improvements followed and made the design possible to fabricate (Digital materiality). Complex form exploration was based on geometrical properties research which is made possible due to computer aided graphical drafting and manufacturing, software and technology. Introduction of parameters in the design phase allowed for the entire process to become more accessible and manageable. Such workflow enables the user to generate various solutions and choose the one that is more aesthetically pleasing or satisfies a certain performative demand. Nowadays surfaces can be generated by an operative or an algorithmic approach in general (Kotnik, 2006), depending on the required end result and workflow. Either approach can be applied to traditional surfaces (curved or polyhedral) in reference to a specific material (Štulić et al, 2012), curved-freeform surfaces (Mesnil et al, 2015) and polyhedral surfaces of non-traditional types (concave cupola) (Obradović, 2015). In addition, surfaces can be generated by various geometrical transformations as well (Đukanović, 2012), which is method that is further explored in this paper.
Relativistic geometry of harmonic equivalents (Dovniković, 1999) offers the possibility of generating a multitude of various geometrical forms on the basis of a harmonic symmetry. The transformation reflects the Dovniković’s presumption that harmonically equivalent curves are the mere visual perception of the same curve by various observers positioned differently in reference to the curve. Therefore, each harmonically inverted form draws a line from the same predecessor. Thus, its geometrical properties are equally treated, directly from their predecessor, i.e. its harmonic equivalent in terms of professor Dovniković. For example, the harmonic successors of the cylinder of revolution (Dovniković, 1999), exhibit the same geometrical properties and are confined within the same restrictions as the cylinder of revolution. Depending on the number of viewing points, the same amount of harmonic equivalents of a single geometrical entity is generated, leaving the architect to choose to most aesthetically pleasing one. As specified in (Stavrić, 2002), the circles and lines are transformed into circles, and as such are easily fabricated from planar sheets of material and applicable in the process of architectural fabrication. In this paper, the generation of curves and surfaces, as well as their planar sections and possibilities for architectural practice application is explored. More complex forms, such as torus, paraboloid, hyperboloid and hyperbolic paraboloid are taken as case studies. Their various manifestative entities, with regards to different viewing points are generated. The possibilities for fabrication, aesthetical and performative capacities are taken under consideration, when choosing the appropriate form in the end. The paper explains the methodology behind the geometry generation process in section 2. Afterwards, in section 3, the methodology is applied to more complex and less researched geometrical shapes and forms in a manner of generating their harmonic equivalents. Section 4 explores the aesthetical and fabrication application of the said harmonic equivalents in the architectural practice in general. Finally, the paper is concluded in section 5.
2. METHODOLOGY
In order to research the phenomenon of harmonic equivalents generation, a proper computational model needs to exist. This implies the utilization of a specific software package that can deliver the results in a visually acceptable format in real time and offer opportunities for custom geometry generation and modelling through an algorithmic approach. The necessity for an algorithmic approach lies in the very nature of the relativistic theory of harmonic equivalents, which is based on geometrical transformations and as such is influenced by a mathematical formula and an algorithmic workflow. For the purposes of this research, the software package Rhinoceros is used. As opposed to general mesh modeller software, where the geometry is approximated by triangular or quadrilateral polygons, it offers geometry generation based on mathematical formulae and principles, by using NURBS geometry which is more precise. Furthermore, all the digital tools that are available in Rhinoceros can be set inside a single algorithmic workflow by using Rhinoceros’ plug-in for visual programing – Grasshopper. In such a manner all the geometrical characteristics and properties can be set as parameters and utilized to manipulate and control the end result. Therefore in this research we use this software combination to mimic the geometry generation workflow regarding harmonic equivalents theory as a set of instructions inside a single Grasshopper algorithm. The geometry is instantly visible in the Rhinoceros viewport which aids in appropriate visualization of the algorithm results in real time.
The algorithm references the sphere, as a fundamental element of the transformation. The sphere is located in the world coordinate origin, O. The other important entity is a point that is mapped with respect to the sphere

M. JOVANOVIĆ ET AL.: COMPUTER AIDED CURVE AND SURFACE GENERATION IN RELATIVISTIC GEOMETRY OF HARMONIC EQUIVALENTS
THE 5TH ICGG CONFERENCE MONGEOMETRIJA 2016 PROCEEDINGS Belgrade: 23-26 June 2016 134
by the harmonic ratio (a cross ratio of 4 points that is equal to -1). Thus, a point A located at a distance d, from the sphere centre with the radius r, is transformed into a point A* on the same radius vector as the point A at a distance of r2/d (Fig. 1).
Fig. 1 – The depiction of the method used for the transformation process, left – 2D drawing; right – 3D view
When the point is a locus of an arbitrary surface, the harmonically equivalent surface is generated. The optimal approach to generating the computational model is that the point A is the locus of the particular surface isocurves, with the appropriate distribution. The appropriate refers to the uniform distribution on the transformed isocurves, having almost uniform distance between each other. In addition, since the point is the locus of an isocurve, the necessary number of points is required to interpolate the end result more precisely and it depends on the complexity of the initial geometry being transformed. In the following section, the manifestative entities of hyperbolic paraboloid and generalized toroid harmonic equivalents are explored.
3. SURFACE GENERATION
3.1. Hyperbolic paraboloid
The hyperbolic paraboloid (HP) is a ruled surface with two systems of straight line generatrices. Thus, its harmonic equivalent is a surface of two systems of circular generatrices. The HP used here is restricted by a warped quadrilateral, hence generating a portion of the entire surface in the transformation. Since computational models cannot display infinitely distant points, the results are constricted within these boundaries seen here in the top view (Fig. 2) and in the front view (Fig. 3).
Fig. 2 – The depiction of the method used for the transformation process on a HP, top view
Fig. 3 – The depiction of the method used for the transformation process on a HP, front view
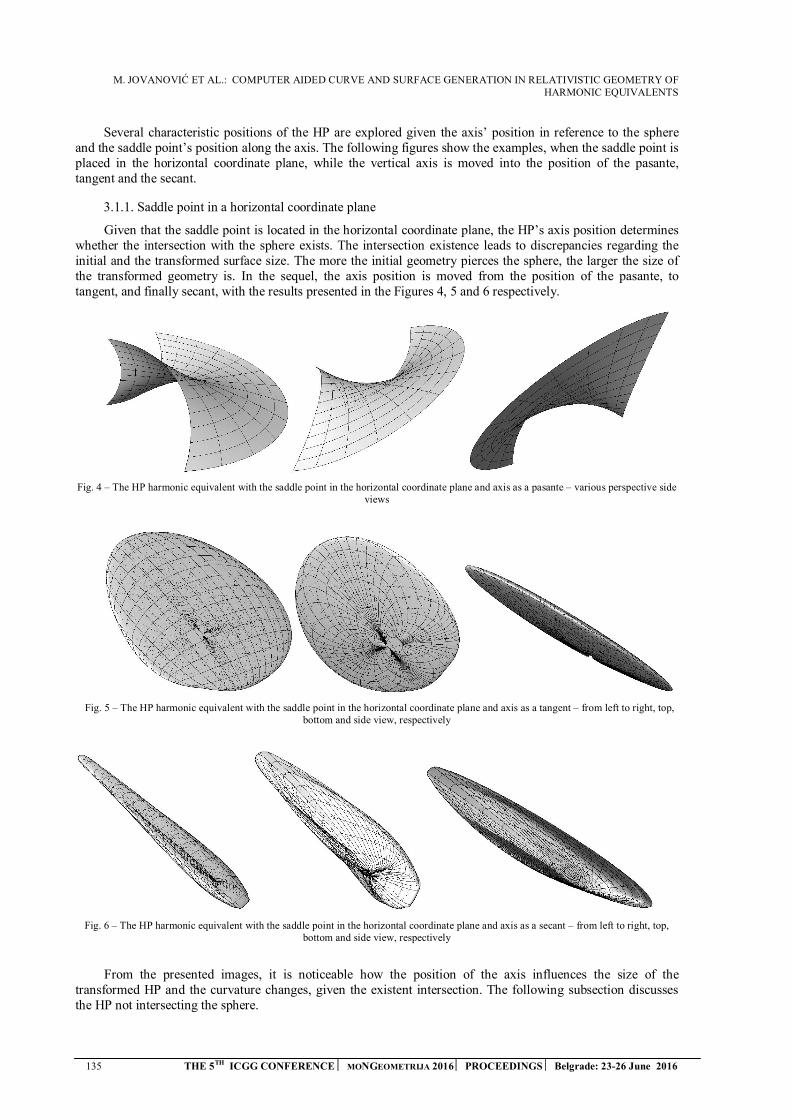
M. JOVANOVIĆ ET AL.: COMPUTER AIDED CURVE AND SURFACE GENERATION IN RELATIVISTIC GEOMETRY OF HARMONIC EQUIVALENTS
135 THE 5TH ICGG CONFERENCE MONGEOMETRIJA 2016 PROCEEDINGS Belgrade: 23-26 June 2016
Several characteristic positions of the HP are explored given the axis’ position in reference to the sphere and the saddle point’s position along the axis. The following figures show the examples, when the saddle point is placed in the horizontal coordinate plane, while the vertical axis is moved into the position of the pasante, tangent and the secant.
3.1.1. Saddle point in a horizontal coordinate plane
Given that the saddle point is located in the horizontal coordinate plane, the HP’s axis position determines whether the intersection with the sphere exists. The intersection existence leads to discrepancies regarding the initial and the transformed surface size. The more the initial geometry pierces the sphere, the larger the size of the transformed geometry is. In the sequel, the axis position is moved from the position of the pasante, to tangent, and finally secant, with the results presented in the Figures 4, 5 and 6 respectively.
Fig. 4 – The HP harmonic equivalent with the saddle point in the horizontal coordinate plane and axis as a pasante – various perspective side views
Fig. 5 – The HP harmonic equivalent with the saddle point in the horizontal coordinate plane and axis as a tangent – from left to right, top, bottom and side view, respectively
Fig. 6 – The HP harmonic equivalent with the saddle point in the horizontal coordinate plane and axis as a secant – from left to right, top, bottom and side view, respectively
From the presented images, it is noticeable how the position of the axis influences the size of the transformed HP and the curvature changes, given the existent intersection. The following subsection discusses the HP not intersecting the sphere.
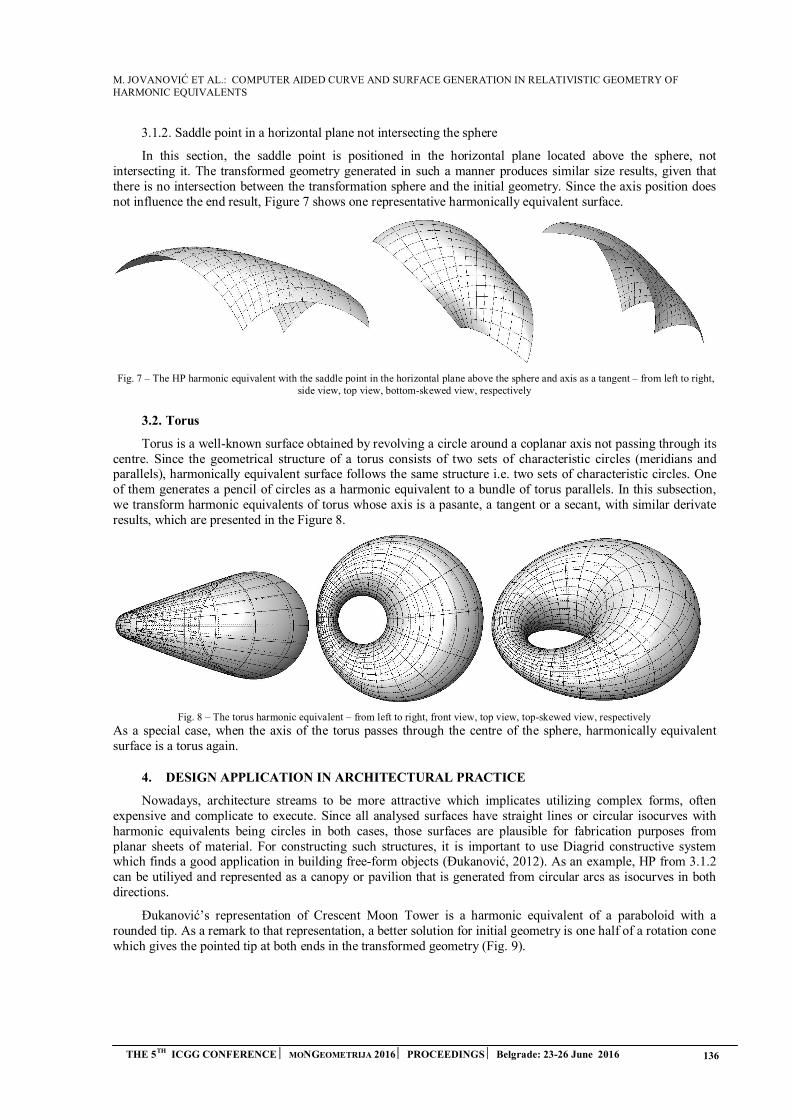
M. JOVANOVIĆ ET AL.: COMPUTER AIDED CURVE AND SURFACE GENERATION IN RELATIVISTIC GEOMETRY OF HARMONIC EQUIVALENTS
THE 5TH ICGG CONFERENCE MONGEOMETRIJA 2016 PROCEEDINGS Belgrade: 23-26 June 2016 136
3.1.2. Saddle point in a horizontal plane not intersecting the sphere
In this section, the saddle point is positioned in the horizontal plane located above the sphere, not intersecting it. The transformed geometry generated in such a manner produces similar size results, given that there is no intersection between the transformation sphere and the initial geometry. Since the axis position does not influence the end result, Figure 7 shows one representative harmonically equivalent surface.
Fig. 7 – The HP harmonic equivalent with the saddle point in the horizontal plane above the sphere and axis as a tangent – from left to right, side view, top view, bottom-skewed view, respectively
3.2. Torus
Torus is a well-known surface obtained by revolving a circle around a coplanar axis not passing through its centre. Since the geometrical structure of a torus consists of two sets of characteristic circles (meridians and parallels), harmonically equivalent surface follows the same structure i.e. two sets of characteristic circles. One of them generates a pencil of circles as a harmonic equivalent to a bundle of torus parallels. In this subsection, we transform harmonic equivalents of torus whose axis is a pasante, a tangent or a secant, with similar derivate results, which are presented in the Figure 8.
Fig. 8 – The torus harmonic equivalent – from left to right, front view, top view, top-skewed view, respectively
As a special case, when the axis of the torus passes through the centre of the sphere, harmonically equivalent surface is a torus again.
4. DESIGN APPLICATION IN ARCHITECTURAL PRACTICE
Nowadays, architecture streams to be more attractive which implicates utilizing complex forms, often expensive and complicate to execute. Since all analysed surfaces have straight lines or circular isocurves with harmonic equivalents being circles in both cases, those surfaces are plausible for fabrication purposes from planar sheets of material. For constructing such structures, it is important to use Diagrid constructive system which finds a good application in building free-form objects (Đukanović, 2012). As an example, HP from 3.1.2 can be utiliyed and represented as a canopy or pavilion that is generated from circular arcs as isocurves in both directions.
Đukanović’s representation of Crescent Moon Tower is a harmonic equivalent of a paraboloid with a rounded tip. As a remark to that representation, a better solution for initial geometry is one half of a rotation cone which gives the pointed tip at both ends in the transformed geometry (Fig. 9).
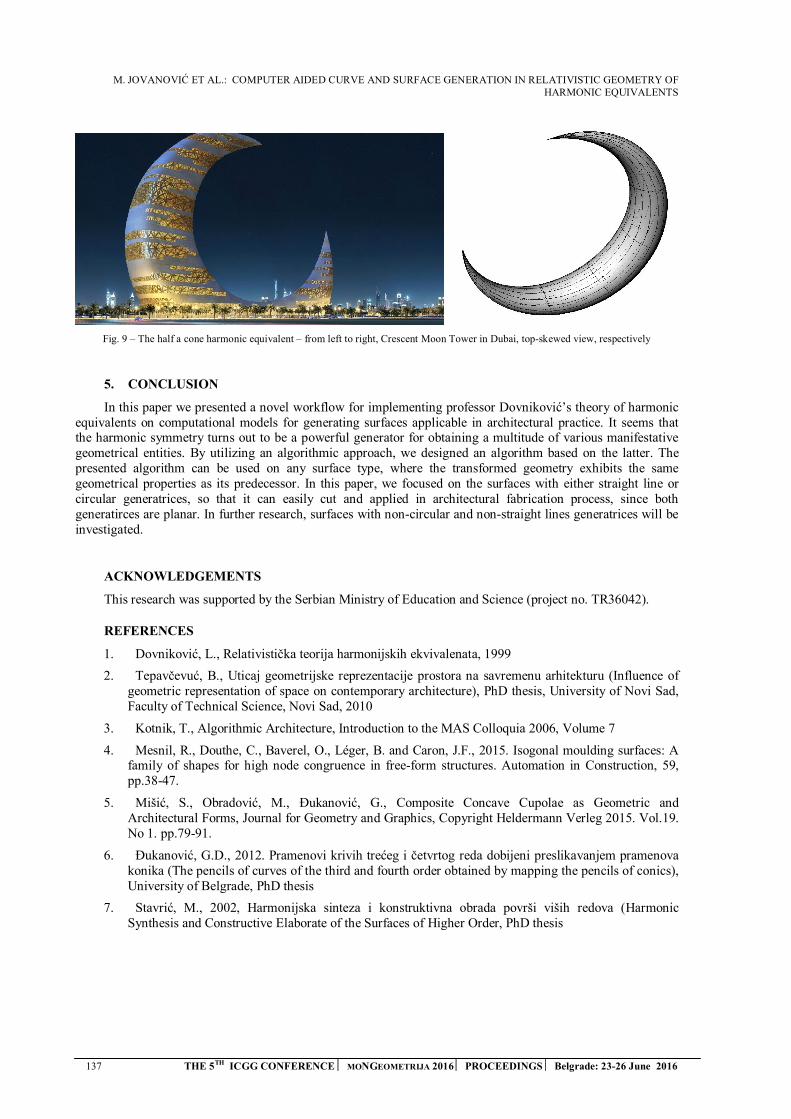
M. JOVANOVIĆ ET AL.: COMPUTER AIDED CURVE AND SURFACE GENERATION IN RELATIVISTIC GEOMETRY OF HARMONIC EQUIVALENTS
137 THE 5TH ICGG CONFERENCE MONGEOMETRIJA 2016 PROCEEDINGS Belgrade: 23-26 June 2016
Fig. 9 – The half a cone harmonic equivalent – from left to right, Crescent Moon Tower in Dubai, top-skewed view, respectively
5. CONCLUSION
In this paper we presented a novel workflow for implementing professor Dovniković’s theory of harmonic equivalents on computational models for generating surfaces applicable in architectural practice. It seems that the harmonic symmetry turns out to be a powerful generator for obtaining a multitude of various manifestative geometrical entities. By utilizing an algorithmic approach, we designed an algorithm based on the latter. The presented algorithm can be used on any surface type, where the transformed geometry exhibits the same geometrical properties as its predecessor. In this paper, we focused on the surfaces with either straight line or circular generatrices, so that it can easily cut and applied in architectural fabrication process, since both generatirces are planar. In further research, surfaces with non-circular and non-straight lines generatrices will be investigated.
ACKNOWLEDGEMENTS
This research was supported by the Serbian Ministry of Education and Science (project no. TR36042).
REFERENCES
1. Dovniković, L., Relativistička teorija harmonijskih ekvivalenata, 1999
2. Tepavčevuć, B., Uticaj geometrijske reprezentacije prostora na savremenu arhitekturu (Influence ofgeometric representation of space on contemporary architecture), PhD thesis, University of Novi Sad, Faculty of Technical Science, Novi Sad, 2010
3. Kotnik, T., Algorithmic Architecture, Introduction to the MAS Colloquia 2006, Volume 7
4. Mesnil, R., Douthe, C., Baverel, O., Léger, B. and Caron, J.F., 2015. Isogonal moulding surfaces: Afamily of shapes for high node congruence in free-form structures. Automation in Construction, 59, pp.38-47.
5. Mišić, S., Obradović, M., Đukanović, G., Composite Concave Cupolae as Geometric andArchitectural Forms, Journal for Geometry and Graphics, Copyright Heldermann Verleg 2015. Vol.19. No 1. pp.79-91.
6. Đukanović, G.D., 2012. Pramenovi krivih trećeg i četvrtog reda dobijeni preslikavanjem pramenovakonika (The pencils of curves of the third and fourth order obtained by mapping the pencils of conics), University of Belgrade, PhD thesis
7. Stavrić, M., 2002, Harmonijska sinteza i konstruktivna obrada površi viših redova (HarmonicSynthesis and Constructive Elaborate of the Surfaces of Higher Order, PhD thesis
S. RISTESKI ET AL.: CONCEPT DESIGN OF A SPORTS COUPE WITH ERGONOMIC ANALYSYS AND PHOTOREALISTIC RENDERING
THE 5TH ICGG CONFERENCE MONGEOMETRIJA 2016 PROCEEDINGS Belgrade: 23-26 June 2016 138
CONCEPT DESIGN OF A SPORTS COUPE WITH ERGONOMIC ANALYSIS AND PHOTOREALISTIC RENDERING
Slavko Risteski
Faculty of Mechanical Engineering, University “Ss. Cyril and Methodius” Skopje, Skopje, Republic of Macedonia
BSc., student, [email protected]
Risto Tashevski
Faculty of Mechanical Engineering, University “Ss. Cyril and Methodius” Skopje, Skopje, Republic of Macedonia
PhD., Professor, [email protected]
Tashko Rizov
Faculty of Mechanical Engineering, University “Ss. Cyril and Methodius” Skopje, Skopje, Republic of Macedonia
PhD., Assistant Professor, [email protected]
ABSTRACT
This paper presents the design process of a vehicle in the sports coupe body style. The process of creation of the 3D model of the vehicle is consisted of several steps: sketching, concept analysis, concept selection, concept processing, creation of a 3D model, and model rendering. In general, the vehicles in the sports coupe body style have as their objective to secure transportation of two passengers, with the addition of possibly two more, as well as to provide space for baggage.
Keywords: concept design of vehicles; ergonomic analysis; photorealistic rendering.

S. RISTESKI ET AL.: CONCEPT DESIGN OF A SPORTS COUPE WITH ERGONOMIC ANALYSYS AND PHOTOREALISTIC RENDERING
139 THE 5TH ICGG CONFERENCE MONGEOMETRIJA 2016 PROCEEDINGS Belgrade: 23-26 June 2016
1. INTRODUCTION
Coupe is a vehicle model of closed type, meaning the roof of the vehicle is part of the body of the vehicle and it can be detached. The bodywork of a coupe resembles like a sport version of a sedan vehicle, offering two or four seating places for passengers. The number of doors usually is two which defines the classical type of coupe, but also it can have four doors. Although this case is much rarer.
Quad coupe by definition is a four door coupe in which the two rear doors are in secondary function and they open only when the front doors are open. Other versions of coupe are also possible like the “couplet” which is a small vehicle with two or three doors, where the third door is auxiliary. This body type often has folding part of the roof and retracting side windows. A “Business coupe” is a type of coupe with bigger dimensions and significantly better comfort, addressing the specific needs of the business people like better sound proofing performances of the interior and additional equipment. A sports coupe in which the roof line is connected with the back part in one smooth line is called “fastback”. A combi coupe is a rarely used term for coupe where the vehicle look is much closer to the hatchback vehicle type.
With the increased popularity of the column-less vehicles with hard roof in the mid-fifties, some vehicle manufacturers begin to use the term coupe in order to define their hardtop models, reserving the term sedan for their models containing a B-column. This definition in not universal and its use has been significantly reduced in recent years.
Figure. 1: Column marking in various body works of vehicles.
Today the term coupe is more a marketing term for the vehicle manufacturers than a true fact about the vehicle design and the technical construction. Today the term coupe is used to describe any vehicle with two, three or even four doors with luxury or sporty look. That is because of the fact that coupes are generally percept as sportier than sedans, meaning that this type is easier to sell than sedan vehicle with two seats for passengers.
2. GENERATING CONCPETS AND CONCPET SKETCHS
The uniqueness and the aesthetics of the design accomplish the impressiveness of a vehicle. This means that the designer has a major role in capturing the aesthetic demands of the buyer. At the same time, the designer has to know the current and previous lines and shapes of the vehicle as well as to define and create the future lines and shapes of the vehicle. With sketching the designer can come to different ideas and elements that are individually acceptable and are interesting to be taken into consideration for the next sketch which is used to perfect the design or to completely start from the beginning.
In this paper we present three concepts of a coupe vehicle.

S. RISTESKI ET AL.: CONCEPT DESIGN OF A SPORTS COUPE WITH ERGONOMIC ANALYSYS AND PHOTOREALISTIC RENDERING
THE 5TH ICGG CONFERENCE MONGEOMETRIJA 2016 PROCEEDINGS Belgrade: 23-26 June 2016 140
Figure. 2: The first concept design of a coupe vehicle.
The first concept design of a coupe presented on Fig. 2 presents a vehicle with sporty lines. The back part of the vehicle and the outward curvature of the front side panel as ideas are kept in the final concept because of their interesting design. This concept is discarded because of the level of resemblances and similarity of the front head light and side silhouette with the existing vehicles of this category.
Figure. 3: The second concept design of a coupe vehicle.
The second concept design of a coupe presented in Fig. 3 presents a modified version of the first concept design by discarding some of the unwanted elements and by maintaining the unique elements and adding new ones. The front main light positioned on the side of the front bonnet of the vehicle is unique in design with its sharp look and non-uniform shape. The front windshield is connected with the side windows of the car resulting in a unified panoramic view of the horizontal sight of the passengers. The rear windshield is connected to the roof of the vehicle.
Figure. 4: The third and final concept design of a coupe vehicle.
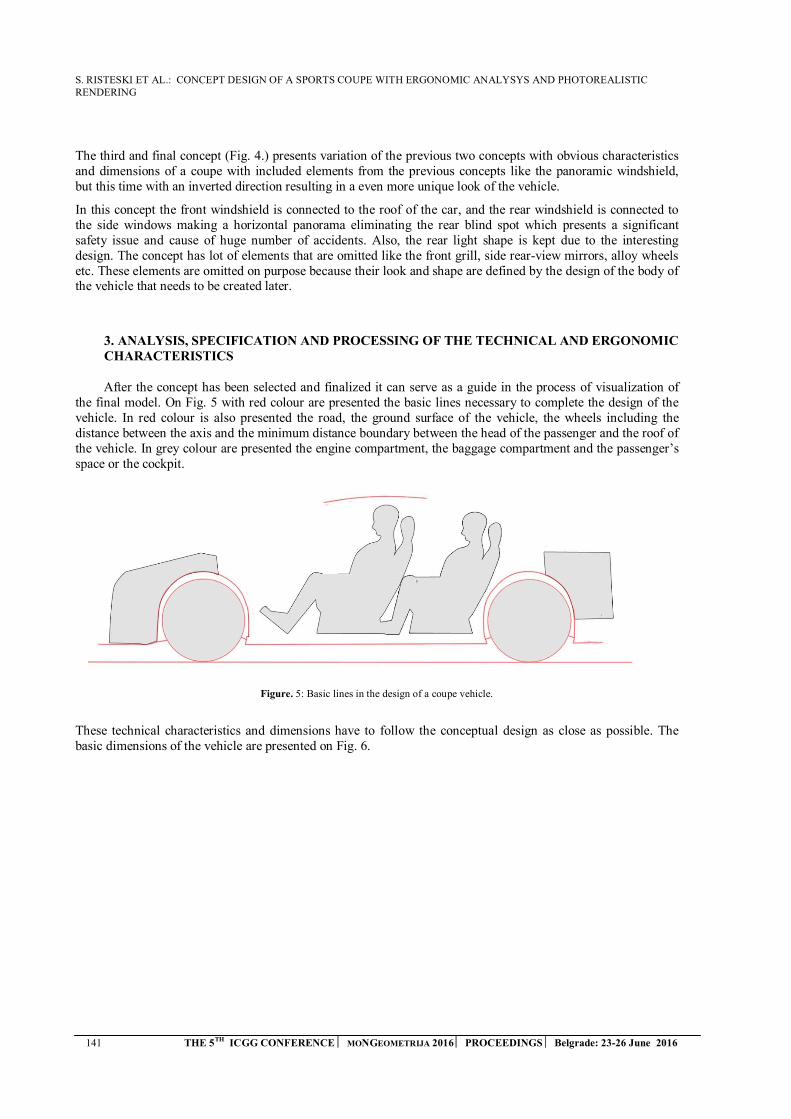
S. RISTESKI ET AL.: CONCEPT DESIGN OF A SPORTS COUPE WITH ERGONOMIC ANALYSYS AND PHOTOREALISTIC RENDERING
141 THE 5TH ICGG CONFERENCE MONGEOMETRIJA 2016 PROCEEDINGS Belgrade: 23-26 June 2016
The third and final concept (Fig. 4.) presents variation of the previous two concepts with obvious characteristics and dimensions of a coupe with included elements from the previous concepts like the panoramic windshield, but this time with an inverted direction resulting in a even more unique look of the vehicle.
In this concept the front windshield is connected to the roof of the car, and the rear windshield is connected to the side windows making a horizontal panorama eliminating the rear blind spot which presents a significant safety issue and cause of huge number of accidents. Also, the rear light shape is kept due to the interesting design. The concept has lot of elements that are omitted like the front grill, side rear-view mirrors, alloy wheels etc. These elements are omitted on purpose because their look and shape are defined by the design of the body of the vehicle that needs to be created later.
3. ANALYSIS, SPECIFICATION AND PROCESSING OF THE TECHNICAL AND ERGONOMICCHARACTERISTICS
After the concept has been selected and finalized it can serve as a guide in the process of visualization of the final model. On Fig. 5 with red colour are presented the basic lines necessary to complete the design of the vehicle. In red colour is also presented the road, the ground surface of the vehicle, the wheels including the distance between the axis and the minimum distance boundary between the head of the passenger and the roof of the vehicle. In grey colour are presented the engine compartment, the baggage compartment and the passenger’s space or the cockpit.
Figure. 5: Basic lines in the design of a coupe vehicle.
These technical characteristics and dimensions have to follow the conceptual design as close as possible. The basic dimensions of the vehicle are presented on Fig. 6.

S. RISTESKI ET AL.: CONCEPT DESIGN OF A SPORTS COUPE WITH ERGONOMIC ANALYSYS AND PHOTOREALISTIC RENDERING
THE 5TH ICGG CONFERENCE MONGEOMETRIJA 2016 PROCEEDINGS Belgrade: 23-26 June 2016 142
Figure. 6: Basic dimensions of the vehicle.
Besides the technical characteristics of the external design of the vehicle, the communication between the passengers and the vehicle should be satisfied regrading comfort and safety. An ergonomic analysis was created (Fig. 6.) by using the standard ergonomic metrics of the side and front view of the vehicle.
In order to make the ergonomic analysis silhouettes (in blue colour) that represents the average man portion of population in terms of height and silhouettes (in yellow colour) that represent the female portion of the population are added. In green colour is presented the field of view of the driver or the active view which is a result of the cross section of the man’s and female’s field of view. On the top view of the vehicle, in green colour, is presented the boundary in space in which the driver can see the left side rear view mirror without turning his/hers head.
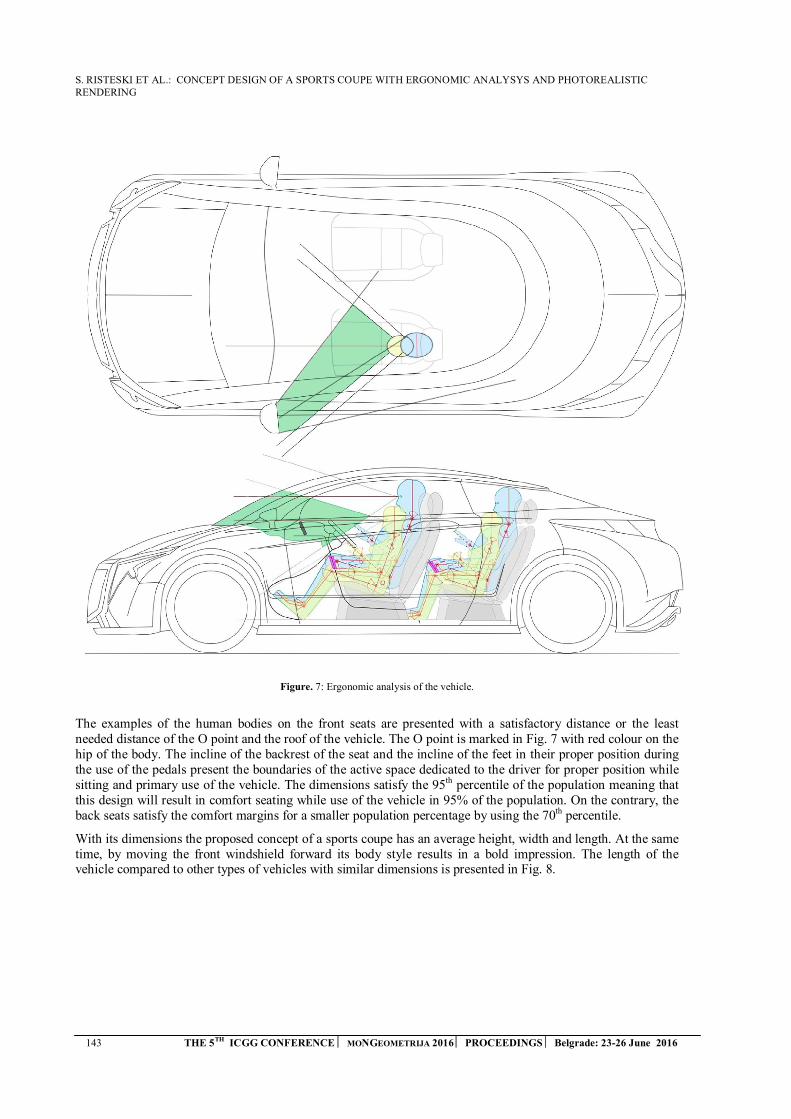
S. RISTESKI ET AL.: CONCEPT DESIGN OF A SPORTS COUPE WITH ERGONOMIC ANALYSYS AND PHOTOREALISTIC RENDERING
143 THE 5TH ICGG CONFERENCE MONGEOMETRIJA 2016 PROCEEDINGS Belgrade: 23-26 June 2016
Figure. 7: Ergonomic analysis of the vehicle.
The examples of the human bodies on the front seats are presented with a satisfactory distance or the least needed distance of the O point and the roof of the vehicle. The O point is marked in Fig. 7 with red colour on the hip of the body. The incline of the backrest of the seat and the incline of the feet in their proper position during the use of the pedals present the boundaries of the active space dedicated to the driver for proper position while sitting and primary use of the vehicle. The dimensions satisfy the 95th percentile of the population meaning that this design will result in comfort seating while use of the vehicle in 95% of the population. On the contrary, the back seats satisfy the comfort margins for a smaller population percentage by using the 70th percentile.
With its dimensions the proposed concept of a sports coupe has an average height, width and length. At the same time, by moving the front windshield forward its body style results in a bold impression. The length of the vehicle compared to other types of vehicles with similar dimensions is presented in Fig. 8.
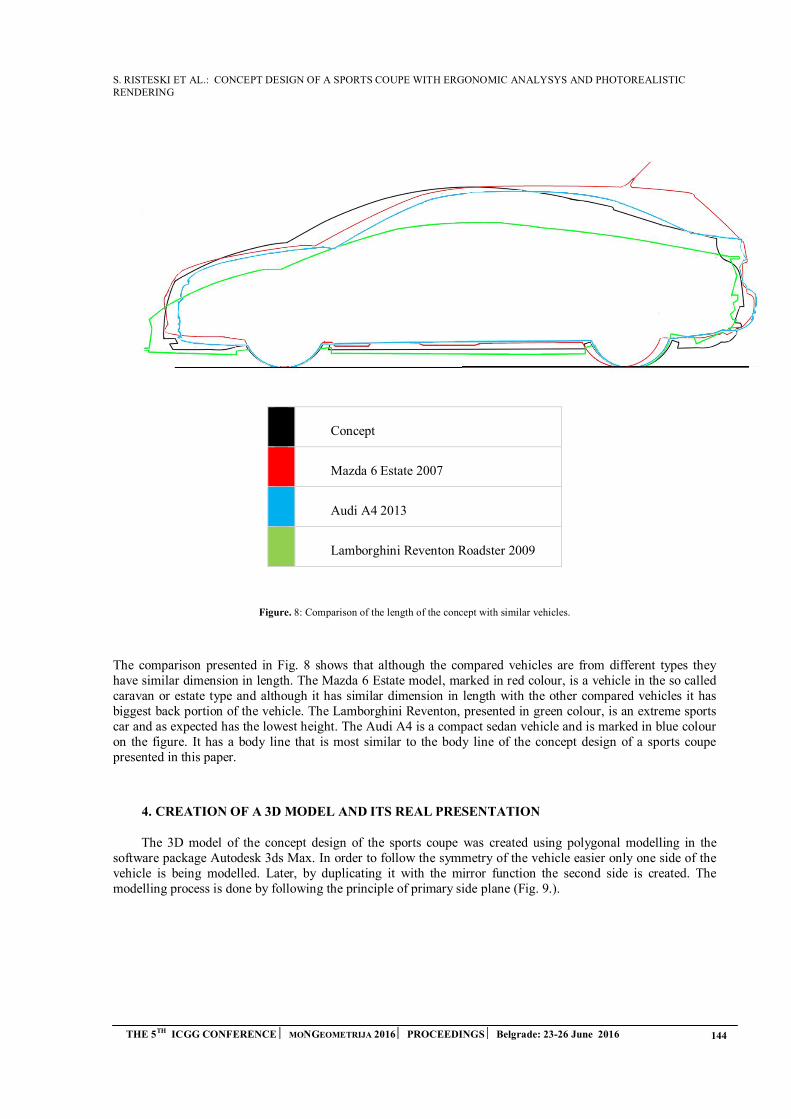
S. RISTESKI ET AL.: CONCEPT DESIGN OF A SPORTS COUPE WITH ERGONOMIC ANALYSYS AND PHOTOREALISTIC RENDERING
THE 5TH ICGG CONFERENCE MONGEOMETRIJA 2016 PROCEEDINGS Belgrade: 23-26 June 2016 144
Concept
Mazda 6 Estate 2007
Audi A4 2013
Lamborghini Reventon Roadster 2009
Figure. 8: Comparison of the length of the concept with similar vehicles.
The comparison presented in Fig. 8 shows that although the compared vehicles are from different types they have similar dimension in length. The Mazda 6 Estate model, marked in red colour, is a vehicle in the so called caravan or estate type and although it has similar dimension in length with the other compared vehicles it has biggest back portion of the vehicle. The Lamborghini Reventon, presented in green colour, is an extreme sports car and as expected has the lowest height. The Audi A4 is a compact sedan vehicle and is marked in blue colour on the figure. It has a body line that is most similar to the body line of the concept design of a sports coupe presented in this paper.
4. CREATION OF A 3D MODEL AND ITS REAL PRESENTATION
The 3D model of the concept design of the sports coupe was created using polygonal modelling in the software package Autodesk 3ds Max. In order to follow the symmetry of the vehicle easier only one side of the vehicle is being modelled. Later, by duplicating it with the mirror function the second side is created. The modelling process is done by following the principle of primary side plane (Fig. 9.).

S. RISTESKI ET AL.: CONCEPT DESIGN OF A SPORTS COUPE WITH ERGONOMIC ANALYSYS AND PHOTOREALISTIC RENDERING
145 THE 5TH ICGG CONFERENCE MONGEOMETRIJA 2016 PROCEEDINGS Belgrade: 23-26 June 2016
Figure. 9: Modelling using the principle of primary side plane.
The rest of the elements are presented in alternate colour and temporary wheels are added for additional visualisation.
By activating the mirror function the complete vehicle is made visible (Fig. 10). After the complete shape of the vehicle is visible the final corrections of the shape can take place continuing towards the final realistic presentation.
After the 3D model is created, in the next step the realistic presentation in a real environment should be made. In this case, the model is going to be processed first in studio environment and then in real environment. For that, the renderer V-ray is used. The V-ray renderer is additional plug-in for the software package Autodesk 3ds Max. For the studio environment a closed demo space has to be created including imitation of the real light reflection. The configuration of the headlight in the space is as following:
Three reflective background lights for soft front reflection of the vehicle, One reflective roof light for soft lighting, One directional light in the background to result in a nice diffuse gradient, and One directional roof light to result in sharp white reflection.
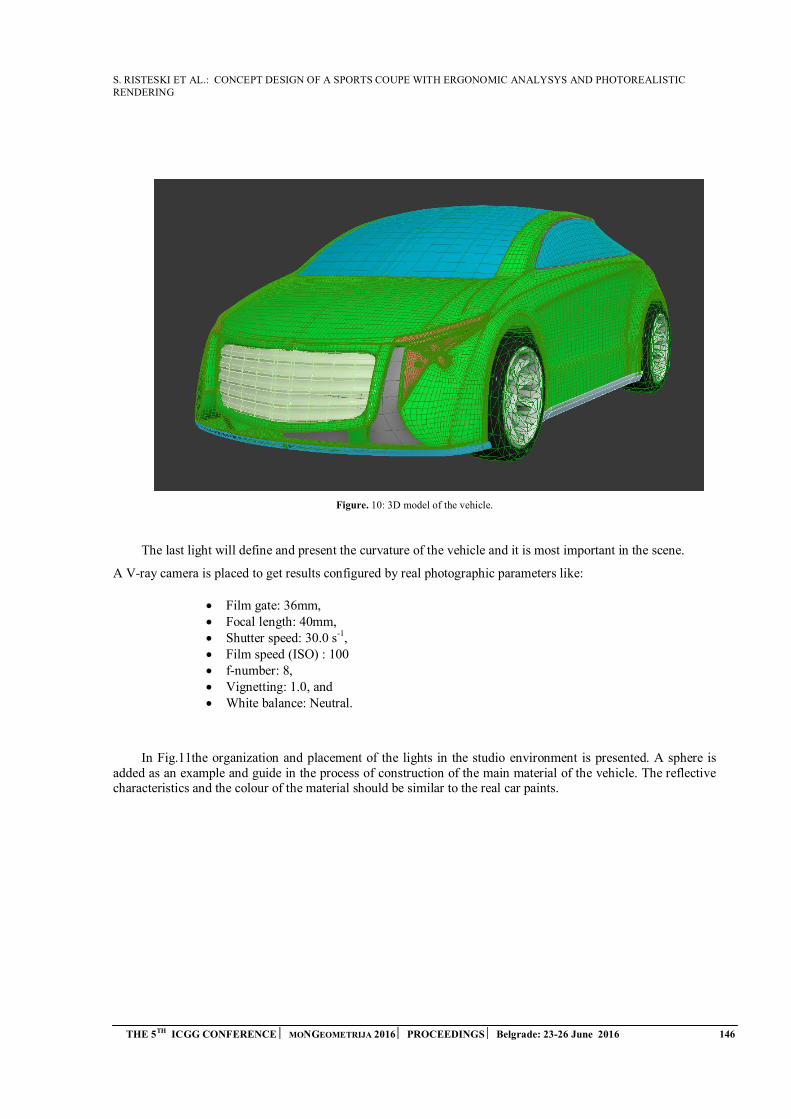
S. RISTESKI ET AL.: CONCEPT DESIGN OF A SPORTS COUPE WITH ERGONOMIC ANALYSYS AND PHOTOREALISTIC RENDERING
THE 5TH ICGG CONFERENCE MONGEOMETRIJA 2016 PROCEEDINGS Belgrade: 23-26 June 2016 146
Figure. 10: 3D model of the vehicle.
The last light will define and present the curvature of the vehicle and it is most important in the scene.
A V-ray camera is placed to get results configured by real photographic parameters like:
Film gate: 36mm, Focal length: 40mm, Shutter speed: 30.0 s-1, Film speed (ISO) : 100 f-number: 8, Vignetting: 1.0, and White balance: Neutral.
In Fig.11the organization and placement of the lights in the studio environment is presented. A sphere is added as an example and guide in the process of construction of the main material of the vehicle. The reflective characteristics and the colour of the material should be similar to the real car paints.

S. RISTESKI ET AL.: CONCEPT DESIGN OF A SPORTS COUPE WITH ERGONOMIC ANALYSYS AND PHOTOREALISTIC RENDERING
147 THE 5TH ICGG CONFERENCE MONGEOMETRIJA 2016 PROCEEDINGS Belgrade: 23-26 June 2016
Figure. 11: Position of lights in the scene using a test element - sphere.
After the determination of the position of the lights, a first test render s conducted using the selected material and lighting. The result of the render is presented in Fig. 12.
Figure. 12: Test render of the material and lighting.
After the final tweaks of some of the parameters and acquiring the desired render quality, the test element is substituted with the modelled vehicle. Using the same configured materials and lighting a render is created (Fig. 13, 14 and 15). In Fig. 16 and 17 a render using the same characteristics is presented, only this time in different colour of the material.
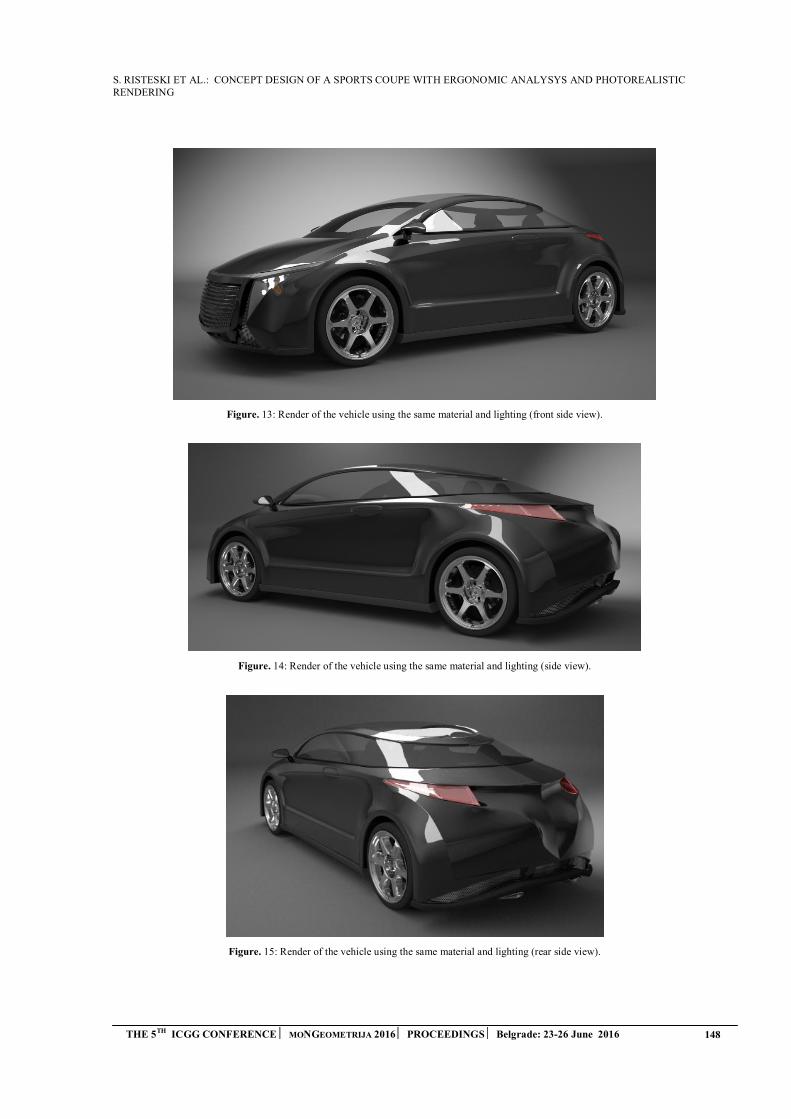
S. RISTESKI ET AL.: CONCEPT DESIGN OF A SPORTS COUPE WITH ERGONOMIC ANALYSYS AND PHOTOREALISTIC RENDERING
THE 5TH ICGG CONFERENCE MONGEOMETRIJA 2016 PROCEEDINGS Belgrade: 23-26 June 2016 148
Figure. 13: Render of the vehicle using the same material and lighting (front side view).
Figure. 14: Render of the vehicle using the same material and lighting (side view).
Figure. 15: Render of the vehicle using the same material and lighting (rear side view).
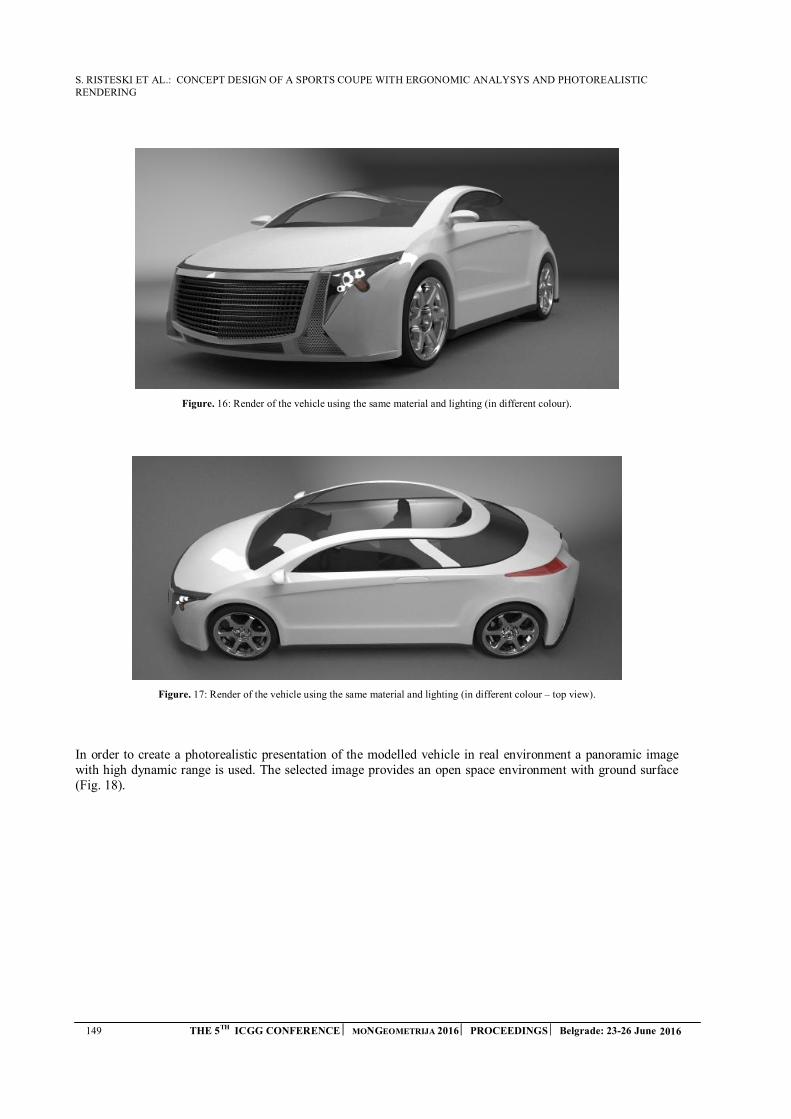
S. RISTESKI ET AL.: CONCEPT DESIGN OF A SPORTS COUPE WITH ERGONOMIC ANALYSYS AND PHOTOREALISTIC RENDERING
149 THE 5TH ICGG CONFERENCE MONGEOMETRIJA 2016 PROCEEDINGS Belgrade: 23-26 June 2016
Figure. 16: Render of the vehicle using the same material and lighting (in different colour).
Figure. 17: Render of the vehicle using the same material and lighting (in different colour – top view).
In order to create a photorealistic presentation of the modelled vehicle in real environment a panoramic image with high dynamic range is used. The selected image provides an open space environment with ground surface (Fig. 18).
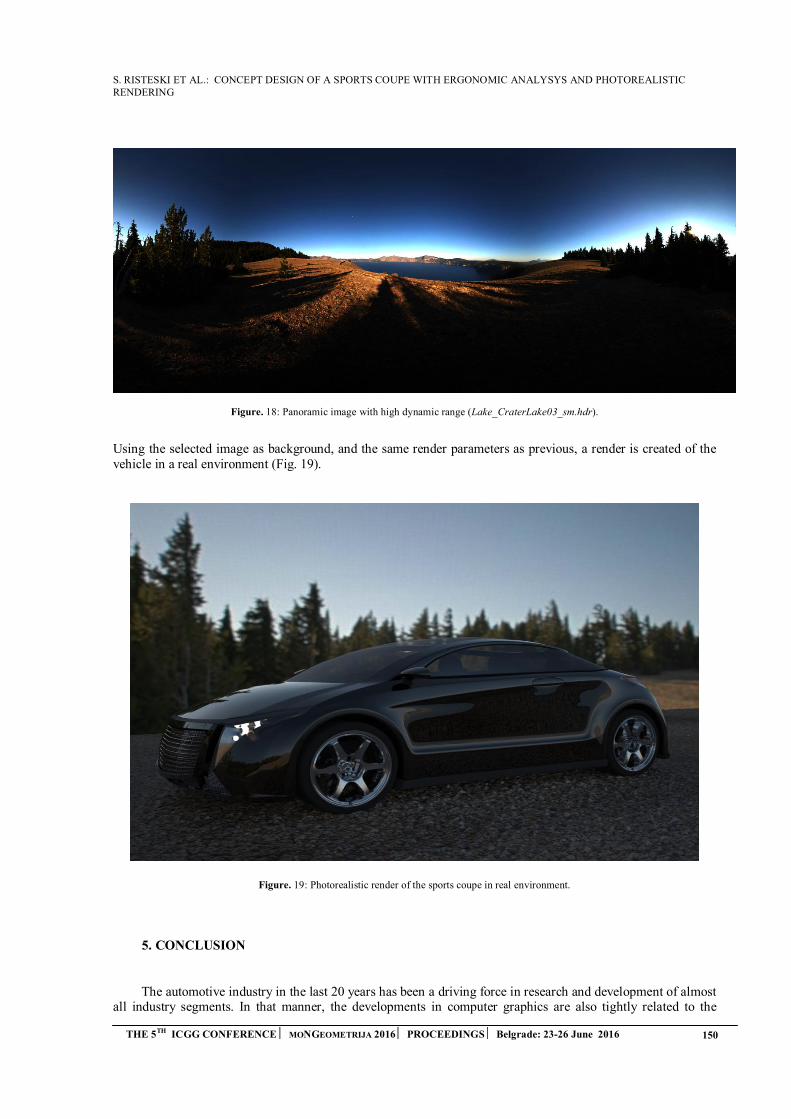
S. RISTESKI ET AL.: CONCEPT DESIGN OF A SPORTS COUPE WITH ERGONOMIC ANALYSYS AND PHOTOREALISTIC RENDERING
THE 5TH ICGG CONFERENCE MONGEOMETRIJA 2016 PROCEEDINGS Belgrade: 23-26 June 2016 150
Figure. 18: Panoramic image with high dynamic range (Lake_CraterLake03_sm.hdr).
Using the selected image as background, and the same render parameters as previous, a render is created of the vehicle in a real environment (Fig. 19).
Figure. 19: Photorealistic render of the sports coupe in real environment.
5. CONCLUSION
The automotive industry in the last 20 years has been a driving force in research and development of almost all industry segments. In that manner, the developments in computer graphics are also tightly related to the
S. RISTESKI ET AL.: CONCEPT DESIGN OF A SPORTS COUPE WITH ERGONOMIC ANALYSYS AND PHOTOREALISTIC RENDERING
151 THE 5TH ICGG CONFERENCE MONGEOMETRIJA 2016 PROCEEDINGS Belgrade: 23-26 June 2016
advancements of the automotive industry. This paper presents the concept design of a sports coupe with ergonomic analysis and photorealistic rendering. The paper presents the process of development of a concept vehicle while explaining the key elements of the sports coupe vehicle segment. In order to come up with a concept design that will satisfy the needs of the passengers and the safety requirements of the automotive industry, a comprehensive ergonomic analysis has been conducted. After concluding the design of the concept sports coupe, the paper presents the process of creating a photorealistic representation.
The automotive industry is based on the principal of balance and harmony between the function and the shape. The cars have to fulfil the needs and expectations of the buyers, by providing smaller volume, multi-functionality, durability, environmentally acceptable, aesthetically attractive and in a price that is affordable on the market.
REFERENCES
1. Zamri Mohamed, Rosnah Mohd Yusuff (2007), Automotive Ergonomics: Passenger Cars InteriorDimension Parameters and Comfort, International Conference On Ergonomics ICE2007, UniversityMalaya, Kuala Lumpur, pp.1-4.
2. Chaffin, D. (2001). Introduction in Digital human modelling for vehicle and workplace design (Ed. D.Chaffin), Society of Automotive Engineers, Inc, Warrendale, USA, pp. 1-14.
3. Quattrocolo, S., Gario, R., and Pizzoni, R. (2002), 3D human and vehicle model for driver andoccupants posture prediction and comfort evaluation, In Proceedings of Digital Human ModellingConference, Munich, Germany, pp. 485-492.
4. Dagmar Kern, Albrecht Schmidt, (2009), Design Space for Driver-based Automotive User Interfaces,Proceedings of the First International Conference on Automotive User Interfaces and InteractiveVehicular Applications (AutomotiveUI 2009), Essen, Germany, pp. 3-10.
5. Pere Brunet, Frederik W. Jansen, (1994), Photorealistic Rendering in Computer Graphics,Proceedings of the Second Eurographics Workshop on Rendering (Focus on Computer Graphics) 4thEdition, Originally published by Springer-Verlag Berlin Heidelberg, New York, USA.
P. PEJIĆ ET AL.: CONTEMPORARY APPROACH IN TRADITIONAL ARCHITECTURAL PROJECT PRESENTATION
CONTEMPORARY APPROACH IN TRADITIONAL ARCHITECTURAL PROJECT PRESENTATION - CASE STUDY OF
MH PETRA
Petar Pejić
Department of Visual Communications, University of Niš, Faculty of Civil Engineering and Architecture, Republic of Serbia
Teaching assistant, [email protected]
Sonja Krasić
Department of Visual Communications, University of Niš, Faculty of Civil Engineering and Architecture, Republic of Serbia
PhD., Associate Professor, [email protected]
Milica Veljković
Department of Visual Communications, University of Niš, Faculty of Civil Engineering and Architecture, Republic of Serbia
Teaching assistant, [email protected]
Srđan Sakan
University of Niš, Faculty of Civil Engineering and Architecture, Republic of Serbia M.Arch., [email protected]
ABSTRACT The traditional method of architectural project presentations involves the use of a printed
poster or elaborate on which the building is presented by using of two-dimensional drawings and images. The main traditional approach problem is the presentation of three-dimensional space on two-dimensional paper. For a better understanding it is necessary to present three-dimensional spatial models of the building or part of a building. The development of smart portable devices with special sensors and greater processing power and contemporary methods of augmented and virtual reality motivated authors to investigate possibilities of their applications in architectural presentations.
The main focus of this paper is the development of modern, portable systems for architectural project presentations which will be presented on a case study of “MH Petra” house. For this purpose a method of virtual and augmented reality is used for upgrading traditional printed catalogue of “MH Petra” project. In this research method of augmented reality is used for presentation of 3D model, animations and as a trigger for virtual reality presentation.
Created system for presentation of architectural project of “MH Petra” house does not aim to substitute traditional methods and systems of presentations, it upgrades presentation using contemporary technology. This approach enables easier and better understanding of all types of architectural objects and urban complex, allowing the user intuitive spatial overview of architectural work.
Keywords: Computer graphics; Virtual Reality; Augmented Reality; Architectural projects.
THE 5TH ICGG CONFERENCE MONGEOMETRIJA 2016 PROCEEDINGS Belgrade: 23-26 June 2016 152
P. PEJIĆ ET AL.: CONTEMPORARY APPROACH IN TRADITIONAL ARCHITECTURAL PROJECT PRESENTATION
1. INTRODUCTION
The traditional method of architectural project presentations involves the use of a printed poster or elaborate on which the building is presented by using of two-dimensional drawings and images [1]. The main traditional approach problem is the presentation of three-dimensional space on two-dimensional paper. This is possible only by using photo realistic render of building 3D model and presentation as a perspective image.
Beside the presentation on printed media, it is possible to present architectural projects in digital form, using different kind of appropriate hardware and software combination. In this case most often the presentation of future building look is done using perspective images and video animations. This type of presentation is limited in terms of the freedom to choose the viewing angle. In perspective images and videos the angles predetermined by the author are displayed and there is no possibility for the user to change them. Therefore, it is often impossible to view the entire facility from all angles and in particular to view the most interesting details [1].
For a better understanding of project it is necessary to present three-dimensional spatial models of the building or part of a building in the way where the user can choose what to see. This is possible to achieve using methods of Virtual or Augmented Reality for presentation of 3D building model.
Virtual Reality can be defined as “A human-computer interface in which the computer creates a sensory immersing environment that interactively responds to and is controlled by the behaviour of the user” [2]. In case of architectural project presentation this mean that user can interact inside of a virtual environment and choose which part of the building want to see. Problem with Virtual Reality presentation is need for higher-quality hardware and specific software because of the manipulation of 3D content. The downside compared to the presentation of prospective images and videos is the need for prior knowledge in the field of 3D content manipulation [1]. Previewing of Virtual Reality can be made simpler for user by addition of specific sensors which can track user movement and made the experience more intuitive. This approach made Virtual Reality system more complex and require greater processing power to handle operations in real time. The commercially most popular approach for the presentation of three-dimensional architectural content this day is: 3D web based services like “3D warehouse” [3] and “Sketchfab” [4]; and application based on Had Mounted Displays like “Oculus Rift” [5], “HTC Vive” [6] and “Samsung Gear VR” [7].
Augmented Reality is an emerging computer technology where the perception of the user is enhanced by the seamless blending between a realistic environment and computer-generated virtual objects coexisting in the same space [8]. The resulting mixture supplements reality, rather than replacing it [9]. According to Azuma [10], Augmented Reality represent a variation of Virtual Environments, or Virtual Reality as it is more commonly called. In these so called Virtual Reality the user is completely surrounded by a synthetic environment. In that state, the user can not perceive the real world and the real environment that surrounds him. On the contrary, the Augmented Reality allows the user to perceive the real world while the virtual elements are superimposed upon or composited with the real world [11]. In this manner, the Augmented Reality is enriching user’s perception of the reality rather than totally replacing it like in the case of the Virtual Reality. The ultimate goal of the Augmented Reality is to convince the user that the two environments, real and virtual, coexist.
Augmented Reality presentation of architectural projects is completely intuitive and does not require any kind of foreknowledge. Basic IT knowledge is enough to preview 3D model of the building from all angles using an adequate combination of hardware and software. The biggest problem represent need for most demanding hardware. Besides the basic components Augmented Reality system must have at least a camera, whereas it is desirable, because of the presentation stability, that it additionally has a gyroscope, an accelerometer and an electronic compass. The complexity and elaborateness of 3D models directly affect the complexity of the necessary calculations and the need for hardware with higher processing power [1].
The focus of this paper is a comparison of traditional and contemporary architecture project presentation through a case study of “MH Petra” house project. Paper present traditional printed project with technical drawings and rendered visualisation and possibility for upgrading it by using contemporary portable devices and methods of Virtual and Augmented Reality. Created system for presentation of architectural project of “MH Petra” house does not aim to substitute traditional methods of presentations, it upgrades presentation using contemporary technology. This approach enables easier and better understanding of all types of architectural objects and urban complex, allowing the user intuitive spatial overview of architectural work.
153 THE 5TH ICGG CONFERENCE MONGEOMETRIJA 2016 PROCEEDINGS Belgrade: 23-26 June 2016
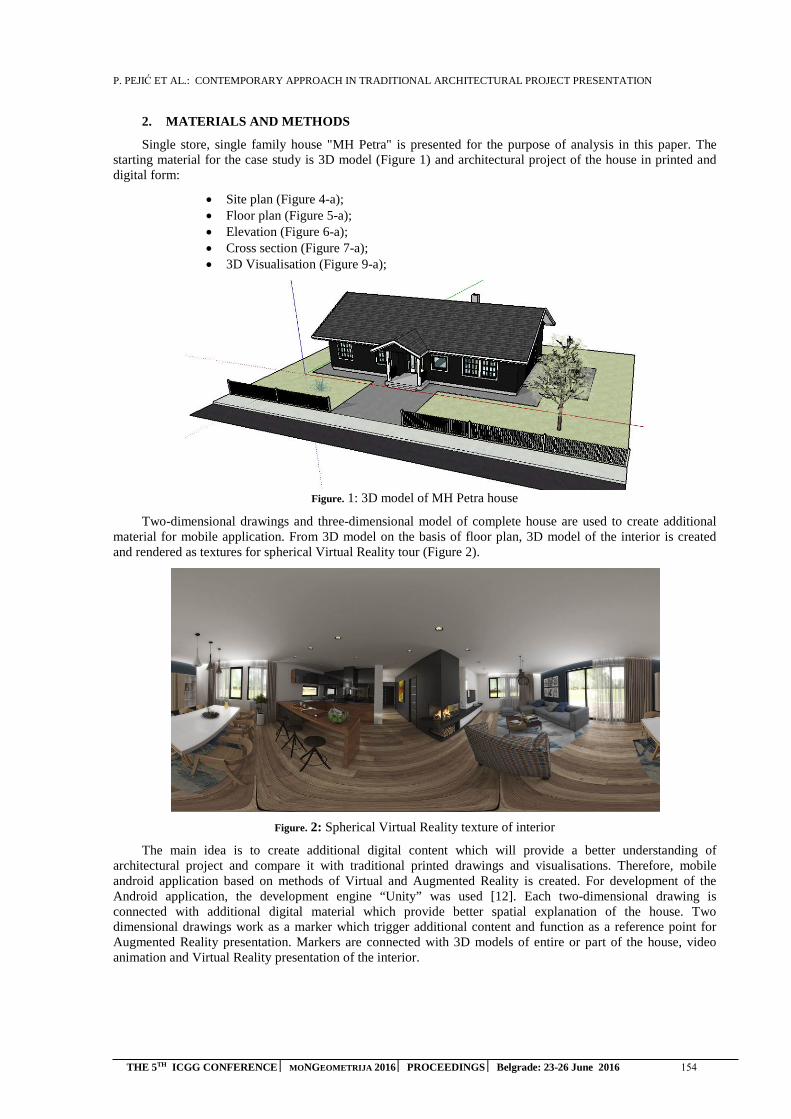
P. PEJIĆ ET AL.: CONTEMPORARY APPROACH IN TRADITIONAL ARCHITECTURAL PROJECT PRESENTATION
2. MATERIALS AND METHODS
Single store, single family house "MH Petra" is presented for the purpose of analysis in this paper. The starting material for the case study is 3D model (Figure 1) and architectural project of the house in printed and digital form:
• Site plan (Figure 4-a);• Floor plan (Figure 5-a);• Elevation (Figure 6-a);• Cross section (Figure 7-a);• 3D Visualisation (Figure 9-a);
Figure. 1: 3D model of MH Petra house
Two-dimensional drawings and three-dimensional model of complete house are used to create additional material for mobile application. From 3D model on the basis of floor plan, 3D model of the interior is created and rendered as textures for spherical Virtual Reality tour (Figure 2).
Figure. 2: Spherical Virtual Reality texture of interior
The main idea is to create additional digital content which will provide a better understanding of architectural project and compare it with traditional printed drawings and visualisations. Therefore, mobile android application based on methods of Virtual and Augmented Reality is created. For development of the Android application, the development engine “Unity” was used [12]. Each two-dimensional drawing is connected with additional digital material which provide better spatial explanation of the house. Two dimensional drawings work as a marker which trigger additional content and function as a reference point for Augmented Reality presentation. Markers are connected with 3D models of entire or part of the house, video animation and Virtual Reality presentation of the interior.
THE 5TH ICGG CONFERENCE MONGEOMETRIJA 2016 PROCEEDINGS Belgrade: 23-26 June 2016 154
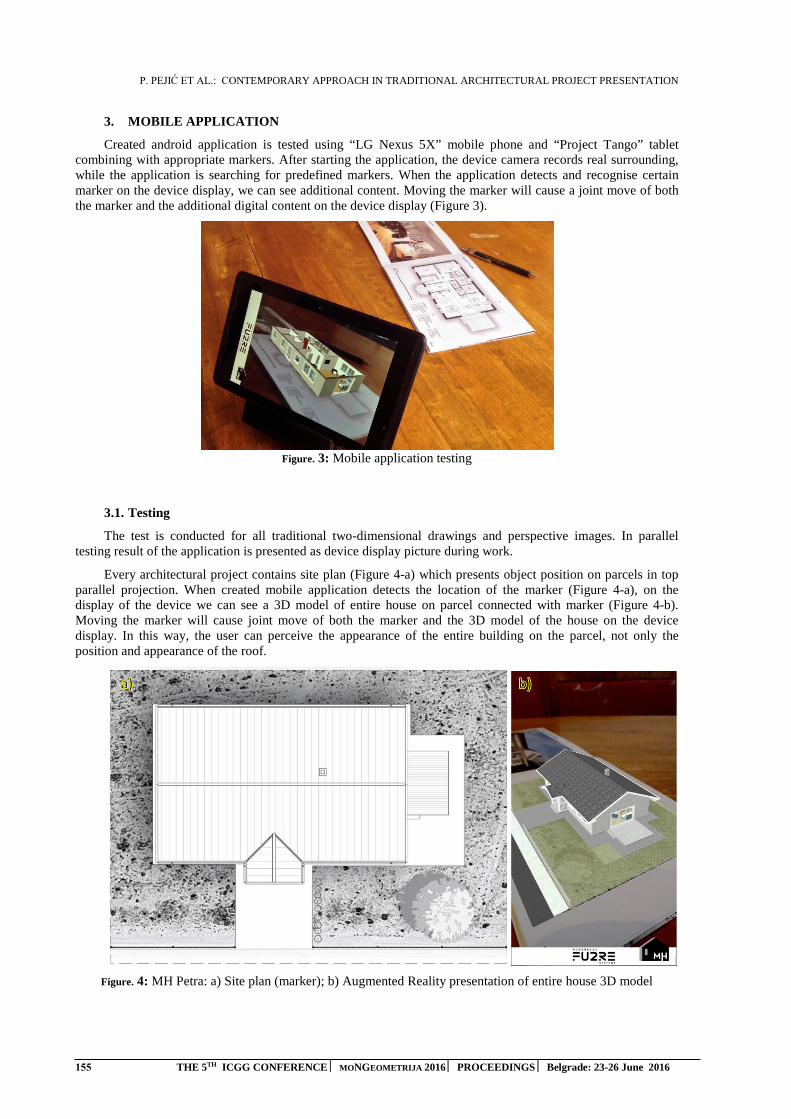
P. PEJIĆ ET AL.: CONTEMPORARY APPROACH IN TRADITIONAL ARCHITECTURAL PROJECT PRESENTATION
3. MOBILE APPLICATION
Created android application is tested using “LG Nexus 5X” mobile phone and “Project Tango” tablet combining with appropriate markers. After starting the application, the device camera records real surrounding, while the application is searching for predefined markers. When the application detects and recognise certain marker on the device display, we can see additional content. Moving the marker will cause a joint move of both the marker and the additional digital content on the device display (Figure 3).
Figure. 3: Mobile application testing
3.1. Testing
The test is conducted for all traditional two-dimensional drawings and perspective images. In parallel testing result of the application is presented as device display picture during work.
Every architectural project contains site plan (Figure 4-a) which presents object position on parcels in top parallel projection. When created mobile application detects the location of the marker (Figure 4-a), on the display of the device we can see a 3D model of entire house on parcel connected with marker (Figure 4-b). Moving the marker will cause joint move of both the marker and the 3D model of the house on the device display. In this way, the user can perceive the appearance of the entire building on the parcel, not only the position and appearance of the roof.
Figure. 4: MH Petra: a) Site plan (marker); b) Augmented Reality presentation of entire house 3D model
155 THE 5TH ICGG CONFERENCE MONGEOMETRIJA 2016 PROCEEDINGS Belgrade: 23-26 June 2016
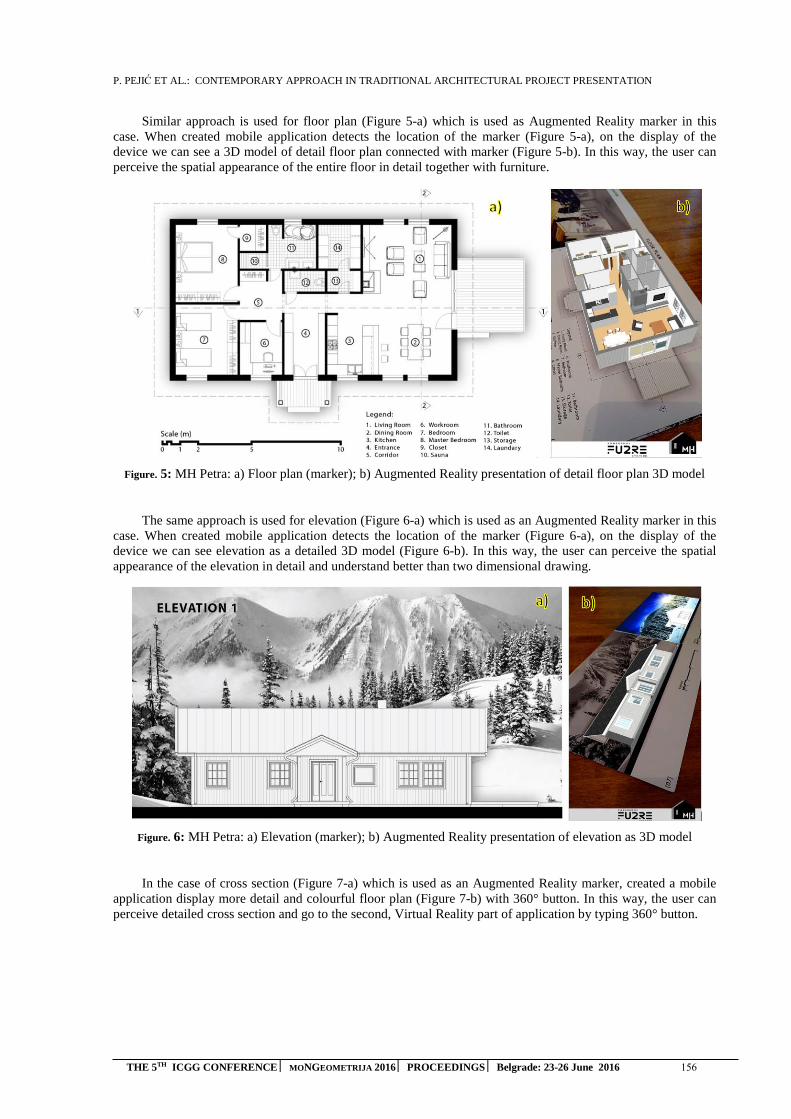
P. PEJIĆ ET AL.: CONTEMPORARY APPROACH IN TRADITIONAL ARCHITECTURAL PROJECT PRESENTATION
Similar approach is used for floor plan (Figure 5-a) which is used as Augmented Reality marker in this case. When created mobile application detects the location of the marker (Figure 5-a), on the display of the device we can see a 3D model of detail floor plan connected with marker (Figure 5-b). In this way, the user can perceive the spatial appearance of the entire floor in detail together with furniture.
Figure. 5: MH Petra: a) Floor plan (marker); b) Augmented Reality presentation of detail floor plan 3D model
The same approach is used for elevation (Figure 6-a) which is used as an Augmented Reality marker in this case. When created mobile application detects the location of the marker (Figure 6-a), on the display of the device we can see elevation as a detailed 3D model (Figure 6-b). In this way, the user can perceive the spatial appearance of the elevation in detail and understand better than two dimensional drawing.
Figure. 6: MH Petra: a) Elevation (marker); b) Augmented Reality presentation of elevation as 3D model
In the case of cross section (Figure 7-a) which is used as an Augmented Reality marker, created a mobile application display more detail and colourful floor plan (Figure 7-b) with 360° button. In this way, the user can perceive detailed cross section and go to the second, Virtual Reality part of application by typing 360° button.
THE 5TH ICGG CONFERENCE MONGEOMETRIJA 2016 PROCEEDINGS Belgrade: 23-26 June 2016 156
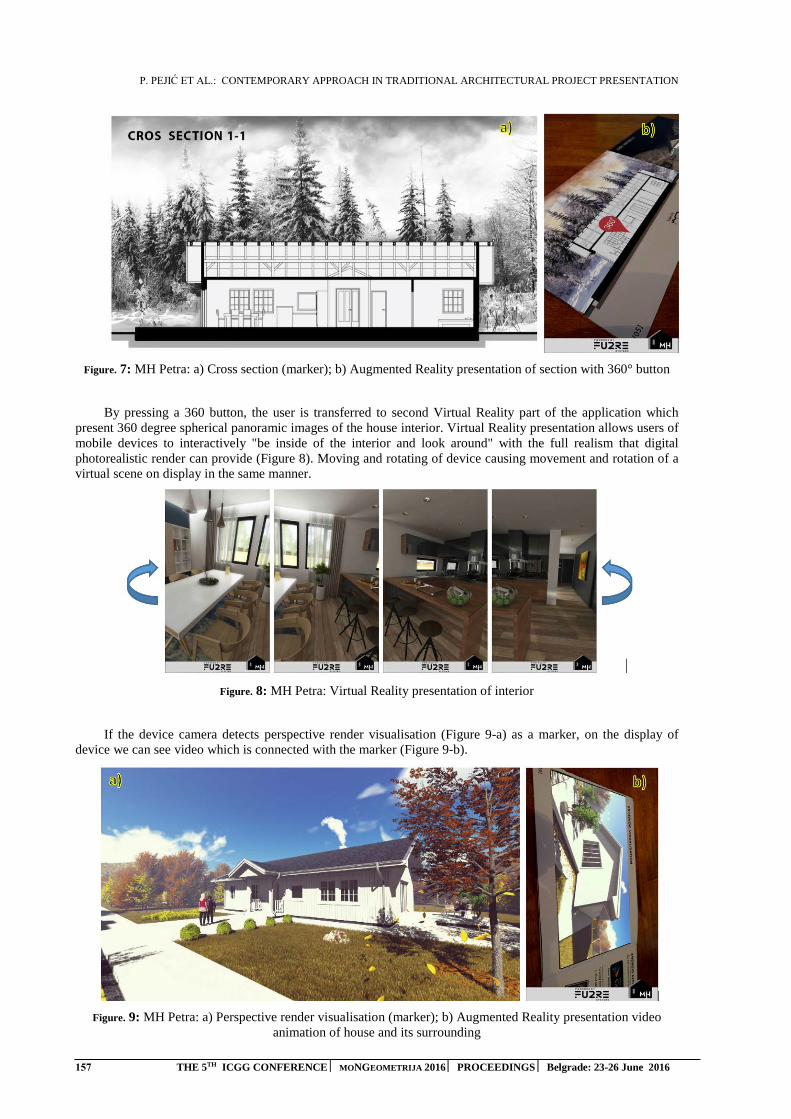
P. PEJIĆ ET AL.: CONTEMPORARY APPROACH IN TRADITIONAL ARCHITECTURAL PROJECT PRESENTATION
Figure. 7: MH Petra: a) Cross section (marker); b) Augmented Reality presentation of section with 360° button
By pressing a 360 button, the user is transferred to second Virtual Reality part of the application which present 360 degree spherical panoramic images of the house interior. Virtual Reality presentation allows users of mobile devices to interactively "be inside of the interior and look around" with the full realism that digital photorealistic render can provide (Figure 8). Moving and rotating of device causing movement and rotation of a virtual scene on display in the same manner.
Figure. 8: MH Petra: Virtual Reality presentation of interior
If the device camera detects perspective render visualisation (Figure 9-a) as a marker, on the display of device we can see video which is connected with the marker (Figure 9-b).
Figure. 9: MH Petra: a) Perspective render visualisation (marker); b) Augmented Reality presentation video animation of house and its surrounding
157 THE 5TH ICGG CONFERENCE MONGEOMETRIJA 2016 PROCEEDINGS Belgrade: 23-26 June 2016
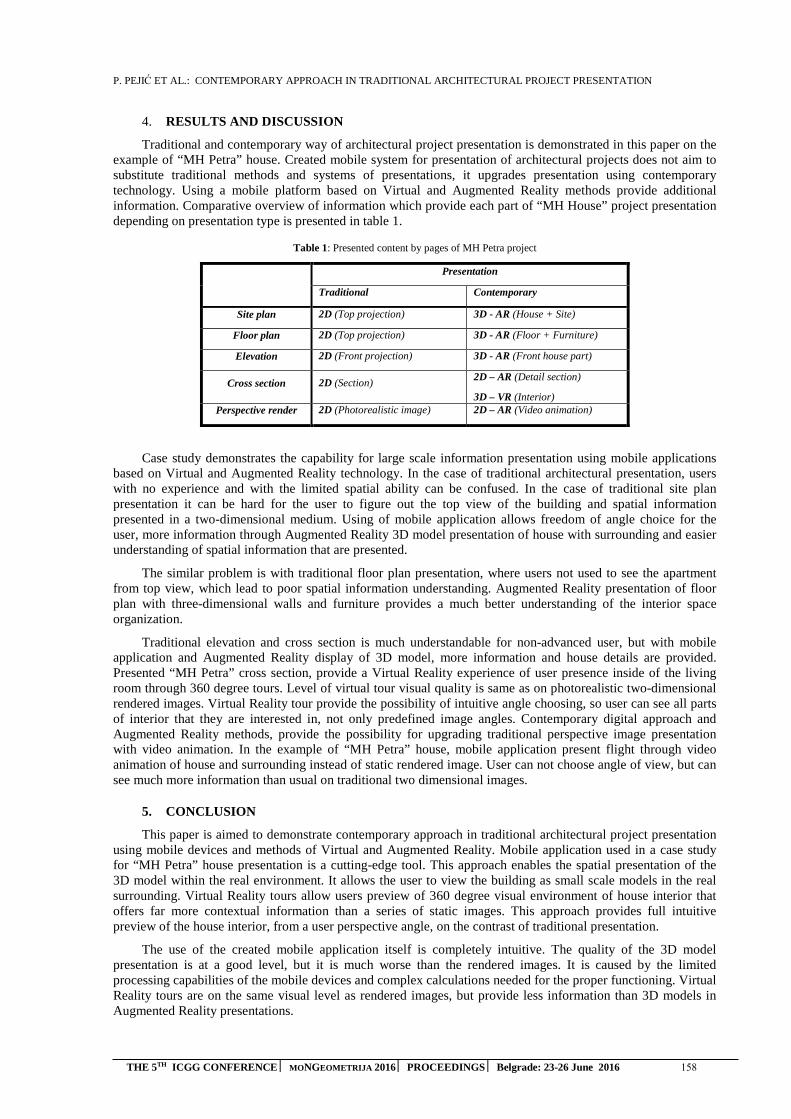
P. PEJIĆ ET AL.: CONTEMPORARY APPROACH IN TRADITIONAL ARCHITECTURAL PROJECT PRESENTATION
4. RESULTS AND DISCUSSION
Traditional and contemporary way of architectural project presentation is demonstrated in this paper on the example of “MH Petra” house. Created mobile system for presentation of architectural projects does not aim to substitute traditional methods and systems of presentations, it upgrades presentation using contemporary technology. Using a mobile platform based on Virtual and Augmented Reality methods provide additional information. Comparative overview of information which provide each part of “MH House” project presentation depending on presentation type is presented in table 1.
Table 1: Presented content by pages of MH Petra project
Presentation
Traditional Contemporary
Site plan 2D (Top projection) 3D - AR (House + Site)
Floor plan 2D (Top projection) 3D - AR (Floor + Furniture)
Elevation 2D (Front projection) 3D - AR (Front house part)
Cross section 2D (Section) 2D – AR (Detail section)
3D – VR (Interior) Perspective render 2D (Photorealistic image) 2D – AR (Video animation)
Case study demonstrates the capability for large scale information presentation using mobile applications based on Virtual and Augmented Reality technology. In the case of traditional architectural presentation, users with no experience and with the limited spatial ability can be confused. In the case of traditional site plan presentation it can be hard for the user to figure out the top view of the building and spatial information presented in a two-dimensional medium. Using of mobile application allows freedom of angle choice for the user, more information through Augmented Reality 3D model presentation of house with surrounding and easier understanding of spatial information that are presented.
The similar problem is with traditional floor plan presentation, where users not used to see the apartment from top view, which lead to poor spatial information understanding. Augmented Reality presentation of floor plan with three-dimensional walls and furniture provides a much better understanding of the interior space organization.
Traditional elevation and cross section is much understandable for non-advanced user, but with mobile application and Augmented Reality display of 3D model, more information and house details are provided. Presented “MH Petra” cross section, provide a Virtual Reality experience of user presence inside of the living room through 360 degree tours. Level of virtual tour visual quality is same as on photorealistic two-dimensional rendered images. Virtual Reality tour provide the possibility of intuitive angle choosing, so user can see all parts of interior that they are interested in, not only predefined image angles. Contemporary digital approach and Augmented Reality methods, provide the possibility for upgrading traditional perspective image presentation with video animation. In the example of “MH Petra” house, mobile application present flight through video animation of house and surrounding instead of static rendered image. User can not choose angle of view, but can see much more information than usual on traditional two dimensional images.
5. CONCLUSION
This paper is aimed to demonstrate contemporary approach in traditional architectural project presentation using mobile devices and methods of Virtual and Augmented Reality. Mobile application used in a case study for “MH Petra” house presentation is a cutting-edge tool. This approach enables the spatial presentation of the 3D model within the real environment. It allows the user to view the building as small scale models in the real surrounding. Virtual Reality tours allow users preview of 360 degree visual environment of house interior that offers far more contextual information than a series of static images. This approach provides full intuitive preview of the house interior, from a user perspective angle, on the contrast of traditional presentation.
The use of the created mobile application itself is completely intuitive. The quality of the 3D model presentation is at a good level, but it is much worse than the rendered images. It is caused by the limited processing capabilities of the mobile devices and complex calculations needed for the proper functioning. Virtual Reality tours are on the same visual level as rendered images, but provide less information than 3D models in Augmented Reality presentations.
THE 5TH ICGG CONFERENCE MONGEOMETRIJA 2016 PROCEEDINGS Belgrade: 23-26 June 2016 158

P. PEJIĆ ET AL.: CONTEMPORARY APPROACH IN TRADITIONAL ARCHITECTURAL PROJECT PRESENTATION
Use of Virtual and Augmented Reality methods in architectural project presentations is very positive for users with no experience and with the limited spatial ability. It provides a better understanding of architectural structures because the user can choose which part of the structure and from which point of view of the architectural structure he/she wants to see completely intuitively.
Future research should cover practical testing with a larger group of all types of users with and without experiences in order to quantitatively measure impact of contemporary Virtual and Augmented Reality methods applications in architectural project presentations.
REFERENCES
1. Pejić, P., Krasić, S. and Jovanović, N., 2014. The application of augmented reality in the presentationof existing architectural facilities, International conference MoNGeometrija 2014, Vlasina, Serbia,Proceedings Volume 1. pp 74-81.
2. Wael, A. A., 2013. Virtual Reality Use in Architectural Design Studios: A case of studying structureand construction, Procedia Computer Science, Elsevier, Volume 25. pp 220-230.
3. 3D Warehouse, 2016. https://3dwarehouse.sketchup.com/ [Accessed: 2. April 2016.].
4. Sketchfab, 2016. https://sketchfab.com/ [Accessed: 2. April 2016.].
5. Oculus Rift, https://www.oculus.com/en-us/ 2016. [Accessed: 2. April 2016.].
6. HTC Vive, https://www.htcvive.com/us/ 2016. [Accessed: 2. April 2016.].
7. Samsung Gear VR, 2016. http://www.samsung.com/global/galaxy/wearables/gear-vr/ [Accessed: 2.April 2016.].
8. Pejić, P., Rizov, T., Krasić, S. and Taševski R., 2015. Presentation of Existing Architectural ObjectsUsing Augmented Reality: Case study - Ada Bridge, Belgrade, Serbia, South East European Journalof Architecture and Design, Volume 2015; Article ID 10011, Skopje. pp 1-4.
9. Pejić, P., Krasić, S., Petković, D. and Veljković, M., 2015. Application of augmented reality in facaderedesign presentation. Journal of Industrial Design and Engineering Grapphics 10(4). pp 45-49.
10. Azuma, R., 1997. A Survey of Augmented Reality, Teleoperators and Virtual Environment. pp 355-385.
11. Ivan, E. S., 1968. A head-mounted three dimensional display. In Proceedings of the December 9-11,1968, fall joint computer conference, part I. ACM, New York, NY, USA. pp 757-764.
12. Unity, https://unity3d.com/ [Accessed: 8. April 2016.].
159 THE 5TH ICGG CONFERENCE MONGEOMETRIJA 2016 PROCEEDINGS Belgrade: 23-26 June 2016
M. PETROVIĆ ET AL.: CURVE FITTING BY MULTIFOCAL ELLIPSES IN ARCHITECTURAL STRUCTURES GEOMETRY
THE 5TH ICGG CONFERENCE MONGEOMETRIJA 2016 PROCEEDINGS Belgrade: 23-26 June 2016 160
CURVE FITTING BY MULTIFOCAL ELLIPSES IN ARCHITECTURAL STRUCTURES GEOMETRY
Maja Petrović
University of Belgrade - Faculty of Transport and Traffic Engineering, Belgrade, Serbia
MSc., Assistant, [email protected]
Bojan Banjac
University of Novi Sad - Faculty of Technical Sciences, Novi Sad, Serbia MSc., Assistant, Student of PhD studies at Faculty of Electrical Engineering, University of Belgrade, Belgrade, Serbia
MSc., Assistant, [email protected]
Branko Malešević
University of Belgrade - Faculty of Electrical Engineering, Belgrade, Serbia
PhD., Associate Professor, [email protected]
Radomir Mijailović
University of Belgrade - Faculty of Transport and Traffic Engineering, Belgrade, Serbia
PhD., Full Professor, [email protected]
ABSTRACT
In this paper are considered some properties of multifocal ellipses and their role in curve fitting. Two-focal ellipse is just one of the well-known curves with applications in architectural structures geometry whose geometrical form is already used in design of floor plan or typical elevation of architectural objects. By use of computer, comparative analysis of shapes of the multifocal curves and contours of plans or elevations of some architectural objects was conducted. Results of analysis are used to determine quality of approximations. Diversity of shapes of the curves allows computer application to find such parameters of curve that approximate ovoid contours with least deviation. For assessment of quality of considered approximations shall be used coefficient of determination.
Keywords: Curve fitting; Multifocal ellipse; Coefficient of determination
1. GENERAL INFORMATION
A scientific area of this research is on design problem in architecture (Duvernoy and Rosin, 2006). Question raised among many researchers is whether contours of architectural objects can be described by known math curves. Barrallo (2011) had opinion that since ancient times, ovals and ellipses have been used to design floor plans and enclosed spaces (Barrallo, 2011). Ziebart et al. (2007) asked following question: "Did the geometrical pattern of these walls conform to an elliptical shape, or to one constructed from a set of interlocking ellipses, or some other pattern?". Petrović et al. (2011) considered the similar problem of the newer architectural structures.
By researching the different types of architectural structures, it can be concluded that 2-focal ellipse may be useful for design of floor plan or typical elevation of architectural objects. It makes sense to ask the question whether another curve could be better choice. We have tried with multifocal ellipses. The coefficient of determination has been used for assessment of quality of considered approximations. The main idea of this paper is to suggest methodology for determining optimal multifocal curve for some architectural object under some assumptions.
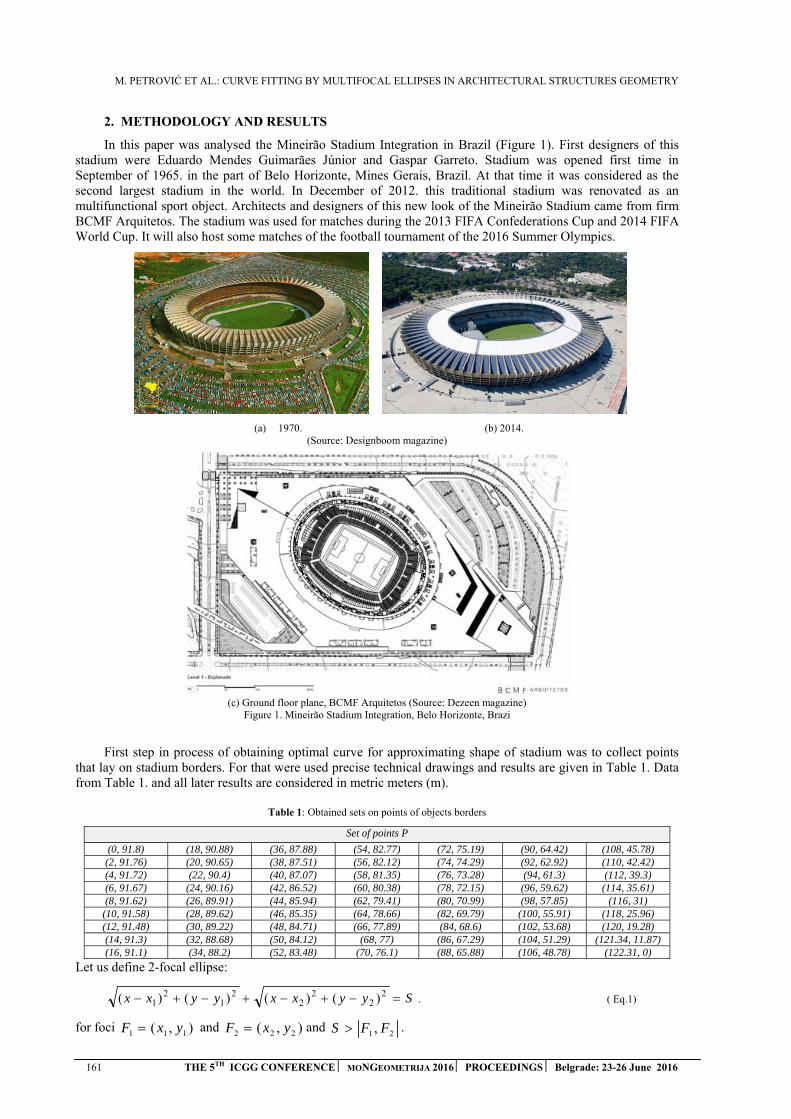
M. PETROVIĆ ET AL.: CURVE FITTING BY MULTIFOCAL ELLIPSES IN ARCHITECTURAL STRUCTURES GEOMETRY
161 THE 5TH ICGG CONFERENCE MONGEOMETRIJA 2016 PROCEEDINGS Belgrade: 23-26 June 2016
2. METHODOLOGY AND RESULTS
In this paper was analysed the Mineirão Stadium Integration in Brazil (Figure 1). First designers of this stadium were Eduardo Mendes Guimarães Júnior and Gaspar Garreto. Stadium was opened first time in September of 1965. in the part of Belo Horizonte, Mines Gerais, Brazil. At that time it was considered as the second largest stadium in the world. In December of 2012. this traditional stadium was renovated as an multifunctional sport object. Architects and designers of this new look of the Mineirão Stadium came from firm BCMF Arquitetos. The stadium was used for matches during the 2013 FIFA Confederations Cup and 2014 FIFA World Cup. It will also host some matches of the football tournament of the 2016 Summer Olympics.
(a) 1970. (b) 2014. (Source: Designboom magazine)
(c) Ground floor plane, BCMF Arquitetos (Source: Dezeen magazine) Figure 1. Mineirão Stadium Integration, Belo Horizonte, Brazi
First step in process of obtaining optimal curve for approximating shape of stadium was to collect points that lay on stadium borders. For that were used precise technical drawings and results are given in Table 1. Data from Table 1. and all later results are considered in metric meters (m).
Table 1: Obtained sets on points of objects borders
Set of points P
(0, 91.8) (18, 90.88) (36, 87.88) (54, 82.77) (72, 75.19) (90, 64.42) (108, 45.78) (2, 91.76) (20, 90.65) (38, 87.51) (56, 82.12) (74, 74.29) (92, 62.92) (110, 42.42) (4, 91.72) (22, 90.4) (40, 87.07) (58, 81.35) (76, 73.28) (94, 61.3) (112, 39.3) (6, 91.67) (24, 90.16) (42, 86.52) (60, 80.38) (78, 72.15) (96, 59.62) (114, 35.61) (8, 91.62) (26, 89.91) (44, 85.94) (62, 79.41) (80, 70.99) (98, 57.85) (116, 31)
(10, 91.58) (28, 89.62) (46, 85.35) (64, 78.66) (82, 69.79) (100, 55.91) (118, 25.96) (12, 91.48) (30, 89.22) (48, 84.71) (66, 77.89) (84, 68.6) (102, 53.68) (120, 19.28) (14, 91.3) (32, 88.68) (50, 84.12) (68, 77) (86, 67.29) (104, 51.29) (121.34, 11.87) (16, 91.1) (34, 88.2) (52, 83.48) (70, 76.1) (88, 65.88) (106, 48.78) (122.31, 0)
Let us define 2-focal ellipse:
Syyxxyyxx 22
22
21
21 )()()()( . ( Eq.1)
for foci 1 1 1( , )F x y and 2 2 2( , )F x y and 1 2,S F F .
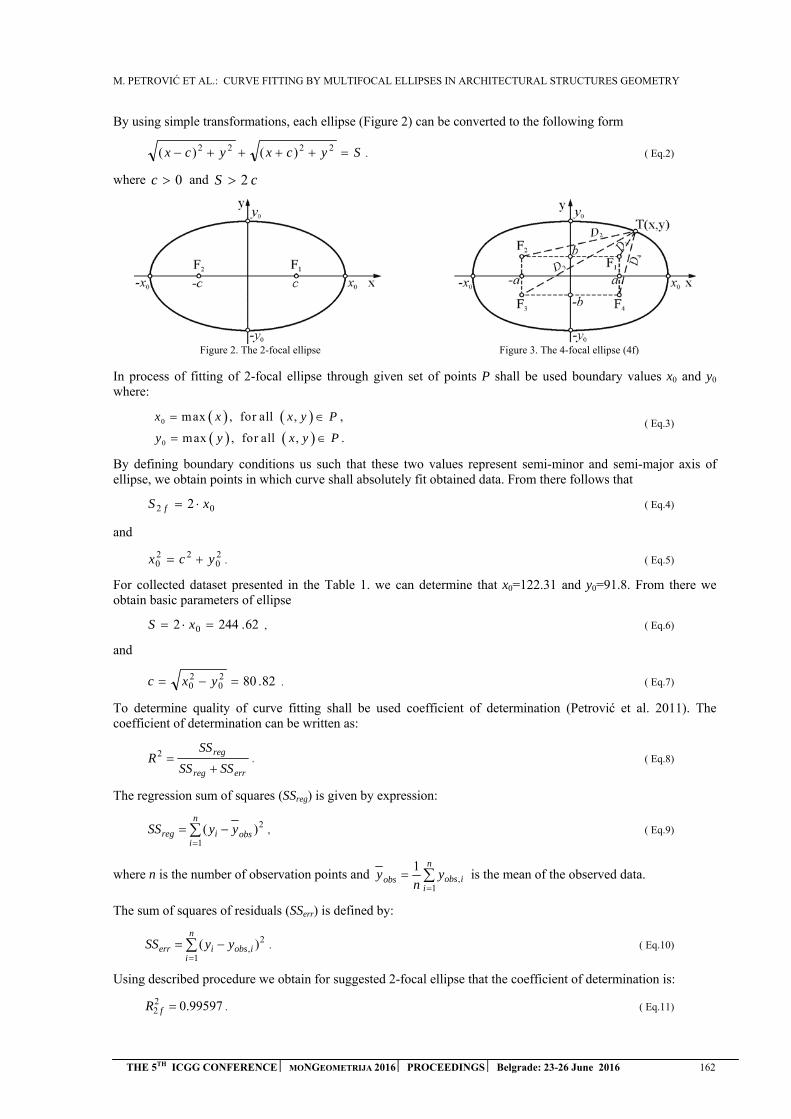
M. PETROVIĆ ET AL.: CURVE FITTING BY MULTIFOCAL ELLIPSES IN ARCHITECTURAL STRUCTURES GEOMETRY
THE 5TH ICGG CONFERENCE MONGEOMETRIJA 2016 PROCEEDINGS Belgrade: 23-26 June 2016 162
By using simple transformations, each ellipse (Figure 2) can be converted to the following form
Sycxycx 2222 )()( . ( Eq.2)
where 0c and 2S c
Figure 2. The 2-focal ellipse Figure 3. The 4-focal ellipse (4f)
In process of fitting of 2-focal ellipse through given set of points P shall be used boundary values x0 and y0 where:
0
0
max , for all , ,
max , for all , .
x x x y P
y y x y P
( Eq.3)
By defining boundary conditions us such that these two values represent semi-minor and semi-major axis of ellipse, we obtain points in which curve shall absolutely fit obtained data. From there follows that
02 2 xS f ( Eq.4)
and
20
220 ycx . ( Eq.5)
For collected dataset presented in the Table 1. we can determine that x0=122.31 and y0=91.8. From there we obtain basic parameters of ellipse
62.2442 0 xS , ( Eq.6)
and
82.8020
20 yxc . ( Eq.7)
To determine quality of curve fitting shall be used coefficient of determination (Petrović et al. 2011). The coefficient of determination can be written as:
errreg
reg
SSSS
SSR
2 . ( Eq.8)
The regression sum of squares (SSreg) is given by expression:
n
iobsireg yySS
1
2)( , ( Eq.9)
where n is the number of observation points and
n
iiobsobs y
ny
1,
1 is the mean of the observed data.
The sum of squares of residuals (SSerr) is defined by:
n
iiobsierr yySS
1
2, )( . ( Eq.10)
Using described procedure we obtain for suggested 2-focal ellipse that the coefficient of determination is:
99597.022 fR . ( Eq.11)
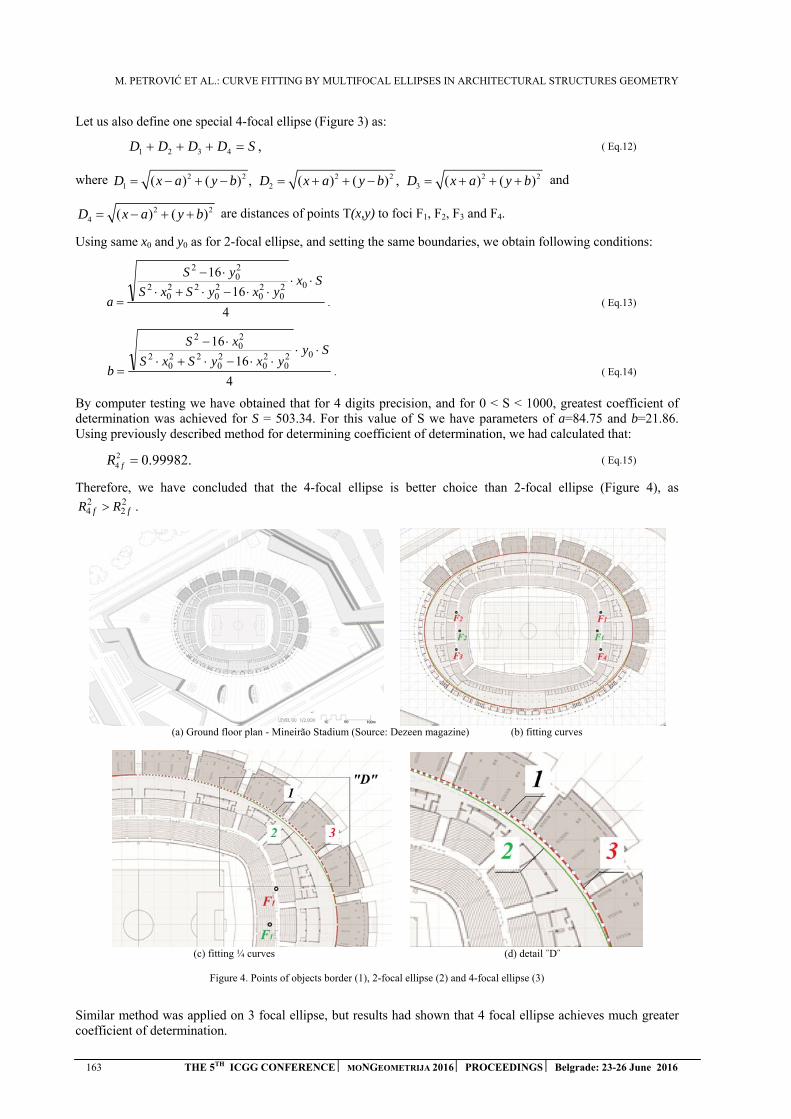
M. PETROVIĆ ET AL.: CURVE FITTING BY MULTIFOCAL ELLIPSES IN ARCHITECTURAL STRUCTURES GEOMETRY
163 THE 5TH ICGG CONFERENCE MONGEOMETRIJA 2016 PROCEEDINGS Belgrade: 23-26 June 2016
Let us also define one special 4-focal ellipse (Figure 3) as:
,4321 SDDDD ( Eq.12)
where 2 2 2 2 2 21 2 3( ) ( ) , ( ) ( ) , ( ) ( )D x a y b D x a y b D x a y b and
2 24 ( ) ( )D x a y b are distances of points T(x,y) to foci F1, F2, F3 and F4.
Using same x0 and y0 as for 2-focal ellipse, and setting the same boundaries, we obtain following conditions:
4
16
1602
020
20
220
2
20
2
SxyxySxS
yS
a
. ( Eq.13)
4
16
1602
020
20
220
2
20
2
SyyxySxS
xS
b
. ( Eq.14)
By computer testing we have obtained that for 4 digits precision, and for 0 < S < 1000, greatest coefficient of determination was achieved for S = 503.34. For this value of S we have parameters of a=84.75 and b=21.86. Using previously described method for determining coefficient of determination, we had calculated that:
24 0.99982.fR ( Eq.15)
Therefore, we have concluded that the 4-focal ellipse is better choice than 2-focal ellipse (Figure 4), as 22
24 ff RR .
(a) Ground floor plan - Mineirão Stadium (Source: Dezeen magazine) (b) fitting curves
(c) fitting ¼ curves (d) detail ˝D˝
Figure 4. Points of objects border (1), 2-focal ellipse (2) and 4-focal ellipse (3)
Similar method was applied on 3 focal ellipse, but results had shown that 4 focal ellipse achieves much greater coefficient of determination.
M. PETROVIĆ ET AL.: CURVE FITTING BY MULTIFOCAL ELLIPSES IN ARCHITECTURAL STRUCTURES GEOMETRY
THE 5TH ICGG CONFERENCE MONGEOMETRIJA 2016 PROCEEDINGS Belgrade: 23-26 June 2016 164
3. CONCLUSION
Approximation of contours of Roman amphitheater using ellipse and different ovaloid shapes is topic of research of many artists and researchers, such as architects or mathematicians (Barrallo, 2011), (Duvernoy, 2002), (Rosin, 2000), (Rosin, 2004). Ovoid architectural forms and their approximation using Hugelschaffer`s egg curve are also analysed in papers (Петровић, 2010) and Petrović et al. (2011). Significance of multifocal curves in reconstruction of bases of oval shapes comes from diversity of shapes of these curves and from their well defined algebraic equation. In this paper was presented that modern day architectural objects such as Mineirão Stadium Integration allow for much better approximation of base of object by use of multifocal curves than those using standard approximation using 2-focal ellipse, considering starting conditions. Results of this analysis were presented in graphical, as well as numerical form by use of coefficient of determination.
ACKNOWLEDGEMENTS
The research presented in this paper has been realized in the framework of the projects financed by the Ministry of Science and Technological Development of the Republic of Serbia (Grants No. III 44006, ON 174032 and TR 36010).
REFERENCES
1. Barrallo J., 2011. Ovals and ellipses in architecture, -Proceedings of ISAMA 2011 TenthInterdisciplinary Conference of the International Society of the Arts, Mathematics, and Architecture,Chicago, pp. 9-18.
2. Designboom magazine, 2016. http://www.designboom.com/architecture/bcmf-arquitetos-mineirao-stadium-belo-horizonte-brazil-05-28-2014/ [Accessed: 20st April 2016]
3. Dezeen magazine, 2016. http://www.dezeen.com [Accessed: 20st April 2016]http://www.dezeen.com/2013/08/19/mineirao-stadium-renovation-by-bcmf-architects/http://www.dezeen.com/2013/05/28/brazil-opens-first-solar-powered-stadium-ahead-of-2014-world-cup/
4. Duvernoy, S., 2002. Architecture and Mathematics in Roman Amphitheaters, Nexus Network Journal4(3).
5. Duvernoy S. and Rosin P.L., 2006. The compass, the ruler and the computer. NEXUS Architectureand Mathematics, VI, pp 21-34.
6. Петровић, M., 2010. Јајасте криве и генерализација Хугелшеферове конструкције, магистарскатеза, Архитектонски факултет, Универзитет у Београду.
7. Petrović M., Obradović M., Mijailović R., 2011. Suitability analysis of Hugelschaffer`s egg curveapplication in architectural structures` geometry, International Conference on Engineering Graphicsand Design, ICEGD JASSY 2011 - "Sustainable Eco Design", Iaşi, Romania, pp. 115-122.
8. Rosin, P., 2000. On Serlio's Construction of Ovals. Nexus Network Journal 2(3).
9. Rosin, P., 2004. On the construction of ovals. -Proceedings of International Society for the Arts,Mathematics, and Architecture (ISAMA 2004), pp. 118-122.
10. Ziebart M., Arthur J., Bateman N., Rauxloh P., Lees D. and Brown J., 2007. Determination of theparameters of the Guildhall amphitheatre ellipse in London. Journal of Archaeological Science. 34,pp. 1505-1514.
Department of Architecture and Urbanism, Faculty of Technical Sciences, University of Novi Sad, Serbia
M.Arch., Teaching Assistant, [email protected]
ABSTRACT
In order to predict and prevent possible collapse of vaulted masonry structures, which are a large part of the architectural heritage, scholars provide various analytical models, which can be used in the stability and safety analysis. One of usual approaches concerns thrust line theory developed during the 18th and 19th century and which has been revisited several times since then. Considering the arch analysis, thrust line, which represents the load path, is the locus of the application points of the resultant thrust forces which develop at the joints between the voussoirs of the arch. Serbian scholar Milutin Milankovitch was the first who provided general theory with correct mathematical elaboration, concerning the true locations of the centres of gravity of each ideal, generic voussoir, which were until then assumed to be located along the centreline of the arch.
Although pointed arches are very common in historic structures, particularly in Gothic architecture, their structural behaviour according to thrust line theory is still hardly researched. In frame of limit equilibrium analysis, some usual assumptions about material behaviour were introduced, reducing the problem of stability to mainly geometrical task. Namely, a self-weight of an arch or its portion is substituted by the area of the arch ring, and is applied in the centre of gravity i.e. in the centroid of the limited area. Therefore, the main task is to determine this area and its centroid. In this paper radial stereotomy, which assumes that joints between voussoirs are concurrent to the centre of the arch, is employed. Since the adoption of polar coordinates results in very large expressions, it has been concluded that the adoption of the Cartesian coordinates is more appropriate. Both incomplete (segmental) and overcomplete (horseshoe) arches were included into the conducted analysis. The determination of the centroid of pointed arch portion is given in detail and the complete analytical expressions are provided. Hence, they can be used in various codes for the analysis of mechanical behaviour of pointed arches.
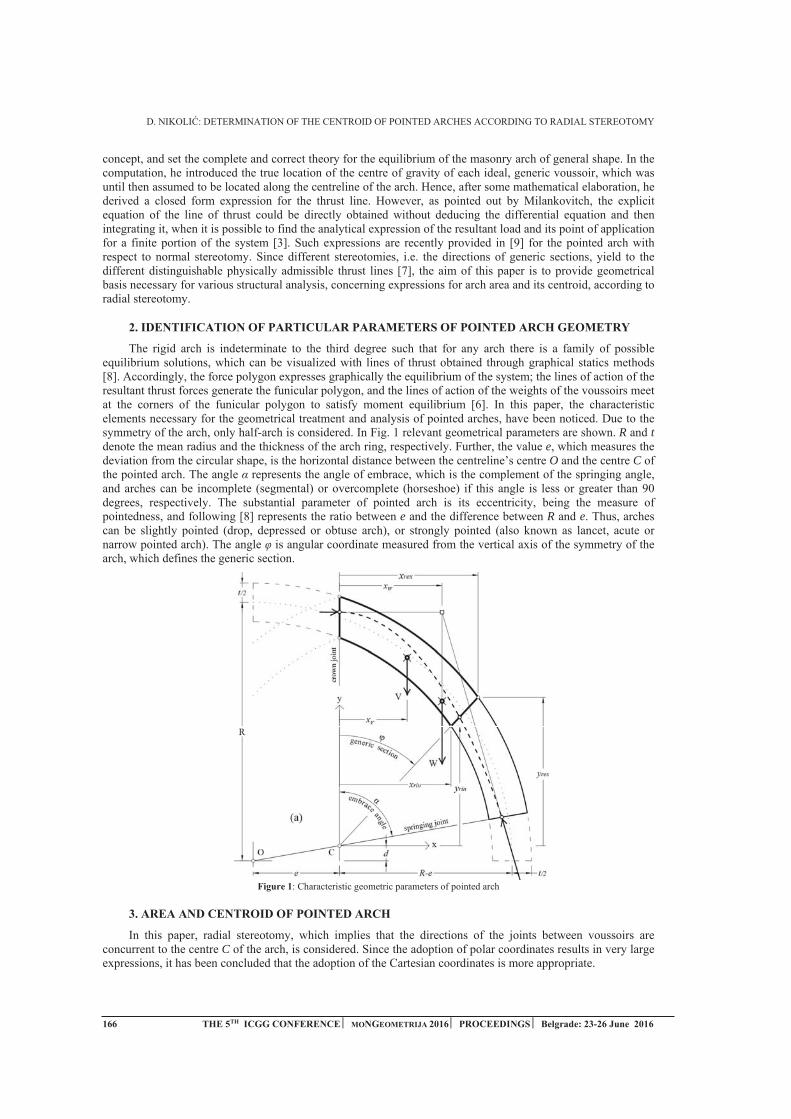
R teO C
e R e
C
(x + e)2 + (y + d)2 = (R + t/2)2
eR
ydRyxex
ex
dR
xeRxyex
ex
Rex = R + t/2 d = e cot( ) yr(x)yr(x) = x cot( ), yr(x) = y(x)
xrex
edReddeedx exrex
yrex
rexrex xy
(x + e)2 + (y + d)2 = (R - t/2)2
eR
ydRyxin
in
dR
xeRxyin
in
Rin = R - t/2 yr(x) = y(x)xrin
edReddeedx inrin
yrin
rinrin xy
V
VVVVVVi
i
V1y
rex
rex
rex
rex
y
yexexex
y
y
eyR
ydRydRyddyyxV
ex
ex
ex
rexexexrexexrex R
eRR
ydReReydReyd
yrex yrex(0)
deRy exrex
V2
rexrexrex xyxV
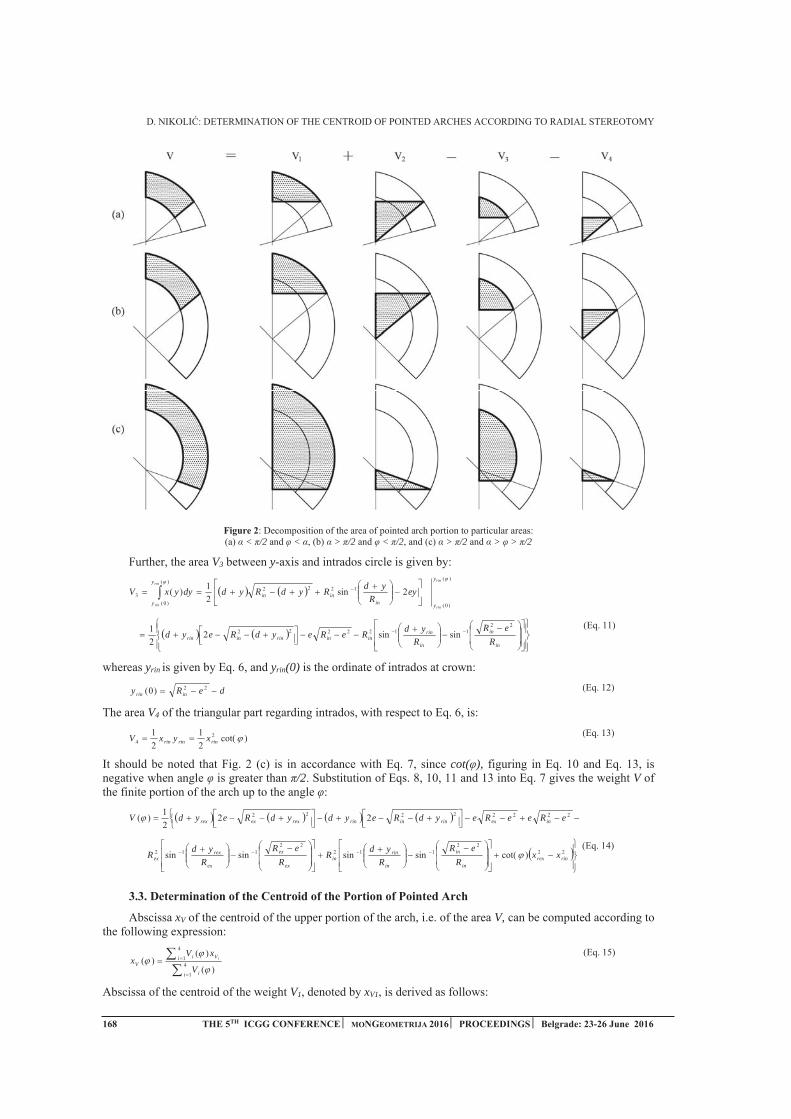
< /2 < > /2 < /2 > /2 > > /2
V3 yrin
rin
rin
rin
y
yininin
y
y
eyR
ydRydRyddyyxV
in
in
in
rinininrininrin R
eRR
ydReReydReyd
yrin yrin(0)
deRy inrin
V4
rinrinrin xyxV
cot( ),/2 V
eReeReydReydydReydV inexrininrinrexexrex
rinrexin
in
in
rinin
ex
ex
ex
rexex xx
ReR
RydR
ReR
RydR
xV V,
i i
i ViV
V
xVx i
V1 xV1
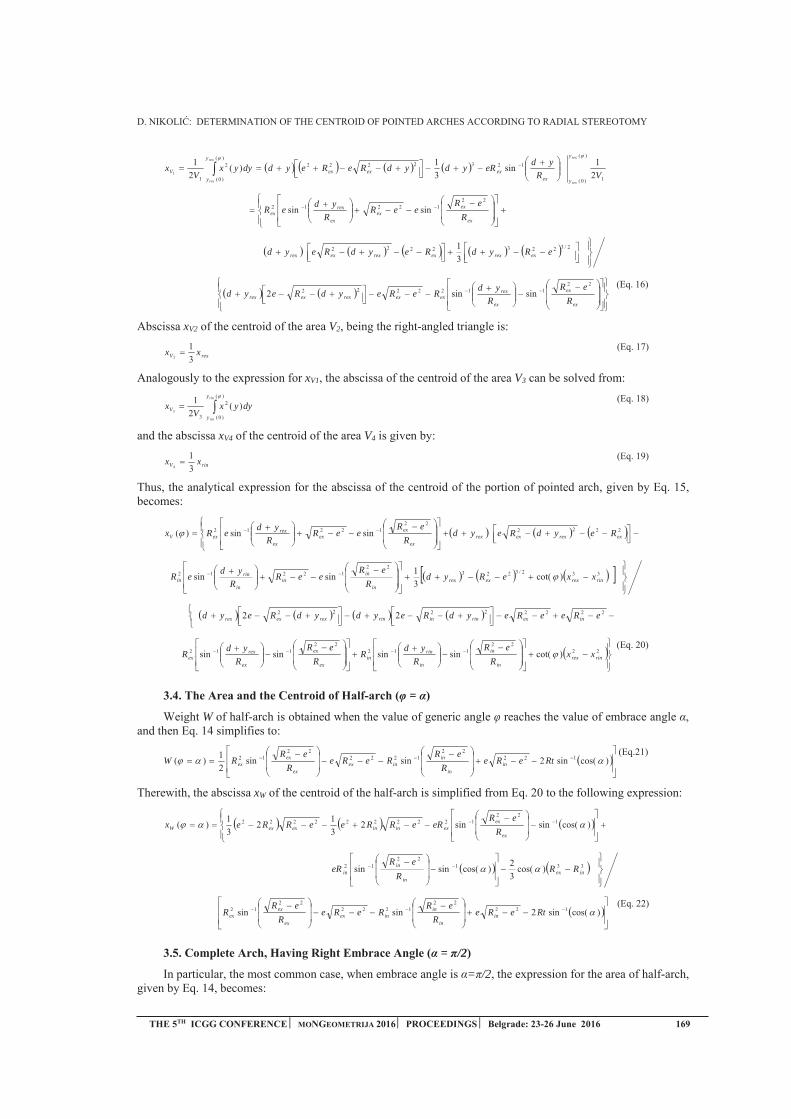
VRydeRydydReReyddyyx
Vx
rex
rex
rex
rex
y
yexexexex
y
yV
ex
exex
ex
rexex R
eReeR
RydeR
eRydReydReyd exrexexrexexrex
ex
ex
ex
rexexexrexexrex R
eRR
ydReReydReyd
xV2 V2
rexV xx
xV1 V3
rin
rin
y
yV dyyx
Vx
xV4 V4
rinV xx
exrexexrexex
exex
ex
rexexV ReydReyd
ReR
eeRR
ydeRx
rinrexexrexin
inin
in
rinin xxeRyd
ReR
eeRR
ydeR
eReeReydReydydReyd inexrininrinrexexrex
rinrexin
in
in
rinin
ex
ex
ex
rexex xx
ReR
RydR
ReR
RydR
=
W
RteReR
eRReRe
ReR
RW inin
ininex
ex
exex
xW
ex
exexininexexW R
eReReRReeRRex
inexin
inin RR
ReR
eR
RteReR
eRReRe
ReR
R inin
ininex
ex
exex
= /2
= /2

eReR
eRReRe
ReR
RW inin
ininex
ex
exex
in
inin
ex
exexininexexW R
eRR
ReR
eReRReeRRex
eReR
eRReRe
ReR
R inin
ininex
ex
exex
Nexus Network Journal,
ArchitecturalScience Review,
Archive of Applied MechanicsZeitschrift für Mathematik und Physik
International Journalof Architectural Heritage
Engineering Failure Analysis
E. VEG ET AL.: DEVELOPMENT OF THE TRANSMISSION TOWER VIRTUAL 3D MODEL FOR STRUCTURAL ANALYSIS IN ANSYS
THE 5TH ICGG CONFERENCE MONGEOMETRIJA 2016 PROCEEDINGS Belgrade: 23-26 June 2016 171
DEVELOPMENT OF THE TRANSMISSION TOWER VIRTUAL 3D MODEL FOR STRUCTURAL ANALYSIS IN ANSYS
Emil Veg
Department for Theory of Machines and Mechanisms, Faculty of Mechanical Engineering, University of Belgrade, Serbia
PhD, Teaching Assistant, [email protected]
Mladen Regodić
Department for Theory of Machines and Mechanisms, Faculty of Mechanical Engineering, University of Belgrade, Serbia
MSc, Teaching Assistant, [email protected]
Aleksandra Joksimović
Student, Faculty of Mechanical Engineering, University of Belgrade, Serbia
BSc, [email protected]
ABSTRACT
In this paper is described a methodology for transmission tower 3D modelling. The task was to develop a virtual 3D model, corresponding to the real structure, which will be subjected to structural analysis in ANSYS software. The process of 3D modelling is crucial for this kind of computer analysis. It requires precise keypoint coordinates defining. Not only the important points of the structure, but also the points of interest for the future structural analysis have to be defined. This means that model developer should be familiar with the structural analysis so he could form adequate keypoints in advance. Main point of the experiment concept is to determine dynamic behaviour of the structure, exposed to a known load. Truly correlated 3D model, with verified geometric, static and dynamic properties offers the opportunity to predict the structure behaviour under loads that can hardly apply on a living structure (extreme overloads, complex loads, and harsh ambient condition).
Keywords: ansys, 3D model, structural analysis
SUBJECT CODE: Applied Geometry
1. INTRODUCTION
Making a 3D model is a complex process of transformation of real structure into virtual model with necessary idealization. Starting points are geometry, supports, loads, expected displacements and deformations [1]. Starting point for structural and modal analysis is adequate virtual 3D model. Scientific paper [2] presents methods for 3D modelling of a machine in Solid Works Motion. It provides good model for conducting of static and dynamic analysis of desired machine at the very beginning of development process. So it can be clear in what way will behave future machine parts during exploitation. Electric power transmission tower is a lattice steel structure. It is build out of, by size different, but standard shape `L` and `U` profiles. The first step in virtual
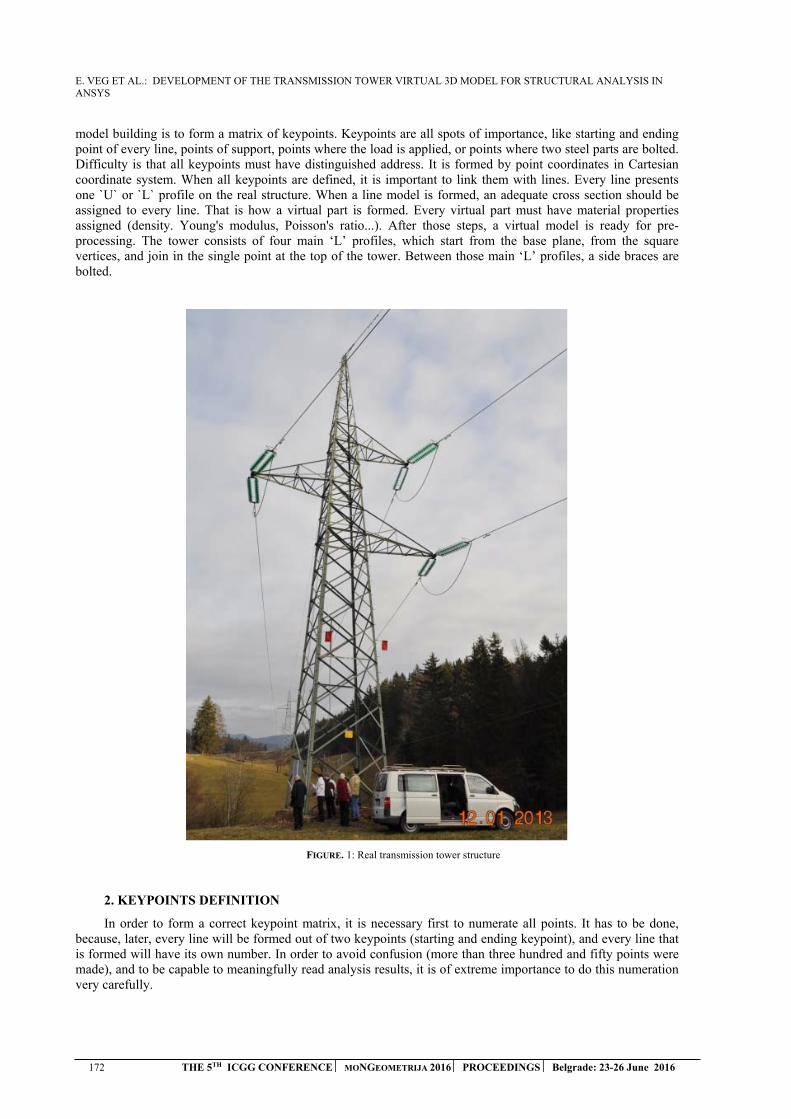
E. VEG ET AL.: DEVELOPMENT OF THE TRANSMISSION TOWER VIRTUAL 3D MODEL FOR STRUCTURAL ANALYSIS IN ANSYS
172 THE 5TH ICGG CONFERENCE MONGEOMETRIJA 2016 PROCEEDINGS Belgrade: 23-26 June 2016
model building is to form a matrix of keypoints. Keypoints are all spots of importance, like starting and ending point of every line, points of support, points where the load is applied, or points where two steel parts are bolted. Difficulty is that all keypoints must have distinguished address. It is formed by point coordinates in Cartesian coordinate system. When all keypoints are defined, it is important to link them with lines. Every line presents one `U` or `L` profile on the real structure. When a line model is formed, an adequate cross section should be assigned to every line. That is how a virtual part is formed. Every virtual part must have material properties assigned (density. Young's modulus, Poisson's ratio...). After those steps, a virtual model is ready for pre-processing. The tower consists of four main ‘L’ profiles, which start from the base plane, from the square vertices, and join in the single point at the top of the tower. Between those main ‘L’ profiles, a side braces are bolted.
FIGURE. 1: Real transmission tower structure
2. KEYPOINTS DEFINITION
In order to form a correct keypoint matrix, it is necessary first to numerate all points. It has to be done, because, later, every line will be formed out of two keypoints (starting and ending keypoint), and every line that is formed will have its own number. In order to avoid confusion (more than three hundred and fifty points were made), and to be capable to meaningfully read analysis results, it is of extreme importance to do this numeration very carefully.
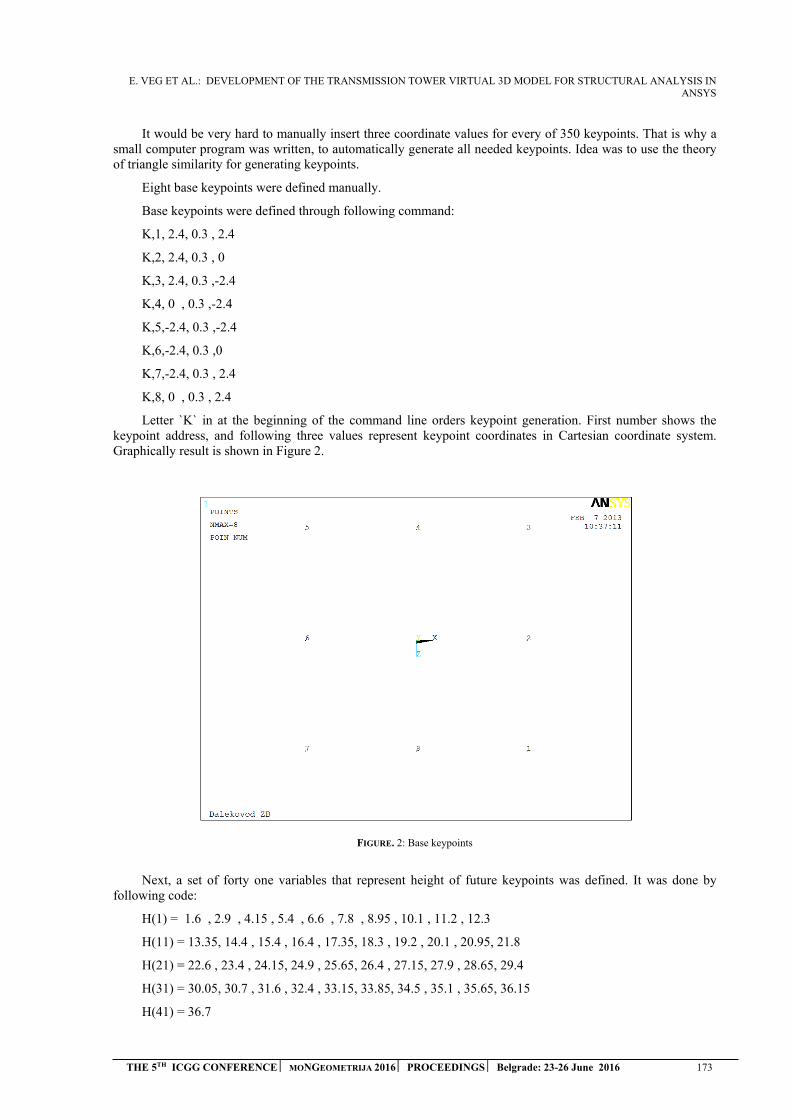
E. VEG ET AL.: DEVELOPMENT OF THE TRANSMISSION TOWER VIRTUAL 3D MODEL FOR STRUCTURAL ANALYSIS IN ANSYS
THE 5TH ICGG CONFERENCE MONGEOMETRIJA 2016 PROCEEDINGS Belgrade: 23-26 June 2016 173
It would be very hard to manually insert three coordinate values for every of 350 keypoints. That is why a small computer program was written, to automatically generate all needed keypoints. Idea was to use the theory of triangle similarity for generating keypoints.
Eight base keypoints were defined manually.
Base keypoints were defined through following command:
K,1, 2.4, 0.3 , 2.4
K,2, 2.4, 0.3 , 0
K,3, 2.4, 0.3 ,-2.4
K,4, 0 , 0.3 ,-2.4
K,5,-2.4, 0.3 ,-2.4
K,6,-2.4, 0.3 ,0
K,7,-2.4, 0.3 , 2.4
K,8, 0 , 0.3 , 2.4
Letter `K` in at the beginning of the command line orders keypoint generation. First number shows the keypoint address, and following three values represent keypoint coordinates in Cartesian coordinate system. Graphically result is shown in Figure 2.
FIGURE. 2: Base keypoints
Next, a set of forty one variables that represent height of future keypoints was defined. It was done by following code:
H(1) = 1.6 , 2.9 , 4.15 , 5.4 , 6.6 , 7.8 , 8.95 , 10.1 , 11.2 , 12.3
H(11) = 13.35, 14.4 , 15.4 , 16.4 , 17.35, 18.3 , 19.2 , 20.1 , 20.95, 21.8
H(21) = 22.6 , 23.4 , 24.15, 24.9 , 25.65, 26.4 , 27.15, 27.9 , 28.65, 29.4
H(31) = 30.05, 30.7 , 31.6 , 32.4 , 33.15, 33.85, 34.5 , 35.1 , 35.65, 36.15
H(41) = 36.7
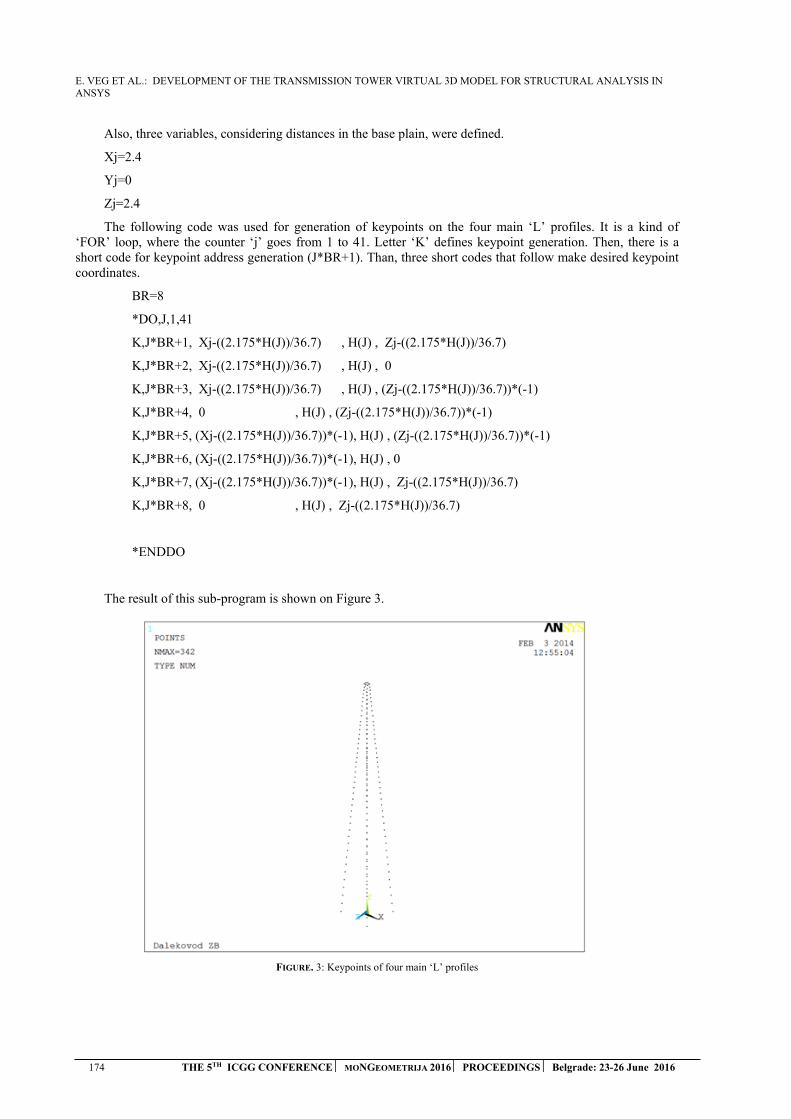
E. VEG ET AL.: DEVELOPMENT OF THE TRANSMISSION TOWER VIRTUAL 3D MODEL FOR STRUCTURAL ANALYSIS IN ANSYS
174 THE 5TH ICGG CONFERENCE MONGEOMETRIJA 2016 PROCEEDINGS Belgrade: 23-26 June 2016
Also, three variables, considering distances in the base plain, were defined.
Xj=2.4
Yj=0
Zj=2.4
The following code was used for generation of keypoints on the four main ‘L’ profiles. It is a kind of ‘FOR’ loop, where the counter ‘j’ goes from 1 to 41. Letter ‘K’ defines keypoint generation. Then, there is a short code for keypoint address generation (J*BR+1). Than, three short codes that follow make desired keypoint coordinates.
BR=8
*DO,J,1,41
K,J*BR+1, Xj-((2.175*H(J))/36.7) , H(J) , Zj-((2.175*H(J))/36.7)
K,J*BR+2, Xj-((2.175*H(J))/36.7) , H(J) , 0
K,J*BR+3, Xj-((2.175*H(J))/36.7) , H(J) , (Zj-((2.175*H(J))/36.7))*(-1)
K,J*BR+4, 0 , H(J) , (Zj-((2.175*H(J))/36.7))*(-1)
K,J*BR+5, (Xj-((2.175*H(J))/36.7))*(-1), H(J) , (Zj-((2.175*H(J))/36.7))*(-1)
K,J*BR+6, (Xj-((2.175*H(J))/36.7))*(-1), H(J) , 0
K,J*BR+7, (Xj-((2.175*H(J))/36.7))*(-1), H(J) , Zj-((2.175*H(J))/36.7)
K,J*BR+8, 0 , H(J) , Zj-((2.175*H(J))/36.7)
*ENDDO
The result of this sub-program is shown on Figure 3.
FIGURE. 3: Keypoints of four main ‘L’ profiles

E. VEG ET AL.: DEVELOPMENT OF THE TRANSMISSION TOWER VIRTUAL 3D MODEL FOR STRUCTURAL ANALYSIS IN ANSYS
THE 5TH ICGG CONFERENCE MONGEOMETRIJA 2016 PROCEEDINGS Belgrade: 23-26 June 2016 175
In the same manner, all other keypoints were defined. Final keypoint matrix is shown on the Figure 4.
FIGURE. 4: Keypoints of four main ‘L’ profiles
Between those keypoints, both main lines and side braces were generated.
3. ASSIGNMENT OF CROSS-SECTIONS
In this process, a BEAM188 element was used. The BEAM188 element is suitable for analysing slender to moderately stubby/thick beam structures. This element is based on Timoshenko beam theory. Shear deformation effects are included.
BEAM188 is a linear (2-node) beam element in 3-D with six degrees of freedom at each node. The degrees of freedom at each node include translations in x,y, and z directions, and rotations about the x,y, and z directions. Warping of cross sections is assumed to be unrestrained.
The beam elements are well-suited for linear, large rotation, and/or large strain nonlinear applications.
BEAM188 includes stress stiffness terms, by default, in any analysis. The stress stiffness terms provided enable the elements to analyse flexural, lateral and torsional stability problems (using eigenvalue buckling or collapse studies with arc length methods).
BEAM188 can be used with any cross section defined. Elasticity and isotropic hardening plasticity models are supported for calculations (irrespective of cross section subtype) [3].
With the following commands, used standard `L` profiles were configured in Ansys:
SECT,40,BEAM,L
SECD,0.040,0.040,0.004,0.004
`SECT 40` is a code name for that kind of profile. It is of a `L` shape (predefined in Ansys) and its dimensions are 40mm x 40mm, with wall thickness of 4mm. Similar code was written for `U` shape cross section.
After completion of cross section assignment, a final result of a defined 3D model is shown on a Figure 5.
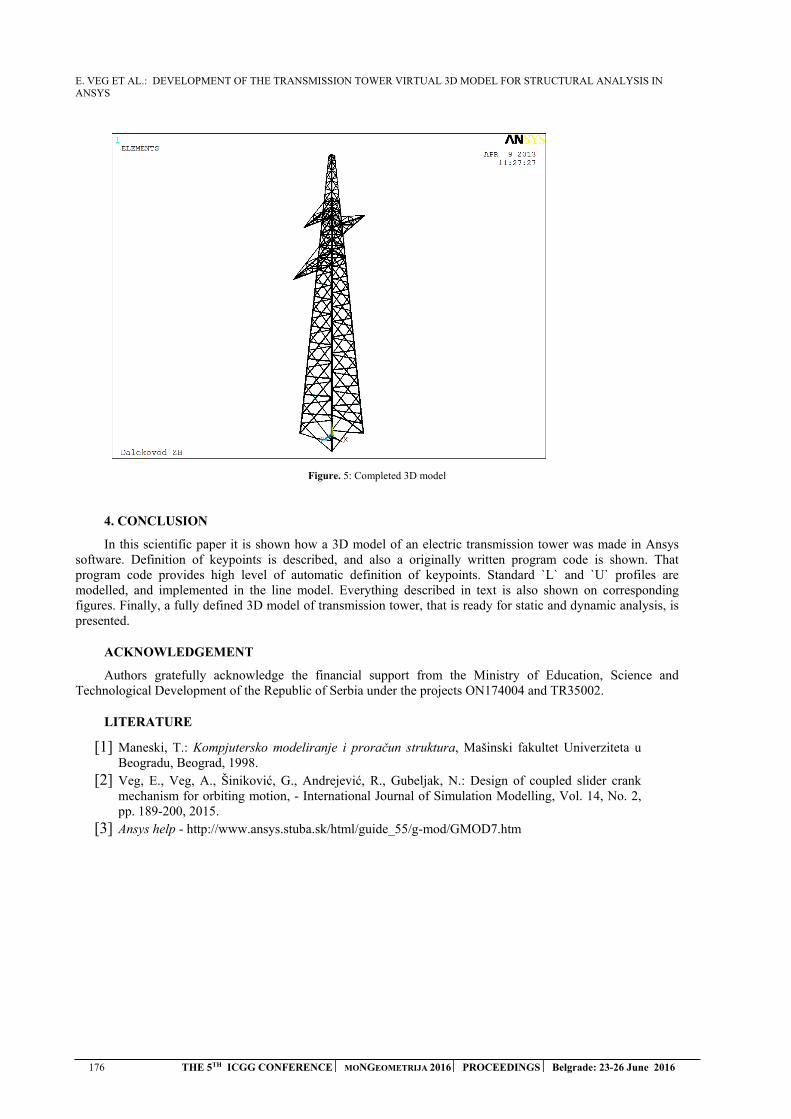
E. VEG ET AL.: DEVELOPMENT OF THE TRANSMISSION TOWER VIRTUAL 3D MODEL FOR STRUCTURAL ANALYSIS IN ANSYS
176 THE 5TH ICGG CONFERENCE MONGEOMETRIJA 2016 PROCEEDINGS Belgrade: 23-26 June 2016
Figure. 5: Completed 3D model
4. CONCLUSION
In this scientific paper it is shown how a 3D model of an electric transmission tower was made in Ansys software. Definition of keypoints is described, and also a originally written program code is shown. That program code provides high level of automatic definition of keypoints. Standard `L` and `U` profiles are modelled, and implemented in the line model. Everything described in text is also shown on corresponding figures. Finally, a fully defined 3D model of transmission tower, that is ready for static and dynamic analysis, is presented.
ACKNOWLEDGEMENT
Authors gratefully acknowledge the financial support from the Ministry of Education, Science and Technological Development of the Republic of Serbia under the projects ON174004 and TR35002.
LITERATURE
[1] Maneski, T.: Kompjutersko modeliranje i proračun struktura, Mašinski fakultet Univerziteta u Beogradu, Beograd, 1998.
[2] Veg, E., Veg, A., Šiniković, G., Andrejević, R., Gubeljak, N.: Design of coupled slider crank mechanism for orbiting motion, - International Journal of Simulation Modelling, Vol. 14, No. 2, pp. 189-200, 2015.
[3] Ansys help - http://www.ansys.stuba.sk/html/guide_55/g-mod/GMOD7.htm
G. LIVA: DIGITAL GEOMETRIES: GEOMETRICAL LOGIC IN FRANCESCO BORROMINI’S CHURCHES OF SAN CARLINO AND SANT’IVO
DIGITAL GEOMETRIES: GEOMETRICAL LOGIC IN FRANCESCO BORROMINI’S CHURCHES OF SAN CARLINO AND SANT’IVO
Gabriella Liva
Department of Architecture and Arts, IUAV University Venice
PhD., Research Fellow, Professor, [email protected]
ABSTRACT
In all works of Francesco Borromini (1599 - 1667) technique and knowledge of the past marvellously mingle with the continuous expressive search typical of the 17th century. His works elaborated principles of dynamism, variety and contrast, by means of spectacular visual solutions going well beyond traditional rules and schemes. Both in the monastery of San Carlino alle Quattro Fontane and in the church of Sant’Ivo alla Sapienza (1642-1660), the precise identification of geometrical shapes in the plan, based on simple and consequential ratios, is fundamental for the spatial development and the volumetric structure of the churches. By integrating the historical and archive-based study of Borromini’s drawings with CAD-developed new drawings, reconstructions and models, digital clones can be produced as the basis for geometrical and configuration hypotheses. In San Carlino(1634-1644), the traditional model of sequential architectural elements is generated by rotational movements with respect to the major or minor axis, by a quarter of the oval matrix, thus generating the internal ovoids removed from the structural masonry work or dissected by horizontal or vertical planes depending on the specific requirements, finally modelling the surfaces that give shape to the church. In Sant'Ivo alla Sapienza (1642-1660) the mutual intersection of two identical equilateral triangles, superimposed but overturned with respect to the common centre, produces six points whose straight and curved sides generate an alternating rhythm with straight and curved niches. The mixed-line contour generates convex and concave lines and surfaces and is consistently used in the covering, as the basis for a very peculiar dome unique in its kind. Following CAD modelling of the digital clone of the church, the hypothesis could be made that the ribs are obtained from the transfer of portions of circles with decreasing radius as the section dimension changes. Moreover, in the final part with cherub sculptures, these circumferences suddenly change to connect with the eye. This brief analysis of two well-known examples of Baroque architecture shows that the rational use of the computer has redefined the boundaries of application of the drawing technique, by adapting it to the most different types of language and paving the way for several interpretations and potential developments. The study of the two churches is centred around the idea of a model starting from an accurate geometrical and configuration analysis of the object, and leading to the production of a digital archetype. Unlike surface or wireframe modelling, solid modelling produces 3D models with mathematical and geometrical properties allowing on-the-field interventions of joining or removing elements in order to produce the desired shape out of the shapeless block. Digital instruments thus become fundamental to build a dialogue between mathematical science and creative expression, by revealing the structural and formal development of the analysed object through an adequate graphical representation retrieving the fundamental principles and applications of descriptive and projection geometry in architecture.
Keywords: digital geometries; solid modeling; applied descriptive geometry; computer aided design;
THE 5TH ICGG CONFERENCE | MONGEOMETRIJA 2016 | PROCEEDINGS Belgrade: 23-26 June 2016 177

G. LIVA: DIGITAL GEOMETRIES: GEOMETRICAL LOGIC IN FRANCESCO BORROMINI’S CHURCHES OF SAN CARLINO AND SANT’IVO
INRODUCTION
"The Architect, through the ordonnance of forms, realizes an order that is a pure creation of his mind; through forms, he affects our senses intensely, provoking plastic emotions; through the relationships that he creates, he stirs in us deep resonances, he gives us the measure of an order that we sense to be in accord with that of the world, he determines the diverse moments of our minds and our hearts; it is then that we experience beauty”1.
Francesco Borromini, (Francesco Castelli, Bissone 1599 - Rome 1667) worked as an architect during four pontificates (Popes Sixtus V, Urban VIII, Innocent X and Alexander VII) and lived in one of the most thriving times from an architectural point of view. In all his works, technique and knowledge of the past marvellously mingle with the continuous expressive search typical of the 17th century. Unlike his contemporaries and predecessors, either painters or sculptors, he was introduced to the craft of architecture following an intense period of craftsmanship training, which would be the basis for his technical and building expertise allowing him to critically appraise the work of his antagonists. Indeed, his initial attempts were distant from the humanistic study of classics, from the faithful respect of proportions and the conventional deep-rooted sense of beauty, and they would lead him towards “practice” rather than “theory”. Later on, his strict use of geometry and his insatiable imagination, coupled with technical mastery and religious symbolism, will lead Borromini to build unique, enveloping structures where dynamism, contrast, upward thrust are the keywords of his architectural language. The extraordinary force of invention and his constant search for a personal style purposefully altering the rigid schemes and stylistic methods typical of the Renaissance confer charm and mystery to his activity, a model of uniqueness for future generations. His complex and enigmatic architectures translate into solid matter the uncertainties and contrasts of the 17th century swept by the Counter-Reformation winds of change, with criticism of commonly accepted principles strongly supported by an insatiable search for truth and the gradual interest for the “exact sciences”. The corruption of the Sun and the moon, the movement of celestial bodies away from Aristotle's unchanging vision, the introduction of an experimental method in the various fields of knowledge started to redraw the atlas of knowledge and encouraged scientists to move towards new knowledge and interpretation horizons. Being the undisputed representatives of tensions and social change, art and architecture started to elaborate more or less strong principles of dynamism, variety and contrast, by means of spectacular visual solutions going well beyond traditional rules and schemes. Bernini’s "bel composto", or unification of the arts, definitively put an end to their separation, and Borromini’s works often resembled virtuoso creative processes generating architectural anamorphoses running along parallel lines with developments in painting2.
MAIN DISCUSSION
The Swiss Italian architect’s works built in Italy confer space by means of plastic sensitivity that is unique in its kind. The articulation of surfaces, the search for movement suggested by the bending of the walls and by the attitude of figures, the skilful use of light and shadow, the creation of emphasised and accelerated perspectives break through the masonry work of the domes and, in a rapid upward movement, shift the observer’s eye towards the sky and the infinite, that same sky and infinite space that Galileo had watched with his spyglass. Architecture is shaped like a sculpture and, vice versa, sculptural elements at times integrate or replace architectural ones: walls are curved and break, columns bend, space becomes a bulk of matter to be shaped with full and empty details, holes, curved and sinuous lines (Figure 01).
1 Le Corbusier, Towards a New Architecture, 1927, page 224. 2 As far as perspective is concerned, the 17th century was characterised by a strong interest in the most curious and hidden aspects of perspective oriented towards anamorphoses. Martin Kemp: The Science of Art. Optical Themes in Western Art from Brunelleschi to Seurat. New Haven and London, 1990; K. Andersen, The Geometry of an Art, The History of the Mathematical. Theory of Perspective from Alberti to Monge, Springer, Berlin 2007; A. De Rosa, G. D’Acunto, La vertigine dello sguardo. Tre saggi sulla rappresentazione anamorfica, Cafoscarina, Venice 2003.
THE 5TH ICGG CONFERENCE | MONGEOMETRIJA 2016 | PROCEEDINGS Belgrade: 23-26 June 2016 178
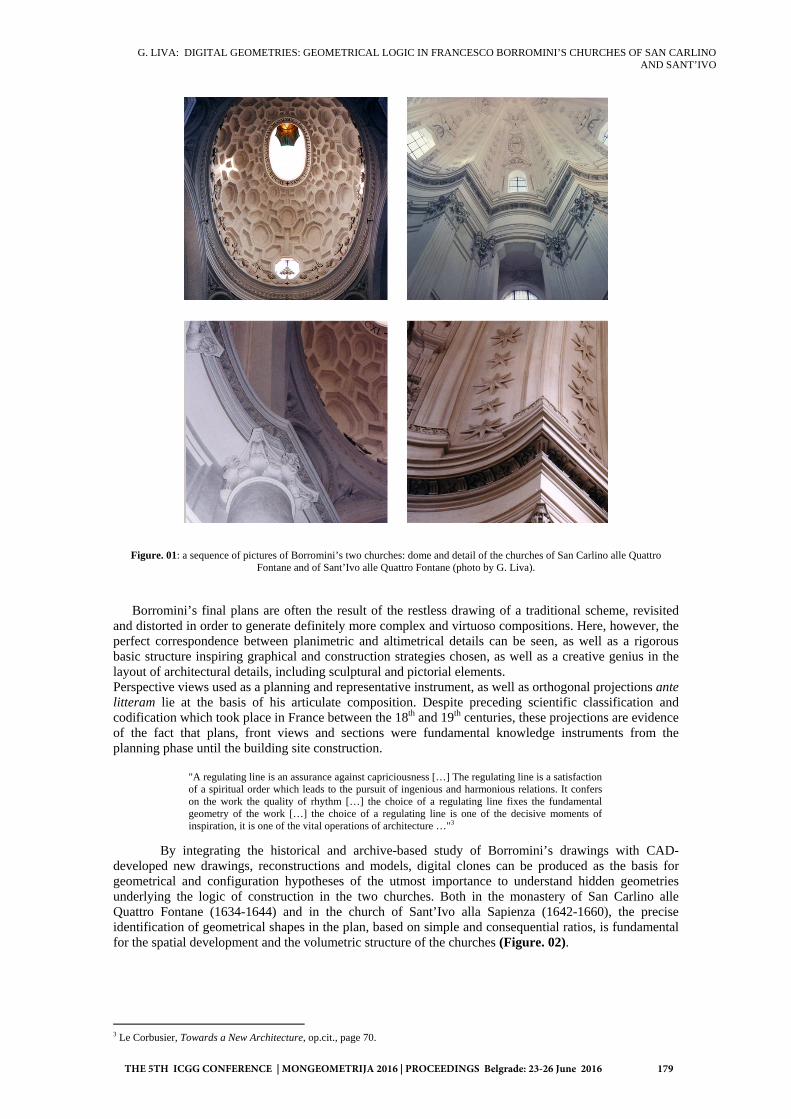
G. LIVA: DIGITAL GEOMETRIES: GEOMETRICAL LOGIC IN FRANCESCO BORROMINI’S CHURCHES OF SAN CARLINO AND SANT’IVO
Figure. 01: a sequence of pictures of Borromini’s two churches: dome and detail of the churches of San Carlino alle Quattro Fontane and of Sant’Ivo alle Quattro Fontane (photo by G. Liva).
Borromini’s final plans are often the result of the restless drawing of a traditional scheme, revisited and distorted in order to generate definitely more complex and virtuoso compositions. Here, however, the perfect correspondence between planimetric and altimetrical details can be seen, as well as a rigorous basic structure inspiring graphical and construction strategies chosen, as well as a creative genius in the layout of architectural details, including sculptural and pictorial elements. Perspective views used as a planning and representative instrument, as well as orthogonal projections ante litteram lie at the basis of his articulate composition. Despite preceding scientific classification and codification which took place in France between the 18th and 19th centuries, these projections are evidence of the fact that plans, front views and sections were fundamental knowledge instruments from the planning phase until the building site construction.
"A regulating line is an assurance against capriciousness […] The regulating line is a satisfaction of a spiritual order which leads to the pursuit of ingenious and harmonious relations. It confers on the work the quality of rhythm […] the choice of a regulating line fixes the fundamental geometry of the work […] the choice of a regulating line is one of the decisive moments of inspiration, it is one of the vital operations of architecture …"3
By integrating the historical and archive-based study of Borromini’s drawings with CAD-developed new drawings, reconstructions and models, digital clones can be produced as the basis for geometrical and configuration hypotheses of the utmost importance to understand hidden geometries underlying the logic of construction in the two churches. Both in the monastery of San Carlino alle Quattro Fontane (1634-1644) and in the church of Sant’Ivo alla Sapienza (1642-1660), the precise identification of geometrical shapes in the plan, based on simple and consequential ratios, is fundamental for the spatial development and the volumetric structure of the churches (Figure. 02).
3 Le Corbusier, Towards a New Architecture, op.cit., page 70.
THE 5TH ICGG CONFERENCE | MONGEOMETRIJA 2016 | PROCEEDINGS Belgrade: 23-26 June 2016 179
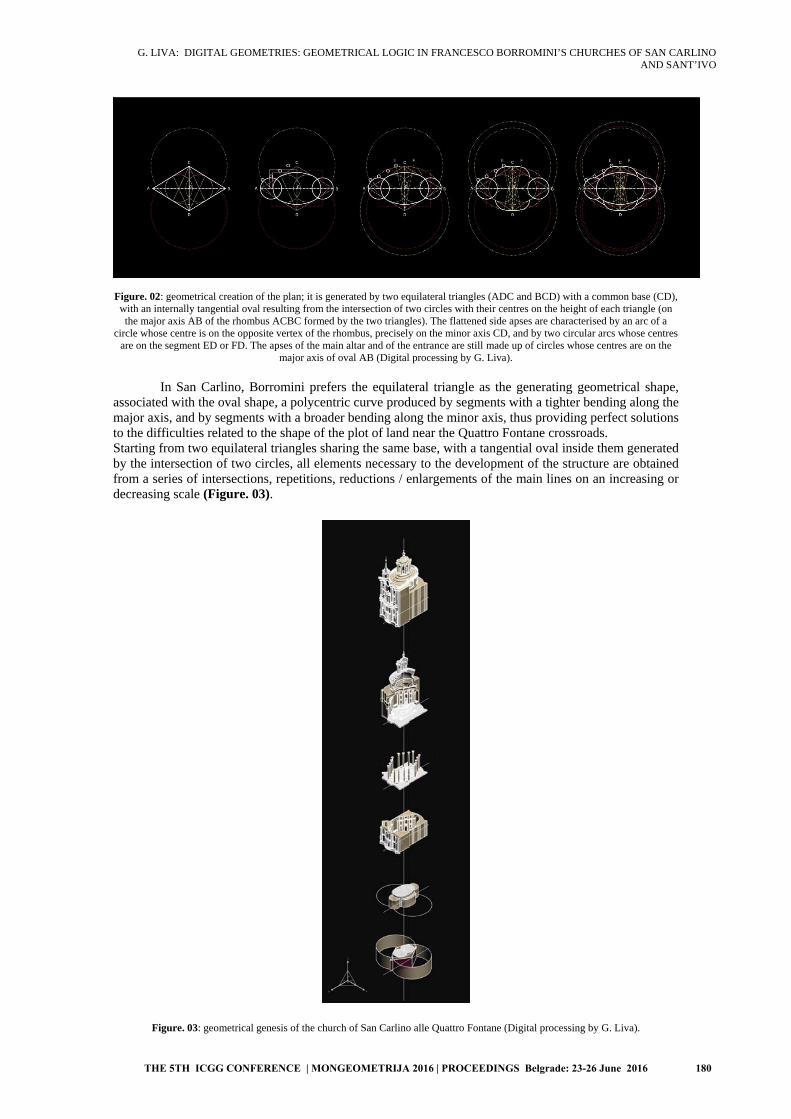
G. LIVA: DIGITAL GEOMETRIES: GEOMETRICAL LOGIC IN FRANCESCO BORROMINI’S CHURCHES OF SAN CARLINO AND SANT’IVO
Figure. 02: geometrical creation of the plan; it is generated by two equilateral triangles (ADC and BCD) with a common base (CD), with an internally tangential oval resulting from the intersection of two circles with their centres on the height of each triangle (on the major axis AB of the rhombus ACBC formed by the two triangles). The flattened side apses are characterised by an arc of a
circle whose centre is on the opposite vertex of the rhombus, precisely on the minor axis CD, and by two circular arcs whose centres are on the segment ED or FD. The apses of the main altar and of the entrance are still made up of circles whose centres are on the
major axis of oval AB (Digital processing by G. Liva).
In San Carlino, Borromini prefers the equilateral triangle as the generating geometrical shape, associated with the oval shape, a polycentric curve produced by segments with a tighter bending along the major axis, and by segments with a broader bending along the minor axis, thus providing perfect solutions to the difficulties related to the shape of the plot of land near the Quattro Fontane crossroads. Starting from two equilateral triangles sharing the same base, with a tangential oval inside them generated by the intersection of two circles, all elements necessary to the development of the structure are obtained from a series of intersections, repetitions, reductions / enlargements of the main lines on an increasing or decreasing scale (Figure. 03).
Figure. 03: geometrical genesis of the church of San Carlino alle Quattro Fontane (Digital processing by G. Liva).
THE 5TH ICGG CONFERENCE | MONGEOMETRIJA 2016 | PROCEEDINGS Belgrade: 23-26 June 2016 180
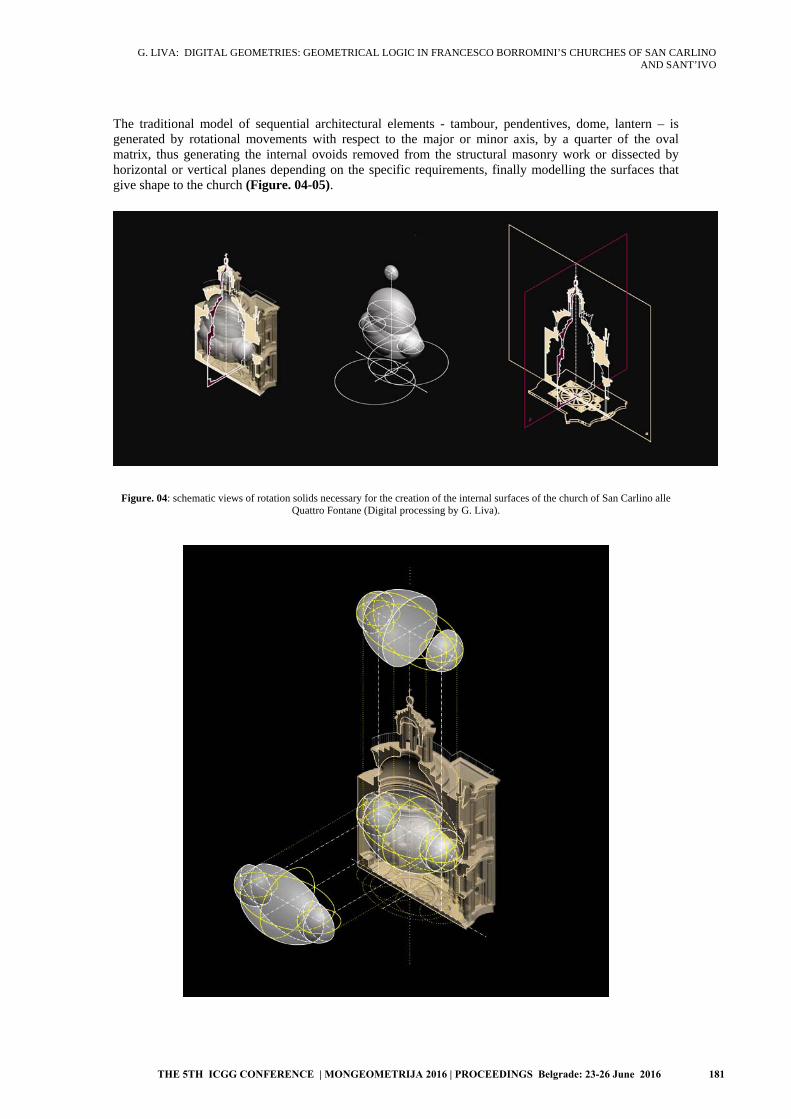
G. LIVA: DIGITAL GEOMETRIES: GEOMETRICAL LOGIC IN FRANCESCO BORROMINI’S CHURCHES OF SAN CARLINO AND SANT’IVO
The traditional model of sequential architectural elements - tambour, pendentives, dome, lantern – is generated by rotational movements with respect to the major or minor axis, by a quarter of the oval matrix, thus generating the internal ovoids removed from the structural masonry work or dissected by horizontal or vertical planes depending on the specific requirements, finally modelling the surfaces that give shape to the church (Figure. 04-05).
Figure. 04: schematic views of rotation solids necessary for the creation of the internal surfaces of the church of San Carlino alle Quattro Fontane (Digital processing by G. Liva).
THE 5TH ICGG CONFERENCE | MONGEOMETRIJA 2016 | PROCEEDINGS Belgrade: 23-26 June 2016 181
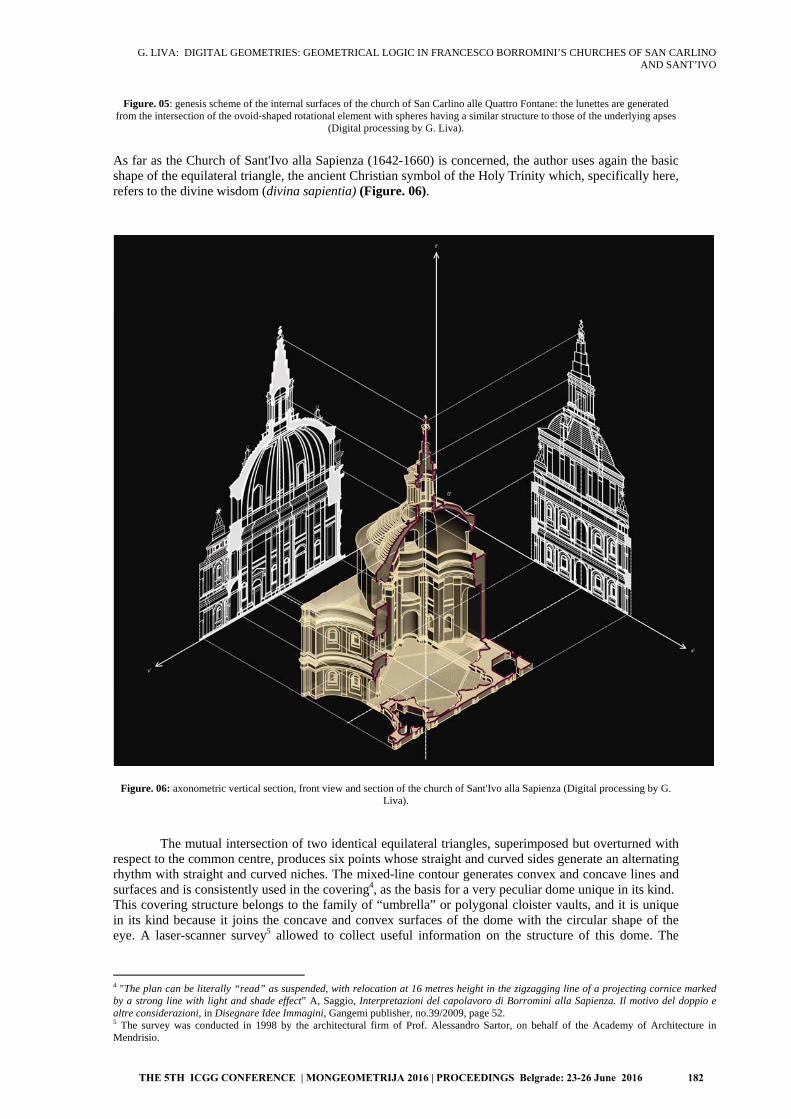
G. LIVA: DIGITAL GEOMETRIES: GEOMETRICAL LOGIC IN FRANCESCO BORROMINI’S CHURCHES OF SAN CARLINO AND SANT’IVO
Figure. 05: genesis scheme of the internal surfaces of the church of San Carlino alle Quattro Fontane: the lunettes are generated from the intersection of the ovoid-shaped rotational element with spheres having a similar structure to those of the underlying apses
(Digital processing by G. Liva).
As far as the Church of Sant'Ivo alla Sapienza (1642-1660) is concerned, the author uses again the basic shape of the equilateral triangle, the ancient Christian symbol of the Holy Trinity which, specifically here, refers to the divine wisdom (divina sapientia) (Figure. 06).
Figure. 06: axonometric vertical section, front view and section of the church of Sant'Ivo alla Sapienza (Digital processing by G. Liva).
The mutual intersection of two identical equilateral triangles, superimposed but overturned with respect to the common centre, produces six points whose straight and curved sides generate an alternating rhythm with straight and curved niches. The mixed-line contour generates convex and concave lines and surfaces and is consistently used in the covering4, as the basis for a very peculiar dome unique in its kind. This covering structure belongs to the family of “umbrella” or polygonal cloister vaults, and it is unique in its kind because it joins the concave and convex surfaces of the dome with the circular shape of the eye. A laser-scanner survey5 allowed to collect useful information on the structure of this dome. The
4 "The plan can be literally “read” as suspended, with relocation at 16 metres height in the zigzagging line of a projecting cornice marked by a strong line with light and shade effect” A, Saggio, Interpretazioni del capolavoro di Borromini alla Sapienza. Il motivo del doppio e altre considerazioni, in Disegnare Idee Immagini, Gangemi publisher, no.39/2009, page 52.5 The survey was conducted in 1998 by the architectural firm of Prof. Alessandro Sartor, on behalf of the Academy of Architecture in Mendrisio.
THE 5TH ICGG CONFERENCE | MONGEOMETRIJA 2016 | PROCEEDINGS Belgrade: 23-26 June 2016 182
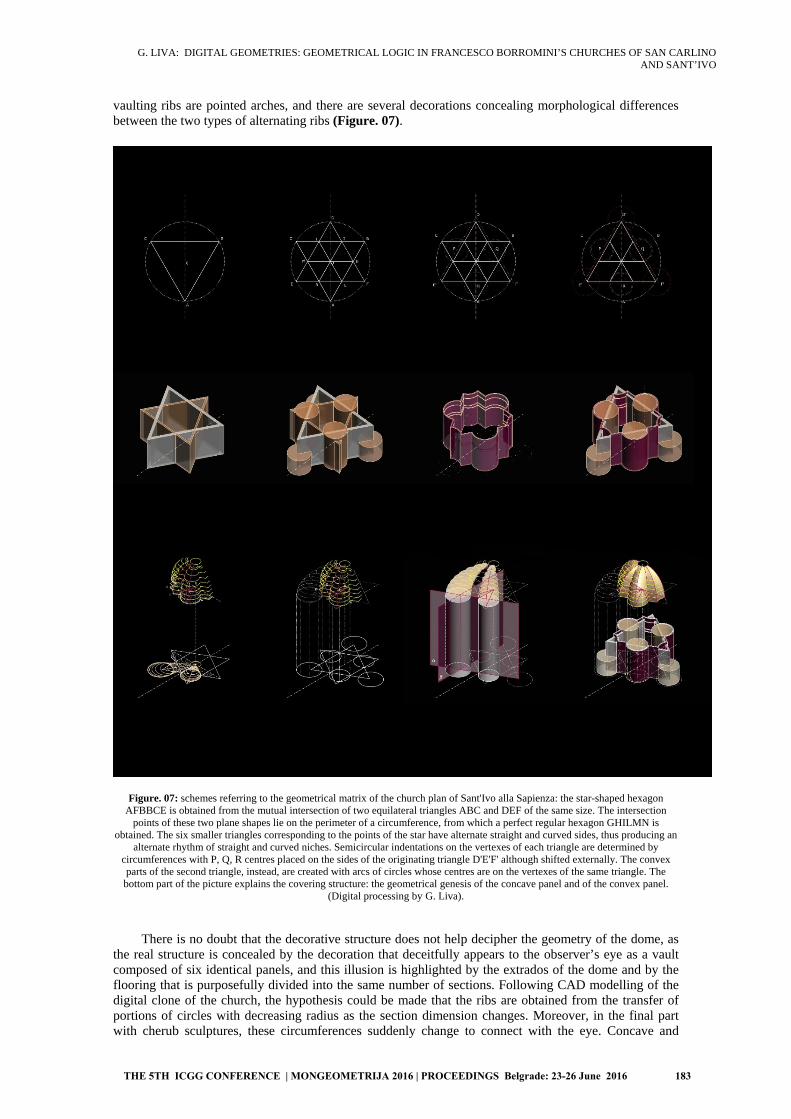
G. LIVA: DIGITAL GEOMETRIES: GEOMETRICAL LOGIC IN FRANCESCO BORROMINI’S CHURCHES OF SAN CARLINO AND SANT’IVO
vaulting ribs are pointed arches, and there are several decorations concealing morphological differences between the two types of alternating ribs (Figure. 07).
Figure. 07: schemes referring to the geometrical matrix of the church plan of Sant'Ivo alla Sapienza: the star-shaped hexagon AFBBCE is obtained from the mutual intersection of two equilateral triangles ABC and DEF of the same size. The intersection
points of these two plane shapes lie on the perimeter of a circumference, from which a perfect regular hexagon GHILMN is obtained. The six smaller triangles corresponding to the points of the star have alternate straight and curved sides, thus producing an
alternate rhythm of straight and curved niches. Semicircular indentations on the vertexes of each triangle are determined by circumferences with P, Q, R centres placed on the sides of the originating triangle D'E'F' although shifted externally. The convex parts of the second triangle, instead, are created with arcs of circles whose centres are on the vertexes of the same triangle. The bottom part of the picture explains the covering structure: the geometrical genesis of the concave panel and of the convex panel.
(Digital processing by G. Liva).
There is no doubt that the decorative structure does not help decipher the geometry of the dome, as the real structure is concealed by the decoration that deceitfully appears to the observer’s eye as a vault composed of six identical panels, and this illusion is highlighted by the extrados of the dome and by the flooring that is purposefully divided into the same number of sections. Following CAD modelling of the digital clone of the church, the hypothesis could be made that the ribs are obtained from the transfer of portions of circles with decreasing radius as the section dimension changes. Moreover, in the final part with cherub sculptures, these circumferences suddenly change to connect with the eye. Concave and
THE 5TH ICGG CONFERENCE | MONGEOMETRIJA 2016 | PROCEEDINGS Belgrade: 23-26 June 2016 183
G. LIVA: DIGITAL GEOMETRIES: GEOMETRICAL LOGIC IN FRANCESCO BORROMINI’S CHURCHES OF SAN CARLINO AND SANT’IVO
convex circle arcs have been virtually reconstructed by means of dividing the structure with parallel planes at different heights and producing the relevant panels: a concave or “cloister” panel, and a convex or “shell-shaped” panel.
CONCLUSIONS
This brief analysis of two well-known examples of Baroque architecture shows that the rational use of the computer has redefined the boundaries of application of the drawing technique, by adapting it to the most different types of language and paving the way for several interpretations and potential developments. Using the three-dimensional module is fundamental to study the architecture, and with just a mouse click it allows to simulate the creation of a plastic model, showing it from different perspectives, opening and closing it, assembling and disassembling it. The digital clone allows indeed to monitor and analyse old as well as new interventions, and to obtain a computerised model from CNC machines, by sculpting the matter or by simulating parts collapsed over time or partially incomplete, thus experiencing architecture from the inside, without neglecting the possibility of producing several pictures of the work under investigation. Orthogonal, axonometric or perspective projections, obtained by simply clicking on the icons of the software, undoubtedly provide an immediate view of the object, although they deprive the observer of any geometric construction. The study of the two Roman churches is centred around the idea of a model starting from an accurate geometrical and configuration analysis of the object, and leading to the production of a digital archetype. This archetype not only describes the object, but it also provides a complex numerical model thereof, which can be modified, sectioned and explored on several levels. Unlike surface or wireframe modelling, solid modelling produces 3D models with mathematical and geometrical properties allowing on-the-field interventions of joining or removing elements in order to produce the desired shape out of the shapeless block. The two virtual clones of the churches and the CAD drawing produced explanatory graphs, Monge projections, axonometric and perspective projections, all significant and useful tools to understand the total volumes of the churches, but also a few valuable architectural solutions on a reduced scale. Visible geometries and invisible plots that could be traced in the past only in the ingenious mind of their architect, now integrate and alternate in a skilful play of surfaces. The clever use of the automatic drawing reveals these wonders to the observer’s idle, too often blind eye. Digital instruments thus become fundamental to build a dialogue between mathematical science and creative expression, by revealing the structural and formal development of the analysed object through an adequate graphical representation retrieving the fundamental principles and applications of descriptive and projection geometry in architecture.
References
Argan G.C., 1978. Borromini, Sansoni Editori (collana Saggi), Milano.
Connors J., 1999. Un teorema sacro: San Carlo alle Quattro Fontane, in Il giovane Borromini. Dagli esordi a San Carlo alle Quattro Fontane, catalogo della mostra, a cura di M. Kahn Rossi, M. Franciolli, Milano. pp. 459-495.
Connors J., 2000. San Carlo alle Quattro Fontane, in Borromini e l'universo barocco, catalogo della mostra, a cura di R. Bosel, C.L. Frommel, Milano. pp. 106-127.
Frommel C.L., Sladek E. (a cura di), 2000. Francesco Borromini: Atti del convegno internazionale. Roma 13-15 gennaio 2000, Electa, Milano.
Migliari R., 2000. La rappresentazione e il controllo dello spazio: morte e trasfigurazione della Geometria descrittiva, in Disegnare Idee Immagini, Gangemi editore, n.20/21 – 2000. pp. 9-17.
Portoghesi P., 2006. Leggere e capire l'architettura, Newton Compton editori, Roma.
Portoghesi P., 1967. Borromini. Architettura come linguaggio, Milano 1967, pp. 39-50.
THE 5TH ICGG CONFERENCE | MONGEOMETRIJA 2016 | PROCEEDINGS Belgrade: 23-26 June 2016 184

G. LIVA: DIGITAL GEOMETRIES: GEOMETRICAL LOGIC IN FRANCESCO BORROMINI’S CHURCHES OF SAN CARLINO AND SANT’IVO
Saggio A., 2009. Interpretazioni del capolavoro di Borromini alla Sapienza. Il motivo del doppio e altre considerazioni, in Disegnare Idee Immagini, Gangemi editore, n.39/2009 pp. 50-59.
Sedlmayr H., 1996. L' architettura di Borromini, M. Pogacnik (a cura di) Mondadori, Milano 1996 (2002).
Wittkower R., 1958. Arte e architettura in Italia 1600-1750, Einaudi, Torino 1993.
THE 5TH ICGG CONFERENCE | MONGEOMETRIJA 2016 | PROCEEDINGS Belgrade: 23-26 June 2016 185
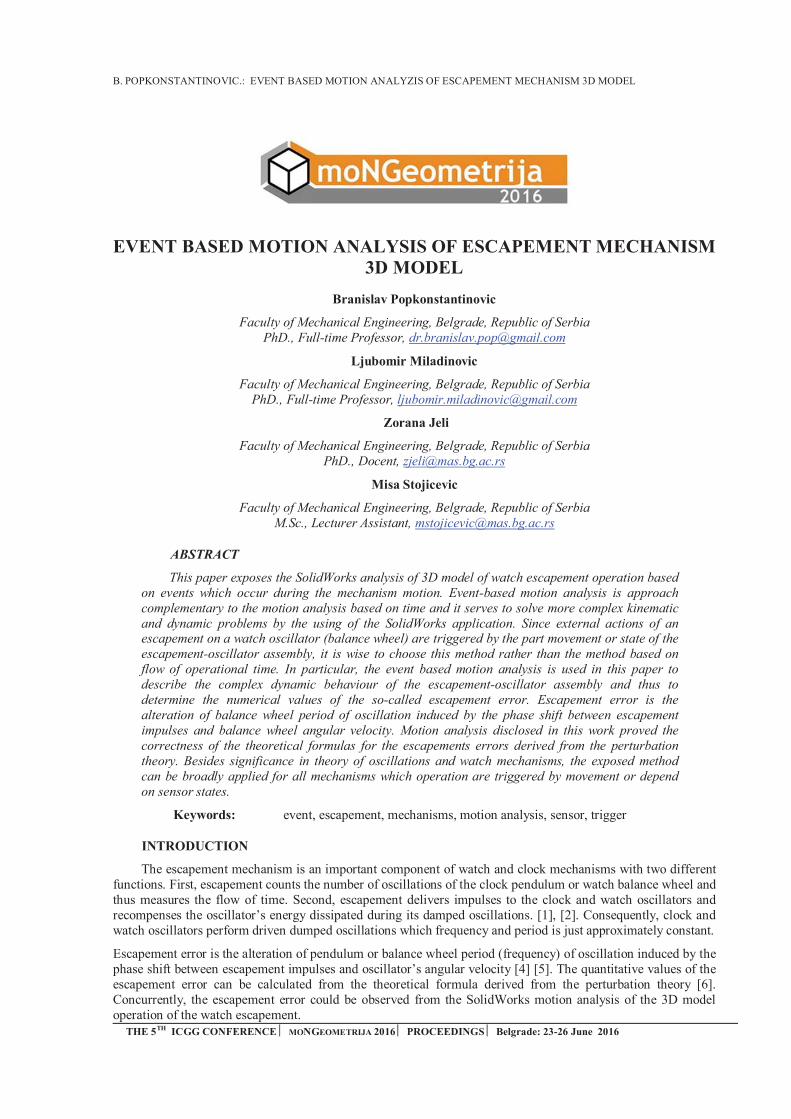
Djordje
Typewritten Text
186

Djordje
Typewritten Text
Djordje
Typewritten Text
187

Djordje
Typewritten Text
188
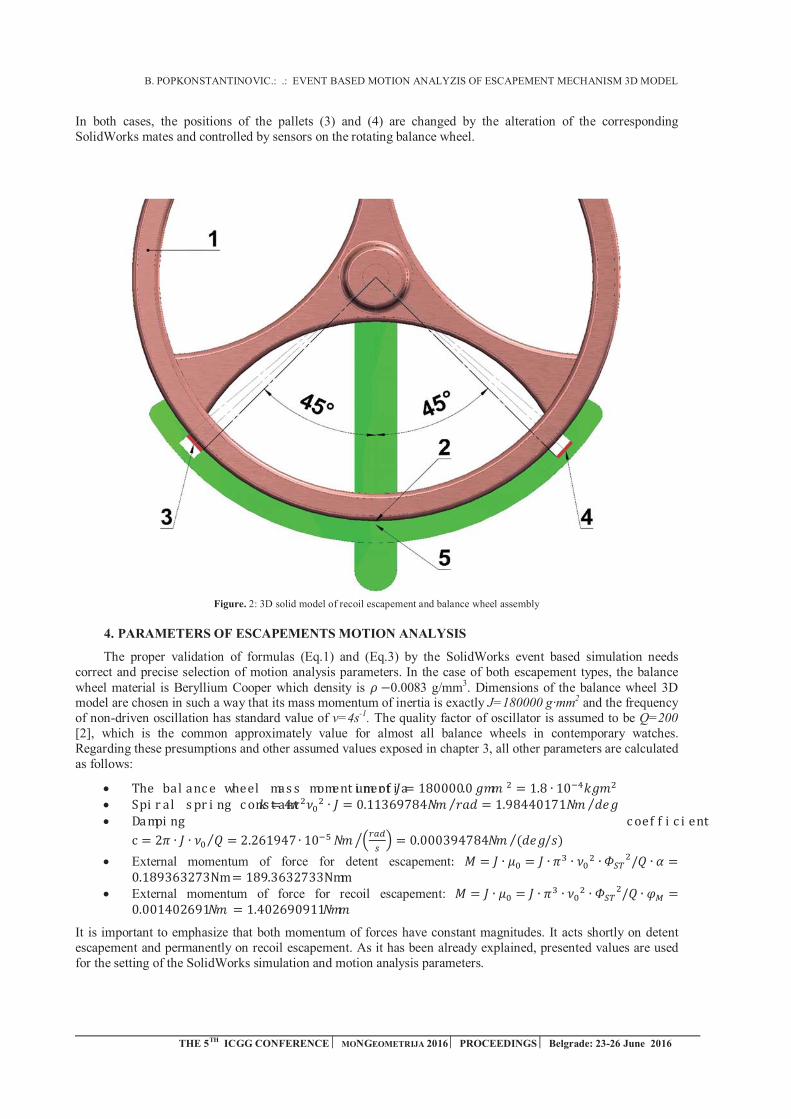
Djordje
Typewritten Text
189
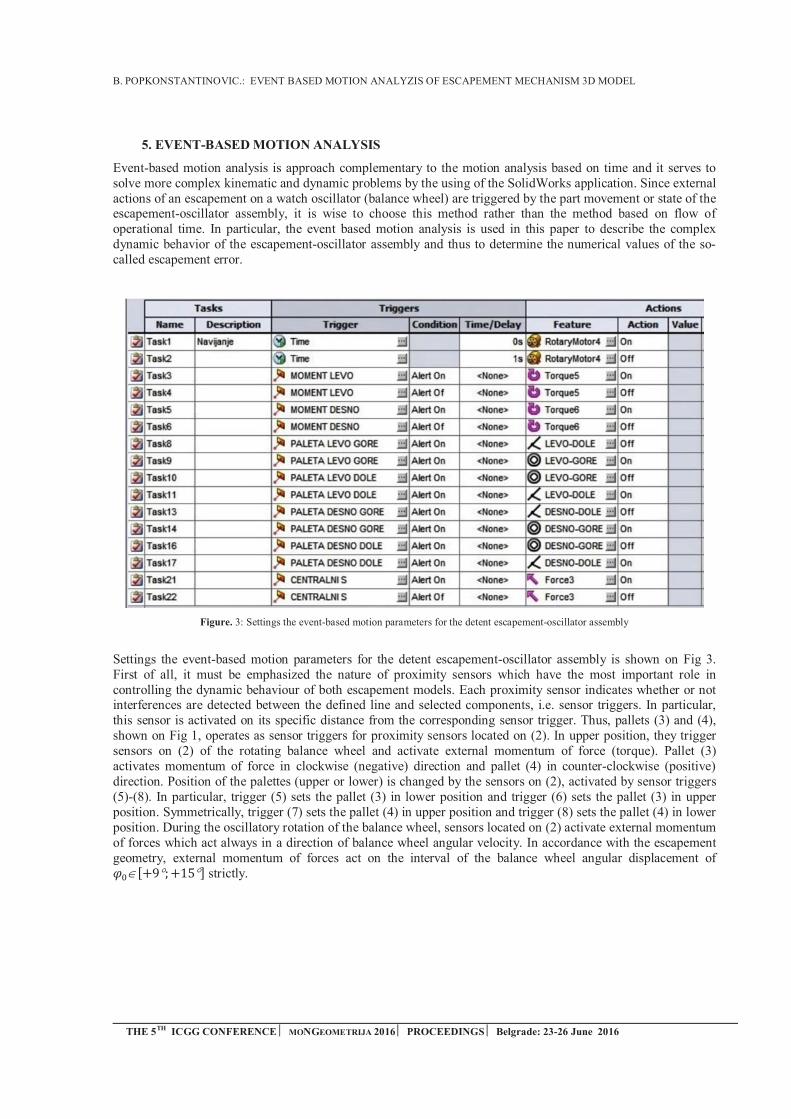
Djordje
Typewritten Text
190
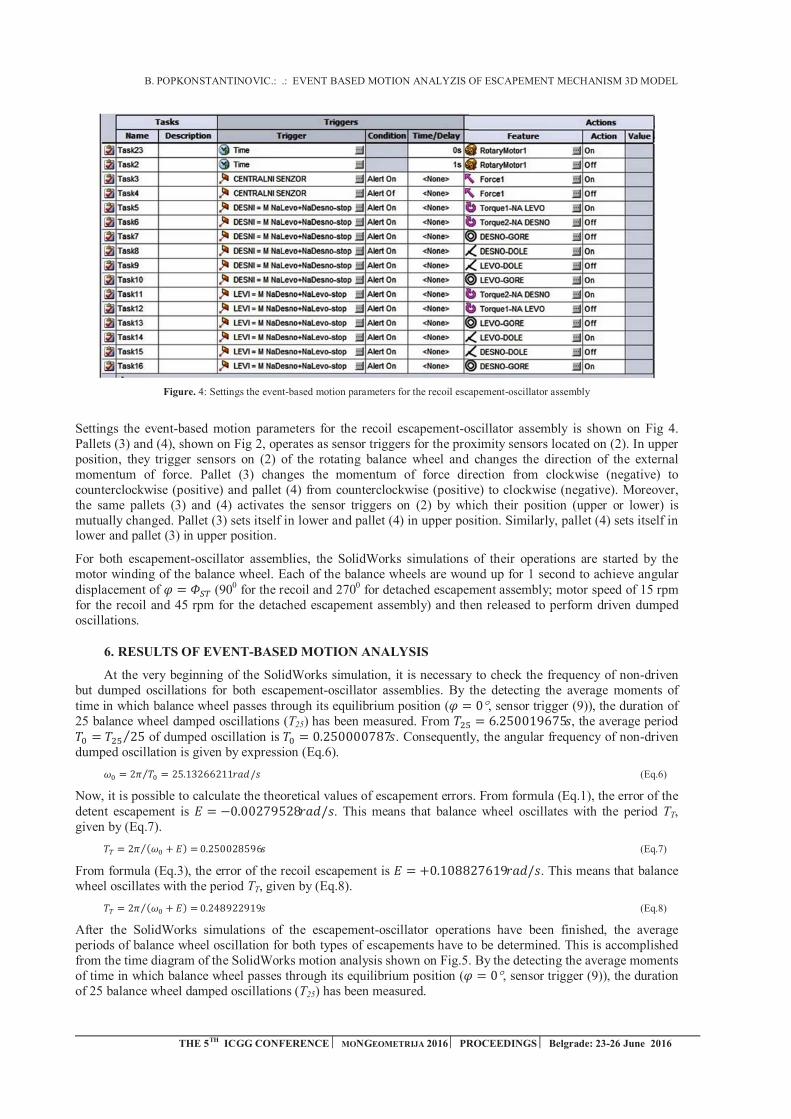
Djordje
Typewritten Text
191

Djordje
Typewritten Text
192

Djordje
Typewritten Text
193
D. DRAGAN ET AL.: EXAMPLES OF RAPID DEVELOPMENT OF 3D CONTENT USING WPF AND HELIX TOOLKIT
THE 5TH ICGG CONFERENCE MONGEOMETRIJA 2016 PROCEEDINGS Belgrade: 23-26 June 2016 194
EXAMPLES OF RAPID DEVELOPMENT OF 3D CONTENT USING WINDOWS PRESENTATION FOUNDATION AND HELIX TOOLKIT
Dinu Dragan
Faculty of Technical Science, University of Novi Sad, Novi Sad, Serbia PhD, Assistant Professor, [email protected]
Srdan Mihic
DOOB Innovation Studio DOO, Novi Sad, Serbia MSc, Software Architect, [email protected]
Dragan Ivetic
Faculty of Technical Science, University of Novi Sad, Novi Sad, Serbia PhD, Full Professor, [email protected]
ABSTRACT
The authors experience in working with Helix Toolkit, a 3D software library for Microsoft .NET, is reported in this paper. Software prototyping is a valuable method of gaining user feedback early in the project development. However, in software projects based on Computer Graphics and/or Computer Vision it is not easy to rapidly develop a software prototype. A substantial time is needed to develop a proprietary game engine or a 3D visualization system. In projects where 3D content is used to visualize results of other software modules, waiting for the 3D visualization prototype could prolong the initial feedback from users to the later phases of project development. If developers do not wait for 3D content visualization prototype, then user feedback is usually based on an incomplete software prototype. Parts of the software prototype that should contain 3D content are left blank and to the users’ imagination. Authors of the paper had the opportunity to work on several such projects and to experience the problem of choosing whether to show prototypes with blank parts or to wait for the development of the 3D content visualization system/prototype. Ultimately, a third solution was used, where a third party software plugin was used for rapid 3D content visualization prototype development. Helix Toolkit was used in projects that were developed using Microsoft Visual Studio C# and WPF (Windows Presentation Foundation). This toolkit is a higher level API for working with 3D content in WPF built upon the 3D functionality of WPF. Its usage is demonstrated in two projects: visualization of a multidimensional quality evaluation system and visualization of 3D body meshes automatically generated.
Keywords: 3D graphics, 3D data visualization, rapid software prototyping, multidimensional data evaluation, 3D software tools, WPF, Helix Toolkit
1. INTRODUCTION
Software prototyping is a long standing part of software development [1]. It is integral part of Many modern software development methodologies [1] such as spiral software development, rapid prototyping, agile software development, etc. Software prototype usually refers to a software sample or an early, incomplete, version of a software product [2]. It is usually used to simulate only a few aspects of the final software product which could be discarded or evolved into the final software product.
Software prototyping, the activity of creating software prototype, brings several benefits to software production:
getting valuable user feedback early in the software development, early evaluation of software design, early comparison of the software implementation with the software specification, early discovery of additional software requirements, proof of concept.
D. DRAGAN ET AL.: EXAMPLES OF RAPID DEVELOPMENT OF 3D CONTENT USING WPF AND HELIX TOOLKIT
195 THE 5TH ICGG CONFERENCE MONGEOMETRIJA 2016 PROCEEDINGS Belgrade: 23-26 June 2016
Fast software prototyping in computer graphics and computer vision, however, is very challenging [3, 4]. Developing a proprietary game engine or a 3D based visualisation system usually requires a substantial amount of time. This could prolong the initial user feedback to later stages of software development. In software projects where 3D content is used to visualize the result of other software modules, this could represent an issue. Some modules could be finished early, but it would not be possible to demonstrate their functionality to the users in a meaningful way, as there is no module for result visualization. In that cases user evaluations or software project inspections could be based on an incomplete software prototype. Parts of the prototype are either left empty or they include some exemplar static images, and, in either way, a lot is left to the users’ imagination.
Even in pure computer graphics software projects, such as game development, it is not acceptable that the initial software prototyping phase lasts too long [5]. Instead, game designer often uses some well establish game platforms such as Unity or Unreal Engine for rapid game prototyping. Often this is used as proof of concept and only after the initial game setup is established game development continues into the next phase.
Similar to the game development, when there is a need to present 3D content, and the 3D visualization module is not finished yet, software developers could use third party software libraries to rapidly develop 3D content visualization prototype(s). If the third party software library contains all the necessary features, visualization part of the software project could be developed completely using the library. One such third party software library for 3D content visualization and manipulation is described in the paper.
Several our projects have been developed using Microsoft Visual Studio software tool, C# programming language, and WPF (Windows Presentation Foundation) graphical subsystem. In these projects 3D content visualization as well as user insight in early project development stages was needed. For 3D content presentation we used Helix Toolkit [6] which is a higher level API for working with 3D content built upon the 3D functionality of WPF. It extends WPF functionality and provides simpler interface through a collection of controls and helper classes. We used Helix Toolkit in several projects that needed visualization of 3D content. Two of those projects are chosen to demonstrate the usage and features of Helix Toolkit.
In the first project we developed a prototype for visualization of multidimensional quality evaluation system (referred to in short as evaluation visualization project in the rest of the paper). Two types of visualization techniques have been used to present results: two-dimensional parallel (2DP) coordinates and extended clustered multi-relational parallel (ECMRP) coordinates. Built in two-dimensional graphical capabilities of PWF were used for 2DP coordinates and Helix Toolkit was used for ECMP coordinates.
In the second project, that is still ongoing, we are working on automatic mesh creation algorithms (referred to as mesh creation project in the rest of the paper). In the early stage of project, we needed to demonstrate to the clients processing pipeline of the future software. One of the requirements was to show the clients how the software will handle mesh visualization and manipulation. As we still did not have our visualization module developed nor were the mesh creation algorithms finished, we used Helix Toolkit to demonstrate how the mesh will be presented and manipulated.
The organization of the paper is as follows. 3D content visualization in WPF is briefly described in Section 2. Helix Toolkit is described in Section 3. The same example is used in Section 2 and 3 to distinguish the difference between the WPF managed 3D scene and Helix Toolkit generated scene. Use of Helix Toolkit in two example projects is demonstrated in Section 4. Section 5 concludes the paper.
2. WPF 3D CONTENT VISUALIZATION
As WPF is a wrapper around the DirectX it provides a complete 3D support with animation capabilities [7]. Many of WPF graphics utilities are actually managed wrappers and extensions of DirectX. Essentially, all of WPF drawings are 3D. With adequate graphic controllers they could be hardware accelerated.
Creation of 3D content in WPF and creation in DirectX differs in two ways. The first difference arises from fact that WPF 3D content has to be drawn in parallel with the rest of WPF controls which are usually rendered in retained mode. All of the graphics placed on the form are retained until explicitly disposed and which part of the graphics is re-drawn is system controlled. When rendered on screen there is a possibility that some parts of the controls or entire controls are not visible and, in that case, operative system will not re-draw that parts or controls. However, when some parts of the control or the entire control become visible again, they are scheduled by system for re-drawing. DirectX base computer games actually work in the so called immediate mode. Re-drawing is application controlled and every time new frame is displayed the software has to explicitly draw the entire scene.

D. DRAGAN ET AL.: EXAMPLES OF RAPID DEVELOPMENT OF 3D CONTENT USING WPF AND HELIX TOOLKIT
THE 5TH ICGG CONFERENCE MONGEOMETRIJA 2016 PROCEEDINGS Belgrade: 23-26 June 2016 196
Like the rest of the WPF graphics, 3D content is rendered in retained mode. 3D scene is initialized and the rest of the time its rendering is system controlled. Animation effects are achieved by translating, scaling, and rotating objects in a scene and/or by translating the viewing position.
The second big difference between WPF and DirectX is that WPF supports both a descriptive and a procedural way of creating models and views. So, it is possible to create the same scene using only XAML code (descriptive way) and/or using only C# code (procedural way). No matter which way of describing 3D scene is used, the result is the same. Also, it is possible to combine those two ways of creating 3D content. For example, it is possible to create some graphics objects in XAML and then manipulate them in C# code.
The easiest way of creating static 3D content in WPF is using XAML code. Example of a cube created in XAML is shown in Figure 1. The examples presented in this section are taken and modified from [7].
Figure. 1: A cube created using WPF
XAML code used to generate the cube from Figure 1 is shown in Listing 1. All the code regarding 3D content is included inside Viewport3D XAML element which controls how the 3D graphic is converted into 2D graphic and how it is rendered on screen. It is usually placed in a XAML container element, such as Grid or Canvas. These container objects are used for placing XAML controls on Form and for controlling their layout and display. In the example from Listing 1, Grid control is used to display Viewport3D and 3D content.
3D content conversion into 2D is controlled through camera object. Camera object defines position in space from which the cube is observed, the direction in which camera points, and the camera orientation (UpDirection attribute of the PerspectiveCamera XAML element).
Rest of the XAML code defines the geometry of the cube through two ModelVisual3D XAML elements. The ModelVisual3D element provides common services for 3D content manipulation and rendering. The first ModelVisual3D element is used to define the lightening of the scene. White directional light is used.
The second ModelVisual3D element is used to define the mesh for rendering. XAML GeometryModel3D element is used for defining the mesh. Mesh in WPF is created using sets of vertices and index arrays which define mesh triangles. Although in the example this is done manually, it is possible to create the mesh in some 3D graphical tool such as Maya or 3DMax and then to import the mesh data created into the XAML code.
To get the realistic 3D scene/object, material is attached to the mesh. In the example blue diffuse material is used to simulate that the cube is covered with blue matt paint.
Equivalent result to aforementioned XAML can be achieved using C# code. The example of the cube from Figure 1 generated using C# code is shown in Listing 2. As it can be observed from Listing 2 classes that correspond to the XAML elements from Listing 1 are used. The correspondence is one on one and fairly obvious. The coded needed to describe the cube geometry is defined in a method called MCube. All the rest of the code needed to construct the 3D model and its view is contained in a method Window_Loaded used for handling the Window Load event. This is the method that will be called after the window initialization and before it is displayed for the first time.
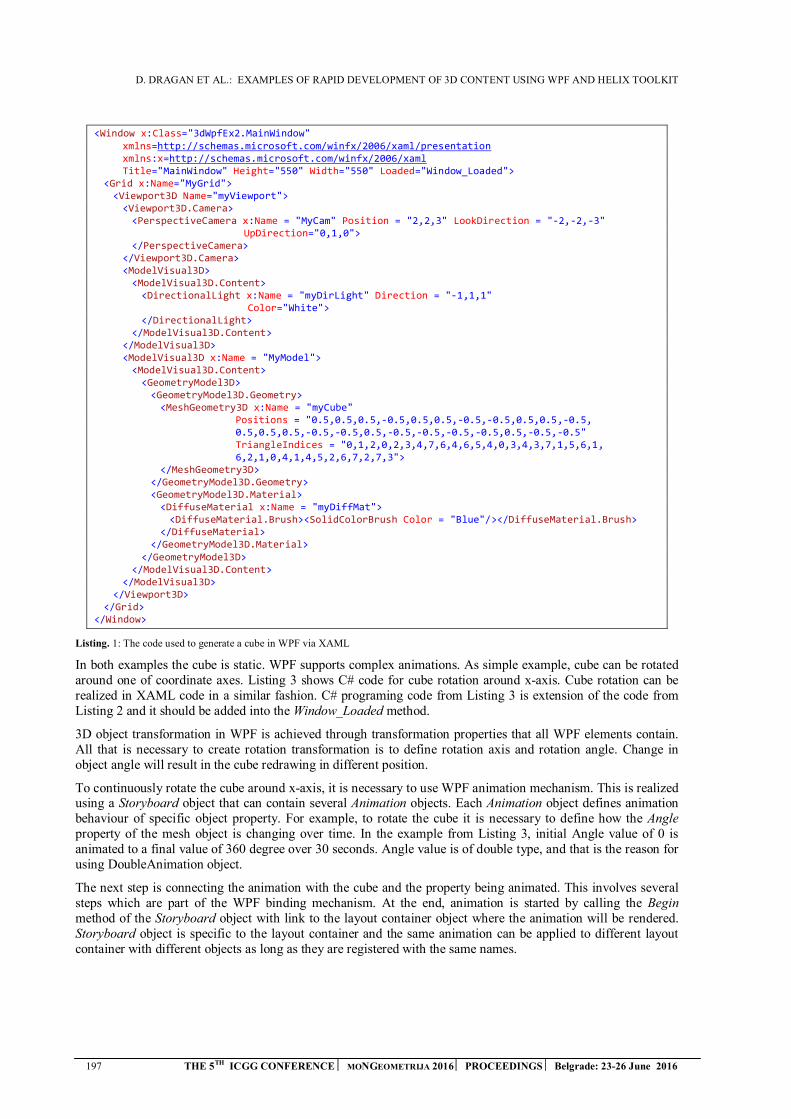
D. DRAGAN ET AL.: EXAMPLES OF RAPID DEVELOPMENT OF 3D CONTENT USING WPF AND HELIX TOOLKIT
197 THE 5TH ICGG CONFERENCE MONGEOMETRIJA 2016 PROCEEDINGS Belgrade: 23-26 June 2016
<Window x:Class="3dWpfEx2.MainWindow" xmlns=http://schemas.microsoft.com/winfx/2006/xaml/presentation xmlns:x=http://schemas.microsoft.com/winfx/2006/xaml Title="MainWindow" Height="550" Width="550" Loaded="Window_Loaded">
<Grid x:Name="MyGrid"> <Viewport3D Name="myViewport"> <Viewport3D.Camera> <PerspectiveCamera x:Name = "MyCam" Position = "2,2,3" LookDirection = "-2,-2,-3"
UpDirection="0,1,0"> </PerspectiveCamera> </Viewport3D.Camera> <ModelVisual3D> <ModelVisual3D.Content> <DirectionalLight x:Name = "myDirLight" Direction = "-1,1,1"
Color="White"> </DirectionalLight>
</ModelVisual3D.Content> </ModelVisual3D> <ModelVisual3D x:Name = "MyModel"> <ModelVisual3D.Content> <GeometryModel3D> <GeometryModel3D.Geometry> <MeshGeometry3D x:Name = "myCube"
Positions = "0.5,0.5,0.5,-0.5,0.5,0.5,-0.5,-0.5,0.5,0.5,-0.5, 0.5,0.5,0.5,-0.5,-0.5,0.5,-0.5,-0.5,-0.5,-0.5,0.5,-0.5,-0.5" TriangleIndices = "0,1,2,0,2,3,4,7,6,4,6,5,4,0,3,4,3,7,1,5,6,1, 6,2,1,0,4,1,4,5,2,6,7,2,7,3">
</MeshGeometry3D> </GeometryModel3D.Geometry> <GeometryModel3D.Material> <DiffuseMaterial x:Name = "myDiffMat"> <DiffuseMaterial.Brush><SolidColorBrush Color = "Blue"/></DiffuseMaterial.Brush>
</DiffuseMaterial> </GeometryModel3D.Material>
</GeometryModel3D> </ModelVisual3D.Content>
</ModelVisual3D> </Viewport3D>
</Grid> </Window>
Listing. 1: The code used to generate a cube in WPF via XAML
In both examples the cube is static. WPF supports complex animations. As simple example, cube can be rotated around one of coordinate axes. Listing 3 shows C# code for cube rotation around x-axis. Cube rotation can be realized in XAML code in a similar fashion. C# programing code from Listing 3 is extension of the code from Listing 2 and it should be added into the Window_Loaded method.
3D object transformation in WPF is achieved through transformation properties that all WPF elements contain. All that is necessary to create rotation transformation is to define rotation axis and rotation angle. Change in object angle will result in the cube redrawing in different position.
To continuously rotate the cube around x-axis, it is necessary to use WPF animation mechanism. This is realized using a Storyboard object that can contain several Animation objects. Each Animation object defines animation behaviour of specific object property. For example, to rotate the cube it is necessary to define how the Angle property of the mesh object is changing over time. In the example from Listing 3, initial Angle value of 0 is animated to a final value of 360 degree over 30 seconds. Angle value is of double type, and that is the reason for using DoubleAnimation object.
The next step is connecting the animation with the cube and the property being animated. This involves several steps which are part of the WPF binding mechanism. At the end, animation is started by calling the Begin method of the Storyboard object with link to the layout container object where the animation will be rendered. Storyboard object is specific to the layout container and the same animation can be applied to different layout container with different objects as long as they are registered with the same names.
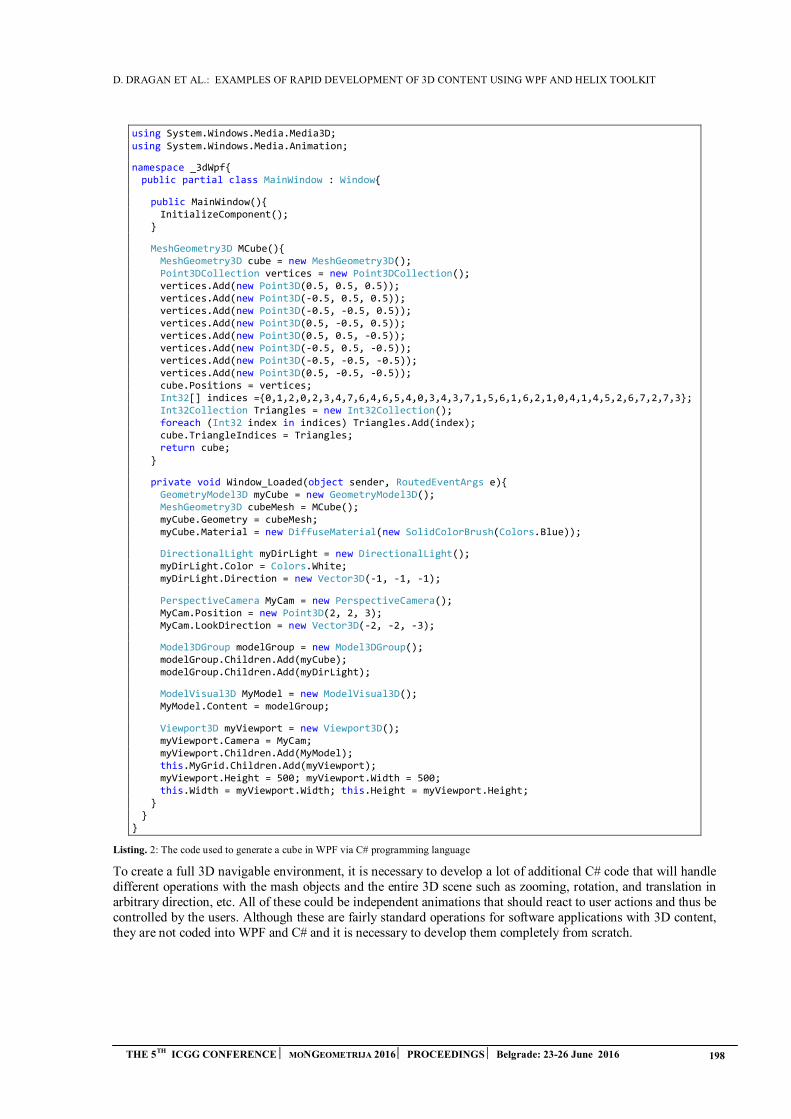
D. DRAGAN ET AL.: EXAMPLES OF RAPID DEVELOPMENT OF 3D CONTENT USING WPF AND HELIX TOOLKIT
THE 5TH ICGG CONFERENCE MONGEOMETRIJA 2016 PROCEEDINGS Belgrade: 23-26 June 2016 198
using System.Windows.Media.Media3D; using System.Windows.Media.Animation;
namespace _3dWpf{ public partial class MainWindow : Window{
public MainWindow(){ InitializeComponent();
}
MeshGeometry3D MCube(){ MeshGeometry3D cube = new MeshGeometry3D(); Point3DCollection vertices = new Point3DCollection(); vertices.Add(new Point3D(0.5, 0.5, 0.5)); vertices.Add(new Point3D(-0.5, 0.5, 0.5)); vertices.Add(new Point3D(-0.5, -0.5, 0.5)); vertices.Add(new Point3D(0.5, -0.5, 0.5)); vertices.Add(new Point3D(0.5, 0.5, -0.5)); vertices.Add(new Point3D(-0.5, 0.5, -0.5)); vertices.Add(new Point3D(-0.5, -0.5, -0.5)); vertices.Add(new Point3D(0.5, -0.5, -0.5)); cube.Positions = vertices; Int32[] indices ={0,1,2,0,2,3,4,7,6,4,6,5,4,0,3,4,3,7,1,5,6,1,6,2,1,0,4,1,4,5,2,6,7,2,7,3}; Int32Collection Triangles = new Int32Collection(); foreach (Int32 index in indices) Triangles.Add(index); cube.TriangleIndices = Triangles; return cube;
}
private void Window_Loaded(object sender, RoutedEventArgs e){ GeometryModel3D myCube = new GeometryModel3D(); MeshGeometry3D cubeMesh = MCube(); myCube.Geometry = cubeMesh; myCube.Material = new DiffuseMaterial(new SolidColorBrush(Colors.Blue));
DirectionalLight myDirLight = new DirectionalLight(); myDirLight.Color = Colors.White; myDirLight.Direction = new Vector3D(-1, -1, -1);
PerspectiveCamera MyCam = new PerspectiveCamera(); MyCam.Position = new Point3D(2, 2, 3); MyCam.LookDirection = new Vector3D(-2, -2, -3);
Model3DGroup modelGroup = new Model3DGroup(); modelGroup.Children.Add(myCube); modelGroup.Children.Add(myDirLight);
ModelVisual3D MyModel = new ModelVisual3D(); MyModel.Content = modelGroup;
Viewport3D myViewport = new Viewport3D(); myViewport.Camera = MyCam; myViewport.Children.Add(MyModel); this.MyGrid.Children.Add(myViewport); myViewport.Height = 500; myViewport.Width = 500; this.Width = myViewport.Width; this.Height = myViewport.Height;
} }
}
Listing. 2: The code used to generate a cube in WPF via C# programming language
To create a full 3D navigable environment, it is necessary to develop a lot of additional C# code that will handle different operations with the mash objects and the entire 3D scene such as zooming, rotation, and translation in arbitrary direction, etc. All of these could be independent animations that should react to user actions and thus be controlled by the users. Although these are fairly standard operations for software applications with 3D content, they are not coded into WPF and C# and it is necessary to develop them completely from scratch.
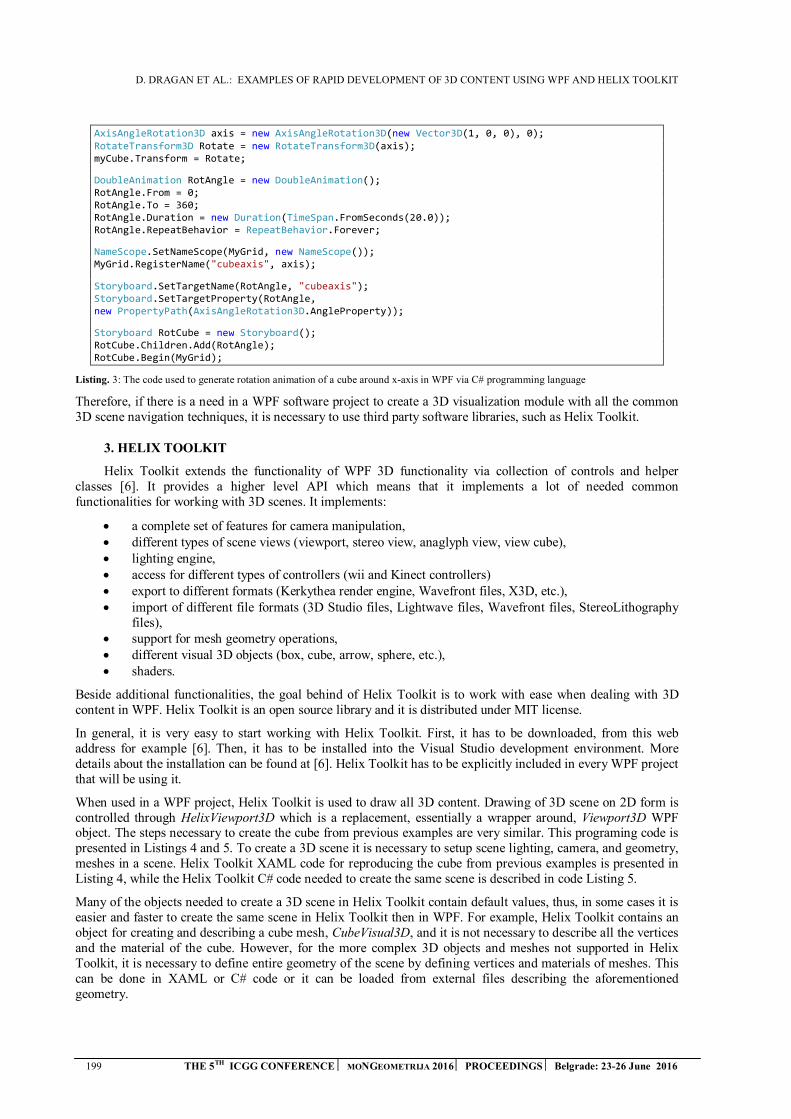
D. DRAGAN ET AL.: EXAMPLES OF RAPID DEVELOPMENT OF 3D CONTENT USING WPF AND HELIX TOOLKIT
199 THE 5TH ICGG CONFERENCE MONGEOMETRIJA 2016 PROCEEDINGS Belgrade: 23-26 June 2016
AxisAngleRotation3D axis = new AxisAngleRotation3D(new Vector3D(1, 0, 0), 0); RotateTransform3D Rotate = new RotateTransform3D(axis); myCube.Transform = Rotate;
DoubleAnimation RotAngle = new DoubleAnimation(); RotAngle.From = 0; RotAngle.To = 360; RotAngle.Duration = new Duration(TimeSpan.FromSeconds(20.0)); RotAngle.RepeatBehavior = RepeatBehavior.Forever;
NameScope.SetNameScope(MyGrid, new NameScope()); MyGrid.RegisterName("cubeaxis", axis);
Storyboard.SetTargetName(RotAngle, "cubeaxis"); Storyboard.SetTargetProperty(RotAngle, new PropertyPath(AxisAngleRotation3D.AngleProperty));
Storyboard RotCube = new Storyboard(); RotCube.Children.Add(RotAngle); RotCube.Begin(MyGrid);
Listing. 3: The code used to generate rotation animation of a cube around x-axis in WPF via C# programming language
Therefore, if there is a need in a WPF software project to create a 3D visualization module with all the common 3D scene navigation techniques, it is necessary to use third party software libraries, such as Helix Toolkit.
3. HELIX TOOLKIT
Helix Toolkit extends the functionality of WPF 3D functionality via collection of controls and helper classes [6]. It provides a higher level API which means that it implements a lot of needed common functionalities for working with 3D scenes. It implements:
a complete set of features for camera manipulation, different types of scene views (viewport, stereo view, anaglyph view, view cube), lighting engine, access for different types of controllers (wii and Kinect controllers) export to different formats (Kerkythea render engine, Wavefront files, X3D, etc.), import of different file formats (3D Studio files, Lightwave files, Wavefront files, StereoLithography
files), support for mesh geometry operations, different visual 3D objects (box, cube, arrow, sphere, etc.), shaders.
Beside additional functionalities, the goal behind of Helix Toolkit is to work with ease when dealing with 3D content in WPF. Helix Toolkit is an open source library and it is distributed under MIT license.
In general, it is very easy to start working with Helix Toolkit. First, it has to be downloaded, from this web address for example [6]. Then, it has to be installed into the Visual Studio development environment. More details about the installation can be found at [6]. Helix Toolkit has to be explicitly included in every WPF project that will be using it.
When used in a WPF project, Helix Toolkit is used to draw all 3D content. Drawing of 3D scene on 2D form is controlled through HelixViewport3D which is a replacement, essentially a wrapper around, Viewport3D WPF object. The steps necessary to create the cube from previous examples are very similar. This programing code is presented in Listings 4 and 5. To create a 3D scene it is necessary to setup scene lighting, camera, and geometry, meshes in a scene. Helix Toolkit XAML code for reproducing the cube from previous examples is presented in Listing 4, while the Helix Toolkit C# code needed to create the same scene is described in code Listing 5.
Many of the objects needed to create a 3D scene in Helix Toolkit contain default values, thus, in some cases it is easier and faster to create the same scene in Helix Toolkit then in WPF. For example, Helix Toolkit contains an object for creating and describing a cube mesh, CubeVisual3D, and it is not necessary to describe all the vertices and the material of the cube. However, for the more complex 3D objects and meshes not supported in Helix Toolkit, it is necessary to define entire geometry of the scene by defining vertices and materials of meshes. This can be done in XAML or C# code or it can be loaded from external files describing the aforementioned geometry.

D. DRAGAN ET AL.: EXAMPLES OF RAPID DEVELOPMENT OF 3D CONTENT USING WPF AND HELIX TOOLKIT
THE 5TH ICGG CONFERENCE MONGEOMETRIJA 2016 PROCEEDINGS Belgrade: 23-26 June 2016 200
<Window x:Class="HTWpf.MainWindow" xmlns="http://schemas.microsoft.com/winfx/2006/xaml/presentation" xmlns:x="http://schemas.microsoft.com/winfx/2006/xaml" xmlns:h="http://helix-toolkit.org/wpf" Title="MainWindow" Height="350" Width="525">
<h:HelixViewport3D > <h:HelixViewport3D.DefaultCamera> <PerspectiveCamera Position="2, 2, 3" LookDirection="-2, -2, -3"/>
</h:HelixViewport3D.DefaultCamera> <h: Position="-1, -1, -1" Color="White"/> <h:CubeVisual3D/>
</h:HelixViewport3D> </Window>
Listing. 4: The code used to generate a cube in Helix Toolkit via XAML
using System.Windows.Media.Media3D; using HelixToolkit; using HelixToolkit.Wpf;
namespace HTWpf { public partial class MainWindow : Window { public MainWindow() { InitializeComponent(); Create3DViewPort();
}
private void Create3DViewPort() { var hVp3D = new HelixViewport3D();
var myLight = new DefaultLights();
var myCube = new CubeVisual3D();
var myCamera = new PerspectiveCamera(); myCamera.Position = new Point3D(2, 2, 3); myCamera.LookDirection = new Vector3D(-2, -2, -3); hVp3D.Camera = myCamera;
hVp3D.Children.Add(myLight); hVp3D.Children.Add(myCube); this.AddChild(hVp3D);
} }
}
Listing. 5: The code used to generate a cube in Helix Toolkit via C#
The resulting cube from both code Listings 4 and 5 is presented in Figure 2. Although it looks the same as the cube from Figure 1 which is the resulting cube of the both codes from Listings 1 and 2, the cube and the 3D scene generated using Helix Toolkit is much more interactive than the scene created using original WPF graphics.
Figure. 2: A cube created using Helix Toolkit
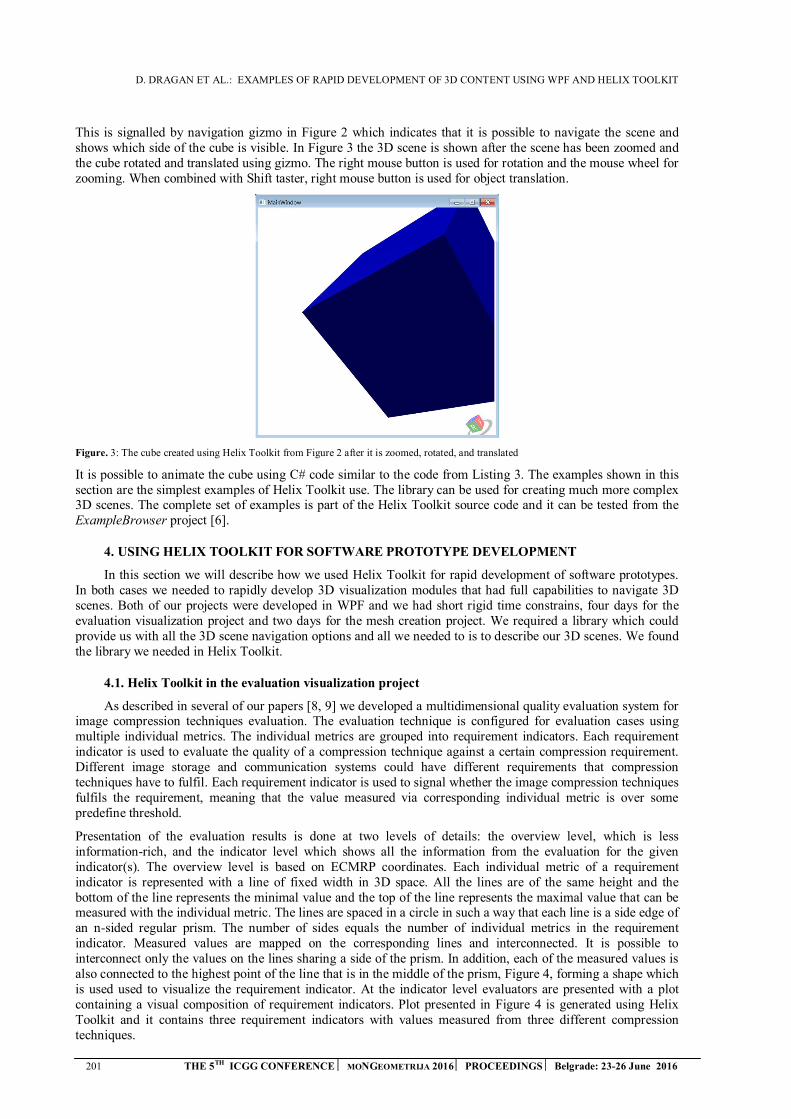
D. DRAGAN ET AL.: EXAMPLES OF RAPID DEVELOPMENT OF 3D CONTENT USING WPF AND HELIX TOOLKIT
201 THE 5TH ICGG CONFERENCE MONGEOMETRIJA 2016 PROCEEDINGS Belgrade: 23-26 June 2016
This is signalled by navigation gizmo in Figure 2 which indicates that it is possible to navigate the scene and shows which side of the cube is visible. In Figure 3 the 3D scene is shown after the scene has been zoomed and the cube rotated and translated using gizmo. The right mouse button is used for rotation and the mouse wheel for zooming. When combined with Shift taster, right mouse button is used for object translation.
Figure. 3: The cube created using Helix Toolkit from Figure 2 after it is zoomed, rotated, and translated
It is possible to animate the cube using C# code similar to the code from Listing 3. The examples shown in this section are the simplest examples of Helix Toolkit use. The library can be used for creating much more complex 3D scenes. The complete set of examples is part of the Helix Toolkit source code and it can be tested from the ExampleBrowser project [6].
4. USING HELIX TOOLKIT FOR SOFTWARE PROTOTYPE DEVELOPMENT
In this section we will describe how we used Helix Toolkit for rapid development of software prototypes. In both cases we needed to rapidly develop 3D visualization modules that had full capabilities to navigate 3D scenes. Both of our projects were developed in WPF and we had short rigid time constrains, four days for the evaluation visualization project and two days for the mesh creation project. We required a library which could provide us with all the 3D scene navigation options and all we needed to is to describe our 3D scenes. We found the library we needed in Helix Toolkit.
4.1. Helix Toolkit in the evaluation visualization project
As described in several of our papers [8, 9] we developed a multidimensional quality evaluation system for image compression techniques evaluation. The evaluation technique is configured for evaluation cases using multiple individual metrics. The individual metrics are grouped into requirement indicators. Each requirement indicator is used to evaluate the quality of a compression technique against a certain compression requirement. Different image storage and communication systems could have different requirements that compression techniques have to fulfil. Each requirement indicator is used to signal whether the image compression techniques fulfils the requirement, meaning that the value measured via corresponding individual metric is over some predefine threshold.
Presentation of the evaluation results is done at two levels of details: the overview level, which is less information-rich, and the indicator level which shows all the information from the evaluation for the given indicator(s). The overview level is based on ECMRP coordinates. Each individual metric of a requirement indicator is represented with a line of fixed width in 3D space. All the lines are of the same height and the bottom of the line represents the minimal value and the top of the line represents the maximal value that can be measured with the individual metric. The lines are spaced in a circle in such a way that each line is a side edge of an n-sided regular prism. The number of sides equals the number of individual metrics in the requirement indicator. Measured values are mapped on the corresponding lines and interconnected. It is possible to interconnect only the values on the lines sharing a side of the prism. In addition, each of the measured values is also connected to the highest point of the line that is in the middle of the prism, Figure 4, forming a shape which is used used to visualize the requirement indicator. At the indicator level evaluators are presented with a plot containing a visual composition of requirement indicators. Plot presented in Figure 4 is generated using Helix Toolkit and it contains three requirement indicators with values measured from three different compression techniques.
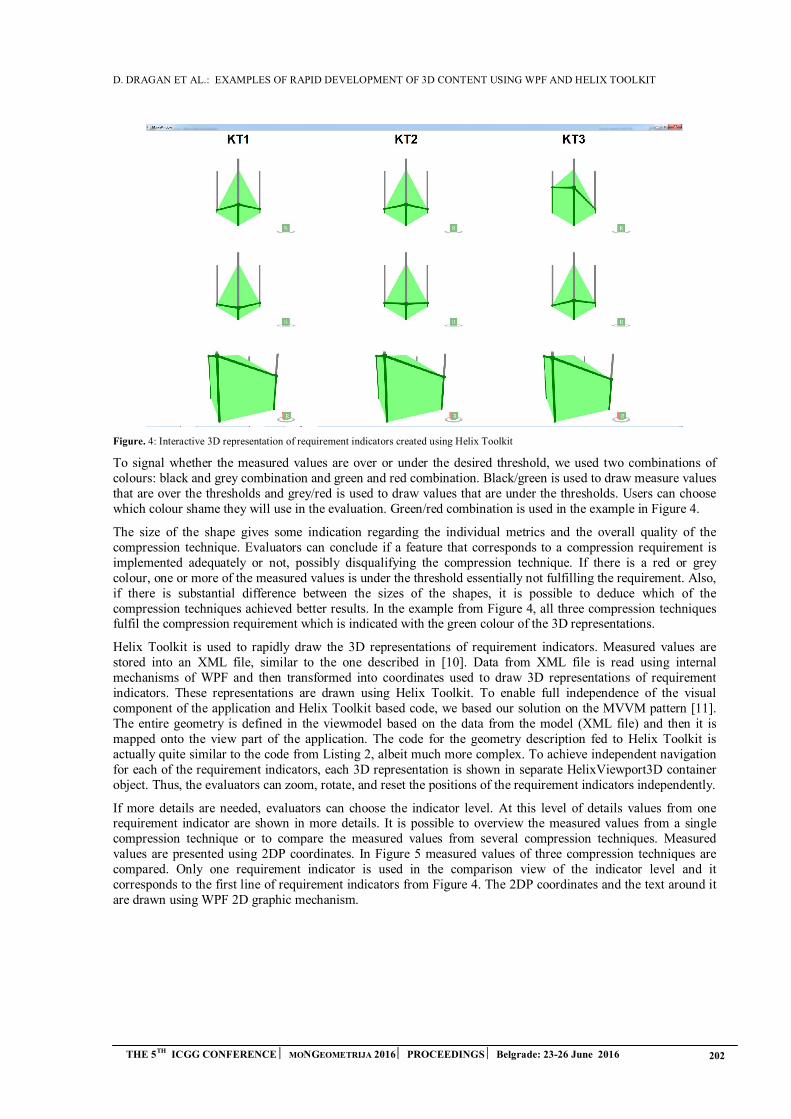
D. DRAGAN ET AL.: EXAMPLES OF RAPID DEVELOPMENT OF 3D CONTENT USING WPF AND HELIX TOOLKIT
THE 5TH ICGG CONFERENCE MONGEOMETRIJA 2016 PROCEEDINGS Belgrade: 23-26 June 2016 202
Figure. 4: Interactive 3D representation of requirement indicators created using Helix Toolkit
To signal whether the measured values are over or under the desired threshold, we used two combinations of colours: black and grey combination and green and red combination. Black/green is used to draw measure values that are over the thresholds and grey/red is used to draw values that are under the thresholds. Users can choose which colour shame they will use in the evaluation. Green/red combination is used in the example in Figure 4.
The size of the shape gives some indication regarding the individual metrics and the overall quality of the compression technique. Evaluators can conclude if a feature that corresponds to a compression requirement is implemented adequately or not, possibly disqualifying the compression technique. If there is a red or grey colour, one or more of the measured values is under the threshold essentially not fulfilling the requirement. Also, if there is substantial difference between the sizes of the shapes, it is possible to deduce which of the compression techniques achieved better results. In the example from Figure 4, all three compression techniques fulfil the compression requirement which is indicated with the green colour of the 3D representations.
Helix Toolkit is used to rapidly draw the 3D representations of requirement indicators. Measured values are stored into an XML file, similar to the one described in [10]. Data from XML file is read using internal mechanisms of WPF and then transformed into coordinates used to draw 3D representations of requirement indicators. These representations are drawn using Helix Toolkit. To enable full independence of the visual component of the application and Helix Toolkit based code, we based our solution on the MVVM pattern [11]. The entire geometry is defined in the viewmodel based on the data from the model (XML file) and then it is mapped onto the view part of the application. The code for the geometry description fed to Helix Toolkit is actually quite similar to the code from Listing 2, albeit much more complex. To achieve independent navigation for each of the requirement indicators, each 3D representation is shown in separate HelixViewport3D container object. Thus, the evaluators can zoom, rotate, and reset the positions of the requirement indicators independently.
If more details are needed, evaluators can choose the indicator level. At this level of details values from one requirement indicator are shown in more details. It is possible to overview the measured values from a single compression technique or to compare the measured values from several compression techniques. Measured values are presented using 2DP coordinates. In Figure 5 measured values of three compression techniques are compared. Only one requirement indicator is used in the comparison view of the indicator level and it corresponds to the first line of requirement indicators from Figure 4. The 2DP coordinates and the text around it are drawn using WPF 2D graphic mechanism.
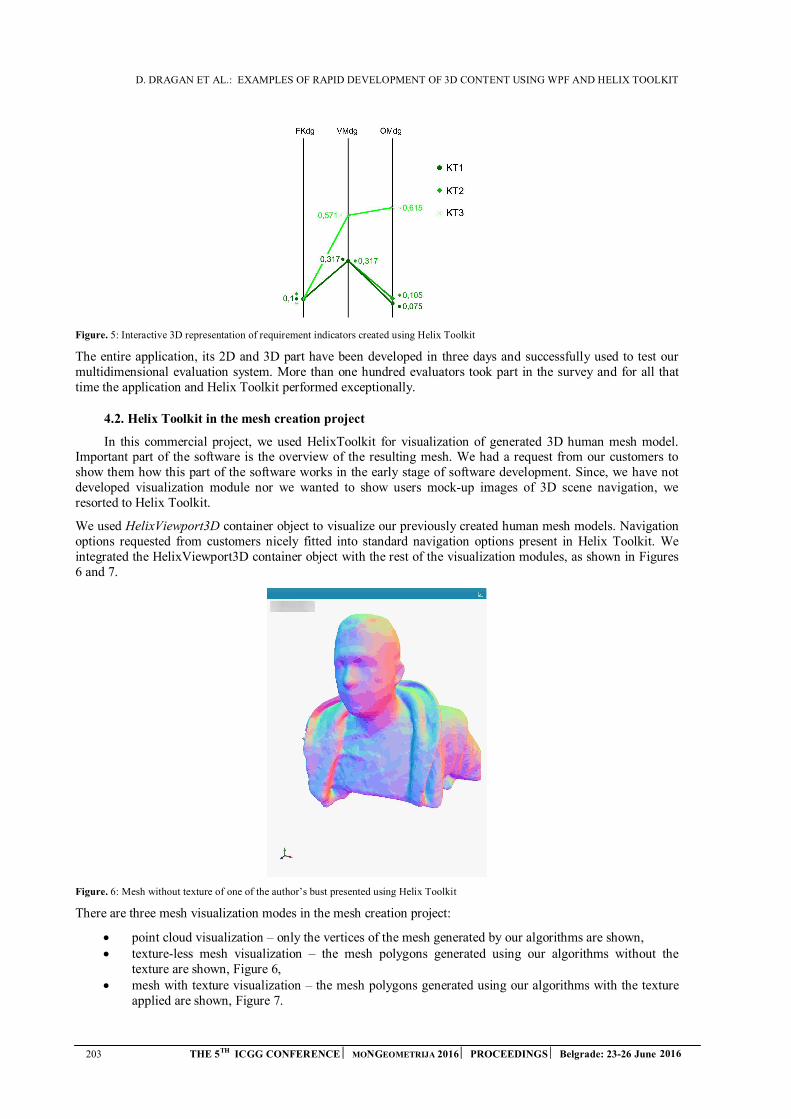
D. DRAGAN ET AL.: EXAMPLES OF RAPID DEVELOPMENT OF 3D CONTENT USING WPF AND HELIX TOOLKIT
203 THE 5TH ICGG CONFERENCE MONGEOMETRIJA 2016 PROCEEDINGS Belgrade: 23-26 June 2016
Figure. 5: Interactive 3D representation of requirement indicators created using Helix Toolkit
The entire application, its 2D and 3D part have been developed in three days and successfully used to test our multidimensional evaluation system. More than one hundred evaluators took part in the survey and for all that time the application and Helix Toolkit performed exceptionally.
4.2. Helix Toolkit in the mesh creation project
In this commercial project, we used HelixToolkit for visualization of generated 3D human mesh model. Important part of the software is the overview of the resulting mesh. We had a request from our customers to show them how this part of the software works in the early stage of software development. Since, we have not developed visualization module nor we wanted to show users mock-up images of 3D scene navigation, we resorted to Helix Toolkit.
We used HelixViewport3D container object to visualize our previously created human mesh models. Navigation options requested from customers nicely fitted into standard navigation options present in Helix Toolkit. We integrated the HelixViewport3D container object with the rest of the visualization modules, as shown in Figures 6 and 7.
Figure. 6: Mesh without texture of one of the author’s bust presented using Helix Toolkit
There are three mesh visualization modes in the mesh creation project:
point cloud visualization – only the vertices of the mesh generated by our algorithms are shown, texture-less mesh visualization – the mesh polygons generated using our algorithms without the
texture are shown, Figure 6, mesh with texture visualization – the mesh polygons generated using our algorithms with the texture
applied are shown, Figure 7.
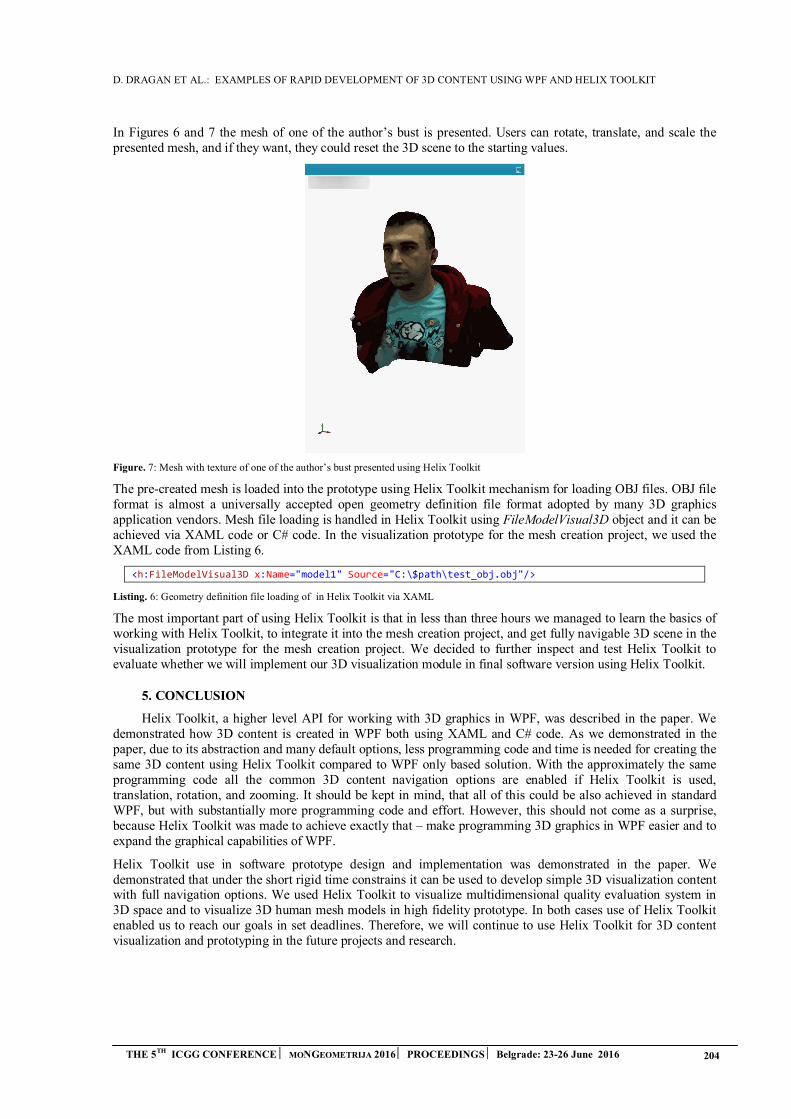
D. DRAGAN ET AL.: EXAMPLES OF RAPID DEVELOPMENT OF 3D CONTENT USING WPF AND HELIX TOOLKIT
THE 5TH ICGG CONFERENCE MONGEOMETRIJA 2016 PROCEEDINGS Belgrade: 23-26 June 2016 204
In Figures 6 and 7 the mesh of one of the author’s bust is presented. Users can rotate, translate, and scale the presented mesh, and if they want, they could reset the 3D scene to the starting values.
Figure. 7: Mesh with texture of one of the author’s bust presented using Helix Toolkit
The pre-created mesh is loaded into the prototype using Helix Toolkit mechanism for loading OBJ files. OBJ file format is almost a universally accepted open geometry definition file format adopted by many 3D graphics application vendors. Mesh file loading is handled in Helix Toolkit using FileModelVisual3D object and it can be achieved via XAML code or C# code. In the visualization prototype for the mesh creation project, we used the XAML code from Listing 6.
<h:FileModelVisual3D x:Name="model1" Source="C:\$path\test_obj.obj"/>
Listing. 6: Geometry definition file loading of in Helix Toolkit via XAML
The most important part of using Helix Toolkit is that in less than three hours we managed to learn the basics of working with Helix Toolkit, to integrate it into the mesh creation project, and get fully navigable 3D scene in the visualization prototype for the mesh creation project. We decided to further inspect and test Helix Toolkit to evaluate whether we will implement our 3D visualization module in final software version using Helix Toolkit.
5. CONCLUSION
Helix Toolkit, a higher level API for working with 3D graphics in WPF, was described in the paper. We demonstrated how 3D content is created in WPF both using XAML and C# code. As we demonstrated in the paper, due to its abstraction and many default options, less programming code and time is needed for creating the same 3D content using Helix Toolkit compared to WPF only based solution. With the approximately the same programming code all the common 3D content navigation options are enabled if Helix Toolkit is used, translation, rotation, and zooming. It should be kept in mind, that all of this could be also achieved in standard WPF, but with substantially more programming code and effort. However, this should not come as a surprise, because Helix Toolkit was made to achieve exactly that – make programming 3D graphics in WPF easier and to expand the graphical capabilities of WPF.
Helix Toolkit use in software prototype design and implementation was demonstrated in the paper. We demonstrated that under the short rigid time constrains it can be used to develop simple 3D visualization content with full navigation options. We used Helix Toolkit to visualize multidimensional quality evaluation system in 3D space and to visualize 3D human mesh models in high fidelity prototype. In both cases use of Helix Toolkit enabled us to reach our goals in set deadlines. Therefore, we will continue to use Helix Toolkit for 3D content visualization and prototyping in the future projects and research.
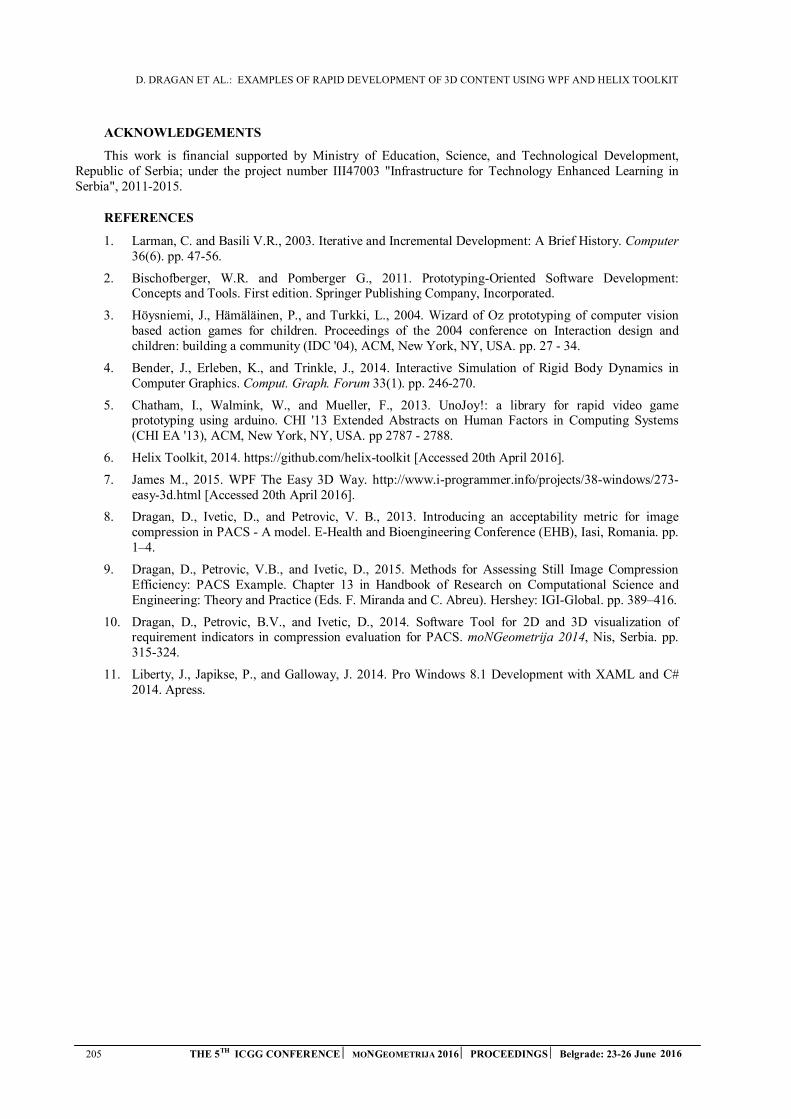
D. DRAGAN ET AL.: EXAMPLES OF RAPID DEVELOPMENT OF 3D CONTENT USING WPF AND HELIX TOOLKIT
205 THE 5TH ICGG CONFERENCE MONGEOMETRIJA 2016 PROCEEDINGS Belgrade: 23-26 June 2016
ACKNOWLEDGEMENTS
This work is financial supported by Ministry of Education, Science, and Technological Development, Republic of Serbia; under the project number III47003 "Infrastructure for Technology Enhanced Learning in Serbia", 2011-2015.
REFERENCES
1. Larman, C. and Basili V.R., 2003. Iterative and Incremental Development: A Brief History. Computer36(6). pp. 47-56.
2. Bischofberger, W.R. and Pomberger G., 2011. Prototyping-Oriented Software Development:Concepts and Tools. First edition. Springer Publishing Company, Incorporated.
3. Höysniemi, J., Hämäläinen, P., and Turkki, L., 2004. Wizard of Oz prototyping of computer visionbased action games for children. Proceedings of the 2004 conference on Interaction design andchildren: building a community (IDC '04), ACM, New York, NY, USA. pp. 27 - 34.
4. Bender, J., Erleben, K., and Trinkle, J., 2014. Interactive Simulation of Rigid Body Dynamics inComputer Graphics. Comput. Graph. Forum 33(1). pp. 246-270.
5. Chatham, I., Walmink, W., and Mueller, F., 2013. UnoJoy!: a library for rapid video gameprototyping using arduino. CHI '13 Extended Abstracts on Human Factors in Computing Systems(CHI EA '13), ACM, New York, NY, USA. pp 2787 - 2788.
6. Helix Toolkit, 2014. https://github.com/helix-toolkit [Accessed 20th April 2016].
7. James M., 2015. WPF The Easy 3D Way. http://www.i-programmer.info/projects/38-windows/273-easy-3d.html [Accessed 20th April 2016].
8. Dragan, D., Ivetic, D., and Petrovic, V. B., 2013. Introducing an acceptability metric for imagecompression in PACS - A model. E-Health and Bioengineering Conference (EHB), Iasi, Romania. pp.1–4.
9. Dragan, D., Petrovic, V.B., and Ivetic, D., 2015. Methods for Assessing Still Image CompressionEfficiency: PACS Example. Chapter 13 in Handbook of Research on Computational Science andEngineering: Theory and Practice (Eds. F. Miranda and C. Abreu). Hershey: IGI-Global. pp. 389–416.
10. Dragan, D., Petrovic, B.V., and Ivetic, D., 2014. Software Tool for 2D and 3D visualization ofrequirement indicators in compression evaluation for PACS. moNGeometrija 2014, Nis, Serbia. pp.315-324.
11. Liberty, J., Japikse, P., and Galloway, J. 2014. Pro Windows 8.1 Development with XAML and C#2014. Apress.
M. STAVRIC ET AL.: FROM PARAMETRIC MODELLING TO DIGITAL FABRICATION: FOLDING SPACE STRUCTURES
THE 5TH ICGG CONFERENCE MONGEOMETRIJA 2016 PROCEEDINGS Belgrade: 23-26 June 2016 206
FROM PARAMETRIC MODELLING TO DIGITAL FABRICATION:
FOLDING SPACE STRUCTURES
Milena Stavric
Graz University of Technology, Graz, Austria
PhD., Ass. Professor, [email protected]
Albert Wiltsche
Graz University of Technology, Graz, Austria
PhD., Ass. Professor, [email protected]
ABSTRACT
The rapid development of parametrical tools for architectural design has implicated a big
challenge for contemporary architectural education. Mathematics and geometry play again an
important role in order to understand these new tools. In the last years many universities have been
introducing digital design and fabrication in there syllabus to provide and teach a broader
understanding of parametrical design. In order to make virtual parametrical models also buildable
for architectural usage a huge amount of knowledge and skills is needed, which induces a big task
for teachers and a big challenge for students. This paper presents our teaching approach to the
design process through parametrical modelling, strongly based on geometry and mathematics. Our
teaching approach will be presented by the design project “Folded space structures”. The core of
our teaching approach is the geometrical understanding of the different relations between the
involved objects and their translation into a geometrical and mathematical language in terms of
computer algorithms, including the mathematical transformation of materials behaviour.
Keywords: generative algorithms; architectural geometry; computational design;
parametrical modelling; folding; digital fabrication;
1. INTRODUCTION
In the age of digital design, the position of geometry has changed. The past fifteen years, geometry has
been neglected and most of the geometrical presentations has been took over by computer-software. The
geometrical courses at most of the universities all around Europe were replaced by CAD courses. This fact is
also the present situation in Austria. Fifteen years ago, students of architecture had a 3 hours lecture and 3 hours
exercises in two semesters. Today we have a reduction to a one-hour lecture and one hour of exercise. From one
side, the lack of knowledge in geometry is visible, but from the other side, it is very hard to change the
curriculum and to get more hours to teach basic geometry. One of the reasons is that universities today offer
more integrated courses than individual courses like in the past. That means, that geometry should be taught as
applied geometry and not as an individual course at the university. These changes let us to setup an applied
geometry course embedded in a design course. In the following chapters we will describe our course “Design of
specialized topics” which integrates the special geometrical topic - folding.
2. DESIGN BY RESEARCH
Since 2014, we have introduced the topic origami-folding within the course “Design of specialized topics”
at the Faculty of Architecture, at Graz University of Technology. The goal of the course was to investigate
folding techniques and to transfer geometrical and mathematical folding rules to buildable folding design. In our
approach we use many techniques, from analog folding to programming, in order to make folding
understandable for the students. Information on folding, especially with a geometrical approach, can be found in
[1] – [7].
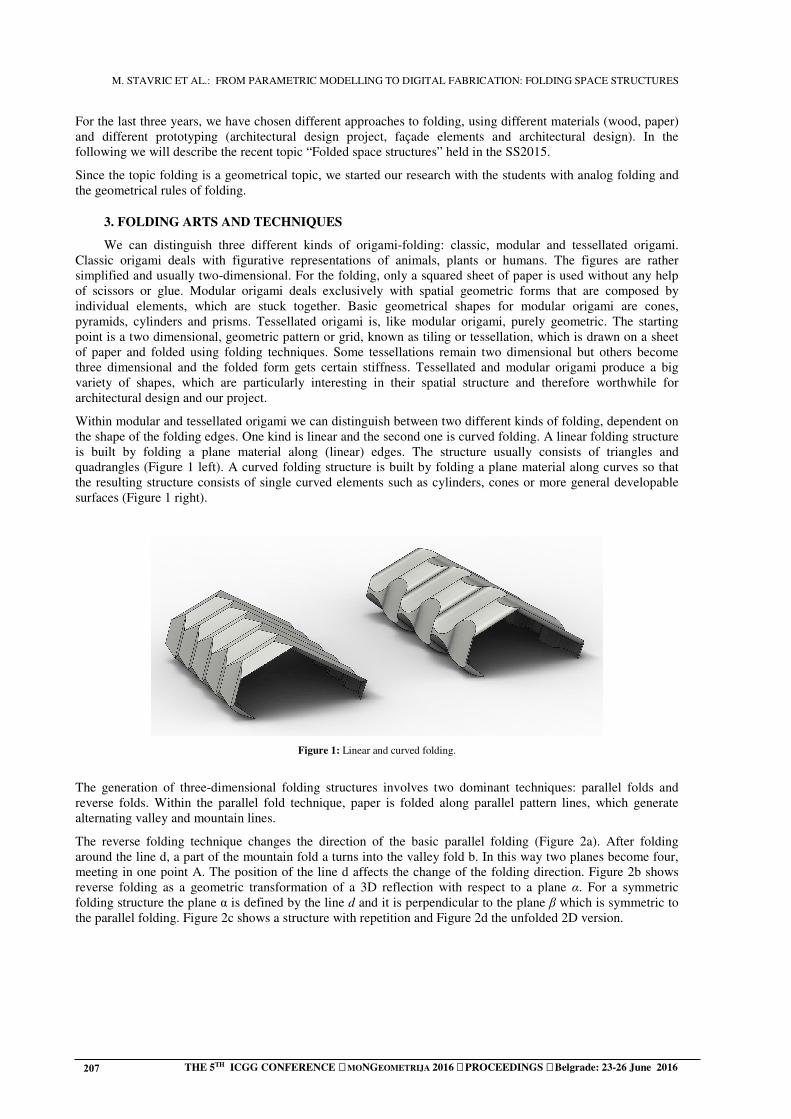
M. STAVRIC ET AL.: FROM PARAMETRIC MODELLING TO DIGITAL FABRICATION: FOLDING SPACE STRUCTURES
207 THE 5TH ICGG CONFERENCE MONGEOMETRIJA 2016 PROCEEDINGS Belgrade: 23-26 June 2016
For the last three years, we have chosen different approaches to folding, using different materials (wood, paper)
and different prototyping (architectural design project, façade elements and architectural design). In the
following we will describe the recent topic “Folded space structures” held in the SS2015.
Since the topic folding is a geometrical topic, we started our research with the students with analog folding and
the geometrical rules of folding.
3. FOLDING ARTS AND TECHNIQUES
We can distinguish three different kinds of origami-folding: classic, modular and tessellated origami.
Classic origami deals with figurative representations of animals, plants or humans. The figures are rather
simplified and usually two-dimensional. For the folding, only a squared sheet of paper is used without any help
of scissors or glue. Modular origami deals exclusively with spatial geometric forms that are composed by
individual elements, which are stuck together. Basic geometrical shapes for modular origami are cones,
pyramids, cylinders and prisms. Tessellated origami is, like modular origami, purely geometric. The starting
point is a two dimensional, geometric pattern or grid, known as tiling or tessellation, which is drawn on a sheet
of paper and folded using folding techniques. Some tessellations remain two dimensional but others become
three dimensional and the folded form gets certain stiffness. Tessellated and modular origami produce a big
variety of shapes, which are particularly interesting in their spatial structure and therefore worthwhile for
architectural design and our project.
Within modular and tessellated origami we can distinguish between two different kinds of folding, dependent on
the shape of the folding edges. One kind is linear and the second one is curved folding. A linear folding structure
is built by folding a plane material along (linear) edges. The structure usually consists of triangles and
quadrangles (Figure 1 left). A curved folding structure is built by folding a plane material along curves so that
the resulting structure consists of single curved elements such as cylinders, cones or more general developable
surfaces (Figure 1 right).
Figure 1: Linear and curved folding.
The generation of three-dimensional folding structures involves two dominant techniques: parallel folds and
reverse folds. Within the parallel fold technique, paper is folded along parallel pattern lines, which generate
alternating valley and mountain lines.
The reverse folding technique changes the direction of the basic parallel folding (Figure 2a). After folding
around the line d, a part of the mountain fold a turns into the valley fold b. In this way two planes become four,
meeting in one point A. The position of the line d affects the change of the folding direction. Figure 2b shows
reverse folding as a geometric transformation of a 3D reflection with respect to a plane α. For a symmetric
folding structure the plane α is defined by the line d and it is perpendicular to the plane β which is symmetric to
the parallel folding. Figure 2c shows a structure with repetition and Figure 2d the unfolded 2D version.
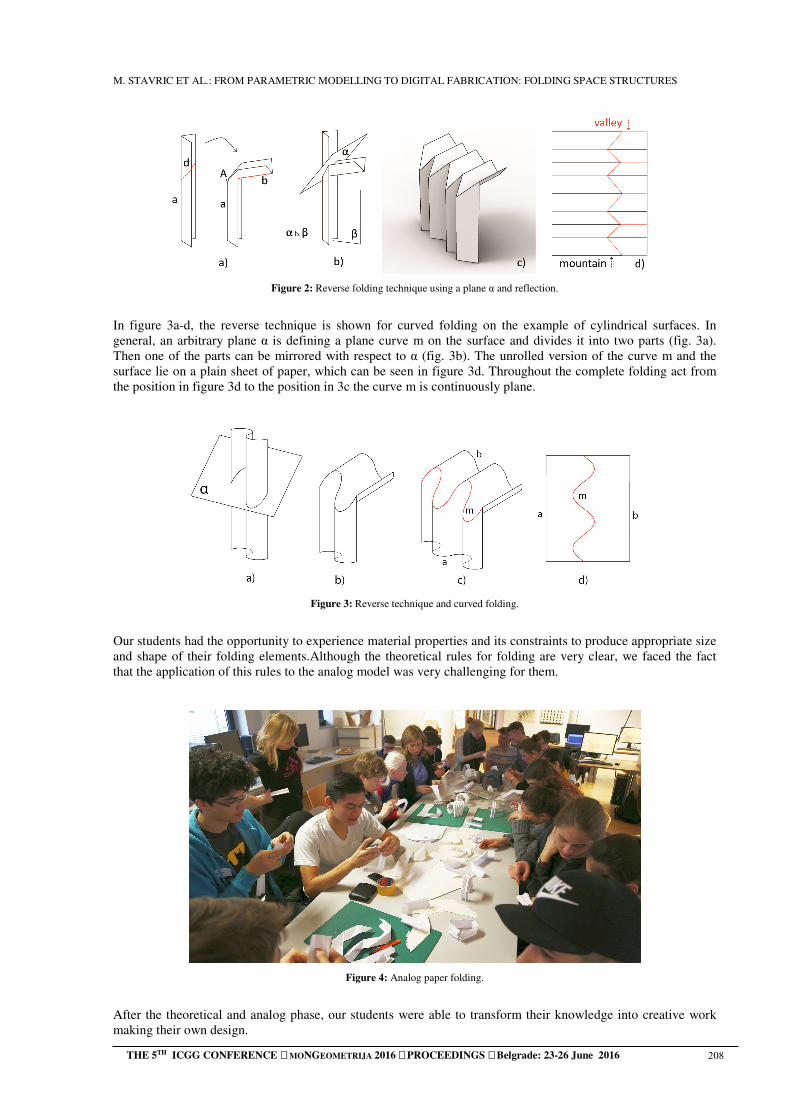
M. STAVRIC ET AL.: FROM PARAMETRIC MODELLING TO DIGITAL FABRICATION: FOLDING SPACE STRUCTURES
THE 5TH ICGG CONFERENCE MONGEOMETRIJA 2016 PROCEEDINGS Belgrade: 23-26 June 2016 208
Figure 2: Reverse folding technique using a plane α and reflection.
In figure 3a-d, the reverse technique is shown for curved folding on the example of cylindrical surfaces. In
general, an arbitrary plane α is defining a plane curve m on the surface and divides it into two parts (fig. 3a).
Then one of the parts can be mirrored with respect to α (fig. 3b). The unrolled version of the curve m and the
surface lie on a plain sheet of paper, which can be seen in figure 3d. Throughout the complete folding act from
the position in figure 3d to the position in 3c the curve m is continuously plane.
Figure 3: Reverse technique and curved folding.
Our students had the opportunity to experience material properties and its constraints to produce appropriate size
and shape of their folding elements.Although the theoretical rules for folding are very clear, we faced the fact
that the application of this rules to the analog model was very challenging for them.
Figure 4: Analog paper folding.
After the theoretical and analog phase, our students were able to transform their knowledge into creative work
making their own design.

M. STAVRIC ET AL.: FROM PARAMETRIC MODELLING TO DIGITAL FABRICATION: FOLDING SPACE STRUCTURES
209 THE 5TH ICGG CONFERENCE MONGEOMETRIJA 2016 PROCEEDINGS Belgrade: 23-26 June 2016
4. FROM 3D DESIGN TO DEVELOPABLE DESIGN
The students had three different tasks. The first task was to develop one tessellated origami element with
the size of 33x33 cm. The second task was to use any kind of folding to make a façade element of about 70x70
cm and the third task was to make a space divider in the size 70x100cm. The size of the elements was limited
due to the size of the material and our laser cutter CNC machine.
For the first task, the students used the CAD software Rhinoceros to make a virtual tessellated folding model and
to develop the cutting pattern. For positioning the folding lines and curves on the paper, they engraved the paper
with the laser cutter on both sides. The big challenge for this task was the differentiation between mountain and
valley folding lines and the manual folding. Figure 5 shows some the results of this phase.
Figure 5: Tessellated folding 33x33 –Exhibition in Belgrade “Space Origami”
While they made their models, the students noticed that the thickness of the paper should be in direct proportion
to the size of the folding pattern and to fold a bigger tessellated structure was not so easy. Based on the
experience collected from the first task most of the students choose modular origami for the second and third
task. In order to make modular origami more interesting, we included parametrical modelling in the design stage.
Parametrical modelling enabled the students to make each modular part in a unique form and size but with the
same geometrical rules.
5. PARAMETRIC DESIGN
For most of the students in our group, it was the first time to face parametrical modelling and to explore the
possibility of this approach. From one side it was challenging for us but from another side it was necessary to
develop teaching strategies that push the students very fast to a level where they could use parametrical
modelling as a creative tool. For the parametrical modelling, we choose the program Grasshopper. Grasshopper
is a graphical algorithm editor and works as a plugin for the CAD program Rhinocerus. Unlike RhinoScript, an
integrated script language for Rhinocerus, Grasshopper does not require the knowledge of writing program or
scripting code, but still allows designers to build form generators from the simple to the awe-inspiring [8].
By using grasshopper in the second and third phase (Figure 6) some students chose the way to build their whole
structure with the same topological element and to order it in a specific unregularly way on a base plate. In a
second approach every element was different but the assembly was done in a regular way. The core of all design
was that each element should be developable and should follow the rules explained in section 3.
Figure 6: A definition in Grasshopper: Making a grid of elements and extrusion of each element in a different direction.
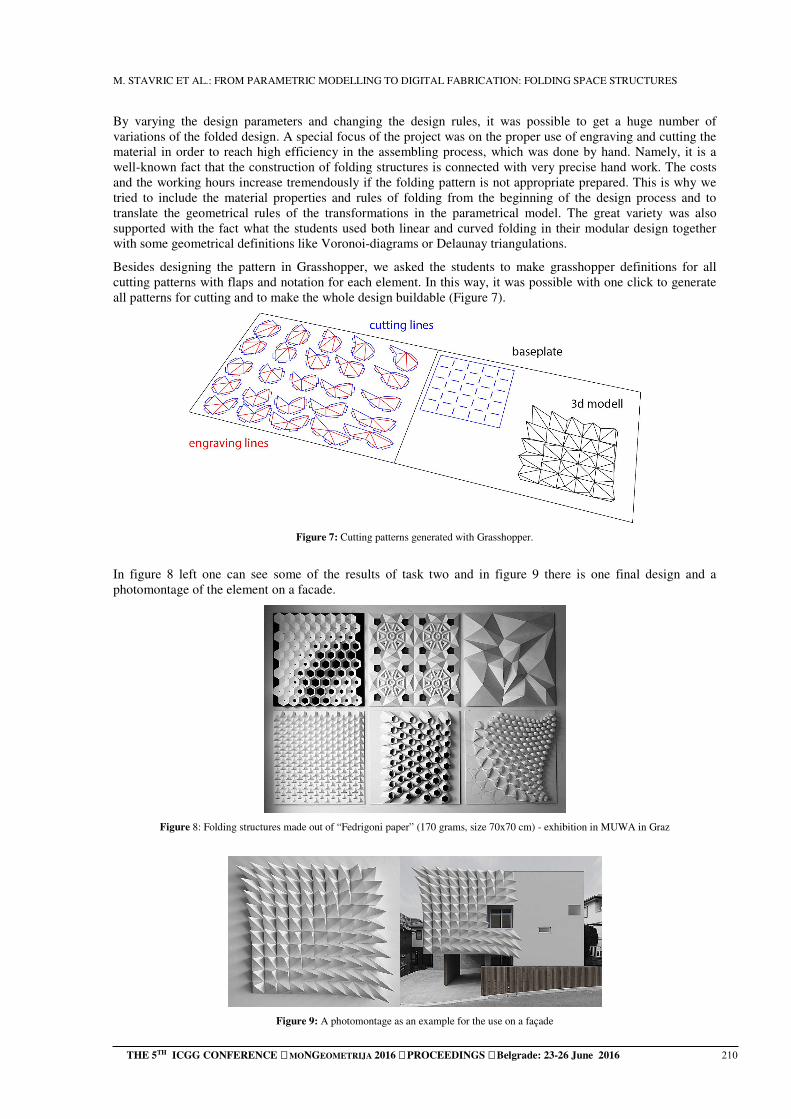
M. STAVRIC ET AL.: FROM PARAMETRIC MODELLING TO DIGITAL FABRICATION: FOLDING SPACE STRUCTURES
THE 5TH ICGG CONFERENCE MONGEOMETRIJA 2016 PROCEEDINGS Belgrade: 23-26 June 2016 210
By varying the design parameters and changing the design rules, it was possible to get a huge number of
variations of the folded design. A special focus of the project was on the proper use of engraving and cutting the
material in order to reach high efficiency in the assembling process, which was done by hand. Namely, it is a
well-known fact that the construction of folding structures is connected with very precise hand work. The costs
and the working hours increase tremendously if the folding pattern is not appropriate prepared. This is why we
tried to include the material properties and rules of folding from the beginning of the design process and to
translate the geometrical rules of the transformations in the parametrical model. The great variety was also
supported with the fact what the students used both linear and curved folding in their modular design together
with some geometrical definitions like Voronoi-diagrams or Delaunay triangulations.
Besides designing the pattern in Grasshopper, we asked the students to make grasshopper definitions for all
cutting patterns with flaps and notation for each element. In this way, it was possible with one click to generate
all patterns for cutting and to make the whole design buildable (Figure 7).
Figure 7: Cutting patterns generated with Grasshopper.
In figure 8 left one can see some of the results of task two and in figure 9 there is one final design and a
photomontage of the element on a facade.
Figure 8: Folding structures made out of “Fedrigoni paper” (170 grams, size 70x70 cm) - exhibition in MUWA in Graz
Figure 9: A photomontage as an example for the use on a façade

M. STAVRIC ET AL.: FROM PARAMETRIC MODELLING TO DIGITAL FABRICATION: FOLDING SPACE STRUCTURES
211 THE 5TH ICGG CONFERENCE MONGEOMETRIJA 2016 PROCEEDINGS Belgrade: 23-26 June 2016
The third task was to develop one space divider, a folding structures that can be perceived from both sides
(figure 10).
Figure 10: Space dividers.
6. CONCLUSION
The goal of the project presented in this paper was to show that digital fabrication has a great potential for design
research experiments in architecture. It can affect our way of thinking about design and the meaning of geometry
in the digital age. Geometry can be taught in applied design courses and our approach to folding is only one of
many examples to give geometry a new function in the age of digital design.
ACKNOWLEDGEMENTS
The authors gratefully acknowledge the work done by our students at Graz University of Technology. Our
gratitude goes also to our student assistant Markus Bartaky for his efforts done for the success of this project. We
are very grateful for the great cooperation with MUWA, Museum of Perception in Graz and her director Eva
Fürstner. In MUWA we exhibited our works nine months and in 2016 we plan a second bigger exhibition at the
same location. We are also deeply grateful to the Austrian Culture Forum in Belgrade and the Belgrade
International Week of Architecture - BINA - that made it possible to exhibit our works also in Belgrade.
REFERENCES
1. Belcastro, S.M., Hull, T.C., 2002. Modelling the folding of paper into three dimensions using affine
transformations, Linear Algebra and its Application, 348, pp.273–282.
2. Geretschlaeger, R., 2008. Geometric Origami, Arbelos, UK.
3. Mitani, J., 2009. A Design method for 3D origami based on rotational sweep. Computer- aided
Design and Application, 6 (1). pp. 69–79.
4. Stachel, H., 2012. A Flexible Planar Tesselation with a Flexion Tiling a Cylinder of Revolution.
Journal of Geometry and Graphics, 16(2). pp 153–170.
5. Stavric, M., Wiltsche, A., 2014. Quadrilateral Patterns for Rigid Folding Structures. International
journal of architectural computing, 121 (1), pp. 61 – 80.
6. Stavric, M., Wiltsche., A. Bogensperger, T., 2015. Generative Design for Folded Timber Structures.
Proceedings of 20th CAADRIA conference, Daegu, South Corea, pp. 673 – 682.
7. Tachi, T., 2009. Generalization of Rigid-Foldable Quadrilateral-Mesh Origami, Journal of the
International Association for Shell and Spatial Structures, 50(3), pp. 173–179.
8. http://www.grasshopper3d.com/

G. GHERGHINA ET AL.: FROM THE SKETCH IN TECHNICAL DRAWING TO DMU IN ENGINEERING EDUCATION
THE 5TH ICGG CONFERENCE MONGEOMETRIJA 2016 PROCEEDINGS Belgrade: 23-26 June 2016 212
FROM THE SKETCH IN TECHNICAL DRAWING TO DMU IN ENGINEERING EDUCATION
George Gherghina Department of Vehicles, Transportation and Industrial Engineering, University of Craiova, Romania
Professor, [email protected]
Dragos Popa Department of Vehicles, Transportation and Industrial Engineering, University of Craiova, Romania
Associate Professor, [email protected]
Dragos Tutunea Department of Vehicles, Transportation and Industrial Engineering, University of Craiova, Romania
Lecturer, [email protected]
ABSTRACT
The complexity of information from a technical drawing, information which ensure the communications between conception and execution as well as between the producer and the client, provides technical drawing a decisive role in the life of a product due the fact that represents the most concise and synthetic communication in technical domain. The paper presents aspects of the evolution of the education of future engineers in the field of technical graphics starting from the basics of classic drawing and current methods of realization DMU digital mock ups. In the current conditions of strong and competitive globalised markets, it is necessary to impose a method of digital design based of the computer performance to simulate the product. The use of these technologies and various CAD programs aided in the productions of different engineering models to an executable simulation model of the product.
Keywords: computer graphics; technical drawing; digital mockup; digital design
1. INTRODUCTION
Conventional method of development and planning is not sufficient to increase the production and manage the complexity of the new products. In the industry the widespread use of CAD technology has gained a lot of attention, many decision in the past required many steps and construction of models and prototypes have been substituted nowadays with this digital methods [2]. In the last few years different tools for production and planning have been developed and use successfully in automotive industry. The existing approaches are based on the management of alphanumerical data for documenting planning results and can be done using new digital planning approaches for production [3]. Many researchers are involved in the design processes of machine tools, cars, aircrafts etc. Instead of single CAD program, a variety of CAD systems is used to design and develop complex products. Many mismatches and interferences due to programs incompatibility of CAD occur. To compensate such problems in the design process real mock-ups have been used [4]. The digital mock-up system (DMU) a tool to build a virtual mock-up in the design stage is used extensively during design and manufacturing processes. DMU can perform simulation such as dynamics, kinematics, strength, thermodynamics, etc. The virtual prototype of a piece can be seen as digital mock-up (DMU) which is composed by 3D models which integrate the mechanical structure of a system [5]. Comparing different studies the fallowing steps can be realized to reduce time design [6]:
Reutilization of existing CAD models and geometry.
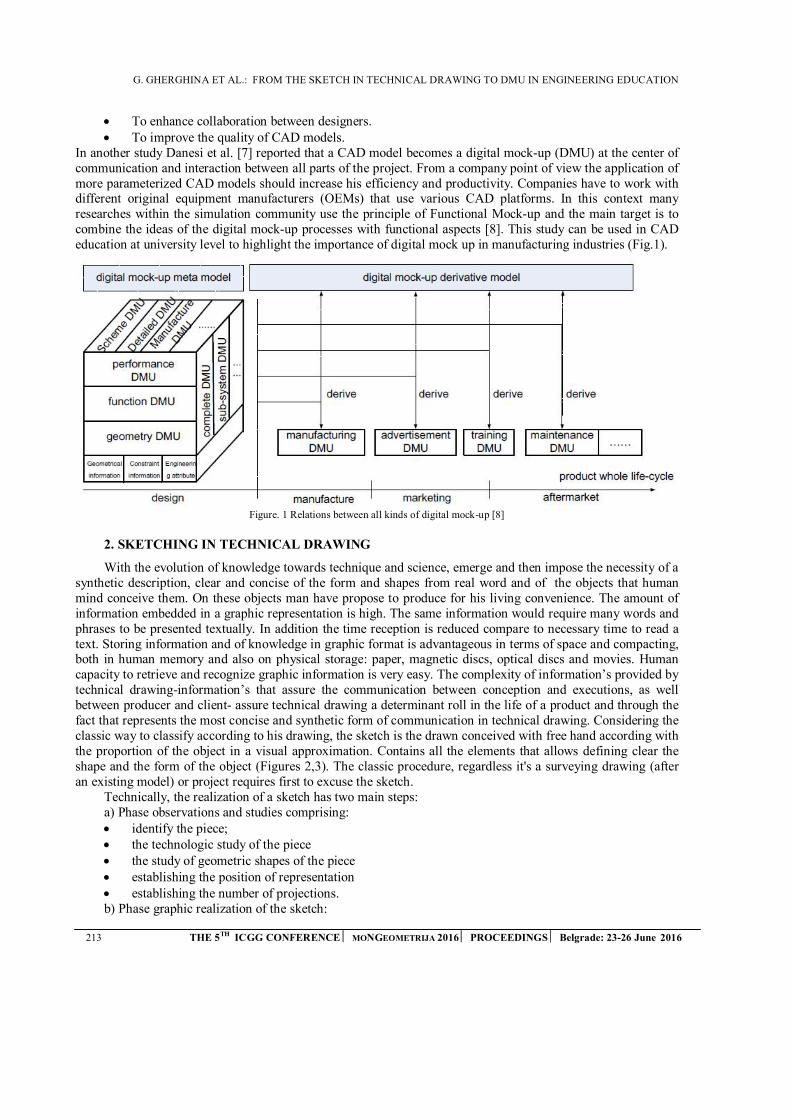
G. GHERGHINA ET AL.: FROM THE SKETCH IN TECHNICAL DRAWING TO DMU IN ENGINEERING EDUCATION
213 THE 5TH ICGG CONFERENCE MONGEOMETRIJA 2016 PROCEEDINGS Belgrade: 23-26 June 2016
To enhance collaboration between designers. To improve the quality of CAD models.
In another study Danesi et al. [7] reported that a CAD model becomes a digital mock-up (DMU) at the center of communication and interaction between all parts of the project. From a company point of view the application of more parameterized CAD models should increase his efficiency and productivity. Companies have to work with different original equipment manufacturers (OEMs) that use various CAD platforms. In this context many researches within the simulation community use the principle of Functional Mock-up and the main target is to combine the ideas of the digital mock-up processes with functional aspects [8]. This study can be used in CAD education at university level to highlight the importance of digital mock up in manufacturing industries (Fig.1).
Figure. 1 Relations between all kinds of digital mock-up [8]
2. SKETCHING IN TECHNICAL DRAWING
With the evolution of knowledge towards technique and science, emerge and then impose the necessity of a synthetic description, clear and concise of the form and shapes from real word and of the objects that human mind conceive them. On these objects man have propose to produce for his living convenience. The amount of information embedded in a graphic representation is high. The same information would require many words and phrases to be presented textually. In addition the time reception is reduced compare to necessary time to read a text. Storing information and of knowledge in graphic format is advantageous in terms of space and compacting, both in human memory and also on physical storage: paper, magnetic discs, optical discs and movies. Human capacity to retrieve and recognize graphic information is very easy. The complexity of information’s provided by technical drawing-information’s that assure the communication between conception and executions, as well between producer and client- assure technical drawing a determinant roll in the life of a product and through the fact that represents the most concise and synthetic form of communication in technical drawing. Considering the classic way to classify according to his drawing, the sketch is the drawn conceived with free hand according with the proportion of the object in a visual approximation. Contains all the elements that allows defining clear the shape and the form of the object (Figures 2,3). The classic procedure, regardless it's a surveying drawing (after an existing model) or project requires first to excuse the sketch.
Technically, the realization of a sketch has two main steps: a) Phase observations and studies comprising: identify the piece; the technologic study of the piece the study of geometric shapes of the piece establishing the position of representation establishing the number of projections.b) Phase graphic realization of the sketch:
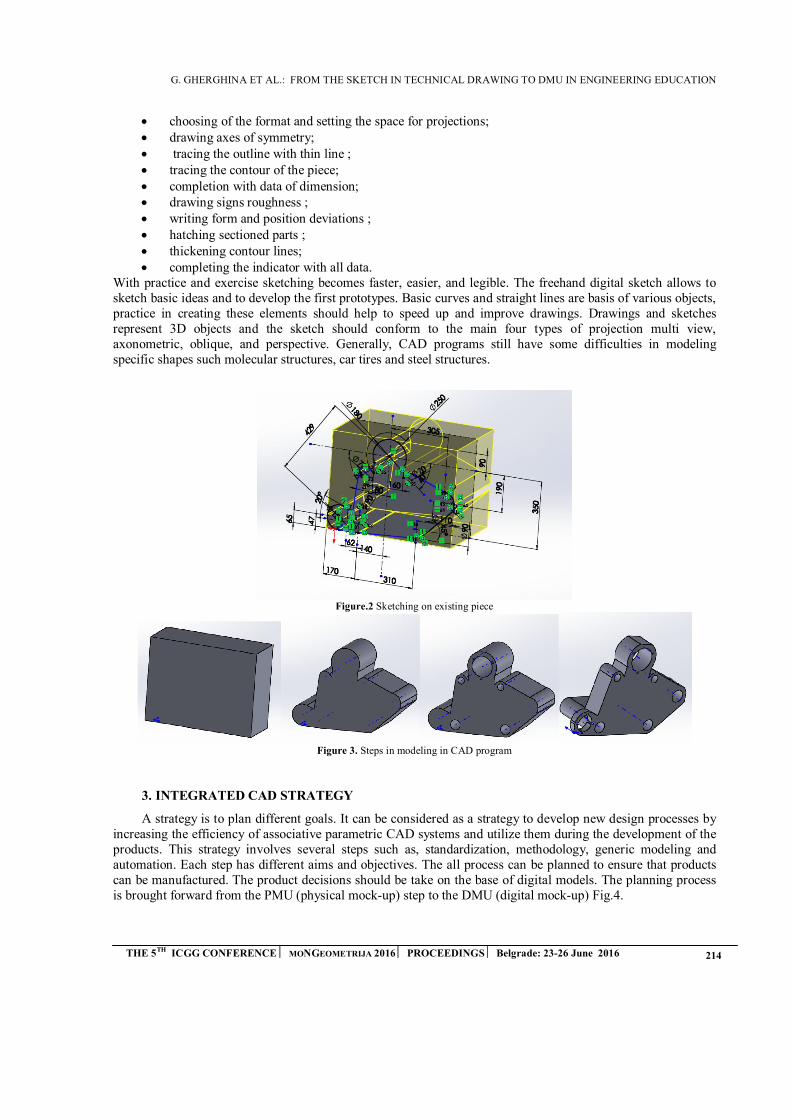
G. GHERGHINA ET AL.: FROM THE SKETCH IN TECHNICAL DRAWING TO DMU IN ENGINEERING EDUCATION
THE 5TH ICGG CONFERENCE MONGEOMETRIJA 2016 PROCEEDINGS Belgrade: 23-26 June 2016 214
choosing of the format and setting the space for projections; drawing axes of symmetry; tracing the outline with thin line ; tracing the contour of the piece; completion with data of dimension; drawing signs roughness ; writing form and position deviations ; hatching sectioned parts ; thickening contour lines; completing the indicator with all data.
With practice and exercise sketching becomes faster, easier, and legible. The freehand digital sketch allows to sketch basic ideas and to develop the first prototypes. Basic curves and straight lines are basis of various objects, practice in creating these elements should help to speed up and improve drawings. Drawings and sketches represent 3D objects and the sketch should conform to the main four types of projection multi view, axonometric, oblique, and perspective. Generally, CAD programs still have some difficulties in modeling specific shapes such molecular structures, car tires and steel structures.
Figure.2 Sketching on existing piece
Figure 3. Steps in modeling in CAD program
3. INTEGRATED CAD STRATEGY
A strategy is to plan different goals. It can be considered as a strategy to develop new design processes by increasing the efficiency of associative parametric CAD systems and utilize them during the development of the products. This strategy involves several steps such as, standardization, methodology, generic modeling and automation. Each step has different aims and objectives. The all process can be planned to ensure that products can be manufactured. The product decisions should be take on the base of digital models. The planning process is brought forward from the PMU (physical mock-up) step to the DMU (digital mock-up) Fig.4.
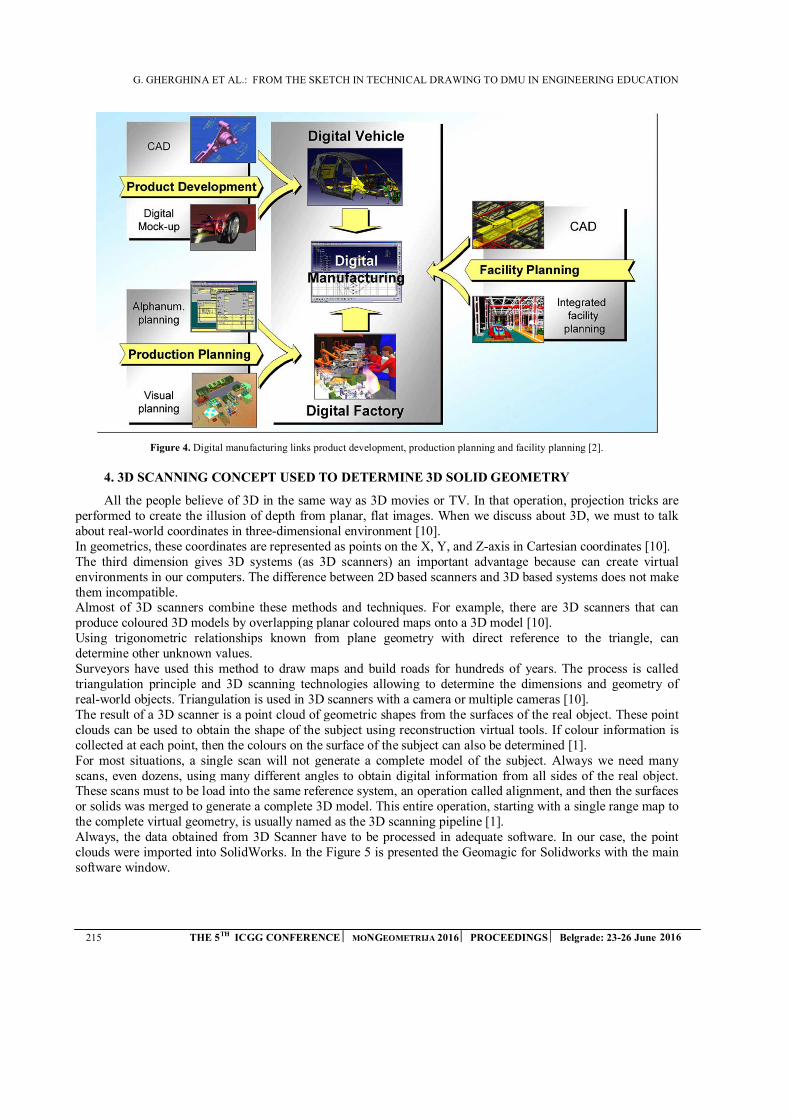
G. GHERGHINA ET AL.: FROM THE SKETCH IN TECHNICAL DRAWING TO DMU IN ENGINEERING EDUCATION
215 THE 5TH ICGG CONFERENCE MONGEOMETRIJA 2016 PROCEEDINGS Belgrade: 23-26 June 2016
Figure 4. Digital manufacturing links product development, production planning and facility planning [2].
4. 3D SCANNING CONCEPT USED TO DETERMINE 3D SOLID GEOMETRY
All the people believe of 3D in the same way as 3D movies or TV. In that operation, projection tricks are performed to create the illusion of depth from planar, flat images. When we discuss about 3D, we must to talk about real-world coordinates in three-dimensional environment [10]. In geometrics, these coordinates are represented as points on the X, Y, and Z-axis in Cartesian coordinates [10]. The third dimension gives 3D systems (as 3D scanners) an important advantage because can create virtual environments in our computers. The difference between 2D based scanners and 3D based systems does not make them incompatible. Almost of 3D scanners combine these methods and techniques. For example, there are 3D scanners that can produce coloured 3D models by overlapping planar coloured maps onto a 3D model [10]. Using trigonometric relationships known from plane geometry with direct reference to the triangle, can determine other unknown values. Surveyors have used this method to draw maps and build roads for hundreds of years. The process is called triangulation principle and 3D scanning technologies allowing to determine the dimensions and geometry of real-world objects. Triangulation is used in 3D scanners with a camera or multiple cameras [10]. The result of a 3D scanner is a point cloud of geometric shapes from the surfaces of the real object. These point clouds can be used to obtain the shape of the subject using reconstruction virtual tools. If colour information is collected at each point, then the colours on the surface of the subject can also be determined [1]. For most situations, a single scan will not generate a complete model of the subject. Always we need many scans, even dozens, using many different angles to obtain digital information from all sides of the real object. These scans must to be load into the same reference system, an operation called alignment, and then the surfaces or solids was merged to generate a complete 3D model. This entire operation, starting with a single range map to the complete virtual geometry, is usually named as the 3D scanning pipeline [1]. Always, the data obtained from 3D Scanner have to be processed in adequate software. In our case, the point clouds were imported into SolidWorks. In the Figure 5 is presented the Geomagic for Solidworks with the main software window.

G. GHERGHINA ET AL.: FROM THE SKETCH IN TECHNICAL DRAWING TO DMU IN ENGINEERING EDUCATION
THE 5TH ICGG CONFERENCE MONGEOMETRIJA 2016 PROCEEDINGS Belgrade: 23-26 June 2016 216
Figure 5. The Geomagic software used for 3D scanning operation
But, very often we don't need only point clouds. In the most situations we must to have solid geometry. Geomagic has important recognition tools. In the Figure 6 we present some important steps used to recognize solid geometry as cylinder, sphere and freeform obtained from point clouds.
Figure 5. The Geomagic recognition tools used for sphere, cylinder and freeform
5. CONCLUSION
The realization of technical documentation required to obtain finite products has evolved permanently. From the manual realization of drawings the technique has evaluated to the automat realization with the aided of computer through specialized software packages. Current 3D scanning technique allows the scan of a piece, import into a modeling program, analyzing and optimizing construction and rapid prototyping. These steps allow obtaining better products, cheaper and faster to satisfy the current competitive market.
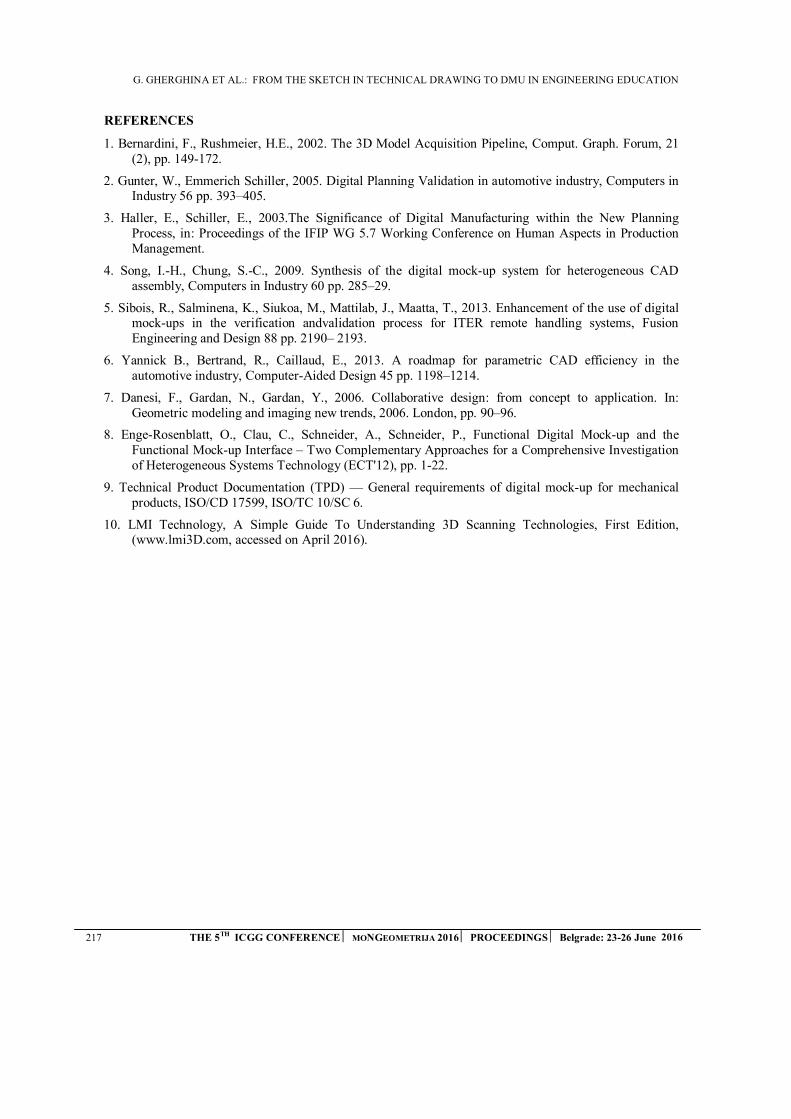
G. GHERGHINA ET AL.: FROM THE SKETCH IN TECHNICAL DRAWING TO DMU IN ENGINEERING EDUCATION
217 THE 5TH ICGG CONFERENCE MONGEOMETRIJA 2016 PROCEEDINGS Belgrade: 23-26 June 2016
REFERENCES
1. Bernardini, F., Rushmeier, H.E., 2002. The 3D Model Acquisition Pipeline, Comput. Graph. Forum, 21(2), pp. 149-172.
2. Gunter, W., Emmerich Schiller, 2005. Digital Planning Validation in automotive industry, Computers inIndustry 56 pp. 393–405.
3. Haller, E., Schiller, E., 2003.The Significance of Digital Manufacturing within the New PlanningProcess, in: Proceedings of the IFIP WG 5.7 Working Conference on Human Aspects in Production Management.
4. Song, I.-H., Chung, S.-C., 2009. Synthesis of the digital mock-up system for heterogeneous CADassembly, Computers in Industry 60 pp. 285–29.
5. Sibois, R., Salminena, K., Siukoa, M., Mattilab, J., Maatta, T., 2013. Enhancement of the use of digitalmock-ups in the verification andvalidation process for ITER remote handling systems, Fusion Engineering and Design 88 pp. 2190– 2193.
6. Yannick B., Bertrand, R., Caillaud, E., 2013. A roadmap for parametric CAD efficiency in theautomotive industry, Computer-Aided Design 45 pp. 1198–1214.
7. Danesi, F., Gardan, N., Gardan, Y., 2006. Collaborative design: from concept to application. In:Geometric modeling and imaging new trends, 2006. London, pp. 90–96.
8. Enge-Rosenblatt, O., Clau, C., Schneider, A., Schneider, P., Functional Digital Mock-up and theFunctional Mock-up Interface – Two Complementary Approaches for a Comprehensive Investigation of Heterogeneous Systems Technology (ECT'12), pp. 1-22.
9. Technical Product Documentation (TPD) — General requirements of digital mock-up for mechanicalproducts, ISO/CD 17599, ISO/TC 10/SC 6.
10. LMI Technology, A Simple Guide To Understanding 3D Scanning Technologies, First Edition,(www.lmi3D.com, accessed on April 2016).
Department of Architecture and Urbanism, Faculty of Technical Sciences, University of Novi Sad, Serbia
M.Arch., Teaching Assistant, [email protected]
Department of Architecture and Urbanism, Faculty of Technical Sciences, University of Novi Sad, Serbia
PhD., Full Professor, [email protected]
ABSTRACT
Historic structures, particularly their structural elements like masonry arches, are often analysed in the framework of limit equilibrium analysis, using the concept of thrust line, which graphically represents a load path. By introducing the traditional assumptions which eliminate the possibility of failure due to material strength, but permit only failure due to instability, i.e. by rotation of arch portion about rupture point on intrados or extrados, the problem of the stability of arch is reduced to mainly geometrical task. Namely, when the thickness of the arch is sufficiently reduced and the limit thrust line touches the intrados and extrados at least in four rupture joints, the arch reaches a limit equilibrium state i.e. it reaches the point of collapse. Since the 18th century, researchers have considered different collapse modes as well as various positions of thrust line in the arches of different shapes, but there is no complete set of collapse modes regarding pointed arches, with precise correlation to the eccentricity and embrace angle. Hence, it is necessary to determine rupture joints and their correct arrangement.
In this paper, the particular geometric parameters that diverse pointed from semicircular arches, such as the position of the application points of the horizontal thrust force acting at the crown and the reaction force acting at the springings, which, beside the eccentricity by default, affect the global position of the thrust line along the arch, have been pointed out. Hence, they have been correlated with the admissible collapse modes. In addition, for a fixed angle of embrace, the correlation between eccentricity and the order of the occurrence of collapse modes has been derived. It has been shown that starting with the segmental arch (having zero eccentricity and five theoretical hinges), and gradually increasing the eccentricity, collapse modes containing six, seven and five hinges (appearing in two different patterns) are successively obtained. In addition, the geometry of optimal pointed arch, representing theoretically the thinnest possible arch, corresponding to the limit collapse mode having seven hinges, has been indicated. The analysis carried out in this paper represents the framework within the numerical calculations, regarding the detection of minimum thicknesses as well as the characteristic eccentricity values corresponding to the limit collapse modes, that are to be conducted.
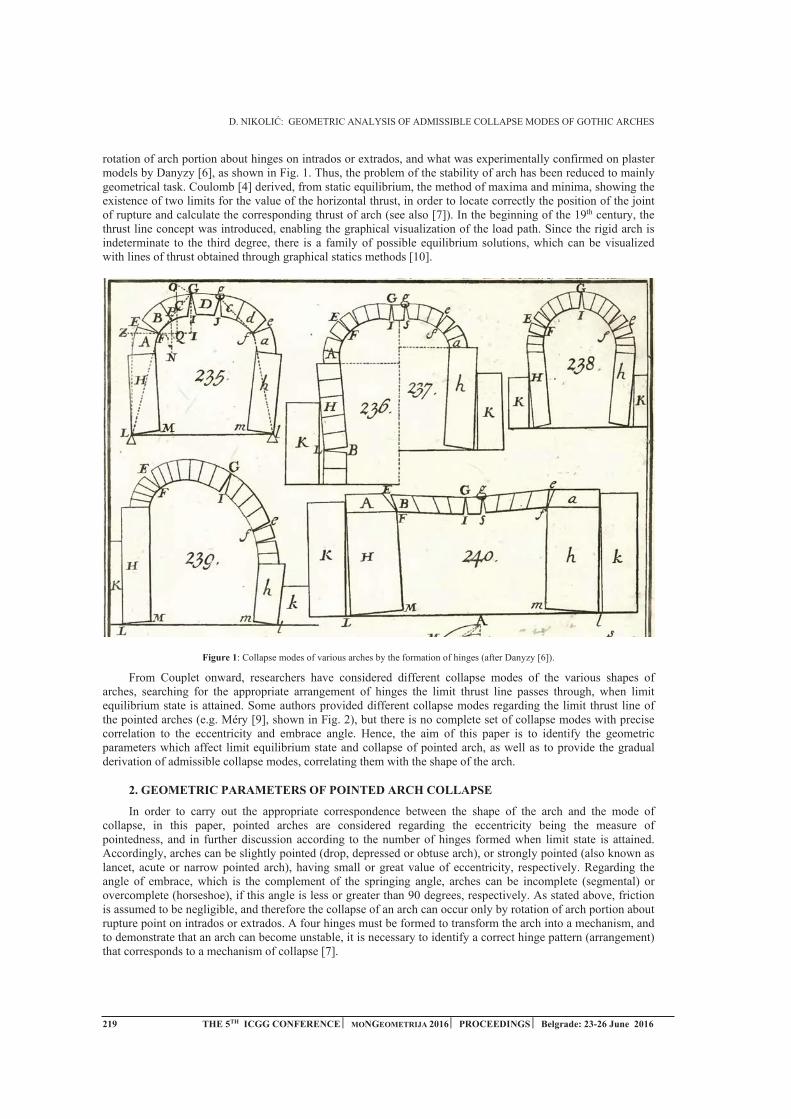
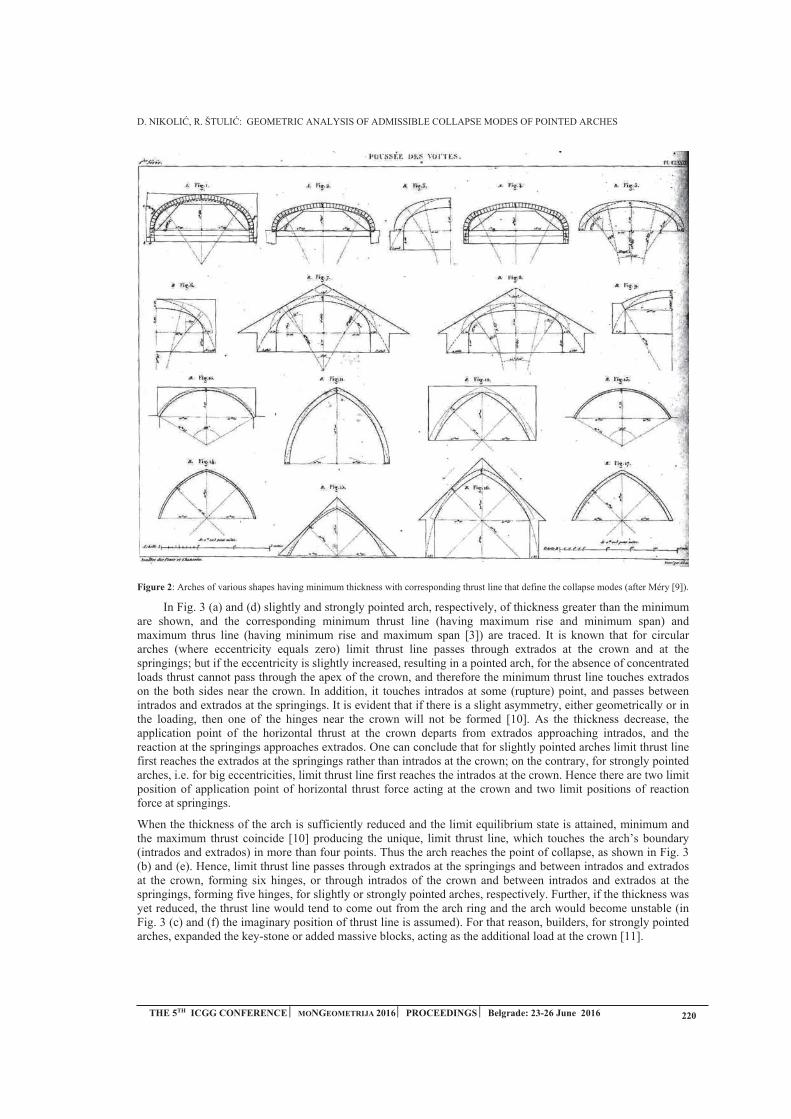
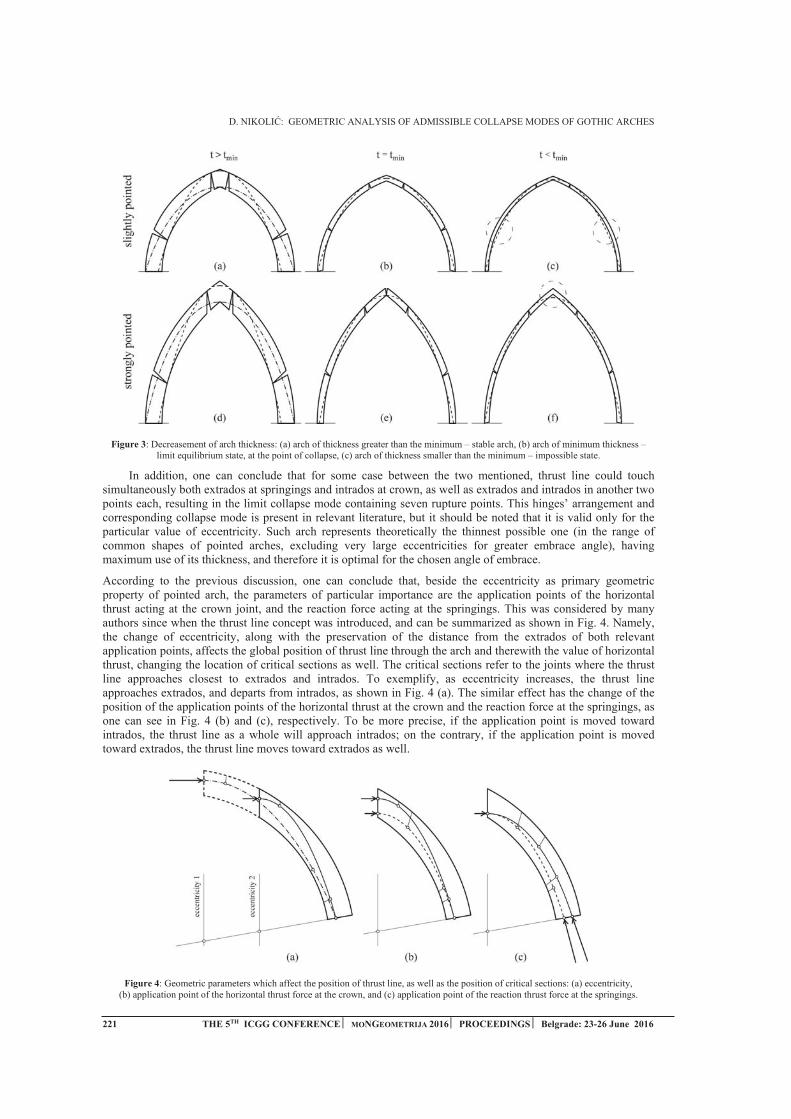
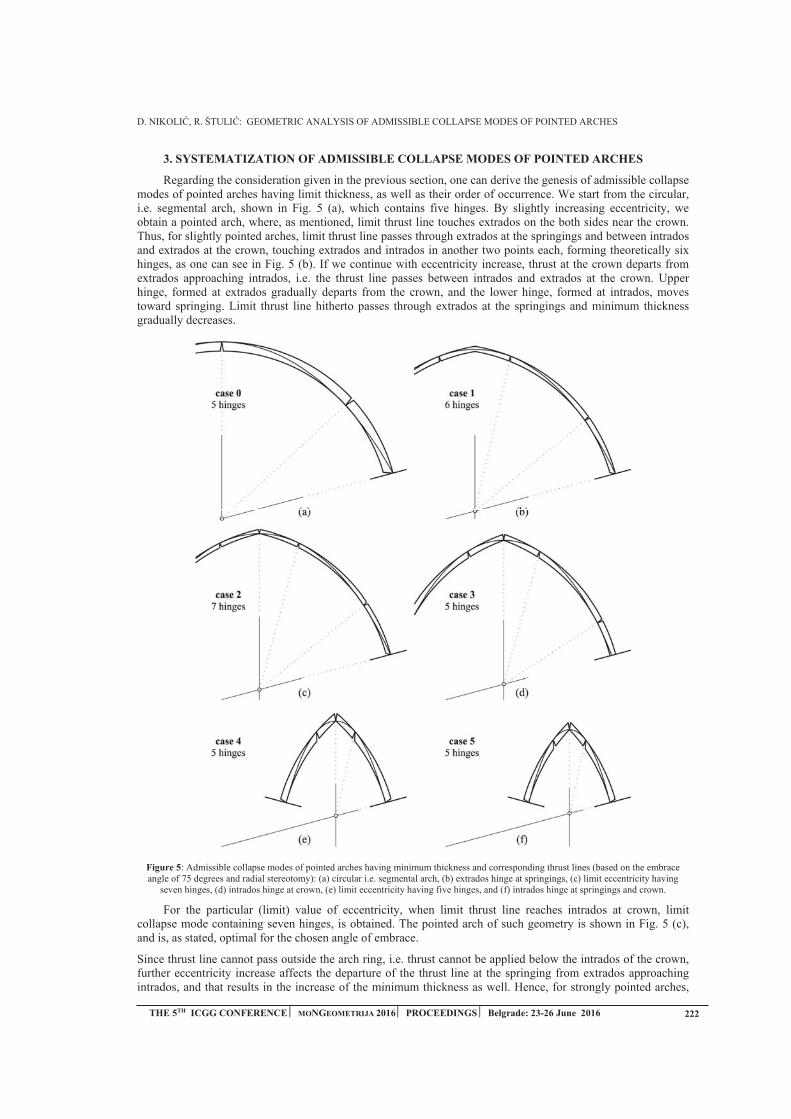
Collapse mode 0 1 2 3 4 Hinge position extrados intrados extrados intrados extrados intrados extrados intrados extrados intrados
Crown Springings Additional
Theoretical number of hinges 5 6 7 5 5

Arch. Appl. Mech.
Annales des ponts et chaussées
Int. J. Archit. Herit.
O. GUMEN ET AL.: GEOMETRIC ANALYSIS OF TURBULENT MACROSTRUCTURE IN JETS LAID ON FLAT SURFACES FOR TURBULENCE INTENSITY CALCULATION
THE 5TH ICGG CONFERENCE MONGEOMETRIJA 2016 PROCEEDINGS Belgrade: 23-26 June 2016 225
GEOMETRIC ANALYSIS OF TURBULENT MACROSTRUCTURE IN JETS LAID ON FLAT SURFACES FOR TURBULENCE INTENSITY
CALCULATION Olena Gumen
Department of descriptive geometry, engineering and computer graphics, National Technical University of Ukraine ‘Kyiv Polytechnic Institute’, Kyiv, Ukraine
Dr. Hab., Professor, [email protected]
Volodymyr Dovhaliuk
Department of Heat Gas Supply and Ventilation, Kyiv National University of Construction and Architecture, Kyiv, Ukraine
PhD., Professor, [email protected]
Viktor Mileikovskyi
Department of Heat Gas Supply and Ventilation, Kyiv National University of Construction and Architecture, Kyiv, Ukraine
PhD., Associate Professor, [email protected]
Olha Lebedieva
Department of descriptive geometry, engineering and computer graphics, National Technical University of Ukraine ‘Kyiv Polytechnic Institute’, Kyiv, Ukraine
PhD., Senior Lecturer, [email protected]
ABSTRACT
The European Norms for ventilation contain turbulence intensity requirements in rooms. One
of the determining factors is turbulence intensity in ventilation jets. In general, determination of it
require experimental data. We found an approach for geometric analysis of turbulent
macrostructure for theoretical calculation of subsonic flows with large-scale vorticity i.e. jets and
boundary layers between flows. This approach is a continuation of the researches of flows with
small-scale vorticity performed by Andrey Tkachuk (1928-2002), the head of Heat Gas Supply and
Ventilation Department of Kyiv National University of Construction and Architecture.
This approach requires building of simplified turbulent macrostructure chart assuming round
large-scale vortices and performing the geometrical analysis of it. In previous works using the
approach we analytically found the averaged characteristic of free jets, jets in flows and jets laid on
different shape surfaces without requirements of any experimental data. The results of geometrical
analysis of heat transfer between flows are used in Ukrainian standard for thermal renovation of
residential buildings.
In this work using the approach we found turbulence intensity of a wall jet on a flat surface
such as room walls or ceiling without any experimental values. The geometric and kinematic
analysis provide pulsation chart of x-component of flow velocity in a point caused only by the
macrostructure excluding the small-scale vorticity. This chart may be integrated by the half-period
of time. To simplify integration we integrate by flow direction instead of integration by the time. The
results are coincide with known experimental data and may be used in flow calculation in rooms.
Keywords: turbulence intensity; turbulent mactostructure; jet; wall jet; computational fluid dynamic
O. GUMEN ET AL.: GEOMETRIC ANALYSIS OF TURBULENT MACROSTRUCTURE IN JETS LAID ON FLAT SURFACES FOR TURBULENCE INTENSITY CALCULATION
226 THE 5TH ICGG CONFERENCE MONGEOMETRIJA 2016 PROCEEDINGS Belgrade: 23-26 June 2016
INTRODUCTION
Human thermal comfort is the human body ability to dissipate all heat energy generated by metabolism without stress on the organism heat regulation system. The heat exchange between the body and the internal room air is dependent on five microclimate parameters, covered by the European Norms:
air temperature; relative humidity; air velocity; average surface temperature (radiant temperature); turbulence intensity
During harmonization with European Norms Ukraine accepted turbulence standardization (Strelchuk O and Sizov O. (2013). The theories of turbulent flow are not developed well enough to easily calculate the turbulence intensity. Most of air distributors documentation contains turbulence charts but they do not consider interaction effects between the jet and other flows and obstacles. CFD (Thool S. B. and Sinha S. L. (2014) simulation require a lot of time for 3D model (mesh) building and calculations using high-cost hardware and software. Therefore, the turbulent flows theory development is necessary for air distribution design simplification.
A. Tkachuk, the professor, head of Heat Gas Supply and Ventilation Department of Kyiv National University of Construction and Architecture (Dovhaliuk V. B. (2015) has developed new theory of turbulent boundary layers using the singularity method. Turbulent flow is regarded as a stream of ideal liquid with small vortices as ‘singularities’. Turbulent boundary layers is described as vortex films of adjoining vortex cords. Using the Kelvin-Stokes theorem this theory describes the influence of vortices directly avoiding additional values with unapparent physical meaning i.e. turbulence viscosity, mixing length or turbulent Prandtl number. The theory has been developed only for averaged flow and it did not cover turbulence parameters. We propose a continuation of A. Tkachuk’s researches. Based on different visual researches (Van Hoof T. at al (2012), Juodis E. S. and Motuziene V., (2014), Papanicolaou P. N. and Gharib M., (1994), Schumamaker S. A. and Driscoll J. F., (2008), Zhukovskyi, S.S. and Labai V.I. (2003) and many other) we offer an approach for jet flows and other flows with large-scale vorticity, which describes such flow as a group of adjoining round large-scale vortices (puffs). It can give averaged parameters of the flows based on geometrical and kinematic analysis avoiding integration in the most of cases. The approach can describe not only the average parameters but also the low-frequency parameter changes (turbulent pulsations) caused by the puffs. In this work the turbulent parameters of a jet laid on a flat wall (flat wall jet) will be calculated. Using Tolmien source concept (Abramovich G. N. (2011) the jet will be considered as discharged from infinitely small slot located at the pole (intersection point of the jet boundaries at large distance from the real slot) of the jet. As the puffs, obviously, have incomparably more energy that small-scale vorticity, they almost determine most of the flow characteristics including turbulence intensity. An abscissa x is usually aligned with the wall. For jets with maximum average (by time) velocity um in a section, local (at a point of the same section) instantaneous (non-averaged) x-velocity ux, local average (by the time) velocity ūx and local pulsation velocity u'x the turbulence intensity
./ε m
I
x uu= (Eq.1)
The pulsation velocity is most commonly defined as root mean square (RMS) of the velocity ux:
,2xx
I
x ūu=u (Eq.2)
where bar means averaging by time.
2. MAIN CONCEPTS
Let us consider (Figure 1 (a) a flat jet from infinitely small slot near to a flat wall w as a puff sheet. Let us choose a puff 1. Between the puffs there are interpuff layers with external parts 2 and internal parts 3. The ambient air (or gas or liquid) inflows 3 to the jet in the normal direction to the wall w. The x-axis is coincident to the wall w in the jet direction and the y-axis runs from the wall to the ambience in the section AB crossing the puff 1 centre O.
The jet has (Abramovich G. N. (2011) two layers: the wall boundary layer (between the lines w and d) with a small-scale turbulent structure (out of scope) and the jet boundary layer with puffs (between lines d and b). For the Tolmien source (as at the enough distance from the real jet beginning) the lines b (the free boundary), g (puff centres locus) and d (division line between puff jet and wall boundary layers) are straight. In this context the line
d is not the maximum velocity line – the locus of points with maximum velocity um in the jet sections.
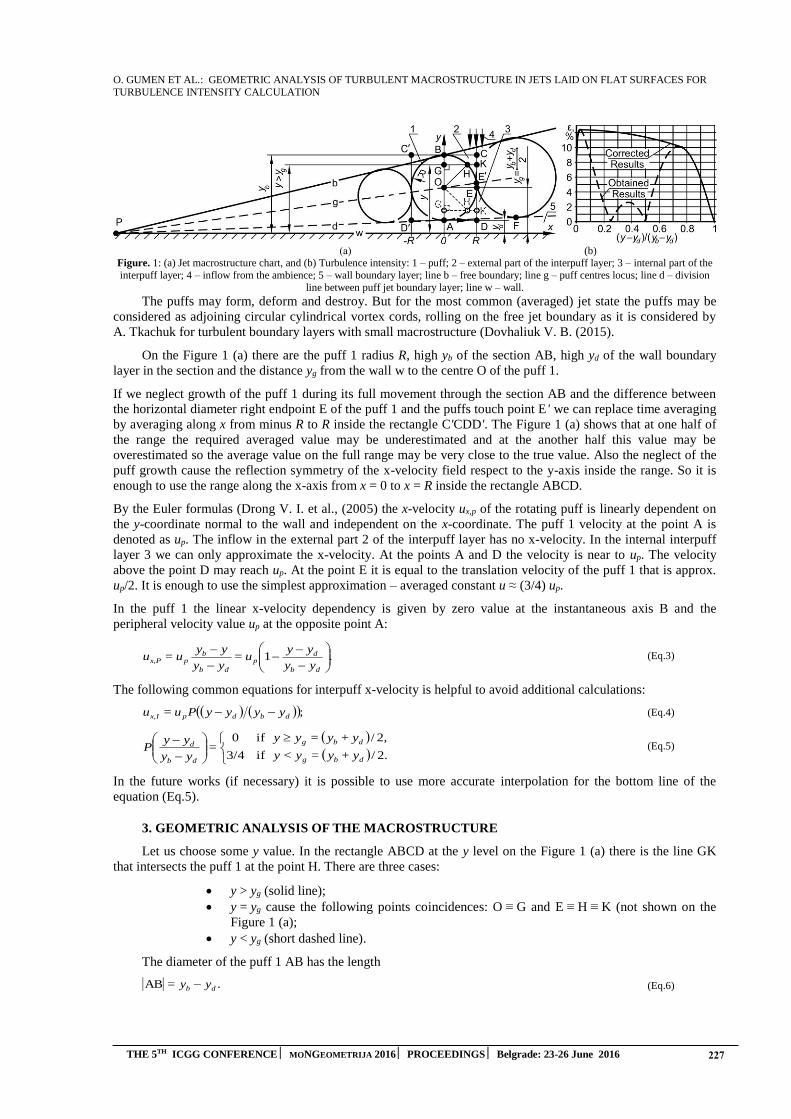
O. GUMEN ET AL.: GEOMETRIC ANALYSIS OF TURBULENT MACROSTRUCTURE IN JETS LAID ON FLAT SURFACES FOR TURBULENCE INTENSITY CALCULATION
THE 5TH ICGG CONFERENCE MONGEOMETRIJA 2016 PROCEEDINGS Belgrade: 23-26 June 2016 227
(а) (b) Figure. 1: (a) Jet macrostructure chart, and (b) Turbulence intensity: 1 – puff; 2 – external part of the interpuff layer; 3 – internal part of the interpuff layer; 4 – inflow from the ambience; 5 – wall boundary layer; line b – free boundary; line g – puff centres locus; line d – division
line between puff jet boundary layer; line w – wall. The puffs may form, deform and destroy. But for the most common (averaged) jet state the puffs may be
considered as adjoining circular cylindrical vortex cords, rolling on the free jet boundary as it is considered by A. Tkachuk for turbulent boundary layers with small macrostructure (Dovhaliuk V. B. (2015).
On the Figure 1 (a) there are the puff 1 radius R, high yb of the section AB, high yd of the wall boundary layer in the section and the distance yg from the wall w to the centre O of the puff 1.
If we neglect growth of the puff 1 during its full movement through the section AB and the difference between the horizontal diameter right endpoint E of the puff 1 and the puffs touch point E' we can replace time averaging by averaging along x from minus R to R inside the rectangle C'CDD'. The Figure 1 (a) shows that at one half of the range the required averaged value may be underestimated and at the another half this value may be overestimated so the average value on the full range may be very close to the true value. Also the neglect of the puff growth cause the reflection symmetry of the x-velocity field respect to the y-axis inside the range. So it is enough to use the range along the x-axis from x = 0 to x = R inside the rectangle ABCD.
By the Euler formulas (Drong V. I. et al., (2005) the x-velocity ux,p of the rotating puff is linearly dependent on the y-coordinate normal to the wall and independent on the x-coordinate. The puff 1 velocity at the point A is denoted as up. The inflow in the external part 2 of the interpuff layer has no x-velocity. In the internal interpuff layer 3 we can only approximate the x-velocity. At the points A and D the velocity is near to up. The velocity above the point D may reach up. At the point E it is equal to the translation velocity of the puff 1 that is approx. up/2. It is enough to use the simplest approximation – averaged constant u ≈ (3/4) up.
In the puff 1 the linear x-velocity dependency is given by zero value at the instantaneous axis B and the peripheral velocity value up at the opposite point A:
.1
db
dp
db
bpPx,
yy
yyu=
yy
yyu=u (Eq.3)
The following common equations for interpuff x-velocity is helpful to avoid additional calculations:
;dbdpIx, yyyyPu=u (Eq.4)
2./ if3/42,/ if0
dbg
dbg
db
d
y+y=y<y
y+y=yy=
yy
yyP (Eq.5)
In the future works (if necessary) it is possible to use more accurate interpolation for the bottom line of the equation (Eq.5).
3. GEOMETRIC ANALYSIS OF THE MACROSTRUCTURE
Let us choose some y value. In the rectangle ABCD at the y level on the Figure 1 (a) there is the line GK that intersects the puff 1 at the point H. There are three cases:
y > yg (solid line); y = yg cause the following points coincidences: O ≡ G and E ≡ H ≡ K (not shown on the
Figure 1 (a); y < yg (short dashed line).
The diameter of the puff 1 AB has the length .AB db yy= (Eq.6)
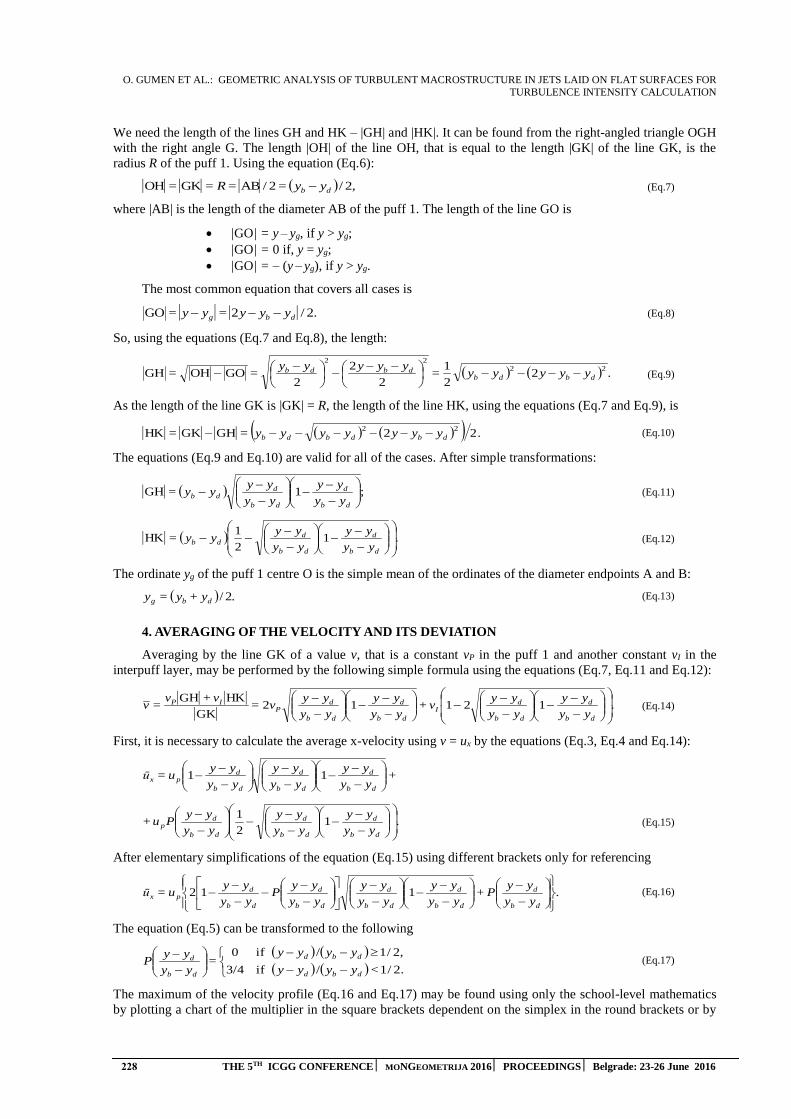
O. GUMEN ET AL.: GEOMETRIC ANALYSIS OF TURBULENT MACROSTRUCTURE IN JETS LAID ON FLAT SURFACES FOR TURBULENCE INTENSITY CALCULATION
228 THE 5TH ICGG CONFERENCE MONGEOMETRIJA 2016 PROCEEDINGS Belgrade: 23-26 June 2016
We need the length of the lines GH and HK – |GH| and |HK|. It can be found from the right-angled triangle OGH with the right angle G. The length |OH| of the line OH, that is equal to the length |GK| of the line GK, is the radius R of the puff 1. Using the equation (Eq.6):
2,/2/ABGKOH db yy==R== (Eq.7)
where |AB| is the length of the diameter AB of the puff 1. The length of the line GO is
|GO| = y – yg, if y > yg; |GO| = 0 if, y = yg; |GO| = – (y – yg), if y > yg.
The most common equation that covers all cases is
2./2GO dbg yyy=yy= (Eq.8)
So, using the equations (Eq.7 and Eq.8), the length:
.221
22
2GOOHGH 22
22
dbdbdbdb yyyyy=
yyyyy==
(Eq.9)
As the length of the line GK is |GK| = R, the length of the line HK, using the equations (Eq.7 and Eq.9), is
.22GHGKHK 22dbdbdb yyyyyyy== (Eq.10)
The equations (Eq.9 and Eq.10) are valid for all of the cases. After simple transformations:
;1GH
db
d
db
ddb
yy
yy
yy
yyyy= (Eq.11)
.121HK
db
d
db
ddb
yy
yy
yy
yyyy= (Eq.12)
The ordinate yg of the puff 1 centre O is the simple mean of the ordinates of the diameter endpoints A and B:
2./dbg y+y=y (Eq.13)
4. AVERAGING OF THE VELOCITY AND ITS DEVIATION
Averaging by the line GK of a value v, that is a constant vP in the puff 1 and another constant vI in the interpuff layer, may be performed by the following simple formula using the equations (Eq.7, Eq.11 and Eq.12):
.12112GK
HKGH
db
d
db
dI
db
d
db
dP
IP
yy
yy
yy
yyv+
yy
yy
yy
yyv=
v+v=v (Eq.14)
First, it is necessary to calculate the average x-velocity using v = ux by the equations (Eq.3, Eq.4 and Eq.14):
+yy
yy
yy
yy
yy
yyu=ū
db
d
db
d
db
dpx
11
.121
db
d
db
d
db
dp
yy
yy
yy
yy
yy
yyPu+ (Eq.15)
After elementary simplifications of the equation (Eq.15) using different brackets only for referencing
.112
db
d
db
d
db
d
db
d
db
dpx
yy
yyP+
yy
yy
yy
yy
yy
yyP
yy
yyu=ū (Eq.16)
The equation (Eq.5) can be transformed to the following
2./1/ if3/42,/1/ if0
<yyyy
yyyy=
yy
yyP
dbd
dbd
db
d (Eq.17)
The maximum of the velocity profile (Eq.16 and Eq.17) may be found using only the school-level mathematics by plotting a chart of the multiplier in the square brackets dependent on the simplex in the round brackets or by
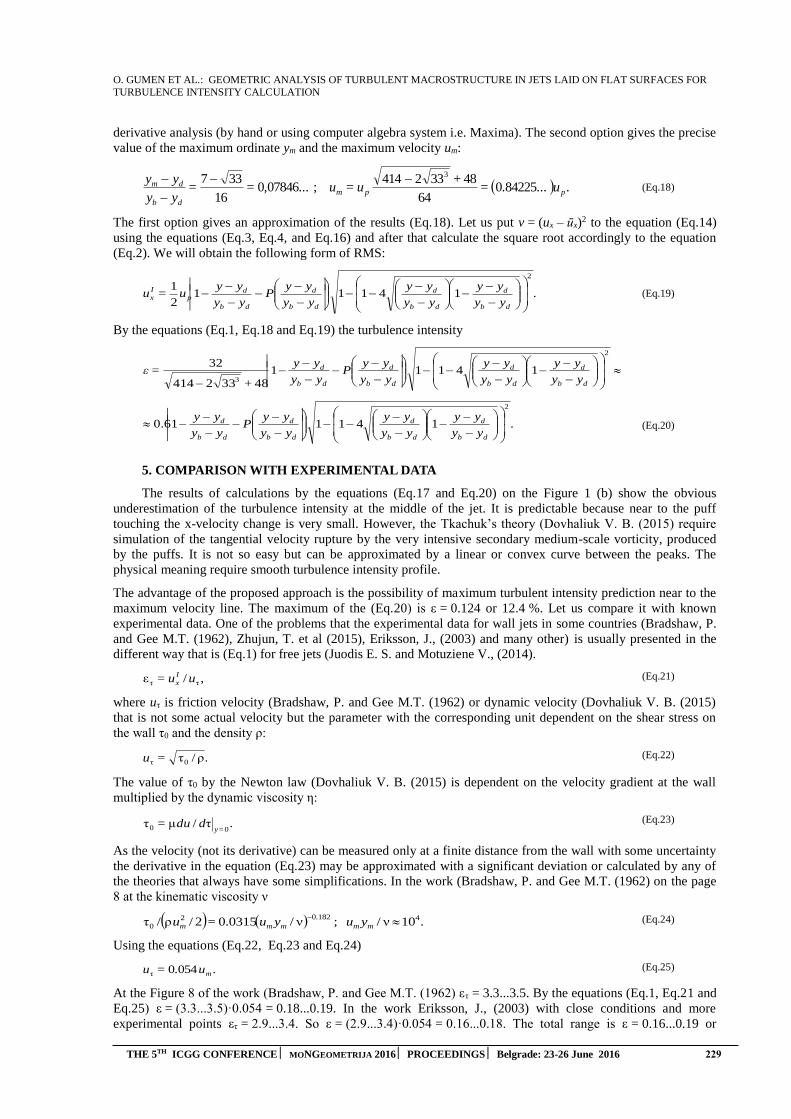
O. GUMEN ET AL.: GEOMETRIC ANALYSIS OF TURBULENT MACROSTRUCTURE IN JETS LAID ON FLAT SURFACES FOR TURBULENCE INTENSITY CALCULATION
THE 5TH ICGG CONFERENCE MONGEOMETRIJA 2016 PROCEEDINGS Belgrade: 23-26 June 2016 229
derivative analysis (by hand or using computer algebra system i.e. Maxima). The second option gives the precise value of the maximum ordinate ym and the maximum velocity um:
.0.84225...64
48332414 ; 0,07846...16
337 3
ppm
db
dm u=+
u=u==yy
yy
(Eq.18)
The first option gives an approximation of the results (Eq.18). Let us put v = (ux – ūx)2 to the equation (Eq.14) using the equations (Eq.3, Eq.4, and Eq.16) and after that calculate the square root accordingly to the equation (Eq.2). We will obtain the following form of RMS:
.1411121
2
db
d
db
d
db
d
db
dp
I
xyy
yy
yy
yy
yy
yyP
yy
yyu=u (Eq.19)
By the equations (Eq.1, Eq.18 and Eq.19) the turbulence intensity
2
314111
48332414
32
db
d
db
d
db
d
db
d
yy
yy
yy
yy
yy
yyP
yy
yy
+=ε
.141110.62
db
d
db
d
db
d
db
d
yy
yy
yy
yy
yy
yyP
yy
yy (Eq.20)
5. COMPARISON WITH EXPERIMENTAL DATA
The results of calculations by the equations (Eq.17 and Eq.20) on the Figure 1 (b) show the obvious underestimation of the turbulence intensity at the middle of the jet. It is predictable because near to the puff touching the x-velocity change is very small. However, the Tkachuk’s theory (Dovhaliuk V. B. (2015) require
simulation of the tangential velocity rupture by the very intensive secondary medium-scale vorticity, produced by the puffs. It is not so easy but can be approximated by a linear or convex curve between the peaks. The physical meaning require smooth turbulence intensity profile.
The advantage of the proposed approach is the possibility of maximum turbulent intensity prediction near to the maximum velocity line. The maximum of the (Eq.20) is ε = 0.124 or 12.4 %. Let us compare it with known experimental data. One of the problems that the experimental data for wall jets in some countries (Bradshaw, P. and Gee M.T. (1962), Zhujun, T. et al (2015), Eriksson, J., (2003) and many other) is usually presented in the different way that is (Eq.1) for free jets (Juodis E. S. and Motuziene V., (2014).
,/ε ττ uu= I
x (Eq.21)
where uτ is friction velocity (Bradshaw, P. and Gee M.T. (1962) or dynamic velocity (Dovhaliuk V. B. (2015) that is not some actual velocity but the parameter with the corresponding unit dependent on the shear stress on the wall τ0 and the density ρ:
.ρ/τ0τ =u (Eq.22)
The value of τ0 by the Newton law (Dovhaliuk V. B. (2015) is dependent on the velocity gradient at the wall multiplied by the dynamic viscosity η:
.τ/μτ 00 =yddu= (Eq.23)
As the velocity (not its derivative) can be measured only at a finite distance from the wall with some uncertainty the derivative in the equation (Eq.23) may be approximated with a significant deviation or calculated by any of the theories that always have some simplifications. In the work (Bradshaw, P. and Gee M.T. (1962) on the page 8 at the kinematic viscosity ν
.10ν/ ; ν/0.03152/ρ/τ 40.18220
mmmmm yuyu=u (Eq.24)
Using the equations (Eq.22, Eq.23 and Eq.24)
.0.054τ mu=u (Eq.25)
At the Figure 8 of the work (Bradshaw, P. and Gee M.T. (1962) ετ = 3.3...3.5. By the equations (Eq.1, Eq.21 and Eq.25) ε = (3.3...3.5)·0.054 = 0.18...0.19. In the work Eriksson, J., (2003) with close conditions and more experimental points ετ = 2.9...3.4. So ε = (2.9...3.4)·0.054 = 0.16...0.18. The total range is ε = 0.16...0.19 or
O. GUMEN ET AL.: GEOMETRIC ANALYSIS OF TURBULENT MACROSTRUCTURE IN JETS LAID ON FLAT SURFACES FOR TURBULENCE INTENSITY CALCULATION
230 THE 5TH ICGG CONFERENCE MONGEOMETRIJA 2016 PROCEEDINGS Belgrade: 23-26 June 2016
16...19 %. So the difference between the result of the work (0.124) and experimental data is 0.036...0.066 or 3.6...6.6 %. As the experimental data have deviation about 3 %, the result of this work is acceptable for the rough estimations. The additional 3.6...6.6 % is the influence of small-scale vorticity.
The very important advantage of this approach: it uses elementary geometry and kinematic knowledges and do not use hard to understand ‘virtual’ quantities with vague physical meaning so we can use it to explain the very
difficult aerodynamic task for wide range of people.
6. CONCLUSIONS
The proposed approach give us a possibility to estimate the turbulence intensity in wall jets caused by the large-scale vorticity. Because it have the main influence, the deviation is 3.6...6.6 %. This deviation is the estimation of small-scale turbulence influence. The advantage of this approach is its simplicity and absence of the additional values with indistinct meaning such as turbulent viscosity, mixing length etc. The future work will describe turbulence intensity of wall jets on walls with different curvature.
REFERENCES
1. Abramovich G. N., 2011. Teoriia turbulentnykh strui. Ekolit, Moskow, Russian Federation.
2. Bradshaw, P. and Gee M.T. 1962. Turbulent Wall Jets with and without an External Stream. Reportsand Memoranda No. 3252*. June, 1960. Her Majesty’s Stationary Office, London, Great Britain.
3. Dovhaliuk V. B., 2015. Aerodynamika ventyliatsii. Navchalnyi posibnyk. IVNVKP Ukrheliotekh,Kyiv, Ukraine.
4. Drong V. I. et al., 2005. Kurs teoreticheskoi mekhaniki. Uchebnik dlia vuzov. 3-e izd., stereotip.MGTU im N.E.Baumana, Moskow, Russian Federation.
5. Eriksson, J., 2003. Experimental studies of the plane turbulent wall jet. Technical reports from RoyalInstitute of Technology Department of Mechanics FaxenLaboratoriet SE-100 44. Stockholm,Sweeden.
6. Juodis E. S. and Motuziene V., 2014. Vedinimo aerodinamika. Vadovelis. ‘Technika’, Vilnius,
Lithuania.
7. Papanicolaou P. N. and Gharib M., 1994. Growth of a Round Jet, Under Local Reynolds NumberGradients. Recent Research Advances in the Fluid Mechanics of Turbulent Jets and Plumes.Proceedings of the NATO Advanced Research Workshop on Recent Research Advances in the FluidMechanics of Turbulent Jets and Plumes. Viana do Castelo, Portugal. Series E: Applied Sciences,Vol. 255. pp 177–190.
8. Thool S. B. and Sinha S. L., 2014. Simulation of Room Airflow using CFD and Validation withExperimental Results. International Journal of Engineering Science and Technology, 6(5). pp 192–
202.
9. Schumamaker S. A. and Driscoll J. F., 2008. Mixing Lengths of Reacting and Nonreacting CoaxialInjectors in a Laboratory Rocket Combastor. 44th AIAA/ASME/SAI/ASEE Joint PropulsionConference and Exhibit. 21-23 July 2008, Hartford, CT. pp 177–190. https://deepblue.lib.umich.edu/bitstream/handle/2027.42/77156/AIAA-2008-5022-346.pdf?sequence=1 [Accessed: 21st April 2016].
10. Strelchuk O and Sizov O., 2013. DBN V.2.5-67:2013. Opalennia, ventyliatsiia ta kondytsionuvannia.Vydannia oficiine. Ukrarhbudinform, Kyiv, Ukraine.
11. Van Hooff T. et al., 2012. PIV Measurements of a Plane Wall Jet in a Confined Space at TraditionalSlot Reynolds Numbers. Exp Fluids, 53(2). pp 499–517.
12. Zhujun, T. et al, 2015. Reynolds Stress Measurements in a Plane Turbulent Wall Jet on a SmoothSurface. International Symposium on Turbulence and Shear Flow Phenomena (TSFP-9) June 30 –
July 3, 2015, Melburn, Australia. pp. 281–305.
13. Zhukovskyi, S. S. and Labai V. I. 2003. Aerodynamika Ventyliatsii. Navchalnyi posibnyk.Vidavnitstvo Natsionalnogo universitetu ‘Lvivska politekhnika’, Lviv, Ukraine.
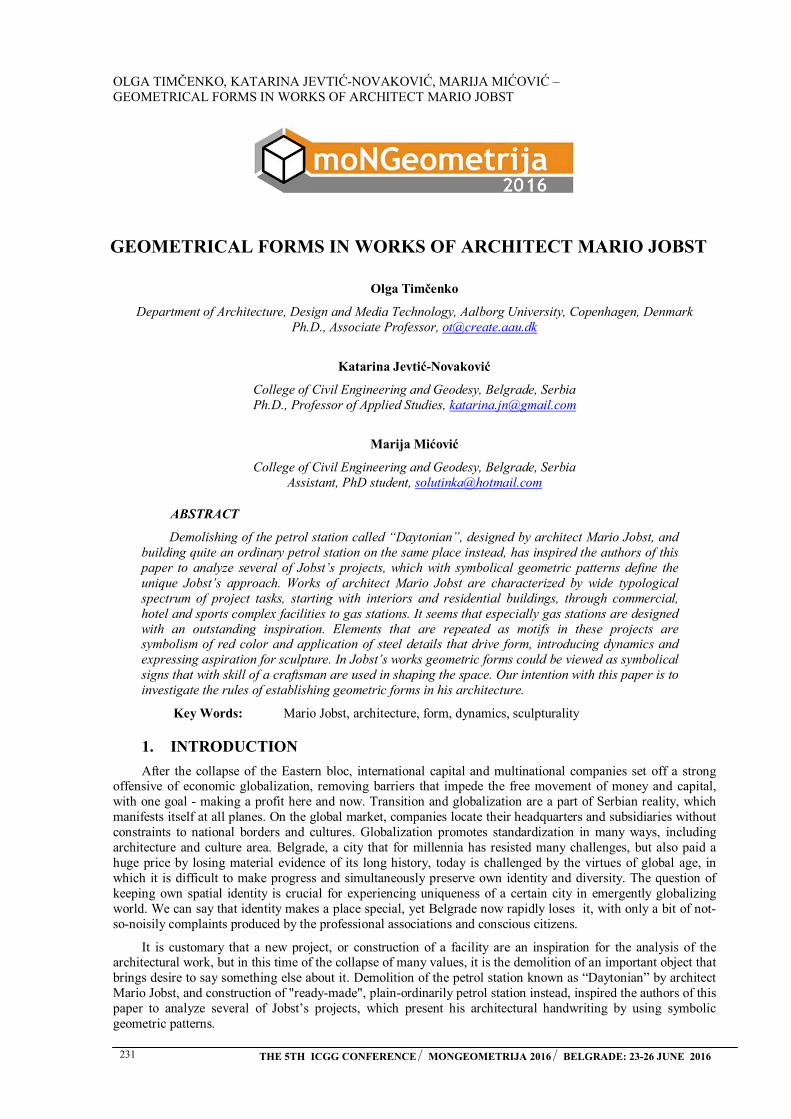
OLGA TIMČENKO, KATARINA JEVTIĆ-NOVAKOVIĆ, MARIJA MIĆOVIĆ – GEOMETRICAL FORMS IN WORKS OF ARCHITECT MARIO JOBST
231 THE 5TH ICGG CONFERENCE MONGEOMETRIJA 2016 BELGRADE: 23-26 JUNE 2016
GEOMETRICAL FORMS IN WORKS OF ARCHITECT MARIO JOBST
Olga Timčenko
Department of Architecture, Design and Media Technology, Aalborg University, Copenhagen, Denmark Ph.D., Associate Professor, [email protected]
Katarina Jevtić-Novaković
College of Civil Engineering and Geodesy, Belgrade, Serbia Ph.D., Professor of Applied Studies, [email protected]
Marija Mićović
College of Civil Engineering and Geodesy, Belgrade, Serbia Assistant, PhD student, [email protected]
ABSTRACT
Demolishing of the petrol station called “Daytonian”, designed by architect Mario Jobst, and building quite an ordinary petrol station on the same place instead, has inspired the authors of this paper to analyze several of Jobst’s projects, which with symbolical geometric patterns define the unique Jobst’s approach. Works of architect Mario Jobst are characterized by wide typological spectrum of project tasks, starting with interiors and residential buildings, through commercial, hotel and sports complex facilities to gas stations. It seems that especially gas stations are designed with an outstanding inspiration. Elements that are repeated as motifs in these projects are symbolism of red color and application of steel details that drive form, introducing dynamics and expressing aspiration for sculpture. In Jobst’s works geometric forms could be viewed as symbolical signs that with skill of a craftsman are used in shaping the space. Our intention with this paper is to investigate the rules of establishing geometric forms in his architecture.
Key Words: Mario Jobst, architecture, form, dynamics, sculpturality
1. INTRODUCTION
After the collapse of the Eastern bloc, international capital and multinational companies set off a strong offensive of economic globalization, removing barriers that impede the free movement of money and capital, with one goal - making a profit here and now. Transition and globalization are a part of Serbian reality, which manifests itself at all planes. On the global market, companies locate their headquarters and subsidiaries without constraints to national borders and cultures. Globalization promotes standardization in many ways, including architecture and culture area. Belgrade, a city that for millennia has resisted many challenges, but also paid a huge price by losing material evidence of its long history, today is challenged by the virtues of global age, in which it is difficult to make progress and simultaneously preserve own identity and diversity. The question of keeping own spatial identity is crucial for experiencing uniqueness of a certain city in emergently globalizing world. We can say that identity makes a place special, yet Belgrade now rapidly loses it, with only a bit of not-so-noisily complaints produced by the professional associations and conscious citizens.
It is customary that a new project, or construction of a facility are an inspiration for the analysis of the architectural work, but in this time of the collapse of many values, it is the demolition of an important object that brings desire to say something else about it. Demolition of the petrol station known as “Daytonian” by architect Mario Jobst, and construction of "ready-made", plain-ordinarily petrol station instead, inspired the authors of this paper to analyze several of Jobst’s projects, which present his architectural handwriting by using symbolic geometric patterns.

OLGA TIMČENKO, KATARINA JEVTIĆ-NOVAKOVIĆ, MARIJA MIĆOVIĆ – GEOMETRICAL FORMS IN WORKS OF ARCHITECT MARIO JOBST
232 THE 5TH ICGG CONFERENCE MONGEOMETRIJA 2016 BELGRADE: 23-26 JUNE 2016
2. MARIO JOBST- A SHORT BIOGRAPHY
Mario Jobst was born in 1940 in Belgrade. He graduated from the Faculty of Architecture in Belgrade in 1971. He worked in the company "Energoprojekt" (1972 to 2003); then he founded together with architect Misko Trpković and economist Zoran Milovanovic a project office DOMAA. He deals with the urban and architectural design, acting very active and fruitful in our country, but also abroad (Russia and African countries). He represents one of the most creative and the most prominent contemporary Serbian builders. His architecture is characterized by expressionistic form, traditional notions of the functions of the human habitat, an extremely high level of imagination and originality. This, together with well-known and widely recognized artistic features make Jobst recognized as one of doyens of Serbian architecture.
From the monograph about him, written by Dr. Zoran Manević, we can get to know many interesting details of his life. Surname Jobst is inherited from German ancestors, and the name Mario is result of his parents’ love of opera. In addition to architecture he had another great passion - fencing. This is a sport discipline that requires precision and quick decision-making, as opponents watching behind the protective mask examine intentions and react in a split second. We can safely conclude that Jobst used his fencing experience to "fight" with investors, administration and other opponents of architectural creativity. On the fencing competitions he met his wife Vera Jeftimijades, also an architect, our most decorated fencer of all time.
Creativity of Mario Jobst and its maturation over time can be traced during a period of work in "Energoprojekt", which marks his great creative productivity. Typology of tasks is extremely heterogeneous; a creative method resulted in a rich designer opus - a large number of projects and the realization of a variety of topics, rounded phases and cycles, as well as some distinctive common characteristics. "African design Syndrome" (as called by Manević), i.e. a trend of projecting monumental objects, could not bypass Mario Jobst. We can recognize this in some works from the earliest period of his work. This primarily refers to the competition project of Banjica Hotel (1978, with B.Ganovićem), as well as the project of the Center of Higher Education in Valjevo (1980). Hotel Banjica is conceived as cumbersome pyramidal structure carried by two giant frames. Inverted pyramidal structure, with prominent structural elements was firstly designed two years earlier, suited for an ambient in the United Arab Emirates. Center of Higher Education in Valjevo, in the form of a perforated truncated cone, continues a recognizable style of "Energoprojekt" monumental edifices.
Figure 1: Banjica Hotel Figure 2: Center of Higher Education in Valjevo Z. Manević- Arhitekta Mario Jobst
Two projects from the mature period of Jobst’s creativity should be emphasized - JAT office building, now Telecom (1988-90) and the complex of office buildings in Block 12 in New Belgrade (1992).
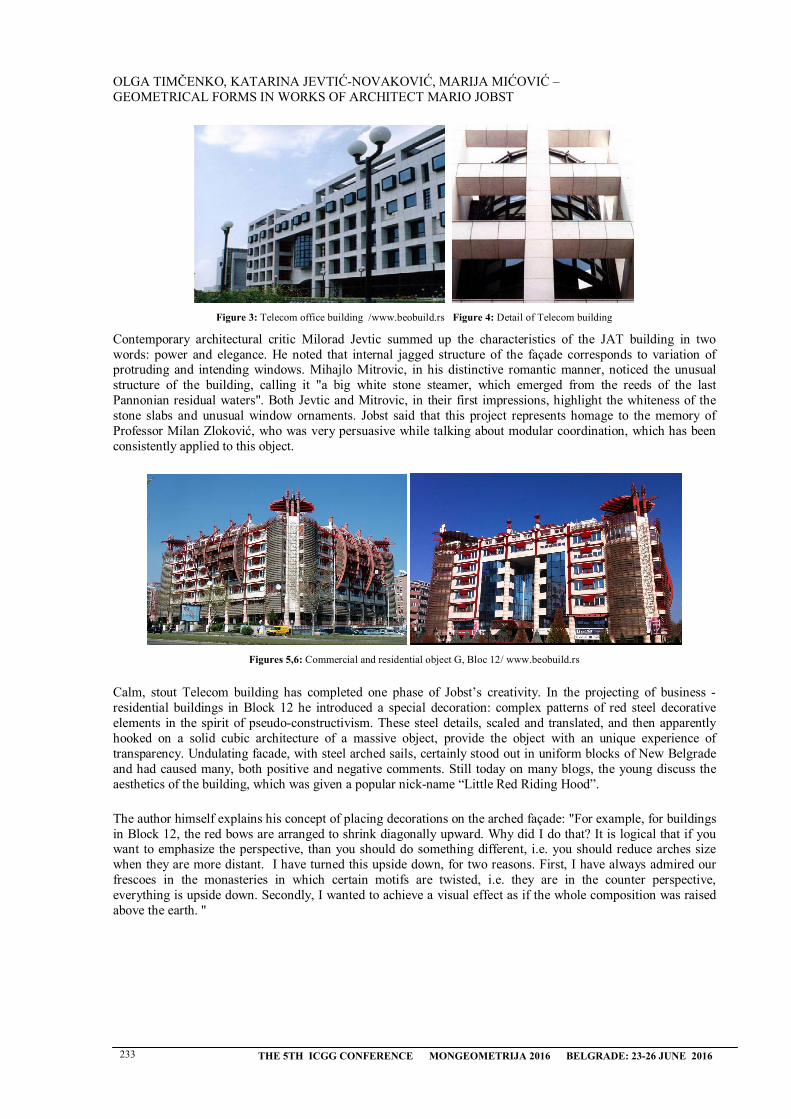
OLGA TIMČENKO, KATARINA JEVTIĆ-NOVAKOVIĆ, MARIJA MIĆOVIĆ – GEOMETRICAL FORMS IN WORKS OF ARCHITECT MARIO JOBST
233 THE 5TH ICGG CONFERENCE MONGEOMETRIJA 2016 BELGRADE: 23-26 JUNE 2016
Figure 3: Telecom office building /www.beobuild.rs Figure 4: Detail of Telecom building
Contemporary architectural critic Milorad Jevtic summed up the characteristics of the JAT building in two words: power and elegance. He noted that internal jagged structure of the façade corresponds to variation of protruding and intending windows. Mihajlo Mitrovic, in his distinctive romantic manner, noticed the unusual structure of the building, calling it "a big white stone steamer, which emerged from the reeds of the last Pannonian residual waters". Both Jevtic and Mitrovic, in their first impressions, highlight the whiteness of the stone slabs and unusual window ornaments. Jobst said that this project represents homage to the memory of Professor Milan Zloković, who was very persuasive while talking about modular coordination, which has been consistently applied to this object.
Figures 5,6: Commercial and residential object G, Bloc 12/ www.beobuild.rs
Calm, stout Telecom building has completed one phase of Jobst’s creativity. In the projecting of business - residential buildings in Block 12 he introduced a special decoration: complex patterns of red steel decorative elements in the spirit of pseudo-constructivism. These steel details, scaled and translated, and then apparently hooked on a solid cubic architecture of a massive object, provide the object with an unique experience of transparency. Undulating facade, with steel arched sails, certainly stood out in uniform blocks of New Belgrade and had caused many, both positive and negative comments. Still today on many blogs, the young discuss the aesthetics of the building, which was given a popular nick-name “Little Red Riding Hood”.
The author himself explains his concept of placing decorations on the arched façade: "For example, for buildings in Block 12, the red bows are arranged to shrink diagonally upward. Why did I do that? It is logical that if you want to emphasize the perspective, than you should do something different, i.e. you should reduce arches size when they are more distant. I have turned this upside down, for two reasons. First, I have always admired our frescoes in the monasteries in which certain motifs are twisted, i.e. they are in the counter perspective, everything is upside down. Secondly, I wanted to achieve a visual effect as if the whole composition was raised above the earth. "

OLGA TIMČENKO, KATARINA JEVTIĆ-NOVAKOVIĆ, MARIJA MIĆOVIĆ – GEOMETRICAL FORMS IN WORKS OF ARCHITECT MARIO JOBST
234 THE 5TH ICGG CONFERENCE MONGEOMETRIJA 2016 BELGRADE: 23-26 JUNE 2016
Figures 7, 8, 9: Block 12 details: Arch sails, Pyramids, Canopy/ www.beobuild.rs
3. PETROL STATIONS AS A SPECIAL TYPE OF INSPIRATION: SMALLOBJECTS, COMPLEX SOLUTIONS
Petrol stations architecture is as old as the existence of commercial road transport - increased needs back in the 19th century caused building of special pumps for refueling. However, the first gas stations worth mentioning for their architecture features appear at the beginning of 20th century, with Moderna art movement. Our country and our architects with their original solutions were not lagging behind at that time. The originality of expression was encouraged primarily by investors, who were hiring renowned architects. However, while such facilities in the world are still operating today, the works of our architects are demolished. For example, in rich Charlottenlund suburb of Copenhagen, Denmark, still exists and operates Arne Jacobsen’s old petrol station from 1938. It is now a class A historic monument. To this day, the petrol station remains the only one of its kind, fully intact and virtually unaltered since its erection in 1938. Arne Jacobsen was one of founders of now well-renowned Scandinavian design. In our country, distinctive reinforced concrete cap, with a diameter of 25 meters, known by the nickname Mushroom, built in Novi Sad by architect Mirko Stojnić, got demolished. Is this yet another case of negligence to preserve our modern architecture, or is this a prelude to the destruction of even more objects of our architectural inheritance, which will in foreseeable future be completely replaced by standardized, uniformed type objects?
Figure 10. Arne Jacobsen’s petrol station, Charlottenlund, Copenhagen, Denmark / www.arne-jacobsen.com
Figures 11, 12: “Mushroom” by M. Stojnic and its demolition / www.gradnja.rs
Mario Jobst had particularly carefully designed several gas stations, some of which were implemented (and ruined!), and some were award-winning, but not implemented. All of them were characterized by an extremely
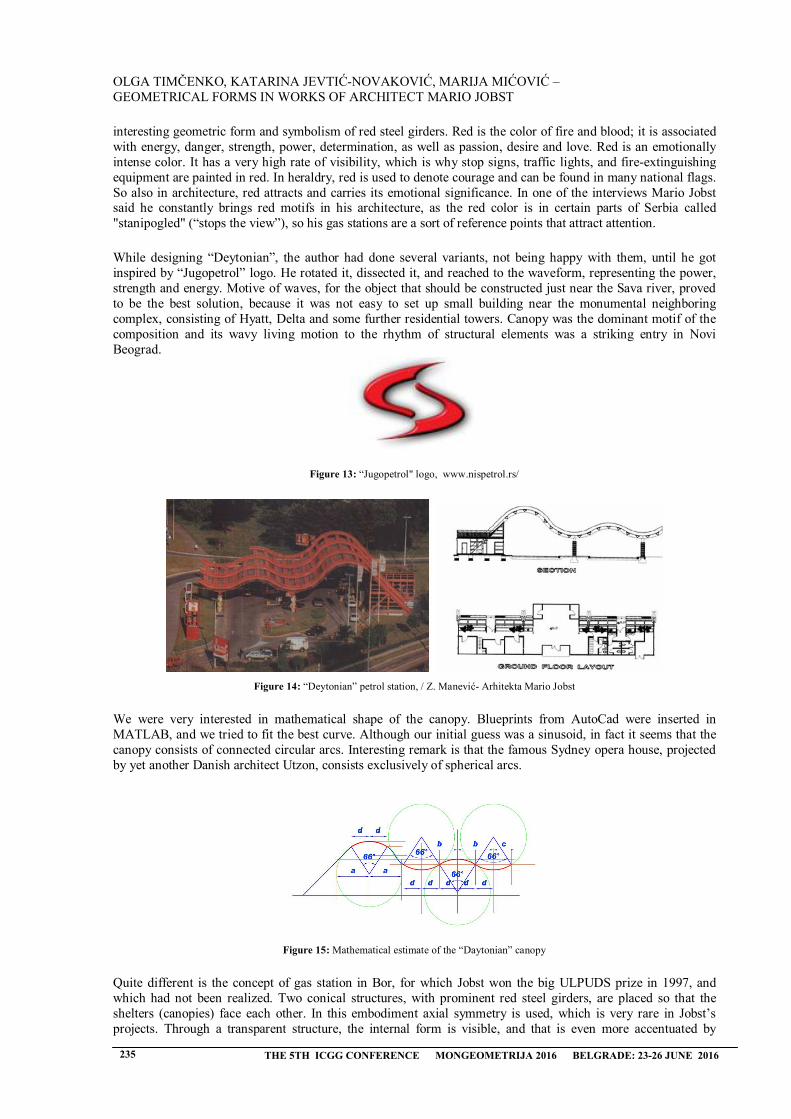
OLGA TIMČENKO, KATARINA JEVTIĆ-NOVAKOVIĆ, MARIJA MIĆOVIĆ – GEOMETRICAL FORMS IN WORKS OF ARCHITECT MARIO JOBST
235 THE 5TH ICGG CONFERENCE MONGEOMETRIJA 2016 BELGRADE: 23-26 JUNE 2016
interesting geometric form and symbolism of red steel girders. Red is the color of fire and blood; it is associated with energy, danger, strength, power, determination, as well as passion, desire and love. Red is an emotionally intense color. It has a very high rate of visibility, which is why stop signs, traffic lights, and fire-extinguishing equipment are painted in red. In heraldry, red is used to denote courage and can be found in many national flags. So also in architecture, red attracts and carries its emotional significance. In one of the interviews Mario Jobst said he constantly brings red motifs in his architecture, as the red color is in certain parts of Serbia called "stanipogled" (“stops the view”), so his gas stations are a sort of reference points that attract attention.
While designing “Deytonian”, the author had done several variants, not being happy with them, until he got inspired by “Jugopetrol” logo. He rotated it, dissected it, and reached to the waveform, representing the power, strength and energy. Motive of waves, for the object that should be constructed just near the Sava river, proved to be the best solution, because it was not easy to set up small building near the monumental neighboring complex, consisting of Hyatt, Delta and some further residential towers. Canopy was the dominant motif of the composition and its wavy living motion to the rhythm of structural elements was a striking entry in Novi Beograd.
Figure 13: “Jugopetrol" logo, www.nispetrol.rs/
Figure 14: “Deytonian” petrol station, / Z. Manević- Arhitekta Mario Jobst
We were very interested in mathematical shape of the canopy. Blueprints from AutoCad were inserted in MATLAB, and we tried to fit the best curve. Although our initial guess was a sinusoid, in fact it seems that the canopy consists of connected circular arcs. Interesting remark is that the famous Sydney opera house, projected by yet another Danish architect Utzon, consists exclusively of spherical arcs.
Figure 15: Mathematical estimate of the “Daytonian” canopy
Quite different is the concept of gas station in Bor, for which Jobst won the big ULPUDS prize in 1997, and which had not been realized. Two conical structures, with prominent red steel girders, are placed so that the shelters (canopies) face each other. In this embodiment axial symmetry is used, which is very rare in Jobst’s projects. Through a transparent structure, the internal form is visible, and that is even more accentuated by
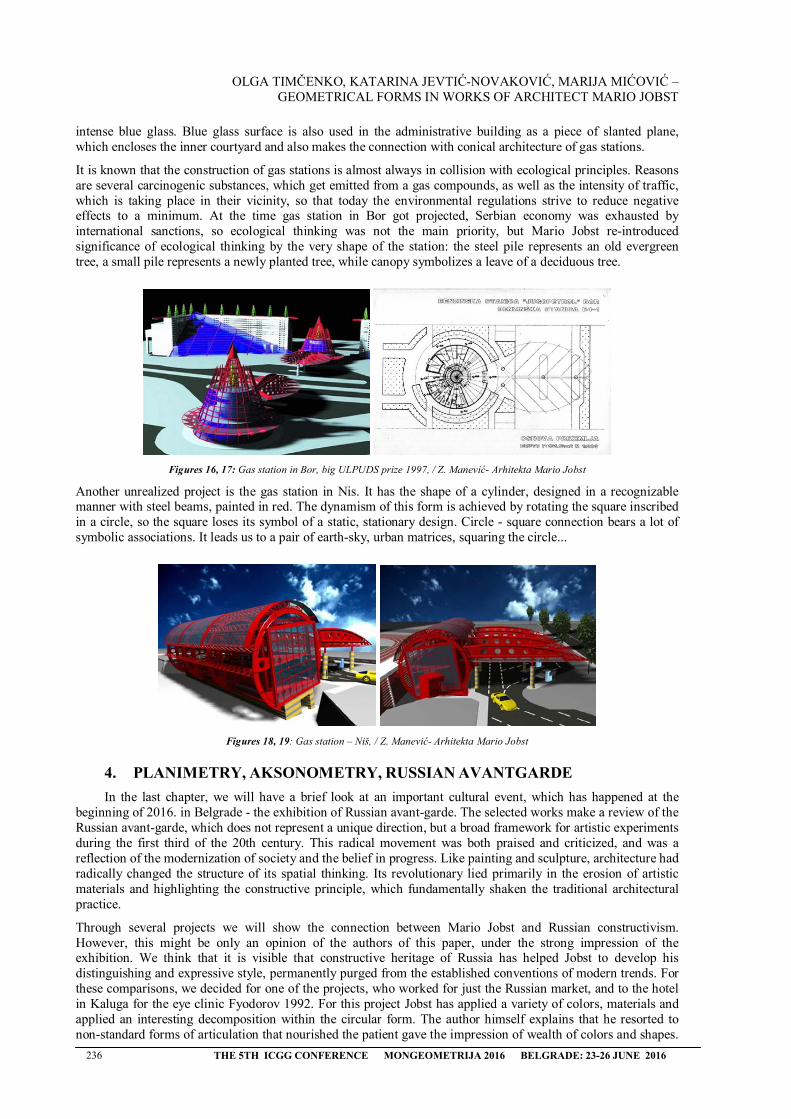
OLGA TIMČENKO, KATARINA JEVTIĆ-NOVAKOVIĆ, MARIJA MIĆOVIĆ – GEOMETRICAL FORMS IN WORKS OF ARCHITECT MARIO JOBST
236 THE 5TH ICGG CONFERENCE MONGEOMETRIJA 2016 BELGRADE: 23-26 JUNE 2016
intense blue glass. Blue glass surface is also used in the administrative building as a piece of slanted plane, which encloses the inner courtyard and also makes the connection with conical architecture of gas stations.
It is known that the construction of gas stations is almost always in collision with ecological principles. Reasons are several carcinogenic substances, which get emitted from a gas compounds, as well as the intensity of traffic, which is taking place in their vicinity, so that today the environmental regulations strive to reduce negative effects to a minimum. At the time gas station in Bor got projected, Serbian economy was exhausted by international sanctions, so ecological thinking was not the main priority, but Mario Jobst re-introduced significance of ecological thinking by the very shape of the station: the steel pile represents an old evergreen tree, a small pile represents a newly planted tree, while canopy symbolizes a leave of a deciduous tree.
Figures 16, 17: Gas station in Bor, big ULPUDS prize 1997, / Z. Manević- Arhitekta Mario Jobst
Another unrealized project is the gas station in Nis. It has the shape of a cylinder, designed in a recognizable manner with steel beams, painted in red. The dynamism of this form is achieved by rotating the square inscribed in a circle, so the square loses its symbol of a static, stationary design. Circle - square connection bears a lot of symbolic associations. It leads us to a pair of earth-sky, urban matrices, squaring the circle...
Figures 18, 19: Gas station – Niš, / Z. Manević- Arhitekta Mario Jobst
4. PLANIMETRY, AKSONOMETRY, RUSSIAN AVANTGARDE
In the last chapter, we will have a brief look at an important cultural event, which has happened at the beginning of 2016. in Belgrade - the exhibition of Russian avant-garde. The selected works make a review of the Russian avant-garde, which does not represent a unique direction, but a broad framework for artistic experiments during the first third of the 20th century. This radical movement was both praised and criticized, and was a reflection of the modernization of society and the belief in progress. Like painting and sculpture, architecture had radically changed the structure of its spatial thinking. Its revolutionary lied primarily in the erosion of artistic materials and highlighting the constructive principle, which fundamentally shaken the traditional architectural practice.
Through several projects we will show the connection between Mario Jobst and Russian constructivism. However, this might be only an opinion of the authors of this paper, under the strong impression of the exhibition. We think that it is visible that constructive heritage of Russia has helped Jobst to develop his distinguishing and expressive style, permanently purged from the established conventions of modern trends. For these comparisons, we decided for one of the projects, who worked for just the Russian market, and to the hotel in Kaluga for the eye clinic Fyodorov 1992. For this project Jobst has applied a variety of colors, materials and applied an interesting decomposition within the circular form. The author himself explains that he resorted to non-standard forms of articulation that nourished the patient gave the impression of wealth of colors and shapes.
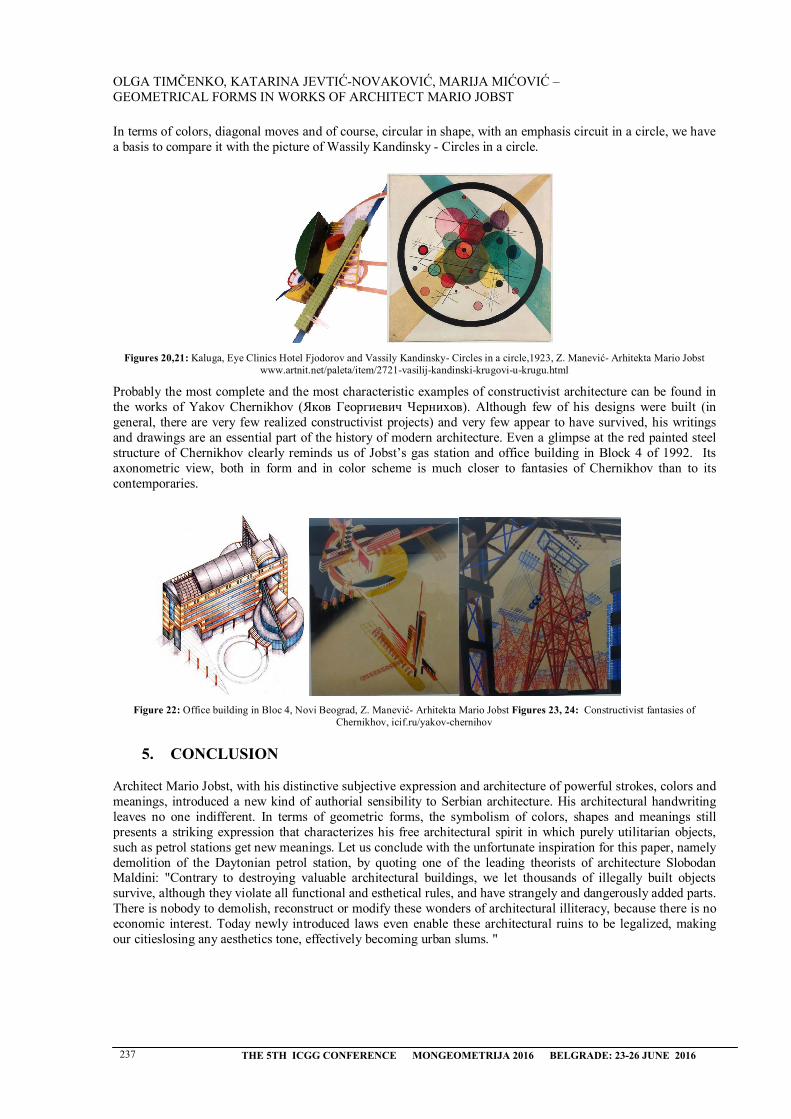
OLGA TIMČENKO, KATARINA JEVTIĆ-NOVAKOVIĆ, MARIJA MIĆOVIĆ – GEOMETRICAL FORMS IN WORKS OF ARCHITECT MARIO JOBST
237 THE 5TH ICGG CONFERENCE MONGEOMETRIJA 2016 BELGRADE: 23-26 JUNE 2016
In terms of colors, diagonal moves and of course, circular in shape, with an emphasis circuit in a circle, we have a basis to compare it with the picture of Wassily Kandinsky - Circles in a circle.
Figures 20,21: Kaluga, Eye Clinics Hotel Fjodorov and Vassily Kandinsky- Circles in a circle,1923, Z. Manević- Arhitekta Mario Jobst www.artnit.net/paleta/item/2721-vasilij-kandinski-krugovi-u-krugu.html
Probably the most complete and the most characteristic examples of constructivist architecture can be found in the works of Yakov Chernikhov (Яков Георгиевич Чернихов). Although few of his designs were built (in general, there are very few realized constructivist projects) and very few appear to have survived, his writings and drawings are an essential part of the history of modern architecture. Even a glimpse at the red painted steel structure of Chernikhov clearly reminds us of Jobst’s gas station and office building in Block 4 of 1992. Its axonometric view, both in form and in color scheme is much closer to fantasies of Chernikhov than to its contemporaries.
Figure 22: Office building in Bloc 4, Novi Beograd, Z. Manević- Arhitekta Mario Jobst Figures 23, 24: Constructivist fantasies of Chernikhov, icif.ru/yakov-chernihov
5. CONCLUSION
Architect Mario Jobst, with his distinctive subjective expression and architecture of powerful strokes, colors and meanings, introduced a new kind of authorial sensibility to Serbian architecture. His architectural handwriting leaves no one indifferent. In terms of geometric forms, the symbolism of colors, shapes and meanings still presents a striking expression that characterizes his free architectural spirit in which purely utilitarian objects, such as petrol stations get new meanings. Let us conclude with the unfortunate inspiration for this paper, namely demolition of the Daytonian petrol station, by quoting one of the leading theorists of architecture Slobodan Maldini: "Contrary to destroying valuable architectural buildings, we let thousands of illegally built objects survive, although they violate all functional and esthetical rules, and have strangely and dangerously added parts. There is nobody to demolish, reconstruct or modify these wonders of architectural illiteracy, because there is no economic interest. Today newly introduced laws even enable these architectural ruins to be legalized, making our citieslosing any aesthetics tone, effectively becoming urban slums. "

OLGA TIMČENKO, KATARINA JEVTIĆ-NOVAKOVIĆ, MARIJA MIĆOVIĆ – GEOMETRICAL FORMS IN WORKS OF ARCHITECT MARIO JOBST
238 THE 5TH ICGG CONFERENCE MONGEOMETRIJA 2016 BELGRADE: 23-26 JUNE 2016
6. LITERATURE
1. Maldini, Slobodan: Rušenje i arhitektura, Večernje novosti, 21.11. 2015. (in Serbian)
2. Bogunović, Slobodan - Arhitektonska enciklopedija Beograda XIX i XX veka(2.tom: Arhitekti), Beograd 2005. (in Serbian)
3. MANEVIĆ, ZORAN - ARHITEKTA MARIO JOBST, MULTIMEDIJALNA MONOGRAFIJA, 2006(IN SERBIAN)
4. Alfirović, Đorđe – Ekspresionizam u arhitekturi XX veka U Srbiji, Doktorska disertacija 2015 (inSerbian)
5. Janakova Grujić, Mare - Mario Jobst- Arhitektura kao skulptura, Ambijenti 3, Beograd, 2005 (inSerbian)
6. Mitrović, Mihajlo – Poslovna zgrada Jat-A, Politika, 27.02.1993. (in Serbian)
7. www.arne-jacobsen.com (visited in September 2015)
8. www.gradnja.rs/in-memoriam-velika-pecurka-i-dejtonka/ (visited in February 2016)
9. icif.ru/yakov-chernihov/biografiya/ (visited in September 2015)
10. www.beobuild.rs (visited in February 2016)
11. www.artnit.net/paleta/item/2721-vasilij-kandinski-krugovi-u-krugu.html (visited in September 2015)
12. www.nispetrol.rs (visited in September 2015)
13. http://www.gradnja.rs/wp-content/uploads/2016/02/pecurka-pumpa-rusenje-2_660x330.jpg (visited inFebruary 2016)
M. STOJICEVIC ET AL.: HISTORY OF WALKING MACHINIES
THE 5TH ICGG CONFERENCE MONGEOMETRIJA 2016 PROCEEDINGS Belgrade: 23-26 June 2016 239
HISTORY OF WALKING MACHINES
Misa Stojićević
Department of Machine Theory and Mechanisms, Faculty of Mechanical Engineering, University of Belgrade, Republic of Serbia
M.Sc., Lecturer Assistant, [email protected]
Miodrag Stoimenov
Department of Machine Theory and Mechanisms, Faculty of Mechanical Engineering, University of Belgrade, Republic of Serbia
PhD., Full Time Professor, [email protected]
Zorana Jeli
Department of Machine Theory and Mechanisms, Faculty of Mechanical Engineering, University of Belgrade, Republic of Serbia
Ph.D., Docent, [email protected]
Branislav Popkonstantinović
Department of Machine Theory and Mechanisms, Faculty of Mechanical Engineering, University of Belgrade, Republic of Serbia
PhD., Full Time Professor, [email protected]
ABSTRACT
This paper shows some of a walking machines throughout a centuries of innovative work of many great minds of engineering, starting as very simple machines who are mimicking animal walk up to modern robots who can achieve complex tasks such as human bipedal walk. It will be pointed out their advantages and disadvantages and it will be shown their future scope. Walking machines have high dynamic growth of interests from a toy industry up to orthopaedic devices. Many of this mechanism are interesting from point of mechanical engineering to show how a development of device surpasses its original ideas and how can be concluded that walking machines are origins of today humanoid robots. Legged mechanism either biped or four-legged have many milestones in development so it is very hard to select some and other to dismiss. However in this paper it will be presented only those related to mechanisms and it will be compared with each other.
Keywords: walking machines; history; robots; bipedal walk;
SUBJECT CODE: History of Geometry (Geometry in Historical Contexts)
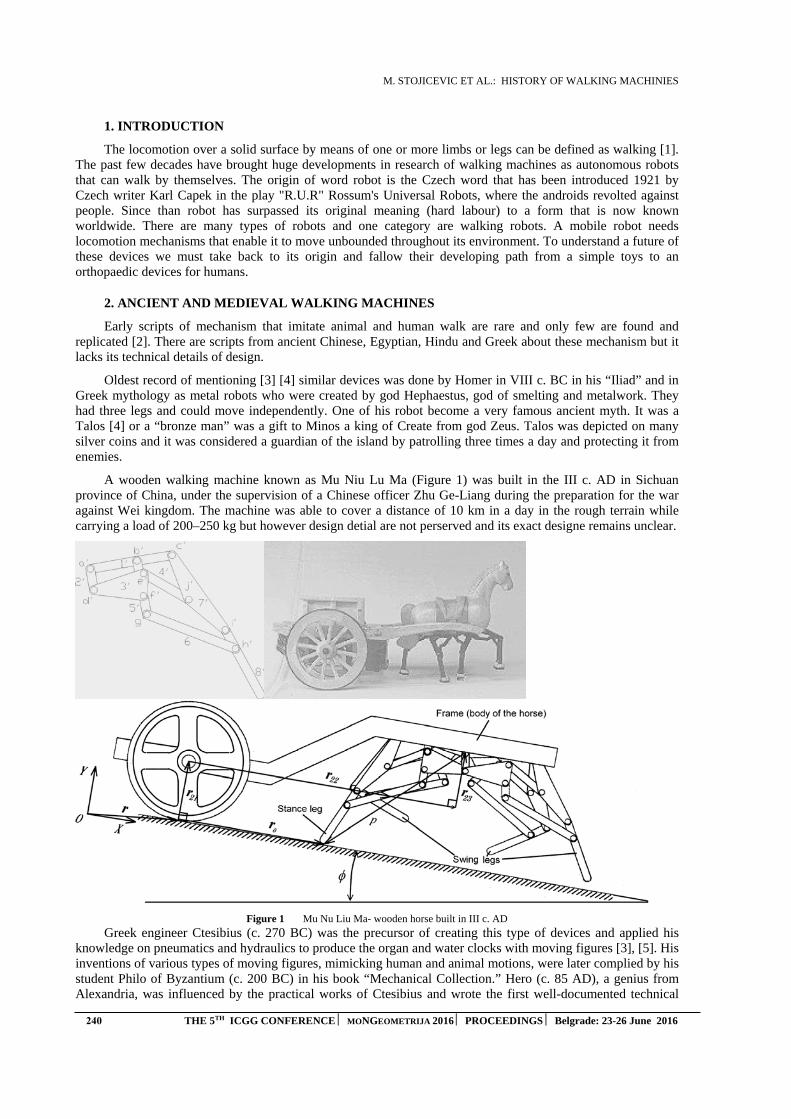
M. STOJICEVIC ET AL.: HISTORY OF WALKING MACHINIES
240 THE 5TH ICGG CONFERENCE MONGEOMETRIJA 2016 PROCEEDINGS Belgrade: 23-26 June 2016
1. INTRODUCTION
The locomotion over a solid surface by means of one or more limbs or legs can be defined as walking [1]. The past few decades have brought huge developments in research of walking machines as autonomous robots that can walk by themselves. The origin of word robot is the Czech word that has been introduced 1921 by Czech writer Karl Capek in the play "R.U.R" Rossum's Universal Robots, where the androids revolted against people. Since than robot has surpassed its original meaning (hard labour) to a form that is now known worldwide. There are many types of robots and one category are walking robots. A mobile robot needs locomotion mechanisms that enable it to move unbounded throughout its environment. To understand a future of these devices we must take back to its origin and fallow their developing path from a simple toys to an orthopaedic devices for humans.
2. ANCIENT AND MEDIEVAL WALKING MACHINES
Early scripts of mechanism that imitate animal and human walk are rare and only few are found and replicated [2]. There are scripts from ancient Chinese, Egyptian, Hindu and Greek about these mechanism but it lacks its technical details of design.
Oldest record of mentioning [3] [4] similar devices was done by Homer in VIII c. BC in his “Iliad” and in Greek mythology as metal robots who were created by god Hephaestus, god of smelting and metalwork. They had three legs and could move independently. One of his robot become a very famous ancient myth. It was a Talos [4] or a “bronze man” was a gift to Minos a king of Create from god Zeus. Talos was depicted on many silver coins and it was considered a guardian of the island by patrolling three times a day and protecting it from enemies.
A wooden walking machine known as Mu Niu Lu Ma (Figure 1) was built in the III c. AD in Sichuan province of China, under the supervision of a Chinese officer Zhu Ge-Liang during the preparation for the war against Wei kingdom. The machine was able to cover a distance of 10 km in a day in the rough terrain while carrying a load of 200–250 kg but however design detial are not perserved and its exact designe remains unclear.
Figure 1 Mu Nu Liu Ma- wooden horse built in III c. AD
Greek engineer Ctesibius (c. 270 BC) was the precursor of creating this type of devices and applied his knowledge on pneumatics and hydraulics to produce the organ and water clocks with moving figures [3], [5]. His inventions of various types of moving figures, mimicking human and animal motions, were later complied by his student Philo of Byzantium (c. 200 BC) in his book “Mechanical Collection.” Hero (c. 85 AD), a genius from Alexandria, was influenced by the practical works of Ctesibius and wrote the first well-documented technical

M. STOJICEVIC ET AL.: HISTORY OF WALKING MACHINIES
THE 5TH ICGG CONFERENCE MONGEOMETRIJA 2016 PROCEEDINGS Belgrade: 23-26 June 2016 241
account on realizable robots: “On Automatic Theatres,” “On Pneumatics,” and “On Mechanics” [5]. In this books it was shown a principals of many mechanisms that later will be used for mimicking movements of human and animals. After a fall of Western Roman Empire many of these knowledge was lost in Western Europe but it remains kept in East Roman Empire later called Byzantine Empire.
After a conquering a large parts of Byzantine Empire the Arabs preserved, disseminated, researched, and applied the knowledge base of the Greek on the design and development of robotic mechanism during the age of decline and stagnation in the western civilization. In the early IX century the Khalif of Baghdad (786–833) took an initiative to retrieve the Greek texts that had been preserved by monasteries and scholars during the decline and fall of western civilization. He deputed three brothers from Persia, also known as Banu Musa (Ahmad, Muhammad and Hasan bin Musa ibn Shakir), for this great mission. They compiled a great book Kitab al-Hiyal [6] (The Book of Ingenious Devices) describing over hundred devices based on the works they collected while incorporating some additions of their own. They invented various fountains and also the first mechanical music instrument; a water driven organ to reproduce music sets mechanically [7].
The Renaissance revived the interest in the ancient Greek art and science and at the same time also promoted the aspiration to verify, reconstruct, and improve upon the ancient achievements. With advancement in art and science also came advancement in robotics and walking mechanism. One name stands out as probably greatest scientist and artist of all time.
Leonardo Da Vinci (1452-1519) renowned primarily as a painter but is also revered as a brilliant engineer and innovator. His lifetime work is collected in script called “Codex Atlanticus” were is set of all of his drawings and writings about work in many science fields from botany to weaponry and from mathematic and music. Among these over 1000 innovations among which is highly detailed inner mechanism for a fully automated robot who looks like a knight [8]. This android was based on advanced knowledge in biomechanics and it was imagined to replicate human movements which knight could have replicated with a complex system of gears and mechanisms by pulling a rope.
Also Leonardo was commissioned to make for a king Francis I of France a mechanical lion [9], [10] which could walk forward, then open its chest to reveal a cluster of lilies. It was a fully automated and self-propelled programmable robot. Lion could walk without any wires 2/3 of its blueprints are lost. It gets its motor power from a coil and using gears ratios operator can set a timing of all an individual action during a motion. Drawings or idea for this machine may came from Arab and possible from Chinese. It’s very complex machine which proves that people since ancient times up to medieval times have a certain understanding of mechanisms which was a capital for future development.
3. XIX CENTURY DEVELOPMENT AND MODERN DAYS WALKERS
Pafnuty Lvovich Chebyshev (1821-1894) was a Russian mathematician who become known in world for his work in the fields of probability, statistics, mechanics, and number theory. P. L. Chebyshev has a first documented walking machine [11] that was built around 1850 (Figure 2). A locomotion system presented by P. L. Chebyshev uses a kinematic linkage to move the body along a straight horizontal path while the feet moved up and down to exchange support during stepping. It consist of four identical lambda shaped parallel linkages which creates the motion of the legs of animal.
Figure 2 Mechanism of Chebyshev
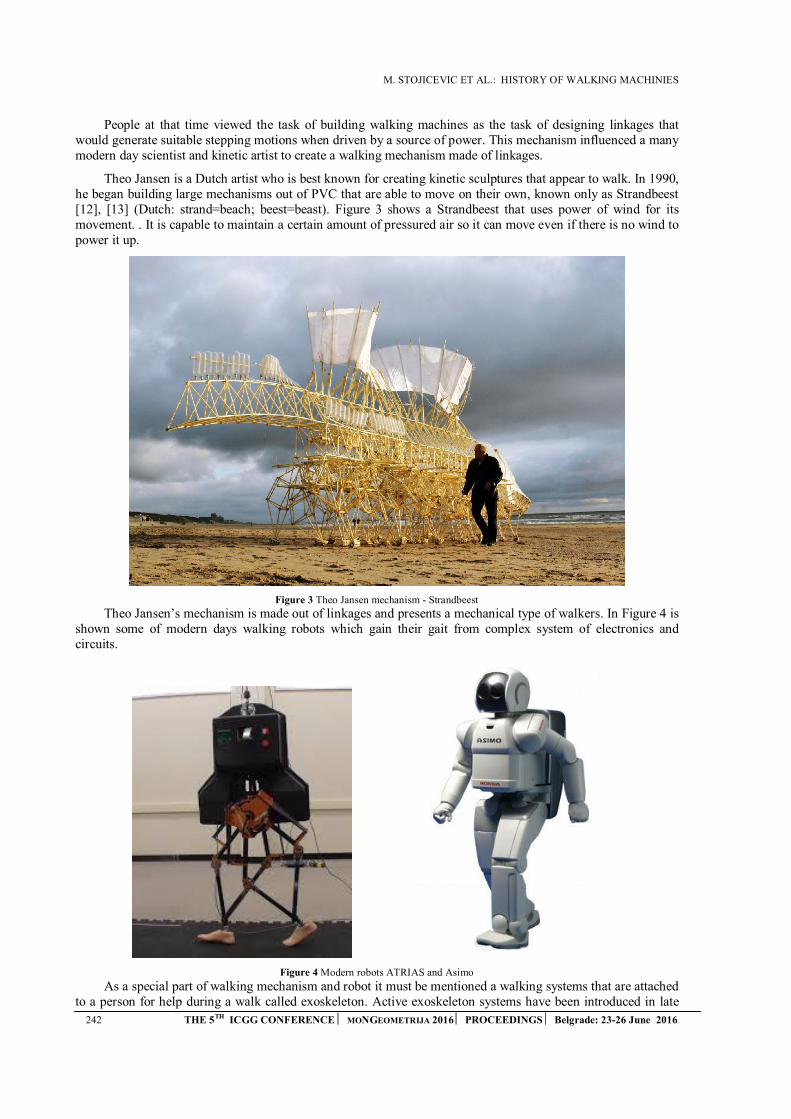
M. STOJICEVIC ET AL.: HISTORY OF WALKING MACHINIES
242 THE 5TH ICGG CONFERENCE MONGEOMETRIJA 2016 PROCEEDINGS Belgrade: 23-26 June 2016
People at that time viewed the task of building walking machines as the task of designing linkages that would generate suitable stepping motions when driven by a source of power. This mechanism influenced a many modern day scientist and kinetic artist to create a walking mechanism made of linkages.
Theo Jansen is a Dutch artist who is best known for creating kinetic sculptures that appear to walk. In 1990, he began building large mechanisms out of PVC that are able to move on their own, known only as Strandbeest [12], [13] (Dutch: strand=beach; beest=beast). Figure 3 shows a Strandbeest that uses power of wind for its movement. . It is capable to maintain a certain amount of pressured air so it can move even if there is no wind to power it up.
Figure 3 Theo Jansen mechanism - Strandbeest
Theo Jansen’s mechanism is made out of linkages and presents a mechanical type of walkers. In Figure 4 is shown some of modern days walking robots which gain their gait from complex system of electronics and circuits.
Figure 4 Modern robots ATRIAS and Asimo
As a special part of walking mechanism and robot it must be mentioned a walking systems that are attached to a person for help during a walk called exoskeleton. Active exoskeleton systems have been introduced in late
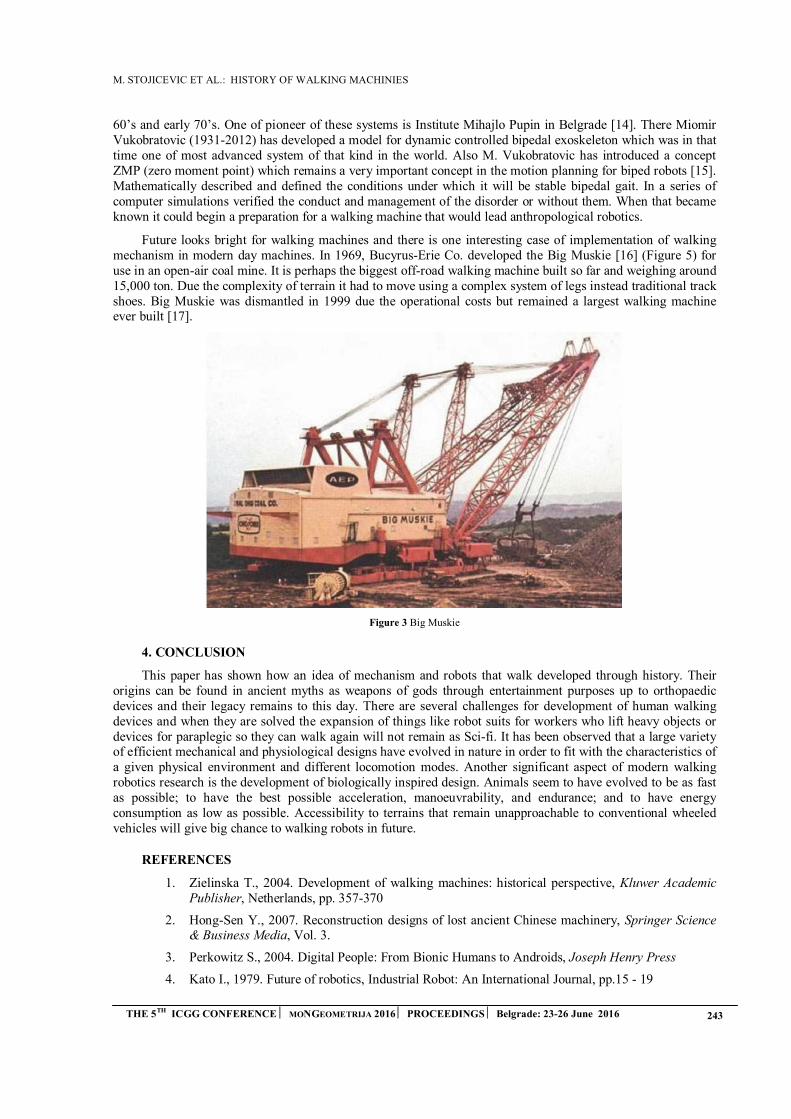
M. STOJICEVIC ET AL.: HISTORY OF WALKING MACHINIES
THE 5TH ICGG CONFERENCE MONGEOMETRIJA 2016 PROCEEDINGS Belgrade: 23-26 June 2016 243
60’s and early 70’s. One of pioneer of these systems is Institute Mihajlo Pupin in Belgrade [14]. There Miomir Vukobratovic (1931-2012) has developed a model for dynamic controlled bipedal exoskeleton which was in that time one of most advanced system of that kind in the world. Also M. Vukobratovic has introduced a concept ZMP (zero moment point) which remains a very important concept in the motion planning for biped robots [15]. Mathematically described and defined the conditions under which it will be stable bipedal gait. In a series of computer simulations verified the conduct and management of the disorder or without them. When that became known it could begin a preparation for a walking machine that would lead anthropological robotics.
Future looks bright for walking machines and there is one interesting case of implementation of walking mechanism in modern day machines. In 1969, Bucyrus-Erie Co. developed the Big Muskie [16] (Figure 5) for use in an open-air coal mine. It is perhaps the biggest off-road walking machine built so far and weighing around 15,000 ton. Due the complexity of terrain it had to move using a complex system of legs instead traditional track shoes. Big Muskie was dismantled in 1999 due the operational costs but remained a largest walking machine ever built [17].
Figure 3 Big Muskie
4. CONCLUSION
This paper has shown how an idea of mechanism and robots that walk developed through history. Their origins can be found in ancient myths as weapons of gods through entertainment purposes up to orthopaedic devices and their legacy remains to this day. There are several challenges for development of human walking devices and when they are solved the expansion of things like robot suits for workers who lift heavy objects or devices for paraplegic so they can walk again will not remain as Sci-fi. It has been observed that a large variety of efficient mechanical and physiological designs have evolved in nature in order to fit with the characteristics of a given physical environment and different locomotion modes. Another significant aspect of modern walking robotics research is the development of biologically inspired design. Animals seem to have evolved to be as fast as possible; to have the best possible acceleration, manoeuvrability, and endurance; and to have energy consumption as low as possible. Accessibility to terrains that remain unapproachable to conventional wheeled vehicles will give big chance to walking robots in future.
REFERENCES
1. Zielinska T., 2004. Development of walking machines: historical perspective, Kluwer AcademicPublisher, Netherlands, pp. 357-370
2. Hong-Sen Y., 2007. Reconstruction designs of lost ancient Chinese machinery, Springer Science& Business Media, Vol. 3.
3. Perkowitz S., 2004. Digital People: From Bionic Humans to Androids, Joseph Henry Press
4. Kato I., 1979. Future of robotics, Industrial Robot: An International Journal, pp.15 - 19
M. STOJICEVIC ET AL.: HISTORY OF WALKING MACHINIES
244 THE 5TH ICGG CONFERENCE MONGEOMETRIJA 2016 PROCEEDINGS Belgrade: 23-26 June 2016
5. Silva M. F., Machado J., 2007., A historical perspective of legged robots, Journal of Vibration andControl, 13(9-10), pp. 1447–1486.
6. Rosheim M. E., 1994., Robot evolution: the development of anthrobotics, John Wiley & Sons, Vol.I. New York USA
7. Struijk, B., 2011. Robots in human societies and industry. Technology, 10(1), 183-195.
8. Tesar D., 1997. Where is the field of robotics going? Technical report of the robotics researchgroup, The University of Texas at Austin
9. Sharkey N., 2007. I ropebot, New Scientist, 195(2611), pp. 32-35
10. Rosheim M. E., 2006., Leonardo’s Lost Robots, Springer Science & Business Media
11. Carbone G, Ceccarelli M., 2005. Legged robotic systems INTECH Open Access Publisher, Cuttingedge robotics
12. Giesbrecht D., Wu C. Q., 2010. Dynamics of Legged Walking Mechanism “Wind Beast”.Department of Mechanical and Manufacturing Engineering, University of Manitoba, California,USA
13. Patnaik S., 2015. Analysis Of Theo Jansen Mechanism (Strandbeest) And Its ComparativeAdvantages Over Wheel Based Mine Escavation System, Analysis, 5(7)
14. Vukobratović M., Branislav B., 2004. Zero-moment point—thirty five years of its lifeInternational Journal of Humanoid Robotics, 1(01), pp. 157-173
15. Vukobratović M., J. Stepanenko, 1972. On the stability of anthropomorphic systems Mathematicalbiosciences, 15(1), pp. 1-37
16. McGhee R. B., 1976. Robot locomotion, Neural control of locomotion, pp.237-264.
17. de Santos, P. G., Garcia E., Estremera J., 2007. Quadrupedal locomotion: an introduction to thecontrol of four-legged robots, Springer Science & Business Media
P. ŠIĐANIN ET AL.: IMMERSIVE VIRTUAL REALITY COURSE AT THE DIGITAL PRODUCTION STUDIES
THE 5TH ICGG CONFERENCE MONGEOMETRIJA 2016 PROCEEDINGS Belgrade: 23-26 June 2016 245
IMMERSIVE VIRTUAL REALITY COURSE AT THE DIGITAL
PRODUCTION STUDIES
Predrag Šiđanin
Faculty of technical sciences, University of Novi Sad, Novi Sad, Serbia
PhD., Full Professor, [email protected]
Marko Lazić
Faculty of technical sciences, University of Novi Sad, Novi Sad, Serbia
MArch., Teaching Assistant, [email protected]
Ratko Obradović
Faculty of technical sciences, University of Novi Sad, Novi Sad, Serbia
PhD., Full Professor, [email protected]
ABSTRACT
Immersive Virtual Reality course is one of two courses for applied 3D visualisation offered at
the Digital production study program at the Educons University in Sremska Kamenica, Serbia, in
addition to Basics of Virtual Reality. The purpose of this course, that is lectured in sixth semester, is
to provide students with both a deep understanding of the fundamentals of Virtual Reality and to
gain practical experience. The students in this course were taught the latest technology of Virtual
reality using the virtual reality headset - Oculus Rift. This paper presents the structure of the
Immersive Virtual Reality course, which provides the students of technical orientation with a
connection to the state of the art visualisation aspect of digital production. Aim of this course is the
final project, for each individual student, that involves the implementation of a VR system that
students are able to use. In this paper the results of this course are displayed and analysed.
Keywords: virtual reality, digital production studies, visualisation, 3D visualisation,
oculus rift
1. INTRODUCTION
Virtual reality (VR) technology can be described as a technology that adds the dimensions of immersion
and interactivity to 3D computer generated models and offers an exploration that is not posible with the
traditional form of representation (Burdea and Coiffet, 2003).Virtual reality is also an interactive and immersive
(with the feeling of presence) experience in a simulated (autonomous) world (Mazuryk et al., 1996). The
technology was developed in the 1960s and 1970s, but in scientific research 1990s were decade were the most
number of papers concerning this topic was published. Interest in VR decreased because the cost of the
necessary equipment was so high, and graphic capabilities of computers could were not on necessary level to
present realistic virtual world. Attempts at bringing VR hardware to the customers market have far fallen short of
commercial success. However, virtual reality is in last few years a stimulating technology in areas such as
visualisation, software engineering, animation and game development. In recent years industry leaders such as
Facebook, with their VR hardware - Oculus Rift, Google’s project Glass for augmented and virtual reality, Sony,
Valve and Microsoft all have once again began to capture the public’s imagination. Now, with required level of
P. ŠIĐANIN ET AL.: IMMERSIVE VIRTUAL REALITY COURSE AT THE DIGITAL PRODUCTION STUDIES
246 THE 5TH ICGG CONFERENCE MONGEOMETRIJA 2016 PROCEEDINGS Belgrade: 23-26 June 2016
hardware power and software services available to include in consumer devices for near photorealistic
experience, it is time for VR to make a splash in the world of computing.
Virtual reality in education is still in early stage of adoption, and there is potential that has not been realised yet
(Stouffs, et. al., 2013; Kalisperis et al. 2002). In this context, now is the time for virtual reality to have much
bigger role in education programmes orientated around areas such as design and product creation, architecture,
television and film production, the computer games industry, interior design, animation, urban planning,
exhibition design and web design. This trend has been adopted by many high rank technical universities such as
ETH in Zurich (ETH, 2016), Ecole Polytechnique Fédérale de Lausanne (EPFL, 2016) and Stanford University
(STANFORD, 2016). In this paper one such course of Virtual Reality is presented. It is one of two courses for
applied 3D visualisation offered at the Digital production study program at the Educons University in Sremska
Kamenica, Serbia.
2. COURSE STRUCTURE
Immersive virtual reality is obligatory course, attended in 6th semester of the undergraduate academic
studies, that is perfomed with two hours lectures, and two hours exercises every week at the Digital production
study program at the Educons University in Sremska Kamenica, Serbia. Aim of this course is introducing
students with theoretical principles of VR technology as well as practical use of it.
Lectures are organized in a way that gives students insight in theoretical framework and historical context of
virtual reality key points in time with an emphasis on up-to-date development of technology. Exercises are
organized towards practical use of VR. Hardware that is available to students is Oculus Rift DK2 headset and
computer with hardware and software capable for rendering VR experience. Lectures and exercises are
correlated, but they are adapted for optimized results considering the time given to students. Lectures are
orientated toward implementation of VR technology that is universal and not specifically defined by present
capabilities of contemporary hardware and software, and exercises are structured around current usage of
software and hardware for optimal price of equipment, time for learning, and performance.
Lectures are divided into several subsets: advanced 3D computer graphics; development of VR technology
before and after 1990s; development of new VR techniques; physical based simulation; human factors and
human interaction; rendering; equipment for virtual reality; display technologies; tracking systems; controllers
and gloves in VR; navigation and interaction in virtual environment; collision detection; VR applications in
industry; technical possibilities for practical use in personal work; relation between VR and augmented reality.
The literature about VR, available on Serbian language is theoretically oriented, it doesn't include new
development of this technology, and it doesn't include practical knowledge applicable for students. For that
reason all the information from the lectures including the guidelines for the practical software application is
available in Serbian language for the students in PowerPoint presentation and updated annually. Additionally
students are encouraged to use English literature and as optional.
Exercises are structured for optimal practical application of VR, but also in relation to other courses in Digital
production study programme. Students are introduced into different set of computer skills before attending
Immersive Virtual Reality course. They are attending different courses that are orientated towards basic 3D
modelling, image and film processing, sound editing, basic key frame 2D animation and programming among
other skills. Course analysed in this paper is relaying on basic understanding of principles learn in those courses.
Software that students are introduced in this analysed course are Trimble SketchUp (SKETCHUP, 2016),
Autodesk 3DS Max (3DS MAX, 2016) and Unity 3D (UNITY, 2016). All of these software are frequently used
in industry and are free of charge in education packages.
SketchUp is program for 3D modelling that is easy to use and have biggest collection of free 3D models on one
place on the internet. 3DS Max is chosen because it is one of the most used software for 3D geometry creation,
modification, visualisation and animation in industry. Unity 3D is software that is free of charge for personal use
and it is often used for visualisation purposes such is VR. Framework of course is shown in table 1. This
approach of course for virtual reality in education is not new (Shiratuddin and Zulkifli, 2001), but it is one of
rare courses that has been developed in this way in region. Students are also given set of video tutorials,
purposely made for them in order to have practical reminder of tools that are been introduced in exercises.

P. ŠIĐANIN ET AL.: IMMERSIVE VIRTUAL REALITY COURSE AT THE DIGITAL PRODUCTION STUDIES
THE 5TH ICGG CONFERENCE MONGEOMETRIJA 2016 PROCEEDINGS Belgrade: 23-26 June 2016 247
Table 1: Exercises dynamics and structure
Week Programme Software Overview
1st Introduction to SketchUp
software
SketchUp Interface. Basic commands and tools. Comparative analysis with
another software that is familiar to students.
2nd Basic modelling techniques SketchUp Drawing 2D shapes, and forming 3D objects from them. Precision drawing techniques.
3rd Advanced modelling
techniques
SketchUp Advanced tools for geometry creation (components, morph
options, Boolean operations).
4th Advanced options SketchUp Scenes management, visualisation, texture tools.
5th Working with 3D components SketchUp Recapitulation and work with 3D components that are freely
available. Setting a scene.
6th Introduction to 3DS Max 3DS Max Geometry creation and modification
7th Texturing, animation, export
of geometry
3DS Max Texturing techniques, basic 3D animation, preparation of 3D
model for export into Unity 3D software.
8th Introduction in Unity 3D software
Unity 3D Interface. Basic tools. Import of objects from SketchUp and 3ds Max
9th Basic geometry and
orientation
Unity 3D Geometry manipulation and first person camera and controller
setting
10th Texturing and animation Unity 3D Advanced techniques for texturing and animation
11th Audio effects Unity 3D Implementation of music and sound effects.
12th Basic principles of MonoDevelop
Unity 3D Introduction into basic Java programming with MonoDevelop
13th Optimization of model SketchUp, 3DS
Max,Unity 3D
Adaption and optimization of 3D model for best VR performance
14th and 15th
Consultations SketchUp, 3DS Max,Unity 3D
Recapitulation and working on individual 3D models and environments.
Students are not obligated to work only in 3 software that are described here, but other software can only be used
if someone have enough practical knowledge to use it. Fully understanding of all features of these 3 software is
not aim of this course, and only specific tools that can be universally used to create virtual environments are
focus of Immersive virtual reality. Goal of exercises is to each student is individually capable of developing a
executable programme for VR visualisation of 3D environment. This can be measured by their final project.
More on subject of the project and results is written in next chapter.
3. RESULTS
Students are graded based on their final exam and their skills and success of the course can be valorised through
it. Final project is individually done by all students and it is work that presents final product that can be
experienced through Virtual reality headset Oculus Rift. Executable file that is developed with Unity 3D using
3D modelling program is final product. On the exam program is checked and graded. Only 4 students have been
attended this course, because only one generation of students have finished 6. semester at the time this paper is
written.
All students have passed the exam first time they attended it. In last weeks of semester students have bring theirs
unfinished work for final consultations and corrections. Figure 1 presents student work from those weeks.
Geometry is based on environment theme that they have chosen. Environments (a) and (b) have medieval theme,
and (c) and (d) have modern theme of urban block and racing track. Students were encouraged to develop and
adapt other effects in order to the theme that they have chosen.
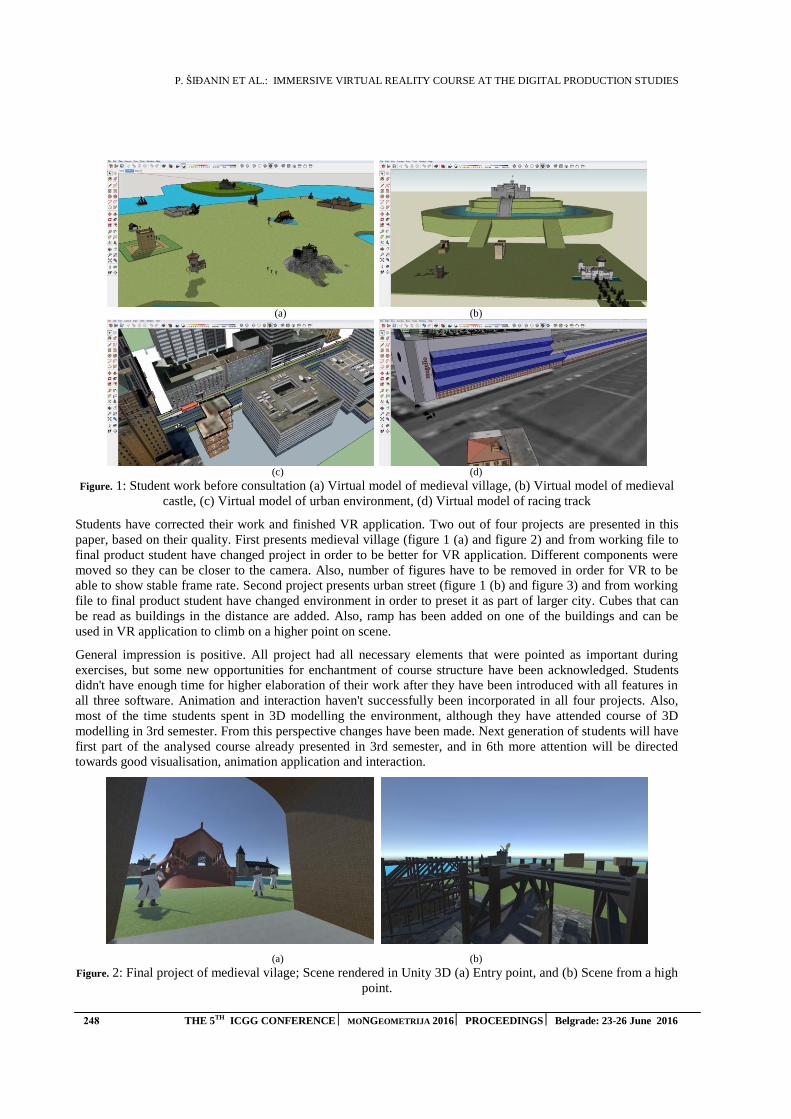
P. ŠIĐANIN ET AL.: IMMERSIVE VIRTUAL REALITY COURSE AT THE DIGITAL PRODUCTION STUDIES
248 THE 5TH ICGG CONFERENCE MONGEOMETRIJA 2016 PROCEEDINGS Belgrade: 23-26 June 2016
(a) (b)
(c) (d)
Figure. 1: Student work before consultation (a) Virtual model of medieval village, (b) Virtual model of medieval
castle, (c) Virtual model of urban environment, (d) Virtual model of racing track
Students have corrected their work and finished VR application. Two out of four projects are presented in this
paper, based on their quality. First presents medieval village (figure 1 (a) and figure 2) and from working file to
final product student have changed project in order to be better for VR application. Different components were
moved so they can be closer to the camera. Also, number of figures have to be removed in order for VR to be
able to show stable frame rate. Second project presents urban street (figure 1 (b) and figure 3) and from working
file to final product student have changed environment in order to preset it as part of larger city. Cubes that can
be read as buildings in the distance are added. Also, ramp has been added on one of the buildings and can be
used in VR application to climb on a higher point on scene.
General impression is positive. All project had all necessary elements that were pointed as important during
exercises, but some new opportunities for enchantment of course structure have been acknowledged. Students
didn't have enough time for higher elaboration of their work after they have been introduced with all features in
all three software. Animation and interaction haven't successfully been incorporated in all four projects. Also,
most of the time students spent in 3D modelling the environment, although they have attended course of 3D
modelling in 3rd semester. From this perspective changes have been made. Next generation of students will have
first part of the analysed course already presented in 3rd semester, and in 6th more attention will be directed
towards good visualisation, animation application and interaction.
(a) (b)
Figure. 2: Final project of medieval vilage; Scene rendered in Unity 3D (a) Entry point, and (b) Scene from a high
point.
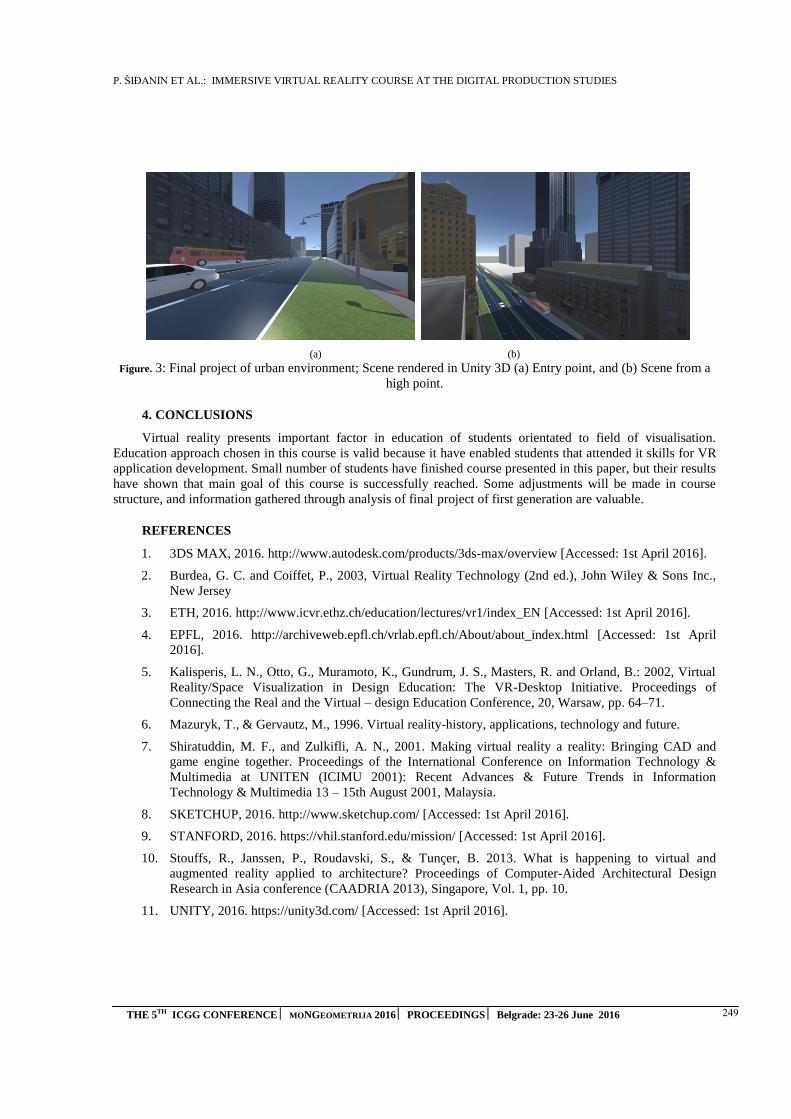
P. ŠIĐANIN ET AL.: IMMERSIVE VIRTUAL REALITY COURSE AT THE DIGITAL PRODUCTION STUDIES
THE 5TH ICGG CONFERENCE MONGEOMETRIJA 2016 PROCEEDINGS Belgrade: 23-26 June 2016 249
(a) (b)
Figure. 3: Final project of urban environment; Scene rendered in Unity 3D (a) Entry point, and (b) Scene from a
high point.
4. CONCLUSIONS
Virtual reality presents important factor in education of students orientated to field of visualisation.
Education approach chosen in this course is valid because it have enabled students that attended it skills for VR
application development. Small number of students have finished course presented in this paper, but their results
have shown that main goal of this course is successfully reached. Some adjustments will be made in course
structure, and information gathered through analysis of final project of first generation are valuable.
REFERENCES
1. 3DS MAX, 2016. http://www.autodesk.com/products/3ds-max/overview [Accessed: 1st April 2016].
2. Burdea, G. C. and Coiffet, P., 2003, Virtual Reality Technology (2nd ed.), John Wiley & Sons Inc.,
New Jersey
3. ETH, 2016. http://www.icvr.ethz.ch/education/lectures/vr1/index_EN [Accessed: 1st April 2016].
4. EPFL, 2016. http://archiveweb.epfl.ch/vrlab.epfl.ch/About/about_index.html [Accessed: 1st April
2016].
5. Kalisperis, L. N., Otto, G., Muramoto, K., Gundrum, J. S., Masters, R. and Orland, B.: 2002, Virtual
Reality/Space Visualization in Design Education: The VR-Desktop Initiative. Proceedings of
Connecting the Real and the Virtual – design Education Conference, 20, Warsaw, pp. 64–71.
6. Mazuryk, T., & Gervautz, M., 1996. Virtual reality-history, applications, technology and future.
7. Shiratuddin, M. F., and Zulkifli, A. N., 2001. Making virtual reality a reality: Bringing CAD and
game engine together. Proceedings of the International Conference on Information Technology &
Multimedia at UNITEN (ICIMU 2001): Recent Advances & Future Trends in Information
Technology & Multimedia 13 – 15th August 2001, Malaysia.
8. SKETCHUP, 2016. http://www.sketchup.com/ [Accessed: 1st April 2016].
9. STANFORD, 2016. https://vhil.stanford.edu/mission/ [Accessed: 1st April 2016].
10. Stouffs, R., Janssen, P., Roudavski, S., & Tunçer, B. 2013. What is happening to virtual and
augmented reality applied to architecture? Proceedings of Computer-Aided Architectural Design
Research in Asia conference (CAADRIA 2013), Singapore, Vol. 1, pp. 10.
11. UNITY, 2016. https://unity3d.com/ [Accessed: 1st April 2016].
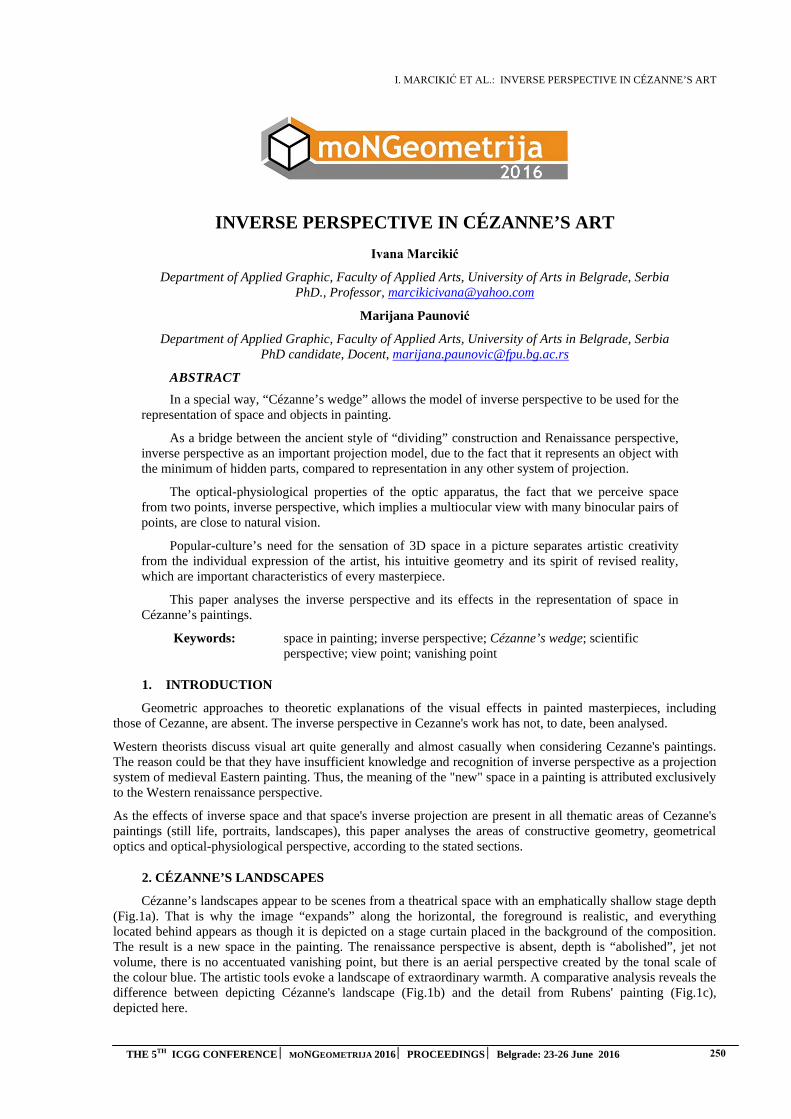
I. MARCIKIĆ ET AL.: INVERSE PERSPECTIVE IN CÉZANNE’S ART
THE 5TH ICGG CONFERENCE MONGEOMETRIJA 2016 PROCEEDINGS Belgrade: 23-26 June 2016 250
INVERSE PERSPECTIVE IN CÉZANNE’S ART
Ivana Marcikić
Department of Applied Graphic, Faculty of Applied Arts, University of Arts in Belgrade, Serbia PhD., Professor, [email protected]
Marijana Paunović
Department of Applied Graphic, Faculty of Applied Arts, University of Arts in Belgrade, Serbia PhD candidate, Docent, [email protected]
ABSTRACT In a special way, “Cézanne’s wedge” allows the model of inverse perspective to be used for the
representation of space and objects in painting.
As a bridge between the ancient style of “dividing” construction and Renaissance perspective, inverse perspective as an important projection model, due to the fact that it represents an object with the minimum of hidden parts, compared to representation in any other system of projection.
The optical-physiological properties of the optic apparatus, the fact that we perceive space from two points, inverse perspective, which implies a multiocular view with many binocular pairs of points, are close to natural vision.
Popular-culture’s need for the sensation of 3D space in a picture separates artistic creativity from the individual expression of the artist, his intuitive geometry and its spirit of revised reality, which are important characteristics of every masterpiece.
This paper analyses the inverse perspective and its effects in the representation of space in Cézanne’s paintings.
Keywords: space in painting; inverse perspective; Cézanne’s wedge; scientific perspective; view point; vanishing point
1. INTRODUCTION
Geometric approaches to theoretic explanations of the visual effects in painted masterpieces, including those of Cezanne, are absent. The inverse perspective in Cezanne's work has not, to date, been analysed.
Western theorists discuss visual art quite generally and almost casually when considering Cezanne's paintings. The reason could be that they have insufficient knowledge and recognition of inverse perspective as a projection system of medieval Eastern painting. Thus, the meaning of the "new" space in a painting is attributed exclusively to the Western renaissance perspective.
As the effects of inverse space and that space's inverse projection are present in all thematic areas of Cezanne's paintings (still life, portraits, landscapes), this paper analyses the areas of constructive geometry, geometrical optics and optical-physiological perspective, according to the stated sections.
2. CÉZANNE’S LANDSCAPES
Cézanne’s landscapes appear to be scenes from a theatrical space with an emphatically shallow stage depth (Fig.1a). That is why the image “expands” along the horizontal, the foreground is realistic, and everything located behind appears as though it is depicted on a stage curtain placed in the background of the composition. The result is a new space in the painting. The renaissance perspective is absent, depth is “abolished”, jet not volume, there is no accentuated vanishing point, but there is an aerial perspective created by the tonal scale of the colour blue. The artistic tools evoke a landscape of extraordinary warmth. A comparative analysis reveals the difference between depicting Cézanne's landscape (Fig.1b) and the detail from Rubens' painting (Fig.1c), depicted here.
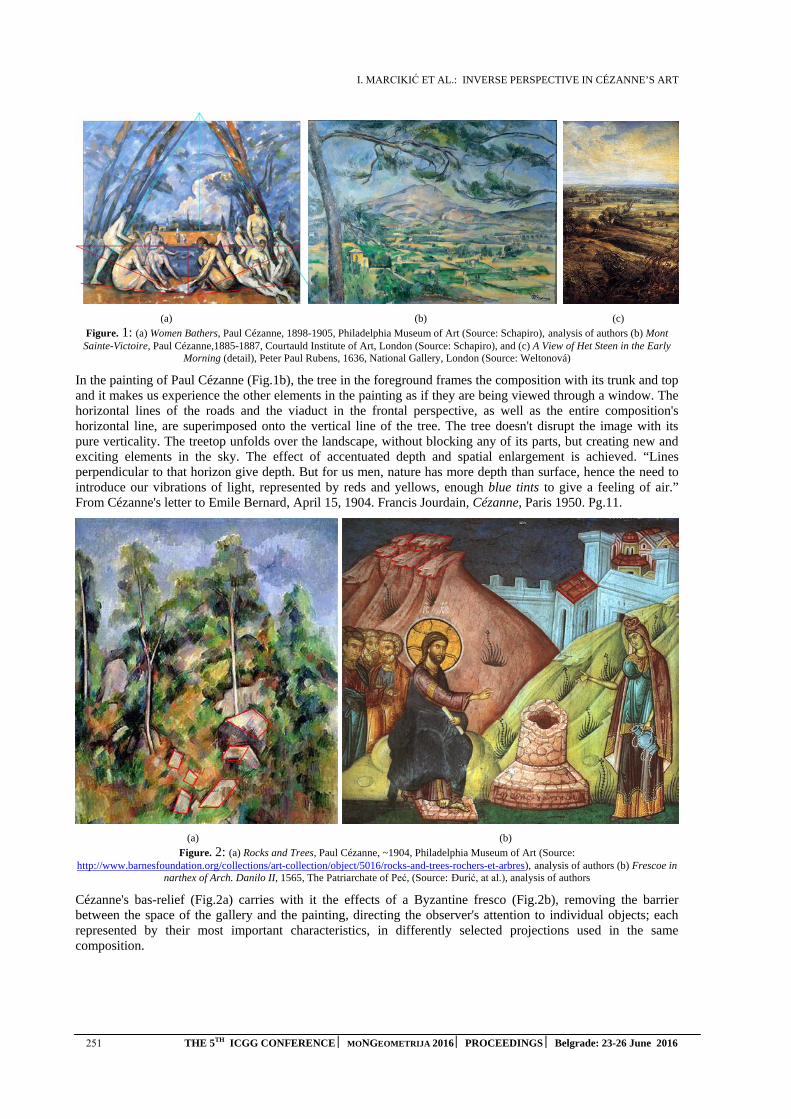
I. MARCIKIĆ ET AL.: INVERSE PERSPECTIVE IN CÉZANNE’S ART
251 THE 5TH ICGG CONFERENCE MONGEOMETRIJA 2016 PROCEEDINGS Belgrade: 23-26 June 2016
(a) (b) (c)
Figure. 1: (a) Women Bathers, Paul Cézanne, 1898-1905, Philadelphia Museum of Art (Source: Schapiro), analysis of authors (b) Mont Sainte-Victoire, Paul Cézanne,1885-1887, Courtauld Institute of Art, London (Source: Schapiro), and (c) A View of Het Steen in the Early
Morning (detail), Peter Paul Rubens, 1636, National Gallery, London (Source: Weltonová)
In the painting of Paul Cézanne (Fig.1b), the tree in the foreground frames the composition with its trunk and top and it makes us experience the other elements in the painting as if they are being viewed through a window. The horizontal lines of the roads and the viaduct in the frontal perspective, as well as the entire composition's horizontal line, are superimposed onto the vertical line of the tree. The tree doesn't disrupt the image with its pure verticality. The treetop unfolds over the landscape, without blocking any of its parts, but creating new and exciting elements in the sky. The effect of accentuated depth and spatial enlargement is achieved. “Lines perpendicular to that horizon give depth. But for us men, nature has more depth than surface, hence the need to introduce our vibrations of light, represented by reds and yellows, enough blue tints to give a feeling of air.” From Cézanne's letter to Emile Bernard, April 15, 1904. Francis Jourdain, Cézanne, Paris 1950. Pg.11.
(a) (b)
Figure. 2: (a) Rocks and Trees, Paul Cézanne, ~1904, Philadelphia Museum of Art (Source: http://www.barnesfoundation.org/collections/art-collection/object/5016/rocks-and-trees-rochers-et-arbres), analysis of authors (b) Frescoe in
narthex of Arch. Danilo II, 1565, The Patriarchate of Peć, (Source: Đurić, at al.), analysis of authors
Cézanne's bas-relief (Fig.2a) carries with it the effects of a Byzantine fresco (Fig.2b), removing the barrier between the space of the gallery and the painting, directing the observer's attention to individual objects; each represented by their most important characteristics, in differently selected projections used in the same composition.
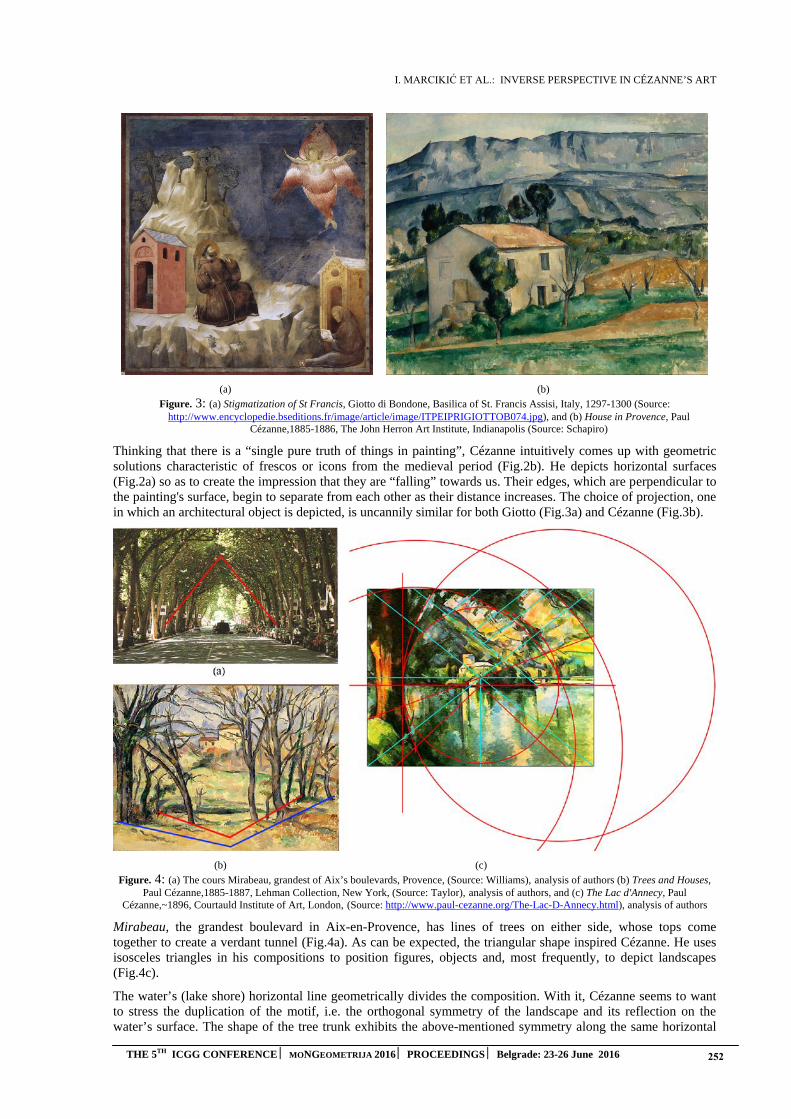
I. MARCIKIĆ ET AL.: INVERSE PERSPECTIVE IN CÉZANNE’S ART
THE 5TH ICGG CONFERENCE MONGEOMETRIJA 2016 PROCEEDINGS Belgrade: 23-26 June 2016 252
(a) (b)
Figure. 3: (a) Stigmatization of St Francis, Giotto di Bondone, Basilica of St. Francis Assisi, Italy, 1297-1300 (Source: http://www.encyclopedie.bseditions.fr/image/article/image/ITPEIPRIGIOTTOB074.jpg), and (b) House in Provence, Paul
Cézanne,1885-1886, The John Herron Art Institute, Indianapolis (Source: Schapiro)
Thinking that there is a “single pure truth of things in painting”, Cézanne intuitively comes up with geometric solutions characteristic of frescos or icons from the medieval period (Fig.2b). He depicts horizontal surfaces (Fig.2a) so as to create the impression that they are “falling” towards us. Their edges, which are perpendicular to the painting's surface, begin to separate from each other as their distance increases. The choice of projection, one in which an architectural object is depicted, is uncannily similar for both Giotto (Fig.3a) and Cézanne (Fig.3b).
(b) (c)
Figure. 4: (a) The cours Mirabeau, grandest of Aix’s boulevards, Provence, (Source: Williams), analysis of authors (b) Trees and Houses, Paul Cézanne,1885-1887, Lehman Collection, New York, (Source: Taylor), analysis of authors, and (c) The Lac d'Annecy, Paul
Cézanne,~1896, Courtauld Institute of Art, London, (Source: http://www.paul-cezanne.org/The-Lac-D-Annecy.html), analysis of authors
Mirabeau, the grandest boulevard in Aix-en-Provence, has lines of trees on either side, whose tops come together to create a verdant tunnel (Fig.4a). As can be expected, the triangular shape inspired Cézanne. He uses isosceles triangles in his compositions to position figures, objects and, most frequently, to depict landscapes (Fig.4c).
The water’s (lake shore) horizontal line geometrically divides the composition. With it, Cézanne seems to want to stress the duplication of the motif, i.e. the orthogonal symmetry of the landscape and its reflection on the water’s surface. The shape of the tree trunk exhibits the above-mentioned symmetry along the same horizontal
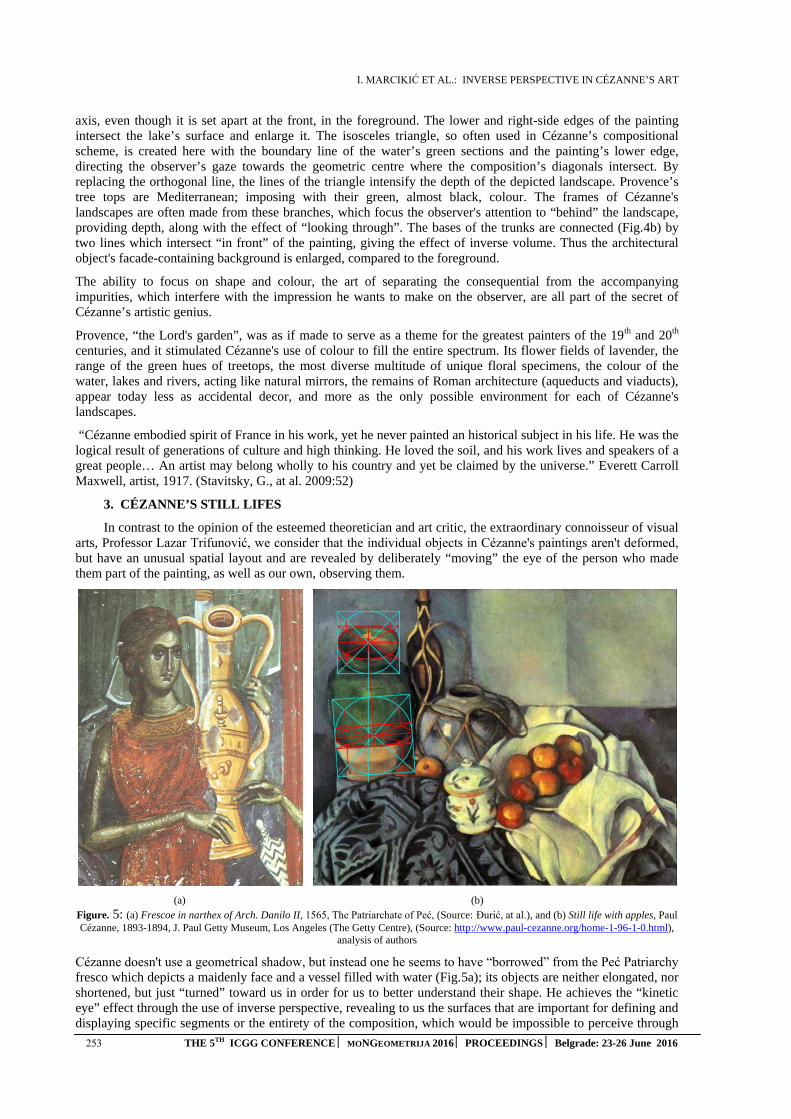
I. MARCIKIĆ ET AL.: INVERSE PERSPECTIVE IN CÉZANNE’S ART
253 THE 5TH ICGG CONFERENCE MONGEOMETRIJA 2016 PROCEEDINGS Belgrade: 23-26 June 2016
axis, even though it is set apart at the front, in the foreground. The lower and right-side edges of the painting intersect the lake’s surface and enlarge it. The isosceles triangle, so often used in Cézanne’s compositional scheme, is created here with the boundary line of the water’s green sections and the painting’s lower edge, directing the observer’s gaze towards the geometric centre where the composition’s diagonals intersect. By replacing the orthogonal line, the lines of the triangle intensify the depth of the depicted landscape. Provence’s tree tops are Mediterranean; imposing with their green, almost black, colour. The frames of Cézanne's landscapes are often made from these branches, which focus the observer's attention to “behind” the landscape, providing depth, along with the effect of “looking through”. The bases of the trunks are connected (Fig.4b) by two lines which intersect “in front” of the painting, giving the effect of inverse volume. Thus the architectural object's facade-containing background is enlarged, compared to the foreground.
The ability to focus on shape and colour, the art of separating the consequential from the accompanying impurities, which interfere with the impression he wants to make on the observer, are all part of the secret of Cézanne’s artistic genius.
Provence, “the Lord's garden”, was as if made to serve as a theme for the greatest painters of the 19th and 20th centuries, and it stimulated Cézanne's use of colour to fill the entire spectrum. Its flower fields of lavender, the range of the green hues of treetops, the most diverse multitude of unique floral specimens, the colour of the water, lakes and rivers, acting like natural mirrors, the remains of Roman architecture (aqueducts and viaducts), appear today less as accidental decor, and more as the only possible environment for each of Cézanne's landscapes.
“Cézanne embodied spirit of France in his work, yet he never painted an historical subject in his life. He was the logical result of generations of culture and high thinking. He loved the soil, and his work lives and speakers of a great people… An artist may belong wholly to his country and yet be claimed by the universe.” Everett Carroll Maxwell, artist, 1917. (Stavitsky, G., at al. 2009:52)
3. CÉZANNE’S STILL LIFES
In contrast to the opinion of the esteemed theoretician and art critic, the extraordinary connoisseur of visual arts, Professor Lazar Trifunović, we consider that the individual objects in Cézanne's paintings aren't deformed, but have an unusual spatial layout and are revealed by deliberately “moving” the eye of the person who made them part of the painting, as well as our own, observing them.
(a) (b)
Figure. 5: (a) Frescoe in narthex of Arch. Danilo II, 1565, The Patriarchate of Peć, (Source: Đurić, at al.), and (b) Still life with apples, Paul Cézanne, 1893-1894, J. Paul Getty Museum, Los Angeles (The Getty Centre), (Source: http://www.paul-cezanne.org/home-1-96-1-0.html),
analysis of authors
Cézanne doesn't use a geometrical shadow, but instead one he seems to have “borrowed” from the Peć Patriarchy fresco which depicts a maidenly face and a vessel filled with water (Fig.5a); its objects are neither elongated, nor shortened, but just “turned” toward us in order for us to better understand their shape. He achieves the “kinetic eye” effect through the use of inverse perspective, revealing to us the surfaces that are important for defining and displaying specific segments or the entirety of the composition, which would be impossible to perceive through
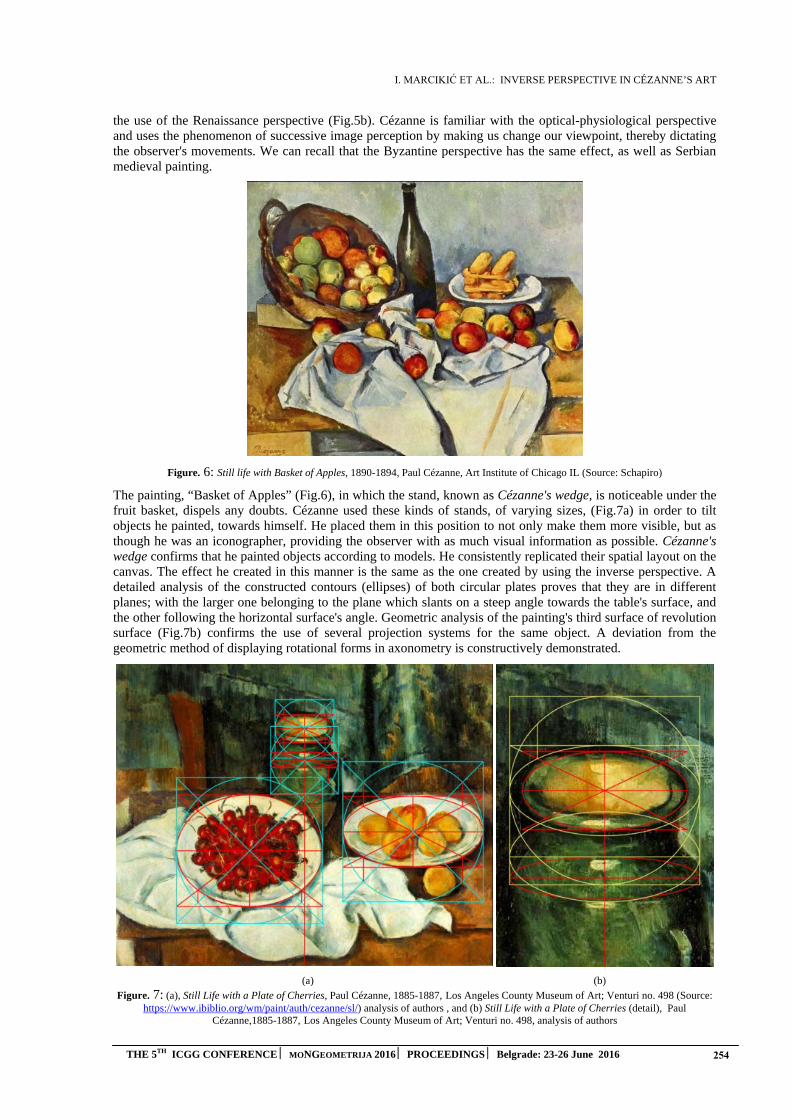
I. MARCIKIĆ ET AL.: INVERSE PERSPECTIVE IN CÉZANNE’S ART
THE 5TH ICGG CONFERENCE MONGEOMETRIJA 2016 PROCEEDINGS Belgrade: 23-26 June 2016 254
the use of the Renaissance perspective (Fig.5b). Cézanne is familiar with the optical-physiological perspective and uses the phenomenon of successive image perception by making us change our viewpoint, thereby dictating the observer's movements. We can recall that the Byzantine perspective has the same effect, as well as Serbian medieval painting.
Figure. 6: Still life with Basket of Apples, 1890-1894, Paul Cézanne, Art Institute of Chicago IL (Source: Schapiro)
The painting, “Basket of Apples” (Fig.6), in which the stand, known as Cézanne's wedge, is noticeable under the fruit basket, dispels any doubts. Cézanne used these kinds of stands, of varying sizes, (Fig.7a) in order to tilt objects he painted, towards himself. He placed them in this position to not only make them more visible, but as though he was an iconographer, providing the observer with as much visual information as possible. Cézanne's wedge confirms that he painted objects according to models. He consistently replicated their spatial layout on the canvas. The effect he created in this manner is the same as the one created by using the inverse perspective. A detailed analysis of the constructed contours (ellipses) of both circular plates proves that they are in different planes; with the larger one belonging to the plane which slants on a steep angle towards the table's surface, and the other following the horizontal surface's angle. Geometric analysis of the painting's third surface of revolution surface (Fig.7b) confirms the use of several projection systems for the same object. A deviation from the geometric method of displaying rotational forms in axonometry is constructively demonstrated.
(a) (b)
Figure. 7: (a), Still Life with a Plate of Cherries, Paul Cézanne, 1885-1887, Los Angeles County Museum of Art; Venturi no. 498 (Source: https://www.ibiblio.org/wm/paint/auth/cezanne/sl/) analysis of authors , and (b) Still Life with a Plate of Cherries (detail), Paul
Cézanne,1885-1887, Los Angeles County Museum of Art; Venturi no. 498, analysis of authors
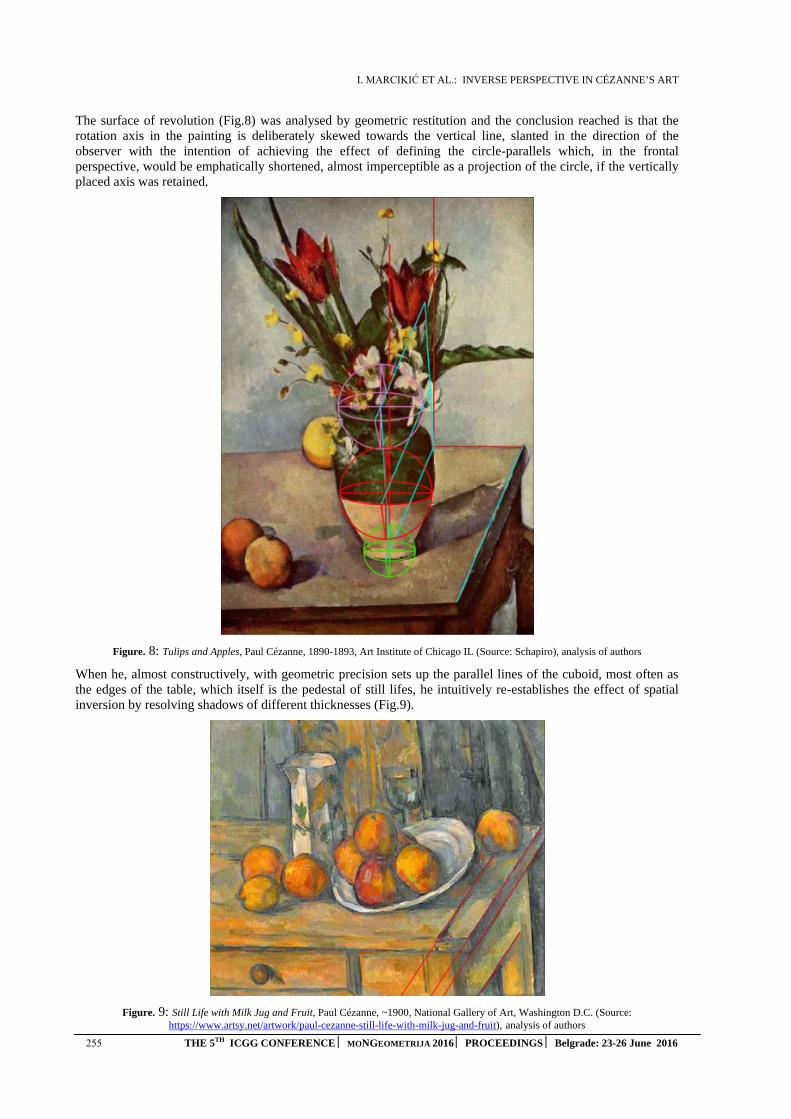
I. MARCIKIĆ ET AL.: INVERSE PERSPECTIVE IN CÉZANNE’S ART
255 THE 5TH ICGG CONFERENCE MONGEOMETRIJA 2016 PROCEEDINGS Belgrade: 23-26 June 2016
The surface of revolution (Fig.8) was analysed by geometric restitution and the conclusion reached is that the rotation axis in the painting is deliberately skewed towards the vertical line, slanted in the direction of the observer with the intention of achieving the effect of defining the circle-parallels which, in the frontal perspective, would be emphatically shortened, almost imperceptible as a projection of the circle, if the vertically placed axis was retained.
Figure. 8: Tulips and Apples, Paul Cézanne, 1890-1893, Art Institute of Chicago IL (Source: Schapiro), analysis of authors
When he, almost constructively, with geometric precision sets up the parallel lines of the cuboid, most often as the edges of the table, which itself is the pedestal of still lifes, he intuitively re-establishes the effect of spatial inversion by resolving shadows of different thicknesses (Fig.9).
Figure. 9: Still Life with Milk Jug and Fruit, Paul Cézanne, ~1900, National Gallery of Art, Washington D.C. (Source: https://www.artsy.net/artwork/paul-cezanne-still-life-with-milk-jug-and-fruit), analysis of authors
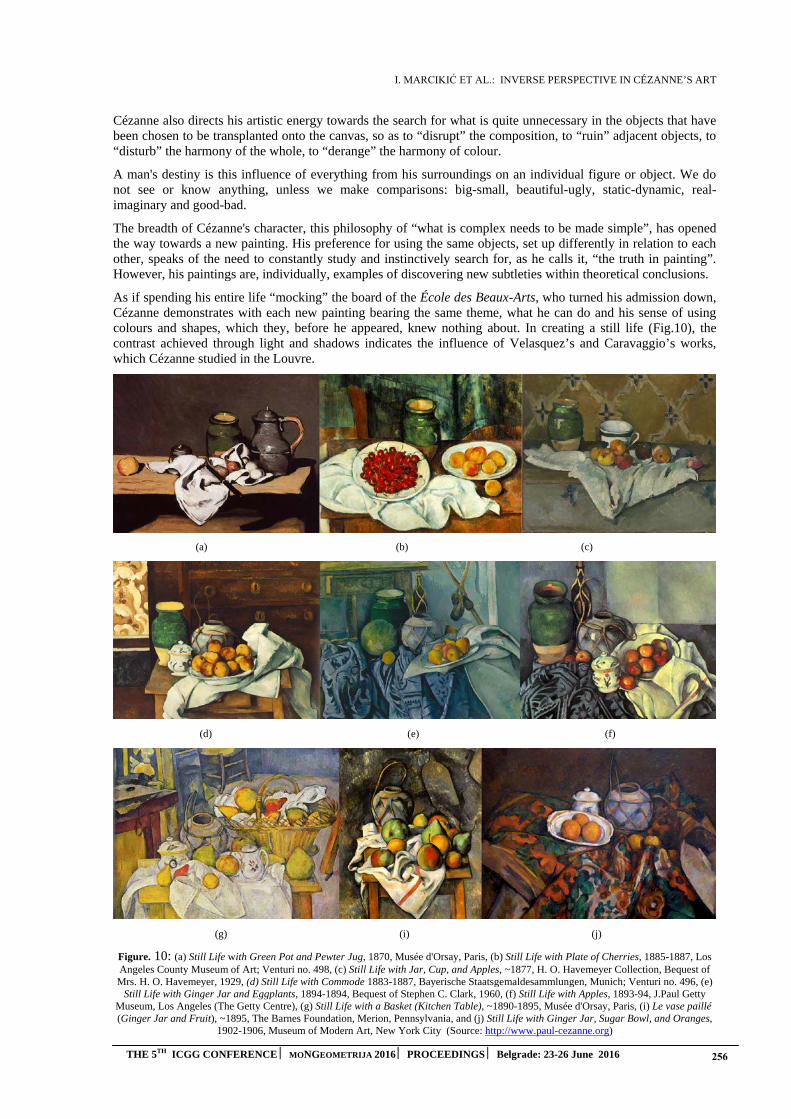
I. MARCIKIĆ ET AL.: INVERSE PERSPECTIVE IN CÉZANNE’S ART
THE 5TH ICGG CONFERENCE MONGEOMETRIJA 2016 PROCEEDINGS Belgrade: 23-26 June 2016 256
Cézanne also directs his artistic energy towards the search for what is quite unnecessary in the objects that have been chosen to be transplanted onto the canvas, so as to “disrupt” the composition, to “ruin” adjacent objects, to “disturb” the harmony of the whole, to “derange” the harmony of colour.
A man's destiny is this influence of everything from his surroundings on an individual figure or object. We do not see or know anything, unless we make comparisons: big-small, beautiful-ugly, static-dynamic, real-imaginary and good-bad.
The breadth of Cézanne's character, this philosophy of “what is complex needs to be made simple”, has opened the way towards a new painting. His preference for using the same objects, set up differently in relation to each other, speaks of the need to constantly study and instinctively search for, as he calls it, “the truth in painting”. However, his paintings are, individually, examples of discovering new subtleties within theoretical conclusions.
As if spending his entire life “mocking” the board of the École des Beaux-Arts, who turned his admission down, Cézanne demonstrates with each new painting bearing the same theme, what he can do and his sense of using colours and shapes, which they, before he appeared, knew nothing about. In creating a still life (Fig.10), the contrast achieved through light and shadows indicates the influence of Velasquez’s and Caravaggio’s works, which Cézanne studied in the Louvre.
(a) (b) (c)
(d) (e) (f)
(g) (i) (j)
Figure. 10: (a) Still Life with Green Pot and Pewter Jug, 1870, Musée d'Orsay, Paris, (b) Still Life with Plate of Cherries, 1885-1887, LosAngeles County Museum of Art; Venturi no. 498, (c) Still Life with Jar, Cup, and Apples, ~1877, H. O. Havemeyer Collection, Bequest of Mrs. H. O. Havemeyer, 1929, (d) Still Life with Commode 1883-1887, Bayerische Staatsgemaldesammlungen, Munich; Venturi no. 496, (e)
Still Life with Ginger Jar and Eggplants, 1894-1894, Bequest of Stephen C. Clark, 1960, (f) Still Life with Apples, 1893-94, J.Paul Getty Museum, Los Angeles (The Getty Centre), (g) Still Life with a Basket (Kitchen Table), ~1890-1895, Musée d'Orsay, Paris, (i) Le vase paillé (Ginger Jar and Fruit), ~1895, The Barnes Foundation, Merion, Pennsylvania, and (j) Still Life with Ginger Jar, Sugar Bowl, and Oranges,
1902-1906, Museum of Modern Art, New York City (Source: http://www.paul-cezanne.org)
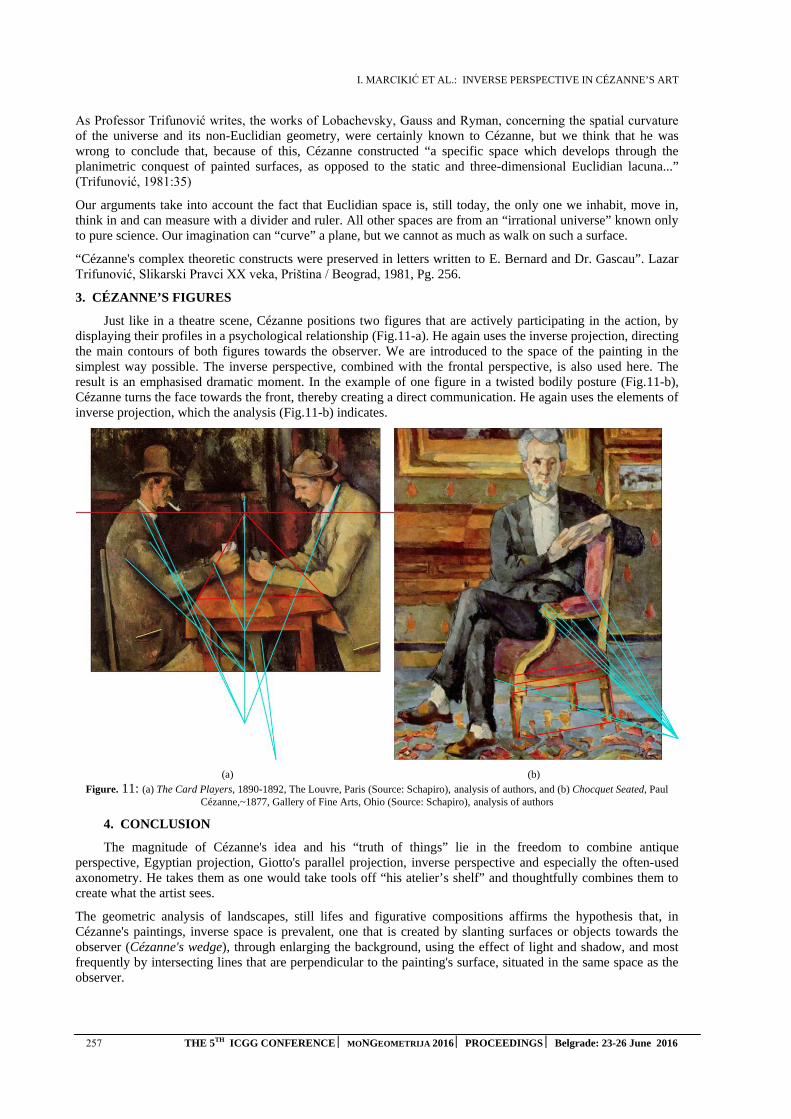
I. MARCIKIĆ ET AL.: INVERSE PERSPECTIVE IN CÉZANNE’S ART
257 THE 5TH ICGG CONFERENCE MONGEOMETRIJA 2016 PROCEEDINGS Belgrade: 23-26 June 2016
As Professor Trifunović writes, the works of Lobachevsky, Gauss and Ryman, concerning the spatial curvature of the universe and its non-Euclidian geometry, were certainly known to Cézanne, but we think that he was wrong to conclude that, because of this, Cézanne constructed “a specific space which develops through the planimetric conquest of painted surfaces, as opposed to the static and three-dimensional Euclidian lacuna...” (Trifunović, 1981:35)
Our arguments take into account the fact that Euclidian space is, still today, the only one we inhabit, move in, think in and can measure with a divider and ruler. All other spaces are from an “irrational universe” known only to pure science. Our imagination can “curve” a plane, but we cannot as much as walk on such a surface.
“Cézanne's complex theoretic constructs were preserved in letters written to E. Bernard and Dr. Gascau”. Lazar Trifunović, Slikarski Pravci XX veka, Priština / Beograd, 1981, Pg. 256.
3. CÉZANNE’S FIGURES
Just like in a theatre scene, Cézanne positions two figures that are actively participating in the action, by displaying their profiles in a psychological relationship (Fig.11-a). He again uses the inverse projection, directing the main contours of both figures towards the observer. We are introduced to the space of the painting in the simplest way possible. The inverse perspective, combined with the frontal perspective, is also used here. The result is an emphasised dramatic moment. In the example of one figure in a twisted bodily posture (Fig.11-b), Cézanne turns the face towards the front, thereby creating a direct communication. He again uses the elements of inverse projection, which the analysis (Fig.11-b) indicates.
(a) (b)
Figure. 11: (a) The Card Players, 1890-1892, The Louvre, Paris (Source: Schapiro), analysis of authors, and (b) Chocquet Seated, Paul Cézanne,~1877, Gallery of Fine Arts, Ohio (Source: Schapiro), analysis of authors
4. CONCLUSION
The magnitude of Cézanne's idea and his “truth of things” lie in the freedom to combine antique perspective, Egyptian projection, Giotto's parallel projection, inverse perspective and especially the often-used axonometry. He takes them as one would take tools off “his atelier’s shelf” and thoughtfully combines them to create what the artist sees.
The geometric analysis of landscapes, still lifes and figurative compositions affirms the hypothesis that, in Cézanne's paintings, inverse space is prevalent, one that is created by slanting surfaces or objects towards the observer (Cézanne's wedge), through enlarging the background, using the effect of light and shadow, and most frequently by intersecting lines that are perpendicular to the painting's surface, situated in the same space as the observer.
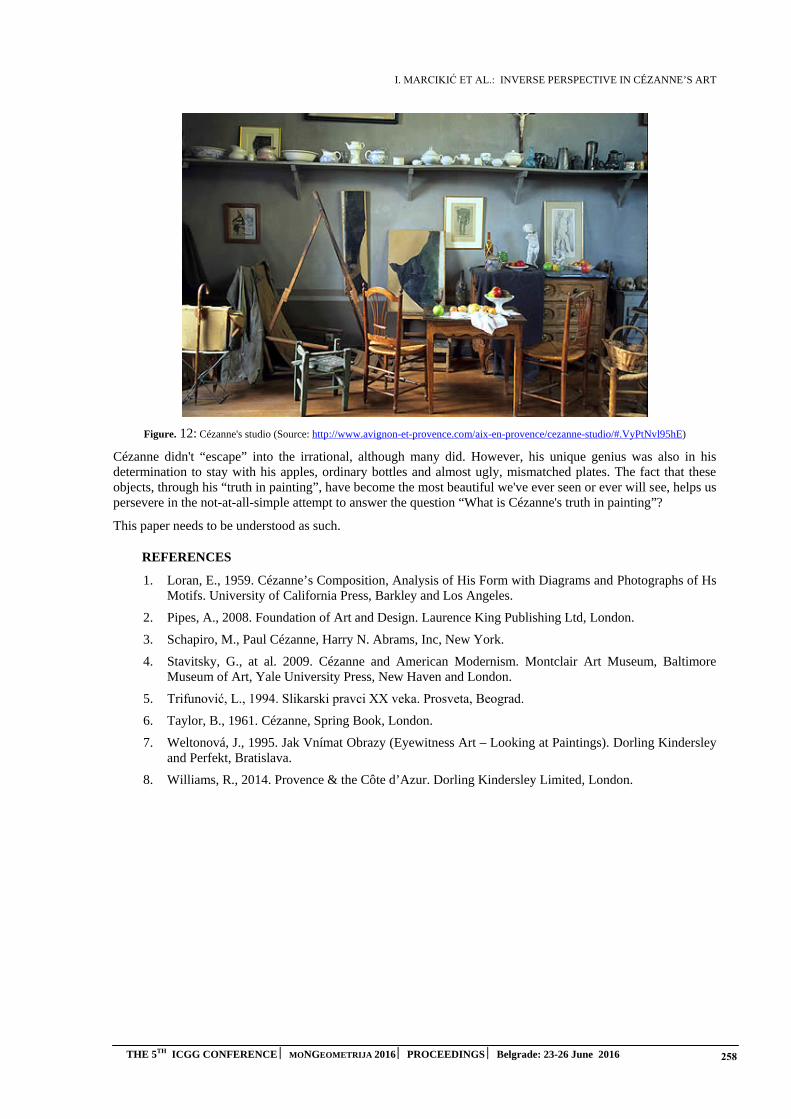
I. MARCIKIĆ ET AL.: INVERSE PERSPECTIVE IN CÉZANNE’S ART
THE 5TH ICGG CONFERENCE MONGEOMETRIJA 2016 PROCEEDINGS Belgrade: 23-26 June 2016 258
Figure. 12: Cézanne's studio (Source: http://www.avignon-et-provence.com/aix-en-provence/cezanne-studio/#.VyPtNvl95hE)
Cézanne didn't “escape” into the irrational, although many did. However, his unique genius was also in his determination to stay with his apples, ordinary bottles and almost ugly, mismatched plates. The fact that these objects, through his “truth in painting”, have become the most beautiful we've ever seen or ever will see, helps us persevere in the not-at-all-simple attempt to answer the question “What is Cézanne's truth in painting”?
This paper needs to be understood as such.
REFERENCES
1. Loran, E., 1959. Cézanne’s Composition, Analysis of His Form with Diagrams and Photographs of HsMotifs. University of California Press, Barkley and Los Angeles.
2. Pipes, A., 2008. Foundation of Art and Design. Laurence King Publishing Ltd, London.
3. Schapiro, M., Paul Cézanne, Harry N. Abrams, Inc, New York.
4. Stavitsky, G., at al. 2009. Cézanne and American Modernism. Montclair Art Museum, BaltimoreMuseum of Art, Yale University Press, New Haven and London.
5. Trifunović, L., 1994. Slikarski pravci XX veka. Prosveta, Beograd.
6. Taylor, B., 1961. Cézanne, Spring Book, London.
7. Weltonová, J., 1995. Jak Vnímat Obrazy (Eyewitness Art – Looking at Paintings). Dorling Kindersleyand Perfekt, Bratislava.
8. Williams, R., 2014. Provence & the Côte d’Azur. Dorling Kindersley Limited, London.
A. DE ROSA: J. F. NICERON: PERSPECTIVE AND ARTIFICIAL MAGIC
THE 5TH ICGG CONFERENCE MONGEOMETRIJA 2016 PROCEEDINGS Belgrade: 23-26 June 2016 259
J. F. NICERON: PERPSECTIVE AND ARTIFICIAL MAGIC
Agostino De Rosa
Department of Architecture and Arts/DCP, University Iuav of Venezia, Venezia, Italy Full Professor, [email protected]
ABSTRACT
The essay deals with the perspectival and artistic work of Minim Father Jean François Niceron (1613-1646), whose life was expressed in a very short period of time - just 33 years - but full of political and cultural events, reflected in works offered today to the eyes of the contemporary observer as extraordinary charades, in perfect ballance between mathematical rigor and taste for the wonderful and amazing. Author of two treaties (the second of which published posthumously) which have become milestones in studies of Seventeenth-century perspective - La perspective curieuse (Paris 1638) and the Thaumaturgus opticus (Paris 1646) -, Niceron early developed from his expressive world which he translated in acutely deceptive works: catoptric anamorphoses, refractive games and murals in accelerated perspective (the only one survived, depicting St. John the Evangelist writing the Apocalypse in Patmos, it is now visible at the Convent of SS. Trinita dei Monti, Rome), to name a few types. The biography of the author outlines a life, suspended between France and Italy, engaged not only in debates developed in the most important scientific and cultural circles of the two countries, but also in theological and religious duties required by his religious Order. The author was fascinated throughout its existence from the idea that in the nature was hidden a divine secret code of which mathematics, and primarily optics, could become interpreters, creating an expressive vocabulary which through the artificial magic re-produces its absolute configurative secret nature, the laws of its making and of its development. His epistemological journey has crossed the paths of Cartesian and Hobbesian thought, his works often becoming a true reflection of contemporary philosophical positions, while nevertheless preserving their stylistic autonomy, both in content and in form.
Keywords: History and Theory of Representational Methods; History of Descriptive Geometry; History of Science; Perspective in Art; Catoptric in Art.
INTRODUCTION
P. IOANNIS FRANCISCO NICERONO. GENI DEL MIRABILIBVS SVI OPERIBVS
The portrait shows a young monk with an the emaciated face, outlined by a barely visible beard wearing a tunic with cap typical of the Minim religious Order, and holding in his hand the planche of his latest treatise, to which he was still working just before his death, September 22 1646. The engraving executed by Michel Lasne (1595- 1667) appears as a space-time paradox, especially since the subject of the portrait will not have the actual time to see his last work published; in fact, he also holds – in the image - this work in his hands, but it will only be published posthumously. If his body is pointing at the book, his face and especially his eyes are pointing elsewhere, beyond the limits of the illustrated page, toward a light source which is reflected in his terse pupils, oriented outside the religious and scientific circles – located in Rome and Paris - in which the young minimum monk lived for most of his short life. Jean-François Niceron in fact died in Aix-en-Provence at the Christological age of 33, having spent his youth in the exercise of faith, in scientific research and testing a bizarre but fascinating application of the theory of artificial magic to the world of images and to perception. The traces of this existence are rarefied, like paths dispersed in a suddendly shrouded mist clearing, and for the scholar it is difficult to approach it with so few landmarks. Few direct documents, but many indirect references to his life; appreciation from the most remarkable minds in Europe at the first half of XVII century, and then the corpus of his scientific and artistic work, often neglected and overlooked: these are the coordinates that offer
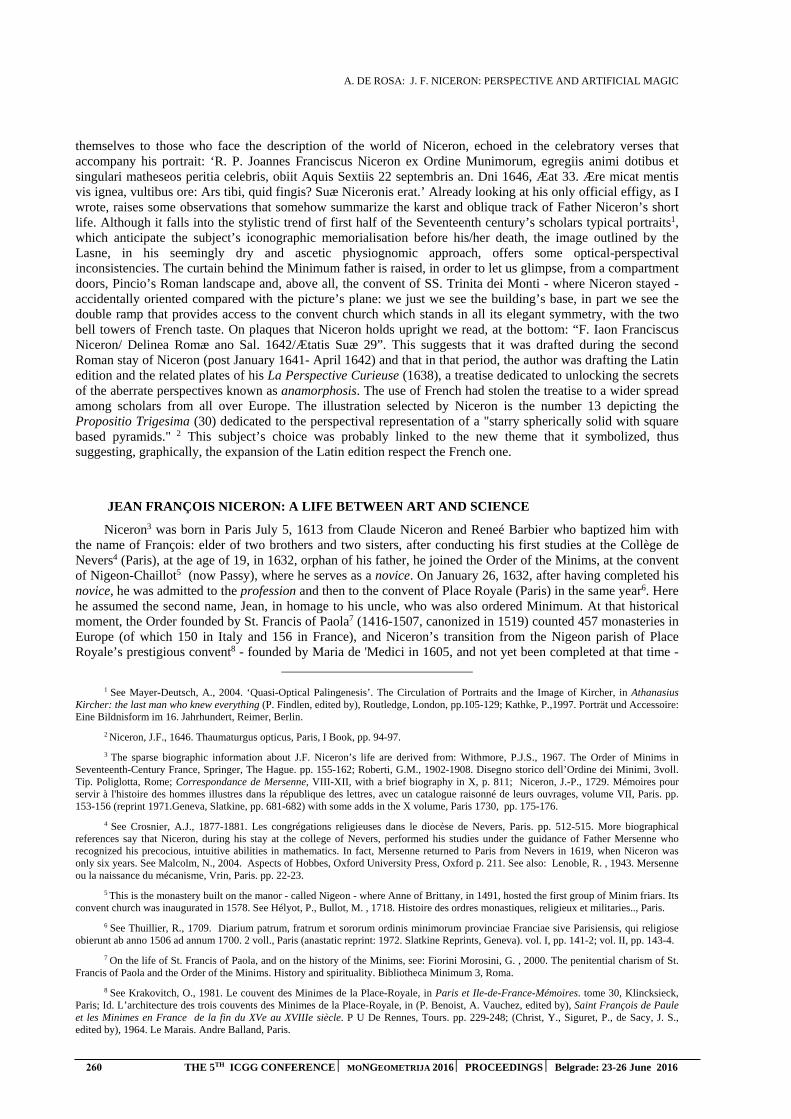
A. DE ROSA: J. F. NICERON: PERSPECTIVE AND ARTIFICIAL MAGIC
260 THE 5TH ICGG CONFERENCE MONGEOMETRIJA 2016 PROCEEDINGS Belgrade: 23-26 June 2016
themselves to those who face the description of the world of Niceron, echoed in the celebratory verses that accompany his portrait: ‘R. P. Joannes Franciscus Niceron ex Ordine Munimorum, egregiis animi dotibus et singulari matheseos peritia celebris, obiit Aquis Sextiis 22 septembris an. Dni 1646, Æat 33. Ære micat mentis vis ignea, vultibus ore: Ars tibi, quid fingis? Suæ Niceronis erat.’ Already looking at his only official effigy, as I wrote, raises some observations that somehow summarize the karst and oblique track of Father Niceron’s short life. Although it falls into the stylistic trend of first half of the Seventeenth century’s scholars typical portraits1, which anticipate the subject’s iconographic memorialisation before his/her death, the image outlined by the Lasne, in his seemingly dry and ascetic physiognomic approach, offers some optical-perspectival inconsistencies. The curtain behind the Minimum father is raised, in order to let us glimpse, from a compartment doors, Pincio’s Roman landscape and, above all, the convent of SS. Trinita dei Monti - where Niceron stayed - accidentally oriented compared with the picture’s plane: we just we see the building’s base, in part we see the double ramp that provides access to the convent church which stands in all its elegant symmetry, with the two bell towers of French taste. On plaques that Niceron holds upright we read, at the bottom: “F. Iaon Franciscus Niceron/ Delinea Romæ ano Sal. 1642/Ætatis Suæ 29”. This suggests that it was drafted during the second Roman stay of Niceron (post January 1641- April 1642) and that in that period, the author was drafting the Latin edition and the related plates of his La Perspective Curieuse (1638), a treatise dedicated to unlocking the secrets of the aberrate perspectives known as anamorphosis. The use of French had stolen the treatise to a wider spread among scholars from all over Europe. The illustration selected by Niceron is the number 13 depicting the Propositio Trigesima (30) dedicated to the perspectival representation of a "starry spherically solid with square based pyramids." 2 This subject’s choice was probably linked to the new theme that it symbolized, thus suggesting, graphically, the expansion of the Latin edition respect the French one.
JEAN FRANÇOIS NICERON: A LIFE BETWEEN ART AND SCIENCE
Niceron3 was born in Paris July 5, 1613 from Claude Niceron and Reneé Barbier who baptized him with the name of François: elder of two brothers and two sisters, after conducting his first studies at the Collège de Nevers4 (Paris), at the age of 19, in 1632, orphan of his father, he joined the Order of the Minims, at the convent of Nigeon-Chaillot5 (now Passy), where he serves as a novice. On January 26, 1632, after having completed his novice, he was admitted to the profession and then to the convent of Place Royale (Paris) in the same year6. Here he assumed the second name, Jean, in homage to his uncle, who was also ordered Minimum. At that historical moment, the Order founded by St. Francis of Paola7 (1416-1507, canonized in 1519) counted 457 monasteries in Europe (of which 150 in Italy and 156 in France), and Niceron’s transition from the Nigeon parish of Place Royale’s prestigious convent8 - founded by Maria de 'Medici in 1605, and not yet been completed at that time -
1 See Mayer-Deutsch, A., 2004. ‘Quasi-Optical Palingenesis’. The Circulation of Portraits and the Image of Kircher, in Athanasius Kircher: the last man who knew everything (P. Findlen, edited by), Routledge, London, pp.105-129; Kathke, P.,1997. Porträt und Accessoire: Eine Bildnisform im 16. Jahrhundert, Reimer, Berlin.
2 Niceron, J.F., 1646. Thaumaturgus opticus, Paris, I Book, pp. 94-97.
3 The sparse biographic information about J.F. Niceron’s life are derived from: Withmore, P.J.S., 1967. The Order of Minims in Seventeenth-Century France, Springer, The Hague. pp. 155-162; Roberti, G.M., 1902-1908. Disegno storico dell’Ordine dei Minimi, 3voll. Tip. Poliglotta, Rome; Correspondance de Mersenne, VIII-XII, with a brief biography in X, p. 811; Niceron, J.-P., 1729. Mémoires pour servir à l'histoire des hommes illustres dans la république des lettres, avec un catalogue raisonné de leurs ouvrages, volume VII, Paris. pp. 153-156 (reprint 1971.Geneva, Slatkine, pp. 681-682) with some adds in the X volume, Paris 1730, pp. 175-176.
4 See Crosnier, A.J., 1877-1881. Les congrégations religieuses dans le diocèse de Nevers, Paris. pp. 512-515. More biographical references say that Niceron, during his stay at the college of Nevers, performed his studies under the guidance of Father Mersenne who recognized his precocious, intuitive abilities in mathematics. In fact, Mersenne returned to Paris from Nevers in 1619, when Niceron was only six years. See Malcolm, N., 2004. Aspects of Hobbes, Oxford University Press, Oxford p. 211. See also: Lenoble, R. , 1943. Mersenne ou la naissance du mécanisme, Vrin, Paris. pp. 22-23.
5 This is the monastery built on the manor - called Nigeon - where Anne of Brittany, in 1491, hosted the first group of Minim friars. Its convent church was inaugurated in 1578. See Hélyot, P., Bullot, M. , 1718. Histoire des ordres monastiques, religieux et militaries.., Paris.
6 See Thuillier, R., 1709. Diarium patrum, fratrum et sororum ordinis minimorum provinciae Franciae sive Parisiensis, qui religiose obierunt ab anno 1506 ad annum 1700. 2 voll., Paris (anastatic reprint: 1972. Slatkine Reprints, Geneva). vol. I, pp. 141-2; vol. II, pp. 143-4.
7 On the life of St. Francis of Paola, and on the history of the Minims, see: Fiorini Morosini, G. , 2000. The penitential charism of St. Francis of Paola and the Order of the Minims. History and spirituality. Bibliotheca Minimum 3, Roma.
8 See Krakovitch, O., 1981. Le couvent des Minimes de la Place-Royale, in Paris et Ile-de-France-Mémoires. tome 30, Klincksieck, Paris; Id. L’architecture des trois couvents des Minimes de la Place-Royale, in (P. Benoist, A. Vauchez, edited by), Saint François de Paule et les Minimes en France de la fin du XVe au XVIIIe siècle. P U De Rennes, Tours. pp. 229-248; (Christ, Y., Siguret, P., de Sacy, J. S., edited by), 1964. Le Marais. Andre Balland, Paris.

A. DE ROSA: J. F. NICERON: PERSPECTIVE AND ARTIFICIAL MAGIC
THE 5TH ICGG CONFERENCE MONGEOMETRIJA 2016 PROCEEDINGS Belgrade: 23-26 June 2016 261
was a certification of the young devotee’s scientific potential, who, in observance of the Minim Rule, could reconcile the exercise of Christian charity with the practice of scientific studies. During the novitiate in 1631, at the age of 18, Niceron had already designed his first artistic work, an anamorphic portrait of Jacques d'Auzolles de Lapeyere (1571-1642), famous author of Mercure charitable9, which he inserted in his work, providing chronological details about it on its back side: it is an aberrated image, outlined and engraved by J. Picard, radiating itself on a horizontal surface, and it becomes recomposed when it’s reflected on a mirror-treated cylinder, placed inside of it, right in the image identified by the writer‘s 'rectified' portrait - executed in a medal shape -, defined by the same Niceron, princeps chronographorum. It is evident that at the time of the portrait of Jacques d'Auzolles, Niceron could not yet have read some seminal works by René Descartes10 (1596-1650), as the Dioptrique (1637) or the Géométrie (1637) which will be centered on the theme of perception and mistakes to which the senses inevitably condemn us: sure he will consult them later, attending both the Library of the Order of the Minims’s Convent in Place Royale (Paris) (which gathered in addition to the precious volumes and incunabula, even many scholars who frequented the intellectual circle of Father Marin Mersenne11 (1588-1648), secrétaire de l'Europe savante, in his cell every Saturday).
Fig. 1. M. Lasne, R. P. Joannes Franciscus Niceron ex Ordine Minimorum, egregiis animi dotibus et singulari matheseos peritia celebris, obiit Aquis Sextiis 22 septembris an. Dni 1646, Aetat 33. Engraving. Paris, first half of XVII century.
Scholars who gathered there - such as those who corresponded with him from all over Europe - were mostly interested in philosophical and mathematical questions and especially in the implications that the ideas of mechanism and of vacuum could result in the study and in the reproduction of natural phenomena: Niceron’s work, since his first artistic and scientific experience, is an attempt to escape from the inexorable idea of the mechanism, to identify "... a strategy to avoid the reduction of appearances to the laws of inert matter, or rather, to find a way through which, in itself, the appearances of material bodies were recognizable and oriented themselves to the spirit, reflected their otherness and their principle, not to be reduced to the size of the res
9 See d’Auzoles de Lapeyre, J., 1638. Le Mercure charitable, ou Contre-Touche et souverain remède pour desempierrer le R. P. Petau, jésuite d'Orléans, depuis peu métamorphosé en fausse pierre-de-touche, par Jacques d'Auzoles Lapeyre. in-fol., G. Alliot, Paris. The catoptrical anamorphosis is reproduced at page 73.
10 See Rodis-Lewis, G., 1997. Cartesio. Una biografia. Editori Riuniti, Roma.
11 The fundamental work on his life and his work remains: de Coste, H., 1649. La vie du R. P. Marin Mersenne, théologien, philosophe et mathématicien, de l'Ordre des Peres Minimes, par F. H. D. C. [Frère Hilarion de Coste], religieux du mesme Ordre. A Paris, chez Sebastien Cramoisy et Gabriel Cramoisy, MDCLIX, in-12°. Paris.
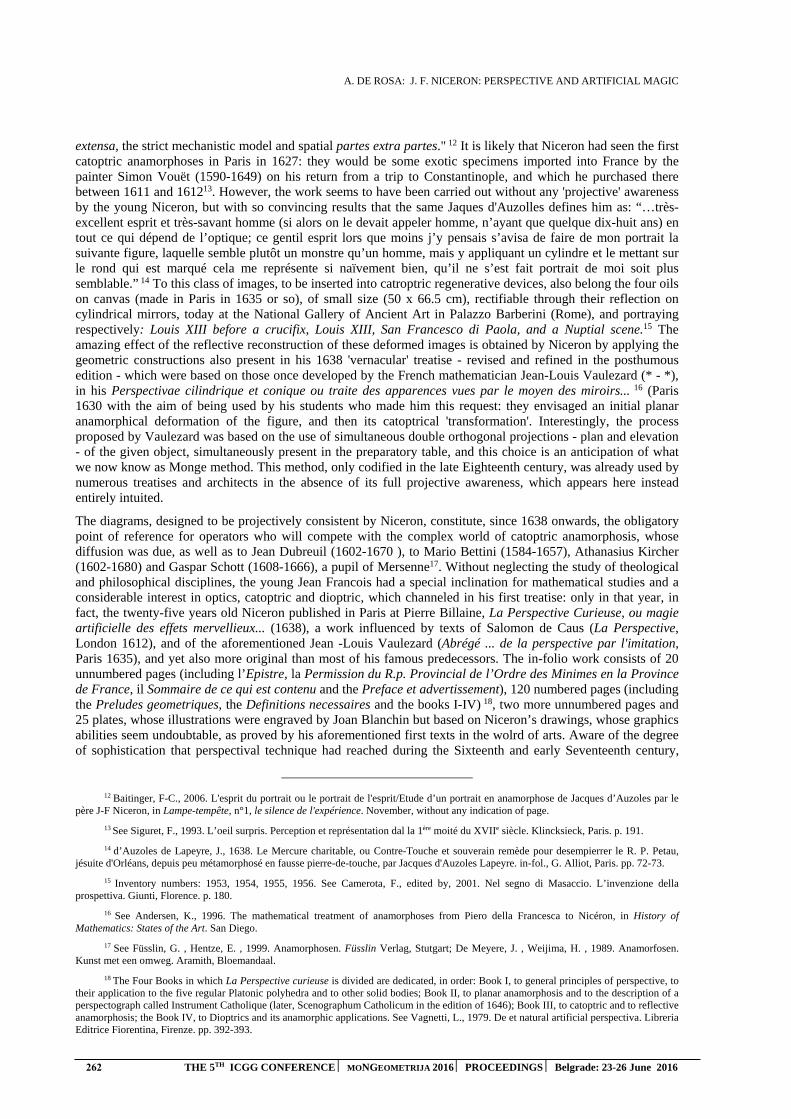
A. DE ROSA: J. F. NICERON: PERSPECTIVE AND ARTIFICIAL MAGIC
262 THE 5TH ICGG CONFERENCE MONGEOMETRIJA 2016 PROCEEDINGS Belgrade: 23-26 June 2016
extensa, the strict mechanistic model and spatial partes extra partes." 12 It is likely that Niceron had seen the first catoptric anamorphoses in Paris in 1627: they would be some exotic specimens imported into France by the painter Simon Vouët (1590-1649) on his return from a trip to Constantinople, and which he purchased there between 1611 and 161213. However, the work seems to have been carried out without any 'projective' awareness by the young Niceron, but with so convincing results that the same Jaques d'Auzolles defines him as: “…très-excellent esprit et très-savant homme (si alors on le devait appeler homme, n’ayant que quelque dix-huit ans) en tout ce qui dépend de l’optique; ce gentil esprit lors que moins j’y pensais s’avisa de faire de mon portrait la suivante figure, laquelle semble plutôt un monstre qu’un homme, mais y appliquant un cylindre et le mettant sur le rond qui est marqué cela me représente si naïvement bien, qu’il ne s’est fait portrait de moi soit plus semblable.” 14 To this class of images, to be inserted into catroptric regenerative devices, also belong the four oils on canvas (made in Paris in 1635 or so), of small size (50 x 66.5 cm), rectifiable through their reflection on cylindrical mirrors, today at the National Gallery of Ancient Art in Palazzo Barberini (Rome), and portraying respectively: Louis XIII before a crucifix, Louis XIII, San Francesco di Paola, and a Nuptial scene.15 The amazing effect of the reflective reconstruction of these deformed images is obtained by Niceron by applying the geometric constructions also present in his 1638 'vernacular' treatise - revised and refined in the posthumous edition - which were based on those once developed by the French mathematician Jean-Louis Vaulezard (* - *), in his Perspectivae cilindrique et conique ou traite des apparences vues par le moyen des miroirs... 16 (Paris 1630 with the aim of being used by his students who made him this request: they envisaged an initial planar anamorphical deformation of the figure, and then its catoptrical 'transformation'. Interestingly, the process proposed by Vaulezard was based on the use of simultaneous double orthogonal projections - plan and elevation - of the given object, simultaneously present in the preparatory table, and this choice is an anticipation of what we now know as Monge method. This method, only codified in the late Eighteenth century, was already used by numerous treatises and architects in the absence of its full projective awareness, which appears here instead entirely intuited.
The diagrams, designed to be projectively consistent by Niceron, constitute, since 1638 onwards, the obligatory point of reference for operators who will compete with the complex world of catoptric anamorphosis, whose diffusion was due, as well as to Jean Dubreuil (1602-1670 ), to Mario Bettini (1584-1657), Athanasius Kircher (1602-1680) and Gaspar Schott (1608-1666), a pupil of Mersenne17. Without neglecting the study of theological and philosophical disciplines, the young Jean Francois had a special inclination for mathematical studies and a considerable interest in optics, catoptric and dioptric, which channeled in his first treatise: only in that year, in fact, the twenty-five years old Niceron published in Paris at Pierre Billaine, La Perspective Curieuse, ou magie artificielle des effets mervellieux... (1638), a work influenced by texts of Salomon de Caus (La Perspective, London 1612), and of the aforementioned Jean -Louis Vaulezard (Abrégé ... de la perspective par l'imitation, Paris 1635), and yet also more original than most of his famous predecessors. The in-folio work consists of 20 unnumbered pages (including l’Epistre, la Permission du R.p. Provincial de l’Ordre des Minimes en la Province de France, il Sommaire de ce qui est contenu and the Preface et advertissement), 120 numbered pages (including the Preludes geometriques, the Definitions necessaires and the books I-IV) 18, two more unnumbered pages and 25 plates, whose illustrations were engraved by Joan Blanchin but based on Niceron’s drawings, whose graphics abilities seem undoubtable, as proved by his aforementioned first texts in the wolrd of arts. Aware of the degree of sophistication that perspectival technique had reached during the Sixteenth and early Seventeenth century,
12 Baitinger, F-C., 2006. L'esprit du portrait ou le portrait de l'esprit/Etude d’un portrait en anamorphose de Jacques d’Auzoles par le père J-F Niceron, in Lampe-tempête, n°1, le silence de l'expérience. November, without any indication of page.
13 See Siguret, F., 1993. L’oeil surpris. Perception et représentation dal la 1ère moité du XVIIe siècle. Klincksieck, Paris. p. 191.
14 d’Auzoles de Lapeyre, J., 1638. Le Mercure charitable, ou Contre-Touche et souverain remède pour desempierrer le R. P. Petau, jésuite d'Orléans, depuis peu métamorphosé en fausse pierre-de-touche, par Jacques d'Auzoles Lapeyre. in-fol., G. Alliot, Paris. pp. 72-73.
15 Inventory numbers: 1953, 1954, 1955, 1956. See Camerota, F., edited by, 2001. Nel segno di Masaccio. L’invenzione della prospettiva. Giunti, Florence. p. 180.
16 See Andersen, K., 1996. The mathematical treatment of anamorphoses from Piero della Francesca to Nicéron, in History of Mathematics: States of the Art. San Diego.
17 See Füsslin, G. , Hentze, E. , 1999. Anamorphosen. Füsslin Verlag, Stutgart; De Meyere, J. , Weijima, H. , 1989. Anamorfosen. Kunst met een omweg. Aramith, Bloemandaal.
18 The Four Books in which La Perspective curieuse is divided are dedicated, in order: Book I, to general principles of perspective, to their application to the five regular Platonic polyhedra and to other solid bodies; Book II, to planar anamorphosis and to the description of a perspectograph called Instrument Catholique (later, Scenographum Catholicum in the edition of 1646); Book III, to catoptric and to reflective anamorphosis; the Book IV, to Dioptrics and its anamorphic applications. See Vagnetti, L., 1979. De et natural artificial perspectiva. Libreria Editrice Fiorentina, Firenze. pp. 392-393.

A. DE ROSA: J. F. NICERON: PERSPECTIVE AND ARTIFICIAL MAGIC
THE 5TH ICGG CONFERENCE MONGEOMETRIJA 2016 PROCEEDINGS Belgrade: 23-26 June 2016 263
Niceron addresses the problem of deformation with an approach that today we might call 'projective' avant la lettre, abandoning the practical expedients now widely exploited,"... because it is a matter of small weight and for which it is not necessary to have any knowledge of perspective." 19 In his treatise the Minim Father, showing a deep understanding of the perspective theories formulated by his predecessors, both Italian and French and German, takes a leading role in the development of the discipline, steering towards an 'Archimedean' approach rather than a 'platonic' one in the espositive issues, which are focused more on the application side of a topic than on the abstractly speculative one. The optic primacy is quickly established, in that, between the senses, the vision just dominates, as Descrates himself asserted in his preface to La Dioptrique. With clear and rigorous language, Niceron proposes and solves many problems of linear perspective, accompanying the theoretical explanation with the beautiful plates engraved by Blanchin. The intention of Father Niceron is not to edit a critical document summary of the best earlier treatises, but to deal with "... kindness of the curious perspective, which, as they have amused him and distracted from the seriousness of theological studies, may not be disagreeable to the curious."
20, One of the critical elements that emerge from the niceronian anamorphic treatment is the unprecedented upheaval of the ontological set provided from the common perspective, which classically foresaw the figurative plane arranged between the eye and the object to be represented: Niceron undermines this liturgy, admitting that the object can be placed accidentally between the other two elements, so as to produce further distortions in projective phase, primarily the effect that anamorphic image projects towards the observer, once it has been rectfied. The beginnings of this projective approach must be found in Piero della Francesca, and in particular in its perspective of a rinfrescatoio with pedestal, subject of fig. LXXIX of his De Prospectiva Pingendi (ca 1482). Later Niceron insists in remembering that he had used the word ‘magic’ in his treatise’s title not to allude to prohibited, esoteric or occult practices, but to refer, as it happened with Giambattista della Porta21, to those effects merveilleux that will be shown through the perspective, this one indeed a magie artificielle; according to historian Amodeo22, it was precisely because of the word ‘magic’ included in the title of his work, that the copies of the first edition of Niceron’s treatise disappeared in a short time, maybe withdrawn by the ecclesiastical authorities because they considered it heretical. However, for Niceron, perspective was not just a form of recreations de savants, but one of those racy exercises of phenomenal mimesis of the world o which belonged also the fabulous balls by Posidonius (135 BC-50 BC), a planetarium which imitated the motions of the heavenly spheres; or the wooden flying dove by Archita (428 BC-347 BC); or even the bronze talking head made by Albertus Magnus (1206 -1280): a plethora of automates whose purpose was therefore to compete with the wonders of nature, and to which René Descartes himself made referenced to in the introduction of the Latin edition of his Traité de l'homme (1648), showing they have used the same Niceron’s literary source, namely De occulta philosophia (1531) by Cornelius Agrippa (1486 -1535). The center of La Perspective Curieuse remains the anamorphosis: the subject is so developed by Niceron in its geometric and figurative (direct and indirect) implications that it soon became the reference text in the specialist studies and his author became an auctoritas summa on the subject. It’s significant that the theme of anamorphosis finds its own more exhaustive exegesis in the scientific texts elaborated by religious stationed in Rome, and in particular in The Perspective Curieuse by our Jean Francois Niceron and in subsequent Latin edition, published posthumously in 1646, edited by Minim Father M. Mersenne, and entitled Thaumaturgus opticus seu admiranda. Optices for radium directum; catoptrices for reflexum and 'Politis corporibus, Planis, cylindricis, polyedris, poligonis, et aliis; Dioptrices for rifractum in diaphanis. As reported by Ilaria Rizzini23, the latter work was intended as a partial realization - for economic and biographical issues - of the publishing project that Niceron cultivated for many years and that, before to the Minim Community undertakings, and then an early death, prevented him from carrying it out. In the text Niceron deforms, in strongly aberrated perspective, besides human figures, the images of common objects, such as a chair and a bench of which are offered, of the first, a distorted version in depth and, the other, in width, but which magically rectify themselves when observed under a very acute viewing angle and from a suitable position. The observer thus becomes consubstantial to that point with the image, instinctively becoming
19 Niceron, J. F., 1638. La perspective curieuse. Paris. p. 90.
20 Ibid.
21 See: della Porta, G.B. 1589. Magia Naturalis, libri XX. Neaples. See also: Hammond, J.H., 1981. The camera oscura. A chronicle. Hilger, Bristol; Pesenti Campagnoni, D., 1995. Verso il cinema. Macchine, spettacoli e mirabili visioni. UTET Università, Torino.
22 See: Amodeo, F., 1933. Lo sviluppo della Prospettiva in Francia nel secolo XVII, in Atti dell’Accademia Pontaniana, vol. LXIII. Neaples. pp. 24-25
23 See: Rizzini, I., October-December 2004. Il Thaumaturgus opticus di Jean-François Niceron: appunti in margine alla traduzione dal Latino, in Bollettino Ufficiale dell’Ordine dei Minimi, n° 4, year LI.

A. DE ROSA: J. F. NICERON: PERSPECTIVE AND ARTIFICIAL MAGIC
264 THE 5TH ICGG CONFERENCE MONGEOMETRIJA 2016 PROCEEDINGS Belgrade: 23-26 June 2016
closer to the picture plane and trying to solve its meaning, and at the end collapsing on it: the cancellation of this hiatus, indispensable to solve the cathartic game in which the initial doubt is followed by visual uncertainty and finally the renewed domain on the image which, according to Lyle Massey, is inscribed in a process of acquiring visual certainty, in which the viewer becomes one with the thing observed; process that is coupled with the established Cartesian ontology grounded "... on a point of view model which depends on a despatialized vision... What distinguishes anamorphosis from cogito is that anamorphic point resists Cartesian recovery of the knowledge of self reaffirming instead the division of a subject that has torn both epistemological and ontological certainty." 24 One of the most interesting sections of the work is contained in Book III, whose content Niceron sums up didactically, revealing how it is entirely dedicated to the study "... of the appearance of flat, cylindrical and conical mirrors, and how to build figures which are related and represent through reflection to something quite different, of what appears being viewed directly." 25 Here the influence carried out by Vaulezard’s work is clear and accepted by the author himself, although Jean-François Niceron will devote to deepen both experimental and theoretical aspects related to catoptric anamorphoses, proposing two procedures for the construction of the reflective anamorphosis, in particular the cylindrical one. In Table 18 (Fig. LIII, LIV, LV) of La Perspective Curieuse also appear the instructions26 to create an optical game consisting of several wooden slats of prismatic shape and with an isosceles triangular section, arranged in succession within a box, on whose visible faces Niceron portrays, in alternating sequence, the face of Francis I of France and the celebratory motto:“Franciscus/Primus/Dei Gratia/Francorum/Rex/Christianissimus/Anno Domini/M.DC.XV.” 27 The illusory effect allows us to see to its same dedication, "in faccia", and the real picture, "per via di sfera", that is, through the use of a mirror, ad hoc tilted, reflecting the surfaces’s rulers not directly visible28. Here Niceron admits to have used two simple theorems taken from Euclid’s Catoptrics (ca. 325 BC-285 BC) to reach his deceptive purpose, in particular the Seventh and Nineteenth. Niceron also offers a variant of the first solution proposed, substituting, for the portrait of Pope Urban VIII, the prismatic triangular rulers with plan listels. James L. Hunt and John Sharp classify this type of device as a channel anamorphosis, in consonance with the definition tabula scalata provided by A. Kircher. James L. Hunt and John Sharp classify this type of device as a channel anamorphosis, in consonance with the definition provided by A. Kircher of tabula scalata29, noting that its presence in the art world had already been reported by Shakespeare30. The historian Frances Terpak identifies a classical lineage in this continuous bipolar device, associating it to the XV books of Metamorphoseon, the famous epic poem of Ovid (43 BC-18 BC) in which, in addition to the theme of magic and wonderful mutation, also marked dramatically by its latent hubris, emerges a hypotactic structure which is typical of anamorphosis, in particular of that which we are examining here: the plural articulation in interconnected subordinate with the text is coupled with the multiple semantic layers of the image, in its everchanging signifier but also in its multiple meanings and intertextual references. At the same hermeneutic profile also belongs a dioptric anamorphosis, present in the same collection of the Galileo Galilei Museum31 dedicated to the optics, sure executed on Niceron’s advice and supervision around 1642, and which consists of an oil painting on wood, attached to an other horizontal tablet, on which is anchored, in front of the painting, a wooden pedestal bearing, in its upper part, a semi-cylindrical pilot-hole hosting a telescope. In the painted image are depicted several Turkish heads (arranged nearly radially around a trophy of arms and flags which occupies a central position in the composition), that then had to then had to be observed through the 'telescope' - equipped with a prismatic lens and a diaphragm -. This device was lost during the Florence flood of of 1966: only in this way it would appear, magically, a portrait of the Grand Duke Ferdinando II de 'Medici, obtained thanks to the refractive selection by the lens’ facets, out of the Saracens’ portraits. The work also presents an inscription, partially abraded, on the horizontal connection element referring, apparently to the role played by the Medici family, since the time of Cosimo I, in financing the fleet which defeated the Turks in Mediterranean: it’s not wrong to see the irony staged
24 Massey, L., Winter 1997. Anamorphosis Through Descartes or Perspective Gone Awry, in Renaissance Quarterly, Vol. 50, numebr 4. p. 1187.
25 Niceron, J. F., 1638. La perspective curieuse. Paris. p. 72.
26 Ivi. pp. 78-80.
27 Ivi. p. 79.
28 See: Hunt, J. L., Sharp, J., 2009. The Channel Anamorphosis, in Journal of Mathematics and the Arts. Vol. 3. pp. 19-31. The authors agree on the use of the term channel anamorphosis, instead of the less correct definitions in use in ordinary or critical language (which employs improper adjectives as Corrugated, Stockade, Turning Pictures or lenticular).
29 See: Kircher, A., 1646. Ars Magna Lucis et Umbrae. Roma. p. 904.
30 See: Shickman, A., 1977. Turning Pictures in ‘Shakespeare’s England’, in The Art Bulletin. Vol. 59. pp 67-70.
31 Room I, inv. Number: 3196 (700x430x530 mm).

A. DE ROSA: J. F. NICERON: PERSPECTIVE AND ARTIFICIAL MAGIC
THE 5TH ICGG CONFERENCE MONGEOMETRIJA 2016 PROCEEDINGS Belgrade: 23-26 June 2016 265
by this device whose implicit message is that it takes as many as 12 heads Turkish kinhs to make that one of King of France. The most explicit recall, in philosophy, to this optical device is provided by Thomas Hobbes (1588-1679) who in his Leviathan (1651) employs its refractive logic closing the chapter on The rights of sovereigns by institutions. Of the two polyhedral lenses represented in the engraving of plate 23, only the second (the one located to the right, in the drawing indicated with the number LXV) is also provided of the elevation, from which it is possible to derive its plausible spatial configuration. The other (the one represented on the left, in the drawing shown with the number LXIV) must be associated to the next table 25 of the treatise, where Niceron apply the same construction to get through the dioptric recomposition of the 14 busts of many Popes and Fathers of the Church, rotating around the image of Christ, the portrait of Pope Urban VIII: note that the central sacred effigy doesn’t participate in the reconstruction of the image of the latter, and it is also left untouched by the operations of optical deconstruction and reconstruction through the faceted lenses; furthermore, the keys that appear in direct vision in St. Peter’s hands, the Father of the Catholic Church, through the multiple refraction of multifaceted lens ‘migrate' miraculously in the hands of Pope Urban VIII.
Fig. 2. Digital reconstruction of plate number 23r after J. F. Niceron, La Perspective Curieuse, Paris 1638. Digital drawing by A. Bortot/Imago rerum.
The great intelligence and scientific depth that emerges from La Perspective curieuse, combined with his considerable practical and artistic skills, earned to Niceron, from General Father Lawrence of Spezzamo, the appointment as commis of Father François de La Noue32 (or Francesco Lanovio, 1595 - 1670) and, also in 1639, that one as a mathematics professor. With this position, he was sent at SS. Trinità dei Monti monastery in Rome, where he met the erudited brother Emmanuel (or Emanuel) Maignan with whom, as remember by Bonnard, "... he will address, in addition to the specifically ecclesiastical sciences, a thorough study of Hebrew and optics."33 The first Roman stay of Niceron is registered in the convent’s Conclusions Capitulaires, confirming its presence in the pincian complex from May 25, 1639 - the date at which it becomes local and vocal - to March 28, 164034.
32 See: Martin, R.P. C., late XVIII century. Histoire du couvent royal des Minimes français de la très sainte Trinité sur le mont Pincius à Rome. Manuscript of the convent of Trinita dei Monti (Ms. Trin.). p. 325.
33 Bonnard, Mgr. F., 1933. Histoire du couvent royal de la Trinité du Mont Pincio à Rome, A. Picard, Paris. p. 173. R.P. C. Martin (in Histoire du couvent royal des Minimes très français de la Sainte Trinité sur le mont Pincius à Rome, quoted before, p. 324) points out that "These two great men were definitely together for ten months and joined in their mathematical occupations, in the study of the Hebrew language, which was taught to them, and to the other, by a certain Francis hired for this from the community."
34 AGM, XVII century. Livre des Conclusions Capitulaires de ce convent de la S.te Trinitè Du mont (5-X-1620 -26-IX- 1649). (T3). This is also confirmed by R. P. C. Martin (in his Histoire du couvent royal des Minimes très français de la Sainte Trinité sur le mont Pincius à Rome, quoted before, pp. 324 and following).
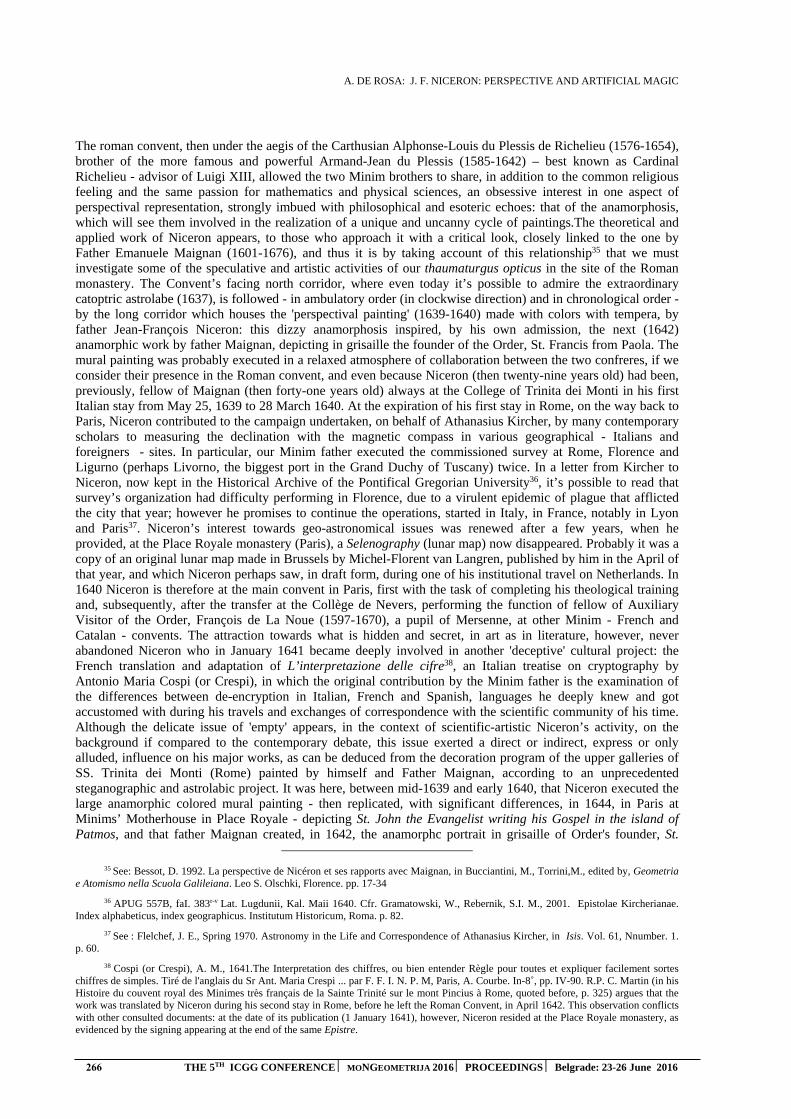
A. DE ROSA: J. F. NICERON: PERSPECTIVE AND ARTIFICIAL MAGIC
266 THE 5TH ICGG CONFERENCE MONGEOMETRIJA 2016 PROCEEDINGS Belgrade: 23-26 June 2016
The roman convent, then under the aegis of the Carthusian Alphonse-Louis du Plessis de Richelieu (1576-1654), brother of the more famous and powerful Armand-Jean du Plessis (1585-1642) – best known as Cardinal Richelieu - advisor of Luigi XIII, allowed the two Minim brothers to share, in addition to the common religious feeling and the same passion for mathematics and physical sciences, an obsessive interest in one aspect of perspectival representation, strongly imbued with philosophical and esoteric echoes: that of the anamorphosis, which will see them involved in the realization of a unique and uncanny cycle of paintings.The theoretical and applied work of Niceron appears, to those who approach it with a critical look, closely linked to the one by Father Emanuele Maignan (1601-1676), and thus it is by taking account of this relationship35 that we must investigate some of the speculative and artistic activities of our thaumaturgus opticus in the site of the Roman monastery. The Convent’s facing north corridor, where even today it’s possible to admire the extraordinary catoptric astrolabe (1637), is followed - in ambulatory order (in clockwise direction) and in chronological order - by the long corridor which houses the 'perspectival painting' (1639-1640) made with colors with tempera, by father Jean-François Niceron: this dizzy anamorphosis inspired, by his own admission, the next (1642) anamorphic work by father Maignan, depicting in grisaille the founder of the Order, St. Francis from Paola. The mural painting was probably executed in a relaxed atmosphere of collaboration between the two confreres, if we consider their presence in the Roman convent, and even because Niceron (then twenty-nine years old) had been, previously, fellow of Maignan (then forty-one years old) always at the College of Trinita dei Monti in his first Italian stay from May 25, 1639 to 28 March 1640. At the expiration of his first stay in Rome, on the way back to Paris, Niceron contributed to the campaign undertaken, on behalf of Athanasius Kircher, by many contemporary scholars to measuring the declination with the magnetic compass in various geographical - Italians and foreigners - sites. In particular, our Minim father executed the commissioned survey at Rome, Florence and Ligurno (perhaps Livorno, the biggest port in the Grand Duchy of Tuscany) twice. In a letter from Kircher to Niceron, now kept in the Historical Archive of the Pontifical Gregorian University36, it’s possible to read that survey’s organization had difficulty performing in Florence, due to a virulent epidemic of plague that afflicted the city that year; however he promises to continue the operations, started in Italy, in France, notably in Lyon and Paris37. Niceron’s interest towards geo-astronomical issues was renewed after a few years, when he provided, at the Place Royale monastery (Paris), a Selenography (lunar map) now disappeared. Probably it was a copy of an original lunar map made in Brussels by Michel-Florent van Langren, published by him in the April of that year, and which Niceron perhaps saw, in draft form, during one of his institutional travel on Netherlands. In 1640 Niceron is therefore at the main convent in Paris, first with the task of completing his theological training and, subsequently, after the transfer at the Collège de Nevers, performing the function of fellow of Auxiliary Visitor of the Order, François de La Noue (1597-1670), a pupil of Mersenne, at other Minim - French and Catalan - convents. The attraction towards what is hidden and secret, in art as in literature, however, never abandoned Niceron who in January 1641 became deeply involved in another 'deceptive' cultural project: the French translation and adaptation of L’interpretazione delle cifre38, an Italian treatise on cryptography by Antonio Maria Cospi (or Crespi), in which the original contribution by the Minim father is the examination of the differences between de-encryption in Italian, French and Spanish, languages he deeply knew and got accustomed with during his travels and exchanges of correspondence with the scientific community of his time. Although the delicate issue of 'empty' appears, in the context of scientific-artistic Niceron’s activity, on the background if compared to the contemporary debate, this issue exerted a direct or indirect, express or only alluded, influence on his major works, as can be deduced from the decoration program of the upper galleries of SS. Trinita dei Monti (Rome) painted by himself and Father Maignan, according to an unprecedented steganographic and astrolabic project. It was here, between mid-1639 and early 1640, that Niceron executed the large anamorphic colored mural painting - then replicated, with significant differences, in 1644, in Paris at Minims’ Motherhouse in Place Royale - depicting St. John the Evangelist writing his Gospel in the island of Patmos, and that father Maignan created, in 1642, the anamorphc portrait in grisaille of Order's founder, St.
35 See: Bessot, D. 1992. La perspective de Nicéron et ses rapports avec Maignan, in Bucciantini, M., Torrini,M., edited by, Geometria e Atomismo nella Scuola Galileiana. Leo S. Olschki, Florence. pp. 17-34
36 APUG 557B, faI. 383r-v Lat. Lugdunii, Kal. Maii 1640. Cfr. Gramatowski, W., Rebernik, S.I. M., 2001. Epistolae Kircherianae. Index alphabeticus, index geographicus. Institutum Historicum, Roma. p. 82.
37 See : Flelchef, J. E., Spring 1970. Astronomy in the Life and Correspondence of Athanasius Kircher, in Isis. Vol. 61, Nnumber. 1. p. 60.
38 Cospi (or Crespi), A. M., 1641.The Interpretation des chiffres, ou bien entender Règle pour toutes et expliquer facilement sortes chiffres de simples. Tiré de l'anglais du Sr Ant. Maria Crespi ... par F. F. I. N. P. M, Paris, A. Courbe. In-8˚, pp. IV-90. R.P. C. Martin (in his Histoire du couvent royal des Minimes très français de la Sainte Trinité sur le mont Pincius à Rome, quoted before, p. 325) argues that the work was translated by Niceron during his second stay in Rome, before he left the Roman Convent, in April 1642. This observation conflicts with other consulted documents: at the date of its publication (1 January 1641), however, Niceron resided at the Place Royale monastery, as evidenced by the signing appearing at the end of the same Epistre.
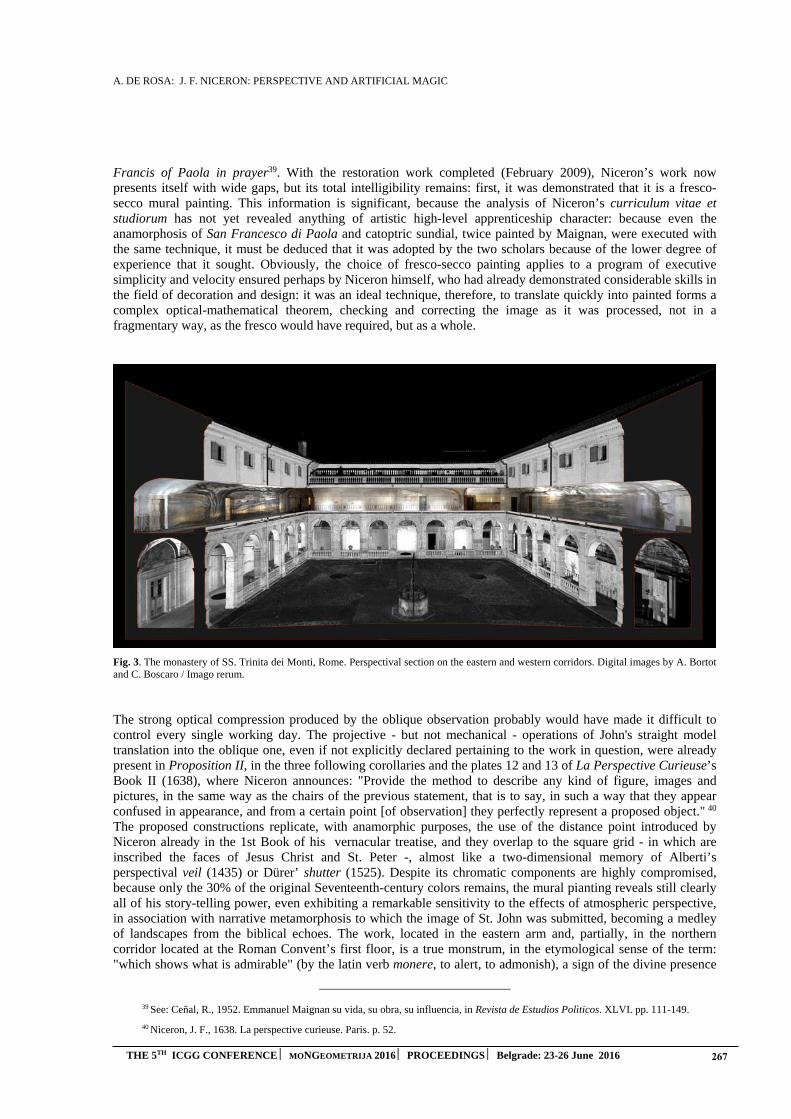
A. DE ROSA: J. F. NICERON: PERSPECTIVE AND ARTIFICIAL MAGIC
THE 5TH ICGG CONFERENCE MONGEOMETRIJA 2016 PROCEEDINGS Belgrade: 23-26 June 2016 267
Francis of Paola in prayer39. With the restoration work completed (February 2009), Niceron’s work now presents itself with wide gaps, but its total intelligibility remains: first, it was demonstrated that it is a fresco-secco mural painting. This information is significant, because the analysis of Niceron’s curriculum vitae et studiorum has not yet revealed anything of artistic high-level apprenticeship character: because even the anamorphosis of San Francesco di Paola and catoptric sundial, twice painted by Maignan, were executed with the same technique, it must be deduced that it was adopted by the two scholars because of the lower degree of experience that it sought. Obviously, the choice of fresco-secco painting applies to a program of executive simplicity and velocity ensured perhaps by Niceron himself, who had already demonstrated considerable skills in the field of decoration and design: it was an ideal technique, therefore, to translate quickly into painted forms a complex optical-mathematical theorem, checking and correcting the image as it was processed, not in a fragmentary way, as the fresco would have required, but as a whole.
Fig. 3. The monastery of SS. Trinita dei Monti, Rome. Perspectival section on the eastern and western corridors. Digital images by A. Bortot and C. Boscaro / Imago rerum.
The strong optical compression produced by the oblique observation probably would have made it difficult to control every single working day. The projective - but not mechanical - operations of John's straight model translation into the oblique one, even if not explicitly declared pertaining to the work in question, were already present in Proposition II, in the three following corollaries and the plates 12 and 13 of La Perspective Curieuse’s Book II (1638), where Niceron announces: "Provide the method to describe any kind of figure, images and pictures, in the same way as the chairs of the previous statement, that is to say, in such a way that they appear confused in appearance, and from a certain point [of observation] they perfectly represent a proposed object." 40 The proposed constructions replicate, with anamorphic purposes, the use of the distance point introduced by Niceron already in the 1st Book of his vernacular treatise, and they overlap to the square grid - in which are inscribed the faces of Jesus Christ and St. Peter -, almost like a two-dimensional memory of Alberti’s perspectival veil (1435) or Dürer’ shutter (1525). Despite its chromatic components are highly compromised, because only the 30% of the original Seventeenth-century colors remains, the mural pianting reveals still clearly all of his story-telling power, even exhibiting a remarkable sensitivity to the effects of atmospheric perspective, in association with narrative metamorphosis to which the image of St. John was submitted, becoming a medley of landscapes from the biblical echoes. The work, located in the eastern arm and, partially, in the northern corridor located at the Roman Convent’s first floor, is a true monstrum, in the etymological sense of the term: "which shows what is admirable" (by the latin verb monere, to alert, to admonish), a sign of the divine presence
39 See: Ceñal, R., 1952. Emmanuel Maignan su vida, su obra, su influencia, in Revista de Estudios Polìticos. XLVI. pp. 111-149.
40 Niceron, J. F., 1638. La perspective curieuse. Paris. p. 52.

A. DE ROSA: J. F. NICERON: PERSPECTIVE AND ARTIFICIAL MAGIC
268 THE 5TH ICGG CONFERENCE MONGEOMETRIJA 2016 PROCEEDINGS Belgrade: 23-26 June 2016
and a wonder which seems to violate the laws of nature, but which also serves as a reassuring or disturbing memento to the observer and the faithful. A large olive tree stands on the corridor, extending itself on the barrel vault, and overhanging St. John who is leaning on the volume about whose pages he’s writing, thanks to a quill (which, viewed from the front, becomes a waterfall), the fourth Gospel or the Apocalypse, although the latter hypothesis seems more plausible, for admission of Niceron himslef. The anamorphosis is properly viewed from a station point located in the south-west, thus close to the beginning of the next corridor that hosts it, not far from the area where now the chapel dedicated to Mater Admirabilis is located. From the digital checks made by me and my team, it is clear that this punctum optimum is symmetrical respect the one expected in the western corridor, for the right observation of St. Francis of Paola. It is therefore probable, in accordance with the history of their works, that Niceron first has influenced Maignan’s choices, not only in the projective setting, but also the configuration of the work’s stage, both paintings being strongly affected by the presence of trees that surround the two portrayed saints. In addition, another tree, but broken and burned (as in the other anamorphosis!), emerges behind the San Giovanni’s body: from its inside, but in the front view, the beholder perceive the image of a burning city (Babylon?), as didactically recalls the engraved inscription very close - AP VIII (Apocalypse, chapter 8, 1-7) – above which hovers an angel playing the trumpet. On the open page of the book supported by St. John’s holy knees, seen frontally, images of animals appear to the viewer such as dispersed in a plowed field, whose furrows spread radially, anamorphosis of the lines hand-penned by the Evangelist. The (human or monstrous) figures are portrayed with discretion, so minute and accurate, and always choosing the tonally next to the background color which hosts it, and so they disappear when viewed obliquely as suggested by Niceron himslef. The same is true for other figures, today only partially recognizable - human bodies which flee, a ruddy and horned devil, others flying angels -, or suggestive landscape elements - rivers, lakes and waterfalls, forests, palm trees and exotic flowers -, which reveal themselves only under a detailed and direct vision: well hidden in the scarlet cloak of St. John – with its progressively darkening tone, moving away from the point of the eye - you should conceal the apocalyptic harvest mentioned in AP XIV (18-20), while in his facial features it seems to recognize the vat from which, as it is said, will flow the river of correlated blood (which is the scarlet cloak of the Saint). Still a heraldic animal populates one of the dry branches of the great backdrop tree: it is an owl, reminiscent of the issue of Babylon’s destruction to which we have already alluded, and here anticipated in subliminal form. Symbolic is also the role of the two birds which sit on the top of barrel vault’s spring line: the largest one, a dove - allusive to the Holy Spirit -, hovers in the air, and on it a serpent - tempter of humanity - leans into space, partially coiled in a frond; the smaller volatile, a sparrow, sits at the lower branch, symbolizing the celestial world that is opposed to the terrestrial, again embodied by the tempter reptile. As recalled by Niceron in his Thaumaturgus Opticus, the mural painting also provided, along the shortened volume’s spine, a long inscription in ancient Greek which reads as follows: "The Apocalypse of Optics, the Eyewitness of Apocalypse." 41 The reference is clearly to the detector power (apokalypsis means revelation) implied on the one hand in the anamorphical magic of the work - which displays its contents only when viewed from a specific point of view, geometrically and spatially constrained -, and the other in the theological role played by St. John, alone among humans to have eyes so sharp to be able to contemplate the True Light of the Word: the eagle, theriomorphic attribute of the Evangelist, is the only living being able to soar so high in the sky to see direct sunlight without becoming blind. Niceron portrays it in foreshortening, next to the Saint, in a very advanced position: its beaked head and one of its spread wings (the other, falling in flawed area of mural painting, is lost) become, when viewed frontally, the backgrounds of a biblical landscape over which a declining sun is obscured by thick smoke, a prelude to the Parousia. Perhaps the choice of such an atypical subject (for Niceron’s mural painting) is to be found in this critical juncture: not being object of special veneration by the French Minims, St. John’s figure must have been chosen for its complex ethical-philosophical level, on the one hand able to bring the word Logos (greek for verb) to God, thus reconciling the Christian culture with a Jewish-Hellenistic vision of the world; and on the other for the absence of deliberate abstraction that characterized his testimony of faith, he referring in his Gospel only to "...what we have heard, which we have seen with our eyes, what we beheld, and what our hands have touched ... life was made manifest." Thus he was the eye witness of the living Logos, epithet with which John loved to be defined (First Epistle of John), as well as the Minims fathers, contemporaries of Niceron’s pictorial work, were the first eyewitnesses of anamorphosis’ scopic catastrophè, startled and then reassured by its continued optical composing and decomposing. But in this act of witness, assigned by Niceron to the opticery of his painting, it still seems possible to see an item attributable to the Cartesian speculation. It is perhaps to this cultural environment that it has to be ascribed the Latin inscription that adorns the pendant cartouche from one of the branches placed over the back of St. John, where we read: "CITRA
41 Niceron, J. F., 1646. Thaumaturgus Opticus. Paris. p. 177.
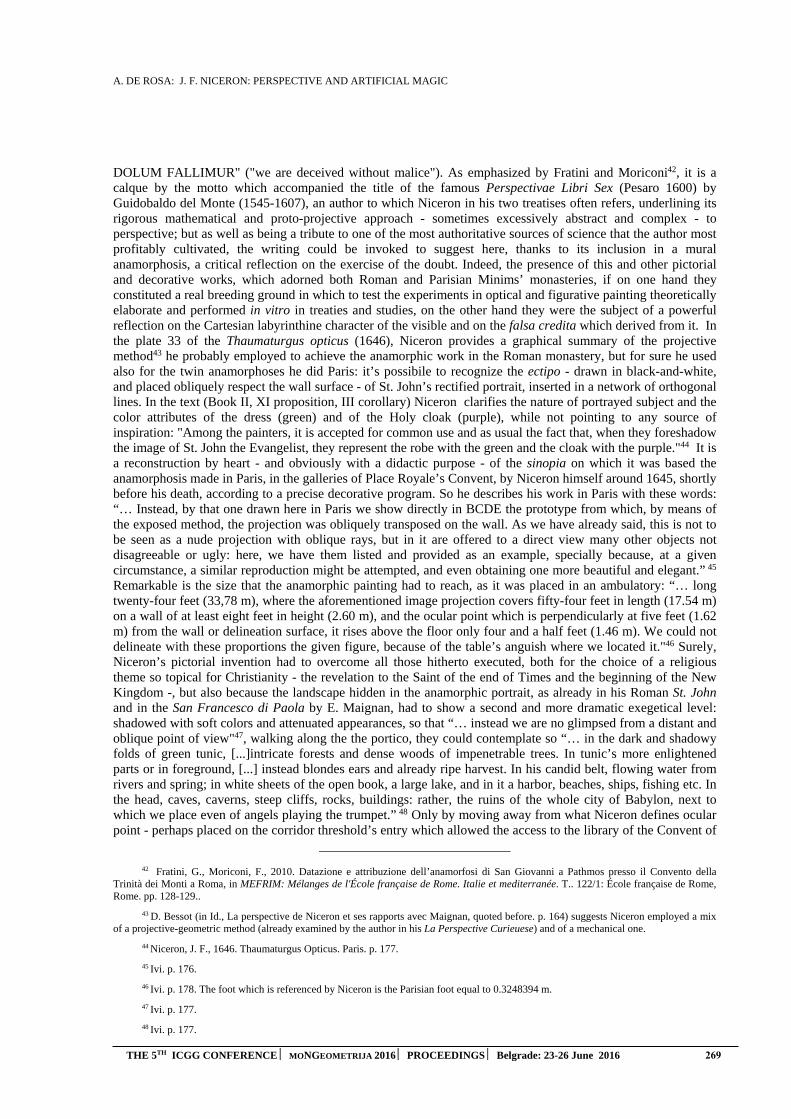
A. DE ROSA: J. F. NICERON: PERSPECTIVE AND ARTIFICIAL MAGIC
THE 5TH ICGG CONFERENCE MONGEOMETRIJA 2016 PROCEEDINGS Belgrade: 23-26 June 2016 269
DOLUM FALLIMUR" ("we are deceived without malice"). As emphasized by Fratini and Moriconi42, it is a calque by the motto which accompanied the title of the famous Perspectivae Libri Sex (Pesaro 1600) by Guidobaldo del Monte (1545-1607), an author to which Niceron in his two treatises often refers, underlining its rigorous mathematical and proto-projective approach - sometimes excessively abstract and complex - to perspective; but as well as being a tribute to one of the most authoritative sources of science that the author most profitably cultivated, the writing could be invoked to suggest here, thanks to its inclusion in a mural anamorphosis, a critical reflection on the exercise of the doubt. Indeed, the presence of this and other pictorial and decorative works, which adorned both Roman and Parisian Minims’ monasteries, if on one hand they constituted a real breeding ground in which to test the experiments in optical and figurative painting theoretically elaborate and performed in vitro in treaties and studies, on the other hand they were the subject of a powerful reflection on the Cartesian labyrinthine character of the visible and on the falsa credita which derived from it. In the plate 33 of the Thaumaturgus opticus (1646), Niceron provides a graphical summary of the projective method43 he probably employed to achieve the anamorphic work in the Roman monastery, but for sure he used also for the twin anamorphoses he did Paris: it’s possibile to recognize the ectipo - drawn in black-and-white, and placed obliquely respect the wall surface - of St. John’s rectified portrait, inserted in a network of orthogonal lines. In the text (Book II, XI proposition, III corollary) Niceron clarifies the nature of portrayed subject and the color attributes of the dress (green) and of the Holy cloak (purple), while not pointing to any source of inspiration: "Among the painters, it is accepted for common use and as usual the fact that, when they foreshadow the image of St. John the Evangelist, they represent the robe with the green and the cloak with the purple."44 It is a reconstruction by heart - and obviously with a didactic purpose - of the sinopia on which it was based the anamorphosis made in Paris, in the galleries of Place Royale’s Convent, by Niceron himself around 1645, shortly before his death, according to a precise decorative program. So he describes his work in Paris with these words: “… Instead, by that one drawn here in Paris we show directly in BCDE the prototype from which, by means of the exposed method, the projection was obliquely transposed on the wall. As we have already said, this is not to be seen as a nude projection with oblique rays, but in it are offered to a direct view many other objects not disagreeable or ugly: here, we have them listed and provided as an example, specially because, at a given circumstance, a similar reproduction might be attempted, and even obtaining one more beautiful and elegant.” 45 Remarkable is the size that the anamorphic painting had to reach, as it was placed in an ambulatory: “… long twenty-four feet (33,78 m), where the aforementioned image projection covers fifty-four feet in length (17.54 m) on a wall of at least eight feet in height (2.60 m), and the ocular point which is perpendicularly at five feet (1.62 m) from the wall or delineation surface, it rises above the floor only four and a half feet (1.46 m). We could notdelineate with these proportions the given figure, because of the table’s anguish where we located it."46 Surely, Niceron’s pictorial invention had to overcome all those hitherto executed, both for the choice of a religious theme so topical for Christianity - the revelation to the Saint of the end of Times and the beginning of the New Kingdom -, but also because the landscape hidden in the anamorphic portrait, as already in his Roman St. John and in the San Francesco di Paola by E. Maignan, had to show a second and more dramatic exegetical level: shadowed with soft colors and attenuated appearances, so that “… instead we are no glimpsed from a distant and oblique point of view"47, walking along the the portico, they could contemplate so “… in the dark and shadowy folds of green tunic, [...]intricate forests and dense woods of impenetrable trees. In tunic’s more enlightened parts or in foreground, [...] instead blondes ears and already ripe harvest. In his candid belt, flowing water from rivers and spring; in white sheets of the open book, a large lake, and in it a harbor, beaches, ships, fishing etc. In the head, caves, caverns, steep cliffs, rocks, buildings: rather, the ruins of the whole city of Babylon, next to which we place even of angels playing the trumpet.” 48 Only by moving away from what Niceron defines ocular point - perhaps placed on the corridor threshold’s entry which allowed the access to the library of the Convent of
42 Fratini, G., Moriconi, F., 2010. Datazione e attribuzione dell’anamorfosi di San Giovanni a Pathmos presso il Convento della Trinità dei Monti a Roma, in MEFRIM: Mélanges de l'École française de Rome. Italie et mediterranée. T.. 122/1: École française de Rome, Rome. pp. 128-129..
43 D. Bessot (in Id., La perspective de Niceron et ses rapports avec Maignan, quoted before. p. 164) suggests Niceron employed a mix of a projective-geometric method (already examined by the author in his La Perspective Curieuese) and of a mechanical one.
44 Niceron, J. F., 1646. Thaumaturgus Opticus. Paris. p. 177.
45 Ivi. p. 176.
46 Ivi. p. 178. The foot which is referenced by Niceron is the Parisian foot equal to 0.3248394 m.
47 Ivi. p. 177.
48 Ivi. p. 177.
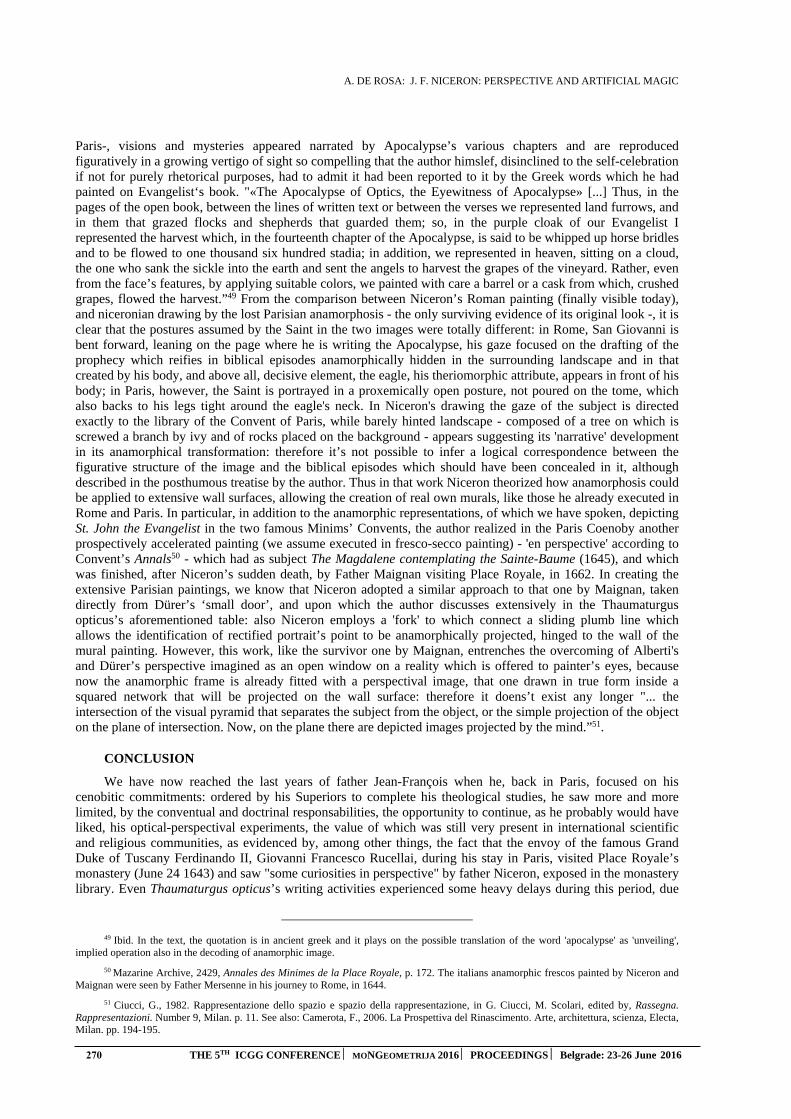
A. DE ROSA: J. F. NICERON: PERSPECTIVE AND ARTIFICIAL MAGIC
270 THE 5TH ICGG CONFERENCE MONGEOMETRIJA 2016 PROCEEDINGS Belgrade: 23-26 June 2016
Paris-, visions and mysteries appeared narrated by Apocalypse’s various chapters and are reproduced figuratively in a growing vertigo of sight so compelling that the author himslef, disinclined to the self-celebration if not for purely rhetorical purposes, had to admit it had been reported to it by the Greek words which he had painted on Evangelist‘s book. "«The Apocalypse of Optics, the Eyewitness of Apocalypse» [...] Thus, in the pages of the open book, between the lines of written text or between the verses we represented land furrows, and in them that grazed flocks and shepherds that guarded them; so, in the purple cloak of our Evangelist I represented the harvest which, in the fourteenth chapter of the Apocalypse, is said to be whipped up horse bridles and to be flowed to one thousand six hundred stadia; in addition, we represented in heaven, sitting on a cloud, the one who sank the sickle into the earth and sent the angels to harvest the grapes of the vineyard. Rather, even from the face’s features, by applying suitable colors, we painted with care a barrel or a cask from which, crushed grapes, flowed the harvest.”49 From the comparison between Niceron’s Roman painting (finally visible today), and niceronian drawing by the lost Parisian anamorphosis - the only surviving evidence of its original look -, it is clear that the postures assumed by the Saint in the two images were totally different: in Rome, San Giovanni is bent forward, leaning on the page where he is writing the Apocalypse, his gaze focused on the drafting of the prophecy which reifies in biblical episodes anamorphically hidden in the surrounding landscape and in that created by his body, and above all, decisive element, the eagle, his theriomorphic attribute, appears in front of his body; in Paris, however, the Saint is portrayed in a proxemically open posture, not poured on the tome, which also backs to his legs tight around the eagle's neck. In Niceron's drawing the gaze of the subject is directed exactly to the library of the Convent of Paris, while barely hinted landscape - composed of a tree on which is screwed a branch by ivy and of rocks placed on the background - appears suggesting its 'narrative' development in its anamorphical transformation: therefore it’s not possible to infer a logical correspondence between the figurative structure of the image and the biblical episodes which should have been concealed in it, although described in the posthumous treatise by the author. Thus in that work Niceron theorized how anamorphosis could be applied to extensive wall surfaces, allowing the creation of real own murals, like those he already executed in Rome and Paris. In particular, in addition to the anamorphic representations, of which we have spoken, depicting St. John the Evangelist in the two famous Minims’ Convents, the author realized in the Paris Coenoby another prospectively accelerated painting (we assume executed in fresco-secco painting) - 'en perspective' according to Convent’s Annals50 - which had as subject The Magdalene contemplating the Sainte-Baume (1645), and which was finished, after Niceron’s sudden death, by Father Maignan visiting Place Royale, in 1662. In creating the extensive Parisian paintings, we know that Niceron adopted a similar approach to that one by Maignan, taken directly from Dürer’s ‘small door’, and upon which the author discusses extensively in the Thaumaturgus opticus’s aforementioned table: also Niceron employs a 'fork' to which connect a sliding plumb line which allows the identification of rectified portrait’s point to be anamorphically projected, hinged to the wall of the mural painting. However, this work, like the survivor one by Maignan, entrenches the overcoming of Alberti's and Dürer’s perspective imagined as an open window on a reality which is offered to painter’s eyes, because now the anamorphic frame is already fitted with a perspectival image, that one drawn in true form inside a squared network that will be projected on the wall surface: therefore it doens’t exist any longer "... the intersection of the visual pyramid that separates the subject from the object, or the simple projection of the object on the plane of intersection. Now, on the plane there are depicted images projected by the mind.”51.
CONCLUSION
We have now reached the last years of father Jean-François when he, back in Paris, focused on his cenobitic commitments: ordered by his Superiors to complete his theological studies, he saw more and more limited, by the conventual and doctrinal responsabilities, the opportunity to continue, as he probably would have liked, his optical-perspectival experiments, the value of which was still very present in international scientific and religious communities, as evidenced by, among other things, the fact that the envoy of the famous Grand Duke of Tuscany Ferdinando II, Giovanni Francesco Rucellai, during his stay in Paris, visited Place Royale’s monastery (June 24 1643) and saw "some curiosities in perspective" by father Niceron, exposed in the monastery library. Even Thaumaturgus opticus’s writing activities experienced some heavy delays during this period, due
49 Ibid. In the text, the quotation is in ancient greek and it plays on the possible translation of the word 'apocalypse' as 'unveiling', implied operation also in the decoding of anamorphic image.
50 Mazarine Archive, 2429, Annales des Minimes de la Place Royale, p. 172. The italians anamorphic frescos painted by Niceron and Maignan were seen by Father Mersenne in his journey to Rome, in 1644.
51 Ciucci, G., 1982. Rappresentazione dello spazio e spazio della rappresentazione, in G. Ciucci, M. Scolari, edited by, Rassegna. Rappresentazioni. Number 9, Milan. p. 11. See also: Camerota, F., 2006. La Prospettiva del Rinascimento. Arte, architettura, scienza, Electa, Milan. pp. 194-195.
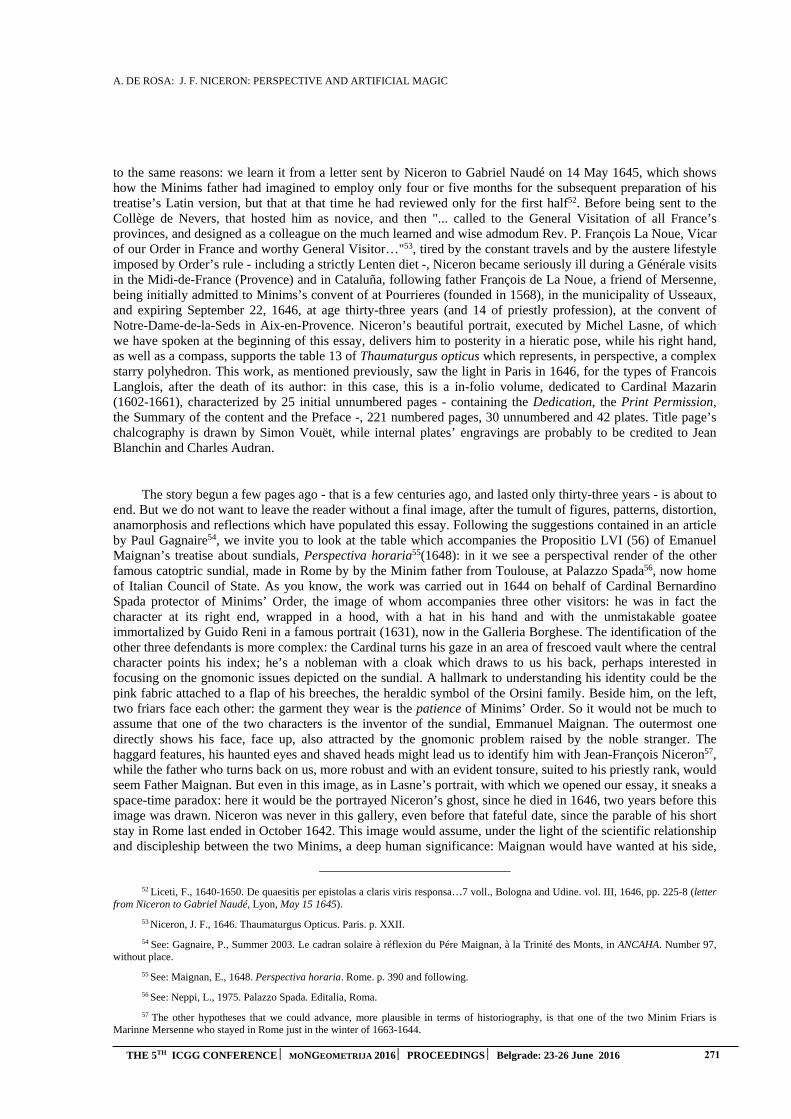
A. DE ROSA: J. F. NICERON: PERSPECTIVE AND ARTIFICIAL MAGIC
THE 5TH ICGG CONFERENCE MONGEOMETRIJA 2016 PROCEEDINGS Belgrade: 23-26 June 2016 271
to the same reasons: we learn it from a letter sent by Niceron to Gabriel Naudé on 14 May 1645, which shows how the Minims father had imagined to employ only four or five months for the subsequent preparation of his treatise’s Latin version, but that at that time he had reviewed only for the first half52. Before being sent to the Collège de Nevers, that hosted him as novice, and then "... called to the General Visitation of all France’s provinces, and designed as a colleague on the much learned and wise admodum Rev. P. François La Noue, Vicar of our Order in France and worthy General Visitor…"53, tired by the constant travels and by the austere lifestyle imposed by Order’s rule - including a strictly Lenten diet -, Niceron became seriously ill during a Générale visits in the Midi-de-France (Provence) and in Cataluña, following father François de La Noue, a friend of Mersenne, being initially admitted to Minims’s convent of at Pourrieres (founded in 1568), in the municipality of Usseaux, and expiring September 22, 1646, at age thirty-three years (and 14 of priestly profession), at the convent of Notre-Dame-de-la-Seds in Aix-en-Provence. Niceron’s beautiful portrait, executed by Michel Lasne, of which we have spoken at the beginning of this essay, delivers him to posterity in a hieratic pose, while his right hand, as well as a compass, supports the table 13 of Thaumaturgus opticus which represents, in perspective, a complex starry polyhedron. This work, as mentioned previously, saw the light in Paris in 1646, for the types of Francois Langlois, after the death of its author: in this case, this is a in-folio volume, dedicated to Cardinal Mazarin (1602-1661), characterized by 25 initial unnumbered pages - containing the Dedication, the Print Permission, the Summary of the content and the Preface -, 221 numbered pages, 30 unnumbered and 42 plates. Title page’s chalcography is drawn by Simon Vouët, while internal plates’ engravings are probably to be credited to Jean Blanchin and Charles Audran.
The story begun a few pages ago - that is a few centuries ago, and lasted only thirty-three years - is about to end. But we do not want to leave the reader without a final image, after the tumult of figures, patterns, distortion, anamorphosis and reflections which have populated this essay. Following the suggestions contained in an article by Paul Gagnaire54, we invite you to look at the table which accompanies the Propositio LVI (56) of Emanuel Maignan’s treatise about sundials, Perspectiva horaria55(1648): in it we see a perspectival render of the other famous catoptric sundial, made in Rome by by the Minim father from Toulouse, at Palazzo Spada56, now home of Italian Council of State. As you know, the work was carried out in 1644 on behalf of Cardinal Bernardino Spada protector of Minims’ Order, the image of whom accompanies three other visitors: he was in fact the character at its right end, wrapped in a hood, with a hat in his hand and with the unmistakable goatee immortalized by Guido Reni in a famous portrait (1631), now in the Galleria Borghese. The identification of the other three defendants is more complex: the Cardinal turns his gaze in an area of frescoed vault where the central character points his index; he’s a nobleman with a cloak which draws to us his back, perhaps interested in focusing on the gnomonic issues depicted on the sundial. A hallmark to understanding his identity could be the pink fabric attached to a flap of his breeches, the heraldic symbol of the Orsini family. Beside him, on the left, two friars face each other: the garment they wear is the patience of Minims’ Order. So it would not be much to assume that one of the two characters is the inventor of the sundial, Emmanuel Maignan. The outermost one directly shows his face, face up, also attracted by the gnomonic problem raised by the noble stranger. The haggard features, his haunted eyes and shaved heads might lead us to identify him with Jean-François Niceron57, while the father who turns back on us, more robust and with an evident tonsure, suited to his priestly rank, would seem Father Maignan. But even in this image, as in Lasne’s portrait, with which we opened our essay, it sneaks a space-time paradox: here it would be the portrayed Niceron’s ghost, since he died in 1646, two years before this image was drawn. Niceron was never in this gallery, even before that fateful date, since the parable of his short stay in Rome last ended in October 1642. This image would assume, under the light of the scientific relationship and discipleship between the two Minims, a deep human significance: Maignan would have wanted at his side,
52 Liceti, F., 1640-1650. De quaesitis per epistolas a claris viris responsa…7 voll., Bologna and Udine. vol. III, 1646, pp. 225-8 (letter from Niceron to Gabriel Naudé, Lyon, May 15 1645).
53 Niceron, J. F., 1646. Thaumaturgus Opticus. Paris. p. XXII.
54 See: Gagnaire, P., Summer 2003. Le cadran solaire à réflexion du Pére Maignan, à la Trinité des Monts, in ANCAHA. Number 97, without place.
55 See: Maignan, E., 1648. Perspectiva horaria. Rome. p. 390 and following.
56 See: Neppi, L., 1975. Palazzo Spada. Editalia, Roma.
57 The other hypotheses that we could advance, more plausible in terms of historiography, is that one of the two Minim Friars is Marinne Mersenne who stayed in Rome just in the winter of 1663-1644.

A. DE ROSA: J. F. NICERON: PERSPECTIVE AND ARTIFICIAL MAGIC
272 THE 5TH ICGG CONFERENCE MONGEOMETRIJA 2016 PROCEEDINGS Belgrade: 23-26 June 2016
even for once, even if only in an image, the friend with whom he had shared academic and theological reflections, decorative projects and wonderful visions hidden in the body of the artificial magic.
IOANNES FRANCISCVS NICERONVS. SENSIS NOVA NVNC RARE CONFICI
REFERENCES
1. Baltrušaitis, J., 1984 (italian version). Anamorfosi o Thaumaturgus Opticus. Adelphi, Milan.
2. Baltrušaitis, J., 2007 (italian version). Lo specchio. Rivelazioni, inganni e science-fiction. Adelphi,Milan.
3. Bessot, D., 2005. Synthèse et développement de techniques d'anamorphoses au XVIIe siècle : lestraités du pére Jean-François Niceron, in MEFRIM: Mélanges de l'École française de Rome. Italie etmediterranée. Vol. 117, 1, Rome.
4. D’Acunto, G., April–June 2006. Jean-François Nicéron's Thaumaturgus opticus: between scientificprecision and natural magic, in Bollettino Ufficiale dell’Ordine dei Minimi. Number 2, year LII.
5. De Rosa, A., 2006. The Optik's Apocalipse. The twin anamorphosis by Emmanuel Maignan and Jean-François Nicéron, in Ikhnos. Lombardi. Siracusa.
6. De Rosa, A., Bortot, A., Boscaro, C., Monteleone, C., Trevisan, E., 2012. Memory and oblivion.Discovery and digital survey of J.-F. Niceron's mural anamorphosis, in Acts of XVI ASITA NationalConference, Vicenza.
7. De Rosa, A., D'Acunto, G., 2002. La vertigine dello sguardo. Saggi sulla rappresentazioneanamorfica. Cafoscarina, Venezia.
8. De Rosa, A., edited by, 2013. Jean François Nicéron. Perspective, Catoptric and Artificial Magic, withcritical editions of La Perspective Curieuse (Paris 1638) and of the Thaumaturgus Opticus (Paris1646). Aracne edizioni, Rome.
9. Fratini, G., Moriconi, F., Datazione e attribuzione dell’anamorfosi di San Giovanni a Pathmos pressoil Convento della Trinità dei Monti a Roma, in “MEFRIM: Mélanges de l'École française de Rome.Italie et mediterranée”, t. 122/1, École française de Rome, Roma 2010.
10. Massey, L., 2007. Picturing space, displacing bodies. Anamorphosis in Early Modern Theories ofPerspective. Pennsylvania State University Press, University Park.
10. Rizzini, I., October–December 2004. Jean-François Nicéron's Thaumaturgus opticus: notes ontranslation from Latin, in Bollettino Ufficiale dell’Ordine dei Minimi. Number 4, year LI.
11. Whitmore, P. J. S., 1967. The Order of Minims in Seventeenth-Century France. Springer, The Hague.
Department of Architecture and Urbanism, Faculty of Technical Sciences, University of Novi Sad, Serbia, PhD, Assistant Professor, [email protected]
Department of Architecture and Urbanism, Faculty of Technical Sciences, University of Novi Sad, Serbia, PhD, Full Professor, [email protected]
Department of Architecture and Urbanism, Faculty of Technical Sciences, University of Novi Sad, Serbia, M.Arch., Teaching Assistant [email protected]
ABSTRACT
The Geometry and Visualization of 3D Space presents an obligatory fundamental course students take during the first year of bachelor studies of Animation in Engineering at the Faculty of Technical Sciences, University of Novi Sad, Serbia. It primarily relies on teaching descriptive geometry, optimized in the sense of its most important learning outcome, which is development of spatial visualization ability and amelioration, and deprived of unnecessary construction methods that were widely used in the past. This paper examines the imperatives and guidelines used while creating course’s content and teaching methodology and adjusting them to the curriculum of the study program and its general and specific educational outcomes. In order to illustrate the results of this process, the comparison with the courses of Descriptive Geometry 1 (DG1) and Descriptive Geometry 2 (DG2) on the study program of Architecture and Urbanism was used.
2.2.1. Mutual Requirements of Fundamental Courses Taught During the First Year of Academic Studies
et al
i.e
2.2.2. Development of Spatial Reasoning
et al
2.2.3. Reformed Teaching Methodology
et al
i.e
et al et al
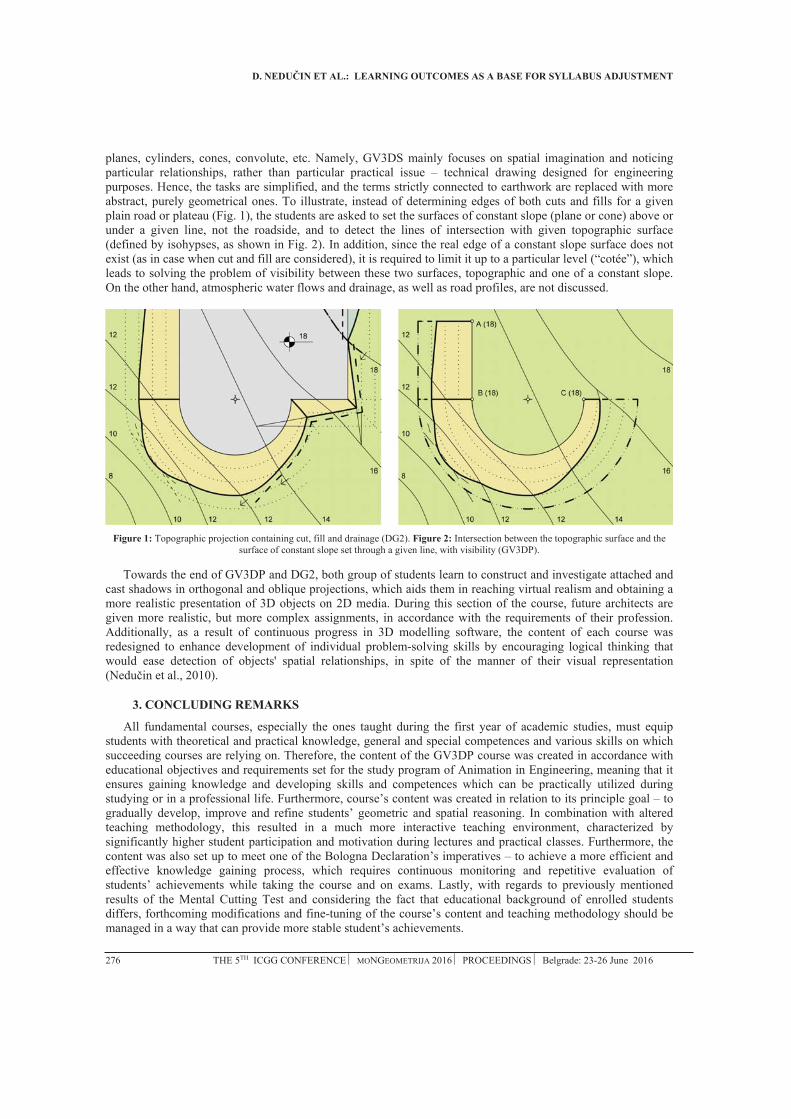

FactaUniversitatis
Pollack Periodica - International Journal for Engineering and Information Sciences
Transactions ofFAMENA
Journal for Geometry and Graphics,
LJ. PETRUSEVSKI ET AL.: MODELING OF FOCAL-DIRECTORIAL SURFACES FOR APPLICATION IN ARCHITECTURE
THE 5TH ICGG CONFERENCE MONGEOMETRIJA 2016 PROCEEDINGS Belgrade: 23-26 June 2016 278
MODELING OF FOCAL-DIRECTORIAL SURFACES FOR APPLICATION IN ARCHITECTURE
Ljiljana Petrusevski
University of Belgrade - Faculty of Architecture, Belgrade, Serbia PhD., Full Professor, [email protected]
Maja Petrovic
University of Belgrade - Faculty of Transport and Traffic Engineering, Belgrade, Serbia MSc., Assistant, [email protected]
Mirjana Devetakovic
University of Belgrade - Faculty of Architecture, Belgrade, Serbia PhD., Assistant Professor, [email protected]
Jelena Ivanovic
University of Belgrade - Faculty of Architecture, Belgrade, Serbia MSc., Teaching Assistant, [email protected]
ABSTRACT
The theme of this paper is the modeling of focal-directorial surfaces, starting with their definition, as a locus of points whose sum of the distances to the focus and/or directrix is constant and predefined. We presented a heuristic algorithm for modeling surfaces and their isocurves, achieved through the use of the Grasshopper visual programming editor in the RhinoCeros environment. Surfaces and their isocurves were generated in a spherical grid, because a Cartesian grid proved unsuitable for the task and the chosen approach. This paper additionally proposes a modeling algorithm of a discrete variation of focal-directorial surfaces. The proposed modeling method is a 3D convex hull implemented on a set of surface points, with the selected points close to that surface. The discrete model is realized both in a Cartesian and spherical grid. There are significant differences between the obtained results.
Keywords: focal-directorial surfaces, modeling, parametric model, surface discretization, 3D convex hull
INTRODUCTION
Due to the development of new technologies, primarily construction technologies and new structural systems, but also because of the rapid progress in the development of computer technology, architectural objects of the 21st century are getting increasingly complex geometric shapes. Traditional orthogonal system is no longer dominant, on the contrary, free, curved forms or parametrically designed shapes are going through an expansion in architectural and urban design.
We can observe a faster development of geometry as a science related to current trends in architectural and urban design. Constructive processing of geometric surfaces is facilitated through the use of modern software, although, the opposite also applies, we have an increased application of constructive procedures for the formation of new 2D and 3D elements (curves and surfaces) in most graphic software, [2], [7], [8], [10], [12].
The theme of this paper is the modeling of focal-directorial surfaces, starting with their definition, [1] and [5], as a locus of points whose sum of the distances S to the focus and/or directrix is constant and predefined. We will not delve into the problem of the generation and usage of implicit equations that describe them mathematically. We presented a heuristic algorithm for modeling surfaces and their isocurves, achieved through the use of the Grasshopper visual programming editor in the RhinoCeros environment, [4]. To speed things up, all tests were first carried out in the programming language Processing, [9] and [11].

LJ. PETRUSEVSKI ET AL.: MODELING OF FOCAL-DIRECTORIAL SURFACES FOR APPLICATION IN ARCHITECTURE
279 THE 5TH ICGG CONFERENCE MONGEOMETRIJA 2016 PROCEEDINGS Belgrade: 23-26 June 2016
Surfaces and their isocurves were generated in a spherical grid, because a Cartesian grid proved unsuitable for the task and the chosen approach. We selected grid points whose sum of distances to the focus and the directrix is within the limits of the predefined absolute error as surface points. As the spherical grid points are distributed in a radial fashion, it turned out that each spoke contains several points for the adopted small step value, so we made an additional improvement – selecting the point with the fewest error between all those points. Isocurves are curves that pass through appropriate points, whereas the surface is a loft passing through one of two sets of isocurves.
Surface discretization is a step in the right direction when it comes to applied architecture, [7] and [10]. This paper additionally proposes a modeling algorithm of a discrete variation of focal-directorial surfaces. The proposed modeling method is a 3D convex hull implemented on a set of surface points, with the selected points close to that surface. The discrete model is realized both in a Cartesian and spherical grid. There are significant differences between the obtained results. The result of algorithm application in the spherical grid is basically a triangular mesh, and in the case of the Cartesian grid, through step variation in the grid and the allowed deviation from the surface, we get varied polyhedral structures as discrete models of the same focal-directorial surface.
The objective of this paper is not to select surfaces suitable for use in architecture, instead, we chose examples that clearly illustrate the content of the paper. Graphic, visual preview of the modeled surface is given in top view, front view and right view, because perspective view alone would not be sufficient to properly view the model.
2. MODELING ALGORITHM OF A FOCAL-DIRECTORIAL SURFACES
The basic idea of this heuristic algorithm is to define a discrete spherical coordinate system – spherical
grid. Each point on the grid is defined with spherical coordinates kji r,, , 20 i,
22
j
,
Rrk 0 where R should be a large enough value so the surface would be within the grid, and the grid itself
is set as a local coordinate system with the coordinate origin within the surface.
Angles j are the points of division in the division of angle to m parts, so mj 0 ,2
0
and
2
m
.
To maintain the same step, angles i are the points of division in the division of angle 2 to m2 parts, so
mi 20 , 00 , 22 m.
The third set of coordinates kr are the points of division of the interval R,0 to n parts, where nk , 00 r ,
Rrn and number n should be large enough to ensure a sufficiently small step for the predefined accuracy.
For fixed i and
j , points kji r,, , nk 0 belong to the ray that penetrates the surface. In this point of
penetration, the sum of distances to the focus and directrix equals the defined value S which defines the surface together with the focuses and directrices. The basic idea is to select a point on the spherical grid closest to the point of penetration, in other words, a grid point whose sum of distances to the focus and directrix is closest to the defined value S. However, one should be careful and make sure that this difference falls within the limits of the predefined absolute or relative error.
Therefore, the procedure should be carried out in two steps. In the first step, for every selected fixed value i
and j , we should select points kji r,, from the corresponding ray, whose sum of distances to the focus and
directrix is within the limits of the permitted error. For each properly selected step, i.e. for each sufficiently large n, we get a number of such points. From the standpoint of permitted error, each of these points would be a good solution, in other words, each of them could be accepted as a surface point.
However, the following step further improves accuracy. Among all these points, we selected the “best”, a point
jiij PP , , with the smallest error. This selection is realized in Processing with the use of an algorithm for
finding the smallest member, and in Grasshopper, using the available sorting of the error array while simultaneously sorting points.
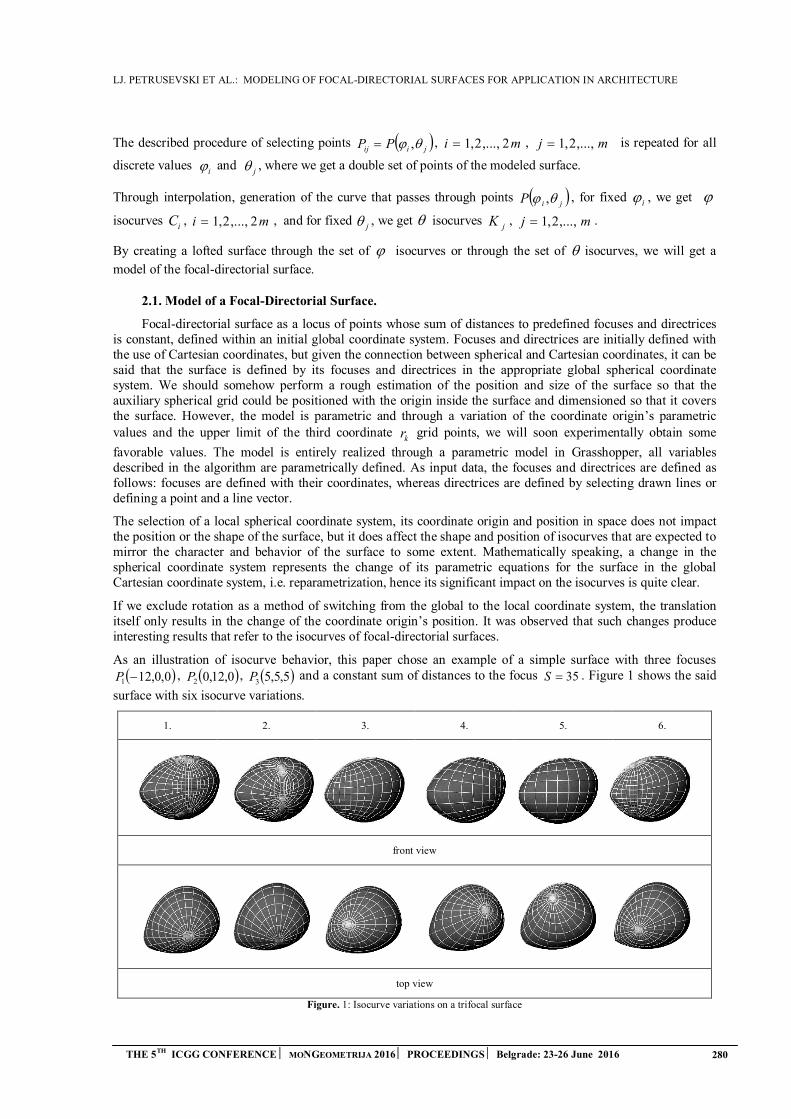
LJ. PETRUSEVSKI ET AL.: MODELING OF FOCAL-DIRECTORIAL SURFACES FOR APPLICATION IN ARCHITECTURE
THE 5TH ICGG CONFERENCE MONGEOMETRIJA 2016 PROCEEDINGS Belgrade: 23-26 June 2016 280
The described procedure of selecting points jiij PP , , mi 2,...,2,1 , mj ,...,2,1 is repeated for all
discrete values i and
j , where we get a double set of points of the modeled surface.
Through interpolation, generation of the curve that passes through points jiP , , for fixed i , we get
isocurves iC , mi 2,...,2,1 , and for fixed
j , we get isocurves jK , mj ,...,2,1 .
By creating a lofted surface through the set of isocurves or through the set of isocurves, we will get a
model of the focal-directorial surface.
2.1. Model of a Focal-Directorial Surface.
Focal-directorial surface as a locus of points whose sum of distances to predefined focuses and directrices is constant, defined within an initial global coordinate system. Focuses and directrices are initially defined with the use of Cartesian coordinates, but given the connection between spherical and Cartesian coordinates, it can be said that the surface is defined by its focuses and directrices in the appropriate global spherical coordinate system. We should somehow perform a rough estimation of the position and size of the surface so that the auxiliary spherical grid could be positioned with the origin inside the surface and dimensioned so that it covers the surface. However, the model is parametric and through a variation of the coordinate origin’s parametric values and the upper limit of the third coordinate
kr grid points, we will soon experimentally obtain some
favorable values. The model is entirely realized through a parametric model in Grasshopper, all variables described in the algorithm are parametrically defined. As input data, the focuses and directrices are defined as follows: focuses are defined with their coordinates, whereas directrices are defined by selecting drawn lines or defining a point and a line vector.
The selection of a local spherical coordinate system, its coordinate origin and position in space does not impact the position or the shape of the surface, but it does affect the shape and position of isocurves that are expected to mirror the character and behavior of the surface to some extent. Mathematically speaking, a change in the spherical coordinate system represents the change of its parametric equations for the surface in the global Cartesian coordinate system, i.e. reparametrization, hence its significant impact on the isocurves is quite clear.
If we exclude rotation as a method of switching from the global to the local coordinate system, the translation itself only results in the change of the coordinate origin’s position. It was observed that such changes produce interesting results that refer to the isocurves of focal-directorial surfaces.
As an illustration of isocurve behavior, this paper chose an example of a simple surface with three focuses 0,0,121 P , 0,12,02P , 5,5,53P and a constant sum of distances to the focus 35S . Figure 1 shows the said
surface with six isocurve variations.
1. 2. 3. 4. 5. 6.
front view
top view
Figure. 1: Isocurve variations on a trifocal surface

LJ. PETRUSEVSKI ET AL.: MODELING OF FOCAL-DIRECTORIAL SURFACES FOR APPLICATION IN ARCHITECTURE
281 THE 5TH ICGG CONFERENCE MONGEOMETRIJA 2016 PROCEEDINGS Belgrade: 23-26 June 2016
By varying the position of the coordinate origin of the local spherical coordinate system (Figure 1), we get different sets of isocurves whose discretization results in various spatial structures based on the same focal-directorial surface. Many of these isocurves don’t visually match the behavior of the surface, and some can even generate visual illusions about the appearance of the surface itself. This fact should not be necessarily viewed in a negative context from the standpoint of architectural application, although control is necessary, as well as the ability to generate isocurves that mirror the behavior of the surface to a sufficient degree.
For that purpose, authors of this paper suggest another step in the modeling algorithm of focal-directorial surfaces. In the second iteration, with the coordinate origin of the spherical grid in the centroid of the obtained model. Results obtained on the example of three surfaces P.1, P.2 and P.3, are shown in Figure 2. The obtained isocurves mirror the behavior of the surface, express their character and clearly indicate the existing symmetries and antisymmetries within the surface.
top front right
P.1.
Trifocal surface
P.2.
Focal-directorial surface
P.3.
Trifocal surface
Figure. 2: Isocurves of modeled surfaces – spherical grid with the coordinate origin in the centroid
Figure 2 first shows a surface P.1. with the isocurve variation shown in Figure 1. It is a focal surface whose focuses are three points in space: the first on the x axis 0,0,121 P , the second on the y axis 0,12,02P and
the third point outside the coordinate axes, 5,5,53P . The sum of distances between the surface points and the
focuses is 35. It is a general case of a scalene triangle, so the surface is not expected to have other planes of symmetry, except the plane of the triangle itself
321 PPP . The resulting isocurves do not display the existing
symmetry. In order for it to be visible, we should perform an additional rotation of the coordinate system or drop the triangle whose vertices are the focuses into the horizontal plane, then perform the modeling. Given that this is not a general problem, it only applies to a trifocal surface, the authors have not tried to model such isocurves.
The next surface, shown in Figure 2, manifests a strong antisymmetry. It is the focal-directorial surface P.2. with two bypassing directrices and one focus. Directrices are the diagonals of two sides of a regular triangular prism, whereas the focus is outside the prism, point 0,5,5P (Figure 3). In its part toward the directrices, it behaves as
a directorial surface, and in the part toward the focus, as a focal surface. This behavior of the surface is mirrored by the shape of isocurves.
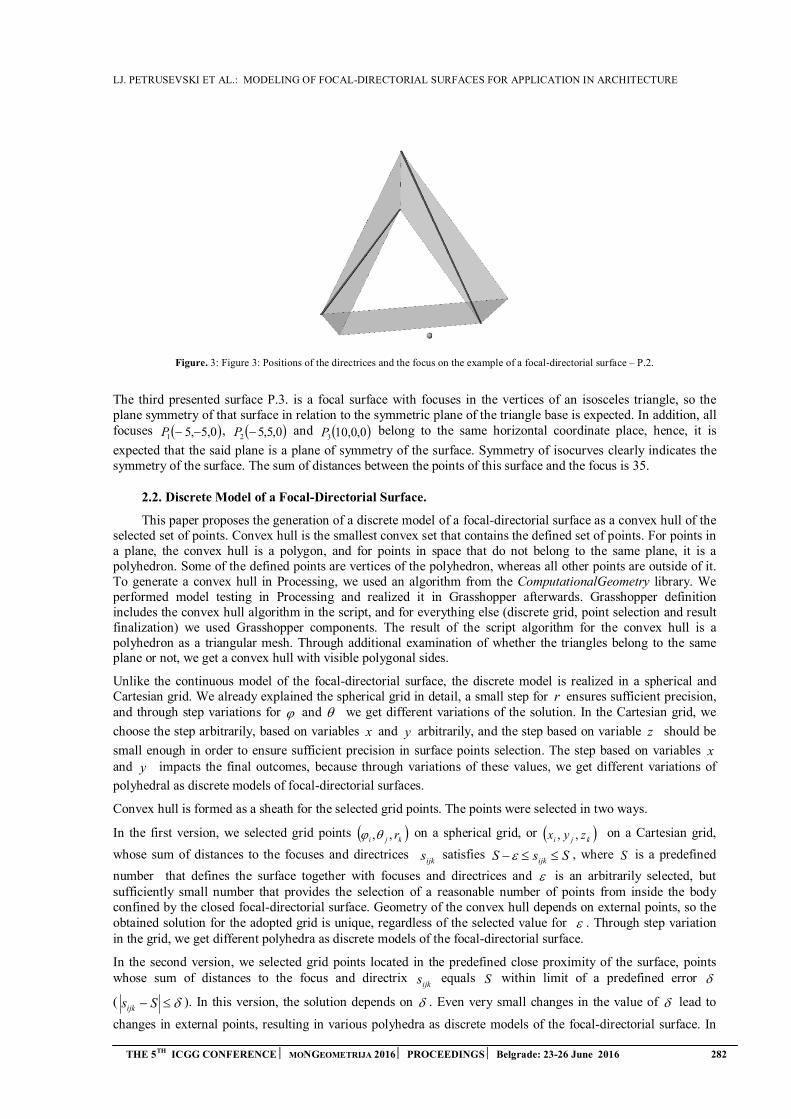
LJ. PETRUSEVSKI ET AL.: MODELING OF FOCAL-DIRECTORIAL SURFACES FOR APPLICATION IN ARCHITECTURE
THE 5TH ICGG CONFERENCE MONGEOMETRIJA 2016 PROCEEDINGS Belgrade: 23-26 June 2016 282
Figure. 3: Figure 3: Positions of the directrices and the focus on the example of a focal-directorial surface – P.2.
The third presented surface P.3. is a focal surface with focuses in the vertices of an isosceles triangle, so the plane symmetry of that surface in relation to the symmetric plane of the triangle base is expected. In addition, all focuses 0,5,51 P , 0,5,52 P and 0,0,103P belong to the same horizontal coordinate place, hence, it is
expected that the said plane is a plane of symmetry of the surface. Symmetry of isocurves clearly indicates the symmetry of the surface. The sum of distances between the points of this surface and the focus is 35.
2.2. Discrete Model of a Focal-Directorial Surface.
This paper proposes the generation of a discrete model of a focal-directorial surface as a convex hull of the selected set of points. Convex hull is the smallest convex set that contains the defined set of points. For points in a plane, the convex hull is a polygon, and for points in space that do not belong to the same plane, it is a polyhedron. Some of the defined points are vertices of the polyhedron, whereas all other points are outside of it. To generate a convex hull in Processing, we used an algorithm from the ComputationalGeometry library. We performed model testing in Processing and realized it in Grasshopper afterwards. Grasshopper definition includes the convex hull algorithm in the script, and for everything else (discrete grid, point selection and result finalization) we used Grasshopper components. The result of the script algorithm for the convex hull is a polyhedron as a triangular mesh. Through additional examination of whether the triangles belong to the same plane or not, we get a convex hull with visible polygonal sides.
Unlike the continuous model of the focal-directorial surface, the discrete model is realized in a spherical and Cartesian grid. We already explained the spherical grid in detail, a small step for r ensures sufficient precision, and through step variations for and we get different variations of the solution. In the Cartesian grid, we
choose the step arbitrarily, based on variables x and y arbitrarily, and the step based on variable z should be
small enough in order to ensure sufficient precision in surface points selection. The step based on variables x and y impacts the final outcomes, because through variations of these values, we get different variations of
polyhedral as discrete models of focal-directorial surfaces.
Convex hull is formed as a sheath for the selected grid points. The points were selected in two ways.
In the first version, we selected grid points kji r,, on a spherical grid, or kji zyx ,, on a Cartesian grid,
whose sum of distances to the focuses and directrices ijks satisfies SsS ijk , where S is a predefined
number that defines the surface together with focuses and directrices and is an arbitrarily selected, but sufficiently small number that provides the selection of a reasonable number of points from inside the body confined by the closed focal-directorial surface. Geometry of the convex hull depends on external points, so the obtained solution for the adopted grid is unique, regardless of the selected value for . Through step variation in the grid, we get different polyhedra as discrete models of the focal-directorial surface.
In the second version, we selected grid points located in the predefined close proximity of the surface, points whose sum of distances to the focus and directrix
ijks equals S within limit of a predefined error
( Ssijk). In this version, the solution depends on . Even very small changes in the value of lead to
changes in external points, resulting in various polyhedra as discrete models of the focal-directorial surface. In
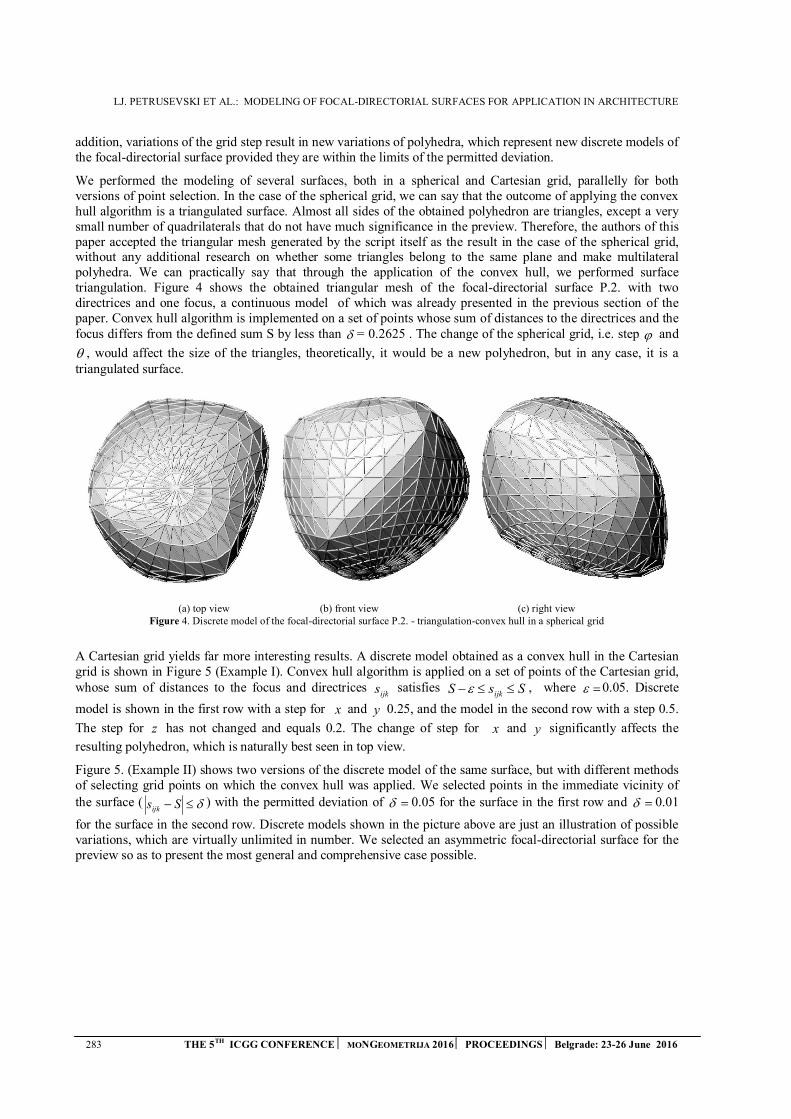
LJ. PETRUSEVSKI ET AL.: MODELING OF FOCAL-DIRECTORIAL SURFACES FOR APPLICATION IN ARCHITECTURE
283 THE 5TH ICGG CONFERENCE MONGEOMETRIJA 2016 PROCEEDINGS Belgrade: 23-26 June 2016
addition, variations of the grid step result in new variations of polyhedra, which represent new discrete models of the focal-directorial surface provided they are within the limits of the permitted deviation.
We performed the modeling of several surfaces, both in a spherical and Cartesian grid, parallelly for both versions of point selection. In the case of the spherical grid, we can say that the outcome of applying the convex hull algorithm is a triangulated surface. Almost all sides of the obtained polyhedron are triangles, except a very small number of quadrilaterals that do not have much significance in the preview. Therefore, the authors of this paper accepted the triangular mesh generated by the script itself as the result in the case of the spherical grid, without any additional research on whether some triangles belong to the same plane and make multilateral polyhedra. We can practically say that through the application of the convex hull, we performed surface triangulation. Figure 4 shows the obtained triangular mesh of the focal-directorial surface P.2. with two directrices and one focus, a continuous model of which was already presented in the previous section of the paper. Convex hull algorithm is implemented on a set of points whose sum of distances to the directrices and the focus differs from the defined sum S by less than = 0.2625 . The change of the spherical grid, i.e. step and
, would affect the size of the triangles, theoretically, it would be a new polyhedron, but in any case, it is atriangulated surface.
(a) top view (b) front view (c) right view Figure 4. Discrete model of the focal-directorial surface P.2. - triangulation-convex hull in a spherical grid
A Cartesian grid yields far more interesting results. A discrete model obtained as a convex hull in the Cartesian grid is shown in Figure 5 (Example I). Convex hull algorithm is applied on a set of points of the Cartesian grid, whose sum of distances to the focus and directrices
ijks satisfies SsS ijk , where 0.05. Discrete
model is shown in the first row with a step for x and y 0.25, and the model in the second row with a step 0.5.
The step for z has not changed and equals 0.2. The change of step for x and y significantly affects the
resulting polyhedron, which is naturally best seen in top view.
Figure 5. (Example II) shows two versions of the discrete model of the same surface, but with different methods of selecting grid points on which the convex hull was applied. We selected points in the immediate vicinity of
the surface ( Ssijk) with the permitted deviation of 0.05 for the surface in the first row and 0.01
for the surface in the second row. Discrete models shown in the picture above are just an illustration of possible variations, which are virtually unlimited in number. We selected an asymmetric focal-directorial surface for the preview so as to present the most general and comprehensive case possible.
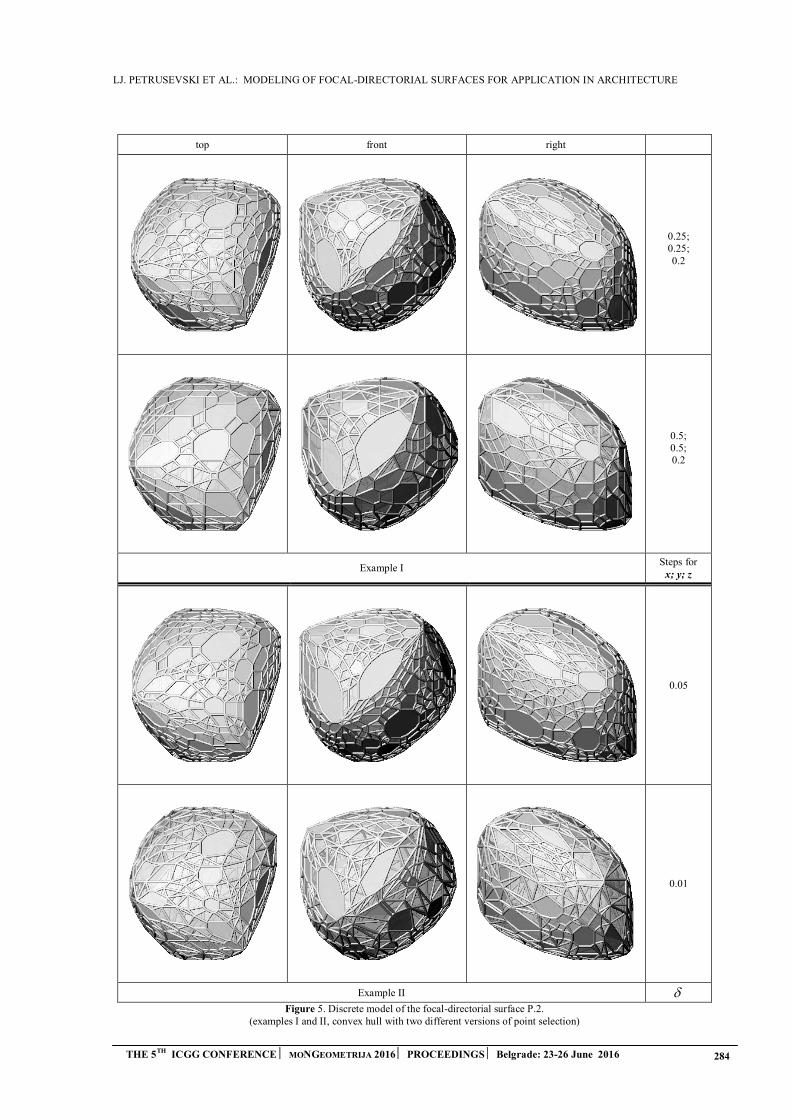
LJ. PETRUSEVSKI ET AL.: MODELING OF FOCAL-DIRECTORIAL SURFACES FOR APPLICATION IN ARCHITECTURE
THE 5TH ICGG CONFERENCE MONGEOMETRIJA 2016 PROCEEDINGS Belgrade: 23-26 June 2016 284
top front right
0.25; 0.25; 0.2
0.5; 0.5; 0.2
Example I Steps for
x; y; z
0.05
0.01
Example II
Figure 5. Discrete model of the focal-directorial surface P.2. (examples I and II, convex hull with two different versions of point selection)
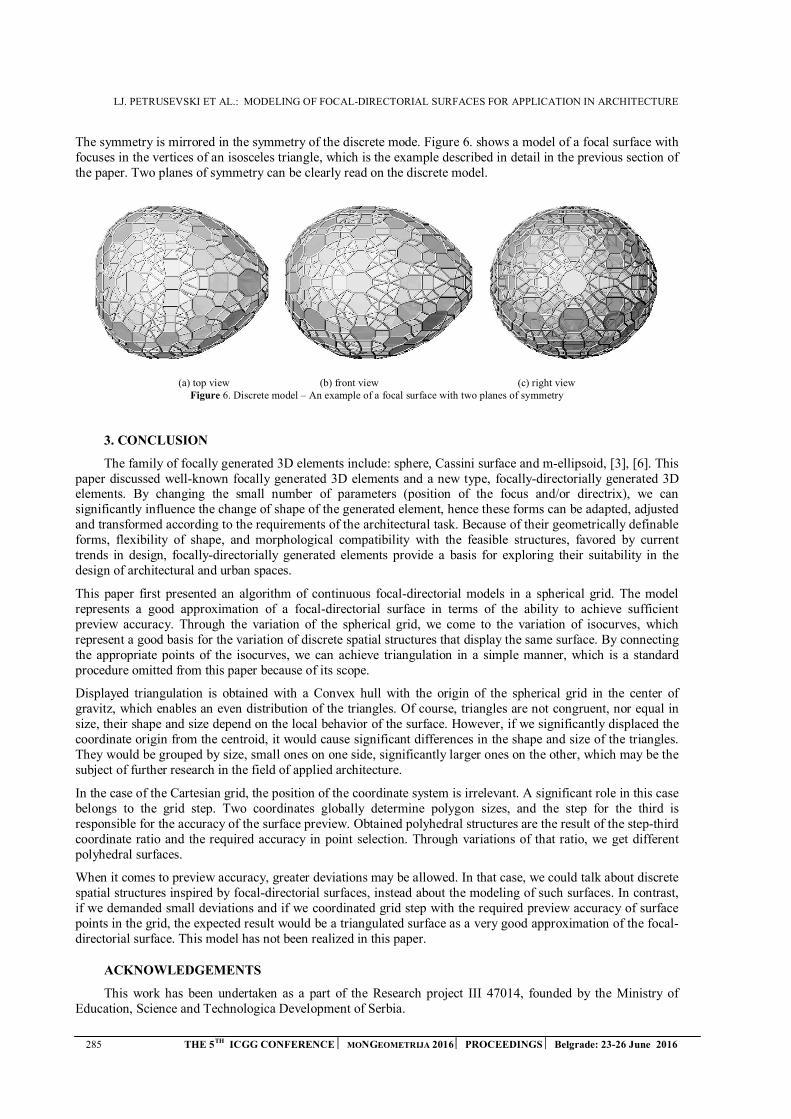
LJ. PETRUSEVSKI ET AL.: MODELING OF FOCAL-DIRECTORIAL SURFACES FOR APPLICATION IN ARCHITECTURE
285 THE 5TH ICGG CONFERENCE MONGEOMETRIJA 2016 PROCEEDINGS Belgrade: 23-26 June 2016
The symmetry is mirrored in the symmetry of the discrete mode. Figure 6. shows a model of a focal surface with focuses in the vertices of an isosceles triangle, which is the example described in detail in the previous section of the paper. Two planes of symmetry can be clearly read on the discrete model.
(a) top view (b) front view (c) right view Figure 6. Discrete model – An example of a focal surface with two planes of symmetry
3. CONCLUSION
The family of focally generated 3D elements include: sphere, Cassini surface and m-ellipsoid, [3], [6]. This paper discussed well-known focally generated 3D elements and a new type, focally-directorially generated 3D elements. By changing the small number of parameters (position of the focus and/or directrix), we can significantly influence the change of shape of the generated element, hence these forms can be adapted, adjusted and transformed according to the requirements of the architectural task. Because of their geometrically definable forms, flexibility of shape, and morphological compatibility with the feasible structures, favored by current trends in design, focally-directorially generated elements provide a basis for exploring their suitability in the design of architectural and urban spaces.
This paper first presented an algorithm of continuous focal-directorial models in a spherical grid. The model represents a good approximation of a focal-directorial surface in terms of the ability to achieve sufficient preview accuracy. Through the variation of the spherical grid, we come to the variation of isocurves, which represent a good basis for the variation of discrete spatial structures that display the same surface. By connecting the appropriate points of the isocurves, we can achieve triangulation in a simple manner, which is a standard procedure omitted from this paper because of its scope.
Displayed triangulation is obtained with a Convex hull with the origin of the spherical grid in the center of gravitz, which enables an even distribution of the triangles. Of course, triangles are not congruent, nor equal in size, their shape and size depend on the local behavior of the surface. However, if we significantly displaced the coordinate origin from the centroid, it would cause significant differences in the shape and size of the triangles. They would be grouped by size, small ones on one side, significantly larger ones on the other, which may be the subject of further research in the field of applied architecture.
In the case of the Cartesian grid, the position of the coordinate system is irrelevant. A significant role in this case belongs to the grid step. Two coordinates globally determine polygon sizes, and the step for the third is responsible for the accuracy of the surface preview. Obtained polyhedral structures are the result of the step-third coordinate ratio and the required accuracy in point selection. Through variations of that ratio, we get different polyhedral surfaces.
When it comes to preview accuracy, greater deviations may be allowed. In that case, we could talk about discrete spatial structures inspired by focal-directorial surfaces, instead about the modeling of such surfaces. In contrast, if we demanded small deviations and if we coordinated grid step with the required preview accuracy of surface points in the grid, the expected result would be a triangulated surface as a very good approximation of the focal-directorial surface. This model has not been realized in this paper.
ACKNOWLEDGEMENTS
This work has been undertaken as a part of the Research project III 47014, founded by the Ministry of Education, Science and Technologica Development of Serbia.

LJ. PETRUSEVSKI ET AL.: MODELING OF FOCAL-DIRECTORIAL SURFACES FOR APPLICATION IN ARCHITECTURE
THE 5TH ICGG CONFERENCE MONGEOMETRIJA 2016 PROCEEDINGS Belgrade: 23-26 June 2016 286
REFERENCES
1. Banjac, B., Petrović, M. and Malešević, B., 2014. Visualization of Weber’s curves and surfaces withapplications in some optimization problems. Proceedings of 22nd Telecommunications ForumTELFOR 2014, Belgrade, Serbia, pp. 1031-1034.
2. Leopold C., 2015. Structural and geometric concepts for architectural design proccess. Boletim daAproged nº 32, Lisboa, Portugal, Junho de 2015, pp. 5-15
3. Nie, J., Parrilo, P. A. and Sturmfels, B., 2008. Semidefinite representation of the m-ellipse. Algorithmsin algebraic geometry. Springer New York, pp. 117-132.
4. Payne, A. and Issa, R., 2009. The Grasshopper Primer, Second Edition.
5. Petrović, M., 2016. Generating the focal-directorial geometric forms as a designing pattern of thearchitectural-urban space (in Serbian), doctoral dissertation, University of Belgrade, Faculty ofArchitecture.
6. Pieper, W. M. (2006) Multifocal Surfaces and Algorithms for Displaying Them. Journal for Geometryand Graphics, 10(1), pp.37-62.
7. Pottmann, H., Brell-Cokcan, S. and Wallner J., 2007. Discrete Surfaces for Architectural Design, in"Curves and Surface Design: Avignon 2006", issued by: P.Chenin, T. Lyche and L.L. Schumaker;Nashboro Press, 2007, ISBN: 978-0-9728482-7-5, pp. 213 - 234.
8. Pottmann, H., Eigensatz, M., Vaxman, A. and Wallner J., 2015. Architectural Geometry, Computersand Graphics, vol. 47, pp. 145-164.
9. Reas, C. and Fry, B., 2014. Processing: A Programming Handbook for Visual Designers, SecondEdition, The MIT Press. 720 pages. Hardcover.
10. Schmiedhofer, H., 2007. Discrete Freeform-Surfaces for Architecture, Diplomarbeit, Advisor: H.Pottmann, Institute for Discrete Mathematics and Geometry Geometric Modeling and IndustrialGeometry, Technischen Universität Wien, Fakultät für Architektur und Raumplanung
11. Shiffman, D., 2012. The Nature of Code: Simulating Natural Systems with Processing, Free SoftwareFoundation.
12. Vouga, E., Höbinger, M., Wallner, J. and Pottmann. H., 2012. Design of self-supporting surfaces.ACM Trans. Graphics, 31:#87, Proc. SIGGRAPH, pp. 1-11.
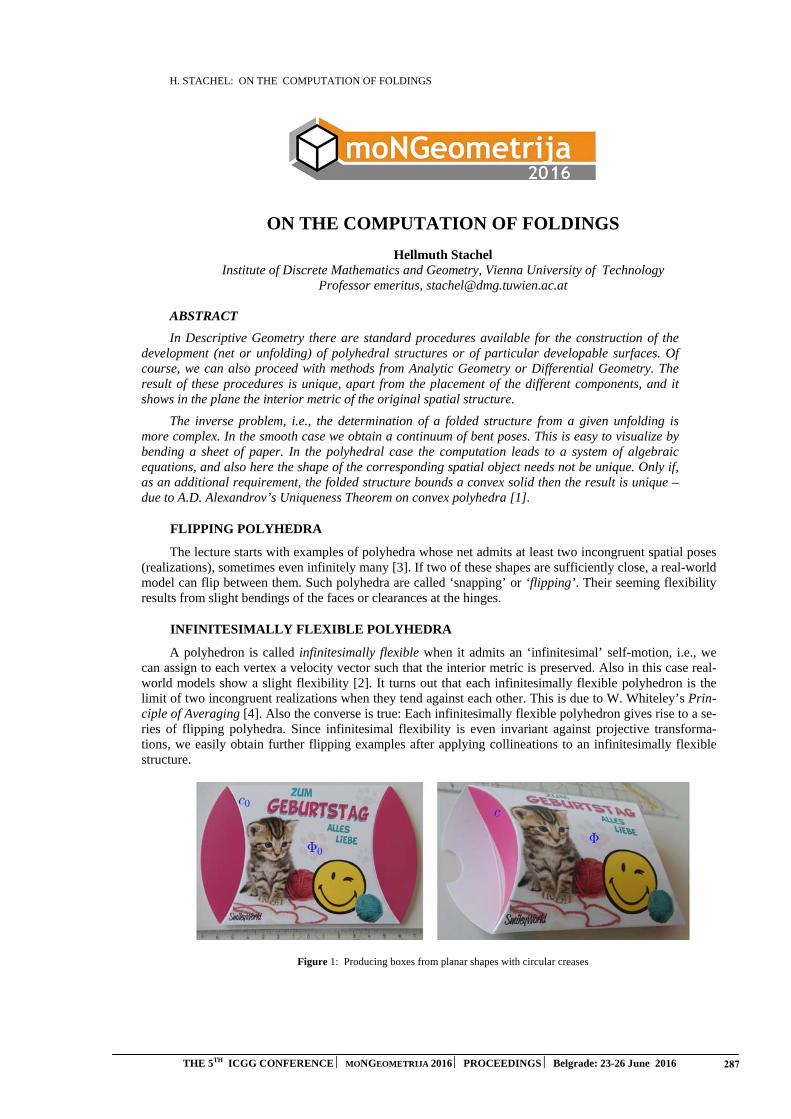
H. STACHEL: ON THE COMPUTATION OF FOLDINGS
THE 5TH ICGG CONFERENCE ⏐ MONGEOMETRIJA 2016 ⏐ PROCEEDINGS ⏐ Belgrade: 23-26 June 2016 287
ON THE COMPUTATION OF FOLDINGS
Hellmuth Stachel Institute of Discrete Mathematics and Geometry, Vienna University of Technology
Professor emeritus, [email protected]
ABSTRACT
In Descriptive Geometry there are standard procedures available for the construction of the development (net or unfolding) of polyhedral structures or of particular developable surfaces. Of course, we can also proceed with methods from Analytic Geometry or Differential Geometry. The result of these procedures is unique, apart from the placement of the different components, and it shows in the plane the interior metric of the original spatial structure.
The inverse problem, i.e., the determination of a folded structure from a given unfolding is more complex. In the smooth case we obtain a continuum of bent poses. This is easy to visualize by bending a sheet of paper. In the polyhedral case the computation leads to a system of algebraic equations, and also here the shape of the corresponding spatial object needs not be unique. Only if, as an additional requirement, the folded structure bounds a convex solid then the result is unique – due to A.D. Alexandrov’s Uniqueness Theorem on convex polyhedra [1].
FLIPPING POLYHEDRA
The lecture starts with examples of polyhedra whose net admits at least two incongruent spatial poses (realizations), sometimes even infinitely many [3]. If two of these shapes are sufficiently close, a real-world model can flip between them. Such polyhedra are called ‘snapping’ or ‘flipping’. Their seeming flexibility results from slight bendings of the faces or clearances at the hinges.
INFINITESIMALLY FLEXIBLE POLYHEDRA
A polyhedron is called infinitesimally flexible when it admits an ‘infinitesimal’ self-motion, i.e., we can assign to each vertex a velocity vector such that the interior metric is preserved. Also in this case real-world models show a slight flexibility [2]. It turns out that each infinitesimally flexible polyhedron is the limit of two incongruent realizations when they tend against each other. This is due to W. Whiteley’s Prin-ciple of Averaging [4]. Also the converse is true: Each infinitesimally flexible polyhedron gives rise to a se-ries of flipping polyhedra. Since infinitesimal flexibility is even invariant against projective transforma-tions, we easily obtain further flipping examples after applying collineations to an infinitesimally flexible structure.
Figure 1: Producing boxes from planar shapes with circular creases
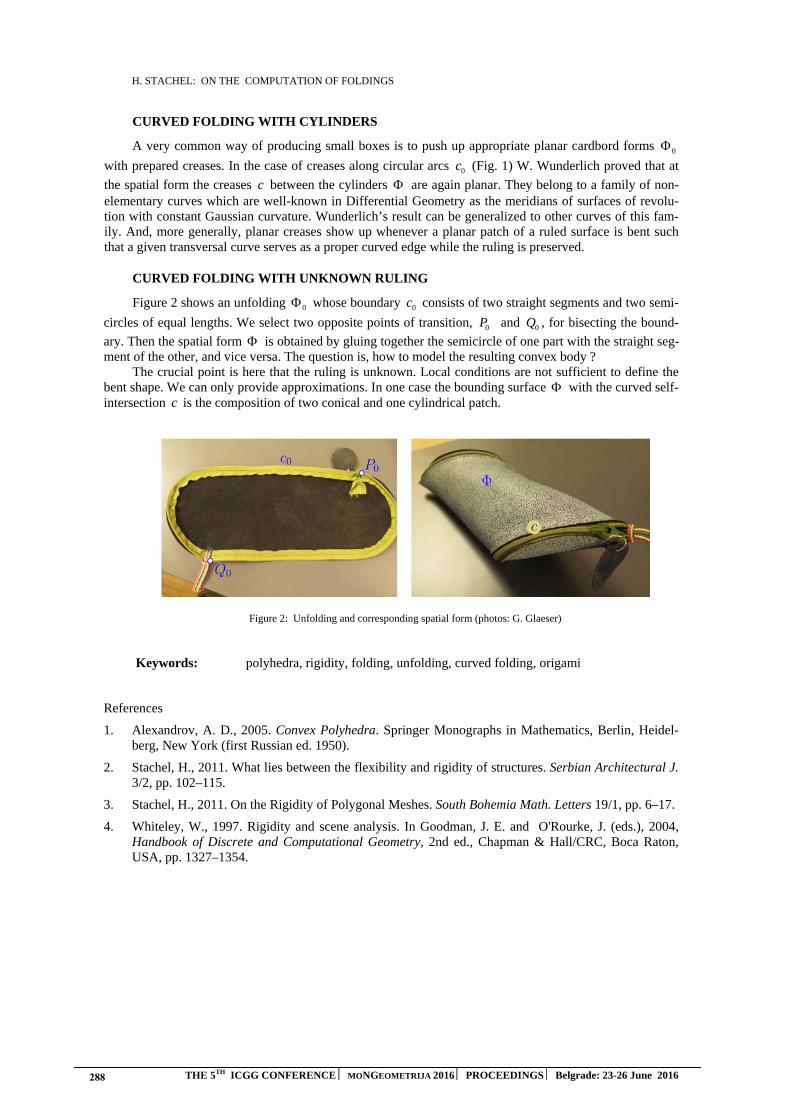
H. STACHEL: ON THE COMPUTATION OF FOLDINGS
288 THE 5TH ICGG CONFERENCE ⏐ MONGEOMETRIJA 2016 ⏐ PROCEEDINGS ⏐ Belgrade: 23-26 June 2016
CURVED FOLDING WITH CYLINDERS
A very common way of producing small boxes is to push up appropriate planar cardbord forms 0Φwith prepared creases. In the case of creases along circular arcs 0c (Fig. 1) W. Wunderlich proved that at
the spatial form the creases c between the cylinders Φ are again planar. They belong to a family of non-elementary curves which are well-known in Differential Geometry as the meridians of surfaces of revolu-tion with constant Gaussian curvature. Wunderlich’s result can be generalized to other curves of this fam-ily. And, more generally, planar creases show up whenever a planar patch of a ruled surface is bent such that a given transversal curve serves as a proper curved edge while the ruling is preserved.
CURVED FOLDING WITH UNKNOWN RULING
Figure 2 shows an unfolding 0Φ whose boundary 0c consists of two straight segments and two semi-
circles of equal lengths. We select two opposite points of transition, 0P and 0Q , for bisecting the bound-
ary. Then the spatial form Φ is obtained by gluing together the semicircle of one part with the straight seg-ment of the other, and vice versa. The question is, how to model the resulting convex body ?
The crucial point is here that the ruling is unknown. Local conditions are not sufficient to define the bent shape. We can only provide approximations. In one case the bounding surface Φ with the curved self-intersection c is the composition of two conical and one cylindrical patch.
Figure 2: Unfolding and corresponding spatial form (photos: G. Glaeser)
Keywords: polyhedra, rigidity, folding, unfolding, curved folding, origami
References
1. Alexandrov, A. D., 2005. Convex Polyhedra. Springer Monographs in Mathematics, Berlin, Heidel-berg, New York (first Russian ed. 1950).
2. Stachel, H., 2011. What lies between the flexibility and rigidity of structures. Serbian Architectural J.3/2, pp. 102–115.
3. Stachel, H., 2011. On the Rigidity of Polygonal Meshes. South Bohemia Math. Letters 19/1, pp. 6–17.
4. Whiteley, W., 1997. Rigidity and scene analysis. In Goodman, J. E. and O'Rourke, J. (eds.), 2004,Handbook of Discrete and Computational Geometry, 2nd ed., Chapman & Hall/CRC, Boca Raton,USA, pp. 1327–1354.
L. SASS ET AL.: ORIGINAL APPLICATIONS FOR GEOMETRICAL EQUIVALENCE PROBLEM
THE 5TH ICGG CONFERENCE MONGEOMETRIJA 2016 PROCEEDINGS Belgrade: 23-26 June 2016 289
ORIGINAL APPLICATIONS FOR GEOMETRICAL EQUIVALENCE PROBLEM
Ludmila Sass
Department of Motor Vehicles, Transports and Industrial Engineering, University of Craiova, Roumanie
PhD., Associate Professor, [email protected]
Alina Duta
Department of Motor Vehicles, Transports and Industrial Engineering, University of Craiova, Roumanie
PhD., Associate Professor, [email protected]
Iulian Popescu
Member of Romanian Academy of Technical Sciences, Craiova, Roumanie Professor, [email protected]
ABSTRACT
The paper is concerned with researches on geometric figures of different shapes but identic
areas (equivalent figures). Our researches are focused on the realization of applications starting
from the geometric problem related to the equivalence process. Two categories of plane geometric
figures were selected for this study: the first one consists in lunes whilst the second consists in
convex polygons: square, rectangle, isosceles trapezoid, hexagon. While the tracing techniques used
by the ancient Greeks in order to draw geometric figures involved only the use of two instruments (a
ruler with no marks and a compass), our current efforts were directed toward extending our
previous researches concerned with the geometric properties of the figures composed of circular
arcs made by Archimedes – Arbelos and Salinon, and respectively of those conceived by
Hyppocrates – lunes. Starting from the Hyppocrates’s demonstration for the equivalence of an
isosceles trapezoid with 3 equal sides, we studied the hexagon and built an original mechanism in
order to generate (by using computer aided techniques) certain lunes on the side of this polygon.
The synthesis of this mechanism with two leading elements was done. The relations determined by
the contour’s method are presented and curves were generated along the hexagon’s sides. By
continuing the researches on geometrical equivalent figures, a scientific „bridge over time” was
built between 3 different historic periods: Antique Greece – Middle Age – Artificial Intelligence Era.
By using Computer Aided Graphics, based on the quadrature solving of a curvilinear figure in
Antique Greece by Hyppocrates, we made a new geometric application of Fibonacci’s sequence
published in his book „Liber Abaci” during the Middle Age.
Keywords: computer graphics; geometrical equivalent figures; applied geometry; lunes; mechanism
1. INTRODUCTION
The circle’s quadrature resulted in the development of integrals’ calculation (Mathematical Analysis) and
operates in the non-euclidian Gauss-Bolyai-Lobachevsky space (hyperbolic geometrical space) [2].
Geometers from Antique Greece intended to solve the circle’s quadrature. They approached the plane’s method
(considered to be initiated by Platon) – intending to build a square whose aria is equivalent to that of a certain circle by using only the ruler and compass.
They were successful in building geometrical figures with various shapes (e.g. square and triangle) with identical areas – that is equivalent figures.
Anaxagoras (499-428 B.C.), Antiphon and Bryson, Hyppocrates from Chios (470-410 B.C.), Dinostratus (390-320 B.C.), Nicomedes (280-210 B.C.), Archimede (287-212 B.C.) are among the scientists who searched solutions for the square’s quadrature.
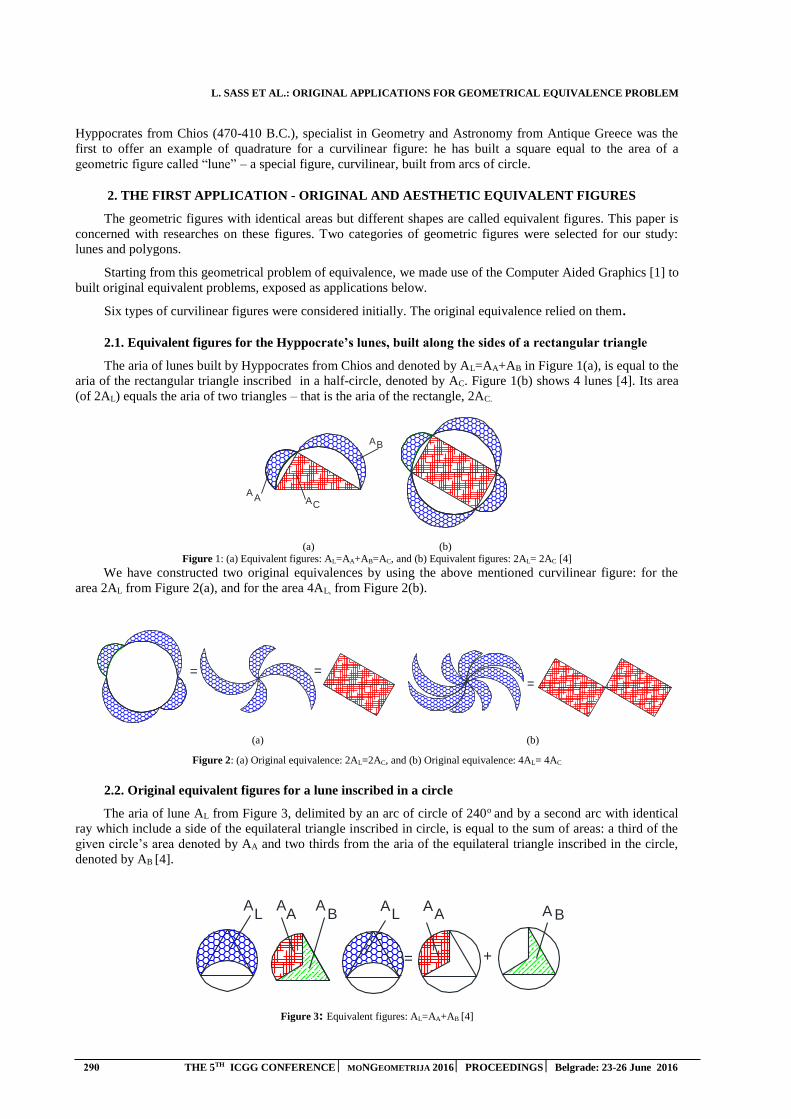
L. SASS ET AL.: ORIGINAL APPLICATIONS FOR GEOMETRICAL EQUIVALENCE PROBLEM
290 THE 5TH ICGG CONFERENCE MONGEOMETRIJA 2016 PROCEEDINGS Belgrade: 23-26 June 2016
Hyppocrates from Chios (470-410 B.C.), specialist in Geometry and Astronomy from Antique Greece was the first to offer an example of quadrature for a curvilinear figure: he has built a square equal to the area of a geometric figure called “lune” – a special figure, curvilinear, built from arcs of circle.
2. THE FIRST APPLICATION - ORIGINAL AND AESTHETIC EQUIVALENT FIGURES
The geometric figures with identical areas but different shapes are called equivalent figures. This paper is concerned with researches on these figures. Two categories of geometric figures were selected for our study: lunes and polygons.
Starting from this geometrical problem of equivalence, we made use of the Computer Aided Graphics [1] to built original equivalent problems, exposed as applications below.
Six types of curvilinear figures were considered initially. The original equivalence relied on them.
2.1. Equivalent figures for the Hyppocrate’s lunes, built along the sides of a rectangular triangle
The aria of lunes built by Hyppocrates from Chios and denoted by AL=AA+AB in Figure 1(a), is equal to the aria of the rectangular triangle inscribed in a half-circle, denoted by AC. Figure 1(b) shows 4 lunes [4]. Its area (of 2AL) equals the aria of two triangles – that is the aria of the rectangle, 2AC.
= ==
= = == = =
= = = =AA
AL
= = = = = = =
= = =
A
BCE
H
M
P
T
D
FK
GN
L
S
V
R
O
x
y
AA A
AB
C
A A A
= +
L A B L A BA A A
LA AABA
AAA
L
ALAA
+=
AAL
BA
A
== =
BL D
- =
A EAA A AA
= = = =
+=
A
A
L BA
A
=
(a) (b) Figure 1: (a) Equivalent figures: AL=AA+AB=AC, and (b) Equivalent figures: 2AL= 2AC [4]
We have constructed two original equivalences by using the above mentioned curvilinear figure: for the area 2AL from Figure 2(a), and for the area 4AL, from Figure 2(b).
= ==
= = == = =
= = = =AA
AL
= = = = = = =
= = =
A
BCE
H
M
P
T
D
FK
GN
L
S
V
R
O
x
y
AA A
AB
C
A A A
= +
L A B L A BA A A
LA AABA
AAA
L
ALAA
+=
AAL
BA
A
== =
BL D
- =
A EAA A AA
= = = =
+=
A
A
L BA
A
=
= ==
= = == = =
= = = =AA
AL
= = = = = = =
= = =
A
BCE
H
M
P
T
D
FK
GN
L
S
V
R
O
x
y
AA A
AB
C
A A A
= +
L A B L A BA A A
LA AABA
AAA
L
ALAA
+=
AAL
BA
A
== =
BL D
- =
A EAA A AA
= = = =
+=
A
A
L BA
A
=
(a) (b)
Figure 2: (a) Original equivalence: 2AL=2AC, and (b) Original equivalence: 4AL= 4AC
2.2. Original equivalent figures for a lune inscribed in a circle
The aria of lune AL from Figure 3, delimited by an arc of circle of 240o and by a second arc with identical ray which include a side of the equilateral triangle inscribed in circle, is equal to the sum of areas: a third of the given circle’s area denoted by AA and two thirds from the aria of the equilateral triangle inscribed in the circle, denoted by AB [4].
= ==
= = == = =
= = = =AA
AL
= = = = = = =
= = =
A
BCE
H
M
P
T
D
FK
GN
L
S
V
R
O
x
y
AA A
AB
C
A A A
= +
L A B L A BA A A
LA AABA
AAA
L
ALAA
+=
AAL
BA
A
== =
BL D
- =
A EAA A AA
= = = =
+=
A
A
L BA
A
=
Figure 3: Equivalent figures: AL=AA+AB [4]
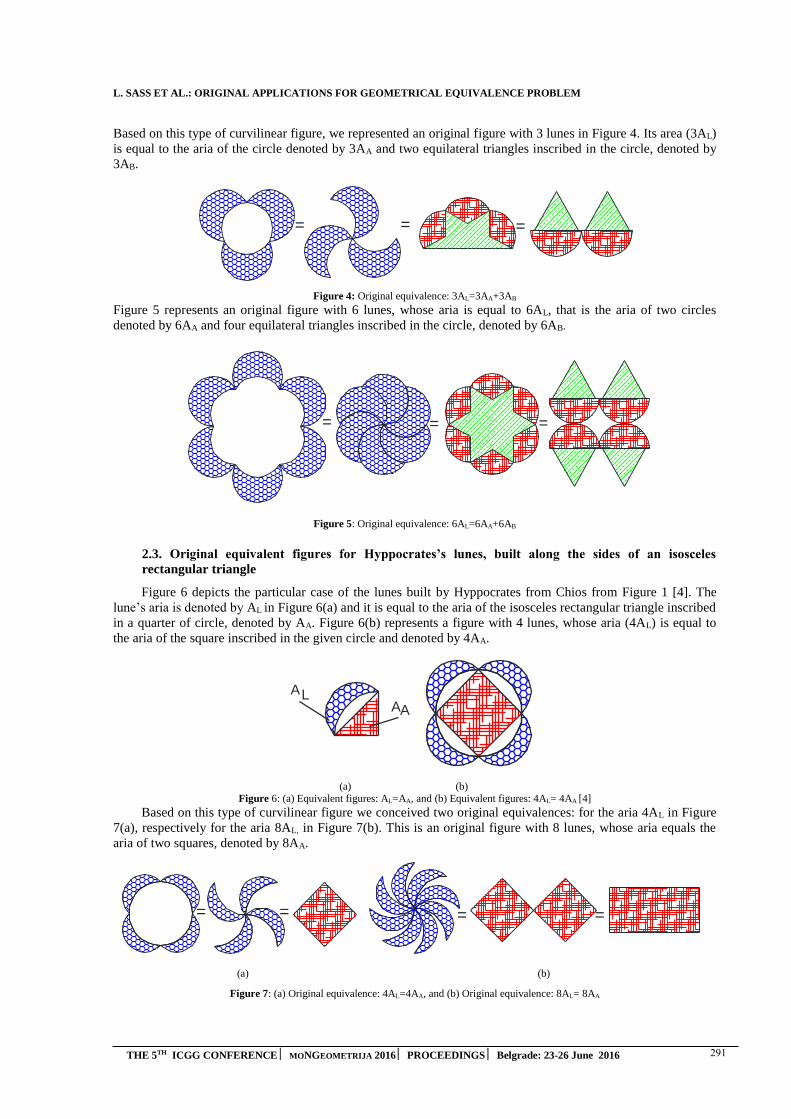
L. SASS ET AL.: ORIGINAL APPLICATIONS FOR GEOMETRICAL EQUIVALENCE PROBLEM
THE 5TH ICGG CONFERENCE MONGEOMETRIJA 2016 PROCEEDINGS Belgrade: 23-26 June 2016 291
Based on this type of curvilinear figure, we represented an original figure with 3 lunes in Figure 4. Its area (3AL) is equal to the aria of the circle denoted by 3AA and two equilateral triangles inscribed in the circle, denoted by 3AB.
= ==
= = == = =
= = = =AA
AL
= = = = = = =
= = =
A
BCE
H
M
P
T
D
FK
GN
L
S
V
R
O
x
y
AA A
AB
C
A A A
= +
L A B L A BA A A
LA AABA
AAA
L
ALAA
+=
AAL
BA
A
== =
BL D
- =
A EAA A AA
= = = =
+=
A
A
L BA
A
=
Figure 4: Original equivalence: 3AL=3AA+3AB
Figure 5 represents an original figure with 6 lunes, whose aria is equal to 6AL, that is the aria of two circles denoted by 6AA and four equilateral triangles inscribed in the circle, denoted by 6AB.
= ==
= = == = =
= = = =AA
AL
= = = = = = =
= = =
A
BCE
H
M
P
T
D
FK
GN
L
S
V
R
O
x
y
AA A
AB
C
A A A
= +
L A B L A BA A A
LA AABA
AAA
L
ALAA
+=
AAL
BA
A
== =
BL D
- =
A EAA A AA
= = = =
+=
A
A
L BA
A
=
Figure 5: Original equivalence: 6AL=6AA+6AB
2.3. Original equivalent figures for Hyppocrates’s lunes, built along the sides of an isosceles
rectangular triangle
Figure 6 depicts the particular case of the lunes built by Hyppocrates from Chios from Figure 1 [4]. The lune’s aria is denoted by AL in Figure 6(a) and it is equal to the aria of the isosceles rectangular triangle inscribed in a quarter of circle, denoted by AA. Figure 6(b) represents a figure with 4 lunes, whose aria (4AL) is equal tothe aria of the square inscribed in the given circle and denoted by 4AA.
= ==
= = == = =
= = = =AA
AL
= = = = = = =
= = =
A
BCE
H
M
P
T
D
FK
GN
L
S
V
R
O
x
y
AA A
AB
C
A A A
= +
L A B L A BA A A
LA AABA
AAA
L
ALAA
+=
AAL
BA
A
== =
BL D
- =
A EAA A AA
= = = =
+=
A
A
L BA
A
=
(a) (b) Figure 6: (a) Equivalent figures: AL=AA, and (b) Equivalent figures: 4AL= 4AA [4]
Based on this type of curvilinear figure we conceived two original equivalences: for the aria 4AL in Figure 7(a), respectively for the aria 8AL, in Figure 7(b). This is an original figure with 8 lunes, whose aria equals the aria of two squares, denoted by 8AA.
= ==
= = == = =
= = = =AA
AL
= = = = = = =
= = =
A
BCE
H
M
P
T
D
FK
GN
L
S
V
R
O
x
y
AA A
AB
C
A A A
= +
L A B L A BA A A
LA AABA
AAA
L
ALAA
+=
AAL
BA
A
== =
BL D
- =
A EAA A AA
= = = =
+=
A
A
L BA
A
=
= ==
= = == = =
= = = =AA
AL
= = = = = = =
= = =
A
BCE
H
M
P
T
D
FK
GN
L
S
V
R
O
x
y
AA A
AB
C
A A A
= +
L A B L A BA A A
LA AABA
AAA
L
ALAA
+=
AAL
BA
A
== =
BL D
- =
A EAA A AA
= = = =
+=
A
A
L BA
A
=
(a) (b)
Figure 7: (a) Original equivalence: 4AL=4AA, and (b) Original equivalence: 8AL= 8AA
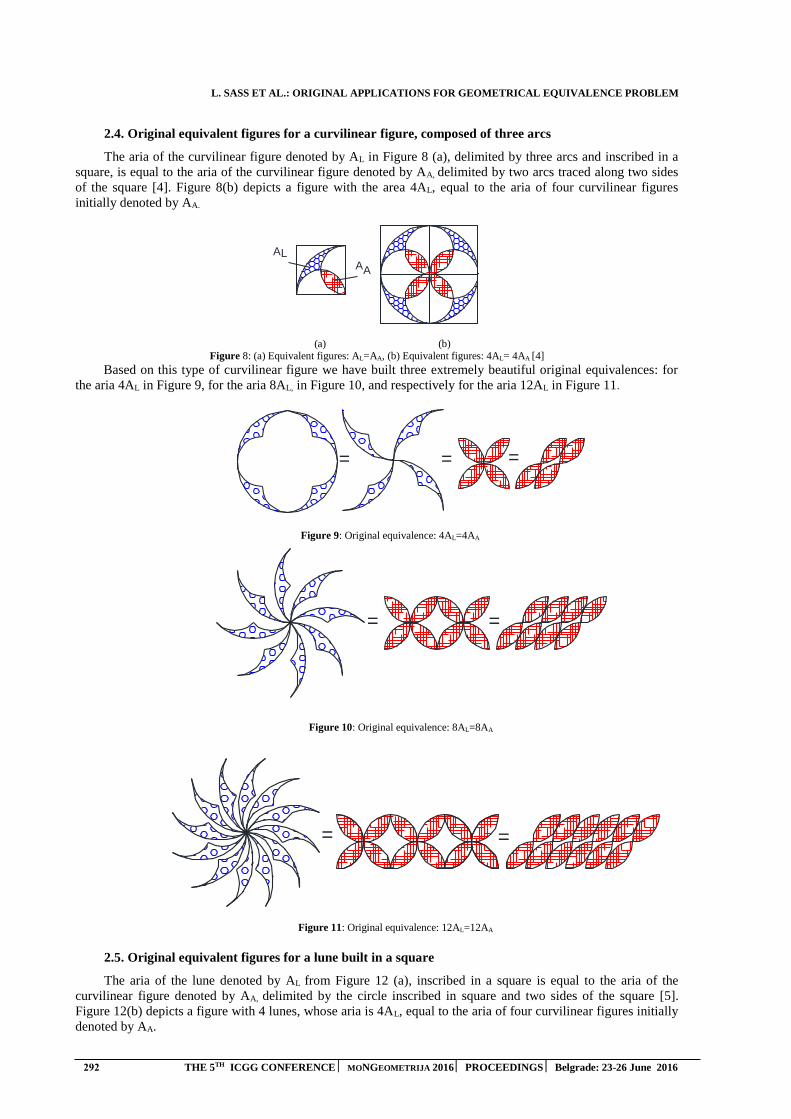
L. SASS ET AL.: ORIGINAL APPLICATIONS FOR GEOMETRICAL EQUIVALENCE PROBLEM
292 THE 5TH ICGG CONFERENCE MONGEOMETRIJA 2016 PROCEEDINGS Belgrade: 23-26 June 2016
2.4. Original equivalent figures for a curvilinear figure, composed of three arcs
The aria of the curvilinear figure denoted by AL in Figure 8 (a), delimited by three arcs and inscribed in a square, is equal to the aria of the curvilinear figure denoted by AA, delimited by two arcs traced along two sides of the square [4]. Figure 8(b) depicts a figure with the area 4AL, equal to the aria of four curvilinear figures initially denoted by AA.
= ==
= = == = =
= = = =AA
AL
= = = = = = =
= = =
A
BCE
H
M
P
T
D
FK
GN
L
S
V
R
O
x
y
AA A
AB
C
A A A
= +
L A B L A BA A A
LA AABA
AAA
L
ALAA
+=
AAL
BA
A
== =
BL D
- =
A EAA A AA
= = = =
+=
A
A
L BA
A
=
(a) (b) Figure 8: (a) Equivalent figures: AL=AA, (b) Equivalent figures: 4AL= 4AA [4]
Based on this type of curvilinear figure we have built three extremely beautiful original equivalences: for the aria 4AL in Figure 9, for the aria 8AL, in Figure 10, and respectively for the aria 12AL in Figure 11.
= ==
= = == = =
= = = =AA
AL
= = = = = = =
= = =
A
BCE
H
M
P
T
D
FK
GN
L
S
V
R
O
x
y
AA A
AB
C
A A A
= +
L A B L A BA A A
LA AABA
AAA
L
ALAA
+=
AAL
BA
A
== =
BL D
- =
A EAA A AA
= = = =
+=
A
A
L BA
A
=
Figure 9: Original equivalence: 4AL=4AA
= ==
= = == = =
= = = =AA
AL
= = = = = = =
= = =
A
BCE
H
M
P
T
D
FK
GN
L
S
V
R
O
x
y
AA A
AB
C
A A A
= +
L A B L A BA A A
LA AABA
AAA
L
ALAA
+=
AAL
BA
A
== =
BL D
- =
A EAA A AA
= = = =
+=
A
A
L BA
A
=
Figure 10: Original equivalence: 8AL=8AA
= ==
= = == = =
= = = =AA
AL
= = = = = = =
= = =
A
BCE
H
M
P
T
D
FK
GN
L
S
V
R
O
x
y
AA A
AB
C
A A A
= +
L A B L A BA A A
LA AABA
AAA
L
ALAA
+=
AAL
BA
A
== =
BL D
- =
A EAA A AA
= = = =
+=
A
A
L BA
A
=
Figure 11: Original equivalence: 12AL=12AA
2.5. Original equivalent figures for a lune built in a square
The aria of the lune denoted by AL from Figure 12 (a), inscribed in a square is equal to the aria of the curvilinear figure denoted by AA, delimited by the circle inscribed in square and two sides of the square [5].Figure 12(b) depicts a figure with 4 lunes, whose aria is 4AL, equal to the aria of four curvilinear figures initiallydenoted by AA.

L. SASS ET AL.: ORIGINAL APPLICATIONS FOR GEOMETRICAL EQUIVALENCE PROBLEM
THE 5TH ICGG CONFERENCE MONGEOMETRIJA 2016 PROCEEDINGS Belgrade: 23-26 June 2016 293
Based on this type of lune, we have conceived two original equivalences: for the aria 4AL in Figure 13(a), respectively for the aria 8AL, in Figure 13(b).
= ==
= = == = =
= = = =AA
AL
= = = = = = =
= = =
A
BCE
H
M
P
T
D
FK
GN
L
S
V
R
O
x
y
AA A
AB
C
A A A
= +
L A B L A BA A A
LA AABA
AAA
L
ALAA
+=
AAL
BA
A
== =
BL D
- =
A EAA A AA
= = = =
+=
A
A
L BA
A
=
(a) (b) Figure 12: (a) Equivalent figures: AL=AA, and (b) Equivalent figures: 4AL= 4AA [5].
= ==
= = == = =
= = = =AA
AL
= = = = = = =
= = =
A
BCE
H
M
P
T
D
FK
GN
L
S
V
R
O
x
y
AA A
AB
C
A A A
= +
L A B L A BA A A
LA AABA
AAA
L
ALAA
+=
AAL
BA
A
== =
BL D
- =
A EAA A AA
= = = =
+=
A
A
L BA
A
=
(a) (b)
Figure 13: (a) Original equivalence: 4AL=4AA, and (b) Original equivalence: 8AL= 8AA
2.6. Original equivalent figures for a trapezoid with three equal sides
Hyppocrates demonstrated that the aria of the isosceles trapezoid with three equal sides inscribed in a half circle denoted by AA in Figure 14 is equal to the sum of the arias of the three lunes built along the equal sides, denoted by AL and the aria of the half circle built along an equal side of the trapezoid denoted by AB [6].
= ==
= = == = =
= = = =AA
AL
= = = = = = =
= = =
A
BCE
H
M
P
T
D
FK
GN
L
S
V
R
O
x
y
AA A
AB
C
A A A
= +
L A B L A BA A A
LA AABA
AAA
L
ALAA
+=
AAL
BA
A
== =
BL D
- =
A EAA A AA
= = = =
+=
A
A
L BA
A
=
Figure 14: Equivalent figures: AA=AL+AB [6] As seen in Figure 15, the aria of the three lunes is AL=AA-AB.
= ==
= = == = =
= = = =AA
AL
= = = = = = =
= = =
A
BCE
H
M
P
T
D
FK
GN
L
S
V
R
O
x
y
AA A
AB
C
A A A
= +
L A B L A BA A A
LA AABA
AAA
L
ALAA
+=
AAL
BA
A
== =
BL D
- =
A EAA A AA
= = = =
+=
A
A
L BA
A
=
Figure 15: Equivalent figures AL=AA-AB=AD=AE From Figure 16 an original figure with 6 lunes is resulting. Its aria is 2AL= 2AD=2AE
= ==
= = == = =
= = = =AA
AL
= = = = = = =
= = =
A
BCE
H
M
P
T
D
FK
GN
L
S
V
R
O
x
y
AA A
AB
C
A A A
= +
L A B L A BA A A
LA AABA
AAA
L
ALAA
+=
AAL
BA
A
== =
BL D
- =
A EAA A AA
= = = =
+=
A
A
L BA
A
=
Figure 16: Original equivalence: 2AL = 2AD = 2AE
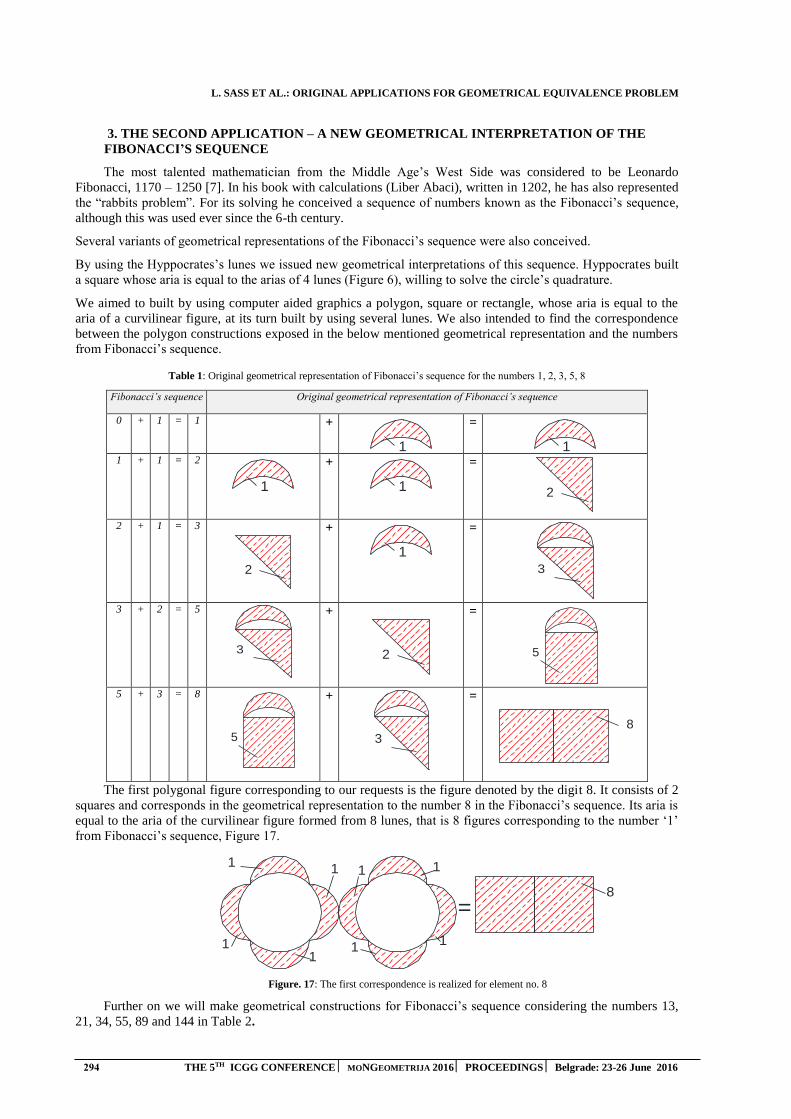
L. SASS ET AL.: ORIGINAL APPLICATIONS FOR GEOMETRICAL EQUIVALENCE PROBLEM
294 THE 5TH ICGG CONFERENCE MONGEOMETRIJA 2016 PROCEEDINGS Belgrade: 23-26 June 2016
3. THE SECOND APPLICATION – A NEW GEOMETRICAL INTERPRETATION OF THEFIBONACCI’S SEQUENCE
The most talented mathematician from the Middle Age’s West Side was considered to be Leonardo Fibonacci, 1170 – 1250 [7]. In his book with calculations (Liber Abaci), written in 1202, he has also represented the “rabbits problem”. For its solving he conceived a sequence of numbers known as the Fibonacci’s sequence, although this was used ever since the 6-th century.
Several variants of geometrical representations of the Fibonacci’s sequence were also conceived.
By using the Hyppocrates’s lunes we issued new geometrical interpretations of this sequence. Hyppocrates built a square whose aria is equal to the arias of 4 lunes (Figure 6), willing to solve the circle’s quadrature.
We aimed to built by using computer aided graphics a polygon, square or rectangle, whose aria is equal to the aria of a curvilinear figure, at its turn built by using several lunes. We also intended to find the correspondence between the polygon constructions exposed in the below mentioned geometrical representation and the numbers from Fibonacci’s sequence.
Table 1: Original geometrical representation of Fibonacci’s sequence for the numbers 1, 2, 3, 5, 8
Fibonacci’s sequence Original geometrical representation of Fibonacci’s sequence
0 + 1 = 1 +
=
8
2
3
5
1
1
1
1 1 1
111
8
=
=
8
2
3
5
1
1
1
1 1 1
111
8
1 + 1 = 2
=
8
2
3
5
1
1
1
1 1 1
111
8
+
=
8
2
3
5
1
1
1
1 1 1
111
8
=
=
8
2
3
5
1
1
1
1 1 1
111
8
2 + 1 = 3
=
8
2
3
5
1
1
1
1 1 1
111
8
+
=
8
2
3
5
1
1
1
1 1 1
111
8
=
=
8
2
3
5
1
1
1
1 1 1
111
8
3 + 2 = 5
=
8
2
3
5
1
1
1
1 1 1
111
8
+
=
8
2
3
5
1
1
1
1 1 1
111
8
=
=
8
2
3
5
1
1
1
1 1 1
111
8
5 + 3 = 8
=
8
2
3
5
1
1
1
1 1 1
111
8
+
=
8
2
3
5
1
1
1
1 1 1
111
8
=
=
8
2
3
5
1
1
1
1 1 1
111
8
The first polygonal figure corresponding to our requests is the figure denoted by the digit 8. It consists of 2 squares and corresponds in the geometrical representation to the number 8 in the Fibonacci’s sequence. Its aria is
equal to the aria of the curvilinear figure formed from 8 lunes, that is 8 figures corresponding to the number ‘1’
from Fibonacci’s sequence, Figure 17.
=
8
2
3
5
1
1
1
1 1 1
111
8
Figure. 17: The first correspondence is realized for element no. 8
Further on we will make geometrical constructions for Fibonacci’s sequence considering the numbers 13, 21, 34, 55, 89 and 144 in Table 2.
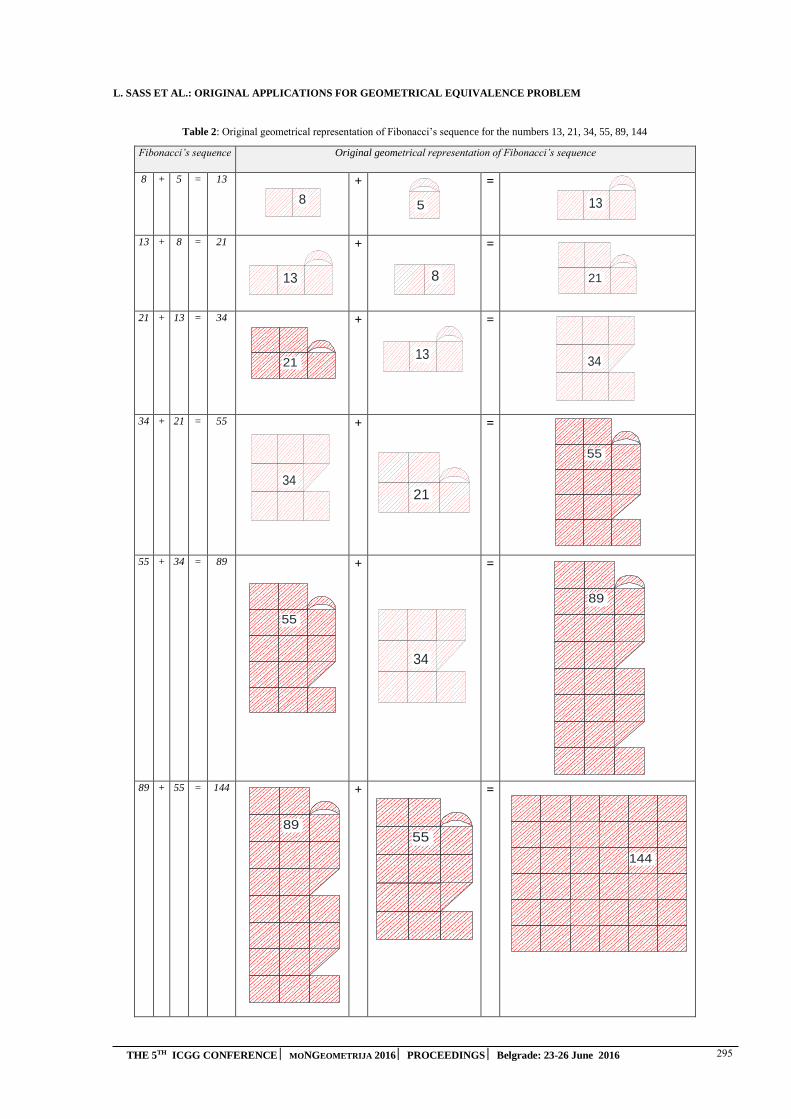
L. SASS ET AL.: ORIGINAL APPLICATIONS FOR GEOMETRICAL EQUIVALENCE PROBLEM
THE 5TH ICGG CONFERENCE MONGEOMETRIJA 2016 PROCEEDINGS Belgrade: 23-26 June 2016 295
Table 2: Original geometrical representation of Fibonacci’s sequence for the numbers 13, 21, 34, 55, 89, 144
Fibonacci’s sequence Original geometrical representation of Fibonacci’s sequence
8 + 5 = 13
34
5
8 13
21
+ 34
5
8 13
21=
34
5
8 13
21
13 + 8 = 21
34
5
8 13
21
+
34
5
8 13
21
= 34
5
8 13
21
21 + 13 = 34
1
1
1
1
1
1
1
1
1
1
1
1
1
1
1
1
1
1
144
55
89
34
5
8 13
21
21
11 1111
55
89
+
34
5
8 13
21
=
34
5
8 13
21
34 + 21 = 55
34
5
8 13
21
+
34
5
8 13
21
=
1
1
1
1
1
1
1
1
1
1
1
1
1
1
1
1
1
1
144
55
89
34
5
8 13
21
21
11 1111
55
89
55 + 34 = 89
1
1
1
1
1
1
1
1
1
1
1
1
1
1
1
1
1
1
144
55
89
34
5
8 13
21
21
11 1111
55
89
+
34
5
8 13
21
=
1
1
1
1
1
1
1
1
1
1
1
1
1
1
1
1
1
1
144
55
89
34
5
8 13
21
21
11 1111
55
89
89 + 55 = 144
1
1
1
1
1
1
1
1
1
1
1
1
1
1
1
1
1
1
144
55
89
34
5
8 13
21
21
11 1111
55
89
+
1
1
1
1
1
1
1
1
1
1
1
1
1
1
1
1
1
1
144
55
89
34
5
8 13
21
21
11 1111
55
89
=
1
1
1
1
1
1
1
1
1
1
1
1
1
1
1
1
1
1
144
55
89
34
5
8 13
21
21
11 1111
55
89

L. SASS ET AL.: ORIGINAL APPLICATIONS FOR GEOMETRICAL EQUIVALENCE PROBLEM
296 THE 5TH ICGG CONFERENCE MONGEOMETRIJA 2016 PROCEEDINGS Belgrade: 23-26 June 2016
We consider that the next figure to meet the imposed conditions is the figure denoted by the number 144. It consists of 36 squares and corresponds in the geometrical representations to the number 144 from Fibonacci’s
sequence. Its aria is equal to the aria of the curvilinear figure formed from 144 lunes, that is 144 geometrical figures corresponding to the number ‘1’ from the sequence, Figure 18.
When continuing this geometrical representation of Fibonacci’s sequence, we could see that we could
obtain (considering the first 46 numbers from the sequence) the correspondence we searched for between the geometrical construction and the numbers from Fibonacci’s sequence for the following numbers: 8, 144, 2584,
46368, 832040, 14930352 and 267914296.
1
1
1
1
1
1
1
1
1
1
1
1
1
1
1
1
1
1
1
1
1
1
1
1
1
1
1
1
1
1
1
1
1
1
1
1
1
1
1
1
1
1
1
1
1
1
1
1
1
1
1
1
1
1
1
1
1
1
1
1
1
1
1
1
1
1
1
1
1
1
1
1
1
1
1
1
1
1
1
1
1
1
1
1
1
1
1
1
1
1
1
1
1
1
1
1
1
1
1
1
1
1
1
1
1
1
1
1
1
1
1
1
1
1
1
1
1
1
1
1
1
1
1
1
1
1
1
1
1
1
1
1
1
1
1
1
1
1
1
1
1
1
1
1
=144
Figure 18: The second correspondence is realized for the element no. 144
4. THE THIRD APPLICATION – ORIGINAL MECHANISM TO GENERATED THE LUNESALONG OF A HEXAGON
We continued the researches on tracing lunes with mechanisms along polygons’ sides, square and rectangle as presented in [2]. Therefore we have built an original mechanism with two leading elements to generate lunes along the sides of a hexagon inscribed in a circle with the radius R.
The first arc of a lune is a half-circle with the radius R/2 whose center is in a fixed point, placed in the middle of the hexagon side. The fix points on the schematic of the mechanism are A, E, H, M, P and T, Figure 20.
In order to trace the 6 arcs we used the first leading element, the crank AB with a tracing point B for the first lune. An arm is added to the element AB (under an angle of 120o, equal to the angle between the hexagon’s
sides) in the point A. This arm ecomes the crank of an articulated parallelogram mechanism defined by the points ACDE. The point D is tracing the second arc of lune along the second side of the hexagon. Considering this principle a sequence of articulated parallelograms is made. The tracing points for the 6 lune’s arcs will be B,
D, G, L, V and S.
The second arc of lunes is quite the circle of radius R, circumscribed to the hexagon. It is traced by using the second leading element, OW, which is a road whose articulation is linked to the base in the center of the reference system and the tracing point placed at the distance R.
Calculations of the following coordinates were made by using the calculation relations established through the method of contours from the Theory of Mechanisms: for the fixed couples A, E, H, M, P, T, for the couples that became tracing points B, D, G, L, V and S and respectively for the other couples. Curves were generated along the hexagon’s sides. In order to verify the results, the hexagon from Figure 19 was generated with our program.

L. SASS ET AL.: ORIGINAL APPLICATIONS FOR GEOMETRICAL EQUIVALENCE PROBLEM
THE 5TH ICGG CONFERENCE MONGEOMETRIJA 2016 PROCEEDINGS Belgrade: 23-26 June 2016 297
Figure 19: Verification for the generation of the hexagon on whose sides the lunes are to be traced
A
L
x
y
B
CD
E
KF
H
N M P
R
S
T
G
O
V
W
Figure 20. Kinematical schema of the mechanism used to generate the lunes along a hexagon sides. Figures 21 (a) presents the subsequent positions of the mechanism for a full rotation of the leading element.
Figure 21 (b) depicts the mechanism’s animation for the domain of lunes’ generation.
(a) (b) Figure 21: (a) Subsequent positions of the mechanism for a full rotation of the first leading element,
and (b) Animation of mechanism for the domain of lunes generation The 6 lunes generated along the hexagon sides by the original mechanism are depicted by Figure 22.
Figure 16 also depicts them.

L. SASS ET AL.: ORIGINAL APPLICATIONS FOR GEOMETRICAL EQUIVALENCE PROBLEM
298 THE 5TH ICGG CONFERENCE MONGEOMETRIJA 2016 PROCEEDINGS Belgrade: 23-26 June 2016
R
Figure 22. Six lunes generated along the hexagon sides
CONCLUSIONS
The results presented in this paper provide few basic conclusions:
although the lunes were discovered by Greeks in Antiquity, they still provide directions forstudy,
they are important when considering the correlation of the areas of these figures with curvesides with other figures whose sides are straight lines; many interesting situations appear in this context,
many variants of lunes and figures, with remarkable aesthetic properties were obtained;they are similar to leaves or flowers from nature, and
it was proven that lunes can also be generated by mechanisms; exemplification withhexagons were provided.
REFERENCES
1. AutoCAD Tutorial, 2015.
2. Popescu, I. and Sass, L., 2000, Lunulele lui Hippocrate. The VII th edition of the National Conference
with international participation, GRAFICA 2000, 19-21 october, Craiova, Romania, SectiuneaGeometrie descriptiva, vol. I, pp. 337-340, ISSN 1223-5296.
3. http://www.scientia.ro/stiinta-la-minut/istoria-ideilor-si-descoperirilor-stiintifice/309-cum- functioneaza-cuadratura-cercului.html [Accessed: 1st December 2015].
4. https://matematicasiesoja.wordpress.com/problemas-de-lunulas/ [Accessed: 1st February 2016].
5. http://geometria-problemas.blogspot.ro/2011/04/problema-geometria-76-cuadrado.html [Accessed: 1st November 2015].
6. http://areeweb.polito.it/didattica/polymath/htmlS/argoment/ParoleMate/Ott_06/LunuleIppocrate.htm[Accessed: 1st December 2015].
7. https://ro.wikipedia.org/wiki/Fibonacci [Accessed: 11 th November 2015].
A. ČUČAKOVIĆ ET AL.: PAPER STRIPS DRIVEN DESIGN – APPLICATION ON DOUBLY CURVED SURFACES
THE 5TH ICGG CONFERENCE MONGEOMETRIJA 2016 PROCEEDINGS Belgrade: 23-26 June 2016 299
PAPER STRIPS DRIVEN DESIGN – APPLICATION ON DOUBLY CURVED SURFACES
Aleksandar Čučaković
Faculty of Civil Engineering, University of Belgrade, Belgrade, Serbia
PhD., Associate Professor, [email protected]
Biljana Jović
Faculty of Forestry, University of Belgrade, Belgrade, Serbia
PhD., Docent, [email protected]
Miloš Tripković
Faculty of Forestry, University of Belgrade, Belgrade, Serbia
Student, [email protected]
ABSTRACT
In this paper, we address the challenge of overcoming the problem of developing doubly
curved surfaces in product design.
Product design uses two kinds of surfaces, developable surfaces and non-developable surfaces,
which are also called singly and doubly curved surfaces, respectively. A developable surface has
zero Gaussian curvature at all points, while a non-developable surface has non-zero Gaussian
curvature at least in some region. Surfaces of many product design object are commonly created as
doubly curved shapes to meet requirements of structure and aesthetic.
The problem of creating the planar development of 3D surfaces with double curvature in the
product design depends on the shape of the surface and the material of the surface cover. Therefore,
the method of deriving a pattern is different when external forces are used in order to generate the
plane patterns such as paper strips from the case when the plane shape can stretch or deform to fit
on the 3D surface.
Given a three-dimensional object surface, the first step of the fabrication process is flattening
or planar development of this surface into a planar shape so that the manufacturer can not only
determine the initial shape of the object but also estimate the strain distribution required to form the
shape depending on a material.
The paper is analysing and rationalizing doubly curved surface of a given shape by multiple
strips of paper glued onto a surface. Results are addressing possibilities of achieving an overall
smooth surface and developing a model for the generation of curvature continuous surfaces
composed of paper strip surfaces, as well as generating alternative solutions that are in the domain
of contemporary product design. The paper illustrates usability and different variations of the
proposed design.
Keywords: doubly curved rotational surfaces; geodesic strip models; paper strips; product design
SUBJECT CODE: Applied Geometry, Geometric Aspects of Art and Design
A. ČUČAKOVIĆ ET AL.: PAPER STRIPS DRIVEN DESIGN – APPLICATION ON DOUBLY CURVED SURFACES
300 THE 5TH ICGG CONFERENCE MONGEOMETRIJA 2016 PROCEEDINGS Belgrade: 23-26 June 2016
INTRODUCTION
The basic division of the smooth surfaces are on the developable and non-developable surfaces, which are also called singly and doubly curved surfaces. There are several ways to generate doubly curved surfaces which are continuous. The difference between developable and non-developable surfaces is that with the developable surfaces tangential plane is touching the surface by line, and in non-developable surfaces at every point of the surface there is a special tangential plane. All doubly curved surfaces are non-developable, and may be generated in different ways.
Among doubly curved surfaces are rotational surfaces. Special forms of rotational surfaces are seen widely in architecture and design. Spheres, cylinders, cones and torus are well-known representatives of this surface class.
Rotational surfaces are generated by rotating a planar or spatial curve about an axis. It is recommended that rotational surfaces may be generated using planar meridian curves rather than arbitrary spatial curves. Meridian curves are symmetric to the rotational axis. Every point of the generating curve describes a circle whose supporting plane lies orthogonally to the axis. Thus, every rotational surfaces carries a set of circles in parallel planes which we call parallel circles.
Planes that contain the axis of the rotational surface intersect the surface along congruent planar curves, the meridian curves. The supporting planes of the parallel circles and the meridian planes of the meridian curves are orthogonal. This implies that the meridian curves and the parallel circles also intersect at right angles. They form a net of orthogonal curves on the surface.
The principles of the generation of the rotational surfaces has been used in design and architecture. Smooth rotational surfaces can be frequently found in modern design. However, they are sometimes not suitable for putting design ideas into practise. When constructing actual physical object we often need discrete or semi-discrete model that sufficiently approximates the smooth surfaces that it is designed with CAD software. In some cases we have to replace smooth surfaces with appropriate planar faces that may be manufactured in a more convenient way. By substituting the meridian curve with the polyline, one obtains a surface formed by conical or cylindrical strips. If the rotation is discretized it generates polyhedral surface (discrete rotational surface). This surface can be used as a suitable replacement for the original surface whose basic elements can be developed in to the plane.
Doubly curved rotational surface is non-developable surface and as such is unsuitable for coating its surface with smooth straight stripes. In overcoming this specific problem it is necessary to use the geodesic line of the surface. Geodesic curves are the shortest line distances between two points on the surface. Geodesic line is the curve on the surface in which in each point the geodesic curvature is zero.
Geometry of doubly curved anticlastic surfaces
The shape of the contours of surfaces can vary between geometrically regular or irregular, polygonal or curved. Form of the surface is related to the nature of its curves and surfaces generation technique. Depending on the sign of the Gaussian curvature that is defined by the
1
2121
rrKKKg
(Eq. 1)
where
11
1r
K (Eq. 2)
is the first main curvature, and
22
1r
K (Eq. 3)
the second main curvature at the specific point of the surface, it is possible to carry out classification of surfaces in the following manner:
Singly curved surfaces:
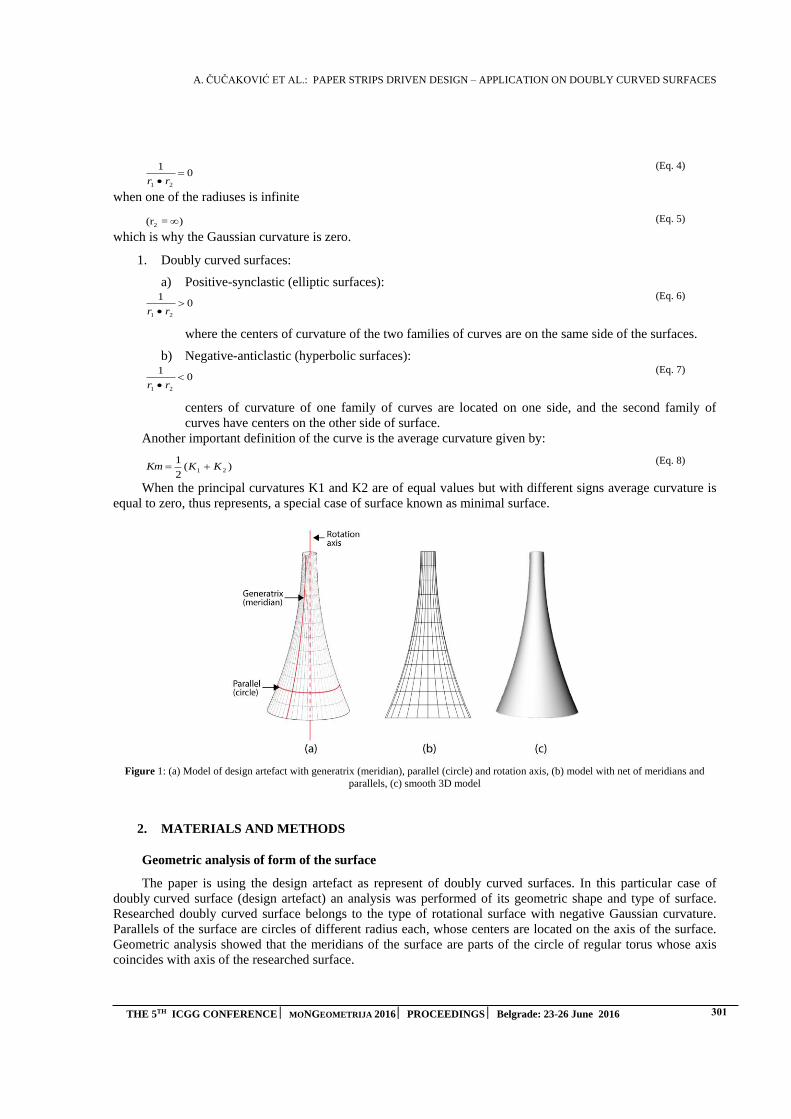
A. ČUČAKOVIĆ ET AL.: PAPER STRIPS DRIVEN DESIGN – APPLICATION ON DOUBLY CURVED SURFACES
THE 5TH ICGG CONFERENCE MONGEOMETRIJA 2016 PROCEEDINGS Belgrade: 23-26 June 2016 301
01
21
rr
(Eq. 4)
when one of the radiuses is infinite
)=(r2 (Eq. 5)
which is why the Gaussian curvature is zero.
1. Doubly curved surfaces:a) Positive-synclastic (elliptic surfaces):
01
21
rr
(Eq. 6)
where the centers of curvature of the two families of curves are on the same side of the surfaces.
b) Negative-anticlastic (hyperbolic surfaces):01
21
rr
(Eq. 7)
centers of curvature of one family of curves are located on one side, and the second family of curves have centers on the other side of surface.
Another important definition of the curve is the average curvature given by:
)(21
21 KKKm (Eq. 8)
When the principal curvatures K1 and K2 are of equal values but with different signs average curvature is equal to zero, thus represents, a special case of surface known as minimal surface.
Figure 1: (a) Model of design artefact with generatrix (meridian), parallel (circle) and rotation axis, (b) model with net of meridians and parallels, (c) smooth 3D model
2. MATERIALS AND METHODS
Geometric analysis of form of the surface
The paper is using the design artefact as represent of doubly curved surfaces. In this particular case of doubly curved surface (design artefact) an analysis was performed of its geometric shape and type of surface. Researched doubly curved surface belongs to the type of rotational surface with negative Gaussian curvature. Parallels of the surface are circles of different radius each, whose centers are located on the axis of the surface. Geometric analysis showed that the meridians of the surface are parts of the circle of regular torus whose axis coincides with axis of the researched surface.
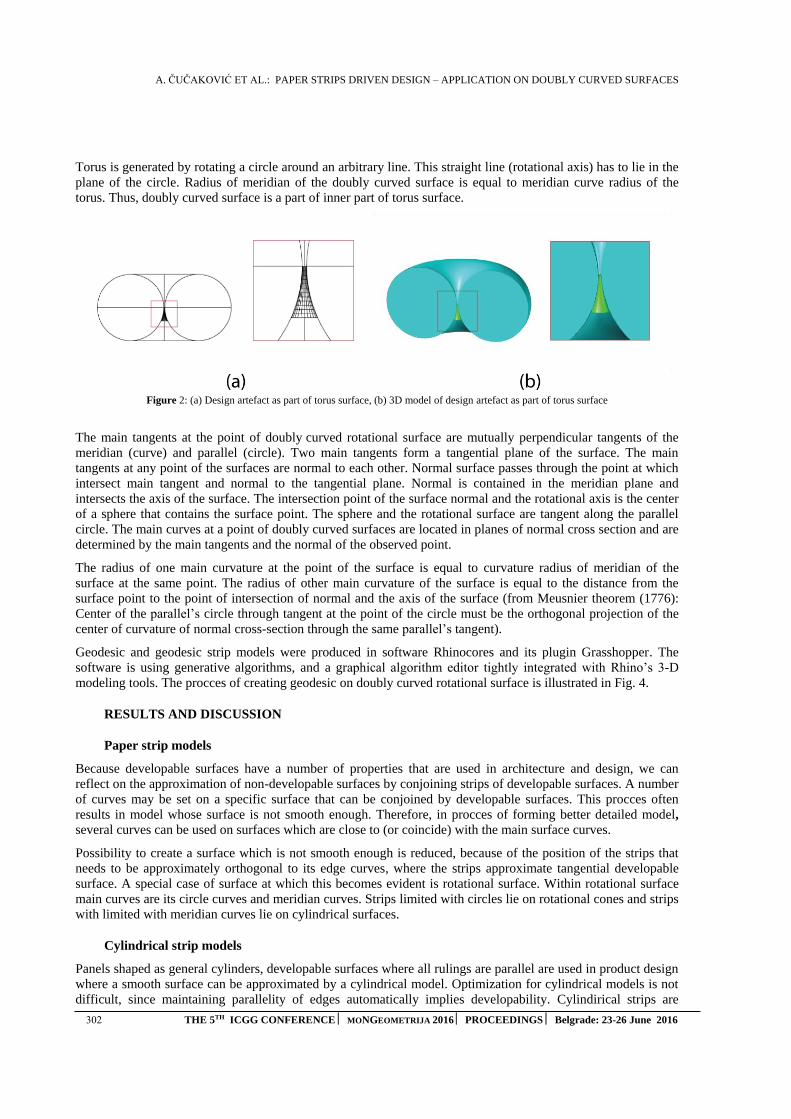
A. ČUČAKOVIĆ ET AL.: PAPER STRIPS DRIVEN DESIGN – APPLICATION ON DOUBLY CURVED SURFACES
302 THE 5TH ICGG CONFERENCE MONGEOMETRIJA 2016 PROCEEDINGS Belgrade: 23-26 June 2016
Torus is generated by rotating a circle around an arbitrary line. This straight line (rotational axis) has to lie in the plane of the circle. Radius of meridian of the doubly curved surface is equal to meridian curve radius of the torus. Thus, doubly curved surface is a part of inner part of torus surface.
Figure 2: (a) Design artefact as part of torus surface, (b) 3D model of design artefact as part of torus surface
The main tangents at the point of doubly curved rotational surface are mutually perpendicular tangents of the meridian (curve) and parallel (circle). Two main tangents form a tangential plane of the surface. The main tangents at any point of the surfaces are normal to each other. Normal surface passes through the point at which intersect main tangent and normal to the tangential plane. Normal is contained in the meridian plane and intersects the axis of the surface. The intersection point of the surface normal and the rotational axis is the center of a sphere that contains the surface point. The sphere and the rotational surface are tangent along the parallel circle. The main curves at a point of doubly curved surfaces are located in planes of normal cross section and are determined by the main tangents and the normal of the observed point.
The radius of one main curvature at the point of the surface is equal to curvature radius of meridian of the surface at the same point. The radius of other main curvature of the surface is equal to the distance from the surface point to the point of intersection of normal and the axis of the surface (from Meusnier theorem (1776): Center of the parallel’s circle through tangent at the point of the circle must be the orthogonal projection of the center of curvature of normal cross-section through the same parallel’s tangent).
Geodesic and geodesic strip models were produced in software Rhinocores and its plugin Grasshopper. The software is using generative algorithms, and a graphical algorithm editor tightly integrated with Rhino’s 3-D modeling tools. The procces of creating geodesic on doubly curved rotational surface is illustrated in Fig. 4.
RESULTS AND DISCUSSION
Paper strip models
Because developable surfaces have a number of properties that are used in architecture and design, we can reflect on the approximation of non-developable surfaces by conjoining strips of developable surfaces. A number of curves may be set on a specific surface that can be conjoined by developable surfaces. This procces often results in model whose surface is not smooth enough. Therefore, in procces of forming better detailed model, several curves can be used on surfaces which are close to (or coincide) with the main surface curves.
Possibility to create a surface which is not smooth enough is reduced, because of the position of the strips that needs to be approximately orthogonal to its edge curves, where the strips approximate tangential developable surface. A special case of surface at which this becomes evident is rotational surface. Within rotational surface main curves are its circle curves and meridian curves. Strips limited with circles lie on rotational cones and strips with limited with meridian curves lie on cylindrical surfaces.
Cylindrical strip models
Panels shaped as general cylinders, developable surfaces where all rulings are parallel are used in product design where a smooth surface can be approximated by a cylindrical model. Optimization for cylindrical models is not difficult, since maintaining parallelity of edges automatically implies developability. Cylindirical strips are
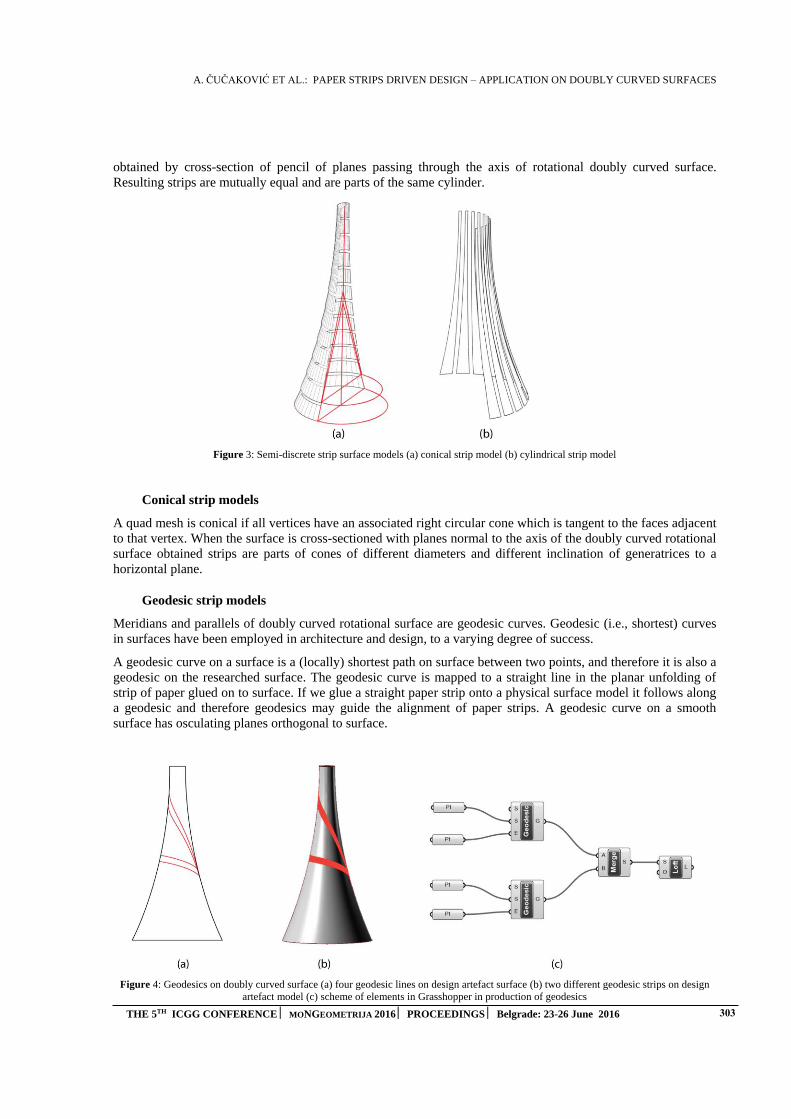
A. ČUČAKOVIĆ ET AL.: PAPER STRIPS DRIVEN DESIGN – APPLICATION ON DOUBLY CURVED SURFACES
THE 5TH ICGG CONFERENCE MONGEOMETRIJA 2016 PROCEEDINGS Belgrade: 23-26 June 2016 303
obtained by cross-section of pencil of planes passing through the axis of rotational doubly curved surface. Resulting strips are mutually equal and are parts of the same cylinder.
Figure 3: Semi-discrete strip surface models (a) conical strip model (b) cylindrical strip model
Conical strip models
A quad mesh is conical if all vertices have an associated right circular cone which is tangent to the faces adjacent to that vertex. When the surface is cross-sectioned with planes normal to the axis of the doubly curved rotational surface obtained strips are parts of cones of different diameters and different inclination of generatrices to a horizontal plane.
Geodesic strip models
Meridians and parallels of doubly curved rotational surface are geodesic curves. Geodesic (i.e., shortest) curves in surfaces have been employed in architecture and design, to a varying degree of success.
A geodesic curve on a surface is a (locally) shortest path on surface between two points, and therefore it is also a geodesic on the researched surface. The geodesic curve is mapped to a straight line in the planar unfolding of strip of paper glued on to surface. If we glue a straight paper strip onto a physical surface model it follows along a geodesic and therefore geodesics may guide the alignment of paper strips. A geodesic curve on a smooth surface has osculating planes orthogonal to surface.
Figure 4: Geodesics on doubly curved surface (a) four geodesic lines on design artefact surface (b) two different geodesic strips on design artefact model (c) scheme of elements in Grasshopper in production of geodesics

A. ČUČAKOVIĆ ET AL.: PAPER STRIPS DRIVEN DESIGN – APPLICATION ON DOUBLY CURVED SURFACES
304 THE 5TH ICGG CONFERENCE MONGEOMETRIJA 2016 PROCEEDINGS Belgrade: 23-26 June 2016
In the semi-discrete case, we therefore define that a D-strip model is a geodesic model, if the osculating planes of edge curves bisect adjacent strips. Such bisector planes are reasonable planes “orthogonal” to the strip model
(which is itself not smooth), if the strip model converges to a smooth surface, those planes converge to exactly orthogonal planes.
It seems feasible to cut them (planar paper strips) out of long rectangular panels. Typically a freeform surface is covered not by one, but by several geodesic D-strip models. In this case the surface can be covered by one geodesic D-strip model, such as conical strip model, as well as cylindrical strip model, but also may be covered with differente families of geodesic strips.
Each edge curve of a geodesic model has oppositely equal geodesic curvatures with respect to adjacent strips. Consequently, developing these strips yields oppositely congruent boundaries. The properties of strips imply that the development of the single strip is approximately straight.
CONCLUSION
In this paper, the problem of designing planar paper strip that corresponds to a part of smooth doubly curved surface has been addressed.
The paper in the first part analyzes the basic geometry of the design artefact - doubly curved rotational surface, after wich deals with geometrical analysis of the given form and its generation as a part of the surface of the torus.
The introduced method of dealing with the problem of first stage is based on usage of elements of the geodesic and Gaussian curvature. Conical and cylindrical strip models are introduced as an alternative method for generating an initial planar development of doubly curved surfaces.
The paper suggests geodesic strip model as a posible solution for developing, but also skinning (covering surface with glued paper strips) doubly curved rotational surface.
ACKNOWLEDGEMENTS
Authors are supported by the Ministry of Education, Science and Technological Development of the Republic of Serbia, Project No. TP 36008.
REFERENCES
1. Azariadis P., Aspragathos N., 1997, Design of plane developments of doubly curved surfacesComputer Aided Design, Vol. 29, No. 10, pp. 675-665, Great Britain.
2. Cucakovic A., Nestorovic M., Jovic B., 2010, Free form surfaces structures, University of Belgrade,Serbia, Proceedings Mongeometrija, Belgrade.
3. Gonzalez-Quintial F., et al., 2014, Freeform surfaces adaptation using planar quadrilateral facets,16th International conference on geometry and graphics, Innsbruck, Austria.
4. Maurin B., Motro R., 2013, Textile Architecture. Materiaux Composites Souples en Architecture,Construction et Interieurs, Birkhauser, 13 p.
5. Postle B., 2012, Methods for creating Curved Shell Structures From Sheet Materials, Buildings, No.2, pp.424-455, UK.
6. Pottmann H., et al., 2007. Freeform surfaces from single curved panels, to appear (Siggraph 2008).
7. Yu G., Patrikalakis N., Maekawa T., 2000, Optimal development of doubly curved surfaces,Massachusetts Institute of Technology, Department of Ocean Engineering, Design Laboratory,Cambridge, MA 02139-4307, USA.
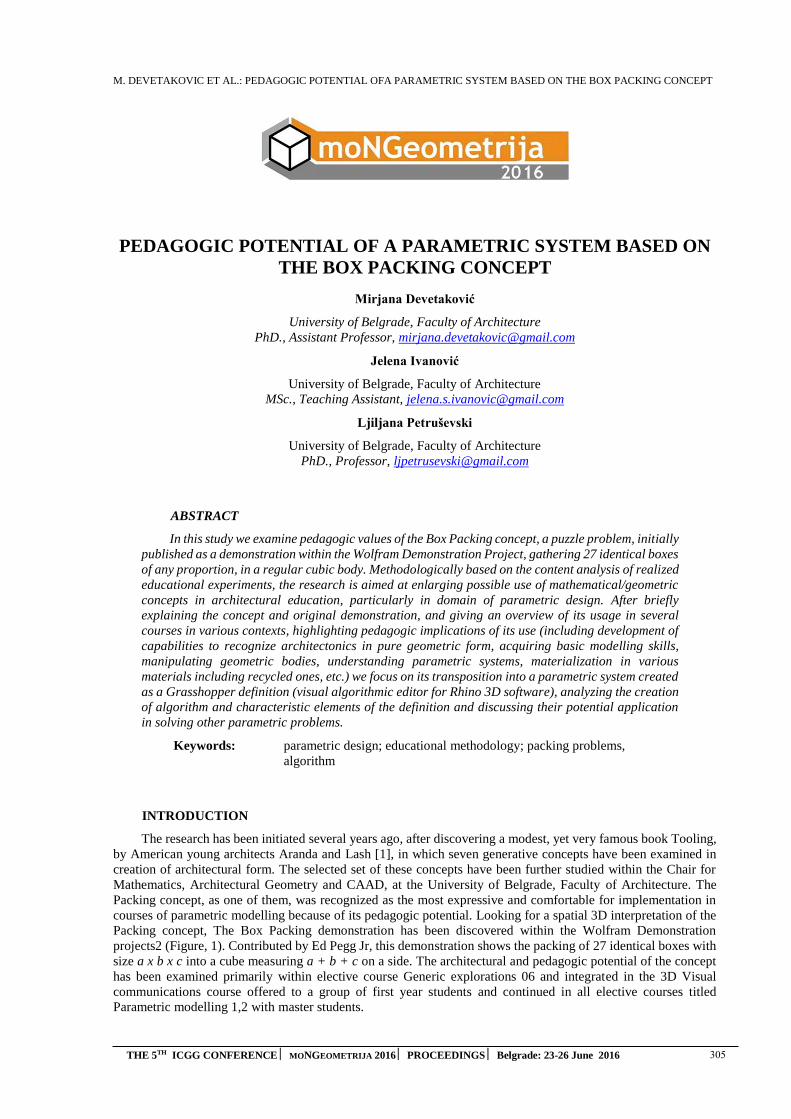
M. DEVETAKOVIC ET AL.: PEDAGOGIC POTENTIAL OFA PARAMETRIC SYSTEM BASED ON THE BOX PACKING CONCEPT
THE 5TH ICGG CONFERENCE MONGEOMETRIJA 2016 PROCEEDINGS Belgrade: 23-26 June 2016 305
PEDAGOGIC POTENTIAL OF A PARAMETRIC SYSTEM BASED ON
THE BOX PACKING CONCEPT
Mirjana Devetaković
University of Belgrade, Faculty of Architecture
PhD., Assistant Professor, [email protected]
Jelena Ivanović
University of Belgrade, Faculty of Architecture
MSc., Teaching Assistant, [email protected]
Ljiljana Petruševski
University of Belgrade, Faculty of Architecture
PhD., Professor, [email protected]
ABSTRACT
In this study we examine pedagogic values of the Box Packing concept, a puzzle problem, initially
published as a demonstration within the Wolfram Demonstration Project, gathering 27 identical boxes
of any proportion, in a regular cubic body. Methodologically based on the content analysis of realized
educational experiments, the research is aimed at enlarging possible use of mathematical/geometric
concepts in architectural education, particularly in domain of parametric design. After briefly
explaining the concept and original demonstration, and giving an overview of its usage in several
courses in various contexts, highlighting pedagogic implications of its use (including development of
capabilities to recognize architectonics in pure geometric form, acquiring basic modelling skills,
manipulating geometric bodies, understanding parametric systems, materialization in various
materials including recycled ones, etc.) we focus on its transposition into a parametric system created
as a Grasshopper definition (visual algorithmic editor for Rhino 3D software), analyzing the creation
of algorithm and characteristic elements of the definition and discussing their potential application
in solving other parametric problems.
Keywords: parametric design; educational methodology; packing problems,
algorithm
INTRODUCTION
The research has been initiated several years ago, after discovering a modest, yet very famous book Tooling,
by American young architects Aranda and Lash [1], in which seven generative concepts have been examined in
creation of architectural form. The selected set of these concepts have been further studied within the Chair for
Mathematics, Architectural Geometry and CAAD, at the University of Belgrade, Faculty of Architecture. The
Packing concept, as one of them, was recognized as the most expressive and comfortable for implementation in
courses of parametric modelling because of its pedagogic potential. Looking for a spatial 3D interpretation of the
Packing concept, The Box Packing demonstration has been discovered within the Wolfram Demonstration
projects2 (Figure, 1). Contributed by Ed Pegg Jr, this demonstration shows the packing of 27 identical boxes with
size a x b x c into a cube measuring a + b + c on a side. The architectural and pedagogic potential of the concept
has been examined primarily within elective course Generic explorations 06 and integrated in the 3D Visual
communications course offered to a group of first year students and continued in all elective courses titled
Parametric modelling 1,2 with master students.
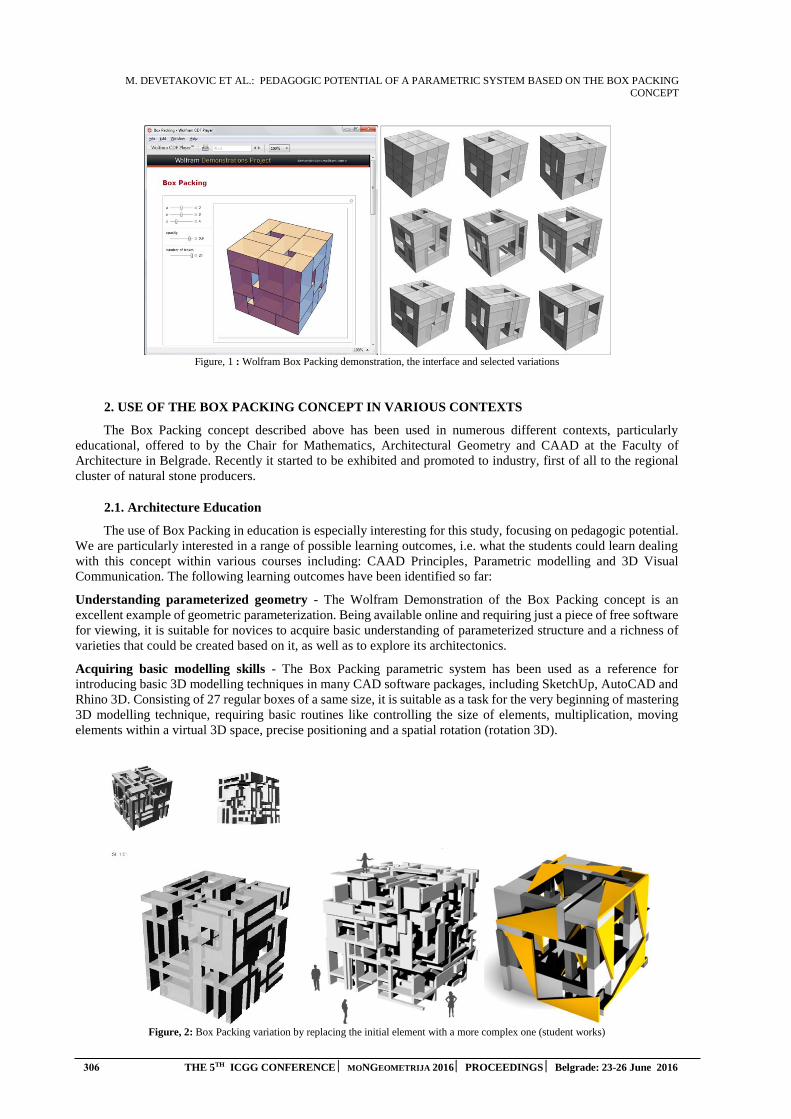
M. DEVETAKOVIC ET AL.: PEDAGOGIC POTENTIAL OF A PARAMETRIC SYSTEM BASED ON THE BOX PACKING
CONCEPT
306 THE 5TH ICGG CONFERENCE MONGEOMETRIJA 2016 PROCEEDINGS Belgrade: 23-26 June 2016
Figure, 1 : Wolfram Box Packing demonstration, the interface and selected variations
2. USE OF THE BOX PACKING CONCEPT IN VARIOUS CONTEXTS
The Box Packing concept described above has been used in numerous different contexts, particularly
educational, offered to by the Chair for Mathematics, Architectural Geometry and CAAD at the Faculty of
Architecture in Belgrade. Recently it started to be exhibited and promoted to industry, first of all to the regional
cluster of natural stone producers.
2.1. Architecture Education
The use of Box Packing in education is especially interesting for this study, focusing on pedagogic potential.
We are particularly interested in a range of possible learning outcomes, i.e. what the students could learn dealing
with this concept within various courses including: CAAD Principles, Parametric modelling and 3D Visual
Communication. The following learning outcomes have been identified so far:
Understanding parameterized geometry - The Wolfram Demonstration of the Box Packing concept is an
excellent example of geometric parameterization. Being available online and requiring just a piece of free software
for viewing, it is suitable for novices to acquire basic understanding of parameterized structure and a richness of
varieties that could be created based on it, as well as to explore its architectonics.
Acquiring basic modelling skills - The Box Packing parametric system has been used as a reference for
introducing basic 3D modelling techniques in many CAD software packages, including SketchUp, AutoCAD and
Rhino 3D. Consisting of 27 regular boxes of a same size, it is suitable as a task for the very beginning of mastering
3D modelling technique, requiring basic routines like controlling the size of elements, multiplication, moving
elements within a virtual 3D space, precise positioning and a spatial rotation (rotation 3D).
Figure, 2: Box Packing variation by replacing the initial element with a more complex one (student works)
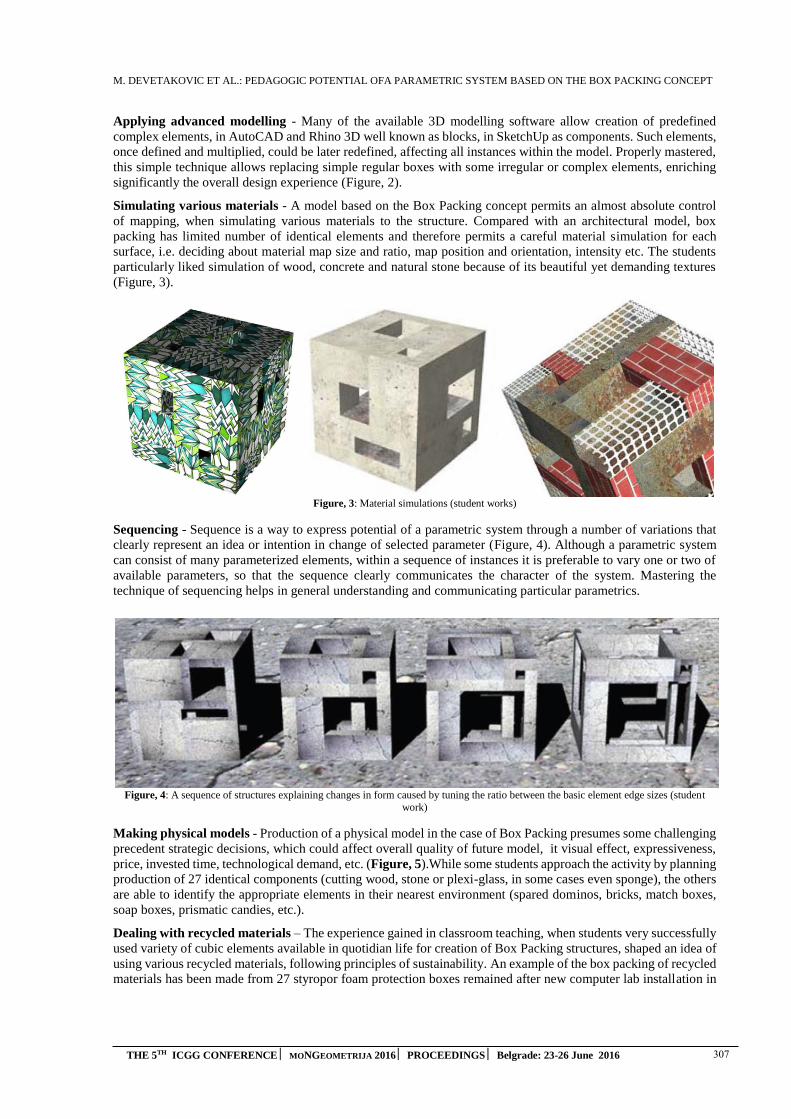
M. DEVETAKOVIC ET AL.: PEDAGOGIC POTENTIAL OFA PARAMETRIC SYSTEM BASED ON THE BOX PACKING CONCEPT
THE 5TH ICGG CONFERENCE MONGEOMETRIJA 2016 PROCEEDINGS Belgrade: 23-26 June 2016 307
Applying advanced modelling - Many of the available 3D modelling software allow creation of predefined
complex elements, in AutoCAD and Rhino 3D well known as blocks, in SketchUp as components. Such elements,
once defined and multiplied, could be later redefined, affecting all instances within the model. Properly mastered,
this simple technique allows replacing simple regular boxes with some irregular or complex elements, enriching
significantly the overall design experience (Figure, 2).
Simulating various materials - A model based on the Box Packing concept permits an almost absolute control
of mapping, when simulating various materials to the structure. Compared with an architectural model, box
packing has limited number of identical elements and therefore permits a careful material simulation for each
surface, i.e. deciding about material map size and ratio, map position and orientation, intensity etc. The students
particularly liked simulation of wood, concrete and natural stone because of its beautiful yet demanding textures
(Figure, 3).
Figure, 3: Material simulations (student works)
Sequencing - Sequence is a way to express potential of a parametric system through a number of variations that
clearly represent an idea or intention in change of selected parameter (Figure, 4). Although a parametric system
can consist of many parameterized elements, within a sequence of instances it is preferable to vary one or two of
available parameters, so that the sequence clearly communicates the character of the system. Mastering the
technique of sequencing helps in general understanding and communicating particular parametrics.
Figure, 4: A sequence of structures explaining changes in form caused by tuning the ratio between the basic element edge sizes (student
work)
Making physical models - Production of a physical model in the case of Box Packing presumes some challenging
precedent strategic decisions, which could affect overall quality of future model, it visual effect, expressiveness,
price, invested time, technological demand, etc. (Figure, 5).While some students approach the activity by planning
production of 27 identical components (cutting wood, stone or plexi-glass, in some cases even sponge), the others
are able to identify the appropriate elements in their nearest environment (spared dominos, bricks, match boxes,
soap boxes, prismatic candies, etc.).
Dealing with recycled materials – The experience gained in classroom teaching, when students very successfully
used variety of cubic elements available in quotidian life for creation of Box Packing structures, shaped an idea of
using various recycled materials, following principles of sustainability. An example of the box packing of recycled
materials has been made from 27 styropor foam protection boxes remained after new computer lab installation in
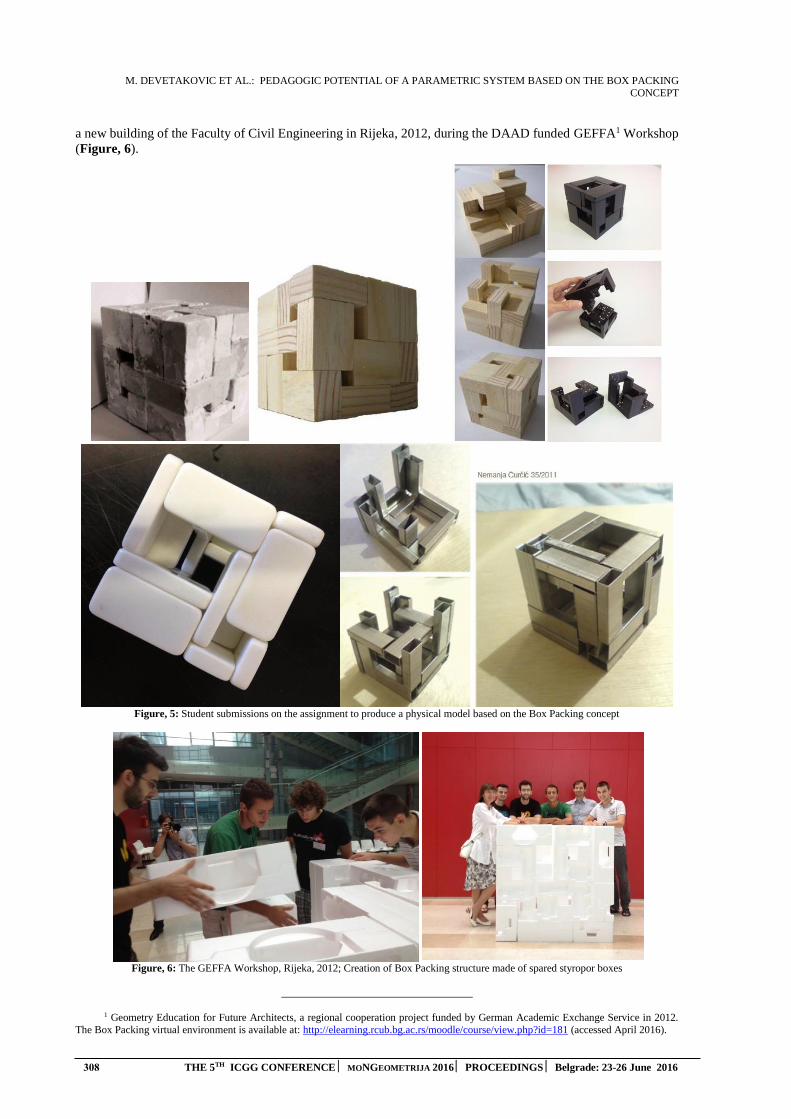
M. DEVETAKOVIC ET AL.: PEDAGOGIC POTENTIAL OF A PARAMETRIC SYSTEM BASED ON THE BOX PACKING
CONCEPT
308 THE 5TH ICGG CONFERENCE MONGEOMETRIJA 2016 PROCEEDINGS Belgrade: 23-26 June 2016
a new building of the Faculty of Civil Engineering in Rijeka, 2012, during the DAAD funded GEFFA1 Workshop
(Figure, 6).
Figure, 5: Student submissions on the assignment to produce a physical model based on the Box Packing concept
Figure, 6: The GEFFA Workshop, Rijeka, 2012; Creation of Box Packing structure made of spared styropor boxes
1 Geometry Education for Future Architects, a regional cooperation project funded by German Academic Exchange Service in 2012.
The Box Packing virtual environment is available at: http://elearning.rcub.bg.ac.rs/moodle/course/view.php?id=181 (accessed April 2016).
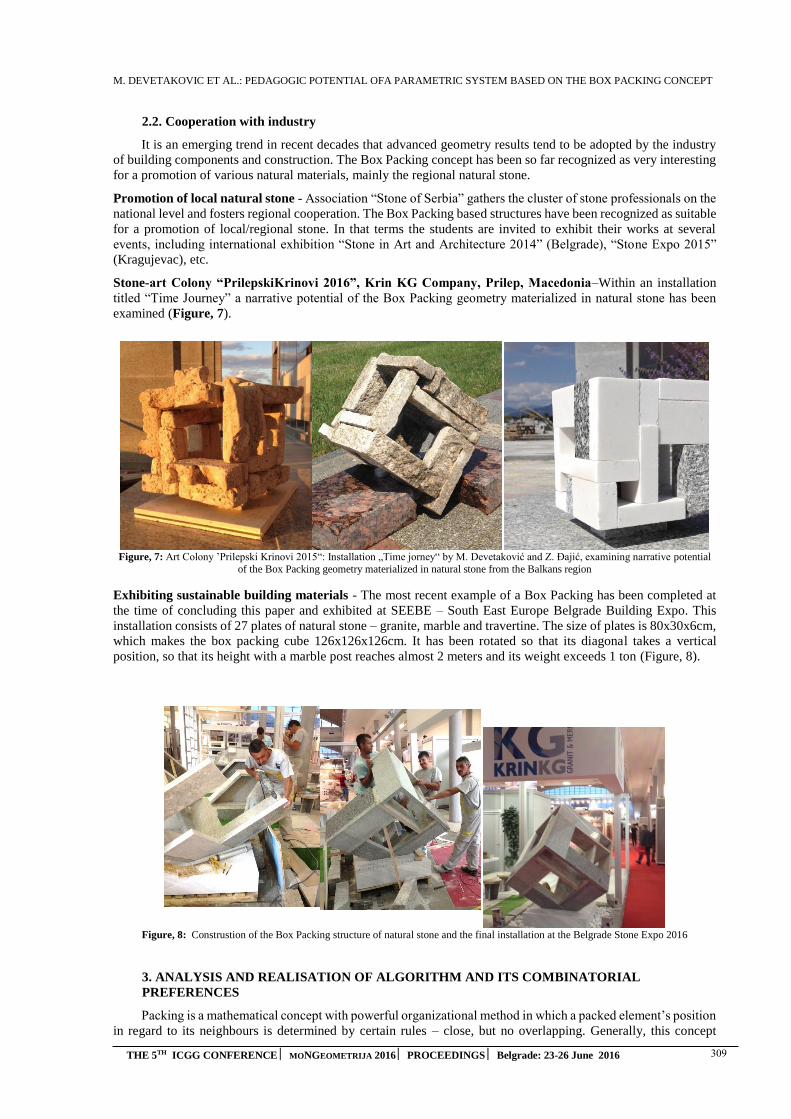
M. DEVETAKOVIC ET AL.: PEDAGOGIC POTENTIAL OFA PARAMETRIC SYSTEM BASED ON THE BOX PACKING CONCEPT
THE 5TH ICGG CONFERENCE MONGEOMETRIJA 2016 PROCEEDINGS Belgrade: 23-26 June 2016 309
2.2. Cooperation with industry
It is an emerging trend in recent decades that advanced geometry results tend to be adopted by the industry
of building components and construction. The Box Packing concept has been so far recognized as very interesting
for a promotion of various natural materials, mainly the regional natural stone.
Promotion of local natural stone - Association “Stone of Serbia” gathers the cluster of stone professionals on the
national level and fosters regional cooperation. The Box Packing based structures have been recognized as suitable
for a promotion of local/regional stone. In that terms the students are invited to exhibit their works at several
events, including international exhibition “Stone in Art and Architecture 2014” (Belgrade), “Stone Expo 2015”
(Kragujevac), etc.
Stone-art Colony “PrilepskiKrinovi 2016”, Krin KG Company, Prilep, Macedonia–Within an installation
titled “Time Journey” a narrative potential of the Box Packing geometry materialized in natural stone has been
examined (Figure, 7).
Figure, 7: Art Colony ’Prilepski Krinovi 2015“: Installation „Time jorney“ by M. Devetaković and Z. Đajić, examining narrative potential
of the Box Packing geometry materialized in natural stone from the Balkans region
Exhibiting sustainable building materials - The most recent example of a Box Packing has been completed at
the time of concluding this paper and exhibited at SEEBE – South East Europe Belgrade Building Expo. This
installation consists of 27 plates of natural stone – granite, marble and travertine. The size of plates is 80x30x6cm,
which makes the box packing cube 126x126x126cm. It has been rotated so that its diagonal takes a vertical
position, so that its height with a marble post reaches almost 2 meters and its weight exceeds 1 ton (Figure, 8).
Figure, 8: Construstion of the Box Packing structure of natural stone and the final installation at the Belgrade Stone Expo 2016
3. ANALYSIS AND REALISATION OF ALGORITHM AND ITS COMBINATORIAL
PREFERENCES
Packing is a mathematical concept with powerful organizational method in which a packed element’s position
in regard to its neighbours is determined by certain rules – close, but no overlapping. Generally, this concept
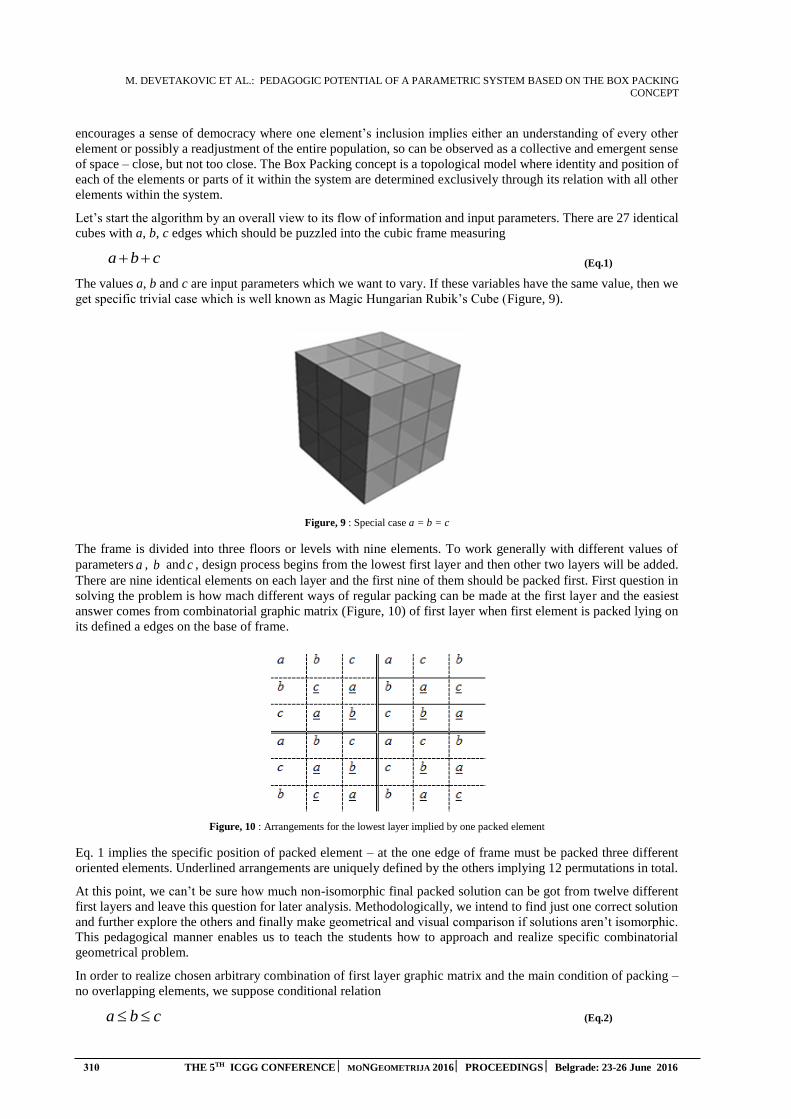
M. DEVETAKOVIC ET AL.: PEDAGOGIC POTENTIAL OF A PARAMETRIC SYSTEM BASED ON THE BOX PACKING
CONCEPT
310 THE 5TH ICGG CONFERENCE MONGEOMETRIJA 2016 PROCEEDINGS Belgrade: 23-26 June 2016
encourages a sense of democracy where one element’s inclusion implies either an understanding of every other
element or possibly a readjustment of the entire population, so can be observed as a collective and emergent sense
of space – close, but not too close. The Box Packing concept is a topological model where identity and position of
each of the elements or parts of it within the system are determined exclusively through its relation with all other
elements within the system.
Let’s start the algorithm by an overall view to its flow of information and input parameters. There are 27 identical
cubes with a, b, c edges which should be puzzled into the cubic frame measuring
(Eq.1)
The values a, b and c are input parameters which we want to vary. If these variables have the same value, then we
get specific trivial case which is well known as Magic Hungarian Rubik’s Cube (Figure, 9).
Figure, 9 : Special case a = b = c
The frame is divided into three floors or levels with nine elements. To work generally with different values of
parameters a , b and c , design process begins from the lowest first layer and then other two layers will be added.
There are nine identical elements on each layer and the first nine of them should be packed first. First question in
solving the problem is how mach different ways of regular packing can be made at the first layer and the easiest
answer comes from combinatorial graphic matrix (Figure, 10) of first layer when first element is packed lying on
its defined a edges on the base of frame.
Figure, 10 : Arrangements for the lowest layer implied by one packed element
Eq. 1 implies the specific position of packed element – at the one edge of frame must be packed three different
oriented elements. Underlined arrangements are uniquely defined by the others implying 12 permutations in total.
At this point, we can’t be sure how much non-isomorphic final packed solution can be got from twelve different
first layers and leave this question for later analysis. Methodologically, we intend to find just one correct solution
and further explore the others and finally make geometrical and visual comparison if solutions aren’t isomorphic.
This pedagogical manner enables us to teach the students how to approach and realize specific combinatorial
geometrical problem.
In order to realize chosen arbitrary combination of first layer graphic matrix and the main condition of packing –
no overlapping elements, we suppose conditional relation
a b c (Eq.2)
a b c

M. DEVETAKOVIC ET AL.: PEDAGOGIC POTENTIAL OFA PARAMETRIC SYSTEM BASED ON THE BOX PACKING CONCEPT
THE 5TH ICGG CONFERENCE MONGEOMETRIJA 2016 PROCEEDINGS Belgrade: 23-26 June 2016 311
Some of different configurations of the first layer are explored by decreasing the value of variable a and increasing
the value of variable c (Figure, 11). It has been noticed that when a b c there isn’t any hole, when a b or
b c there is just one hole and in another cases, there are two holes on the base of frame. Size of holes is directly
implied by proportion of parameters a , b and c .
Figure, 11 - Decreasing of maximal and increasing of minimal parameters
Table 1: Corner’s coordinates of all packed elements
1 (0,0,0) (a,c,b)
2 (a,0,0) (a+c,b,a)
3 (a+c,0,0) (a+b+c,c,a)
4 (0,c,0) (a,b+c,c)
5 (a,b,0) (a+b,a+b,c)
6 (a+b,c,0) (a+b+c,a+c,b)
7 (0,b+c,0) (b, a+b+c,c)
8 (b,a+b,0) (a+b, a+b+c,b)
9 (a+b,a+c,0) (a+b+c,a+b+c,a)
10 (0,0,b) (b,a,b+c)
11 (b,0,a) (b+c,a,a+b)
12 (b+c,0,a) (a+b+c,c,a+b)
13 (0,a,c) (c,a+b,a+c)
14 (c,a,c) (b+c,a+c,a+c)
15 (b+c,c,b) (a+b+c,b+c,b+c)
16 (0,a+b,c) (b,a+b+c,a+c)
17 (b,a+c,b) (a+b,a+b+c,b+c)
18 (a+b,b+c,a) (a+b+c,a+b+c,a+b)
19 (0,0,b+c) (c,b,a+b+c)
20 (c,0,a+b) (b+c,a, a+b+c,)
21 (b+c,0,a+b) (a+b+c,b, a+b+c)
22 (0,b,a+c) (c,a+b, a+b+c)
23 (c,a,a+c) (a+c,a+c, a+b+c)
24 (a+c,b,b+c) (a+b+c,b+c,a+b+c)
25 (0,a+b,a+c) (a, a+b+c, a+b+c)
26 (a,a+c,b+c) (a+c,a+b+c,a+b+c)
27 (a+c,b+c,a+b) (a+b+c,a+b+c,a+b+c)

M. DEVETAKOVIC ET AL.: PEDAGOGIC POTENTIAL OF A PARAMETRIC SYSTEM BASED ON THE BOX PACKING
CONCEPT
312 THE 5TH ICGG CONFERENCE MONGEOMETRIJA 2016 PROCEEDINGS Belgrade: 23-26 June 2016
The next step involves generating the special position coordinates of elements which should be packed on the next
level. Obviously, position and dimension of just placed elements define gradually hierarchies at the next layer and
this goes on, step by step to produce the whole geometry which we call form. Basically this algorithm of packing
deals with the huge amount of data and calculations which grows through the flow of algorithms (Table 1).
These three levels are strong interconnected and their members affect each other and in that sense this method can
be called associative. Final packed form is comprised of different hierarchies, each associated with logic and
position details of all other preceding.
4. STEPS OF DEVELOPMENT OF GRASSHOPPER DEFINITION – TRANSPOSING
MATHEMATICAL CONCEPT INTO PARAMETRIC SYSTEM
Packing is a mathematical concept with powerful organizational method in which a packed element’s position
in regard to its neighbours is determined by certain rules – close, but no overlapping. Generally, this concept
encourages a sense of democracy where one element’s inclusion implies either an understanding of every other
element or possibly a readjustment of the entire population, so can be observed. For exploring geometrical,
architectural and pedagogical potential of described concept, we worked on transposing Wolfram demonstration
into some CAD or parametric software tool and chose Rhinoceros with its plug-in Grasshopper. Rhinoceros
(Rhino) is a stand-alone, commercial NURBS-based 3D modelling tool, developed by Robert McNeel &
Associates [6], commonly used for design, architecture, CAD/CAM, rapid prototyping, reverse engineering as
well as multimedia and graphic design industry. Increasing popularity of this software is based on its diversity,
multi-disciplinary functions, low-learning curve, relatively low cost, rich and powerful features set and its ability
to import and export over 30 files formats, which allows Rhino to act as a converter tool between programs in
design workflow. Popular among students and professionals, Rhinoceros modelling tool is endemic in the
architectural design world.
It gained its popularity and predominant role in architectural design because of the Grasshopper plug-in for
computational parametric design. Grasshopper is a visual programming language; graphical algorithm editor
tightly integrated with Rhino’s 3D modelling tools and presents one of the most powerful parametric platforms.
This tool requires no knowledge of programming or scripting, but still allows designers and students to build form
generators from the simple to the awe-inspiring. In our research of generative concepts, parametric modelling with
help of Grasshopper environment proved itself as the best and the most successful intuitive parametrical method
to explore design of concepts and to interpret them architecturally. From pedagogic point of view, the main raison
why we chose Grasshopper as a tool for development of the box packing algorithm is a potentiality to look at
concept as a set of sophisticated relationships between cube elements and to map those relationships graphically
and programmatically into a system that allows them interactively play with alternatives. Furthermore, algorithm
method and logical thinking for transposing this mathematical model into parametric system can be translated and
interpreted to the other different geometrical problems.
In Grasshopper, parameters are objects that represent data, components are objects that do actions like move,
orientate, decompose etc. Programs called definitions are created by dragging and dropping components onto a
canvas. The outputs to these components are then connected to the inputs of subsequent components. Parametric
relationships within the objects are mapped on these connections between components. For transposing special
coordinates of corners for all twenty seven elements (Table 1), we use Grasshopper component titled Box2Pt which
just create a box defined by two opposite corner points A and B. Of course, it is supposed that the start of packing
is ( , , ) (0,0,0)x y z and this point is corner A for the first packed element at the same time.
Based on the above conception, the definition in Grasshopper can be developed as follows. Component panels
provide all elements we need for our form and canvas is the work place where we put our components and set up
the algorithm. The values a , b and c are input parameters which will be varied, so we put three numeric slider on
the workplace at the start. Instead of assigning fixed values, now parameters that define packing elements are
stored as slider variables. By changing values on sliders different proportions of element can be effortlessly
created. To realize condition (Eq. 2), values on sliders have to be sorted using components Sort List (Figure, 12).
Using component List Item, corresponding numeric values are transferred to the new objects which save arranged
input variables. That allows user to change values of parameters a , b and c without thinking about satisfying
conditional relation (Eq. 2).
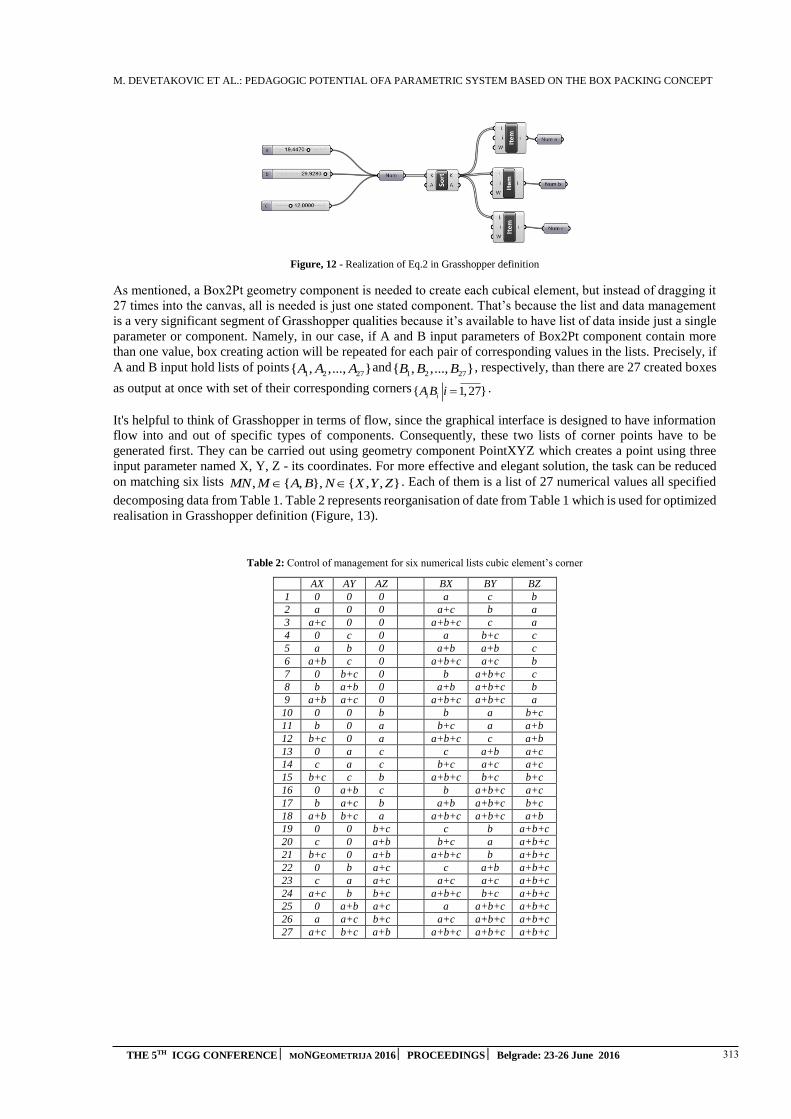
M. DEVETAKOVIC ET AL.: PEDAGOGIC POTENTIAL OFA PARAMETRIC SYSTEM BASED ON THE BOX PACKING CONCEPT
THE 5TH ICGG CONFERENCE MONGEOMETRIJA 2016 PROCEEDINGS Belgrade: 23-26 June 2016 313
Figure, 12 - Realization of Eq.2 in Grasshopper definition
Аs mentioned, a Box2Pt geometry component is needed to create each cubical element, but instead of dragging it
27 times into the canvas, all is needed is just one stated component. That’s because the list and data management
is a very significant segment of Grasshopper qualities because it’s available to have list of data inside just a single
parameter or component. Namely, in our case, if A and B input parameters of Box2Pt component contain more
than one value, box creating action will be repeated for each pair of corresponding values in the lists. Precisely, if
A and B input hold lists of points1 2 27{ , ,..., }A A A and
1 2 27{ , ,..., }B B B , respectively, than there are 27 created boxes
as output at once with set of their corresponding corners{ 1,27}i iA B i .
It's helpful to think of Grasshopper in terms of flow, since the graphical interface is designed to have information
flow into and out of specific types of components. Consequently, these two lists of corner points have to be
generated first. They can be carried out using geometry component PointXYZ which creates a point using three
input parameter named X, Y, Z - its coordinates. For more effective and elegant solution, the task can be reduced
on matching six lists , { , }, { , , }MN M A B N X Y Z . Each of them is a list of 27 numerical values all specified
decomposing data from Table 1. Table 2 represents reorganisation of date from Table 1 which is used for optimized
realisation in Grasshopper definition (Figure, 13).
Table 2: Control of management for six numerical lists cubic element’s corner
AX AY AZ BX BY BZ
1 0 0 0 a c b
2 a 0 0 a+c b a
3 a+c 0 0 a+b+c c a
4 0 c 0 a b+c c
5 a b 0 a+b a+b c
6 a+b c 0 a+b+c a+c b
7 0 b+c 0 b a+b+c c
8 b a+b 0 a+b a+b+c b
9 a+b a+c 0 a+b+c a+b+c a
10 0 0 b b a b+c
11 b 0 a b+c a a+b
12 b+c 0 a a+b+c c a+b
13 0 a c c a+b a+c
14 c a c b+c a+c a+c
15 b+c c b a+b+c b+c b+c
16 0 a+b c b a+b+c a+c
17 b a+c b a+b a+b+c b+c
18 a+b b+c a a+b+c a+b+c a+b
19 0 0 b+c c b a+b+c
20 c 0 a+b b+c a a+b+c
21 b+c 0 a+b a+b+c b a+b+c
22 0 b a+c c a+b a+b+c
23 c a a+c a+c a+c a+b+c
24 a+c b b+c a+b+c b+c a+b+c
25 0 a+b a+c a a+b+c a+b+c
26 a a+c b+c a+c a+b+c a+b+c
27 a+c b+c a+b a+b+c a+b+c a+b+c

M. DEVETAKOVIC ET AL.: PEDAGOGIC POTENTIAL OF A PARAMETRIC SYSTEM BASED ON THE BOX PACKING
CONCEPT
314 THE 5TH ICGG CONFERENCE MONGEOMETRIJA 2016 PROCEEDINGS Belgrade: 23-26 June 2016
Figure, 13 - Grasshopper’s segment for six numerical lists cubic element’s corner management
Weaving of our six lists can be made with six Grasshopper Weave components, one for each of them, but our idea
was optimization in sense of minimizing the number of input lists and exploiting numerous repeating of elements
and its dependence in resulting output lists. Pedagogically, realization of this concept enables us to demonstrate
significance of logic connection within numbers for Grasshopper code optimization, effectiveness and facility for
later modifications and extensions. Every Wave component controls the order of a list. P input of this component
is the weaving pattern and this determines the order in which our values are arranged, concerning waved. Input
Manager of Wave allows to user waving as many lists as needed. Finally, after making all necessary connections
within components, all 54 corner points are generated and that automatically produce 27 packed elements (Figure,
14).
Within the theoretical framework the creation of a form can be understood as a process of individualization where
every particular property of a distinctive element is a result of accumulation and interaction of influences,
conditions and restrictions. Grasshopper is instantly interactive when we change an input parameter. Every time
when we change a , b and c on their sliders, the generated cubical body automatically changes own geometry and
adapts to the new variables. Every detail on the resulting geometry is completely and instantly interacting. As
shown on Figure, 14, definition is stated with a new number slider parameter which defines number of packed
visible element (from 1 to 27).
Figure, 14 - Initial Grasshopper definition of Box Packing concept
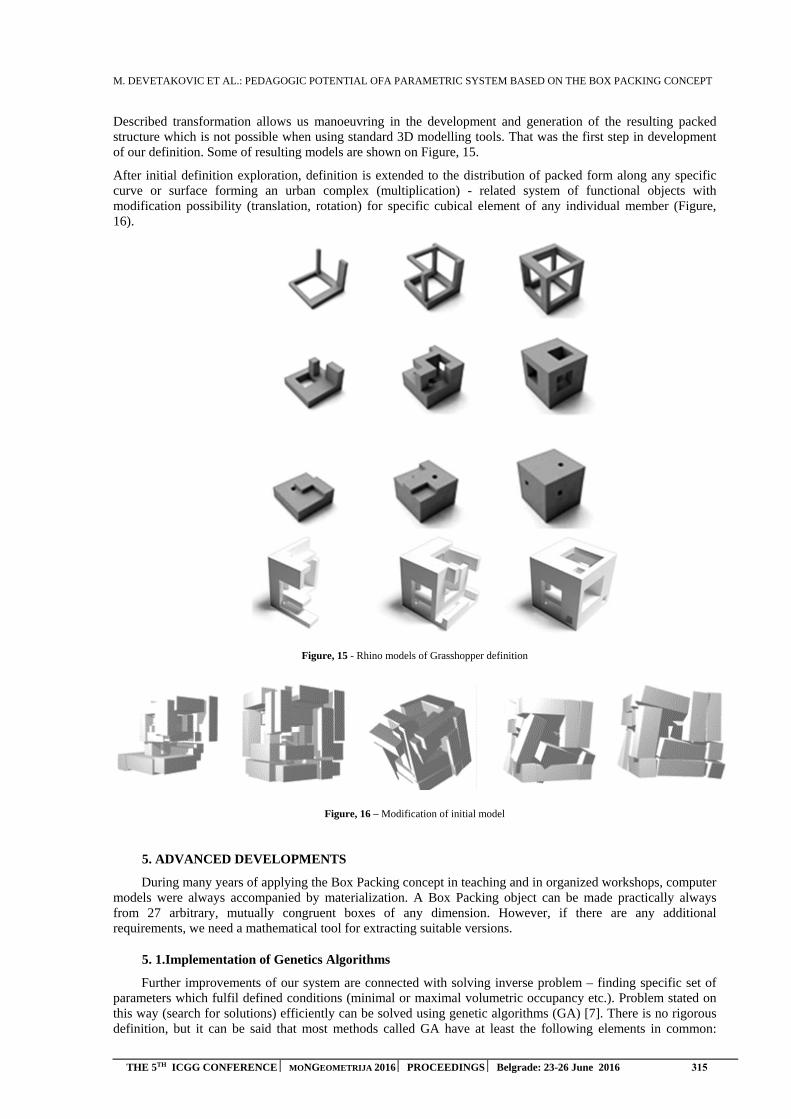
M. DEVETAKOVIC ET AL.: PEDAGOGIC POTENTIAL OFA PARAMETRIC SYSTEM BASED ON THE BOX PACKING CONCEPT
THE 5TH ICGG CONFERENCE MONGEOMETRIJA 2016 PROCEEDINGS Belgrade: 23-26 June 2016 315
Described transformation allows us manoeuvring in the development and generation of the resulting packed structure which is not possible when using standard 3D modelling tools. That was the first step in development of our definition. Some of resulting models are shown on Figure, 15.
After initial definition exploration, definition is extended to the distribution of packed form along any specific curve or surface forming an urban complex (multiplication) - related system of functional objects with modification possibility (translation, rotation) for specific cubical element of any individual member (Figure, 16).
Figure, 15 - Rhino models of Grasshopper definition
Figure, 16 – Modification of initial model
5. ADVANCED DEVELOPMENTS
During many years of applying the Box Packing concept in teaching and in organized workshops, computer models were always accompanied by materialization. A Box Packing object can be made practically always from 27 arbitrary, mutually congruent boxes of any dimension. However, if there are any additional requirements, we need a mathematical tool for extracting suitable versions.
5. 1.Implementation of Genetics Algorithms
Further improvements of our system are connected with solving inverse problem – finding specific set of parameters which fulfil defined conditions (minimal or maximal volumetric occupancy etc.). Problem stated on this way (search for solutions) efficiently can be solved using genetic algorithms (GA) [7]. There is no rigorous definition, but it can be said that most methods called GA have at least the following elements in common:
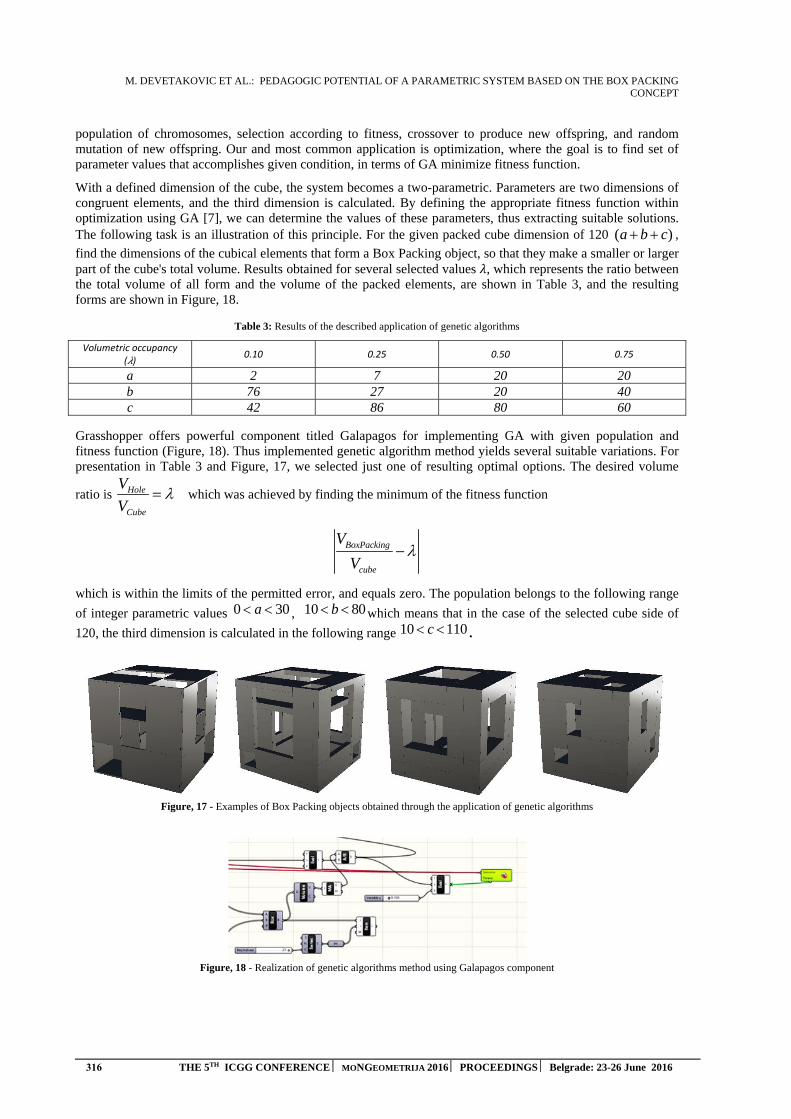
M. DEVETAKOVIC ET AL.: PEDAGOGIC POTENTIAL OF A PARAMETRIC SYSTEM BASED ON THE BOX PACKING CONCEPT
316 THE 5TH ICGG CONFERENCE MONGEOMETRIJA 2016 PROCEEDINGS Belgrade: 23-26 June 2016
population of chromosomes, selection according to fitness, crossover to produce new offspring, and random mutation of new offspring. Our and most common application is optimization, where the goal is to find set of parameter values that accomplishes given condition, in terms of GA minimize fitness function.
With a defined dimension of the cube, the system becomes a two-parametric. Parameters are two dimensions of congruent elements, and the third dimension is calculated. By defining the appropriate fitness function within optimization using GA [7], we can determine the values of these parameters, thus extracting suitable solutions. The following task is an illustration of this principle. For the given packed cube dimension of 120 ( )a b c ,
find the dimensions of the cubical elements that form a Box Packing object, so that they make a smaller or larger part of the cube's total volume. Results obtained for several selected values , which represents the ratio between the total volume of all form and the volume of the packed elements, are shown in Table 3, and the resulting forms are shown in Figure, 18.
Table 3: Results of the described application of genetic algorithms
Volumetric occupancy ( )
0.10 0.25 0.50 0.75
a 2 7 20 20b 76 27 20 40c 42 86 80 60
Grasshopper offers powerful component titled Galapagos for implementing GA with given population and fitness function (Figure, 18). Thus implemented genetic algorithm method yields several suitable variations. For presentation in Table 3 and Figure, 17, we selected just one of resulting optimal options. The desired volume
ratio is Hole
Cube
V
V which was achieved by finding the minimum of the fitness function
BoxPacking
cube
V
V
which is within the limits of the permitted error, and equals zero. The population belongs to the following range
of integer parametric values 0 30a , 10 80b which means that in the case of the selected cube side of
120, the third dimension is calculated in the following range 10 110c .
Figure, 17 - Examples of Box Packing objects obtained through the application of genetic algorithms
Figure, 18 - Realization of genetic algorithms method using Galapagos component

M. DEVETAKOVIC ET AL.: PEDAGOGIC POTENTIAL OFA PARAMETRIC SYSTEM BASED ON THE BOX PACKING CONCEPT
THE 5TH ICGG CONFERENCE MONGEOMETRIJA 2016 PROCEEDINGS Belgrade: 23-26 June 2016 317
5. 2.Box-Counting Dimension
Box-counting fractal dimension of a fractal object is calculated in relation to a raster at different scales [2],
[3]. For different side lengths r with ( )N r , we defined the smallest number of cubical elements with the side
length r necessary to cover the shape. In the case of a one-dimensional line segment, two-dimensional unit square
and a three-dimensional unit cube the relation between r and ( )N r is easy to establish. 1( )N r
r ,
21
( ) ,N rr
31
( )N rr
, in that order.
For more complex geometric shapes, the functional relationship between r and ( )N r is not explicit. We will start
from the approximate power law relation
1( ) ( )dN r k
r
(Eq.3)
which can also be written in the following form
1( ( )) ( ) ( )Log N r dLog Log k
r
(Eq.4)
where d is the box-counting dimension. In order to calculate d, this equality can be observed as a linear equation
in the Cartesian coordinate system with coordinate axes 1( )Logr
and ( ( ))Log N r , where the box-counting
dimension d is the slope of the said line. Through line approximation, using the method of least squares, which
has the smallest mean squared deviation from points 1( )Logr
and ( ( ))Log N r , we will calculate bd d [3]. The
box-counting dimension bd is often approximated in practice with the slope of the line through a pair of points
[10]:
2 1
2 1
( ( )) ( ( ))
1 1( ) ( )
b
Log N r Log N rd
Log Logr r
(Eq.5)
On the other hand, if we divide the left and right side of the last equation by 1( )Logr
and switch to the limit when
0r , the box-counting dimension will be
0
( ( ))lim
1( )
br
Log N rd
Logr
(Eq.6)
so, we can say that [3]:
( ( ))
1( )
b
Log N rd
Logr
(Eq.7)
for a sufficiently small r .
This paper analyzes the box-counting fractal dimension of spatial forms obtained with the use of the Box Packing
concept. Grasshopper definition of Box Packing has a built-in additional part which determines the minimum
number of boxes 1( )N r and
2( )N r that cover the shape for two selected side lengths 1r and
2r , calculates the
box-counting dimension for each of those values 1( )b bd d r and
2( )b bd d r (Eq.7) and calculates the box-
counting dimension 1 2( , )b bd d r r as the slope of the line segment (Eq.5). To extract boxes of the Cartesian grid
that cover the shape, we used the Grasshopper component ColissionOneMany.
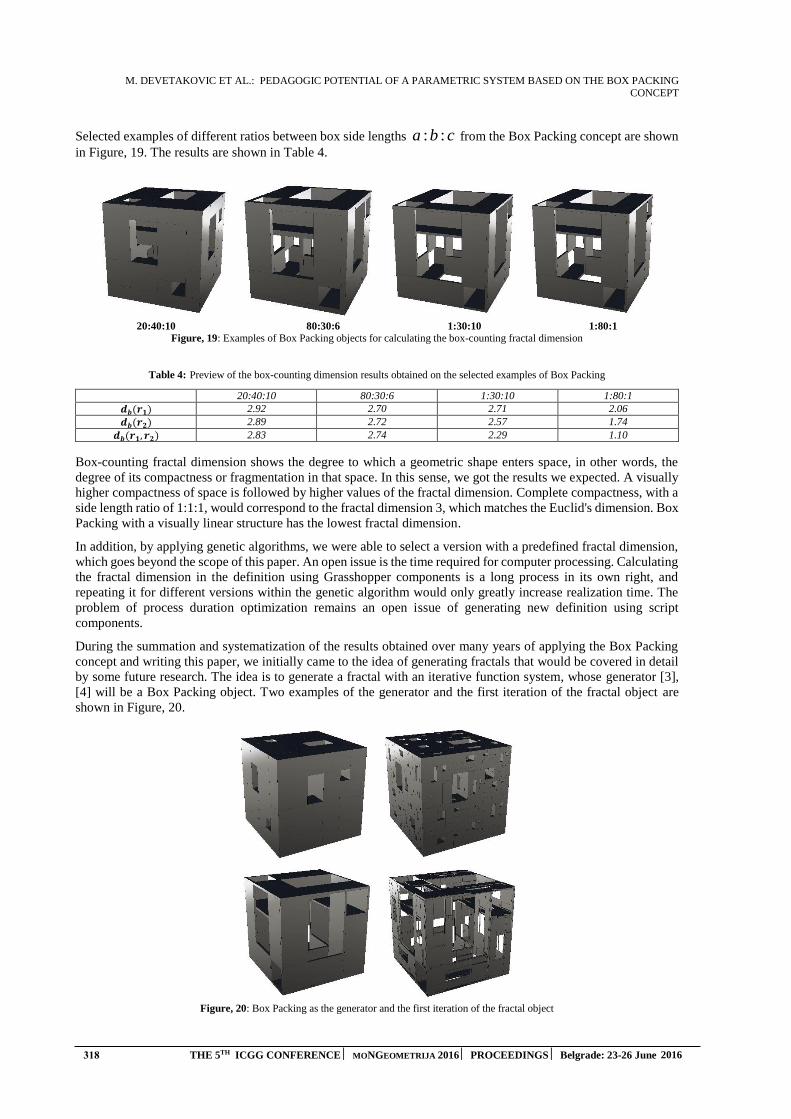
M. DEVETAKOVIC ET AL.: PEDAGOGIC POTENTIAL OF A PARAMETRIC SYSTEM BASED ON THE BOX PACKING
CONCEPT
318 THE 5TH ICGG CONFERENCE MONGEOMETRIJA 2016 PROCEEDINGS Belgrade: 23-26 June 2016
Selected examples of different ratios between box side lengths : :a b c from the Box Packing concept are shown
in Figure, 19. The results are shown in Table 4.
20:40:10 80:30:6 1:30:10 1:80:1
Figure, 19: Examples of Box Packing objects for calculating the box-counting fractal dimension
Table 4: Preview of the box-counting dimension results obtained on the selected examples of Box Packing
20:40:10 80:30:6 1:30:10 1:80:1
𝒅𝒃(𝒓𝟏) 2.92 2.70 2.71 2.06
𝒅𝒃(𝒓𝟐) 2.89 2.72 2.57 1.74
𝒅𝒃(𝒓𝟏, 𝒓𝟐) 2.83 2.74 2.29 1.10
Box-counting fractal dimension shows the degree to which a geometric shape enters space, in other words, the
degree of its compactness or fragmentation in that space. In this sense, we got the results we expected. A visually
higher compactness of space is followed by higher values of the fractal dimension. Complete compactness, with a
side length ratio of 1:1:1, would correspond to the fractal dimension 3, which matches the Euclid's dimension. Box
Packing with a visually linear structure has the lowest fractal dimension.
In addition, by applying genetic algorithms, we were able to select a version with a predefined fractal dimension,
which goes beyond the scope of this paper. An open issue is the time required for computer processing. Calculating
the fractal dimension in the definition using Grasshopper components is a long process in its own right, and
repeating it for different versions within the genetic algorithm would only greatly increase realization time. The
problem of process duration optimization remains an open issue of generating new definition using script
components.
During the summation and systematization of the results obtained over many years of applying the Box Packing
concept and writing this paper, we initially came to the idea of generating fractals that would be covered in detail
by some future research. The idea is to generate a fractal with an iterative function system, whose generator [3],
[4] will be a Box Packing object. Two examples of the generator and the first iteration of the fractal object are
shown in Figure, 20.
Figure, 20: Box Packing as the generator and the first iteration of the fractal object
M. DEVETAKOVIC ET AL.: PEDAGOGIC POTENTIAL OFA PARAMETRIC SYSTEM BASED ON THE BOX PACKING CONCEPT
THE 5TH ICGG CONFERENCE MONGEOMETRIJA 2016 PROCEEDINGS Belgrade: 23-26 June 2016 319
6. CONCLUSION
Box Packing is a case of mathematical concepts with a significant potential to be exploited in various
contexts, be it educational, promotional, artistic or any other related to geometry driven design. Applied in
architectural education it is primarily aimed at demonstrating how multidisciplinary, in this case integration of
mathematics and geometry enriches design process. In this study we focused on pedagogic aspects of its use,
ranging from mastering basic modelling techniques, various simulations, materialization in small scale models and
real life objects. Introducing a complex algorithmic approach into the process of building parametric systems has
been particularly highlighted and analyzed. It opens a realm of sophisticated programming techniques to
architectural students, with a special attention on the combinatorial part. Finally, understanding more advanced
techniques like genetic algorithms and abstract notions like fractal dimension, lead to another level of form finding
approaches represented in fractalized initial form, promising some further and unexpected design results.
ACKNOWLEDGEMENTS
This work has been undertaken as a part of the Research projects TR 36035 and ON 174026, founded by the
Ministry of Education, Science and Technologic Development of Serbia.
REFERENCES
1. Aranda, B. and Lash, C., 2006. Pamphlet architecture 27. Tooling, Princeton Architectural Press, New
York, USA.
2. Batty, M. and Longley, P., 1994. Fractal City, Academic Press, London, England.
3. Frame, M., Mandelbrot, B., and Neger, N., 1924-2010, Fractal Geometry, Yale University,
http://users.math.yale.edu/public_html/People/frame/Fractals/, [Accessed: 1st April 2016].
4. Mandelbrot, B., 1982. The fractal geometry of nature, Freeman, New York, USA .
5. McNeel, B., Davidson, S., and Grasshopper Development Team, 2015, The Grasshopper Primer, 3 rd
edition, ModeLab, GitBook,
http://grasshopperprimer.com/en/index.html , [Accessed: 15th April 2016].
6. McNeel, R., and Rhinoceros Development Team, Rhinoceros 3D
https://www.rhino3d.com/, [Accessed: 19th April 2016].
7. Mitchell, M., 1999, An Introduction to Genetic Algorithms, A Bradford Book The MIT Press,
Cambridge, London. England.
8. Pegg, E., Wolfram Demonstration Project, Box Packing
http://demonstrations.wolfram.com/BoxPacking/, [Accessed: 15th April 2016].
9. Stone of Serbia
http://www.kamensrbije.org.rs/index_eng.html [Accessed: 25th April 2016.]
10. Wahl, B. R., and Van Roy, P., and Larsen, M., and Kampman, E., and Gonzalez, L., K.. Fractal
Explorer, Chapter 4, Calculating: Fractals Dimension
http://www.wahl.org/fe/HTML_version/link/FE4W/c4.htm, [Accessed: 1st April 2016].
V.B. PETROVIĆ ET AL.: PIXEL BASED FOCUS EVALUATION ALGORITHMS WITH APPLICATIONS IN VISUAL IMPAIRMENT SIMULATION
THE 5TH ICGG CONFERENCE MONGEOMETRIJA 2016 PROCEEDINGS Belgrade: 23-26 June 2016 320
PIXEL-BASED FOCUS EVALUATION ALGORITHMS WITH APPLICATIONS IN VISUAL IMPAIRMENT SIMULATION
Veljko B. Petrović
Department of Applied Computer Science, Faculty of Technical Sciences, University of Novi Sad, Novi Sad, Serbia.
M.S., assistant, [email protected]
Dinu Dragan
Department of Applied Computer Science, Faculty of Technical Sciences, University of Novi Sad, Novi Sad, Serbia
PhD., Assistant Professor, [email protected]
Dragan Ivetić
Department of Applied Computer Science, Faculty of Technical Sciences, University of Novi Sad, Novi Sad, Serbia
PhD., Full Professor, [email protected]
ABSTRACT
This paper describes the implementation and evaluation of a family of algorithms for pixel-based evaluation of image focus. They analyze an arbitrary image and measure its degree of focus. This can be used to automatically filter low-quality shots in a picture archiving and communication system or drive an autofocusing system. This paper evaluates the sensitivity of the algorithms to uniform and nonuniform simulated lack of focus and empirically measures the efficiency of the algorithms, both in terms of CPU time and in the terms of memory used and it does so on a large picture dataset (n = 12007) in order to obtain reliable data. It discusses the relative benefits of various algorithms and determines a set of guidelines meant to suggest the optimal algorithm to use in various circumstances. Lastly, it discusses the possible application of this family of algorithms in visual impairment simulation used to aid inclusive design. A part of visual impairment that often needs to be simulated is poor visual acuity which manifests as an out-of-focus image at the retina, perceived as “blurry.” Current approaches in visual impairment simulation approximate this effect using blurring algorithms with empirically determined input parameters. This paper investigates a variant approach based on visual pyramids verified using pixel-based focus evaluation.
Keywords: focus evaluation, impairment simulation, inclusive design, computer graphics
1. INTRODUCTION
The purpose of this paper is the evaluation of pixel-based autofocusing algorithms in image acquisition systems. Specifically, it attempts to determine the accuracy of such predictive models by statistical modelling on a very large data set of uniform pictures. The benefit of this approach are the ability to produce results with a very high level of confidence, using the extremely large dataset to remove any bias or irregularity. Once the algorithms are evaluated, and the results of the test presented, the paper then presents a simple heuristic for choosing a suitable algorithm for applications.
A lot has already been done in this area. Autofocusing algorithms rely on measures of focus, and perfecting them is a key need of industry. A search of the literature reveals a lot of work in this field, starting with the pioneering work by Groen et al.[1] and the systematization of this approach in work by Krotkov[2]. As the need for ever more efficient autofocus[3] increased, specialist studies emerged dealing with broad areas of interest, such as machine vision[4], image fusion[5, 6], image enhancement[7] and most prominently automated microscopy in biology and medicine[8–11]. A survey of this work leads to the uncomplicated conclusion that the approaches based on edge-detection (such as the Tenengrad algorithm) and statistical approaches based on variance analysis
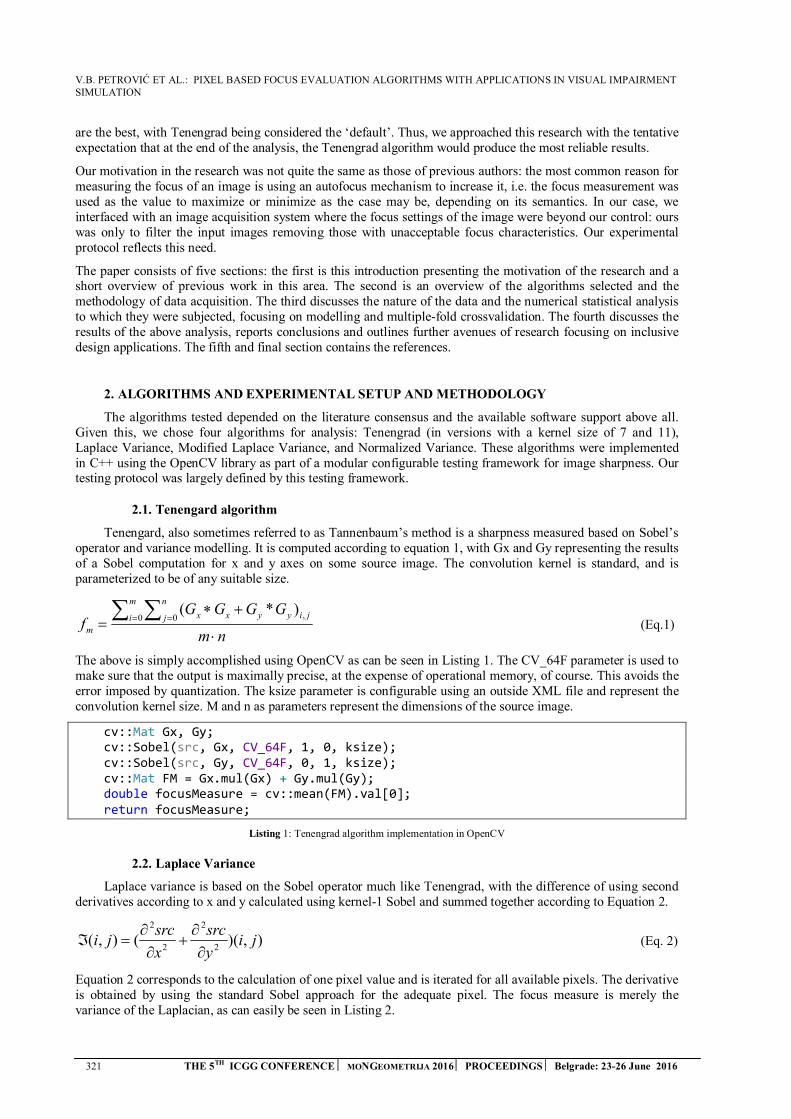
V.B. PETROVIĆ ET AL.: PIXEL BASED FOCUS EVALUATION ALGORITHMS WITH APPLICATIONS IN VISUAL IMPAIRMENT SIMULATION
321 THE 5TH ICGG CONFERENCE MONGEOMETRIJA 2016 PROCEEDINGS Belgrade: 23-26 June 2016
are the best, with Tenengrad being considered the ‘default’. Thus, we approached this research with the tentative expectation that at the end of the analysis, the Tenengrad algorithm would produce the most reliable results.
Our motivation in the research was not quite the same as those of previous authors: the most common reason for measuring the focus of an image is using an autofocus mechanism to increase it, i.e. the focus measurement was used as the value to maximize or minimize as the case may be, depending on its semantics. In our case, we interfaced with an image acquisition system where the focus settings of the image were beyond our control: ours was only to filter the input images removing those with unacceptable focus characteristics. Our experimental protocol reflects this need.
The paper consists of five sections: the first is this introduction presenting the motivation of the research and a short overview of previous work in this area. The second is an overview of the algorithms selected and the methodology of data acquisition. The third discusses the nature of the data and the numerical statistical analysis to which they were subjected, focusing on modelling and multiple-fold crossvalidation. The fourth discusses the results of the above analysis, reports conclusions and outlines further avenues of research focusing on inclusive design applications. The fifth and final section contains the references.
2. ALGORITHMS AND EXPERIMENTAL SETUP AND METHODOLOGY
The algorithms tested depended on the literature consensus and the available software support above all. Given this, we chose four algorithms for analysis: Tenengrad (in versions with a kernel size of 7 and 11), Laplace Variance, Modified Laplace Variance, and Normalized Variance. These algorithms were implemented in C++ using the OpenCV library as part of a modular configurable testing framework for image sharpness. Our testing protocol was largely defined by this testing framework.
2.1. Tenengard algorithm
Tenengard, also sometimes referred to as Tannenbaum’s method is a sharpness measured based on Sobel’s operator and variance modelling. It is computed according to equation 1, with Gx and Gy representing the results of a Sobel computation for x and y axes on some source image. The convolution kernel is standard, and is parameterized to be of any suitable size.
nm
GGGGf
m
i
n
j jiyyxx
m
0 0 ,)*(
(Eq.1)
The above is simply accomplished using OpenCV as can be seen in Listing 1. The CV_64F parameter is used to make sure that the output is maximally precise, at the expense of operational memory, of course. This avoids the error imposed by quantization. The ksize parameter is configurable using an outside XML file and represent the convolution kernel size. M and n as parameters represent the dimensions of the source image.
cv::Mat Gx, Gy; cv::Sobel(src, Gx, CV_64F, 1, 0, ksize); cv::Sobel(src, Gy, CV_64F, 0, 1, ksize); cv::Mat FM = Gx.mul(Gx) + Gy.mul(Gy); double focusMeasure = cv::mean(FM).val[0]; return focusMeasure;
Listing 1: Tenengrad algorithm implementation in OpenCV
2.2. Laplace Variance
Laplace variance is based on the Sobel operator much like Tenengrad, with the difference of using second derivatives according to x and y calculated using kernel-1 Sobel and summed together according to Equation 2.
),)((),(2
2
2
2
jiy
src
x
srcji
(Eq. 2)
Equation 2 corresponds to the calculation of one pixel value and is iterated for all available pixels. The derivative is obtained by using the standard Sobel approach for the adequate pixel. The focus measure is merely the variance of the Laplacian, as can easily be seen in Listing 2.
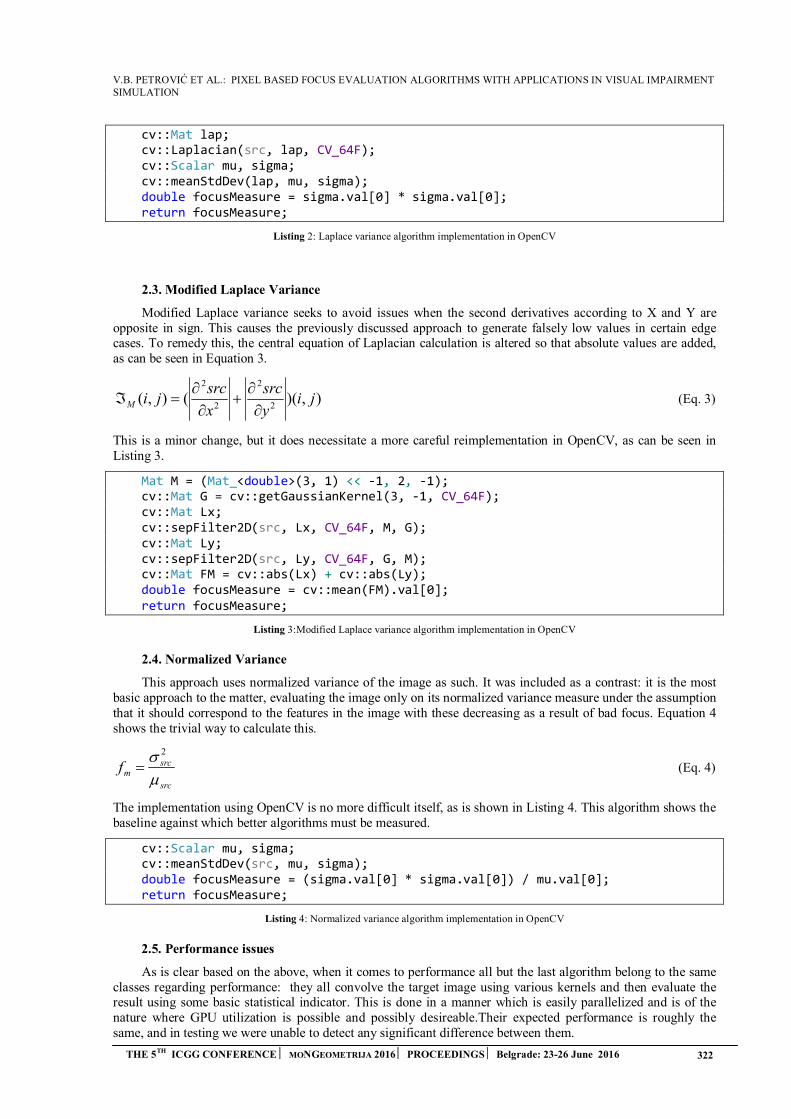
V.B. PETROVIĆ ET AL.: PIXEL BASED FOCUS EVALUATION ALGORITHMS WITH APPLICATIONS IN VISUAL IMPAIRMENT SIMULATION
THE 5TH ICGG CONFERENCE MONGEOMETRIJA 2016 PROCEEDINGS Belgrade: 23-26 June 2016 322
cv::Mat lap; cv::Laplacian(src, lap, CV_64F); cv::Scalar mu, sigma; cv::meanStdDev(lap, mu, sigma); double focusMeasure = sigma.val[0] * sigma.val[0]; return focusMeasure;
Listing 2: Laplace variance algorithm implementation in OpenCV
2.3. Modified Laplace Variance
Modified Laplace variance seeks to avoid issues when the second derivatives according to X and Y are opposite in sign. This causes the previously discussed approach to generate falsely low values in certain edge cases. To remedy this, the central equation of Laplacian calculation is altered so that absolute values are added, as can be seen in Equation 3.
),)((),(2
2
2
2
jiy
src
x
srcjiM
(Eq. 3)
This is a minor change, but it does necessitate a more careful reimplementation in OpenCV, as can be seen in Listing 3.
Mat M = (Mat_<double>(3, 1) << -1, 2, -1); cv::Mat G = cv::getGaussianKernel(3, -1, CV_64F); cv::Mat Lx; cv::sepFilter2D(src, Lx, CV_64F, M, G); cv::Mat Ly; cv::sepFilter2D(src, Ly, CV_64F, G, M); cv::Mat FM = cv::abs(Lx) + cv::abs(Ly); double focusMeasure = cv::mean(FM).val[0]; return focusMeasure;
Listing 3:Modified Laplace variance algorithm implementation in OpenCV
2.4. Normalized Variance
This approach uses normalized variance of the image as such. It was included as a contrast: it is the most basic approach to the matter, evaluating the image only on its normalized variance measure under the assumption that it should correspond to the features in the image with these decreasing as a result of bad focus. Equation 4 shows the trivial way to calculate this.
src
srcmf
2
(Eq. 4)
The implementation using OpenCV is no more difficult itself, as is shown in Listing 4. This algorithm shows the baseline against which better algorithms must be measured.
cv::Scalar mu, sigma; cv::meanStdDev(src, mu, sigma); double focusMeasure = (sigma.val[0] * sigma.val[0]) / mu.val[0]; return focusMeasure;
Listing 4: Normalized variance algorithm implementation in OpenCV
2.5. Performance issues
As is clear based on the above, when it comes to performance all but the last algorithm belong to the same classes regarding performance: they all convolve the target image using various kernels and then evaluate the result using some basic statistical indicator. This is done in a manner which is easily parallelized and is of the nature where GPU utilization is possible and possibly desireable.Their expected performance is roughly the same, and in testing we were unable to detect any significant difference between them.

V.B. PETROVIĆ ET AL.: PIXEL BASED FOCUS EVALUATION ALGORITHMS WITH APPLICATIONS IN VISUAL IMPAIRMENT SIMULATION
323 THE 5TH ICGG CONFERENCE MONGEOMETRIJA 2016 PROCEEDINGS Belgrade: 23-26 June 2016
Thus, it was decided that optimizing for performance was futile: our requirements did not include realtime operation in the manner of autofocusing algorithms, and the focus-detection preprocessing step in our total workflow was negligible no matter which algorithm we chose. It was then clear that the algorithm selection criterion can only be accuracy.
2.6. Testing protocol
The method for testing was simple: a sample of 12007 images was selected, though due to technical issues, the eventual sample size was n = 7624. Each of these sample images was categorized as either a low-contrast or high-contrast image, where low-contrast images were those where the subject (always a human) wore clothing of similar color to the background (white), and the high-contrast images were those in which the subject wore contrasting clothing. This parameter was incorporated into the test in order to control of the effect of image nature on accuracy. Images were subjected to all the discussed algorithms in order both in their base form, and in the form that was artificially blurred. The results were then recorded as a 7.7MB output file after approximately 48 hours of processing. This was all accomplished using a custom-built testing framework with could be configured using a XML dialect visible on Listing 5. The data file was loaded into the R programming environment and subjected to analysis outlined in section 3.
<?xml version="1.0"?> <SharpEConfig> <global> <pair key="output">output.dat</pair> <pair key="gaussActive">TRUE</pair> <pair key="gaussKXInit">11</pair> <pair key="gaussKXStep">2</pair> <pair key="gaussKXEnd">12</pair> <pair key="gaussKYInit">11</pair> <pair key="gaussKYStep">2</pair> <pair key="gaussKYEnd">12</pair> <pair key="gaussSXInit">11</pair> <pair key="gaussSXStep">2</pair> <pair key="gaussSXEnd">12</pair> <pair key="gaussSYInit">11</pair> <pair key="gaussSYStep">2</pair> <pair key="gaussSYEnd">12</pair> </global> <targets> <target>
<path>D:\training\w</path> <byshop>TRUE</byshop> <hasempty>FALSE</hasempty>
<empty>./empty/</empty> <mask>*.jpg</mask> <type>WHITE</type>
</target> <target> <path>D:\training\b</path> <byshop>TRUE</byshop> <hasempty>FALSE</hasempty> <empty>./empty/</empty> <mask>*.jpg</mask> <type>BLACK</type>
</target> </targets> <algorithms>
<algorithm> <id>LaplaceVarianceTest</id>
<type>LaplaceVarianceAlgorithm</type> </algorithm>
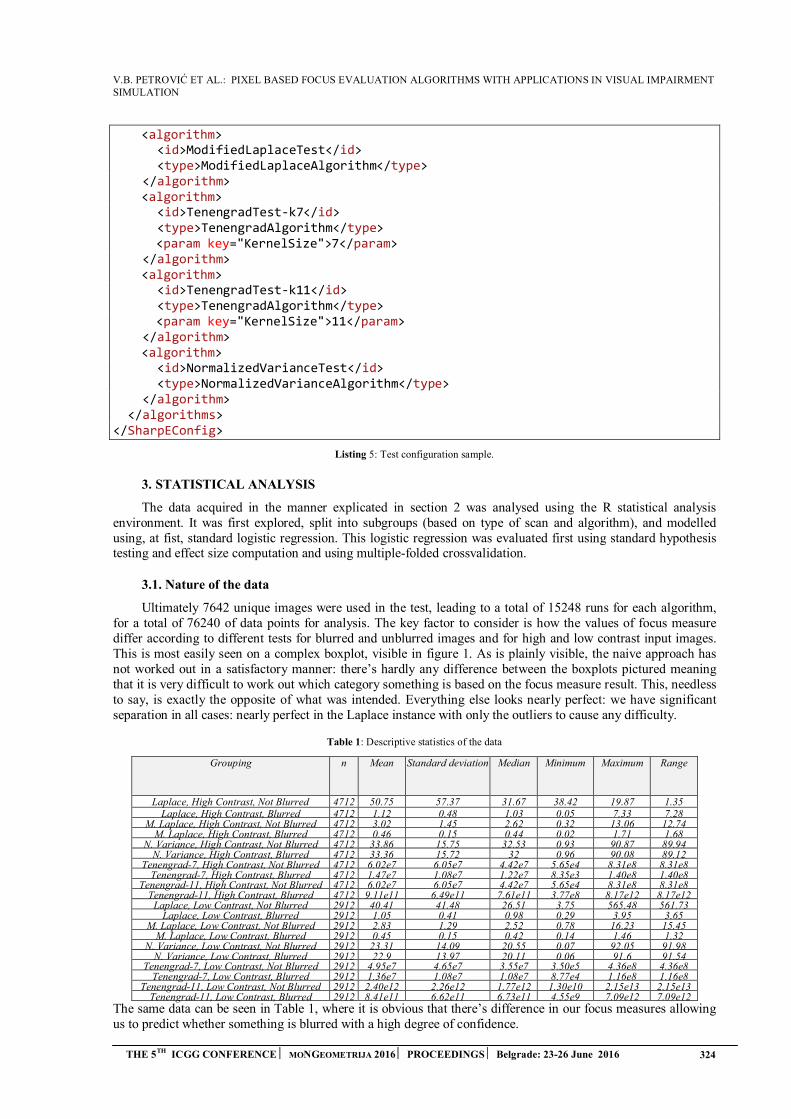
V.B. PETROVIĆ ET AL.: PIXEL BASED FOCUS EVALUATION ALGORITHMS WITH APPLICATIONS IN VISUAL IMPAIRMENT SIMULATION
THE 5TH ICGG CONFERENCE MONGEOMETRIJA 2016 PROCEEDINGS Belgrade: 23-26 June 2016 324
<algorithm> <id>ModifiedLaplaceTest</id> <type>ModifiedLaplaceAlgorithm</type>
</algorithm> <algorithm> <id>TenengradTest-k7</id> <type>TenengradAlgorithm</type>
<param key="KernelSize">7</param> </algorithm>
<algorithm> <id>TenengradTest-k11</id> <type>TenengradAlgorithm</type>
<param key="KernelSize">11</param> </algorithm>
<algorithm> <id>NormalizedVarianceTest</id> <type>NormalizedVarianceAlgorithm</type>
</algorithm> </algorithms> </SharpEConfig>
Listing 5: Test configuration sample.
3. STATISTICAL ANALYSIS
The data acquired in the manner explicated in section 2 was analysed using the R statistical analysis environment. It was first explored, split into subgroups (based on type of scan and algorithm), and modelled using, at fist, standard logistic regression. This logistic regression was evaluated first using standard hypothesis testing and effect size computation and using multiple-folded crossvalidation.
3.1. Nature of the data
Ultimately 7642 unique images were used in the test, leading to a total of 15248 runs for each algorithm, for a total of 76240 of data points for analysis. The key factor to consider is how the values of focus measure differ according to different tests for blurred and unblurred images and for high and low contrast input images. This is most easily seen on a complex boxplot, visible in figure 1. As is plainly visible, the naive approach has not worked out in a satisfactory manner: there’s hardly any difference between the boxplots pictured meaning that it is very difficult to work out which category something is based on the focus measure result. This, needless to say, is exactly the opposite of what was intended. Everything else looks nearly perfect: we have significant separation in all cases: nearly perfect in the Laplace instance with only the outliers to cause any difficulty.
Table 1: Descriptive statistics of the data
Grouping n Mean Standard deviation Median Minimum Maximum Range
Laplace, High Contrast, Not Blurred 4712 50.75 57.37 31.67 38.42 19.87 1.35 Laplace, High Contrast, Blurred 4712 1.12 0.48 1.03 0.05 7.33 7.28
M. Laplace, High Contrast, Not Blurred 4712 3.02 1.45 2.62 0.32 13.06 12.74 M. Laplace, High Contrast, Blurred 4712 0.46 0.15 0.44 0.02 1.71 1.68
N. Variance, High Contrast, Not Blurred 4712 33.86 15.75 32.53 0.93 90.87 89.94 N. Variance, High Contrast, Blurred 4712 33.36 15.72 32 0.96 90.08 89.12
Tenengrad-7, High Contrast, Not Blurred 4712 6.02e7 6.05e7 4.42e7 5.65e4 8.31e8 8.31e8 Tenengrad-7, High Contrast, Blurred 4712 1.47e7 1.08e7 1.22e7 8.35e3 1.40e8 1.40e8
Tenengrad-11, High Contrast, Not Blurred 4712 6.02e7 6.05e7 4.42e7 5.65e4 8.31e8 8.31e8 Tenengrad-11, High Contrast, Blurred 4712 9.11e11 6.49e11 7.61e11 3.77e8 8.17e12 8.17e12
Laplace, Low Contrast, Not Blurred 2912 40.41 41.48 26.51 3.75 565.48 561.73 Laplace, Low Contrast, Blurred 2912 1.05 0.41 0.98 0.29 3.95 3.65
M. Laplace, Low Contrast, Not Blurred 2912 2.83 1.29 2.52 0.78 16.23 15.45 M. Laplace, Low Contrast, Blurred 2912 0.45 0.15 0.42 0.14 1.46 1.32
N. Variance, Low Contrast, Not Blurred 2912 23.31 14.09 20.55 0.07 92.05 91.98 N. Variance, Low Contrast, Blurred 2912 22.9 13.97 20.11 0.06 91.6 91.54
Tenengrad-7, Low Contrast, Not Blurred 2912 4.95e7 4.65e7 3.55e7 3.50e5 4.36e8 4.36e8 Tenengrad-7, Low Contrast, Blurred 2912 1.36e7 1.08e7 1.08e7 8.77e4 1.16e8 1.16e8
Tenengrad-11, Low Contrast, Not Blurred 2912 2.40e12 2.26e12 1.77e12 1.30e10 2.15e13 2.15e13 Tenengrad-11, Low Contrast, Blurred 2912 8.41e11 6.62e11 6.73e11 4.55e9 7.09e12 7.09e12
The same data can be seen in Table 1, where it is obvious that there’s difference in our focus measures allowing us to predict whether something is blurred with a high degree of confidence.
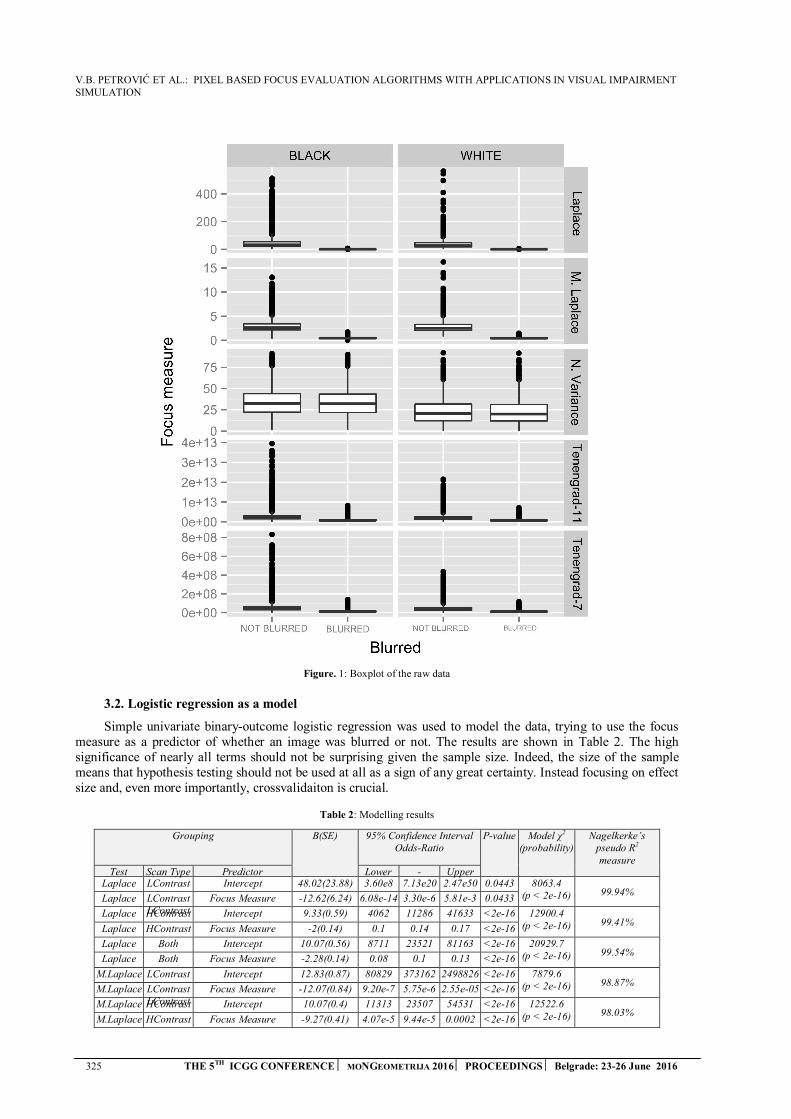
V.B. PETROVIĆ ET AL.: PIXEL BASED FOCUS EVALUATION ALGORITHMS WITH APPLICATIONS IN VISUAL IMPAIRMENT SIMULATION
325 THE 5TH ICGG CONFERENCE MONGEOMETRIJA 2016 PROCEEDINGS Belgrade: 23-26 June 2016
Figure. 1: Boxplot of the raw data
3.2. Logistic regression as a model
Simple univariate binary-outcome logistic regression was used to model the data, trying to use the focus measure as a predictor of whether an image was blurred or not. The results are shown in Table 2. The high significance of nearly all terms should not be surprising given the sample size. Indeed, the size of the sample means that hypothesis testing should not be used at all as a sign of any great certainty. Instead focusing on effect size and, even more importantly, crossvalidaiton is crucial.
Table 2: Modelling results
Grouping B(SE) 95% Confidence Interval Odds-Ratio
P-value Model χ2 (probability)
Nagelkerke’s pseudo R2
measure Test Scan Type Predictor Lower - Upper
Laplace LContrast Intercept 48.02(23.88) 3.60e8 7.13e20 2.47e50 0.0443 8063.4 (p < 2e-16) 99.94%
Laplace LContrast LContrast
Focus Measure -12.62(6.24) 6.08e-14 3.30e-6 5.81e-3 0.0433
Laplace HContrast Intercept 9.33(0.59) 4062 11286 41633 <2e-16 12900.4 (p < 2e-16) 99.41%
Laplace HContrast Focus Measure -2(0.14) 0.1 0.14 0.17 <2e-16
Laplace Both Intercept 10.07(0.56) 8711 23521 81163 <2e-16 20929.7 (p < 2e-16) 99.54%
Laplace Both Focus Measure -2.28(0.14) 0.08 0.1 0.13 <2e-16
M.Laplace LContrast Intercept 12.83(0.87) 80829 373162 2498826 <2e-16 7879.6 (p < 2e-16) 98.87%
M.Laplace LContrast LContrast
Focus Measure -12.07(0.84) 9.20e-7 5.75e-6 2.55e-05 <2e-16
M.Laplace HContrast Intercept 10.07(0.4) 11313 23507 54531 <2e-16 12522.6 (p < 2e-16) 98.03%
M.Laplace HContrast Focus Measure -9.27(0.41) 4.07e-5 9.44e-5 0.0002 <2e-16
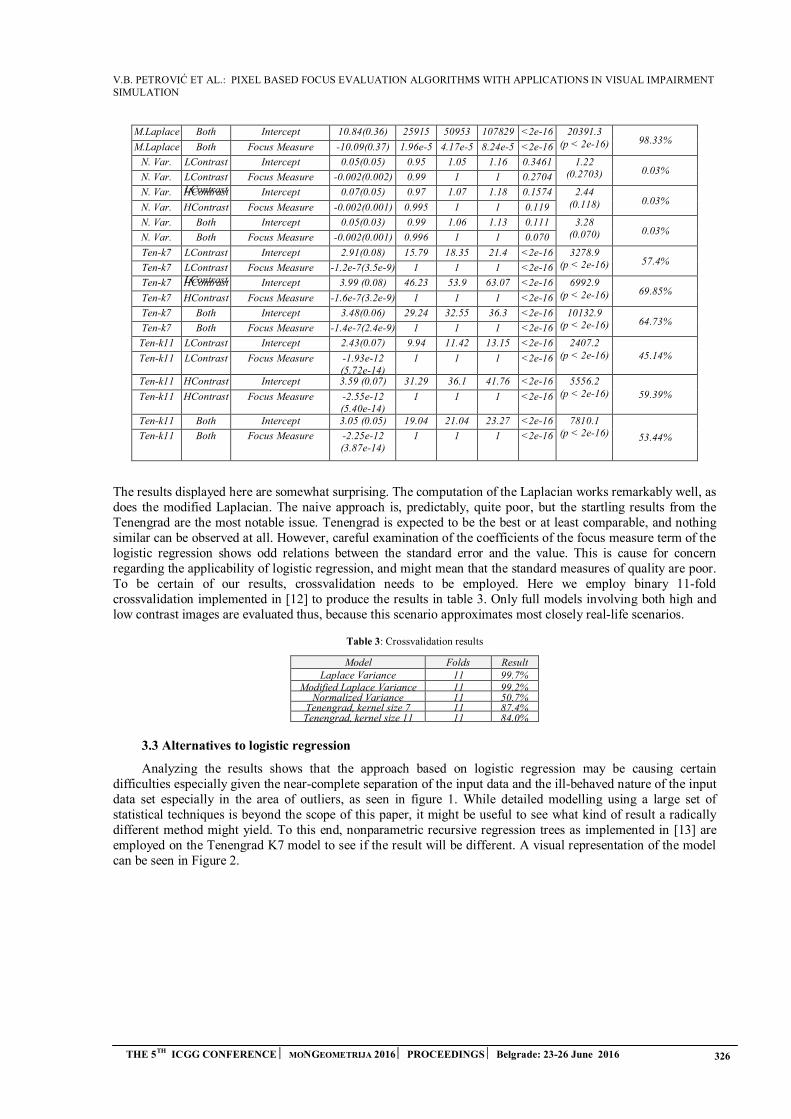
V.B. PETROVIĆ ET AL.: PIXEL BASED FOCUS EVALUATION ALGORITHMS WITH APPLICATIONS IN VISUAL IMPAIRMENT SIMULATION
THE 5TH ICGG CONFERENCE MONGEOMETRIJA 2016 PROCEEDINGS Belgrade: 23-26 June 2016 326
M.Laplace Both Intercept 10.84(0.36) 25915 50953 107829 <2e-16 20391.3 (p < 2e-16) 98.33%
M.Laplace Both Focus Measure -10.09(0.37) 1.96e-5 4.17e-5 8.24e-5 <2e-16
N. Var. LContrast Intercept 0.05(0.05) 0.95 1.05 1.16 0.3461 1.22 (0.2703) 0.03%
N. Var. LContrast LContrast
Focus Measure -0.002(0.002) 0.99 1 1 0.2704
N. Var. HContrast Intercept 0.07(0.05) 0.97 1.07 1.18 0.1574 2.44 (0.118) 0.03%
N. Var. HContrast Focus Measure -0.002(0.001) 0.995 1 1 0.119
N. Var. Both Intercept 0.05(0.03) 0.99 1.06 1.13 0.111 3.28 (0.070) 0.03%
N. Var. Both Focus Measure -0.002(0.001) 0.996 1 1 0.070
Ten-k7 LContrast Intercept 2.91(0.08) 15.79 18.35 21.4 <2e-16 3278.9 (p < 2e-16) 57.4%
Ten-k7 LContrast LContrast
Focus Measure -1.2e-7(3.5e-9) 1 1 1 <2e-16
Ten-k7 HContrast Intercept 3.99 (0.08) 46.23 53.9 63.07 <2e-16 6992.9 (p < 2e-16) 69.85%
Ten-k7 HContrast Focus Measure -1.6e-7(3.2e-9) 1 1 1 <2e-16
Ten-k7 Both Intercept 3.48(0.06) 29.24 32.55 36.3 <2e-16 10132.9 (p < 2e-16) 64.73%
Ten-k7 Both Focus Measure -1.4e-7(2.4e-9) 1 1 1 <2e-16
Ten-k11 LContrast Intercept 2.43(0.07) 9.94 11.42 13.15 <2e-16 2407.2 (p < 2e-16) 45.14% Ten-k11 LContrast Focus Measure -1.93e-12
(5.72e-14) 1 1 1 <2e-16
Ten-k11 HContrast Intercept 3.59 (0.07) 31.29 36.1 41.76 <2e-16 5556.2 (p < 2e-16) 59.39% Ten-k11 HContrast Focus Measure -2.55e-12
(5.40e-14) 1 1 1 <2e-16
Ten-k11 Both Intercept 3.05 (0.05) 19.04 21.04 23.27 <2e-16 7810.1 (p < 2e-16) 53.44% Ten-k11 Both Focus Measure -2.25e-12
(3.87e-14) 1 1 1 <2e-16
The results displayed here are somewhat surprising. The computation of the Laplacian works remarkably well, as does the modified Laplacian. The naive approach is, predictably, quite poor, but the startling results from the Tenengrad are the most notable issue. Tenengrad is expected to be the best or at least comparable, and nothing similar can be observed at all. However, careful examination of the coefficients of the focus measure term of the logistic regression shows odd relations between the standard error and the value. This is cause for concern regarding the applicability of logistic regression, and might mean that the standard measures of quality are poor. To be certain of our results, crossvalidation needs to be employed. Here we employ binary 11-fold crossvalidation implemented in [12] to produce the results in table 3. Only full models involving both high and low contrast images are evaluated thus, because this scenario approximates most closely real-life scenarios.
Table 3: Crossvalidation results
Model
Folds Result
Laplace Variance 11 99.7% Modified Laplace Variance 11 99.2%
Normalized Variance 11 50.7% Tenengrad, kernel size 7 11 87.4% Tenengrad, kernel size 11 11 84.0%
3.3 Alternatives to logistic regression
Analyzing the results shows that the approach based on logistic regression may be causing certain difficulties especially given the near-complete separation of the input data and the ill-behaved nature of the input data set especially in the area of outliers, as seen in figure 1. While detailed modelling using a large set of statistical techniques is beyond the scope of this paper, it might be useful to see what kind of result a radically different method might yield. To this end, nonparametric recursive regression trees as implemented in [13] are employed on the Tenengrad K7 model to see if the result will be different. A visual representation of the model can be seen in Figure 2.
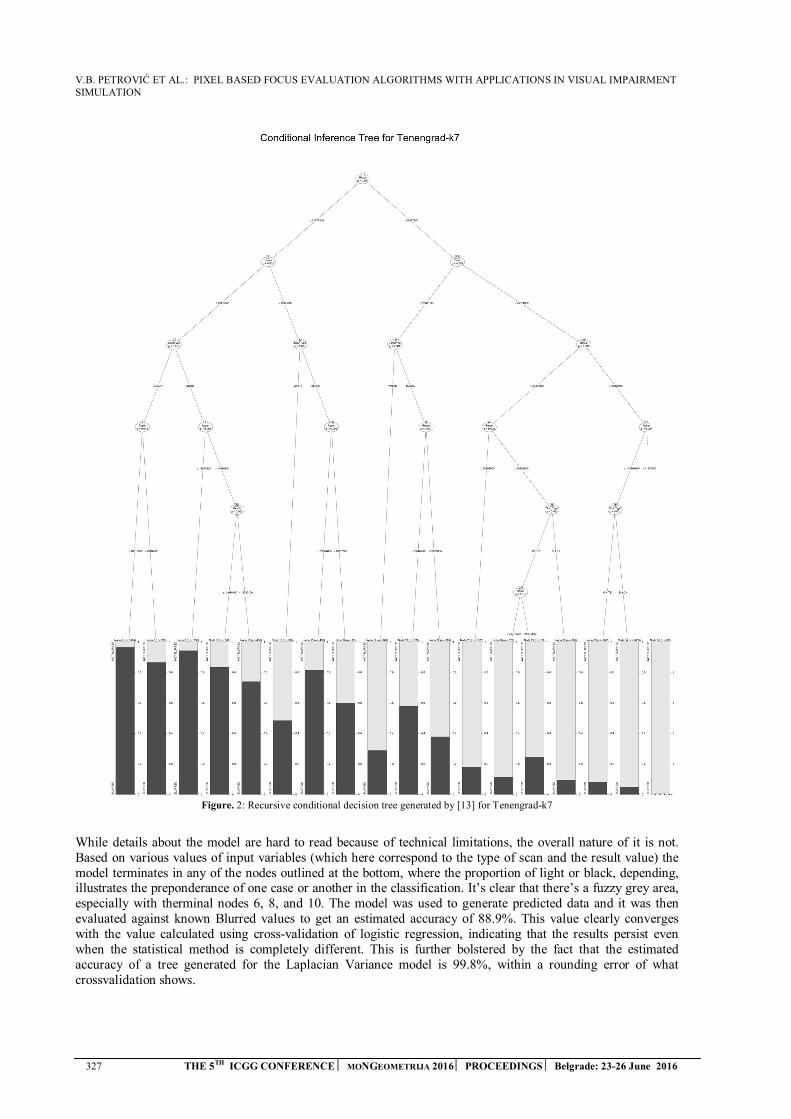
V.B. PETROVIĆ ET AL.: PIXEL BASED FOCUS EVALUATION ALGORITHMS WITH APPLICATIONS IN VISUAL IMPAIRMENT SIMULATION
327 THE 5TH ICGG CONFERENCE MONGEOMETRIJA 2016 PROCEEDINGS Belgrade: 23-26 June 2016
Figure. 2: Recursive conditional decision tree generated by [13] for Tenengrad-k7
While details about the model are hard to read because of technical limitations, the overall nature of it is not. Based on various values of input variables (which here correspond to the type of scan and the result value) the model terminates in any of the nodes outlined at the bottom, where the proportion of light or black, depending, illustrates the preponderance of one case or another in the classification. It’s clear that there’s a fuzzy grey area, especially with therminal nodes 6, 8, and 10. The model was used to generate predicted data and it was then evaluated against known Blurred values to get an estimated accuracy of 88.9%. This value clearly converges with the value calculated using cross-validation of logistic regression, indicating that the results persist even when the statistical method is completely different. This is further bolstered by the fact that the estimated accuracy of a tree generated for the Laplacian Variance model is 99.8%, within a rounding error of what crossvalidation shows.
V.B. PETROVIĆ ET AL.: PIXEL BASED FOCUS EVALUATION ALGORITHMS WITH APPLICATIONS IN VISUAL IMPAIRMENT SIMULATION
THE 5TH ICGG CONFERENCE MONGEOMETRIJA 2016 PROCEEDINGS Belgrade: 23-26 June 2016 328
4. CONCLUSIONS
The above shows that the only sustainable conclusion is that methods based on Laplacian variance are clearly superior, whether in their modified or unmodified form. The naive approach is completely useless showing no better results than chance. Tenengrad shows respectable results, but still inferior ones, with he quality of the value decreasing with the kernel size. Quite possibly, a smaller kernel size will allow for even greater accuracy. Time constraints did not allow for this to be tested, but it can certainly be the subject of future research. A possible confounder is the nature of simulated blurring used—it is not inconceivable that some feature of this approach fits Laplacian variance particularly well, though it should be noted that both it and Tenengrad use the same Sobel operator for feature extraction.
It is clear that further research on this topic is necessary, and that even larger data sets (being prepared) and different ways of simulating out-of-focus images might be tried to test for the hypothesis that the blurring method used confounded the results. Further, approaches not based on logistic regression could be tried. Results using recursive conditional decision trees show promise, but aren’t significantly different from those produced by logistic regression. In the future, it may be advisable to investigate Bayesian modelling of the data or to use random forest approaches in order to extract maximum utility from the data and create an extremely reliable statistical model.
An unexpected area in which this research can be applied is in the field of disability simulation for inclusive design. Inclusive design is the field of engineering design, specifically user interface design, which seeks to include as many people as possible in its targeted user base despite difficulties of perception, cognition, or ability. For this purpose, an effective way to increase empathy[14] and to help with inclusive design[15] is to simulate disabilities for the developer: presenting the same challenges as those in the target audience may face. One key perceptual difficulty that needs to be modelled is poor visual acuity caused by the eye being unable to focus a clear image on the retina. This problem is present in conditions as diverse as common myopia and age-related macular degeneration[16]. A common way of simulating this is applying a blurring filter on the image, but this is a solution chosen for convenience rather than veracity.
A further avenue of application of this research is to use the most effective focus measure to determine which type of blurring with which parameters is most efficient in producing an unfocused image. This development, of course, is dependent on further research that seeks to test the hypothesis that the focus measures are largely unrelated to the type of image blurring selected.
ACKNOWLEDGEMENTS
This work is financially supported by Ministry of Science and Technological Development, Republic of Serbia; under the project number TR32044. “Development of software tools for the analysis and improvement of business processes", 2011-2015.
References
1. Groen, F. C., Young, I. T., & Ligthart, G. (1985). A comparison of different focus functions for use inautofocus algorithms. Cytometry, 6(2), 81–91.
2. Krotkov, E. P. (2012). Active computer vision by cooperative focus and stereo. Springer Science &Business Media.
3. Yao, Y., Abidi, B., Doggaz, N., & Abidi, M. (2006). Evaluation of sharpness measures and searchalgorithms for the auto focusing of high-magnification images. In Defense and Security Symposium(p. 62460G–62460G). International Society for Optics and Photonics.
4. Chern, N. N. K., Neow, P. A., & Ang Jr, M. H. (2001). Practical issues in pixel-based autofocusingfor machine vision. In Robotics and Automation, 2001. Proceedings 2001 ICRA. IEEE InternationalConference on (Vol. 3, pp. 2791–2796). IEEE.
5. Bai, X., Zhang, Y., Zhou, F., & Xue, B. (2015). Quadtree-based multi-focus image fusion using aweighted focus-measure. Information Fusion, 22, 105–118.
6. Huang, W., & Jing, Z. (2007). Evaluation of focus measures in multi-focus image fusion. Patternrecognition letters, 28(4), 493–500.

V.B. PETROVIĆ ET AL.: PIXEL BASED FOCUS EVALUATION ALGORITHMS WITH APPLICATIONS IN VISUAL IMPAIRMENT SIMULATION
329 THE 5TH ICGG CONFERENCE MONGEOMETRIJA 2016 PROCEEDINGS Belgrade: 23-26 June 2016
7. Puniani, S., & Arora, S. (2015). Performance Evaluation of Image Enhancement Techniques.International Journal of Signal Processing, Image Processing and Pattern Recognition, 8(8), 251–262.
8. Mea, V. Della, Viel, F., & Beltrami, C. A. (2005). A pixel-based autofocusing technique for digitalhistologic and cytologic slides. Computerized Medical Imaging and Graphics, 29(5), 333–341.
9. Sun, Y., Duthaler, S., & Nelson, B. J. (2004). Autofocusing in computer microscopy: selecting theoptimal focus algorithm. Microscopy research and technique, 65(3), 139–149.
10. Sánchez-Brea, L., Barreira-Rodríguez, N., Mosquera-González, A., García-Resúa, C., & Yebra-Pimentel, E. (2015). Automatic Selection of Video Frames for Hyperemia Grading. In Computer Aided Systems Theory–EUROCAST 2015 (pp. 479–486). Springer.
11. ZHANG, X., JIA, C., & XIE, K. (2016). Evaluation of Autofocus Algorithms for Automatic Detectionof Caenorhabditis elegans Lipid Droplets. Progress in Biochemistry and Biophysics, 43(2), 167–175.
12. Maindonald, J. H., & Braun, W. J. (2015). DAAG: Data Analysis and Graphics Data and Functions.Retrieved from http://CRAN.R-project.org/package=DAAG
13. Hothorn, T., Hornik, K., & Zeileis, A. (2006). Unbiased Recursive Partitioning: A ConditionalInference Framework. Journal of Computational and Graphical Statistics, 15(3), 651–674.
14. Flower, A., Burns, M. K., & Bottsford-Miller, N. A. (2007). Meta-Analysis of Disability SimulationResearch. Remedial and Special Education, 28(2), 72–79. doi:10.1177/07419325070280020601
15. Biswas, P., & Langdon, P. (2013). Inclusive User Modeling and Simulation. In P. Biswas, C. Duarte,P. Langdon, L. Almeida, & C. Jung (Eds.), A Multimodal End-2-End Approach to Accessible Computing (pp. 71–89). Springer London. Retrieved from http://link.springer.com/chapter/10.1007/978-1-4471-5082-4_4
16. de Jong, P. T. V. M. (2006). Age-Related Macular Degeneration. New England Journal of Medicine,355(14), 1474–1485. doi:10.1056/NEJMra062326

M. OBRADOVIĆ, POLYHEDRAL FORMS OBTAINED BY COMBINIG LATERAL SHEET OF CP II-10 AND TRUNCATED DODECAHEDRON
THE 5TH InternationalCONFERENCE MONGEOMETRIJA 2016 PROCEEDINGS Belgrade: 23-26 June 2016 330
POLYHEDRAL FORMS OBTAINED BY COMBINIG LATERAL SHEET OF CP II-10 AND TRUNCATED DODECAHEDRON
Marija Obradović
Department of mathematics, physics and descriptive geometry, Faculty of Civil engineering, University of Belgrade, Belgrade, Serbia, PhD., Associate Professor, [email protected]
ABSTRACT
The paper analyzes a possibility of obtaining polyhedral shapes formed by combining polyhedral surfaces based on the lateral sheet, i.e. segment surface of elongated concave pyramids of the second sort (CeP II-10, type A and type B). In previous research, CP II type A, and CP II type B were elaborated in detail. In both cases, it is shown that there is a pattern by which concave pyramid of the second sort can be formed over bases - regular polygons, starting from n=6 to n=9. It is also possible for a lateral sheet of such a polyhedron to be formed even with base polygon of n=10, but not the pyramid itself, as lateral faces of the solid penetrate the base. However, these polyhedral surfaces can be further combined with prisms and antiprism, featuring as integral factors in concave elongated and gyroelongated pyramids of the second sort. Thus, in this paper we discuss further potential of these polyhedral surfaces, on the example of combining them with Archimedean solid - Truncated dodecahedron (U26). The faces of this solid consist of 12 decagons and 20 triangles. On the decagonal faces, decagonal polygons of the CP II segments can be added, which produces new polyhedral composite forms that are, furthermore, concave deltahedra. There are considered possibilities of obtaining polyhedral shapes by combining sheet segments of CP II -10-M and CP II-10-m, as well as of CP II-10-B with U26. Finally, a couple of interesting shape suggestions are given, compound polyhedra obtained by intersection of paired composite concave polyhedra originated in the described manner.
Keywords: concave polyhedra, composite polyhedra, truncated dodecahedron, CP II-10, augmentation, incavation
SUBJECT CODE: Theoretical Geometry
INTRODUCTION
This article examines procedures for creating obtainable new polyhedral shapes - composite polyhedra, comprised of concave polyhedral segments based on the geometry of the decagonal concave pyramids of the second sort (CP II-10). Our previous research [11], [12], [7], thoroughly describes the concave polyhedral shapes which will be used here. CP II type A and CP II type B are presented in [11] and [12] respectively. In both cases, it is shown that there is a pattern by which we can form a concave pyramid of the second sort with regular polygons as bases, starting from n=6 to n=9, with the possibility of forming a lateral sheet of such a polyhedron even for n=10, but not the pyramid itself, as lateral faces penetrate the base. These polyhedral segments can be further combined with prisms and antiprisms, taking part in the formation of a closed space, producing a solid, so they can occur as integral parts of concave elongated and gyro-elongated pyramids of the second sort: CeP II-10, and CgeP II-10. Thus, in this paper, we use only a segment, lateral sheet of these polyhedra, which consists exclusively of equilateral triangles and can be folded by creasing a planar net.
The study of these forms represents a continuation of the research started with the concave cupolae of the second sort, (CC II), and the higher sorts, conducted in [5], [6], [8], [9], [10].
Since the base around which all the concerned concave surfaces arise is a regular polygon - decagon, we will examine possibilities of forming convex polyhedra which will also be deltahedra, consisting exclusively of
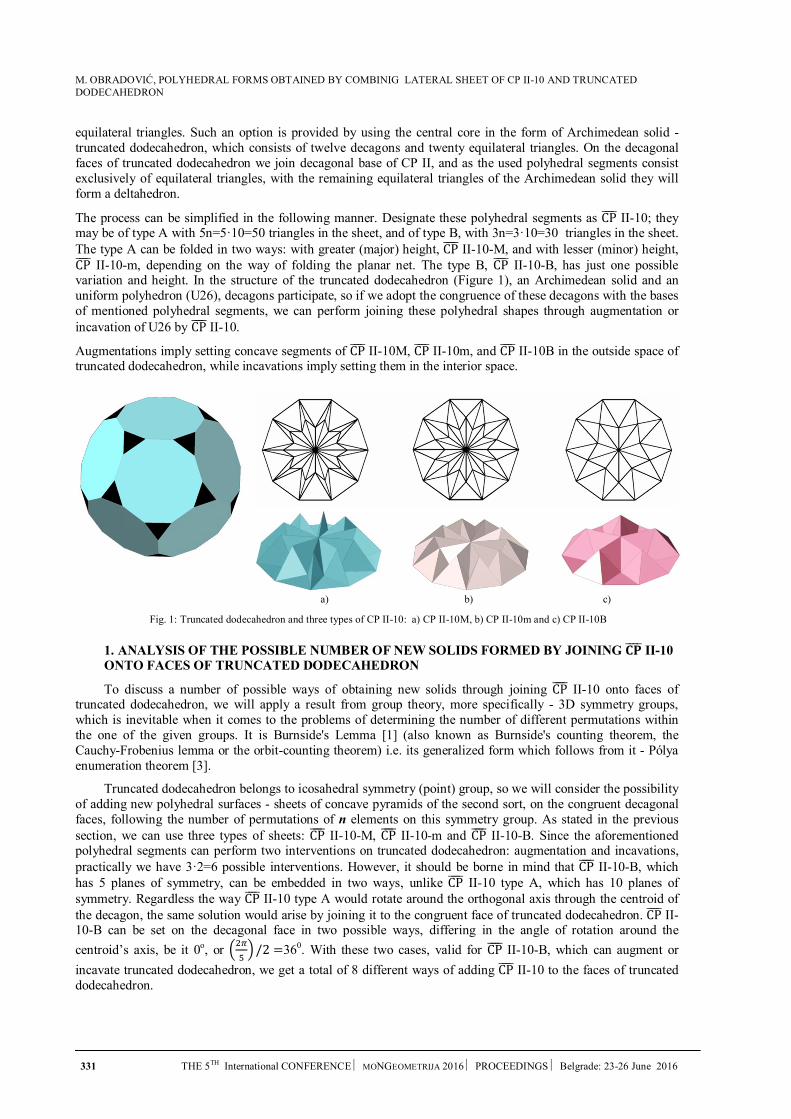
M. OBRADOVIĆ, POLYHEDRAL FORMS OBTAINED BY COMBINIG LATERAL SHEET OF CP II-10 AND TRUNCATED DODECAHEDRON
331 THE 5TH International CONFERENCE MONGEOMETRIJA 2016 PROCEEDINGS Belgrade: 23-26 June 2016
equilateral triangles. Such an option is provided by using the central core in the form of Archimedean solid - truncated dodecahedron, which consists of twelve decagons and twenty equilateral triangles. On the decagonal faces of truncated dodecahedron we join decagonal base of CP II, and as the used polyhedral segments consist exclusively of equilateral triangles, with the remaining equilateral triangles of the Archimedean solid they will form a deltahedron.
The process can be simplified in the following manner. Designate these polyhedral segments as CP���� II-10; they may be of type A with 5n=5·10=50 triangles in the sheet, and of type B, with 3n=3·10=30 triangles in the sheet. The type A can be folded in two ways: with greater (major) height, CP���� II-10-M, and with lesser (minor) height, CP���� II-10-m, depending on the way of folding the planar net. The type B, CP���� II-10-B, has just one possible variation and height. In the structure of the truncated dodecahedron (Figure 1), an Archimedean solid and an uniform polyhedron (U26), decagons participate, so if we adopt the congruence of these decagons with the bases of mentioned polyhedral segments, we can perform joining these polyhedral shapes through augmentation or incavation of U26 by CP���� II-10.
Augmentations imply setting concave segments of CP���� II-10M, CP���� II-10m, and CP���� II-10B in the outside space of truncated dodecahedron, while incavations imply setting them in the interior space.
a) b) c)
Fig. 1: Truncated dodecahedron and three types of CP II-10: a) CP II-10M, b) CP II-10m and c) CP II-10B
1. ANALYSIS OF THE POSSIBLE NUMBER OF NEW SOLIDS FORMED BY JOINING ������ II-10ONTO FACES OF TRUNCATED DODECAHEDRON
To discuss a number of possible ways of obtaining new solids through joining CP���� II-10 onto faces of truncated dodecahedron, we will apply a result from group theory, more specifically - 3D symmetry groups, which is inevitable when it comes to the problems of determining the number of different permutations within the one of the given groups. It is Burnside's Lemma [1] (also known as Burnside's counting theorem, the Cauchy-Frobenius lemma or the orbit-counting theorem) i.e. its generalized form which follows from it - Pólya enumeration theorem [3].
Truncated dodecahedron belongs to icosahedral symmetry (point) group, so we will consider the possibility of adding new polyhedral surfaces - sheets of concave pyramids of the second sort, on the congruent decagonal faces, following the number of permutations of n elements on this symmetry group. As stated in the previous section, we can use three types of sheets: CP���� II-10-M, CP���� II-10-m and CP���� II-10-B. Since the aforementioned polyhedral segments can perform two interventions on truncated dodecahedron: augmentation and incavations, practically we have 3·2=6 possible interventions. However, it should be borne in mind that CP���� II-10-B, which has 5 planes of symmetry, can be embedded in two ways, unlike CP���� II-10 type A, which has 10 planes of symmetry. Regardless the way CP���� II-10 type A would rotate around the orthogonal axis through the centroid of the decagon, the same solution would arise by joining it to the congruent face of truncated dodecahedron. CP���� II-10-B can be set on the decagonal face in two possible ways, differing in the angle of rotation around the
centroid’s axis, be it 0o, or ���
��/2 =360. With these two cases, valid for CP���� II-10-B, which can augment or
incavate truncated dodecahedron, we get a total of 8 different ways of adding CP���� II-10 to the faces of truncated dodecahedron.
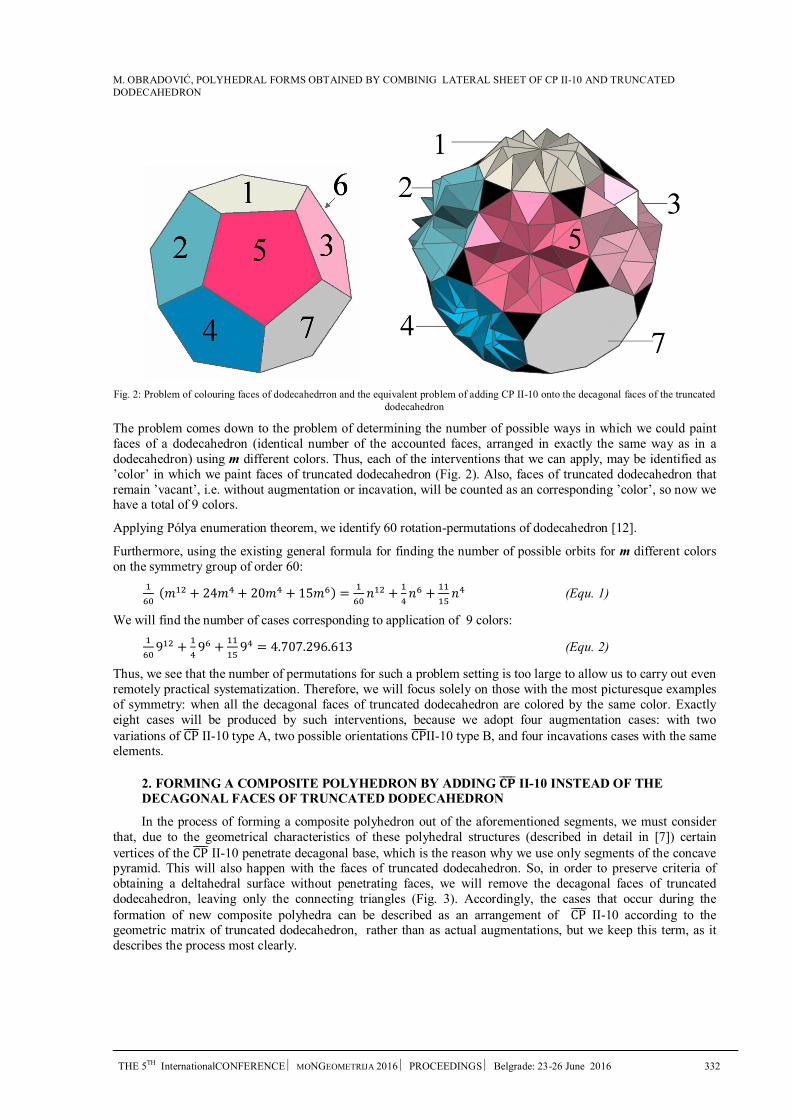
M. OBRADOVIĆ, POLYHEDRAL FORMS OBTAINED BY COMBINIG LATERAL SHEET OF CP II-10 AND TRUNCATED DODECAHEDRON
THE 5TH InternationalCONFERENCE MONGEOMETRIJA 2016 PROCEEDINGS Belgrade: 23-26 June 2016 332
Fig. 2: Problem of colouring faces of dodecahedrron and the equivalent problem of adding CP II-10 onto the decagonal faces of the truncated dodecahedron
The problem comes down to the problem of determining the number of possible ways in which we could paint faces of a dodecahedron (identical number of the accounted faces, arranged in exactly the same way as in a dodecahedron) using m different colors. Thus, each of the interventions that we can apply, may be identified as ’color’ in which we paint faces of truncated dodecahedron (Fig. 2). Also, faces of truncated dodecahedron that remain ’vacant’, i.e. without augmentation or incavation, will be counted as an corresponding ’color’, so now we have a total of 9 colors.
Applying Pólya enumeration theorem, we identify 60 rotation-permutations of dodecahedron [12].
Furthermore, using the existing general formula for finding the number of possible orbits for m different colors on the symmetry group of order 60:
�
��(��� + 24�� + 20�� + 15��) =
�
����� +
�
��� +
��
���� (Equ. 1)
We will find the number of cases corresponding to application of 9 colors:
�
��9�� +
�
�9� +
��
��9� = 4.707.296.613 (Equ. 2)
Thus, we see that the number of permutations for such a problem setting is too large to allow us to carry out even remotely practical systematization. Therefore, we will focus solely on those with the most picturesque examples of symmetry: when all the decagonal faces of truncated dodecahedron are colored by the same color. Exactly eight cases will be produced by such interventions, because we adopt four augmentation cases: with two variations of CP���� II-10 type A, two possible orientations CP����II-10 type B, and four incavations cases with the same elements.
2. FORMING A COMPOSITE POLYHEDRON BY ADDING ������ II-10 INSTEAD OF THEDECAGONAL FACES OF TRUNCATED DODECAHEDRON
In the process of forming a composite polyhedron out of the aforementioned segments, we must consider that, due to the geometrical characteristics of these polyhedral structures (described in detail in [7]) certain vertices of the CP���� II-10 penetrate decagonal base, which is the reason why we use only segments of the concave pyramid. This will also happen with the faces of truncated dodecahedron. So, in order to preserve criteria of obtaining a deltahedral surface without penetrating faces, we will remove the decagonal faces of truncated dodecahedron, leaving only the connecting triangles (Fig. 3). Accordingly, the cases that occur during the formation of new composite polyhedra can be described as an arrangement of CP���� II-10 according to the geometric matrix of truncated dodecahedron, rather than as actual augmentations, but we keep this term, as it describes the process most clearly.
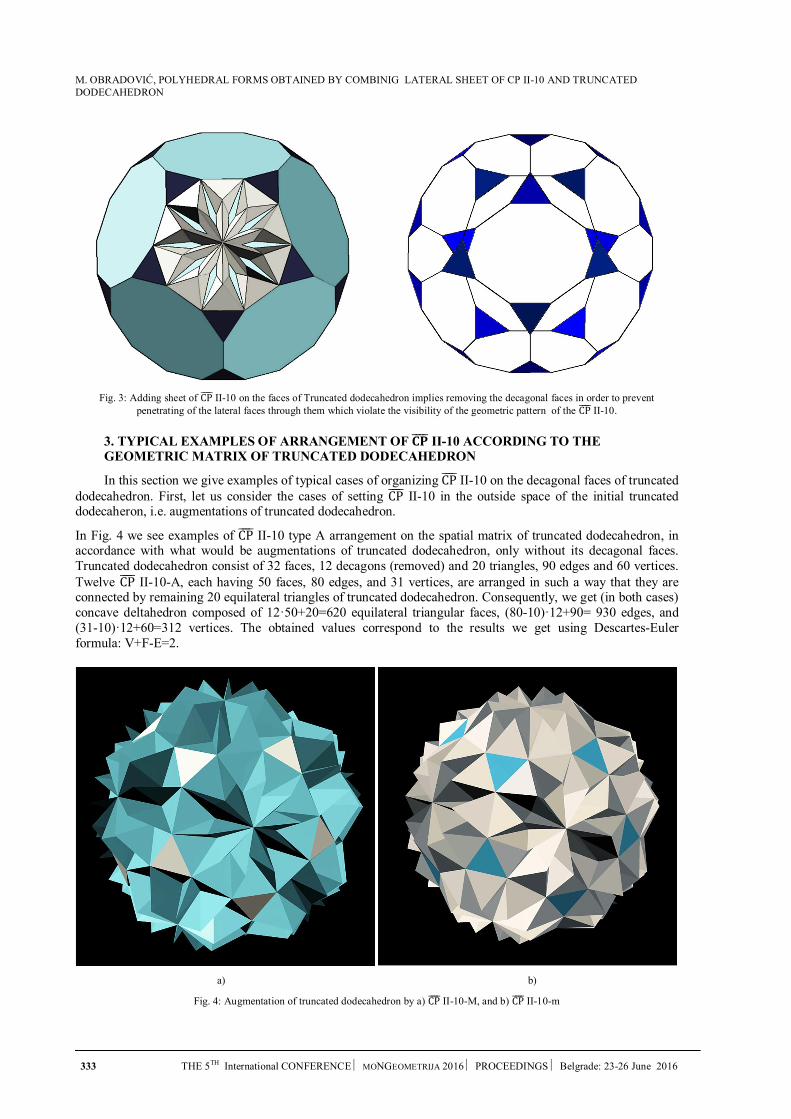
M. OBRADOVIĆ, POLYHEDRAL FORMS OBTAINED BY COMBINIG LATERAL SHEET OF CP II-10 AND TRUNCATED DODECAHEDRON
333 THE 5TH International CONFERENCE MONGEOMETRIJA 2016 PROCEEDINGS Belgrade: 23-26 June 2016
Fig. 3: Adding sheet of CP���� II-10 on the faces of Truncated dodecahedron implies removing the decagonal faces in order to prevent penetrating of the lateral faces through them which violate the visibility of the geometric pattern of the CP���� II-10.
3. TYPICAL EXAMPLES OF ARRANGEMENT OF ������ II-10 ACCORDING TO THEGEOMETRIC MATRIX OF TRUNCATED DODECAHEDRON
In this section we give examples of typical cases of organizing CP���� II-10 on the decagonal faces of truncated dodecahedron. First, let us consider the cases of setting CP���� II-10 in the outside space of the initial truncated dodecaheron, i.e. augmentations of truncated dodecahedron.
In Fig. 4 we see examples of CP���� II-10 type A arrangement on the spatial matrix of truncated dodecahedron, in accordance with what would be augmentations of truncated dodecahedron, only without its decagonal faces. Truncated dodecahedron consist of 32 faces, 12 decagons (removed) and 20 triangles, 90 edges and 60 vertices. Twelve CP���� II-10-A, each having 50 faces, 80 edges, and 31 vertices, are arranged in such a way that they are connected by remaining 20 equilateral triangles of truncated dodecahedron. Consequently, we get (in both cases) concave deltahedron composed of 12·50+20=620 equilateral triangular faces, (80-10)·12+90= 930 edges, and (31-10)·12+60=312 vertices. The obtained values correspond to the results we get using Descartes-Euler formula: V+F-E=2.
a) b)
Fig. 4: Augmentation of truncated dodecahedron by a) CP���� II-10-M, and b) CP���� II-10-m
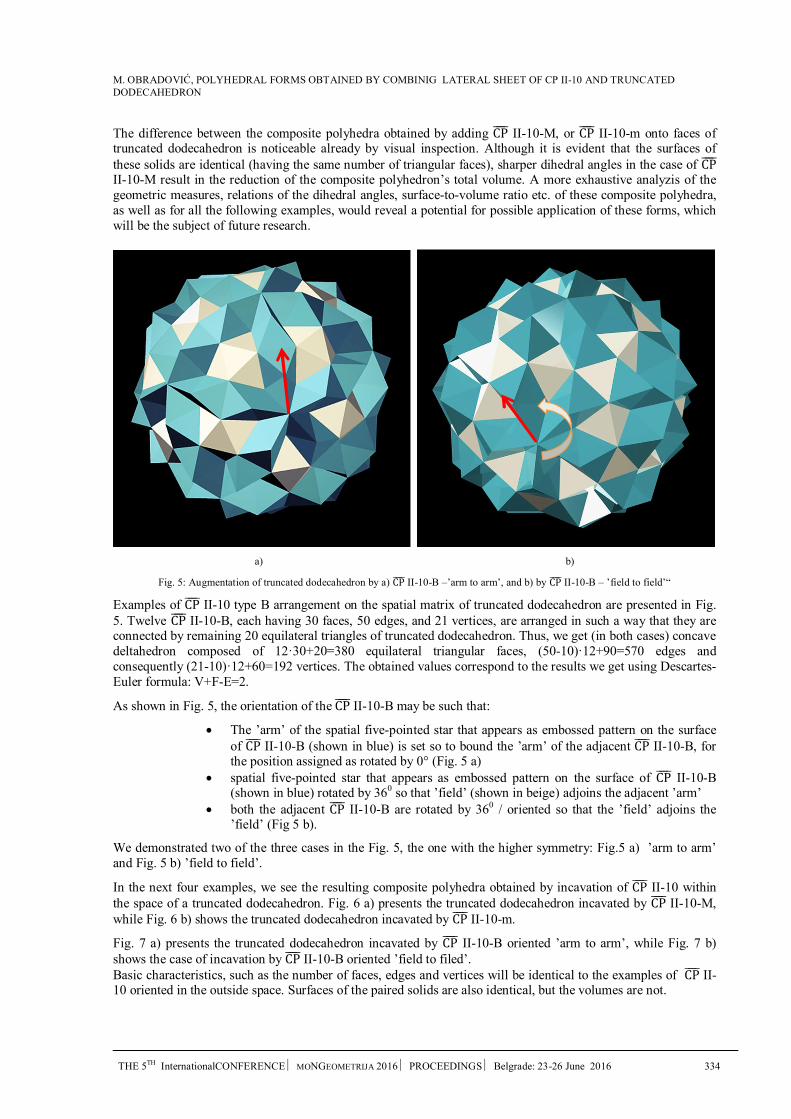
M. OBRADOVIĆ, POLYHEDRAL FORMS OBTAINED BY COMBINIG LATERAL SHEET OF CP II-10 AND TRUNCATED DODECAHEDRON
THE 5TH InternationalCONFERENCE MONGEOMETRIJA 2016 PROCEEDINGS Belgrade: 23-26 June 2016 334
The difference between the composite polyhedra obtained by adding CP���� II-10-M, or CP���� II-10-m onto faces of truncated dodecahedron is noticeable already by visual inspection. Although it is evident that the surfaces of these solids are identical (having the same number of triangular faces), sharper dihedral angles in the case of CP���� II-10-M result in the reduction of the composite polyhedron’s total volume. A more exhaustive analyzis of the geometric measures, relations of the dihedral angles, surface-to-volume ratio etc. of these composite polyhedra, as well as for all the following examples, would reveal a potential for possible application of these forms, which will be the subject of future research.
a) b)
Fig. 5: Augmentation of truncated dodecahedron by a) CP���� II-10-B –’arm to arm’, and b) by CP���� II-10-B – ’field to field’“
Examples of CP���� II-10 type B arrangement on the spatial matrix of truncated dodecahedron are presented in Fig. 5. Twelve CP���� II-10-B, each having 30 faces, 50 edges, and 21 vertices, are arranged in such a way that they areconnected by remaining 20 equilateral triangles of truncated dodecahedron. Thus, we get (in both cases) concave deltahedron composed of 12·30+20=380 equilateral triangular faces, (50-10)·12+90=570 edges and consequently (21-10)·12+60=192 vertices. The obtained values correspond to the results we get using Descartes-Euler formula: V+F-E=2.
As shown in Fig. 5, the orientation of the CP���� II-10-B may be such that:
The ’arm’ of the spatial five-pointed star that appears as embossed pattern on the surfaceof CP���� II-10-B (shown in blue) is set so to bound the ’arm’ of the adjacent CP���� II-10-B, forthe position assigned as rotated by 0° (Fig. 5 a)
spatial five-pointed star that appears as embossed pattern on the surface of CP���� II-10-B(shown in blue) rotated by 360 so that ’field’ (shown in beige) adjoins the adjacent ’arm’
both the adjacent CP���� II-10-B are rotated by 360 / oriented so that the ’field’ adjoins the’field’ (Fig 5 b).
We demonstrated two of the three cases in the Fig. 5, the one with the higher symmetry: Fig.5 a) ’arm to arm’ and Fig. 5 b) ’field to field’.
In the next four examples, we see the resulting composite polyhedra obtained by incavation of CP���� II-10 within the space of a truncated dodecahedron. Fig. 6 a) presents the truncated dodecahedron incavated by CP���� II-10-M, while Fig. 6 b) shows the truncated dodecahedron incavated by CP���� II-10-m.
Fig. 7 a) presents the truncated dodecahedron incavated by CP���� II-10-B oriented ’arm to arm’, while Fig. 7 b) shows the case of incavation by CP���� II-10-B oriented ’field to filed’. Basic characteristics, such as the number of faces, edges and vertices will be identical to the examples of CP���� II-10 oriented in the outside space. Surfaces of the paired solids are also identical, but the volumes are not.
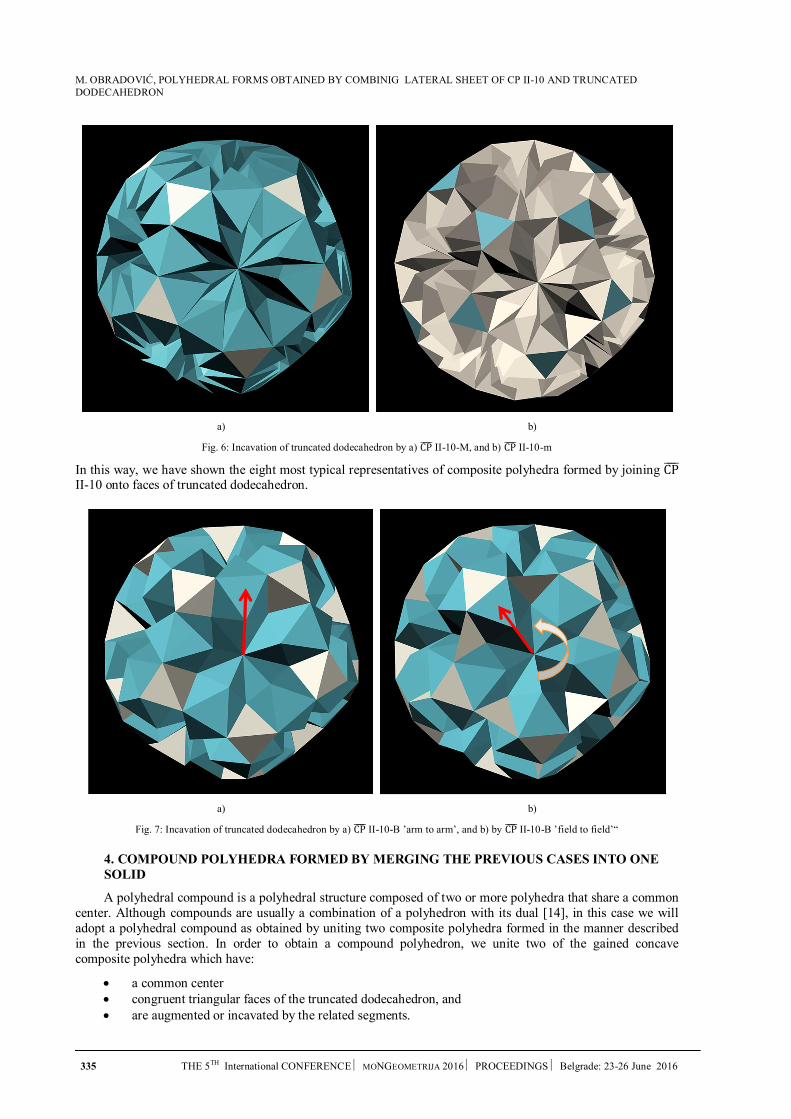
M. OBRADOVIĆ, POLYHEDRAL FORMS OBTAINED BY COMBINIG LATERAL SHEET OF CP II-10 AND TRUNCATED DODECAHEDRON
335 THE 5TH International CONFERENCE MONGEOMETRIJA 2016 PROCEEDINGS Belgrade: 23-26 June 2016
a) b)
Fig. 6: Incavation of truncated dodecahedron by a) CP���� II-10-M, and b) CP���� II-10-m
In this way, we have shown the eight most typical representatives of composite polyhedra formed by joining CP���� II-10 onto faces of truncated dodecahedron.
a) b)
Fig. 7: Incavation of truncated dodecahedron by a) CP���� II-10-B ’arm to arm’, and b) by CP���� II-10-B ’field to field’“
4. COMPOUND POLYHEDRA FORMED BY MERGING THE PREVIOUS CASES INTO ONESOLID
A polyhedral compound is a polyhedral structure composed of two or more polyhedra that share a common center. Although compounds are usually a combination of a polyhedron with its dual [14], in this case we will adopt a polyhedral compound as obtained by uniting two composite polyhedra formed in the manner described in the previous section. In order to obtain a compound polyhedron, we unite two of the gained concave composite polyhedra which have:
a common center congruent triangular faces of the truncated dodecahedron, and are augmented or incavated by the related segments.
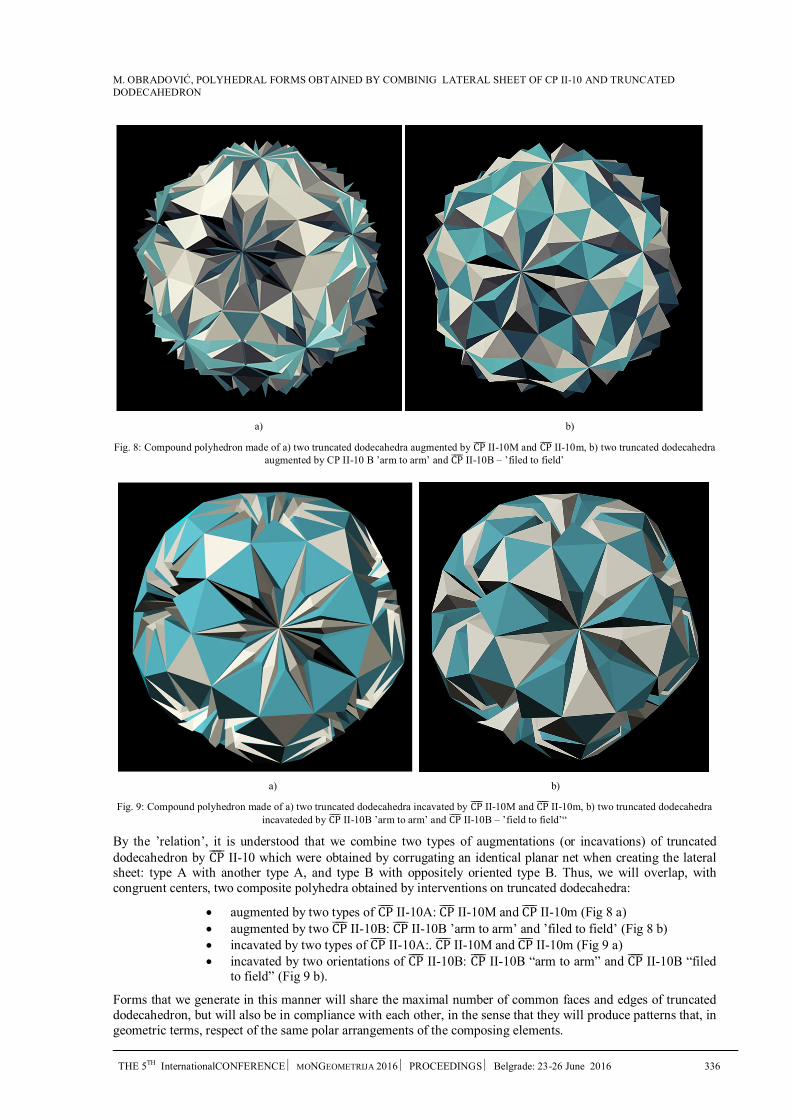
M. OBRADOVIĆ, POLYHEDRAL FORMS OBTAINED BY COMBINIG LATERAL SHEET OF CP II-10 AND TRUNCATED DODECAHEDRON
THE 5TH InternationalCONFERENCE MONGEOMETRIJA 2016 PROCEEDINGS Belgrade: 23-26 June 2016 336
a) b)
Fig. 8: Compound polyhedron made of a) two truncated dodecahedra augmented by CP���� II-10M and CP���� II-10m, b) two truncated dodecahedra augmented by CP II-10 B ’arm to arm’ and CP���� II-10B – ’filed to field’
a) b)
Fig. 9: Compound polyhedron made of a) two truncated dodecahedra incavated by CP���� II-10M and CP���� II-10m, b) two truncated dodecahedra incavateded by CP���� II-10B ’arm to arm’ and CP���� II-10B – ’field to field’“
By the ’relation’, it is understood that we combine two types of augmentations (or incavations) of truncated dodecahedron by CP���� II-10 which were obtained by corrugating an identical planar net when creating the lateral sheet: type A with another type A, and type B with oppositely oriented type B. Thus, we will overlap, with congruent centers, two composite polyhedra obtained by interventions on truncated dodecahedra:
augmented by two types of CP���� II-10A: CP���� II-10M and CP���� II-10m (Fig 8 a) augmented by two CP���� II-10B: CP���� II-10B ’arm to arm’ and ’filed to field’ (Fig 8 b) incavated by two types of CP���� II-10A:. CP���� II-10M and CP���� II-10m (Fig 9 a) incavated by two orientations of CP���� II-10B: CP���� II-10B “arm to arm” and CP���� II-10B “filed
to field” (Fig 9 b).
Forms that we generate in this manner will share the maximal number of common faces and edges of truncated dodecahedron, but will also be in compliance with each other, in the sense that they will produce patterns that, in geometric terms, respect of the same polar arrangements of the composing elements.
M. OBRADOVIĆ, POLYHEDRAL FORMS OBTAINED BY COMBINIG LATERAL SHEET OF CP II-10 AND TRUNCATED DODECAHEDRON
337 THE 5TH International CONFERENCE MONGEOMETRIJA 2016 PROCEEDINGS Belgrade: 23-26 June 2016
5. CONCLUSIONS
The paper presents a number of possible concave composite polyhedra that may be obtained by adding segments of CeP II-10: CP���� II-10, onto decagonal bases of truncated dodecahedron. It is shown that the number (over 4.7 billion) is far beyond the possibilities of visualizing each of them individually. Hence, only the most typical examples of adding one type of CP���� II-10 to all the decagonal faces are given. They may be placed in outer space, making augmentations of truncated dodecahedron, or dented into the interior space, making incavations. In addition to the eight elementary cases, also four cases of the compound polyhedra formation were given, obtained by overlapping two examples of matching composite polyhedra with a common center (overlapped two augmentations with CP���� II-10-A and overlapped two augmentations with CP���� II-10-B). Once the features of the newly obtained polyhedral shapes have been considered, even just by visual inspection, we can then take the next steps in the research and look for the most appropriate area of their application.
ACKNOWLEDGEMENT
This paper is partly supported by MPNTR grant No. III44006.
REFERENCES
1. Burnside, W. Theory of Groups of Finite Order, Cambridge University Press, 1897.
2. Emmerich D.G. Composite polyhedra (Polyedres composites) – Topologie Strucutrale #13, 1986.
3. Harary, F. "Pólya's Enumeration Theorem." Graph Theory. Reading, MA: Addison-Wesley, pp. 180-184, 1994.
4. Huybers P.: Polyhedroids, An Anthology of Structural Morphology, World scientific Publishing Co.Pte. Ltd. 2009. pp. 49-62.
5. Mišić S., Obradović M. Đukanović G.: Composite Concave Cupolae as Geometric and ArchitecturalForms, Journal for Geometry and Graphics, Copyright Heldermann Verlag 2015. Vol.19. No 1. pp79-91. ISSN 1433-8157
6. Obradović M., A Group Of Polyhedra Arised As Variations Of Concave Bicupolae Of Second Sort,Proceedings of 3rd International Scientific Conference MoNGeometrija 2012, ISBN 978-86-7892-405-7 Novi Sad, jun 21-24. 2012. pp. 95-132.
7. Obradović M., Konstruktivno – geometrijska obrada toroidnih deltaedara sa pravilnom poligonalnomosnovom, Arhitektonski fakultet Univerziteta u Beogradu, 2006.
8. Obradović M., Mišić S., Concave Regular Faced Cupolae of Second Sort, Proceedings of 13th ICGG,July 2008, Dresden, Germany, El. Book, pp. 1-10.
9. Obradović M., Mišić S., Petrović M.: Investigating Composite Polyhedral forms obtained bycombining concave cupolae of II sort with Archimedean Solids, Proceedings of 3rd InternationalScientific Conference MoNGeometrija 2012, ISBN 978-86-7892-405-7 Novi Sad, jun 21-24. 2012.pg.109 – 123.
10. Obradović M., Mišić S., Popkonstantinović B., Petrović M., Malešević B., Obradović R.,Investigation of concave cupolae based polyhedral structures and their potential application inarchitecture, TTEM Journal, Vol.8., No.3, 8/9 2013, pp 1198-1214.
11. Obradović M., Mišić S., Popkonstantinović B.: Concave Pyramids of Second Sort -The Occurrence,Types, Variations, 4th International Scientific Conference on Geometry and Graphics,moNGeometrija 2014, jun 20-22.Vlasina, Serbia, Proceedings Vol 2. pp. 157 -168. ISBN 978-86-88601-14-6
12. Obradović M., Mišić S., Popkonstantinović B.: Variations of Concave Pyramids of Second Sort withan Even Number of Base Sides, Journal of Industrial Design and Engineering Graphics (JIDEG) –The SORGING Journal, Volume 10, Special Issue, Fascicle 1, pp. 45-50. Brasov, Romania, June2015.
13. O'Connor J.: Topics in Geometry, Platonic Solids, School of Mathematics and Statistics, Universityof St Andrews, Scotland . http://www-history.mcs.st-and.ac.uk/~john/geometry/Lectures/L10.html
14. W. Hart George, Compound Polyhedra, Wirtual Polyhedra, ©1996.http://www.georgehart.com/virtual-polyhedra/compounds-info.html
R. OBRADOVIĆ ET AL.: PRE PRODUCTION FOR DEVELOPMENT OF EDUCATIONAL 3D ANIMATION ACCORDING TO VEJNOVIC MODIFICATION OF THE CESAREAN SECTION TECHNIQUE
THE 5TH ICGG CONFERENCE MONGEOMETRIJA 2016 PROCEEDINGS Belgrade: 23-26 June 2016 338
PRE PRODUCTION FOR DEVELOPMENT OF EDUCATIONAL 3D ANIMATION ACCORDING TO VEJNOVIC MODIFICATION OF THE
CESAREAN SECTION TECHNIQUE Ratko Obradović
Faculty of Technical Sciences, University of Novi Sad, Novi Sad, Republic of Serbia PhD., Full Professor, [email protected]
Tihomir Vejnović Faculty of Medicine, University of Novi Sad, Novi Sad, Republic of Serbia
PhD., Full Professor, [email protected]
Igor Kekeljević Faculty of Technical Sciences, University of Novi Sad, Novi Sad, Republic of Serbia
PhD., Assistant, [email protected]
Aleksandra Vejnović Faculty of Medicine, University of Novi Sad, Novi Sad, Republic of Serbia
MD., Teaching Associate, [email protected]
Nemanja Višnjevac Faculty of Medicine, University of Novi Sad, Novi Sad, Republic of Serbia
MD., Assistant, [email protected]
Mirko Raković Faculty of Technical Sciences, University of Novi Sad, Novi Sad, Republic of Serbia
PhD., Assistant Professor, [email protected]
Stevan Milatović Faculty of Medicine, University of Novi Sad, Novi Sad, Republic of Serbia
MD., Assistant, [email protected]
ABSTRACT
Computer Graphics can be used for educational, interdisciplinary presentations and for visualization purposes, as it represents an ideal means to teach any discipline that could benefit from the visual presentation. Everyone needs visualization because it is the most natural way in which people view the world, hence the well-known saying that “a picture is worth a thousand words". Visualization represents an excellent choice for presentation in studying and teaching, as well as in information transfer. Engineering Animation is used as a presentation technique. It can be an important link between an idea and its realization like building a model/object.
In this paper, we will show all the necessary techniques used in the process of creating 3D Computer Animation which are prepared to assist in the education and virtual training of Medical Doctors. We are in charge of the development of 3D Computer Animation according to professor Vejnovic’s modification of the cesarean section technique. The process of creating 3D animation will be shown using a couple of examples. Also, the procedure and the list of steps that need to be followed in this specific case to create a 3D animation for educational purposes will be shown.
Keywords: Computer Graphics; Animation for Educational purposes; Cesarean Section technique
R. OBRADOVIĆ ET AL.: PRE PRODUCTION FOR DEVEPMENT OF EDUCATIONAL 3D ANIMATION ACCORDING TO VEJNOVIC MODIFICATION OF THE CESAREAN SECTION TECHNIQUE
339 THE 5TH ICGG CONFERENCE MONGEOMETRIJA 2016 PROCEEDINGS Belgrade: 23-26 June 2016
1. INTRODUCTION
Educational animations are animations produced for the specific purpose of fostering learning. The popularity of using animations to help learners understand and remember information has greatly increased since the advent of powerful graphics-oriented computers. This technology allows animations to be produced much more easily and cheaply than in former years. Previously, traditional animation required specialized labour-intensive techniques that were both time-consuming and expensive. In contrast, software is now available that makes it possible for individual educators to author their own animations without the need for specialist expertise. Teachers are no longer limited to relying on static graphics but can readily convert them into educational animations. The first educational animations were created around the middle of the 20th century and were two-dimensional. The Story of Menstruation [1] is a 1946 10-minute American animated film produced by Walt Disney Productions. It was commissioned by the International Cello-Cotton Company and was shown in a non-theatrical release to approximately 105 million American students in health education classes. In 2015, it was selected for preservation in the National Film Registry (USA). Donald in Mathmagic Land [2] is a 27-minute Donald Duck educational featurette released on June 26, 1959. The film was made available to schools and became one of the most popular educational films ever made by Disney. As Walt Disney explained "The cartoon is a good medium to stimulate interest. We have recently explained mathematics in a film and in that way excited public interest in this very important subject". There are many technical animations, for example, 3D movie - how a car engine works [3]. This animation describes the working principles of engines in the context of an inline-four engine that operates in a four-stroke mode. This kind of engine has four cylinders mounted in a straight line. Jose Arce and Oscar Ivanisevich, two famous surgeons, wanted an animated film showing the technique of their work. To learn and see what needs to be animated Quirino Cristiani had to attend operations [9]. He agreed to that on condition that they ensure him a strong drink. He made two movies: Gastrotomia (1925) and Rinoplastia (1925) which Sorbonne University later bought for educational purposes. The films were praised for accuracy and realism.
The aim of this paper is creating a storyboard as a final step in the pre-production of the animation which presents the procedure for closure of the uterine incision according to Vejnovic’s modified technique of caesarean section ([6], [7]). Namely, there are different approaches in the uterine closure and some of them pass with minor complications [8]. A storyboard is a graphic organizer in the form of illustrations or images displayed in sequence for the purpose of pre-visualizing a motion picture, animation, motion graphics or interactive media sequence [5]. The storyboarding process, in the form it is known today, was developed at Walt Disney studios during the early 1930s, after several years of similar processes being in use at Walt Disney and other animation studios.
The topic of the paper is not a medical one, it is mainly technical. We obtained the initial data by making a high-resolution film in which a doctor – surgeon, instead of repairing of the uterus, sews two pieces of sponge. There are several reasons for this: first, when sewing the sponge the whole procedure was performed in a relaxed atmosphere, the doctors did not hurry. We had time to ask questions and discuss some aspects in order to adequately understand the problem and the procedure. Another reason is that with real repairing of the uterus there is a lot of blood which certainly reduces the visibility and transparency. Precisely because of the bleeding, in real life the doctors must perform the whole procedure in the shortest period of time and there is no time for discussion and asking questions. The third reason is that the procedure is carried out by two doctors who stand on either side of the patient with other medical personnel also present in the operating theatre so it is a very crowded scene. The position of the camera in such a situation would be bad and would, therefore, result in a bad footage. Once we captured the sewing of the sponge, from a few iterations, which included drawing storyboards and consultations with the doctors and then making corrections to the storyboard, we produced the storyboard presented in this paper. An integral part of the storyboard are corresponding comments related to individual drawings. Our intention was that every reader of this paper regardless of whether they are a medical professional, but especially if they are a doctor, understands the procedure of repairing the uterus with caesarean sections using Vejnovic modification. Experienced doctors surgeons have realized that new technologies such as computer animation can provide new tools for the education of young gynaecologists who come to specialize at the Clinic for Gynaecology and Obstetrics in Novi Sad, Serbia. That was the underlying idea for forming our team combining the expertise of doctors - gynaecologists and professionals who deal with computer visualization [4], especially computer graphics. The ultimate goal of this project is to create a 3D computer animation in which the described procedure of repairing uterus will be animated. With storyboard, the pre-production procedure is completed for creating new animations.
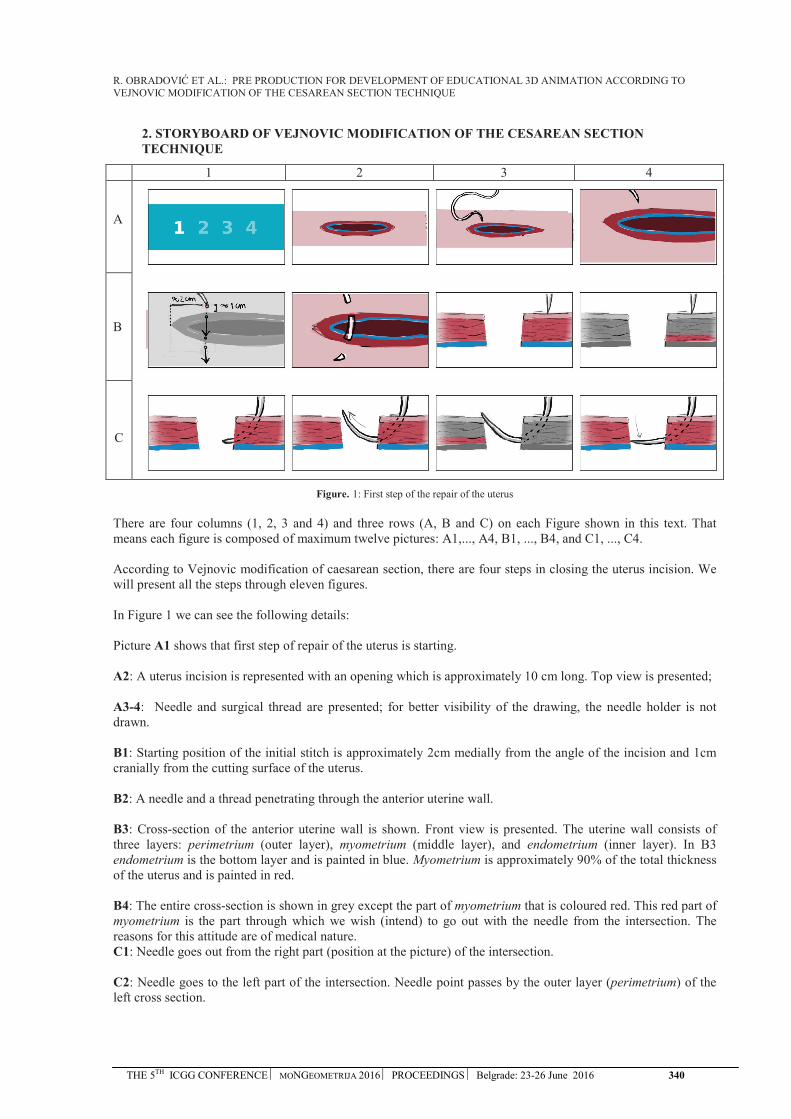
R. OBRADOVIĆ ET AL.: PRE PRODUCTION FOR DEVELOPMENT OF EDUCATIONAL 3D ANIMATION ACCORDING TO VEJNOVIC MODIFICATION OF THE CESAREAN SECTION TECHNIQUE
THE 5TH ICGG CONFERENCE MONGEOMETRIJA 2016 PROCEEDINGS Belgrade: 23-26 June 2016 340
2. STORYBOARD OF VEJNOVIC MODIFICATION OF THE CESAREAN SECTIONTECHNIQUE
1 2 3 4
A
B
C
Figure. 1: First step of the repair of the uterus
There are four columns (1, 2, 3 and 4) and three rows (A, B and C) on each Figure shown in this text. That means each figure is composed of maximum twelve pictures: A1,..., A4, B1, ..., B4, and C1, ..., C4.
According to Vejnovic modification of caesarean section, there are four steps in closing the uterus incision. We will present all the steps through eleven figures.
In Figure 1 we can see the following details:
Picture A1 shows that first step of repair of the uterus is starting.
A2: A uterus incision is represented with an opening which is approximately 10 cm long. Top view is presented;
A3-4: Needle and surgical thread are presented; for better visibility of the drawing, the needle holder is not drawn.
B1: Starting position of the initial stitch is approximately 2cm medially from the angle of the incision and 1cm cranially from the cutting surface of the uterus.
B2: A needle and a thread penetrating through the anterior uterine wall.
B3: Cross-section of the anterior uterine wall is shown. Front view is presented. The uterine wall consists of three layers: perimetrium (outer layer), myometrium (middle layer), and endometrium (inner layer). In B3 endometrium is the bottom layer and is painted in blue. Myometrium is approximately 90% of the total thickness of the uterus and is painted in red.
B4: The entire cross-section is shown in grey except the part of myometrium that is coloured red. This red part of myometrium is the part through which we wish (intend) to go out with the needle from the intersection. The reasons for this attitude are of medical nature. C1: Needle goes out from the right part (position at the picture) of the intersection.
C2: Needle goes to the left part of the intersection. Needle point passes by the outer layer (perimetrium) of the left cross section.
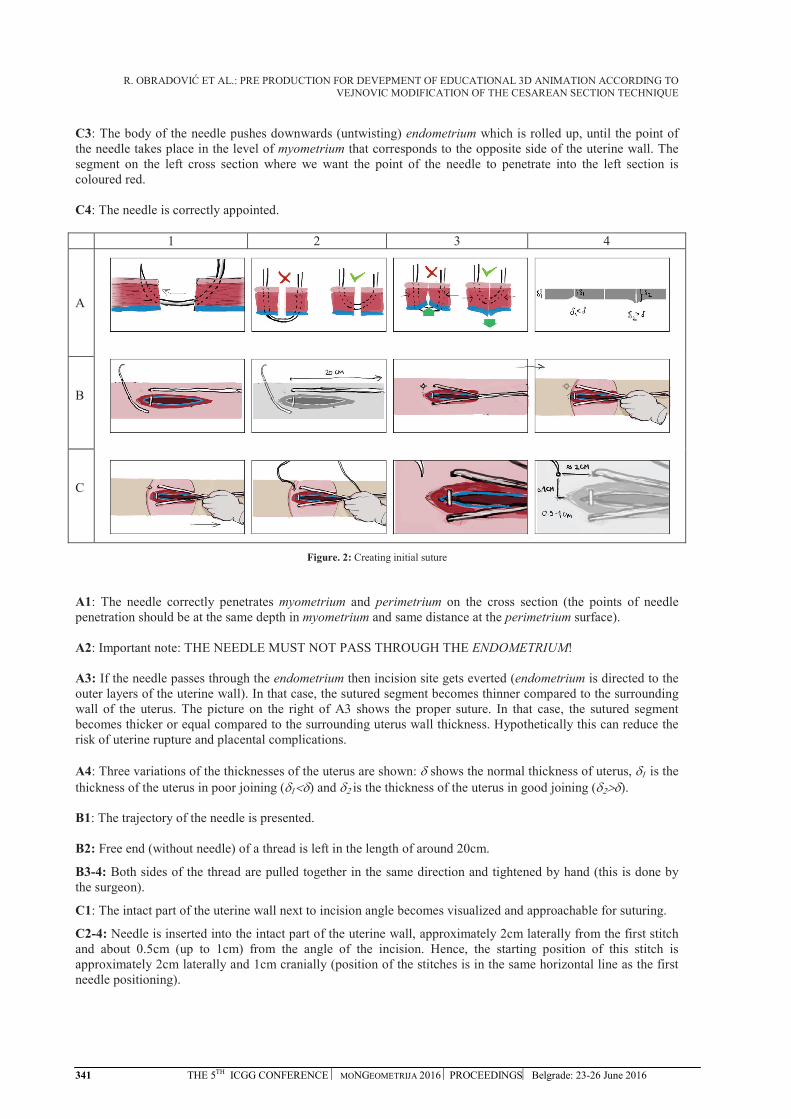
R. OBRADOVIĆ ET AL.: PRE PRODUCTION FOR DEVEPMENT OF EDUCATIONAL 3D ANIMATION ACCORDING TO VEJNOVIC MODIFICATION OF THE CESAREAN SECTION TECHNIQUE
341 THE 5TH ICGG CONFERENCE MONGEOMETRIJA 2016 PROCEEDINGS Belgrade: 23-26 June 2016
C3: The body of the needle pushes downwards (untwisting) endometrium which is rolled up, until the point of the needle takes place in the level of myometrium that corresponds to the opposite side of the uterine wall. The segment on the left cross section where we want the point of the needle to penetrate into the left section is coloured red.
C4: The needle is correctly appointed.
1 2 3 4
A
B
C
Figure. 2: Creating initial suture
A1: The needle correctly penetrates myometrium and perimetrium on the cross section (the points of needle penetration should be at the same depth in myometrium and same distance at the perimetrium surface).
A2: Important note: THE NEEDLE MUST NOT PASS THROUGH THE ENDOMETRIUM!
A3: If the needle passes through the endometrium then incision site gets everted (endometrium is directed to the outer layers of the uterine wall). In that case, the sutured segment becomes thinner compared to the surrounding wall of the uterus. The picture on the right of A3 shows the proper suture. In that case, the sutured segment becomes thicker or equal compared to the surrounding uterus wall thickness. Hypothetically this can reduce the risk of uterine rupture and placental complications.
A4: Three variations of the thicknesses of the uterus are shown: δ shows the normal thickness of uterus, δ1 is the thickness of the uterus in poor joining (δ1<δ) and δ2 is the thickness of the uterus in good joining (δ2>δ).
B1: The trajectory of the needle is presented.
B2: Free end (without needle) of a thread is left in the length of around 20cm.
B3-4: Both sides of the thread are pulled together in the same direction and tightened by hand (this is done by the surgeon).
C1: The intact part of the uterine wall next to incision angle becomes visualized and approachable for suturing.
C2-4: Needle is inserted into the intact part of the uterine wall, approximately 2cm laterally from the first stitch and about 0.5cm (up to 1cm) from the angle of the incision. Hence, the starting position of this stitch is approximately 2cm laterally and 1cm cranially (position of the stitches is in the same horizontal line as the first needle positioning).
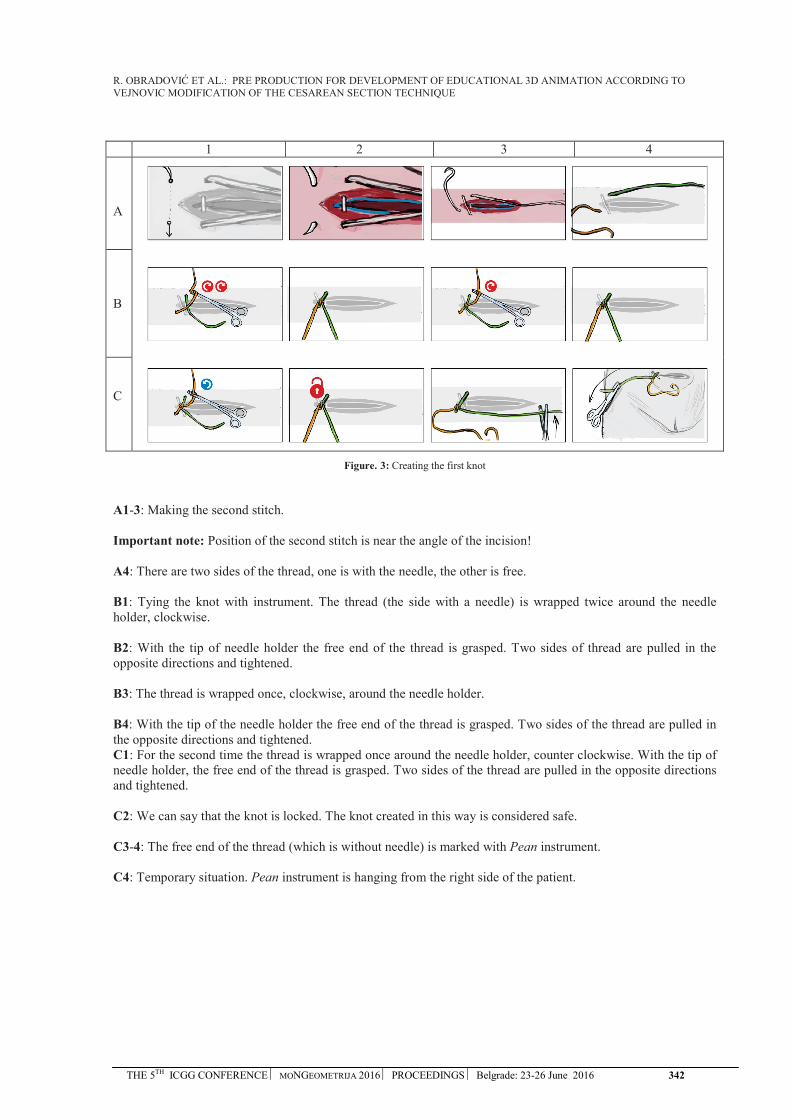
R. OBRADOVIĆ ET AL.: PRE PRODUCTION FOR DEVELOPMENT OF EDUCATIONAL 3D ANIMATION ACCORDING TO VEJNOVIC MODIFICATION OF THE CESAREAN SECTION TECHNIQUE
THE 5TH ICGG CONFERENCE MONGEOMETRIJA 2016 PROCEEDINGS Belgrade: 23-26 June 2016 342
1 2 3 4
A
B
C
Figure. 3: Creating the first knot
A1-3: Making the second stitch.
Important note: Position of the second stitch is near the angle of the incision!
A4: There are two sides of the thread, one is with the needle, the other is free.
B1: Tying the knot with instrument. The thread (the side with a needle) is wrapped twice around the needle holder, clockwise.
B2: With the tip of needle holder the free end of the thread is grasped. Two sides of thread are pulled in the opposite directions and tightened.
B3: The thread is wrapped once, clockwise, around the needle holder.
B4: With the tip of the needle holder the free end of the thread is grasped. Two sides of the thread are pulled in the opposite directions and tightened. C1: For the second time the thread is wrapped once around the needle holder, counter clockwise. With the tip of needle holder, the free end of the thread is grasped. Two sides of the thread are pulled in the opposite directions and tightened.
C2: We can say that the knot is locked. The knot created in this way is considered safe.
C3-4: The free end of the thread (which is without needle) is marked with Pean instrument.
C4: Temporary situation. Pean instrument is hanging from the right side of the patient.

R. OBRADOVIĆ ET AL.: PRE PRODUCTION FOR DEVEPMENT OF EDUCATIONAL 3D ANIMATION ACCORDING TO VEJNOVIC MODIFICATION OF THE CESAREAN SECTION TECHNIQUE
343 THE 5TH ICGG CONFERENCE MONGEOMETRIJA 2016 PROCEEDINGS Belgrade: 23-26 June 2016
1 2 3 4
A
B
C
Figure. 4: Making the first running-locked suture
A1-3: The running-locked suture starts with the stitch which is 1-2cm medially from the initial suture and around 1 cm cranially from the cutting surface (1st running-locked suture).
A4: Pay attention to the trajectory of the thread. The thread should create a loop as it is shown. The succeeding stitch (2nd running-locked suture) is made with the same interspace (1-2cm medially from the nearest suture and around 1 cm cranially from the cutting surface).B1: The 2nd running-locked suture is finished and the 3rd running-locked suture is started with the same interspace (1-2 cm medially from the nearest suture and around 1 cm cranially from the cutting surface).
B2: The 3rd running-locked suture is finished.
B3-4: Tying the knot with instrument. The thread (the side with a needle) is wrapped twice around the needle holder, clockwise. With the tip of the needle holder, the free end of the thread is grasped. Two sides of thread are pulled in the opposite directions.
C1: Distance between the initial suture and 3rd running-locked suture is approximately 5cm before tightening both threads and creating the final knot.
C2: The surgeon tightens the threads by pulling the two parts of the thread in the opposite directions.
C3: By tightening the thread, the distance between the initial suture and the 3rd running-locked suture is reduced.
C4: The distance between the initial suture and 3rd running-locked suture is approximately halved and it is now about 2.5cm long.

R. OBRADOVIĆ ET AL.: PRE PRODUCTION FOR DEVELOPMENT OF EDUCATIONAL 3D ANIMATION ACCORDING TO VEJNOVIC MODIFICATION OF THE CESAREAN SECTION TECHNIQUE
THE 5TH ICGG CONFERENCE MONGEOMETRIJA 2016 PROCEEDINGS Belgrade: 23-26 June 2016 344
1 2 3 4
A
B
C
Figure. 5: Finishing the first step and starting the second step of the repair of the uterus
A1-2: Locking the knot. The thread is wrapped once around the needle holder, clockwise. With the tip of the needle holder, the free end of the thread is grasped. Two sides of the thread are pulled in the opposite directions and tightened.
A3-4: For the second time the thread is wrapped once around the needle holder, counter clockwise. With the tip of the needle holder, the free end of the thread is grasped. Two sides of the thread are pulled in the opposite directions and tightened. This side knot is locked now.
B1: The free end of the thread (which is without needle) is marked with the same Pean instrument and left hanging from the right side of the patient.
C1: The second step of repair of the uterus starts.
C2-4: Repetition of the sequence A3-4, B1 from Figure 1 at the opposite angle of the incision.
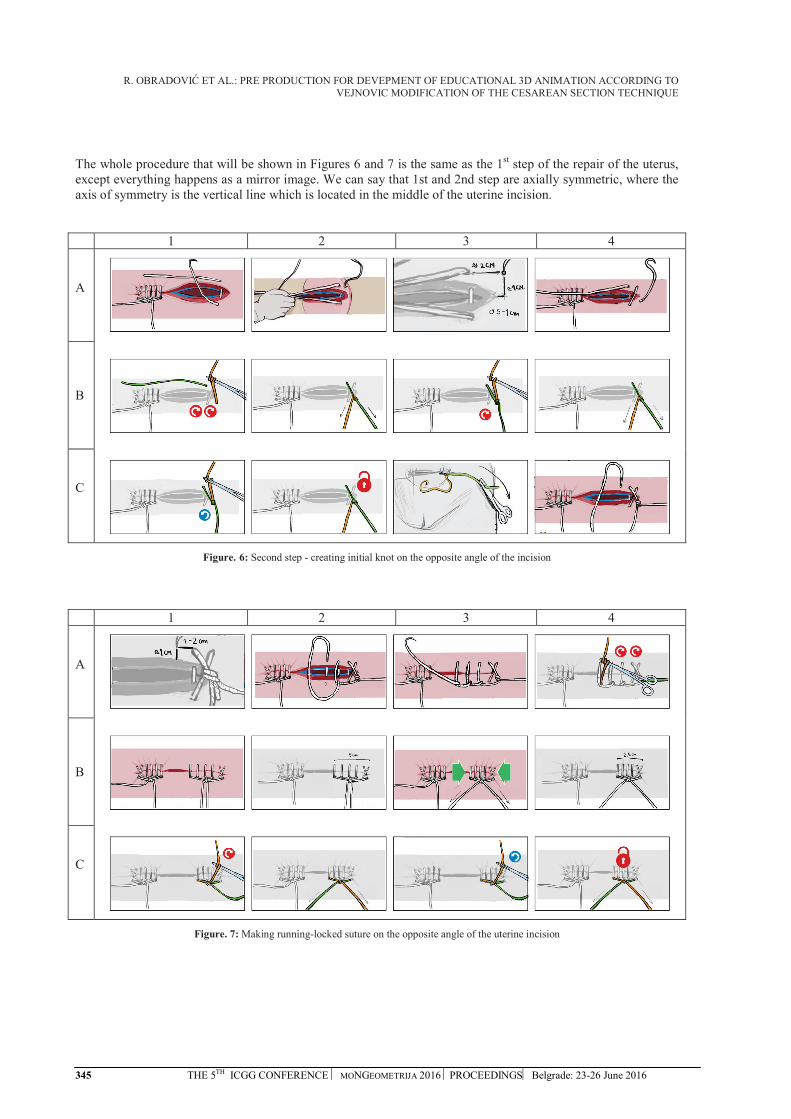
R. OBRADOVIĆ ET AL.: PRE PRODUCTION FOR DEVEPMENT OF EDUCATIONAL 3D ANIMATION ACCORDING TO VEJNOVIC MODIFICATION OF THE CESAREAN SECTION TECHNIQUE
345 THE 5TH ICGG CONFERENCE MONGEOMETRIJA 2016 PROCEEDINGS Belgrade: 23-26 June 2016
The whole procedure that will be shown in Figures 6 and 7 is the same as the 1st step of the repair of the uterus, except everything happens as a mirror image. We can say that 1st and 2nd step are axially symmetric, where the axis of symmetry is the vertical line which is located in the middle of the uterine incision.
1 2 3 4
A
B
C
Figure. 6: Second step - creating initial knot on the opposite angle of the incision
1 2 3 4
A
B
C
Figure. 7: Making running-locked suture on the opposite angle of the uterine incision
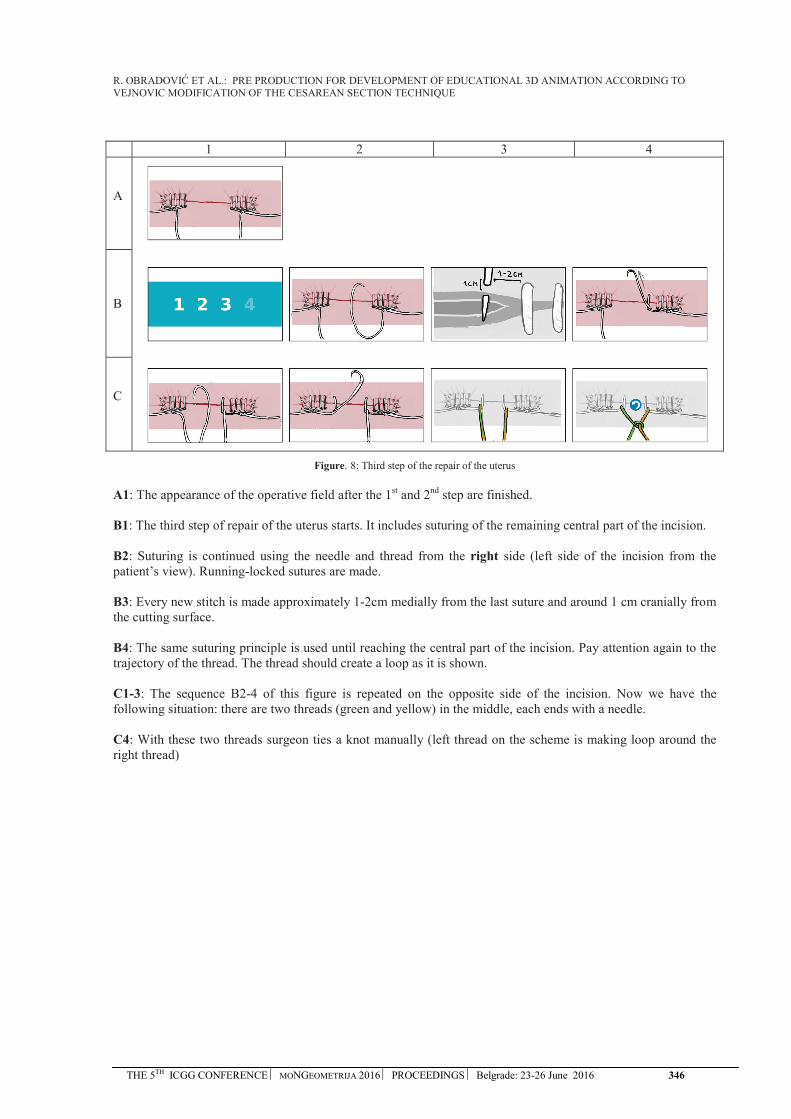
R. OBRADOVIĆ ET AL.: PRE PRODUCTION FOR DEVELOPMENT OF EDUCATIONAL 3D ANIMATION ACCORDING TO VEJNOVIC MODIFICATION OF THE CESAREAN SECTION TECHNIQUE
THE 5TH ICGG CONFERENCE MONGEOMETRIJA 2016 PROCEEDINGS Belgrade: 23-26 June 2016 346
1 2 3 4
A
B
C
Figure. 8: Third step of the repair of the uterus
A1: The appearance of the operative field after the 1st and 2nd step are finished.
B1: The third step of repair of the uterus starts. It includes suturing of the remaining central part of the incision.
B2: Suturing is continued using the needle and thread from the right side (left side of the incision from the patient’s view). Running-locked sutures are made.
B3: Every new stitch is made approximately 1-2cm medially from the last suture and around 1 cm cranially from the cutting surface.
B4: The same suturing principle is used until reaching the central part of the incision. Pay attention again to the trajectory of the thread. The thread should create a loop as it is shown.
C1-3: The sequence B2-4 of this figure is repeated on the opposite side of the incision. Now we have the following situation: there are two threads (green and yellow) in the middle, each ends with a needle.
C4: With these two threads surgeon ties a knot manually (left thread on the scheme is making loop around the right thread)
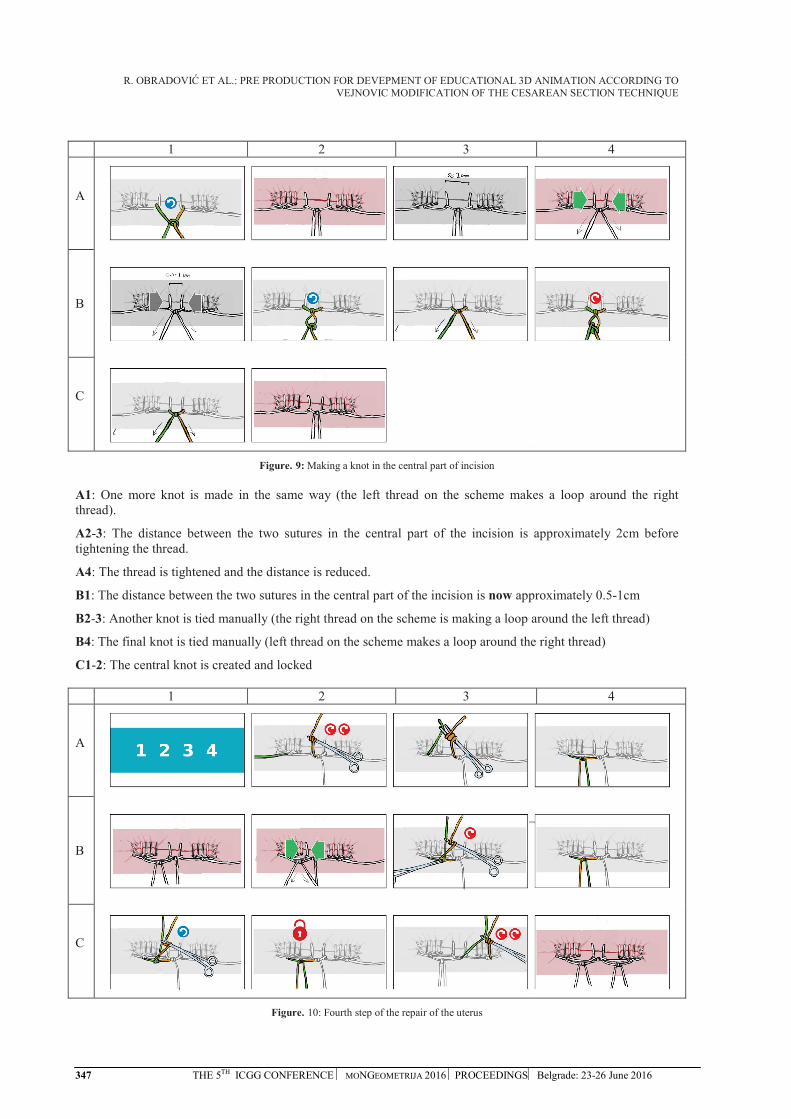
R. OBRADOVIĆ ET AL.: PRE PRODUCTION FOR DEVEPMENT OF EDUCATIONAL 3D ANIMATION ACCORDING TO VEJNOVIC MODIFICATION OF THE CESAREAN SECTION TECHNIQUE
347 THE 5TH ICGG CONFERENCE MONGEOMETRIJA 2016 PROCEEDINGS Belgrade: 23-26 June 2016
1 2 3 4
A
B
C
Figure. 9: Making a knot in the central part of incision
A1: One more knot is made in the same way (the left thread on the scheme makes a loop around the right thread).
A2-3: The distance between the two sutures in the central part of the incision is approximately 2cm before tightening the thread.
A4: The thread is tightened and the distance is reduced.
B1: The distance between the two sutures in the central part of the incision is now approximately 0.5-1cm
B2-3: Another knot is tied manually (the right thread on the scheme is making a loop around the left thread)
B4: The final knot is tied manually (left thread on the scheme makes a loop around the right thread)
C1-2: The central knot is created and locked
1 2 3 4
A
B
C
Figure. 10: Fourth step of the repair of the uterus

R. OBRADOVIĆ ET AL.: PRE PRODUCTION FOR DEVELOPMENT OF EDUCATIONAL 3D ANIMATION ACCORDING TO VEJNOVIC MODIFICATION OF THE CESAREAN SECTION TECHNIQUE
THE 5TH ICGG CONFERENCE MONGEOMETRIJA 2016 PROCEEDINGS Belgrade: 23-26 June 2016 348
A1: The fourth step of repair of the uterus starts.
A2-4: There are four threads, two of them are in the middle and end with a needle, one free end originates from left side knot and another free end originates from the right knot.
The left thread from the middle is wrapped twice around the needle holder, clockwise. With the tip of the needle holder, the left free end of the thread is grasped. Two sides of thread are pulled in the opposite directions.
B1-2: Two sides of the thread are tightened and the distance between the two sutures is reduced.
B3-4: Locking the left knot. The same thread (with a needle) is wrapped once around the needle holder, clockwise. With the tip of the needle holder, the same free end of the thread is grasped. Two sides of thread are pulled in the opposite directions and tightened.
C1: For the second time the thread is wrapped ones around the needle holder, counterclockwise. With the tip of the needle holder, the free end of the thread is grasped. Two sides of the thread are pulled in the opposite directions and tightened.
C2: The final left knot is locked.
C3-4: The right thread from the middle is wrapped twice around the needle holder, clockwise. With the tip of the needle holder, the right free end of the thread is grasped. Two sides of the thread are pulled in the opposite directions.
1 2 3 4
A
B
C
Figure. 11: Finishing the repair of the uterus
A1: Two sides of thread are tightened and the distance between the two sutures is reduced.
A2-3: Locking the right knot. The same thread (with a needle) is wrapped once around the needle holder clockwise. With the tip of the needle holder, the same free end of the thread is grasped. Two sides of the thread are pulled in the opposite directions and tightened.
A4: Foe the second time the thread is wrapped once around the needle holder, counterclockwise. With the tip of the needle holder, the free end of the thread is grasped. Two sides of thread are pulled in the opposite directions and tightened.
B1: This is the final right knot.
B2: All knots are locked. There are two pairs of thread ends.
B3: Using scissors two ends at the right side are cut.
B4: Using scissors two ends at the left side are cut.
C1: Operative field appearance after the repair of the uterus is completed.

R. OBRADOVIĆ ET AL.: PRE PRODUCTION FOR DEVEPMENT OF EDUCATIONAL 3D ANIMATION ACCORDING TO VEJNOVIC MODIFICATION OF THE CESAREAN SECTION TECHNIQUE
349 THE 5TH ICGG CONFERENCE MONGEOMETRIJA 2016 PROCEEDINGS Belgrade: 23-26 June 2016
Recapitulation
C2: The uterine incision at the start was approximately 10 cm long. After the suturing the length of the uterine incision is reduced to approximately 5cm.
C3: This is cross-section view demonstrating the effects of two suturing techniques on the length and thickness of the uterine incision. Two results are presented – a poor one (top picture) and a good one (bottom picture).
Important notes:
Bad result (Fig. 11, C3, top picture) would occur if the needle passes through the endometrium while suturing. In the standard technique of uterus repair, at the end of the process, the incision is as long as the initial incision.
Better result (Fig. 11, C3, bottom picture) is obtained if Vejnovic modification of the cesarean section technique is performed:
1. In this case, the length of the incision is approximately halved.2. It is particularly important in reducing the risk of complications in the subsequent pregnancies.
CONCLUSION
This paper provides a brief overview of the use of 2D and 3D animations for education in various fields. The main topic of this work is creating a storyboard in which Vejnovic modification of repairing uterus at caesarean section is shown. Namely, it was noted in modern gynaecological practice that the possibilities for good and quality education of new doctors and residents are almost exhausted. On the other hand, experienced doctors have noticed that some of the disadvantages of the standard process of education can be overcome by the use of new technologies. This is where animation, a new tool in education which has several advantages, can help. The animation does not happen in the operating theatre where doctors and surgeons do not have enough time to teach because they have to operate and complete the operation at the optimum time. The animation of this process offers an opportunity to a young doctor to repeatedly see the operation on the screen, and with the animation many segments of the operation can be enlarged or shown in slow motion, and the whole procedure can be watched a countless number of times. This offers multiple benefits, to experienced doctors and even more to the younger ones. This practically means that a young doctor will be present at the real operation only when they become familiar with almost the whole procedure in the virtual world and after that, during the actual operation, they will be able to remove all doubts in consultation with an experienced surgeon. On the other hand, the time an experienced surgeon needs to be spent on the education of young doctors is significantly reduced and the process of education increases significantly in efficiency and speed and therefore in the quality.
This paper presents a detailed storyboard which is illustrated in 11 figures, each with a maximum of 12 pictures. An integral part of the storyboard are the detailed comments, which should clarify the situation to every reader. The storyboard is created based on the film showing a procedure of repairing the uterus by using a sponge model instead of a uterus. This is done in order to achieve a better shot than with a video of real operation conditions. It shows the surgical procedure without haste, in a relaxed atmosphere along with many significant comments on the details of the operation that a surgeon could emphasize and repeat. This also avoided blood on the scene, which in real terms reduces the transparency of the recording. In this way, the pre-production of the process of repairing the uterus by a modified Vejnovic technique is completed and our next job will be to create an educational 3D animation on this topic and thus complete the idea.
ACKNOWLEDGEMENTS
The research for this paper was financially supported by the Provincial Secretariat for Science and Technological Development of the Autonomous Province of Vojvodina through the financing of the project "Developing of educational 2D/3D visual animation repairing uterus at caesarean section". We also thank the anonymous reviewers for their feedback.

R. OBRADOVIĆ ET AL.: PRE PRODUCTION FOR DEVELOPMENT OF EDUCATIONAL 3D ANIMATION ACCORDING TO VEJNOVIC MODIFICATION OF THE CESAREAN SECTION TECHNIQUE
THE 5TH ICGG CONFERENCE MONGEOMETRIJA 2016 PROCEEDINGS Belgrade: 23-26 June 2016 350
REFERENCES
1. The Story of Menstruation, 1946. https://www.youtube.com/watch?v=eLhld_PI2zg
[Accessed: 1st April 2016].
2. Donald in Mathmagic Land, 1959. https://www.youtube.com/watch?v=AJgkaU08VvY
[Accessed: 1st April 2016].
3. How a Car Engine Works, 2011. https://www.youtube.com/watch?v=4W_NRHxekaY
[Accessed: 1st April 2016].
4. Computer Graphics - Engineering Animation Studies, Faculty of Technical Sciences, 2011.http://www.racunarska-grafika.com/index.php/studentski-radovi [Accessed: 1st April 2016].
5. Byrne, M.T., 1999. The Art of Layout And Storyboarding. Leixlip, Co. Kildare, Ireland.
6. Vejnovic, T., Costa, S.D., Ignatov, A., 2012. New Technique for Caesarean Section. Geburtshilfe undFrauenheilkunde, Vol. 72 No. 9. pp. 840-845.
7. Vejnovic, T., 2008. Caesarean delivery - Vejnovic modification. Srpski arhiv za celokupno lekarstvo,Vol. 136. pp. 109-115.
8. Vejnovic, T., Grahovac, M., Veselovski, A., Koledin, S., 2011. Surgical wounds complications in twodifferent techniques of a cesarian section. Healthmed, Vol. 5 No. 6. pp. 1754-1761.
9. Palihnić, S., Bendazzi, Giannalberto, 2015. Dvaput prvi - Quirino Cristiani i dugometražni animiranifilm, Hrvatski filmski letopis, No. 84, Croatia.
BAJSANSKI ET AL.: PROCEDURAL MODELLING TOOLS IN ARCHITECTURAL EDUCATION
THE 5TH ICGG CONFERENCE MONGEOMETRIJA 2016 PROCEEDINGS Belgrade: 23-26 June 2016 351
PROCEDURAL MODELLING TOOLS IN ARCHITECTURAL EDUCATION
Ivana Bajšanski
Department of Architecture, University of Novi Sad, Novi Sad, Serbia MSc., Teaching Assistant, [email protected]
Miloš Mandić
RT-RK, Novi Sad, Serbia MSc., [email protected]
Bojan Tepavčević
Department of Architecture, University of Novi Sad, Novi Sad, Serbia PhD., Associate Professor, [email protected]
ABSTRACT
Procedural modelling in architecture has become very important area of research in the last several years. In architectural and urban planning practice procedural modelling based on shape grammar has been used as a method for 3D modelling of smart cities. Accordingly, contrary to traditional approaches of modelling, many schools of architecture introduce shape grammar as obligatory field of research for their students. The aim of this paper is to emphasize the importance of introducing procedural modelling, shape grammar and software applications into student’s education and architectural practice. Various approaches of generating complex built urban environments are presented. In the students’ practical works, it is shown that shape grammar used for generating buildings with historical styles is different compared to buildings which belong to the modern style of architecture. Also, there is emphasis on the importance of differences between processes of generating rules in historical and modern buildings. The CGA (Computer Generated Architecture) shape grammar is a unique programming language based on the rules specified to generate complex urban environments within the City Engine software application. Taking into account that each three-dimensional or two-dimensional shape can be defined with simple grammar rules, and that a complex urban environment can be generated easily. Due to this it is concluded that shape grammar and procedural modelling have an influence on architectural education and consequently on architectural practice.
Keywords: Procedural modelling, City Engine, Architectural education, Complex built environment.
1. INTRODUCTION
In recent years, creation of complex three-dimensional built environments is one of the most important tasks in urban planning and architecture practice (Huang et al., 2013). Cities are urban systems of high complex geometrical forms, which imply the cultural, historical, economic and social changes over time. Hence, the huge problem in modelling of complex built environment is complicated forms and various styles of facades. Modelling of large three-dimensional environments, such as cities, is a complicated process for architects and urban planners. Furthermore, modelling of compelling urban areas and cities is time consuming and very
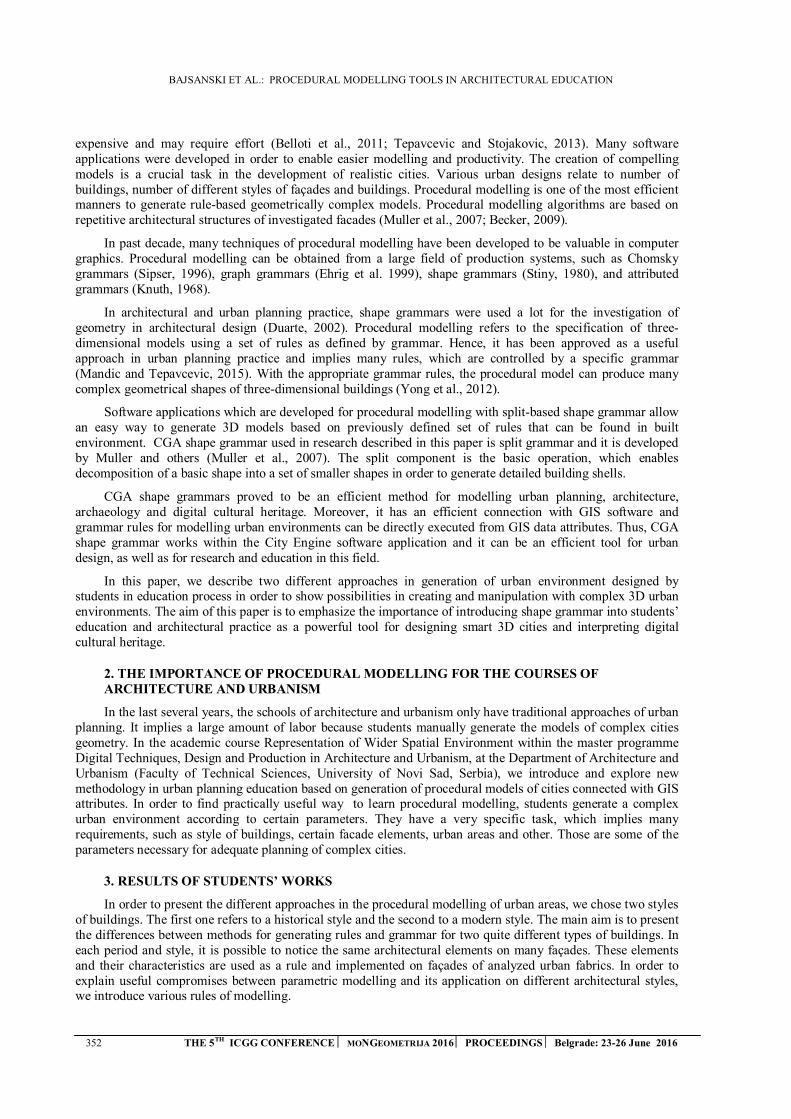
BAJSANSKI ET AL.: PROCEDURAL MODELLING TOOLS IN ARCHITECTURAL EDUCATION
352 THE 5TH ICGG CONFERENCE MONGEOMETRIJA 2016 PROCEEDINGS Belgrade: 23-26 June 2016
expensive and may require effort (Belloti et al., 2011; Tepavcevic and Stojakovic, 2013). Many software applications were developed in order to enable easier modelling and productivity. The creation of compelling models is a crucial task in the development of realistic cities. Various urban designs relate to number of buildings, number of different styles of façades and buildings. Procedural modelling is one of the most efficient manners to generate rule-based geometrically complex models. Procedural modelling algorithms are based on repetitive architectural structures of investigated facades (Muller et al., 2007; Becker, 2009).
In past decade, many techniques of procedural modelling have been developed to be valuable in computer graphics. Procedural modelling can be obtained from a large field of production systems, such as Chomsky grammars (Sipser, 1996), graph grammars (Ehrig et al. 1999), shape grammars (Stiny, 1980), and attributed grammars (Knuth, 1968).
In architectural and urban planning practice, shape grammars were used a lot for the investigation of geometry in architectural design (Duarte, 2002). Procedural modelling refers to the specification of three-dimensional models using a set of rules as defined by grammar. Hence, it has been approved as a useful approach in urban planning practice and implies many rules, which are controlled by a specific grammar (Mandic and Tepavcevic, 2015). With the appropriate grammar rules, the procedural model can produce many complex geometrical shapes of three-dimensional buildings (Yong et al., 2012).
Software applications which are developed for procedural modelling with split-based shape grammar allow an easy way to generate 3D models based on previously defined set of rules that can be found in built environment. CGA shape grammar used in research described in this paper is split grammar and it is developed by Muller and others (Muller et al., 2007). The split component is the basic operation, which enables decomposition of a basic shape into a set of smaller shapes in order to generate detailed building shells.
CGA shape grammars proved to be an efficient method for modelling urban planning, architecture, archaeology and digital cultural heritage. Moreover, it has an efficient connection with GIS software and grammar rules for modelling urban environments can be directly executed from GIS data attributes. Thus, CGA shape grammar works within the City Engine software application and it can be an efficient tool for urban design, as well as for research and education in this field.
In this paper, we describe two different approaches in generation of urban environment designed by students in education process in order to show possibilities in creating and manipulation with complex 3D urban environments. The aim of this paper is to emphasize the importance of introducing shape grammar into students’ education and architectural practice as a powerful tool for designing smart 3D cities and interpreting digital cultural heritage.
2. THE IMPORTANCE OF PROCEDURAL MODELLING FOR THE COURSES OFARCHITECTURE AND URBANISM
In the last several years, the schools of architecture and urbanism only have traditional approaches of urban planning. It implies a large amount of labor because students manually generate the models of complex cities geometry. In the academic course Representation of Wider Spatial Environment within the master programme Digital Techniques, Design and Production in Architecture and Urbanism, at the Department of Architecture and Urbanism (Faculty of Technical Sciences, University of Novi Sad, Serbia), we introduce and explore new methodology in urban planning education based on generation of procedural models of cities connected with GIS attributes. In order to find practically useful way to learn procedural modelling, students generate a complex urban environment according to certain parameters. They have a very specific task, which implies many requirements, such as style of buildings, certain facade elements, urban areas and other. Those are some of the parameters necessary for adequate planning of complex cities.
3. RESULTS OF STUDENTS’ WORKS
In order to present the different approaches in the procedural modelling of urban areas, we chose two styles of buildings. The first one refers to a historical style and the second to a modern style. The main aim is to present the differences between methods for generating rules and grammar for two quite different types of buildings. In each period and style, it is possible to notice the same architectural elements on many façades. These elements and their characteristics are used as a rule and implemented on façades of analyzed urban fabrics. In order to explain useful compromises between parametric modelling and its application on different architectural styles, we introduce various rules of modelling.
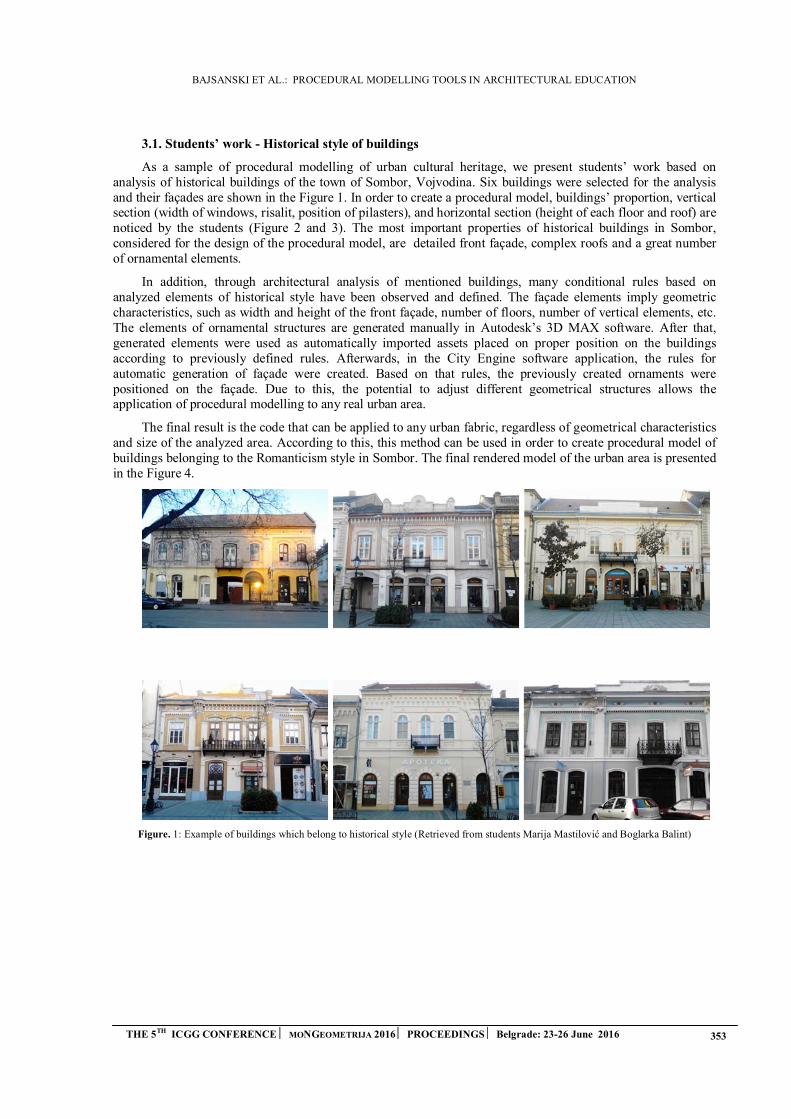
BAJSANSKI ET AL.: PROCEDURAL MODELLING TOOLS IN ARCHITECTURAL EDUCATION
THE 5TH ICGG CONFERENCE MONGEOMETRIJA 2016 PROCEEDINGS Belgrade: 23-26 June 2016 353
3.1. Students’ work - Historical style of buildings
As a sample of procedural modelling of urban cultural heritage, we present students’ work based on analysis of historical buildings of the town of Sombor, Vojvodina. Six buildings were selected for the analysis and their façades are shown in the Figure 1. In order to create a procedural model, buildings’ proportion, vertical section (width of windows, risalit, position of pilasters), and horizontal section (height of each floor and roof) are noticed by the students (Figure 2 and 3). The most important properties of historical buildings in Sombor, considered for the design of the procedural model, are detailed front façade, complex roofs and a great number of ornamental elements.
In addition, through architectural analysis of mentioned buildings, many conditional rules based on analyzed elements of historical style have been observed and defined. The façade elements imply geometric characteristics, such as width and height of the front façade, number of floors, number of vertical elements, etc. The elements of ornamental structures are generated manually in Autodesk’s 3D MAX software. After that, generated elements were used as automatically imported assets placed on proper position on the buildings according to previously defined rules. Afterwards, in the City Engine software application, the rules for automatic generation of façade were created. Based on that rules, the previously created ornaments were positioned on the façade. Due to this, the potential to adjust different geometrical structures allows the application of procedural modelling to any real urban area.
The final result is the code that can be applied to any urban fabric, regardless of geometrical characteristics and size of the analyzed area. According to this, this method can be used in order to create procedural model of buildings belonging to the Romanticism style in Sombor. The final rendered model of the urban area is presented in the Figure 4.
Figure. 1: Example of buildings which belong to historical style (Retrieved from students Marija Mastilović and Boglarka Balint)
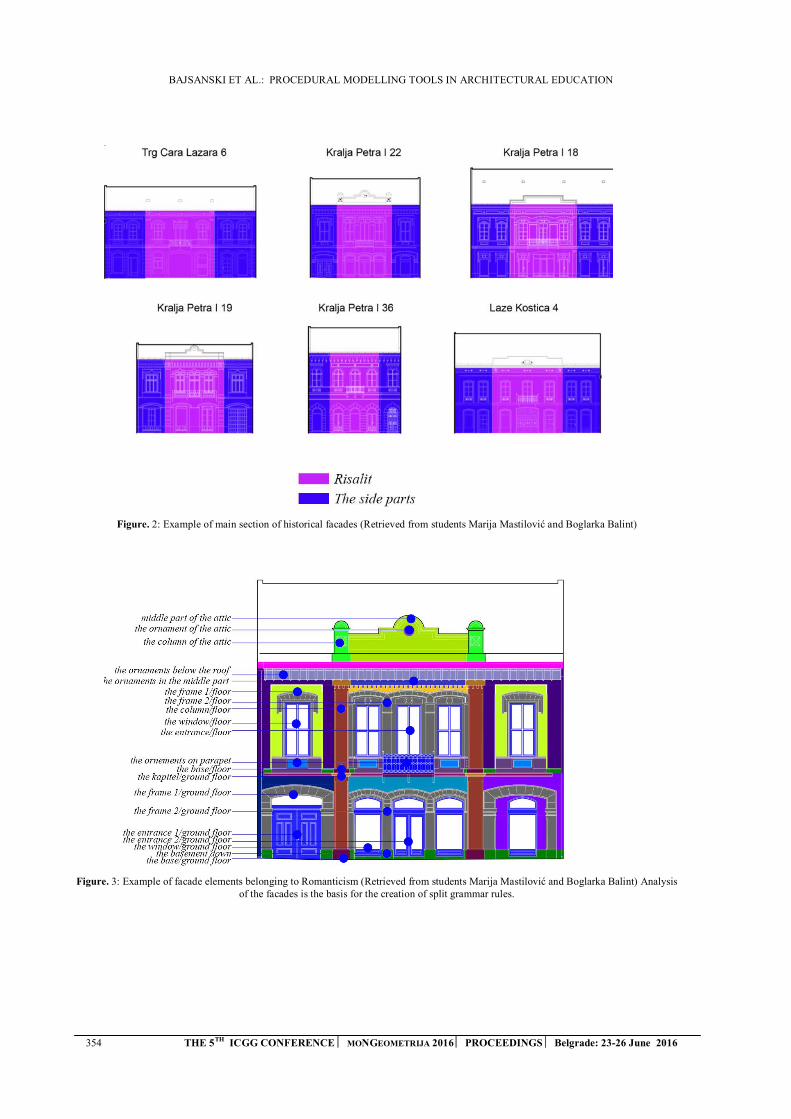
BAJSANSKI ET AL.: PROCEDURAL MODELLING TOOLS IN ARCHITECTURAL EDUCATION
354 THE 5TH ICGG CONFERENCE MONGEOMETRIJA 2016 PROCEEDINGS Belgrade: 23-26 June 2016
Figure. 2: Example of main section of historical facades (Retrieved from students Marija Mastilović and Boglarka Balint)
Figure. 3: Example of facade elements belonging to Romanticism (Retrieved from students Marija Mastilović and Boglarka Balint) Analysis of the facades is the basis for the creation of split grammar rules.

BAJSANSKI ET AL.: PROCEDURAL MODELLING TOOLS IN ARCHITECTURAL EDUCATION
THE 5TH ICGG CONFERENCE MONGEOMETRIJA 2016 PROCEEDINGS Belgrade: 23-26 June 2016 355
Figure. 4: The generated 3D model of investigated historical urban area (Retrieved from students Marija Mastilović and Boglarka Balint)
3.2 Students work - Modern style of buildings
Contrary to procedural modelling of historical cities, design and modelling of modern urban areas require different approach and issues, and challenge creation of design rules that can be applied as a tool in urban planning. They were tested during the academic year of 2015. The theme of the course was recognition of elements of architecture specifics for certain successful examples of urban renewal projects in European cities and their implementation into building blocks for urban areas in Novi Sad.
In order to demonstrate the application of procedural modelling, we provide examples of modern buildings of European cities. The selected areas from European cities are the Hafencity urban district in Hamburg and the Eastern Docklands in Amsterdam. Each of these urban district contains buildings with specific geometrically characteristics and same façade elements. Students’ task was determination of the most important and most usually façade elements belongs to European urban districts (Figure 5). The most common elements noticed by students are brisoleys, loggia, erker and balcony. In this example, we show how different types of elements can be easily generated.
After determination, the next phase was implementation of specific characteristics into buildings, which are placed in an empty urban block in the city of Novi Sad. The undeveloped urban areas of Nova Detelinara and Ribarac in Novi Sad were selected for urban transformation using procedural modelling. The final generated 3D models of investigated urban areas are presented in Figure 6.
Figure. 5: Example of facade elements belongs to Modern style (Retrieved from students Ivana Stojanovic, Jovan Maksimovic and Zeljko Pavlovic)
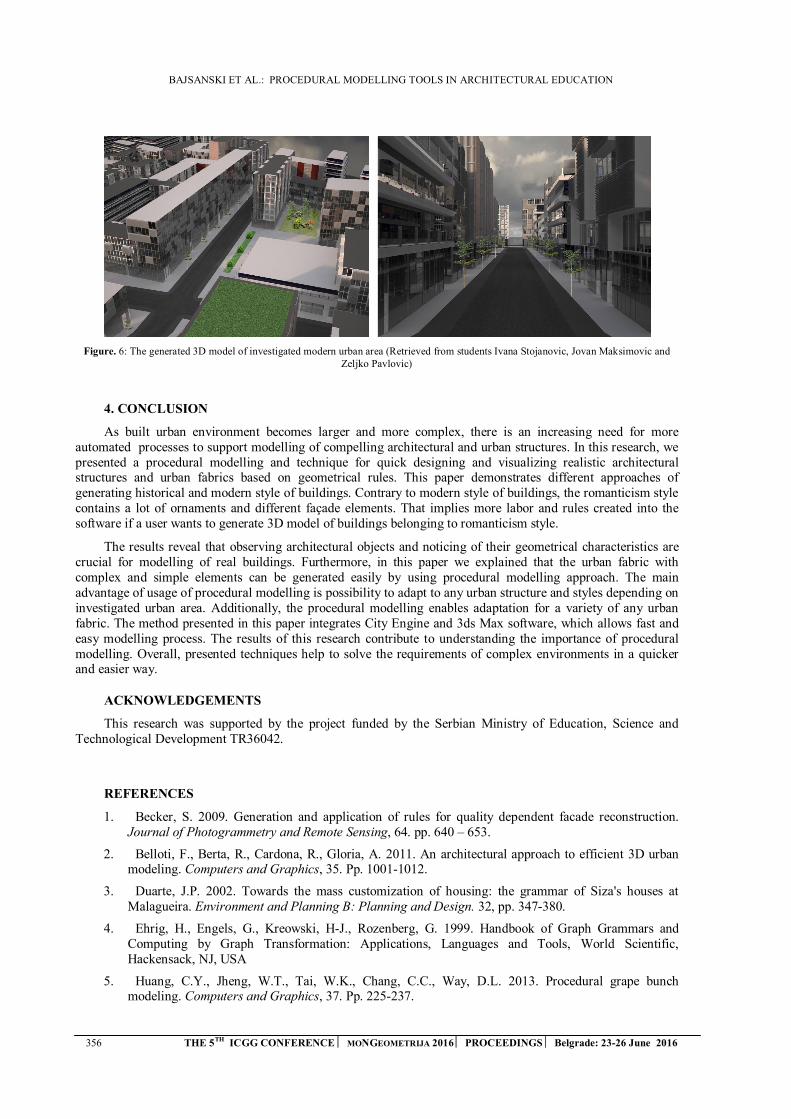
BAJSANSKI ET AL.: PROCEDURAL MODELLING TOOLS IN ARCHITECTURAL EDUCATION
356 THE 5TH ICGG CONFERENCE MONGEOMETRIJA 2016 PROCEEDINGS Belgrade: 23-26 June 2016
Figure. 6: The generated 3D model of investigated modern urban area (Retrieved from students Ivana Stojanovic, Jovan Maksimovic and Zeljko Pavlovic)
4. CONCLUSION
As built urban environment becomes larger and more complex, there is an increasing need for more automated processes to support modelling of compelling architectural and urban structures. In this research, we presented a procedural modelling and technique for quick designing and visualizing realistic architectural structures and urban fabrics based on geometrical rules. This paper demonstrates different approaches of generating historical and modern style of buildings. Contrary to modern style of buildings, the romanticism style contains a lot of ornaments and different façade elements. That implies more labor and rules created into the software if a user wants to generate 3D model of buildings belonging to romanticism style.
The results reveal that observing architectural objects and noticing of their geometrical characteristics are crucial for modelling of real buildings. Furthermore, in this paper we explained that the urban fabric with complex and simple elements can be generated easily by using procedural modelling approach. The main advantage of usage of procedural modelling is possibility to adapt to any urban structure and styles depending on investigated urban area. Additionally, the procedural modelling enables adaptation for a variety of any urban fabric. The method presented in this paper integrates City Engine and 3ds Max software, which allows fast and easy modelling process. The results of this research contribute to understanding the importance of procedural modelling. Overall, presented techniques help to solve the requirements of complex environments in a quicker and easier way.
ACKNOWLEDGEMENTS
This research was supported by the project funded by the Serbian Ministry of Education, Science and Technological Development TR36042.
REFERENCES
1. Becker, S. 2009. Generation and application of rules for quality dependent facade reconstruction.Journal of Photogrammetry and Remote Sensing, 64. pp. 640 – 653.
2. Belloti, F., Berta, R., Cardona, R., Gloria, A. 2011. An architectural approach to efficient 3D urbanmodeling. Computers and Graphics, 35. Pp. 1001-1012.
3. Duarte, J.P. 2002. Towards the mass customization of housing: the grammar of Siza's houses atMalagueira. Environment and Planning B: Planning and Design. 32, pp. 347-380.
4. Ehrig, H., Engels, G., Kreowski, H-J., Rozenberg, G. 1999. Handbook of Graph Grammars andComputing by Graph Transformation: Applications, Languages and Tools, World Scientific, Hackensack, NJ, USA
5. Huang, C.Y., Jheng, W.T., Tai, W.K., Chang, C.C., Way, D.L. 2013. Procedural grape bunchmodeling. Computers and Graphics, 37. Pp. 225-237.
BAJSANSKI ET AL.: PROCEDURAL MODELLING TOOLS IN ARCHITECTURAL EDUCATION
THE 5TH ICGG CONFERENCE MONGEOMETRIJA 2016 PROCEEDINGS Belgrade: 23-26 June 2016 357
6. Knuth, DE. 1968. Semantics of context-free languages. Mathematical Systems Theory. 2. Pp. 127-145.
7. Mandic, M., Tepavcevic, B. 2015. Analysis of shape grammar application as a tool for urban design.Environment and planning B. Planning and design. 42. Pp. 675-687.
8. Muller, P., Zeng. G., Wonka, P., Gool, V. 2007. Image-based procedural modeling of facades.Transaction in graphics, 26. Pp. 1-8.
9. Sipser, M. 1996. Introduction to the Theory of Computation. Course Technology, Boston, Mass, USA
10. Stiny, G. 1980. Introduction to shape and shape grammars. Environment and Planning B. 3. Pp. 343-361.
11. Tepavcevic, B., Stojakovic, V. 2013. Procedural modeling in architecture based on statistical andfuzzy inference. Automation in Construction, 35. Pp. 329-337.
12. Yong, L., Mingmin, Z., Yunliang, J., Haiying, Z. 2012. Improving procedural modeling withsemantics in digital architectural heritage. Computers and graphics. 36. Pp. 178-184.
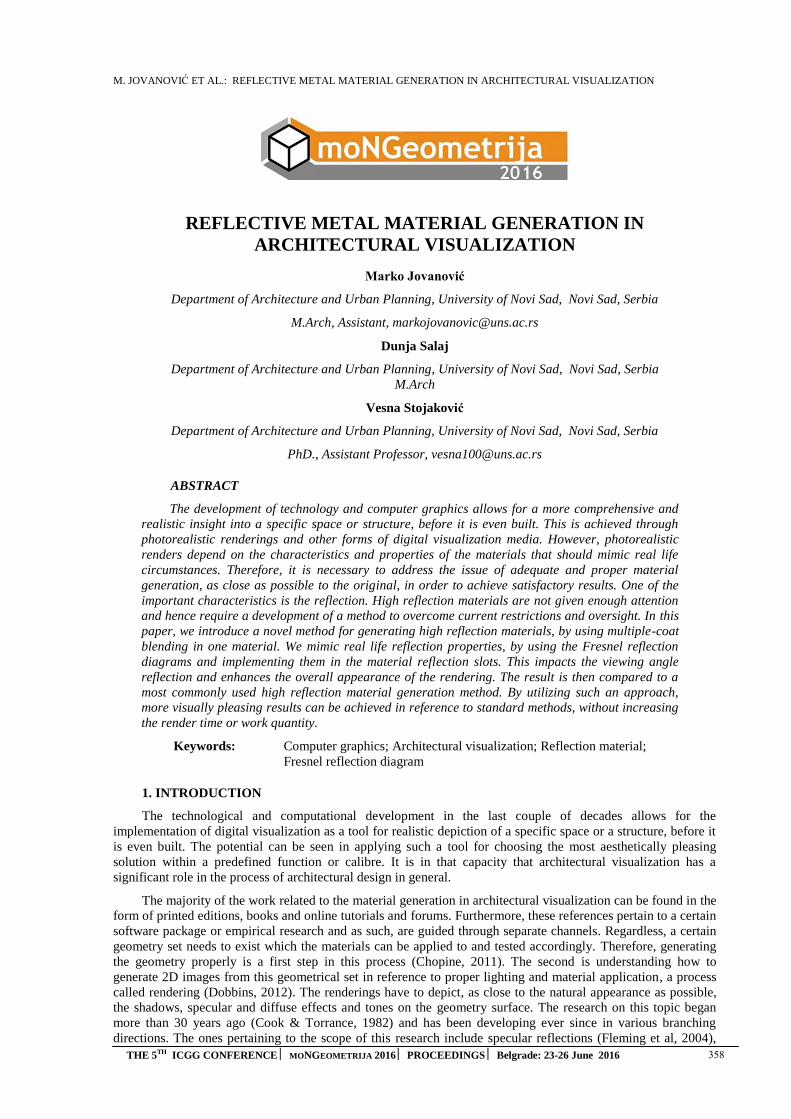
M. JOVANOVIĆ ET AL.: REFLECTIVE METAL MATERIAL GENERATION IN ARCHITECTURAL VISUALIZATION
THE 5TH ICGG CONFERENCE MONGEOMETRIJA 2016 PROCEEDINGS Belgrade: 23-26 June 2016 358
REFLECTIVE METAL MATERIAL GENERATION IN
ARCHITECTURAL VISUALIZATION
Marko Jovanović
Department of Architecture and Urban Planning, University of Novi Sad, Novi Sad, Serbia
M.Arch, Assistant, [email protected]
Dunja Salaj
Department of Architecture and Urban Planning, University of Novi Sad, Novi Sad, Serbia
M.Arch
Vesna Stojaković
Department of Architecture and Urban Planning, University of Novi Sad, Novi Sad, Serbia
PhD., Assistant Professor, [email protected]
ABSTRACT
The development of technology and computer graphics allows for a more comprehensive and
realistic insight into a specific space or structure, before it is even built. This is achieved through
photorealistic renderings and other forms of digital visualization media. However, photorealistic
renders depend on the characteristics and properties of the materials that should mimic real life
circumstances. Therefore, it is necessary to address the issue of adequate and proper material
generation, as close as possible to the original, in order to achieve satisfactory results. One of the
important characteristics is the reflection. High reflection materials are not given enough attention
and hence require a development of a method to overcome current restrictions and oversight. In this
paper, we introduce a novel method for generating high reflection materials, by using multiple-coat
blending in one material. We mimic real life reflection properties, by using the Fresnel reflection
diagrams and implementing them in the material reflection slots. This impacts the viewing angle
reflection and enhances the overall appearance of the rendering. The result is then compared to a
most commonly used high reflection material generation method. By utilizing such an approach,
more visually pleasing results can be achieved in reference to standard methods, without increasing
the render time or work quantity.
Keywords: Computer graphics; Architectural visualization; Reflection material;
Fresnel reflection diagram
1. INTRODUCTION
The technological and computational development in the last couple of decades allows for the
implementation of digital visualization as a tool for realistic depiction of a specific space or a structure, before it
is even built. The potential can be seen in applying such a tool for choosing the most aesthetically pleasing
solution within a predefined function or calibre. It is in that capacity that architectural visualization has a
significant role in the process of architectural design in general.
The majority of the work related to the material generation in architectural visualization can be found in the
form of printed editions, books and online tutorials and forums. Furthermore, these references pertain to a certain
software package or empirical research and as such, are guided through separate channels. Regardless, a certain
geometry set needs to exist which the materials can be applied to and tested accordingly. Therefore, generating
the geometry properly is a first step in this process (Chopine, 2011). The second is understanding how to
generate 2D images from this geometrical set in reference to proper lighting and material application, a process
called rendering (Dobbins, 2012). The renderings have to depict, as close to the natural appearance as possible,
the shadows, specular and diffuse effects and tones on the geometry surface. The research on this topic began
more than 30 years ago (Cook & Torrance, 1982) and has been developing ever since in various branching
directions. The ones pertaining to the scope of this research include specular reflections (Fleming et al, 2004),
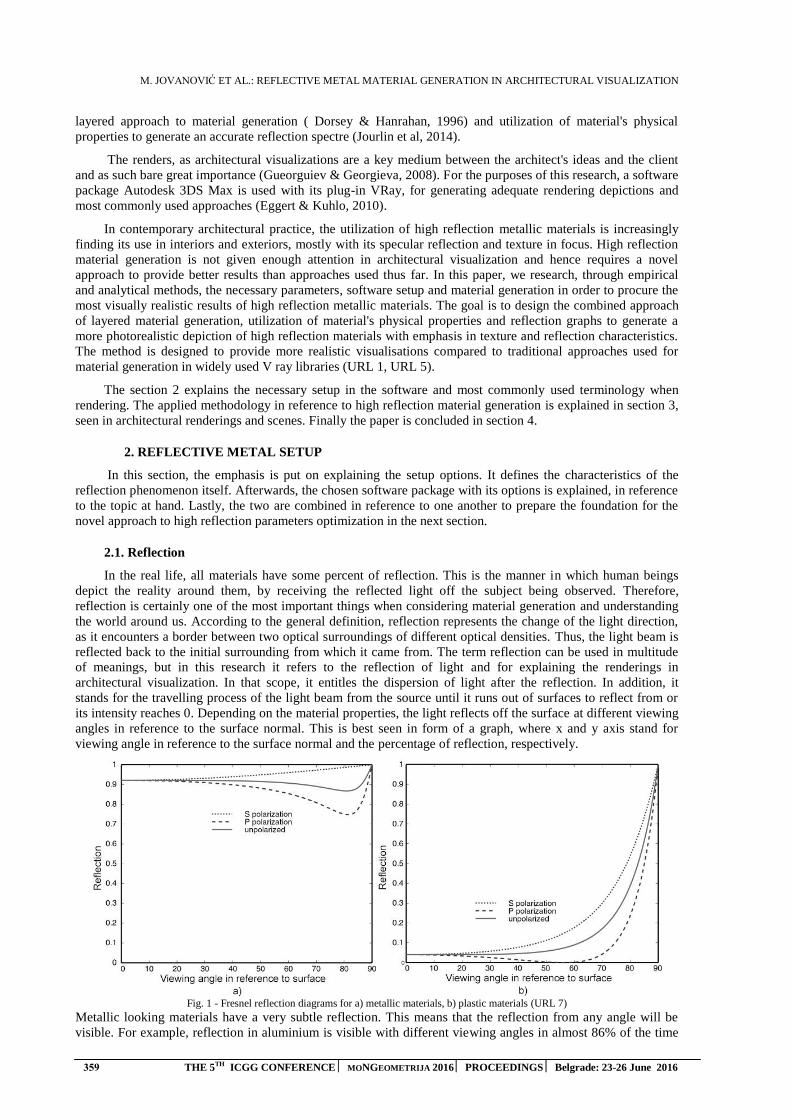
M. JOVANOVIĆ ET AL.: REFLECTIVE METAL MATERIAL GENERATION IN ARCHITECTURAL VISUALIZATION
359 THE 5TH ICGG CONFERENCE MONGEOMETRIJA 2016 PROCEEDINGS Belgrade: 23-26 June 2016
layered approach to material generation ( Dorsey & Hanrahan, 1996) and utilization of material's physical
properties to generate an accurate reflection spectre (Jourlin et al, 2014).
The renders, as architectural visualizations are a key medium between the architect's ideas and the client
and as such bare great importance (Gueorguiev & Georgieva, 2008). For the purposes of this research, a software
package Autodesk 3DS Max is used with its plug-in VRay, for generating adequate rendering depictions and
most commonly used approaches (Eggert & Kuhlo, 2010).
In contemporary architectural practice, the utilization of high reflection metallic materials is increasingly
finding its use in interiors and exteriors, mostly with its specular reflection and texture in focus. High reflection
material generation is not given enough attention in architectural visualization and hence requires a novel
approach to provide better results than approaches used thus far. In this paper, we research, through empirical
and analytical methods, the necessary parameters, software setup and material generation in order to procure the
most visually realistic results of high reflection metallic materials. The goal is to design the combined approach
of layered material generation, utilization of material's physical properties and reflection graphs to generate a
more photorealistic depiction of high reflection materials with emphasis in texture and reflection characteristics.
The method is designed to provide more realistic visualisations compared to traditional approaches used for
material generation in widely used V ray libraries (URL 1, URL 5).
The section 2 explains the necessary setup in the software and most commonly used terminology when
rendering. The applied methodology in reference to high reflection material generation is explained in section 3,
seen in architectural renderings and scenes. Finally the paper is concluded in section 4.
2. REFLECTIVE METAL SETUP
In this section, the emphasis is put on explaining the setup options. It defines the characteristics of the
reflection phenomenon itself. Afterwards, the chosen software package with its options is explained, in reference
to the topic at hand. Lastly, the two are combined in reference to one another to prepare the foundation for the
novel approach to high reflection parameters optimization in the next section.
2.1. Reflection
In the real life, all materials have some percent of reflection. This is the manner in which human beings
depict the reality around them, by receiving the reflected light off the subject being observed. Therefore,
reflection is certainly one of the most important things when considering material generation and understanding
the world around us. According to the general definition, reflection represents the change of the light direction,
as it encounters a border between two optical surroundings of different optical densities. Thus, the light beam is
reflected back to the initial surrounding from which it came from. The term reflection can be used in multitude
of meanings, but in this research it refers to the reflection of light and for explaining the renderings in
architectural visualization. In that scope, it entitles the dispersion of light after the reflection. In addition, it
stands for the travelling process of the light beam from the source until it runs out of surfaces to reflect from or
its intensity reaches 0. Depending on the material properties, the light reflects off the surface at different viewing
angles in reference to the surface normal. This is best seen in form of a graph, where x and y axis stand for
viewing angle in reference to the surface normal and the percentage of reflection, respectively.
Fig. 1 - Fresnel reflection diagrams for a) metallic materials, b) plastic materials (URL 7)
Metallic looking materials have a very subtle reflection. This means that the reflection from any angle will be
visible. For example, reflection in aluminium is visible with different viewing angles in almost 86% of the time

M. JOVANOVIĆ ET AL.: REFLECTIVE METAL MATERIAL GENERATION IN ARCHITECTURAL VISUALIZATION
THE 5TH ICGG CONFERENCE MONGEOMETRIJA 2016 PROCEEDINGS Belgrade: 23-26 June 2016 360
(Fig 1a). In comparison, non-metallic looking materials, such as plastic have a very low percent of viewing
angles for the visible reflection, only 4% (Fig 1b).
In order to further analyze the reflective surfaces in computer graphics it is necessary to introduce the term
BRDF or the bi-directional reflection distribution function. It defines how the light reflects off an opaque
surface, with a premise of nonexistent subsurface scattering in form of a mathematical formula. By introducing
the mathematical formula to the computational process, reflections and shadows can be calculated in the digital
surroundings. The characteristics of its implementation in the process of architectural visualization will be
explained in the section 2.3. Here only the division into four reflection types is explained (URL 2). The first is
the diffuse reflection, which disperses the initial light beam equally in all directions. The second one is the
glossy reflection, which disperses the initial light in several directions within a single plane, leaving the
reflection blurry. The third type represents the total reflection, which reflects the light beam in only one
direction. The last group is the retro reflection, where the reflection is generated by bouncing the light beam back
from where it came from. Given the nature of the reflection phenomenon, an adequate computational model
needs to be defined and geometry generated, in order to apply it adequately. Hence the following chapter
explains the setup behind these terms.
3.2. Geometry generation and software setup
Regardless of the approach used, the geometry has to be properly modelled. Otherwise the shadows and
irregularities may appear, shattering the photorealistic depiction of the renderings. Since the 3ds Max software
package offers the opportunity for texturing, material generation and rendering as well, it provides a great basis
for researching the topic of this paper. The plug-in VRay is used as a rendering engine, a platform for generating
the materials, lighting, camera setup and renderings as the main result. The choice is made in reference to the
multiple benefits, such as the frame buffer (a separate window for rendering purposes), region rendering
(possibility of rendering only a portion of the image), the rendering pass overview, which helps in later colour
correction, image adjustments and the automated saving of each pass. The region rendering and the automated
saving are of especial importance in this research, since it provides a time-saving approach when comparing two
succeeding renders. Since this research is partially empirical, this proves to be very significant.
Another important part of the entire process, in terms of render quality, are the setup options. The global
illumination is used, as a way to incorporate the light beam bouncing from surfaces to produce more accurate
viewing results. Irradiance map is used as a primary engine and light cache as the secondary. This combination
produces good quality/speed ratio renderings, as verified by a huge online community (URL 4, URL 6) and
empirically, as well. The setup is excellent for generating quick, comparison ready samples for both simple and
complex scenes, which are the chosen surrounding for testing the reflective nature of metallic materials in
renderings.
The material generation is the other important scope here and hence requires further explanation. The VRay
material library, within the VRay plug-in, provides great examples of most commonly used materials in
architectural renderings. However, their render quality is far from perfect and hence needs proper adjustment to
generate the proper look. Two VRay material types are used here, the VrayMtl and the VrayBlendMtl, which are
modified to serve our needs of render quality. Since VrayBlendMtl is based on the VrayMtl, the following
subsection will explain the setup for it and base the further research and development on it.
3.3. Reflective material setup
This subsection will combine the physical phenomenon of the reflection with the options in the 3ds Max
software, in order to explore the high reflection metallic material generation. The VrayMtl is the ubiquitous
choice for Vray renderings. It consists of three main parts that generate the end result - the Diffuse, Reflection
and Refraction Channels. Each of these channels uses colours or maps (images) in order to simulate any
necessary portion, such as texture, reflection, blurriness, transparency etc. The diffuse represents the main colour
or texture of the material. The refraction and reflection use the same in order to determine how the light passes
through, or reflects off the material, respectively. Since refraction is not the focus of this research it is omitted
from this discussion further on. In order to account for the viewing angles of the reflections, the introduction of
maps is preferred in order to specify it.
The map that will be used here is the Falloff map. The default falloff map has a linear graph of dependence
between the viewing angle and the percentage of reflection. This means that when the geometry is viewed
perpendicularly to the surface, the reflection will not exist, while deviating from this by 90 degrees will produce
total reflection. Renderings done like this usually do not produce photorealistic results, since it does not take into
account the reflection properties of the material applied, nor the difference in wavelengths of the light beam
illuminating the material.
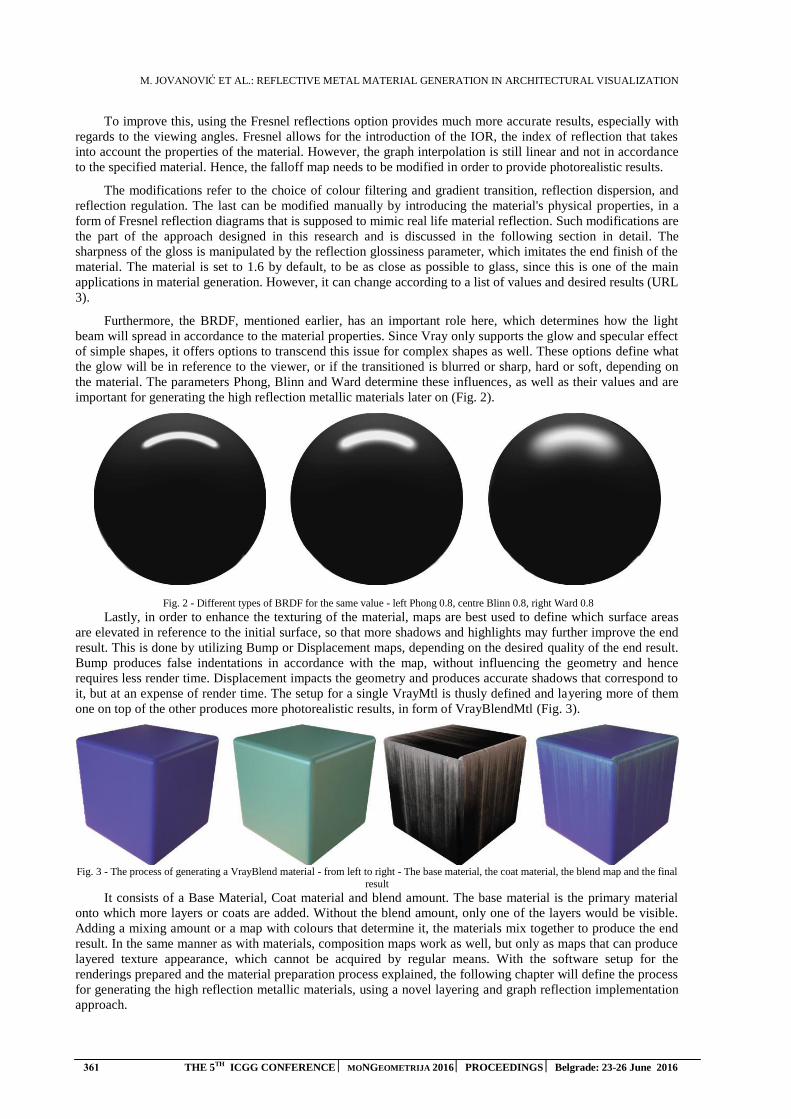
M. JOVANOVIĆ ET AL.: REFLECTIVE METAL MATERIAL GENERATION IN ARCHITECTURAL VISUALIZATION
361 THE 5TH ICGG CONFERENCE MONGEOMETRIJA 2016 PROCEEDINGS Belgrade: 23-26 June 2016
To improve this, using the Fresnel reflections option provides much more accurate results, especially with
regards to the viewing angles. Fresnel allows for the introduction of the IOR, the index of reflection that takes
into account the properties of the material. However, the graph interpolation is still linear and not in accordance
to the specified material. Hence, the falloff map needs to be modified in order to provide photorealistic results.
The modifications refer to the choice of colour filtering and gradient transition, reflection dispersion, and
reflection regulation. The last can be modified manually by introducing the material's physical properties, in a
form of Fresnel reflection diagrams that is supposed to mimic real life material reflection. Such modifications are
the part of the approach designed in this research and is discussed in the following section in detail. The
sharpness of the gloss is manipulated by the reflection glossiness parameter, which imitates the end finish of the
material. The material is set to 1.6 by default, to be as close as possible to glass, since this is one of the main
applications in material generation. However, it can change according to a list of values and desired results (URL
3).
Furthermore, the BRDF, mentioned earlier, has an important role here, which determines how the light
beam will spread in accordance to the material properties. Since Vray only supports the glow and specular effect
of simple shapes, it offers options to transcend this issue for complex shapes as well. These options define what
the glow will be in reference to the viewer, or if the transitioned is blurred or sharp, hard or soft, depending on
the material. The parameters Phong, Blinn and Ward determine these influences, as well as their values and are
important for generating the high reflection metallic materials later on (Fig. 2).
Fig. 2 - Different types of BRDF for the same value - left Phong 0.8, centre Blinn 0.8, right Ward 0.8
Lastly, in order to enhance the texturing of the material, maps are best used to define which surface areas
are elevated in reference to the initial surface, so that more shadows and highlights may further improve the end
result. This is done by utilizing Bump or Displacement maps, depending on the desired quality of the end result.
Bump produces false indentations in accordance with the map, without influencing the geometry and hence
requires less render time. Displacement impacts the geometry and produces accurate shadows that correspond to
it, but at an expense of render time. The setup for a single VrayMtl is thusly defined and layering more of them
one on top of the other produces more photorealistic results, in form of VrayBlendMtl (Fig. 3).
Fig. 3 - The process of generating a VrayBlend material - from left to right - The base material, the coat material, the blend map and the final
result
It consists of a Base Material, Coat material and blend amount. The base material is the primary material
onto which more layers or coats are added. Without the blend amount, only one of the layers would be visible.
Adding a mixing amount or a map with colours that determine it, the materials mix together to produce the end
result. In the same manner as with materials, composition maps work as well, but only as maps that can produce
layered texture appearance, which cannot be acquired by regular means. With the software setup for the
renderings prepared and the material preparation process explained, the following chapter will define the process
for generating the high reflection metallic materials, using a novel layering and graph reflection implementation
approach.
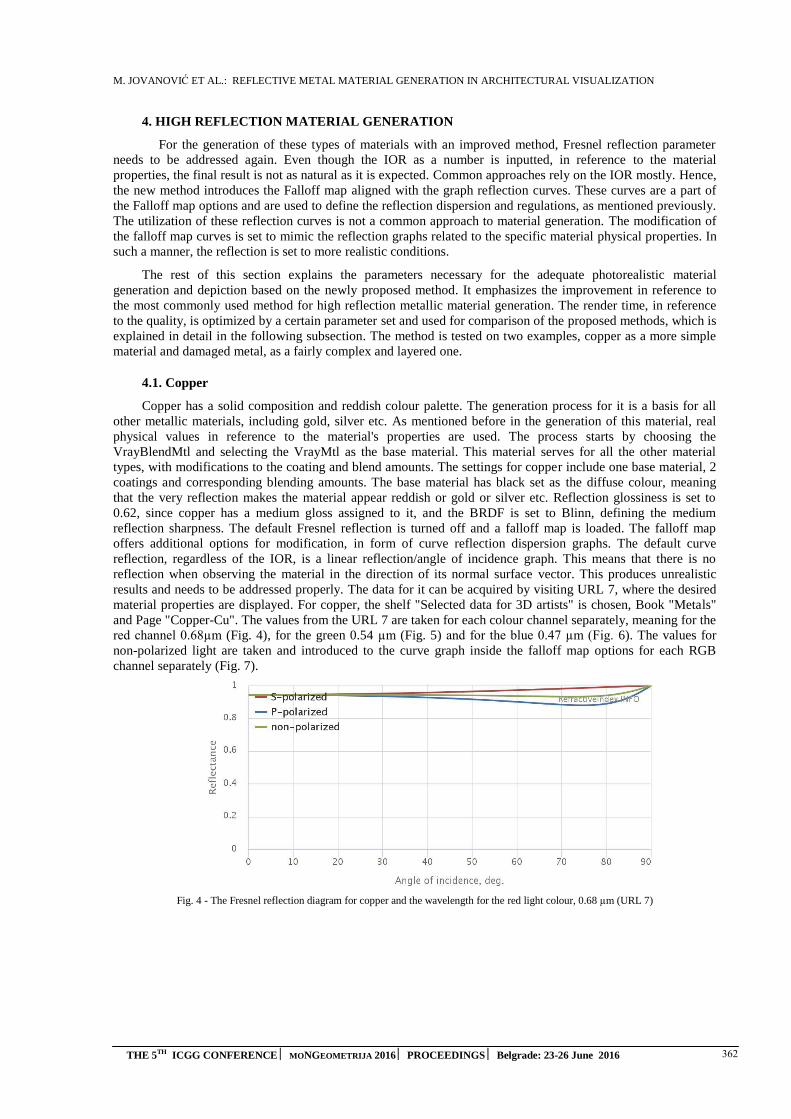
M. JOVANOVIĆ ET AL.: REFLECTIVE METAL MATERIAL GENERATION IN ARCHITECTURAL VISUALIZATION
THE 5TH ICGG CONFERENCE MONGEOMETRIJA 2016 PROCEEDINGS Belgrade: 23-26 June 2016 362
4. HIGH REFLECTION MATERIAL GENERATION
For the generation of these types of materials with an improved method, Fresnel reflection parameter
needs to be addressed again. Even though the IOR as a number is inputted, in reference to the material
properties, the final result is not as natural as it is expected. Common approaches rely on the IOR mostly. Hence,
the new method introduces the Falloff map aligned with the graph reflection curves. These curves are a part of
the Falloff map options and are used to define the reflection dispersion and regulations, as mentioned previously.
The utilization of these reflection curves is not a common approach to material generation. The modification of
the falloff map curves is set to mimic the reflection graphs related to the specific material physical properties. In
such a manner, the reflection is set to more realistic conditions.
The rest of this section explains the parameters necessary for the adequate photorealistic material
generation and depiction based on the newly proposed method. It emphasizes the improvement in reference to
the most commonly used method for high reflection metallic material generation. The render time, in reference
to the quality, is optimized by a certain parameter set and used for comparison of the proposed methods, which is
explained in detail in the following subsection. The method is tested on two examples, copper as a more simple
material and damaged metal, as a fairly complex and layered one.
4.1. Copper
Copper has a solid composition and reddish colour palette. The generation process for it is a basis for all
other metallic materials, including gold, silver etc. As mentioned before in the generation of this material, real
physical values in reference to the material's properties are used. The process starts by choosing the
VrayBlendMtl and selecting the VrayMtl as the base material. This material serves for all the other material
types, with modifications to the coating and blend amounts. The settings for copper include one base material, 2
coatings and corresponding blending amounts. The base material has black set as the diffuse colour, meaning
that the very reflection makes the material appear reddish or gold or silver etc. Reflection glossiness is set to
0.62, since copper has a medium gloss assigned to it, and the BRDF is set to Blinn, defining the medium
reflection sharpness. The default Fresnel reflection is turned off and a falloff map is loaded. The falloff map
offers additional options for modification, in form of curve reflection dispersion graphs. The default curve
reflection, regardless of the IOR, is a linear reflection/angle of incidence graph. This means that there is no
reflection when observing the material in the direction of its normal surface vector. This produces unrealistic
results and needs to be addressed properly. The data for it can be acquired by visiting URL 7, where the desired
material properties are displayed. For copper, the shelf "Selected data for 3D artists" is chosen, Book "Metals"
and Page "Copper-Cu". The values from the URL 7 are taken for each colour channel separately, meaning for the
red channel 0.68µm (Fig. 4), for the green 0.54 µm (Fig. 5) and for the blue 0.47 µm (Fig. 6). The values for
non-polarized light are taken and introduced to the curve graph inside the falloff map options for each RGB
channel separately (Fig. 7).
Fig. 4 - The Fresnel reflection diagram for copper and the wavelength for the red light colour, 0.68 µm (URL 7)
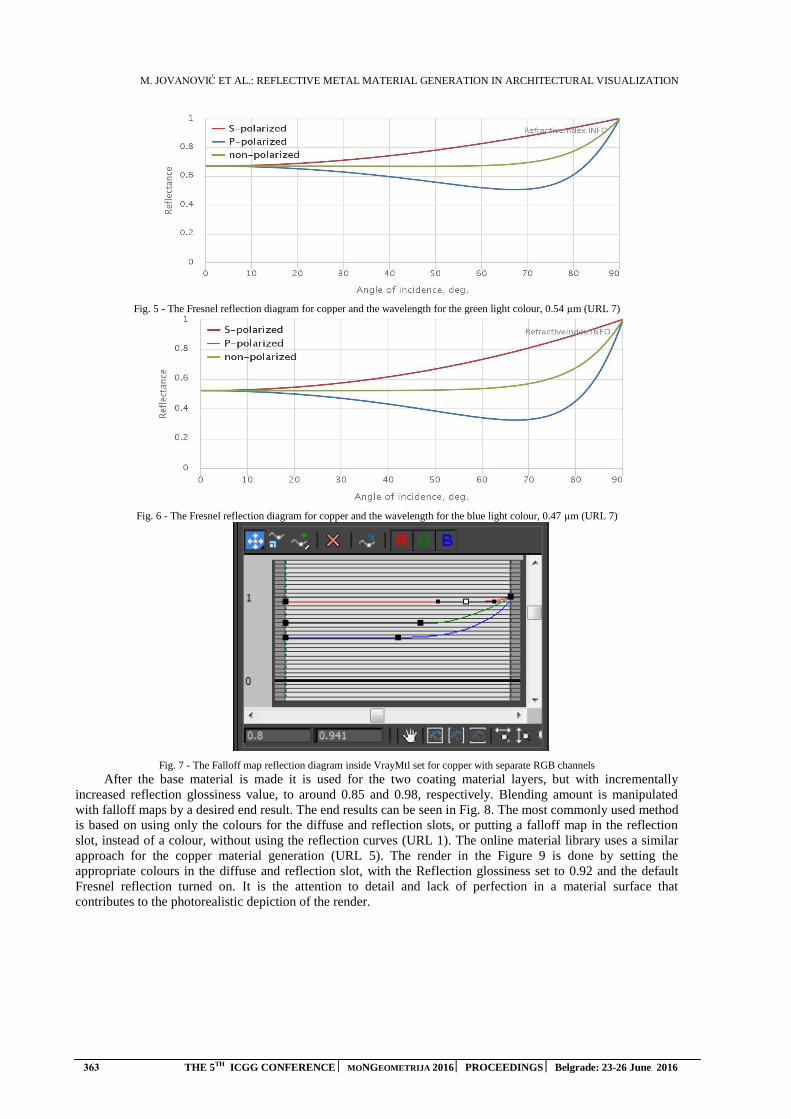
M. JOVANOVIĆ ET AL.: REFLECTIVE METAL MATERIAL GENERATION IN ARCHITECTURAL VISUALIZATION
363 THE 5TH ICGG CONFERENCE MONGEOMETRIJA 2016 PROCEEDINGS Belgrade: 23-26 June 2016
Fig. 5 - The Fresnel reflection diagram for copper and the wavelength for the green light colour, 0.54 µm (URL 7)
Fig. 6 - The Fresnel reflection diagram for copper and the wavelength for the blue light colour, 0.47 µm (URL 7)
Fig. 7 - The Falloff map reflection diagram inside VrayMtl set for copper with separate RGB channels
After the base material is made it is used for the two coating material layers, but with incrementally
increased reflection glossiness value, to around 0.85 and 0.98, respectively. Blending amount is manipulated
with falloff maps by a desired end result. The end results can be seen in Fig. 8. The most commonly used method
is based on using only the colours for the diffuse and reflection slots, or putting a falloff map in the reflection
slot, instead of a colour, without using the reflection curves (URL 1). The online material library uses a similar
approach for the copper material generation (URL 5). The render in the Figure 9 is done by setting the
appropriate colours in the diffuse and reflection slot, with the Reflection glossiness set to 0.92 and the default
Fresnel reflection turned on. It is the attention to detail and lack of perfection in a material surface that
contributes to the photorealistic depiction of the render.
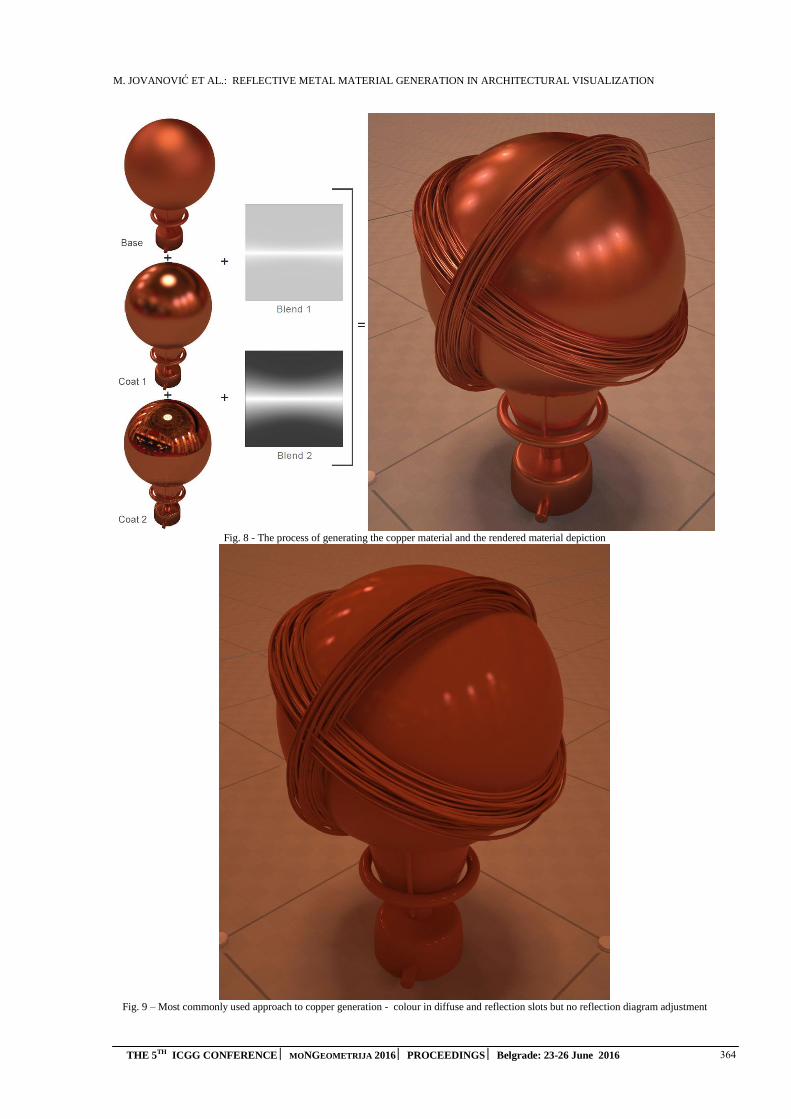
M. JOVANOVIĆ ET AL.: REFLECTIVE METAL MATERIAL GENERATION IN ARCHITECTURAL VISUALIZATION
THE 5TH ICGG CONFERENCE MONGEOMETRIJA 2016 PROCEEDINGS Belgrade: 23-26 June 2016 364
Fig. 8 - The process of generating the copper material and the rendered material depiction
Fig. 9 – Most commonly used approach to copper generation - colour in diffuse and reflection slots but no reflection diagram adjustment
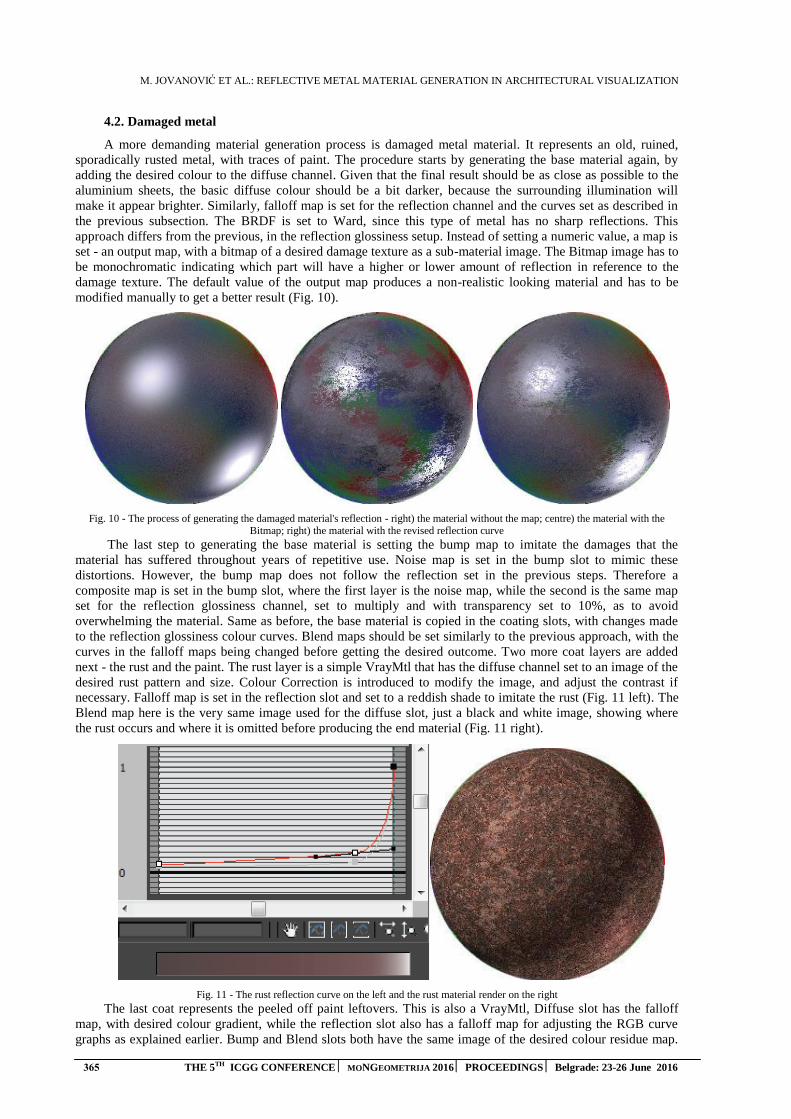
M. JOVANOVIĆ ET AL.: REFLECTIVE METAL MATERIAL GENERATION IN ARCHITECTURAL VISUALIZATION
365 THE 5TH ICGG CONFERENCE MONGEOMETRIJA 2016 PROCEEDINGS Belgrade: 23-26 June 2016
4.2. Damaged metal
A more demanding material generation process is damaged metal material. It represents an old, ruined,
sporadically rusted metal, with traces of paint. The procedure starts by generating the base material again, by
adding the desired colour to the diffuse channel. Given that the final result should be as close as possible to the
aluminium sheets, the basic diffuse colour should be a bit darker, because the surrounding illumination will
make it appear brighter. Similarly, falloff map is set for the reflection channel and the curves set as described in
the previous subsection. The BRDF is set to Ward, since this type of metal has no sharp reflections. This
approach differs from the previous, in the reflection glossiness setup. Instead of setting a numeric value, a map is
set - an output map, with a bitmap of a desired damage texture as a sub-material image. The Bitmap image has to
be monochromatic indicating which part will have a higher or lower amount of reflection in reference to the
damage texture. The default value of the output map produces a non-realistic looking material and has to be
modified manually to get a better result (Fig. 10).
Fig. 10 - The process of generating the damaged material's reflection - right) the material without the map; centre) the material with the Bitmap; right) the material with the revised reflection curve
The last step to generating the base material is setting the bump map to imitate the damages that the
material has suffered throughout years of repetitive use. Noise map is set in the bump slot to mimic these
distortions. However, the bump map does not follow the reflection set in the previous steps. Therefore a
composite map is set in the bump slot, where the first layer is the noise map, while the second is the same map
set for the reflection glossiness channel, set to multiply and with transparency set to 10%, as to avoid
overwhelming the material. Same as before, the base material is copied in the coating slots, with changes made
to the reflection glossiness colour curves. Blend maps should be set similarly to the previous approach, with the
curves in the falloff maps being changed before getting the desired outcome. Two more coat layers are added
next - the rust and the paint. The rust layer is a simple VrayMtl that has the diffuse channel set to an image of the
desired rust pattern and size. Colour Correction is introduced to modify the image, and adjust the contrast if
necessary. Falloff map is set in the reflection slot and set to a reddish shade to imitate the rust (Fig. 11 left). The
Blend map here is the very same image used for the diffuse slot, just a black and white image, showing where
the rust occurs and where it is omitted before producing the end material (Fig. 11 right).
Fig. 11 - The rust reflection curve on the left and the rust material render on the right
The last coat represents the peeled off paint leftovers. This is also a VrayMtl, Diffuse slot has the falloff
map, with desired colour gradient, while the reflection slot also has a falloff map for adjusting the RGB curve
graphs as explained earlier. Bump and Blend slots both have the same image of the desired colour residue map.

M. JOVANOVIĆ ET AL.: REFLECTIVE METAL MATERIAL GENERATION IN ARCHITECTURAL VISUALIZATION
THE 5TH ICGG CONFERENCE MONGEOMETRIJA 2016 PROCEEDINGS Belgrade: 23-26 June 2016 366
Bump shows that the paint had a certain thickness on the material, while blend only shows it in that portion of
the material. The end result can be seen in the Fig. 12.
Fig. 12 - The process of blending a complex material and the end result
The layered and blending approach to material generation, especially when dealing with complex materials,
coupled with the insertion of reflection diagrams based on real life material properties represents a
straightforward process to photorealistic material depiction.
5. CONCLUSION
Taking into account all of the above mentioned approaches and improvements to the existing methods,
regarding architectural visualization rendering, we can see the significance of its application in architectural
practice. Photo-realistic materials carry a certain note to them, since they mimic the reality and hence drive
people towards identifying themselves as if it were the real depiction of an actual area and not a digital model.
The presence of texture evokes the sense of tactile or somatosensory experience and therefore presents a
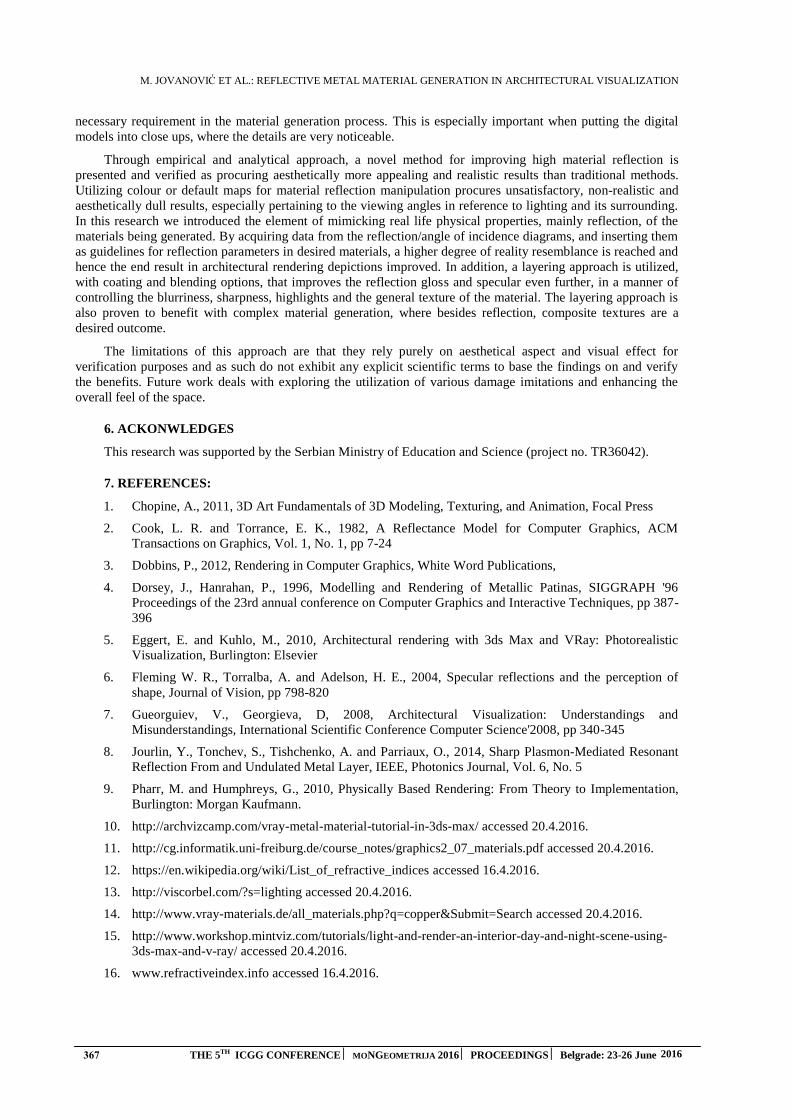
M. JOVANOVIĆ ET AL.: REFLECTIVE METAL MATERIAL GENERATION IN ARCHITECTURAL VISUALIZATION
367 THE 5TH ICGG CONFERENCE MONGEOMETRIJA 2016 PROCEEDINGS Belgrade: 23-26 June 2016
necessary requirement in the material generation process. This is especially important when putting the digital
models into close ups, where the details are very noticeable.
Through empirical and analytical approach, a novel method for improving high material reflection is
presented and verified as procuring aesthetically more appealing and realistic results than traditional methods.
Utilizing colour or default maps for material reflection manipulation procures unsatisfactory, non-realistic and
aesthetically dull results, especially pertaining to the viewing angles in reference to lighting and its surrounding.
In this research we introduced the element of mimicking real life physical properties, mainly reflection, of the
materials being generated. By acquiring data from the reflection/angle of incidence diagrams, and inserting them
as guidelines for reflection parameters in desired materials, a higher degree of reality resemblance is reached and
hence the end result in architectural rendering depictions improved. In addition, a layering approach is utilized,
with coating and blending options, that improves the reflection gloss and specular even further, in a manner of
controlling the blurriness, sharpness, highlights and the general texture of the material. The layering approach is
also proven to benefit with complex material generation, where besides reflection, composite textures are a
desired outcome.
The limitations of this approach are that they rely purely on aesthetical aspect and visual effect for
verification purposes and as such do not exhibit any explicit scientific terms to base the findings on and verify
the benefits. Future work deals with exploring the utilization of various damage imitations and enhancing the
overall feel of the space.
6. ACKONWLEDGES
This research was supported by the Serbian Ministry of Education and Science (project no. TR36042).
7. REFERENCES:
1. Chopine, A., 2011, 3D Art Fundamentals of 3D Modeling, Texturing, and Animation, Focal Press
2. Cook, L. R. and Torrance, E. K., 1982, A Reflectance Model for Computer Graphics, ACM
Transactions on Graphics, Vol. 1, No. 1, pp 7-24
3. Dobbins, P., 2012, Rendering in Computer Graphics, White Word Publications,
4. Dorsey, J., Hanrahan, P., 1996, Modelling and Rendering of Metallic Patinas, SIGGRAPH '96
Proceedings of the 23rd annual conference on Computer Graphics and Interactive Techniques, pp 387-
396
5. Eggert, E. and Kuhlo, M., 2010, Architectural rendering with 3ds Max and VRay: Photorealistic
Visualization, Burlington: Elsevier
6. Fleming W. R., Torralba, A. and Adelson, H. E., 2004, Specular reflections and the perception of
shape, Journal of Vision, pp 798-820
7. Gueorguiev, V., Georgieva, D, 2008, Architectural Visualization: Understandings and
Misunderstandings, International Scientific Conference Computer Science'2008, pp 340-345
8. Jourlin, Y., Tonchev, S., Tishchenko, A. and Parriaux, O., 2014, Sharp Plasmon-Mediated Resonant
Reflection From and Undulated Metal Layer, IEEE, Photonics Journal, Vol. 6, No. 5
9. Pharr, M. and Humphreys, G., 2010, Physically Based Rendering: From Theory to Implementation,
Burlington: Morgan Kaufmann.
10. http://archvizcamp.com/vray-metal-material-tutorial-in-3ds-max/ accessed 20.4.2016.
11. http://cg.informatik.uni-freiburg.de/course_notes/graphics2_07_materials.pdf accessed 20.4.2016.
12. https://en.wikipedia.org/wiki/List_of_refractive_indices accessed 16.4.2016.
13. http://viscorbel.com/?s=lighting accessed 20.4.2016.
14. http://www.vray-materials.de/all_materials.php?q=copper&Submit=Search accessed 20.4.2016.
15. http://www.workshop.mintviz.com/tutorials/light-and-render-an-interior-day-and-night-scene-using-
3ds-max-and-v-ray/ accessed 20.4.2016.
16. www.refractiveindex.info accessed 16.4.2016.
G. WEISS ET AL.: REMARKS ON PERSPECTIVE POLYGONS AND SIMPLEXES
THE 5TH ICGG CONFERENCE MONGEOMETRIJA 2016 PROCEEDINGS Belgrade: 23-26 June 2016 368
REMARKS ON PERSPECTIVE POLYGONS AND SIMPEXES
Gunter Weiss
Institute for Geometry, University of Technology Dresden, Dresden, Germany
Hirotaka Ebisui
Oval Research Centre, Iwakuni, Japan [email protected]
ABSTRACT
The planar figure of two triangles being in perspective position is associated with a theorem of Desargues, which is responsible for the fact that the coordinate set of the plane is a field. This well-known theorem of Desargues allows the obvious interpretation in space of a three-sided pyramid, which is intersected by two planes. The article is dedicated to generalizing this theorem of Desargues to perspective polygons and simplexes in a projective n-space and their linear images in a subspace. Hereby one can find remarkable incidences and configurations. Starting point to this investigation is a planar figure of perspective quadrangles, where the second author discovered a remarkable coincidence figure. The proof of this incidence statement is based on an interpretation of the planar “Ebisui figure” as the central projection of a (projective) cross-polytope in 4-space. This principle can also be extended to higher dimensions.
Keywords: projective space, harmonic homology, perspectivity, Desargues’ theorem, simplex, cross polytope, polyhedron, central axonometry
1 INTRODUCTION AND EBISUI’S THEOREM
Let π be a projective Desargues plane such that its coordinate field has not the characteristic 2. As a consequence of this assumption π can be immerged into a projective space of dimension 3 and there exist harmonic quadruplets of collinear points. (Plane π is a Fano plane, i.e. each quadrangle in π has a triangle of diagonal points; confer e.g. Ref. 1.) For such a plane π the following theorem holds, see Fig. 1:
Theorem 1 (“Ebisui’s Theorem”1): Let , , , , 1,2, be two Z-perspective quadrangles of . Then the intersection points
∩ : , ∩ : ,∩ : , ∩ : ,∩ : , ∩ : ̅ ,
(Eq.1)
define three lines , , ̅ , which are incident with a common point .
A simple but lengthy proof of Theorem 1 might use elementary affine vector calculus in π assuming that none of the given and calculated points is an ideal point. Of course one will use an affine (or even projective) coordinate frame in , which is suitably connected with the given point set , , … , to make calculation as simple as possible. But such an analytic proof does not show, where Theorem 1 belongs to and in which way it generalizes the well-known Desargues’ theorem of perspective triangles. As the Theorem 1 deals only with incidences, it obviously belongs to projective geometry based on a rather general coordinate field , even it, at first, was stated as a theorem in a Euclidean plane.
1 Oral communication at the „Meeting of the Japan Society for Geometry and Graphics”, Mai 12-13, 2007, Tokyo.
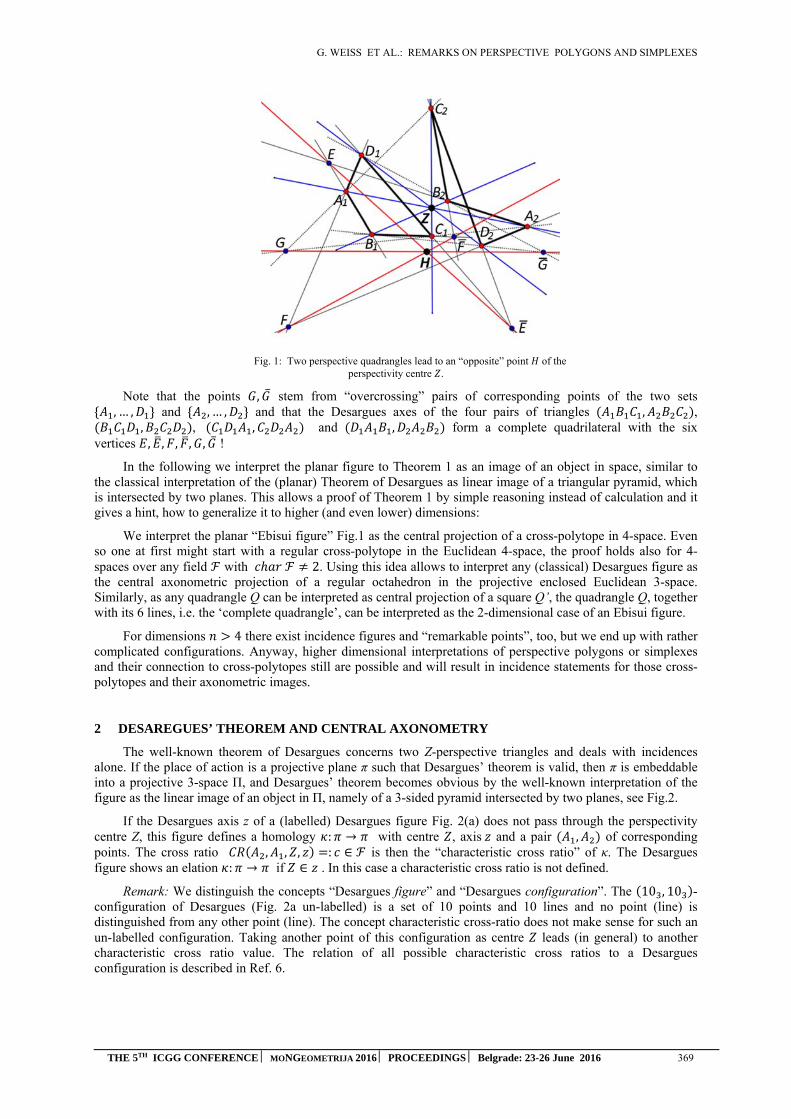
G. WEISS ET AL.: REMARKS ON PERSPECTIVE POLYGONS AND SIMPLEXES
THE 5TH ICGG CONFERENCE MONGEOMETRIJA 2016 PROCEEDINGS Belgrade: 23-26 June 2016 369
Fig. 1: Two perspective quadrangles lead to an “opposite” point of the
perspectivity centre .
Note that the points , ̅ stem from “overcrossing” pairs of corresponding points of the two sets , … , and , … , and that the Desargues axes of the four pairs of triangles , ,
, , , and , form a complete quadrilateral with the six vertices , , , , , ̅ !
In the following we interpret the planar figure to Theorem 1 as an image of an object in space, similar to the classical interpretation of the (planar) Theorem of Desargues as linear image of a triangular pyramid, which is intersected by two planes. This allows a proof of Theorem 1 by simple reasoning instead of calculation and it gives a hint, how to generalize it to higher (and even lower) dimensions:
We interpret the planar “Ebisui figure” Fig.1 as the central projection of a cross-polytope in 4-space. Even so one at first might start with a regular cross-polytope in the Euclidean 4-space, the proof holds also for 4-spaces over any field with 2. Using this idea allows to interpret any (classical) Desargues figure as the central axonometric projection of a regular octahedron in the projective enclosed Euclidean 3-space. Similarly, as any quadrangle Q can be interpreted as central projection of a square Q’, the quadrangle Q, together with its 6 lines, i.e. the ‘complete quadrangle’, can be interpreted as the 2-dimensional case of an Ebisui figure.
For dimensions 4 there exist incidence figures and “remarkable points”, too, but we end up with rather complicated configurations. Anyway, higher dimensional interpretations of perspective polygons or simplexes and their connection to cross-polytopes still are possible and will result in incidence statements for those cross-polytopes and their axonometric images.
2 DESAREGUES’ THEOREM AND CENTRAL AXONOMETRY
The well-known theorem of Desargues concerns two Z-perspective triangles and deals with incidences alone. If the place of action is a projective plane π such that Desargues’ theorem is valid, then π is embeddable into a projective 3-space Π, and Desargues’ theorem becomes obvious by the well-known interpretation of the figure as the linear image of an object in Π, namely of a 3-sided pyramid intersected by two planes, see Fig.2.
If the Desargues axis z of a (labelled) Desargues figure Fig. 2(a) does not pass through the perspectivity centre Z, this figure defines a homology : → with centre , axis and a pair , of corresponding points. The cross ratio , , , : ∈ is then the “characteristic cross ratio” of κ. The Desargues figure shows an elation : → if ∈ . In this case a characteristic cross ratio is not defined.
Remark: We distinguish the concepts “Desargues figure” and “Desargues configuration”. The 10 , 10 -configuration of Desargues (Fig. 2a un-labelled) is a set of 10 points and 10 lines and no point (line) is distinguished from any other point (line). The concept characteristic cross-ratio does not make sense for such an un-labelled configuration. Taking another point of this configuration as centre leads (in general) to another characteristic cross ratio value. The relation of all possible characteristic cross ratios to a Desargues configuration is described in Ref. 6.
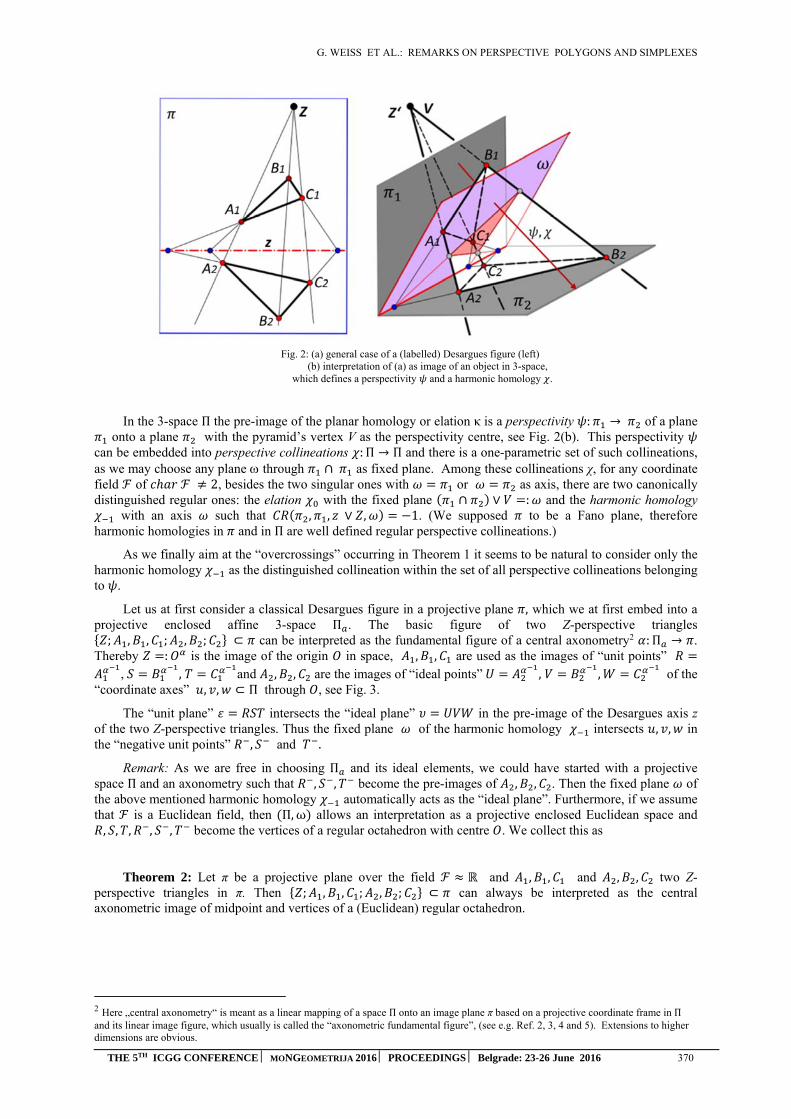
G. WEISS ET AL.: REMARKS ON PERSPECTIVE POLYGONS AND SIMPLEXES
THE 5TH ICGG CONFERENCE MONGEOMETRIJA 2016 PROCEEDINGS Belgrade: 23-26 June 2016 370
Fig. 2: (a) general case of a (labelled) Desargues figure (left)
(b) interpretation of (a) as image of an object in 3-space, which defines a perspectivity and a harmonic homology .
In the 3-space Π the pre-image of the planar homology or elation κ is a perspectivity : → of a plane onto a plane with the pyramid’s vertex V as the perspectivity centre, see Fig. 2(b). This perspectivity
can be embedded into perspective collineations : Π → Π and there is a one-parametric set of such collineations, as we may choose any plane through ∩ as fixed plane. Among these collineations χ, for any coordinate field of 2, besides the two singular ones with or as axis, there are two canonically distinguished regular ones: the elation with the fixed plane ∩ ∨ : and the harmonic homology
with an axis such that , , ∨ , 1. (We supposed to be a Fano plane, therefore harmonic homologies in and in Π are well defined regular perspective collineations.)
As we finally aim at the “overcrossings” occurring in Theorem 1 it seems to be natural to consider only the harmonic homology as the distinguished collineation within the set of all perspective collineations belonging to .
Let us at first consider a classical Desargues figure in a projective plane , which we at first embed into a projective enclosed affine 3-space Π . The basic figure of two Z-perspective triangles ; , , ; , ; ⊂ can be interpreted as the fundamental figure of a central axonometry2 : Π → .
Thereby : is the image of the origin in space, , , are used as the images of “unit points” , , and , , are the images of “ideal points” , , of the
“coordinate axes” , , ⊂ Π through , see Fig. 3.
The “unit plane” intersects the “ideal plane” in the pre-image of the Desargues axis z of the two Z-perspective triangles. Thus the fixed plane of the harmonic homology intersects , , in the “negative unit points” , and .
Remark: As we are free in choosing Π and its ideal elements, we could have started with a projective space Π and an axonometry such that , , become the pre-images of , , . Then the fixed plane of the above mentioned harmonic homology automatically acts as the “ideal plane”. Furthermore, if we assume that is a Euclidean field, then Π,ω allows an interpretation as a projective enclosed Euclidean space and , , , , , become the vertices of a regular octahedron with centre . We collect this as
Theorem 2: Let π be a projective plane over the field and , , and , , two Z-perspective triangles in π. Then ; , , ; , ; ⊂ can always be interpreted as the central axonometric image of midpoint and vertices of a (Euclidean) regular octahedron.
2 Here „central axonometry“ is meant as a linear mapping of a space Π onto an image plane π based on a projective coordinate frame in Π and its linear image figure, which usually is called the “axonometric fundamental figure”, (see e.g. Ref. 2, 3, 4 and 5). Extensions to higher dimensions are obvious.
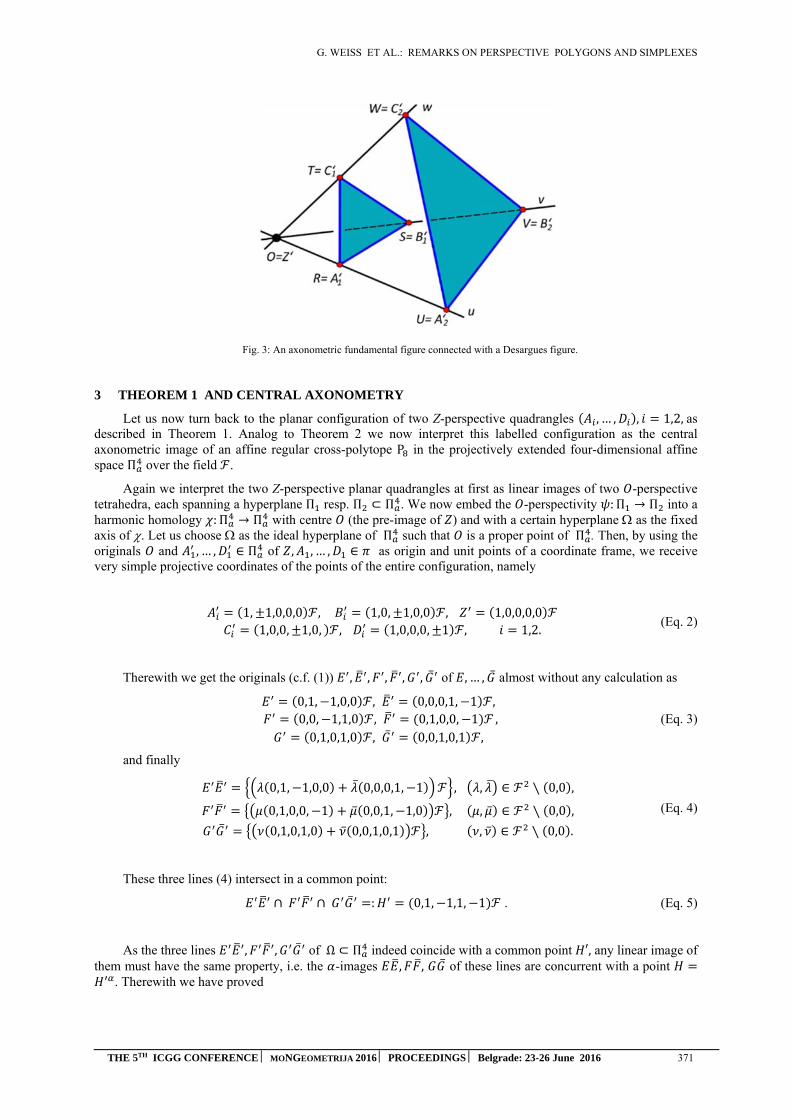
G. WEISS ET AL.: REMARKS ON PERSPECTIVE POLYGONS AND SIMPLEXES
THE 5TH ICGG CONFERENCE MONGEOMETRIJA 2016 PROCEEDINGS Belgrade: 23-26 June 2016 371
Fig. 3: An axonometric fundamental figure connected with a Desargues figure.
3 THEOREM 1 AND CENTRAL AXONOMETRY
Let us now turn back to the planar configuration of two Z-perspective quadrangles , … , , 1,2,as described in Theorem 1. Analog to Theorem 2 we now interpret this labelled configuration as the central axonometric image of an affine regular cross-polytope P in the projectively extended four-dimensional affine space Π over the field .
Again we interpret the two Z-perspective planar quadrangles at first as linear images of two -perspective tetrahedra, each spanning a hyperplane Π resp. Π ⊂ Π . We now embed the -perspectivity : Π → Π into a harmonic homology : Π → Π with centre (the pre-image of ) and with a certain hyperplane as the fixed axis of . Let us choose as the ideal hyperplane of Π such that is a proper point of Π . Then, by using the originals and , … , ∈ Π of , , … , ∈ as origin and unit points of a coordinate frame, we receive very simple projective coordinates of the points of the entire configuration, namely
1, 1,0,0,0 , 1,0, 1,0,0 , 1,0,0,0,01,0,0, 1,0, , 1,0,0,0, 1 , 1,2.
(Eq. 2)
Therewith we get the originals (c.f. (1)) , , , , , ̅ of , … , ̅ almost without any calculation as
0,1, 1,0,0 , 0,0,0,1, 1 ,0,0, 1,1,0 , 0,1,0,0, 10,1,0,1,0 , ̅ 0,0,1,0,1 ,
, (Eq. 3)
and finally
0,1, 1,0,0 ̅ 0,0,0,1, 1 , , ̅ ∈ ∖ 0,0 ,
0,1,0,0, 1 ̅ 0,0,1, 1,0 , , ̅ ∈ ∖ 0,0 ,̅ 0,1,0,1,0 ̅ 0,0,1,0,1 , , ̅ ∈ ∖ 0,0 .
(Eq. 4)
These three lines (4) intersect in a common point:
∩ ∩ ̅ : 0,1, 1,1, 1 . (Eq. 5)
As the three lines , , ̅ of Ω ⊂ Π indeed coincide with a common point ′, any linear image of them must have the same property, i.e. the -images , , ̅ of these lines are concurrent with a point
. Therewith we have proved

G. WEISS ET AL.: REMARKS ON PERSPECTIVE POLYGONS AND SIMPLEXES
THE 5TH ICGG CONFERENCE MONGEOMETRIJA 2016 PROCEEDINGS Belgrade: 23-26 June 2016 372
Theorem 3: Let be given a labelled planar “Ebisui figure” consisting of two Z-perspective quadrangles , , , , 1,2, together with centre Z and the intersection points , … , ̅ according to Theorem 1.
- Then ; , … , ; , … , can always be interpreted as the linear image (central axonometric image) of an affine regular cross-polytope P with vertices , … . , and centre ′ in a four-dimensional projective extended affine space Π .
- Furthermore, the originals ’, ’, ’and ’, ’, ̅ ’ of , … , ̅ form two perspective triangles in the ideal hyperplane of Π with a point ′ as their Desargues centre, which maps onto the remarkable “Ebisui-point” of the given Ebisui figure.
Remark 1: Obviously, if Π is taken as a projective enclosed Euclidean 4-space, then P can be interpreted as a Euclidean regular cross-polytope.
Remark 2: Note that central axonometry maps a point ’ of the n-space to a point of an image k-space or plane using the so-called coordinate path with respect to the axonometric base figure. The coordinate path uses the projective coordinates of ′, therefore it is not necessary to distinguish between the originals ’ and their axonometric images P in terms of coordinates. In the following we therefore will omit to use different labelling for originals and their images, as it will come clear from the text what is meant.
4 COMPLETE QUADRANGLES AS THE TWO-DIMENSIONAL CASE: FANO’S FIGURE
Instead of perspective triangles in a projective Fano-plane and its interpretation as (central) axonometric image of an octahedron let us now consider two line segments ≔ , , ≔ , ⊂ such that the endpoints of those segments form a quadrangle. These labelled segments define a unique perspectivity centre (see Fig. 4). Interpretation in space now degenerates to an interpretation in a projective enclosed affine (resp. Euclidean) plane ′: , … , are linear axonometric images of the vertices , … , of a parallelogram (resp. a square); thereby point is the image of its centre ′. Again we embed the perspectivity : → into a harmonic homology : → and its axis ′ passes through point ≔ ∩ and it contains the intersection ’ of “overcrossing lines” , . The axonometry : ′ → is simply a projective collineation, we receive , , , 1, what is a trivial property of complete quadrangles in a Fano plane .
Fig. 4: Two generally positioned labelled segments spanning a plane are trivially in perspective position
and they give rise to a FANO figure as the two-dimensional case of Ebisui’s construction.
As a trivial result we state
Theorem 4: A labelled complete quadrangle in a projective Fano plane allows an interpretation as the two-dimensional (degenerated) case of a general Desargues figure in the sense of H. Ebisui.
5 EBISUI-POINTS OF PERSPECTIVE TETRAHEDRA AND COMPLETE QUADRANGLES
Already the four-dimensional case has to consider two sub-cases: the one described in Theorem 3 and one, where we start with a pair of perspective skew quadrangles in a 3-space Π . Also this figure is a proper axonometric basis figure for an axonometry : Π → Π and therefore we can use the same calculation as for Theorem 3 receiving the same point ′ ∈ Π as result. Again we can state as a

G. WEISS ET AL.: REMARKS ON PERSPECTIVE POLYGONS AND SIMPLEXES
THE 5TH ICGG CONFERENCE MONGEOMETRIJA 2016 PROCEEDINGS Belgrade: 23-26 June 2016 373
Theorem 5: Let two labelled skew quadrangles in a three-dimensional projective Fano space be given in perspective position. Then the three lines , , ̅ defined according to Theorem 1 have a common point .
Remark 1: Two labelled tetrahedra in perspective position or two planar complete quadrangles in perspective position give rise to three pairs of edge quadrilaterals and each pair leads to an Ebisui point ,1,2,3. This combinatorial approach, which we also want to apply to higher dimensions, makes a re-labelling of the quadrangles necessary:
In the following we label the points of the first quadrangle with , 1, … ,4, and those of the second quadrangle with , 1, … ,4. The “direct Desargues points” mean ∩ : , while Desargues points stemming from “overcrossings” are labelled by ≔ ∩ . We will also use the “ideal points” of lines and being harmonic to with respect to the pairs , .The points form a simplex (i.e. a tetrahedron) in the ideal hyperplane, i.e. a 3-space and have 0, , , , as projective coordinates.
We list the three cases with the corresponding figures and coordinates below (Table 1, Fig.5 and 6):
Table 1: (Axonometric) projective coordinates of the Ebisui-points to perspective tetrahedra.
Case 1): quadrangle , , ,
Case 2): quadrangle , , ,
Case 3): quadrangle , , ,
0,1, 1,0,00,0,0,1, 1
0,1, 1,0,00,0,0,1, 1
0,0,1,0, 10,1,0, 1,0
0,0,1, 1,00,1,0,0, 1
0,0,1,0, 10,1,0, 1,0
0,0,1, 1,00,1,0,0, 1
0,1,0,1,00,0,1,0,1
0,1,0,0,10,0,1,1,0
0,1,1,0,00,0,0,1,1
, , , , , , , , , , , ,
, , , , , ∩ ∩ , , , ,
From Table 1 we read off that there occur only six different points , and they are the vertices of a complete quadrilateral, the sides of which are the Desargues axes of the four pairs of partial triangles of the given pair of quadrangles resp. tetrahedra. The three Ebisui-points are the diagonal points of this quadrilateral (Fig. 5). In addition we can state
Theorem 6: Given two tetrahedra or two planar quadrangles in perspective positions, then the three lines , , stemming from “overcrossings” meet in a common point 0,1,1,1,1 . The three
Ebisui-points together with have (axonometric) projective coordinates, which can be interpreted as vertices of a regular tetrahedron in the ideal hyperplane of a projectively enclosed affine 4-space Π .

G. WEISS ET AL.: REMARKS ON PERSPECTIVE POLYGONS AND SIMPLEXES
THE 5TH ICGG CONFERENCE MONGEOMETRIJA 2016 PROCEEDINGS Belgrade: 23-26 June 2016 374
Fig. 5: Configuration of intersection points of corresponding sides
of perspective tetrahedra and their three Ebisui points .
We show the mutual incidences described in Theorem 6 in an axonometric view of that ideal hyperplane of Π in Fig. 6.
Fig. 6: Configuration of intersection points of “overcrossing” connecting sides
of perspective tetrahedra and their three Ebisui points .
Remark 2: Among other incidences we find that the lines , and have a common point 0, 1,1,1,1 and similarly
∩ ∩ 0,1, 1,1,1 ,
∩ ∩ 0,1,1, 1,1 ,
∩ ∩ 0,1,1,1, 1 .
The simplexes , … , and , … , are -perspective, while , … , and , , , are not only -perspective, but also -perspective, see Fig. 6.
Remark 3: The points can be interpreted as vertices of an octahedron with centre . We also recognize that, within the ideal hyperplane of Π , i.e. a 3-space Π , this octahedron defines a Desargues configuration and e.g. a perspectivity with centre mapping the triangle onto the triangle and again
can be embedded into a harmonic homology with axis plane spanned by the complete quadrilateral , see Fig. 5. The three collinear points , , span the Desargues axis of the perspectivity , i.e. the lines
and meet at , and so on. But there are altogether four possibilities of such perspectivities

G. WEISS ET AL.: REMARKS ON PERSPECTIVE POLYGONS AND SIMPLEXES
THE 5TH ICGG CONFERENCE MONGEOMETRIJA 2016 PROCEEDINGS Belgrade: 23-26 June 2016 375
resp. homologies and each side of the complete quadrilateral acts as Desargues axis of each of these perspectivities.
Our cross-polytope P , which realises a perspectivity between two opposite face tetrahedra and the canonically defined harmonic homology to , induces an octahedron P in the (ideal) axis hyperplane of . This octahedron again delivers the classical situation of a Desargues figure as treated in Chapter 2 with the two-dimensional case of a complete quadrangle in the axis plane of , see Chapter 4. In the following we shall see that this hierarchical structure also holds for higher-dimensional cases.
6 HIGHER-DIMENSIONAL CASES
The idea of interpreting the planar figures as axonometric image of a square, an octahedron or a cross-polytope P suggests to consider pairs of closed polygons with vertices in perspective position in a given classical projective -space Π and interpret them as the central axonometric image of a cross-polytope P in an
-dimensional affine (resp. Euclidean) space Π with an “ideal hyperplane” Π as projective enclosure. The polygons , … , and , … , together with centre give reason to 4 quadrangles and each of them
lead to three Ebisui-points and one point . There occur 2 direct Desargues points ∩ and 2
points stemming from “overcrossing” lines , . Interpreting the points of the two polygons as vertices of P with centre (- we use the same symbols for points in Π and in Π - ) the points and as well as
the Ebisui-points and the points of type span the ideal hyperplane Π . The intersections of Π ∩: can be used to define a coordinate frame in Π . The three hyperplanes Π , Π ,Π spanned by resp. resp. intersect in a space Π spanned by the set , see Fig. 7.
Fig. 7: Symbolic visualisation of perspective p-simplexes and their “direct” and “overcrossing” Desargues points and .
In the following we present the case 5 as an example, which already illustrates the occuring incidences and configurations also for arbitrary cases of .
Let two -perspective 5-gons , be given in a projective -space (2 5), then, after interpreting this set of 11 points (which we assume to be different) as an axonometric fundamental figure of an axonometry : Π → Π , the originals resp. resp. the homogenous coordinates 1,0,0,0,0,0 resp. 1, , … , resp. 1, , , , , form a 5-cross-polytope P . By this we get 10 “direct”
and 10 “overcrossing” Desargues points as follows (Table 2):

G. WEISS ET AL.: REMARKS ON PERSPECTIVE POLYGONS AND SIMPLEXES
THE 5TH ICGG CONFERENCE MONGEOMETRIJA 2016 PROCEEDINGS Belgrade: 23-26 June 2016 376
Table 2: (Axonometric) projective coordinates of the direct and overcrossing Desargues points to perspective 5-gons
∩ 0,1, 1,0,0,0 ∩ 0,1,1,0,0,0
∩ 0,1,0, 1,0,0 ∩ 0,1,0,1,0,0
∩ 0,1,0,0, 1,0 ∩ 0,1,0,0,1,0
∩ 0,1,0,0,0, 1 ∩ 0,1,0,0,0,1
∩ 0,0,1, 1,0,0 ∩ 0,0,1,1,0,0
∩ 0,0,1,0, 1,0 ∩ 0,0,1,0,1,0
∩ 0,0,1,0,0, 1 ∩ 0,0,1,0,0,1
∩ 0,0,0,1, 1,0 ∩ 0,0,0,1,1,0
∩ 0,0,0,1,0, 1 ∩ 0,0,0,1,0,1
∩ 0,0,0,0,1, 1 ∩ 0,0,0,0,1,1
From Table 2 follows that the ten triplets of direct Desargues points , , are collinear with lines and that all those points span a 3-space Π ⊂ Π ⊂ Π . As expected we find that the 10 points and
10 lines form a Desargues configuration in Π with five planes , 1, … ,5, , containing 4 lines and six points . These five planes correlate to the five -perspective pairs of partial quadrangles , of the given perspective 5-gons, and each of the pairs , leads to a triplet of Ebisui points , , in the corresponding plane ⊂ Π and a point ∈ Π . We list the coordinates in Table 3:
Table 3: (Axonometric) projective coordinates of the 15 Ebisui points and the 5 points to two given perspective 5-gons
, 0,1, 1,1, 1,0 0,1, 1, 1,1,0 0,1,1, 1, 1,0 0,1,1,1,1,0
, 0,1, 1,1,0, 1 0,1, 1, 1,0,1 0,1,1, 1,0, 1 0,1,1,1,0,1
, 0,1, 1,0,1, 1 0,1, 1,0, 1,1 0,1,1,0, 1, 1 0,1,1,0,1,1
, 0,1,0, 1,1, 1 0,1,0, 1, 1,1 0,1,0,1, 1, 1 0,1,0,1,1,1
, 0,0,1, 1,1, 1 0,0,1, 1, 1,1 0,0,1,1, 1, 1 0,0,1,1,1,1
From Tables 2 and 3 we read off that the ten lines pass through and that e.g. , , , are collinear and harmonic, and we notice that e.g. the pair of Ebisui triangles and is -perspective. The “ideal points” ∈ Π of the five lines are harmonic to 1,0, … ,0 with respect to
, and they are therefore well defined also in the axonometric image space Π , 2 5.
The five pairs of points , are in perspective position with the “unit point” 0,1,1,1,1,1 ∈ Π . The quadruplets , , , and , , , are -perspective and form a 4-cross-polytope P with centre and “ideal points” , , , as expected. Obviously there occur all together five such 4-crosspolytopes and the points are their centres. The tetrahedron , , , contains the octahedron
, , , , , as a cross-polytope P with centre , see Fig. 8.
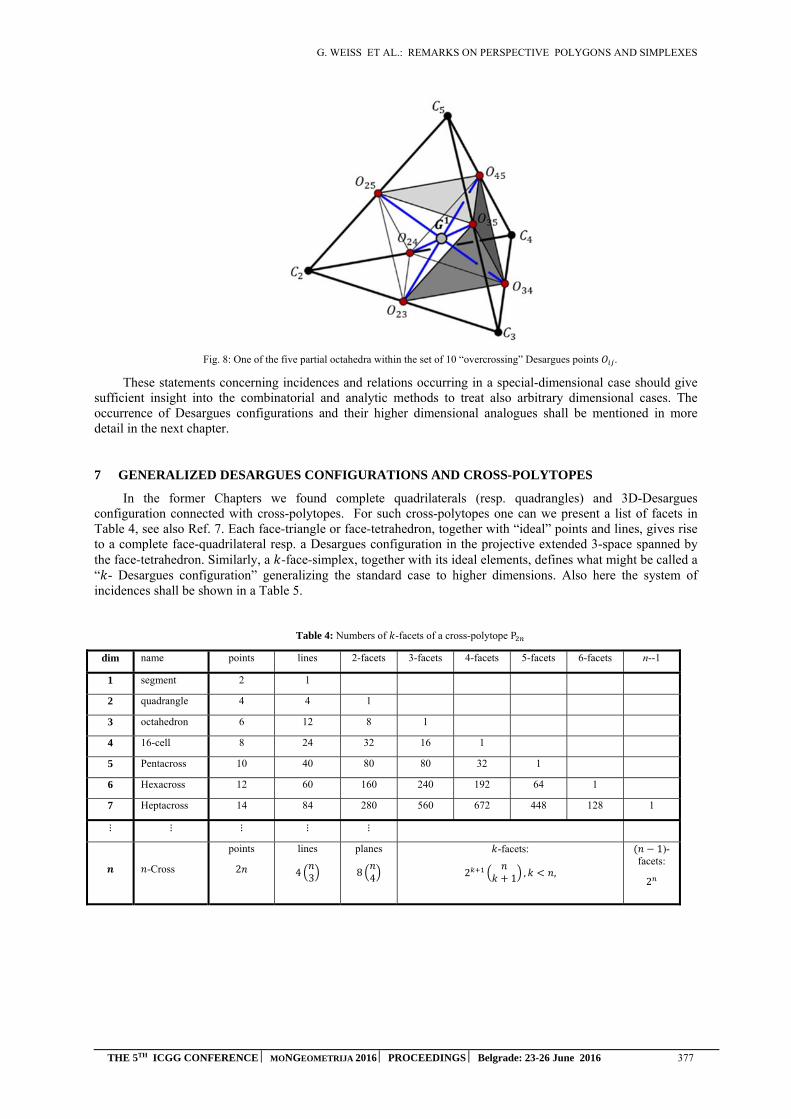
G. WEISS ET AL.: REMARKS ON PERSPECTIVE POLYGONS AND SIMPLEXES
THE 5TH ICGG CONFERENCE MONGEOMETRIJA 2016 PROCEEDINGS Belgrade: 23-26 June 2016 377
Fig. 8: One of the five partial octahedra within the set of 10 “overcrossing” Desargues points .
These statements concerning incidences and relations occurring in a special-dimensional case should give sufficient insight into the combinatorial and analytic methods to treat also arbitrary dimensional cases. The occurrence of Desargues configurations and their higher dimensional analogues shall be mentioned in more detail in the next chapter.
7 GENERALIZED DESARGUES CONFIGURATIONS AND CROSS-POLYTOPES
In the former Chapters we found complete quadrilaterals (resp. quadrangles) and 3D-Desargues configuration connected with cross-polytopes. For such cross-polytopes one can we present a list of facets in Table 4, see also Ref. 7. Each face-triangle or face-tetrahedron, together with “ideal” points and lines, gives rise to a complete face-quadrilateral resp. a Desargues configuration in the projective extended 3-space spanned by the face-tetrahedron. Similarly, a -face-simplex, together with its ideal elements, defines what might be called a “ - Desargues configuration” generalizing the standard case to higher dimensions. Also here the system of incidences shall be shown in a Table 5.
Table 4: Numbers of -facets of a cross-polytope P
dim name points lines 2-facets 3-facets 4-facets 5-facets 6-facets n--1
1 segment 2 1
2 quadrangle 4 4 1
3 octahedron 6 12 8 1
4 16-cell 8 24 32 16 1
5 Pentacross 10 40 80 80 32 1
6 Hexacross 12 60 160 240 192 64 1
7 Heptacross 14 84 280 560 672 448 128 1
⋮ ⋮ ⋮ ⋮ ⋮
-Cross
points
2
lines
4 3
planes
8 4
-facets:
2 1 , ,
1)-facets:
2

G. WEISS ET AL.: REMARKS ON PERSPECTIVE POLYGONS AND SIMPLEXES
THE 5TH ICGG CONFERENCE MONGEOMETRIJA 2016 PROCEEDINGS Belgrade: 23-26 June 2016 378
Table 5: Numbers of incident subspaces within -dimensional generalized Desargues configurations
dim incident with a
points lines planes 3-spaces 4-spaces 5-spaces 6-spaces
2 point 1 2 1
line 3 1 1
plane 6 4 1
3 point 1 3 3 1
line 3 1 2 1
plane 6 4 1 1
3-space 10 10 5 1
4 point 1 4 6 4 1
line 3 1 3 3 1
plane 6 4 1 2 1
3-space 10 10 5 1 1
4-space 15 20 15 6 1
5 point 1 5 10 10 5 1
line 3 1 4 6 4 1
plane 6 4 1 3 3 1
3-space 10 10 5 1 2 1
4-space 15 20 15 6 1 1
5-space 21 35 35 21 7 1
6 point 1 6 15 20 15 6 1
line 3 1 5 10 10 5 1
plane 6 4 1 4 6 4 1
3-space 10 10 5 1 3 3 1
4-space 15 20 15 6 1 2 1
5-space 21 35 35 21 7 1 1
6-space 28 56 70 56 28 8 1
point 1 , … dim
line 3 1 1
plane 6 4 1 2
3-space 10 10 5 1 3
⋮
2 ,…dim…dim
1
,… dim…dim
1)-space
1 1 1
-space 2 1
G. WEISS ET AL.: REMARKS ON PERSPECTIVE POLYGONS AND SIMPLEXES
THE 5TH ICGG CONFERENCE MONGEOMETRIJA 2016 PROCEEDINGS Belgrade: 23-26 June 2016 379
8 CONCLUSION
Starting from the discovery of a “remarkable point” occurring at perspective quadrangles in the projective enclosed Euclidean plane by the second author we could now generalize this fact to projective spaces over any coordinate field with 2 and any dimension 2. The key tool is the interpretation of the given pair of perspective -gons as axonometric fundamental figure of a central axonometry mapping an affine cross-polytope of a -dimensional projective enclosed affine space to the given pair of -gons in the -space spanned by them. As the axonometric coordinate path in the image -space uses the same projective coordinates as are used in the original -space, the calculation of occurring incidences acts on Zeroes and Ones alone.
ACKNOWLEDGEMENT
The first author was supported in parts by the University of Tokyo during a stay in March 2011.
REFERENCES
1. Brauner, H.: Geometrie Projektiver Räume I,II. BI Wissenschaftsverlag, Mannheim/Wien/Zürich 1976, 3-411-01512-8 and 3-411-01513-6 Hochschultaschenbuch
2. Havlicek, H: On the matrices of central linear mappings, Math. Bohem. 121 (1996), 151-156.
3. Stachel, H.: Mehrdimensionale Axonometrie, in: N.K. Stephanidis (ed.), Proceedings of the Congress of Geometry, Thessaloniki 1987, 159-168.
4. Stachel, H.,: On Arne Dür's equation concerning central axonometries, J. Geom. Graphics 8 (2004),
215-224.
5. Stachel, H. - Szabó, J. – Vogel, H.: Ein Satz über die Zentralaxonometrie, Sb. österr. Akad. Wiss., math.-naturw. Kl., Abt.II 203 (1994), 3-11.
6. Weiss, G.; Manhart, F.: About some mappings defined by a classical Desargues configuration. Journal
for Geometry and Graphics vol. 16 (2012), Nr. 2, p. 1-12
7. https://en.wikipedia.org/wiki/Cross-polytope (retrieved April 18, 2016).
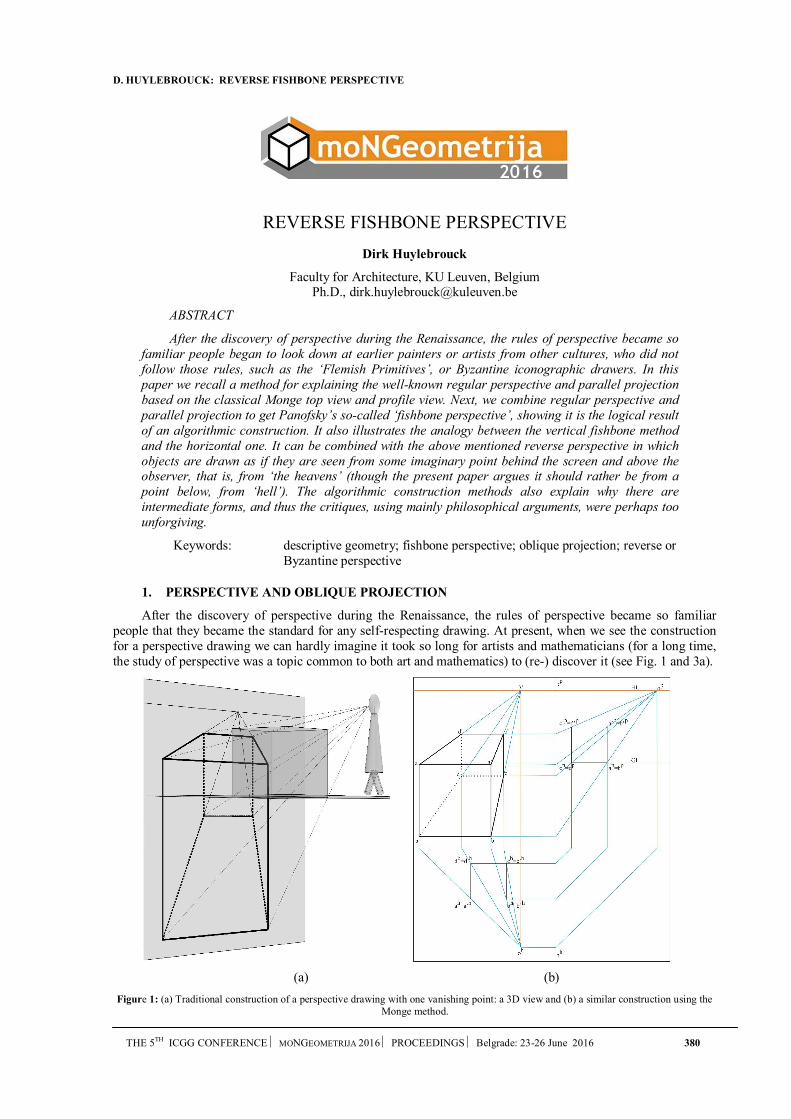
D. HUYLEBROUCK: REVERSE FISHBONE PERSPECTIVE
THE 5TH ICGG CONFERENCE MONGEOMETRIJA 2016 PROCEEDINGS Belgrade: 23-26 June 2016 380
REVERSE FISHBONE PERSPECTIVE
Dirk Huylebrouck
Faculty for Architecture, KU Leuven, Belgium Ph.D., [email protected]
ABSTRACT
After the discovery of perspective during the Renaissance, the rules of perspective became so familiar people began to look down at earlier painters or artists from other cultures, who did not follow those rules, such as the ‘Flemish Primitives’, or Byzantine iconographic drawers. In this paper we recall a method for explaining the well-known regular perspective and parallel projection based on the classical Monge top view and profile view. Next, we combine regular perspective and parallel projection to get Panofsky’s so-called ‘fishbone perspective’, showing it is the logical result of an algorithmic construction. It also illustrates the analogy between the vertical fishbone method and the horizontal one. It can be combined with the above mentioned reverse perspective in which objects are drawn as if they are seen from some imaginary point behind the screen and above the observer, that is, from ‘the heavens’ (though the present paper argues it should rather be from a point below, from ‘hell’). The algorithmic construction methods also explain why there are intermediate forms, and thus the critiques, using mainly philosophical arguments, were perhaps too unforgiving.
Keywords: descriptive geometry; fishbone perspective; oblique projection; reverse or Byzantine perspective
1. PERSPECTIVE AND OBLIQUE PROJECTION
After the discovery of perspective during the Renaissance, the rules of perspective became so familiar people that they became the standard for any self-respecting drawing. At present, when we see the construction for a perspective drawing we can hardly imagine it took so long for artists and mathematicians (for a long time, the study of perspective was a topic common to both art and mathematics) to (re-) discover it (see Fig. 1 and 3a).
(a) (b)
Figure 1: (a) Traditional construction of a perspective drawing with one vanishing point: a 3D view and (b) a similar construction using the Monge method.
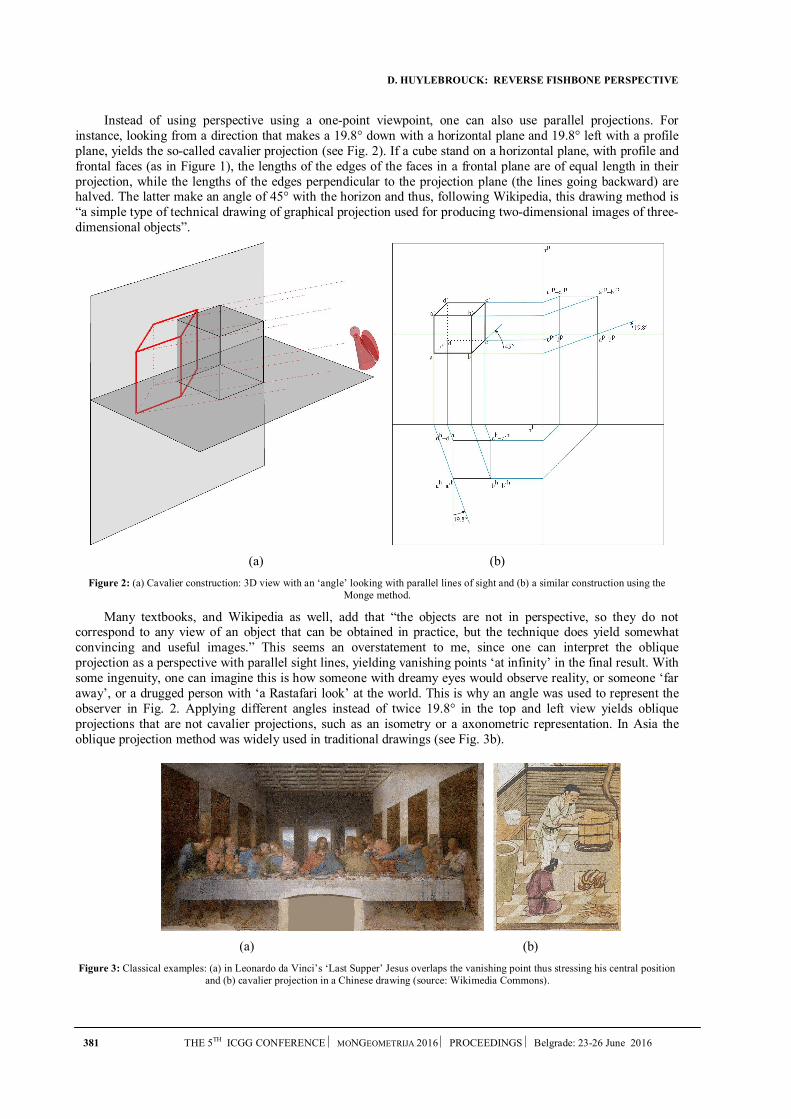
D. HUYLEBROUCK: REVERSE FISHBONE PERSPECTIVE
381 THE 5TH ICGG CONFERENCE MONGEOMETRIJA 2016 PROCEEDINGS Belgrade: 23-26 June 2016
Instead of using perspective using a one-point viewpoint, one can also use parallel projections. For instance, looking from a direction that makes a 19.8° down with a horizontal plane and 19.8° left with a profile plane, yields the so-called cavalier projection (see Fig. 2). If a cube stand on a horizontal plane, with profile and frontal faces (as in Figure 1), the lengths of the edges of the faces in a frontal plane are of equal length in their projection, while the lengths of the edges perpendicular to the projection plane (the lines going backward) are halved. The latter make an angle of 45° with the horizon and thus, following Wikipedia, this drawing method is “a simple type of technical drawing of graphical projection used for producing two-dimensional images of three-dimensional objects”.
(a) (b)
Figure 2: (a) Cavalier construction: 3D view with an ‘angle’ looking with parallel lines of sight and (b) a similar construction using the Monge method.
Many textbooks, and Wikipedia as well, add that “the objects are not in perspective, so they do not correspond to any view of an object that can be obtained in practice, but the technique does yield somewhat convincing and useful images.” This seems an overstatement to me, since one can interpret the oblique projection as a perspective with parallel sight lines, yielding vanishing points ‘at infinity’ in the final result. With some ingenuity, one can imagine this is how someone with dreamy eyes would observe reality, or someone ‘far away’, or a drugged person with ‘a Rastafari look’ at the world. This is why an angle was used to represent the observer in Fig. 2. Applying different angles instead of twice 19.8° in the top and left view yields oblique projections that are not cavalier projections, such as an isometry or a axonometric representation. In Asia the oblique projection method was widely used in traditional drawings (see Fig. 3b).
(a) (b)
Figure 3: Classical examples: (a) in Leonardo da Vinci’s ‘Last Supper’ Jesus overlaps the vanishing point thus stressing his central position and (b) cavalier projection in a Chinese drawing (source: Wikimedia Commons).
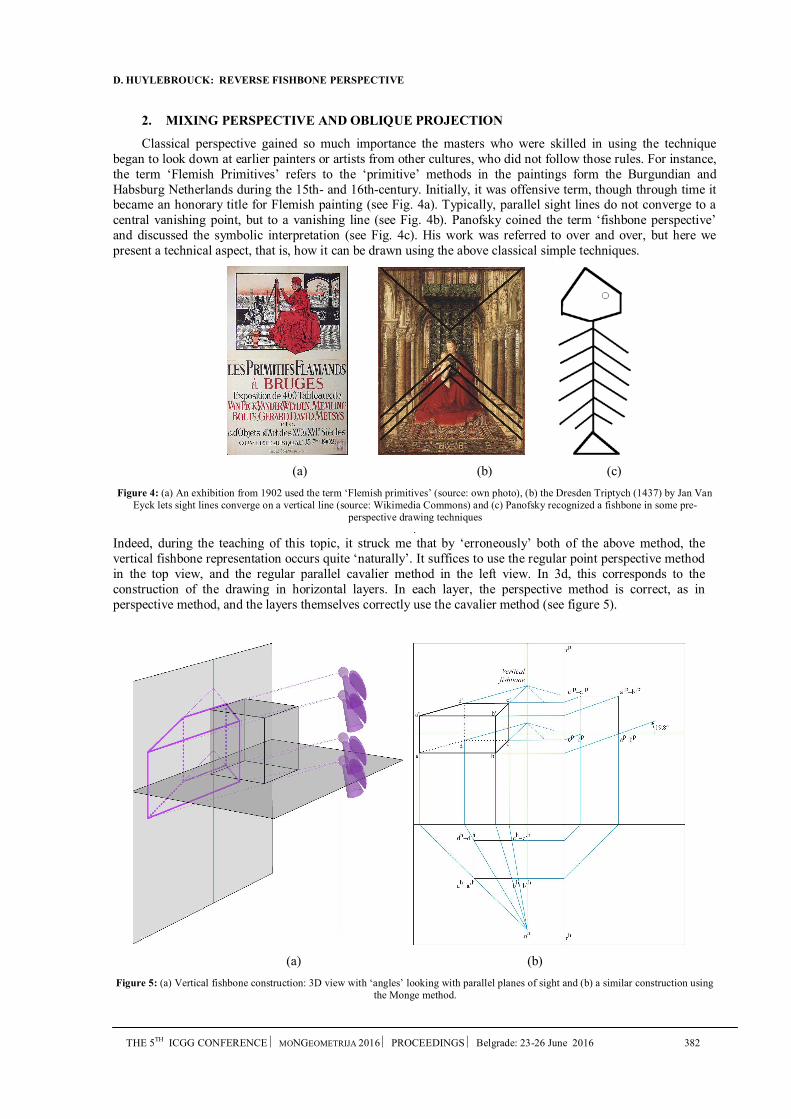
D. HUYLEBROUCK: REVERSE FISHBONE PERSPECTIVE
THE 5TH ICGG CONFERENCE MONGEOMETRIJA 2016 PROCEEDINGS Belgrade: 23-26 June 2016 382
2. MIXING PERSPECTIVE AND OBLIQUE PROJECTION
Classical perspective gained so much importance the masters who were skilled in using the technique began to look down at earlier painters or artists from other cultures, who did not follow those rules. For instance, the term ‘Flemish Primitives’ refers to the ‘primitive’ methods in the paintings form the Burgundian and Habsburg Netherlands during the 15th- and 16th-century. Initially, it was offensive term, though through time it became an honorary title for Flemish painting (see Fig. 4a). Typically, parallel sight lines do not converge to a central vanishing point, but to a vanishing line (see Fig. 4b). Panofsky coined the term ‘fishbone perspective’ and discussed the symbolic interpretation (see Fig. 4c). His work was referred to over and over, but here we present a technical aspect, that is, how it can be drawn using the above classical simple techniques.
(a) (b) (c)
Figure 4: (a) An exhibition from 1902 used the term ‘Flemish primitives’ (source: own photo), (b) the Dresden Triptych (1437) by Jan Van Eyck lets sight lines converge on a vertical line (source: Wikimedia Commons) and (c) Panofsky recognized a fishbone in some pre-
perspective drawing techniques .
Indeed, during the teaching of this topic, it struck me that by ‘erroneously’ both of the above method, the vertical fishbone representation occurs quite ‘naturally’. It suffices to use the regular point perspective method in the top view, and the regular parallel cavalier method in the left view. In 3d, this corresponds to the construction of the drawing in horizontal layers. In each layer, the perspective method is correct, as in perspective method, and the layers themselves correctly use the cavalier method (see figure 5).
(a) (b)
Figure 5: (a) Vertical fishbone construction: 3D view with ‘angles’ looking with parallel planes of sight and (b) a similar construction using the Monge method.

D. HUYLEBROUCK: REVERSE FISHBONE PERSPECTIVE
383 THE 5TH ICGG CONFERENCE MONGEOMETRIJA 2016 PROCEEDINGS Belgrade: 23-26 June 2016
To the creative descriptive geometer, this of course brings an idea to mind: why not mix the perspective method and the cavalier method differently, and use the regular point perspective method in the left view, and the regular parallel cavalier method in the top view? Indeed, this makes sense: it creates a horizontal fishbone (see Fig. 6 and Fig. 7b).
(a) (b)
Figure 6: (a) Horizontal fishbone construction: 3D view with observers again looking with parallel planes of sight and (b) a similar construction using the Monge method.
These constructions show that the ‘fishbone perspectives’ are a logical result of an algorithmic construction, which can be repeated on computer if desired, and thus that it is more than the outcome of some loose artistic or philosophical ideas that may even seem arbitrary. It also illustrates the analogy between the vertical fishbone method and the horizontal one. For some iconographic art however, these representations do not seem sufficient to explain them (see Fig. 7b), and that will be the topic of the next section.
(a) (b)
Figure 7: (a) Example of a horizontal fishbone artwork: The Flagellation of Christ (c. 1320) by Pietro Lorenzetti (source: Wikimedia Commons) and (b) an introduction to the next section: the ‘Presentation of the Virgin in the Temple’, with an in this context appropriate
angle in the above right corner (Studenica, King’s Church, 1314; photo by the author).
3. REVERSE PERSPECTIVE
Another case with a telling name is the ‘reverse’ perspective in Byzantine drawings. Of course, it refers to the apparently opposite sense of the perspective lines, that seem to come towards the observer of the drawing instead of going away from him, but its name can also be interpreted as opposed to the ‘regular, direct’
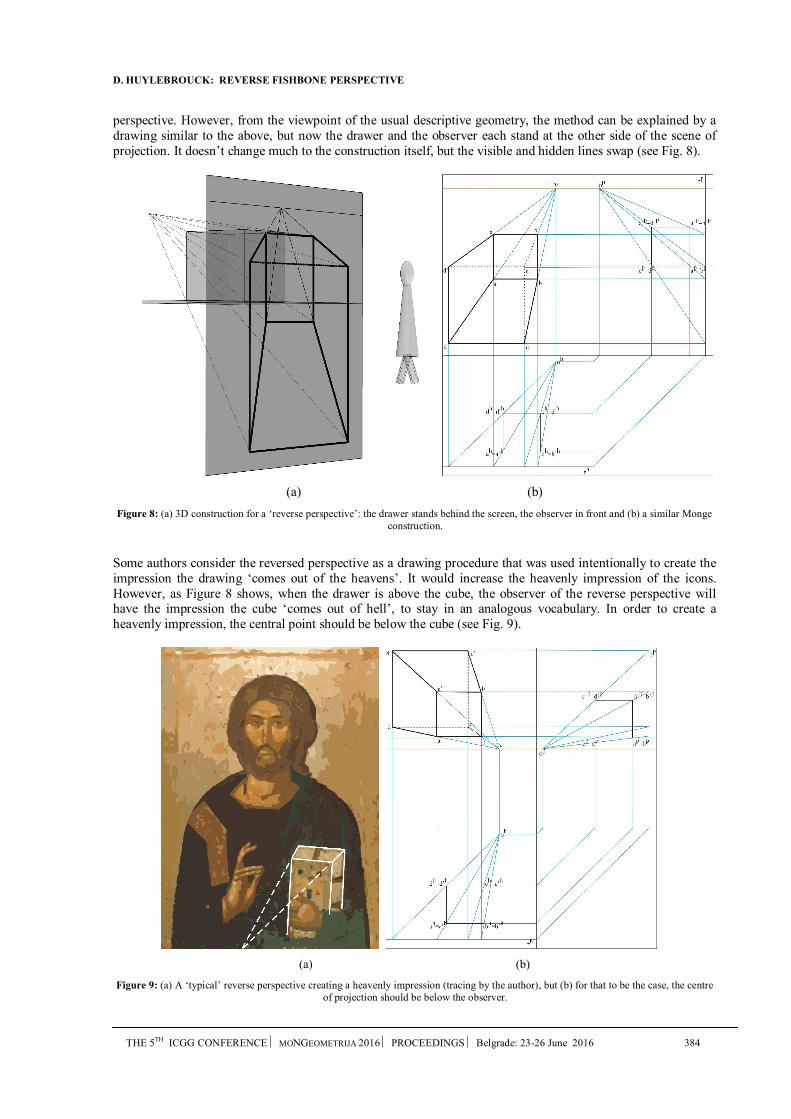
D. HUYLEBROUCK: REVERSE FISHBONE PERSPECTIVE
THE 5TH ICGG CONFERENCE MONGEOMETRIJA 2016 PROCEEDINGS Belgrade: 23-26 June 2016 384
perspective. However, from the viewpoint of the usual descriptive geometry, the method can be explained by a drawing similar to the above, but now the drawer and the observer each stand at the other side of the scene of projection. It doesn’t change much to the construction itself, but the visible and hidden lines swap (see Fig. 8).
(a) (b)
Figure 8: (a) 3D construction for a ‘reverse perspective’: the drawer stands behind the screen, the observer in front and (b) a similar Monge construction.
Some authors consider the reversed perspective as a drawing procedure that was used intentionally to create the impression the drawing ‘comes out of the heavens’. It would increase the heavenly impression of the icons. However, as Figure 8 shows, when the drawer is above the cube, the observer of the reverse perspective will have the impression the cube ‘comes out of hell’, to stay in an analogous vocabulary. In order to create a heavenly impression, the central point should be below the cube (see Fig. 9).
(a) (b)
Figure 9: (a) A ‘typical’ reverse perspective creating a heavenly impression (tracing by the author), but (b) for that to be the case, the centre of projection should be below the observer.
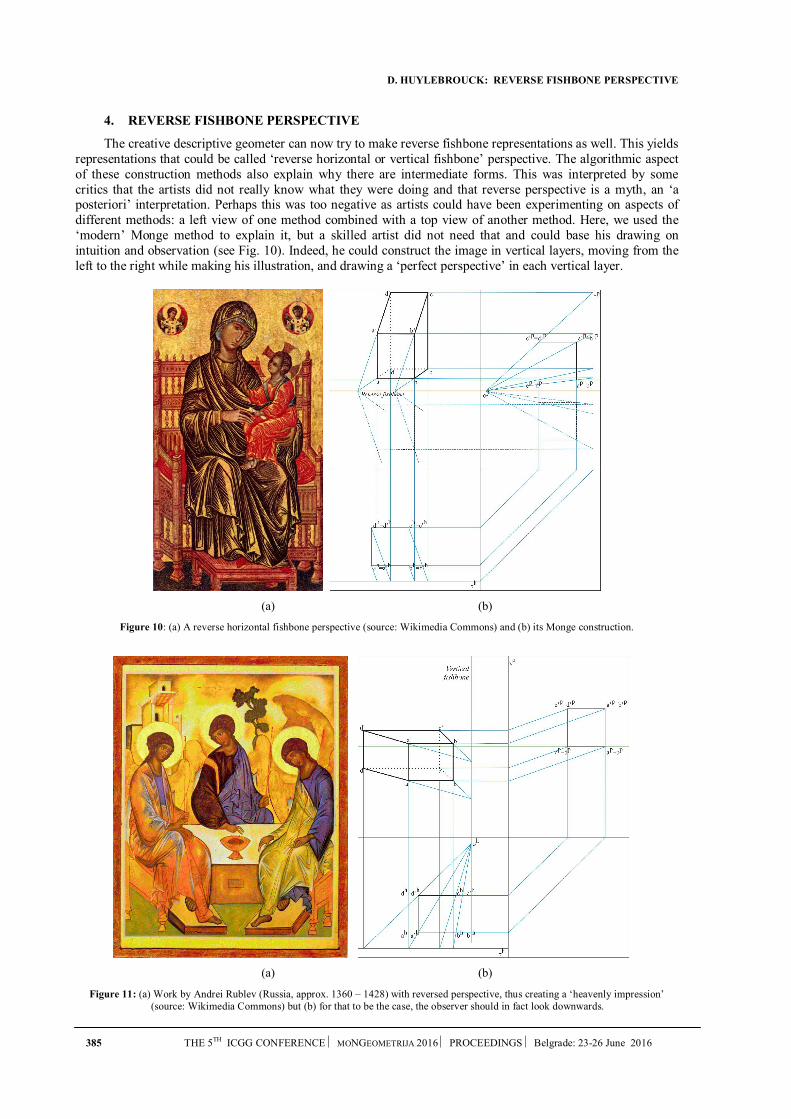
D. HUYLEBROUCK: REVERSE FISHBONE PERSPECTIVE
385 THE 5TH ICGG CONFERENCE MONGEOMETRIJA 2016 PROCEEDINGS Belgrade: 23-26 June 2016
4. REVERSE FISHBONE PERSPECTIVE
The creative descriptive geometer can now try to make reverse fishbone representations as well. This yields representations that could be called ‘reverse horizontal or vertical fishbone’ perspective. The algorithmic aspect of these construction methods also explain why there are intermediate forms. This was interpreted by some critics that the artists did not really know what they were doing and that reverse perspective is a myth, an ‘a posteriori’ interpretation. Perhaps this was too negative as artists could have been experimenting on aspects of different methods: a left view of one method combined with a top view of another method. Here, we used the ‘modern’ Monge method to explain it, but a skilled artist did not need that and could base his drawing on intuition and observation (see Fig. 10). Indeed, he could construct the image in vertical layers, moving from the left to the right while making his illustration, and drawing a ‘perfect perspective’ in each vertical layer.
(a) (b)
Figure 10: (a) A reverse horizontal fishbone perspective (source: Wikimedia Commons) and (b) its Monge construction.
(a) (b)
Figure 11: (a) Work by Andrei Rublev (Russia, approx. 1360 – 1428) with reversed perspective, thus creating a ‘heavenly impression’ (source: Wikimedia Commons) but (b) for that to be the case, the observer should in fact look downwards.

D. HUYLEBROUCK: REVERSE FISHBONE PERSPECTIVE
THE 5TH ICGG CONFERENCE MONGEOMETRIJA 2016 PROCEEDINGS Belgrade: 23-26 June 2016 386
Similarly, examples of a reverse vertical fishbone can be discovered too. Again, it is a downward looking direction that creates a heavenly impression (see Fig. 11). Here it seems the artist used horizontal layers, moving up or down while making his illustration, and making a ‘perfect perspective’ in each horizontal layer. Thus, a part from the philosophical considerations, this Byzantine art could be inspired by logical, practical ideas as well.
5. REFERENCES
Kirsti Andersen, ‘The Geometry of an Art, The History of the Mathematical Theory of Perspective from Alberti to Monge’, Springer-Verlag New York Inc. 2006.
Conesa Tejada, S. ‘Perspectiva naturalis y perspectiva artificialis, el espacio perspectivo en la pintura primitiva italiana. Propuestas para la creación artística’, PhD thesis at the Universitat Politècnica de València, 2011.
Panofsky, Erwin. ‘Perspective as Symbolic Form’, Zone Books, 1991.
David (an otherwise anonymous blog), ‘Icons and their Interpretation, Information for the objective student of Russian, Greek, and Balkan icons’, https://russianicons.wordpress.com/2011/09/01/reverse-perspective-another-icon-myth/, accessed on September 1, 2011.
A. . CUCAKOVIC ET AL.: SHADOW SHAPES OF METAMORPHOSES HYPERCUBE
THE 5TH ICGG CONFERENCE MONGEOMETRIJA 2016 PROCEEDINGS Belgrade: 23-26 June 2016 387
SHADOW SHAPES OF METHAMORPHOSES HYPERCUBE
Aleksandar Čučaković
Department of Mathematics, Physics and Descriptive Geometry, Faculty of Civil Engineering , University of
Belgrade, Republic of Serbia
PhD, Associate Professor, [email protected]
Biljana Jović
Department of Landscape architecture, Faculty of Forestry, University of Belgrade, Republic of Serbia
PhD, Docent, [email protected]
Andrea Đukin
Department of Landscape architecture, Faculty of Forestry, University of Belgrade, Republic of Serbia
student, [email protected]
ABSTRACT
This paper deals with researching the relation between 4D and 3D space for graphic
presentation in different projections, where is focus on light centre of projection and its effect on
shadow. Imagine 3D form from 2D image of the object is possible. Relation between 3D and 2D
space could be extended to 4D and multidimensional space. 3D graphics should make 4D
information’s visible. Experience is needed for direct understanding of the 4D space and getting
knowledge of 4D space geometry.
Duality principles between plane and 3D space could be conclude that two 3D spaces which
have common line (belong to the same line) also have common plane. That means if two 3D spaces
intersect, their intersection is a plane. Two 3D spaces which have common intersection plane,
belong to the space which is higher for one dimension – 4D space.
4D objects do not actually exist in the physical world, so the main question is: since the
shadow of a 3D object is projected on a 2D plane, is it possible for the shadow of a 4D object, able
to cast a 3D shadow? The easiest way to understand projections could be shadows. There are two
main types of shadows, depending on the distance between the object casting a shadow and the
source of light. As the cube rotates, the side lengths and internal angles in the projection change;
the distorted sides morph into squares and back as the inner and outer squares change places.
These distortions are not actually occurring, and that as a part of the shadow grows the
corresponding cube face is just rotating closer to the light source. The important features of the
cube, like the number of faces and vertices, stay true to the actual three-dimensional object even in
projection. The four-dimensional equivalent of a shadow is a three-dimensional projection. While a
cube with a facet directed towards a nearby light in three dimensions casts a shadow of a square
within a square, a tesseract with a facet directed towards a nearby light source in four dimensions
casts a three-dimensional “shadow” of a cube within a cube. Instead of the cube’s facet closest to
the light source projected as an outer square, we have the facet of the tesseract closest to the four-
dimensional light source projected as an outer cube. Similarly, instead of the facet of a cube farthest
from the light projected as an inner square, the facet of a tesseract farthest from the light is
projected as an inner cube.
While the shadows and projections of hypercube supply on many scientific disciplines such as
mathematics, physics, architecture, they, and their use is still not sufficiently well known.
Keywords: hypercube; shadows; metamorphoses; animation
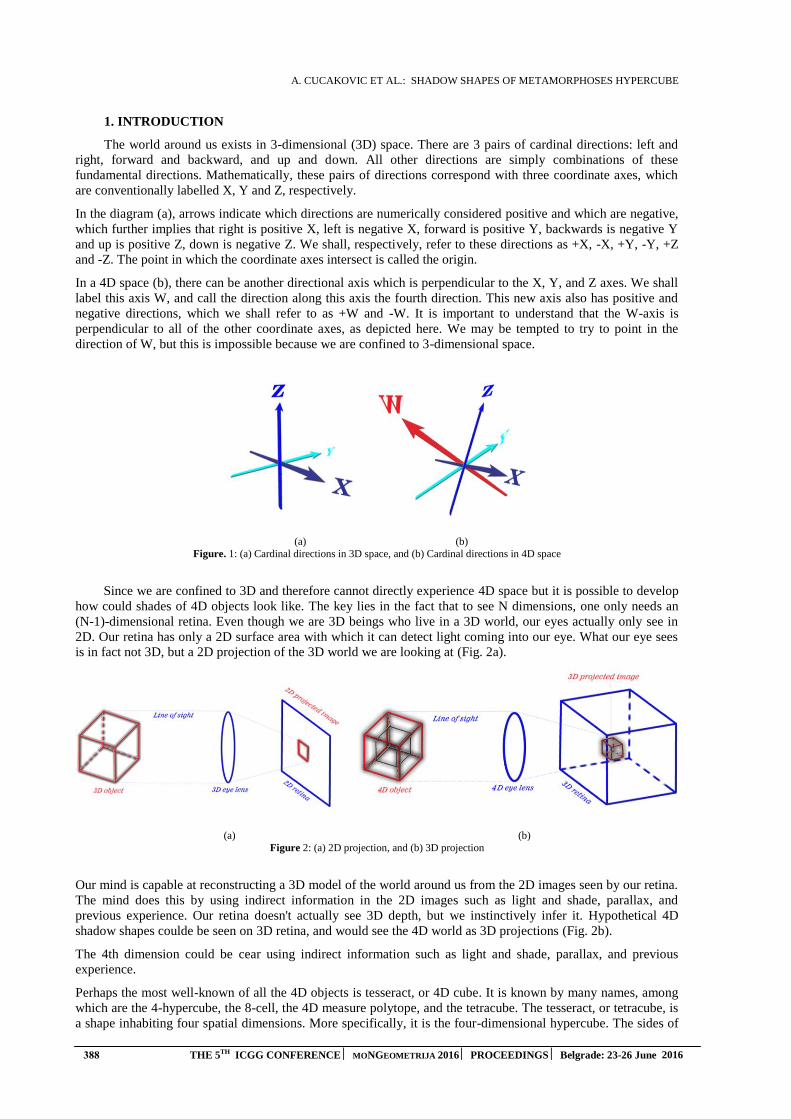
A. CUCAKOVIC ET AL.: SHADOW SHAPES OF METAMORPHOSES HYPERCUBE
388 THE 5TH ICGG CONFERENCE MONGEOMETRIJA 2016 PROCEEDINGS Belgrade: 23-26 June 2016
1. INTRODUCTION
The world around us exists in 3-dimensional (3D) space. There are 3 pairs of cardinal directions: left and
right, forward and backward, and up and down. All other directions are simply combinations of these
fundamental directions. Mathematically, these pairs of directions correspond with three coordinate axes, which
are conventionally labelled X, Y and Z, respectively.
In the diagram (a), arrows indicate which directions are numerically considered positive and which are negative,
which further implies that right is positive X, left is negative X, forward is positive Y, backwards is negative Y
and up is positive Z, down is negative Z. We shall, respectively, refer to these directions as +X, -X, +Y, -Y, +Z
and -Z. The point in which the coordinate axes intersect is called the origin.
In a 4D space (b), there can be another directional axis which is perpendicular to the X, Y, and Z axes. We shall
label this axis W, and call the direction along this axis the fourth direction. This new axis also has positive and
negative directions, which we shall refer to as +W and -W. It is important to understand that the W-axis is
perpendicular to all of the other coordinate axes, as depicted here. We may be tempted to try to point in the
direction of W, but this is impossible because we are confined to 3-dimensional space.
(a) (b)
Figure. 1: (a) Cardinal directions in 3D space, and (b) Cardinal directions in 4D space
Since we are confined to 3D and therefore cannot directly experience 4D space but it is possible to develop
how could shades of 4D objects look like. The key lies in the fact that to see N dimensions, one only needs an
(N-1)-dimensional retina. Even though we are 3D beings who live in a 3D world, our eyes actually only see in
2D. Our retina has only a 2D surface area with which it can detect light coming into our eye. What our eye sees
is in fact not 3D, but a 2D projection of the 3D world we are looking at (Fig. 2a).
(a) (b)
Figure 2: (a) 2D projection, and (b) 3D projection
Our mind is capable at reconstructing a 3D model of the world around us from the 2D images seen by our retina.
The mind does this by using indirect information in the 2D images such as light and shade, parallax, and
previous experience. Our retina doesn't actually see 3D depth, but we instinctively infer it. Hypothetical 4D
shadow shapes coulde be seen on 3D retina, and would see the 4D world as 3D projections (Fig. 2b).
The 4th dimension could be cear using indirect information such as light and shade, parallax, and previous
experience.
Perhaps the most well-known of all the 4D objects is tesseract, or 4D cube. It is known by many names, among
which are the 4-hypercube, the 8-cell, the 4D measure polytope, and the tetracube. The tesseract, or tetracube, is
a shape inhabiting four spatial dimensions. More specifically, it is the four-dimensional hypercube. The sides of
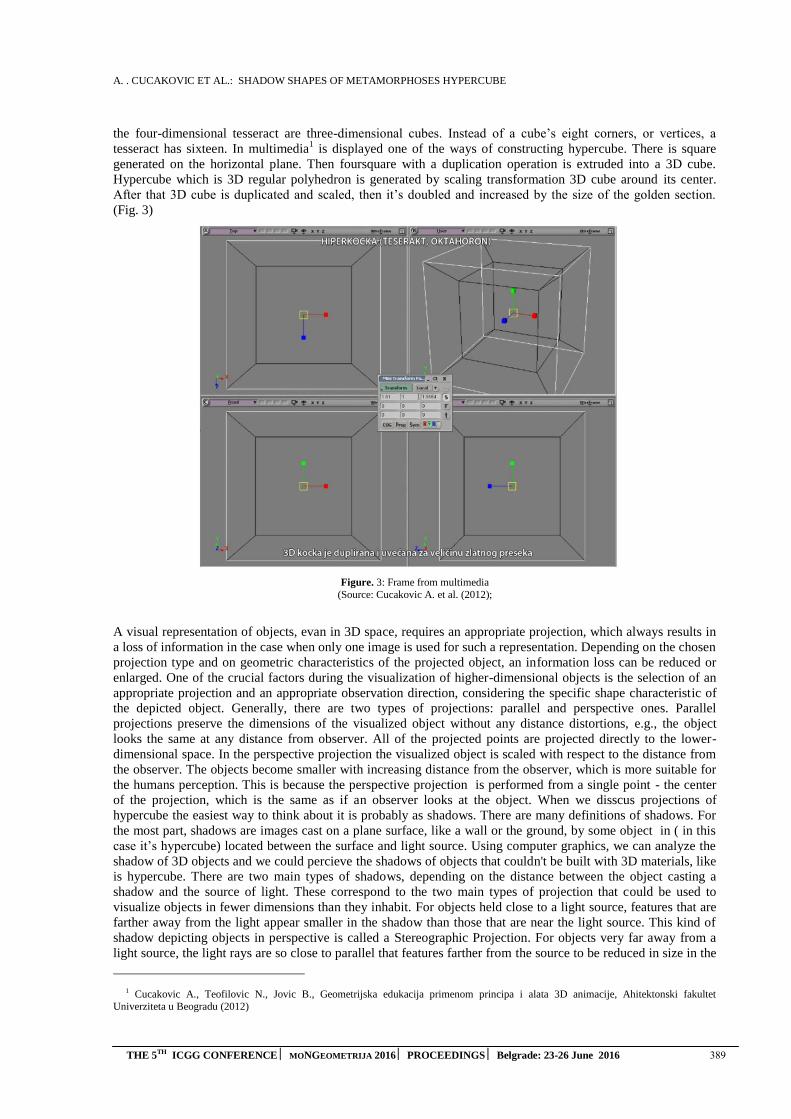
A. . CUCAKOVIC ET AL.: SHADOW SHAPES OF METAMORPHOSES HYPERCUBE
THE 5TH ICGG CONFERENCE MONGEOMETRIJA 2016 PROCEEDINGS Belgrade: 23-26 June 2016 389
the four-dimensional tesseract are three-dimensional cubes. Instead of a cube’s eight corners, or vertices, a
tesseract has sixteen. In multimedia1 is displayed one of the ways of constructing hypercube. There is square
generated on the horizontal plane. Then foursquare with a duplication operation is extruded into a 3D cube.
Hypercube which is 3D regular polyhedron is generated by scaling transformation 3D cube around its center.
After that 3D cube is duplicated and scaled, then it’s doubled and increased by the size of the golden section.
(Fig. 3)
Figure. 3: Frame from multimedia
(Source: Cucakovic A. et al. (2012);
A visual representation of objects, evan in 3D space, requires an appropriate projection, which always results in
a loss of information in the case when only one image is used for such a representation. Depending on the chosen
projection type and on geometric characteristics of the projected object, an information loss can be reduced or
enlarged. One of the crucial factors during the visualization of higher-dimensional objects is the selection of an
appropriate projection and an appropriate observation direction, considering the specific shape characteristic of
the depicted object. Generally, there are two types of projections: parallel and perspective ones. Parallel
projections preserve the dimensions of the visualized object without any distance distortions, e.g., the object
looks the same at any distance from observer. All of the projected points are projected directly to the lower-
dimensional space. In the perspective projection the visualized object is scaled with respect to the distance from
the observer. The objects become smaller with increasing distance from the observer, which is more suitable for
the humans perception. This is because the perspective projection is performed from a single point - the center
of the projection, which is the same as if an observer looks at the object. When we disscus projections of
hypercube the easiest way to think about it is probably as shadows. There are many definitions of shadows. For
the most part, shadows are images cast on a plane surface, like a wall or the ground, by some object in ( in this
case it’s hypercube) located between the surface and light source. Using computer graphics, we can analyze the
shadow of 3D objects and we could percieve the shadows of objects that couldn't be built with 3D materials, like
is hypercube. There are two main types of shadows, depending on the distance between the object casting a
shadow and the source of light. These correspond to the two main types of projection that could be used to
visualize objects in fewer dimensions than they inhabit. For objects held close to a light source, features that are
farther away from the light appear smaller in the shadow than those that are near the light source. This kind of
shadow depicting objects in perspective is called a Stereographic Projection. For objects very far away from a
light source, the light rays are so close to parallel that features farther from the source to be reduced in size in the
1 Cucakovic A., Teofilovic N., Jovic B., Geometrijska edukacija primenom principa i alata 3D animacije, Ahitektonski fakultet
Univerziteta u Beogradu (2012)
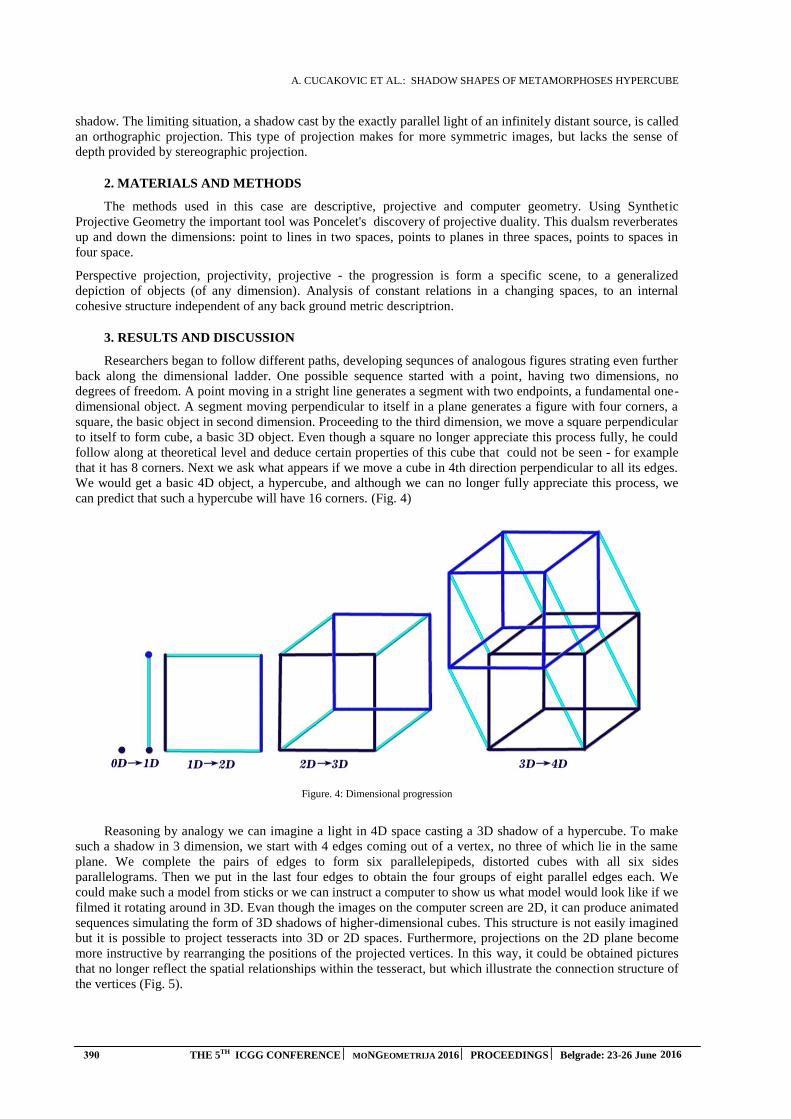
A. CUCAKOVIC ET AL.: SHADOW SHAPES OF METAMORPHOSES HYPERCUBE
390 THE 5TH ICGG CONFERENCE MONGEOMETRIJA 2016 PROCEEDINGS Belgrade: 23-26 June 2016
shadow. The limiting situation, a shadow cast by the exactly parallel light of an infinitely distant source, is called
an orthographic projection. This type of projection makes for more symmetric images, but lacks the sense of
depth provided by stereographic projection.
2. MATERIALS AND METHODS
The methods used in this case are descriptive, projective and computer geometry. Using Synthetic
Projective Geometry the important tool was Poncelet's discovery of projective duality. This dualsm reverberates
up and down the dimensions: point to lines in two spaces, points to planes in three spaces, points to spaces in
four space.
Perspective projection, projectivity, projective - the progression is form a specific scene, to a generalized
depiction of objects (of any dimension). Analysis of constant relations in a changing spaces, to an internal
cohesive structure independent of any back ground metric descriptrion.
3. RESULTS AND DISCUSSION
Researchers began to follow different paths, developing sequnces of analogous figures strating even further
back along the dimensional ladder. One possible sequence started with a point, having two dimensions, no
degrees of freedom. A point moving in a stright line generates a segment with two endpoints, a fundamental one-
dimensional object. A segment moving perpendicular to itself in a plane generates a figure with four corners, a
square, the basic object in second dimension. Proceeding to the third dimension, we move a square perpendicular
to itself to form cube, a basic 3D object. Even though a square no longer appreciate this process fully, he could
follow along at theoretical level and deduce certain properties of this cube that could not be seen - for example
that it has 8 corners. Next we ask what appears if we move a cube in 4th direction perpendicular to all its edges.
We would get a basic 4D object, a hypercube, and although we can no longer fully appreciate this process, we
can predict that such a hypercube will have 16 corners. (Fig. 4)
Figure. 4: Dimensional progression
Reasoning by analogy we can imagine a light in 4D space casting a 3D shadow of a hypercube. To make
such a shadow in 3 dimension, we start with 4 edges coming out of a vertex, no three of which lie in the same
plane. We complete the pairs of edges to form six parallelepipeds, distorted cubes with all six sides
parallelograms. Then we put in the last four edges to obtain the four groups of eight parallel edges each. We
could make such a model from sticks or we can instruct a computer to show us what model would look like if we
filmed it rotating around in 3D. Evan though the images on the computer screen are 2D, it can produce animated
sequences simulating the form of 3D shadows of higher-dimensional cubes. This structure is not easily imagined
but it is possible to project tesseracts into 3D or 2D spaces. Furthermore, projections on the 2D plane become
more instructive by rearranging the positions of the projected vertices. In this way, it could be obtained pictures
that no longer reflect the spatial relationships within the tesseract, but which illustrate the connection structure of
the vertices (Fig. 5).
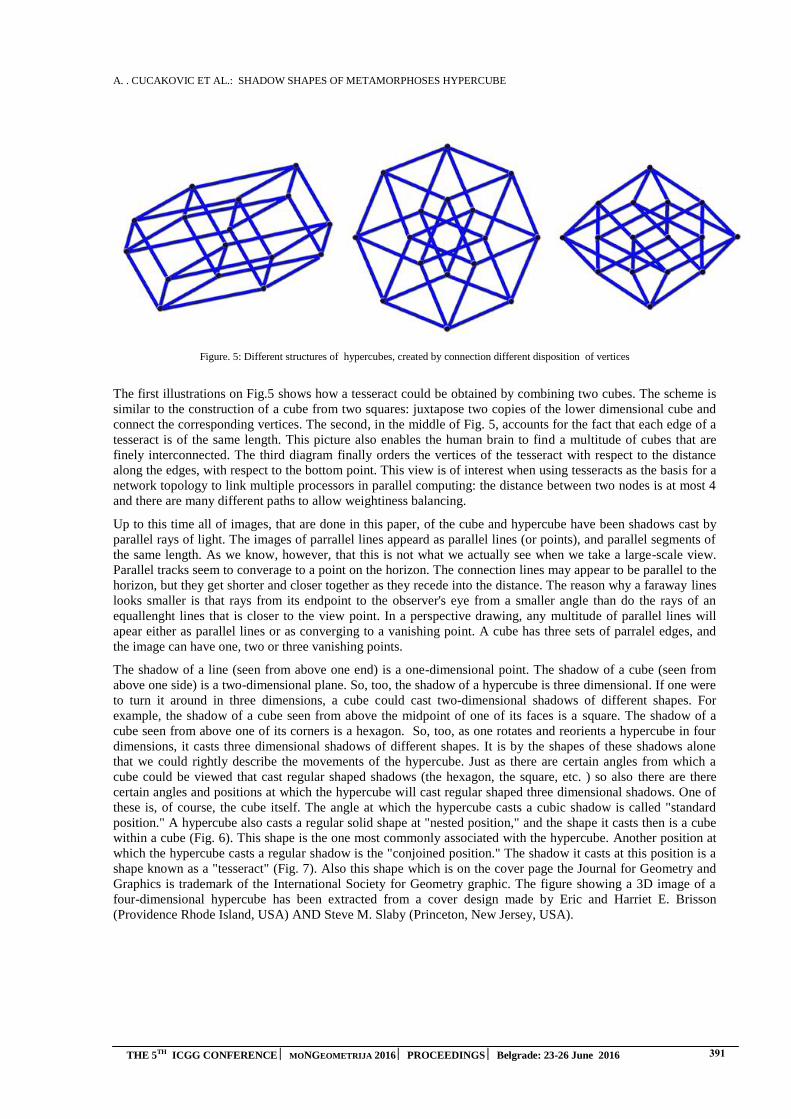
A. . CUCAKOVIC ET AL.: SHADOW SHAPES OF METAMORPHOSES HYPERCUBE
THE 5TH ICGG CONFERENCE MONGEOMETRIJA 2016 PROCEEDINGS Belgrade: 23-26 June 2016 391
Figure. 5: Different structures of hypercubes, created by connection different disposition of vertices
The first illustrations on Fig.5 shows how a tesseract could be obtained by combining two cubes. The scheme is
similar to the construction of a cube from two squares: juxtapose two copies of the lower dimensional cube and
connect the corresponding vertices. The second, in the middle of Fig. 5, accounts for the fact that each edge of a
tesseract is of the same length. This picture also enables the human brain to find a multitude of cubes that are
finely interconnected. The third diagram finally orders the vertices of the tesseract with respect to the distance
along the edges, with respect to the bottom point. This view is of interest when using tesseracts as the basis for a
network topology to link multiple processors in parallel computing: the distance between two nodes is at most 4
and there are many different paths to allow weightiness balancing.
Up to this time all of images, that are done in this paper, of the cube and hypercube have been shadows cast by
parallel rays of light. The images of parrallel lines appeard as parallel lines (or points), and parallel segments of
the same length. As we know, however, that this is not what we actually see when we take a large-scale view.
Parallel tracks seem to converage to a point on the horizon. The connection lines may appear to be parallel to the
horizon, but they get shorter and closer together as they recede into the distance. The reason why a faraway lines
looks smaller is that rays from its endpoint to the observer's eye from a smaller angle than do the rays of an
equallenght lines that is closer to the view point. In a perspective drawing, any multitude of parallel lines will
apear either as parallel lines or as converging to a vanishing point. A cube has three sets of parralel edges, and
the image can have one, two or three vanishing points.
The shadow of a line (seen from above one end) is a one-dimensional point. The shadow of a cube (seen from
above one side) is a two-dimensional plane. So, too, the shadow of a hypercube is three dimensional. If one were
to turn it around in three dimensions, a cube could cast two-dimensional shadows of different shapes. For
example, the shadow of a cube seen from above the midpoint of one of its faces is a square. The shadow of a
cube seen from above one of its corners is a hexagon. So, too, as one rotates and reorients a hypercube in four
dimensions, it casts three dimensional shadows of different shapes. It is by the shapes of these shadows alone
that we could rightly describe the movements of the hypercube. Just as there are certain angles from which a
cube could be viewed that cast regular shaped shadows (the hexagon, the square, etc. ) so also there are there
certain angles and positions at which the hypercube will cast regular shaped three dimensional shadows. One of
these is, of course, the cube itself. The angle at which the hypercube casts a cubic shadow is called "standard
position." A hypercube also casts a regular solid shape at "nested position," and the shape it casts then is a cube
within a cube (Fig. 6). This shape is the one most commonly associated with the hypercube. Another position at
which the hypercube casts a regular shadow is the "conjoined position." The shadow it casts at this position is a
shape known as a "tesseract" (Fig. 7). Also this shape which is on the cover page the Journal for Geometry and
Graphics is trademark of the International Society for Geometry graphic. The figure showing a 3D image of a
four-dimensional hypercube has been extracted from a cover design made by Eric and Harriet E. Brisson
(Providence Rhode Island, USA) AND Steve M. Slaby (Princeton, New Jersey, USA).

A. CUCAKOVIC ET AL.: SHADOW SHAPES OF METAMORPHOSES HYPERCUBE
392 THE 5TH ICGG CONFERENCE MONGEOMETRIJA 2016 PROCEEDINGS Belgrade: 23-26 June 2016
Figure. 6: Nested position Figure.7: Conjoined position Figure.8: Antipode position
The last position at which the hypercube casts a regular shaped shadow here is called "antipode" position (Fig.
8). The hypercube at antipode also consists of two cubes. The "antipode" position is a view from above one of
the hypercube's edges. In addition to the three most common position there is still much more (figure 9).
Figure. 9: Some other positions of hypercube
All of these regular solid shapes are only different shadows cast by the same hypercube. The only difference is
that the hypercube is being seen from different angles. Just as a cube casts different shaped two dimensional
shadows as it is rotated in three dimensional space, too, does the hypercube cast different shaped three
dimensional shadows as it rotates in 4D space. The rotation of a hypercube differs from the rotation of a cube.
However, hypercube is comprised of two cubes, each with the same volume, its rotation moves one of these
cubes through the other. Thrown shadows of special position where the hypercube 8 edges normal to the plane of
the shadow. Hypercube changes its shape due to the linear movement of a vanishing edge of the hypercube that
are not normal to the plane of the shadows. Line movement vanishing edges of the hypercube parallel to the
plane of shadow and light rays that are parallel to each other, are normal to the plane of thrown shadow (Fig. 10).
Figure. 10: Thrown shadows of special positions hypercube

A. . CUCAKOVIC ET AL.: SHADOW SHAPES OF METAMORPHOSES HYPERCUBE
THE 5TH ICGG CONFERENCE MONGEOMETRIJA 2016 PROCEEDINGS Belgrade: 23-26 June 2016 393
The perspective views of a slightly rotated 3D cube, it is evan more difficult to imagine the views of a
hypercube as it spins in 4D space. Fortunately the computer, which provided the parallel projections of the
hypercube can also produce perspective views of the hypercube from any viewpoint we choose. The metod by
which it achieves this result is called central projection.
To make a image re-creating the perspective view of a cubical framework viewed from the top, we could put the
light rays from our view point and capture the shadow on a photographic plate below. That shadow gives an
accurate record of exactly what would be seen from the viewpoint at which the picture was taken, and if we
stand in that spot and look at the shadow image, we would receive the same impressions we would get from
looking at the actual object. Once we choose a view point and a projection plane, the application can determine
the position of the image of vertex strikes the plane. Almost the same that creates a central projection of a cube
on the plane could be used to create a central projection of a hypercube in 3D space and then to show the
projection on the computer screen.
Technologically, the animation can be defined as the process of making a sequence of static images which
rapidly succession in the perception of the viewer creates the illusion of the movement. If we look at objects that
this sequence of images contains, we can say that animate means to display their changes (positions, shapes,
colors, etc). Computer animation can be defined as the art and technology to create the illusion of movement
using a computer or computer animation involves computer-based calculation in that produce sequence of image
that is in human perception creates the illusion of movement. The movement recorded in the sequence of static
images that can rotate at a certain speed the human eye perceives as a continuous. To create an animation using
parallel projection, the program keeps track of the position of one corner of the cube or hypercube and all of
corners attached to it by edges. Once the images of these points are determined, all the other points and segments
can be drawn easily since the images of parallel segments of the same length will be parallel segments of the
same length. Some additional calculates are necessary for central projections since images of parallel segments
will no longer be parallel but will lie in lines going through ''vanishing points''.
Figure.11: Frames from animation
3.1. Hypercube in art
Hypercube have appeared in literature since 1940 when Robert A. Heinlein in "And He Built a Crooked
House" where he described a house built as unfolded tesseract. When an ordinary 3D cube is unfolded, it forms a
cross of six unit squares. So it has been consider that when the hypercube is unfolded, it forms a cross of eight

A. CUCAKOVIC ET AL.: SHADOW SHAPES OF METAMORPHOSES HYPERCUBE
394 THE 5TH ICGG CONFERENCE MONGEOMETRIJA 2016 PROCEEDINGS Belgrade: 23-26 June 2016
unit cubes. The painting "Crucifixion (Corpus Hypercubus)" (Fig. 11), by Salvador Dalí, 1954, depicts the
crucified Jesus upon the net of a hypercube. It is featured to collection at the Metropolitan Museum of Art in
New York. Here, we see that the central cube is surrounded by six cubes, one for each side, plus a subtended
eighth cube. However, this type of hyper-cross is comprised of eight unit cubes, while the flat cross formed by
the unfolded 3D cube is only comprised of six unit squares.
Figure.12: The painting "Crucifixion (Corpus Hypercubus)" (Source: http://www.metmuseum.org/art/collection/search/488880)
Another type of hypercross can be formed without the subtended eighth cube. Like the unfolded 3D cube, it has
six cube sides around each side.This type of hypercross should not be misunderstood as lacking the eighth
subtended cube. However, the eighth cube is simply hidden within this form of the hypercross, between the six
surrounding cubes and the central seventh. It is what is known as an "impossible" cube. This type of impossible
cube was discovered, along with a similar impossible triangle, in the 20th century by mathematician Roger
Penrose. Such impossible shapes were then incorporated into the architectures depicted by Dutch artist Maurit
Cornelius Escher. This type of cube is called "impossible" because it cannot exist in 3D space, although it can be
depicted two dimensionally. Here is a wooden scultpure of the impossible cube. It is comprised of two separate
sculptures, one above and one below, and then photographed at an angle which allows them to appear as if they
were a single cohesive whole (Fig. 12).
Figure.13: A wooden scultpure of the impossible cube by Maurit Cornelius Escher
(Source: www.pinterest.com)

A. . CUCAKOVIC ET AL.: SHADOW SHAPES OF METAMORPHOSES HYPERCUBE
THE 5TH ICGG CONFERENCE MONGEOMETRIJA 2016 PROCEEDINGS Belgrade: 23-26 June 2016 395
4. CONCLUSION
As a representative of the 4D space in this paper it was used basic polyhedron 4D - hypercube. To generate
the hypercube, its metamorphosis, creating topological structure and finding the optimal thrown shadows
hypercube used descriptive methods, projective geometry and computer animation.
When we look at a cube, the closer parts will have larger images and the parts farther away will have
smaller ones. The front face of a cube will be larger than the back face. This '' square-within-a-square'' is a
familiar representation of our view of a cube in front of one plane. Images of vertical and horizontal edges
appear as vertical or horizontal segments, but the edges heading away from us appear to converge toward the
centre. The closest and farthest faces appear to be squares and the images of other four faces are trapezoids. As
we well know that the six faces of a cube are squares of the same size and shape, even though they don't appear
that way in any single view.
To get a better perception of the cube, we could look a whole sequence of views as we walk around the
cube, or equivalently, as observer stand still and the cube spins about vertical axis. As the cube begins to spin,
the images of vertical lines remain vertical, but the previously horizontal and parallel segments now have images
lying on lines that converge to a point. At this stage, the images of the top and bottom squares are not even
trapezoids since no two edges have parallel images.
As the cube continues to rotate, the trapezoidal image of one of the vertical faces appears to flatten out into
a vertical segment and then to open again into trapezoid. The image appears to pass through itself as the inner
and outer squares change places. The same phenomenon occurs if we rotate the cube about horizontal axis.
Perspective always causes some distortion, but we are able to accommodate the distortions by relying
subconsciously on our experiences of the perceived objects. When we see a rotating cube, we think about cube,
not varying sequence of squares, trapezoids, and more complicated four-sided figures.
Analogous to the perspective views of a cube, it could be imagined a sequence of perspective views of
hypercube in 3D space. Just as a cube appears to be a square within a square when viewed from directly in front,
the front - view of the hypercube will appear to be a cube within a cube. The closest part of the hypercube will
appear as a large cube, and the part farthest away will appear to be a smaller cube inside the lager one. In 3D
case, the images of four edges of cube join vertices of outer square to corresponding vertices of the inner square
to front four trapezoids. In 4D case the images of 8 edges of a hypercube will join vertices of the outer cube to
corresponding vertices of the inner cube, thus forming six incomplete pyramids. This central projection is one of
the most popular representation of the hypercube.
The animation has been done for general position of the hypercube that moving or rotating and changing its
form and the respective positions of the light source-reflector. Animation of the hypercube is done in the
animation studio “Lunema”. The process of the animation enabled visualization of the metamorphosis 3D
models of the hypercube and the changing shape of its shadow on the plane.
Direction of further research could be connected to the other five convex regular 4D polytopes.
ACKNOWLEDGMENT
Authors are supported by the Ministry of Education, Science and Technological Development of the
Republic of Serbia, Project No. TP 36008.
REFERENCES
1. Banchoff T., Beyond the third dimension, Scientific American Library, New York (1990)
2. Barlow Gee J., Basic Metaphysics, www.benpadiah.com/basic_intro.html , (2003)

A. CUCAKOVIC ET AL.: SHADOW SHAPES OF METAMORPHOSES HYPERCUBE
396 THE 5TH ICGG CONFERENCE MONGEOMETRIJA 2016 PROCEEDINGS Belgrade: 23-26 June 2016
3. Cucaković A., Nestorović M., Jović B., 4D space geometry,14th ICGG, 4-8 AUG 2010. KYOTO,
JAPAN.
4. Cucakovic, A., Nestorovic, M,. Jovic, B., Comparing, Visualization and Relation Overview of 3D
and 4D Geometrical Space, Applied Geometry and Graphics, The Interdepartmental Collection of
Proceedings 2009 Kiev, ISUE No 82, p. 137-142, 28. September - 2. October 2009. - Crimea, Sudak,
Ukraina
5. Cucakovic A., Teofilovic N., Jovic B., Geometrijska edukacija primenom principa i alata 3D
animacije, Ahitektonski fakultet Univerziteta u Beogradu (2012)
6. Jovic B., Geometrijska edukacija na polju vizualizacije i eksperimentalnog dizajna primenom
virtuelnih tehnologija, Arhitektonski fakultet Univerziteta u Beogradu (2012)
7. Katunin A., Visualization of Fractals Based on Regular Convex Polychora, Journal for Geometry and
Graphics Volume 19, No. 1, 1-11 (2015)
8. Robbin T., Shadows of Reality: The Fourth Dimension in Relativity, Cubism, and Modern Thought,
Yale University Press (2006)
9. Teofilovic N., Umetnost pokreta u prostoru praznine, Ahitektonski fakultet Univerziteta u Beogradu
(2011)
L. VÖRÖS: SPATIAL RECONSTRUCTION OF IMPOSSIBLE PICTURES
THE 5TH ICGG CONFERENCE ⏐ MONGEOMETRIJA 2016 ⏐ PROCEEDINGS ⏐ Belgrade: 23-26 June 2016 397
SPATIAL RECONSTRUCTION OF IMPOSSIBLE PICTURES
László Vörös
Department of Visual Studies, Faculty of Engineering and Information Technology, University of Pécs, Hungary
DLA, Associate Professor, [email protected]
ABSTRACT
The isometric, orthogonal axonometric projection of space-filling common cubes joins the planar tiling of regular triangles. Several works of art are created by the application of 2D images of cubes touching each other by faces. These appear to be, and often are, impossible to reconstruct in space. Spatial reconstructions of these pictures can be built with help of a special 3-dimensional model of the 6-dimensional cube and of lower dimensional parts derived from this. The above described projection of the elements joins also the net of regular triangles. The contribution presents the geometrical way how to transform these spatial shapes to get the same pictures by optional central projections. The effect can be enhanced by mirroring of the center point. A new AutoLisp routine can construct the folding pattern of each element and gives information about the order of assembling as well.
The presented topic is very suitable for workshops of architecture, design and artist students. The laws of the perspective, so the connection between mathematics and art, can be illustrated by special effects used in spectacular works of art.
Keywords: computer graphics; descriptive and applied geometry; hypercube; fine arts
INTRODUCTION
The Reuterswärd-Penrose triangle and the Penrose staircase form the geometrical foundation of impossible pictures of M. C. Escher. These shapes, and several works of art, are created by the application of 2D images of cubes touching each other on their faces. Well known examples include the works of Victor Vasarely and also Tamás F. Farkas [2-3, 6-9]. These seem to be impossible, and often are impossible to reconstruct in space. It is possible to build spatial reconstructions of the above works of art by using a special 3-dimensional model of the 6-dimensional cube and of lower dimensional parts derived from it.
2. THE APPLIED HYPERCUBE MODEL
2.1. Zonotope Models of Hyper Cubes
Any k segments with a common vertex can be the initial edges of the k-dimensional cube (further on k-cube) modelled in the three-dimensional space (3-model). From these the 3-models or also their polyhedral surfaces can be generated by the well known procedure. That is by moving the lower-dimensional elements along edges parallel with the direction of the next dimension [5]. Thus each polyhedron will become a zonotope [1, 4] i.e. a ‘translational sum’ of some segments (Minkowski-type sum) [5]. The model will be centrally symmetric and its faces have edges in even number. The opposite edges are parallel with each other.
2.2. The Special 3-model of the 6-cube
Lifting the vertices of a k-sided regular polygon from their plane perpendicularly to the same height and connecting them with the centre of the polygon, the so got segments can be the initial edges of a special 3-model of the k-cube (Figure 1a). This model is central and rotational symmetric like the common cube. (If k=6, the initial edges can be gained also from those of two common cubes with coinciding diagonals. One of them must be rotated 60 degrees around the diagonal as it is showed in Figure 1b.) In Figure 2 can be seen, how many differently shaped and oriented images can have the special 3-models of the lower dimensional parts of the 6-cube. The isometric, orthogonal axonometric projection of the special 3-model of the 6-cube and of the derived lower-dimensional parts join a network of regular triangles (Figure 3) like the same projection of common cubes and its faces, i.e. 2-dimensional parts.
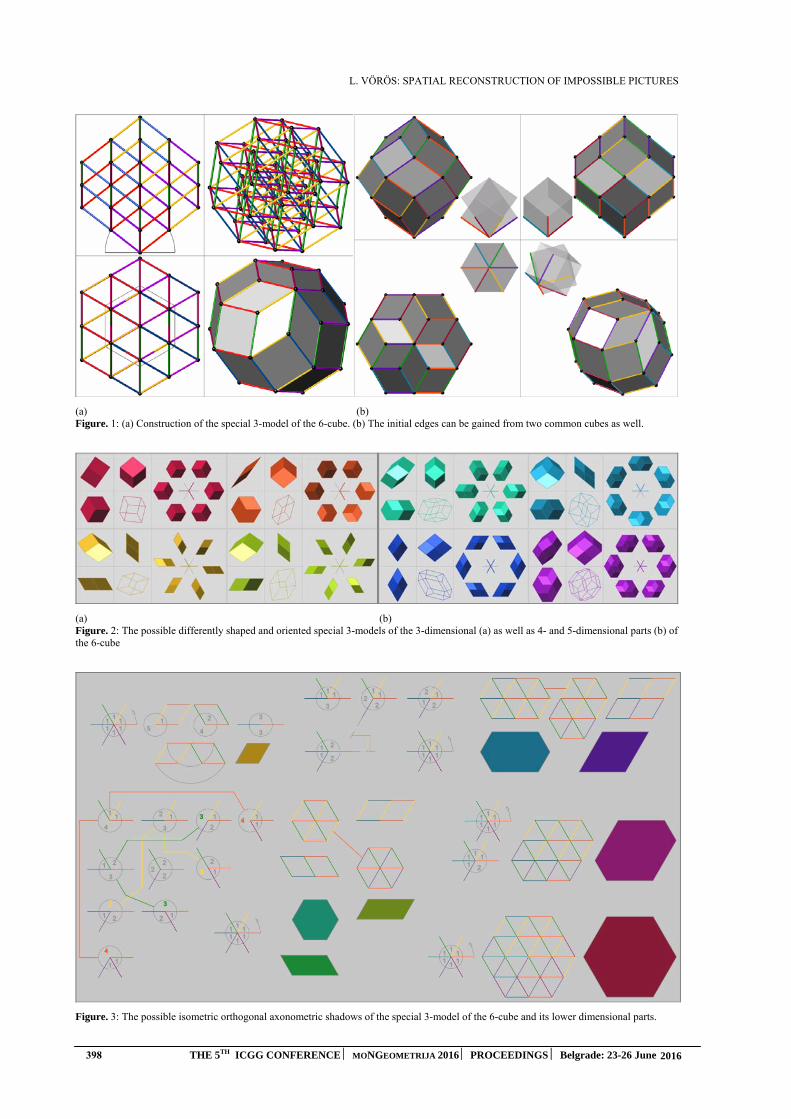
L. VÖRÖS: SPATIAL RECONSTRUCTION OF IMPOSSIBLE PICTURES
398 THE 5TH ICGG CONFERENCE ⏐ MONGEOMETRIJA 2016 ⏐ PROCEEDINGS ⏐ Belgrade: 23-26 June 2016
(a) (b) Figure. 1: (a) Construction of the special 3-model of the 6-cube. (b) The initial edges can be gained from two common cubes as well.
(a) (b) Figure. 2: The possible differently shaped and oriented special 3-models of the 3-dimensional (a) as well as 4- and 5-dimensional parts (b) of the 6-cube
Figure. 3: The possible isometric orthogonal axonometric shadows of the special 3-model of the 6-cube and its lower dimensional parts.
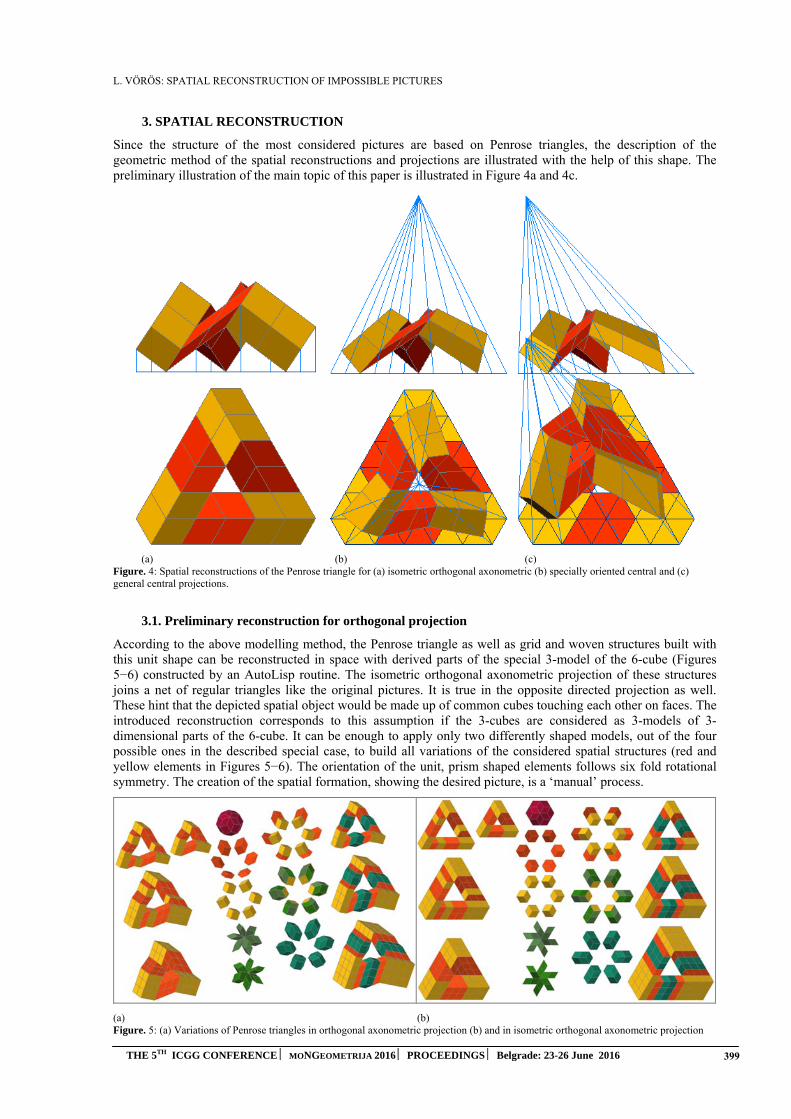
L. VÖRÖS: SPATIAL RECONSTRUCTION OF IMPOSSIBLE PICTURES
THE 5TH ICGG CONFERENCE ⏐ MONGEOMETRIJA 2016 ⏐ PROCEEDINGS ⏐ Belgrade: 23-26 June 2016 399
3. SPATIAL RECONSTRUCTION
Since the structure of the most considered pictures are based on Penrose triangles, the description of the geometric method of the spatial reconstructions and projections are illustrated with the help of this shape. The preliminary illustration of the main topic of this paper is illustrated in Figure 4a and 4c.
(a) (b) (c) Figure. 4: Spatial reconstructions of the Penrose triangle for (a) isometric orthogonal axonometric (b) specially oriented central and (c) general central projections.
3.1. Preliminary reconstruction for orthogonal projection
According to the above modelling method, the Penrose triangle as well as grid and woven structures built with this unit shape can be reconstructed in space with derived parts of the special 3-model of the 6-cube (Figures 5−6) constructed by an AutoLisp routine. The isometric orthogonal axonometric projection of these structures joins a net of regular triangles like the original pictures. It is true in the opposite directed projection as well. These hint that the depicted spatial object would be made up of common cubes touching each other on faces. The introduced reconstruction corresponds to this assumption if the 3-cubes are considered as 3-models of 3-dimensional parts of the 6-cube. It can be enough to apply only two differently shaped models, out of the four possible ones in the described special case, to build all variations of the considered spatial structures (red and yellow elements in Figures 5−6). The orientation of the unit, prism shaped elements follows six fold rotational symmetry. The creation of the spatial formation, showing the desired picture, is a ‘manual’ process.
(a) (b) Figure. 5: (a) Variations of Penrose triangles in orthogonal axonometric projection (b) and in isometric orthogonal axonometric projection
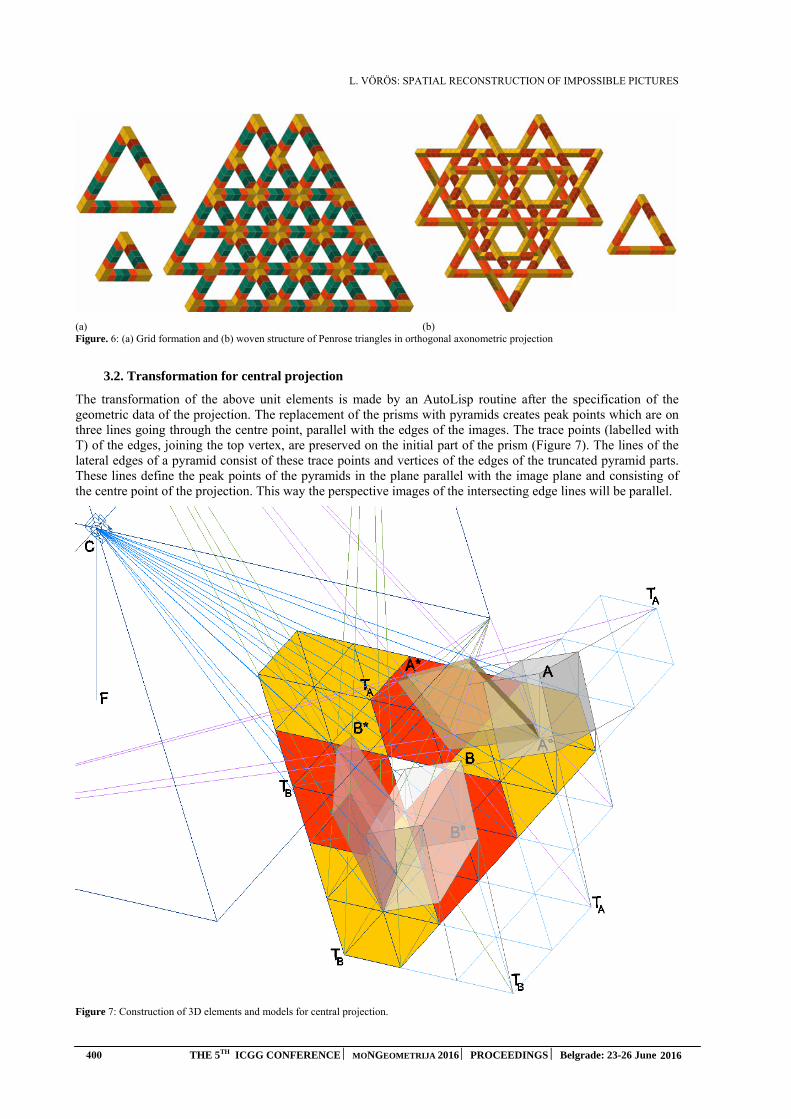
L. VÖRÖS: SPATIAL RECONSTRUCTION OF IMPOSSIBLE PICTURES
400 THE 5TH ICGG CONFERENCE ⏐ MONGEOMETRIJA 2016 ⏐ PROCEEDINGS ⏐ Belgrade: 23-26 June 2016
(a) (b) Figure. 6: (a) Grid formation and (b) woven structure of Penrose triangles in orthogonal axonometric projection
3.2. Transformation for central projection
The transformation of the above unit elements is made by an AutoLisp routine after the specification of the geometric data of the projection. The replacement of the prisms with pyramids creates peak points which are on three lines going through the centre point, parallel with the edges of the images. The trace points (labelled with T) of the edges, joining the top vertex, are preserved on the initial part of the prism (Figure 7). The lines of thelateral edges of a pyramid consist of these trace points and vertices of the edges of the truncated pyramid parts. These lines define the peak points of the pyramids in the plane parallel with the image plane and consisting of the centre point of the projection. This way the perspective images of the intersecting edge lines will be parallel.
Figure 7: Construction of 3D elements and models for central projection.
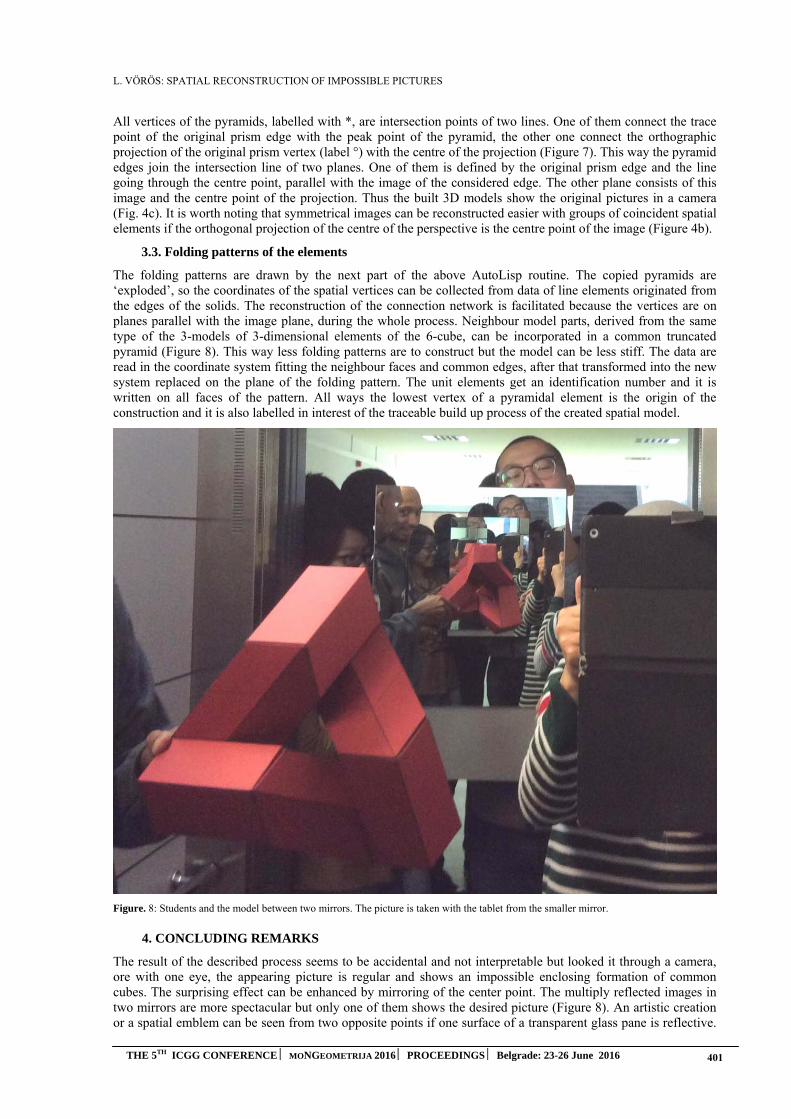
L. VÖRÖS: SPATIAL RECONSTRUCTION OF IMPOSSIBLE PICTURES
THE 5TH ICGG CONFERENCE ⏐ MONGEOMETRIJA 2016 ⏐ PROCEEDINGS ⏐ Belgrade: 23-26 June 2016 401
All vertices of the pyramids, labelled with *, are intersection points of two lines. One of them connect the trace point of the original prism edge with the peak point of the pyramid, the other one connect the orthographic projection of the original prism vertex (label °) with the centre of the projection (Figure 7). This way the pyramid edges join the intersection line of two planes. One of them is defined by the original prism edge and the line going through the centre point, parallel with the image of the considered edge. The other plane consists of this image and the centre point of the projection. Thus the built 3D models show the original pictures in a camera (Fig. 4c). It is worth noting that symmetrical images can be reconstructed easier with groups of coincident spatial elements if the orthogonal projection of the centre of the perspective is the centre point of the image (Figure 4b).
3.3. Folding patterns of the elements
The folding patterns are drawn by the next part of the above AutoLisp routine. The copied pyramids are ‘exploded’, so the coordinates of the spatial vertices can be collected from data of line elements originated from the edges of the solids. The reconstruction of the connection network is facilitated because the vertices are on planes parallel with the image plane, during the whole process. Neighbour model parts, derived from the same type of the 3-models of 3-dimensional elements of the 6-cube, can be incorporated in a common truncated pyramid (Figure 8). This way less folding patterns are to construct but the model can be less stiff. The data are read in the coordinate system fitting the neighbour faces and common edges, after that transformed into the new system replaced on the plane of the folding pattern. The unit elements get an identification number and it is written on all faces of the pattern. All ways the lowest vertex of a pyramidal element is the origin of the construction and it is also labelled in interest of the traceable build up process of the created spatial model.
Figure. 8: Students and the model between two mirrors. The picture is taken with the tablet from the smaller mirror.
4. CONCLUDING REMARKS
The result of the described process seems to be accidental and not interpretable but looked it through a camera, ore with one eye, the appearing picture is regular and shows an impossible enclosing formation of common cubes. The surprising effect can be enhanced by mirroring of the center point. The multiply reflected images in two mirrors are more spectacular but only one of them shows the desired picture (Figure 8). An artistic creation or a spatial emblem can be seen from two opposite points if one surface of a transparent glass pane is reflective.

L. VÖRÖS: SPATIAL RECONSTRUCTION OF IMPOSSIBLE PICTURES
402 THE 5TH ICGG CONFERENCE ⏐ MONGEOMETRIJA 2016 ⏐ PROCEEDINGS ⏐ Belgrade: 23-26 June 2016
This phenomenon could be applied in architectural spaces but also different parts of representative buildings could have these special shapes if those can be seen from large distance.
The presented topic is very suitable for workshops of architecture, design and artist students. The laws of the perspective, so the connection between mathematics and art, can be explained and illustrated by special effects used in spectacular works of art created with common work. It requires simple tools but sophisticated planning process and provides complex knowledge.
The creation of the constructions and figures for the described models and for this paper was aided by the AutoCAD program and AutoLisp routines, latter is developed by the Author.
REFERENCES
1. Coxeter, H.S.M., 1973. Regular Polytopes. Third edition. Dover
2. Darvas, Gy., 2006. The Art of Tamás F. Farkas. KoG, Vol. 10. No. 10., p. 53.
http://www.hdgg.hr/kog/
3. F. Farkas T., 2010. Impossible Ornaments. In Proceedings of Conference Bridges Pécs, pp. 513-514.
4. Towle R., 2008. Zonotopes, symmetrical-structures, http://zonotopia.blogspot.com [Accessed:30st February 2015].
5. Vörös, L., 2006. Two- and Three-dimensional Tilings Based on a Model of the Six-dimensionalCube. KoG, Vol. 10. No. 10., pp. 19-25.
http://www.hdgg.hr/kog/
6. Vörös, L., 2011. Art in Shadows of the Six-Dimensional Cube. In Proceedings of ConferenceBridges Coimbra, pp. 257-262.
7. Vörös, L., 2012. Art in shadow of the Six-dimensional Cube. In Experience-centered Approachand Visuality in the Education of Mathematics and Physics, Kaposvári Egyetem, pp. 231-234.
ISBN 978-963-9821-52-1
8. Vörös, L., 2012. Variations of Spatial Reconstructions for a Planned Picture of Tamás F. Farkas.In Abstracts of GeoGra Conference, SZIE YMÉK Budapest.
http://www.asz.ymmf.hu/geogra/en/reglist
9. Vörös, L., 2015. Spatial Reconstructions of Pictures Based on Penrose Shapes. In Proceedings ofConference Aplimat, Bratislava, pp. 761-766.

C. MÂRZA ET AL.: STUDY REGARDING THE GEOMETRY OF SOME CONNECTING PIECES FOR CIRCULAR DUCTS
THE 5TH ICGG CONFERENCE MONGEOMETRIJA 2016 PROCEEDINGS Belgrade: 23-26 June 2016 403
STUDY REGARDING THE GEOMETRY OF SOME CONNECTING PIECES FOR CIRCULAR DUCTS
Carmen Mârza
Department of Building Services Engineering, Technical University of Cluj Napoca, Cluj Napoca, Romania PhD., Associate Professor, [email protected]
Georgiana Corsiuc
Department of Building Services Engineering, Technical University of Cluj Napoca, Cluj Napoca, Romania PhD., Assistant, [email protected]
ABSTRACT
In this paper the authors aim to make a presentation and an analysis of the geometry of some component parts that changes the direction of the fluids transportation imposed by the route of the pipes. Since ventilation and air conditioning installations involve large dimensions, they require a more extended study. Some case studies were conducted for ducts having circular cross section, which represents technical applications of the cylindrical and conical surfaces geometry. In practice we are interested in issues related to the implementation of patterns, which involves knowledge related to plane sections, developments and intersections of these surfaces. A case that has advantages in terms of achieving airtight junctions results by sectioning the ducts about antiparallel sections. The authors make a graphical study - by using the methods of descriptive geometry, as well as an analytical study, required for the design of computational programs, that allow afterwards the production of these components with a high degree of accuracy and also in a shorter period of time.
Keywords: ventilation ducts; connecting pieces; cylindrical surface; conical surface; circular section; antiparallel sections; developments, patterns.
1. INTRODUCTION
With the development and industrialization of society, naturally, it appeared a new trend in architecture which belongs to the post-modern style, namely high tech architecture, also called structural or technological expressionism, because it corresponds to the expressionism in arts. This trend had as support for the implementation, the discovery of some materials with outstanding structural performance, advanced technologies as well as the opportunity of modelling the structures on computer.
Structural expressionism is characterized by straight lines and right angles, through linear cuts or through circular shapes and simple curves. The impression it creates is of slight austerity, simplicity and functionality. The "cold" feature is due to the used materials and colors [3].
A part of society has looked critically and skeptically this direction, but in the end it imposed because it responds to the needs and expectations of contemporary men, who become pragmatic and efficient. We can say that high tech architecture is urban, sophisticated and artificial.
An emblematic building of this style, which was built in the 70’s of the last century was the center Georges Pompidou in Paris, designed by the architects Renzo Piano, Richard Rogers and Gianfranco Franchini. It must also mention the names of other architects who have been identified with this style by worldwide known works, such as Norman Foster and Santiago Calatrava. This style is well suited to buildings for offices, exhibition spaces, air station, show-rooms, but in the end it was extended to residential buildings.
In previous architectural styles any kind of installations were made buried or concealed. This way of assembling was eligible for classic styles, where the utilities had a limited role. With the increasing demands of the occupants on habitat conditions - generally or to the microclimate - particularly, the installations gained a key role and increased their role in a building. Implicitly the space allocated to them increased. Thus, masking with false ceilings or achievement of special technical spaces has become a costly choice, as it diminished the usable
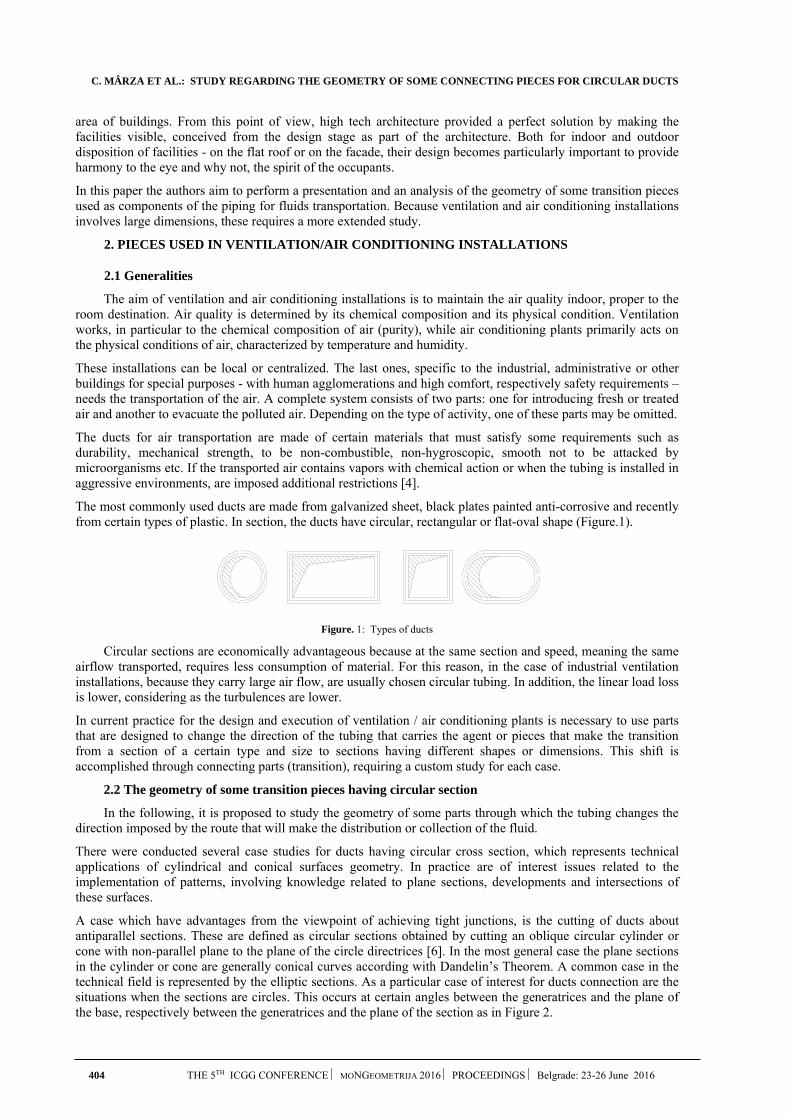
C. MÂRZA ET AL.: STUDY REGARDING THE GEOMETRY OF SOME CONNECTING PIECES FOR CIRCULAR DUCTS
404 THE 5TH ICGG CONFERENCE MONGEOMETRIJA 2016 PROCEEDINGS Belgrade: 23-26 June 2016
area of buildings. From this point of view, high tech architecture provided a perfect solution by making the facilities visible, conceived from the design stage as part of the architecture. Both for indoor and outdoor disposition of facilities - on the flat roof or on the facade, their design becomes particularly important to provide harmony to the eye and why not, the spirit of the occupants.
In this paper the authors aim to perform a presentation and an analysis of the geometry of some transition pieces used as components of the piping for fluids transportation. Because ventilation and air conditioning installations involves large dimensions, these requires a more extended study.
2. PIECES USED IN VENTILATION/AIR CONDITIONING INSTALLATIONS
2.1 Generalities
The aim of ventilation and air conditioning installations is to maintain the air quality indoor, proper to the room destination. Air quality is determined by its chemical composition and its physical condition. Ventilation works, in particular to the chemical composition of air (purity), while air conditioning plants primarily acts on the physical conditions of air, characterized by temperature and humidity.
These installations can be local or centralized. The last ones, specific to the industrial, administrative or other buildings for special purposes - with human agglomerations and high comfort, respectively safety requirements – needs the transportation of the air. A complete system consists of two parts: one for introducing fresh or treated air and another to evacuate the polluted air. Depending on the type of activity, one of these parts may be omitted.
The ducts for air transportation are made of certain materials that must satisfy some requirements such as durability, mechanical strength, to be non-combustible, non-hygroscopic, smooth not to be attacked by microorganisms etc. If the transported air contains vapors with chemical action or when the tubing is installed in aggressive environments, are imposed additional restrictions [4].
The most commonly used ducts are made from galvanized sheet, black plates painted anti-corrosive and recently from certain types of plastic. In section, the ducts have circular, rectangular or flat-oval shape (Figure.1).
Figure. 1: Types of ducts
Circular sections are economically advantageous because at the same section and speed, meaning the same airflow transported, requires less consumption of material. For this reason, in the case of industrial ventilation installations, because they carry large air flow, are usually chosen circular tubing. In addition, the linear load loss is lower, considering as the turbulences are lower.
In current practice for the design and execution of ventilation / air conditioning plants is necessary to use parts that are designed to change the direction of the tubing that carries the agent or pieces that make the transition from a section of a certain type and size to sections having different shapes or dimensions. This shift is accomplished through connecting parts (transition), requiring a custom study for each case.
2.2 The geometry of some transition pieces having circular section
In the following, it is proposed to study the geometry of some parts through which the tubing changes the direction imposed by the route that will make the distribution or collection of the fluid.
There were conducted several case studies for ducts having circular cross section, which represents technical applications of cylindrical and conical surfaces geometry. In practice are of interest issues related to the implementation of patterns, involving knowledge related to plane sections, developments and intersections of these surfaces.
A case which have advantages from the viewpoint of achieving tight junctions, is the cutting of ducts about antiparallel sections. These are defined as circular sections obtained by cutting an oblique circular cylinder or cone with non-parallel plane to the plane of the circle directrices [6]. In the most general case the plane sections in the cylinder or cone are generally conical curves according with Dandelin’s Theorem. A common case in the technical field is represented by the elliptic sections. As a particular case of interest for ducts connection are the situations when the sections are circles. This occurs at certain angles between the generatrices and the plane of the base, respectively between the generatrices and the plane of the section as in Figure 2.
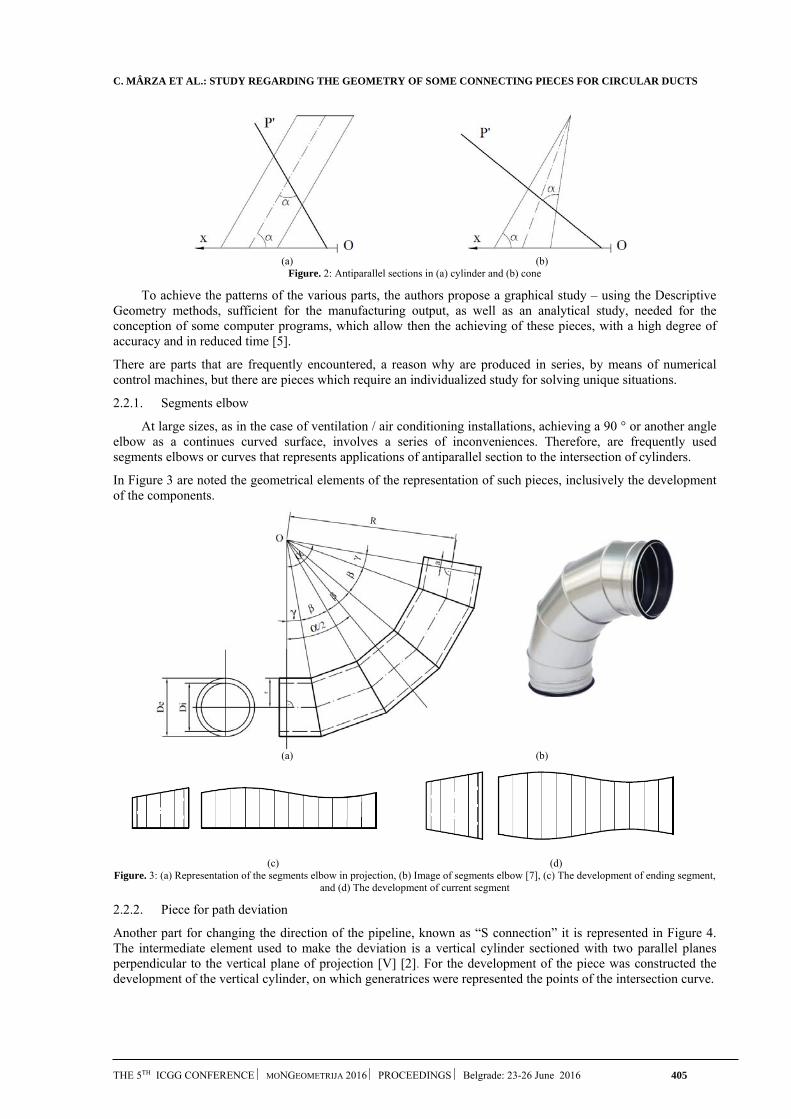
C. MÂRZA ET AL.: STUDY REGARDING THE GEOMETRY OF SOME CONNECTING PIECES FOR CIRCULAR DUCTS
THE 5TH ICGG CONFERENCE MONGEOMETRIJA 2016 PROCEEDINGS Belgrade: 23-26 June 2016 405
(a) (b)
Figure. 2: Antiparallel sections in (a) cylinder and (b) cone
To achieve the patterns of the various parts, the authors propose a graphical study – using the Descriptive Geometry methods, sufficient for the manufacturing output, as well as an analytical study, needed for the conception of some computer programs, which allow then the achieving of these pieces, with a high degree of accuracy and in reduced time [5].
There are parts that are frequently encountered, a reason why are produced in series, by means of numerical control machines, but there are pieces which require an individualized study for solving unique situations.
2.2.1. Segments elbow
At large sizes, as in the case of ventilation / air conditioning installations, achieving a 90 ° or another angle elbow as a continues curved surface, involves a series of inconveniences. Therefore, are frequently used segments elbows or curves that represents applications of antiparallel section to the intersection of cylinders.
In Figure 3 are noted the geometrical elements of the representation of such pieces, inclusively the development of the components.
(a) (b)
(c) (d)
Figure. 3: (a) Representation of the segments elbow in projection, (b) Image of segments elbow [7], (c) The development of ending segment, and (d) The development of current segment
2.2.2. Piece for path deviation
Another part for changing the direction of the pipeline, known as “S connection” it is represented in Figure 4. The intermediate element used to make the deviation is a vertical cylinder sectioned with two parallel planes perpendicular to the vertical plane of projection [V] [2]. For the development of the piece was constructed the development of the vertical cylinder, on which generatrices were represented the points of the intersection curve.
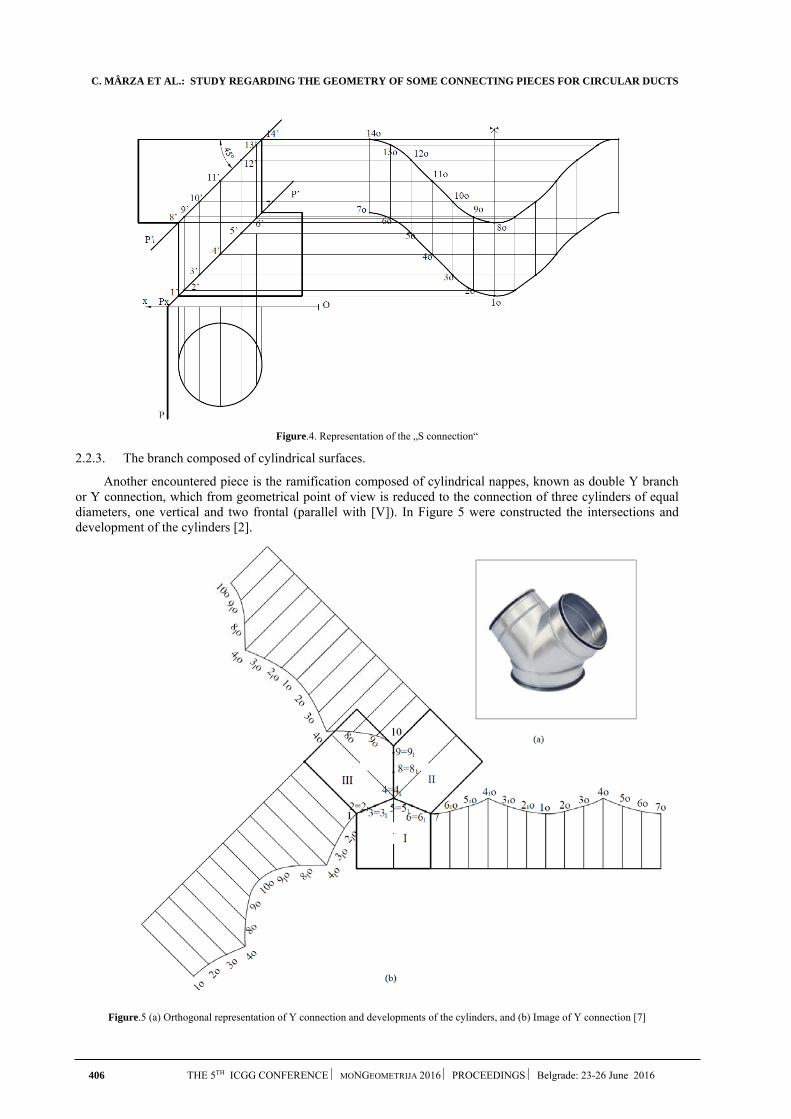
C. MÂRZA ET AL.: STUDY REGARDING THE GEOMETRY OF SOME CONNECTING PIECES FOR CIRCULAR DUCTS
406 THE 5TH ICGG CONFERENCE MONGEOMETRIJA 2016 PROCEEDINGS Belgrade: 23-26 June 2016
Figure.4. Representation of the „S connection“
2.2.3. The branch composed of cylindrical surfaces.
Another encountered piece is the ramification composed of cylindrical nappes, known as double Y branch or Y connection, which from geometrical point of view is reduced to the connection of three cylinders of equal diameters, one vertical and two frontal (parallel with [V]). In Figure 5 were constructed the intersections and development of the cylinders [2].
Figure.5 (a) Orthogonal representation of Y connection and developments of the cylinders, and (b) Image of Y connection [7]
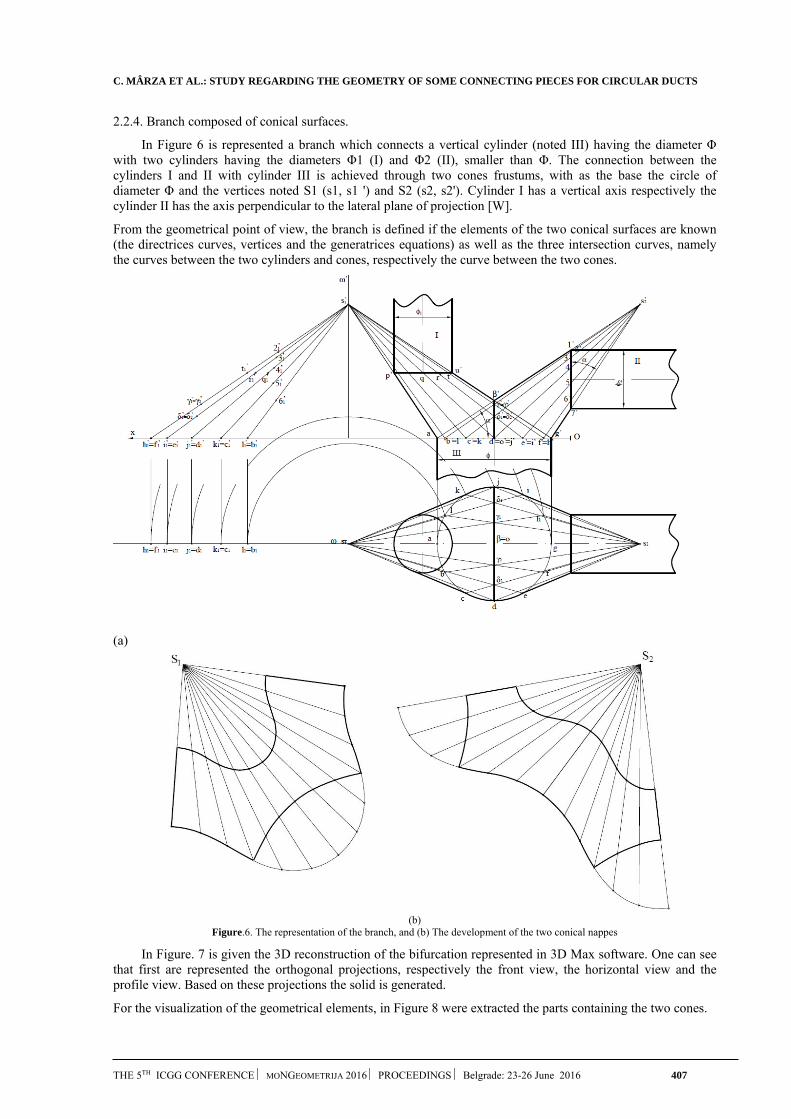
C. MÂRZA ET AL.: STUDY REGARDING THE GEOMETRY OF SOME CONNECTING PIECES FOR CIRCULAR DUCTS
THE 5TH ICGG CONFERENCE MONGEOMETRIJA 2016 PROCEEDINGS Belgrade: 23-26 June 2016 407
2.2.4. Branch composed of conical surfaces.
In Figure 6 is represented a branch which connects a vertical cylinder (noted III) having the diameter Φ with two cylinders having the diameters Φ1 (I) and Φ2 (II), smaller than Φ. The connection between the cylinders I and II with cylinder III is achieved through two cones frustums, with as the base the circle of diameter Φ and the vertices noted S1 (s1, s1 ') and S2 (s2, s2'). Cylinder I has a vertical axis respectively the cylinder II has the axis perpendicular to the lateral plane of projection [W].
From the geometrical point of view, the branch is defined if the elements of the two conical surfaces are known (the directrices curves, vertices and the generatrices equations) as well as the three intersection curves, namely the curves between the two cylinders and cones, respectively the curve between the two cones.
(a)
(b)
Figure.6. The representation of the branch, and (b) The development of the two conical nappes
In Figure. 7 is given the 3D reconstruction of the bifurcation represented in 3D Max software. One can see that first are represented the orthogonal projections, respectively the front view, the horizontal view and the profile view. Based on these projections the solid is generated.
For the visualization of the geometrical elements, in Figure 8 were extracted the parts containing the two cones.
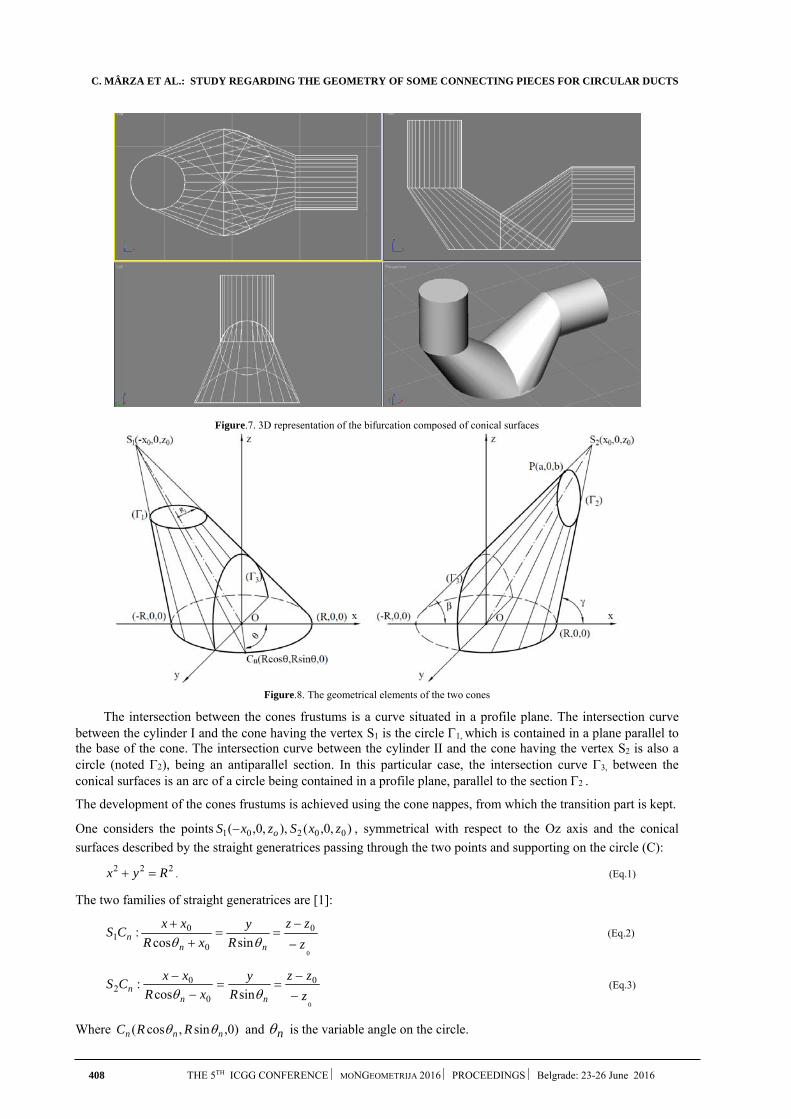
C. MÂRZA ET AL.: STUDY REGARDING THE GEOMETRY OF SOME CONNECTING PIECES FOR CIRCULAR DUCTS
408 THE 5TH ICGG CONFERENCE MONGEOMETRIJA 2016 PROCEEDINGS Belgrade: 23-26 June 2016
Figure.7. 3D representation of the bifurcation composed of conical surfaces
Figure.8. The geometrical elements of the two cones
The intersection between the cones frustums is a curve situated in a profile plane. The intersection curve between the cylinder I and the cone having the vertex S1 is the circle 1, which is contained in a plane parallel to the base of the cone. The intersection curve between the cylinder II and the cone having the vertex S2 is also a circle (noted ), being an antiparallel section. In this particular case, the intersection curve 3, between the conical surfaces is an arc of a circle being contained in a profile plane, parallel to the section .
The development of the cones frustums is achieved using the cone nappes, from which the transition part is kept.
One considers the points ),0,( ),,0,( 00201 zxSzxS o , symmetrical with respect to the Oz axis and the conical
surfaces described by the straight generatrices passing through the two points and supporting on the circle (C):
222 Ryx . (Eq.1)
The two families of straight generatrices are [1]:
0
0
0
01 sincos
:z
zz
R
y
xR
xxCS
nnn
(Eq.2)
0
0
0
02 sincos
:z
zz
R
y
xR
xxCS
nnn
(Eq.3)
Where )0,sin,cos( nnn RRC and n is the variable angle on the circle.

C. MÂRZA ET AL.: STUDY REGARDING THE GEOMETRY OF SOME CONNECTING PIECES FOR CIRCULAR DUCTS
THE 5TH ICGG CONFERENCE MONGEOMETRIJA 2016 PROCEEDINGS Belgrade: 23-26 June 2016 409
The coordinates of a point belonging to the curve 1 verify the equations [5]:
;)(
cos 101 R
RRxRx ii
(Eq.4)
;sin1 ii Ry (Eq.5)
;)( 10
2 R
RRzzzi
(Eq.6)
The coordinates of a point belonging to the curve 2 are given by the equations [5]:
)(cos
sin0
0
tg
bzxa
xR
Ry
i
i
, i=1,2,3,….,n; (Eq.7)
)cos(
)cos(
00
00
xRtgz
bzRatgzz
i
i
. (Eq.8)
The intersection curve 3 , between the conical surfaces verify the equations [5]:
;,...,2,1,cos
sin
0
0 njRx
Rxy
j
jj
(Eq.9)
]2,2
3[]
2,0[,
cos
cos
0
0
j
j
jj Rx
Rzz (Eq.10)
3. CONCLUSIONS
Considering the large size of the piping of ventilation and air conditioning installations, as well as their frequent use in buildings with high comfort requirements on air quality, it imposes a rigorous study on design and construction of the component elements. They must ensure the tightness of longitudinal and cross joints, to provide laminar flow of the agent, to be silent and aesthetic.
The attention of the authors was directed toward the circular section ducts, used with high incidence in industrial halls, commercial and exhibition buildings etc. One of the conditions of selecting the type of section is related to the available space for the fitting ducts.
In this paper were presented few pieces that change the direction of the agent route. The branch composed of conical surfaces was analysed both from graphically and analytically point of view. In the situations where the plotting and the execution of the development patterns of these pieces requires a high precision, it is necessary to use calculus algorithms which can be implemented on computer numerical control (CNC) machines.
REFERENCES
1. Berger, M., Geometry Revealed, A Jacob's Ladder to Modern Higher Geometry, Springer, 2010.
2. Gogu ,M., Olariu, F., Geometrie Descriptivă (Descriptive Geometry), Lito UTCN, Cluj Napoca, 1999.
3. Mârza, C., Duca, E., Corsiuc, G., Considerations regarding the geometrical construction of distributors/collectors equipment used in ventilation/air conditioning, Scientific Bulletin of the Politehnica University of Timisoara, Issue 2/2013 - Transactions on Hydrotechnics, pp 53-56.
4. Mârza C., Deac, A., Corsiuc G, Methods for representing the tubing of ventilation/air-conditioning plants, Journal of Industrial Design and Engineering Graphics, Volume 10, Special issue ICEGD, fascicle 2, June 2015, pp. 31-36.
5. Moncea J., Alămoreanu I., Desfășurarea suprafețelor (Development of surfaces), Editura Tehnică, Bucharest, 1975.
6. Moncea J., Geometrie descriptivă (Descriptive Geometry), Editura Didactică și Pedagogică, Bucharest, 1982.
7. *** http://www.stronghouse.ro/catalog_stronghouse_web.pdf [Accesed in 28 March 2016]
M. KOCEVSKI ET AL.: THE DESIGN PROCESS OF A MODERN MINER’S HELMET WITH INTEGRATION OF SAFETY NEEDS
THE 5TH ICGG CONFERENCE MONGEOMETRIJA 2016 PROCEEDINGS Belgrade: 23-26 June 2016 410
THE DESIGN PROCESS OF A MODERN MINER’S HELMET WITH INTEGRATION OF SAFETY NEEDS
Mihajlo Kocevski FX3X dooel Skopje, Macedonia
MSc., designer, [email protected]
Risto Tashevski Faculty of Mechanical Engineering, University “Ss. Cyril and Methodius” Skopje, Skopje, Republic of
Macedonia PhD., Professor, [email protected]
Tashko Rizov Faculty of Mechanical Engineering, University “Ss. Cyril and Methodius” Skopje, Skopje, Republic of
Macedonia PhD., Assistant Professor, [email protected]
Marijan Gavrilovski Faculty of Mechanical Engineering, University “Ss. Cyril and Methodius” Skopje, Skopje, Republic of
Macedonia PhD., Professor, [email protected]
ABSTRACT
This paper presents the design process of a modern helmet for miners that would be ideal for all workers who risk their lives every day in underground and surface mines to supply us the materials we need for our everyday life. The dangers that the miners face throughout their work time are chronologically explained, as well as the necessary preventive measures and the security measures needed for the achieved. Compared to the classic mining helmet only an impact protection and a lamp holding bracket is provided, the design of the helmet presented in this paper is based on
the method of integrating the needs of the miner. Through the available technology today pretty much everything is possible, so it is truly sad because significant improvements have been made in the mining branch while the protection of the miners is still at a bare minimum.
The exterior of the helmet is simple, with curved lines and is used to its maximum in order to integrate all the proper functions without ruining the esthetics. The interior of the helmet is designed to withstand an impact without allowing injury to happen. Besides the integrated functions such as the air filters and the option for attaching oxygen tanks, the helmet is still comfortable and it does not present a burden to be worn throughout the work.
Keywords: miner helmet, design process, protection at work, safety design.
M. KOCEVSKI ET AL.: THE DESIGN PROCESS OF A MODERN MINER’S HELMET WITH INTEGRATION OF SAFETY NEEDS
411 THE 5TH ICGG CONFERENCE MONGEOMETRIJA 2016 PROCEEDINGS Belgrade: 23-26 June 2016
1. DANGERS IN MINING
Miners are constantly exposed to dangers during their everyday work. The dangers are various and they differ according to the fact is the miner working in an underground or in a surface mine, the region in which the miner operates as well as the available technology (machines and tools) used in the process. Unfortunately, besides the significant improvement in the available technology, human health and security has remained on a basic level. For their protection miners are still using basic helmets, sometimes with build-in masks, and not a thing more for their further protection has been accepted.
1.1. Dangerous air articles
The most abundant compound in the Earth’s core is the free crystal silica which presents the most often air dust with which miners are in contact. The most probable form of the silica is quartz and it can be found as cristobalite and tridymite. The contents of silica in different types of ores vary, but even that is not a real indicator of the level of free silica that can be present in the air. It is not unusual to have presence of 30% of free silica dioxide in the ore and 10% in the air, or vice versa. Sand can contain up to 100% silica dioxide and granite can contain up to 40%.
After a longer exposure of a human organism to silica, silicosis might occur, which is a typical pneumoconiosis which is developed in years and without trace. Exposure to silica is often connected with increased risk of tuberculosis, lung cancer as well as some auto immune illnesses like sclerodermas, systematic lupus erythematosus and rheumatic arthritis.
Dust from coal presents a significant danger in the underground and surface mines. The composition of the dust varies depending on the type of coal that is excavated. The dust is created during explosions, drilling, cutting and transportation of the coal. The dust from coal can result in pneumoconiosis and it contributes to development of chronic illnesses like bronchitis and lung emphysema [1].
1.2. Dangerous gases and fumes
Most common toxic gasses that are present in the mines are methane and sulfurous dioxide (Table 1). The presence of these gasses results in deficit of oxygen. Methane is highly flammable. Most explosions in coal mines are result of ignited methane and are followed by even stronger explosions of the coal dust. Throughout the history of coal mining, fires and explosions have been the main cause for death of thousands of miners.
Table 1: The most toxic gases and their impact on health
Gas Used name Impact on health
Methane (CH4) Explosive gas Suffocation
Carbon monoxide (CO) White suffocate Chemical suffocation
Hydrogen sulfate (H2S) Lazy suffocate Nose irritation, eyes and throat; obstruction of the respiratory system
Lack of oxygen Black suffocate Anoxia
Explosion of product Consistent suffocate Irritation of the respiratory system
Exhaust from engines Exhaust gas Irritation of the respiratory system; lung cancer
1.3. Physical dangers
Noise is very much present in mining. It is created by the operation of the powerful machines, air-conditioning systems, explosions and transportation of ore. Exposure to noise in underground mines is significantly higher compared to surface mines. Noise can be reduced by using conventional means for noise control of the mining machines and with use of hearing protection equipment [1].
Ionizing radiation is dangerous in mining as well as in other industries. A free radon might be released from the ore by detonation or it might enter a mine through underground streams. A radon and decomposing products emit non-ionizing radiation, some of them having enough energy to cause cancer cells to lungs.

M. KOCEVSKI ET AL.: THE DESIGN PROCESS OF A MODERN MINER’S HELMET WITH INTEGRATION OF SAFETY NEEDS
THE 5TH ICGG CONFERENCE MONGEOMETRIJA 2016 PROCEEDINGS Belgrade: 23-26 June 2016 412
Heat presents danger in mines as well. In underground mines, main source of heat is the ore itself. The temperature of the ore is increased by 1°C for every 100m depth. Other sources of heat stress are the physical activity of the miners, circulation of air, surrounding temperature and moisture of air, as well as the heat generated by the mining equipment. The temperature can reach around 40°C in the deep mines (deeper than 1.000 m). Mains sources of heat in surface mines are the physical activity, proximity to hot engines, air temperature, moisture and sunlight. Reduction the heat stress can be achieved by introducing cooling devices, limiting the physical activity and providing adequate quantities of drinking water, protection from the sunlight and appropriate ventilation.
Drills can cause significant vibrations that can result in damage to the nerves in miner’s hands – vibration white finger. This symptom is noticed for the first time in mines in Japan, India and Canada.
2. PREVENTIVE MEASURES FOR PROTECTION
Head protection of the miner is necessary due to the potential for head injuries caused by mechanical or electrical nature, low temperature, heat radiation, dirt, radioactive radiation, wet and other. For protecting the miner’s head from mechanical injuries a helmet is used. Protective helmets must comply with the following requirements: to be durable on deformation and penetration, to be able to absorb impact and to be easy for maintenance. Depending on the use, they are produced from leather, phenol epoxy, polyamide, polyethylene, polyester etc. Helmets can be in form of a hat or a cap.
Plastic helmets are not suitable for high temperatures, but on the other hand are very light. Helmets from aluminium are more durable, easy for maintenance, deflect heat, but are permanently deformed on impact. Negative side of the aluminium helmets is the fact that they are conducting electricity.
For head protection from electrical current helmets made from materials that have the appropriate resilience are made.
For head protection only from heat radiation hoods from asbestos are used, or a combination of asbestos and aluminium foil. These hoods are often combined with a face protector and protection for neck and shoulders. For protecting the eyes of the miner cobalt glass is used. If in the mines beside the mechanical injures, danger from high temperature is present, then the protective helmets are made from thermo resistant material.
In a case where beside the mechanical injuries, the miner’s work is followed by low temperatures, the protective helmets should have additional parts that can be placed underneath the helmet. These parts are made out of cotton or wool fabrics, or leather with fur. If in the working conditions the protection from cold is primary, and there is no present possibility for mechanical injuries, then caps lined with fur are used.
Figure. 1: Standard protection for miners (Source: Environmental Protection Agency).
In wet working conditions, where beside the danger of mechanical injuries, there are possibilities for wetting the miner’s head, then helmets made from water resilient materials are used. In working conditions where rotating parts of machines can tangle upon the worker’s hair, protective caps, hoods, nets and scarfs are used.
Dirt and dust in the working environment can cause various skin conditions to the head of the miner. In order to prevent this, appropriate caps made from thick cotton fabric are used. They have to be easy to maintain. In
M. KOCEVSKI ET AL.: THE DESIGN PROCESS OF A MODERN MINER’S HELMET WITH INTEGRATION OF SAFETY NEEDS
413 THE 5TH ICGG CONFERENCE MONGEOMETRIJA 2016 PROCEEDINGS Belgrade: 23-26 June 2016
working conditions where radioactive radiation is present, the whole body of the miner is exposed to it, so specific protection equipment only for the head is not available. The protection comes in a form of an overall suit composed of protection for the body, head and face [3].
For protecting the eyes, in general various types of protective glasses are used. If danger to the face is present, the eyes protection equipment is always made in such a way that it covers the whole face.
Depending on the factors for eyes damage, different types of eye googles are produced, like: protective glasses with transparent glass – used in operations where danger of injuries to the eyes are possible from flying small particles, for example when filing, grinding, stirring etc.
When there is a danger to the eyes present from flying particles from the front and from the side, glasses with side protection are used. This is the case in operations like grinding, milling, wood grating or similar activities.
For protecting the eyes from eroding materials (ammonia, formaldehyde etc.) transparent triplex glasses with leak-proof frames are used.
For workers that operate with welding machines, in order to protect their head, neck and eyes of the direct and indirect effect of the ultraviolet and heat radiation, as well as from the flying particles special shields are used. They can be hand held or head mounted.
The protection of the hearing organs of miners is necessary due to the fact that the damage from noise is significant to the hearing organs and through them to the complete nerve system. Noise is defined as any non-desired sound with high intensity that causes uncomfortable hearing reaction. Noise today is produced as a result of the fast technological development of the industrial production, motor transportation and noise producing activities [5].
If the noise is constant during the working period, the working capability of the miner is decreased, the hearing organs are getting damaged and in certain level the nerve system is ruined. Due to that, the protection of the hearing is essential.
For those workplaces where noise that cannot be reduced with technical means below the allowed limit is present, workers must use appropriate protection equipment, like:
cotton for protection from noise level up to 75 dB ear plugs for protection for noise level up to 85 dB ear protection equipment for noise level up to 105 dB
Ear plugs cannot reduce the average value of the audibility for more than 15 dB. Also, the protection equipment should not irritate the ears and must provide that the noise will not surpass the allowed limit [1].
Beside the regular conditions that apply to all protective equipment (not to irritate skin, not to transfer paint and to be easy to maintain), the noise protective equipment should:
to damp noise efficiently to be comfortable their use should not result in physiologic or pathologic changes to the ear canal to only allow to pass sounds with low frequency
The ear plug is usually made in a form of an unformed or formed plug. The unformed plug is made out of material (bee wax, cotton or similar plastic material), formed according the ear canal of the user. The formed plug is made out of material that is not irritating for the skin, not easily fumbles and is bad in transmitting the sound oscillations. These plugs have pre-defined shape [6].
The ear protective equipment is consistent of two shells with elastic semi-circle holder. The shell is consisted of cushion and body of the shell, and the elastic semi-circle holder is consisted of two elastic strips formed according the shape of the head. The force with which the ear protective equipment is pushing upon the head should not be bigger than 10N (approx. 1kp) and the weight of the equipment should not be bigger than 0.4 kg [4].
Protection of the respiratory system. By breathing an exchange of gases is done between the organism and the environment. The goal of the respiratory system is to supply the necessary level of oxygen and to throw out carbon dioxide (CO2) which if present in increased level can cause suffocation and death.
Workers that work in polluted environment where fog, smoke, dust or anything similar is present (when concentration level is above allowed), appropriate equipment for protection of the worker breathing organs must be used.
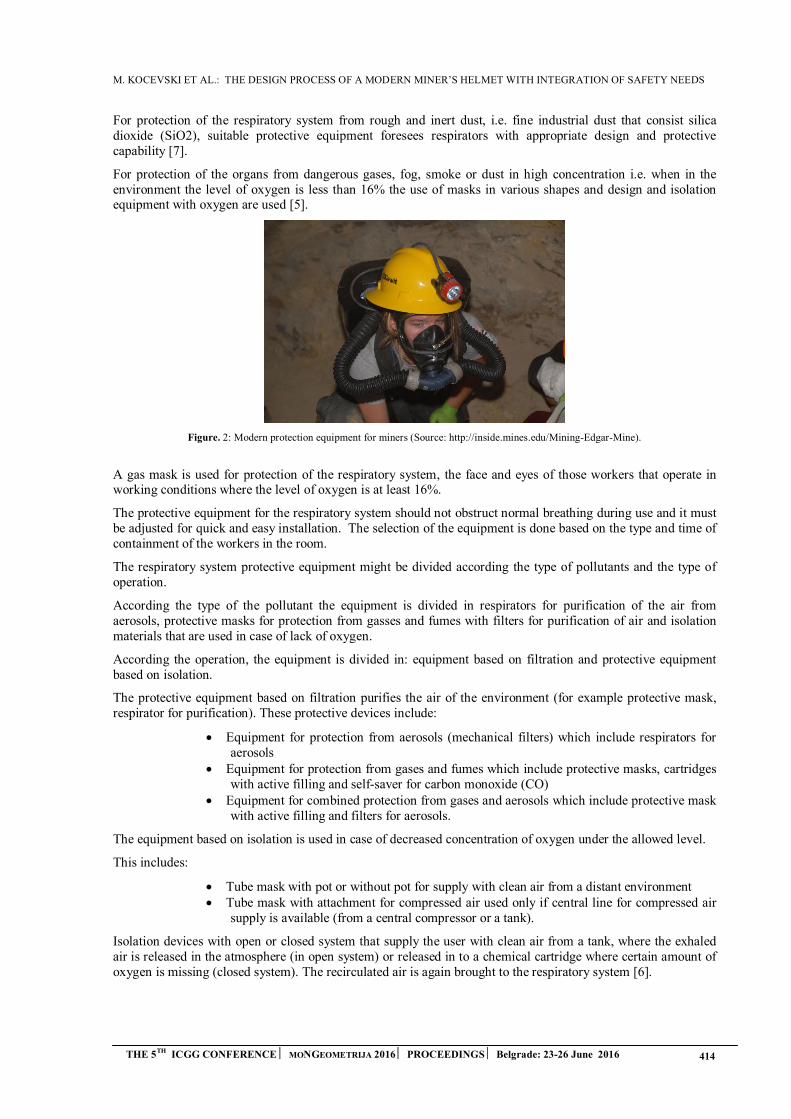
M. KOCEVSKI ET AL.: THE DESIGN PROCESS OF A MODERN MINER’S HELMET WITH INTEGRATION OF SAFETY NEEDS
THE 5TH ICGG CONFERENCE MONGEOMETRIJA 2016 PROCEEDINGS Belgrade: 23-26 June 2016 414
For protection of the respiratory system from rough and inert dust, i.e. fine industrial dust that consist silica dioxide (SiO2), suitable protective equipment foresees respirators with appropriate design and protective capability [7].
For protection of the organs from dangerous gases, fog, smoke or dust in high concentration i.e. when in the environment the level of oxygen is less than 16% the use of masks in various shapes and design and isolation equipment with oxygen are used [5].
Figure. 2: Modern protection equipment for miners (Source: http://inside.mines.edu/Mining-Edgar-Mine).
A gas mask is used for protection of the respiratory system, the face and eyes of those workers that operate in working conditions where the level of oxygen is at least 16%.
The protective equipment for the respiratory system should not obstruct normal breathing during use and it must be adjusted for quick and easy installation. The selection of the equipment is done based on the type and time of containment of the workers in the room.
The respiratory system protective equipment might be divided according the type of pollutants and the type of operation.
According the type of the pollutant the equipment is divided in respirators for purification of the air from aerosols, protective masks for protection from gasses and fumes with filters for purification of air and isolation materials that are used in case of lack of oxygen.
According the operation, the equipment is divided in: equipment based on filtration and protective equipment based on isolation.
The protective equipment based on filtration purifies the air of the environment (for example protective mask, respirator for purification). These protective devices include:
Equipment for protection from aerosols (mechanical filters) which include respirators foraerosols
Equipment for protection from gases and fumes which include protective masks, cartridgeswith active filling and self-saver for carbon monoxide (CO)
Equipment for combined protection from gases and aerosols which include protective maskwith active filling and filters for aerosols.
The equipment based on isolation is used in case of decreased concentration of oxygen under the allowed level.
This includes:
Tube mask with pot or without pot for supply with clean air from a distant environment Tube mask with attachment for compressed air used only if central line for compressed air
supply is available (from a central compressor or a tank).
Isolation devices with open or closed system that supply the user with clean air from a tank, where the exhaled air is released in the atmosphere (in open system) or released in to a chemical cartridge where certain amount of oxygen is missing (closed system). The recirculated air is again brought to the respiratory system [6].
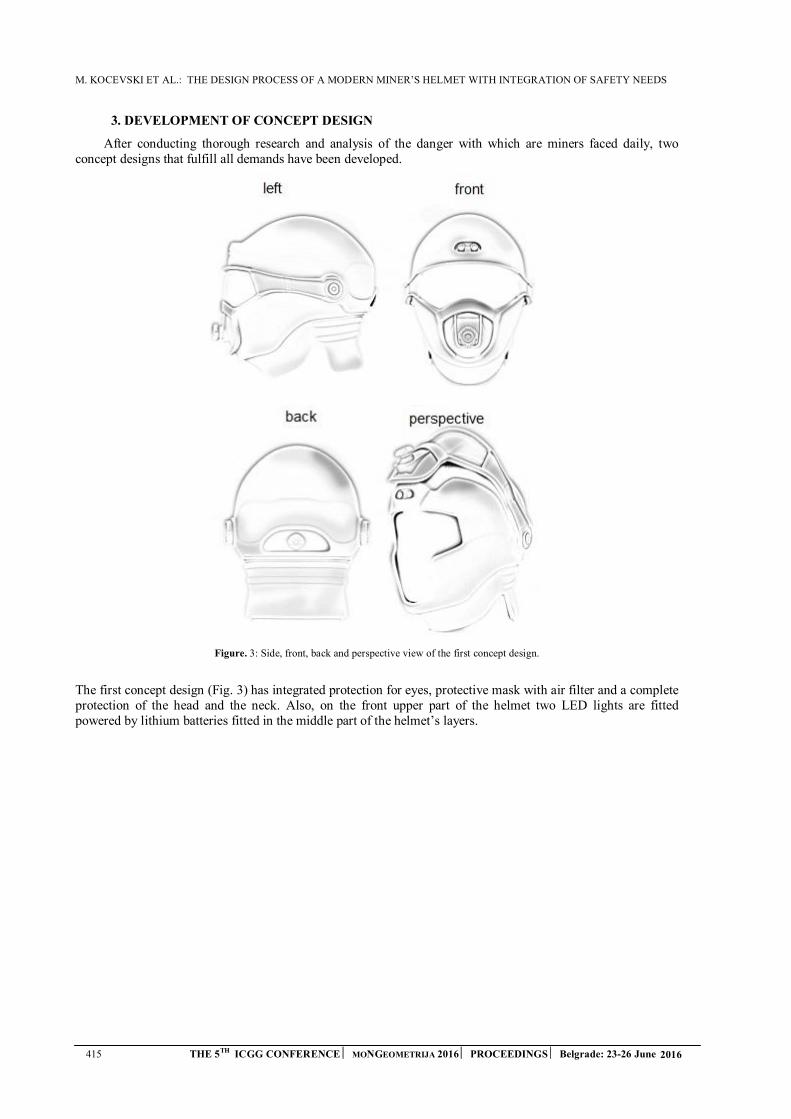
M. KOCEVSKI ET AL.: THE DESIGN PROCESS OF A MODERN MINER’S HELMET WITH INTEGRATION OF SAFETY NEEDS
415 THE 5TH ICGG CONFERENCE MONGEOMETRIJA 2016 PROCEEDINGS Belgrade: 23-26 June 2016
3. DEVELOPMENT OF CONCEPT DESIGN
After conducting thorough research and analysis of the danger with which are miners faced daily, two concept designs that fulfill all demands have been developed.
Figure. 3: Side, front, back and perspective view of the first concept design.
The first concept design (Fig. 3) has integrated protection for eyes, protective mask with air filter and a complete protection of the head and the neck. Also, on the front upper part of the helmet two LED lights are fitted powered by lithium batteries fitted in the middle part of the helmet’s layers.
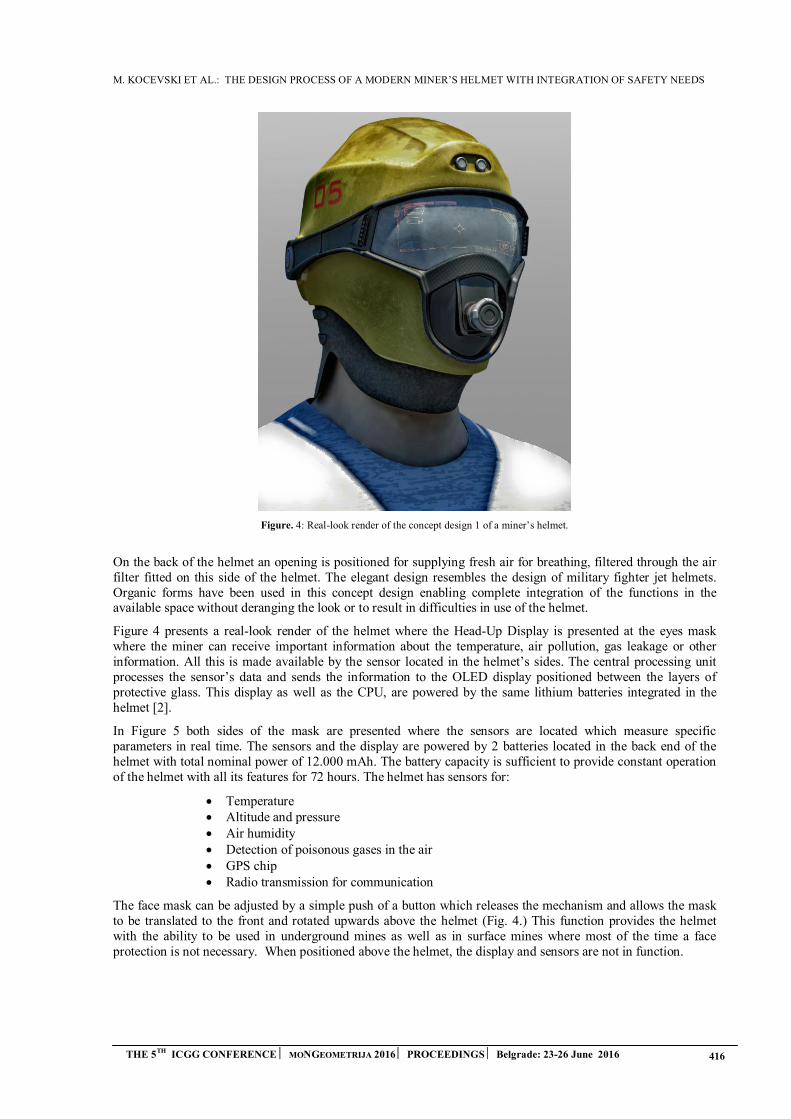
M. KOCEVSKI ET AL.: THE DESIGN PROCESS OF A MODERN MINER’S HELMET WITH INTEGRATION OF SAFETY NEEDS
THE 5TH ICGG CONFERENCE MONGEOMETRIJA 2016 PROCEEDINGS Belgrade: 23-26 June 2016 416
Figure. 4: Real-look render of the concept design 1 of a miner’s helmet.
On the back of the helmet an opening is positioned for supplying fresh air for breathing, filtered through the air filter fitted on this side of the helmet. The elegant design resembles the design of military fighter jet helmets. Organic forms have been used in this concept design enabling complete integration of the functions in the available space without deranging the look or to result in difficulties in use of the helmet.
Figure 4 presents a real-look render of the helmet where the Head-Up Display is presented at the eyes mask where the miner can receive important information about the temperature, air pollution, gas leakage or other information. All this is made available by the sensor located in the helmet’s sides. The central processing unit processes the sensor’s data and sends the information to the OLED display positioned between the layers of protective glass. This display as well as the CPU, are powered by the same lithium batteries integrated in the helmet [2].
In Figure 5 both sides of the mask are presented where the sensors are located which measure specific parameters in real time. The sensors and the display are powered by 2 batteries located in the back end of the helmet with total nominal power of 12.000 mAh. The battery capacity is sufficient to provide constant operation of the helmet with all its features for 72 hours. The helmet has sensors for:
Temperature Altitude and pressure Air humidity Detection of poisonous gases in the air GPS chip Radio transmission for communication
The face mask can be adjusted by a simple push of a button which releases the mechanism and allows the mask to be translated to the front and rotated upwards above the helmet (Fig. 4.) This function provides the helmet with the ability to be used in underground mines as well as in surface mines where most of the time a face protection is not necessary. When positioned above the helmet, the display and sensors are not in function.
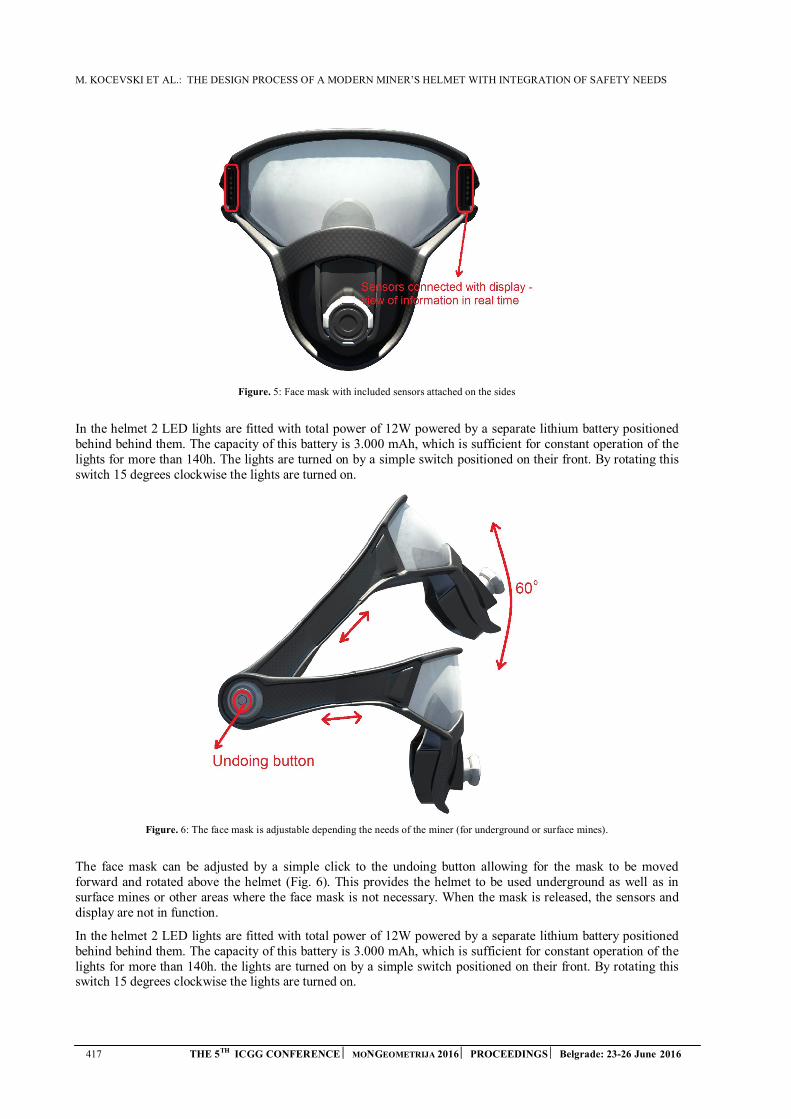
M. KOCEVSKI ET AL.: THE DESIGN PROCESS OF A MODERN MINER’S HELMET WITH INTEGRATION OF SAFETY NEEDS
417 THE 5TH ICGG CONFERENCE MONGEOMETRIJA 2016 PROCEEDINGS Belgrade: 23-26 June 2016
Figure. 5: Face mask with included sensors attached on the sides
In the helmet 2 LED lights are fitted with total power of 12W powered by a separate lithium battery positioned behind behind them. The capacity of this battery is 3.000 mAh, which is sufficient for constant operation of the lights for more than 140h. The lights are turned on by a simple switch positioned on their front. By rotating this switch 15 degrees clockwise the lights are turned on.
Figure. 6: The face mask is adjustable depending the needs of the miner (for underground or surface mines).
The face mask can be adjusted by a simple click to the undoing button allowing for the mask to be moved forward and rotated above the helmet (Fig. 6). This provides the helmet to be used underground as well as in surface mines or other areas where the face mask is not necessary. When the mask is released, the sensors and display are not in function.
In the helmet 2 LED lights are fitted with total power of 12W powered by a separate lithium battery positioned behind behind them. The capacity of this battery is 3.000 mAh, which is sufficient for constant operation of the lights for more than 140h. the lights are turned on by a simple switch positioned on their front. By rotating this switch 15 degrees clockwise the lights are turned on.
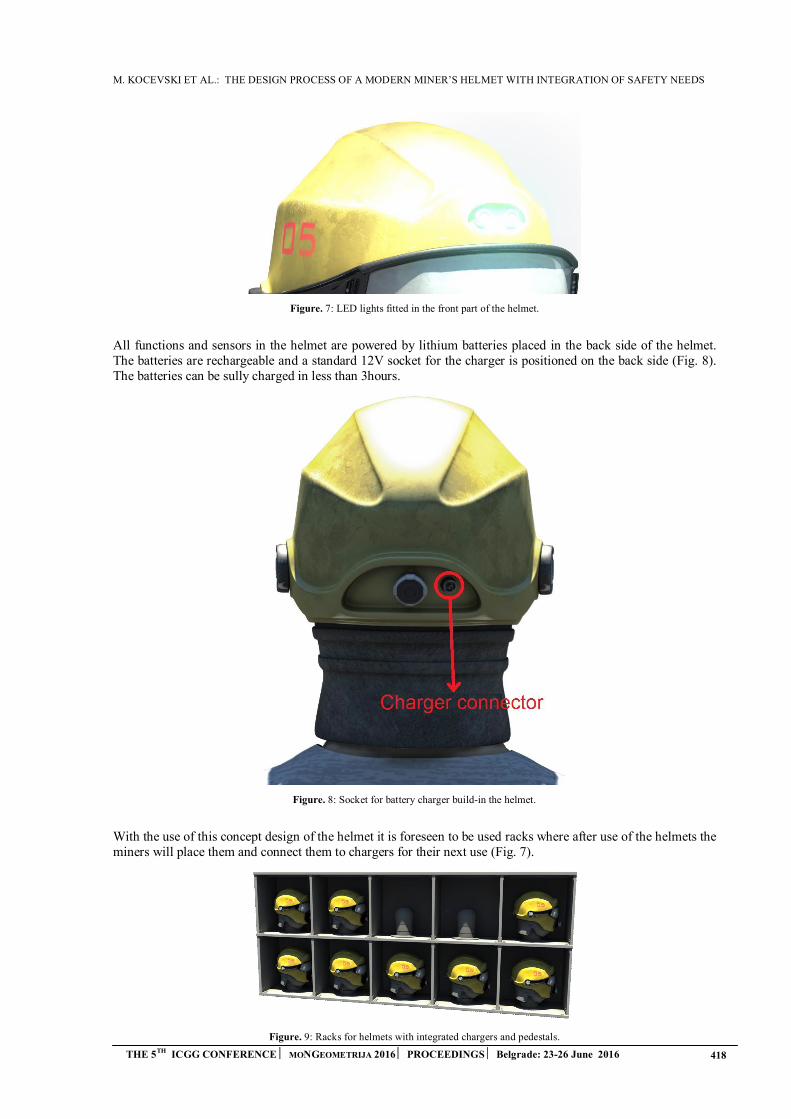
M. KOCEVSKI ET AL.: THE DESIGN PROCESS OF A MODERN MINER’S HELMET WITH INTEGRATION OF SAFETY NEEDS
THE 5TH ICGG CONFERENCE MONGEOMETRIJA 2016 PROCEEDINGS Belgrade: 23-26 June 2016 418
Figure. 7: LED lights fitted in the front part of the helmet.
All functions and sensors in the helmet are powered by lithium batteries placed in the back side of the helmet. The batteries are rechargeable and a standard 12V socket for the charger is positioned on the back side (Fig. 8). The batteries can be sully charged in less than 3hours.
Figure. 8: Socket for battery charger build-in the helmet.
With the use of this concept design of the helmet it is foreseen to be used racks where after use of the helmets the miners will place them and connect them to chargers for their next use (Fig. 7).
Figure. 9: Racks for helmets with integrated chargers and pedestals.
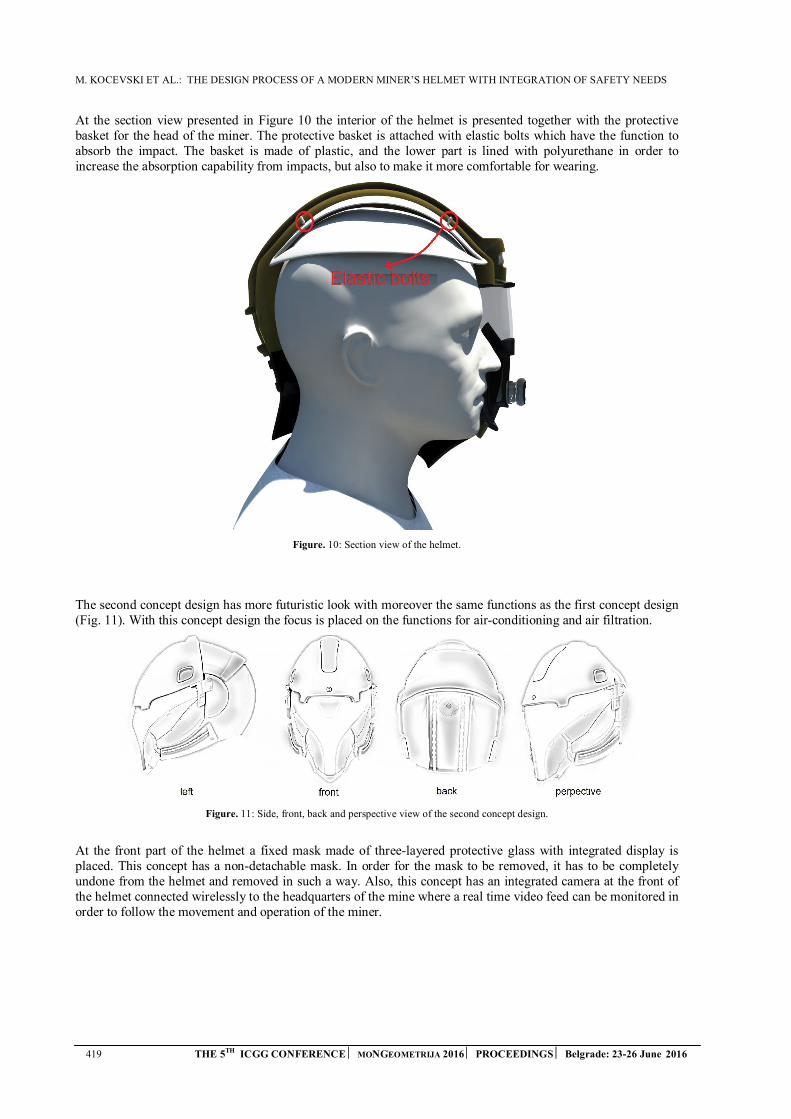
M. KOCEVSKI ET AL.: THE DESIGN PROCESS OF A MODERN MINER’S HELMET WITH INTEGRATION OF SAFETY NEEDS
419 THE 5TH ICGG CONFERENCE MONGEOMETRIJA 2016 PROCEEDINGS Belgrade: 23-26 June 2016
At the section view presented in Figure 10 the interior of the helmet is presented together with the protective basket for the head of the miner. The protective basket is attached with elastic bolts which have the function to absorb the impact. The basket is made of plastic, and the lower part is lined with polyurethane in order to increase the absorption capability from impacts, but also to make it more comfortable for wearing.
Figure. 10: Section view of the helmet.
The second concept design has more futuristic look with moreover the same functions as the first concept design (Fig. 11). With this concept design the focus is placed on the functions for air-conditioning and air filtration.
Figure. 11: Side, front, back and perspective view of the second concept design.
At the front part of the helmet a fixed mask made of three-layered protective glass with integrated display is placed. This concept has a non-detachable mask. In order for the mask to be removed, it has to be completely undone from the helmet and removed in such a way. Also, this concept has an integrated camera at the front of the helmet connected wirelessly to the headquarters of the mine where a real time video feed can be monitored in order to follow the movement and operation of the miner.
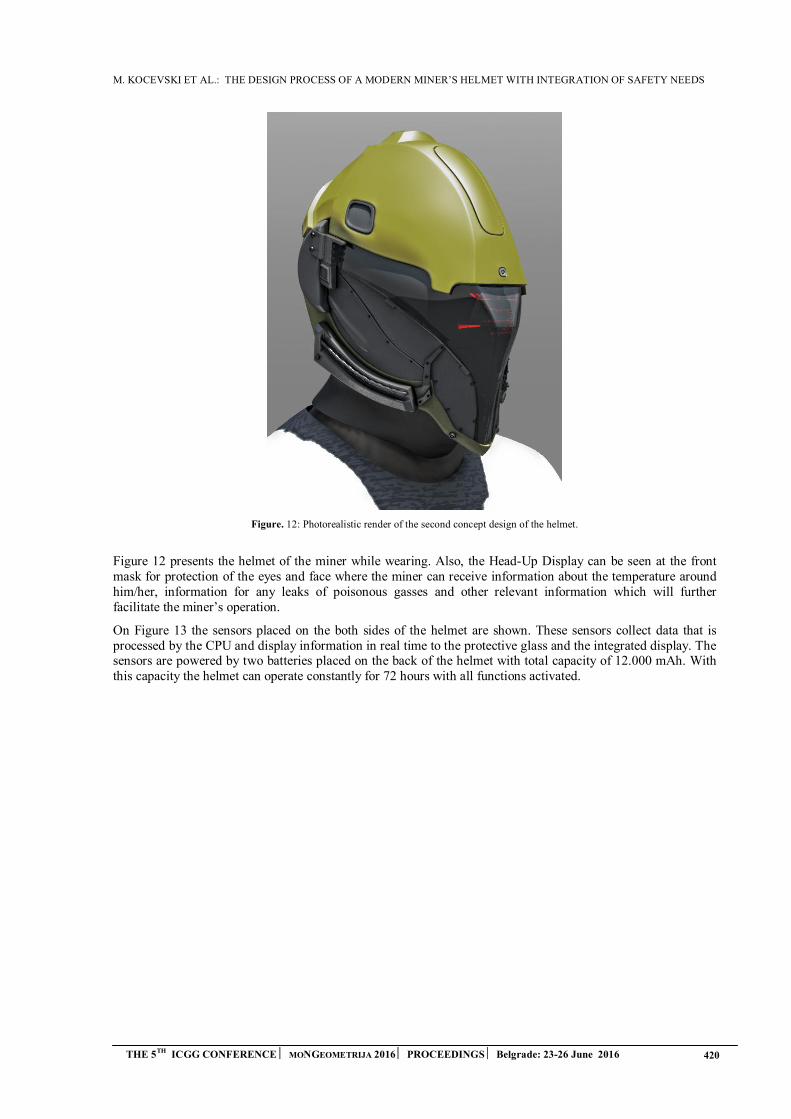
M. KOCEVSKI ET AL.: THE DESIGN PROCESS OF A MODERN MINER’S HELMET WITH INTEGRATION OF SAFETY NEEDS
THE 5TH ICGG CONFERENCE MONGEOMETRIJA 2016 PROCEEDINGS Belgrade: 23-26 June 2016 420
Figure. 12: Photorealistic render of the second concept design of the helmet.
Figure 12 presents the helmet of the miner while wearing. Also, the Head-Up Display can be seen at the front mask for protection of the eyes and face where the miner can receive information about the temperature around him/her, information for any leaks of poisonous gasses and other relevant information which will further facilitate the miner’s operation.
On Figure 13 the sensors placed on the both sides of the helmet are shown. These sensors collect data that is processed by the CPU and display information in real time to the protective glass and the integrated display. The sensors are powered by two batteries placed on the back of the helmet with total capacity of 12.000 mAh. With this capacity the helmet can operate constantly for 72 hours with all functions activated.
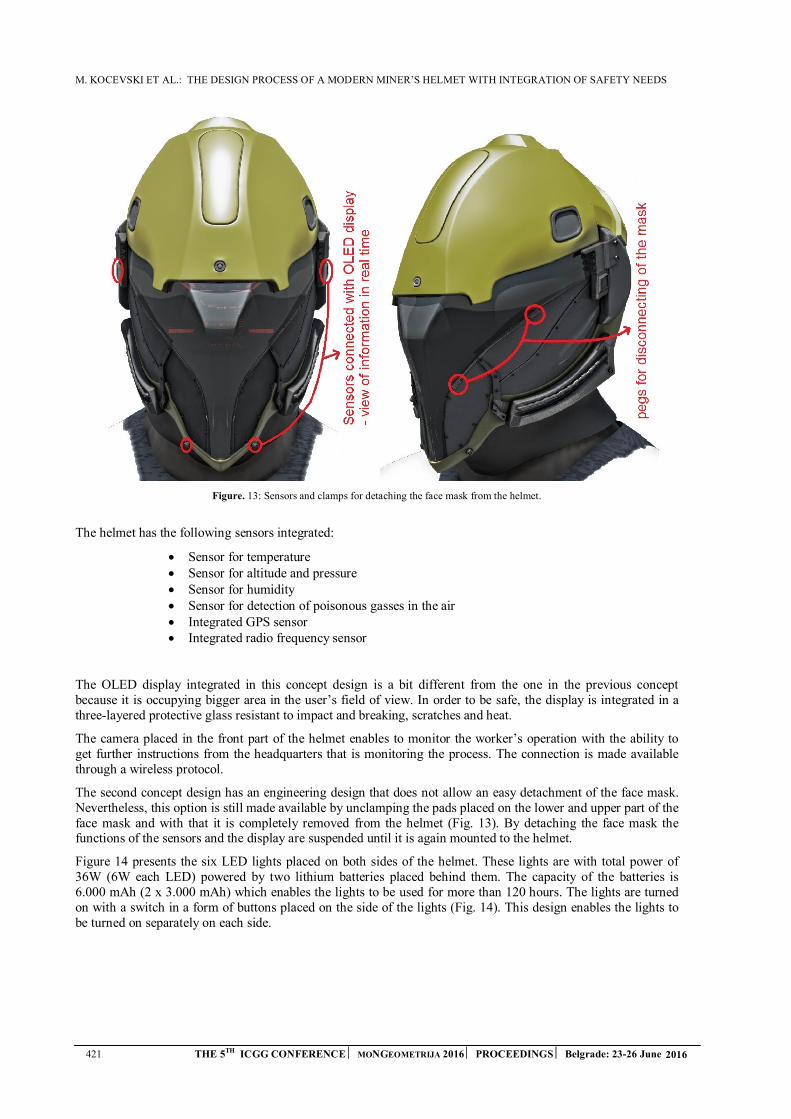
M. KOCEVSKI ET AL.: THE DESIGN PROCESS OF A MODERN MINER’S HELMET WITH INTEGRATION OF SAFETY NEEDS
421 THE 5TH ICGG CONFERENCE MONGEOMETRIJA 2016 PROCEEDINGS Belgrade: 23-26 June 2016
Figure. 13: Sensors and clamps for detaching the face mask from the helmet.
The helmet has the following sensors integrated:
Sensor for temperature Sensor for altitude and pressure Sensor for humidity Sensor for detection of poisonous gasses in the air Integrated GPS sensor Integrated radio frequency sensor
The OLED display integrated in this concept design is a bit different from the one in the previous concept because it is occupying bigger area in the user’s field of view. In order to be safe, the display is integrated in a three-layered protective glass resistant to impact and breaking, scratches and heat.
The camera placed in the front part of the helmet enables to monitor the worker’s operation with the ability to get further instructions from the headquarters that is monitoring the process. The connection is made available through a wireless protocol.
The second concept design has an engineering design that does not allow an easy detachment of the face mask. Nevertheless, this option is still made available by unclamping the pads placed on the lower and upper part of the face mask and with that it is completely removed from the helmet (Fig. 13). By detaching the face mask the functions of the sensors and the display are suspended until it is again mounted to the helmet.
Figure 14 presents the six LED lights placed on both sides of the helmet. These lights are with total power of 36W (6W each LED) powered by two lithium batteries placed behind them. The capacity of the batteries is 6.000 mAh (2 x 3.000 mAh) which enables the lights to be used for more than 120 hours. The lights are turned on with a switch in a form of buttons placed on the side of the lights (Fig. 14). This design enables the lights to be turned on separately on each side.
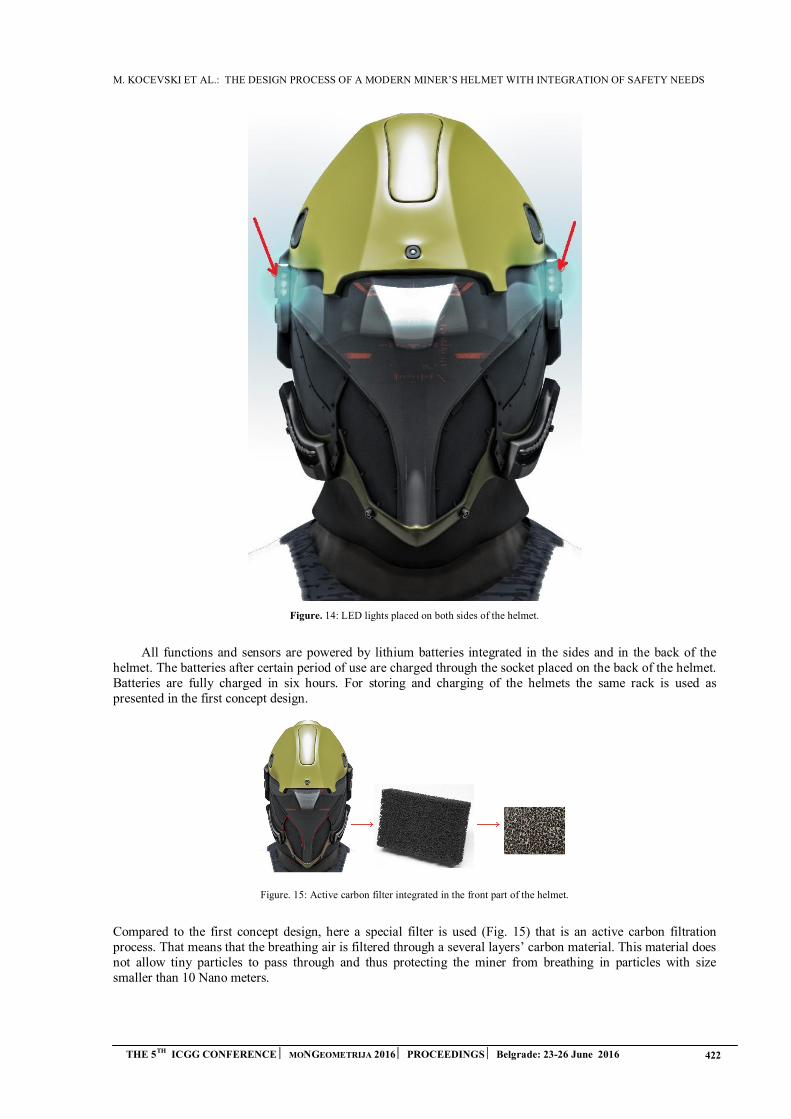
M. KOCEVSKI ET AL.: THE DESIGN PROCESS OF A MODERN MINER’S HELMET WITH INTEGRATION OF SAFETY NEEDS
THE 5TH ICGG CONFERENCE MONGEOMETRIJA 2016 PROCEEDINGS Belgrade: 23-26 June 2016 422
Figure. 14: LED lights placed on both sides of the helmet.
All functions and sensors are powered by lithium batteries integrated in the sides and in the back of the helmet. The batteries after certain period of use are charged through the socket placed on the back of the helmet. Batteries are fully charged in six hours. For storing and charging of the helmets the same rack is used as presented in the first concept design.
Figure. 15: Active carbon filter integrated in the front part of the helmet.
Compared to the first concept design, here a special filter is used (Fig. 15) that is an active carbon filtration process. That means that the breathing air is filtered through a several layers’ carbon material. This material does not allow tiny particles to pass through and thus protecting the miner from breathing in particles with size smaller than 10 Nano meters.
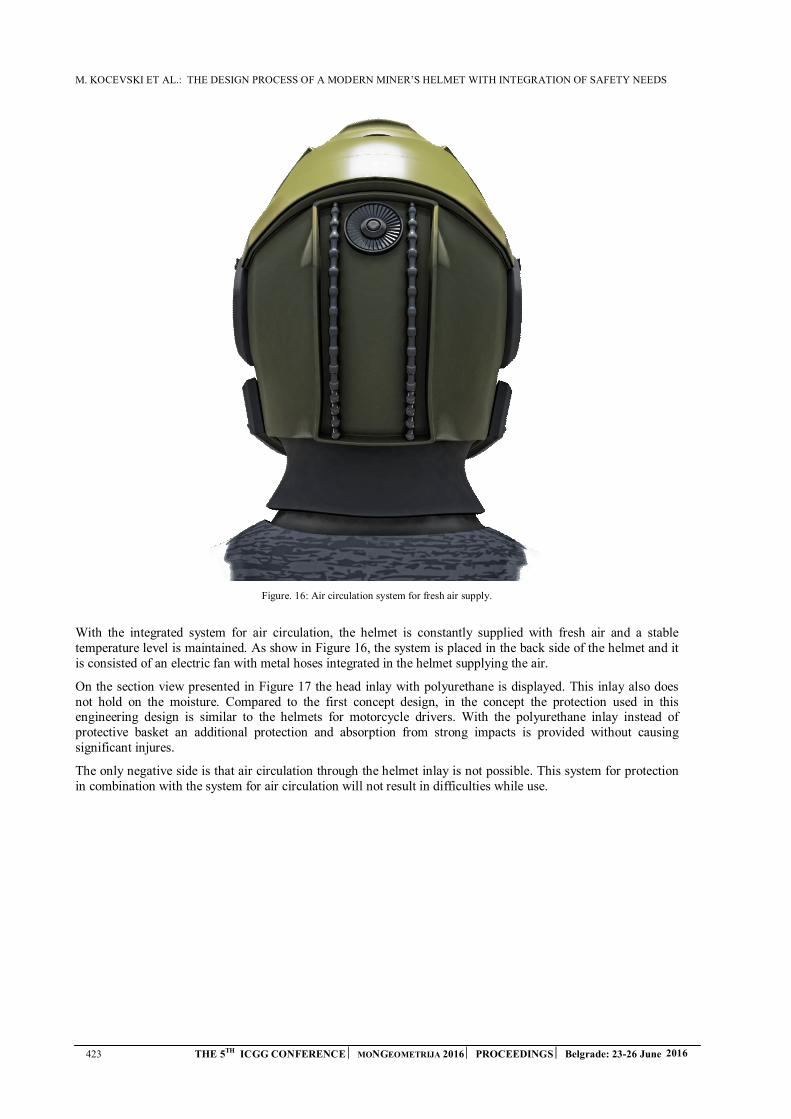
M. KOCEVSKI ET AL.: THE DESIGN PROCESS OF A MODERN MINER’S HELMET WITH INTEGRATION OF SAFETY NEEDS
423 THE 5TH ICGG CONFERENCE MONGEOMETRIJA 2016 PROCEEDINGS Belgrade: 23-26 June 2016
Figure. 16: Air circulation system for fresh air supply.
With the integrated system for air circulation, the helmet is constantly supplied with fresh air and a stable temperature level is maintained. As show in Figure 16, the system is placed in the back side of the helmet and it is consisted of an electric fan with metal hoses integrated in the helmet supplying the air.
On the section view presented in Figure 17 the head inlay with polyurethane is displayed. This inlay also does not hold on the moisture. Compared to the first concept design, in the concept the protection used in this engineering design is similar to the helmets for motorcycle drivers. With the polyurethane inlay instead of protective basket an additional protection and absorption from strong impacts is provided without causing significant injures.
The only negative side is that air circulation through the helmet inlay is not possible. This system for protection in combination with the system for air circulation will not result in difficulties while use.
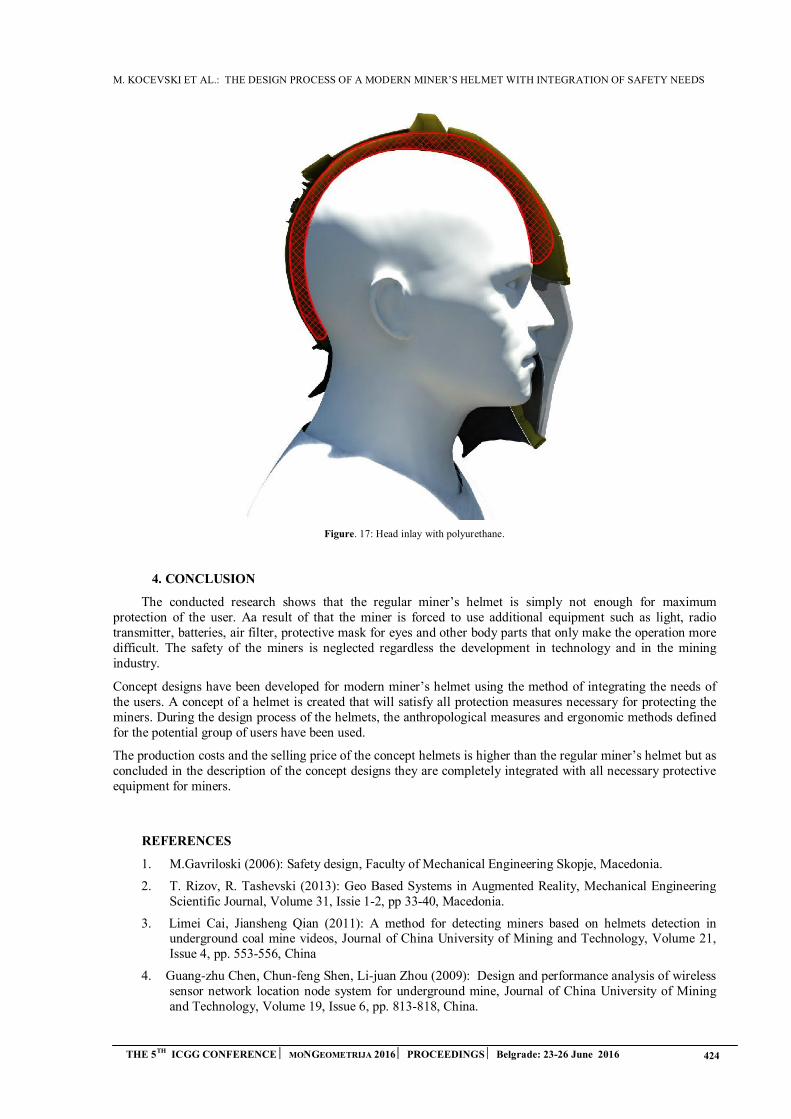
M. KOCEVSKI ET AL.: THE DESIGN PROCESS OF A MODERN MINER’S HELMET WITH INTEGRATION OF SAFETY NEEDS
THE 5TH ICGG CONFERENCE MONGEOMETRIJA 2016 PROCEEDINGS Belgrade: 23-26 June 2016 424
Figure. 17: Head inlay with polyurethane.
4. CONCLUSION
The conducted research shows that the regular miner’s helmet is simply not enough for maximum protection of the user. Aa result of that the miner is forced to use additional equipment such as light, radio transmitter, batteries, air filter, protective mask for eyes and other body parts that only make the operation more difficult. The safety of the miners is neglected regardless the development in technology and in the mining industry.
Concept designs have been developed for modern miner’s helmet using the method of integrating the needs of the users. A concept of a helmet is created that will satisfy all protection measures necessary for protecting the miners. During the design process of the helmets, the anthropological measures and ergonomic methods defined for the potential group of users have been used.
The production costs and the selling price of the concept helmets is higher than the regular miner’s helmet but as concluded in the description of the concept designs they are completely integrated with all necessary protective equipment for miners.
REFERENCES
1. M.Gavriloski (2006): Safety design, Faculty of Mechanical Engineering Skopje, Macedonia.
2. T. Rizov, R. Tashevski (2013): Geo Based Systems in Augmented Reality, Mechanical EngineeringScientific Journal, Volume 31, Issie 1-2, pp 33-40, Macedonia.
3. Limei Cai, Jiansheng Qian (2011): A method for detecting miners based on helmets detection inunderground coal mine videos, Journal of China University of Mining and Technology, Volume 21,Issue 4, pp. 553-556, China
4. Guang-zhu Chen, Chun-feng Shen, Li-juan Zhou (2009): Design and performance analysis of wirelesssensor network location node system for underground mine, Journal of China University of Miningand Technology, Volume 19, Issue 6, pp. 813-818, China.

M. KOCEVSKI ET AL.: THE DESIGN PROCESS OF A MODERN MINER’S HELMET WITH INTEGRATION OF SAFETY NEEDS
425 THE 5TH ICGG CONFERENCE MONGEOMETRIJA 2016 PROCEEDINGS Belgrade: 23-26 June 2016
5. R S Mangus, C J Simons, L E Jacobson, E W Streib, G A Gomez (2004): Current helmet andprotective equipment usage among previously injured ATV and motorcycle riders, International Journal on Injury Prevention, Volume 10, Issue 1, pp 56 – 58, USA.
6. Atlas Copco Sweden (2013): Miner helmet, International Design Excellence Awards 2013, categoryIndustrial Design Awards, Organized by the Industrial Designers Society of America (IDSA), USA
7. Stojadinovic, S.; Svrkota, I.; Petrovic, D.; Denic, M.; Pantovic, R.; Milic, V. (2005): Mining injuriesin Serbian underground coal mines—A 10-year study, Injury 2012 Scientific Journal, Volume 43, Serbia.
D. KUŠAR ET AL.: THE IMPORTANCE OF A COMPREHENSIVE ANALYSIS OF STUDENTS’ CONTRIBUTIONS FOR SPATIAL CONCEPT DEVELOPMENT
THE 5TH ICGG CONFERENCE MONGEOMETRIJA 2016 PROCEEDINGS Belgrade: 23-26 June 2016 426
THE IMPORTANCE OF A COMPREHENSIVE ANALYSIS OF STUDENTS’ CONTRIBUTIONS FOR SPATIAL CONCEPT
DEVELOPMENT
Domen Kušar
University of Ljubljana, Faculty of Architecture, Ljubljana, Slovenia PhD., Assistant Professor, [email protected]
Mateja Volgemut
University of Ljubljana, Faculty of Architecture, Ljubljana, Slovenia Teaching Assistant, [email protected]
ABSTRACT
Spatial ability is one of the human capacities that is essential for the survival and development of the society. Psychologists found out that the spatial ability is composed of various subgenres that define our perception of space.Descriptive geometry (DG) falls within the scope of teaching field that helps humans develop spatial ability. The original purpose of descriptive geometry was to provide a standardized way of communication between professionals of various, in particular technical areas in the field of representing the various elements on a two-dimensional medium. With the development of technology, especially computers, it has increased the number of modes of communication. The modern way of teaching DG advantageously exploited all these opportunities. On the other hand, modern technology allows us to know in which areas of spatial visualization the students are more proficient and in which they are less. Among the objectives of the integrated development of spatial visualization, which would tend DG it is to determine what are the weaker areas and then try to develop them.During the course of DG at the Faculty of Architecture, we analysed the colloquium tasks and domestic work. Tasks are split to individual spatial operations that are required to yield the correct solution. Results showed the problematic areas that need to be developed more.
Keywords: spatial ability, descriptive geometry, education
INTRODUCTION
A good spatial concept is essential for all those who manage space, i.e. architects, urban planners, public stakeholders, and the like. In addition to linguistic, mathematical, movement, natural, musical, and personal intelligence, it constitutes an integral part of human capabilities. It is also important for all other professionals who deal with spatial elements and the relations between them, such as manufacturers of machinery, vehicles, furniture, etc. The research of spatial concepts is a relatively young science, as the studies have been conducted for just a little more than 130 years [10]. Studies have shown that the notion of spatial concept covers a wide range of different space perception abilities. This has led to confusion over the naming of its integral parts and the use of the terms “visual”, “spatial”, and “concept”. In his study, J.P. Guilford [2] found that spatial conception has four integral parts:
1. spatial orientation;2. ability to present a three-dimensional object through a two-dimensional medium;3. ability to search for spatial solutions through drawings;4. ability of quick spatial perceptions and behaviour.

D. KUŠAR ET AL.: THE IMPORTANCE OF A COMPREHENSIVE ANALYSIS OF STUDENTS’ CONTRIBUTIONS FOR SPATIAL CONCEPT DEVELOPMENT
THE 5TH ICGG CONFERENCE MONGEOMETRIJA 2016 PROCEEDINGS Belgrade: 23-26 June 2016 427
McGee [9] divided spatial concepts into two strong groups:
1. spatial visualisation; and2. spatial orientation.
In his opinion, the ability to perceive space is composed of five components:
1. spatial perception;2. spatial visualisation;3. mental rotations;4. mental relations;5. spatial orientation.
However, the problem lies in the fact that it is not possible to make a sharp distinction between individual components, as certain fields overlap each other. Linn and Peterson [8] as well as Law, Pellegrino and Hunt [7] all tried to regulate the definitions of individual fields. They identified five notions related to spatial conception:
1. Spatial conception is supposed to be a concept that generally refers to the skills invisualisation, transformation, formation, and recall of symbolic, non-linguistic spatialinformation. Spatial conception is thus supposed to cover mental rotations, spatialperception, and spatial visualisation.
2. Mental rotations are supposed to include the ability of quick and precise rotations of a two- or three-dimensional image or object.
3. Spatial perception is supposed to represent the individual’s ability to determine spatialrelations with respect to orientation.
4. Spatial visualisation is supposed to include complex manipulations of spatial informationwith different spatial displays.
5. Dynamic spatial reasoning is supposed to include an assessment of relative speed anddistance.
On the basis of the analyses of spatial concepts, Yilmaz [14] made a model representing the following main components of spatial conception:
1. closure speed;2. spatial orientation;3. environmental ability;4. flexibility of closure;5. spatial relations;6. spatial visualisations;7. spatiomemoral (spatiomeporal) ability;8. perceptual speed.
In relation to other intelligences, spatial intelligence used to be underestimated [13], which is probably due to the fact that the public considers it to be an innate ability. However, subsequent studies [4], [11] refuted this argument, proving that the development of spatial conception takes place throughout life and that the process is most active at a young age [1], [3].
The Faculty of Architecture of the University of Ljubljana (hereinafter: “UL FA”) aims to develop spatial conception within various courses, most actively in the first year. Since 1999, the level of students’ conception has been monitored through the Descriptive Geometry course, using the mental rotation test (MRT). The test excellently covers the field of mental rotations rather than other fields. The results of these studies were repeatedly presented in the Journal of Geometry and Graphics, Yournal, Journal of Built Environment, and AR Architecture, Research Journal as well as at different conferences [5], [6]. In the academic year 2015/2016, we aimed to put more emphasis on the analysis of projects and midterm exams. We presumed that the students were doing very well in certain fields, while other fields could be further developed. Based on this, more attention could be paid to the less-developed fields of spatial concepts. It was found that different exercises could improve spatial conception [12].
METHOD
Descriptive Geometry is a compulsory course in the first year of UL FA. The students of the Single-Cycle Master’s Programme in Architecture have one hour of lectures and two hours of practice every week throughout the year. In the winter semester, the majority (14/15) of time is devoted to the method of orthogonal projections (Monge’s method) and one hour to topographic projection. The summer semester is equally divided into shading

D. KUŠAR ET AL.: THE IMPORTANCE OF A COMPREHENSIVE ANALYSIS OF STUDENTS’ CONTRIBUTIONS FOR SPATIAL CONCEPT DEVELOPMENT
THE 5TH ICGG CONFERENCE MONGEOMETRIJA 2016 PROCEEDINGS Belgrade: 23-26 June 2016 428
as a form of oblique projection, axonometry, and central projection. The course includes 6 regular midterm exams (3 in each semester) and one repeat exam. The midterm exams last one hour. The students get a sheet of paper containing exercises with drawn information. The exam is carried out with traditional drawing tools and without the use of literature. If the students pass the midterm exams, they do not have to take the final exam, which serves as a motivation for regular work and successful completion of the course. Projects represent another obligation within the course. In the winter semester, the students draw 20 projects on A4 sheets. 15 projects are drawn independently at home and 5 at UL FA within the practical part of the course. The summer semester includes 9 projects drawn on A3 sheets.
The study took into account the first two midterm exams (Figure 1), as they cover basic descriptive geometry exercises. Other midterm exams are more complex (drawing shades, axonometry, etc.) and require a larger number of basic procedures. Both midterm exams were composed of five exercises. The analysis also avoided the evaluation of the first project, which only consisted of drawing different types of lines. We thus analysed 10 midterm exam exercises and 16 projects of the winter semester.
Figure. 1: Example of exercises 1 and 2 of the second midterm exam (identifying the correct size of the angle between two passants and identifying the correct size of the angle between two planes).
In order to analyse the state of spatial conception, we analysed individual exercises of midterm exams and projects from the perspective of individual procedures required to obtain the correct result. These procedures include spatial relations of points, lines, and planes, and some special constructions. The figure below (Figure 2) gives an example of project 8.
Figure. 2: Example of project 8: Using the method of orthogonal projections (Monge’s method) and the prescribed military axonometry, draw the decline lines g1, g2 and g3 from the selected point Q(x,y,z) of the plane E, if the plane E is given by three points.
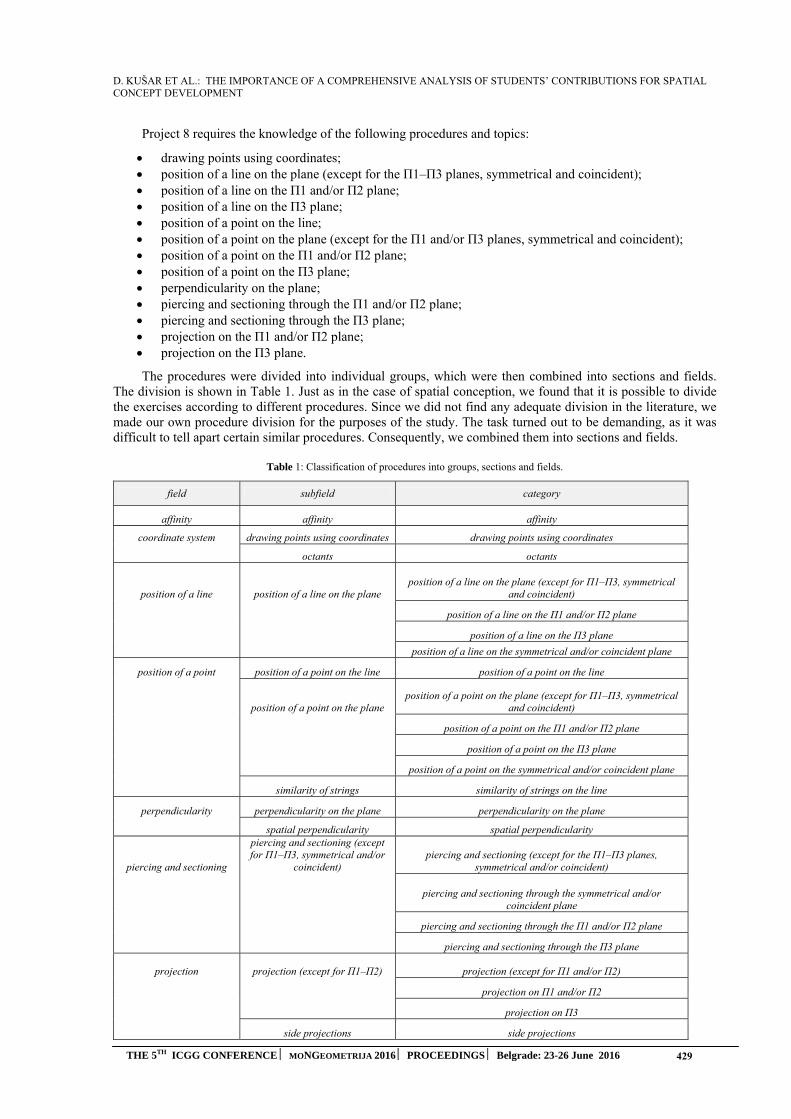
D. KUŠAR ET AL.: THE IMPORTANCE OF A COMPREHENSIVE ANALYSIS OF STUDENTS’ CONTRIBUTIONS FOR SPATIAL CONCEPT DEVELOPMENT
THE 5TH ICGG CONFERENCE MONGEOMETRIJA 2016 PROCEEDINGS Belgrade: 23-26 June 2016 429
Project 8 requires the knowledge of the following procedures and topics:
drawing points using coordinates; position of a line on the plane (except for the П1–П3 planes, symmetrical and coincident); position of a line on the П1 and/or П2 plane; position of a line on the П3 plane; position of a point on the line; position of a point on the plane (except for the П1 and/or П3 planes, symmetrical and coincident); position of a point on the П1 and/or П2 plane; position of a point on the П3 plane; perpendicularity on the plane; piercing and sectioning through the П1 and/or П2 plane; piercing and sectioning through the П3 plane; projection on the П1 and/or П2 plane; projection on the П3 plane.
The procedures were divided into individual groups, which were then combined into sections and fields. The division is shown in Table 1. Just as in the case of spatial conception, we found that it is possible to divide the exercises according to different procedures. Since we did not find any adequate division in the literature, we made our own procedure division for the purposes of the study. The task turned out to be demanding, as it was difficult to tell apart certain similar procedures. Consequently, we combined them into sections and fields.
Table 1: Classification of procedures into groups, sections and fields.
field subfield category
affinity affinity affinity
coordinate system drawing points using coordinates drawing points using coordinates
octants octants
position of a line position of a line on the plane position of a line on the plane (except for П1–П3, symmetrical
and coincident)
position of a line on the П1 and/or П2 plane
position of a line on the П3 plane
position of a line on the symmetrical and/or coincident plane
position of a point position of a point on the line position of a point on the line
position of a point on the plane position of a point on the plane (except for П1–П3, symmetrical
and coincident)
position of a point on the П1 and/or П2 plane
position of a point on the П3 plane
position of a point on the symmetrical and/or coincident plane
similarity of strings similarity of strings on the line
perpendicularity perpendicularity on the plane perpendicularity on the plane
spatial perpendicularity spatial perpendicularity
piercing and sectioning
piercing and sectioning (except for П1–П3, symmetrical and/or
coincident) piercing and sectioning (except for the П1–П3 planes,
symmetrical and/or coincident)
piercing and sectioning through the symmetrical and/or coincident plane
piercing and sectioning through the П1 and/or П2 plane
piercing and sectioning through the П3 plane
projection projection (except for П1–П2) projection (except for П1 and/or П2)
projection on П1 and/or П2
projection on П3
side projections side projections
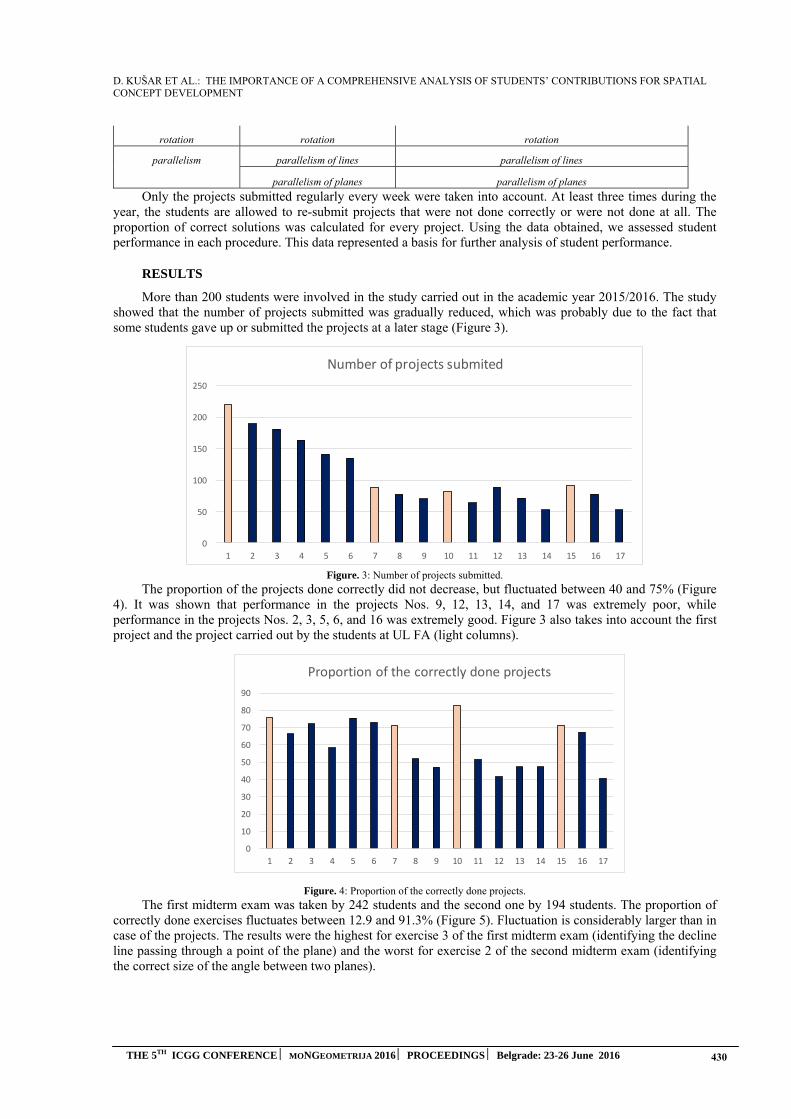
D. KUŠAR ET AL.: THE IMPORTANCE OF A COMPREHENSIVE ANALYSIS OF STUDENTS’ CONTRIBUTIONS FOR SPATIAL CONCEPT DEVELOPMENT
THE 5TH ICGG CONFERENCE MONGEOMETRIJA 2016 PROCEEDINGS Belgrade: 23-26 June 2016 430
rotation rotation rotation
parallelism parallelism of lines parallelism of lines
parallelism of planes parallelism of planes
Only the projects submitted regularly every week were taken into account. At least three times during the year, the students are allowed to re-submit projects that were not done correctly or were not done at all. The proportion of correct solutions was calculated for every project. Using the data obtained, we assessed student performance in each procedure. This data represented a basis for further analysis of student performance.
RESULTS
More than 200 students were involved in the study carried out in the academic year 2015/2016. The study showed that the number of projects submitted was gradually reduced, which was probably due to the fact that some students gave up or submitted the projects at a later stage (Figure 3).
0
50
100
150
200
250
1 2 3 4 5 6 7 8 9 10 11 12 13 14 15 16 17
Number of projects submited
Figure. 3: Number of projects submitted.
The proportion of the projects done correctly did not decrease, but fluctuated between 40 and 75% (Figure 4). It was shown that performance in the projects Nos. 9, 12, 13, 14, and 17 was extremely poor, while performance in the projects Nos. 2, 3, 5, 6, and 16 was extremely good. Figure 3 also takes into account the first project and the project carried out by the students at UL FA (light columns).
0
10
20
30
40
50
60
70
80
90
1 2 3 4 5 6 7 8 9 10 11 12 13 14 15 16 17
Proportion of the correctly done projects
Figure. 4: Proportion of the correctly done projects.
The first midterm exam was taken by 242 students and the second one by 194 students. The proportion of correctly done exercises fluctuates between 12.9 and 91.3% (Figure 5). Fluctuation is considerably larger than in case of the projects. The results were the highest for exercise 3 of the first midterm exam (identifying the decline line passing through a point of the plane) and the worst for exercise 2 of the second midterm exam (identifying the correct size of the angle between two planes).
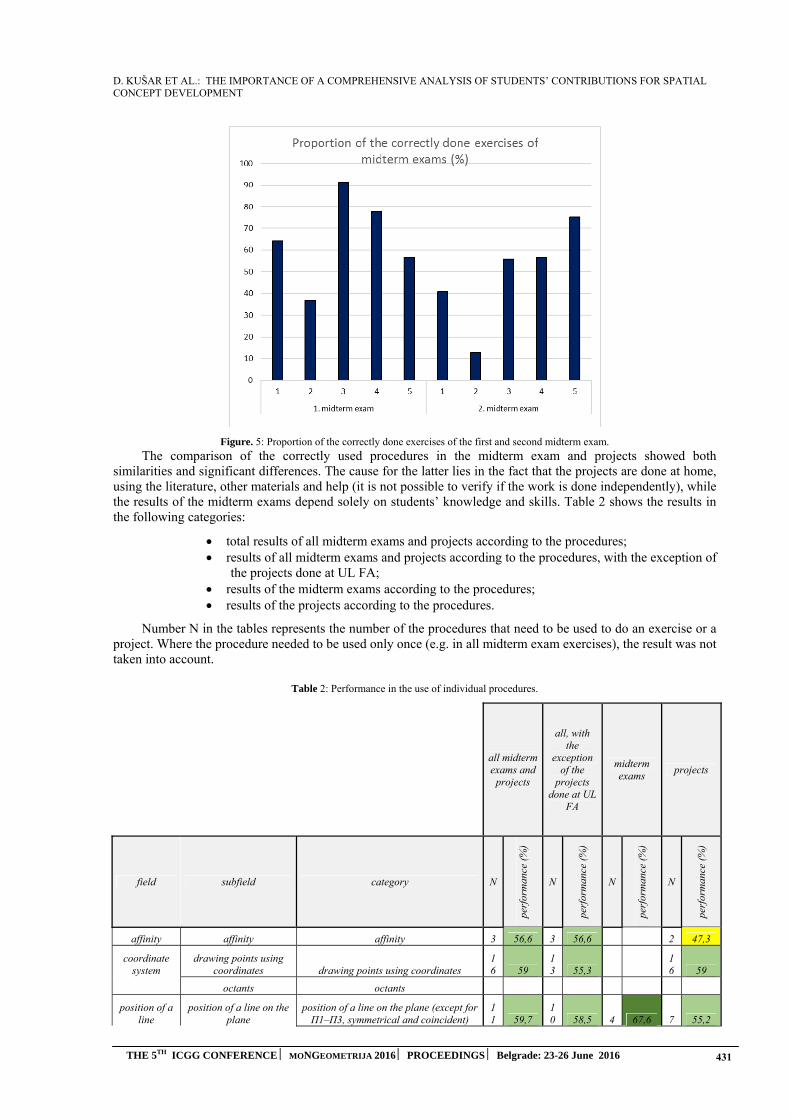
D. KUŠAR ET AL.: THE IMPORTANCE OF A COMPREHENSIVE ANALYSIS OF STUDENTS’ CONTRIBUTIONS FOR SPATIAL CONCEPT DEVELOPMENT
THE 5TH ICGG CONFERENCE MONGEOMETRIJA 2016 PROCEEDINGS Belgrade: 23-26 June 2016 431
Figure. 5: Proportion of the correctly done exercises of the first and second midterm exam.
The comparison of the correctly used procedures in the midterm exam and projects showed both similarities and significant differences. The cause for the latter lies in the fact that the projects are done at home, using the literature, other materials and help (it is not possible to verify if the work is done independently), while the results of the midterm exams depend solely on students’ knowledge and skills. Table 2 shows the results in the following categories:
total results of all midterm exams and projects according to the procedures; results of all midterm exams and projects according to the procedures, with the exception of
the projects done at UL FA; results of the midterm exams according to the procedures; results of the projects according to the procedures.
Number N in the tables represents the number of the procedures that need to be used to do an exercise or a project. Where the procedure needed to be used only once (e.g. in all midterm exam exercises), the result was not taken into account.
Table 2: Performance in the use of individual procedures.
all midterm exams and
projects
all, with the
exception of the
projects done at UL
FA
midterm exams
projects
field subfield category N
perf
orm
ance
(%
)
N
perf
orm
ance
(%
)
N
perf
orm
ance
(%
)
N
perf
orm
ance
(%
)
affinity affinity affinity 3 56,6 3 56,6 2 47,3
coordinate system
drawing points using coordinates drawing points using coordinates
16 59
13 55,3
16 59
octants octants
position of a line
position of a line on the plane
position of a line on the plane (except for П1–П3, symmetrical and coincident)
11 59,7
10 58,5 4 67,6 7 55,2

D. KUŠAR ET AL.: THE IMPORTANCE OF A COMPREHENSIVE ANALYSIS OF STUDENTS’ CONTRIBUTIONS FOR SPATIAL CONCEPT DEVELOPMENT
THE 5TH ICGG CONFERENCE MONGEOMETRIJA 2016 PROCEEDINGS Belgrade: 23-26 June 2016 432
position of a line on the П1 and/or П2 plane
10 63,2 8 59,8 3 59,7 7 64,7
position of a line on the П3 plane 6 66,9 4 61,9 6 66,9
position of a line on the symmetrical and/or coincident plane
position of a point
position of a point on the line position of a point on the line
25 57,9
22 55,5
10 56,9
15 58,5
position of a point on the plane
position of a point on the plane (except for П1–П3, symmetrical and coincident) 9 62,2 7 57,9 3 52,7 6 66,9
position of a point on the П1 and/or П2 plane
13 65,9
11 63,9 5 69,1 8 63,9
position of a point on the П3 plane 7 65,7 5 61,1 7 65,7
position of a point on the symmetrical and/or coincident plane
similarity of strings similarity of strings on the line
perpendi - cularity
perpendicularity on the plane perpendicularity on the plane 8 63,8 6 59,4 7 59,9
spatial perpendicularity spatial perpendicularity 7 52,2 6 47,2 2 34,9 5 59,2
piercing and sectioning
piercing and sectioning (except for П1–П3, symmetrical and/or
coincident)
piercing and sectioning (except for the П1–П3 planes, symmetrical and/or
coincident) 9 49,1 8 44,8 3 36,8 6 55,2
piercing and sectioning through the symmetrical and/or coincident plane
piercing and sectioning through the П1 and/or П2 plane
17 54,2
14 49,7 3 38
14 57,6
piercing and sectioning through the П3 plane 7 65,7 5 61,1 7 65,7
projection projection (except for
П1–П2) projection (except for П1 and/or П2) 7 52,1 6 48,9 3 52,7 4 51,6
projection on П1 and/or П2 21 57,9
19 55,9 8 54,6
13 59,9
projection on П3 7 67,5 5 63,7 7 67,5
side projections side projections 6 51,6 6 51,6 2 56,3 4 49,2
rotation rotation rotation 5 43,9 4 37 2 26,8 3 55,3
parallelism parallelism of lines parallelism of lines 11 53,9 9 48,8 3 47,3 8 56,4
parallelism of planes parallelism of planes 3 41,9 3 41,9 2 44,4
TOTAL 57,7 54,3 50,3 58,6
DISCUSSION
The survey showed different results of student performance in individual procedures. It was indicated that the procedures dealing with spatial perpendicularity, piercing, sectioning and, in particular, rotation are most complex. A drop in mental rotations is also observed every year when verifying students’ spatial conception using the MRT test. Although the results fluctuate, there is a trend of reduced spatial conception in the field of mental rotations.
Student performance was the best in case of the position of lines and points.
Moreover, the results showed some shortcomings of the study. As mentioned above, the majority of projects is done by the students at home, while some of them are carried out under the supervision of a teaching assistant at UL FA. The real knowledge can thus only be proven at the midterm exams, which results in low grades. Nevertheless, we believe that the results acquired will help us dedicate more time to the groups where students performed poorly. In this way, we have already evaluated the midterm exam exercises and identified the content that is used less frequently and should be included in the future. We will also try to include other recognised spatial conception tests in the study and thus further develop the field of spatial conception.
D. KUŠAR ET AL.: THE IMPORTANCE OF A COMPREHENSIVE ANALYSIS OF STUDENTS’ CONTRIBUTIONS FOR SPATIAL CONCEPT DEVELOPMENT
THE 5TH ICGG CONFERENCE MONGEOMETRIJA 2016 PROCEEDINGS Belgrade: 23-26 June 2016 433
REFERENCES
1. Casey, B.,et al., 2008. Use of a storytelling context to improve girls' and boys' geometry skills inkindergarten. Journal of applied developmental psychology, 29(1). pp 29-48.
2. Guilford, J.P., 1996. Personality. McGraw-Hill, New York, USA.
3. Gorska, R., 2005. Modern Research on Spatial Abilities – An Overview and New Results. 11thScientific and professional Coloquium of CSCGCG: zbornik povzetkov. Varaždinske toplice, 18. – 21.September 2005, Croatian society for geometry and graphics, Zagreb.
4. Huttenlocher, J., Newcombe, N., and Vasilyeva, M., 1999. Spatial scaling in young children.Psychological Sciences, 10(5), pp 393-398.
5. Kušar, D., 2004. Prostorska predstava študentov Fakultete za arhitekturo v Ljubljani. AR. Arhitektura,raziskave, 1. pp 66-69.
6. Kušar, D., Volgemut, M., 2014. Thirteen years of MRT : results, options and dilemmas. Proceedingsof the 16th International Conference on Geometry and Graphics, Innsbruck, August 2014, Innsbruck,Innsbruck University Press, pp 1248-1256.
7. Law, D. J., Pellegrino, J., W., and Hunt, E., 1993. Comparing the tortoise and the hare: genderdifferences and experience in dynamic spatial reasoning. Psychological Science, 4(1), 35–40.
8. Linn, M. C., Petersen, A. C., 1986. A meta-analysis of gender differences in spatial ability:Implications for mathematics and science achievement. J. S. Hyde & M. C. Linn (Eds.), Thepsychology of gender: Advances through meta-analysis. Baltimore, Johns Hopkins University Press.
9. McGee, M.G., 1979. Human Spatial Abilities: Psychometric studies and environmental, genetic,hormonal and neurological influences, Psychological Bulletin, 86(5), 889-918.
10. Mohler, J., 2008: A review of spatial ability research. Engineering Design Graphics Journal, vol 72(2).
11. Piaget, J., Inhelder, B. 1971. The child's conception of space. F. J. Langdon & J. L. Lunzer, Trans.London, Routledge and Kegan Paul.
12. Saito, T., Suzuki, K., Jingu, T., 1998. Relations between spatial ability evaluated by a Mental cuttingtest and engineering graphics education. Proceedings 8th international conference on engineeringcomputer graphics and Descriptive geometry, ICGG. pp 231-235.
13. Schaik, L., 2008: Spatial Intelligence. John Wiley & Sons, Ltd Chichester.
14. Yilmaz, B., 2009. On the development and measurement of spatial ability. International ElectronicJournal of Elementary Education. 1(2).
A. ČUČAKOVIĆ ET AL.: THE POSSIBILITIES OF APPLICATION OF 3D DIGITAL MODELS IN CULTURAL HERITAGE OBJECT PROTECTION AND RECONSTRUCTION
434 THE 5TH ICGG CONFERENCE MONGEOMETRIJA 2016 PROCEEDINGS Belgrade: 23-26 June 2016
THE POSSIBILITIES OF APPLICATION OF 3D DIGITAL MODELS IN CULTURAL HERITAGE OBJECT PROTECTION AND
RECONSTRUCTION
Aleksandar Čučaković
Department of Mathematics, Physics and Descriptive Geometry, Faculty of Civil Engineering, University of Belgrade, Belgrade, Serbia
PhD., Associate Professor, [email protected]
Magdalena Dragović
Department of Mathematics, Physics and Descriptive Geometry, Faculty of Civil Engineering, University of Belgrade, Belgrade, Serbia
PhD., Assistant Professor, [email protected]
Marko Pejić
Department of Geodesy and Geoinformatics, Faculty of Civil Engineering, University of Belgrade, Belgrade, Serbia
PhD., Assistant Professor, [email protected]
Milesa Srećković
Institute of Physics, Faculty of Electrical Engineering, University of Belgrade, Belgrade, Serbia PhD., Professor, [email protected]
Jelena Pandžić
Department of Geodesy and Geoinformatics, Faculty of Civil Engineering, University of Belgrade, Belgrade, Serbia
MSc., PhD. candidate, [email protected]
ABSTRACT
Contemporary cultural heritage protection relies on precise technical documentation obtained by new technology accomplishments in the domain of 3D digital models. Both 3D models of the existing state of object and virtual ones are equally important in reconstruction and renewal processes. Accurate, textured and detailed 3D point cloud models of various objects, i.e. cultural heritage monuments, are outcomes of contemporary photogrammetric and laser scanning method application, aided by adequate software solutions. The authors presented procedures and results of terrestrial laser scanning and 3D modelling of a cultural heritage monument – the monastery church of the complex Kastaljan, located in the mountain region Kosmaj in Serbia.
The first part of presented research, concerning data acquisition, carried out using laser scanner and adequate software processing, resulted in 3D dense point cloud model and further 2D plan view along with characteristic cross sections. The possibilities of 3D model presentation, measurements and additional graphic operations were explored, through various software solutions aided by adequate technical support.
The second part of research elaborated on the reconstruction of the entire 3D model of the church in the complex Kastaljan, dated back to the 13th century, according to its architectural style characteristics.
Keywords: 3D digital documentation; laser scanning; 3D modelling; point cloud; cultural heritage monument; geometric analyses; 3D model visualisation
A. ČUČAKOVIĆ ET AL.: THE POSSIBILITIES OF APPLICATION OF 3D DIGITAL MODELS IN CULTURAL HERITAGE OBJECT PROTECTION AND RECONSTRUCTION
435 THE 5TH ICGG CONFERENCE MONGEOMETRIJA 2016 PROCEEDINGS Belgrade: 23-26 June 2016
SUBJECT CODE: Applied Geometry and Graphics - Modelling of objects and processes
1. INTRODUCTION
Contemporary digital 3D models vary due to modelling techniques. According to one's needs and potentials the adequate technique should be chosen. Applications of 3D models are numerous and actual in different branches, e.g. industry, geodesy, civil engineering, architecture, cultural heritage protection, medicine, etc. During the last decade the development of laser scanning technology and photogrammetric software solutions turned the focus onto 3D point cloud models (Quattrini and Baleani, 2015, Srećković et al., 2015a, Bijelić and Krasić, 2012, Alonso and Choi, 2014). The outcomes of 3D point cloud modelling became significant source for design, construction, operations and maintenance, marketing and proposals, forensics, security planning, education and entertainment, civil infrastructure, plant and industrial applications, cultural heritage protection and archaeology. This research aims are in the area of cultural heritage protection and reconstruction, concerning the application of 3D point cloud models and additional 3D geometric models created in various software.
1.1. The importance of 3D documentation in cultural heritage protection
Three-dimensional digital model of an existing building plays several important roles in cultural heritage protection and reconstruction. The importance of cultural heritage documentation is unquestionable. Cultural heritage documentation has a short definition as follows: "recording of the existent state and surroundings of the building by reports, drawings and photographs" (Yilmaz et al., 2007). Although this definition implies all kind of documents concerning cultural heritage object, it can be said that contemporary digital 3D model is a source of such defined tasks. After 3D model analyses, the reports on building phases (layers of the building visible in 3D model), evaluation of deformation or destruction of the building or its parts can be made; characteristic views of 3D model can be transformed into 2D drawings (elevations, facades and sections); various 2D images can be obtained from the same source. Historical goals are also included through transfer of information to the future generations by historical media presentations, virtual museums and 3D model libraries (Polić Radovanović et al., 2010, Horošavin, 2010). Most of the goals share cultural heritage monuments planned for reconstruction process and the ones already being reconstructed (Boeykens et al., 2008, Dragović et al., 2015).
1.2. The methodologies for obtaining 3D point cloud model
Nowadays various surveying methods like tacheometry, photogrammetry and laser scanning can be used to obtain data necessary for 3D modelling of complex structures (Pejić, 2013). Depending on the nature of the engineering task, i.e. structure characteristics, sometimes several methods have to be combined for proper data acquisition (Obidowski, 2003, Altuntas et al., 2014). In comparison with tacheometric surveying, photogrammetric method and laser scanning result not only in pure geometric data (point coordinates), but also in RGB values (colours) of object points. In the case of laser scanning these values allocated to points are obtained using a digital camera integrated in a laser scanner system. The combination of geometric data and colours makes photogrammetry and laser scanning particularly suitable for deriving realistic 3D models of various structures and thus for use in the area of cultural heritage protection and reconstruction (Yastikli, 2007, Obidowski, 2003, Altuntas et al., 2014). In this case terrestrial (close-range) photogrammetry and terrestrial laser scanning (TLS) are used although both of these methods have their airborne variants as well: aerial photogrammetry and airborne laser scanning (Lasaponara et al., 2011, Srećković et al., 2015b). And while photogrammetry means obtaining point coordinates from photos of a structure, laser scanning features a procedure for obtaining point coordinates similar to that of tacheometric surveying (measuring angles and distances) but much faster. Nevertheless, both photogrammetry and laser scanning result in point clouds of similar density (Pejić, 2013). Data post-processing in both cases is quite time-consuming compared with field work and requires computers with high performances and specialized software. Workflow for getting everything out of nothing involves data collecting in the field (obtaining photos or laser scans), data post-processing (e.g. filtering, registration, etc.), 3D modelling using adequate software and finally geometric analysis of a structure (Entwistle et al., 2009).
In this paper the procedure of obtaining architectural documentation from terrestrial laser scanning data aided by photographs is presented. The case study was the monastery church of the complex Kastaljan near Belgrade.
2. TERRESTRIAL LASER SCANNING PROCEDURE
Terrestrial laser scanning as a method for mass data acquisition collects geometric information on an object by measuring angles and distances towards object points. The result of terrestrial laser scanning is a point cloud consisting of a huge number of points. For each individual point in a point cloud its coordinates (X, Y and Z) and the intensity of the reflected laser beam are stored in the instruments' memory. More sophisticated scanning systems record mentioned RGB values of points using an integrated digital camera. Modern scanners enable
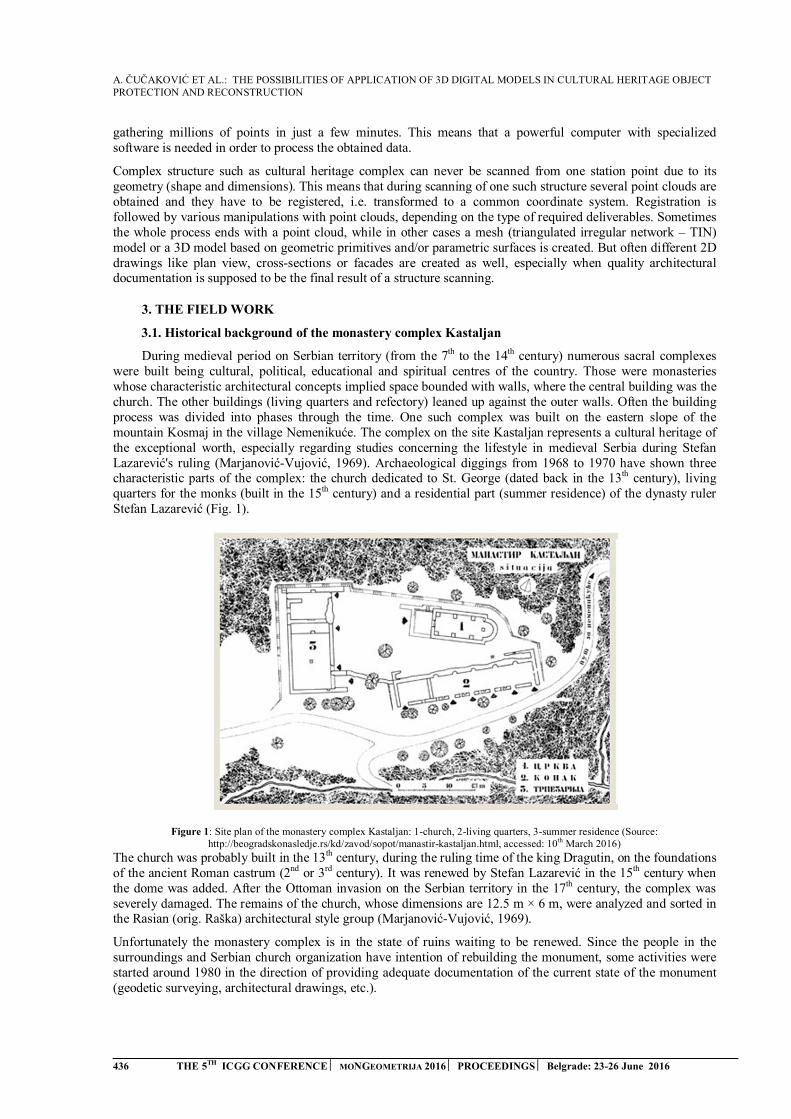
A. ČUČAKOVIĆ ET AL.: THE POSSIBILITIES OF APPLICATION OF 3D DIGITAL MODELS IN CULTURAL HERITAGE OBJECT PROTECTION AND RECONSTRUCTION
436 THE 5TH ICGG CONFERENCE MONGEOMETRIJA 2016 PROCEEDINGS Belgrade: 23-26 June 2016
gathering millions of points in just a few minutes. This means that a powerful computer with specialized software is needed in order to process the obtained data.
Complex structure such as cultural heritage complex can never be scanned from one station point due to its geometry (shape and dimensions). This means that during scanning of one such structure several point clouds are obtained and they have to be registered, i.e. transformed to a common coordinate system. Registration is followed by various manipulations with point clouds, depending on the type of required deliverables. Sometimes the whole process ends with a point cloud, while in other cases a mesh (triangulated irregular network – TIN) model or a 3D model based on geometric primitives and/or parametric surfaces is created. But often different 2D drawings like plan view, cross-sections or facades are created as well, especially when quality architectural documentation is supposed to be the final result of a structure scanning.
3. THE FIELD WORK
3.1. Historical background of the monastery complex Kastaljan
During medieval period on Serbian territory (from the 7th to the 14th century) numerous sacral complexes were built being cultural, political, educational and spiritual centres of the country. Those were monasteries whose characteristic architectural concepts implied space bounded with walls, where the central building was the church. The other buildings (living quarters and refectory) leaned up against the outer walls. Often the building process was divided into phases through the time. One such complex was built on the eastern slope of the mountain Kosmaj in the village Nemenikuće. The complex on the site Kastaljan represents a cultural heritage of the exceptional worth, especially regarding studies concerning the lifestyle in medieval Serbia during Stefan Lazarević's ruling (Marjanović-Vujović, 1969). Archaeological diggings from 1968 to 1970 have shown three characteristic parts of the complex: the church dedicated to St. George (dated back in the 13th century), living quarters for the monks (built in the 15th century) and a residential part (summer residence) of the dynasty ruler Stefan Lazarević (Fig. 1).
Figure 1: Site plan of the monastery complex Kastaljan: 1-church, 2-living quarters, 3-summer residence (Source: http://beogradskonasledje.rs/kd/zavod/sopot/manastir-kastaljan.html, accessed: 10th March 2016)
The church was probably built in the 13th century, during the ruling time of the king Dragutin, on the foundations of the ancient Roman castrum (2nd or 3rd century). It was renewed by Stefan Lazarević in the 15th century when the dome was added. After the Ottoman invasion on the Serbian territory in the 17th century, the complex was severely damaged. The remains of the church, whose dimensions are 12.5 m × 6 m, were analyzed and sorted in the Rasian (orig. Raška) architectural style group (Marjanović-Vujović, 1969).
Unfortunately the monastery complex is in the state of ruins waiting to be renewed. Since the people in the surroundings and Serbian church organization have intention of rebuilding the monument, some activities were started around 1980 in the direction of providing adequate documentation of the current state of the monument (geodetic surveying, architectural drawings, etc.).
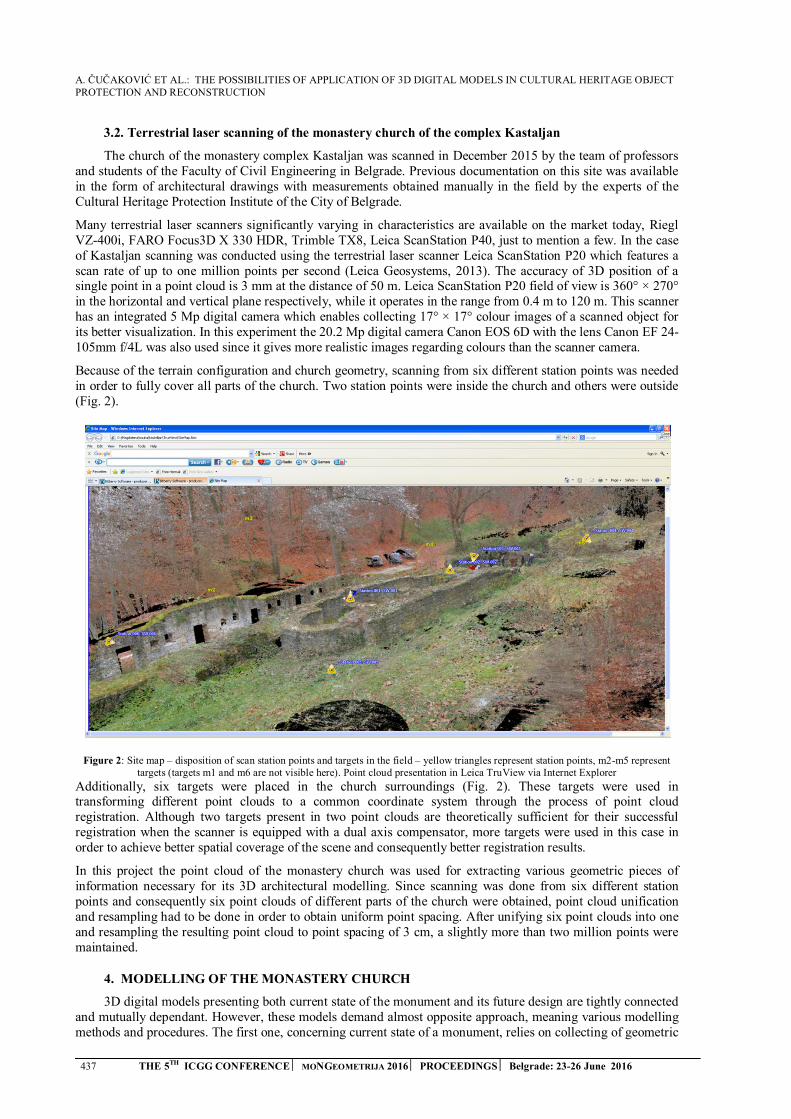
A. ČUČAKOVIĆ ET AL.: THE POSSIBILITIES OF APPLICATION OF 3D DIGITAL MODELS IN CULTURAL HERITAGE OBJECT PROTECTION AND RECONSTRUCTION
437 THE 5TH ICGG CONFERENCE MONGEOMETRIJA 2016 PROCEEDINGS Belgrade: 23-26 June 2016
3.2. Terrestrial laser scanning of the monastery church of the complex Kastaljan
The church of the monastery complex Kastaljan was scanned in December 2015 by the team of professors and students of the Faculty of Civil Engineering in Belgrade. Previous documentation on this site was available in the form of architectural drawings with measurements obtained manually in the field by the experts of the Cultural Heritage Protection Institute of the City of Belgrade.
Many terrestrial laser scanners significantly varying in characteristics are available on the market today, Riegl VZ-400i, FARO Focus3D X 330 HDR, Trimble TX8, Leica ScanStation P40, just to mention a few. In the case of Kastaljan scanning was conducted using the terrestrial laser scanner Leica ScanStation P20 which features a scan rate of up to one million points per second (Leica Geosystems, 2013). The accuracy of 3D position of a single point in a point cloud is 3 mm at the distance of 50 m. Leica ScanStation P20 field of view is 360° × 270° in the horizontal and vertical plane respectively, while it operates in the range from 0.4 m to 120 m. This scanner has an integrated 5 Mp digital camera which enables collecting 17° × 17° colour images of a scanned object for its better visualization. In this experiment the 20.2 Mp digital camera Canon EOS 6D with the lens Canon EF 24-105mm f/4L was also used since it gives more realistic images regarding colours than the scanner camera.
Because of the terrain configuration and church geometry, scanning from six different station points was needed in order to fully cover all parts of the church. Two station points were inside the church and others were outside (Fig. 2).
Figure 2: Site map – disposition of scan station points and targets in the field – yellow triangles represent station points, m2-m5 represent targets (targets m1 and m6 are not visible here). Point cloud presentation in Leica TruView via Internet Explorer
Additionally, six targets were placed in the church surroundings (Fig. 2). These targets were used in transforming different point clouds to a common coordinate system through the process of point cloud registration. Although two targets present in two point clouds are theoretically sufficient for their successful registration when the scanner is equipped with a dual axis compensator, more targets were used in this case in order to achieve better spatial coverage of the scene and consequently better registration results.
In this project the point cloud of the monastery church was used for extracting various geometric pieces of information necessary for its 3D architectural modelling. Since scanning was done from six different station points and consequently six point clouds of different parts of the church were obtained, point cloud unification and resampling had to be done in order to obtain uniform point spacing. After unifying six point clouds into one and resampling the resulting point cloud to point spacing of 3 cm, a slightly more than two million points were maintained.
4. MODELLING OF THE MONASTERY CHURCH
3D digital models presenting both current state of the monument and its future design are tightly connected and mutually dependant. However, these models demand almost opposite approach, meaning various modelling methods and procedures. The first one, concerning current state of a monument, relies on collecting of geometric
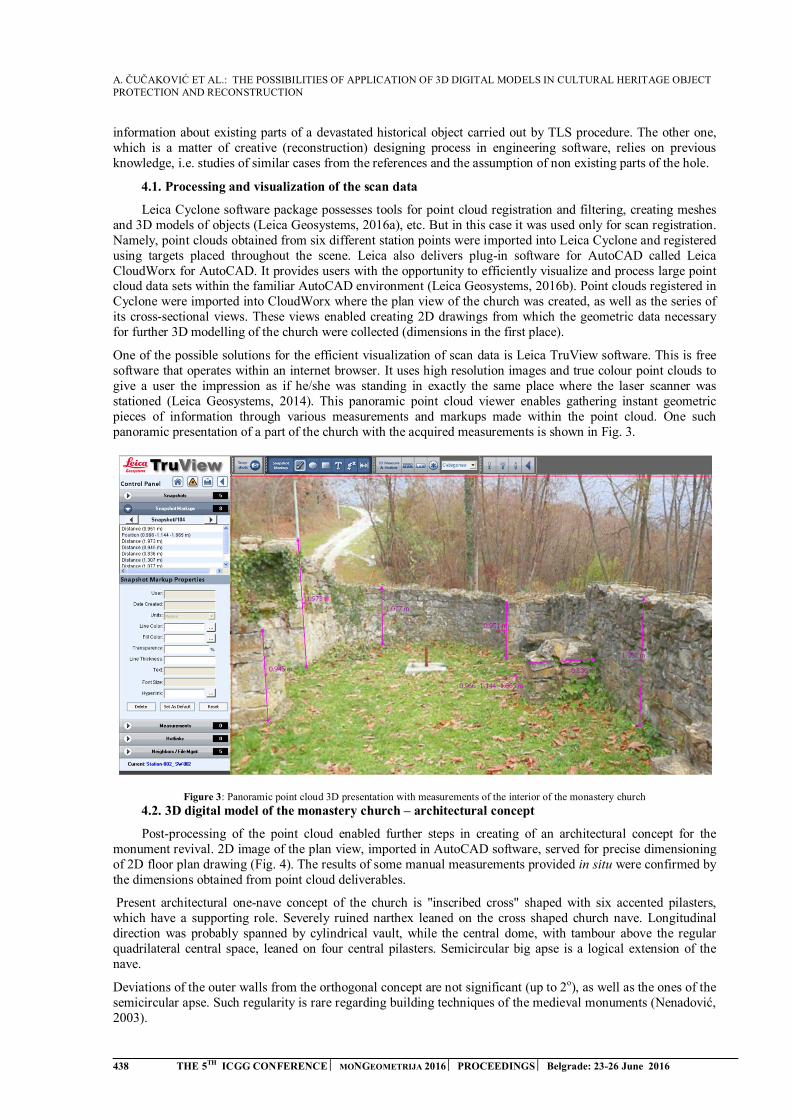
A. ČUČAKOVIĆ ET AL.: THE POSSIBILITIES OF APPLICATION OF 3D DIGITAL MODELS IN CULTURAL HERITAGE OBJECT PROTECTION AND RECONSTRUCTION
438 THE 5TH ICGG CONFERENCE MONGEOMETRIJA 2016 PROCEEDINGS Belgrade: 23-26 June 2016
information about existing parts of a devastated historical object carried out by TLS procedure. The other one, which is a matter of creative (reconstruction) designing process in engineering software, relies on previous knowledge, i.e. studies of similar cases from the references and the assumption of non existing parts of the hole.
4.1. Processing and visualization of the scan data
Leica Cyclone software package possesses tools for point cloud registration and filtering, creating meshes and 3D models of objects (Leica Geosystems, 2016a), etc. But in this case it was used only for scan registration. Namely, point clouds obtained from six different station points were imported into Leica Cyclone and registered using targets placed throughout the scene. Leica also delivers plug-in software for AutoCAD called Leica CloudWorx for AutoCAD. It provides users with the opportunity to efficiently visualize and process large point cloud data sets within the familiar AutoCAD environment (Leica Geosystems, 2016b). Point clouds registered in Cyclone were imported into CloudWorx where the plan view of the church was created, as well as the series of its cross-sectional views. These views enabled creating 2D drawings from which the geometric data necessary for further 3D modelling of the church were collected (dimensions in the first place).
One of the possible solutions for the efficient visualization of scan data is Leica TruView software. This is free software that operates within an internet browser. It uses high resolution images and true colour point clouds to give a user the impression as if he/she was standing in exactly the same place where the laser scanner was stationed (Leica Geosystems, 2014). This panoramic point cloud viewer enables gathering instant geometric pieces of information through various measurements and markups made within the point cloud. One such panoramic presentation of a part of the church with the acquired measurements is shown in Fig. 3.
Figure 3: Panoramic point cloud 3D presentation with measurements of the interior of the monastery church
4.2. 3D digital model of the monastery church – architectural concept
Post-processing of the point cloud enabled further steps in creating of an architectural concept for the monument revival. 2D image of the plan view, imported in AutoCAD software, served for precise dimensioning of 2D floor plan drawing (Fig. 4). The results of some manual measurements provided in situ were confirmed by the dimensions obtained from point cloud deliverables.
Present architectural one-nave concept of the church is "inscribed cross" shaped with six accented pilasters, which have a supporting role. Severely ruined narthex leaned on the cross shaped church nave. Longitudinal direction was probably spanned by cylindrical vault, while the central dome, with tambour above the regular quadrilateral central space, leaned on four central pilasters. Semicircular big apse is a logical extension of the nave.
Deviations of the outer walls from the orthogonal concept are not significant (up to 2o), as well as the ones of the semicircular apse. Such regularity is rare regarding building techniques of the medieval monuments (Nenadović, 2003).
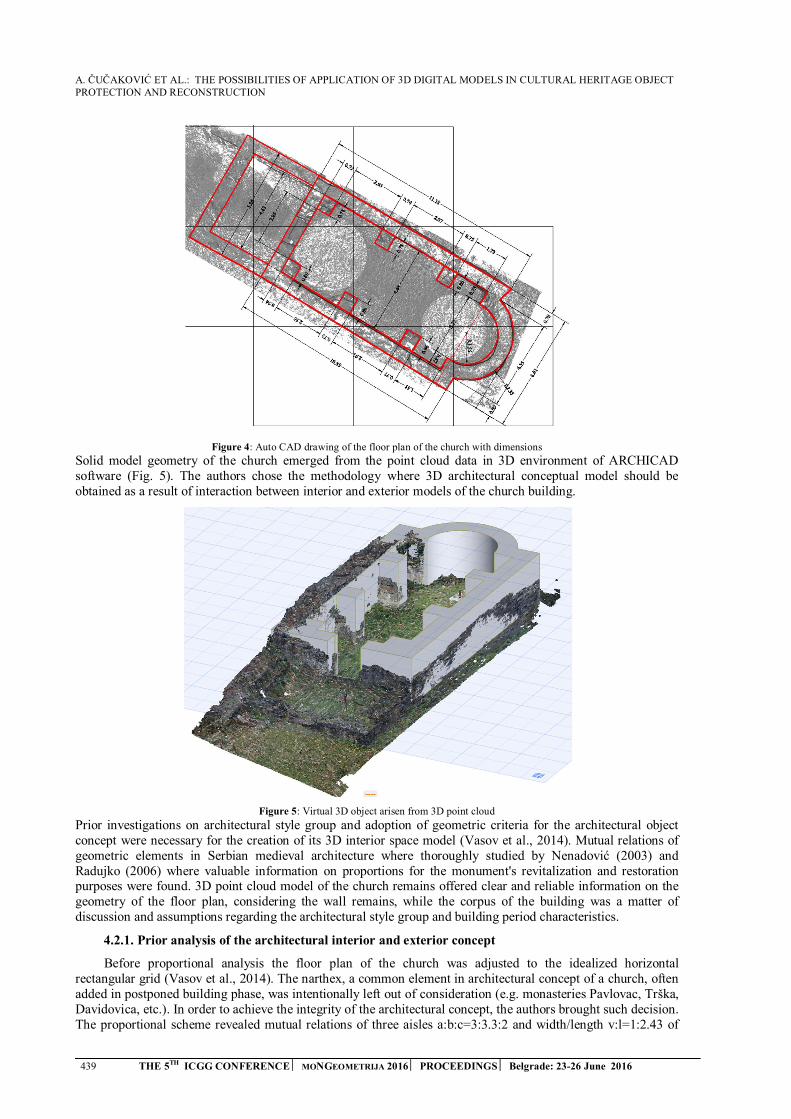
A. ČUČAKOVIĆ ET AL.: THE POSSIBILITIES OF APPLICATION OF 3D DIGITAL MODELS IN CULTURAL HERITAGE OBJECT PROTECTION AND RECONSTRUCTION
439 THE 5TH ICGG CONFERENCE MONGEOMETRIJA 2016 PROCEEDINGS Belgrade: 23-26 June 2016
Figure 4: Auto CAD drawing of the floor plan of the church with dimensions
Solid model geometry of the church emerged from the point cloud data in 3D environment of ARCHICAD software (Fig. 5). The authors chose the methodology where 3D architectural conceptual model should be obtained as a result of interaction between interior and exterior models of the church building.
Figure 5: Virtual 3D object arisen from 3D point cloud
Prior investigations on architectural style group and adoption of geometric criteria for the architectural object concept were necessary for the creation of its 3D interior space model (Vasov et al., 2014). Mutual relations of geometric elements in Serbian medieval architecture where thoroughly studied by Nenadović (2003) and Radujko (2006) where valuable information on proportions for the monument's revitalization and restoration purposes were found. 3D point cloud model of the church remains offered clear and reliable information on the geometry of the floor plan, considering the wall remains, while the corpus of the building was a matter of discussion and assumptions regarding the architectural style group and building period characteristics.
4.2.1. Prior analysis of the architectural interior and exterior concept
Before proportional analysis the floor plan of the church was adjusted to the idealized horizontal rectangular grid (Vasov et al., 2014). The narthex, a common element in architectural concept of a church, often added in postponed building phase, was intentionally left out of consideration (e.g. monasteries Pavlovac, Trška, Davidovica, etc.). In order to achieve the integrity of the architectural concept, the authors brought such decision. The proportional scheme revealed mutual relations of three aisles a:b:c=3:3.3:2 and width/length v:l=1:2.43 of
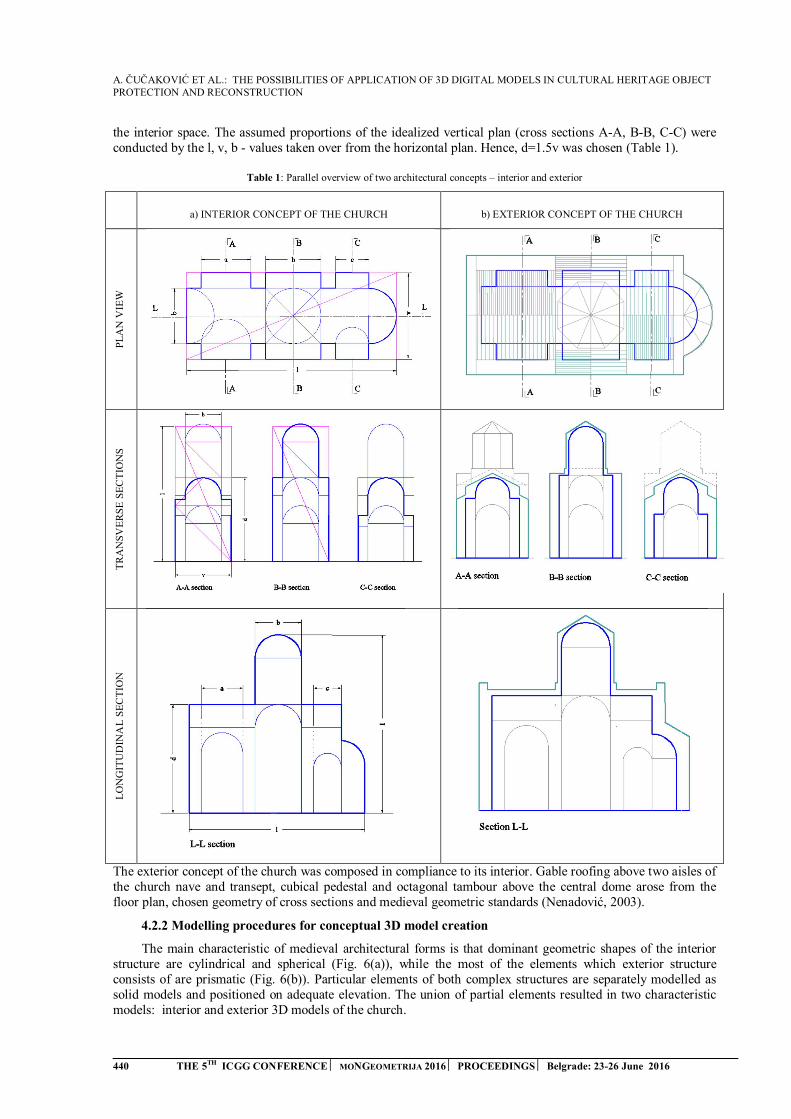
A. ČUČAKOVIĆ ET AL.: THE POSSIBILITIES OF APPLICATION OF 3D DIGITAL MODELS IN CULTURAL HERITAGE OBJECT PROTECTION AND RECONSTRUCTION
440 THE 5TH ICGG CONFERENCE MONGEOMETRIJA 2016 PROCEEDINGS Belgrade: 23-26 June 2016
the interior space. The assumed proportions of the idealized vertical plan (cross sections A-A, B-B, C-C) were conducted by the l, v, b - values taken over from the horizontal plan. Hence, d=1.5v was chosen (Table 1).
Table 1: Parallel overview of two architectural concepts – interior and exterior
a) INTERIOR CONCEPT OF THE CHURCH b) EXTERIOR CONCEPT OF THE CHURCH
PL
AN
VIE
W
TR
AN
SV
ER
SE
SE
CT
ION
S
LO
NG
ITU
DIN
AL
SE
CT
ION
The exterior concept of the church was composed in compliance to its interior. Gable roofing above two aisles of the church nave and transept, cubical pedestal and octagonal tambour above the central dome arose from the floor plan, chosen geometry of cross sections and medieval geometric standards (Nenadović, 2003).
4.2.2 Modelling procedures for conceptual 3D model creation
The main characteristic of medieval architectural forms is that dominant geometric shapes of the interior structure are cylindrical and spherical (Fig. 6(a)), while the most of the elements which exterior structure consists of are prismatic (Fig. 6(b)). Particular elements of both complex structures are separately modelled as solid models and positioned on adequate elevation. The union of partial elements resulted in two characteristic models: interior and exterior 3D models of the church.

A. ČUČAKOVIĆ ET AL.: THE POSSIBILITIES OF APPLICATION OF 3D DIGITAL MODELS IN CULTURAL HERITAGE OBJECT PROTECTION AND RECONSTRUCTION
441 THE 5TH ICGG CONFERENCE MONGEOMETRIJA 2016 PROCEEDINGS Belgrade: 23-26 June 2016
Three vaulted alcoves varying in dimensions lean on the dominant central vaulted space. Semi-spherical element above central isle, cut with four vertical planes, represents the substructure for final pendentives. Cylindrical tambour with calotte above it, reaches the highest point of the central inner space. Half cylindrical apse is the ending element along the major axis of the interior model. The modelling procedures rely on extruding of characteristic profiles (in vertical planes) or creation of geometric primitives cut with adequate planes (Fig. 6(a)).
The main corpus of the exterior 3D model is defined by its transverse cross sections of the first and third isle (sections A-A and C-C). The east and west facade walls have simplified version of this geometry. The same logic is followed concerning the transept creation (the central extension of the side facades). The cubical pedestal and dome structure are designed as regular prismatic shapes (four and eight sided) with pyramidal ending (Fig. 6(b)).
(a) (b)
Figure 6: The two conceptual 3D models of the church - interior model (a) and exterior model (b)
The final – conceptual 3D model of the church was obtained by subtracting the interior space model from the exterior model. For the presentation purposes of the final modelling results, longitudinal cutting plane was set along the major axis of the church (Fig. 7).
(a) (b)
Figure 7: Final phases of conceptual 3D church model: two models interfering (a) and subtracted model (b)
5. CONCLUSION
This research merged some of the consecutive phases in the workflow of cultural heritage monument protection and revitalization which characterize 3D digital modelling. The first phase is collecting of 3D data by terrestrial laser scanning, while the second phase involves creating architectural documentation of the existing state of the monument and 3D virtual model (architectural concept proposal) of the renewed monument based on the collected 3D data. Although it is not rare nowadays for a point cloud itself to be considered a final TLS product, in this project it served as a basis for extracting various geometric pieces of information necessary for 3D architectural modelling of the monastery church.
The result of TLS was detailed 3D point cloud (with its deliverables) of the monastery church of the complex Kastaljan. 3D virtual model of the renewed church inside the complex Kastaljan based on this point cloud consists of two conceptual geometric models representing interior and exterior architectural forms.
A. ČUČAKOVIĆ ET AL.: THE POSSIBILITIES OF APPLICATION OF 3D DIGITAL MODELS IN CULTURAL HERITAGE OBJECT PROTECTION AND RECONSTRUCTION
442 THE 5TH ICGG CONFERENCE MONGEOMETRIJA 2016 PROCEEDINGS Belgrade: 23-26 June 2016
Here applied methodology for creation of 3D models, where two complex structures of the church exterior and interior mutually interact, has shown time efficiency and reliability in prior analyses for architectural design proposal. The possibility of fitting the 3D virtual model into 3D point cloud model in compatible software solutions enabled one more check point in defining the final design proposal of the restored monument.
Further investigations may consider possible variations of the exterior model: designing of the roof surfaces (e.g. curved shapes), tambour (e.g. cylindrical surface), or gable (e.g. curved ending of the wall), which strongly depend on authors' experience in reconstruction and revitalization of medieval Serbian monuments, reliable historical information and knowledge.
ACKNOWLEDGEMENTS
This paper is financially supported by the Ministry of Education, Science and Technological Development of the Republic of Serbia through Contracts No. TR 36009 and TR 36008.
REFERENCES Alonso, A. and Choi, M. H., 2014. Automatic range scan point cloud registration using hierarchical level and feature recognition filters. Proceedings of the 16th International Conference on Geometry and Graphics, ISGG, Innsbruck, Austria. pp. 103-114.
Altuntas, C., Yildiz, F. and Baygul, E., 2014. Documentation of historical structures in the courtyard of Mevlana museum by terrestrial lidar and photogrammetry. Mediterranean Archaeology and Archaeometry, 14(2). pp.233-242.
Bijelić, I. and Krasić, S., 2012. Significance of digital photogrammetry in protection of cultural heritage. Proceedings of the 3rd International Conference on Geometry and Graphics, MoNGeometrija 2012, Novi Sad, Serbia. pp. 75-84.
Boeykens, S., Quintero, M. S. and Neuckermans, H., 2008. Improving architectural design analysis using 3D modelling and visualization techniques. Proceedings of the 14th International Conference on Virtual Systems and Multimedia Dedicated to Digital heritage, VSMM 2008, Limassol, Cyprus. pp. 67-73.
Dragović, М., Čučaković, A. and Srećković, M., 2015. Geometric approach to the revitalization process of medieval Serbian monasteries. Proceedings of the 13th International Conference on Engineering and Computer Graphics, BALTGRAF-13, Vilnius, Lithuania. pp. 47-53.
Entwistle, J. A., McCaffrey, K. J. W. and Abrahams, P. W., 2009. Three-dimensional (3D) visualization: the application of terrestrial laser scanning in the investigation of historical Scottish farming townships. Journal of Archaeological Science, 36. pp. 860-866.
Horošavin, B., 2010. The possibilities of Implementation of 3D Visualisation Technology in the Domain of Cultural Heritage Preservation. Pregled NCD, 17. pp. 25-31.
Lasaponara, R., Coluzzi, R. and Masini, N., 2011. Flights into the past: full-waveform airborne laser scanning data for archaeological investigation, Journal of Archaeological Science, 38. pp. 2061-2070.
Leica Geosystems, 2013. http://www.leica-geosystems.de/downloads123/hds/hds/ScanStation_P20/broch-ures-datasheet/Leica_ScanStation_P20_DAT_en.pdf [Accessed: 10th March 2016].
Leica Geosystems, 2014. http://hds.leica-geosystems.com/downloads123/hds/hds/cyclone/brochures-datasheet/Cyclone_PUBLISHER_TruView_DS_en.pdf [Accessed: 10th March 2016].
Leica Geosystems, 2016a. http://hds.leica-geosystems.com/en/Leica-Cyclone_6515.htm [Accessed: 10th March 2016].
Leica Geosystems, 2016b. http://hds.leica-geosystems.com/downloads123/hds/hds/cloudworx/brochures-datasheet/Cloudworx_Autocad_DataSheet_en.pdf [Accessed: 10th March 2016].
Marjanović-Vujović, G., 1969. Kasteljan, Nemenikuće. Arheološki pregled, 11. pp. 234-236.
Nenadović, S. M., 2003. Građevinske tehnike u srednjevekovnoj Srbiji. Prosveta, Beograd, Srbija (in Serbian).
Obidowski, R., 2003. Final report on combining photogrammetry and 3D laser scanning for the 3D data acquisition and modelling services project. Array Systems Computing Inc., Toronto.
Pejić, M., 2013. Accuracy of the objects modeling using terrestrial laser scanning technology. PhD thesis. Faculty of Civil Engineering, Belgrade, Serbia (in Serbian).

A. ČUČAKOVIĆ ET AL.: THE POSSIBILITIES OF APPLICATION OF 3D DIGITAL MODELS IN CULTURAL HERITAGE OBJECT PROTECTION AND RECONSTRUCTION
443 THE 5TH ICGG CONFERENCE MONGEOMETRIJA 2016 PROCEEDINGS Belgrade: 23-26 June 2016
Polić Radovanović, S., Ristić, S., Jegdić, B. and Nikolić, Z., 2010. Methodological and technical aspects of application of new techniques in cultural heritage protection. Institute Goša & Central Insitute for Conservation in Belgrade, Belgrade, Serbia (in Serbian).
Quattrini, R. and Baleani, E., 2015. Theoretical background and historical analysis for 3D reconstruction model. Villa Thiene at Cicogna. Journal of Cultural Heritage, 16. pp. 119-125.
Radujko, M., 2006. Koporin. Faculty of Philosophy & Institute of Art History & Museum of Serbian Orthodox Church, Belgrade, Serbia (in Serbian).
Srećković, M., Dragović, M., Čučaković, A., Borna, N., Polić, S., Bojanić, S. and Nešić, S., 2015a. Potential and contemporary laser applications with parallel techniques in the processes of monitoring, protection and restoration of cultural heritage objects. Proceedings of the Second International Conference Modern Methods of Testing and Evaluation in Science, NANT, Belgrade, Serbia. pp. 94-104.
Srećković, M., Pavlović, M., Veinović, Z. and Ostojić S., 2015b. Lidars, Ladars, Colidars and Dials. Studio 789 Team, Belgrade, Serbia (in Serbian).
Vasov, M., Bogdanović, V., Ranđelović, D. and Krstić, H., 2014. Geometry of interior space of church buildings of medieval Serbian architecture, Proceedings of the 4th International Conference on Geometry and Graphics, MoNGeometrija 2014, Vlasina, Serbia. pp. 110-119.
Yastikli, N., 2007. Documentation of cultural heritage using digital photogrammetry and laser scanning. Journal of Cultural Heritage, 8. pp 423-427.
Yilmaz, H. M., Yakar, M., Gulec, S. A. and Dulgerler, O. N., 2007. Importance of digital close-range photogrammetry in documentation of cultural heritage. Journal of Cultural Heritage, 8. pp 428-433.
S. GRCAK ET AL.: THE PRESENTATION OF AN EXISTING CITY BLOCK LOCATED ON DR ZORAN DJINDJIC BOULEVARD IN NIS BY USING AR MEDIA
THE 5TH ICGG CONFERENCE MONGEOMETRIJA 2016 PROCEEDINGS Belgrade: 23-26 June 2016 444
THE PRESENTATION OF AN EXISTING CITY BLOCK LOCATED ON DR ZORAN DJINDJIC BOULEVARD IN NIS BY USING AR MEDIA
Stefan Grcak Department of Architecture, University of Nis, Nis, Republic of Serbia
2nd year student, [email protected]
Stefan Djukic Department of Architecture, University of Nis, Nis, Republic of Serbia
2nd year student, [email protected]
Vukasin Vasic Department of Architecture, University of Nis, Nis, Republic of Serbia
2nd year student, [email protected]
Petar Pejic Department of Architecture, University of Nis, Nis, Republic of Serbia
PhD student, [email protected]
Sonja Krasic Department of Architecture, University of Nis, Nis, Republic of Serbia
PhD, Associate Professor, [email protected]
POSTER PRESENTATION
M. VELJKOVIC ET AL.: USE OF THE TORUS IN THE DESIGN OF MODERN ARCHITECTURAL STRUCTURES
445 THE 5TH ICGG CONFERENCE MONGEOMETRIJA 2016 PROCEEDINGS Belgrade: 23-26 June 2016
USE OF THE TORUS IN THE DESIGN OF MODERN ARCHITECTURAL STRUCTURES
Milica Veljković
Faculty of Civil Engineering and Architecture - University of Niš PhD student, [email protected]
Sonja Krasić
Faculty of Civil Engineering and Architecture - University of Niš PhD., Associate Professor, [email protected]
Petar Pejić
Faculty of Civil Engineering and Architecture - University of Niš PhD student, [email protected]
ABSTRACT
The use of different surface geometries in the design of architectural structures enriches, enhances and modernizes the form of the object. Double-curved surfaces are often applied in modern architecture. However, a special working surface of the fourth order, torus (anuloid), is one of the rarely-used geometric surfaces for the construction of objects. The use of the torus was the most topical during sixties of the 20th century, while in modern architecture it has been neglected. Very creative clips can be obtained by a variety of straight intersections of the torus, which can be then used to form a modern architectural object. Any form of the foundation of the object can be made by folding these clips appropriately. Mounting facility construction simplifies and speeds up the execution of the construction work, which affects the cost of the object. In this paper, the idea of making as a small number of different molds as possible for the prefabrication of mounting elements in the form of a torus. In addition, it aims at encouraging the current and future architects to use this surface for shaping, which will contribute to the attractiveness and monumentality of the objects.
Keywords: torus, geometric surfaces, prefabrication, modern architecture
1. INTRODUCTION
Designing of architectural structures implies the use of different surface geometries and shapes, their integration, harmony and tune, as well as the overall aesthetic impression obtained by matching their mass, position, and proportions. The use of line-generated polyhedral surfaces in constructing buildings is the most common and easiest for the construction. However, charm and reviving of architectural structures is the appearance of curves, curved surface, i.e. the deviation from monotonous straight lines, or their combination. In the history of the construction of architectural objects using the curved surfaces, the twice curved revolving surface, torus, has been used at least.
The word torus comes from Latin, meaning ‘cushion’. In geometry, torus is a surface of revolution, obtained by revolving a circle in 3D space about an axis coplanar with the circle. Sometimes, torus is called a ‘cosmic doughnut’ [1]. Toric surfaces are widely applied in tires, bracelets, chain links, pipes and elbows, vaults covers and so on [2]. Torus is one of the special revolving surfaces of the fourth order, which arises from the rotation of a circle around a permanent straight line, which is in the plane of the circle. The circle that rotates is a semi-meridian, while surfaces perpendicular to the axis intersects the torus along concentric circles, which are called parallels [3]. Depending on the position of the circle with respect to the straight line around which it rotates, there are three types of torus: ring-, horn- and spindle-shaped (Fig. 1). If the axis of rotation does not touch the surface of the circle, it is called ring torus or just torus. In the event that the axis of rotation tangents circles then this surface is called horn torus, while if the axis of rotation intersects the circle, a spindle torus is generated [4].
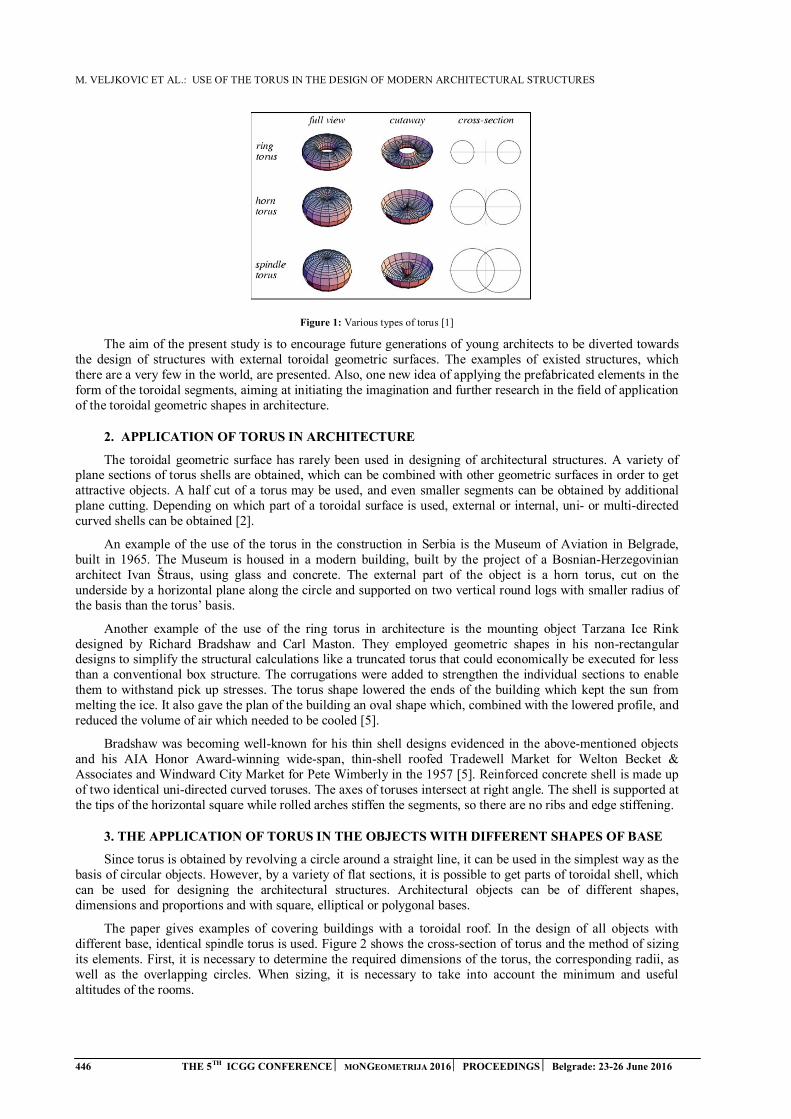
M. VELJKOVIC ET AL.: USE OF THE TORUS IN THE DESIGN OF MODERN ARCHITECTURAL STRUCTURES
446 THE 5TH ICGG CONFERENCE MONGEOMETRIJA 2016 PROCEEDINGS Belgrade: 23-26 June 2016
Figure 1: Various types of torus [1]
The aim of the present study is to encourage future generations of young architects to be diverted towards the design of structures with external toroidal geometric surfaces. The examples of existed structures, which there are a very few in the world, are presented. Also, one new idea of applying the prefabricated elements in the form of the toroidal segments, aiming at initiating the imagination and further research in the field of application of the toroidal geometric shapes in architecture.
2. APPLICATION OF TORUS IN ARCHITECTURE
The toroidal geometric surface has rarely been used in designing of architectural structures. A variety of plane sections of torus shells are obtained, which can be combined with other geometric surfaces in order to get attractive objects. A half cut of a torus may be used, and even smaller segments can be obtained by additional plane cutting. Depending on which part of a toroidal surface is used, external or internal, uni- or multi-directed curved shells can be obtained [2].
An example of the use of the torus in the construction in Serbia is the Museum of Aviation in Belgrade, built in 1965. The Museum is housed in a modern building, built by the project of a Bosnian-Herzegovinian architect Ivan Štraus, using glass and concrete. The external part of the object is a horn torus, cut on the underside by a horizontal plane along the circle and supported on two vertical round logs with smaller radius of the basis than the torus’ basis.
Another example of the use of the ring torus in architecture is the mounting object Tarzana Ice Rink designed by Richard Bradshaw and Carl Maston. They employed geometric shapes in his non-rectangular designs to simplify the structural calculations like a truncated torus that could economically be executed for less than a conventional box structure. The corrugations were added to strengthen the individual sections to enable them to withstand pick up stresses. The torus shape lowered the ends of the building which kept the sun from melting the ice. It also gave the plan of the building an oval shape which, combined with the lowered profile, and reduced the volume of air which needed to be cooled [5].
Bradshaw was becoming well-known for his thin shell designs evidenced in the above-mentioned objects and his AIA Honor Award-winning wide-span, thin-shell roofed Tradewell Market for Welton Becket & Associates and Windward City Market for Pete Wimberly in the 1957 [5]. Reinforced concrete shell is made up of two identical uni-directed curved toruses. The axes of toruses intersect at right angle. The shell is supported at the tips of the horizontal square while rolled arches stiffen the segments, so there are no ribs and edge stiffening.
3. THE APPLICATION OF TORUS IN THE OBJECTS WITH DIFFERENT SHAPES OF BASE
Since torus is obtained by revolving a circle around a straight line, it can be used in the simplest way as the basis of circular objects. However, by a variety of flat sections, it is possible to get parts of toroidal shell, which can be used for designing the architectural structures. Architectural objects can be of different shapes, dimensions and proportions and with square, elliptical or polygonal bases.
The paper gives examples of covering buildings with a toroidal roof. In the design of all objects with different base, identical spindle torus is used. Figure 2 shows the cross-section of torus and the method of sizing its elements. First, it is necessary to determine the required dimensions of the torus, the corresponding radii, as well as the overlapping circles. When sizing, it is necessary to take into account the minimum and useful altitudes of the rooms.

M. VELJKOVIC ET AL.: USE OF THE TORUS IN THE DESIGN OF MODERN ARCHITECTURAL STRUCTURES
447 THE 5TH ICGG CONFERENCE MONGEOMETRIJA 2016 PROCEEDINGS Belgrade: 23-26 June 2016
Figure 2: Cross-section of the torus. Method of sizing the torus used for covering objects
Based on the cross section of the torus, the corresponding dimensions of the object’s base can be determined, or vice versa. In order to ensure the stability of the facility, while not disturbing the aesthetic appearance, the idea is that in some parts of the building, the parts of the torus, which go down from the roof to the ground, are kept. Figure 3 shows the top view of torus, presented by the largest circle, with the contours of the base of different shapes: squared, circular, elliptical and hexagonal. There is a supporting pillar in the centre of the object. Water drainage is provided on both sides of the curvature as well as towards the external and inner sides of the toroidal shell, i.e. in the centre of the object where the vertical gutter placed in the middle of the hollow supporting pillar. Roof-supporting elements rely on a central pillar and they are based in the ground, around the perimeter of the torus, while the non-supporting elements of the roof are connected to the central pillar by a console and with the supporting roof elements. Shadowed parts in Figure 3 represent the roof supporting elements, parts of the torus, which extend to the ground. Supporting roof elements that are based at the external side of the building are identical in all examples.
Figure 3: The top view of torus with the contours of the base of different shapes: squared, circular, elliptical and hexagonal.
The procedure of obtaining the appropriate geometric shapes for designing an imaginary object is shown in Figure 4. It is necessary that the toroidal geometrical surface is first modeled by a software package, then the unnecessary parts of the torus are eliminated by the appropriate cut-off planes while the necessary parts are retained.
Figure 4: Gradual modeling of the roof of the building with a rectangular base
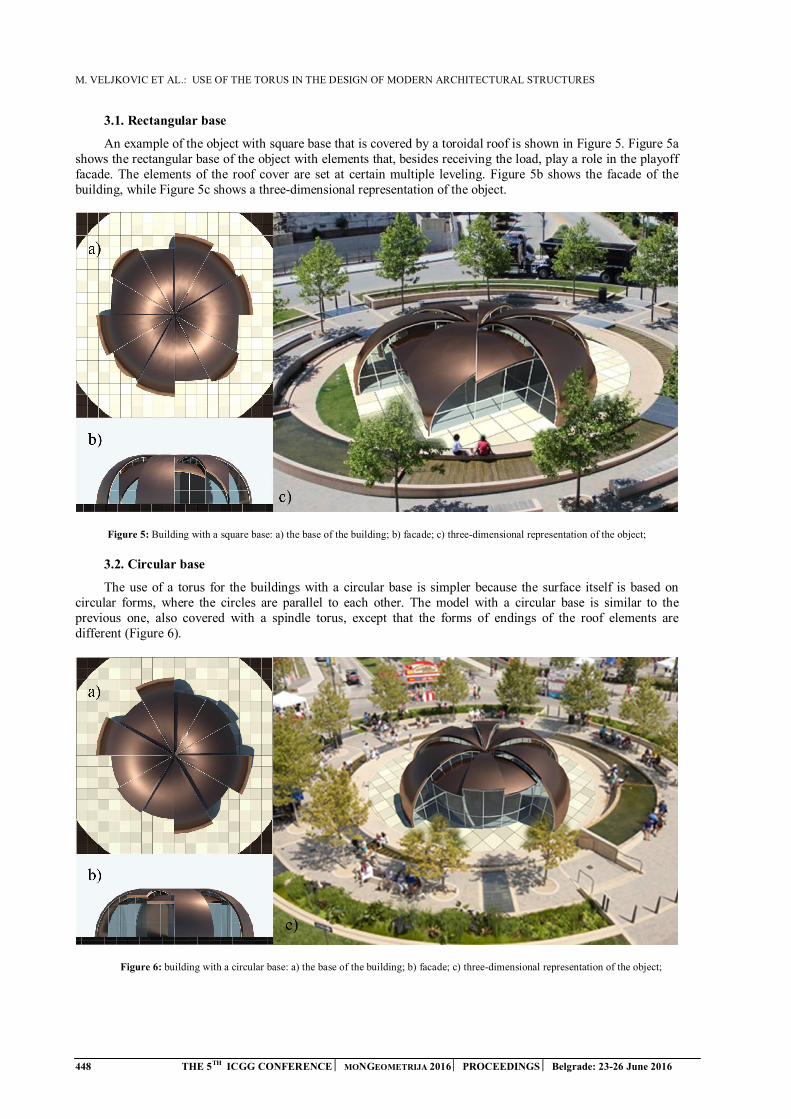
M. VELJKOVIC ET AL.: USE OF THE TORUS IN THE DESIGN OF MODERN ARCHITECTURAL STRUCTURES
448 THE 5TH ICGG CONFERENCE MONGEOMETRIJA 2016 PROCEEDINGS Belgrade: 23-26 June 2016
3.1. Rectangular base
An example of the object with square base that is covered by a toroidal roof is shown in Figure 5. Figure 5a shows the rectangular base of the object with elements that, besides receiving the load, play a role in the playoff facade. The elements of the roof cover are set at certain multiple leveling. Figure 5b shows the facade of the building, while Figure 5c shows a three-dimensional representation of the object.
Figure 5: Building with a square base: a) the base of the building; b) facade; c) three-dimensional representation of the object;
3.2. Circular base
The use of a torus for the buildings with a circular base is simpler because the surface itself is based on circular forms, where the circles are parallel to each other. The model with a circular base is similar to the previous one, also covered with a spindle torus, except that the forms of endings of the roof elements are different (Figure 6).
Figure 6: building with a circular base: a) the base of the building; b) facade; c) three-dimensional representation of the object;
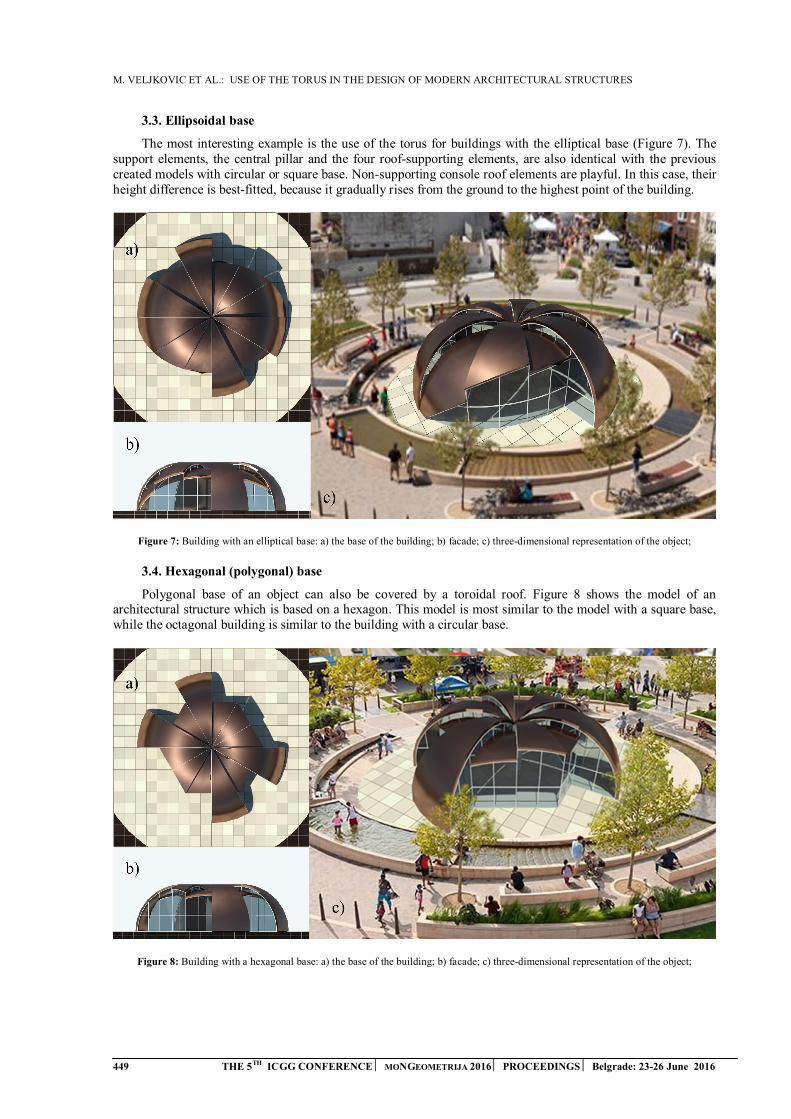
M. VELJKOVIC ET AL.: USE OF THE TORUS IN THE DESIGN OF MODERN ARCHITECTURAL STRUCTURES
449 THE 5TH ICGG CONFERENCE MONGEOMETRIJA 2016 PROCEEDINGS Belgrade: 23-26 June 2016
3.3. Ellipsoidal base
The most interesting example is the use of the torus for buildings with the elliptical base (Figure 7). The support elements, the central pillar and the four roof-supporting elements, are also identical with the previous created models with circular or square base. Non-supporting console roof elements are playful. In this case, their height difference is best-fitted, because it gradually rises from the ground to the highest point of the building.
Figure 7: Building with an elliptical base: a) the base of the building; b) facade; c) three-dimensional representation of the object;
3.4. Hexagonal (polygonal) base
Polygonal base of an object can also be covered by a toroidal roof. Figure 8 shows the model of an architectural structure which is based on a hexagon. This model is most similar to the model with a square base, while the octagonal building is similar to the building with a circular base.
Figure 8: Building with a hexagonal base: a) the base of the building; b) facade; c) three-dimensional representation of the object;

M. VELJKOVIC ET AL.: USE OF THE TORUS IN THE DESIGN OF MODERN ARCHITECTURAL STRUCTURES
450 THE 5TH ICGG CONFERENCE MONGEOMETRIJA 2016 PROCEEDINGS Belgrade: 23-26 June 2016
4. PREFABRICATION OF CONSTRUCTION ELEMENTS
4.1. Prefabricated elements
The objects made of prefabricated elements, mounted at the object’s location, have been built for several decades around the world. Depending on the needs, financial opportunities and climate conditions, different systems, materials and construction techniques are applied [6]. Prefabricated elements enable more efficient, faster and simpler construction works. Today, the economy is important, indicating the reduced cost of the building and overall labor needed. The prefabrication reduces the need for more labors, primarily due to the acceleration of the construction process. It can be applied in urbanized settlements, i.e. in the city core, since it is possible to organize the mounting without any delay of elements on the construction site, or with a minimal space for storing the elements. This means that the elements can be lifted directly from the transport truck and then mounted using the crane [7].
Until now, the prefabricated buildings have been built by one of three basic systems: cell, panel or skeletal. This paper presents the idea of the prefabrication of elements that are a set of panel and skeletal systems. Since the building with a few floors are considered, one central main supporting pillar are planned, where the roof elements of the revolved surface are supported. To manufacture the toroidal prefabricated elements, a mold should be made. Based on the idea of reducing the number of different molds, the torus is divided into, for instance, twelve equal parts. In all examples of the objects with different bases, the identical supporting elements being the parts of the torus appears, which are relying on both the central pillar and the foundation (Fig. 9).
Figure 9: Presentation of supporting elements - pillar and supporting roof elements in the form of a torus
Prefabrication primarily involves the manufacture of molds for making the supporting roof elements. Molds for prefabrication of various reinforced concrete structures [8] can be made in the form of steel molds set on vibrating tables or as steel 'batteries'. Console and supporting roof elements are identical in shape, but the former have different endings, with no founding, and mostly much shorter. However, due to the assumption that the supporting elements should be more massive, which will be precisely defined by a proper calculation, the manufacture of another mold for making toroidal console roof elements is planned. Since the length and endings of the mold are different depending on the shape of the object’s base, it is assumed the temporary filling of the mold where it is not necessary to make the element. As the role of these elements is different, the principle of connecting the console elements with the roof supporting elements is achieved by hanging, providing that the console elements are stiffened to each other.
4.2. Manufacturing of prefabricated elements
To make prefabricated elements of reinforced concrete would be complicated, primarily due to the bending of reinforcement in the required position that depends on the shape of the mold, or geometric surfaces, as well as the distribution of rods at equal distances that would be radially increased, so it would be difficult to connect all rods in place with the connection to the pillar. The problem can be solved by filling the steel molds with fiber-reinforced concrete in order to make prefabricated components. Fiber-reinforced concrete is increasingly used in the construction of modern objects using the advanced technology. Instead of the reinforcement in the form of steel rods, the reinforced concrete consists of a large number of various steel, metallic fine fibers interfering to each other and being themselves the composition of the concrete mass. A characteristic of these materials are good physico-mechanical, technological and exploitation characteristics. The use of fiber-reinforced concrete in the architecture solved many problems for designing objects made of different geometric surfaces, including the revolving surface of the second order.
After mounting the facility on site, the cladding of prefabricated roof elements is planned by thermal insulation, waterproof insulation and roofing material.

M. VELJKOVIC ET AL.: USE OF THE TORUS IN THE DESIGN OF MODERN ARCHITECTURAL STRUCTURES
451 THE 5TH ICGG CONFERENCE MONGEOMETRIJA 2016 PROCEEDINGS Belgrade: 23-26 June 2016
5. RESULTS
Prefabrication of elements for the construction of architectural objects designed by the surfaces of revolution is easier for construction, compared to traditional monolithic cast elements on the site. To build all types of buildings, with different bases, it is enough to make three molds, as all supporting elements are the same, while only cantilever bearing elements differ. The molds for console supporting elements can temporarily be filled up by the filling material to permit shortening of prefabricated element, changing of its console ending, while the endings that rely on the pillar are identical.
When molds should be made for each different element, it is necessary to consider when a smaller number of molds are necessary and how many molds are needed for the production of all types of prefabricated buildings designed by the toroidal geometric surface. Figure 10 shows all top view of objects with different bases.
Figure 10: Objects with various basis: the) square; b) ellipse; c) circuit; d) hexagon;
The number of prefabricated elements in the case of the object with square base (Figure 10a) is four, with two symmetrical elements (mirror), which would facilitate the making of molds. The problem of connecting elements because of sloping would require another different mold, the fifth. Elements that are located in the corners, adjacently set, are at different heights and their mutual connections with other elements are different. Designing of connective elements would significantly influence the number of different panels in the case of a building with a square base.
For an object with an elliptical base five different elements can be seen, where two of them are also symmetric, but set at different heights, which means that their connections with other elements are different. Good characteristic of this form is that one console roof element ends at the floor, which means that it is possible to provide its foundation that would further ensure and secure the structural system.
The objects with a circular base are the simplest because they have only two different roof elements, including a carrying and console element. Depending on the connections, due to the difference in the height of their position, it is possible to distinguish the third type of roof elements.
A similar situation is with polygonal bases because they are multiply symmetrical; the greater the number of angles of the polygon, the less the chance of a higher number of console elements. In the case of hexagonal base, three types of elements are distinguished, whereby two console elements are symmetrical to each other. The important observation is the identity of the console elements with the elements that appear in the form of a square base. If the construction of buildings with a variety of bases is organized, among which there are the objects with square and hexagonal bases, it will be effective to utilize the same molds for making of identical mutual elements.
Table 1 presents an overview of the number of various molds in the case of various bases allowing the calculation of the total number of elements, depending on the number and type of objects that are planned to be built.
Table 1: Schematic representation of the numerical situation for prefabricated elements depending on the type of object
Shape of base Number of supporting
pillars
Number of supporting
roof elements
Number of cantilevered roof elements
Number of different
elements (molds)
Minimal number of different elements
Number of symmetrical
elements (molds)
Identical elements (molds)
Total number of elements per object
Square 1 4 8 5 4 2 Hexagon 13 Ellipse 1 6 6 5 5 2 / 13 Circle 1 4 8 3 2 / / 13 Hexagon 1 4 8 3 3 2 Square 13 Total 4 18 30 16-2=14 14-2=12 6 2 52
M. VELJKOVIC ET AL.: USE OF THE TORUS IN THE DESIGN OF MODERN ARCHITECTURAL STRUCTURES
452 THE 5TH ICGG CONFERENCE MONGEOMETRIJA 2016 PROCEEDINGS Belgrade: 23-26 June 2016
Note: The total number of prefabricated elements, which are given in Table 1 in the case of filling the longer mold for console elements, can provide the flexibility of the geometric shape of the prefabricated element. In this case, for the construction of a single object of any type of foundation, it is necessary to make molds for four different elements: the first for the pillar, the other for the supporting roof element that occurs in all types, the third for non-supporting console element the mold of which will used with appropriate temporary filling in pouring fiber-reinforced concrete and the forth mold, designed for the object with the elliptical base, for the element which is partly founded in the ground.
6. CONCLUSION
The use of different geometric surfaces in architecture refines, modernizes and enriches the architecture itself, which therefore should be made more diverse and more dynamic. Application of the torus in the design of buildings does not need to be limited only to the objects with a circular base, but it can be used for buildings with different geometric shapes. In the case of these types of objects, the playfulness of the roof structure plays a key role because it gives life to the object. As the prefabricated building is more profitable for this kind of works, the given examples show the ability to construct prefabricated objects, with different forms of the base, in a similar manner. The prefabricated building system is very effective and should be used maximally, because in addition to the long durability, efficient and rapid construction, it can provide the long-lasting comfort and the friendly atmosphere for staying and carrying out the planned activities. Therefore, it is very important to permanently work on the improvement of not only prefabricated elements but also the machinery that is needed for safe transportation and on-site mounting of these elements [9].
The comparison of the above mentioned examples of objects shows how it is possible in the same way to get more different solutions by the use of torus in architecture, while the choice of the form depends on the personal affinity of the architect. The objects with a circular base are the simplest for the construction of objects designed by the torus. They can be made by a set of identical elements which are poured out in the same mold. In the case of the square-shaped base, differences in the change in the height inside the building are larger, compared to a circular shape where the height of the room is the same along the contour. The elliptical-shaped base fits the most in this make-up of objects because roof elements gradually rise along the facade from the ground to the top of the roof. Although the possible number of identical and similar elements is calculated, the better option is to make only two roof molds for making all elements of different objects using fill in the casting of fiber-reinforced concrete.
Because of rarely-used revolving surfaces, the idea is to encourage the future builders about the revival of the torus on the facades of architectural structures. The aim of the paper is not to favor the proposed system but to offer it to the professionals that will, through further improvements, show its justification.
7. REFERENCES
[1] https://100mandalas.com/2015/05/17/sacred-geometry-torus/ (Accessed: 2016-01-04).
[2] Izquierdo Asensi, F., 1975. Geometria descriptiva superiory aplicada. Editorial dossat, S.A. Madrid.
[3] Krasić, S., 2012. Geometrijske površi u arhitekturi, Građevinsko-arhitektonski fakultet, Niš.
[4] Brauner, H. and Kickinger, W., 1980. Geometrija u graditeljstvu, Školska knjiga, Zagreb.
[5] http://socalarchhistory.blogspot.rs/2011/01/award-winning-ice-rink-by-richard.html (Accessed: 2016-06-04).
[6] Stefanović, J., Cvetković, S. and Petrović, L., 2013. Primena ćelijskog Sistema u eko arhitekturi, Zbornik radova rađevinsko-arhitektonskog fakulteta Niš, 28. pp 141-154.
[7] Petrović, G. and Napijalo, P., 2007. Primena IMS prefabrikovane armirano betonske skeletne konstrukcije u građenju objekata niske spratnosti, Institut za ispitivanje materijala a.d. Beograd Centar za tehnologiju građenja i konstrukcije, Beograd.
[8] Bučar, G., 1990. Oplate za betonske građevine, Bučar Gorazd, Sarajevo.
[9] Veljković, М., Marković, B. and Milošević, V., 2014. Unificiranje panela kod montažnih konstrukcija. Zbornik radova Građevinsko-arhitektonskog fakulteta Niš, 29. pp 167-180.
IREM s.p.a., Craiova, Romania MSc, Civil Engineer, [email protected]
Technical University of Cluj-Napoca, Romania PhD student, [email protected]
Department of Automotive, Transportation and Industrial Engineering, University of Craiova, Romania PhD, Associate Professor, [email protected]
Department of Automotive, Transportation and Industrial Engineering, University of Craiova, Romania PhD, Associate Professor, [email protected]
Colibri Children’s and Youth Theatre, Craiova, Romania MSc, Manager, [email protected]
ABSTRACT:
The paper presented a virtual model of a building with five levels, which was experimentally virtual tested. The building had isolated foundations, reinforced concrete pillars with dimensions (25 cm width and 50 cm length). Reinforced concrete floors with the thickness 15 cm over the first level, the second level, the third level and the last level. The pillars of the building were supposed at torsion with the torque between 100000 Nm and 900000 Nm. The results are shown in the figures and diagrams.
Also, was used the finite element method for building simulation for the snow load. Using the geographic distribution, the building will have the load value calculation of 2KN/m2. In the paper were presented some pictures of forces system and the resulted pressures that were applied to the building to simulate the snow loads. Also, were presented the diagrams of the results.
Based on the 3D model of the building and the digitalized displacement diagram was made the kinematics and dynamics simulation of the building similar to the earthquake on March 4, 1977 in Vrancea, Romania at 21:22 local time, felt throughout the Balkans. It had a magnitude of 7.2, making it the second most powerful earthquake recorded in Romania in the 20th century.
Also, was simulate the action of the wind in front of building with Flow simulations analysis module. For that, was studied the effect obtained due to an air mass travelling at a velocity of 150km / h from the south of the building perpendicular to the facade. The results were shown in the maps of pressures, speeds or temperatures.
To obtain real similar calculations were made the simulations of the building for the situations when we have multiple loads (snow, earthquake, wind).
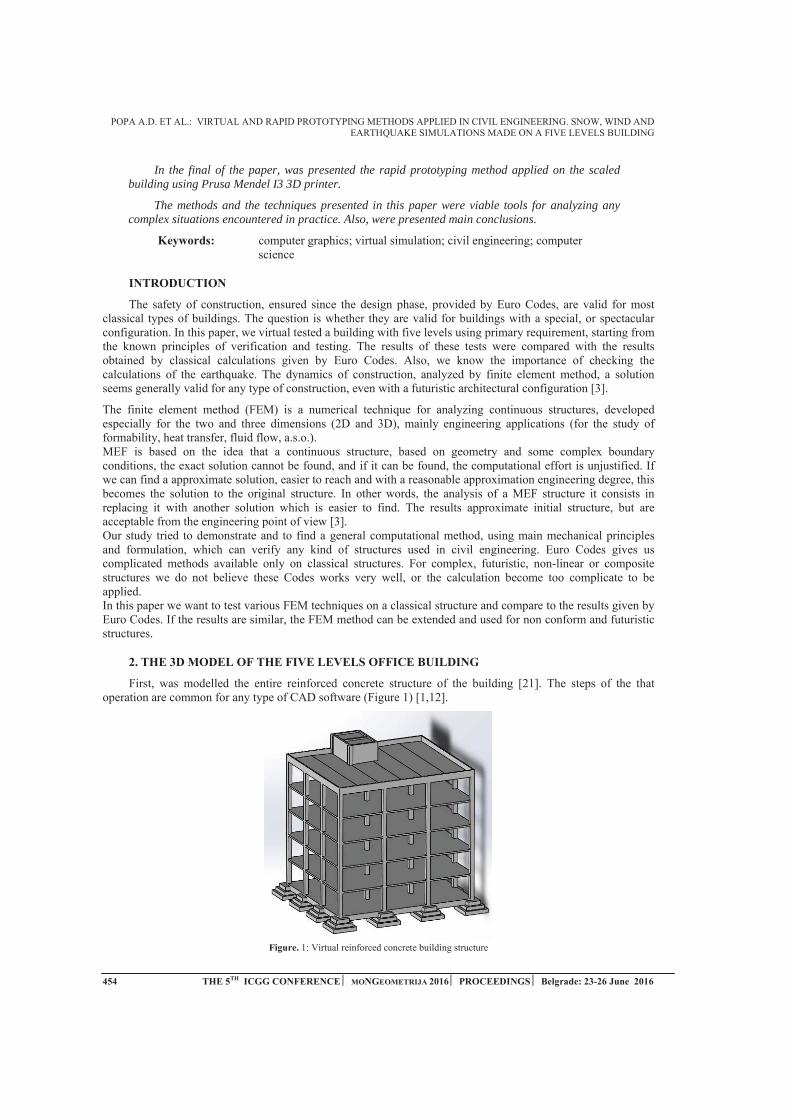
In the final of the paper, was presented the rapid prototyping method applied on the scaled building using Prusa Mendel I3 3D printer.
The methods and the techniques presented in this paper were viable tools for analyzing any complex situations encountered in practice. Also, were presented main conclusions.
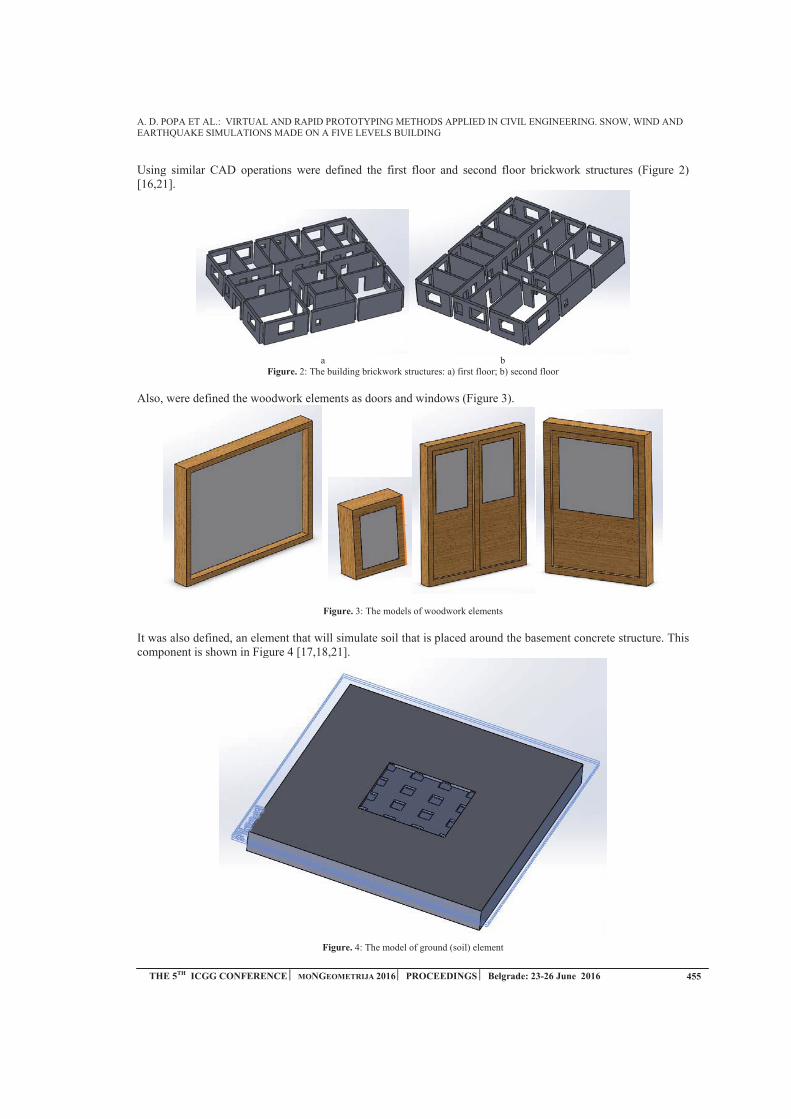
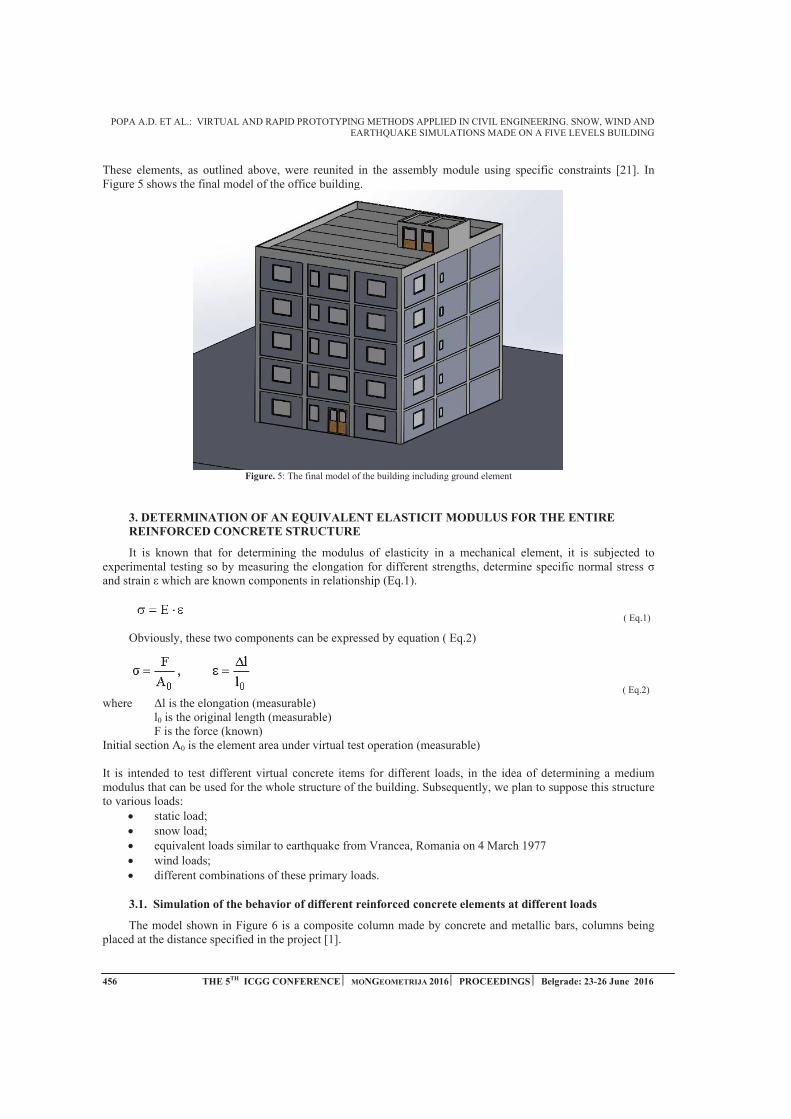
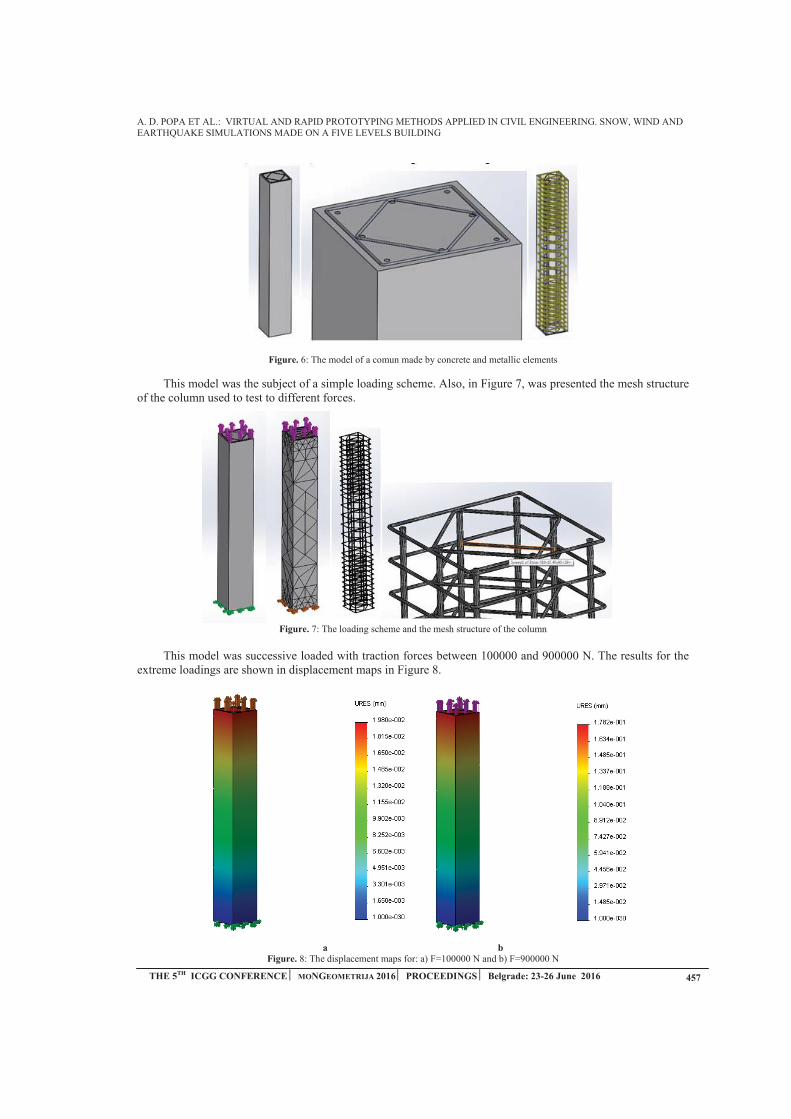
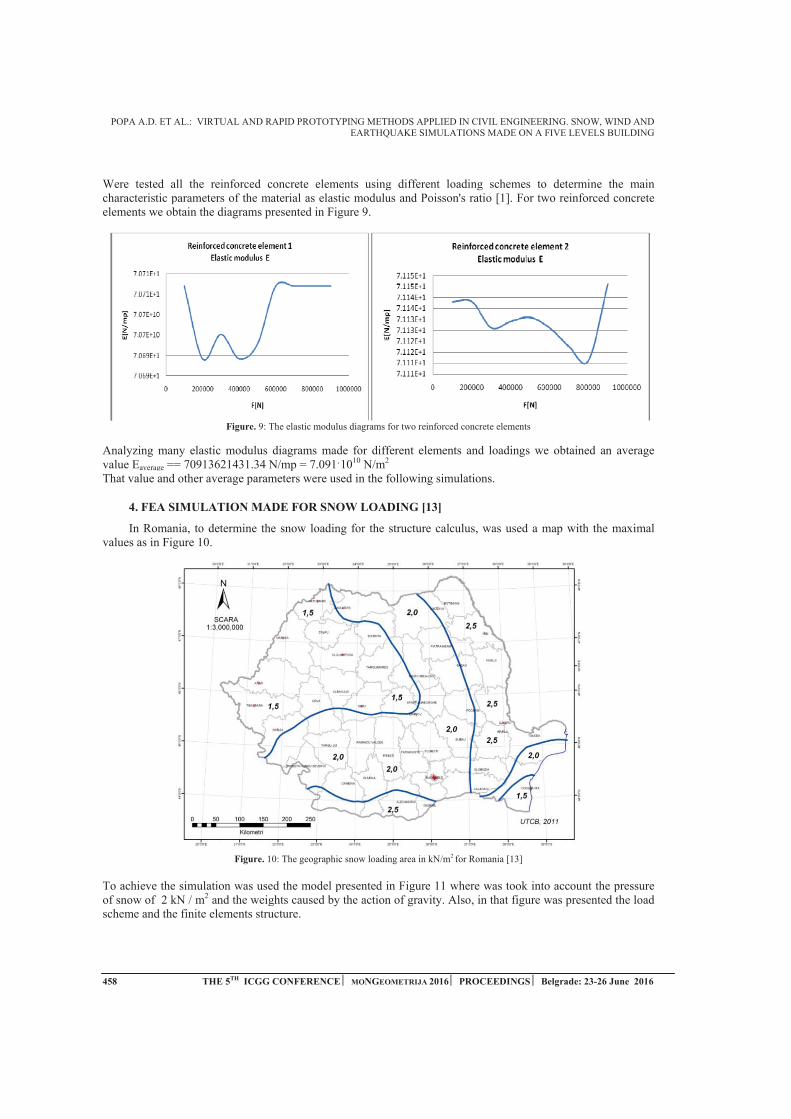
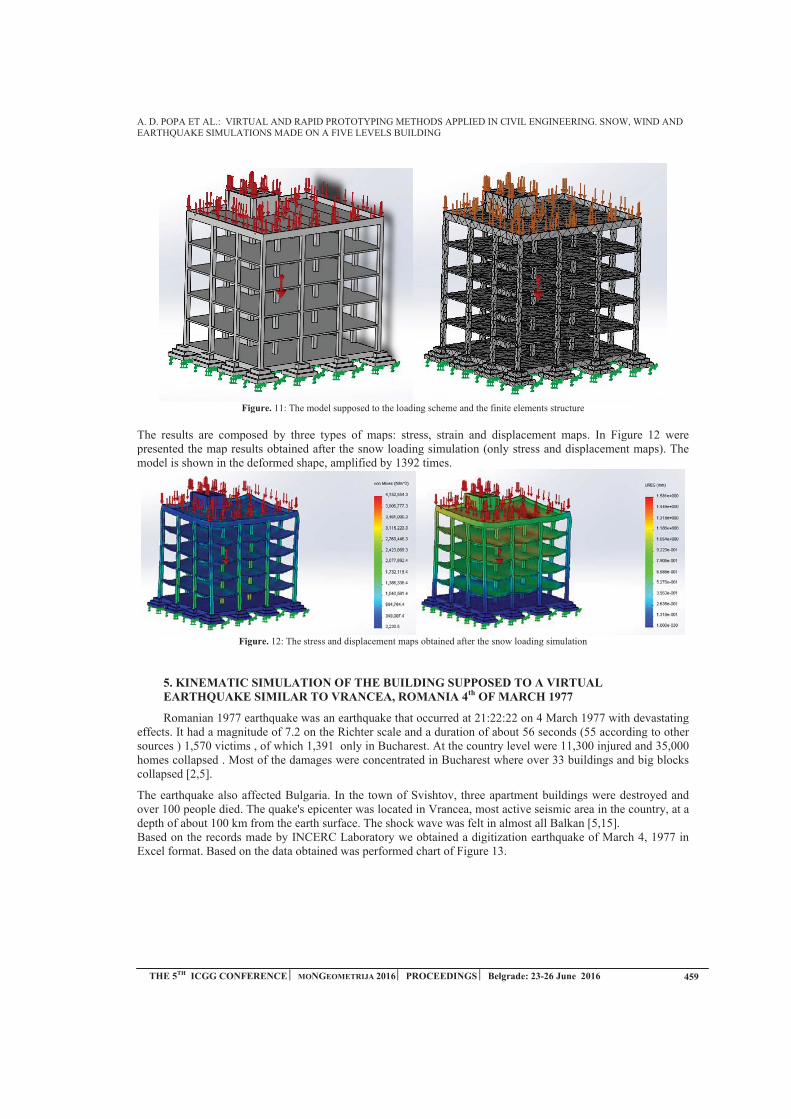

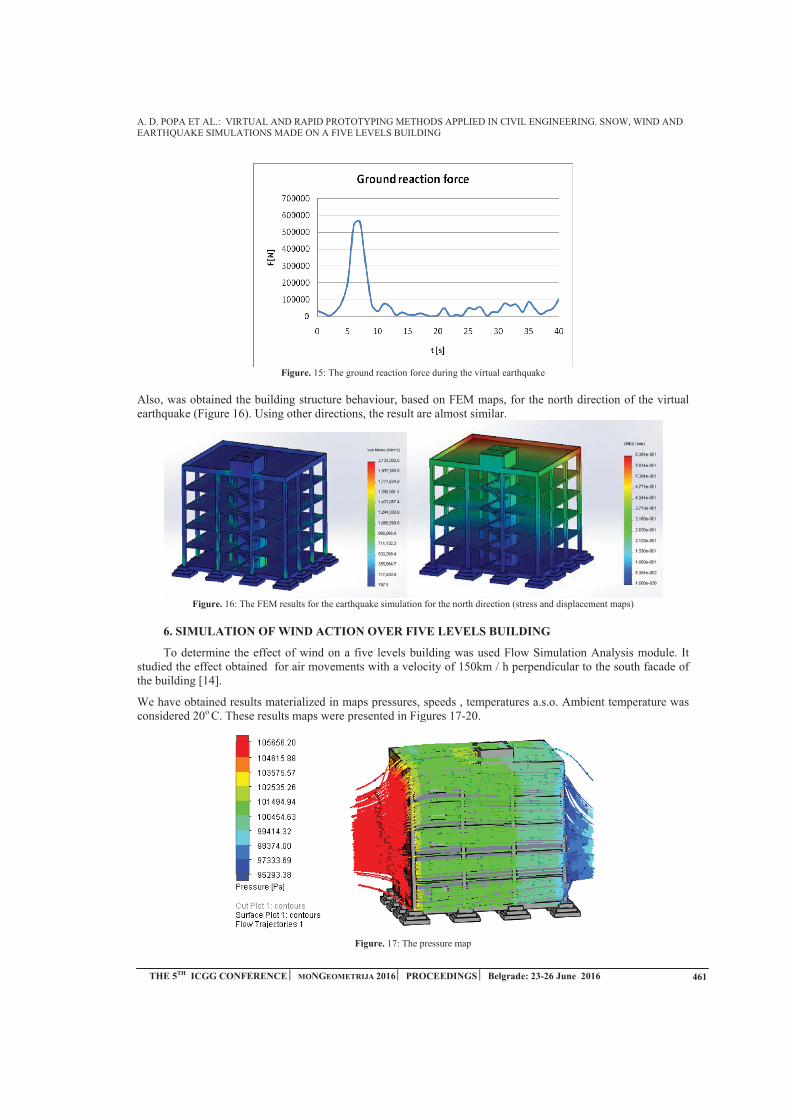
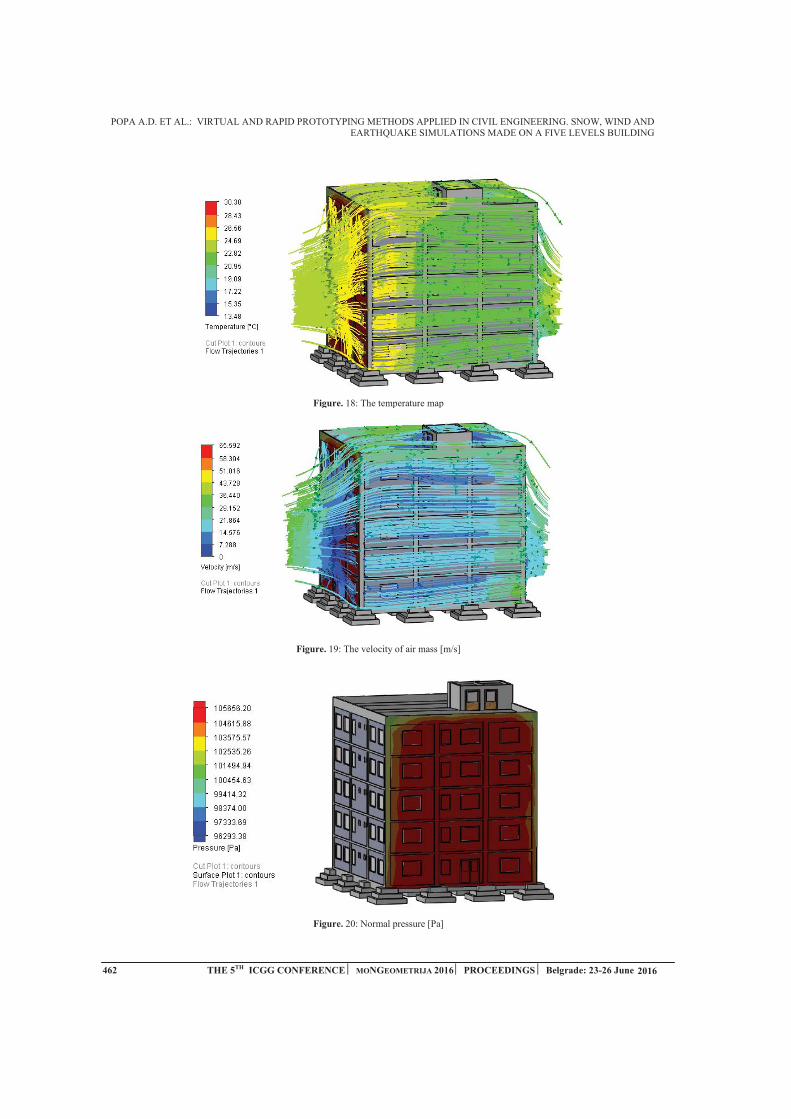
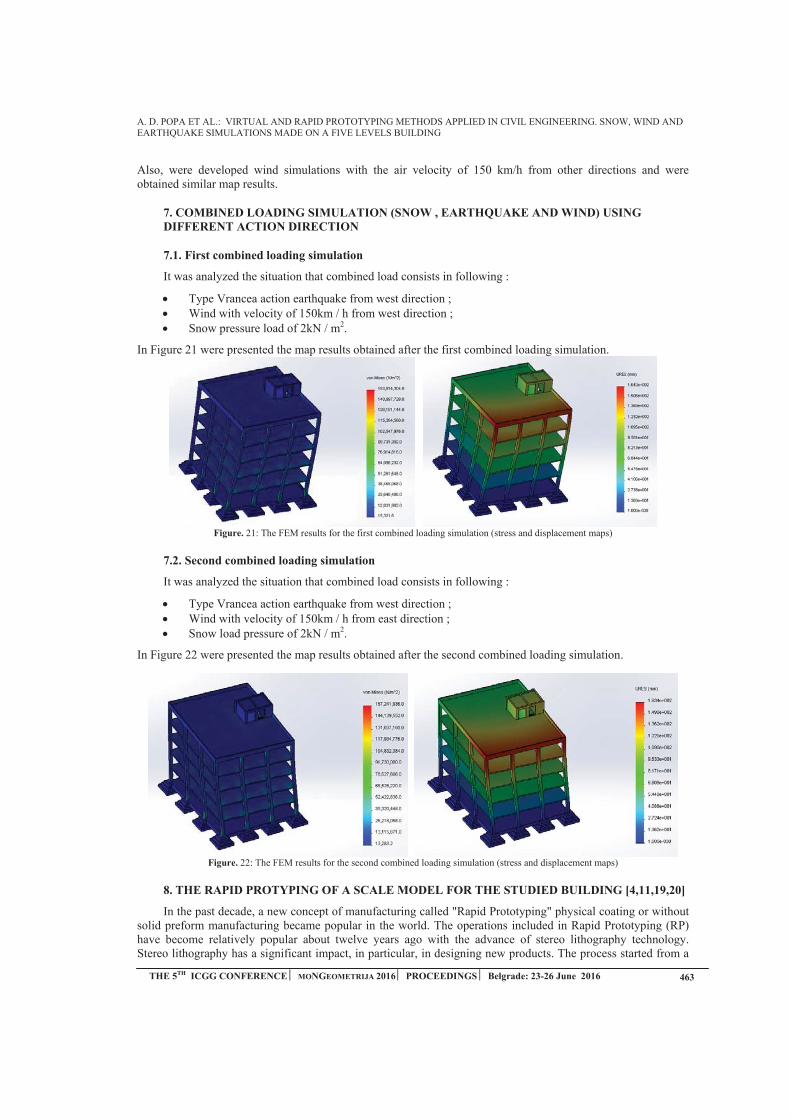
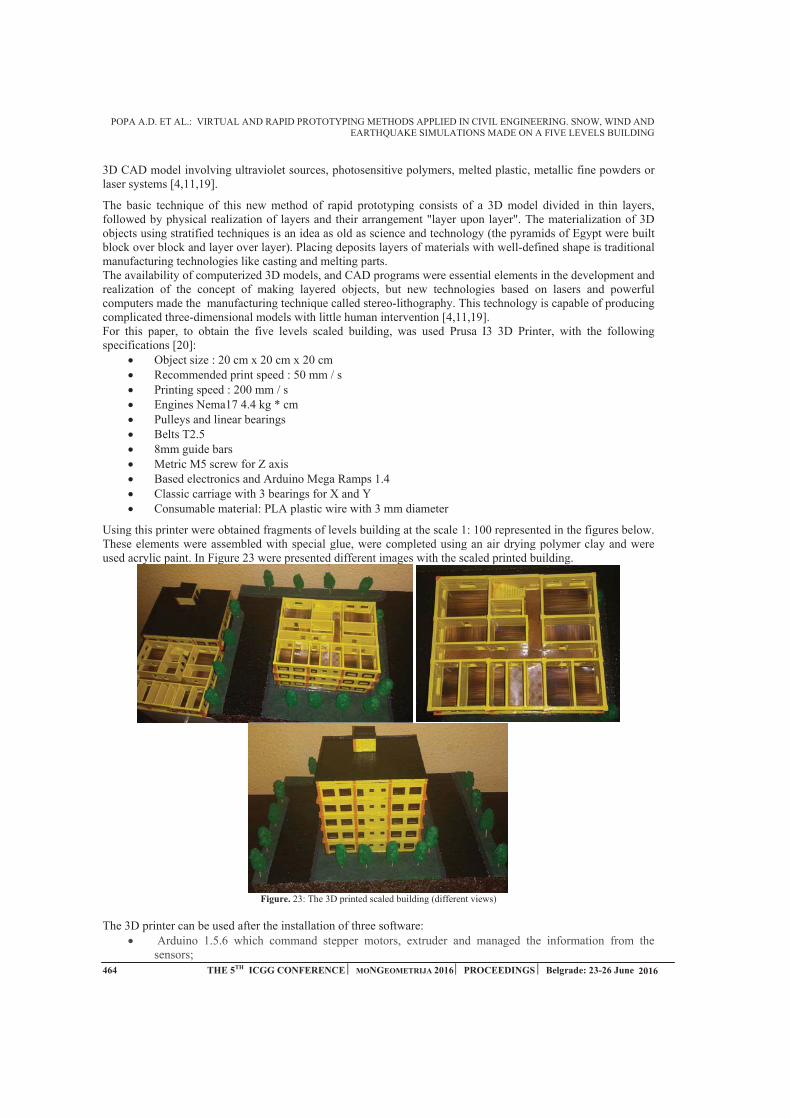


G. BUCIU ET AL.: VIRTUAL AND RAPID PROTOTYPING METHODS APPLIED IN ORTHOPAEDICS
THE 5TH ICGG CONFERENCE ⏐⏐ MONGEOMETRIJA 2016 ⏐ PROCEEDINGS ⏐ Belgrade: 23-26 June 2016
VIRTUAL AND RAPID PROTOTYPING METHODS APPLIED IN ORTHOPAEDICS
Gabriel Buciu
Constantin Brancusi University of Targu Jiu, Faculty of Health and Behavioral Sciences, Targu Jiu, Romania PhD, Associate Lecturer, [email protected]
Dragos-Laurentiu Popa Department of Automotive, Transportation and Industrial Engineering, University of Craiova, Craiova,
Romania PhD, Associate Professor, [email protected]
Dragos Niculescu
University of Medicine and Pharmacy Craiova, Faculty of General Medicine, Craiova, Romania,
PhD, [email protected]
George Gherghina
Department of Automotive, Transportation and Industrial Engineering, University of Craiova, Craiova, Romania
PhD, Professor, [email protected]
Calin Daniel Cosmin
County Emergency Hospital, Tabaci street no. 1, Craiova, Romania
PhD student, [email protected]
Dragos Tutunea
Department of Automotive, Transportation and Industrial Engineering, University of Craiova, Craiova, Romania
PhD, lecturer, [email protected]
ABSTRACT
The paper presents some methods used to analyze human bone joints. The cooperation between medical research team and the engineer research group give important tools for medical devices design. To re-create a 3D parametrical environment it was used a CAD software which permits to define complex models. First, there were defined the "hard" parts as the main bone components and "soft" parts as ligaments or menisci using CT images. The contours of the CT images were transferred to CAD environment where, step by step, and section by section, using complex CAD methods, the virtual elements were defined. The model of the lower limbs during a virtual walking was recomposed using kinematic parameters determined by filming a human subject. In this case, the entire mechanical behaviour of each bone component was determined, including the femur, tibia, menisci and cruciate ligaments. Also, using CAD methods, were created virtual models of human joints. These virtual models of the human joints were exported to kinematic analysis software and the results of the kinematic capture, such the functions of the joint position vs time, were transposed to virtual bio-mechanical joints. In the last decade, a new concept called rapid prototyping, physical coating or without solid pre-form manufacturing, has become very popular. The process starts with a 3D CAD model involving CAM techniques and polymers. Using these techniques, our team fabricated physical polymers prototypes of bones, different implants and prosthetic elements for othopaedic applications.
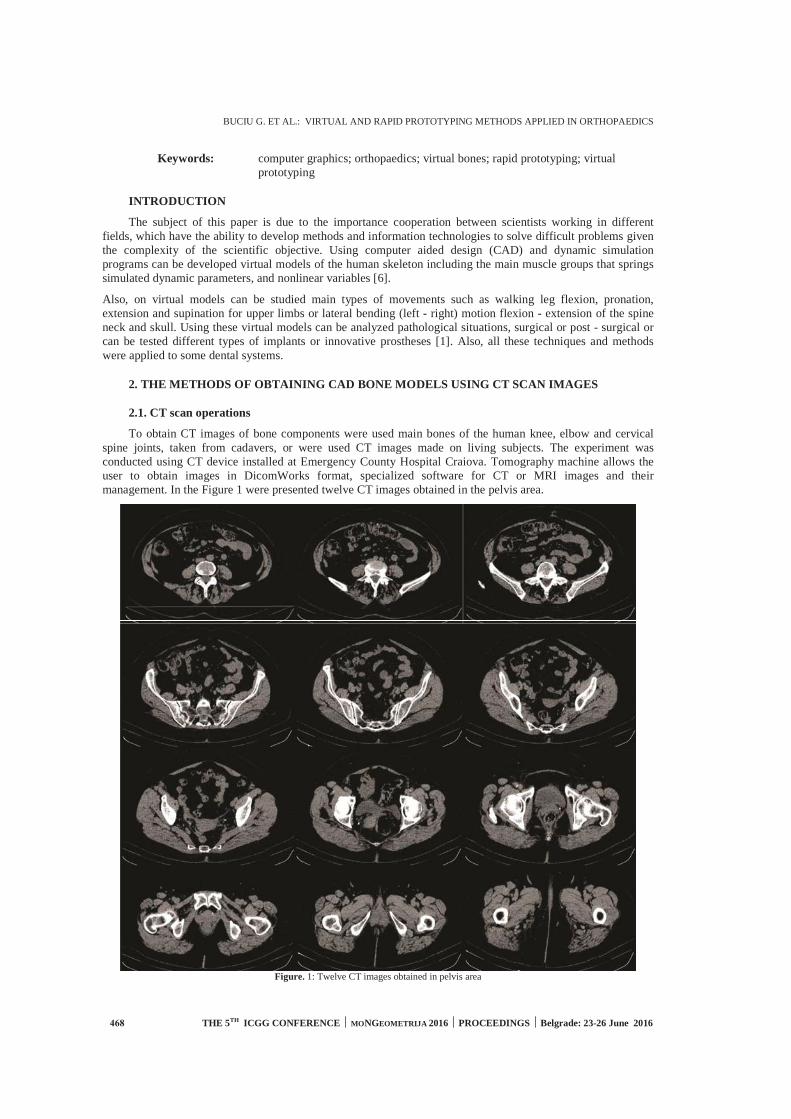
BUCIU G. ET AL.: VIRTUAL AND RAPID PROTOTYPING METHODS APPLIED IN ORTHOPAEDICS
THE 5TH ICGG CONFERENCE ⏐⏐ MONGEOMETRIJA 2016 ⏐ PROCEEDINGS ⏐ Belgrade: 23-26 June 2016
Keywords: computer graphics; orthopaedics; virtual bones; rapid prototyping; virtual prototyping
INTRODUCTION
The subject of this paper is due to the importance cooperation between scientists working in different fields, which have the ability to develop methods and information technologies to solve difficult problems given the complexity of the scientific objective. Using computer aided design (CAD) and dynamic simulation programs can be developed virtual models of the human skeleton including the main muscle groups that springs simulated dynamic parameters, and nonlinear variables [6].
Also, on virtual models can be studied main types of movements such as walking leg flexion, pronation, extension and supination for upper limbs or lateral bending (left - right) motion flexion - extension of the spine neck and skull. Using these virtual models can be analyzed pathological situations, surgical or post - surgical or can be tested different types of implants or innovative prostheses [1]. Also, all these techniques and methods were applied to some dental systems.
2. THE METHODS OF OBTAINING CAD BONE MODELS USING CT SCAN IMAGES
2.1. CT scan operations
To obtain CT images of bone components were used main bones of the human knee, elbow and cervical spine joints, taken from cadavers, or were used CT images made on living subjects. The experiment was conducted using CT device installed at Emergency County Hospital Craiova. Tomography machine allows the user to obtain images in DicomWorks format, specialized software for CT or MRI images and their management. In the Figure 1 were presented twelve CT images obtained in the pelvis area.
Figure. 1: Twelve CT images obtained in pelvis area

G. BUCIU ET AL.: VIRTUAL AND RAPID PROTOTYPING METHODS APPLIED IN ORTHOPAEDICS
THE 5TH ICGG CONFERENCE ⏐⏐ MONGEOMETRIJA 2016 ⏐ PROCEEDINGS ⏐ Belgrade: 23-26 June 2016
To obtain the CT images of the three bone components (humerus, cubitus and radius) were used two scanning schemes. First, was completed a scanning operation using different distances. For the ends of the bones was used another scheme with a less distance. To make a correct scaling process for the images, was used a round plastic bar with known dimension during CT operation. In Figure 2 were presented eight CT images obtained for elbow bones.
Figure. 2: Eight CT images obtained for elbow bones
To obtain the virtual components of the human cervical spine were analyzed many computer tomography images obtained in different planes. Can be used different schemes for scanning with cross-sectional parallel planes. Other CT schemes were applied to cervical and skull area to determine the geometry of the C1-C7 vertebrae and skull bones. In Figure 3 were presented eight main CT images obtained in cervical area.
Figure. 3: Eight CT images obtained for cervical and skull area
In Orthopaedics, fixation is the process in which the fragments are fixed in anatomical position and maintained until consolidation, sometimes using metal implants. It should be noted that the position must be anatomic for the fracture. Sometimes the fixation is made, for example in the case of osteotomy, where anatomic reduction of the fracture isn’t achieved, but the contrary is aimed at modifying bone anatomy.
Biomechanics fixation is the fixation after which the used material takes over the forces that occur in fracture focus to achieve consolidation. After a biomechanical fixation without a cast immobilization recovery is much better and faster.
Sometimes a cast immobilization is necessary because tasks that occur in the outbreak of fracture can overcome strength of materials used, or their points of attachment to bone, causing new fractures in these areas, or rupture of fixation material. These types of fractures are usually presented on long bones, as tibia and femur.
For the shaft fractures of the long bones fixation with rigid intra-medullary nails are used. Two techniques of fixation can be used: with open center or closed center. Unlocked-rigid nails are used in the cases of un-comminuted shaft fractures, when the fracture focus crosses the narrow space of the medullary canal, when the forces on both sides are removed, having a well controlled rotation. Locked-rigid nails are used when the medullary canal is wider at one piece.
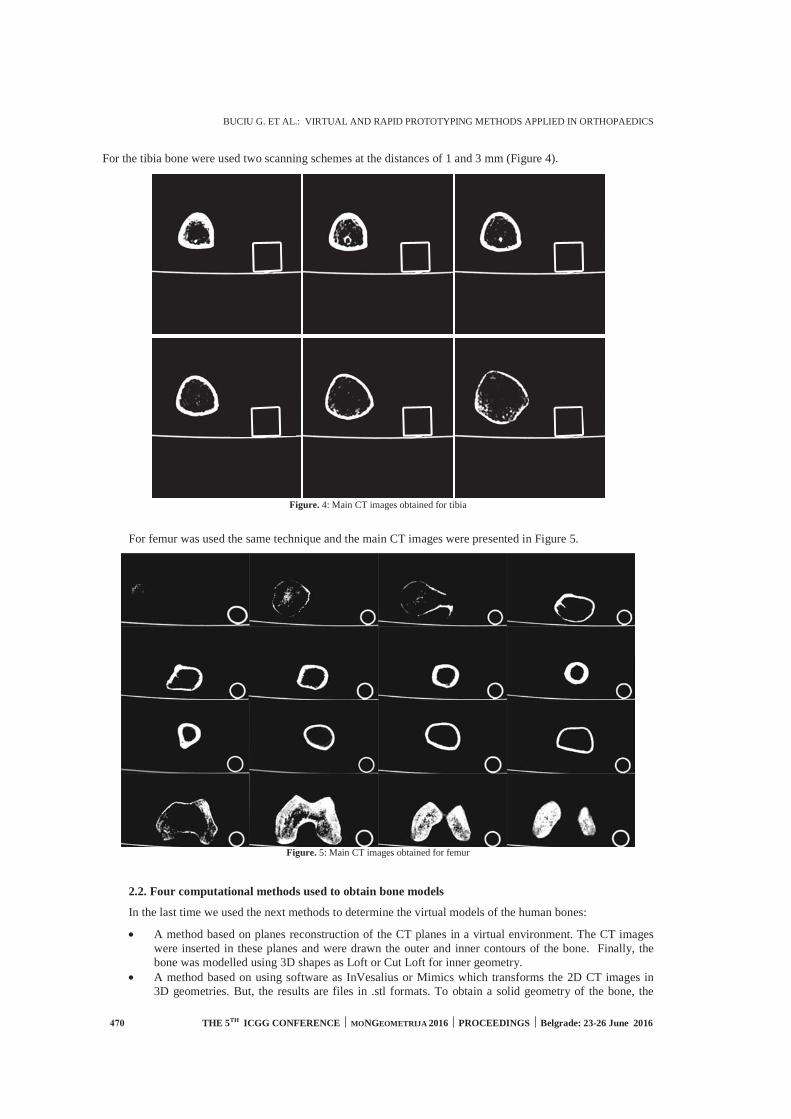
BUCIU G. ET AL.: VIRTUAL AND RAPID PROTOTYPING METHODS APPLIED IN ORTHOPAEDICS
THE 5TH ICGG CONFERENCE ⏐⏐ MONGEOMETRIJA 2016 ⏐ PROCEEDINGS ⏐ Belgrade: 23-26 June 2016
For the tibia bone were used two scanning schemes at the distances of 1 and 3 mm (Figure 4).
Figure. 4: Main CT images obtained for tibia
For femur was used the same technique and the main CT images were presented in Figure 5.
Figure. 5: Main CT images obtained for femur
2.2. Four computational methods used to obtain bone models
In the last time we used the next methods to determine the virtual models of the human bones:
• A method based on planes reconstruction of the CT planes in a virtual environment. The CT imageswere inserted in these planes and were drawn the outer and inner contours of the bone. Finally, thebone was modelled using 3D shapes as Loft or Cut Loft for inner geometry.
• A method based on using software as InVesalius or Mimics which transforms the 2D CT images in3D geometries. But, the results are files in .stl formats. To obtain a solid geometry of the bone, the
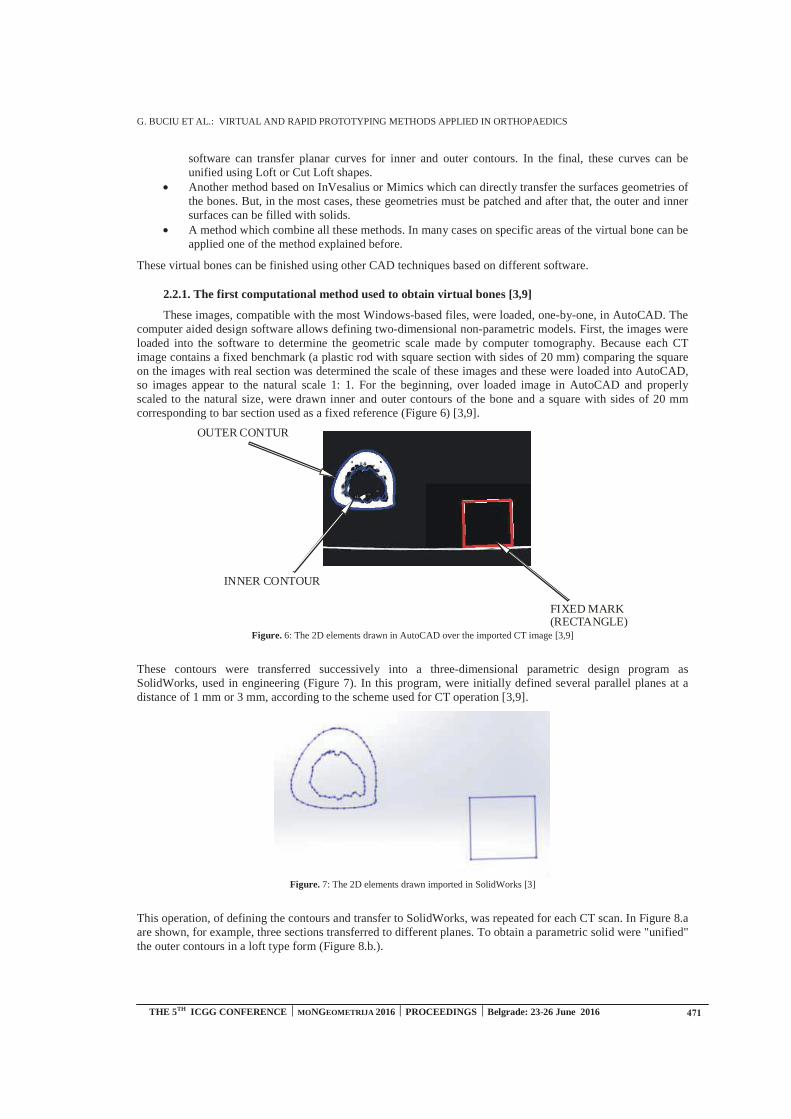
G. BUCIU ET AL.: VIRTUAL AND RAPID PROTOTYPING METHODS APPLIED IN ORTHOPAEDICS
THE 5TH ICGG CONFERENCE ⏐⏐ MONGEOMETRIJA 2016 ⏐ PROCEEDINGS ⏐ Belgrade: 23-26 June 2016
software can transfer planar curves for inner and outer contours. In the final, these curves can be unified using Loft or Cut Loft shapes.
• Another method based on InVesalius or Mimics which can directly transfer the surfaces geometries ofthe bones. But, in the most cases, these geometries must be patched and after that, the outer and inner surfaces can be filled with solids.
• A method which combine all these methods. In many cases on specific areas of the virtual bone can beapplied one of the method explained before.
These virtual bones can be finished using other CAD techniques based on different software.
2.2.1. The first computational method used to obtain virtual bones [3,9]
These images, compatible with the most Windows-based files, were loaded, one-by-one, in AutoCAD. The computer aided design software allows defining two-dimensional non-parametric models. First, the images were loaded into the software to determine the geometric scale made by computer tomography. Because each CT image contains a fixed benchmark (a plastic rod with square section with sides of 20 mm) comparing the square on the images with real section was determined the scale of these images and these were loaded into AutoCAD, so images appear to the natural scale 1: 1. For the beginning, over loaded image in AutoCAD and properly scaled to the natural size, were drawn inner and outer contours of the bone and a square with sides of 20 mm corresponding to bar section used as a fixed reference (Figure 6) [3,9].
OUTER CONTUR
INNER CONTOUR
FIXED MARK(RECTANGLE)
Figure. 6: The 2D elements drawn in AutoCAD over the imported CT image [3,9]
These contours were transferred successively into a three-dimensional parametric design program as SolidWorks, used in engineering (Figure 7). In this program, were initially defined several parallel planes at a distance of 1 mm or 3 mm, according to the scheme used for CT operation [3,9].
Figure. 7: The 2D elements drawn imported in SolidWorks [3]
This operation, of defining the contours and transfer to SolidWorks, was repeated for each CT scan. In Figure 8.a are shown, for example, three sections transferred to different planes. To obtain a parametric solid were "unified" the outer contours in a loft type form (Figure 8.b.).
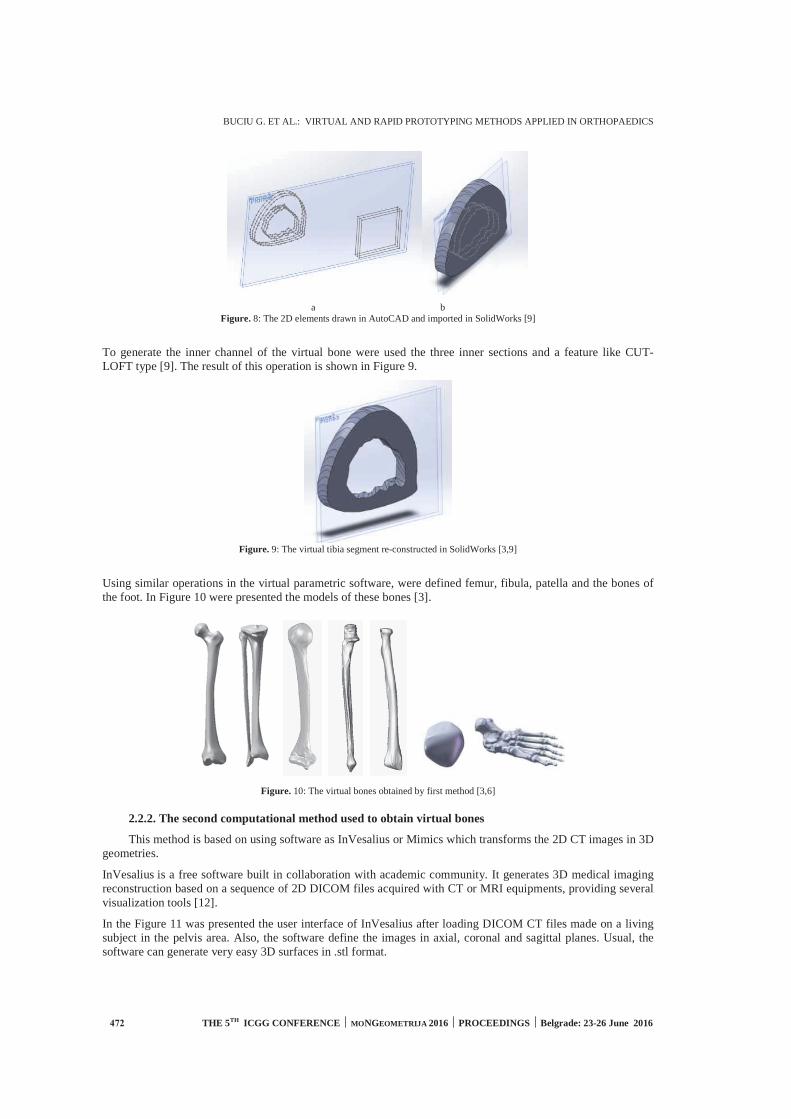
BUCIU G. ET AL.: VIRTUAL AND RAPID PROTOTYPING METHODS APPLIED IN ORTHOPAEDICS
THE 5TH ICGG CONFERENCE ⏐⏐ MONGEOMETRIJA 2016 ⏐ PROCEEDINGS ⏐ Belgrade: 23-26 June 2016
a b Figure. 8: The 2D elements drawn in AutoCAD and imported in SolidWorks [9]
To generate the inner channel of the virtual bone were used the three inner sections and a feature like CUT-LOFT type [9]. The result of this operation is shown in Figure 9.
Figure. 9: The virtual tibia segment re-constructed in SolidWorks [3,9]
Using similar operations in the virtual parametric software, were defined femur, fibula, patella and the bones of the foot. In Figure 10 were presented the models of these bones [3].
Figure. 10: The virtual bones obtained by first method [3,6]
2.2.2. The second computational method used to obtain virtual bones
This method is based on using software as InVesalius or Mimics which transforms the 2D CT images in 3D geometries.
InVesalius is a free software built in collaboration with academic community. It generates 3D medical imaging reconstruction based on a sequence of 2D DICOM files acquired with CT or MRI equipments, providing several visualization tools [12].
In the Figure 11 was presented the user interface of InVesalius after loading DICOM CT files made on a living subject in the pelvis area. Also, the software define the images in axial, coronal and sagittal planes. Usual, the software can generate very easy 3D surfaces in .stl format.
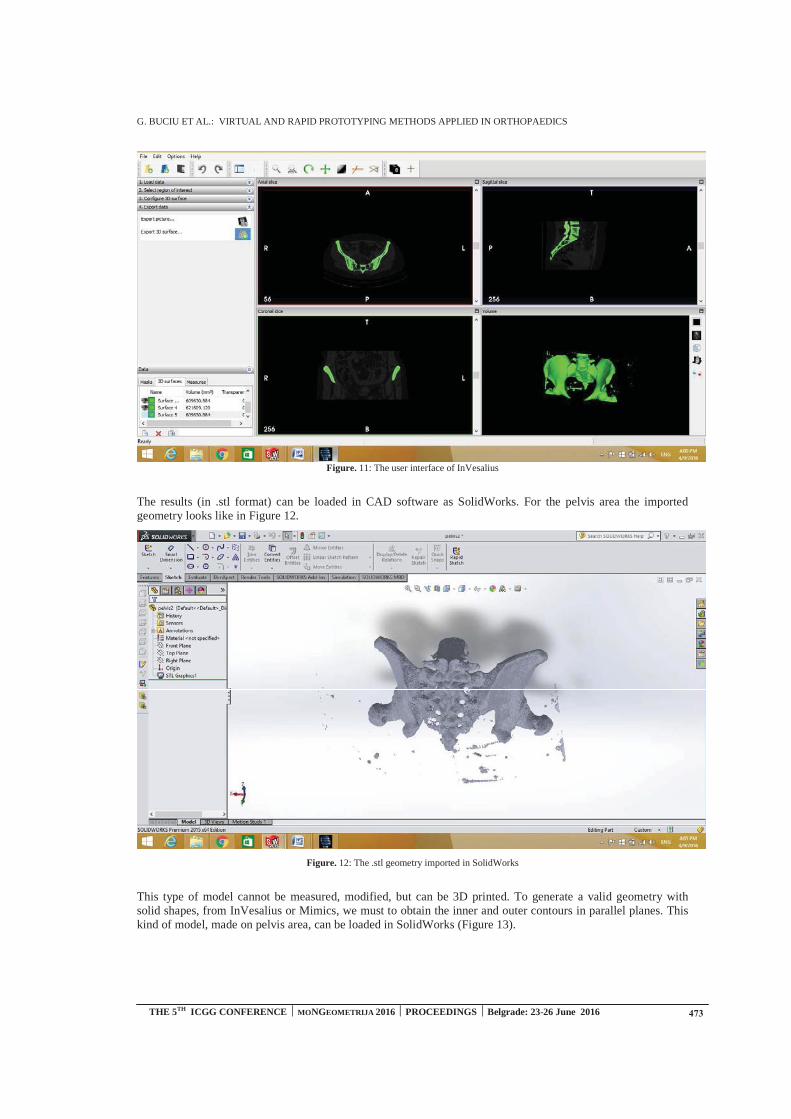
G. BUCIU ET AL.: VIRTUAL AND RAPID PROTOTYPING METHODS APPLIED IN ORTHOPAEDICS
THE 5TH ICGG CONFERENCE ⏐⏐ MONGEOMETRIJA 2016 ⏐ PROCEEDINGS ⏐ Belgrade: 23-26 June 2016
Figure. 11: The user interface of InVesalius
The results (in .stl format) can be loaded in CAD software as SolidWorks. For the pelvis area the imported geometry looks like in Figure 12.
Figure. 12: The .stl geometry imported in SolidWorks
This type of model cannot be measured, modified, but can be 3D printed. To generate a valid geometry with solid shapes, from InVesalius or Mimics, we must to obtain the inner and outer contours in parallel planes. This kind of model, made on pelvis area, can be loaded in SolidWorks (Figure 13).
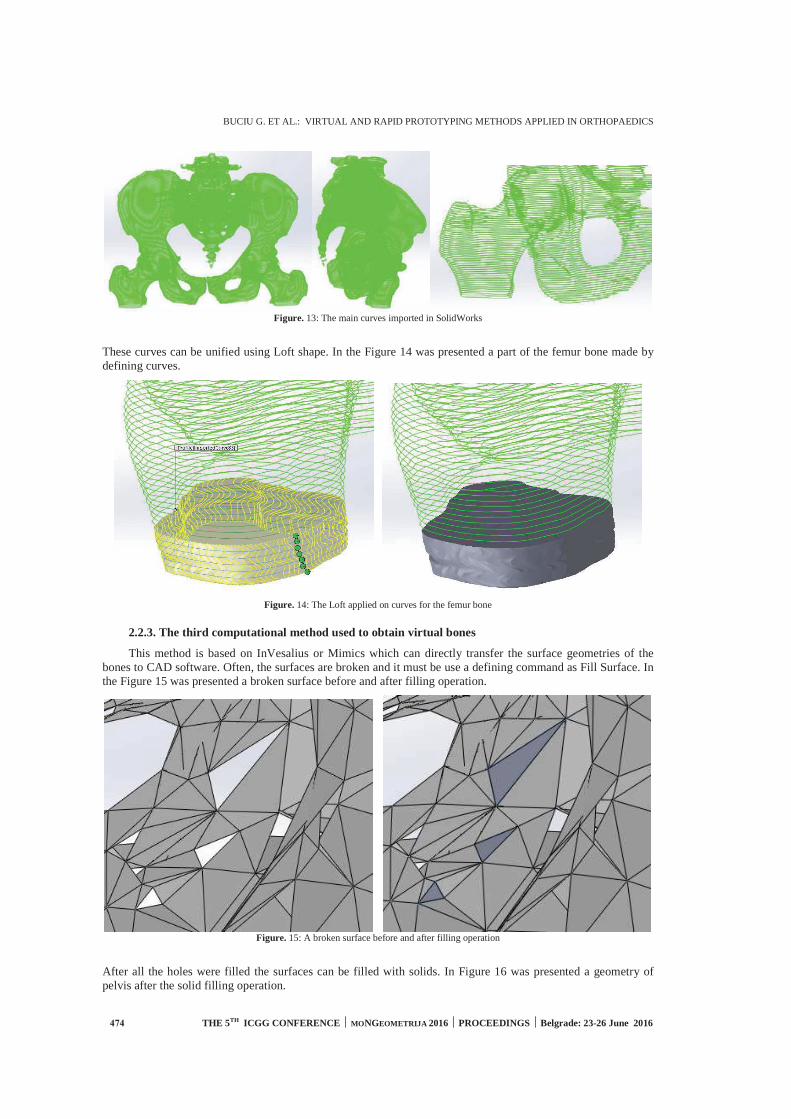
BUCIU G. ET AL.: VIRTUAL AND RAPID PROTOTYPING METHODS APPLIED IN ORTHOPAEDICS
THE 5TH ICGG CONFERENCE ⏐⏐ MONGEOMETRIJA 2016 ⏐ PROCEEDINGS ⏐ Belgrade: 23-26 June 2016
Figure. 13: The main curves imported in SolidWorks
These curves can be unified using Loft shape. In the Figure 14 was presented a part of the femur bone made by defining curves.
Figure. 14: The Loft applied on curves for the femur bone
2.2.3. The third computational method used to obtain virtual bones
This method is based on InVesalius or Mimics which can directly transfer the surface geometries of the bones to CAD software. Often, the surfaces are broken and it must be use a defining command as Fill Surface. In the Figure 15 was presented a broken surface before and after filling operation.
Figure. 15: A broken surface before and after filling operation
After all the holes were filled the surfaces can be filled with solids. In Figure 16 was presented a geometry of pelvis after the solid filling operation.
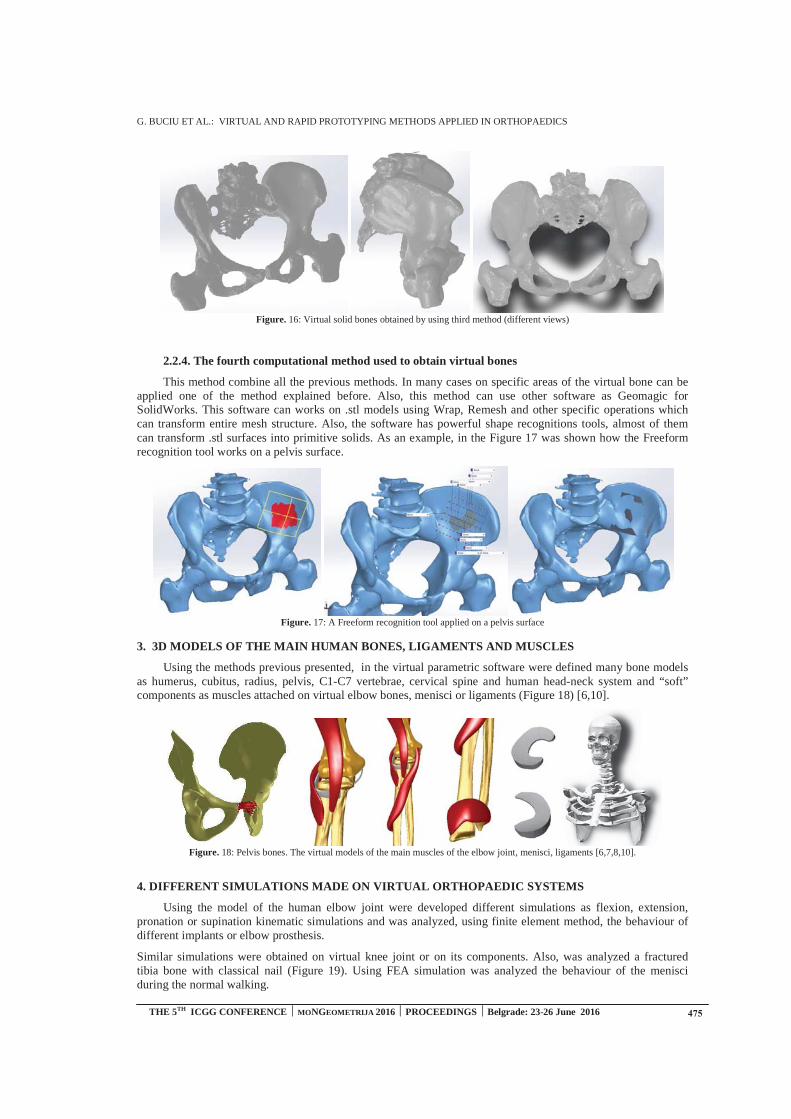
G. BUCIU ET AL.: VIRTUAL AND RAPID PROTOTYPING METHODS APPLIED IN ORTHOPAEDICS
THE 5TH ICGG CONFERENCE ⏐⏐ MONGEOMETRIJA 2016 ⏐ PROCEEDINGS ⏐ Belgrade: 23-26 June 2016
Figure. 16: Virtual solid bones obtained by using third method (different views)
2.2.4. The fourth computational method used to obtain virtual bones
This method combine all the previous methods. In many cases on specific areas of the virtual bone can be applied one of the method explained before. Also, this method can use other software as Geomagic for SolidWorks. This software can works on .stl models using Wrap, Remesh and other specific operations which can transform entire mesh structure. Also, the software has powerful shape recognitions tools, almost of them can transform .stl surfaces into primitive solids. As an example, in the Figure 17 was shown how the Freeform recognition tool works on a pelvis surface.
Figure. 17: A Freeform recognition tool applied on a pelvis surface
3. 3D MODELS OF THE MAIN HUMAN BONES, LIGAMENTS AND MUSCLES
Using the methods previous presented, in the virtual parametric software were defined many bone models as humerus, cubitus, radius, pelvis, C1-C7 vertebrae, cervical spine and human head-neck system and “soft” components as muscles attached on virtual elbow bones, menisci or ligaments (Figure 18) [6,10].
Figure. 18: Pelvis bones. The virtual models of the main muscles of the elbow joint, menisci, ligaments [6,7,8,10].
4. DIFFERENT SIMULATIONS MADE ON VIRTUAL ORTHOPAEDIC SYSTEMS
Using the model of the human elbow joint were developed different simulations as flexion, extension, pronation or supination kinematic simulations and was analyzed, using finite element method, the behaviour of different implants or elbow prosthesis.
Similar simulations were obtained on virtual knee joint or on its components. Also, was analyzed a fractured tibia bone with classical nail (Figure 19). Using FEA simulation was analyzed the behaviour of the menisci during the normal walking.
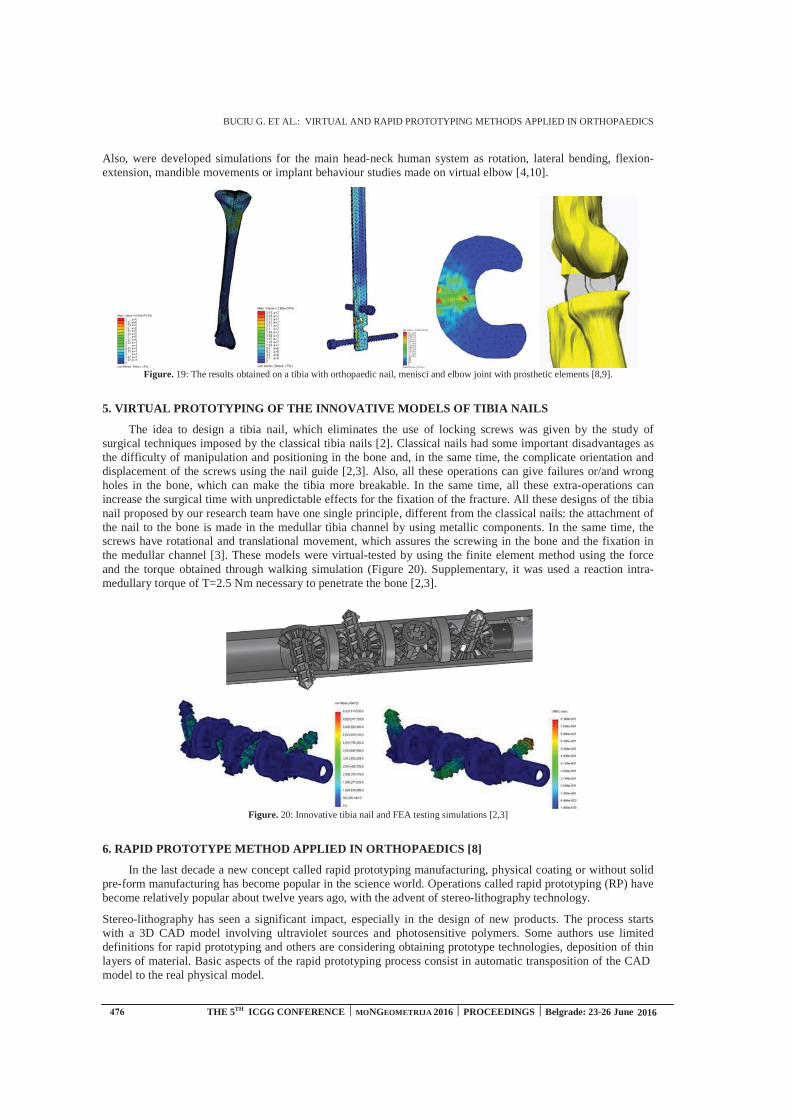
BUCIU G. ET AL.: VIRTUAL AND RAPID PROTOTYPING METHODS APPLIED IN ORTHOPAEDICS
THE 5TH ICGG CONFERENCE ⏐⏐ MONGEOMETRIJA 2016 ⏐ PROCEEDINGS ⏐ Belgrade: 23-26 June 2016
Also, were developed simulations for the main head-neck human system as rotation, lateral bending, flexion-extension, mandible movements or implant behaviour studies made on virtual elbow [4,10].
Figure. 19: The results obtained on a tibia with orthopaedic nail, menisci and elbow joint with prosthetic elements [8,9].
5. VIRTUAL PROTOTYPING OF THE INNOVATIVE MODELS OF TIBIA NAILS
The idea to design a tibia nail, which eliminates the use of locking screws was given by the study of surgical techniques imposed by the classical tibia nails [2]. Classical nails had some important disadvantages as the difficulty of manipulation and positioning in the bone and, in the same time, the complicate orientation and displacement of the screws using the nail guide [2,3]. Also, all these operations can give failures or/and wrong holes in the bone, which can make the tibia more breakable. In the same time, all these extra-operations can increase the surgical time with unpredictable effects for the fixation of the fracture. All these designs of the tibia nail proposed by our research team have one single principle, different from the classical nails: the attachment of the nail to the bone is made in the medullar tibia channel by using metallic components. In the same time, the screws have rotational and translational movement, which assures the screwing in the bone and the fixation in the medullar channel [3]. These models were virtual-tested by using the finite element method using the force and the torque obtained through walking simulation (Figure 20). Supplementary, it was used a reaction intra-medullary torque of T=2.5 Nm necessary to penetrate the bone [2,3].
Figure. 20: Innovative tibia nail and FEA testing simulations [2,3]
6. RAPID PROTOTYPE METHOD APPLIED IN ORTHOPAEDICS [8]
In the last decade a new concept called rapid prototyping manufacturing, physical coating or without solid pre-form manufacturing has become popular in the science world. Operations called rapid prototyping (RP) have become relatively popular about twelve years ago, with the advent of stereo-lithography technology.
Stereo-lithography has seen a significant impact, especially in the design of new products. The process starts with a 3D CAD model involving ultraviolet sources and photosensitive polymers. Some authors use limited definitions for rapid prototyping and others are considering obtaining prototype technologies, deposition of thin layers of material. Basic aspects of the rapid prototyping process consist in automatic transposition of the CAD model to the real physical model.
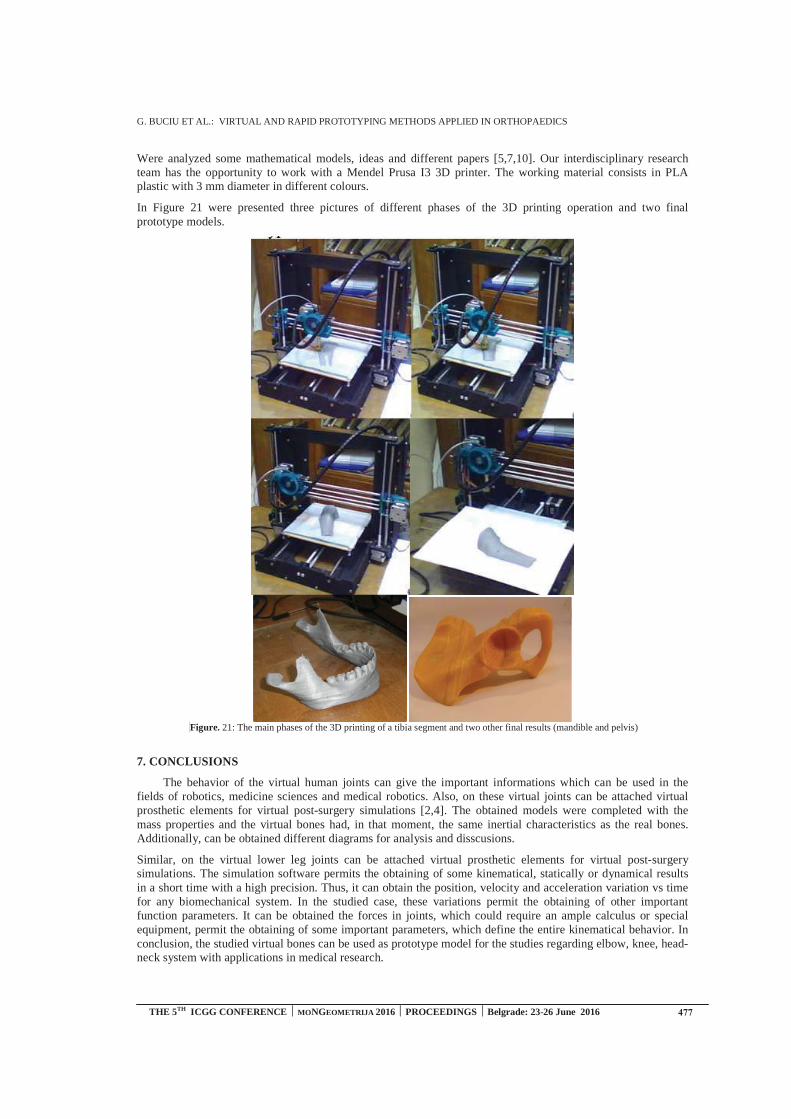
G. BUCIU ET AL.: VIRTUAL AND RAPID PROTOTYPING METHODS APPLIED IN ORTHOPAEDICS
THE 5TH ICGG CONFERENCE ⏐⏐ MONGEOMETRIJA 2016 ⏐ PROCEEDINGS ⏐ Belgrade: 23-26 June 2016
Were analyzed some mathematical models, ideas and different papers [5,7,10]. Our interdisciplinary research team has the opportunity to work with a Mendel Prusa I3 3D printer. The working material consists in PLA plastic with 3 mm diameter in different colours.
In Figure 21 were presented three pictures of different phases of the 3D printing operation and two final prototype models.
Figure. 21: The main phases of the 3D printing of a tibia segment and two other final results (mandible and pelvis)
7. CONCLUSIONS
The behavior of the virtual human joints can give the important informations which can be used in the fields of robotics, medicine sciences and medical robotics. Also, on these virtual joints can be attached virtual prosthetic elements for virtual post-surgery simulations [2,4]. The obtained models were completed with the mass properties and the virtual bones had, in that moment, the same inertial characteristics as the real bones. Additionally, can be obtained different diagrams for analysis and disscusions.
Similar, on the virtual lower leg joints can be attached virtual prosthetic elements for virtual post-surgery simulations. The simulation software permits the obtaining of some kinematical, statically or dynamical results in a short time with a high precision. Thus, it can obtain the position, velocity and acceleration variation vs time for any biomechanical system. In the studied case, these variations permit the obtaining of other important function parameters. It can be obtained the forces in joints, which could require an ample calculus or special equipment, permit the obtaining of some important parameters, which define the entire kinematical behavior. In conclusion, the studied virtual bones can be used as prototype model for the studies regarding elbow, knee, head-neck system with applications in medical research.

BUCIU G. ET AL.: VIRTUAL AND RAPID PROTOTYPING METHODS APPLIED IN ORTHOPAEDICS
THE 5TH ICGG CONFERENCE ⏐⏐ MONGEOMETRIJA 2016 ⏐ PROCEEDINGS ⏐ Belgrade: 23-26 June 2016
Also, were developed many types of kinematic and FEA simulations made on different assemblies composed by bones and metallic components to determine the virtual behaviour and to test implants and prosthetic elements [11]. Using rapid prototyping method these prosthetic components can be 3D printed and analyzed.
ACKNOWLEDGEMENTS
This work was partially supported by the grant number 9C/27.01.2014, awarded in the internal grant competition of the University of Craiova, Romania.
REFERENCES
1. Baciu, C., 1986. Musculoskeletal surgery and prosthesis, in Romanian, Ed. medicala, Bucure ti,pp. 399-404.
2. Buciu, G., Grecu, D., Niculescu, D., Chiutu, L., Stoica, M. and Popa, D., 2013. Studies aboutVirtual Behavior of Tibia Fractures and Nails During the Fixation. Journal of Industrial Designand Engineering Graphics, vol.8, issue no.2, pp. 5-10.
3. Buciu, G., Tarnita, D. N., Popa, D. L., Lungu, M. A., Miritoiu, C. and Ungureanu, A., 2014.Virtual and Experimental Studies about Human Walking. Virtual Lower Leg Environment.Innovative Design of Tibia Nail. Applied Mechanics and Materials, Trans Tech Publications,Switzerland, Vol. 657, pp 770-774.
4. Ciunel, S., Duta, A., Popa, D.L., Popa-Mitroi, G. and Dumitru, V., 2014. The Behavior of theVirtual Human Head-Neck System during the Main Movements, Applied Mechanics andMaterials, Trans Tech Publications, Switzerland, Vol. 657, pp. 780-784.
5. Duta, A., Ozyilmaz, E. and Sass, L., 2011. Phi Relationships And Fractals Of ThePentagon. Buletinul Institutului Politehnic Din Ia i, Tomme LVII (LXI), Fasc. 3, pp. 281-288.
6. Popa, D. L., Gherghina, G., Duta, A., Tutunea, D. and Ciunel, S., 2014. The methods andtechniques used for the human bones virtual re-construction. Proceedings of 4th InternationalScientific Conference on Geometry and Graphics moNGeometrija, vol.1, pp.189-198.
7. Popa, D. L., Gherghina, G., Tutunea, D. and Bogdan M. L., 2010. The Kinematic, Dynamic andFEA Analysis of the Human Main Joints. Proceedings of 14th International Research/ExpertConference ”Trends in the Development of Machinery and Associated Technology”,Mediterranean Cruise.
8. Popa, D. L., Tutunea, D., Gherghina, G. and Ciunel, S., 2015. Methods used for the virtual humanbones and joints re-construction. Normal and pathological human joints virtual simulations.Journal of Industrial Design and Engineering Graphics, special issue, section 2, Applied Geometryand Graphics, pp. 49-54.
9. SolidWorks. Tutorials. 1995-2016.
10. Tarni , D., Boborelu, C., Popa, D., Tarni , C. and Rusu, L., 2010. The three-dimensionalmodeling of the complex virtual human elbow joint. Romanian Journal of Morphology andEmbriology, Ed. Academiei Romane, 51(3), pp. 489-495.
11. Wiesel, S.W., 2010. Operative techniques in orthopaedic surgery, vol. 1.
12. http://svn.softwarepublico.gov.br/trac/invesalius [Accessed: 11th April 2015].
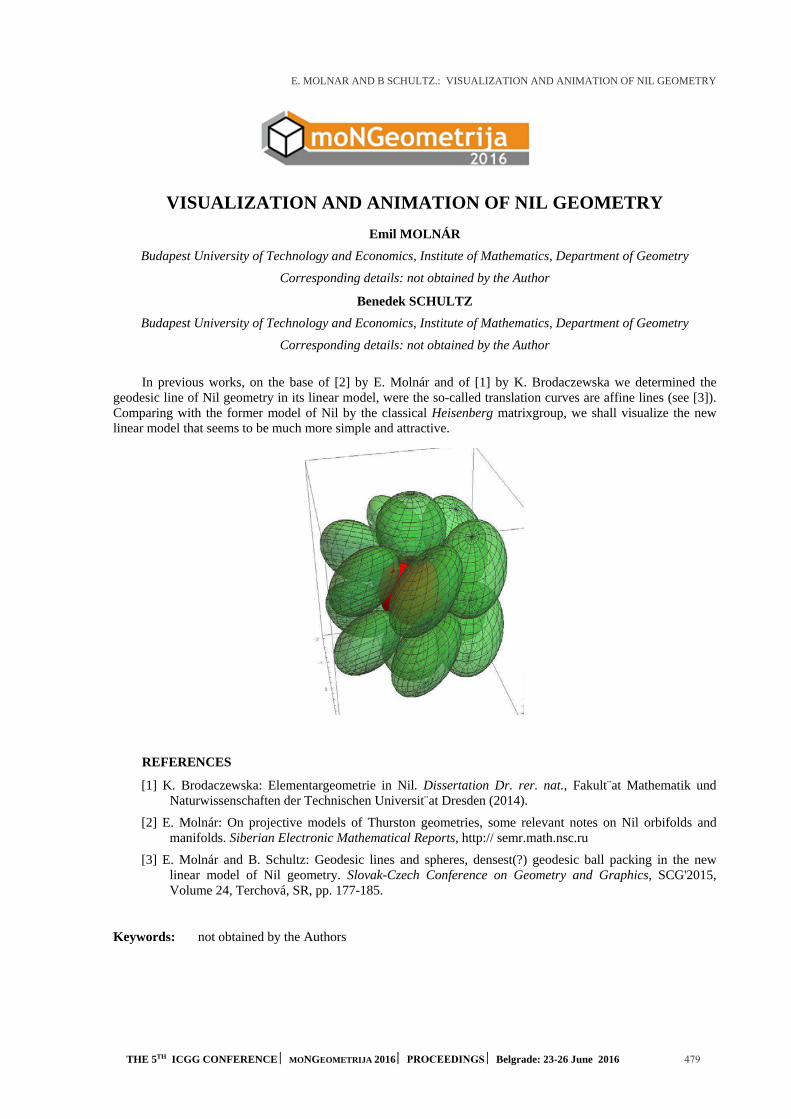
E. MOLNAR AND B SCHULTZ.: VISUALIZATION AND ANIMATION OF NIL GEOMETRY
THE 5TH ICGG CONFERENCE MONGEOMETRIJA 2016 PROCEEDINGS Belgrade: 23-26 June 2016 479
VISUALIZATION AND ANIMATION OF NIL GEOMETRY
Emil MOLNÁR
Budapest University of Technology and Economics, Institute of Mathematics, Department of Geometry
Corresponding details: not obtained by the Author
Benedek SCHULTZ
Budapest University of Technology and Economics, Institute of Mathematics, Department of Geometry
Corresponding details: not obtained by the Author
In previous works, on the base of [2] by E. Molnár and of [1] by K. Brodaczewska we determined the geodesic line of Nil geometry in its linear model, were the so-called translation curves are affine lines (see [3]). Comparing with the former model of Nil by the classical Heisenberg matrixgroup, we shall visualize the new linear model that seems to be much more simple and attractive.
REFERENCES
[1] K. Brodaczewska: Elementargeometrie in Nil. Dissertation Dr. rer. nat., Fakult¨at Mathematik und Naturwissenschaften der Technischen Universit¨at Dresden (2014).
[2] E. Molnár: On projective models of Thurston geometries, some relevant notes on Nil orbifolds and manifolds. Siberian Electronic Mathematical Reports, http:// semr.math.nsc.ru
[3] E. Molnár and B. Schultz: Geodesic lines and spheres, densest(?) geodesic ball packing in the new linear model of Nil geometry. Slovak-Czech Conference on Geometry and Graphics, SCG'2015, Volume 24, Terchová, SR, pp. 177-185.
Keywords: not obtained by the Authors

www.mongeometrija.org


![Ёпов[у 1]:е $пошпап](https://static.fdokumen.com/doc/165x107/631cb52e665120b3330bfcdc/yopovu-1e-poshpap.jpg)