
Proceedings / INTERNATIONAL conference on spatial data Infrastructures 2010
428
-
Upload
independent -
Category
Documents
-
view
1 -
download
0
Transcript of Proceedings / INTERNATIONAL conference on spatial data Infrastructures 2010


PPPP RRRR OOOO CCCC EEEE EEEE DDDD IIII NNNN GGGG SSSS
INTERNATIONAL SCIENTIFIC CONFERENCE
“International Conference on Spatial Data Infrastructures 2010”
15-17 September 2010, FON University, Skopje, Macedonia
All papers have been reviewed by the international review commission

INTERNATIONAL SCIENTIFIC CONFERENCE
“INTERNATIONAL CONFERENCE ON SPATIAL DATA INFRASTRUCTURES 2010”
15-17 September 2010, FON University, Skopje, Macedonia
http://sdi2010.evkartenn.com; [email protected]
2 / 10
EDITORS:
Ass.Prof.Dr. Bashkim IDRIZI, President of Geo-SEE Faculty of Natural Sciences and Mathematics
State University of Tetova
Str. Dzon Kenedi, 25/4-20, 1000 Skopje MACEDONIA Tel: + 389 75 712-998 e-mail: [email protected] e-mail: [email protected] web: www.unite.edu.mk Dimo TODOROVSKI, MSc
Researcher in Land Administration Domain
e-mail: [email protected] e-mail: [email protected]
South-East European Research Association on Geo Sciences “Geo-SEE”
www.geo-see.org
str. Dzon Kenedi, 25/1-d3;
1000 Skopje;
MACEDONIA.

INTERNATIONAL SCIENTIFIC CONFERENCE
“INTERNATIONAL CONFERENCE ON SPATIAL DATA INFRASTRUCTURES 2010”
15-17 September 2010, FON University, Skopje, Macedonia
http://sdi2010.evkartenn.com; [email protected]
3 / 10
GENERAL INTRODUCTION The main theme of the Conference was the development and use of Spatial Data Infrastructures (SDI’s) and all their aspects - technology, criteria and standards for organizing and sharing spatial data. The realization of the European INSPIRE directive in the countries of South East Europe was expected to be an important part of the conference. A Spatial Data Infrastructure (SDI) provides access to any kind of spatial data to users. It comprises the technology, policies, standards and human resources necessary to acquire, process, store, distribute and improve utilization of spatial data. The conference has the ambition to become the major SDI conference in the region and be influential for SDI development. It follows an earlier conference entitled “Importance of developing National Spatial Data Infrastructure of the Republic of Macedonia based on INSPIRE directive” that took place in Skopje on 27 March 2009 at the FON University. The conference showed the importance of SDIs and their use, on local, national or regional level in the region of South East Europe and its relation to global initiatives. It targets the process of spatial data sharing through the Internet, as a tool for faster, easier and simpler access to spatial data by all stakeholders, customers and clients; the implementation of International/Global and European criteria for organizing digital spatial data; the impact of SDIs on all application fields; cooperation between stakeholders such as state institutions responsible for collecting, structuring, archiving, updating and analyzing spatial data according to their legal mission and obligation. The conference brought together stakeholders interested in the development and use of SDIs, with a focus on the region of South-East Europe. Participants from other countries-continents would contribute with their research and experience. Scientist, researchers, industry and data owners from public or private sector are expected to contribute to increased understanding and awareness of SDIs in the region and to the identification of new ways of their implementation and use. Participation of professionals from all over the world, especially from European countries in the conference allowed sharing their experiences in developing and using SDI’s in their countries. Through scientific and practical solutions presented by the participants (scientific institutions-researchers, governmental and private sector organizations), and fruitful discussions and papers, methodologies and ways would be put forward, which will help finding out the probably best-appropriate-common ways for developing SDI’s in the region and in general and for special purposes and applications.
Bashkim IDRIZI Dimo TODOROVSKI

INTERNATIONAL SCIENTIFIC CONFERENCE
“INTERNATIONAL CONFERENCE ON SPATIAL DATA INFRASTRUCTURES 2010”
15-17 September 2010, FON University, Skopje, Macedonia
http://sdi2010.evkartenn.com; [email protected]
4 / 10
ORGANIZER:
South-East European Research Association on Geo Sciences “Geo-SEE”
Co-organizers:
International Federation of Surveyors “FIG” European Umbrella Organization for Geographic Information “EUROGI” Chamber of Authorized Surveyors of the Republic of Macedonia Geography department – State University of Tetova, Tetova, Macedonia FON University, Skopje, Macedonia Faculty of Geo-Information Science and Earth Observation – University of Twente, Enschede, Netherland
International organizing committee:
Alessandro ANNONI, Head of Spatial Data Infrastructures Unit, Joint Research Centre - European Commission, Italy András OSSKO, President of FIG Commission 7, Hungary Clarke KC, University of California SB, USA D.R. Fraser TAYLOR, Carleton University, Canada Georg GARTNER, Vienna University of Technology, Austria Ian MASSER, Past President of GSDI, University of Sheffield, Great Britain Laszlo ZENTAI, Etvosh University, Hungary Lazo ROLJIC, Pan-European University, Banja Luka, Bosnia and Herzegovina Mark REICHARDT, President of Open Geospatial Consortium (OGC) Mauro SALVEMINI, President of EUROGI Milan KONECNY, Past President of ICA, Check Republic Murat MEHA, University of Prishtina, Kosovo Necla ULUGTEKIN, Technical University of Istanbul, Turkey Oztug BILDIRICI, Selcuk University, Turkey Pal NIKOLLI, University of Tirana, Albania Puthiyavalappil RAJASEKHAR, Survey of India, India Raina PAVLOVA, Technical University of Sofia, Bulgaria Stig ENEMARK, President of FIG, Denmark Temenoujka BANDROVA, University of architecture, civil engineering and geodesy, Bulgaria Tuan VO ANH, General department of Land Administration, Vietnam Ulrich BOES, President of AGISEE, Bulgaria Yoshikazu FUKUSHIMA, Secretary General of ISCGM, Japan Željko BAČIĆ, Director General, State Geodetic Administration, Croatia

INTERNATIONAL SCIENTIFIC CONFERENCE
“INTERNATIONAL CONFERENCE ON SPATIAL DATA INFRASTRUCTURES 2010”
15-17 September 2010, FON University, Skopje, Macedonia
http://sdi2010.evkartenn.com; [email protected]
5 / 10
Local organizing committee:
Bashkim IDRIZI, State University of Tetova, President of Geo-SEE, Skopje Boris NIKODINOVSKI, Scientific Institution “IR Dr BN”, Skopje Boris PAUNOVSKI, Geoplan, Skopje Jove TALEVSKI, “St. Kliment Ohridski” University, Bitola Lazo PETRUSEVSKI, City of Skopje, Skopje Naumce LAZAREVSKI, Geoinformatika, Skopje Risto RIBAROVSKI, Chamber of Authorized Surveyors of the Republic of Macedonia, Skopje Temelko RISTEVSKI, FON University, Skopje Zlatko SRBINOSKI, “Ss. Cyril and Methodius” University, Skopje
International review commission:
Bashkim IDRIZI, State University of Tetova, President of Geo-SEE, Macedonia Clarke KC, University of California SB, USA D.R. Fraser TAYLOR, Carleton University, Canada Dimo TODOROVSKI, Researcher in Land Administration Domain, Macedonia Ian MASSER, Past President of GSDI, University of Sheffield, Great Britain Laszlo ZENTAI, Etvosh University, Hungary Lazo ROLJIC, Pan-European University, Banja Luka, Bosnia and Herzegovina Mauro SALVEMINI, Sapienza University of Rome, President of EUROGI, Italy Milan KONECNY, Past President of ICA, Check Republic Miljenko LAPAINE, University of Zagreb, Croatia Murat MEHA, University of Prishtina, Kosovo Necla ULUGTEKIN, Technical University of Istanbul, Turkey Oztug BILDIRICI, Selcuk University, Turkey Pal NIKOLLI, University of Tirana, Albania Puthiyavalappil RAJASEKHAR, Survey of India, India Raina PAVLOVA, Technical University of Sofia, Bulgaria Tuan VO ANH, General department of Land Administration, Vietnam Ulrich BOES, President of AGISEE, Bulgaria
Venue:
FON University – Skopje, Macedonia; www.fon.edu.mk

INTERNATIONAL SCIENTIFIC CONFERENCE
“INTERNATIONAL CONFERENCE ON SPATIAL DATA INFRASTRUCTURES 2010”
15-17 September 2010, FON University, Skopje, Macedonia
http://sdi2010.evkartenn.com; [email protected]
6 / 10
GREETING FROM PROF. STIG ENEMARK, PRESIDENT OF FIG
to the International Conference on SDI 2010 Skopje, Republic of Macedonia, 15-17 September 2010.
Dear Colleague, It is my great pleasure as President of the International Federation of Surveyors, FIG, to co-sponsor the International Conference on Spatial Data Infrastructures, to be held in Skopje, Republic of Macedonia, 15-17 September 2010. The conference themes cover all aspects of SDI’s and will have a special focus on the realization of the European INSPIRE directive in the countries of South East Europe. The conference has the potential to become the major SDI conference in the region and be influential for SDI
development in general. The conference will show the importance of SDIs and their use, on local, national or regional level in the region of South East Europe and its relation to global initiatives. Such global initiatives are also addressed through the work of FIG Commission 3 (Spatial Information Management) with a special focus on the challenges of the mega cities. I am therefore happy to know that the current Chair of FIG Commission 3 Mrs Chryssy Potsiou from Greece will attend the conference on behalf of FIG and ensure that the best possible synergies can be established. FIG is “Building the Capacity” based on our current work plan in the sense that capacity is needed in developing countries to meet the challenges of fighting poverty and developing a basis for a sustainable future. At the same time capacity is needed in developed countries to meet the challenges of the future in terms of institutional and organisational development in the areas of surveying and land administration. Therefore I am looking forward with great expectations to the outcome of the conference in Skopje and further cooperation to enhance professional development in the region. On behalf of FIG and the global surveying community I wish all the best for the SDI Conference in Skopje.
Prof. Stig Enemark President of FIG

INTERNATIONAL SCIENTIFIC CONFERENCE
“INTERNATIONAL CONFERENCE ON SPATIAL DATA INFRASTRUCTURES 2010”
15-17 September 2010, FON University, Skopje, Macedonia
http://sdi2010.evkartenn.com; [email protected]
7 / 10
GREETING FROM PROF. MAURO SALVEMINI, PRESIDENT OF EUROGI
to the International Conference on SDI 2010 - Skopje
We are definitely living in an ICT era where the geographic information is playing more and more a relevant role in the everyday life. Governments and private companies are basing and offering to citizens services placed on geographic components of the information and , on the other hand, the final user demand of micro-knowledge about territory and environment is steadily increasing. This process is affecting all
nations in different ways spanning from the essential cadastral information to advanced location based services. Generally speaking the euphoria for the GI might drive the consideration that everything is easy to get in the field and that the achievement of final good results regarding GI is obvious. Unfortunately the reality demonstrates that relevant efforts are clearly needed nowadays and that every one involved in GI should be involved for a better and deeper useful exploitation of GI in modern society. Awareness needs to be fostered, capacity building has to be performed in order to create reactive users especially in public administrations and the research, as a pillar component of societal development, needs to be sustained. In the present scene so well depicted by the INSPIRE Krakow Declaration , just recently approved, the role of non governmental organizations such as associations as EUROGI and his members absolutely fits the scene interpreting the final user needs for collaborating with the governments and public administrations for the benefit of the citizens. In this sense EUROGI is proud to support the SKOPJE 2010 Conference also as a starting event representing the academic and societal interest of this European region for the themes of SDI and GI. The European Umbrella Organization for Geographic Information (EUROGI) is a non-aligned, non-profit pan European organization which aims at promoting the widespread and effective usage of Geographical Information. Its direct membership involves representation from 17 countries, and includes private sector companies and other pan-European organizations involved in GI matters. Through its national members EUROGI has representation of over 6500 organisations across Europe. It was established in 1994 arising from an initiative of the European Commission which at the time saw the need for a combined European voice on Geographical Information matters. Mauro Salvemini President of EUROGI August 2010

INTERNATIONAL SCIENTIFIC CONFERENCE
“INTERNATIONAL CONFERENCE ON SPATIAL DATA INFRASTRUCTURES 2010”
15-17 September 2010, FON University, Skopje, Macedonia
http://sdi2010.evkartenn.com; [email protected]
8 / 10
CONTENTS:
1. Detailed survey concerning INSPIRE - coordination, funding and sharing measures in South-East Europe Joep Comprovets, Belgium, Danny Vandenbroucke, Belgium, Zorica Nedović-Budić, Ireland and Dimo Todorovski, Macedonia
1
2. Build-up of a business model for sustainable NSDI Vlado Cetl, Ivan Landek and Ante Roncevic, Croatia
17
3. NSDI in the context of INSPIRE – Slovenia’s state of the art and private sector challenges Bozena Lipej, and Darija Modrijan, Slovenia
30
4. The role of the Agency for Real Estate Cadastre in the establishment of the National Spatial Data Infrastructure Sonja Dimova, Macedonia
49
5. How a national GI association supports the SDI developments – the case of Hungary Gabor Remetey-Fulopp, Hungary
63
6. Hellenic mapping and cadastral organization GIS portal – towards Greek SDI Thodoros Vakkas, Angelos Tzotsos and John Petrogonas Greece
76
7. Slovenia Web-based GIS system: a case study from Slovenia Daniela Stojanova and Tom Levanic, Slovenia
88
8. Kosovo Expansion of the population in Kosovo by grid and construction of WEBGIS in Statistical Office of Kosovo Rahman Tara and Idriz Shala, Kosovo
96
9. Mapping air pollution in urban Tirana area using GIS Manjola Banja, Elvin Como, Bledar Murtaj and Albana Zotaj, Albania
105
10. An approach to mapping evapotranspiration by meteorological element with application to the territory of Albania Aferdita Laska Merkoci, Gezim Gjata, Miriam Ndini Bogdani,
Mirela Dvorani and Edlira Shkurti.Albania
115
11. Spatial data for better government of large cities – Bulgarian case Maria NIikolova, Bulgaria
133
12. Spatial Information in Megacity Management Paul Kelly, Australia, Robin Mclaren, Scotland and Hartmut
Mueller, Germany
144

INTERNATIONAL SCIENTIFIC CONFERENCE
“INTERNATIONAL CONFERENCE ON SPATIAL DATA INFRASTRUCTURES 2010”
15-17 September 2010, FON University, Skopje, Macedonia
http://sdi2010.evkartenn.com; [email protected]
9 / 10
13. Spatial Information Management and the current rapid processes of urbanization Yerach Doytsher, Israel, Paul Kelly Australia, Rafic Khouri,
France, Robin Mclaren, Scotland, Hartmut Mueller Germany and Chryssy Potsiou, Greece
158
14. Urban Management: Availability of technical tools development Chryssy POTSIOU, Greece and Yerach DOYTSHER, Israel
175
15. The infrastructure for spatial information in the European community vs. regional SDI: the shortest way for reaching economic and social development Mauro Salvemini, Italy
198
16. Regional GI cluster in support to the SDI development Anders Ostman and Jan Bjerkman, Sweden
209
17. Some issues to be taken into consideration while developing a NSDI in the Republic of Macedonia Dimo Todorovski, Macedonia
218
18. Deploying SMEs Engagement in SDI implementation Luka Jovicic, Serbia
226
19. Increasing accessibility and interoperability of soil data by building up an INSPIRE compliant European spatial data infrastructure Katharina Feiden, Fred Kruse, Germany, Zhenya Valcheva, and Georgi Georgiev, Bulgaria
238
20. Kosovo forest inventory project 2002-2003 Ferim Gashi, Kosovo
249
21. Overview on global map as contributor of GSDI Bashkim Idrizi, Macedoina, Murat Meha, Kosovo, Pal Nikolli,
Albania and Ismail Kabashi Kosovo
259
22. Some Alternative Solutions For Open Source SDI Arnaud Deleurme, Greece
277
23. Geoportal Solutions Based On Esri Gis Platform In Southeast Europe Dejan Krstevski, Macedonia
288
24. Homogeneous Coordinate Frames Vs. Existing Inhomogeneous Data Gerhard Navratil, Austria, Ismail Kabashi, Kosovo and Michaela
Ragobnic, Austria
306
25. The Coordinate Reference Systems Of Spatial Data Infrastructures In Albania Pal Nikolli, Albania, and Bashkim Idrizi, Macedonia
319

INTERNATIONAL SCIENTIFIC CONFERENCE
“INTERNATIONAL CONFERENCE ON SPATIAL DATA INFRASTRUCTURES 2010”
15-17 September 2010, FON University, Skopje, Macedonia
http://sdi2010.evkartenn.com; [email protected]
10 / 10
26. Development And Implementation Of New It System For Real Estate Cadastre Of The Republic Of Macedonia Dusan Fajfar, Vasja Kavcic, and Damijan Ravnik, Slovenia
336
27. Spatial Data Infrastructure For Real Estate Administration Based On Satellite Data Subija Izeirovski, Igor Nedelkovski, Macedonia Pece Gorsevski USA and Kujtim Xhila, Macedonia
347
28. Multipurpose Land Information Systems - An Albanian Perspective Pal Nikolli, Albania, Bashkim Idrizi, Macedonia, Ismail Kabashi, Kosovo and Sonila Papathimiu, Albania
365
29. The Creation Of Information System For The Unfinished Land Consolidation Of 1983/89 In Kosovo Murat Meha, Kosovo and Bashkim Idrizi, Macedonia
380
30. Administrative Protection Of The Confidentiality Of Spatial Information In The Republic Of Macedonia Temelko Risteski, Macedonia
390
31. Spatial Classification Of Land Parcels In Land Administration Systems Halil Ibrahim Inan, Arif Cagdas Aydinoglu, Tahsin
Yomralioglu,Turkey
405
32. Sponsors of the conference 414

International Conference SDI 2010 – Skopje; 15-17.09.2010
1
DETAILED SURVEY CONCERNING INSPIRE -
COORDINATION, FUNDING AND SHARING MEASURES IN
SOUTH-EAST EUROPE
Joep CROMPVOETS
1, Danny VANDENBROUCKE
2,
Zorica NEDOVIĆ-BUDIĆ 3, Dimo TODOROVSKI
4
ABSTRACT
In order to have better information concerning the current status of INSPIRE-implementation and
implementation process, a survey was distributed to the National Contact Points in November
2009. The survey aimed to collect information on the transposition of the INSPIRE-directive, the
set-up of coordination structures and specific INSPIRE bodies, the way they work and the way
tasks are distributed amongst the stakeholders. The survey also collected information on the
strategy developed for a smooth implementation of INSPIRE, the measures taken to fund specific
aspects related to the set-up of INSPIRE components (e.g. budget for coordination body, for
Implementing Rules on Metadata, for harmonising and transforming existing data sets) and the
measures taken to improve data and service sharing, including the encountered or expected
problems. The survey was based on a questionnaire with open and closed questions. Because
some of the questions were open, it is likely that the responses are not compatible as a result. The
answers to the questions were received in the months of January – March 2010.
This paper focuses on the survey results concerning the EU-member states Bulgaria, Cyprus,
Greece, Hungary, Romania, Slovenia, and EU-candidates Croatia, Macedonia, Turkey of South-
East Europe. The survey results are presented in the following way: Transposition status of
INSPIRE, Implementation strategy, Coordination and Cooperation, Measures to improve data and
service sharing, and Other questions. At the end, the main results are summarised.
Key words: INSPIRE, NSDI, Transposition, Coordination, Data and service sharing
1Dr. Joep CROMPVOETS, [email protected]
Public Management Institute, Katholieke Universiteit Leuven, www.publicmanagement.be
Tel.: +32 16 323134, Fax: +32 15 323611.
Parkstraat 45, bus 3609, B-3000, Leuven, Belgium 2 Danny VANDENBROUCKE, [email protected]
Spatial Application Division Leuven, Katholieke Universiteit Leuven, http://sadl.kuleuven.be/
Tel.: +32 16 329731, Fax: +32 16 329724.
Celestijnenlaan 200e, bus 02411, B-3001, Heverlee, Belgium 3 Prof. Zorica NEDOVIĆ-BUDIĆ, [email protected]
University College Dublin, School of Geography, Planning and Environmental Policy,
http://www.ucd.ie/gpep/index.html
Tel.: +353 (0)17162753, Fax: +353 (0)17162788.
Richview Campus - Planning Building, Clonskeagh Road, Dublin 14, Ireland 4 Dimo TODOROVSKI, MSc, [email protected], [email protected]
Researcher in Land Administration Domain
Mob.: +389 70 461 450,
Pavle Ilik 2/3-12, 1000 Skopje, Republic of Macedonia

International Conference SDI 2010 – Skopje; 15-17.09.2010
2
1. INTRODUCTION
The European Commission launched the INSPIRE initiative in 2001. With this initiative
the European Union wants to contribute to the development of a European Spatial Data
Infrastructure. The aim of this infrastructure is to allow the public sector users at the
European, national and sub-national level to share easily spatial data from a wide range
of sources in an interoperable way for the execution of a variety of public tasks. In order
to have a common legal basis throughout Europe, the European Commission drafted a
proposal for a Directive in 2004: “Establishing an infrastructure for spatial information
in the Community (INSPIRE)”. After intensive discussions between the Commission,
the Parliament and the Council, the final Directive was adopted on 25 April 2007
(European Commission, 2007).
From the very beginning, it was recognised that INSPIRE should build upon the
existing components of the emerging SDIs at national and sub-national level. In order to
have a better view on the status and development of these SDIs, the Commission
launched a study in 2002 which is known as INSPIRE State of Play (Vandenbroucke et
al. 2008). The study collects information on NSDIs in EU, EU Candidate en EFTA
countries according to the components as described in the GSDI cookbook (Nebert,
2004).
In order to have better information concerning the current status of INSPIRE-
implementation and implementation process, a survey was distributed to the National
Contact Points in November 2009. The survey aimed to collect information on the
transposition of the INSPIRE-directive, the set-up of coordination structures and
specific INSPIRE bodies, the way they work and the way tasks are distributed amongst
the stakeholders. The survey also collected information on the strategy developed for a
smooth implementation of INSPIRE, the measures taken to fund specific aspects related
to the set-up of INSPIRE components (e.g. budget for coordination body, for
Implementing Rules on Metadata, for harmonising and transforming existing data sets)
and the measures taken to improve data and service sharing, including the encountered
or expected problems. The survey was based on a questionnaire with open and closed
questions. Because some of the questions were open, it is likely that the responses are
not compatible as a result. The answers to the questions were received in the months of
January – March 2010.
This paper focuses on the survey results concerning the EU-member states Bulgaria
(BG), Cyprus (CY), Greece (GR), Hungary (HU), Romania (RO), Slovenia (SI), and
EU-candidates Croatia (HR), Macedonia (MK), Turkey (TR) of South-East Europe. The
survey results are presented in the following way: Chapter 2. Transposition status of
INSPIRE, Chapter 3. Implementation strategy, Chapter 4. Coordination and
Cooperation, Chapter 5. Measures to improve data and service sharing, and Chapter 6.
Other questions. At the end, the main results are summarised.
Finally, it is important to mention that the presented figures are directly copied from the
answers given by the National Contact Points and no revisions have made.

International Conference SDI 2010 – Skopje; 15-17.09.2010
3
2. TRANSPOSITION STATUS
The INSPIRE Directive came into operation on 15 May 2007, and member states were
given two years from this date to complete the tasks of transposing its provision into
national legislation. Related to this issue, the following questions were asked:
- What is the status of the transposition of the INSPIRE Directive? (Table 1)
- What were the main problems to overcome during the transposition phase? (Table 2)
- Which were the articles of the Directive that caused the biggest headaches? (Table 3)
Below the main results of these three questions are presented (Tables 1, 2 and 3).
Table 1a: Status INSPIRE Transposition by country
Country Status
BG Final text voted
CY Final text
GR Draft text
HR Partly transposed
HU Final text voted
MK Nothing
RO Final text published
SI Final text voted
TR Draft text
Table 1b: Summary of Status INSPIRE Transposition (8)
Nothing 1
Partly transposed 1
Draft text 2
Final text 1
Final text voted 3
Final text published 1
From the figures (in Table 1), it appears that only in one country (RO) a Final text is
published regarding the INSPIRE Transposition, a high variety in status of INSPIRE-
transposition across South-East Europe exists, and INSPIRE-transposition also a South-
East European activity is.
Table 2a: Main problems to overcome during transposition phase by country.
Country Problems
BG Coordination + No clear Implementing Rules
CY Coordination
GR Coordination + Data sharing policies + Legislation (no legal framework)
HR
HU No clear Implementing Rules
MK
RO Coordination + Institutionalisation + Transposition law

International Conference SDI 2010 – Skopje; 15-17.09.2010
4
SI Coordination + No clear Implementing Rules
TR Coordination
Table 2b: Summary of Main problems to overcome during transposition phase (7)
Coordination 6
Transposition law 1
No clear Implementing Rules 3
Institutionalisation 1
Data sharing policies 1
Legislation (privacy + data protection; security +
confidentiality; No Legal framework) 1
From these figures (in Table 2), it appears that the setting up of coordinate structures
and related arrangements have caused the main problems. Moreover, it appears that the
Implementing Rules have also caused some problems.
Table 3a: Articles of the Directive causing headaches by country
Country Articles that caused headaches
BG
CY Article 7
GR Article 19 (organisational structure) + Article 17 on data pricing and licencing
HR
HU Article 13, 14 and 17
MK
RO Unclear definition of public authorities
SI Article 17
TR
Table 3b: Summary of Articles of the Directive causing headaches (5)
No response 4
Article 17 3
Article 14 1
Article 19 1
Article 13 1
Article 7 1
From the figures (in Table 3), it appears that Article 17 referring to Data Sharing has
caused the biggest headaches. The high No response is remarkable.
Additional comments from the countries related to this Article issues are:
- GR. Article 19: it is very difficult to set up a new organisational structure
serving the needs of implementing INSPIRE, because of the high
fragmentation of responsibilities and activities throughout the public sector and
the non-existence of an operational framework for NSDI.

International Conference SDI 2010 – Skopje; 15-17.09.2010
5
- HU. Article 13: it was difficult to decide the limiting rules which could be set
up in the public access to spatial data sets and services related to paragraph 1,
because of collisions with the Hungarian data protection regulation. Article 14:
it caused many problems whether the spatial data services referred to in points
(b), (c), (d) and (e) of Article 11 may be ensured free of charges or not, since
the Hungarian data protection rules are more permissive. Article 17: it was the
same problem mentioned referring to Article 14 whether the data-sharing
between the public authorities may be ensured free of charges or not.
- RO. Article 3, number 3 (“public authority”): this definition has a different
meaning in RO.
- SI. Article 17: a common pricing policy was not regulated.
3. IMPLEMENTATION STRATEGY
The next questions deal with the strategies developed for a smooth implementation of
INSPIRE:
- Is there a strategy document regarding the INSPIRE implementation? On
organizational issues? On technological aspects? Is there an implementation plan
(different from the strategic document(s)) that describes the implementation steps?
(Table 4)
- Who has been involved in developing this strategy? (Table 5)
- Is the funding policy defined for INSPIRE-implementation? (Table 6)
- Is the funding for the coordinating body.structure, metadata creation, data
harmonisation/transformation, service development, setting-up registers? (Table 7)
- What are the sources of the funding? (Table 8)
Below the main results of these five questions are presented (Tables 4 – 8).
Table 4a: Strategy documents & Implementation plan by country
Strategy document
Implementation plan Organisational Technological
BG Yes Yes Yes
CY No Partly No
GR No No Yes
HR Partly Partly Partly
HU No No No
MK No No No
RO No No No
SI No No No
TR Yes Yes Yes
Table 4b: Summary of Strategy documents & Implementation plan (9)
Strategy document (Organisational)
Yes 2
No 6
Partly 1

International Conference SDI 2010 – Skopje; 15-17.09.2010
6
Strategy document (Technological)
Yes 2
No 5
Partly 2
Implementation plan
Yes 3
No 5
Partly 1
From the figures (in Table 4), it appears that most countries have any Strategy
documents or Implementation plans regarding INSPIRE (except BG, HR, TR). In GR,
only an Implementation plan has been written.
Additional comments from the countries related to these strategy documents and
implementation plans are:
- CY. A new strategy is promoted. A new project covers the strategic upgrade of
the currently applied Integrated Land Information System into a National Land
Information System providing the Cyprian NSDI. A pilot project using “real
live” data will be implemented, and a total of 5 land related agencies will be
linked together for sharing and exchanging spatial data. Special provisions will
ensure that the whole project will be implemented according to INSPIRE.
- RO. The Contact Point for INSPIRE is setting up a project financed by EU
Structure Funds in order to develop a RO INSPIRE strategy.
Table 5a: Involved in developing strategy by country
EU
National
government State Local Utility Universities Institutes
Commercial &
professional users
BG X X X X
CY X X
GR
HR X X X X X X X
HU
MK
RO X
SI X X X
TR X
Table 5b: Summary of Involved in developing strategy (6)
EU 2
National government 6
State 1
Local 1
Utilities 1
Universities 2
Institutes (public & private) 3

International Conference SDI 2010 – Skopje; 15-17.09.2010
7
Commercial & professional users 2
From the figures (in Table 5), it appears that the National governments are the main
organisations in the region that are involved in developing strategies. (Public & private)
institutes, Universities, and commercial & Professional users are also involved. In two
countries, the EU is involved (BG, HR).
Table 6a: Funding policy for INSPIRE Implementation by country
Funding policy
BG No
CY No
GR No
HR Partly
HU Yes
MK No
RO No
SI No
TR Yes
Table 6b: Summary of Funding policy for INSPIRE Implementation (9)
Yes 2
Partly 1
No 6
From the figures (in the Table 6), it appears that most countries have no Funding policy
(except HU, HR and TR).
Additional comments from HU related to these funding policies are:
- Since there are a number of INSPIRE data themes that do not have data
specifications and the directive does not clarify the scale of the data that has to
be included in the services, this makes it almost impossible to determine who
are the stakeholders and which datasets are involved. Thus cost calculation is
very uncertain. It is difficult to start implementing such a work without a
proper cost-benefit analysis, so the HUNAGI (Hungarian Association for Geo
Information) was asked to perform this analysis. The result of this analysis is
that the full implementation of the INSPIRE directive will cost around HUF
9,140,329,000 (± €34,000,000).
Table 7a: Funding for … (by country)
Coordinating
body/structure
Metadata
Creation
Data
harmonisation
Service
development
Setting-up
registers
BG
CY X X X X
GR
HR X

International Conference SDI 2010 – Skopje; 15-17.09.2010
8
HU X X X X
MK
RO
SI
TR X X X X X
Table 7b: Summary Funding for … (5)
Coordinating body/structure 4
Metadata creation 2
Data harmonisation 3
Service development 3
Setting up registers 2
From the figures (in the Table 7), it appeared that funding is mainly needed for
Coordinating body/structure. Funding is sometimes also needed for Metadata creation,
Data harmonisation, Service development and Setting up registers. In addition, finding
multiple activities is common practice. Table 8a: Funding sources by country
International
governments
National
governm.
State
governm. Provincial Agencies
Funds/Grant
(Inter)national
Private sector
donations
BG
CY X X
GR
HR X X X
HU X X
MK
RO X X
SI X
TR X X
Table 8b: Summary Funding sources (9)
International governments 0
National governments 6
State governments 1
Provincial 0
Agencies 2
Fund/grant (inter)national 3
Private sector donations 0
From the figures (in the Table 8), it appears that National government is the main source
of funding, National funds/grants are sometimes used for funding the INSPIRE-
implementation funding, and many countries have multiple sources to fund the

International Conference SDI 2010 – Skopje; 15-17.09.2010
9
INSPIRE-implementation. In TR, a publicly owned / privately operated company
(Turksat Corp. Inc.) is the main source of funding.
4. COORDINATION AND COOPERATION
The next questions deal with the coordination and cooperation issues related to the
implementation of the INSPIRE-directive:
- What is the name of the specific coordinating structure/body established to
implement INSPIRE? (Table 9)
- Is an existing organisation appointed to take the lead or act as coordinating
body? (Table 10)
- How many stakeholders are involved in the coordination? (Table 11)
- Which levels of authority are involved in the coordination? (Table 12)
- Which organisations are the most active in complying with INSPIRE? (Table
13)
- Are there organisations (both public and private) that changed their internal
structures in order to cope with INSPIRE? (Table 14)
Below the main results related to six questions are presented (Tables 9 – 14).
Table 9: Name INSPIRE coordination body by country
Name
BG
CY INSPIRE Management Board
GR
HR National SDI Council, NSDI Board, NSDI Workgroups
HU National Coordinating Committee for environmental spatial information
MK
RO Council for National Infrastructure for Spatial Information
SI National Contact Point
TR
From the figures (in the Table 9), it appears that a high diversiy of names exist referring
to same type of body. It is unknown what the names of the coordination bodies (if they
exist) are in BG, GR, MK and TR).
Table 10a: Existing organisation appointed to take the lead by country
BG Ministry of Transport, Information Technology and Communications
CY Ministry of Interior
GR
HR State Geodetic Administration
H
U Ministry of Environment and Water
M
K
RO National Agency for Cadastre and Land Registration

International Conference SDI 2010 – Skopje; 15-17.09.2010
10
SI Ministry of Environment and spatial planning
TR
General Directorate for Land Registry & Cadastre within Ministry of
Development & Housing
Table 10b: Summary of Existing organisation appointed to take the lead (7)
Mapping agencies 2
Ministries 5
From the figures (in the Table 10), it appears that ministries and mapping agencies are
the organisations appointed to take the lead in the implementation of INSPIRE. In two
countries (GR, MK), the organisations appointed to take the lead are unknown. In two
other countries, the Ministries of Environment are appointed to take the lead (HU, SI).
Table 11: Number of stakeholders involved by country
# Stakeholders
BG
CY 7
GR 14
HR 16
HU
MK
RO 20
SI
TR 32
Table 11b: Summary of Number of stakeholders involved (5)
Minimum 7
Maximum 32
Median 16
From the figures (in the Table 11), it appears that the number of stakeholders involved
ranges from 7 to 32 organisations, and that several countries are not able to provide the
number.
Table 12a: Involved levels in coordination by country
National Regional Local
BG X
CY X
GR
HR X X X
HU X
MK X
RO X X
SI X
TR X X

International Conference SDI 2010 – Skopje; 15-17.09.2010
11
Table 12b: Summary of Involved levels in coordination (8)
National 8
Regional 1
Local 3
From the figures (in the Table 12), it appears that the National level is the dominant
level in coordination. GR is the only EU member state where the national government is
(still) not involved. In 5 countries, only the national level is involved (BG, CY, HU,
MK, SI).
Table 13a: Most active organisations by country
BG Environment
CY Mapping agencies, Ministries, Environment, Statistics, Geology, Post, Utilities
GR Mapping agencies
HR Mapping agencies, Ministries, Private sector companies
HU Mapping agencies, Ministries, Regions
MK
RO Mapping agencies, Ministries
SI Mapping agencies, Ministries, Environment, Statistics
TR Ministries, publicly owned/privately operating company
Table 13b: Summary of Most active organisations (8)
Mapping agencies 7
Ministries 5
Regions 1
Environment 3
Statistics 2
Geology 1
Post 1
Utilities 1
Private sector companies 1
Publicly owned / privately
operating companies 1
From the figures (in the Table 13), it appears that the Mapping agencies are the most
active organisations in the region, but Ministries and Environmental protection agencies
are also active. In addition, the long list of active organisation types is remarkable.
Table 14a: Internal structure change within organisations in order to cope with
INSPIRE by country
BG No, too early
CY No
GR No

International Conference SDI 2010 – Skopje; 15-17.09.2010
12
HR Yes
HU Yes
MK
RO Yes
SI No
TR Yes
Table 14b: Summary of Internal structure change within organisations in order to cope
with INSPIRE (8)
No, too early 1
No 3
Yes 4
From the figures (in the Table 13), it appears that several countries have experienced
internal structure change within organisations in order to cope with INSPIRE. The most
internal structure changes happen at the mapping agencies (HR, HU, RO, TR). For
example, the HR mapping agency State Geodetic Administration has changed its
organizational structure, and a NSDI-section is introduced. In addition, the TR General
Directorate for Land Registry & Cadastre within Ministry of Development & Housing
has also experienced some changes
5. MEASURES TO IMPROVE DATA AND SERVICE SHARING
In order to improve the data and service sharing, specific measures have been taken.
The following two questions deal with these measures:\
- How is access to spatial data sets falling under one of the 34 INSPIRE theme
regulated? (Table 15)
- Are any of the reasons that can be invoked - according to the Directive – to
limit public access to certain data sets currently applied? (Table 16)
It is important to remark that the results are not dataset specific, but cover all the
relevant data sets together. In this way, the results have to be only interpreted as an
indication regarding the application of the access regulations across Europe, and the
existing reasons for limited public data access across Europe.
Below the main results related to the two questions are presented (Tables 15 – 16).
Table 15a: Access regulation by country
Unrestricted
public access
Unavailable for
external use
Selective/limited
by policy
Ad hoc/ by individual
request
BG
CY X
GR X
HR X X X
HU X X X
MK

International Conference SDI 2010 – Skopje; 15-17.09.2010
13
RO
SI X X
TR X X
Table 15b: Summary Access regulation (6)
Unrestricted public access 3
Unavailable for external use 2
Selective /limited by policy 4
Ad hoc / by individual request 3
From the figures (in the Table 15), it appears that the “Selective/limited by policy” is
the most frequently used access regulation, and that “Unavailable for external use” is
the least frequently used access regulation. Moreover, it appears that in many countries
multiple access regulation types are applied.
Additional comment from HR related to Access regulation is:
- Several datasets (alphanumerical cadastral and land registry data, agricultural
land subsidy system data) are available via web-browsers free of charge to any
user (www.katastar.hr , www.pravosudjel.hr, www.arkod.hr). In accordance to
the respective laws and by-laws for some datasets a fee is charged (like
topographical maps etc.). These datasets are all available without restrictions,
but a fee has to be paid.
Table 16a: Reasons for limited public data access by country
Confidentia
lity of the
proceeding
s of public
authorities
International
relations,
public
security or
national
defence
Cou
rse
of
just
ice
Confidentiali
ty of
commercial
or industrial
information
Intelle
ctual
proper
ty
rights
Confid
entialit
y of
persona
l data
Protection of
information
provided on
a voluntary
basis
Protect
ion of
the
enviro
nment
BG
CY X X
GR X X X
HR X X X X
HU X X
MK
RO
SI X
TR
Table 16b: Summary of Reasons for limited public data access (5)
Confidentiality of the proceedings of public authorities 1
International relations, public security or national defence 3
Course of justice 0
Confidentiality of commercial or industrial information 2
Intellectual property rights 2

International Conference SDI 2010 – Skopje; 15-17.09.2010
14
Confidentiality of personal data 3
Protection of information provided on a voluntary basis 0
Protection of the environment 1
From the figures (in the Table 16), it appears that many reasons are applicable for
limited public data access, and the key reasons for limited public data access are
International relations, public security or national defence, and Confidentiality of
personal data (privacy). Other important reasons for limited public data access are
Confidentiality of commercial or industrial information, and Intellectual property rights.
Finally, it is remarkable that three countries ticked none of the presented reasons (BG,
MK, TR).
6. OTHER QUESTIONS
The last remaining questions deal with the establishment of the National Geo-portal and
the INSPIRE. The corresponding questions are:
- Is a National Geo-portal established, in the sense of a single entry point to data
and services, for INSPIRE? (Table 17)
- What is the main success that INSPIRE has achieved so far? (Table 18)
Below the main results related to these two questions are presented (Tables 17 – 18).
Table 17a: Establishment of National Geo-portal by country
BG No
CY No
GR No
HR No
HU No
MK No
RO No
SI Yes
TR No
Table 17b: Summary of Establishment of National Geo-portal (9)
Yes 1
No 8
From the figures (in the Table 17), it appears clearly that not many countries have
established a National Geo-portal. Only SI established a National Geoportal. The
Number of datasets discovered, Number of datasets viewed, and Number of datasets
downloaded are respectively, 30, 30 and 15.
Table 18a: Main INSPIRE Success by country
BG Spatial data awareness, Capacity building
CY New law for data sharing/access
GR

International Conference SDI 2010 – Skopje; 15-17.09.2010
15
HR
HU Spatial data awareness, NSDI-awareness
MK
RO
SI Harmonisation, Process coordination between data providers and users
TR Spatial data awareness, Feasibility study
Table 18b: Summary of Main INSPIRE Success(5)
Spatial data awareness 3
(N)SDI-awareness 1
Harmonisation data providers/users 1
SDI-Capacity building 1
Legislation for data sharing 1
Spatial data harmonisation 1
Feasibility study 1
From the figures (in the Table 18), it appears that the list of INSPIRE successes is (still)
rather short, and that the increase of the awareness of the strengths of spatial data use is
the main success of INSPIRE in the region. It also appears that most successes are non-
technological. Finally, it is remarkable that four countries were not able to mention any
INSPIRE success (GR, HR, MK, RO).
7. SUMMARY
Having a look to the results, the current status of the INSPIRE-implementation in
South-East Europe, in particular concerning the INSPIRE-coordination, funding and
sharing measures, can be characterised as follows:
- Transposition of INSPIRE is not completed in most countries
- Coordination structures and related arrangements appear to be problematic
- Most countries have any Strategy document or Implementation plans regarding
INSPIRE-implementation
- National governments are the organisations involved in developing strategies
- Most countries have no Funding policy for INSPIRE-implementation
- Funding is mainly used for financing the Coordination bodies/structures
- The Funding source is the National government
- Ministries and mapping agencies are the organisations appointed to take the
lead in the INSPRE implementation process
- A significant number of Stakeholders are involved in the coordination
- The National level is the level involved in the coordination
- Most active organisations are the Mapping agencies
- ‘Selective/Limited by policy’ is the most commonly applied measure for
Access Regulation
- Security and Privacy issues are the main reasons for limited public access
- Not many National Geo-portals have been established in the region
- The main INSPIRE success so far is the increase of the awareness of the
strengths of spatial data use

International Conference SDI 2010 – Skopje; 15-17.09.2010
16
In order to interpret the meaning of the survey results for the future INSPIRE-
implementation in the region of South-East Europe, it is necessary to analyse the results
in more detail. Therefore, more research to analyse the results is strongly needed.
8. REFERENCES European Commission. (2007). Directive 2007/2/EC of the European Parliament and the Council
of 14 March 2007 establishing
an infrastructure for spatial information in the Community (INSPIRE). Official Journal
of the European Union 326:12-30.
Nebert, D.D., ed. (2004). Developing spatial data infrastructures: The SDI cookbook. Version 2.0.
Reston, Va: FGDC.
www.gsdi.org.
Vandenbroucke, D., Janssen, K., J. Van Orshoven. (2008). INSPIRE State of Play: Generic
approach to assess the status of
NSDIs. In A Multi-View Framework to Assess Spatial Data Infrastructures, eds. J.
Crompvoets, A. Rajabifard, B. van
Loenen, T. Delgado Fernández. Melbourne: Melbourne University Press

International Conference SDI 2010 – Skopje; 15-17.09.2010
17
BUILD-UP OF A BUSINESS MODEL FOR SUSTAINABLE NSDI
Vlado CETL 1, Ivan LANDEK
2, Ante RONČEVIĆ
3
ABSTRACT Experiences from most countries worldwide show that initial funds for setting up the first generation NSDI come from the state budget. However, the NSDI development process has several phases, including implementation, maintenance and further development, which requires a long-term stable finance mechanism. Therefore, a short-term finance mechanism can rely on the state budget, but for sustainable development it is necessary to define a long-term one. Development stage of the existing NSDI is closely related to this. In the early phase of the NSDI set-up, it is not possible to gain benefits alongside reasonable costs, and financial support is necessary. In this phase it is unlikely to expect bigger engagement from the private sector, and the financing relies on the state budget. Further development and the move from the 1st-generation to 2nd-generation NSDI marks its ability to stimulate productivity and the spatial data and service market, to achieve benefits and contribute to the overall society welfare. Support for this process is achieved through building a business model for sustainable partnership and a business network, and for functioning joint services. This paper gives theoretical views of the build-up of an NSDI business model, as well as practical experiences of the work group for building the NSDI business model in Croatia. Key words: NSDI, business model, Croatia.
1. INTRODUCTION
Over 80 % of all available information includes a spatial component (Ryttersgard 2001), which calls for more efficient management of spatial data at all society levels. From local to global level, there is a need for simpler access to spatial data, their integration and use. Organization of spatial records and their distribution leads to development of a spatial data infrastructure (SDI) at national, regional and global levels. Each higher level consists of one or more elements of a lower level and besides the vertical connection between specific levels, there are some firm, complex horizontal connections based on the legal and political framework. It is difficult to define the
1 Ph.D. Vlado CETL, [email protected] Institution, Faculty of Geodesy, www.geof.hr Tel.: +385 1 4639-191, Gsm.: +385 91 5021-888, Fax: +385 1 4828-081. Kaciceva, 26, 10000 Zagreb, Croatia. 2 Ivan LANDEK, dipl. ing., [email protected] State Geodetic Administration, www.dgu.hr Tel.: +385 1 6165-422, Gsm.: +385 98 382-620, Fax: +385 1 6165-430. Horvatova, 82, 10000 Zagreb, Croatia. 3 MSc Ante RONČEVIĆ, dipl. oecc., [email protected] Croatian Radiotelevision, www.hrt.hr Tel.: +385 1 6343-186, Gsm.: +385 98 354-643, Fax: +385 1 6343-850. Prisavlje, 3, 10000 Zagreb, Croatia.

International Conference SDI 2010 – Skopje; 15-17.09.2010
18
extent of thoroughness of data that will satisfy users’ needs at specific levels. Considering the hierarchy and needs, the given data are mostly an agreement between all available data at different levels. Results of the research done in Rajabifard et al. (2000) show that a national spatial data infrastructure (NSDI) plays a key role in the development and implementation of other levels. The initiatives taken are aimed at an unlimited, quick, single and simple access to spatial data and services for all interested users. Also, what is common to all initiatives is the economic aspect of NSDI, ie. importance and effect on the economic development of countries taking part in its implementation (Cetl, 2007). The initiators are mostly governments or competent ministries, which means that establishment of an SDI is not only in the interest of spatial data users, but is a priority for the whole society (Cetl et al., 2002). From today's perspective, the SDI development can be divided into two generations (Masser, 2005). The first generation was primarily oriented towards technical issues and data as final products (product-oriented). In this phase it was unlikely to expect bigger engagement from the private sector, and the financing relied mainly on the state budget. The second generation has been oriented towards users and services (service-oriented). Today spatial data users not only want to access data, but also use various services and analyses, which includes combining different heterogeneous spatial databases and other sources. A prerequisite for this new, user- and service-oriented SDI generation is interoperability. From the financial point of view 2nd-generation NSDI marks its ability to stimulate productivity and the spatial data and service market, to achieve benefits and contribute to the overall society welfare. The market for spatial data, information and services has undergone major changes, with the Internet and E-commerce as business drivers. Today we can often see every day some new products and services specified by spatial data users for a specific use. Just few years ago only producers were able to specify the content and quality of an available product. The shift from a situation where the national mapping agencies almost had a monopoly to a market with a widely distributed supply chain demands new business models, new prizing algorithms, clarified rules for copyright, standardized product specifications and access to metadata and it demands partnership and strategic partnerships between the possible players in the spatial information arena (Ryttersgaard and Ives, 2001). The emergence of Google Earth and Google Maps has created a geo-awareness and has catalyzed a thirst for custom spatial data and services (Donker, 2009). The greatest producers but also the greatest users of spatial data and services are governments. They often possess high-quality large-scale spatial data, primarily collected, developed and maintained to support public tasks. This rich source of spatial data asks to be used and reused both within the public sector and by the whole society. There is no doubt that simple access to geospatial data is the key prerequisite for an efficient and economically prosperous society. According to this, Croatia started an NSDI improvement to achieve benefits from usage of spatial data and services. One of the tasks in the process of improvement is creating of a sustainable business model. In this paper it will be presented some theoretical aspects of NSDI business model, as well as practical experiences of the work group for building the NSDI business model in Croatia.

International Conference SDI 2010 – Skopje; 15-17.09.2010
19
2. NSDI FINANCIAL ASPECTS
The NSDI development is complex. It is a joint effort involving stakeholders from different levels of government, the private sector, academia and the professions. Individuals or groups may each play a single but different role or take on multiple roles. This is very much determined by one’s positioning and business model in the spatial information industry (Chan et al, 2005). An SDI at the national level is very important to a nation’s development and requires a strong political will and contributions from all sectors of the society for its successful implementation (Giff and Coleman, 2002). An SDI may be viewed as a Classic Infrastructure providing public goods since spatial information displays a majority of the characteristics associated with public goods.
2.1. Business case
The NSDI must not be developed hastily, but a clear vision is needed, which is to be based on organizational, human and financial resources (Cetl et al., 2009a). How much NSDI cost and is it possible to realistically estimate all the costs necessary for its building, improvement and maintenance, plus the costs of all connected activities? The answer to this question requires an accurate definition of the SDI parts and all included subjects, as well as drawing up a business case the crucial component of which should be financing models. A business case structure has 7 steps (Centre for International Economics, 2000) (Figure 1).
Figure 1. A business case structure for NSDI
The role of a business case is defining the source, size and all other factors influencing the development and demand of a product. In the NSDI context a business model has to identify all economic and social benefits. Also, effective methods should be developed

International Conference SDI 2010 – Skopje; 15-17.09.2010
20
which will demonstrate usefulness to different types of investors. Finding the most efficient financing mechanism is achieved through analyzing and testing different models in different conditions. Such analyses should give answers to and guidelines for key financial questions:
1. Where and when to look for sources of financing? 2. What are the connections between different sources? 3. How to present the financing concept in the best way to the Government and
other financial subjects (banks and private sector)? 4. How to organize financing for efficient implementation (financing of different
phases)? 5. What is the time period for financing? 6. What is the effect of financing on the pricing and fee policies?
Defining everything included in the NSDI includes the costs of its improvement and other connected activities. The sources and amount of costs can be seen through several factors:
1. Costs of collecting spatial data and/or their maintenance; 2. Costs of physical infrastructure (net resources); 3. Costs of adjusting data to appropriate norms, creation of metadata and
catalogue; 4. Costs of people: 5. Other costs.
Unlike the costs that can be estimated and approximated to a high degree of accuracy, a benefit estimate is more complex. The reason for this is a possible big number of different applications and users who, by using spatial data and information, create further improvement and revenue in their organizations, which indirectly affects the whole society (Cetl, 2007). Rightly or wrongly it is often claimed that the "real" benefits of SDI are better decision- making, improved policy outcomes, more flexible access to data or some other so-called soft benefit (Wishart, 2009). Doing cost-benefit analyses for the needs of NSDI is not simple and around the world there are very few extensive cost/benefit and RoI (Return on Investment) studies (Cetl et al, 2008a). It is certain that we cannot tell who and what all is included in the creation of NSDI, what costs these activities make, and what all sources of financing are necessary. Some existing cost-benefit analyses result in the ratio from 1:3 to 1:4. According to Roger Longhorn (2009) the RoI ratio for an SDI or SDI like activity was never less than 1:1! So it is unquestionable that the NSDI improvement results in financial benefits for all subjects included in the process and the society as a whole.
2.2. Business model
After defining a business case, a business model should be defined. Business model is a method of doing business by which a company can sustain itself – ie. generate revenue. Revenue is an income that a company receives from its normal business activities, usually from the sale of goods and services to customers. A business model describes the strategies implemented to achieve this goal. A business case or a financial model is an essential part of the business model.

International Conference SDI 2010 – Skopje; 15-17.09.2010
21
Setting up an efficient NSDI requires creating a business model in close correlation to an implementation model (Wagner 2005) (Figure 2).
Figure 2. Correlation between an implementation and a business model
A business model defines business goals of the infrastructure. It also has to clearly define roles of all NSDI subjects for business processes within the NSDI, and enable a short-term and long-term sustainable financing and development. One of the important issues in NSDI business model is also a question of appropriate pricing policy. The question whether public bodies can charge for making their spatial data available has been a constantly returning item on the NSDI agenda for years. Spatial data can be used by public bodies for performing their public tasks, by the private sector for creating commercial products, or by citizens for participating in their national democracy or holding their government accountable. The arguments that are used to defend either cost recovery or open access policies will have a higher or lower value depending on this purpose of use (Janssen et al., 2009). The ratio between prices of public information and charges for their usage is very complex. Influences on that ratio are at least from market but much more from social, political and very often subjective criteria (Cetl et al., 2008b). Generally, there are three basic models for charging spatial data dissemination:
1. Full cost recovery – costs of collecting and distributing data are fully defined and covered
2. Partial return on investment – costs of distribution and part of investment costs are defined and covered. This differs depending on whether it is a private, commercial or noncommercial user. Private and commercial users pay more, and noncommercial less or only marginal costs.
3. Model of partial return on the investments in distribution – only distribution costs are defined. There is usually no difference between private, commercial and noncommercial users. Security of data privacy and copyrights should be guaranteed.
4. Free-of-charge access to data.

International Conference SDI 2010 – Skopje; 15-17.09.2010
22
There have been debates in Europe in the last years about whether fees should be introduced or free access granted, as for example in the USA. A majority advocates free access and unlimited use of all data which the public administration possesses, which is supported in academic research as well. However, the other option claims that users generally make bigger pressure if they pay for the given data, which eventually results in a better quality of spatial data. A good example is the model used in the Kingdom of Norway. To be able to consider data which are free for a wider group of users - citizens (it is assumed that use of data will not generate a new product with a new value), it is necessary to close the financing circle so that total costs are divided between the state administration, units of local self-government and big public companies (eg. INA, JANAF, PLINACRO).
3. NSDI IN CROATIA
In the last few years there have been different initiatives and activities concerned with the NSDI and most of these were initiated by the State Geodetic Administration (SGA), which is the national mapping and cartographic agency (NMCA). The first legislation concerning the NSDI in Croatia came into force in February 2007 with a new Law on State Survey and Real Estate Cadastre (OG, 2007). A separate chapter defines NSDI as a set of measurements, standards, specifications and services which, within the framework of establishing e-government, aim at enabling effective gathering, managing, exchange and usage of georeferenced spatial data. The Law gives definitions of NSDI and metadata, content of metadata information, services, NSDI data and subjects that are required to participate in its establishment and maintenance, and what is very important, gives an institutional framework and defines NSDI bodies and their responsibilities. It is to be stressed that at the time the Law was being prepared, the INSPIRE directive was in its final phase. Croatia is still a non-EU country and is not required to apply the INSPIRE directive at the moment, but it was decided to use the advantage of INSPIRE being prepared in order to make the information society ready for implementing it at the moment Croatia joins the EU. As a result there is a high compatibility between the Law and the INSPIRE directive (Cetl et al., 2009b). Furthermore, the Law defines an institutional framework, i.e. NSDI bodies at three management levels: NSDI Council, Committee and working groups as well as their obligations (Figure 3).

International Conference SDI 2010 – Skopje; 15-17.09.2010
23
Figure 3. NSDI institutional framework
The NSDI establishment and coordination of the activities of the NSDI subjects are governed by the NSDI body composed of a chairman and 15 members appointed and relieved of duty by the Croatian Government. The members come from different ministries, state bodies, IT, geodetic and geo-informatics economic community. The NSDI Council promotes the establishment of the spatial data sets and services as well as the establishment and monitoring of the spatial metadata system functioning of the NSDI subjects (Bačić and Rašić, 2009). At the managerial level, there is the SDI Committee appointed by the Council and consisting of three representatives from the Council, two from the SGA and the heads of working groups. The NSDI Committee implements the NSDI establishment policy determined by the NSDI Council, performs the works and tasks delegated by the NSDI Council, coordinates and monitors the work of the working groups and coordinates the implementation activities of the NSDI subjects related to their establishment in accordance with the NSDI Council guidelines. Working groups are temporary or permanent work bodies responsible for the concept and implementation aspects. Their members are representatives of the state authorities at all levels, of users and producers of spatial data, research and educational institutions, etc. These bodies are appointed or dismissed by the NSDI Committee, with approval of the NSDI Council. A prerequisite for forming a body is a clearly defined mission and a detailed execution plan. During 2008 two working groups (WGs) were created: a WG for NSDI technical standards and a WG for spatial data sharing policies. At the end of 2009 three new working groups were created: WG for building the NSDI establishment capacities, WG for linking the NSDI program and e-Government and WG for establishing a business model for the NSDI.

International Conference SDI 2010 – Skopje; 15-17.09.2010
24
The State Geodetic Administration in the organizational structure is a coordination body, a kind of secretariat, providing continuous support in the NSDI development process, coordinating work of all NSDI bodies, and providing technical support. Its main tasks are: set-up and maintenance of the central NSDI web portal, securing communication support, public relations, services of leading projects, services of quality control, etc. This organizational structure is similar to that in countries like Germany or the Netherlands.
3.1. WG for establishing a business model for the NSDI
The Croatian vision of NSDI concluded that spatial data and services should be treated as economic goods, produced and integrated in the value chains and as such an object of trade. Market mechanisms will be used to coordinate the supply and demand of products based on spatial data. Due to complexity of tasks which are to be realized to set conditions for a market treatment of public spatial data, it is necessary to network three types of partners:
• infrastructure management, • content management, • sales management.
Precisely with this aim the NSDI Council decided on 8 July 2009 to form a WG for establishing an NSDI business model. The first meeting of the WG was held on 20 October 2009. The working group has a director and 28 members. A response to participate in the group outdid all expectations and this WG has the most members in comparison to others which have 10 members on average. The WG members come from the state administration, ministries, academia and private sector. The WG is organized as one operational WG and three subgroups. The operational WG has a director and three representatives from each subgroup, who meet regularly once a month. The WG will develop a model for establishing sustainable partnership and a business network, and for works of joint services such as a catalogue, etc. It should be emphasized that this WG is doing a pioneering work because similar WGs in other countries are also in the early phases of work. The activities which the WG is doing at the moment are:
• enabling exchange of experiences, good examples and other information for efficient implementation of an NSDI business model,
• monitoring the activities of implementing INSPIRE, • collaboration with other working groups within the NSDI establishment, • creating a strategy for building an NSDI business model, • reporting on its work to the NSDI Board and NSDI Council.
One of the first goals to be achieved is creating a strategy for NSDI business model, which will be put forward to the NSDI Council, and which should be accepted by the Croatian Government as a national strategy or a white paper.

International Conference SDI 2010 – Skopje; 15-17.09.2010
25
3.2. Existing business model for spatial data producing
The whole production of official spatial data in Croatia that are under responsibility of SGA has been outsourced and performed by private sector. The Law on State Survey and Real Estate Cadastre confirmed the co-financing model, defining that counties, cities, municipalities and other interested legal and natural persons can participate in the provision of funds for carrying out the state survey and real estate cadastre works. The described process was a prototype of NSDI (Figure 4).
Figure 4. Cooperation model as an NSDI forerunner (Bačić et al, 2008)
The previous model was primarily oriented towards certain ministries, units of local self-government and larger state and public companies. This co-financing model will be continued also with new participants in the upcoming period, given that there is readiness and interest of all stakeholders that have been participating in the co-financing so far. Subjects which sign this agreement with the SGA are given the right to use of official spatial data under the SGA’s authority for the period in which the agreement is in force. Although the described model is functional and efficient, its primary purpose is financing the creation of new spatial data and updating the existing data. Also, the agreement is signed for a fixed time period, and the NSDI requires a long-term stable financing model. For this reason the evolution from the 1st to 2nd generation NSDI requires a bigger engagement of the private sector. Financing mechanisms for the NSDI improvement have to cover a short-term (initial) as well as a long-term (permanent) period. Spatial data and information within the public sector bodies represent public goods, and the aim of NSDI improvement is a support to efficient management and e-government. Besides, it has already been mentioned that

International Conference SDI 2010 – Skopje; 15-17.09.2010
26
the Government is generally the biggest user of spatial data. So it can be concluded that initial funds for the improvement should be provided from the state budget. Further financing requires additional sources, and according to research results, the optimal mechanism seems to be public-private partnership (Figure 5).
Figure 5. NSDI financing model (Cetl, 2007)
One of ever more common financing sources for infrastructural projects is public-private partnership, which involves cooperation between the public administration bodies and the private sector with the aim of satisfying a public need. In this way, through different methods the private sector can employ its own resources and skills to offer goods and services traditionally provided by the public administration bodies. A bigger engagement of the private sector in the NSDI improvement can be expected only after the initial phase. The reason for this is the achievement of added value, which is the main factor in this sector. The end of the initial period should result in setting up services which will be recognized by the private sector for further investment, which will finance the maintenance and development or the 2nd generation NSDI. 4. CONCLUSIONS Considering the effects and significance of wider interest to the public and society, the NSDI improvement should be regarded as an essential prerequisite and basis for building an overall societal information infrastructure, and as such a public project. This is supported by the fact that most spatial data which make the NSDI frame are public spatial data. Here the important task is to define a business model that will ensure a long-term financing and a sustainable NSDI. Most of the existing 1st generation NSDIs worldwide rely largely on a combination of financing from the state budget. In most cases these financing models were planned for one-time use with no future vision. The first generation NSDI in Croatia also relied exclusively on the state budget. Since the NSDI is currently in a transition phase from the 1st to 2nd generation, this requires the right structuring of financing mechanisms and a much bigger participation of the private sector. This is not possible without an efficient business model, which is the main task of the working group for its building. The existing model which served as the basis for NSDI has to be expanded through bigger engagement of the private sector. The future business model will have to describe an information and communication

International Conference SDI 2010 – Skopje; 15-17.09.2010
27
platform, products, business processes, legal aspects, pricing, marketing, support of new businesses and business networks. It will also define concepts and rules for business processes within the NSDI and the participating companies. Creating a pricing policy as part of the business model is also a very important factor in the NSDI improvement. The issue of data price and fees for usage is debatable, but the main NSDI principle should be "as cheap as possible". In line with that there should be a combination of: open access and cost recovery, use of spatial data and services for non-commercial purposes free of charge or with minimum costs of dissemination and maintenance, and charging for commercial purposes.
5. REFERENCES
Bačić, Ž., Rašić, Lj., Landek, I., Malnar, N., 2008. Building Croatian Spatial Data Infrastructure
in Line with the European Standards. Proceedings of ISPRS Commission IV Congress, Beijing, China.
Bačić, Ž., Rašić, Lj., 2009. Croatian SDI: A Tool for Accelerated Development of the Geo-conscious Society, Proceedings of FIG Working week, May 3-8, Eliat, Israel.
Centre for International Economics, 2000. Scoping the business case for SDI development. The Study prepared for GSDI Steering Committe. Canberra & Sydney, Australia.
Cetl, V., Roić, M., Matijević, H., 2002. Internet and Spatial Data Infrastructure - Towards a Spatial Society. Proceedings of 4th CARNet Users Conference - CUC2002, CARNet, Zagreb, Croatia.
Cetl, V., 2007. Analysis of improvement of Spatial Data Infrastructure. PhD thesis, Faculty of geodesy, University of Zagreb, Croatia.
Cetl, V., Roić, M, Mastelić Ivić, S. 2008a. Cost-Benefit Analysis of the Improvement of Spatial Data Infrastructure – Case Study Croatia, Geodetski vestnik, br. 3.
Cetl, V., Roić, M., Rončević, A., 2008b. Društveni i ekonomski aspekti nacionalne infrastrukture prostornih podataka, Društvena istraživanja, br. 3, str. 483.-504.
Cetl, V., Roić, M. Mastelić Ivić, S., 2009a. Creation of an NSDI strategy – Case Study Croatia, International Journal of Spatial Data Infrastructures Research, Vol 4, pp. 96-110.
Cetl, V., Bačić, Ž., Rašić, Lj., 2009b. NSDI Framework in Croatia. GIM International, Vol. 23, Number 12, pp. 18-21.
Chan, T., O., Feeney, M., Rajabifard, A., Williamson, I., P., 2001. The dynamic nature of spatial data infrastructures: a method of descriptive classification. Geomatica, vol 1, pp. 65-72.
Donker, F., W., 2009. Public Sector Geo Web Services: Which Business Model Will Pay for a Free Lunch. Spatial Data Infrastructure Convergence: Building SDI Bridges to address Global Changes, Proceedings of 11th Global Spatial Data Infrastructure Conference, Rotterdam, The Netherlands.
Giff, G., Coleman, D., 2002. Funding Models for SDI implementation: from Local to Global. Proceedings of GSDI 6 Conference. Budapest, Hungary.
Janssen, K., Dumortier, J., Crompovets, J., 2009. Charging for public sector spatial data: a balancing act on a rope of purpose? Spatial Data Infrastructure Convergence: Building SDI Bridges to address Global Changes, Proceedings of 11th Global Spatial Data Infrastructure Conference, Rotterdam, The Netherlands.
Longhorn, R., Blakemore, M., 2009. Geographic Information: Value, Pricing, Production and Consumption. CRC Press/Taylor & Francis Group.
Masser, I., 2005. GIS Worlds: Creating spatial data infrastructures. Redlands, CA: ESRI Press. Official Gazette 2007. Law on State Survey and the Real Estate Cadastre, 16. Rajabifard, A., Williamson, I., P., Holland, P., Johnstone, G., 2000. From Local to Global SDI
Initiatives: a pyramid to building blocks. Proceedings of 4th Global Spatial Data Infrastructure Conference, Cape Town, South Africa

International Conference SDI 2010 – Skopje; 15-17.09.2010
28
Ryttersgard, J., 2001. Spatial Data Infrastructure – Developing trends and Challenges. International Conference on Spatial Information for Sustainable Development, Nairobi, Kenya.
Ryttersgard, J., Ives, J., C., 2001. FIG Views of GIS and NSDI. Sustainable Development. GSDI for Improved Decision-Making. Proceedings of 5th Global Spatial Data Infrastructure Conference, Cartagena, Colombia.
Wagner, R., M., 2005. Need for a Framework SDI Business Model. Joint EuroSDR/EuroGeographics Workshop, BKG Frankfurt, Germany, 23-25 February.
Wishart, K. 2009. Building a business case for an SDI. Spatial Data Infrastructure Convergence: Building SDI Bridges to address Global Changes, Proceedings of 11th Global Spatial Data Infrastructure Conference, Rotterdam, The Netherlands.
6. BIOGRAPHICAL NOTES OF THE AUTHORS
Vlado Cetl is an assistant professor on Spatial Information Management/Cadastre at the Faculty of Geodesy in Zagreb. The main fields of his research work are geoinformation, spatial data infrastructures, real estate cadastre and land management. He completed a PhD in 2007 with the thesis “Analysis of improvement of the spatial data infrastructure” at the University of Zagreb. He leads and participates actively in numerous GIS and SDI projects at international and national level and has published several professional and scientific papers. Currently he
is a leader of working group for business model in Croatia NSDI, and a member of working group for NSDI technical standards. He is also president of technical committee TO211 in Croatian Standards Institute.
Ivan Landek was born on April 6, 1958 in Slavonski Brod where he completed his primary and secondary school education. At the Faculty of Geodesy of the University of Zagreb he graduated in 1984 and after that he worked in the companies of Hidroelektra and Geozavod in Zagreb. In the 1986 – 1989 period he worked as an assistant at the University of Zagreb Faculty of Geodesy. Since 1996 he has been employed at the State Geodetic Administration of the Republic of Croatia where he first worked as a Deputy Head of the Department for
Photogrammetry, Remote Sensing and Topography, then as a Head of the same Department, and since 2000 he has been Assistant Director-General at the Sector for Topographic Survey and State Maps. Furthermore, between 1997 and 1999 he performed works of the Head of the Commission for Environmental Protection and Physical Planning at the Scientific Council for Remote Sensing and Photointerpretation at the Croatian Academy of Arts and Sciences, and now he is member of Editorial Board. In 2001, he was elected member of Administrative Council of the Croatian Geodetic Institute (CGI) and since 2005 he has been President of this Administrative Council. Since 2007 he has been a representative of the Republic of Croatia at the European Spatial Data Research (Euro SDR), and since 2008 he has been vice-president of the Croatian Cartographic Society (CCS) for the official cartography. He is a member of Croatian Geodetic Society. He is author or co-author of a large number of scientific and professional papers.

International Conference SDI 2010 – Skopje; 15-17.09.2010
29
Ante Rončević is employed by HRT (Croatian Radiotelevision) in Zagreb as Adviser of General Director. He is a PhD candidate at the Faculty of Economics and Business at The University of Zagreb. He is a external associate at the Faculty of Economics and Business and the Faculty of Geodesy. Main field of his research work are corporation economics, financial market and coordination of macro economical policy. He participates actively in several projects at international and national level and has published more than 40 professional and scientific
papers.

International Conference SDI 2010 – Skopje; 15-17.09.2010
30
NSDI IN THE CONTEXT OF INSPIRE – SLOVENIA’S STATE
OF THE ART AND PRIVATE SECTOR CHALLENGES
Božena LIPEJ 1, Darija MODRIJAN
2
ABSTRACT
In Slovenia, just recently, Act on Spatial Data Infrastructure was adopted. It defines general rules
for establishing infrastructure for spatial information in the Republic of Slovenia, according to the
Directive of the European Parliament and the Council, INSPIRE.
Infrastructure for spatial information consist of metadata, spatial data sets and spatial data
services, network services and technologies, agreements on sharing access and use, and
coordination and monitoring mechanisms, processes and procedures, established, operated or
made available for the purpose of the law eg. Directive.
The Surveying and Mapping Authority of the Republic of Slovenia was nominated as a national
contact point for INSPIRE. The Government will nominate an inter-sectoral commission for
infrastructure for spatial information that will coordinate all work in the respective field. The
formal process has started. In practice, many data users and data providers operate in line with the
main INSPIRE principles. But, it is always a question of coordination, management, data quality,
data actuality, responsibilities, financial issues and a general aim to move the issues forward.
Member States reports that will be prepared for the Commission by 15 May 2010 will show state
of the art of activities in the implementation of the directive.
In the framework of the NSDI and INSPIRE directive the role of the private sector is not
explicitly defined. It is the fact that private sector companies are data providers on one side and
data users on the other side. As such, companies are aware of data value and are an indispensable
partner in the establishment, maintenance, development and innovation of spatial data
infrastructure. It is their challenge and an external, society expectation. The private sector needs
to enter into public-private partnership arrangements and to explore the models of partnership
cooperation.
There need to be more interactions between EuroGeographics, national mapping and cadastral
authorities, private sector and NGO’s and other relevant associations, not only in the South East
Europe, but at a larger, European scale. Best practices from different countries should be used for
supporting better development of NSDIs.
Key word: INSPPIRE, NSDI, Public Private Partnership, Slovenia, spatial data infrastructure
1 Ass.Prof.Dr. Božena LIPEJ, [email protected]
Geodetski zavod Slovenije d.d., www.gzs-dd.si
Tel.: +386 1 6002-800, Fax: +386 1 6002-891.
Brodišče 30, 1236 Trzin, Slovenia. 2 Darija MODRIJAN, [email protected]
Geodetski zavod Slovenije d.d., www.gzs-dd.si
Tel.: +386 1 6002-886, Gsm.: +386 40 842-027, Fax: +386 1 6002-891.
Brodišče 30, 1236 Trzin, Slovenia.

International Conference SDI 2010 – Skopje; 15-17.09.2010
31
1. INTRODUCTION
Europe and its members are increasingly facing challenges which demand radical
changes in the economic and environmental fields. A small contribution to
harmonization of efforts in the environmental field is also the adoption of the INSPIRE
Directive, one of the results of which should be the establishment of NSDIs in the
Member States. Public administration, academia, NGOs and personal initiative are
facing challenges to respond to the changing and challenging market needs. Private
sector has potentials that have to be materialized. Public private partnerships (PPP) have
to be strengthened and PPP arrangements need to go beyond traditional contracts. There
needs to be some sharing of risks, benefits and rewards, designed to create a collaborate
effort to drive forward real advances in public services. Directive-oriented
implementation has not yet begun in Slovenia; however the development in this
direction has been planned, developed and monitored for several years.
2. IMPLEMENTATION OF INSPIRE DIRECTIVE
INSPIRE directive provides general rules needed for the establishment of the
infrastructure for spatial information in the European Community, for the purposes of
Community environmental policies and policies or activities which may have an impact
on environment (EUR-LEX,2010). In Slovenia the transposition phase is in process
with adoption of a new law in February 2010, where The Surveying and Mapping
Authority of the Republic of Slovenia (SMCA) have a leading role.
SMCA has been active during the time that INSPIRE directive has been developed,
coordinated and finally adopted. Therefore SMCA already manages majority of data
types listed in annexes to the Directive INSPIRE. Metadata services and data viewers
are already available to users through web portal ‘prostor’. For the users good access to
data and services related to spatial data and their use are assured. Search services for
most of the spatial data are available to users without unnecessary administrative
obstacles (Petek, T., 2008).
Slovenia is now facing a responsibility for establishing Slovenian spatial data
infrastructure (SDI) and mechanisms for coordination of all stakeholders. It is necessary
to define legal and technical details of spatial data interoperability, review data access
rules for spatial data, which are managed by public authorities in Slovenia and
harmonize pricing policy rules.
2.1. LEGAL ASPECTS
Act on Spatial Data Infrastructure was adopted in February 2010 (Zakon o infrastrukturi
za prostorske informacije - Ur. L. RS 8/2010). It provides the legal framework for the
establishment and operation of spatial data infrastructure in the Republic of Slovenia as
part of the European infrastructure. Under that law, the Slovenian law transmit
INSPIRE directive establishing an Infrastructure for Spatial Information in the
European Union.

International Conference SDI 2010 – Skopje; 15-17.09.2010
32
The new act includes all the measures needed to ensure consistent spatial data and the
completeness of the database entries for interoperability of spatial data from different
databases and connectivity infrastructure for search, access and use of spatial data. It
defines all the involved parties, their tasks and obligations to establish the needed
components of SDI that will be in line with INSPIRE directive and also with Slovenian
needs and tradition.
Consistent with the INSPIRE directive new act defines a list of spatial data and
classification of data, establishment and management of geo-portal, content of metadata,
interoperability of spatial data and services associated with them, network services,
limiting of public access (according with the law on public information - access to
information on emissions into the environment is not restricted), charging for network
services (free access - viewing of data, data transformation services can be charged by
price published in the Catalogue of public information) and sharing data and services.
Act establishes a so-called national point of contact, which is responsible for contacts
with the European Commission regarding the INSPIRE directive and for the effective
implementation of an infrastructure for spatial information. This task is the
responsibility of the SMCA as a body within the Ministry of Environment and Spatial
Planning.
In the new act main tasks of national point of contact are defined. These tasks are the
following:
– Keep and maintain a list of spatial data
– Keep detailed descriptions of the spatial data
– Manage the geo-portal for spatial information
– Keep and maintain an information system for the metadata
– Take care to ensure interoperability of spatial data and services in connection
therewith
– Prepare proposals for the operational programs of the Government
– Ensure implementation of the implementing rules of the INSPIRE Directive in
the Republic of Slovenia
– Developing and to complementing strategy for SDI
– Developing a program of actions and measures necessary to meet the
requirements for establishing of SDI
– Preparing a report on the provision of infrastructure for spatial information for
the European Commission
In addition to Act on Spatial Data Infrastructure many other regulations are governing
the implementation of ISPIRE directive. Most important are the following:
– Access to public sector information Act (PSI directive)
– Act of electronic commerce and electronic signature
– Electronically commerce in public sector sub law
– Copy right Act
– Spatial planning Act
– Geodetically Legislation
– Environmental protection law
International Conference SDI 2010 – Skopje; 15-17.09.2010
33
2.2. ORGANIZATIONAL ASPECTS
With the main tasks of national point of contact or SMCA, the organizational aspect of
implementation INSPIRE directive is well defined. The SMCA is responsible for the
basic data on physical space and real estate in the finalized databases and provides
services pertaining to the registration of changes in physical space and on real estate
properties, performs the role of a coordinator in the field of the real estate system and
the spatial data infrastructure.
The SMCA should assure efficient maintaining of the data at each relevant authority, to
avoid duplication of spatial data, to establish guidelines, national standards, integration,
logistic and user support. To achieve these objectives cooperation and working together
with public organizations and also private sectors dealing with geodata is necessary.
In cooperation with the Ministry of Finance, SMCA introduces mass real estate
valuation with the objective of creating foundations for successful and efficient real
estate administration and provision of data for objective and comprehensive real estate
taxation as well as increased efficiency of the real estate market.
2.3. FINANCIAL ASPECTS
The SMCA made an estimation of financial costs for implementing and improving
existing SDI. The costs for Slovenia are approaching 15 mio Eur until the year 2019.
These costs include spatial data and services accommodation, creating new services,
communication infrastructure, metadata preparation and some human resources costs.
2.4 REPORT ON PROVISION OF INFRASTRUCTURE FOR SPATIAL
INFORMATION IN THE REPUBLIC OF SLOVENIA
In compliance with the Law on Infrastructure for Spatial Information, the Government
of the Republic of Slovenia will send the Report on Provision of Infrastructure for
Spatial Information to the European Commission by 15 May 2010. The first Report
prepared by SMCA as the implementer of tasks of the national contact points is at the
moment, in compliance with the law, in the interministerial proceeding and will soon be
discussed by the Government and submitted to the European Commission. The Report
presents current conditions in this field and the activities planned for the coming years.
The Government of the Republic of Slovenia has not yet appointed an interministerial
coordination group that would strategically coordinate work in this field. The Report
presents a further organizational structure which, on the operational level, envisages the
establishment of: Working group for legal regulations, Working group for
standardization and harmonization of data, Working group for metadata and data
integration and Working group for prototype solutions. It is not clear from the Report
who the members of the individual working bodies are going to be but the structure of
the interministerial coordination group that will be composed of 10 ministries is clearly
specified. It is not clear from the Report whether the structures will include the
representatives of the non-public sector but this would be more than useful in order to
provide wider level of use for this infrastructure (SMCA, 2010).

International Conference SDI 2010 – Skopje; 15-17.09.2010
34
3. PRESENT STATE OF NSDI IN SLOVENIA
INSPIRE directive is based on a number of common principles:
– Data should be collected only once and kept where it can be maintained most
effectively.
– It should be possible to combine seamless spatial information from different
sources across Europe and share it with many users and applications.
– It should be possible for information collected at one level/scale to be shared
with all levels/scales; detailed for thorough investigations, general for strategic
purposes.
– Geographic information needed for good governance at all levels should be
readily and transparently available.
– Easy to find what geographic information is available, how it can be used to
meet a particular need, and under which conditions it can be acquired and used
In order to be able to follow main principles of INSPRE directive the structure of NSDI
is defined as: ‘infrastructure for spatial information means metadata, spatial data sets
and spatial data services; network services and technologies; agreements on sharing,
access and use; and coordination and monitoring mechanisms, processes and
procedures, established, operated or made available in accordance with this Directive.’
(GSDI, 2010)
Each of these components serves as a cornerstone in establishing consistency and
structure when it comes to documenting spatial data for everyday applications, as well
as in building a distributed network of producers and users that facilitate data sharing.
3.1. EXISTING SPATIAL DATA
The main public organizations dealing with geodata in Slovenia are defined in a Report
on provision of infrastructure for spatial information in the republic of Slovenia:
– MOP - Ministry of the Environment and Spatial Planning (www.mop.gov.si)
– SMCA - The Surveying and Mapping Authority of the Republic of Slovenia
(www.gu.gov.si)
– EAS - Environmental Agency of the Republic of Slovenia (www.arso.gov.si)
– Ministry of Agriculture, Forestry and Food (www.mkgp.gov.si)
– Ministry of Transport (www.mzp.gov.si)
– Slovenian Roads Agency (www.dc.gov.si)
– Ministry of Health (www.mz.gov.si)
– Ministry of Interior (www.mnz.gov.si)
– Ministry of the Economy (www.mg.gov.si),
– Ministry of Public Administrations (www.mju.gov.si)
– Administration for civil protection and disaster relief (www.sos112.si)
– Ministry of Culture (www.mk.gov.si)
– Statistical Office of the Republic of Slovenia (http://www.surs.si/)
– SFS – Slovenia Forest Service (www.zgs.gov.si)
– Geological Survey of Slovenia (www.geo-zs.si)
– Geodetic Institute of Slovenia (www.geod-is.si)

International Conference SDI 2010 – Skopje; 15-17.09.2010
35
– Biotechnical Faculty (www.bf.uni-lj.si)
– Fisheries Research Institute of Slovenia (www.zzrs.si)
Private sector
– Commercial data service providers
The article describes the data that are accessible through the Internet and maintained for
the entire territory of Slovenia.
3.1.1. Data maintained by SMCA
The SMCA is responsible for most of data from Annex I and Annex II of the INSPIRE
directive and also for some data from Annex III. The changes that will be needed to
harmonize spatial data with INSPIRE interoperability framework depend on
implementing rules – Data Specifications, which are in preparation.
Land Cadastre links real property rights on properties administered by the Land
Register with the location in physical space. The graphic representation of parcel
boundaries is provided in digital form represented by the digital cadastral maps. They
show parcel and parcel parts boundaries, and parcel numbers. The data are referenced in
the national coordinate system. They have been created for the entire territory of
Slovenia.
The Building Cadastre is a basic record of data on buildings and parts of buildings,
which links real property rights on buildings, administered by the Land Register, with
the location in physical space. The basic units of the Building Cadastre are a building
and a part of a building. Each building has one or more parts. In the Building Cadastre a
building is recorded with its location and shape, and designated by the building number.
The building’s floor plan, the building height and the number of floors represent the
location and shape of the building. Building cadastre is created for the entire territory of
Slovenia.
Real Estate Register contains real estate data (title holder, building equipment,
different actual uses, data about building characteristics, areas etc.) This register was
established in year 2008 with purposes to amend existing data and ensure complete data
on all real estate properties in Slovenia, ensure simple recording of the actual real estate
situation and to create an open, multipurpose technical record of data on real estate. In
Slovenia Supreme Court is responsible for Land Register. The Land Registry contains
information about legal rights to real property objects, such as information about
ownership, servitudes and mortgages.
Register of Spatial Units is based on integrated database that comprises location and
attributes data on spatial units and on addresses for the whole country.
Consolidated Cadastre of Public Infrastructure administers the data on the objects of
the public infrastructure owned by the state (state roads, water infrastructure, etc.),
municipalities (water supply network, sewage system, waste dumps, etc.) and private
companies (cable networks, telecommunication devices and networks, etc.)

International Conference SDI 2010 – Skopje; 15-17.09.2010
36
Real Estate Market Register administers and updates the data on purchase and rental
transactions with land parcels, buildings and parts of buildings. The data on legal
transactions are submitted into the register by municipalities, administrative units, the
Tax Administration of the Republic of Slovenia, real estate agencies and notaries public.
Vector database of topographic data of homogeneous accuracy and details
appropriate for the 1:5000 scale is divided by objects into four areas (buildings, traffic,
land cover, hydrography). The whole territory is also covered with topographic maps:
basic (scale 1:5.000), national (scales 1:25.000 and 1:50.000), they are in analogue and
digital form.
National general maps (scales from 1:250.000 to 1: 1.000.000) are available in printed
form, digital vector form and raster form. The Generalized cartographic database was
established in the period between 1994 and 1996 with data acquisition from scans of the
national topographic maps at 1:25,000 and has been regularly updated since then. It
comprises four groups of objects: roads, waters, contour lines and railways.
Digital elevation models with grid size of 5 m, 12,5 m, 25 m and 100 m are created for
the whole country.
Orthophotos are created in black-white, color and near-infrared (NIR) technique and
are covering the whole Slovenia. Resolution (ground sample distance) is 0,5m for
black-white and color orthophotos and 1 m for NIR orthophotos.
Register of geographical names is created to meet three precision levels: for 1:5,000,
1:25,000 and 1:250,000 scales and is regularly updated. Also the names from maps at
1:25,000 and 1:250,000 scales have undergone toponomastic review.
In the field of Reference system the SMCA has started implementing the
“Establishment of a GPS stations network and implementation of the European
coordinate system in Slovenia” project that is subsided by a Norwegian financial
mechanism.
Metadata. The SMCA administers and updates metadata for all geodetic databases.
Metadata enables searching by data, providers thereof, areas of preparation; metadata
contains descriptions of data characteristics, data accuracy, the method and frequency of
database updating, etc.
Metadata system is available at http://prostor.gov.si/CEPP/index.jsp or at
http://prostor.gov.si/cepp_eng/index.jsp when needed in English.
3.1.2. Data maintained by the Environmental Agency of the Republic of Slovenia
The Environmental Agency of the Republic of Slovenia (EAS)
(http://www.arso.gov.si/) is a body of the Ministry of the Environment and Spatial
Planning. Its mission is to monitor, analyze and forecast natural phenomena and
processes in the environment, and to reduce natural threats to people and property. One
of its tasks is to ensure high-quality environmental data for all target groups.

International Conference SDI 2010 – Skopje; 15-17.09.2010
37
ATLAS OF SLOVENIA. Free access to the data maintained by EAS is available
through the portal Environmental Atlas of Slovenia (http://gis.arso.gov.si/atlasokolja).
Available data are covering the whole territory of Slovenia and are the following:
Monitoring points – national network of seismic stations, data on water quality, air
quality stations, meteorological stations.
Environment – landfill of municipal waste, sensitive areas for eutrification, sensitive
areas of bathing water with catchment areas, agglomerations.
Air quality – air quality evaluation zones, PM10 air quality areas, air pollution with
SO2 and air quality zones for SO2.
Climate - air temperature, precipitation, snow cover, bright sunshine duration, wind
speed.
Water - water permit, fish water segment, surface water bodies (lines and areas),
categorization of watercourses regulation, water protection areas (divided into a
national, municipal and commercial level), bathing water with catchment areas,
groundwater bodies, hydrographic areas, river basins and flood waters.
Nature – valuable natural features, valuable natural features (Caves), ecologically
important areas (Caves), national protected areas (points and areas), local protected
areas (points and areas), areas appropriate for shellfish, living territory of a bear, Natura
2000, SPA extras, valuable natural features, ecologically important areas, zonation
(protected areas), regional ZRSVN units.
Land and soil – research of soil pollution in Slovenia, Land slide probability (source:
Geological Survey of Slovenia).
Earthquakes – earthquake catalogue, map of seismological risk.
For the background and for easier orientation some SMCA’s layers are added:
– Infrastructure – state roads, EMF sources
– Spatial Units – national border, administrative units
– General maps
Metadata by standard ISO 19115 are available for all data maintained by EAS.
Beside the Atlas of Slovenia EAS maintains also EIONET-SI, an information and
communication network. It supports collection and dissemination of environmental
data. It is a part of EIONET network established by European Environment Agency
(EEA). EIONET (Environmental Information and Observation Network) consists of the
EEA itself, a number of European Topic Centers and a network of around 900 experts
from 37 countries in over 300 national environment agencies and other bodies dealing
with environmental information.
3.1.3. Data maintained by Statistical Office of the Republic of Slovenia

International Conference SDI 2010 – Skopje; 15-17.09.2010
38
Statistical Office of the Republic of Slovenia is the main producer and coordinator of
carrying out programs of statistical surveys. In addition to linking and coordinating the
statistical system, it’s most important tasks include international co-operation,
determining methodological and classification standards, anticipating users' needs,
collection, processing and dissemination of data, and taking care of data confidentiality.
In the scheme of organization of the Government of the Republic of Slovenia, the
Statistical Office – which participates in budget discussions as an independent
governmental institution – is directly responsible to the Prime Minister.
INTERACTIVE STATISTICAL ATLAS OF SLOVENIA (http://www.stat.si/)
shows data for selected statistical indicators on interactive maps of Slovenian statistical
regions and municipalities, mostly in longer time series. In the tool a user can select
indicators, territorial levels (statistical regions or municipalities) and available years.
Atlas is based on data from SI-STAT data portal (http://www.stat.si/). Data are
divided by fields of statistics. Within individual fields of statistics, links to all published
statistical data are available by subject areas.
Data in SI-STAT portal are:
– Tables in PC-Axis format to allow direct inspection through a Web interface, a
selection of categories to see, save in different formats and subscribe to
notifications about new publications (information only for registered users).
Links to other information published on the website of the Statistical Office
(available publications data (XLS format).
– Links to the data available at the Bank of statistics.
– Links to websites of accredited program of statistical surveys, which are
published statistics for the areas covered by approved contractors.
– Links to European statistics collected by Eurostat from national statistical
offices of the Member States of the European Union and candidate countries
Fields of statistical data are:
Demography and social statistics – population, labor market, level of living,
education, culture and sport, health, social protection, crime.
Economy – national accounts, prices, business entities, mining and manufacturing,
distributive trade and other service activities, tourism, transport, information society,
research and development, science and technology, external trade, business tendency.
Environmental and natural resources – territory and climate, agriculture and fishing,
forestry and hunting, energy, environment.
General – general, administrative and territorial structure, elections, indicators.
3.1.4. Data maintained by Ministry of Agriculture, Forestry and Food

International Conference SDI 2010 – Skopje; 15-17.09.2010
39
Spatial data maintained by Ministry of Agriculture, Forestry and Food are available
through four different geo-portals:
eREGISTER KMETIJSKIH GOSPODARSTEV (eRKG, e-Register of Farms)
(http://rkg.gov.si/GERK/eRKG/) - allows viewing of the farmer written and graphic
information about their holding. Entering the application is possible only through digital
certificates on-line. ERKG is a web application that allows Farmers to be reviewed their
data from the register of agricultural holdings applications. The information contained
in the application registry holdings are held in administrative units and containing the
following databases in the field of agriculture:
– Register of agricultural holdings - farms
– Graphic records of land parcels of the farms
– Register of common pasture
– Records of hops
– Register of olive plantations
– Records of the orchards
– Record of extensive orchards and meadows
– Register of grape and wine producers.
Users of eRKG application are allowed to print information and extract data from the
application.
Web portal KataKoma (kataster/komasacije: Cadastre/Land consolidation)
(http://rkg.gov.si/GERK/) - application of spatial information provides an overview of
land consolidation areas, and some bases.
Bases are the data maintained by SMCA:
- Orthophotos
- Land Cadastre
- data from the Register of Spatial Units
Spatial data maintained in the Ministry of Agriculture, Forestry and Food are:
- GERK - graphical unit of farm parcel
- Land consolidation areas
Web portal KatMeSiNa (http://rkg.gov.si/GERK/) - the application provides an
overview of spatial information systems and cadastre, land reclamation facilities
(systems and devices) and some bases
Bases are the data maintained by SMCA and EAS:
- Orthophotos (SMCA)
- Land Cadastre (SMCA)
- Topographic maps in a scale 1:50 000 (SMCA)
- data from the Register of Spatial Units (SMCA)
- Protected Areas (regional park, regional park, national parks, Natura 2000,
water protected areas) (EAS)
Spatial data maintained in the Ministry of Agriculture, Forestry and Food are:
- GERK - graphical unit of farm parcel
- Land use

International Conference SDI 2010 – Skopje; 15-17.09.2010
40
- Land reclamation system (divided to all systems and partially functioning
systems)
- Irrigation systems (divided to all systems and partially functioning systems)
- Drainage systems (divided to all systems and partially functioning systems)
WEB PORTAL GERK/RABA (graphical unit of farm parcel/use)
(http://rkg.gov.si/GERK/) - provides an overview of spatial data GERK and USE, and
some bases. Bases are:
– data maintained by SMCA (orthophotos, cadastral maps, cadastral
municipalities, digital elevation models, topographic maps, data from the
Register of Spatial Units)
– data maintained by Slovenia Forest Service-SFS (forestry data)
– data maintained by Environmental Agency of the Republic of Slovenia (land
and soil, water protection areas)
Spatial data maintained in the Ministry of Agriculture, Forestry and Food are:
– Land Use - the actual use of agricultural land is in digital graphic format,
maintained on the basis of orthophoto, satellite imagery or other sources, by
type of use (arable land, hop fields, vineyards, orchards, intensive, extensive
orchards and olive plantations, permanent grassland, etc.).
– GERK - graphical unit of farm parcel means compact area of land with the
same type of actual use that is in use of one agriculture holding and only one
type of crops is growing on it.
– Renewal of vineyards (all renewal should be announced in advance)
– Areas of limited opportunities for Agricultural activity - hill and mountain
areas, specific natural limits, etc.
3.2. ACCESS TO THE DATA
Access to the data is enabled through the information systems of authorities that are
maintaining data. They comprise the production systems, which primarily obtain and
process data, and the distribution systems, which distribute spatial data either directly
into other information systems or to end users through e-services. Distribution systems
were established on the user demands for up-to-date, high quality, standardized and
quickly accessible geodata. The distribution systems enable a quick and secure access to
interoperable data from various spatial databases.
As the SMCA is responsible for most of data of the INSPIRE directive access to its data
is described in more detail. All data described in the article are accessible in a manner
and under conditions similar to those described.
Access to geodetic data is enabled to numerous groups of users, both in terms of
certificates, maps, plottings, extracts, online browsers, online data distribution, as well
as providing certificates and information at customer service windows in all SMA
locations. The infrastructure or web services was developed in line with the OGC
recommendations and ISO standards and this enabled the development of new services
for users and provides the standardized access to data (Ažman, I., Petek, T., 2009).

International Conference SDI 2010 – Skopje; 15-17.09.2010
41
Electronic access to the data is available through a computer-supported distribution
system that is based at the Ministry of Public Administration (MPA) as part of the
national information system. Practically all the databases are included in the distribution
environment: the Land Cadastre, the Building Cadastre, the Register of Spatial Units
with Addresses, the Register of Geographical Names, geodetic points, the Real Estate
Market Record, the Consolidated Cadastre of Public Infrastructure as well as the vector
and raster topographic data. Their regular daily updating is provided.
The distribution system is separated from the production data, and as such it is as
independent as possible of the systems and changes in the production, which is of the
organization of data suppliers and changes in the manner of administration to data
updating. Through the creation and use of special interfaces, online services and user
applications, it enables a simple, secure, and correct use of geodetic data.
Electronically access to the geodetic data is enabled for its users in two ways: access to
data and distribution of data (data transfer to the user’s system). Free access to
cartographic data is available via portal PROSTOR (means space) to all users, allowing
them to search for a location and to display this location on the selected cartographic
basis (orthophoto, a basic topographic map, national topographic maps, etc.) free of
charge. Another public access is access to the latest registered data in the Land
Cadastre, the Building Cadastre, the Register of Spatial Units, the Consolidated
Cadastre of Public Infrastructure and real estate transactions on the basis of a real estate
identifier (land parcel number, a building or part of a building number or an address).
The service is free of charge and available for registered users at http://prostor.gov.si. In
accordance with the legislation it is also possible to obtain data on the owner of real
estate (land parcel or a building) on the basis of providing a real estate identifier. This
service of access for registered users is intended primarily for users in public
administration (national and local level), commercial users (real estate agents, lawyers,
insurance agencies, banks, etc.) and land survey service providers.
The distribution of geodetic data is intended for the so-called registered users. Special
online services, which enable a secure and controlled access, enable data transfer from
the distribution system to the user’s system. Online services enable access to digital data
in line with standards and recommendations pertaining to the field of geographical
information systems and online services, whereat taking into consideration the standards
of SIST (the Slovenian Institute for Standardization), CEN (the European Committee
for Standardization), and ISO (International Organization for Standardization) as well as
the recommendations made by OGC and W3C (World Wide Web Consortium) (Ažman,
I., Petek, T., 2009).
The basic web services are developed for the Land Cadastre, the Building Cadastre, and
the Register of Spatial Units with House Numbers, the Consolidated Cadastre of Public
Infrastructure, and the Real Estate Market Register. Simultaneously with the
development of web services also the basic interoperability framework based on the
XML and GML data exchange format are defined.

International Conference SDI 2010 – Skopje; 15-17.09.2010
42
3.3. PURPOSES AND RIGHTS TO ACCESS AND USE THE DATA
Purposes and rights to access to the data are described in more details for the SMCA’s
data, since they are defined in strict compliance with the INSPIRE directive and the
Slovenian Act on Spatial Data Infrastructure. Access to other data described in this
article is free, or allowed to a certificated users.
The purposes of using geodetic data are:
- viewing geodetic data,
- use of geodetic data for public or private purpose,
- re-use of geodetic data.
Viewing geodetic data The public access link on the http://prostor.gov.si portal allows
the users to use the free browser of the Land Cadastre, the Building Cadastre and the
Register of Spatial Units data. The real property identifier allows browsing attribute and
graphic data registered in the Land Cadastre, the Building Cadastre and the Register of
Spatial Units. This kind of use is free for all users with Internet access.
Use of geodetic data for public or private purpose The use of geodetic data
constitutes the use of data for their initial purpose for which the data were produced.
The use of geodetic data for public or private purpose is access to data by public bodies
(data sharing) and access to data by the owners of real properties. The data are free, only
material costs can be charged.
Re-use of geodetic data is every use of data by natural or legal person for all purposes
except viewing data and using data for the original purpose for which the data were
produced. The re-use of geodetic data can be in three different ways:
- Ungainful re-use of geodetic data where the clients requesting data are natural
persons - individuals, societies, nongovernmental organizations and other legal
persons not involved in a gainful activity and which state that they are
obtaining data which they will use for own purposes and not for re-selling data
or selling products or services in which the data were used. The data are free,
only material costs can be charged.
- Unchangeable gainful re-use of geodetic data. The re-use of data for a gainful
purpose with the purpose of spreading information, ensuring freedom of
expression, culture and art as well as the use of information by media. Only
material costs are charged.
- Chargeable re-use of geodetic data for a gainful purpose is the use of data by
natural or legal persons for a chargeable gainful purpose except for the purpose
of spreading information, ensuring the freedom of expression, culture and art
as well as the use of information by the media. The clients requesting data are
natural and legal persons who state that they are obtaining data for re-use for a
gainful purpose. Users must pay for the data and for the material costs too
(Ažman, I., Petek, T., 2009).

International Conference SDI 2010 – Skopje; 15-17.09.2010
43
4. ROLE OF THE PRIVATE SECTOR
NSDI implementation cannot be completed in a single phase. A so called layered
approach needs to be adopted as ongoing work. Three layers - provision, content and
governance - argue for local participation and the bottom-up approach, which are indeed
important ingredients of SDI. The carriage and devices layers are fundamental for data
exchange and communication, or as SDI Africa argues: "Partnerships and
communication are the heart of SDI." (SDI Africa, 2010)
The fact is that NSDI can just not be implemented by government alone because a lot of
enterprise/development activities are also done outside government domain. Private
enterprise has to play a vital and complementary role - be it in solutions, be it in joint-
venture initiatives with data-owners or in working the way ahead to deliver. Academic
also have to provide advanced research of powerful spatial search engines, spatial data
mining tools, modeling tools and many other research inputs (Rukund, M., 2007).
There is no common understanding of precisely what the term public private partnership
(PPP) means. The concept of PPP cannot be standardized internationally since PPP
initiatives must meet the policy objectives of individual governments, complement other
public procurement approaches and service delivery methods and must be implemented
in light of the available resources.
However PPP is, as defined by the UNECE (UNECE PPP, 2005), 'A partnership
between a public organization and a private company which takes the form of a medium
to long term relationship in which the partners have agreed to work closely together to
deliver improvements to services in the interest of the public. There will be agreed
arrangements for the sharing of risks, benefits and rewards and the utilization of multi-
sector skills, expertise and finance. Such partnerships are usually encouraged and
supported by government policy’.
PPP is not privatization; main difference is in a level of public control and oversight. It
is not revolutionary, this approach is known mainly in the fields, like: transportation,
water/wastewater, urban development, energy, financial management, schools (Asmat,
A., 2008).
4.1. MAIN FACTS ON PPP
It is a general trend in Europe and worldwide that the private sector has increasingly
been invited to take part in different activities in the field of geodesy, mapping,
cadastre, land registry, land consolidation and land management. The aim has been to
bring together the experience and skills of different partners in a way that guarantees the
maximum benefit with the best practical and financial outcomes. Governments
progressively turn to the private sector for additional resources as well as to capitalize
on the private sector’s efficiency, capacity and innovation. The extent of private-sector
involvement needs to be carefully considered against each country's individual
circumstances in order to find a reasonable and harmonized balance (Lipej, B., 2008)
It is argued that a PPP is a social partnership, as it includes not only the public sector
but also organizations that are outside official boundaries, such as private sector,

International Conference SDI 2010 – Skopje; 15-17.09.2010
44
academia and research institutes as well as non governmental organizations. These
groups are all key stakeholders of NSDI. Therefore, this approach brings more
stakeholders of NSDI on a unified platform as compared with other approaches.
4.1.1. Main strengths of partners
Private Sector Strengths are based mainly on the results of Market Competition and are
the following:
- Management Efficiency
- Newer Technologies
- Workplace Efficiencies
- Cash Flow Management
- Personnel Development
- Shared Resources (Money)
Public sector strengths are based mainly on the results of serving the Public Trust and
are:
- Legal Authority
- Protection of Procurement Policies
- Broad prospective/balance the competing goals to meet public needs
- Personnel – dedicated but constrained
- Capital resources
4.1.2. Main conditions for success of PPP
Statutory and Political Environment. A successful partnership can result only if there
is commitment from the top. Public officials must be willing to be actively involved in
supporting the concept of PPPs and taking a leadership role in the development of each
given partnership. A well-informed political leader can play a critical role in minimizing
misperceptions about the value to the public of an effectively developed partnership.
Equally important, there should be a statutory foundation for the implementation of
each partnership.
Public Sector’s Organized Structure. Once a partnership has been established, the
public-sector must remain actively involved in the project or program. On-going
monitoring of the performance of the partnership is important in assuring its success.
This monitoring should be done on a daily, weekly, monthly or quarterly basis for
different aspects of each partnership
Detailed Business Plan (Contract). Involved parties must know what to expect of the
partnership beforehand. A carefully developed plan will substantially increase the
probability of success of the partnership. This plan most often will take the form of an
extensive, detailed contract, clearly describing the responsibilities of both the public and
private partners. In addition to attempting to foresee areas of respective responsibilities,
a good plan or contract will include a clearly defined method of dispute resolution.

International Conference SDI 2010 – Skopje; 15-17.09.2010
45
Guaranteed Revenue Stream. While the private partner may provide the initial
funding for capital improvements, there must be a means of repayment of this
investment over the long term of the partnership. The income stream can be generated
by a variety and combination of sources (fees, tolls, shadow tolls, tax increment
financing, or a wide range of additional options), but must be assured for the length of
the partnership.
Stakeholder Support. More people will be affected by a partnership than just the
public officials and the private-sector partner. Affected employees, the portions of the
public receiving the service, the press, appropriate labor unions and relevant interest
groups will all have opinions, and frequently significant misconceptions about a
partnership and its value to all the public. It is important to communicate openly and
candidly with these stakeholders to minimize potential resistance to establishing a
partnership.
Careful selection of Partner. The lowest bid is not always the best choice for selecting
a partner. The best value in a partner is critical in a long-term relationship that is central
to a successful partnership. A candidate's experience in the specific area of partnerships
being considered is an important factor in identifying the right partner (NCPPP, 2010).
4.1.3. Main advantages of PPP
Main advantages of PPP are political support, financial effects and data
democratization.
Political Support
PPP brings political support as the public sector is part of this type of partnership and
the need for sustained political support is required for NSDI implementation, because
government leadership is essential to the SDI development process.
Finance
As in any developmental process, it is important to understand who the stakeholders are
what roles each can play and how much finance, time and level of expertise is available.
SDI implementation standard is that funding mechanisms must be in place if an SDI is
to be implemented in a timely and efficient manner. Therefore, PPP will bring finance
for NSDI implementation. Financial successful must be evaluated through many facts of
public-private partnership:
- Maximizing the use of each sector’s strength
- Reducing of development risk
- Reducing of public capital investment
- Mobilization of excess or underutilized assets
- Improvements on efficiencies/quicker completion
- Better environmental compliance
- Improvements of service to the community
- Improvements of cost effectiveness
- Sharing of resources
- Sharing / allocating of risks
- Mutual rewards

International Conference SDI 2010 – Skopje; 15-17.09.2010
46
Data Democratization
Data democratization can be seen and envisioned as one of the ultimate goals of NSDI.
Data sharing/exchange does not guarantee that every citizen will be able to access
data/information with or without a fee. Because PPP includes federal, state, and local
governments, NGOs, academia, research institutes and citizens as stakeholders, data
democratization would enable a democratic environment for the data user community
rather than a bureaucratic environment, which creates hurdles for data sharing,
exchange and use. Simply said, NSDI development through the PPP approach has this
added advantage. Therefore, PPP becomes the rationale not only for funding, sharing
benefits and risks but also it would further development. Democratization of access to
geospatial data thus enables value-added suppliers to create new data products and
service (Nebert, D., 2004).
4.2. SITUATION IN THE FIELD OF PPP IN SLOVENIA IN RELATION
TO NSDI
There is a perceptible trend in Slovenia to reduce public consumption. This is shown in
reducing the number of public administration employees, in public procurements and in
reducing the funds intended for maintenance and development of public infrastructure.
However, the economic crisis has affected the private sector as well. A necessity of
increased investments in development and of thoughtful investments into the future on
one side, and a fight for survival on the other, strongly paralyse the companies.
PPP may be a partial solution for both sides, as division of costs and benefits is a strong
argument to decide for a partnership. Thus it will be easier for the public administration
to comply with the requirements set by the European Union, while work and existence
will be secured for the private sector – with a preliminary financial input, of course.
The managers of various databases kept in Slovenia have established some of these
databases by themselves and they hired the private sector to implement others. It is
important to have confidence in the efficiency and quality level of implementation in
such activities, as this is a pre-condition for further works.
In Slovenia, public sector on state, regional and local level often involves private sector
in the set-up and maintenance of data and in the establishment and maintenance of
services. The trend and legislative changes are going in that direction as well. All
arrangements are made in accordance with the public procurement legislation. In that
respect, many of INSPIRE data themes were set-up with the involvement of the private
sector, like: geodetic and geographic reference systems, geographical names,
administrative units, addresses, cadastral parcels, transport network, buildings,
hydrography, elevation, orthophoto etc. Private sector is involved in setting-up and
maintenance of metadata systems, data view, search and transfer services, web based
services, web feature services, different portals. Public sector on his own has developed
a few solutions for viewing data for the general public and for local authorities
(Geopedia, Bioportal, PISO, iObčina).
In all these interactions, or at least in most described activities, there is no agreement on
sharing of risks, benefits and rewards what is a value added component in the
partnership (UNECE, 2005). There is a great desire to find a key for a real PPP in the

International Conference SDI 2010 – Skopje; 15-17.09.2010
47
field of spatial and real estate data management, but a model is very hard to define and
implement. The size of a country and it’s population is one of the barriers that makes
finding a workable solution even more difficult. The most reliable approach is under
preparation in the municipality of Ljubljana for the arrangement of real estate records
where it is interesting to mention that all payments for services provided will be
executed after the real estate assets of municipality are going to be sold.
A lot of contents, leading solutions and strategies in the field of NSDI in Slovenia still
need to be discussed and implemented, which means that a more organized approach to
PPP is necessary in order to satisfy the needs of the European and Slovenian users
within an appropriate time period and with the limited financial and staff capacities.
5. CONCLUSIONS
For the effective NSDI implementation there is a need to work more efficiently,
effectively and economically and in doing so offer customer-oriented services. More
cooperation is necessary, private private, public public and public private. The directive
requirements are based on the interdisciplinary and integrating approach. Public and
private sectors should operate according to the complementing and synergy principles
which would result in high-quality foundation for PPP provision. There are respected
European organizations, like EuroGeographics (European Association of National
Mapping, Cadastral and land Registry Agencies) that has to take the lead role in
facilitating the process and in supporting the countries for transferring best INSPIRE
practices among them. Under development there are regional initiatives, like the one for
the Western Balkan, Inspiration, which deals with the SDI implementation. In Slovenia
a lot has already been done, but the activities should continue in more organized way. It
would be advisable to include in the coordination INSPIRE structures appointed by the
Government of the Republic of Slovenia the representatives of the users and
stakeholders’ societies. This is the way to balance the theoretical and practical forms of
implementation of the directive in Slovenia and any other country.
5. REFERENCES Asmat, A., 2008. NSDI Implementation Strategies. Directions Magazine Web site,
http://www.directionsmag.com
Ažman, I., Petek, T., 2009. Spatial Data Infrastructure at the Surveying and Mapping Authority in
Slovenia. 3rd INSPIRE conference. Netherlands
EAS, 2010. Environmental Agency of the Republic of Slovenia Web site, http://www.arso.gov.si/
EUR-LEX, 2010. Access to European Union law Web site, http://www.eur-lex.europa.eu
GSDI, 2010. Global Spatial Data Infrastructure, Web site, http://www.gsdi.org
Lipej, B., 2008, Future challenges for surveyors in developing European and national societies –
national mapping and cadastral agencies’ point of view, Congress of the European surveyors,
Strasbourg
MKGP, 2010. Ministry for Agriculture, Forestry and Food Web site, http://rkg.gov.si
NCPPP, 2010. National council for public-private partnerships Web site, http://www.ncppp.org
Nebert, D., 2004, The SDI Cookbook, GSDI Newsletter, Number 1, Vol. 2
Petek, T., 2008. Geodesy and INSPIRE directive. Geodetski vestnik. Number 4, Vol. 52
Rukund, M., 2007. NSDI – Then, now and whenever. Coordinates Magazine. Vol. 3, Issue VIII.
SDI Africa, 2010. Implementation guide, Web site, http://geoinfo.uneca.org/sdiafrica

International Conference SDI 2010 – Skopje; 15-17.09.2010
48
SMCA, 2010. Report on Provision of Infrastructure for Spatial Information. Surveying and
Mapping Authority in Slovenia Web site, http://www.gov.si/gu
SMCA, 2010. Surveying and Mapping Authority in Slovenia Web site, http://www.gov.si/gu
SORS, 2010. Statistical Office of the Republic of Slovenia Web site, http://www.surs.si/
UNECE, 2005. Working Party on Land Administration, Guiding principles for Public private
partnership (PPP) in land administration,
http://www.unece.org/hlm/documents/2005/hbp/wp.7/HBP-WP.7-2005-8-e.pdf
UNECE, 2005. Working Party on Land Administration, Principles for the use of Public private
partnership within land administration in the ECE member countries,
http://www.unece.org/hlm/wpla/
6. BIOGRAPHICAL NOTES OF THE AUTHORS
Bozena Lipej, Ph.D., Ass.Prof., has been the General Manager of Geodetski
zavod Slovenije d.d. from 2008. Before that she was the Deputy Director
General at the Surveying and mapping authority of the Republic of Slovenia
for several years. She has managed several activities and projects in the field
of cartography, real estate and geodesy. In the period 2000-2005 she was an
Executive director and project manager of the Real estate registration
modernization project in Slovenia that was the biggest interdisciplinary real
estate project nationwide, with partners from four ministries, the Supreme Court, the World Bank
and the European Union. She chaired the UNECE Working party on land administration and was
the working party bureau member in the period 2001-2005. From 2005 to 2008 she was chairing
the EuroGeographics' Cadastre and land registry group. She gives lectures on real estate recording
and management at one of the Slovenian private faculties for three years and she was nominated
as Ass. prof in May 2010. She is the co-author of the actual European real estate statements and
documents and the author of more than 150 professional articles. Her key qualification is in
management and project management. Her technical skills and competences are in real estate
management, cartography, GIS, data management – for more information see: COBISS (Co-
operative Online Bibliographic System & Services):
http://splet02.izum.si/cobiss/BibPersonal.jsp?lang=eng&init=t.
Darija Modrijan graduated at the University of Ljubljana, Faculty of Civil Engineering and
Geodesy with the thesis: Use of Agricultural land - capture of spatial data and monitoring
information on changes.
Since 2002 has been employed at Geodetski zavod Slovenije d.d., currently she is the head of the
Department of Photogrammetry. She is a member of Slovenian Chamber of Engineers and of the
Slovenian Association of Surveyors. She participated in several international projects and in the
World Bank projects in the fields of geodesy in which Geodetski zavod Slovenije d.d. was
performing works. As a co-worker of the Urban Planning Institute of the republic of Slovenia she
was strongly involved in a project ONIX (ONline Information Exchange) – World Bank project.
For a fix term she worked also for a Slovenian Academy of Sciences and Arts.

International Conference SDI 2010 – Skopje; 15-17.09.2010
49
THE ROLE OF THE AGENCY FOR REAL ESTATE CADASTRE
IN THE ESTABLISHMENT OF THE NATIONAL SPATIAL
DATA INFRASTRUCTURE
Sonja DIMOVA1
ABSTRACT
The geo-spatial data are an important element in making significant decisions on global
and local level. The dynamic progress of the computer technology in the past several decades has
enabled for the data to be easily accessed all over the world. The improved software solutions, the
performances of the data storage media, geo-portals as well as the lower hardware costs
contribute immensely to the improved data accessibility.
However, the number of geo-spatial data which in Agency for real estate cadastre-
AREC exist in written/drawn paper form is not small and this data form is a huge limitation.
Having this in mind, there is a great need of their migration into digital form, which as an integral
part of the National Spatial Data Infrastructure-NSDI will enable management of the geo-spatial
data, performance of analysis and making the right decisions in a manner previously impossible.
The creation of the NSDI is directly dependable from the digital geo-spatial data from
AREC. These data are called basic data and they are mainly used as base or template on to which
other thematic spatial data sets are added, creating new cartographic forms and contents, used to
process all further activities in the community.
Key word: geo-spatial data, NSDI, geo-portals, thematic spatial data.
1. INTRODUCTION
The collection of geospatial data in each country requires a great deal of
financial resources. These resources are significantly multiplied considering the fact that
many organizations, institutions and individuals collect the same geospatial data. For
example, the state bodies, the telecommunication companies, electricity distribution
companies, heating companies and the local self government units are just part of the
institutions which invest big amounts of resources for the purpose of collecting and
processing spatial data, each of them in their own way and manner and in a different
application. This manner of collecting the data produces additional problems during the
use of the data due to the fact that most often the conversion of the data from one into
another application is not simple at all, especially while saving the attributes of the data.
The difficult technical conversion of the data is additionally burdened by the fact that
1 Eng. Sonja DIMOVA, [email protected]; [email protected]
Agency for Real Estate Cadastre, www.katastar.gov.mk
Tel.: +389 2 3175-987 ext.109, Gsm.: +389 75 364-723, Fax: +389 2 3171-945 ext.103.
Str. Trifun Hadzijanev, 4, 1000 Skopje, Macedonia.

International Conference SDI 2010 – Skopje; 15-17.09.2010
50
certain institutions, due to legal or personal reasons, are not very fond of sharing or
distributing the data they own with other institutions.
The way out from such situation is possible via establishment of National Spatial
Data Infrastructure (NSDI) as a summary of measures, norms, specifications and
services which have the objective to enable quality collection, share and use of the geo-
reference spatial data within the e-government. The up-to-date and accurate geospatial
data as part of the NSDI will be easily accessible and will provide local, national and
global economic development, better environment, stability and social progress through:
� Decrease of the double expenditures of the institutions while collecting the
geospatial data i.e. financial savings;
� Increase of the efficiency and effectiveness in the use of geospatial data
through streamlining the access to the data;
� Improvement of the quality of the geo-spatial information through
implementation of standards;
� Building partnership relations on national and local level, including the
private sector;
� Increase of the benefit from the data use;
� Upgrade of the data for multipurpose use;
� Raising the awareness for understanding the vision, the concepts and the
benefit from the NSDI through education.
Recognizing the importance of the NSDI as well as the positive development trend
of the standardized infrastructures of spatial data, the Agency for REC undertook
activities with the objective of qualitative collection, administration, share and use of
geo-referenced spatial data.
Namely, if it take that the geospatial data are the foundations of the NSDI as well as
the fact that the Agency for REC (AREC) is authorized for the geo-spatial data from the
basic geodetic works, the survey and the real estate cadastre, the topographic maps and
the spatial data registry, it is only logical that AREC is to be the leader in the
development and the implementation of the NSDI as well as in the promotion of the
joint access for all interested parties.
2. THE ROLE OF AREC IN CREATING THE NSDI IN COMPLIANCE
TO THE LAW
ON REC
The generally accepted concept of creating NSDI points out to its interconnectivity
with the geo-spatial data, especially with the ones under the authority of the Agency for
REC.
Namely, the cartographic and cadastre data are the representative of the biggest part
of the spatial data within the NSDI and are considered to be one of the most important
components in the process of: management, production of development studies,
planning projects, economic and social development, and analysis of the dissemination
of the spatial events, their inter-relations and other. Having in mind the stated, AREC
has undertaken the first steps towards regulating the establishment of the NSDI in 2008,
through definition of the provisions in the Law on real estate cadastre.

International Conference SDI 2010 – Skopje; 15-17.09.2010
51
In compliance to the Law on REC, the AREC is the institution established to
perform works related to the establishment and maintenance of the real estate cadastre,
the management of the geodetic-cadastre information system – GCIS and the
establishment and maintenance of the public access to the NSDI. In compliance to the
stated legal regulative, the NSDI includes the establishment of:
- Content of metadata
- Summary of spatial data
- Maintenance of the spatial data
- Networking technology
- Contracts for share, access and use of spatial data
- Coordination and supervision mechanisms
- Procedures
The content of some articles (Law on Real estate cadastre 2008, Official gazette 40/2008)
in the chapter for the NSDI includes the types of data out of which the NSDI will be
created and in light of the previously stated, the NSDI is comprised of spatial data
administered in electronic form and they refer for the entire territory of Republic of
Macedonia, while being under the authority of:
- The state administration bodies
- The local self-government units
- Public authorities
- Natural persons and legal entities responsible for the management of the
spatial data
- Natural persons and legal entities which use the data and the services
from the NSDI and provide services based on spatial data
Part of the NSDI will also be the spatial geo-referenced data referring to:
- Real estate cadastre
- Hydrography
- Roads
- Protected areas, national parks and cultural historic monuments
- Spatial planning
- Environmental protection
- Geo-referenced statistical data
- Other
The finding, the review and the use of the spatial data is enabled by the metadata.
The metadata comprise information for:
- Spatial data (content description);
- Synchronization of data with the prescribed standards and normative;
- Rules for use of data and services resulting from them;
- Data quality;

International Conference SDI 2010 – Skopje; 15-17.09.2010
52
- State administration bodies, local self-government units, public
enterprises, public authorities, persons responsible for establishment,
maintenance, distribution and management of the spatial data;
- Data for which the access is limited and limitation reasons.
Besides the above mentioned provisions from the Law on REC which regulate the
content of the NSDI and the metadata, the Law also stipulates the obligation of AREC
for establishment and maintenance of the public access to metadata on the internet via a
geo-portal, in a way which will enable the NSDI subjects to interactively maintain the
information. The vision is to make the NSDI an interactive service or a one stop shop
source for spatial information, while its data/layers to be the main source for all GIS
activities towards support of the sustainable development and economic growth.
Having in mind the previously said, with the objective to improve the legal
regulative in the NSDI part, it is needed to supplement the regulative with new articles
which will define and precisely elaborate the working bodies of the NSDI (the
committee and members), their authorizations, services, networking and similar.
3. ORGANIZATION AND CHARACTERISTICS OF THE SPATIAL
DATA IN AREC
In order to collect, process, maintain, manage, use and distribute the spatial data, a
Geodetic – Cadastre Information System (GCIS) is established in AREC. The system
comprises the spatial and descriptive data from the real estate cadastre, the basic
geodetic works, the real estate survey, the topographic maps, the data for the illegally
built objects and temporary objects. The data from the GCIS, which by their nature have
a leading role during the NSDI establishment, refer to:
• The basic geodetic works
• The real estate cadastre
• The topographic maps
• The spatial units registry
Each of the stated items has specific qualitative and quantitative characteristics.
In compliance to our legislative, GCIS is administered in paper/analogue and
electronic form. Spatial data in electronic form are kept in special computer systems,
while the data in written form are kept in special rooms and conditions due to their
permanent protection.
Having in mind the conceptual structure of the GCIS and its correlation with the
NSDI, one can conclude that at this moment only the data that is part of the electronic
form of GCIS will be the basis on which the NSDI will be built on. During the
establishment of the NSDI, the characteristics of the GCIS data need to be taken into
account in order to identify their specifics and to be harmonized. Besides the stated, one
should consider also the quantity of the spatial data which still exists in paper form, due
to the fact that these data need to digitized first and then implemented in the NSDI.

International Conference SDI 2010 – Skopje; 15-17.09.2010
53
3.1. Characteristics of the data from the basic geodetic works
The scope of the basic geodetic works has the objective to define the state geodetic
datum, cartographic projection and reference networks, with the goal to execute the
basic geodetic reference system of permanent, homogenic geodetic points in relation to
which the definition of spatial data is performed.
The current state reference system and the cartographic projection as a summary of
numeric constants necessary for definition of the position of the geodetic points is used
on a national and local level and has the characteristics stated in table 1.
Table 1: State geodetic datum and cartographic projection
Element Characteristics
Horizontal datum Hermannskogel
Ellipsoid Bessel 1841
Cartographic projection Gauss-Krüger projection
Coordinate system Y- axis, projection of the equator,
X-axis, projection of the meridian λ = 21o
Vertical datum Ortometric heights in relation to the mareograph in Trst
Realization Trigonometric network and leveling network
The geodetic points serve as a basis for positioning of spatial data and they can
belong to the classical reference networks and GNSS networks.
3.1.1. Classic reference networks
The classic reference networks are comprised of geodetic points placed according
specific rules and criteria. The networks i.e. the points are categorized as: trigonometric,
polygonometric, polygon, linear and leveling. The shape and the placement of the
trigonometric points from first order are illustrated in picture 1.

International Conference SDI 2010 – Skopje; 15-17.09.2010
54
Picture 1: Shape of the trigonometric network from first order
The users of the geodetic point’s data, most often private geodetic companies,
besides the standard manner of obtaining the coordinates, can use the web-page of the
AREC to directly access the coordinates of the trigonometric points. The quantity of the
geodetic point accessible through internet (www.katastar.gov.mk).
The data for the other types of geodetic points (polygon, polygonometric and
leveling) are still issued only in paper form. The intention of AREC is conversion of the
records and the description of the geodetic points in electronic form, which will allow
faster and simplified method of access to the geodetic points.
3.1.2 GNSS reference networks
The network comprised of 59 passive GNSS points is established during 2004 in
service of orientation of the aero-photogrammetric images which serve as basis for
production of digital topographic maps in scale of 25.000 (picture 2). These points on
the field are stabilized with specific marks and are placed on distance of approximately
30 kilometers.

International Conference SDI 2010 – Skopje; 15-17.09.2010
55
Picture 2: Schedule of passive GNSS network
Besides the passive GNSS network, AREC intensively works on creating an active
GNSS network comprising 14 active GNSS stations (picture 3). During 2010, AREC
plans production of a Strategy for transformation of the state coordinate system into the
European Terrestrial coordinate system.
Picture 3: Schedule of active GNSS stations

International Conference SDI 2010 – Skopje; 15-17.09.2010
56
The functions of the GNSS reference system will be focused towards: on-line
support of the field works during different types of survey, cadastre maintenance, as
well as towards easier management of digital spatial data, reaching compatibility with
the European countries and similar.
3.2. Characteristics of the real estate cadastre
The real estate cadastre is a public book in which are registered the real property
rights and other real rights, the real property data as well as other real rights whose
registration is stipulated by law. The real estate cadastre data are comprised in the
electronic database i.e. cadastre registry book and on the cadastre plans. The real estate
cadastre data represent one connected unit, and in compliance to the legislative for the
real estate cadastre, they can be structured as:
� spatial data i.e. coordinates of detail points which define the real property
(parcels, buildings and separate parts of buildings) within the state
reference system; and
� descriptive data i.e. data used to describe the attributes and characteristics
of the real properties (name of the real property right holder, address, the
right over the property, number of the property, the property’s address,
manner of use, area and similar). Every descriptive data is connected with
its adequate spatial data.
The spatial data are presented only in the cadastre plans, while the descriptive data
(alpha numeric) can be contained also on the cadastre plans and in the cadastre registry
book. In the cadastre registry book are inserted data registered in a form of numbers or
textual records and these data are already in electronic form. Opposite of the cadastre
registry book, the condition with the cadastre plans as big scale plans produced in scale
of 1:500, 1:1000, 1:2500 and 1:5000 in service of establishment of the real estate
cadastre is completely different. The quantity of the cadastre plans per number of detail
lists specified according the scale of their production is presented in table 2.
Table 2: Quantity of the cadastre plans
In summary, the quantity of the cadastre plans/lists in AREC is 13.053 lists, which
covers an area of circa 25.000 km2. Only for around 30% of the stated area, the data
from the cadastre plans exist in digital form. Having in mind the fact that the digital
form is a condition for participation of the data in the NSDI, the cadastre plans need to
be digitized. In line with the previously said, AREC is undertaking steps for
digitalization of the cadastre plans with a performance tempo that will enable their
completion in digital vector form by 2012. These steps will enable integration of the
data from the real estate cadastre in the NSDI and they will be in correlation with the
European directive for Spatial Data Infrastructure (INSPIRE) – Annex 1 (spatial data
subjects).
Scale of cadastre plans Quantity of detail lists
500 257
1000 2332
2500 9643
5000 830

International Conference SDI 2010 – Skopje; 15-17.09.2010
57
The data from the alphanumeric database as well as the data from the digital
cadastre plans in form of information are available on AREC’s web-page
(www.katastar.gov.mk).
3.3 Characteristics of the topographic maps
In reference to their integration in the NSDI, the topographic maps can be viewed
through the methodology of their production, the update of the topographic data and
other.
Initially accepted in the NSDI will be those maps which are produced with the
application of a methodology which will enable digital production of the cartographic
data. On the other hand, the topographic maps which are produced manually i.e. with
the use of methodology that allows a product in analogue form, digitalization must be
performed.
The methodology for production of digital topographic plans in AREC is applied
since 2004 as a result of the joint project “production of basic state GIS map” executed
between the Agency for REC and the Japanese International Cooperation Agency. In
the past period, with the application of the new methodology, AREC has produced new
160 lists from a digital topographic map in scale of 25.000. What remains is to produce
45 lists from the same, covering the whole territory of R. Macedonia. The data
comprised in the new topographic maps are organized in a topographic data model as an
organized summary of data which provides efficient use, processing, presentation and
safekeeping of cartographic information. The data model for the digital topographic
maps in scale of 1:25000 describes the structure and the content of the fundamental data
comprising the map. The creation of the conceptual model is performed with application
of object modeling due to its adaptability towards complex structures as well as due to
its compatibility with the world standards (Dimova.S, 2007, Methodology and standards for
production of digital topographic maps). The conceptual model of the topographic data for
scale of 1:25000 includes organization of the data and manner of their presentation, and
is produced in compliance to the theory for object based modeling and the standard for
object orientation modeling ISO 19100 (picture 4).

International Conference SDI 2010 – Skopje; 15-17.09.2010
58
Picture 4: Conceptual scheme for the topographic data model in scale of 1:25000,
produced with application of UML
The classification of the data occurs as a result to the logical grouping of the objects
comprised in the map depending on the geometry, the category, the type and the feature
of each object.
As we can see from the conceptual scheme, the topographic data model (picture 4)
is comprised of eleven packages such as:
• Administrative areas
• Land classification
• Roads
• Railways
• Hydrography
• Small objects
• Topographic characteristics
Railways
MACEDONIA
25000 TDM
Waters
Topographic
Characteristics
Small objects Roads
Coordinate
network and frame Spatial Scheme
Reference raster
Text - Textual
Records
Administrative Areas
Land Classification

International Conference SDI 2010 – Skopje; 15-17.09.2010
59
• Text (textual records)
• Reference raster
• Coordinate network and frame
• Spatial scheme
The main characteristic of each class is its name i.e. title while the attributes of each
class can be: History (date of creating the class), type of element (geometric point,
geometric line and geometric polygon), item (name of the class), name (text in
Macedonian and English), code (code in a form of a full-number record which is unique
for each type of object from the model) and comments which additionally elaborate the
class (Dimova.S, 2007, Spatial Data Infrastructure for topographic maps).
The topographic data model for scale of 1:25000 includes a total of 221 objects
with the following quantitative schedule: administrative areas – 2; land classification –
41; roads – 42; railways – 22; hydrography – 28; small objects – 48; topographic
characteristics – 21 and text (textual records) – 17 objects.
The Digital Terrain Model (DTM) is one of the basic products in the process of
production of the new maps on the basis of which the grid surface model GSM is
produced, with size of the basis - 20 meters. This surface model is applied during the
production of the digital ortophoto maps in scale of 1:25000.
The map of Republic of Macedonia is also produced in digital form in scale of
1:1.000.000, as an integral part of the “world global map”.
Besides the new digital topographic maps, AREC has old topographic maps
produced by the Military Geographic Institute from Belgrade which are in analogue
form (table 3).
Table 3: Topographic maps in analogue form
The basis for production of the stated maps is the performed topographic-
photogrammetric survey of the land in the period of 1947 - 1967. The originals for all
types of analogue maps are not available to AREC due to the fact that they are kept in
the Military – Geodetic Institute in Belgrade. In order to provide an insight in the
content of the maps via the internet, the maps are converted in digital form through
scanning and geo-referencing.
Insight in all scales of the topographic maps is available over the web-page of AREC.
3.4. Characteristics of the spatial unit’s registry
The spatial unit’s registry includes the following spatial units: static areas, cadastre
municipalities, populated area, local self-government units and census areas. For each
spatial unit, in the registry are recorded data for: the name, the sole identification
number (code), the graphic layout of the borders, other data related to the spatial unit as
Scale of topographic maps Quantity of lists Year of production Mark
25000 205 1968-1981 TK25
50000 61 1958-1972 TK50
100000 22 1968-1973 TK100
200000 8 1972-1975 TK200
500000 1 1977-1982 TK500

International Conference SDI 2010 – Skopje; 15-17.09.2010
60
well as the changes that occurred and relate to the spatial unit. The most important use
of this registry is the support to the census of the population and the agricultural land.
4. NEXT STEPS
Acknowledging the meaning, the benefits and the role of the NSDI in every modern
system, our country needs to establish the NSDI as soon as possible. Besides the time
required for implementation of the NSDI, demonstrated by the personal experiences of
the countries already working on this subject, financial resources and good coordination
of all involved parties is also essential.
In our case, the time required for overcoming the low level of digitalization of the
spatial data in AREC needs to be added to the length of the time required to establish
the NSDI. In service of the effective management of the time and the processes of the
NSDI, the planned activities in AREC are aimed towards simultaneous completion of
the digitalization and the drafting of the NSDI strategy.
The activities in service of creating the NSDI are incorporated in the extension of
the Real Estate Cadastre and Registration Project 2010-2012, financed by a World
Bank loan.
The analyzed types of spatial data in AREC will be part of the NSDI strategy and
will have to include the spatial data from the ministry of agriculture, environment,
transport and communications, local self-government, state office for statistics and other
identified institutions in the NSDI strategy. The strategy will also have to answer the
needs of the legal changes in service of establishing a coordinative body for NSDI, the
application of the electronic signature, the manner and model for conveying
administrative, the organizational and technological measures.
5. CONCLUSION
The data from the survey, the cadastre and the topographic maps are the essential
basis of each NSDI. Having in mind the Law on REC and the authority over the
establishment of the NSDI, AREC has undertaken the initiative to start the activities
related to the NSDI. In that sense, the following activities are planned:
� Production of NSDI strategy;
� Development of NSDI data model and standards;
� Conversion of analogue cadastre plans in vector digital form;
� Implementation of the sole European reference system ETRS89 and
creating conditions for its use during the acquisition of new data;
� Establishment of web-GIS portal in AREC;
� Establishment of governmental NSDI Geo-Portal.
The initial activities in reference to the establishment of the NSDI are planned to be
undertaken by the Agency for Real Estate Cadastre – AREC during 2010. The
implementation of the activities is planned to be executed in two stages.
The first stage will be focused towards production of two documents, the Strategy
for development of NSDI and Data Model and standards for AREC. The

International Conference SDI 2010 – Skopje; 15-17.09.2010
61
implementation of these documents will be executed during the second stage, during
which the AREC Geo-Portal will be established first and then the process will continue
with the establishment of the inter-coordination on national level with institutions which
will be identified in the NSDI strategy. As a summary of all activities, in 2012 AREC
plans to establish the governmental Geo-Portal on a national level.
The development of the data model and the standards of the analyzed types of
spatial data in AREC will enable their inclusion in the NSDI. This is very important
especially if one has in mind the content of the three annexes of the European directive
INSPIRE 2007/2/FC, the data from the basic geodetic works, the real estate cadastre,
the topographic maps and the spatial units registry need to be integrated in the NSDI.
With the objective to achieve common success, AREC will have to pay special
attention to the cooperation and the level of participation of the key institutions in the
NSDI.
7. REFERENCES
Dimova, S. (2007): Spatial Data Infrastructure for topographic maps (1108), FIG Working
Week, Hong Kong 13-17 May 2007
Dimova, S. (2007): Methodology and standards for production of digital topographic maps, PhD
thesis, Faculty of civil engineering Skopje, Republic of Macedonia.
Dimova, S., Srbinoski Z. (2008): Aspect of positional accuracy of digital cartographic data, 2nd
International Conference on Cartography & GIS, Borovec, Republic of Bulgaria.
Dukadinovska, E. (2009): Topographic Data Base for digital map in scale 1:25000 – component
of NSDI, International scientific conference, Importance of developing National Spatial Data
Infrastructure of Republic of Macedonia based on INSPIRE directions, Skopje
Guptill, S.C., Morrison, J.L., editors, (2001): Elements of spatial data quality, Elsevier Science
Ltd, The Boulevard, Langford Lane, Klidington, England 1995.
ISO19113, (2002): Geographic information - Quality principles, TC 211; ISO Standards.
INSPIRE Directive (2007), Official journal of the European Union, Directive 2007/2/EC of the
European Parliament and of the Council of 14 March 2007 establishing an Infrastructure for
Spatial Information in the European Community (INSPIRE)
Japan International Cooperation Agency (2004): The study for establishment of state base
maps in the Republic of Macedonia, Skopje.
State authority for geodetic works & JICA (2005): Macedonia 1:25000 Spatial database data
specification, Skopje, Republic of Macedonia
Law on Real estate cadastre (2008), Official gazette 40/2008, Skopje, Republic of Macedonia.
Salge F. (1997): Standardization in the Filed of Geographic Information: The European Efforts.
Spatial Database transfer standards2: Characteristic for assessing standards and full descriptions
of the national and international standards in the world, editor H., Moellering, Elsevier science
publishers itd, UK.
8. BIOGRAPHICAL NOTES OF THE AUTHORS
Dimova I. Sonja (maiden name Bandzova) is born on 21 of January
1968 in Ohrid. Mrs. Dimova has completed the primary school in
Ohrid. In 1982, Mrs. Dimova enrolls at the Civil Works High school
“Niko Nestor” in Struga (department of geodesy). After completing
the High school in 1986, Mrs. Dimova continues the education at the
Civil Works Faculty in Belgrade - department of geodesy. Mrs.
Dimova graduated in 1991 with the thesis “Interactive computer

International Conference SDI 2010 – Skopje; 15-17.09.2010
62
support during digitalization of contours line in the
photogrammetric instruments”. In 1999, Mrs. Dimova starts the
post graduate studies at the Faculty of Mathematical Sciences in
Skopje, Institute for Geography – thematic cartography. Mrs. Dimova
completes the post graduate studies with the thesis “Computer
support during of cartographic shaping of the relief”. Mrs.
Dimova starts the doctoral studies at the Civil Works Faculty in
Skopje in 2005. In 2008, Mrs. Dimova completes the doctoral studies
with the thesis “Methodology and standards for production of
digital topographic maps” and is awarded Doctor of Technical
Sciences. Continually from 1991, Mrs. Dimova is employed at the
Agency for Real Estate Cadastre.

International Conference SDI 2010 – Skopje; 15-17.09.2010
63
HOW A NATIONAL GI ASSOCIATION SUPPORTS THE SDI
DEVELOPMENT - THE CASE OF HUNGARY
Gabor REMETEY-FÜLÖPP 1 ABSTRACT In this paper the activities of the non-profit, interdisciplinary national GI umbrella organisation HUNAGI are highlighted demonstrating the influence of its member institutions and organistions in the evolution of the National Spatial Data Infrastruture in Hungary. The paper will focus on networking, channeled communication, and HUNAGI’s involvement in SDI-related actions on domestic and international level. The facilitator role of the organisation is introduced based on the multisector networking with governmental agencies, academic institutions, universities, the private sector, NGOs and local governments. Most of the prime data providers, stakeholders, value added service operators and users became member or partner of the national GI association. Having about 100 member institutions and organisations, HUNAGI is in direct contact with about 500 domestic experts in GI on regular basis including postgraduate students and alumni as individuals. Membership architecture and impact of the economic recession will be highlighted. In order to support the availability, reliability, accessibility and useability of spatial data in line with INSPIRE and PSI directives, HUNAGI as SDIC is heavily involved in awareness raising, information share and channeling, arranging joint actions involving the target user communities and sharing knowledge and know-how on best practices and lessons to be learned. Partnership with the e-content industry, the logistics community, the space-related cluster and the ITS sector will be mentioned. Tools used for the community interface will be highlighted. The field of operation is not restricted on the domestic links. One of the feature of HUNAGI is the commited involvement in the SDI-related international relations such as EUROGI, GSDI and Digital Earth. There is a link to UNSDI too. These activities will be introduced and the benefits will be illustrated. HUNAGI and its members are contributing to several EU projects in order to enable better implementation of the relevant legislation framework directives. Here the Humboldt (supporting GMES and INSPIRE), eSDI-Net+ (SDI best practice identification, evaluation and dissemination), EURADIN (harmonizing address infrastructure) and LAPSI (legal aspects of public sector information and re-use) will be mentioned. Conclusion will be made by calling the attention on the opportunities for sharing experiences with the balkan countries via the anticipated joint actions of EUROGI and Eurogeographics.
Key words: NSDI, Networking, Information share, Communication, INSPIRE, PSI. 1. INTRODUCTION Inagurated in 1994 and registered in January 1996, the Hungarian Association for Geo-information shortly HUNAGI was established as a non-profit, national, interdisciplinary umbrella organisation
1 Dr. Gábor REMETEY-FÜLÖPP , [email protected] Hungarian Association for Geo-information (HUNAGI) www.hunagi.hu Tel.: +36 1 3556322, Gsm.: +36 30 4158276 Pethényi út 11/b, 1122 Budapest, Hungary

International Conference SDI 2010 – Skopje; 15-17.09.2010
64
- to promote, stimulate, encourage and support the development and use of GI and its associated technologies, - to strengthen the institutional links between the multidisciplinary GI communities in Hungary and in abroad, - to provide representation and visibility of the GI community's interests in the European Umbrella Organisation for Geographic Information (EUROGI), and to build up contacts with similar national GI associations. Being involved also in the activities of the Global Spatial Data Infrastructure Initiatives (which became Association at the time of the GSDI6 held in Budapest), HUNAGI was invited to the INSPIRE Expert Groups of the European Commission between 2002 till 2006. After Hungary joined the European Union in 2004, the country was represented in the INSPIRE-related Council Meetings and later commitology actions by the Ministry of Environment and Water backed with the Ministry of Agriculture and Rural Development in some GI related issues. MoARD’s involvement was heavily supported since the beginning by its Institute of Geodesy, Cartography and Remote Sensing (FÖMI), member of HUNAGI. FÖMI, the Hungarian Met Service OMSZ and the Hungarian Geological Institute (MÁFI) became Legally Mandated Organisations (LMO) , while HUNAGI a Spatial Data Interest Community (SDIC) registered by the DG JRC Spatial Data Infrastructure Unit in Ispra. Between 2004-2006 HUNAGI lead the SDI Strategy Working Group of the multiageny framework of the Information Society Strategy under the auspice Ministry of Communication and Informatics. Meantime the first National Status Reports on INSPIRE were prepared by HUNAGI in conjuction with FÖMI for the subcontractor KU.Leuven. In 2007 MoEW – responsible for the task - asked HUNAGI to be involved in the completion of the INSPIRE questionnaire and the document was prepared by HUNAGI and FÖMI again. In 2009 as contractor, HUNAGI provided an Impact analysis on the INSPIRE implementation for MoEW. The document was prepared by HUNAGI member COWI Ltd, a professional consultant company involving experts from FÖMI, the Regional Development Public Benefit Company, HUNAGI and the National Statistical Office (KSH). The document was intended to support the decisions related to the adoption of the INSPIRE legislation. The Environment Act amended by MoEW step in force on May 15 1009, while a Governmental degree (241/2009.x.29) was announced on the establishment of the National Environment GI System and a decision was made on governmental level (1176/2009x.26) to set up of a Committee with defined tasks in order to support the Hungarian Representative in the European INSPIRE Committee. The first Committee meeting was held on 31 March 2010 hosted by MoEW and the frequency of the meetings will be 4 times per year. Altough HUNAGI was not invited so far, it is anticipated, the announced Expert subgroups will provide opportunity for HUNAGI experts to be invited. 2. SETTING HUNAGI ON THE SCENE 2.1. Network HUNAGI became today a spatial data interest community network of organisations and institutions interested in the acquisition, service or use of Geographic Information and related technology developments. So far over 220 decisions have been made by the

International Conference SDI 2010 – Skopje; 15-17.09.2010
65
(today one hundred) members at the 19 General Assemblies during the past 15 years. Between the Assemblies, a Presidential Board supervises the activities and recommends changes. In 2008 the Presidential Board was strengthened by an upgrade to 7 members. The multidisciplinary nature of the organisation is well reflected by the afiliations of the Board members, who are representing the following areas: Informatics in Town Planning and Regional Development (HUNAGI President, VÁTI), National Cadastral Mapping and Remote Sensing (FÖMI), Topographic Mapping (HM Topograph), Local Government Informatics (Szombathely), Landscape Planning and Rural Development (Budapest Corvinus University), as well as the Departments of Physical Geography (Szeged) as well as Cartography and Geoinformatics (ELTE, Budapest). The Secretary-general came from the Ministry of Agriculture and Rural Development, while the Secretary - a post established in 2009 - is filled by the Deputy Delegate for the European INSPIRE Committee on behalf of the Ministry of Environment and Water. (Mention should be made some of the ministries including MoEW will be affected by the structural changes announced by new government on 3rd May 2010). The Controlling Committe is lead by representative of a the private sector (e-Government Ltd) having members from the prime spatial data provider FÖMI and a vocational training institution in Nagykanizsa. 2.1.1. Membership
Starting by 7 founding organisation in 1994, so far 145 institutions and organisations applied for membership in HUNAGI and about 40 left the Association due to different (mainly financial) reasons. Especially 2008-2009 became difficult years for HUNAGI by loosing nearly 25 % of its members – mainly as a consequence of the economic recession and the uplift of the membership fee in the public institution category. However, the facilitator role of the organisation steadily attracts newcomers such as the Hungarian Post Office, the Nav N Go Ltd, Research Institute of Agricultural Economics only a few to mention who applied in 2010. The network clusters are around governmental agencies, academic research institutions, universities, the private sector, NGOs and local governments. Most of the prime data providers in geosciences from Meteorology to Geology and Geodetic/Geophysical Research Establishment to Earth Observation, stakeholders, developers, value added service operators and users became member or partner of the national GI association. The recent member academic institutions with their enrollment year are shown on Fig. 1
Fig. 1 Academic institution members of HUNAGI
1994 Faculty of Geoinformatics, University of West-Hungary 1996 ATC Agroinformatics and Applied Mathematics Department, University of Debrecen 1997 Dept of Physical Geography, József Attila University of Sciences 1999 Institute for Environmental and Landscape Management, Szent István University, Gödöllő 2000 Chair of Landscape Planning and Regional Development, Budapest University of Economics and Public Administration Research Institute of Soil Sciences and Agrochemistry of the Hungarian Academy of Sciences (MTA TAKI) 2001 Chair of Surveying and Remote Sensing, Institute of Geomatics and Engineering Faculty of Forestry, University of West-Hungary

International Conference SDI 2010 – Skopje; 15-17.09.2010
66
Chair of Water- and Environment Management, Faculty of Agricultural Sciences, Debrecen University Department of Cartographic Science and Geoinformatics, L.Eötvös University Institute of Mathematics and Informatics, Faculty of Agricultural Sciences, University of Kaposvár 2002 Institute for Ecology and Botany of the Hungarian Academy of Sciences 2003 Department of Surveying and Geodesy Budapest Univ of Technology and Economics Pollack Mihály College of Engineering, Department of Public Utilities, Geodesy and Environmental Protection, University of Pécs Regional Research Centre Alföld of the Hungarian Academy of Sciences (MTA RKK) 2004 Zsigmondy Vilmos és Széchenyi István School for Vocational Training, Nagykanizsa Chair of Automation, Veszprém University Research Institute of Geodesy and Geophysics (MTA GGKI) 2005 Corvinus University of Budapest, Faculty of Public Administration Department for Public Management and Urban Studies 2008 BCE Department of Mathematics & Informatics 2010 University of Debrecen, Dept of Physical Geography and Geoinformatics
Recent governmental institution members with their enrollment year are shown on Fig. 2
Fig. 2 Governmental institution members of HUNAGI
1995 Hungarian Space Office 1996 Mapping Service of the Hungarian Defence Forces 1997 Geological Institute of Hungary (MÁFI) GRID Budapest at MoEW Institute of Geodesy, Cartography and Remote Sensing (FÖMI) incl. 8 subscribed projects (INSPIRE, LandCover, LPIS/PIR, GNSS, Int‘lRelations, MADOP, DigitalLandOffices, VINGIS) 1998 Regional Development and Town Planning Nonprofit Ltd (VÁTI) 2001 Hungarian Meteorological Service (OMSZ) 2002 Baranya County Land Office Capital Land Office Mapping Nonprofit Ltd., MoDefence Somogy County Land Office State Forestry Service 2003 Tolna County Land Office Pest County Land Office Csongrád County Land Office Békés County Land Office Borsod-Abaúj-Zemplén County Land Office Geodetic and Geophysical Research Institute of the Hungarian Academy of Sciences 2005. Environmental Protection & Water Directorate of the Region Central Tisza Szabolcs-Szatmár-Bereg County Land Office Heves County Land Office Bács-Kiskun County Land Office

International Conference SDI 2010 – Skopje; 15-17.09.2010
67
Hajdú-Bihar County Land Office Szombathely Municipality 2006 FVMMI, Gödöllő MoARD Institte of Vocational Training 2007 Zalaegerszeg Municipality 2008 Directorate Water & Environment 2009 Aggtelek National Park Balaton-felvidék National Park Bükk National Park Duna-Dráva National Park Duna-Ipoly National Park Fertő-Hanság National Park Hortobágyi National Park Kiskunsági National Park Körös-Maros National Park Őrség National Park 2010 Research Institute of Agricultural Economics
HUNAGI general Assembly opened the door for the private sector in 2000. Despite the frequent fluctuation, the number of SMEs increased steadily. Recent private sector members with their enrollment year are shown on Fig. 3
Fig. 3 Private organisation members of HUNAGI
2001 Bonaventura GIS Market Analysis and Publishing Ltd. www.terinformatika-online.hu DigiTerra GEOinformatics System House Ltd www.digiterra.hu GeoX Ltd www.geox.hu Térkép (HISZI-MAP) Ltd. www.hiszi-map.hu National Cadastral Programme Non-profit Co. www.nkp-kht.hu WEBhu Ltd. www.webhu.hu 2002 Autodesk Hungary Ltd. www.autodesk.hu Congress Ltd www.congress.hu ESRI Hungary Ltd www.esrihu.hu Geodézia Ltd www.geodeziakft.hu HungaroCAD Ltd www.hungarocad.hu VARINEX Informatics Ltd www.varinex.hu 2003 InterMap Ltd. www.intermap.hu Compet-Terra Ltd. http://competterra.com/ GeoData Ltd. www.geoadat.hu GT Rt (Geodetic and Cartographic Shareholding Co.) www.geodezia.hu T-Systems Ltd/IQSYS Ltd www.iqsys.hu 2004 EUROSENSE Ltd. www.eurosense.hu HungaroGEO Ltd www.hungarogeo.hu Rudas & Karig Ltd http://www.rudaskarig.hu/ 2008 Daten-Kontor Ltd www.dk.hu TEKIRÉ Ltd www.tekire.hu GEOlevel Ltd www.geolevel.hu

International Conference SDI 2010 – Skopje; 15-17.09.2010
68
2009 GotMap Ltd(Ohio, USA) www.gotmap.com COWI Kft www.cowi.hu 2010 Magyar Posta Zrt. www.posta.hu Nav N Go Ltd www.navngo.com
The recent NGO members with their enrollment year are shown on Fig. 4
Fig. 4 Non-governmental organisation members of HUNAGI
1994 gita Hungary Geospatial Information & Technology Association Hungarian Society of Surveying, Mapping and Remote Sensing John v. Neumann Society for Computing Sciences 1998 Hungarian Federation of Agroinformatics (MAGISZ) 2003 UN FAO SEUR, Budapest
The members are well distributed in the country: all the counties have at least one institutions or organisations represented in HUNAGI. Moreover, nearly 50 students and alumni are individual members of the HUNAGI Student Division. Their mentor is the former Dean of the College Geoinformatics of the West Hungary University Prof. Béla Márkus. 2.1.2. Agreement-based cooperation with other interest groups, and informal
partnerships
In order to enhance the information dissemination towards neighbour areas generating cross fertilization enabling innovative solutions, agreement based links and cooperations have been emerged with the following target areas: Agroinformatics (MAGISZ), eGovernment, Public Service Information and its re-use (MATISZ), Intelligent Transportation Systems (ITS Hungary), Purchase, Inventory and Logistics (MLBKT) organising joint workshops and seminars (two times so far). The most important collaboration in 2009 was the completion of an INSPIRE-related economic impact analysis. Contracted by MoEW the document was achieved in teamwork lead by the subcontractor COWI Ltd. It is anticipated, promising links will gain synergy with the ITS Hungary where HUNAGI is funding member and the just founded opensource oriented Hungarian CASCADOSS Society. Ideas and considerations regarding future developments associated beyond INSPIRE were inspired by the recession, to strengthen the transparency and competitiveness. In line with these ideas consultancy was provided for the State Audit Office (ÁSZ) in 2009. The results led to a formal two-year collaboration agreement between ÁSZ and HUNAGI introducing GIS to support the fight against corruption. Additional formal MoU was signed with the Hungarian Space Cluster HUNSPACE in 2010 to promote the use of novel technologies and tools and sharing know-hows for the benefit of the SMEs of the two communities. Recently, informal communications are paving the way for other future thematic cooperations towards e.g. landscape planners, nature protection community and the Monitoring Unit of the Hungarian Ornitological Society (MME) to

International Conference SDI 2010 – Skopje; 15-17.09.2010
69
share information on innovative solutions where the users are heavily involved in the data acqusition (TÉKA, Fecskefigyelo, Turistautak). HUNAGI as registred public benefit society keeps contacts with practically any entities and individuals (experts, decision makers) regardless with their membership status. 2.2. Communication and awareness raising In order to support the availability, reliability, accessibility and useability of spatial data in line with INSPIRE and PSI directives, HUNAGI as SDIC is heavily involved in awareness raising, information share and channeling. The arrangement of joint actions with thematic target communities, sharing knowledge and know-how on best practices and lessons to be learned are acknowledged by the members, especially the private sector representatives. The extended mailing list of HUNAGI used for eNewsletter and Circulars contains 500+ experts. HUNAGI newsbogs and thematic blogs attracted so far 150,000+ visitors from 100+ countries. A two-page HUNAGI flyer in English updated monthly is devoted to participants of meetings of closed shop events.
2.2.1. Internet
HUNAGI has internet presence since 1995 supported by the ELTE Department of Cartography and Geoinformatics till 1998. Since that year the HUNAGI website is hosted by FÖMI (www.hunagi.hu). In 2006 onward HUNAGI introduced its newsbog services in Hungarian and in English (unsdihu.blogspot.com) launching some additional thematic blogs entitled according to the main chapters of the NSDI Strategy. The contents of the blogs incliding the extensive photo archive (HUNAGI Visuals Resource) are available for reuse according to the Creative Commons 2.5 Licence. The 1668 blogposts of the flagship blog HUNAGI Napló hunagi8.blogspot.com was read by 89,244+ visitors so far, with 80-120 hits/day today. HUNAGI keeps direct contact with its members and domestic partners using t 200 strong Member Mailing List and 500+ strong Extended Mailing List respectively. The International Mailing List is not used for mass mailing. HUNAGI e-Newsletter is circulated twice a month highlighting the latest news might be interesing for the members and partners. As an example, HUNAGI websblog posted the following news addressing INSPIRE-related issues in the past three months: - EUROGI presentations at the INSPIRE Conference in Krakow (on April 4) - Minutes of the EUROGI Annual General Meeting (with downloadable INSPIRE-related presentations of the Members Day) (Apr 2) - Call for Opportunity: Web-based Consultation on the Annex II and III (March 30, March 1) - EUROGI Members Day in Brussels (March 25) - Call for Contribution on Beyond INSPIRE, Next Steps and Hot Topics (March 17) - INSPIRE Forum: Opensource software expert Group Call for Join (Feb 24) - Last reminder: Deadline of the INSPIRE Conference (January 28) Additional HUNAGI blogs are devoted to Legislation, Data Policy, Standards and Data Specifications, Data Acquisition and Updating, Metadata Service and Data Access, SDIC Comments, Vocabulary, Science and Education, New products and Publications, Flashback (HUNAGI-related archived annual reports back to 1994), HUNAGI Blog of Events (a comprehensive and continuously updated log based on the incoming mails and reminders), GI/GIS and the Future, Tripshots (Photographic Portfolio since 2006. Actually, the HUNAGI Digital Archive goes back to January 1999).

International Conference SDI 2010 – Skopje; 15-17.09.2010
70
Three additional website is maintained with the content of three thematic areas, where HUNAGI is directly or indirectly involved in domestic and international actions namely: EURADIN http://euradinhu.blogspot.com , LAPSI http://lapsihu.blogspot.com , and PLAN4all http://plan4allhu.blogspot.com .
2.2.2. Journals
There are two Hungarian journal devoted to GI, both are published by HUNAGI members. Geodézia és Kartográfia is the printed one which belongs to the Hung. Society of Surveying, Mapping and Remote Sensing (MFTTT). The other is a portal entitled Térinformatika-online (www.terinformatika-online.hu) published by Bonaventura Ltd editor of the once Térinformatika Journal stopped in 2008 by the HUNGIS Foundation (which was stopped after 18 years too). As further e-journals are concerned, HUNAGI officers and liaisons are active in the Editorial Board of the Journal of Agricultural Informatics, Budapest, International Journal of the Spatial Data Infrastructure Research (Ispra) and the International Journal of Digital Earth (Beijing) and provide contributions to the PSI Platform (London) as correspondent. 2.2.3.Conferences, workshops, seminars
In the past 10 months HUNAGI organised two international workshops in conjuction with FÖMI and Geox Ltd. The subject was devoted to the European Address Harmonisation project called EURADIN. The first was held on 2nd September 2009 involving the major stakeholders, the second targeting the address service providers and users on 23 March 2010. On 25 February 2010 the first Thematic HUNAGI Conference entiled „Do we have to pay for everything?“ was hosted by MoARD. The topic was OSS and free spatial data for Local Governments. Invited internatinal speakers were represented among others EUROGI, OGC, DG Informatics, AGEO, Humboldt and CASCADOSS projects. 2.3. HUNAGI membership in other societies HUNAGI is member of ITS Hungary (Intelligent Trasportation Systems), MAGISZ (Hungarian Federation of Agricultural Informatics). On European level HUNAGI is member of the European Umbrella Organisation of Geographic Information (EUROGI) and the Genoa based Geographic Information System International Group (GISIG). On the global scene HUNAGI has three strong links: membership in the Global Spatial Data Infrastructure Association (Reston, GSDI), the International Society of Digital Earth (Beijing, ISDE) and as invited observer in UNGIWG the UN GI Working Group chaired by UNOOSA/UN-SPIDER and UNACE. Nearly 3 year long HUNAGI was active member of the UNESCO and International Geoscsience driven International Year of the Planet Earth (2007-2009). On behalf GSDI Association HUNAGI member had the opportunity to be delegated at the IVth GEO Plenary and Ministerial Summit as well as the Vth GEO Plenary held in Cape Town and Bucarest respectively. HUNAGI officer is acting as liason to the CEOS Working Group on Information Systems and Services on behalf of GSDI Association. The links with neighbour countries‘ NGIAs such as AGEO and CAGI are also important to mention. Many HUNAGI member institution liaisons are active in international learned societies such as FIG, ICA. 2.3.1. International institutional links

International Conference SDI 2010 – Skopje; 15-17.09.2010
71
The field of operation is not restricted on the domestic links. One of the feature of HUNAGI is the commited involvement in the SDI-related international relations such as EUROGI, GSDI and Digital Earth. There is a link to UNSDI too. These activities will be introduced and the benefits will be illustrated. The following listings reflect the turbolent activities related to the institutional links on Domestic, Cross-border, European and Global level in 2009-2010 so far: Domestic level links Participation of the Hungarian Space Research Council Meeting Setting up Hungarian SDI Group in INSPIRE Forum by the Hungarian Academy of Science, Subcommittee on Geodesy and Geoinformatics Cross-border activities CAGI Cross-border: Participation of the CEE-SDI in Prague AGEO Cross border: National EURADIN Conference, Vienna ITD-HUNSPACE-HSO talks with Bavarian Space sector representatives and EADS Astrium European-level activities Participation of the EUROGI ExCom hosted by IGN, Madrid Participation of the EUROGI ExCom Meeting, Members Day and Annual General Meeting in Brussels EUROGI ExCom Meeting hosted by HUNAGI in Budapest EUROGI ExCom and General Board Meetings in Turin Attending DG JRC brainstorming on Europe in Digital Earth in Ispra HUNAGI attends the EUROGI ExCom Meeting in Rome Compilation of GI/EO Calendar of Conferences in the CEE & SEE Countries in 2010-
2011 for EUROGI ExCom Attend EUROGI Annual General Board Meeting in Brussels Global-level activities Taking part of the CEOS WGISS27 Meeting in Toulouse Participation GSDI-11 Conference in Rotterdam Co-chairmanhip, GSDI WG on Legal & SocioEconomics Impacts Participation of the ISDE-6 in Beijing Participation of the ISDE ExCom Meeting in Beijing with contribution to the Beijing Declaration 2009 Participation of the Editorial Board Meeting of the Int’l Journal of Digital Earth in Beijing HUNAGI invited to the 10th UNGIWG Plenary and Poster Exhibition hosted by UNOOSA/UN-SPIDER in Bonn IGS: Two Hungarians among the founding members of the International Geospatial Society HUNAGI officer was asked to serve as advisor to the Past President of GSDI Association Joining the LinkedIn‘s GOV-OSS-Resource Center Forum Special liaison with the UN (with a short flashback) On 28th September 2006 at the 1st UNSDI HUCO Stakeholder’s Meeting held in Budapest HUNAGI got the mandate from the leading Hungarian stakeholders to run the

International Conference SDI 2010 – Skopje; 15-17.09.2010
72
UN Spatial Data Infrastructure Hungarian Coordination Office (UNSDI-HUCO). These stakeholders include: Institute of Geodesy, Cartography and Remote Sensing, Hungarian Geological Institute Hungarian Meteorological Service (OMSZ) Hungarian Space Office, Ministry of Environment and Water Mapping Service of the Hungarian Defence Forces Ministry of Defence Mapping Company Ministry of Economy and Transport National Directorate General for Disaster Management Research Institute for Soil Science and Agricultural Chemistry University West Hungary Faculty of Geoinformatics VÁTI Hungarian Public Nonprofit Company for Regional Development and Town Planning FÖMI/HUNAGI Proposal for setting up UNSDI HUCO Hungarian Association for Geo-information Introductory presentations of the Stakeholders marked with blue are available at www.unsdi.hu. UNSDI HUCO was invited to the INSPIRE-UNSDI consultation to DG JRC, Ispra, 15th December, 2006 HUCO presentation is available at www.unsdi.hu . The 2nd UNSDI HUCO Stakeholders’ Meeting was hosted by the Hung. Met Service on January 26, 2007, while the 3rd UNSDI HUCO Stakeholders’ Meeting with the Delegation of the Chinese NSDI Strategy Committee was hosted by FÖMI on May 22, 2007. HUCO was invited to the 1st UN Global Partner Meeting organised by UNGIWG and hosted by European Space Agency ESRIN in Frascati. The Town Planning and Regional Development Public Benefit Co. and FÖMI were also invited. In 2007 HUCO’s proposal to refer UNSDI in IYPE’ Paris Declaration was accepted. HUCO position paper was submitted to the UNGIWG Secretariat in Geneva in June. HUCO contributed to the UNGIWG -9 Plenary and participation of the 9th UNGIWG Meeting as invited partner in Vienna. GSDI/HUNAGI proposal to CEOS WGISS at the WGISS27 hosted by CNES was well received to formulatte user requirements on SDIs and related services in the GSDI SDI Cookbook Wiki in case of applications which need quick response time under the guidance of UN-SPIDER. Invited partner at the 10th UNGIWG Plenary & Meeting in Bonn, taking part at the Poster Exhibition with a poster on VINGIS of FÖMI was arranged by HUCO in October 2009. 3. ACTIVITIES IN SDI CONTEXT HUNAGI and its members are contributing to several EU projects in order to enable better implementation of the relevant legislation framework directives. Here the Humboldt (supporting GMES and INSPIRE), eSDI-Net+ (SDI best practice identification, evaluation and dissemination), EURADIN (harmonizing address infrastructure) as well as Plan4all (INSPIRE compliance in the spatial planning) and LAPSI (legal aspects of public sector information and re-use) will be mentioned. 3.1. Domestic activities: HUNAGI in the facilitator role Participation of the EUMETSAT-OMSZ-MÜI Information Day hosted by the Hung.
Meteo Service in Budapest

International Conference SDI 2010 – Skopje; 15-17.09.2010
73
Preparing the LAPSI Project-related Task Force Team Participation of the gita Hungary Conference in Balatonalmádi HUNAGI presentation on SDI evaluation at ESRI HU Users‘ Conference in Budapest Participation of the Society and GIS Conference organised by ELTE TTK TFT in Budapest Participation of the GIS Day event organised jointly by ELTE TGT SASFA and HUNAGI in Budapest SME4SPACE Workshop organised by HUNSPACE Budapest NatureSDI+ Workshop hosted by MoEW in Budapest Participation of the Light-Space-Imagery Conference organised by GeoIQ and MFTTT in Dobogókő HUNAGI visited the Faculty of Natural Resources Management of the Károly Róbert College in Gyöngyös. Application of the evaluation methodology of ePublicServices for spatial data services using synergy with eSDI-Net+ achievements (MATISZ) Some hot topics which arise in HUNAGI’s field of work includes: HUNAGI in the Hungarian Space Council, MoU with the Hungarian Space Cluster in Earth observation and SDI, Forging Geoscience links (IYPE), FOSS4GI for the Local Governments CASCADOSS, Novel applications by involving the users: TÉKA Landscape assets cadaster, Bird Monitoring activities of MME, Túristautak. 3.2. EU projects Participation with the goal to maximize the potentials and benefits offered by the international collaborations and networks on European and Global level and providing feedbacks to facilitate the implementation of the INSPIRE Directive. Some of the actions in 2009 and in 2010 so far: ePSIplus European Public Sector Information and Re-use Participation of the ePSIplus Closing Thematic Workshop on GIS/Meteo hosted by the Documentation France in Paris Humboldt Participation of the HUMBOLDT Rewiever and Advisory Board Meeting hosted by Fraunhofer Institute in Darmstadt CASCADOSS: Opensource tools for INSPIRE and GMES Participation of the CASCADOSS Regional Meeting hosted by Compet-Terra in Szeged Participation of the CASCADOSS Workshop hosted by FÖMI in Budapest eSDI-NET+ European SDI Network Participation of the eSDI-Net+ Inter-WP Meeting hosted by SEERC in Thessaloniki Participation of the eSDI-Net+ Consortium Meeting in Leuven Participation of the eSDI-Net+ Consortium Meeting in Krakow eSDI-NET+ Consortium Meeting, and the European SDI Best Practice Award Conference, Turin Six subnational SDI have been nominated by HUNAGI for eSDI-Net+.

International Conference SDI 2010 – Skopje; 15-17.09.2010
74
Evaluation methodology will be enhanced with HUNAGI participation ensuring applicability for self assessments. Investigate the use for web-based services in ePublic services, a recent proposed joint action with MATISZ, the Hungarian Federation of e-Content Industry. eSDI-Net+ Consortium meeting hosted by Fraunhofer Institute, Darmstadt Hungarian version of www.esdinetplus.eu completed EURADIN European Address Infrastructure To build dialogue between address service providers, users and governmental stakeholders to fill the legislation gap and to identify responsible agency Preparation of the European Address Infrastructure National Workshop (EURADIN)
hosted by FÖMI in Budapest Organising the EURADIN National Workshop in Budapest EURADIN project report completed for EUROGI LAPSI Involvement in Network on Legal Aspects of PSI and re-use - HUNAGI LAPSI team established involving the Prime Ministers‘ Office e-Government Centre, the Hungarian Federation of e-Content Industry, FÖMI, Neumann-House Nonprofit public company, Dr. Tamás A.Kovács Lawyer‘ Office and HUNAGI EU LAPSI project preparation meeting hosted by MoARD Attend LAPSI project kick-off meeting in Turin and reporting on the highlights at the 3rd LAPSIHU Team. Plan4all – Spatial Planning and INSPIRE Expert contribution to PLAN4ALL invited by WP leader Manfred Schenk in Rome Proposal to host a National Plan4all Workshop in Budapest submitted for EUROGI 3.3. Consultancy and advisor role 3.3.1.Policy issues
Land Management as driving force (planned int’l conference on Cadastre-SDI-
eGovernment scheduled for the EU Hungarian Presidency with suggested organisers EUROGI and EuroGeographics) Brainstorming on the possible events under the Hungarian EU Presidentship in first Semester of 2011 Talks with the Chair of the National Council of Communication and Informatics Talks with the eGovernance Center of the Prime Minister’s Office on the PSI and re-use
related project LAPSI Meeting with the President and Secretary of the Geosciences Committee of the
Hungarian Academy of Sciences in the subject Digital Earth 3.3.2 Consultancy and advise
Attend and promote Digital Earth at the Closing Meeting of the Hungarian National Committee on IYPE (2007-2009) hosted by the Hungarian Academy of Sciences
Attend and promote the application of GI/EO-related novel technologies at the Joint Board Meeting of the Hungarian Space Council and the Space Research Board arranged by the Hungarian Space Office.

International Conference SDI 2010 – Skopje; 15-17.09.2010
75
4. CONCLUSIONS Considerations regarding future developments needed in the INSPIRE context are as follow: Need for jointly agreed goals and approved strategy Need for interagency cooperation, framework and collaboration Need for INSPIRE compliant services, monitoring, reporting Need for dissemination of best practices and lessons learned (mostly via EU projects) There is an opportunity to share experiences with the Balkan Countries via the anticipated joint actions of EUROGI and Eurogeographics to organise an International Conference in the subject Cadastre – SDI – e-Government under the Hungarian EU Presidentship in the 2nd Quartars 2011. Note: recession opens often space for innovative thinking and motivating driver for cooperation The horizontal networking and international links strengthen cohesion, increasing competitiveness and - consequently - are equally beneficial for decision makers, INSPIRE compliance service providers and for the USERS. 5. REFERENCES Lévai P., 2009. Spatial Data. 1st National EURADIN Workshop in Budapest, 2 September 2009 Mikus D., 2010. INSPIRE. HUNAGI Conference, Budapest, 25 February 2010 (In Hungarian) Remetey G., 2010 Beyond INSPIRE: the Next Steps. EUROGI Members‘ Day, Brussels, 26 March, 2010 Spatial Data Interest Community Networking – HUNAGI in nutshell 7 April 2010 http://www.fomi.hu/hunagi/pdf/2004/FlyerApril7Aoldal.pdf and http://www.fomi.hu/hunagi/pdf/2004/Flyer7AprilBoldal.pdf 6. BIOGRAPHICAL NOTES OF THE AUTHORS
Graduated and postgraduated in Surveying and Automation in Geodesy, Budapest Technical University; Chief Counsellor, Department of Land Administration and Geoinformation, Ministry of Agriculture and Rural Development, Budapest 1986-2006; Head, Image Processing Lab, Remote Sensing Center, Institute of
Geodesy, Cartography and Remote Sensing, Budapest 1980-1986; Secretary General, HUNAGI, 1994-; Life membership in Hungarian Society of Surveying, Mapping and Remote Sensing, 1971-; Member in National Geographic Society (Washington DC), 1971-; Hungarian Astronautical Society; Bureau, UNECE WPLA, 2005-2006; Editorial Advisory Board, GIM (Lemmen) 1992-; Editorial Advisory Board, Int'l Journal SDI Research (Ispra), 2006-; Editorial Advisory Board, Int'l Journal Digital Earth (Beijing), 2006-; Member, National GEO Board, 2005-; Advisory Comm, Board of Directors and Secretary, GSDI Assoc., 1998-2009; INSPIRE Expert Group of the European Commission, 2002-2006; Permanent Committee on Cadastre in the EU, 2005-2006; Liaision, GSDI Assoc. in CEOS WGISS, 2006-; President, ISPRS Commission VII Resources & Environmental Monitoring, 1996-2000; Co-Chair, ISPRS WG VII/4 Human Settlements and Impact Analysis, 2000-2004; Co-Chair, ISPRS WG IV/1 SDI, 2004-2006; Head, UNSDI HUCO Budapest 2006-; Reviewer, EU Humboldt Project 2007-, Delegate in GEO on behalf GSDI Association (2007-2009) ; Member, ExCom Int'l Society of Digital Earth (2008); Correspondent, PSI Platform (2009).

International Conference SDI 2010 – Skopje; 15-17.09.2010
76
HELLENIC MAPPING AND CADASTRAL ORGANIZATION GIS
PORTAL – TOWARDS GREEK SDI
Theodoros VAKKAS1, Angelos TZOTSOS
2, John PETROGONAS
3
ABSTRACT
In this paper the development of the Hellenic Mapping and Cadastral Organization’s (HEMCO’s)
GIS portal in conjunction with the creation of the Greek Spatial Data Infrastructure is discussed.
HEMCO is a state organization under the auspices of the Ministry for the Environment, Energy
and Climate Change, owning a massive amount of geospatial data. Moreover, HEMCO is now
officially responsible for monitoring and implementing Inspire Directive in Greece. Although
Greek SDI’s development is at an initial state at the moment, HEMCO took some initial actions in
order to conform to the INSPIRE Directive and published its available spatial data through this
new portal.
In the context of a large scale project regarding the implementation of an Integrated Information
System for managing and publishing geospatial data, Organization succeeded in creating a
scalable infrastructure, introducing innovative functionality features, fulfilling at the same time
INSPIRE requirements as regards the availability of metadata for spatial data and the availability
of some basic network services. The implementation of the portal included digitization of more
than 100,000 datasets, creation of approximately 500,000 metadata files and publishing through a
geoportal with viewing and ordering capabilities. Also, customized software was implemented for
metadata creation and manipulation within the portal's database.
Future developments will include a full scale INSPIRE portal implementation which will be the
center node of the Greek SDI.
Key word: INSPIRE Directive, Metadata, Spatial Database, Intergraph, OGC Services.
1. INTRODUCTION
Hellenic Mapping and Cadastral Organization is a state organization, under the auspices
of the former Ministry of Environment, Physical Planning and Public Works, now
Ministry for the Environment, Energy and Climate Change. Main purpose of HEMCO
is the drawing up and maintenance of a positive cadastre for Greece, the geodetic
coverage and the mapping of the country, the enrollment and mapping of the natural
1 MSc. Theodoros VAKKAS, [email protected]
Geospatial Enabling Technologies Ltd., www.getmap.gr
Tel.: +30 210 66 64 192, Gsm.: +30 6936 950 603, Fax: +30 210 66 63 979.
7Α-Β Posidonos Av. & Lokridos Str., 18344, Moschato - Athens, Greece. 2 Eng. Angelos TZOTSOS, [email protected]
Geospatial Enabling Technologies Ltd., www.getmap.gr
Tel.: +30 210 66 64 192, Gsm.: +30 6932 149 344, Fax: +30 210 66 63 979.
7Α-Β Posidonos Av. & Lokridos Str., 18344, Moschato - Athens, Greece. 3 Eng. John PETROGONAS, [email protected]
Geospatial Enabling Technologies Ltd., www.getmap.gr
Tel.: +30 210 66 64 192, Gsm.: +30 6949 614 854, Fax: +30 210 66 63 979.
7Α-Β Posidonos Av. & Lokridos Str., 18344, Moschato - Athens, Greece.

International Conference SDI 2010 – Skopje; 15-17.09.2010
77
resources and the creation of a land and environment data base. Its jurisdiction
constitutes of:
o The responsibility to create basic and derivative maps, diagrams as well as to
update, revise and maintain them.
o The creation and maintenance of the Greek Cadastre, as well as the approval,
the coordination and the supervision of all the cartographic and cadastral
programs of the public sector.
o Executing of aerial photography and photogrammetric programs for public
services.
o The creation and maintenance of a Land and Environment Information System.
o The drawing up of specifications, regulations and prices for related works.
o The development of research and informatics regarding all the above fields.
o The execution on any additional project, necessary for the accomplishment of
its mission.
Moreover, HEMCO is responsible for monitoring and implementing INSPIRE Directive
in Greece.
During the last decades HEMCO became the owner of massive spatial datasets. For
instance, the archive of analog aerial photos contains more than 500,000 items, dating
from late 1930’s. Consequently, it was necessary for the Organization to obtain an
Information System which would provide it with the necessary means to manage,
maintain, protect and publish its geospatial data.
In this context, a project was designed, and the tender was awarded in the year 2009 to
ANCO S.A. and Geospatial Enabling Technologies Ltd. Due to the asynchronous
issuing of project specifications (late 2006) and INSPIRE Directive’s entrance into
force (May 2007), there were no predictions for an implementation conforming with the
Directive’s demands. During project’s implementation (2009-2010) though, it had
already become obvious on behalf of HEMCO’s administration that there were delays in
creating the Greek Spatial Data Infrastructure and that the project should be
implemented in a way that could be further utilized by the Greek SDI. The
implementation changes should be done with respect to the initial specifications and the
time schedule. That way, it was decided for a Metadata System to be developed and at
minimum, software supporting INSPIRE Network Services to be provided.
In this paper, the technical details of the portal are discussed and the technologies
behind this effort are presented. The structure of the paper includes the system
description in Chapter 2, the metadata system in Chapter 3, while conclusions are
discussed in Chapter 4.
2. GIS PORTAL - SYSTEM DESCRIPTION
In the tender at its initial form, HEMCO specified that the Information System’s design
and implementation should take into consideration the special needs of the Organization
for specific kind of geospatial data. A major consideration was the availability of more
than 500,000 aerial photographs, which are more than 95% of the overall Organization’s
data. Also, it should be taken under consideration that the system should include vector
data available from HEMCO to the public (free or through fees), and develop various

International Conference SDI 2010 – Skopje; 15-17.09.2010
78
automated procedures for ordering and easily obtaining data through the portal. At the
same time, the tender described an Information System that would include a database
system, a file management system and a web application. The web application would
integrate the file management capabilities within the database storage and publish at the
same time a web-GIS interface for viewing and ordering data and several SDI services
on top of this software infrastructure.
2.1. Spatial Datasets
The spatial data owned by HEMCO that should be included in the system were:
o Approximatelly 100,000 aerial photographs in films.
o Flight plans of 400,000 aerial photos in printed maps.
o Hand written journals of the flight missions including the majority of the
metadata for the aerial photos.
o Analog base maps covering the entire Greek territory.
o Data from Corine Land Cover 2000 program in digital and analog form.
o Analog diagrams from the Convention on Wetlands of International
Importance (Ramsar Convention).
o Digital Cadastral Maps.
o Geodetic network of Greece in digital form.
o Administrative units and boundaries of Greece.
o Various Topographic maps.
o Digital Elevation Models.
o Orthoimagery
Also, the project described that all digitized aerial photos would be processed and
included in photogrammetric projects in order to be oriented and included in the system.
So a new dataset that should be produced was the orientation project files.
All the data mentioned in the above list, are HEMCO's ownership and are distributed
exclusively by HEMCO to the public or to various government organizations.
2.2. Hardware Infrastructure
For the implementation of the Information System a medium setup of servers and
hardware was deployed. This included:
o A database server
o A file system server
o An application server
o A web proxy server
o Two Firewalls
o A 8 TB Storage System
This setup was suggested by the initial tender and could not be upgraded.
2.3. Software requirements
The software component of the Information System was initially described in the tender
in means of system functionality. The system should be able to include raster and vector
spatial data. Vector data should be maintained in the form of a spatial database and

International Conference SDI 2010 – Skopje; 15-17.09.2010
79
raster data should be maintained from a file system server in order to avoid multiple
copies within the Organization. Metadata should be maintained within a database after
implementing an ISO 19115 compliant schema for storing and discovery purposes. At
the same time, a data schema should be implemented in the database to be linked to the
file system management for raster files and tables including vector data.
2.3.1. Database system
The database system of the Information System included 4 schemas and was
implemented using Microsoft SQL Server 2005 technology. Upon this technology,
various steps of logical and physical design of the database were performed in order to
include the appropriate representations and data structures needed for the portal
functionality.
The first schema implemented included the tables, stored procedures, triggers etc, for all
the vector data information. This schema was build around a central table holding the
link between all databases of the Information System. This table holds information
about the identification of files in the system, as well as identification for metadata
elements and even identification for a single record of data, such as a line, a point, a
polygon or a raster file. This way, any reference to each of these elements could lead to
discovery of all other connected components of the system. For example, the link
between metadata and data is based on the common record in this central data table.
The second database schema supported the Metadata System. This was implemented
using the technical guidelines of INSPIRE and was compliant with the ISO 19115 and
19139 standards. This database schema was implemented by Intergraph Coorporation
and especially Intergraph Poland as part of their SDI Pro software. After an extended
period of testing and implementing linkage to the main schema of the database, the
schema for metadata was finalized. Details on the metadata system developed for this
portal, are presented in Chapter 3.
The third database schema included the file management system. This schema
incorporated a model that links all physical files and folders to virtual files and folders
within a virtual space in the Organization's network . This was to ensure that all
members of the Organization would have appropriate and secure access to the data files
and that the administration of those data would be centralized. Also, another goal of this
system was to avoid data replication to many client workstations. Every file in the
system receives a special physical file ID (TSID) and this is linked in the main table of
the first database along with metadata identification and database identification. This
way, not only a member of the Organization can find the data of a specific dataset, but
also in a single step query, can discover the metadata as well as the originating physical
files of the dataset.
Finally, the fourth database schema included the portal functionality, all the tables
needed to implement ordering of data, automated processing of orders, pricing policy
and automation of procedures (workflow) for the Organization. This functionality was
modeled and implemented to a database representation to facilitate the portal's
functionality.

International Conference SDI 2010 – Skopje; 15-17.09.2010
80
2.3.2. GIS and File Management System
As stated previously, all data were organized in several database schemas, in order to
provide the required functionality. This led to a disadvantage of the system architecture,
which was the complexity of the database. This complexity was not only in the data
themselves, but also in the procedure required in order to insert the data into the
database. To overcome this problem, a number of custom applications was developed to
automate the insertion of the data into the database. For every kind of dataset/dataset
series, a custom application (Figure 1) ensured that all the related tables in the data,
metadata and file management system schemas would be updated correctly during data
insertion. These applications were developed with the .NET framework upon the
Intergraph's APIs (GeoMedia and TerraShare).
Figure 1. Custom Applications for data insertion
The main GIS platform for the Information System was GeoMedia Professional. This
platform was used for vector data manipulation, preprocessing and translation. Then the
custom applications were used for data insertion into the database for further use by the
portal's Web GIS application, as well as the INSPIRE web services. All processing of
raster data was performed in Intergraph's Image Station Software family.
Moreover, all physical files (raster and vector) were inserted to the file management
system, implemented upon Intergraph's TerraShare technology. This technology
provided the infrastructure to organize the spatial data files within the HEMCO's
network and, as mentioned before, provide secure access to the data, while avoiding
data duplication. At the same time, this system provided the capability to spatially
enable generic digital file storage (such as word files or pdf files) within the
Organization. Through the file management system, all ordering transactions on the data
were performed faster, all data files could be recovered through queries in the database
and the virtual network space was available to the end user (Figure 2) as well as to the
portal through a common software interface.

International Conference SDI 2010 – Skopje; 15-17.09.2010
81
Figure 2.File Management System -Terrashare
2.3.3. Web Applications
The third main part of the Information System was the Web portal itself. This included
the main Web GIS application for viewing and ordering data (Figure 3) as well as a
content management system and INSPIRE compliant web services (Viewing and
Discovery Services based on Web Map Service [WMS] and Catalog Service [CSW] of
Open Geospatial Consortium [OGC]). It should be noted that viewing aerial photos is
performed by an on the fly interpretation of photogrammetric data, resulting in a
correctly oriented in geographical space aerial photo.
Figure 3. Web GIS Portal
The main Web application, since the initial project specifications required specific
functionality for searching and ordering data, was implemented using the Intergraph's

International Conference SDI 2010 – Skopje; 15-17.09.2010
82
WebMap technology accompanied with the TerraShare Web module for fast raster
rendering through the Web and SVG for rich vector representation over the browser.
The main functionality includes selection of data type for searching, location selection
(through text or through spatial queries), and selection based on attribute queries (such
as scale, temporal extend etc). It should be noted that the main application was not
implemented using the INSPIRE technical guidelines for data discovery, since this
document was not available when the tender was formed, several years ago. This
resulted into different functionality specification (lack of search criteria like keywords
in data search capabilities) which was not permitted to modify for legal reasons.
To compensate this, a full Discovery Service (CSW 2.0.2 ISO Profile) was implemented
using the SDI Pro software, so that a third party application (or other catalog service) to
be able to consume (or harvest) all the available metadata infrastructure (more details in
Chapter 3). Using this catalogue service, all INSPIRE compliant queries can be
executed. As far as the viewing services are concerned, a WMS service was also
implemented using SDI Pro software, so that HEMCO’s data can be accessed by third
party appications.
3. INSPIRE METADATA SYSTEM
The implementation of INSPIRE Directive’s specifications as regards metadata are
recorded in the corresponding regulation, that is Commission Regulation (EC) No
1205/2008 of 3 December 2008. This document in conjunction with ISO Standards
(ISO 19115, 19119, 19139) and the INSPIRE Implementing rules were the basic
guideline during the development of the metadata system.
HEMCO’s Metadata System was designed in order to be able to support:
o creation of metadata files
o editing of metadata files
o validation of metadata files
o central management of metadata
o metadata discovery
Special attention was given to provide the system with the ability to perform in a
massive way. HEMCO’s Metadata System is based on custom applications developed
by GET Ltd and software provided by Intergraph.
3.1. Applications for Metadata Creation
Metadata Editor (Figure 4) and Batch Metadata Creator (Figure 5) are desktop
applications that were implemented in order to create metadata files in XML format,
conformant with the INSPIRE implementing rules.

International Conference SDI 2010 – Skopje; 15-17.09.2010
83
Figure 4.Metadata Editor
These applications were designed to provide users with an interface similar to the
prototype web application of the Inspire Geoportal, grouping relevant metadata
elements in separate tabs. Both of the applications encapsulate the same functionality
with Batch Metadata Creator providing users with the extra feature of creating metadata
files in a massive way. That is a very useful feature, especially when some or most of
the metadata elements values to be provided are the same (e.g. organization responsible
party, role, scale). In such a case, users have to fill only once the metadata elements that
share the same values (for all the spatial datasets opened) saving time in an operational
environment.
Through the applications all the mandatory metadata elements according to the Inspire
Metadata Implementing Rules must be filled prior to saving a metadata file. At the same
time, a validation mechanism facilitates the error
Figure 5.Batch Metadata Creator

International Conference SDI 2010 – Skopje; 15-17.09.2010
84
control and handling. All drop down lists included in the applications contain elements
that populate the corresponding xml elements with valid values, through a translation
executing at saving the file time.
An extra feature of the applications is that they can be used to open files containing
geospatial data in various formats (Geotiff, JPEG2000, JPG, ERDAS IMG, ESRI SHP,
ER-MAPPER ERS, DTM) and automatically extract their bounding box in the WGS84
LAT/LON system (EPSG code 4326).
3.2. Applications for Metadata Editing
Revising or modifying metadata is a common task in an operational environment where
data correction/update takes place. Moreover, metadata creation was proven to be an
error prone procedure and at all events, human errors cannot be excluded. Metadata
Editor and Batch Metadata Editor (Figure 6) were developed to meet especially these
needs.
While Metadata Creator can be used to edit/create only one metadata file at a time
Batch Metadata Editor facilitates the correction/replacement of metadata element values
in batch mode. In particular, after metadata files to be edited are loaded, new or correct
value of metadata elements are provided. The application is then replacing the value in
all metadata files, given that the validation mechanism is always supporting the
procedure.
Figure 6.Batch Metadata Editor
3.3. Applications for Metadata Validation
As already being noted, custom applications described in sections 3.1 and 3.2 provide a
validation mechanism against INSPIRE Metadata Implementing Rules. In addition,
Geomedia Catalogue Admin – GCA (Figure 7) was used to validate metadata created.
This application is part of Intergraph’s Catalogue Service implementation software used
mainly for importing metadata in a relational database schema. GCA provides the extra

International Conference SDI 2010 – Skopje; 15-17.09.2010
85
feature of validating also against ISO 19115 Standard. GCA comes with an application
programming Interface that was used to interact with the database schema (described in
the following section).
Figure 7. Geomedia Catalogue Admin
3.4. Metadata Database Schema
All metadata files were stored in a metadata warehouse (file system) managed and
linked to the spatial datasets through the File Management System (Terrashare). In
order to support network services implementation and utilize the advantages a
Relational Database Management System (RDBMS) offers like central management,
support of multiple applications, security etc, a relational database schema was formed.
The ISO 19115 metadata conceptual model is captured in a hierarchical structure of
database relations (tables), while a set of stored procedures, triggers, sequences is used
to support the mapping of UML concepts to the relational schema. The database schema
includes a table where the entire xml metadata files are stored. Updating database is
based on the retrieval of the desired record (metadata file) and re-importing the file.
3.5. Catalogue Service
HEMCO’s metadata were initially accessible through the Web GIS application in means
of a service providing access to the corresponding metadata of features selected by the
user (Figure 8). In addition to that, Intergraph’s Catalogue Service was implemented.
The Service is compliant with the OGC CSW 2.0.2 ISO Profile, but it was decided that
the final form would be instantiated in the Greek SDI node.

International Conference SDI 2010 – Skopje; 15-17.09.2010
86
Figure 8. Metadata access
4. CONCLUSIONS
HEMCO achieved to create a modern, scalable hardware and software infrastructure,
making it capable to manage and publish its geospatial data in an efficient way.
Through the project implementation, HEMCO managed to automate many of its
internal procedures while obtaining valuable know-how on enterprise spatial systems
and SDI technologies. Also, HEMCO became the first organization in the Greek public
sector, possessing INSPIRE compatible metadata files, validating its state as the official
INSPIRE implementer in Greece. In this way, the Organization met an initial goal
which was the availability of metadata for its own data.
While there have been delays at the Directive’s implementation (mainly due to the lack
of an appropriate legal framework), HEMCO was able to support and provide rest of the
public sector’s owners of geospatial data with valuable expertise and tools about
metadata creation, promoting the effort to conform with the Directive’s demand for
availability of metadata for spatial data themes of Annex I and II of the Directive by
December 2010. Already, the second large spatial data owner, the Ministry of Rural
Development and food is using the same tools to develop a similar infrastructure and
publish its metadata to the public.
Finally, in a wider context of its initiatives, HEMCO utilized its infrastructure in order
to follow the monitoring and reporting guidelines. Future developments will include a
full scale INSPIRE portal implementation (on hardware and software infrastructure)
which will be the center node of the Greek SDI.

International Conference SDI 2010 – Skopje; 15-17.09.2010
87
5. REFERENCES European Commission, 2007. Directive 2007/2/EC of the European Parliament and of the Council
of 14 March 2007 establishing an Infrastructure for Spatial Information in the European
Community (INSPIRE). Official Journal of the European Union. European Commission.
European Commission, 2008. Commission Regulation (EC) No 1205/2008 of 3 December 2008,
implementing Directive 2007/2/EC of the European Parliament and of the Council as regards
metadata. European Commission.
Drafting Team Metadata and European Commission Joint Research, 2009. INSPIRE Metadata
Implementing Rules: Technical Guidelines based on EN ISO 19115 and EN ISO 19119,
European Commission.
International Organization for Standardization (ISO), 2003. ISO 19115:2003 Geographic
information Metadata. ISO.
6. BIOGRAPHICAL NOTES OF THE AUTHORS
Theodoros Vakkas works as a spatial systems engineer at
Geospatial Enabling Technologies Ltd. He is member of the
consulting comittee for the implementation of the INSPIRE
Directive in Greece. He holds an M.A. in Geoinformatics and a
Rural and Surveying Engineering Degree, from the National
Technical University of Athens. He is specialized in metadata and
he is expierienced in geospatial systems implementation. His
interests involve spatial database systems and geodesy.
Angelos Tzotsos is a software engineer at Geospatial Enabling
Technologies Ltd. He specializes in OGC web services and Open
Source Software. He is currently a PhD candidate in Remote
Sensing at the National Technical University of Athens and holds a
Rural and Surveying Engineering Degree. His research interests
involve remote sensing, object-based image analysis, computer
vision, machine learning, expert systems and spatial web services.t

International Conference SDI 2010 – Skopje; 15-17.09.2010
88
WEB-BASED GIS SYSTEM: A CASE STUDY FROM SLOVENIA
Daniela STOJANOVA 1
Tom LEVANIČ 2
ABSTRACT
Large amount of geographical data have been used more and more in many areas in
different application domains, such as government, telecommunications, utilities,
cadastre, land management, environment and ecology. Recently, the internet technology
is moving Geographical Information Systems (GIS) towards Web based applications,
providing more visual information for the end users and simplifying the interaction
between users and GIS. We present a web based information system that has been
developed by the Slovenian Forestry Institute in order to promote the hunting
community in Slovenia. This information system facilitates the hunting in terms of
providing online up-to-date information on various dispossessions of species on
different locations. The information is made available at three different levels i.e.
Country level, where the information are aggregated at national level; Hunting region
level where the information is aggregated at district-wise; and at Hunting communities
level where the information is aggregated village-wise. The application follows
OpenGIS Standards compliant for Web Feature Service (WFS) and Web Map Service
(WMS). The data is stored in a spatial database. The output formats includes tables,
graphs and maps products (Google Earth, GEORSS, Shapefiles, raster image formats,
pdf, etc.). All presented data are extensively equipped with their metadata description,
so as to enable delivery of exact information to the end user. Technologies like HTML
and JAVA scripts are made use of for designing the client end interfaces. The Web GIS
based applications constitute the new paradigm of distributed applications, that
combines the best aspects of the development of components and the development web
using standard GIS protocols and data formats of generalized use to obtain
multiplatform integration.
Key word: Web GIS, WMS, spatial data, cartography, open source software.
1. INTRODUCTION Large amount of geographical data have been used more and more in many areas in
different application domains, such as government, telecommunications, utilities,
cadastre, land management, environment and ecology. Along with process, the set of
1 Msc. Daniela STOJANOVA, [email protected]
Slovenian Forestry Institute, www.gozdis.si
Tel.: +386 1 200 150, +386-1-200 7800, Gsm.: +386 40 184 826, Fax: +386 1 257 3589
Večna Pot 2, 1000 Ljubljana, Slovenia.
2 Doc Dr. Tom LEVANIČ, [email protected]
Slovenian Forestry Institute, www.gozdis.si
Tel.: +386-1-200 7800, Fax: +386 1 257 3589
Večna Pot 2, 1000 Ljubljana, Slovenia.
International Conference SDI 2010 – Skopje; 15-17.09.2010
89
available GIS applications and its complexity is increasing as well. The applications
have many advanced functionalities and capabilities that make them on one hand very
easy and fast to use and very difficult for beginners especially having to deal with
application specific menus and procedure steps.
Recently, the internet technology is moving Geographical Information Systems
(GIS) towards Web based applications, providing more visual information for the end
users and simplifying the interaction between users and GIS.
In this study, we present OSLIS Information System (Central Slovenian
Hunting Information System), a web based information system that has been developed
and maintained by the Slovenian Forestry Institute. The development of the system was
guided by an initiative of the Ministry of agriculture, forestry and food of Slovenia to
set up and provide public services i.e. to display and share information on the hunting
activities and conditions in Slovenia. The system is based on two expertises (Jerina,
2008; Levanič and Stojanova, 2009).
The main objective of the system is connecting existing geographically-
referenced information to the GeoWEB using open standards and operating as a node
within a free and open Spatial Data Infrastructure (SDI). In addition, it promotes the
hunting community in Slovenia by enabling access to game information for the general
public. Instead of using the GIS functionalities of the expensive commercial solutions
(such as Arcview/ ArcInfo, MapInfo, etc.), the system combines open-source Web GIS
solutions and spatial database functionalities providing technical and data support for
preparation of wildlife management plans and reports. OSLIS is available at
http://oslis.gozdis.si.
The OSLIS system is an umbrella system, intentionally designed to serve as a
platform for joining multiple external data about the game, collected by hunters on the
field. The system architecture is intended to combine a large amount of data by
receiving data from several databases once a day. The data is then integrated and stored
in a spatial database, so it can be queried on the fly. Data entry and verification happens
at the database level, thus OSLIS is not intended for data entering, data maintenance and
does not guarantee data quality. The system is capable of aggregating and displaying the
external data in an organized form, either as a map, graph or table. In this way, the users
can exploit this advantage of using web services to interactively connect to the spatial
data and use it in an efficient and flexible way.
The information is made available at three different levels i.e. Country level,
where the information are aggregated at national level; Hunting region level where the
information is aggregated at district-wise; and at Hunting communities level where the
information is aggregated village-wise.
The system provides support for planners in the creation of wildlife
management plans in a way that it provides outputs (maps, graphs and tables) in the
range and quality that have not been available until now. In terms of preparation of the
wildlife management plans, the system follows the National Rules on the content of
wildlife management plans. Other wildlife management plans’ activities like analysis of
past management, evaluation of the status of populations and wildlife habitats,
assessment of the ecological balance and consistency with the natural environment, can
also be supported and simplified by the use and analysis of the output results of the
system. In future, we expect that the system will support and follow the forthcoming
national legislature for annual hunting region plans.

International Conference SDI 2010 – Skopje; 15-17.09.2010
90
In the process of system development we were aware of the fact that the
system is only as useful as the programs that underlie its operation, so we established
OSLIS as an open-source system for which users do not pay licensing. Due to the use of
open-source components, OSLIS is accessible to all users free of charge. The system is
completely independent from the operating system. The access to the OSLIS system
requires minimum software and GIS knowledge.
The paper is structured as follows. Section 2 gives a brief overview of the
technology used to build the system. Section 3 describes the functionalities of the
OSLIS system while Section 4 discusses our concluding remarks and further issues that
are currently under investigation.
2. TECHNOLOGY
The OSLIS Information System is a Web GIS application build on free and open source
platform Geoserver (http://geoserver.org/). GeoServer is a Java-based software server
that allows for great flexibility in map creation and data sharing by using open standards
set forth by the Open Geospatial Consortium (OGC) (http://www.opengeospatial.org/).
GeoServer aims to operate as a node within a free and open Spatial Data Infrastructure
(SDI).
The main characteristics of GeoServer include:
- Creation of maps in a variety of output formats (WFS, GML, KML, SVG,
PDF, GeoRSS, JPEG, PNG, Geotiff, OGR Output – MapInfo Tab and
MID/MIF, Shp, CSV, GeoJSON, etc.), by implementing the Web Map Service
(WMS) standard. WMS is a standard protocol for serving georeferenced map
images over the Internet that are generated by a map server using data from a
GIS database.
- Quick and easy map generation enabled by OpenLayers, a free mapping library
integrated in GeoServer.
- Publishing data from any
major spatial data sources such as GeoTIFF, ArcGrid, MapInfo, external WFS,
WorldImages, ImageMosiacs, Image Pyramids, Erdas Imagine, Shapefile,
ArcSDE, GML, DB2, MySQL, SQL Server, VPF, PostGIS and Oracle.
- Sharing and editing data that are used to generate maps, by conforming to the
Web Feature Service (WFS) standard. WFS specification is an interface
allowing requests for geographical features across the web being highly
interoperable.
- Freeing your data and permitting greater transparency. This allows distributed,
decentralized structure of geospatial data.
- GeoServer can connect with traditional GIS architectures such as ESRI
ArcGIS, MapInfo, etc.
- It is free software. This significantly lowers the financial barrier to entry when
compared to traditional GIS products.
- It is also open source. Bug fixes and feature improvements in open source
software are greatly accelerated when compared to traditional software
solutions.
Having GeoServer as the major component, OSLIS incorporates all of the above
mentioned characteristics. In particular:
International Conference SDI 2010 – Skopje; 15-17.09.2010
91
- It employs WMS and WFS standards for map dynamic map creation and
sharing.
- PostGIS (http://postgis.refractions.net) is used as a data source for web
mapping. PostGIS is an extension to the PostgreSQL
(http://www.postgresql.org/) open source object-relational database system that
allows GIS (Geographic Information System) objects to be stored in the
database. PostGIS data can be exported to several output GIS formats such as
Shapefile and MapInfo.
- The output formats includes tables, graphs and maps products. The data is
displayed on the popular mapping applications Google Maps, Google Earth
and Yahoo Maps.
- All presented data are extensively equipped with their metadata description, to
enable delivery of exact information to the end user.
- Technologies like HTML, XML and Javascript are used for designing the
client end interfaces.
The main advantage of the OSLIS system is that it represents a WEB GIS
application that combines the best aspects of the development of web components using
standard GIS protocols and the data formats of general use.
Another advantage of the OSLIS system is that it incorporates all of the above
mentioned characteristics of the Geoserver platform within a simple web portal solution.
The user can take advantage of the technology aspects without any previous
technological or GIS knowledge. The system is easy to use and the generation of maps
on user request very fast.
3. FUNCTIONALITY
Web services are set up by the public sector for several reasons: to share
information with other public sector organizations, to inform citizens and the private
sector and to market public sector information.
Our system tends to promote the hunting in Slovenia in terms of providing online up-to-
date information on various dispossessions of species on different locations and sharing
information on the hunting activities to the general public as well to the hunting
specialists. The general public has a limited access to the information while the
professional public has unlimited access to all available information, protected via valid
username and password.
The user can find information on the number of withdrawal:
- per hunting species, e.g. information on the number of withdrawal per animal
species in particular period, the number of withdrawal per animal sub-category
within a specific hunting species in particular period, the number of animals
that died from a specific disease in particular period, the number of animals
that were driven over on highways or railways in particular period, the period
of maximum withdrawal per species, etc.
- on different hunting locations,
- for different type of loss, e.g. the number of animals that died from disease in
particular period, the number of animals that were driven over on a highway or
a railway in particular period, etc.
- per different type of disease,
- in comparison to the number of planned withdraw etc.

International Conference SDI 2010 – Skopje; 15-17.09.2010
92
The information is made available at three different levels i.e. Country level, where
the information are aggregated at national level; Hunting region level where the
information is aggregated at district-wise; and at Hunting communities level where the
information is aggregated village-wise. The system is capable of displaying information
on the hunting activities in form of tables, graphs and interactive maps on all three
levels.
The information is available in form of maps, graphs and tables:
- Cartographic printouts
- Tabular printouts
- Graphical printouts
3.1. Cartographic printouts
The map output consists of several vector and raster layers in different geo-reference
coordinate systems, displayed one over another. The information on the withdrawal of
the hunting species is given by vector point layer, while the information on the hunting
communities, hunting regions and couture of the Slovenia is given by vector polygon
layers, both in the Gauss-Krueger coordinate system. By default, the base layer is the
Google's physical layer which is a natural map of roads, rivers and similar attributes
given in World Geodetic System (WGS84). In addition, selection of more raster
cartographical base layers is possible. Thus, the user can choose among Google's layers
(satellite, terrain, streets and hybrid) with spatial resolution up to 0.5m and Landsat
layers with 30 x 30 m resolution. Note that Landsat satellite image quality is very poor,
especially it is not suitable for zooming options and detailed view.
Figure1: A map for the withdrawal of wild boar in Slovenia in the year 2009. The size of the red
dots shows the amount of withdrawal. The cartographical raster basis layer is the
Google’s physical layer.

International Conference SDI 2010 – Skopje; 15-17.09.2010
93
The demonstration maps (Figures 1 - 2) present some of the possible maps
generated by the OSLIS system. Figure1 presents the withdrawal of wild boar in
Slovenia in the year 2009 whereas Figure2 presents the withdrawal of deer in Slovenia
in the year 2009 in the Novo Mesto hunting region. The cartographical raster base layer
given in Figure1 is the Google’s physical layer whereas the base layer presented in
Figure2 is the Google’s hybrid layer. The amount of removal is illustrated with the size
of a red dot. Minimum dot represents a withdrawal from 1-5 animals and the maximum
red dot represents a withdrawal of more than 10 animals.
Figure2: A map for the withdrawal of deer in Slovenia in the year 2009 in the Novo Mesto
hunting region. The size of the red dots shows the amount of withdrawal while the
violet couture line shows the Novo Mesto hunting region. The cartographical raster
basis layer is the Google’s hybrid layer.
The user can adjust positioning and zooming options. It is possible to display
and print maps up to A0 printer format, or to store them in several output formats such
as PNG, EPS or PDF.
3.2. Tabular printouts
In addition to map printing option, the system also enables users to print and export
tables according to predetermined criteria (e.g., geographical levels, species, type of
disease, type of loss, etc). Tabular printouts are a good tool for analyzing different
combinations of attribute and calculation data. Some predefined printouts are available
to the general public while the experts have opportunity to choose among all possible
different combinations supported by the system. Currently, the database contains data
for the last 5 years. Data before 2005 are unreliable in spatial context as well as
incomplete.

International Conference SDI 2010 – Skopje; 15-17.09.2010
94
3.3. Graphic printouts
Similarly as the maps and tables outputs, the graphical printouts are possible for various
combinations of possible attributes (type of disease, type of loss, type of of animal
species, spatial level, time periods, etc.). The graphics can be exported into standard
graphical formats like PNG, PDF or EPS. This allows very ease integration of high
quality graphs in reports and expertise which is very important for the support of the
wildlife management planning.
The structure of the fox withdrawal for the period from 2005 to 2010 in
Slovenia is preseted in Figure 3. The male population withdrawal is given on the left
group bar (labeled as samci) while the female population withdrawal is given on the
right group bar of the graph (labeled as samice).
Figure3: The structure of the fox withdrawal for the period 2005-2010 in Slovenia. The
male population withdrawal is given on the left group bar (labeled as samci = male)
while the female population withdrawal is given on the right group bar of the graph
(labeled as samice = female). Lower values in 2010 contain only data from January till
April.
CONCLUIONS
Web services are set up by the public sector for several reasons: to share information
with other public sector organizations, to inform citizens and the private sector and to
market public sector information. In this study, we present OSLIS - a web based
information system that has been developed and maintained by the Slovenian Forestry
Institute. It is focused on connecting existing geographically-referenced information to
the GeoWEB using open standards and operating as a node within a free and open
Spatial Data Infrastructure.
The need for this kind of system has arisen from the need to share information
on the hunting activities in Slovenia with the general public, inform the public about the

International Conference SDI 2010 – Skopje; 15-17.09.2010
95
current status of the hunting activities as well as to promote and popularize them.
Beside the general public, the system is also intended to serve to hunters and hunting
specialists. All of them have different access rights to different kinds of information that
are interesting and appropriate for them. The system encloses all kinds of species that
can be found on the national territory of Slovenia. The species that are considered for
hunting have been determinate by the official law of Slovenia.
We believe that information from the system can offer IT support to decision
makers and wild management plan makers in both the long and short-term management
plans for the game. The support provide from the system is prearranged in accordance
with the Rules on the content wildlife management plans. In the segment of long-term
plans, the data from the OSLIS may be utilized in the development of hunting region
management plans and activities, assessment of the state population and in assessment
of the ecological balance and consistency. On the level of short-term wildlife
management plans, the use of the information support offered by the OSLIS system in
directed in preparing short-term assessments, analysis, guidelines and measures.
ACKNOWLEDGEMENTS
This article has been written as part of the activities of the project “Public forestry
service”, financed by the Ministry of agriculture forestry and food of Slovenia.
REFERENCES
Jerina, K., 2008. Vrednotenje podatkov osrednjega slovenskega lovskega informacijskega
sistema. Ekspertiza, Biotehniška fakulteta, Oddelek za gozdarstvo in obnovljive gozdne vire,
Ljubljana 2008.
Levanič, T. Stojanova D., 2009. Sistem OSLIS – Informacijska podpora načrtovanju upravjanja z
divjadjo. Ekspertiza, Gozdarski Inštitut Slovenije, Ljubljana, 2009.
BIOGRAPHICAL NOTES OF THE AUTHORS Daniela Stojanova is a reseach assistant at the Slovenian Fresty
Institute. She received Master of New Media and E-science at the
Jozef Stefan Postgraduate School in Ljubljana, Slovenia in 2009.
She has experience in research projects and web-based GIS
applications, interests in Machine Learning and Data Mining,
relational and spatial databases and Remote Sensing.

International Conference SDI 2010 – Skopje; 15-17.09.2010
96
EXPANSION OF THE POPULATION IN KOSOVO BY GRID
AND CONSTRUCTION OF WEBGIS IN STATISTICAL OFFICE
OF KOSOVO
Rrahman TARA1, Idriz SHALA
2
ABSTRACT Statistical Office of Kosovo was appointed as a leading unit in terms of two spatial themes
mentioned in appendix III: “Statistical units”, and Population distribution – demography”.
Furthermore, the point assignment will allow easy processing of statistical data in any area,
including grid system. Geographical grid systems are included in Annex I, which means that
they are considered as reference data. The INSPIRE data specification on Geographical grid
systems has been prepared following the participative principle of a consensus building process.
In this workshop we will present the method of collection of data for the creation of GRID Map
of Household and Population Data in Kosovo as well as the content of WebGIS system in
Statistical Office of Kosovo that is of key importance for dissemination of statistical
information. A new production method for grid statistics which is based on a relational database
started adopted at Statistical Office of Kosovo. In the new production method the compilation of
grid statistics is based on the location data of buildings. Various attribute data on individual
persons, households, buildings and dwellings can, with the help of links between tables, be
assigned to specific buildings.
Key word: WebGIS, GRID, INSPIRE
1. INTRODUCTION
In this paper we shall make the description of geo-database for population census,
implementation and management of this database, procedures for update of
Enumeration Areas and data dissemination via GRID model.
Until now the data at Statistical Office of Kosovo (SOK) have been published in
aggregated form by municipality and settlement level. Grid as a new method to be
implemented at SOK shall help in dissemination of statistical data with a higher spatial
accuracy.
In addition to data on the number of households and number of population that have
been entered into grid form, it’s expect that in the near future to have other types of
statistical data such as social, economic, agricultural and demographic statistical data
that can be analyzed and disseminated through grid.
1 Rrahman TARA, [email protected], [email protected]
Statistical Office of Kosovo, www.ks-gov.net/esk
Tel.: +381 38 235-111, Gsm.: +377(0)44 443 064.
Str. Rr.. Zenel Salihu, nr.4, 10000 Prishtina, Kosovo. 2 MSc. Idriz SHALA, [email protected], [email protected]
Statistical Office of Kosovo, www.ks-gov.net/esk
Tel.: +381 38 235-111, Gsm.: +377(0)44 366 434.
Str. Rr.. Zenel Salihu, nr.4, 10000 Prishtina, Kosovo.

International Conference SDI 2010 – Skopje; 15-17.09.2010
97
Statistics Kosovo encourages the development of spatially referenced statistics.
Statistics Kosovo is participating in the GEOSTAT project which aims to create a
standardized demographic distribution of the total population by 1 km² grids for all
Europe.
Statistical Office of Kosovo joined the European Forum for Geo-statistics and is taking
an active part in the GEOSTAT project, according to the INSPIRE directive the
Geographical grid systems from Annex I are included as well. Grid-based population
models have considerable advantages for population representation, offering more
meaningful representation of settlement and neighborhood pattern, including the
geography of unpopulated areas, and providing stability through time. As a result,
gridded models have seen extensive use where population must be integrated with
environmental phenomena.
2. NEW DATA PRODUCTS: ESTIMATES DATA AND GRID MAP
Creation of the map representing the population distribution via Grid method and with
the help of GIS for the whole territory of Kosovo is of special importance not only for
the statistical statistics but also for the Kosovo’s society in general. This map would
contribute in enrichment of the national geo-database and GIS.
In this paper we shall present the methods and the approach of creating the data and
creation of dissemination of population based on the Grid 1km x 1 km.
After the digitalization of buildings from the orthophotos of 2004 and update of them
based on the satellite images of 2008, Statistical Office of Kosovo has gathered data on
the number of households, number of inhabitants and other statistical data for every
single building in Kosovo. These gathered data / information shall serve as a base for
conducting a successful population census in Kosovo.
Following the digitalization and data gathering processes, all the information have been
entered into GIS and therefore on this base of the thematic map has been created and
presented in 1km x 1km Grid.
All these information have been collected directly from the households using door to
door method. Initially it was created the centroids with X, and Y values and the number
of inhabitants for each centroid of the occupied buildings, followed by the creation of
the link of them with each specific 1 km x 1 km grid and finally it was created the
vectorial base (grid with data on the number of inhabitants).
Figure 1: Data producing process - from points to grids

International Conference SDI 2010 – Skopje; 15-17.09.2010
98
Grid map 1km x 1km is created using WGS_1984_UTM_Zone_34 NH. File format
MapInfo+dBase-format
Table 1. No of Grids by number of Inhabitants
Inhabitans per individual square kilometre No
1-10 523
11-50 1276
51-100 831
101-250 1248
251-750 1243
750 or more 447
Uninhabited 5774
Total 11342
Main objective for mapping and GIS unit is a harmonized dataset of population
distribution. Population grid data is listed in the Annexes of the INSPIRE Directive.

International Conference SDI 2010 – Skopje; 15-17.09.2010
99
Map 1: Kosovo grid population map 2009 – this poster is presented in European Forum for
Geostatistics held in October 2009, at Hague Statistics/ Netherlands1
1 European Forum for Geostatistics (2009) http://www.efgs.ssb.no/

International Conference SDI 2010 – Skopje; 15-17.09.2010
100
Map 2: Geostat Population Map 2010 – this poster is presented in Eurostat, Working
party/meeting Geographical Information Systems for Statistics organized in Luxembourg, March
2010.
This map was updated in beginning of 2010 by European Statistics incorporating data
for some other countries among them was Kosovo also.

International Conference SDI 2010 – Skopje; 15-17.09.2010
101
Figure 2: is presented at Geostat Population Map 2010, data on Kosovo are provided by
Statistical Office of Kosovo / Cartography and GIS unit
GI initiatives in Europe for the standardization of spatial data in the field of statistics is
to crate EU – wide population grid maps from the 2011 census and to develop a
methodological framework for geo-coding population mapping on km grids.
(http://www.efgs.info).
SOK has now started with some existing comprehensive country data to harmonize the
data according to these standards. After a Population Census to be held in Kosovo in
2011 all data will be geo-coded and will be used according to specific topics in the field
of statistics according to INSPIRE directive to contribute in building of the National
Spatial Data Infrastructure (NSDI) of the Republic of Kosovo.
3. CREATION OF WEBGIS AT STATISTICAL OFFICE OF KOSOVO
Statistical Office of Kosovo (SOK) for the first time in 2009 has created the Web GIS.
The users of the Web GIS are meant to be SOK, other public institutions of Kosovo and
the general public. Initially the Web GIS is designed in Albanian language only.
SOK through the Web GIS shall offer updated statistical data that shall be of a wide use.
Web GIS in addition to offering various statistical data it also offers the possibility of
analyzing the special statistical information based on the SQL and other methods of
analysis such as creation of technical maps based on demographic and socio-economic
structures, measure of lengths, creation of buffers, selections according to themes and
grouping of information according to specific standards etc.
* Web GIS is based on the MapInfo and ESRI technology.
* All the layers presented in the Web GIS are in the coordinative system UTM-
WGS 1984 Nh.
* Statistical Data that shall be presented in WebGIS are taken from the statistical
data published by SOK.
Procedures for construction of the SOK web-gis have been completed, now web-gis is
in a function of different users through this link www.ks-gov.net/esk. After

International Conference SDI 2010 – Skopje; 15-17.09.2010
102
completing the Census, the web-gis will be updated and enriched with various statistical
information. Statistical data will be presented in the aggregated form according to the
level of municipality, settlement and Grid.
3.1. Platform
* Web Application dedicated to SOK
* User friendly with .NET technology
* Queries features and view results in map view
* Results in tabular and map format
* Fast, good image/map quality
* Image size limited only by server capabilities
* User ESRI/MapInfo files
3.2. The map layers
Territorial division (Kosovo, municipalities, settlements, Grid 1 km x 1km) .
3.3. The active information layers according to the map layers
Alphanumeric information, data on the field of employment according to sectors,
number of business, data from the field of education, judiciary, agriculture etc.
3.4. Activities
Search by location of objects, by name, Query, Buffers, Distance, filters, select by
polygon, by square by data, overview window printing options etc.
Figure 3: A WebGIS example on distribution of the statisical information by municipal
level

International Conference SDI 2010 – Skopje; 15-17.09.2010
103
Figure 4: A WebGIS example on distribution of statistical information by grid
4. CONCLUSIONS
This paper has reviewed the methodology developed of grid-based population mapping
in Statistical Office of Kosovo. Also it provides further explanations on the WEBGIS
contents of statistical information.
After the Census it shall be created the possibility for entering all the data (such as those
from the social, economic, demographic, and agricultural) in grid and also the
dissemination of them through the system of WebGIS.
Planned future activities in Cartography and GIS Office are:
� Production of thematic mapping and spatial analysis, data dissemination and
services
� Implementation of a grid system for all statistical data dissemination.
� Update of statistical data in GIS and dissemination of them through the Web
GIS
� Cooperation with other Institutions for the definition and implementation of a
NSDI
� Development of metadata information

International Conference SDI 2010 – Skopje; 15-17.09.2010
104
5. REFERENCES
European Forum for Geostatistics (2009) http://www.efgs.ssb.no/
Meeting of the Working Party ‘Geographical Information Systems for Statistics’Luxembourg,
8—9 March 2010
Statistical grid for Norway Documentation of national grids for analysis and visualisation of
spatial data in Norway, Geir-Harald Strand and Vilni Verner Holst Bloch ,2009 Statistics
Norway
Martin, D. (2009) Population 24/7: building time-specific population grid models
School of Geography, University of Southampton, Southampton, SO17 1BJ, UK Guidelines for Geographic Data Intended for the GISCO Reference Database, Lovell Johns Ltd,
Witney, UK 2005 Eurostat.
GISCO Database Manual, SADL, K.U. Leuven R&D 2005 Eurostat
GISCO Desktop Mapping guide V. 2, Directorate D - Unit D2 Regional Statistics and
Geographical Information, Eurostat
6. BIOGRAPHICAL NOTES OF THE AUTHORS
RRAHMAN TARA is born on 02 March. 1950 in Pristina,Kosovo. He
studied in the field of economic in Pristina. Since 1971 he is working in
the Statistical Office of Kosovo. From 2002 he is working with
Department of Population and Housing Census in the Cartography and
GIS unit. He participated in many international visits and conferences on
Census preparations according to international standards. Since 2007 he
started to implement the INSPIRE Directive in the field of statistics in
Kosovo.
IDRIZ SHALA is born on 17 March 1980 in Prizren, Kosovo. Studied in
Geography Faculty and Masters by the University of Pristina in a subject
of Spatial Socio Economic Models. From 2002, he is working in the
Statistical Office of Kosovo, Department of Population and Housing
Census in the Cartographic & GIS unit. Shala attended study visits in
European Universities and Institutions. Since 2007, together with
colleague Mr. Rrahman Tara started to implement INSPIRE Directive in
the statistical field in Kosovo. This sector made some presentations in
Eurostat and National Statistical Institutions in EU countries related with
implementation of these Directives by Statistical Office of Kosovo.

International Conference SDI 2010 – Skopje; 15-17.09.2010
105
MAPPING AIR POLLUTION IN URBAN TIRANA AREA USING
GIS
Manjola BANJA1, Elvin COMO
2, Bledar MURTAJ
3 , Albana ZOTAJ
4
ABSTRACT
The recent development of spatial data infrastructure in the frame of geographic information
systems (GISs) has created the new era of different applications in the field of environment. The
scope and the scale of urban areas problems make the GIS a powerful tool for management of
spatial and temporal data, complex analyses and visualization. The ability to manage a number of
spatial and temporal data formats, data structures created in the frame of the GISs open the ways
to building air quality information systems that synthesize geospatial and temporal air quality data
to support spatial-temporal analysis and dynamic modeling. Mapping of air pollution within a
GIS environment for 6 selected points at the urban area of Tirana during 2009 was developed.
Surveys for air pollutants as NOx, NO2, O3 and SO2 were conducted using passive sampler
Analyst based on European Directive (EC Directive 96/62 EC ed EC Directive 99/30) that
indicates the passive sampling as an indicative method for preliminary evaluation of air quality.
Two-one month periods over winter and summer period are chosen to expose the passive
samplers. The pollutant concentrations for each period are visualized in the planar view of the
Tirana urban area. GIS was used to compare the two planar views representing the periods of
passive sampling in order to investigate the influence of meteorological conditions. The
visualized result has the potential to provide valuable information for pollution impact analysis,
by including also the dimension of the influenced area and population. The spatial assessment of
air pollution within Tirana urban area can be exploited by environmental and medical authorities
in order to plan their future strategies.
Key word: Air pollution, GIS, passive sampling, Tirana
1. INTRODUCTION
Usually, air pollution monitoring in urban environments is performed by operating a
certain number of monitoring stations located in several sites which are representative
of the general exposure to pollution by population ( Allegrini I., et al, 2002).. In such
situations, pollutant concentrations are measured by means of proper analyzers. Such a
1 PhD. Manjola BANJA, [email protected]
Institute of Energy, Water and Environment, Polytechnic University of Tirana
Tel.: +35542222202
Rr.“Durresit“, 219, Tirana,Albania. 2 MSc. Elvin COMO, [email protected]
Institute of Energy, Water and Environment, Polytechnic University of Tirana
Tel.: +35542222202
Rr.”Durersit”, 219, Tirana, Albania 3 M.Sc. Bledar Myrtaj, [email protected]
Institute of Energy, Water and Environment, Polytechnic University of Tirana
Tel.: +35542222202
Rr.”Durersit”, 219, Tirana, Albania 4 M.Sc. Albana Zoaj, [email protected]
GIS Specialist

International Conference SDI 2010 – Skopje; 15-17.09.2010
106
conventional approach, although found satisfactory in many instances, has a number of
definite limitations: standard monitoring stations require high investment costs,
extensive maintenance and training and highly specialized personnel, data gathered by
automatic analyzers are not suitable for a rapid interpretation and, unless used to
compare the values with pre-defined limits or air quality standards, they are not always
useful. Another method to assess pollutant concentration is based on the use of diffusive
devices which is an ideal tool to determine the pollutant distribution over a large area
and to assess integrated concentration levels, over long period of time. The different
techniques are used in the monitoring process in order to determine the individual
factors of pollution and stress of the urban environment, to estimate short term and long
term changes and to develop models that can simulate a real environmental situation to
aid the decision making process. Considering the nature of collected measurements, the
research requires a spatio-temporal data management. The increase in computing power
and graphics is facilitating the advance of geographic information systems-GIS, which
can effectively satisfy these tasks. Capabilities of the GIS include mainly management
of spatial data in the form of map layers, which can visualize real objects by vector and
raster data formats together with graphs and multimedia presentations. Data analysis in
the frame of the GIS represents one of the next steps. A number of definitions describe
capabilities of the GIS to solve a wide range of environmental problems, which are
related to urban areas. Burrough (1998) defines the GIS as a powerful set of tools for
collecting, storing, retrieving at will, transforming and displaying spatial data from the
real world for a particular set of purposes. The GIS contains a huge range of spatial
analyses and temporal comparisons, which allow carrying out and display of output data
in the GIS’s layers. Air pollution maps are potentially powerful tools particularly for
urban areas for use in epidemiological studies. They can help to identify the “hot-spots”
in need of special investigation or monitoring. In Tirana urban area according to 2007
traffic data, average traffic counts have increased 13.1% over the previous year and
have been climbing at about that same rate for the past 7 years. The combined increase
in road traffic and lack of significant improvement in road infrastructure has caused
chronic congestion on all principle roads and dangerously high levels of pollution.
Vehicle emissions are responsible for the majority of CO, hydrocarbons, NOx, SO2 and
inhaled particulate matter present in the atmosphere of the city (Kim J.J., et al, 2001).
Due to increasing attention devoted to the direct health risks associated with air
pollution from local traffic sources, two-one month passive monitoring field campaign
were conducted during year 2009. Mapping of air pollutants as NOx, O3 and SO2 is
visualized in the planar view of Tirana urban area using GIS. The planar visualization is
displayed to improve its interpretability and to point the hot spots where the highest
pollution occurs which can be easily detected by representing pollution level using an
appropriate color ramp. The spatial and temporal of air pollution in Tirana urban area is
investigated based on ambient air quality levels in summer and winter. At the same time
the influence of meteorological conditions is analyzed.
1. METHODOLOGY
The assessment of atmospheric pollution in urban area is a very important step for the
definition of locations where to deploy the monitoring stations. Such locations are
selected according to several information, which include: type and intensity of emitting
sources; distribution of polluting sources in the urban area; expected maximum

International Conference SDI 2010 – Skopje; 15-17.09.2010
107
concentration points in relationship to the presence of human targets (population
exposition); prevailing meteorological conditions; model applications; geographical
context; other proper studies (Allegrini I, et al, 2002).. The monitoring sites have to be
representative of a sufficiently large area in the vicinity, so that the sampling station can
be considered representative of a larger area or representative of sites characterized by
similar environmental conditions. The methodology of this study is based on grid
selection which is used to identify the measuring points (figure 1) and a number of 6
points is defined. Every point is chosen to represent as well as possible the air pollutants
emission sources of the entire grid to which it belongs. It takes also accounts of traffic
flow and the number of the inhabitants per grid. An area of influence for each sample
was defined considering a circle of 200 m of radius. This choice is partially arbitrary but
it was a result of the attempt to locate the passive samplers on a grid. A receptor grid is
elaborated with a distance between points of 200 m. The data was structured and stored
in the temporal database while Tirana’s digital map at scale 1: 20000 was being
uploaded and topologically structured using ArcView and ArcInfo GIS software. The
location of stations in the maps was determined. Attribute data were assigned to spatial
objects and the system become ready for spatio-temporal analysis and management.
After the experimental campaigns, the results of this technique are complemented by
proper studies, which take into account for the location of emitting sources, the
distribution of exposed population and the prevailing meteorological conditions.
Figure 1. Tirana urban area and the passive monitoring points

International Conference SDI 2010 – Skopje; 15-17.09.2010
108
2.1 Site description
Tirana city is located at the central part of Albania and is the capital of the country. The
greater urban area occupies ~31 km2 and extends approximately 25 km far away from
Adriatic Sea. At a distance of approximately 7 km of the eastern part are the foothills of
Dajti Mountain, (1612 m maximum height). The western part is surrounded by small
hills, whose height is ~400 m. Topography, is not intense to the northwestern part of the
city, so air from the sea could reach the urban area via this physical channel, when sea
breeze circulation is developed. In the urban area of Tirana live ~700,000 inhabitants
(INSTAT, 2005), but most likely the population is increase thenceforth. The area is
dominated by a Mediterranean climate with dry and hot summer. The main wind
direction during summer is NW and during winter is SE. The wind velocity is lower
during almost all year (figure 2).
1.5 2 2.5 3 3.5 4 4.5
1
1.5
2
2.5
3
3.5
4
1 1.5 2 2.5 3 3.5 4 4.5 5 5.5
1
1.5
2
2.5
3
3.5
4
Figure 2. Wind direction and wind velocity in Tirana area

International Conference SDI 2010 – Skopje; 15-17.09.2010
109
2.2 Passive sampling
Measurements with passive samplers turned out to be an appropriate method when one
wants to get a spatial distribution of air pollution (Brown R. H., 1993).. With passive
samplers, it is possible to measure NO2, NOx, SO2, O3 and some other pollutants as
well. The key principle for passive samplers is the Fick’s diffusion law and the transport
of pollutant molecule from entrance of the sampler to its end, where membrane with
absorbent is located. Among several kinds of passive samplers that have been
developed, Analyst® samplers are chosen for this purpose. The Analyst®, was
developed, patented and certified by CNR (Rome, Italy), by the Institute for
Atmospheric Pollution (Primary Reference Laboratory for Atmospheric Pollution), as
equivalent method for the determination of the concentration in ambient air of sulphur
dioxide, nitrogen oxides, and benzene in accordance with Italian legislation. The
Analyst® (Manes F. et al, 2003) has been tested over a relatively long periods of time
and their performances are documented in a large number of scientific publications.
Since the technique is very inexpensive, a large number of passive samplers may be
deployed in the urban environment (Seinfeld J.H., et al, 2006) in order to gain detailed
information about spatial distribution of pollution and about the occurrence of sites
where the exposition of population is at high levels. The ambient concentration of NO2,
NOx, and SO2 is known to follow a seasonal cycle (Lin Y.T.,et al,2001) with peak
values in winter and lower concentrations during summer period while O3 seasonal
cycle present higher values during summer period and lower values during winter. For
this reason the first one-month sampling campaign was conducted during 13 March – 16
April 2009 when elevated values of NO2, NOx and SO2 are expected and the second
sampling campaign was conducted during period 03 July – 04 August 2009 when
elevated values of O3 are expected. During our campaigns, samplers were exposed
together with shelters. We fixed shelters with samplers on different objects. We chose
mainly traffic lights, street lights, trees or something similar. Samplers were set 2,5-3,5
m above the ground and depending by the site type 0,5-300 m away from road-side.
Samplers exposed for one-month, after installation were collected in the same order
they were deployed. The Analyst® samplers were sent to the Italian institute in order to
be analyzed using the Ion-Chromatography method. The monitoring sites code, the
description of measuring points, their typology and the time of passive sampling
exposure are presented in table 1. It can be seen that we have chosen two traffic sites,
two urban sites, one suburban site and one background site.
Table 1. Monitoring sites, typology and time of exposure
Site code Description Typology Pollutants Exposure time (min)
Exped.1 Exped.2
TR 1 IEWE Lab suburban O3,NOx,NO2 47545 43266
TR 2 IEWE traffic O3,NOx,SO2 47465 43194
TR 3 AEF background O3,NOx,NO2 47500 43218
TR 4 Ring road-H.Tahsin cross traffic NO2,NOx,SO2 47487 44765
TR 5 Directory of Public Health urban O3,NO2,SO2 47415 43224
TR 6 Dinamo Stadium urban NOx,NO2,SO2 47406 43350

International Conference SDI 2010 – Skopje; 15-17.09.2010
110
3. RESULTS AND DISCUSSIONS
The analysis reveals that Tirana urban area is characterized by more than one hot-spot
related to pollutants as nitrogen oxides and ozone. For this reason the analysis is
focused on these pollutants and a comparison between two expeditions is conducted in
order to investigate the influence of meteorological conditions. The figures 3 & 4
present the comparison between two passive sampling periods for the nitrogen dioxide.
It can be seen that site Tr2 presents levels of nitrogen oxides during both expeditions
approximately 3 times higher than the annual limit value equals to 40 µg/m3 of the
National Standard of Air Quality (NSAQ). This site situated at the eastern part of the
city center and directly at the cross-road with elevated traffic is capable to represent the
peak values of nitrogen oxides and sulphur dioxide concentrations. Due to the fact that
the content of the sulphur in fuels is low the sulphur concentration doesn’t overcome the
limit value of the NSAQ. It can be seen that the nitrogen dioxide concentrations are
more elevated during the cold period which is related to the influence of the
meteorological conditions that tends to trap the pollutants at the layers near the surface.
During summer period, due to the mixing of the atmosphere layers related to the
elevated temperature and high solar radiation, the nitrogen oxides and sulphur dioxide
concentrations are lower.
Figure 3. NO2 concentration in Tirana urban area, expedition I

International Conference SDI 2010 – Skopje; 15-17.09.2010
111
Figure 4. NO2 concentration in Tirana urban area, expedition II
In figures 5 & 6 is presented the comparison between two passive sampling periods for
ozone. It can be seen that the ozone concentrations at sites Tr1, Tr3 and Tr5 are higher
than at the other sites. Site Tr1 present levels of ozone which are higher than the limit
value of 65 µg/m3 of the NSAQ. This site is situated to the western part of the city
center and the main source of pollution is the construction activity. Since the site is
situated at the city suburbs it is capable to represent adequately the peak values of ozone
concentration. The ozone concentrations measured are more elevated during summer
period when the photochemical reactions are present due to the effect of high solar
radiation and air temperatures.

International Conference SDI 2010 – Skopje; 15-17.09.2010
112
Figure 5. O3 concentration in Tirana urban area, expedition I
Figure 6. O3 concetration in Tirana urban area, expedition II

International Conference SDI 2010 – Skopje; 15-17.09.2010
113
4. CONCLUSIONS
GIS is one of the important technologies which help us to monitor, analyze and decide
on the air pollution quality in the urban area. The Tirana urban area is characterized by
more than one hot-spot site mainly influenced by the road emissions. The highest
nitrogen oxides values were found near streets with high traffic volume. The ambient air
quality situation for ozone is strongly influenced by the meteorological conditions.
Obtained data from passive monitoring process show that the pollution levels in Tirana
urban area are going higher. This problem leads us through creating a statistically valid
surface which subsequently is used in GIS for optimum decision making based on the
air quality factors which can be collected as maps and ground stations data.
Geostatistical methods are urgently needed for the amount of pollution in everywhere.
The spatial assessment of air pollution within Tirana urban area can be exploited by
environmental and medical authorities in order to plan their future strategies.
5. REFERENCES
Lorentz, T., Friebertshaeuser, J., Lohmeyer, A., 2003. GIS based urban scale air pollution
modeling within a German-Bulgarian twinning project. Contr. to 17th Intl. Conf. Informatics for
Environmental Protection, Cottbus
Pummakarnchanaa,O., Tripathia, N., Duttab, J., 2005. Air pollution monitoring and GIS
modeling: a new use of nanotechnology based solid state gas sensors. Science and Technology of
Advanced Materials 6.
Kim J.J., Smorodinsky S., Lipsett M., Singer B.C.,Hodgson A.T., Ostro B., 2004, “Traffic-related
Air Pollution near Busy Roads”, Am J Respir Crit Care Med Vol 170
Brown R. H., 1993. The use of diffusive samplers for monitoring of ambient air.Pure&Appl.
Chern., Vol. 65, No. 8
Agrawal1 I.C., Gupta R.D., Gupta V.K., 2003. GIS as modelling and decision support tool for air
quality management: a conceptual framework. Map India Conference
Lin Y.T., Young H.L., Wang S.Ch., 2001. Spatial variations of ground level ozone concentrations
in areas of different scales”, Atmospheric Environment 35
Institute of Statistics of Albania ( INSTAT), ( 2005)., “ Albania in figures 2005”
Matejicek L., Spatial Modelling of Air Pollution in Urban Areas with GIS: A Case Study on
Integrated Database Development. Project GACR 205020898,
Seinfeld J.H., Pandis S.N., 2006. Atmospheric chemistry and physics. John Wiley & Sons, INC.
Second edition
Briggs, D.J., 2007. The use of GIS to evaluate the traffic related pollution. Occup Environ Med
64
Shad, R., Ashoori, H., Afshari, N., 2008. Evaluation of optimum methods for predicting pollution
concentration in GIS environment. International Archives in the Photogrammetry, Remote
sensing and Spatial Information Sciences.
Burrough, PA; and RA McDonnell. 1998. Principles of Geographic Information Systems. Oxford.
EC Directive 96/62 EC & EC Directive 99/30, 1996 & 1999., Official Journal of European
Communities
Allegrini I., Costabile F., 2002, “ A new approach for monitoring atmospheric pollution in urban
environment”, Global Conference “ Building a Sustainable World”, San-Paolo, Brasil
Manes F., De Santis F., Giannini M.A., Vazzana C., Capogna F., Allegrini I., 2003, “ Integrated
ambient ozone evaluation by passive samplers and clover biomonitoring mini-stations”, The
Science of the Total Environment, Vol 308, issues 1-3, pp. 133-141.

International Conference SDI 2010 – Skopje; 15-17.09.2010
114
6. BIOGRAPHICAL NOTES OF THE AUTHORS
PhD. Manjola BANJA is currently a scientific researcher at Institute of
Energy, Water and Environment, Polytechnic University of Tirana. She
develops her scientific activity as part of the Department of Climate and
Environment. During period 2003- 2008 she has been Deputy Director of
Hydrometeorological Institute, Academy of Sciences of Albania. The main
field of her activity is study and monitoring of environment (air and water).
She has participated in different studies and projects dealing with
environment monitoring in the role of coordinator and expert.
M.Sc. Elvin COMO is currently a scientific researcher at Institute of
Energy, Water and Environment, Polytechnic University of Tirana. He
develops his scientific activity as part of the Department of Climate and
Environment. The main field of his activity is study and monitoring of
environment (air and water). He has participated in different studies and
projects dealing with environment monitoring.
M.Sc. Bledar MYRTAJ is currently a scientific researcher at Institute of Energy, Water and
Environment, Polytechnic University of Tirana. He develops his scientific activity as part of the
Department of Climate and Environment. The main field of his activity is study and monitoring of
environment (air and water). He has participated in different studies and projects dealing with
environment monitoring.
M.Sc. Albana ZOTAJ is a GIS and remote sensing specialist. She has worked as a researcher at
the Geographic Center of the Academy of Sciences till 2008. For the last 4 years she has held the
position of Head of GIS & Remote Sensing Department at the Geographic Center. Her main
responsibilities were to find foreign and domestic partners through different kinds of projects and
the management of them. During her career she has participated in a number of projects as
consultant. Through these activities, she gained extensive knowledge and experience in the fields
of GIS and mapping and she is well acquainted with the availability and quality of the existing
map material in Albania as well as the existing GIS environment

International Conference SDI 2010 – Skopje; 15-17.09.2010
115
AN APPROACH TO MAPPING EVAPOTRANSPIRATION BY
METEOROLOGICAL ELEMENT WITH APPLICATION TO
THE TERRITORY OF ALBANIA
Aferdita LASKA MERKOCI
1, Gëzim GJATA
2,
Miriam NDINI BOGDANI 3, Mirela DVORANI
4, Edlira SHKURTI
5
ABSTRACT
Evapotranspiration is one of the major problems of soil water balance Evapotranspiration. Data
and Information, as an important element in the context of Spatial data Infrastructure is a question
of great interest to a wide community of specialists, such as meteorologists, agronomists,
hydrologists, managers of irrigation etc. Many particular researches are carried out in Albania to
evaluate evapotraspiration. This paper is an attempt to introduce a general evaluation of the
evapotranspiration in the Albanian territory, including the evapotranspiration regionalization.
Evaluation of evapotranspiration in the Albanian territory plays a major role because Albania is a
complicated and complex natural area in Europe as a result of its specific physical-geographical
conditions: a mountainous region, typical Mediterranean climate, a particular hydrographical
system, etc.
There are various methods applied: direct measurement or observed method, indirect calculating
method using empiric formulas, based on meteorological data, water balance method. It is
evaluated by using multi-annual archival hydro-meteorological information of the Institute for
Energy, Water and Environment, such as temperature, rainfall, solar radiation, vapor pressure,
wind speed. Evotranspiration evaluation is based on the observed period of 20-30 years and 6
experimental stations GGJ with an observed period of about 10 years. Evaporation is evaluated by
computing its principal components, such as: potential or reference evapotranspitarion – E0, real
evapotranspiration – ER, evaporation deficit – ∆E, pluviometric deficit – ∆x. Evapotranspiration
and territory altitude dependence subdues the vertical zonal law, having e typical regional
character. Using these dependences, the evapotranspiration maps are compiled for the Albanian
territory.
1 Dr. Aferdita LASKA MERKOCI, [email protected]
Polytechnic University of Tirana
Institute for Energy Water and Environment
Department of Climate and Environment 2 Dr. Gëzim GJATA, [email protected]
Polytechnic University of Tirana
Department of Geodesy
Head in Cartography & Remote Sensing 3 Dr. Miriam NDINI BOGDANI, [email protected]
Polytechnic University of Tirana
Institute for Energy Water and Environment
Department of water-hydrology 4 MSc Mirela DVORANI, [email protected]
Polytechnic University of Tirana
Institute for Energy Water and Environment
Department of water-hydrology 5Edlira SHKURTI [email protected]
Polytechnic University of Tirana
Department of Geodesy
Teaching Assistant
International Conference SDI 2010 – Skopje; 15-17.09.2010
116
The diverse meteorological elements and the evapotranspiration values, evaluated according to
the various empirical methods have been updated and plotted on the 3D digital map, thereby
creating the data spatial distribution by employing G.I.S system. The spatial distribution for the
values of evapotranspiration in the Albanian territory has been performed in connection with
other spatial values, such as altitude above sea level, longitude and latitude for each area, rainfall
rate distribution, temperature, solar radiation, relative humidity and other strata as the variable
elements of spatial data infrastructure to be processed and analyzed in the context of GIS program
Key word: Evapotranspiration, regionalization, empirical method, map, G.I.S, spatial
1. INTRODUCTION This paper is an attempt to introduce a general evaluation of the evapotranspiration in
Albanian territory. Evapotranspiration is one of the major problems of soil water
balance. Knowing the amount of water directly evaporated from the soil or through
transpiration of plants is a point of interest not only for the agronomists, but also for
meteorologist, hydrologists, managers of irrigation etc. Evaluation of evapotranspiration
in the Albanian territory plays a major role because Albania is a complicated and
complex natural area in Europe as a result of its specific physical-geographical
conditions: a mountainous region, typical Mediterranean climate, a particular
hydrographical system, etc.
The principle of evapotranspiration estimation consists in the association of
climatological data, which provide a way of determining the atmospheric demand of
water, with both agronomic knowledge and estimates of soil water availability which,
combined, indicate how the soil-crop system can meet this demand. There are various
methods applied for its evaluation, respectively: direct method, indirect calculating
method using empiric formulas, based on meteorological data, water balance method. It
is evaluated by using multi-annual archival hydro-meteorological information of the
Institute for Energy, Water and Environment, such as temperature, rainfall, solar
radiation, vapor pressure, wind speed.
Albanian monitoring network consists of more than 125 meteorological stations located
all over the country with an observed long period, 175 hydrometric stations, and
experimental stations, especially in the Lushnja region with an observed period of about
10 years. Evapotranspiration evaluation is based on the observed period of 1961-1990.
National topographical maps of 1:25000 scale are used to evaluate the morphometric
characteristics
2. DESCRIPTION OF THE REGION
The Republic of Albania is situated in South east Europe, in the western part of the
Balkan Peninsula facing the Adriatic Sea (sandy shore) and the Ionian Sea (rocky
shore). Albania has a surface area of 28,745 km2. Its terrain is mountainous, with the
hilly and mountainous areas making up 77% of the country’s territory, with an average
altitude of 708 meters double that of Europe.
The general length of the state border is 1,093 km, out of which 657 km land border,
316 km sea border, 48 km river border and 72 km lake border. North and Northeast,
Albania borders with the Republic of Montenegro, East bordering with Former
Yugoslav Republic of Macedonia, while south and southeast with Greece.(Figure1)
A number of rivers flow into the sea such as Buna, Drini, Mati, Ishmi, Erzen,
Shkumbin, Seman, Vjosa and Bistrica which constitute an important source of hydro
power. The lakes are of varying origin: glacial lakes in the highlands, carstic lakes in the

International Conference SDI 2010 – Skopje; 15-17.09.2010
117
hilly areas, and tectonic lakes Shkodra, Ohri and Prespa.(Selenica A et Al 1984)
Moreover they are very important for the fishermen, especially those of wetland type,
which are large fishing reserves.
Albania belongs to the subtropical Mediterranean climate. It is characterized by mild
winter with abundant precipitation and hot, dry summer. The annual mean air
temperature has a wide variation over the territory. All the territory is characterized by
the negative trend of annual mean temperature. The negative trend of annual mean
temperature comes out as a result of the influence of negative trend of minimum
temperatures. The mean annual precipitation total over the Albania is about 1,485
mm/year. The highest precipitation total (70%) is recorded during the cold months
(October-March). The richest month in precipitation over the whole territory is
November, while the poorest are July and August.
Figure 1 Geographical map of Albania

International Conference SDI 2010 – Skopje; 15-17.09.2010
118
3. METHODS AND ANALYSES
Evapotranspiration in Albania is determined by the correlation of different geographical
factors, such as: climate, relief, territory lithological structure, vegetation, etc. As a
result the influence of all these factors in the territory is different not only during the
months, seasons and different periods of the year, but also in the multi-annual cycle.
The evaluation of potential evapotranspiration, otherwise recognized nowadays as the
referential area evapotranspiration, has been performed with reference to diverse
climatic zones in Albania. Therefore, to this end, the Albanian territory subjected has
been classified into three areas:
I-Field areas situated on the Western Lowlands in Shkoder, Lezhe, Lushnje, Durres,
Vlore;
II-Hilly areas in Peshkopi, Burrel, etc;
III-Mountainous areas in Korce, Erseke, etc;
In this paper it is evaluated by computing Potential Evapotranspiration (reference
evapotranspiration) ETp, Real Evapotranspiration – ETR, Evaporation Deficit –∆E,
Pluviometric Deficit – ∆X0. Reference (Potential) Evaporation – ET0 is calculated by
various methods such as: Turc, Penman, Thornthweit, Penman Monteith, Equation
FAO56 Penman-Monteith.Penman Monteith ASCE. In 1990, the experts and researches
of FAO in collaboration with the International Commission for Irrigation and Drainage
of OBM chose the FAO Penman Monteith as the correct method for the evaluation of
ETp.
3.1 Evapotranspiration reference ( Potential)
Since Reference evapotranspiration (ET0) was defined as atmospheric demand, there
were a lot of attempts to establish the formulae giving its dependence on meteorological
observation. These formulae can be classified into empirical formulae and formulae
based on physics. In the empirical formulae we can find: the radiation methods and the
temperature methods (Thornthwaite). The physics formulae are Penman formula
original, Penman Monteith , Turc, Blaney Cridel, Penman Monteith ASCE, FAO56
Penman Monteith etc.
The values of ET0, calculated by different ways, result similar to be each-other. It is
evidently seen in Figure 2, with relevance to the Distribution of months values of ETp
by Turc, Penman original, Thornthwaite methods (Laska A 2007, 2008). These values
are relatively similar, to the results of the direct experimental observed method (the
Lushnja stations), the difference about – δET0 = ±5÷10%.
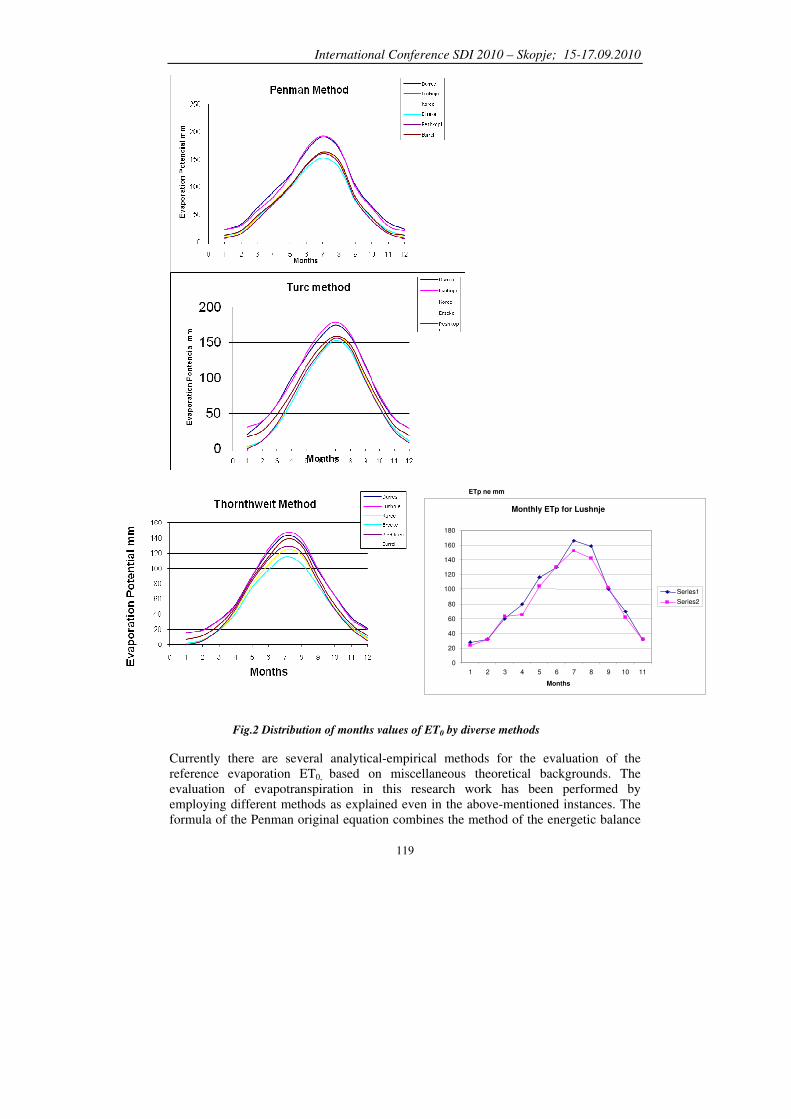
International Conference SDI 2010 – Skopje; 15-17.09.2010
119
Fig.2 Distribution of months values of ET0 by diverse methods
Currently there are several analytical-empirical methods for the evaluation of the
reference evaporation ET0, based on miscellaneous theoretical backgrounds. The
evaluation of evapotranspiration in this research work has been performed by
employing different methods as explained even in the above-mentioned instances. The
formula of the Penman original equation combines the method of the energetic balance
Monthly ETp for Lushnje
0
20 40 60 80
100
120
140
160
180
1 2 3 4 5 6 7 8 9 10 11 Months
ETp ne mm
Series1 Series2

International Conference SDI 2010 – Skopje; 15-17.09.2010
120
with that of the turbulent diffusion. Later, this equation was subjected to numerous
modifications by various scholars and researchers. The most significant modification for
this equation is recognized as Monteith, whose mathematical expression has been
introduced as the Penman Monteith method. Later, various modifications have been
carried out wherein the FAO56 Penman Monteith has been recently recognized as the
most accurate and physically comprehensive method, since his formula involves the
exploitation of numerous climatic elements.(FAO 2000) In addition, it should be
emphasized that this formula is closer to reality, apart from few differences, as
compared to the direct method (Lushnje Station in Lowland of Albania)
Therefore, the average monthly Reference Evapotranspiration on the Albanian territory
differs from about ET0 = 10 ÷ 40mm in January, the coldest month of the year, to about
ET0 = 120 ÷ 170mm in June, the hottest month, referring to FAO56 Pennman-Monteith
and ASCE Penman Monteith. The average annual potential evaporation for the multi-
annual period is about ET0 = 800 ÷ 1100mm. The average annual (potential) reference
evaporation in the plains varies from ET0 = 1000 ÷ 1100mm and on the mountains
about ET0 = 800 ÷ 850mm. (referring to FAO56 Pennman-Monteith)
In the Figure 3 has been presented the distribution of reference (potencial)
evapotranspiration (by GIS system) on the Albanian territory.
3.1.1. Employing GIS for the visualisation of Etp, Etr and ∆∆∆∆E
With a view to visually representing evapotranspiration, as well as representing it not
only graphically, but also by employing other data as well, even the method of
representing them through the GIS systems was utilized. It is common knowledge that
the GIS systems constitute an extremely efficient method for the data collection, their
digital processing, their linkage to a database, their graphical displaying and realizing
QUERIES with a graphic interface.
Considering the entire range of the statistical data of evapotranspiration with various
climatic elements, such as rainfalls, monthly average temperature, sun radiation, wind,
relative humidity, etc., in this research employing the GIS systems was intended to
enable the mapping through the evapotranspiration isolines and rainfalls, as well as the
evapotranspiration with temperatures through the isolines, which themselves indicate
the same size, or value, which permeates the entire country’s territory. The isolines were
acquired analytically considering the statistical data collected throughout the years.
This representation permits and enables the scholars and researchers of various research
areas to have a quick and logical perception of these phenomena, thereby enabling them
to have a clear and simplified understanding in cases of decision-making or in the event
of specialists in the various research areas are looking for information associated with
this problem.
In the following maps it is evident that the data representation, both the
evapotranspiration data and the data associated with the various climatic elements has
been made in line with the logic familiar to every specialist and the public at large. As
regards realizing the QUEIRES within the framework of GIS, there was established a
Linkage between the graphical representation and the database for the data available to
us (Gjata G 2009). In this case this linkage was modeled by utilizing a simple
hierarchical ranking between evapotranspiration and rainfalls (or in cases, which have
not been represented, based on the relationship between evapotanspiration and the
various climatic elements), thereby realizing a topologic process for a dot, line, and
polygon, hence enabling the linkage with the database.

International Conference SDI 2010 – Skopje; 15-17.09.2010
121
The maps represented are a product of this system established for the research
introduced and submitted in this conference.
These maps are formed by using different layers for each climatic element using their
monthly and yearly data. The layers allow everyone see more clearly the spatial data
and compare them easily. As regards QUERIES, their programming is continuing so as
to enhancing the opportunities towards a comprehensive alphanumeric representation.
Within the framework of the products received by GIS, even the regionalization
hartograme of the evapotranspiration values for the entire country’s territory was
acquired, Figure 9
It is exactly by implementing the formula of FAO56 Penman Monteith that we have
managed to obtain the results for monthly and annual ET0 for the territory of Albania.
The annual distribution of the ET0 values, the annual rainfalls and mean temperature
(January, July, annual) for the territory of Albania is represented through GIS in Figure
3 ,4,5

International Conference SDI 2010 – Skopje; 15-17.09.2010
122
Figure 3 The distribution of ET0 on the Albanian territory

International Conference SDI 2010 – Skopje; 15-17.09.2010
123
Figure 4 The annual distribution of rainfall on the Albanian territory

International Conference SDI 2010 – Skopje; 15-17.09.2010
124
a. January b. July
c. annual
Figure 5 The distribution of mean temperature on the Albanian territory
a. January, b. July, c. annual

International Conference SDI 2010 – Skopje; 15-17.09.2010
125
3.2 Real Evaporation
Another component of evapotranspiration is the Real Evapotranspiration ETr It is
calculated by the methods: Thornthwait, Turc, water balance, Cotagne and
Costandinov.(1986 Pano N) The values of ETr, calculated by different methods, result
relatively similar to each other. At the same time, these are relatively similar to the
results of the deficit water flow-Z0 calculated by the water balance method (difference
about –δ ETr = ±5-10%). The monthly distribution of the real evapotranspiration values
according to the Thornthwait method haven been graphically represented in Figure 6.
Figure 6 The monthly distribution of Etr according to Thornthweit method on the Albanian
territory
ETr in Albania varies from about 650 ÷ 700mm in the coastal area to 300 ÷ 400mm in
the mountains, having an average of ETR = 500 ÷ 600mm all over the Albanian
territory. Real Evaporation ETR is presented with water balance method on Figure 8 by
the GIS system.
3.3. Deficit evaporation
Deficit evaporation ∆E is computed as the difference ( )RETETE −=∆ 0 . ∆E in
Albanian varies about ∆E = 425 ÷ 450mm on the coastal area to ∆E = 150 ÷ 200mm in
the mountains. Having already recognised the ETp values, it is possible to determine the
pluviometric deficit ∆E referring to every period of the year, as a difference of potential
evapotranspiration with the respective rainfalls corresponding to this period. It is in this
way that the water balance-sheet for every month of the year is calculated, likewise the
pluviometric deficit is later determined during the dry months, whereas the superfluous
water-supply is determined during the wet months.
In Figure 7 there has been represented the annual distribution of pluviometric deficit
∆E in Albania, wherein it is evident that during the June-September period Etp is greater
than the rainfalls, consequently there is shortage of water-supply. The opposite happens

International Conference SDI 2010 – Skopje; 15-17.09.2010
126
during the October-May period when the rainfalls are greater than evapotranspiration,
consequently there are excessive rainfalls.
-300
-200
-100
0
100
200
300
I II III IV V VI VII VIII IX X XI XII
Potential Evapotranspirat ion – ET 0
Dificit Evaporat ion – DE
+ E (in mm)
Months
Figure 7. Annual distribution of ETP; ETR and deficit evaporation - �E in Albania

International Conference SDI 2010 – Skopje; 15-17.09.2010
127
Figure 8 The distribution of real evaporation on the Albanian territory

International Conference SDI 2010 – Skopje; 15-17.09.2010
128
4. RESULTS AND CONCLUSIONS
Evapotranspiration is an important phenomena and representative element of the water
balance of the Albanian territory. The principal results of the evapotranspiration
evaluation for the Albanian territory are:
Annual Evapotranspiration distribution is generally characterized by a typical
Mediterranean nature.
The scheme of classification and division into homogenous sectors is based on
evaluation and determination of the natural factors participating in the
evapotranspiration process.
Albanian territory division scheme in homogeneous regions, based on evaluation and
determination of the natural factors, influencing the intensity of the evapotranspiration
process, is presented in this paper.
Territory morphometric parameters. Morphometric factors are determined by the
topographical characteristics of the Albanian territory. The main parameters considered
are: (h) – territory average altitude, and (l) – distance from the Sea.
Territory climatic parameters. Climatic parameters are: Sun radiation (J), Air
temperature (ta), precipitation (X0), Air humidity (l0), wind (v), etc.
Many important indicators to evaluate the integral impact of the natural conditions of
the territory on the evapotranspiration process are respectively: Reference
Evapotranspiration ET0, Real Evapotranspiration ETR and Deficit Evaporation ∆E.
Table 1
In the general scheme of evapotranspiration intensity process, the natural conditions of
the Albanian territory are grouped as in the following:
Computation principal parameters of the water balance of the territory. Water balance
parameters are: pluviometric deficit (∆X0) ∆X0 in Albania varies about 200mm on the
coastal area to 2500 ÷ 3000mm on the mountain
Analyzing and dividing the Albanian territory in homogeneous areas, region is accepted
as the smallest tecsinometric unit.
Classification is made for the following evapotranspiration categories: high, low and
mean.
For the natural specific conditions of the Albanian territory, particularly, for
mountainous areas, values of both evapotranspiration components were computed based
on their vertical gradients and their altitude above sea level.
Composition methodology of the distribution for annual evapotranspiration
components (ET0, ETR, ∆E, ∆X0 and Z0) used in the paper consists in the classification
of the Albanian territory by the respective gradient hXPM 0= . Which were taken
into consideration by the GIS System.
Evapotranspiration components and territory altitude subdues the vertical zone low,
having a typical regional character. Using these dependences, in the table 2 are made
their components for the Albanian territory.
As a conclusion, in the following we are representing the values of the respective
Evapotranspiration components (ET0, ETR and ∆X0) according to the various climatic
regions and various altitudes of the Albanian territory.
Utilising GIS as a means of visual representation of the numerous ETp statistical data
constitutes an innovatory approach for our article since it increases the community for
the users of the relevant data. GIS enables the monthly representation of various data,
both those associated with Etp, as well as the climatic elements.

International Conference SDI 2010 – Skopje; 15-17.09.2010
129
Within the framework of the products received by GIS, even the regionalization
hartograme of the evapotranspiration values for the entire country’s territory was
acquired, Figure 9
Table 1 The evapotranspiration components (ET0, ETr and �X0) in the Albanian territory
Nr ELEMENTS Region I1 – Low ET0
(in mm)
Region II1 – Mean
ET0
(in mm)
I
Potential
Evapotranspiration
(ET0)
÷=
÷=
mmB
mmA
800701
700500
1
1
÷=
÷=
mmD
mmC
1000901
900801
1
1
II
Real
Evapotranspiration
(ETR)
÷=
÷=
mmB
mmA
500401
400300
2
2
÷=
÷=
mmD
mmC
600551
550501
2
2
III
Deficit
Pluviometric
( )0 0 0X ET X∆ = −
÷=
÷−=
mmB
mmA
200001
000200
3
3
÷=
÷=
mmD
mmC
1000401
400201
3
3
Nr ELEMENTS Region III1 – High
ET0 (in mm)
I
Potential
Evapotranspiration
(ET0)
÷=
÷=
mmF
mmE
12001101
11001001
1
1
II
Real
Evapotranspiration
(ETR)
÷=
÷=
mmF
mmE
800701
700601
2
2
III
Deficit
Pluviometric
( )0 0 0X ET X∆ = −
÷=
÷=
mmF
mmE
30001501
15001001
3
3

International Conference SDI 2010 – Skopje; 15-17.09.2010
130
Figure 9 The evapotranspiration components (ET0, ETr and �X0) in the Albanian territory

International Conference SDI 2010 – Skopje; 15-17.09.2010
131
5. REFERENCES
Allan D. Randall Mean annual runoff, precipitation, and evapotranspiration in the Glaciated
Northeastern United State , 1951-8 0 Kanada
Alen, R.G&al, 2000: Issues, requirements, and challenges in selecting and specifying a
standardized ET equation. In.Proc 4° Natl.Irrig. Symp, 201-208. St.Joseph,Nich: ASAE
B.Itier, 1994: Draft for discussion at NATO WORKSHOP “Sustainability of irrigated agriculture”
Measurement and estimation of evapotranspiration. VIMEIRO (P)
Doorenbas. I., and Pruitt, W.O.1977 Crop water requirement FAO Irrigation and Drainage Paper
No. 24, United Nations – Food and Agriculture Organization, Rome Italy 156
FAO, 2000: Guidelines for predicting of crop water requirement. FAO Irrigation and Drain.
Paper No 56 Rome, Italy
Grazhdani S., 2002: Agrometeorologjia. Tirane
Grazhdani S., 1998: Estimating reference evapotranspiration for the climate conditions of South-
Eastern Albania. Agriculture Mediterranean Vol. 126
Jaho S., Selenica A., 1984: Climatological and Hydrological Characteristics of Western Lowland.
IHM, Monograph. P.179-199. Tirana
Laska A., 2007, 2008: Estimating Evapotranspiration by the Hydrometeorological Elements in
the Fier and Sukth regions of Albania, Graduation Diploma Thesis p. 12-40
Merkoci A., 1984: Estimating Evapotranspiration by the Hydrometeorological Elements in the
Kamza region of Albania, Graduation Diploma Thesis p. 10-36
M.Poire et CH. Ollier., Irrigation
Monteith,J. L., 1965: Evapotranspiration and environment. The state and environment of water in
living organisms. 19th Symposium for Experimental Biology Cambridge University Press.
Cambridge, UK 205-234
Pano N., 1986: L’evapotranspiration en Albania. IHM, Nr.11, p125-143. Tirana
Selenica A et al. 1984 The Climate and Hydrology feature of Western Lowland of Albania
Gjata G Natonal Report of Albania 2009: "Developments on establishing the Albanian Satelite
Positioning System (ALBPOS)", EUREF 2009
6. BIOGRAPHICAL NOTES OF THE AUTHORS
The impact of climate change in agriculture in diverse phases of
development.
The Effect of Meteorological Elements on Crop Yields and
Methods of Forecasting
The Evaluation of Evapotranspiration on the Albanian Territory
The effect of meteorological element in agriculture (temperature,
rainfall, wind, ET)
The Drought in Albania (DMSCE Project)
The Climate Characteristics of some region in Albania
The management of meteorological and agrometeorological data network
The statistical model in agriculture
Establishing a GIS System as a tool to manage natyral resourses
in the rajon of Tirana-Durresi Kavaja
Design and Implementation of GIS systems on data and geologic
Documentation

International Conference SDI 2010 – Skopje; 15-17.09.2010
132
Organisation and Institutionalisation of Geoinformation Activities and GIS in Albania
Natonal Report of Albania 2009: "Developments on establishing the Albanian Satelite
Positioning System (ALBPOS)", EUREF 2009
Albanian Watershed Assessment –US Forest Service 1999-
200Assessment of Climate Change Impacts on the Hydrological
Cycle in South – Eastern Europe. Project of IHP – UNESCO (2003-
2005).
Technology Need Assessment for coastal adaptation in the project
Expedited Financing of Climate Change Enabling activities (Phase
II). UNDP/GEF project, 2003-2004.
Impacts of Climate Change to the Power Sector and Identification
of the Adaptation Response Measures in the Mati River
Catchment’s Area1 (MRCA). Research study for the project:
Enhance regional SEE cooperation in the field of climate policy.
Joint contribution of REC, UNDP, CCP/U and MEFW. October
2007 (coauthor)
Vulnerability assessment and adaptation options within the project
Second National Communication of Albania in Response to its
Commitments to UNFCCC. UNDP/GEF project, 2005-2008.
Evaluation of low flow and its regionalization in Albania territory. Ministry
of Science and Education Albania. (2007-2009)
Management of hydrological data base
The statistical methods and its employment in hydrological service
Some evaluation of evapotranspiration on the Albanian territory
Batimetrie of Skutary lake
The statistical model in agriculture
Programmer/Developer in GIS Systems like:
GIS Analysis and Statistics in Police System,
GIS application that manages the network of Medium and Low
voltage distribution,
GIS application for Rates of Tirana municipality,
GIS application that manages the distribution of companies’
products through a map.

International Conference SDI 2010 – Skopje; 15-17.09.2010
133
SPATIAL DATA FOR BETTER GOVERNMENT OF LARGE
CITIES – BULGARIAN CASE
Maria NIKOLOVA1
ABSTRACT
The development of new data, approaches, and spatial analysis tools and data collection methods
over the past years has revolutionized the process of governance the large cities. The usage of
spatial data helps in researching the milestones in city’s government. Innovations in public
administration are expressed as delivering new public services and improving the existing.
Internet-based GIS enable any department of the public organization to extend the services for
citizens and business without time and distance limitation. Government of the cities is dependable
and correlated with the size of municipalities, with their geographical location.
The application of integrated data from GIS and satellite data is demonstrated in examples for
crisis management in Bulgaria. Researched examples cover GIS help in the situation with a forest
fire, monitoring of snow cover on the territory of Bulgaria and explosion in the military section
near Sofia.
Key word: e-government, spatial data, innovations in public sector, GIS, city governance.
1. INTRODUCTION
G-government is a concept, reflecting the ever enlargement impact of GIS and its entry
into modern management. Using the advantages of GIS and the Internet, G-government
makes more efficient government, sets a new level of administrative services.
The objectives of the research are on the first place to identify what information to
extract from built up areas for deriving more information on location, condition and
evolution of high risk, related to international disaster risk reduction. The research will
focus how to quicken government disaster and crisis response capacity. In some aspect
it is concerned with development of standardized and defined procedures.
In the terms of cities’ problems an objective is to the ability to integrate spatial
information because public representatives for disasters and management of crisis can
communicate and connect to do business between themselves and the government. Thus
individual participants in the process need to connect to each other, sharing and
collaborating with different types and formats of spatial information.
Using spatial information requires technologies which are open and can interoperate
between each other.
1 PhD Maria NIKOLOVA, [email protected]
New Bulgarian University, www.nbu.bg
Tel.: +359 2 8110281, Gsm.: +359 887978832
Str.Montevideo, 21, 1618 Sofia, Bulgaria.

International Conference SDI 2010 – Skopje; 15-17.09.2010
134
The integration of data in a territory of a country allow the government to derive the
greatest benefit from the stored data in existing systems. Sharing data among
government departments and between related institutions will be the main benefit from
usage of spatial data.
2. NEW APPROACH TO SPATIAL DATA
Precise spatial information gives new opportunities to researchers because these data
raise new challenges - they allow research participants to be identified and therefore
threaten the promise of confidentiality made when collecting the social data to which
spatial data are linked. The unique capacity of spatial data leads to facilitating the
process of identification of individuals on public places. This is absolutely important in
the current time when the need of more security is needed in the big cities. Spatial data
combine text, graphical and geographical information and as a result a general reports
can be provided after processing the data.
The development of new data, approaches, and spatial analysis tools and data collection
methods over the past years has revolutionized how researchers approach many
questions. The availability of satellite images with high resolution of the Earth,
collected repeatedly over time, also availability of software for converting those images
into digital information about specific locations, has made possible new methods of
analysis. At the last year are available more and improved satellite images as aerial
images, become more popular global positioning systems (GPS) and other types of
sensors — especially radio frequency identification (RFID) tags. All these data and
tools may be used to track people worldwide. That way is possible to provide ubiquitous
tracking of individuals and groups. The same technologies also permit enhanced
research that may support business enterprises. Such examples are providing tracking
information for commercial vehicles to optimize their route and to control their
movement. Another example is tracking the shipments of goods. Improved
understanding of how these spatial data interact with social variables can help for much
clearer picture of the nature of access to health care compared with the time when
spatial data were not available. The usage of spatial data for better government of the
big cities improves their importance for managing the cities’ problems.
These new tools and methods have become more widely available. Their usage needs of
more study in depth. For example using these data may be performed an analysis of
health services and the focus may be on access as a function of age, sex, race, income,
occupation, education and employment. Now is already possible to examine how access
and its effects on health are influenced by distances from home and work to health care
providers, as well as the quality of the available transportation routes and modes of
traveling to providers.
The most important challenge for research the link between public and spatial data is the
development and use of geographical information systems (GIS). They make possible to
put together data from different sources and points on the surface of the Earth as a
result. This connection has great importance because geographic coordinates are a
unique and unchanging identification system. Using GIS is possible to collect data from
participants in a public survey and these data can be linked to the location where are

International Conference SDI 2010 – Skopje; 15-17.09.2010
135
living the participants or to their workplaces, or land holdings. Then the analysis may be
performed in connection with data collected from other sources, such as satellite
observations or administrative records that are in connection to the same physical
location. Such data linkage can reveal more information about research participants than
can be known from either source alone. Such revelations can increase the fund of
human knowledge. Such analysis can also be seen by the people whose data are linked
as an invasion of privacy or a violation of a pledge of confidentiality.
A number of possible approaches exist for preserving respondent confidentiality when
links to geospatial information could raise non-observance. The approaches fall in two
main categories: institutional approaches, which involve restricting access to sensitive
data; and technical and statistical approaches, which involve transforming the data in
various ways to enhance the protection of confidentiality
(http://site.ebrary.com/lib/nbu/Doc?id=10170926 &ppg=70, 2007).
3. GIS IMPLEMENTATION AS INNOVATION FOR E-GOVERNMENT
During the process of development of e-government it becomes mature and the
expectations for more interactive and responsive e-government have also been growing
(Norris & Moon, 2005). Yildiz (2007, p. 647) claims, “E-government research up to
date for the most part limited itself to the study of the outcomes and outputs of the e-
government project. Thus, understanding the political process behind e-government
development is vital for overcoming both definitional and analytical limitation,” and
also argues, “such an effort requires a historical understanding of the relationship
between technology and administration”.
The traditional government computer based information systems are built when closed,
connected, integrated and and proprietary IT infrastructure exists. The main goal of
traditional information systems is to help and support with their functions, connectivity
and capacity the end-users because of increasing their productivity. The appearance of
the internet and web-based technologies has made the government services more
accessible. Organizations in the public sector have higher pressure and demand from the
public, businesses and government agencies for more and better services of e-
government. A successful implementation of e-government requires careful planning of
future strategies for satisfying these higher demands. The integration between the new
e-government information systems and the existing internal systems has to be redefined
in terms of IT elements and business processes (Fletcher, 2004). The rapidly emerging
open and standardized IT environment has generated additional requirements such as
security and privacy protection (Abie et al., 2004; Deakins & Dillon, 2002). Moreover,
the characteristics of demand for e-government services from the public are often
uncertain and the client computing environment is largely unknown. These issues have
posed a great amount of challenges for IT managers in the public sector who are
charged for satisfying the service demand around the clock with acceptable performance
level (Richardson, 2004).
Usually GIS is connected with geographical maps. In fact the map is only one of the
types for work with geographical data and that way appears only one of the outputs of
GIS. In principle GIS includes 3 aspects – geographical data base (geo-data); maps

International Conference SDI 2010 – Skopje; 15-17.09.2010
136
(interactive maps that demonstrate objects from the earth surface and relationship
between objects); models.
The perceived benefits of using the centralized, Internet-based GIS seemed endless.
Users could easily interact with the system to obtain the data and information they need
according to their requirements. The staff of public organizations has the ability to enter
data into the GIS database, to request and receive reports, to generate maps in real time
from the workplace computers. That way the public organizations’ staff may provide
the highest level of public services with minimum resources, because the number of
staff becomes less and at the costs are decreasing). Managers of the public organizations
have the ability to perform analyses to better understand the resources of any county and
circumstances for taking their decisions. Moreover Internet-based GIS enables any
department of the public organization to extend the services to citizens and business
without any time and distance limitation.
E-government decisions and presence can range from a simple website of the public
organization to fully integrated e-government services across government and multi-
government administrative boundaries. Each e-government development stage is
associated with the triggers and activities that take place in a unique way such that it is
critical to understand where the current e-government initiative stands in a continuous e-
government process (Tsai N., B. Choi, M. Perry, 2009).
Innovation and implications for public services has been defined as a ‘‘reverse product
cycle” – the application of new technology will first lead to an improvement of
efficiency in the delivery of existing services, then to a better quality and eventually to
the introduction of brand new services (Barras, 1986). The technology adoption and
decisions to undertake costly innovation efforts in the public sector also reflect the
political will of central and local governments, coupled with the recognition that change
requires the allocation of substantial resources (Arduini, D, 2010); and the pressures
exerted by users (voters) on local governments to improve the quality of services
supplied by public administration (Clark et al., 2008).
The interactive and comprehensive nature of innovation is mediated by spatial factors,
such as geographic closeness and local knowledge collection. There are strong examples
of inter-regional variations in the formation and adoption of applied new technology in
the public sector services, uncovered that innovation tends to be geographically limited.
Innovations in public administration are dependable and correlated with the size of
municipalities, with their geographical location. For example e-government service
supply provided by Italian municipalities is a non-homogeneous and strongly
asymmetrical process presenting intensities which vary according to the geographical
localization of every municipality. (Arduini, D, 2010).
Some of GIS application for better government of the modern city is:
- Optimization of the planning process of the cities
- Planning the communication infrastructure on the territory of the city
- Urban development
- Building underground infrastructure

International Conference SDI 2010 – Skopje; 15-17.09.2010
137
Internet-based GIS represent a new approach to innovation in the public administration.
First of all the better services are delivered to the users of the system; they interact easy
with the system and to access data and information. On the other hand the
administrative staff enters data into GIS database, also receive reports, and generate
maps in a real time. The administration provides sophisticated public services with
minimum resources. Managers of the public organizations make analyses because of
future research on specific country part.
It is obvious that by the help of a new technology, using geographical dependant
information can be researched and improved better the process of innovations used in
the public sector.
4. SPATIAL DATA INFRASTRUCTURE ASSESSMENT
The Spatial Data Infrastructure (SDI) carries a lot of benefits to the information society
with its implementation. There arises a need for SDI assessment because of the changes
in government fiscal policies, market-oriented economies and the further development
of first generation SDIs. The sum effect is that governments, as main financiers of SDI,
are now demanding that methodology be put in place to justify the implementation of
SDIs before additional funds can be accessed (Stewart, 2006).
SDIs are usually complex, with various components, many stakeholders, monopolistic
tendencies and therefore, will have complex performances. A consequent of the
maturity of first generation SDIs is the fact that they will require or soon will require
reengineering and recapitalization to transform them into SDIs capable of providing the
services demanded by current and future users (Giff G., J. Crompvoets, 2008). For
example SDIs may require technological upgrades, more effective policies to better
support their objectives. In some cases this means more current e-government
initiatives, informed decision-making, sustainable development, more flexible land
administration systems, national security. Therefore, SDIs must be assessed within these
objectives and performance information on these objectives reported to the financiers.
5. GIS FOR GETTING OVER CRISIS SITUATIONS – BULGARIAN
CASE STUDY
In the current environment of lage cities with millions inhabitans and business
companies the public organizations are dealing with a great amount of data that are
stored in different formats and on various places. Because of the aim to take better
managerial decision the data are to be integrated and analyzed. GIS are able to integrate
and connect data including spatial component independently of data source. GIS also
helps for combination the spatial location of the objects and the descriptive information
(attributes) for the objects. For example data for citizens may be connected with
addresses; buildings in the city may be connected with plots and streets with networks.
The information in the system is combining and visualizing in several layers and that
way helps in better comprehension of events and interconnections between objects. As
a result the person responsible to take decisions for better government the large city may
become aware of the realtion between posted data and final decision. GIS takes in

International Conference SDI 2010 – Skopje; 15-17.09.2010
138
consideration automatically all available data and that way the possibility for better
managerial activity is real.
Because of the tendency for optimizing the administrative structure in Bulgarian
administration, the chahges on organizational level are recently made. The
administrative structure responsible now for crisis management are based in the
Ministry of Internal affairs and in the Ministry of Transport, Information Technologies
and Communication.
The Executive Agency ESMIS, founded in September 2009 under the management of
the Ministry of Transport, Information Technologies and Communication uses
integration of distance and geoinformation technologies for crisis management. The
goal of the Agency is to develop and support the National Portal for spatial data. During
the process of administrative changes a project BulgaRisk is started in 2008 with the
aim to integrate satellite images in the process of risk management for natural disasters
in the country. According the plan of the European Comission, the members of EC will
make a risk assessment for the water basin’s beds till 2011 and prepare crisis recovery
plans till 2013.
5.1. Checking and tracking of events danger for environment and people.
Because to secure the citizens in the large modern cities the government should use
modern technologies and innovative decisions for public services. Fires arise from
natural occurrence or because of human intervention.
For the purpose the equipment for functioning GIS systems is two terrestrial satellite
stations that receipt and process data in real time. Via Internet the stations send satellite
images with 32 m resolution.
GIS uses centralized geodata base with special information for the objects like
structures, events, critical infrastructure and operation that should be taken in the time
of crisis. The systems are analyzing and estimating the current status of the atmosphere,
land and water surface. For example if about any place the information for the rainfall is
compared with the air pictures from the same place is possible to define the places
where all the year there is water.
GIS makes analysis of output data and marks the position with x, y and z coordinates
for length, width and height or with another geocodes, like post code or road milestone.
Any variable is possible to be entered in GIS and to be positioned in the space. The
system converts any information in digital form. The system is used for localization of
fires on the base of satellite data recent to the real time. The image is accompanied with
geocoordinates of the fire, information for the damage area and fire intensity. Data for
atmosphere pressure, direction and speed of the wind are represented in graphical type.

International Conference SDI 2010 – Skopje; 15-17.09.2010
139
Fig. 1. Fire detection for Bulgaria.
The use of the system is for more effective operating in prognosis, planning, prevention,
preparation and operation of arising crises. The system covers all stages in the crisis
action. For proper functioning of the system a support of the actual state of information
is needed. Information covers all about the territory, forces of reaction, available
resources in exact territory, critical infrastructure near the territory, meteorological
status and other important factors.
GIS integrates the information entering of different sources, makes georeferenting and
submits a new, qualitative view on the integrated information. An example about
information hold in the system is whether the fire brigade has enough a specialized
technique for dealing with a concrete fire (Fig.1). The system is functioning at several
levels. The first two levels communicate each other and integrate the information. At
the first level a centralized data base is used storing always actual information. On the
second level the county administrative organization have the opportunity to enter and to
use information and then to coordinate the activities against crisis. The lowest level is
the local government. It is the main source for input actual information in the system
because the events are happened at local level, also most of the crises are happening
locally. In case of destroying the communications between the levels GIS continues to
function. The reason is that the exchange of information may realize via Internet or
through external electronic device.
Functioning of the system via Internet has no special requirements for installation, that
way the staff has a quick access to the system in the time of crisis. The information
flows easy to the media. That way is possible control over the published information on
purpose to help the quick decision of the crisis.

International Conference SDI 2010 – Skopje; 15-17.09.2010
140
Information that helps to foresee some types of crisis is stored continuously in the
system. For example if there is data for a concrete place that at summer time often are
getting big fires or floods, these disasters may be predicted and timely to take measures
for prevention. Data integration helps to find hot points of crisis, to analyze and to
prevent future disasters.
5.2. Forest fire in Dabovo.
Using integration of GIS data and satellite data on Fig. 2 is shown a map of forest fire at
2007 in the area of village Dabovo, Stara Zagora district. On the map are shown the
satellite images from Disaster Monitoring Constellation with resolution 32 m before the
fire, at the time of the fire and after the fire. It is clearly shown the affected territory, the
fire at the stage of advance and the direction of smoke dissemination. For evaluation of
the after-effects data from Corine Landcover are used.
Fig. 2. Fire in Dabovo.
During the time of crisis is very important factor the reaction forces because of victims.
Except of fire the crisis may be earthquake, landslide, flood or other. GIS uses systems
for tracking GPRS and tracks the actual information. That way in every minute there is
information about the place of ambulances, fire brigades. It is possible immediately to
send help to victims. The staff for saving operations may be informed using mobile
communication for the progress of disaster. At the same time the staff may enter
information in the system using various communication channels.
Also may of data at the time of disaster are available using satellite pictures. For
example that way may be found easily arising forest fires.

International Conference SDI 2010 – Skopje; 15-17.09.2010
141
5.3. Examples of other GIS applications in the country.
Monitoring of snow cover on the territory of Bulgaria is a demonstration of application
the integration between GIS and distance measurement. Satellite images from the
stations MODIS are used. The resolution is 500 m, the applied index, received from the
data bases of satellite stations NOAA, gives information for the status of the snow cover
over the territory of the country. As a result of integration a one-day and long-time
images of the snow cover on the territory of the country are got. The images are as a
result of processing with ERDAS.
A National data base and a spectral library exist on the base of archive index of
vegetation and agro climate data for the country. For the territory of Bulgaria are
defined “standard areas” and a catalogue is published with all processed data and results
from estimation the index dynamics of vegetation for the basic agriculture crops.
The data base gives the opportunity to estimate and analyse the results for the last 10
years. That way there is information about the years with worst and optimum conditions
for agriculture crops growth. This data base is used as a base for comparison for future
and for monitoring of the drought and dry.
Another example of GIS application is the real functioning of the system at the time of
explosion in the military section in Chelopechene, on 03.07.2008. On the fig.3 is shown
a satellite image, integrated in GIS environment, at the time of damage. The location of
the explosion is clearly seen, also the direction of smoke wind. Upper right – the land of
the district according Corine Land cover, where the place of explosion is drawn in
Black Square. Down left – satellite image of the district before the explosion - the place
of explosion is drawn in Black Square. Down right - satellite image of the district after
the explosion – the effects are shown in dark grey, with black border.

International Conference SDI 2010 – Skopje; 15-17.09.2010
142
Fig. 3. The explosion in Chelopechene.
6. CONCLUSIONS
GIS application for dealing with crisis situations helps in many aspects as is shown in
the examples. First of all the information about the place, size of the fire is detailed and
currently actual. The changes in the situation are tracking from the system also. GIS
helps the responsible people to be informed about technical and human resources
available at the moment near the crisis. That way the system helped for better
management of the crisis. Management of crises is an important factor for better
government of the places where are living many peoples as in the big cities.
In other aspects GIS prevents from disasters connected with natural effects like drought,
heavy snowfall, cool weather.
In a security-related applications, and in particular crisis management, satellite-derived
information plays an essential role as a synoptic, independent and objective source,
especially in the case of international controversy and conflict related issues. Spatial
information allows us to understand cities better and to make better decisions about
them as a result. The city of tomorrow will be built upon a foundation of sustainable
processes that will generate cleaner air, water and higher energy efficiency while
delivering revolutionary transportation systems and quantifiable numbers to prove
quality living exists.

International Conference SDI 2010 – Skopje; 15-17.09.2010
143
7. REFERENCES Abie, H., Foyn, B., Bing, J., Blobel, B., Pharow, P., Delgado, J., Karnouskos, S., Pitkanen, O., &
Tzovaras, D., 2004. The need for a digital rights management framework for the next generation
of E-Government services. Electronic Government, an International Journal, 1(1), 8−28.
Arduini, D., et al., 2010. Technology adoption and innovation in public services the case of e-
government in Italy. Inf. Econ. Policy.
Barras, R., 1986. Towards a theory of innovation in services. Research Policy 15, 161–173.
Clark, J., Good, B., Simmonds, P., 2008. Innovation in the Public and Third Sectors, National
Endowment for Science, Technology and the Arts (NESTA) Innovation Index Working Paper,
London.
Deakins, E., & Dillon, S. M., 2002. E-Government in New Zealand: The local authority
perspective. International Journal of Public Sector Management, 15(5), 375−398.
Fletcher, P. D., 2004. Portals and policy: Implications of electronic access to U.S. federal
government information and services. In A. Pavlichev, & G. D. Garson (Eds.), Digital
government: principles and best practices (pp. 52−62). Hershey, PA: IdeaGroup Publishing.
Giff G., J. Crompvoets, 2008. Performance Indicators a tool to Support Spatial Data Infrastructure
assessment. Computers, Environment and Urban Systems, 32 365–376.
http://site.ebrary.com/lib/nbu/Doc?id=10170926&ppg=70. Putting People on the Map: Protecting
Confidentiality with Linked Social-Spatial Data, 2007. Panel on Confidentiality Issues Arising
from the Integration of Remotely Sensed and SelfIdentifying Data (Contributor); National
Research Council (Contributor). Washington, DC, USA: National Academies Press.p 70.
Norris, D. F., & Moon, M. J., 2005. Advancing E-Government at the grassroots: Tortoise or hare?
Public Administration Review, 65(1), 64−75.
Richardson, C., 2004. Digital government: Balancing risk and reward through public/private
partnerships. In A. Pavlichev, & G. D. Garson (Eds.), Digital government:
Stewart, C., 2006. Results-based management accountability framework. GEOIDE/
GeoConnections workshop on value/ evaluating spatial data infrastructures, Ottawa, Ontario,
Canada.
Tsai N., B. Choi, M. Perry, 2009. Improving the process of E-Government initiative: An in-depth
case study of
web-based GIS implementation. Government Information Quarterly, 26. pp. 368–376.
Yildiz, M., 2007. E-Government research: Reviewing the literature, limitations, and ways
forward. Government Information Quarterly, 24(3), 646−665.
6. BIOGRAPHICAL NOTES OF THE AUTHORS
Maria Nikolova has M.Sc. Degree in Computer Science at Technical
University, Sofia. She achieved PhD Degree with a dissertation “E-
government models for communication between administration and
business” at State University of Library Studies and Information
Technologies, Sofia. Maria Nikolova has attended Master class on
eGov Training Methods & Tools, 2007 in Hague, Netherlands.
Her professional experience is as a lecturer at New Bulgarian
University, Sofia and as a Senior Lecturer, International University College, Sofia.
Her research activity is as a Project Manager of HESP international project "Management
Information System, Research Scientist in the Institute of Information Technologies.
Maria Nikolova has many publications in the Proceedings of International Conferences on the
theme of e-government. Her interests are in the area of information technologies as a tool for
better government, e-business and innovations.

International Conference SDI 2010 – Skopje; 15-17.09.2010
144
SPATIAL INFORMATION IN MEGACITY MANAGEMENT
Paul KELLY1, Robin McLAREN
2, Hartmut MUELLER
3
ABSTRACT
FIG Commission 3 performed an extended research on the need for Spatial Information
Management particularly caused by the processes related to worldwide rapid urbanization. The
result of the research study was published in FIG publication 48. This paper mainly presents the
contribution of FIG Commission 3 working group WG3.2 ’Using Spatial Data Infrastructures to
Manage Cities’ to the report. An extensive Internet research was performed to document existing
City SDIs in relation with the corresponding National SDIs, on site visits to a selected number of
megacities and interviews with individual decision makers in city administrations took place, data
received from questionnaires were reviewed and assessed.
Key word: Spatial Information Management, Urbanization, Megacities, SDI assessment, City
SDI
1. INTRODUCTION
City administrations of large cities often are confronted with a multitude of key
problems, like informal settlements (land tenure, development approvals, building
control), traffic management, natural hazards (floods, earthquakes, fires), unclear
responsibilities and mandates (within or between administrations), uncoordinated
planning, water management (fresh water supply and waste-water disposal), provision
of continuous electrical power, visual pollution and garbage disposal, air and water
pollution control. To manage such problems adequately, urban governance urgently
needs comprehensive, reliable and easy accessible spatial data, in other words, a well-
functioning spatial data infrastructure (SDI), see Doytsher et al. (2010).
The working group has adopted a pragmatic approach, based on working with
administrations in mega cities (populations greater than 10 million) to identify key
problems they face both now and in the future; and then provide materials that foster
1 Paul KELLY, [email protected]
Spatial Strategies Pty Ltd
Tel.: +614 3727-4449.
Managing Director, Spatial Strategies Pty Ltd, Sydney, Australia
Chair of FIG Commission 3 Working Group 3.2 2 Robin McLAREN, M.Sc.E., [email protected]
Know Edge Ltd
Tel.: +44 131 443-1872, Fax: +44 131 443-1872
33 Lockharton Ave., Edinburgh EH14 1AY, Scotland, UK. 3 Prof. Dr. Hartmut MUELLER, [email protected]
Mainz University of Applied Sciences
Tel.: +49 6131 628-1438, Fax: + 49 6131 2859 699
Lucy-Hillebrand-Str.2, D-55128 Mainz, Germany Co-chair of FIG Commission 3 Working Group 3.2

International Conference SDI 2010 – Skopje; 15-17.09.2010
145
further development of international best practice in the use of SDI to better manage our
cities (Kelly et al., 2009).
2. KEY PROBLEMS OF URBAN AREAS
2.1 Survey amongst city administrations
The working group developed a questionnaire about current problems facing mega
cities and their current use of SDI. The questionnaire was distributed to contacts in 13
mega cities. A number of city administrations responded to the questionnaire. Also, the
working group facilitated fact-finding visits to interview senior administrators in a
further three cities.
In all, initial data was obtained from 7 cities either by their direct response to the
questionnaire (Q) or by a personal visit and interviews by working group members (V),
see Table 1.
2.2 Interpretation of survey results
Informal settlements are a problem in only some cities. Further research may indicate
that it is a problem mainly in countries where development controls and tenure systems
are immature and land administration capacity is low (Enemark and McLaren, 2008). A
particular problem reported by one city is development being allowed in water
catchment areas used by the city, but not under development control of city planning
authorities. Some of the experience with planning and development laws, regulations,
procedures and systems used in some of the cities may be useful to others.
Table 1. Key Problems Facing City Administrations
Problem Hong
Kong
SAR
(Q)
China
Tokyo
(Q)
Japan
Seoul
(Q)
Korea
Istanbul
(V)
Turkey
London
(V)
United
Kingdom
New
York
City
(V)
USA
Lagos
(Q)
Nigeria
Informal settlements
(land tenure,
development
approvals, building
control)
N Y N Y N N Y/High
Traffic management Y/Med Y Y Y Y N Y/High
Natural hazards
(floods, earthquakes,
fires)
N Y Y Y Y Y Y/High
Unclear
responsibilities and
mandates (within or
between
N N N N N N Y/High

International Conference SDI 2010 – Skopje; 15-17.09.2010
146
administrations)
Uncoordinated
planning
N N - N N N Y/High
Water management
(fresh water supply
and waste-water
disposal)
Y/Med Y N Y N N Y/High
Provision of
continuous electrical
power
N Y N N N N Y/High
Visual pollution and
garbage disposal
Y/Med Y N N N Y Y/High
Air and water
pollution control
Y/Med Y Y N Y Y Y/High
Population growth - - - Y Y - -
Traffic management is a common problem. City transport and police agencies were not
part of the initial information gathering. Given the commonality of the problem, this
may be an area for further study.
Natural hazards and emergency management were high on most cities’ lists. Risk
profiles from floods, fires, earthquakes and other hazards differ between cities, but
capacity to plan, prepare, respond and recover from disasters is a common issue.
It appears that unclear responsibilities and mandates (within or between administrations)
is not a major issue for most cities. However, all cities appear to have problems with
overlapping responsibilities amongst internal and external agencies, leading to
operational dysfunction such as a multitude of agencies holding non-accessible spatial
data. It is clear that solutions to problems facing mega cities require concerted response
from many internal units and regional and national agencies in areas such as planning,
infrastructure, development and land use controls, transportation, environmental
management and water management. Mandates might be clear, but rationalisation of
functions and more effective levels of cooperation may still be needed.
It seems that in many mega cities, the city administration does not have responsibility
for all matters covering the full area of the city. Several cities reported that their city
administration did not have control over development, but rather it was the
responsibility of local government units (an average appears to be around 30 municipal
authorities within the area of the “greater city”). In some cases, other levels of
government had land use and development control responsibilities. So, even if city
planning is centrally coordinated, often city administrations have little control over the
implementation (i.e. land use and building controls) of these plans. In short, some city
administrations have control over key city development functions; others do not.
The influence of megacities reaches out well outside their administrative boundaries to
the peri-urban and regions beyond. It is essential that the greater region is managed
holistically to maximise the economic benefits of the city. This places even greater
emphasis on effective governance of the larger region, cooperation in planning and
development control and sharing information.

International Conference SDI 2010 – Skopje; 15-17.09.2010
147
Another area for further study may be the role of infrastructure providers, such as utility
services, not being part of the planning and development process. In many cases, these
authorities are not part of the city administration, being privatised or at another level of
government.
Environmental management, especially pollution control is another problem area
reported by several cities. Again, the experience of some cities in managing
environmental problems may be useful to others.
The inevitability of further population growth is likely to be a common issue. Some
cities reported that their administrations have little control on population growth. It was
a regional or national issue and needed to be addressed at that level. However, city
administrations need to address the consequences of growth, which will add further
stress to existing systems and facilities, even for those cities not experiencing problems
at the moment. Just finding enough housing for people will be a common problem.
Monitoring population change effectively and being able to respond through planning
and infrastructure development will be major challenges.
3. SDI AVAILABILITY IN THE WORLD’S LARGEST CITIES
3.1 SDI availability by geographic region
This section presents the results of an internet investigation, collecting information
about current use of SDI in the world’s largest metropolitan areas. A short overview of
general NSDI development for all countries of the world holding at least one mega city
will be provided as will be the use of SDI or comparable initiatives in the associated
metropolitan areas. Indicators for assessing spatially enabled government services were
described by Ezigbalike and Rajabifard (2009). Leaving legislative and organisational
SDI aspects aside, the evaluation presented here focuses on the technical aspects of the
use of spatial information technology in mega city management. The classification of
the results is done on the basis of usability and accessibility of spatial data which was
identified by the internet search.
Like in the home countries of the mega cities, the application of spatial information
technology in the mega cities of the world is largely diverse. Table 2 shows the
availability of digital spatial data in the mega cities under review. The application of
spatial information technology in the cities under consideration varies considerably. It
starts from the provision of simple WebGIS applications which only show the road
network and some less basic data like in Jakarta or Mumbai, it comprises advanced
applications which enable the presentation of social, economic, ecological and urban
information related to the city (e.g., Buenos Aires, Los Angeles, Paris) and it ends up
with highly elaborated comprehensive distributed information systems which can be
found in Seoul, London and New York City.

International Conference SDI 2010 – Skopje; 15-17.09.2010
148
Table 2. Application of SDI in the world’s mega cities
SDI
development
status
unknown
SDI master
plan
available
Primary
spatial
data
available
Secondary
spatial data
available
Spatial data
accessibility
available
Bangkok ●
Beijing ●
Buenos Aires ●
Cairo ●
Delhi ●
Dhaka ●
Guangzhou ●
Istanbul ●
Jakarta ●
Karachi ●
Lagos ●
London ●
Los Angeles ●
Manila ●
Mexico City ●
Moscow ●
Mumbai ●
New York ●
Osaka ●
Paris ●
Rio de Janeiro ●
Sao Paulo ●
Seoul ●
Shanghai ●
Tehran ●
Tokyo ●
Figure 1 gives a geographic overview of SDI availability in the world’s megacity
hosting regions (Boos and Mueller, 2009a, Boos and Mueller, 2009b).

International Conference SDI 2010 – Skopje; 15-17.09.2010
149
Figure 1: SDI availability in the world’s mega cities and their home countries
3.1.1. SDI application in the African region
NSDI in Egypt is still rudimental. Considering the underdeveloped NSDI of Egypt, it is
no surprise, that for the city of Cairo no information concerning SDI development or
comparable initiatives could be found.
Nigeria started the implementation of a National Geospatial Data Infrastructure (NGDI)
in 2003 (Federal Ministry of Science and Technology of Nigeria, 2003). In 2007, the
government of Lagos constituted a committee for the provision of a fully digital
mapping and enterprise GIS for Lagos State. The policy framework adopted by the
administration for the development of Lagos should be reached by generation and
sharing of information with organised private sector, developing skilled and
knowledgeable workers.

International Conference SDI 2010 – Skopje; 15-17.09.2010
150
3.1.2. SDI application in the Asia-Pacific region
In Bangladesh no official NSDI exists. In accordance with the rudimental national SDI
initiatives in Bangladesh in Dhaka neither city SDI nor any WebGIS application or
similar was identified.
China has paid great attention to construct the Digital China Geospatial Framework
(DCGF). A series of fundamental spatial databases was completed as the kernel of
DCGF. A fully digital nationwide spatial data production system is widely established.
In 2002, the Shanghai Municipal Government announced the “Digital City Shanghai”
strategy. In this context a distributed WebGIS application for managing landscape
resources was developed, which allows the connection of all landscape bureaus of the
city where data are kept locally for maintenance and updates. These data are also
available online to the central bureau and other local bureaus. In 2004, the city authority
of Guangzhou, the capital city of south China, initiated the Digital Municipality of
Guangzhou (DigiM.GZ) project which aims to represent the Guangzhou metropolitan
area as a digitalised virtual municipality by using a wide range of up-to-date GIS and
telecommunications technologies. In Beijing, the Beijing Digital Green Management
Information System is available, which integrates a database of Beijing landscaping
areas and a database of social, economic, ecological and urban infrastructure.
The NSDI scheme in India (established in 2001) aims at using GIS to merge satellite
imagery and ancient topographic maps with data on water resources, flooding, rainfall,
crop patterns, and civic layouts to produce 3-D digital maps. Another objective of the
Indian NSDI is to achieve a national coverage of all forest maps, land use, groundwater
and wasteland maps, pollution data, meteorological department's weather-info and
department of ocean development's sea maps. In 2005/06 in the Handni Chowk area of
the walled city of Delhi, a pilot study on generating a 3D-GIS database was
accomplished. The database was created by using a base map at scale 1:2500, high
resolution satellite data, ground control points, video of the area, high resolution DEM
from LiDAR/ ALTM and by 3D GIS data processing and analysis software. In Mumbai
various GIS applications for small areas with different aims have been made. The
Mumbai Metropolitan Region Development Authority (MMRDA) recognised the
usefulness of this technology and thus proposes in its Regional Plan (1996-2011) to
build up a Regional Information System. These developments may be stimulated by the
Collective Research Initiative Trust (CRIT) that plans to generate an open-access SDI
and a set of simple tools and applications for knowledge transfer and participatory urban
planning by communities and citizens in Mumbai.
The Indonesian NSDI aims at improvement of coordination mechanism, completion of
spatial databases and national metadata developments, activation of national
clearinghouse and development of Digital Indonesia. The city of Jakarta has a simple
WebGIS application, which represents the road network of the city and enables different
search functions to find streets and points of interest.
In Iran, national organisations, ministry and municipal offices as well as private
companies are active in the field of mapping and spatial data production. The Tehran
municipality, Public & International Relations Department committed to the
development of a WebGIS with more than 140 layers.

International Conference SDI 2010 – Skopje; 15-17.09.2010
151
In Japan, the NSDI is implemented by the Geographical Survey Institute (GSI) and
different ministries, who began their work on the Spatial Data Framework in 1995 and
completed it in 2003. The future work of the Japanese NSDI concentrates on a new
infrastructure concept, which is promoted as "Digital Japan" and which shall lead to a
virtual and real-time representation of the land. Concerning the two Japanese mega
cities Osaka and Tokyo, the internet investigation could not extract any specific SDI-
initiatives, although the survey response from Tokyo indicated that base mapping and
agency-specific spatial applications do exist. Both cities developed long-term master
plans, where principal goals for city planning are formulated but no SDI strategy could
be identified.
In Pakistan no official NSDI was established. In its “Megacities Preparation Project”
from 2005 Karachi’s government schedules the development of digital maps of the city
by using GIS technologies.
First official activities for establishing an NSDI in Philippines were initiated in 2001.
As a member of a developing country Metro Manila has not yet a comprehensive SDI
available. A Disaster Management Information System called “Metro Manila Map
Viewer” was developed in 2004.
The first phase of an NSDI Master Plan for South Korea was completed in 2000. Basic
GIS infrastructure has been established by producing various kinds of digital maps. The
second phase of the NSDI, which started in 2001, concentrated on spreading GIS
application for maintaining the digital maps and developing national standards. The city
of Seoul has at its disposal a widespread SDI on the technical base of several distributed
GIS applications like Urban Planning Information System, Road Information System,
Soil Information System, and other municipal affairs Information Systems. A Spatial
Data Warehouse is available which provides for sharing and accessing the different
spatial data of the GIS systems via a GIS Portal system.
Development of the Thailand NSDI fits very well with the Thai Government’s scheme
for a comprehensive utilisation of Information Technologies to support administration
and public services. The key mechanism is the development of e-Government in which
GIS is a key component and plays an important role in providing for dynamic
information to support better governance of the country. For the city of Bangkok there
is a webpage in Thai language that seems to grant access to a comprehensive collection
of spatial data in different GIS applications.
3.1.3. SDI application in the European region
In France there is no explicit overall governmental initiative to develop an NSDI even
though a geoportal was launched in 2006 and a multitude of NSDI-like initiatives are
undertaken. In Paris a WebGIS application gives access to the most important spatial
data about the city. It is possible to access a series of thematic maps through a
multiplicity of data layers
Russia’s NSDI concept schedules a three stage process, which should be finalised by
2015 with the implementation of the national NSDI. For the city of Moscow no specific
SDI solution information could be found during the internet investigation.
There are several persisting problems in the field of SDI in Turkey: lack of coordination
between institutions; no standardisation, neither with regard to the spatial reference

International Conference SDI 2010 – Skopje; 15-17.09.2010
152
system, nor to data quality or data exchange; data duplication; the majority of large
scale data not available in digital format; interoperability does not (yet) exist; lack of
expert personnel and budget; and a lot of difficulties to share data. Istanbul's Water and
Sewerage Administration (ISKI) developed the Infrastructure Information System
(ISKABIS) to control and manage extensive water and wastewater facilities for the
Istanbul Metropolitan Area with more than 30 applications implemented The city
administration of Istanbul provides for a WebGIS, which represents the road network
for the metropolitan area of Istanbul containing a precise division into lots and house
numbers, orthophotos of different years and a range of thematic information, as well.
There is now a formal Location Strategy for the United Kingdom with a single
organisation with responsibility for its establishment and coordination. The country as a
whole has a well developed GI sector, with extensive datasets available from both
public and private sector sources. The government of the city of London provides for
the City Online Maps Project Accessing Spatial Systems (COMPASS), which aims at
improving access to information about the city of London through a unique access
point. One remarkable SDI application in London is the Newham Neighbourhood
Information Management System (NIMS), where users gain access to data on
economic, social and environmental conditions of the borough.
3.1.4. SDI application in the Pan-American region
In 2004 the National Geographic Information System of the Republic of Argentina
(PROSIGA) started as an Internet distributed GIS, in which seven specific SDI working
groups are present: Institutional framework, Policy and Agreements, Fundamental and
Basic Data, Metadata and Catalogues, Diffusion and Communication, Training, Search
Engine for Geographic Names and IT for SDIs. The department of Geographic
Information Systems of the city administration of Buenos Aires developed a widespread
WebGIS application built up on open source components and integrating a multiplicity
of spatial data of the city. The GIS covers a range of applications like health, education,
tourism, sports, culture, leisure, green spaces, social services, transportation etc. and
enables access to information up to parcel units.
The Brazilian cartographic community, in particular Federal Government agencies,
made great efforts to constitute an NSDI in Brazil. Map servers offer diverse
information and provide for geodata of the whole country. The department for planning
of the city of Sao Paulo makes an internet portal available, which enables access to a
multiplicity of statistical data, thematic maps and allows for the visualisation of
infrastructural data in a WebGIS client. For Rio de Janeiro the department of city
planning offers digital maps and databases of the municipality of Rio in a Geoportal and
allows for download of statistical tables, maps and spatial data.
The Mexican NSDI implementation has been led by the National Institute of
Geography, Statistics and Informatics (INEGI) since 1997. INEGI developed an internet
presence (GeoPortal), where users can view and download a series of spatial data,
including appropriate metadata. For the Mexican mega city Mexico City the internet
investigation did not extract any specific SDI-like-initiative.
The United States clearinghouse was established in 1994 with the US Federal
Geographic Data Committee (FGDC) responsibility of NSDI implementation. The
NSDI major development focus is at the United States federal level, although efforts

International Conference SDI 2010 – Skopje; 15-17.09.2010
153
have been made to support coordination at State level as well. Spatial data are provided
in a nationwide geoportal offering a multiplicity of functions to access, publish and
share spatial data in a widespread number of categories. An Interactive City Map of
New York City provides information on transportation, education, public safety, resident
service and city life. The office of Emergency Management operates a GIS, which maps
and accesses data — from flood zones and local infrastructure to population density and
blocked roads — before, during, and after an emergency case. Beyond that the City
government runs a spatially-enabled public website called ACCESS NYC, which has
the capability to identify and to display over 30 City, State, and Federal human service
benefit programs to explore appropriate services for the individual users needs. The Los
Angeles city administration publishes a collection of interactive maps containing
information on traffic, parcels, flooding, city services, leisure, among other information.
3.2. Current Use of Spatial Data within interviewed city administrations
It was interesting to note that those senior administrators interviewed by the working
group candidly admitted the importance of spatial data and analysis in helping them do
their job. As users of spatial information, they personally believed that access to timely
and accurate spatial data and tools was a key requirement in managing functions such as
city planning.
Correspondents reported widespread use of spatial data in a range of city functions,
including:
� Land registration and tenure administration;
� Cadastral survey, mapping and data management;
� Policy development, planning and citizen engagement;
� Land use and development control;
� Transportation planning and road or highway management;
� Public works, infrastructure development and maintenance;
� Environmental protection;
� Coastal, ports and marine management
� Law enforcement and security;
� Public health management;
� Visualisation of urban environment, demographic trends and social conditions for
use by elected officials and citizens.
In fact, collection and usage is so widespread that data integration, access and use was
hampered by the diversity of data holdings and systems managed by individual units.
Getting data for planning processes, for example, can be difficult, costly and slow.
Fundamental data management standards were not being used.
Access to data held by other levels of government was also problematic. Collating data
across internal units and external agencies was an impediment to providing timely
information to citizens.
All cities reported that they had at least some elements of an SDI. Most cities reported
that they had only small “central” GIS units, under-resourced and generally incapable of
providing a comprehensive citywide SDI. Missing capabilities included no common
metadata, spatial data policies and standards, formal data sharing arrangements between
units or agencies or shared data access mechanism.

International Conference SDI 2010 – Skopje; 15-17.09.2010
154
Most do not have a formal “GIS strategy” across the whole administration. However,
most countries covered by this project have national (and in some cases regional) SDI
strategies. Unfortunately, at this stage it is not clear to the working group what
connection there is between national and local strategies or how national strategies will
meet the needs of cities.
Some cities have developed an intranet that could be used to access spatial data held
across multiple units.
The results of the survey and internet search show that several cities have invested in
providing access to spatial data as part of public websites, reporting information about
aspects of city administration such as land tenure, use, planning, environmental and
disaster management information. These could be used as exemplars by other cities.
4. CURRENT NEEDS
4.1 Key tools needed to address problems
Some key tools needed to address megacity problems were identified by the study.
These included:
� Strengthening planning laws to cover not just the planning process, but the
monitoring and implementation of the laws and to ensure that the planning process
is guided by economic and environment development strategy.
� Planning and development control over water catchments and other sensitive areas
affecting the city.
� Improved governance to provide good communication between all city units and
strong partnerships between the city administration and agencies at other levels of
government, especially in infrastructure development and maintenance.
� Coordinated planning and implementation involving transportation, utilities and
other infrastructure providers.
� Working with the private sector to ensure financial and property markets have the
capacity to meet current and future needs for jobs and housing.
� A strong focus on disaster management, including coordinated planning,
preparation, response and recovery operations.
� In the developing world, a stronger focus was needed on good governance,
institutional development and capacity building.
� Encourage the use of crowdsourcing to capture spatial information to complement
the official sources.
� Ensure that aid agencies delivering projects within the cities provide spatial data
based on international standards.
It should be noted that the needs of cities in the developed and developing world are
significantly different.
4.2 Most immediate SDI needs
Correspondents identified some immediate requirements to support creation or further
growth of SDI in their cities. They have differing priorities and some have already
solved these problems. Those reported include:

International Conference SDI 2010 – Skopje; 15-17.09.2010
155
� Completion of base mapping covering the city;
� Completion of conversion of base data into digital form;
� Common definitive street address file and integrated cadastral (legal, fiscal and
spatial) database;
� Solving internal institutional arrangements to provide access to existing data held
by individual units, preferably some type of policy or edict setting up a formalised
structure;
� Greater cooperation and cost sharing in new data collection, especially with other
levels of government;
� Obtaining stronger sponsorship for SDI development from senior city officials and
obtaining commensurate resources to do the job;
� A broader understanding within city administration units about the benefits of
integrating and using spatial information to do their job better;
� Access to expertise in areas such as spatial data management and ICT to build
capacity for web-based repositories and access mechanisms, data integration and
spatial data products; (sometimes this is just a matter of better access to existing
people spread across units and sometimes need for external help);
� Development of an agreed spatial data strategy, including data access agreements,
prioritisation of new data collection, sharing of resources, use of common data
standards and systems interoperability;
� A spatially-enabled one-stop citizen interface.
5. CONCLUSIONS
The aim of FIG Commission 3 working group WG3.2 is to support development and
use of spatial data infrastructure (SDI) by city authorities in the world’s largest cities.
SDI developments in existing mega cities were reviewed, current problems and issues
and use of SDI was identified. The results may be used for future consideration.
6. REFERENCES Boos S, Müller H., 2009a. Current use of spatial information technology in megacity
management. Nordic Journal of Surveying and Real Estate Research - Special Series. Bd.
Vol. 4. 2009, pp 6-24.
Boos, S., Müller, H., 2009b. Evaluation of spatial information technology applications for
megacity management. Loenen, B. van, Besemer, J.W.J., Zevenbergen, J.A. (Eds.). SDI
Convergence. Research, Emerging Trends, and Critical Assessment. Delft, The Netherlands,
pp 189 - 203
Doytsher, Y., Kelly, P., Khouri, R., McLaren, R., Potsiou, C., 2010. Rapid Urbanization and
Mega Cities: The Need for Spatial Information Management. Research study by FIG
Commission 3. FIG publication no. 48, 96pp. The International Federation of Surveyors
(FIG), Copenhagen, Denmark.
Enemark, S., McLaren, R., 2008. Preventing Informal Development - through means of
sustainable land use control. FIG Working Week 2008 Integrating Generations, Stockholm,
Sweden 14-19 June 2008. http://www.fig.net/pub/fig2008/papers/~
ts08a/ts08a_01_enemark_mclaren_2734.pdf

International Conference SDI 2010 – Skopje; 15-17.09.2010
156
Ezigbalike, Ch. and Rajabifard, A., 2009. Indicators for Assessing Spatially Enabled Government
Services. GSDI 11 World Conference Spatial Data Infrastructure Convergence: Building SDI
Bridges to address Global Challenges, Rotterdam, The Netherlands, 15-19 June 2009.
http://www.gsdi.org/gsdi11/papers/pdf/329.pdf
Kelly, P., McLaren, R., Müller, H., 2009. Spatial data infrastructure and the environment of urban
areas. The 7th FIG Regional Conference – Spatial Data Serving People, Land Governance and
the Environment – Building the Capacity, Hanoi, Vietnam, 19-22 October 2009,
http://www.fig.net/pub/vietnam/papers/ts03a/ts03a_kelly_mclaren_mueller_3657.pdf
7. BIOGRAPHICAL NOTES OF THE AUTHORS
Paul Kelly has extensive experience in the development of spatial
information policy and has been a senior executive in both national
and state/provincial organizations in Australia. He was Executive
Director of the national office of ANZLIC – the Spatial Information
Council of Australia and New Zealand from 2001 to 2004. He has
also held senior executive positions as Chief Information Officer of
a NSW government agency, Chief of Staff to the Lord Mayor of
Brisbane and Deputy Surveyor-General of NSW. He has degrees in
surveying, geography, history and political science. Since 2004, he
has been the Managing Director of Spatial Strategies Pty Ltd, which offers advice on
the strategic use of spatial information in government agencies and business enterprises.
Paul is the chair of FIG Commission 3 Working Group 3.2.
Robin McLaren is an independent management consultant who
excels at developing location enabling strategies and turning
business requirements into effective information system solutions
that deliver significant benefits. Since forming Know Edge Ltd in
1986, he has gained extensive experience in developing enterprise
location enabling strategies, programme and business change
management, and providing independent advice to support
Information Systems procurement. He thrives in complex
situations and has been involved in key UK projects that have significantly shaped the
GI sector in recent years, such as the National Land Information Service, National
Addressing initiatives and the UK Location Strategy. Robin is an internationally
recognized expert in Land Reform / Land Information Management Systems. He has
worked extensively with aid agencies implementing National Land Registration and
Cadastral Systems world-wide to strengthen land tenure in support of economic
reforms; most notably as technical advisor to the Hungarian government to support their
land reform programme during the 1990s.
Prof. Dr. Hartmut Mueller got his diploma and doctoral degree in
geodesy at Karlsruhe University. After 8 years of research he turned
into the marketing and software development departments of
worldwide working enterprises for 6 years. Since 1991 he has been
working as a professor at Mainz University of Applied sciences.
Since 1998 he has been a member of the board of i3mainz, Institute
for Spatial Information and Surveying Technology. In the DVW –
German Association of Geodesy, Geo-information and Land

International Conference SDI 2010 – Skopje; 15-17.09.2010
157
Management he is the chair of working group 2 – Geo-information and Geodata
Management. He is the co-chair of FIG Commission 3 Working Group 3.2 – Spatial
Data Infrastructure for 2007-2010.

158
SPATIAL INFORMATION MANAGEMENT AND
THE CURRENT RAPID PROCESSES OF URBANIZATION
* Yerach DOYTSHER
1, Paul KELLY
2, Rafic KHOURI
3, Robin
McLAREN4, Hartmut MUELLER
5, Chryssy POTSIOU
6
ABSTRACT The goal of this research is to investigate the emerging needs, the current trends and the extent of using SDIs in selected megacities, but also to identify the emerging possibilities for using new technical tools for the governance of sustainable large urban areas applied by the surveying- mapping- data processing community.
The methodology followed includes experience gained through a four year review of existing relevant publications about the problems created in the world’s urban centres due to rapid urbanization, the SDI developments and other technological innovative achievements relevant to spatial data collection in urban areas, and Internet research on existing SDIs. A questionnaire was compiled and distributed in several administrators of most megacities and in parallel on site visits took place to a selected number of them in order to collect further information by interviews with individual decision makers in city administrations. An in-depth investigation was made on the problems addressed and the policies and practices applied by the master plan of Paris.
A review and assessment of data derived both from questionnaires, interviews and all other sources was made, and the conclusions and proposals are presented.
1 Prof. Dr. Yerach DOYTSHER, [email protected] Technion - Israel Institute of Technology, Tel.: +972 4 829-3183, Gsm.: +972 54 4690-110, Fax: +972 4 829-5708. Mapping and Geo-Information Eng., Technion City, Israel Chair-Elect of FIG Commission 3 2 Paul KELLY, [email protected] Spatial Strategies Pty Ltd Tel.: +614 3727-4449. Managing Director, Spatial Strategies Pty Ltd, Sydney, Australia Chair of FIG Commission 3 Working Group 3.2 3 Rafic KHOURI, [email protected] Ordre des Géomètres-Experts OGE Tel.: +33 1 5383-8812, Fax: + 33 1 4561-1407. 40, avenue Hoche, F-75008 Paris, France 4 Robin McLAREN, M.Sc.E., [email protected] Know Edge Ltd Tel.: +44 131 443-1872, Fax: +44 131 443-1872 33 Lockharton Ave., Edinburgh EH14 1AY, Scotland, UK. 5 Prof. Dr. Hartmut MUELLER, [email protected] Mainz University of Applied Sciences Tel.: +49 6131 628-1438, Fax: + 49 6131 2859 699 Lucy-Hillebrand-Str.2, D-55128 Mainz, Germany Co-chair of FIG Commission 3 Working Group 3.2 6 Assist. Prof. Chryssy POTSIOU, [email protected] National Technical University of Athens Tel.: +30 210 7722-688, Gsm.: +30 6944 710-817, Fax: +30 210 7722-677. 9 Iroon Polytechnion St., Athens, Greece Chair of FIG Commission 3 * Authors’ names are listed in alphabetical order

159
Key word: Spatial Information Management, Urbanization, Megacities, Data Collection, Spatial tools
1. INTRODUCTION Today there is an ever-increasing demand for the collection, integration, management and sharing of reliable spatial information, and the relevant education, experience sharing and development of best practices. This growing demand is driven by some of the most important changes in society which in turn are magnified by rapid urbanization and the conditions of the world’s megacities. It is the purpose of FIG and its Commission 3 (Spatial Information Management) to assist the profession in all aspects of spatial data management in respond to these challenges and in support of society everywhere.
During the 2007–2010 term of office FIG Commission 3 has addressed the phenomenon of rapid urbanization and its impacts. Its particular focus has been on identifying spatial tools and general principles, norms and standards for good governance using reliable and accessible spatial information and providing guidance to interested countries to successfully address the problem of rapid urbanization. A central theme has been the formal access to land, property and housing for all. Further research will focus on climate change and disaster prevention and response, and other security issues that emerge due to rapid urbanization and accelerated development. FIG Commission 3 has cooperated closely with agencies of the United Nations (UN-ECE, WPLA, UN-HABITAT and GLTN), the World Bank, ISPRS and other sister associations. FIG publication 48 is a further contribution of FIG and FIG Commission 3 in this field. This paper briefly presents the recommendations presented in this publication, which should help governments, decision makers and professionals to deal with the major challenges of rapid urbanization. 2. BACKGROUND The International Federation of Surveyors (FIG) is an international, non-government organisation whose purpose is to support international collaboration for the progress of surveying in all fields and applications. FIG Commission 3 (Spatial Information Management) has undertaken a research study about trends in the use of spatial information and technology in supporting the management of eight of the world’s largest cities. The research has included: � Management of spatial information about land, property and marine data; � Spatial Data Infrastructure, including policy, institutional and technical
frameworks; � Management and transfer of knowledge and skills in using spatial information; � Impacts on organisational structure, business models and public-private
partnerships � Spatial information management in the support of good city governance.

160
This current research study is responsive to the aims of the Commission 3 work plan and is a further contribution in this direction. It investigates the current trends in using spatial information in particular for the management of megacities, where needs are
enlarged and urgent.
Location, in the form of spatial data, is a key enabler to visualize current situations, predict impacts and enhance service delivery. Information about location is a natural integrator, capable of enabling complex analysis of spatial distribution of places, events and services; providing opportunities to link up government services, interact with customers and optimize delivery options.
The value of spatial (location-referenced) data is growing in recognition internationally. Many countries with developed economies now have policies and strategies aimed at maximizing the benefit from spatial data held by government agencies in particular. A wealth of existing map, image and measurement data can already be found in areas such as land administration, natural resource management, marine administration, transportation, defense, communications, utility services and statistical collections. The challenge is for users, both within and outside these areas of activity, to discover, access, and use this information to improve decision-making, business outcomes and customer services.
As cities get larger spatial information is becoming a key resource in efficient delivery of e-government services, public safety, national security and asset management. In this study, it is proposed that a city-wide spatial data infrastructure linked to similar structures in other levels of government, can provide a sustainable solution to many problems of megacities. Despite all the progress made in spatial data collection, modeling and dissemination, it is important to look for ways and methods to improve e-government taking into account the needs of citizens.
The goal of this research is to investigate the emerging needs, the current trends and the extent of using SDIs in selected megacities, but also to identify the emerging possibilities for using new technical tools for the governance of sustainable large urban areas applied by the surveying- mapping- data processing community. The study aims to demonstrate these technical tools, not only to governmental policy makers, but also to planners, economists, scientists, environmentalists, sociologists and all others with an interest in the life of megacities.
However, it should be mentioned that each city should build its own spatial data infrastructure, and should choose its own tools appropriate to its own social, economic and cultural environment. The publication suggests alternative ways to meet the current requirements and makes general recommendations on best practice. It does not advocate the use of any specific tools because each country has a different history and experience.
The methodology followed for this study includes: � Identification of experience gained through the general current FIG Com 3 activity
to improve management of expanding urban areas. � Review of existing publications and other sources. � Internet research on specific problems of megacities and on existing SDIs. � On site visits to a selected number of megacities and interviews with individual
decision makers in city administrations. � Review and assessment of data received from questionnaires.

161
3. URBANISATION Urbanisation is a major change taking place globally. The urban global tipping point was reached in 2007 when for the first time in history over half of the world’s population 3.3 billion people were living in urban areas (Figure 1). It is estimated that a further 500 million people will be urbanised in the next five years and projections indicate that 60% of the world’s population will be urbanised by 2030.
Figure 1. The urban and rural population of the world (source: United Nations Population
Division, 2006)
This rush to the cities, caused in part by the attraction of opportunities for wealth generation and economic development, has created the phenomenon of ’megacities’: urban areas with a population of 10 million or more. There are currently 19 megacities in the world and there are expected to be 27 by 2020 (Figure 2). Over half of this growth will be in Asia where the world’s economic geography is now shifting.
This incredibly rapid growth of megacities causes severe ecological, economical and social problems. It is increasingly difficult to manage this growth in a sustainable way. It is recognized that over 70% of the growth currently takes place outside the formal planning process and that 30% of urban populations in developing countries are living in slums or informal settlements, i.e. where vacant state-owned or private land is occupied illegally and is used for illegal slum housing. In sub-Saharan Africa, 90% of new urban settlements are taking the form of slums. These are especially vulnerable to climate change impacts as they are usually built on hazardous sites in high-risk locations. Even in developed countries unplanned or informal urban development is a major issue.

162
Figure 2. Growth of megacities and prediction
for 2015 (source: Zwingle E., 2002)
Figure 3. Increase of greenhouse gas
emissions (source: Wilbanks et al., 2007)
Urbanization is also contributing significantly to climate change. The 20 largest cities consume 80% of the world’s energy and urban areas generate 80% of greenhouse gas emissions worldwide (Figure 3). Cities are where climate change measures will either succeed or fail.
Rapid urbanization is presenting the greatest test for land professionals in the application of land governance to support and achieve the Millennium Development Goals (MDGs). The challenge is to deal with the social, economic and environment consequences of this development through more effective and comprehensive land administration functions, supported by effective Spatial Data Infrastructures, resolving issues such as climate change, insecurity, energy scarcity, environmental pollution, infrastructure chaos and extreme poverty. 4. PROBLEMS TO BE MANAGED WITHIN MEGACITIES Administrations in large cities are often confronted with a multitude of key problems, like high urban densities, transport, traffic congestion, energy inadequacy, unplanned development and lack of basic services, illegal construction both within the city and in the periphery, informal real estate markets, creation of slums, poor natural hazards management in overpopulated areas, crime, water, soil and air pollution leading to environmental degradation, climate change and poor governance arrangements (Figures 4, 5).
The inevitability of further population growth is a common issue. Some cities reported that their administrations have little control over population growth; it was a regional or national issue and must be addressed at that level. However, monitoring population

163
change effectively and being able to respond through planning and infrastructure development will be major challenges.
Figure 4. Informal settlements. Slum in Mexico City (left), Kibera, Nigeria (right)
Informal settlements are a problem in many cities. An increasing number of citizens do not have either permanent or temporary access to land and adequate shelter. This exclusion is caused, in many cases, by structural social inequalities, inheritance constraints, conflicts, non pro-poor or pro-gender land policies and land administration systems that are ineffective and expensive for the end user. Without a range of appropriate interventions being applied within the broader context of economic growth and poverty reduction policies, social exclusion and poverty will continue to spiral out of control; already 90% of new settlements in sub-Sahara Africa are slums.
Figure 5. Examples of problems in large cities: traffic congestion, energy inadequacy
(top); Garbage management (bottom left); floods (bottom right) Natural hazards and emergency management are major issues in most cities. Risk profiles from floods, fires, earthquakes and other hazards differ among cities, but capacity to plan, prepare, respond and recover from disasters is a common need.
During 2007–8 for the purposes of this research study, initial data about problems facing city administrators were obtained from seven cities (Hong Kong, Tokyo, Seoul,

164
Istanbul, London, New York and Lagos) either by their direct response to the questionnaire or by personal visits and interviews by the authors and contributors. 5. CITY GOVERNANCE Many cities appear to have problems with unclear and overlapping responsibilities amongst internal and external agencies, leading to operational dysfunction such as a multitude of agencies holding non-accessible spatial information. For example, Sao Paulo comprises component cities all with their own governance arrangements. It is clear that solutions to problems facing megacities require concerted response from many internal units and regional and national agencies in areas such as planning, infrastructure, development and land use controls, transportation, environmental management and water management. Mandates might be clear, but rationalisation of functions and more effective levels of cooperation and information sharing are needed.
Even if city planning is centrally coordinated, city administrations often have little control over the implementation (i.e. land use and building controls) of their policies and plans. For example, in France the greater Paris region, Île de France, has a regional planning authority that sets planning policies for the highly decentralized 1,280 communes (Figure 6). Political differences create tensions in the consistent implementation of these planning policies.

165
Figure 6. The greater Paris master plan project-housing (source: SDRIF, 2008)
The influence of megacities reaches well outside their administrative boundaries to the peri-urban and regions beyond. It is essential that the greater region be managed holistically to maximize the economic benefits of the city. Regional planning places even greater emphasis on effective governance of the larger region, even across international boundaries, with cooperation in planning, development control and sharing information being essential.
In many cases, infrastructure providers are not a direct part of the city administration’s planning and development process, some are private enterprises while others may be located at another level of government. This causes problems with the proactive planning and strengthening of utility services. Most megacities support some level of civil society participation in the planning and design of their services, such as citizen involvement in the urban planning process. However, spatially enabled web based services are providing new opportunities to more closely involve citizens in consultations and land administration functions.

166
6. SPATIAL INFORMATION TO MANAGE MEGACITIES The rapid growth of megacities causes severe social, economical and ecological problems. How can this growth be nurtured in a sustainable way? The challenge for land professionals is to provide the megacity ‘managers’, both political and professional, with appropriate ‘actionable intelligence’ that is up-to-date, citywide and in a timely manner to support more proactive decision making that encourages more effective sustainable development.
Spatial information has become indispensable for numerous aspects of urban development, planning and management. The increasing importance of spatial information has been due to recent strides in spatial information capture (especially satellite remote sensing and positioning), management (utilizing geographic information systems and database tools) and access (witness the growth in web mapping services), as well as the development of analytical techniques such as high resolution mapping of urban environments (Table 1). These more efficient techniques can lead to a wider diversity of information that is more up-to-date.
Table 1: Use of Spatial Data in City Administration
Inputs
Base Maps Imagery Demographics Natural and Built Infrastructure/Network Data Sensor Webs Environment Data
Spatial ↓↓↓↓ Data Tools
Data integration Information access Visualisation Spatial Analysis Spatial Planning and Modelling
Service Delivery ↓↓↓↓ Using Spatial Data

167
Urban Design
Planning codes; Land zoning; City-wide environmental plans; Smart growth; Sustainable neighbourhoods
Utility Services
Telemetry; SCADA; Micro-tunnelling; Asset mana-gement and inventory; Disaster preparedness, response and recovery
Urban Management
Development and building permits; Electronic lodgement of applications; Automated valuation/taxes
Transport Planning
Trip analysis; Scenarios; Integrated public transport networks; Real-time monitoring of movements
Environmental Justice
Sitting impacts; Best use of land resources; Placement of public facilities
Economic Development
Find available and suitable land; Workforce demographics
Community Involvement
Scenario and impact analysis, option development; 3D visualisation; Fly-throughs
Public Safety
Emergency response management; Crime modelling; Emergency dispatch and routing
Environmental Services
Optimising waste collection networks; Water storage, allocation and distribution; Environmental monitoring
Outcomes ↓↓↓↓
Performance Monitoring, Evaluation and Reporting
In some circumstances, a wealth of existing map, image and measurement data can already be found in areas such as land administration, natural resource management, marine administration, transportation, defense, communications, utility services and statistical collections. The challenge is for users both within and outside these areas of activity to break down the information silos and to discover, to access and to use the shared information to improve decision-making, business outcomes and customer services.
The study has found that spatial information technology is being recognized widely as one of the tools needed to understand and address the big urban problems, but there is still a general lack of knowledge amongst communities of practice about what spatial solutions exist and how they can used and prioritized.
Information to support the management of cities is traditionally channeled and aggregated up the vertical information highway from a local, operational level to a policy level. In developed countries, urban growth and its characteristics can normally be measured through information derived from the land administration functions. However, in the megacities of the developing countries, informal settlements are the norm, growth is rampant and administrative structures are limited. The traditional source of change information is not readily available there. 7. SPATIAL DATA INFRASTRUCTURES (SDI) FOR MEGACITIES The concept of using SDI to more efficiently manage, access and use spatial information across megacities is evolving and megacities are at different stages of their

168
implementation. The EC INSPIRE Directive has provided welcome impetus across Europe and beyond. However, most cities have no strategic framework to guide and create their SDI. This reflects the difficulty of the task to create an SDI within megacities that are organisationally complex and involve a large number of stakeholders with diverse sets of spatial information; a microcosm of the national problem.
Figure 7. Public access to parcel information of the City of Buenos Aires, Argentina
(source: http://mapa.buenosaires.gov.ar/sig/index.phtml)
City administrations have different interpretations of what constitutes an SDI, but most reported that they had at least some elements of an SDI already in place. Cities like Paris and New York have a more mature and comprehensive implementation of a megacity SDI, managed by dedicated resources. However, most cities reported that they had only small “central GIS units”, under-resourced and generally incapable of providing a comprehensive citywide SDI. Missing capabilities included no spatial data policies and standards, common metadata, formal data sharing arrangements between units or agencies, or shared data access mechanisms. It could be many years before mature and fully populated SDI emerge in megacities. However, it is important for megacities, especially in developing countries, to develop SDI capabilities in areas that will deliver the most benefits to their current pressing needs.
Most do not have a formal “spatial information strategy” across the whole administration. However, most countries covered by this project have national (and in some cases regional) SDI strategies. At this stage it is not clear what connection there is between national and local strategies or how national strategies will meet the needs of cities. Some cities, for example New York, have developed an intranet that could be

169
used to access spatial data held across multiple units. Other cities, such as Buenos Aires (Figure 7), have invested in providing access to spatial data as part of their public websites, reporting information about aspects of city administration such as land tenure, use, planning, environmental and disaster management information. Approaches like these should be used as exemplars by other cities.
Although Norway does not have megacities, the Norwegian SDI provides a model for an application of spatial data infrastructure in a democratic society enabling citizen participation in policy and decision-making for city management (Figure 8). 8. INNOVATIVE USES OF SPATIAL INFORMATION TOOLS TO
MANAGE MEGACITIES New tools, techniques and policies are required to baseline and integrate the social, economic and environmental factors associated with megacities, to monitor growth and change across the megacity and to forecast areas of risk – all within shorter timeframes than previously accepted. Moreover, they must be flexible enough to meet traditional needs such as land development, tenure and value applications, but be designed to be interoperable and integrate within the city wide SDI as it evolves. Access to integrated spatial information from the SDI will lead to more joined-up, proactive decision making allowing the prioritising of scarce resources to tackle the most sensitive and risk prone areas within a megacity.
Figure 8. Citizen Services on Norwegian MyPage Geoportal (source: Strande, 2009)
These tools must support the operation of land administration functions, but should also support the management of key problems such as disaster management, flooding

170
control, environmental management, health and transportation, for example, but also encourage economic development and reduce social inequalities.
These spatial information tools include: � Data collection & maintenance – high resolution satellite imagery (< 0.5m) is now
commercially available at an affordable rate from a number of sources with repeat coverage at a frequency greater than required for this application. This opens up the possibility to efficiently generate topographic and thematic mapping (at a scale of at least 1:5,000) and to better understand changes across the city, such as sporadic creation of informal settlements.
� Data integration and access – international interoperable information and services standards allow the possibility of the real-time merging of data and services (plug and play) from a variety of sources across the city. This will be achieved through the creation of shared, web information services to allow users access to the wide range of information held by different agencies across the city. This will be instrumental in breaking down information silos and will lead to the innovative re-use of spatial information.
� Data analysis - data mining and knowledge discovery techniques allow the integration of a wide range of spatial information and associated attribute information. This creates the opportunity to perform more effective forms of analysis and decision-making, leading to more cost effective solutions such as targeting of limited city resources for health care and maximising the economic benefits of investments in transportation.
� 3-D city modelling - many applications are enhanced by the use of 3-D spatial information, such as visualisation of planning development proposals, flood predictions, modelling population growth, tourist visit simulations and the design of transportation networks. 3-D spatial information of the natural and built environments is increasingly available, e.g. through LiDAR and terrestrial laser scanning, making many of these applications operationally viable.
� Citizen centric urban sensing – The new generation of urban sensors, including cellular phones (Figure 9), has potential for providing managers with access to a range of current spatial and environmental information about the evolving activities of their megacities. By these means peoples’ movements can be monitored; their use and modes of transport determined and people could voluntarily provide information about changes to their environment.
However a number of prerequisites are indicated: � Legislative and policy frameworks; � A system of quality analysis of information and data voluntarily submitted from
unofficial sources. � Agreement on what information can be captured and how it can be used. Citizens
can choose to opt out; to volunteer information; or to participate in incentive schemes;
� Appeals for crowd sourcing should focused on topics to help manage the city more effectively, e.g. environmental damage;
� An information infrastructure to manage, analyse and distribute urban sensed information to facilitate its widespread use in solving urban problems; and
� A communication strategy to provide transparency and to ensure that citizens understand the benefits.

171
Figure 9. Personalized estimates of environmental exposure (source: http://urban.cens.ucla.edu/)
(left); Interactive D-Tower in the Netherlands (Photo: Henk Vlasblom) (right)
It is probable that people will participate when provided with smooth and ubiquitous access to information and the ease of providing information through m-government applications, for example. The increased levels and quality of participation will most likely take time to evolve as citizens gradually realize tangible evidence of urban improvements related to their participation. One initial consequence may be that city authorities just receive hundreds of trivial requests for services. This traffic must be managed effectively and acted upon in a beneficial manner by city authorities to build trust with the citizens.
The successful introduction of urban sensing will involve considerable cultural and behavioral change of politicians, government officials, the business community and citizens and develop incrementally as policies and legislation evolve. It has great potential to fill the current gaps in urban information needed to understand the dynamics of megacities.
At the national level, no country has so far generated data management policies that truly integrate and utilise this new approach. In Doetinchem in the Netherlands, a 12 metre tall tower (Figure 9 right) maps emotions of the inhabitants. The tower changes the lights according to emotions reflected from the D-tower website (www.d-toren.nl).
Devices as citizen-activated sensors, RFID and LBS may provide government with efficient and practical means of data collection in support of urban management and environmental monitoring. However, these devices are also potential tools for citizen control by totalitarian governments. What may begin as traffic control may be adapted to crowd and demonstration control. The D-Tower of the Netherlands could easily become a device designed to give a repressive government of some other country a means of early detection and suppression of popular dissent. All such “urban sensing” devices must be subject to full public awareness and acceptance. There must be an enactment of enabling legislation. Due process must be available to the citizenry of any democracy, including judicial challenge and final adjudication.
As these devices are currently in experimental stages primarily in countries with developed economies and long established democratic processes, there may be concerns that there would be a major risk in introducing such systems in unstable governments in developing economies. Citizen participation in data collection must be voluntary and
data collection methods must be transparent and open to public understanding.

172
9. SPATIAL INFORMATION POLICY CONSTRAINTS Advances in developing megacity SDI will only occur when senior management are convinced of the benefits through experience derived from business case studies and only when SDI implementation is guided by a supportive megacity information strategy. However, it is difficult to achieve this type of strategy in the complex multi-layer governance structures of the megacities.
As spatial information is used more commonly with more citizen awareness, there is a risk of popular mistrust concerning privacy issues. It is therefore essential that policy frameworks are established legally for the appropriate use of spatial information. It is also important to raise public awareness about the benefits citizens will enjoy through SDI, mainly due to increased transparency in city governance; and the opportunity for public participation in decision-making.
It must be recognized that citizen participation in information gathering suggests certain risks like the concern for privacy; suspicion of governmental intrusion and loss of public support; the issue of quality of data collected by non professionals and the need for quality analysis; the danger of miss-use of citizen-provided information by repressive governments; and the question of the capacity of governmental agencies to monitor, evaluate, and interpret the volumes of data collected in certain urban sensing systems. 10. ACKNOWLEDGEMENTS Special thanks go to the correspondents in the seven megacities used as case studies, to Prof Rahmi Nurhan CELIK, Istanbul Technical University and Anthony ADEOYE, Lagos city administrator. To Gerasimos APOSTOLATOS, FIG Com3 vice chair of Administration and all FIG Commission 3 delegates who have participated and prepared coordinated research papers in the three annual workshops is gratefully acknowledged. To the Technical Chamber of Greece for its continuous four-year support of FIG Commission 3 relevant activities and for hosting the annual 2007 Commission 3 Workshop; to the Spanish Association of Surveyors and to DVW German Association of Geodesy, Geoinformation and Land Management for hosting the annual Commission 3 workshops; and to the French Order of Surveyors for hosting the final expert group meeting in Paris.
Special thanks to Prof Stig ENEMARK, President of FIG, for providing strategic guidance in identifying urbanization as a key global issue in supporting the Millennium Development Goals. 11. REFERENCES Strande K., 2009. "Spatial Data Infrastructure as Tools in Environment and Geohazard
Management Examples from Norway". Proceedings of the 7th FIG Regional Conference, Hanoi, Vietnam, http://www.fig.net/pub/vietnam/papers/ts01d/ ts01d_strande_3595.pdf
SDRIF, 2008. "Paris master plan project 2008"; French acronym: SDRIF.

173
United Nations Population Division, 2006. "World Urbanization Prospects: The 2005 Revision", New York.
Wilbanks T.J., Romero L. P., Bao M., Berkhout F., Cairncross S., Ceron J.P., Kapshe M., Muir-Wood R., Zapata-Marti R., 2007. "Industry, Settlement and Society". Climate Change 2007: Impacts, Adaptation and Vulnerability. Contribution of Working Group II to the Fourth Assessment Report of the Intergovernmental Panel on Climate Change, Cambridge University Press, Cambridge, UK, 357-390.
World Bank, 2009. "World Development Report 2009, Reshaping Economic Geography", The International Bank for Reconstruction and Development / The World Bank, ISBN 978-0-8213-7607-2.
Zwingle E., 2002."Cities: Challenges for Humanity", National Geographic Magazine, November 2002
http://mapa.buenosaires.gov.ar/sig/index.phtml http://urban.cens.ucla.edu/ http://www.d-toren.nl/site/ 12. BIOGRAPHICAL NOTES OF THE AUTHORS
Prof. Dr. Yerach Doytsher graduated from the Technion - Israel Institute of Technology in Civil Engineering in 1967. He received a M.Sc. (1972) and D.Sc. (1979) in Geodetic Engineering also from the Technion. Until 1995 he was involved in geodetic and mapping projects and consultation within the private and public sectors in Israel. Since 1996 he is a faculty staff member in Civil and Environmental Engineering at the Technion, and is currently the Dean of the Faculty of Architecture and Town Planning. He also heads the Geodesy and Mapping Research Center at the Technion.
He is the chair-elect (and chair for the period 2011-2014) of FIG Commission 3 on “Spatial Information Management”.
Paul Kelly has extensive experience in the development of spatial information policy and has been a senior executive in both national and state/provincial organizations in Australia. He was Executive Director of the national office of ANZLIC – the Spatial Information Council of Australia and New Zealand from 2001 to 2004. He has also held senior executive positions as Chief Information Officer of a NSW government agency, Chief of Staff to the Lord Mayor of Brisbane and Deputy Surveyor-General of NSW. He has degrees in surveying, geography, history and political science. Since 2004, he
has been the Managing Director of Spatial Strategies Pty Ltd, which offers advice on the strategic use of spatial information in government agencies and business enterprises. Paul is the chair of FIG Commission 3 Working Group 3.2.
Rafic KHOURI, born in Cairo in 1951; graduated in France with Masters in economics and demography, with a special focus on developmental issues. For twenty years, he has been the senior international officer of an important Middle Eastern humanitarian organization, in France as well as with United Nations organizations and the International Red Cross in Geneva. Involved, since ten years, in the international relations of the French licensed

174
surveyors; currently, secretary general of Geoexpert, corporate member of FIG, and senior international relations of the French Order of licensed surveyors. Member of Commission 3 of the FIG, and author or co-author of several presentations in FIG.
Robin McLaren is an independent management consultant who excels at developing location enabling strategies and turning business requirements into effective information system solutions that deliver significant benefits. Since forming Know Edge Ltd in 1986, he has gained extensive experience in developing enterprise location enabling strategies, programme and business change management, and providing independent advice to support Information Systems procurement. He thrives in complex situations
and has been involved in key UK projects that have significantly shaped the GI sector in recent years, such as the National Land Information Service, National Addressing initiatives and the UK Location Strategy. Robin is an internationally recognized expert in Land Reform / Land Information Management Systems. He has worked extensively with aid agencies implementing National Land Registration and Cadastral Systems world-wide to strengthen land tenure in support of economic reforms; most notably as technical advisor to the Hungarian government to support their land reform programme during the 1990s.
Prof. Dr. Hartmut Mueller got his diploma and doctoral degree in geodesy at Karlsruhe University. After 8 years of research he turned into the marketing and software development departments of worldwide working enterprises for 6 years. Since 1991 he has been working as a professor at Mainz University of Applied sciences. Since 1998 he has been a member of the board of i3mainz, Institute for Spatial Information and Surveying Technology. In the DVW – German Association of Geodesy, Geo-information and Land Management he is the chair of working group 2 – Geo-information
and Geodata Management. He is the co-chair of FIG Commission 3 Working Group 3.2 – Spatial Data Infrastructure for 2007-2010.
Dr. Chryssy Potsiou, Assist. Prof., teaching Cadastre, Land Management, Valuation, and Spatial Information Management at the School of Rural and Surveying Engineering of the National Technical University of Athens (NTUA) in Greece, is a surveying engineer graduated in 1982 from the same School. She received her PhD in the field of “Cadastral Spatial Information Collection and Management” in 1995, also from NTUA. In parallel, since 1982 she works as a private consultant, mainly in cadastral, photogrammetric, urban planning and regeneration projects. She is the chair of FIG
Commission 3 on “Spatial Information Management”, for the period 2006-2010. She has been an elected member of the UN-ECE WPLA Bureau for the periods 2001-2011.

International Conference SDI 2010 – Skopje; 15-17.09.2010
175
URBAN MANAGEMENT: AVAILABILITY OF
TECHNICAL TOOLS
Chryssy POTSIOU 1, Yerach DOYTSHER
2
ABSTRACT
The research identifies the basic social, economic, and environmental impacts of the current
global urbanization rates and the results of this research are illustrated by examples and statistics
derived from various countries. It is emphasized that the current situation and its impacts bring
new challenges for planners, surveyors and government administrators.
Simultaneously with the rapid global urbanization process, mainly in the second half of the 20th
century, major technological developments occurred and their impact on the surveying, mapping
and geographic information communities is extremely significant. During the last decades new
advanced hardware systems and sophisticated geospatial processing algorithms have been
developed, thus affecting dramatically the traditional methods for data collection and data
processing and providing surveyors, planners and administrators with new methods and
techniques to improve the systems and tools used for land management.
A review of the available technical tools for spatial information collection, integration and
management is given mainly according to their applicability for better urban management.
Proposals are given about the most appropriate tools that facilitate usage of the diverse spatial
information derived from various sources (such as photogrammetry, field surveying, radar,
LiDAR, cartographic digitization and scanning) to facilitate current urban planning and
management needs (such as city modeling, informal development detection, environmental
monitoring, risk management, disaster prevention).
Key word: Urbanization, Spatial Management Tools, Data Collection, Data Integration, Data
Processing
1. INTRODUCTION
Homo sapiens did not start as an urban citizen; it took about 120,000 years until the end
of the last ice age when the very first “human settlement” appeared, and about 6,000
years more until the classical antiquity when people established large cities to live
together for security and prosperity, for trade, but also for worship or for other specific
purposes like the organization of the Olympic Games. Generally, living together meant
security and provided the opportunity to exchange goods and ideas. During the 5th
1 Assist. Prof. Chryssy POTSIOU, [email protected]
National Technical University of Athens
Tel.: +30 210 7722-688, Gsm.: +30 6944 710-817, Fax: +30 210 7722-677.
9 Iroon Polytechnion St., Athens, Greece
Chair of FIG Commission 3 2 Prof. Dr. Yerach DOYTSHER, [email protected]
Technion - Israel Institute of Technology,
Tel.: +972 4 829-3183, Gsm.: +972 54 4690-110, Fax: +972 4 829-5708.
Mapping and Geo-Information Eng., Technion City, Israel
Chair-Elect of FIG Commission 3

International Conference SDI 2010 – Skopje; 15-17.09.2010
176
century B.C. several Greek cities had populations of several thousand people. By
example, it is estimated that in those days the city of Athens in its greater jurisdiction of
a total area of 2650 Km2 had about 40,000 citizens, the city of Argos had 20,000, and
the city of Samos, the capital of an Aegean island, of 450 km2 had 15,000 citizens
(Mega, 1990; Tassios, 2009).
The 5th century BC brought an innovative element in the history of the cities, the
initiation of city planning by Hyppodamos from Mellitus; however, the “rectangular
road network” had already been applied in Egypt and Babylon (Mega,1990; Lavedan,
1926; Martin, 1956). Location and topography played a major role in the development
and structure of the cities. Most ancient cities had structural similarities: built near water
(sea, lake, or river) the lower city had a public square (Agora) of a mean size of 20x40
m2 and an Acropolis built on the top of the hill; the area in between was used for
constructions such as theaters and stadiums that required a natural ground inclination (of
about 23o-27o).
As some cities developed through the centuries, they became known for their specific
attributes. By example, in the classical era Delphi, Delos, Epidauros and later on Rome,
Jerusalem and Mecca were known for their religious role, Alexandria for the library,
Constantinople as the capital of the empire, and Beijing as a center of administration. In
modern days culture and market have in a way “replaced” religion; visitors, but also
investors and large international corporations, are attracted by the largest cities
worldwide for the museums, exhibitions, cultural events, fashion, theaters, art galleries,
etc. Cities became centers of learning, innovation and sophistication.
However, already since the very early years there was much concern about the size and
the density of the cities and about their expansion. Plato (in his “Republic”, 49B)
advised “as long as the city expands without loosing its connectivity let it expand, but
no more”.
It is true that technological improvements in transportation, and some primitive services
provision, like fresh water and sanitation, in the Roman times have facilitated the
increase of urban population. However, all over the world, many city-dwellers’ health is
still threatened by inadequate provision of fresh water and sanitation.
During the Byzantine era, Constantinople had a population of 500,000 citizens (6th-7th
century AD) and was considered to be the second largest city after Baghdad. Today, the
same city, Istanbul, has become a mega-city of approximately11 million citizens. It is
obvious that the location and topography of the area, together with other major factors
like economy, conquest, good or not so good government, disease, etc, have played a
major role for the longevity and expansion of several cities through centuries.
Initially the industrial revolution didn’t actually improve the quality of life in the urban
areas, but because it offered a plethora of jobs, a new urban era began. The twentieth
century witnessed the rapid urbanization of the world’s population. By 1900 13% of the
world’s population became urban. During the next years, improvements in medicine and
science allowed larger city densities. According to UN reports, the urban population
increased from 220 million in 1900 to 732 million in 1950 (29% of the world’s
population). By 2007 50% of the world population live in the cities; further
improvements in technology, medicine and prevention of disease allowed even larger
urban densities; according to latest predictions, 4.9 billion people, or 60% of the world’s
population, are expected to be urban dwellers in 2030 (Table 1).

International Conference SDI 2010 – Skopje; 15-17.09.2010
177
Table 1. Global proportion of the urban population increase (source: UN Population Division)
Year Urban population (million) Proportion
1900 220 13 %
1950 732 29 %
2005 3,200 49 %
2030 4,900 60 %
Investigations show significant differences in urban population change between the
more developed regions and the less developed regions. The majority of the inhabitants
of the less developed regions still live in rural areas, but in the more developed regions
the population is already highly urbanized. As urbanization tends to rise, as
development increases, urbanization is expected to rise as well, in future (Table 2).
However, despite their lower levels of urbanization, less developed regions have more
than double the number of urban dwellers than the more developed (2.3 billion vs. 0.9
billion). By 1968, the urban population of the less developed regions surpassed for the
first time that of the more developed regions and continues to do so thereafter;
furthermore, the rapid growth of the population of the less developed regions combined
with the near stagnation of the population in the more developed regions implies that
the gap in the number of urban dwellers between the two will continue to increase
(Table 2) (UN, 2006).
Table 2. Differences in urban population rates (source: UN Population Division)
Year More developed regions Less developed regions
Population (billion) Per cent Population (billion) Per cent
1900 0.15 0.07 14 %
2005 0.90 74 % 2.3 43 %
2030 1.00 81 % 3.9 56 %
Eight out of the nine countries with more than 50 million rural residents (Bangladesh,
China, Ethiopia, India, Indonesia, Nigeria, Pakistan, Viet Nam), are all located in the
less developed regions. Additional population is expected to migrate to these cities in
future.
The 20th century is related to the emergence of mega-cities (cities with population
greater than 10 million). Never before had such large populations been concentrated in
cities. Since 1950, the number of mega-cities has risen from 2 to 20 in 2005 (UN,
2006). Moreover, 17 out of the 20 mega-cities in the world are located in the less
developed regions. Ancient Megalopolis, built by Epaminondas in 371-368 B.C., was
the capital of the Arcadian alliance in Greece, and was considered to be a model of a
prosperous, happy and peaceful city; most current mega-cities (that actually share the
same name with the ancient city) but also metropolitan cities (cities up to 5 million) do
not experience a similar quality of life, since global population growth is becoming an
urban phenomenon mainly in the less developed regions (UN, 2006).

International Conference SDI 2010 – Skopje; 15-17.09.2010
178
2. IMPACTS OF RAPID URBANIZATION
According to the research results, impacts may be briefly classified as following:
� High urban densities, lack of green areas and buildings reflecting local cultural
heritage, of local historic or architectural value
� Transport, traffic congestion
� Energy inadequacy
� Unplanned development and lack of basic services e.g., public transportation,
fresh water, parking areas, waste management, sanitation, public toilets
� Illegal construction both within the city and in the periphery; dilapidated city
centers
� Unclear or informal real estate markets
� Creation of slums
� Poor natural hazards (floods, fires, earthquakes, etc) management in
overpopulated areas
� Crime
� Water, soil and air pollution; environmental degradation
� Climate change
� Inefficient administration, bad governance (Potsiou, 2008)
Almost all big modern cities, due to over-increased population, worry about pollution,
creation of dilapidated city centers, energy inadequacy, increased criminality, garbage
treatment, etc. It is ironic that much of what was once considered as the major
advantages of life in the city, like security, better housing conditions, and services
provision are now transformed into the city’s major disadvantages, like criminality,
slums, lack of services.
In 500 BC the city of Athens organized the first municipal dump in the Western world.
Citizens were required to dispose their waste at least one mile from the city walls.
Today, Athens is in the grip of a garbage crisis. Six thousand tons of trash is produced
daily in this city of more than 4.5 million people.
Until 2005 Greece was operating 1102 open landfills. Greece has successfully managed
to close most open landfills (only 410 are still operating) and avoid high EU penalties.
However, the costs for the regeneration and mechanical recycling procedure are also
high (~145 million €) (Potsiou, 2009).
The Public Power Corporation’s (PPC) plant in Kozani, Greece has been found to be
one of the most polluting in Europe. PPC will pay up to 2,2 billion euros a year for
carbon emission licenses unless it shifts away from its dependence on lignite.
Consumers could expect a rise in electricity bills of 45% by 2013 (Figure 1) (Potsiou,
2008).
When it comes to transportation in mega-cities, statistics show that Mumbai (a city of
14-18 million citizens) has low level of car ownership with 29 cars per 1,000 residents;
55.5 % of Mumbai’s population walk, 21.9 % go by train, 14.4 % use the bus, and only
1.6 percent drive their car. However, more than 20,000 people have been killed on
Mumbai’s notoriously overcrowded train system over the past five years — many of
them crushed, run over or electrocuted — according to official data. No other city in
India has so many people traveling by one mode of transport. There are a minimum of
10 deaths daily on the railways (The Boston Globe, April 18, 2008).

International Conference SDI 2010 – Skopje; 15-17.09.2010
179
As cities expand beyond their administrative boundaries they lack the financial or
jurisdictional capacity to provide the necessary services (planning, water, electricity,
sanitation, etc) to all inhabitants. The administration of the city becomes more
complicated and bureaucratic in the less developed countries, where new technology
and necessary digital tools are not implemented.
Fresh water becomes expensive. Most cities in the developing world discharge their
sewage untreated into the rivers (from where they also draw their drinking water) or into
the sea, together with farm chemicals and industrial effluents. Some 20 years ago, for
example, a large quantity of Delhi's sewage was used for irrigating the agricultural
lands. Today much of the agricultural land has been converted into residential colonies.
Delhi alone contributes around 3,296 MLD (million liters per day) of sewage to the
local water bodies.
Figure 1. PPC plants in Greece Figure 2. High urban densities in countries in
transition
Most of the world’s current urban expansion is caused by the poor migrating in
unprecedented numbers. This situation usually results in the overwhelming of capacity
in certain places. This is also the case in most eastern European countries in transition
(Tsenkova et al., 2009). Accelerated development, pro-poor or affordable housing
needs, and economies of scale often lead to high urban densities (Figure 2) by tearing
down the stock of old buildings, including buildings of character, built to a human scale,
that reflect local architecture and history. Affordable housing often seems to mean
identical constructions, of more than 25m height, built of concrete. By example, for
achieving economies of scale in Skopje the capital city (of only 571,040 citizens) of
FYROM, this has recently become the minimum required height prescribed in the
building regulations, while in the past planners were accustomed to work with
maximum permitted height standards. Furthermore, due to pressure to reduce
government deficits, many developing economies apply flexible or poor environmental
regulations for their productive units in order to achieve competitive advantages in
production, and attract international investment.

International Conference SDI 2010 – Skopje; 15-17.09.2010
180
Safety standards are frequently overlooked, for the sake of increased commercial
profits, with terrible results (Sahapira, 2009 & Altan, 2009). Such was the case of L’
Aquila, Italy in April 2009, following a strong earthquake. Humanity has lived with
floods for centuries but the impact of floods was not felt to the same extent in the past
as it is experienced now. Construction in the stream and river routes or close to the
coast, or in areas where extensive deforestation has taken place due to accelerated
development, presents greater risk of flooding. The results are similar whether in the
favelas of Sao Paulo, or in the unplanned settlements of Eastern Europe, or in New
Orleans, or in Asia. Natural disasters, floods, earthquakes and fires are more difficult to
deal with in highly urbanized areas, and affect both rich and poor (Figure 3).
Figure 3. Floods in Mumbai Figure 4. Fires in Attica, the greater region of
Athens, Greece in 2009
Rapid population increases lead to rapid informal urban development (Tsenkova et al.,
2009). As cities get crowded and polluted and new technology enables people to work
in rural areas at the urban fringe (where rural and non-serviced land is cheaper) on home
computers, or makes commuting easier, an inverse process, the so called sub-
urbanization takes place mainly around large cities. The spread of low or middle-
income population to the cities' outskirts and surrounding rural lands for better living
conditions in single family self-made houses results in informal or unplanned
development of relatively good construction quality, expansion of municipal areas,
illegal changes in the spatial organization of land-uses, informal real estate markets and
loss of state revenue, and increased pressure on water resources and green areas
(Potsiou, 2009).
Due to the failure of the state to ensure modern and effective zoning and planning
regulations and the multiplicity of administrative agencies involved in forest and public
protection, uncontrollable fires in the greater region of Athens metropolitan centre
becomes an ever-more-regular phenomenon (Figure 4) threatening people’s lives and
properties scattered on the periphery of the city.

International Conference SDI 2010 – Skopje; 15-17.09.2010
181
Figure 5. Left: Dharavi, Mumbai, India. Right: Informal settlement in Albania
Another type of informal development is caused by the poor who seem to prefer urban
squalor to rural hopelessness. According to UN statistics, one of every three of the
world’s city residents lives in inadequate housing with few or no basic services (fresh
water, sanitation, schools, hospital, and security). The world’s slum population is
expected to reach 1.4 billion by 2020. Informal settlements, whether of good or bad
construction quality have a common characteristic all over the world: they do not
officially exist! And for that reason government provides nothing or very little in the
best cases. Slums in the less developed areas whether in Latin America, Africa, Asia
(Figure 5 left), Ex-Soviet Asia, or even in Europe (Figure 5 right) have a few similar
characteristics: unclear land tenure, poor quality and size of construction, no or poor
access to services and violation of land-use zoning.
Unfortunately the slum situation is not going to change easily because both the city
administrations and the slum dwellers enjoy some benefits:
� Frequently, many people make money from such informal housing sector
� Slums provide cheap labour that enables city to operate
� The situation suits the authorities nicely, since the economy of the city is
supported and at the same time is an alternative to the missing social housing
policy
� Several politicians and civil servants are reputed to be landlords in slums areas
� Poor rural people or immigrants are offered hope for employment in the formal
economy of the city
� Slums are usually well placed, near the city: if the poor do find jobs they can walk
to work (Potsiou, 2008).
As shown above, rapid urban development leads to a series of problems, the most
important threat of which may be the global climate change. World greenhouse gas
emissions, one of the major factors responsible for climate change, have increased 70%
between 1970 and 2004. Much of that is due to growth in the sectors of energy
(+145%), transportation (+120%) and industry (+65%), and to the reduction of forest
land and land use changes (40%) (Wilbanks et al., 2007). Current sustainable
development policies are directed at practices leading to climate change, and much
research is being carried out to provide appropriate policy options for the sectors of
energy supply, transportation, buildings, industry, agriculture, forestry and waste
management.

International Conference SDI 2010 – Skopje; 15-17.09.2010
182
Restrictions on private rights in the use of land in terms of air, soil and water pollution
have to be defined clearly and accepted by all market participants (state, individuals,
funding institutions, entrepreneurs, etc) and applied equitably. All must assume the
costs of the natural resources they consume, knowing that their competitors do the same
(Economic Studies Division of Alpha Bank, 2007).
Urbanization can still be seen as an indicator of development, generally related to
industrialized and technologically advanced economies. The concentration of major
economic activities in the urban areas produces economies of scale and leads to various
social and economic benefits, like employment, higher quality of health and education
services, trade and cultural activities. It is a matter of human rights that people are free
to choose where they will live. However, nobody wants to live in a city which is
congested, suffers constant blackouts and frequent floods, has few parks, poor schools
and clinics, is devoid of any buildings of charm, and is governed by an incompetent
public sector.
Legislation and regulations for water supply, sewage treatment, control of air, water and
soil pollution from industry and traffic, control of radioactive and toxic substances
storage, garbage management, garbage burial and studies for the environmental impact
of each large development project, are in the agenda of the authorities in most countries.
Such legislation however, cannot always be efficiently applied and relevant services
cannot be appropriately planned without the necessary legal framework for the
provision and dissemination of reliable and updated relevant spatial information.
Markets cannot function efficiently without reliable systems to secure land tenure and
zoning and planning systems to define the regulations concerning private rights for the
use of land and natural resources. In Europe, spatial information infrastructure is usually
provided by the cadastral, planning and land development permitting authorities and it
is a fundamental tool for sound decision making, providing for the management of land
in a holistic way (Enemark, 2007 & 2009).
It is obvious that humanity has never experienced such problems in the past. It is a
matter of good governance to achieve sustainable urban growth, and this brings new
challenges for planners, surveyors and Governments. The new tools that are now
available, in comparison to the past times, are reliable advanced technology and spatial
data for better decision-making. In the following, the resolutions of a research made on
the current technical tools that support spatial data collection, management and
dissemination for the purpose of good governance and sustainable urban development
will be reported.
3. TECHNICAL TOOLS
Following the rapid urbanization processes, the need for updated, precise and
continuous representation of our natural environment in general, and urban areas in
particular, is nowadays one of the more urgent and major tasks the surveying and
mapping community has to answer and give adequate solution to. During the last
decades major technological developments in data collection, data integration, data
analysis and building of sophisticated GI databases were introduced. These new data
acquisition technologies on the one hand, and methods, algorithms and software
packages on the other hand, yield that the surveyors, computer experts and the mapping

International Conference SDI 2010 – Skopje; 15-17.09.2010
183
community has to give answer to rapid and frequent updating, integration and analysis
of existing GI databases, and moreover - deal with data volumes, resolution levels, and
accuracies that were unknown until recently. These technological developments can be
divided into two groups: (i) data collection; and, (ii) data integration, processing and
analysis.
3.1. Data Collection Technologies
As to data collection, until recently it was basically acquired and measured by one of the
following three different techniques (Zhilin et al., 2005):
a. Photogrammetry, which utilizes stereo pairs of aerial or space imagery covering
approximately the same area;
b. Field surveying that utilizes total station and Global Positioning System (GPS)
receivers for a direct field measurements;
c. Cartographic digitization and scanning, which utilizes raster vectorization
techniques to convert existing maps.
Recent technological developments feature two new techniques in addition to the
existing ones:
d. Radar based systems, utilizing radargrammetry techniques as well as Interferometric
Synthetic Aperture Radar (IfSAR) imaging;
e. LiDAR (Light Detection and Ranging) that produces 3D point cloud representing
the scanned region.
3.1.1. Photogrammetry
Photogrammetry utilizes a pair of stereo images (covering approximately the same area
from two different directions and positions), i.e., stereoscopic model. The geometric
properties of objects are determined from the acquired images by a metric measurement
of 3D coordinates. Usually, large regions are covered by an aerial strip or a block
containing a large number of photographs (and stereoscopic models). As a result, aerial
imagery is probably the most common and most effective source to map a region
(usually acquiring a digital geospatial dataset or database of the region), as well as to
update existing maps (or GI databases).
Figure 6. Operational Photogrammetric Systems (Habib, 2009)

International Conference SDI 2010 – Skopje; 15-17.09.2010
184
Similar to aerial imagery, satellite imagery are common today and is being used in
photogrammetry, usually only for production of maps at smaller scales. Though satellite
imagery resolution is becoming denser, aerial images still present higher resolution -
and are relatively more accurate. The horizontal/vertical accuracy is a variable figure
that is a function of the sources and photogrammetric equipment utilized to collect the
data. It is worth noting that with the development of digital aerial cameras since the
1990s and small digital metric (aerial) cameras in last few years, high quality digital
imagery is increasingly available (Figure 6). Additionally, with the progress in high
performance computer hardware and software, automation of part of the
photogrammetric processes becomes feasible and techniques from image processing and
computer vision have successfully been employed (Habib, 2009).
3.1.2. Field Surveying
Traditional field surveying techniques acquire the precise location (position) of certain
points on earth, i.e., coordinates, by direct measurement. This can be done by measuring
distances and angles while utilizing total-station, or GPS receiver for the task. Though
the accuracy of a position acquired here is very high (in respect to other techniques),
this type of equipment deliver much fewer data and is usually used to measure and map
only small areas (especially when high level of accuracy is required, i.e., in dense urban
areas). Field surveying is usually being used to measure ground control points as a basis
for the photogrammetric process.
3.1.3. Cartographic Digitization and Scanning
Digitization and scanning can be performed on maps in order to "transform" existing
graphical paper maps to a digital dataset (probably as input to a digital geospatial
database). This can be achieved by: i) vector-based line following, and; ii) raster-based
scanning. Though manual digitization is still performed, semi-automated and automated
algorithms are becoming more available nowadays, and many on-the-shelf GIS
(Geographic Information System) software packages are equipped with tools delivering
these tasks. Manual quality assurance was widespread when applying theses tasks,
though with new automated developments it is becoming less common - and eventually
will disappear soon. Until recently, producing a digital database via these techniques
while using medium-scale to small-scale maps was very common. Nowadays, these
techniques are being used mainly to "digitize" graphical map of underground
infrastructure networks (i.e., water and sewage networks) where direct field surveying
might be non-possible or too expensive.
3.1.4. Radar Based Systems
SAR technology (based on Doppler frequency shifts principle) is utilized mainly to
acquire images, and it was proved that these images are very sensitive to terrain
variation. Until recently, SAR images were utilized mainly to produce DTMs
(describing the terrain) either by radargrammetry algorithms by parallax measurement
(principally similar to traditional photogrammetry only here it utilizes intensity data for
measurement), or by inteferometery algorithms by phase shifts extracted from two
acquired epochs.

International Conference SDI 2010 – Skopje; 15-17.09.2010
185
In the last few years, based on the remote-sensing satellite technology, small and
compact high-resolution radar systems have been developed, systems that can monitor
land and buildings from air as well as from space. These radar systems monitor
structures such as dams, harbours, canals and buildings, leading to mapping of urban
areas, for example: planning, cadastral updating, etc. Several flights over the same
location enable us to discover changes between pictures, revealing ground movements
that could affect structures. This technology can be used for accurate mapping,
deformation monitoring (at the range of millimeters), change detection and many more.
3.1.5. LiDAR
Since the mid 1990s, LiDAR technology has been becoming an applicable and available
tool for surveying and processing of geospatial data. This system provides a dense and
accurate 3D points cloud of the scanned area. The LiDAR system integrates three sub-
systems: laser scanner, Global Positioning System (GPS) and the Inertial Navigation
System (INS). The general concept of this system is precise measurement of the time
that the pulse generated by the scanner travels to and from an object it hits on the
scanned area (i.e., from the launch epoch to the receive epoch). Combined with the GPS
and INS sub-systems, accurate calculation of the spatial location of the object becomes
feasible.
Figure 7. Sample of LiDAR data: A 3D view of urban neighborhood
Although the LiDAR system provides a dense 3D points cloud that describes accurately
objects within the scanned area, it is not an explicit representation. This is due to the
fact that points cannot be classified automatically and semantically as terrain, trees,
vegetation, objects (such as buildings), etc. Moreover, the amount of data is relatively
large, and in respect to file size can reach up to several gigabytes. Therefore, an
automatic or semiautomatic technique is required to analyze the acquired data. Different

International Conference SDI 2010 – Skopje; 15-17.09.2010
186
strategies to differentiate between the ground point and the non-ground points (i.e.,
buildings) have been developed in the last few years (Vosselman and Dijkaman ,2001;
Morgen and Habib, 2002; Filin and Pfeifer, 2006; Abo Akel et al., 2009). These
approaches enable to automatically (or semi-automatically) reconstruct the buildings
and other natural as well as man-made objects and receive a 3D map of the measured
urban area (Figure 7).
3.2. Data integration, processing and analysis
During the last decades the digital mapping community is facing major and significant
developments of algorithms, methods and software packages dealing with data
integration, data processing and data analysis. These developments have improved our
abilities to handle and process geospatial information. In the following sub-chapters a
few of these abilities will be presented.
3.2.1. Data integration
Digital maps are collected by various institutions and different means, representing
different disciplines, kept in different databases, and maintained separately. Urban areas
are in particular covered by diverse geographic information sources. These facts lead to
partial different representations of the same world reality. In order for one to efficiently
using the information, it should be obtained from the different sources and merged
together (by applying an integration process).
Mechanisms for overcoming spatial and semantic heterogeneity in diverse information
sources are critical components of any interoperable system. In the case of diverse
geographic information sources, such mechanisms present particular difficulties since
the semantic structure of geographic information cannot be considered independently of
its spatial structure. The issue of integration is even more complicated due to the fact
that the different digital datasets (or databases) can contain data in vector format (a
discrete data structure, where entities in the world are represented by objects) as well as
raster format (a continues data structure, build of a two dimensional array of pixels,
where each pixel represents a characteristic of an equal area rectangular of the world).
Moreover, a simple solution of overlaying the different digital datasets (by using the
straightforward "cut and paste" algorithm) is not applicable due to different geodetic
projections and datum.
Integration of heterogeneous datasets has received a lot of attention in the last 1-2
decades. Diffrent approaches to the issue have been proposed by many reserachers.
Wiederhold (1999), Neiling and Lenz (2000) and Boucelma et al. (2002) suggested an
architecture of wrappers and mediators for integration systems. According to this
approach, wrappers extract data from heterogeneous sources and transform the extracted
data to a uniform format. A mediator receives data from the wrappers and integrates it.
Integration of spatial datasets by finding correspondences between schema elements
was proposed by Devogele et al. (1998). It was shown that interoperability can be
achieved in applications that manage spatial data. This aspect of integration - how to
provide interoperability - was also suggested by Parent and Spaccapietra (2000) and
Laurini et al. (2002).
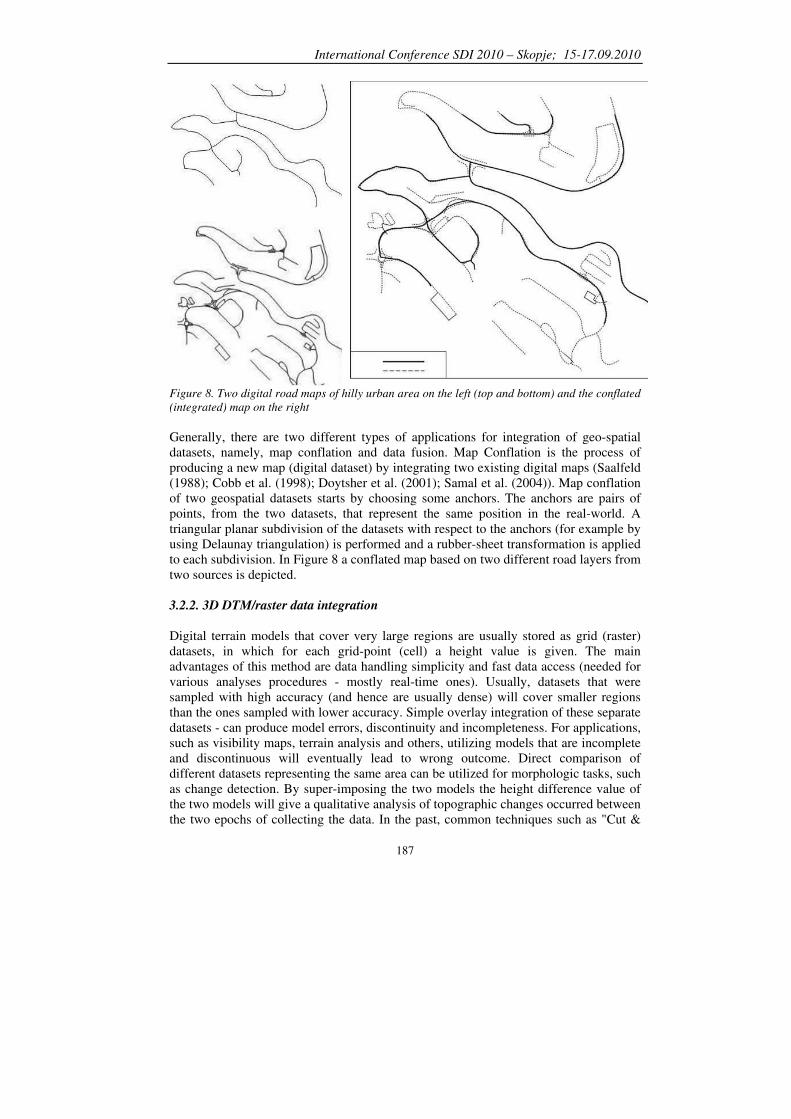
International Conference SDI 2010 – Skopje; 15-17.09.2010
187
Figure 8. Two digital road maps of hilly urban area on the left (top and bottom) and the conflated
(integrated) map on the right
Generally, there are two different types of applications for integration of geo-spatial
datasets, namely, map conflation and data fusion. Map Conflation is the process of
producing a new map (digital dataset) by integrating two existing digital maps (Saalfeld
(1988); Cobb et al. (1998); Doytsher et al. (2001); Samal et al. (2004)). Map conflation
of two geospatial datasets starts by choosing some anchors. The anchors are pairs of
points, from the two datasets, that represent the same position in the real-world. A
triangular planar subdivision of the datasets with respect to the anchors (for example by
using Delaunay triangulation) is performed and a rubber-sheet transformation is applied
to each subdivision. In Figure 8 a conflated map based on two different road layers from
two sources is depicted.
3.2.2. 3D DTM/raster data integration
Digital terrain models that cover very large regions are usually stored as grid (raster)
datasets, in which for each grid-point (cell) a height value is given. The main
advantages of this method are data handling simplicity and fast data access (needed for
various analyses procedures - mostly real-time ones). Usually, datasets that were
sampled with high accuracy (and hence are usually dense) will cover smaller regions
than the ones sampled with lower accuracy. Simple overlay integration of these separate
datasets - can produce model errors, discontinuity and incompleteness. For applications,
such as visibility maps, terrain analysis and others, utilizing models that are incomplete
and discontinuous will eventually lead to wrong outcome. Direct comparison of
different datasets representing the same area can be utilized for morphologic tasks, such
as change detection. By super-imposing the two models the height difference value of
the two models will give a qualitative analysis of topographic changes occurred between
the two epochs of collecting the data. In the past, common techniques such as "Cut &

International Conference SDI 2010 – Skopje; 15-17.09.2010
188
Paste" and "Height Smoothing" were in use. These techniques are characterized by not
preserving the spatial morphology and topography of the terrain (Laurini, 1998).
In the last few years, in order to avoid these complications when integrating terrain
relief models, new approaches and new algorithms were suggested. These algorithms
serve as the basis of establishing reliable and qualitative environmental control
processes. As opposed to the previous common techniques, which did not or only
globally analyzed the corresponding topography of both datasets, in the new algorithms
a local thorough investigation of the relative spatial correlations that exist between the
datasets is achieved, and consequently, preventing distortions as well as an ambiguous
and ill-defined modeling analysis. These algorithms are aimed at achieving a continuous
topological representation and correct structures of the terrain as represented in the
merged DTM, while taking into account the differences in both height field and planar
location of terrain entities (see Figure 9).
Figure 9. Integrated DTM: a non-continuous dataset based on the common Copy & Paste
mechanism (left), and an improved continuous dataset (right) (source: Doytsher et al. 2009)
It is worth noting that similar approaches are being implemented when raster datasets
(images) are to be merged. A more detailed description regarding raster integration can
be found in (Shragai et al., 2005).
3.2.3. Constructing a seamless geospatial database
One of the common procedures in establishing geographic databases is constructing a
seamless database based on separate adjacent separate maps. The conversion of paper
maps, i.e., cadastral blocks, into digital data (through processes of digitizing or scanning
and vectorization) is usually performed separately, map by map, and only at a second
stage are all the separate maps combined into one continuous database. Between
adjacent digital maps, gaps and overlaps can be found due to various factors. Among
those may be included the accuracy of digitizing or scanning processes; inaccuracies
inherent in the original drawings; non-homogeneous interpretations by different
operators during the input process of boundary lines of adjacent maps, etc.
Edge matching process means the determination of common boundaries of the adjacent
maps, thus annulling the gaps and overlaps, and achieving continuity of details passing
from one map into another (such as roads, power lines etc.). During this process only

International Conference SDI 2010 – Skopje; 15-17.09.2010
189
points lying on the external boundaries of the maps are corrected, thus obtaining a
unique definition of those boundaries. During this process we do not normally correct or
change features or points that fall within the map itself, and therefore relative distortions
and discrepancies occur between the contents of the map and its boundaries.
Figure 10. A triangulated rubber-sheeting map sub-division
It is possible to ignore this phenomenon of relative "disorders" between the boundaries
of the maps and their content in cases of low accuracy data and/or maps at a small scale.
Nevertheless, when handling geospatial data of urban areas in general and cadastral
information in particular, these disorders and distortions cannot and should not be
ignored. In these cases, edge matching is insufficient and it is recommended to apply
non-linear transformations to solve existing disorders and distortions. Non-linear
transformation or rubber-sheeting refers to a process by which a digital map or a layer is
"distorted" to allow it to be seamlessly connected to adjacent maps or layers, and/or to
be precisely super-imposed to other maps or layers covering the same area. In the last
few years various approaches to rubber sheeting have been developed with various
proposed solutions, inter alia, a polygon morphing technique associated with a
Delaunay triangulation (Cho et al., 1996), a non-rectangular bilinear interpolation
(Doytsher, 2000), a triangulation and rubber-sheet transformation for correcting
orthoimagery (Chen et al., 2006), and others. Figure 10 depicts a typical triangulated
rubber-sheeting sub-division. In Figure 11 a group of cadastral maps are depicted in
their original situation (pre-processing) and in their final seamless cadastral definition
(post-processing).

International Conference SDI 2010 – Skopje; 15-17.09.2010
190
Figure 11. Original separate pre-processing cadastral blocks (left); Post-processing homogeneous seamless
cadastral continuity (right)
3.2.4. 3D City Modeling
Generating 3D city models is a relevant and challenging task, both from a practical and
a scientific point of view (Gruen and Wang, 1998). This type of data is extremely
important in many areas of the urban environment such as municipal management,
planning, communications, security and defense, tourism, etc. Most of the input data for
these systems was until recently collected manually (“point by point”) on Digital
Photogrammetric Workstations (DPW) or analytical streoplotters. In the last two
decades, extensive research dealing with 3D building extraction from aerial images on
the one hand and from LiDAR points cloud on the other hand has been carried out by
the photogrammetric and computer vision communities. However, full automation of
object space extraction by "autonomous" systems is still far from being implementable.
There is a great variety of algorithms for automation in building extraction both from
aerial images as well as from LiDAR data, algorithms depending on the type of
building, level of required detail, usage of external and a priori information, and level of
automation and operator interference (Gruen, 1997).
As to aerial images, most of the 3-dimensional algorithms are based on processing at
least two solved images (a photogrammetric model) and the assumption that roofs are
composed of several spatial polygons, and that they can be obtained by extracting all or
even only some of them (when the model is known). The algorithms can be divided into
two types: those that extract a contour and height (2½D) of flat roof buildings (e.g.:
Gerke et al., 2001; Ruther et al., 2002; Oriot and Michel, 2004) and those that extract
the detailed roof (3D) of the buildings (e.g.: Gulch et al., 1999; Gruen and Wang, 2001;
Rau and Chen, 2003, Avrahami et al., 2008). In Figure 12 the steps of automatic
extracting 3D buildings are depicted.

International Conference SDI 2010 – Skopje; 15-17.09.2010
191
Figure 12. Steps in automatic extraction process of 3D building from aerial photographs
(G-Model roof – left; L-Model roof – right)
Since the LiDAR technology provides a dense and accurate 3D points cloud of the
scanned area only as an explicit representation of the ground surface (terrain together
with all connected man-made objects), algorithms has to be developed in order to
extract 3-dimensionally the buildings. The extraction of buildings from LiDAR data is
usually divided into two parts where the first involves their detection within the points
cloud, and the second the reconstruction of their 3D shape. For their detection, different
approaches have been suggested. Within these approaches can be mentioned: edge
operators to localize buildings (Wang, 1998); morphological opening filters to identify
the non-buildings (Oda et al., 2004); local segmentation to identify detached solid
objects (Alharthy and Bethel, 2004); using of external data in the form of ground plans
to localize the buildings (Schwalbe et al., 2004) and many others.
As for the reconstruction of the 3D shapes of buildings, the extraction of the roof
primitives, in almost all cases, is based on segmentation of the points cloud that will
seek partition into a set of planar faces (Voegtle et al., 2005; Rottensteiner et al., 2005;
Rottensteiner 2006, Abo Akel et al., 2009). While a large body of research has been
devoted into building reconstruction, many challenges still remain unanswered. One
such challenge concerns the general planar roof-face assumption that is common to
almost all reconstruction models. While planar roof-face buildings are still the majority,
buildings with general roof shape can be found in almost every scene. In Figures 13 and
14 the reconstruction results of buildings are depicted. In Figure 13 it is a complex
building with a free-form roof surface that is constructed, while in Figure 14 three
complex buildings with flat faces is constructed.

International Conference SDI 2010 – Skopje; 15-17.09.2010
192
Figure 13. Reconstruction of a building with a free-
form roof surface: (a) point cloud; (c) segmented
point cloud; (d) segmented point cloud in down-
looking view; (e) connectivity graph ; (f)
reconstruction results
Figure 14. Reconstruction results of
three complex buildings. Left to right:
segmented point cloud; segments
boundaries; roof topology; final
reconstruction results
A sample of extracting the buildings of an urban neighborhood from LiDAR data is
depicted in Figure 15. Even though the LiDAR information in this scene is a non-dense
points cloud (only 0.6 points per square-meter), the results of extracting the complex
buildings, as depicted in the figure, is impressive. It is noteworthy mentioning that new
LiDAR systems are capable to measure nowadays up to 18-20 points per square-meter,
and the potential for extracting very detailed urban scenes and build accurate and
precise 3D city models is very high.
Figure 15. A 3D view of an urban neighborhood showing the LiDAR data (right) and the
complete reconstruction results (left)
There are two types of laser scanners, namely, airborne and terrestrial. Even though the
characteristics of the two types are similar, they are dissimilar in terms of the measuring
range; density of the measured points cloud, precision, etc. Using terrestrial laser
scanners are being used to construct realistic 3D building facade models of urban
scenes. These models are beneficial to various fields such as urban planning, heritage
documentation and better decision-making and organization of the urban environment.
Laser data and optical data have a complementary nature when extraction of 3-

International Conference SDI 2010 – Skopje; 15-17.09.2010
193
dimensional feature is required. As efficient integration of these two data sources will
lead to a more reliable and automated extraction of 3D features, automatic and
semiautomatic building facade reconstruction approaches and algorithms have been
developed in last few years, approaches which efficiently combine information from
terrestrial laser point clouds and close range images (Sester, 2009; Pu and Vosselman,
2009). The result of a terrestrial laser scanning (a points cloud containing several
hundred thousands points) presented in Figure 16 depicts the inherent potential of this
technology to construct realistic 3D building facade models of urban scenes.
Figure 16. Results of a terrestrial scanning of a complex facade
4. CONCLUDING REMARKS
Human beings have been congregating in cities for several thousand years, for common
defence, the development of commerce and the practice of religion. The benefits of this
urbanization of peoples include development of public security, culture, education and
the many systems of civic, political and religious organization. But not all the results of
urbanization have been favourable either for the quality of life of people, or for the
environment in which we all live. As people gather in ever greater numbers in their
cities, the consequent impact on land and resources is multiplied. Large congregations
of people in relatively limited spaces threaten to exceed the natural supplies of potable
water. As large populations of people use water for various vital purposes an opposite
problem of disposal results in the form of sewage and waste water in many forms, in an
irony of supply shortage versus a disposal overburden. The same is true of the very air
that we breathe: We come together in our cities to find employment in the activities that
result in air pollution with direct impacts on the enjoyment of our surroundings, and
with an ever-greater degradation of public health.
The less direct results of urban settlement include floods that result from construction in
stream paths and tidal areas; mud slides that are the result of deforestation; crime that
flourishes in crowded areas with insufficient job opportunity; slums that are the result of
inadequate affordable housing; and an exhausted supply of land, not only for housing,
but for the quality of life of the city’s residents. Most of the causation for these well-
documented problems may be traced to an over-use – or abuse – of the land and its
resources. The quantification of these problems, then, is a challenge to the

International Conference SDI 2010 – Skopje; 15-17.09.2010
194
surveying/mapping/data processing community. Fortunately, the technical tools
required for this process that includes both discovery and quantification, are in the
hands of our community. From surveying in the field to photogrammetry, radar-based
systems and LIDAR, and digitization and scanning, we possess the needed tools in the
discovery phase. The quantification phase is the integration, processing and analysis of
the collected data for presentation to the policy-makers of government and the problem-
solvers, planners, etc of the commercial community.
It is noteworthy that the work of the surveying/mapping/data processing community is
not done when the policy-makers take over. The process of data collection and
monitoring of the physical systems put in place, as the many problems of the city are
addressed, must continue. The tools are available for all these efforts and the
professionals of our community will continue to apply their skills as the policy-makers
seek solutions to the problems of the urban environment. The vision and goal of this
research has been to demonstrate, not only to government policy-makers, but to
planners, economists, scientists, environmentalists, sociologists and all others with an
interest in the life of our cities, the technical tools for environmental urban management
applied by the surveying/mapping/data processing community.
5. REFERENCES Abo Akel N., Filin S., Doytsher Y., 2009. "Reconstruction of Complex Shape Buildings from
LiDAR Data Using Free Form Surfaces". Photogrammetric Engineering and Remote Sensing,
75(3):271-280.
Altan O., 2009. "Role of Geospatial Professionals in Risk and Disaster Management and
Preventing Natural Catastrophies". Proceedings of the FIG Working Week 2009, Eilat, Israel,
http://www.ortra.com/fig/
Avrahami Y., Raizman Y., Doytsher Y., 2008. "A Polygonal Approach for Automation in
Extraction of Serial Modular Roofs", Photogrammetric Engineering and Remote Sensing,
74(11):1365-1378.
Boucelma O., Essid M., Lacroix, Z., 2002. "A WFS-Based Mediation System for GIS
Interoperability". Proceedings of the 10th ACM international symposium on Advances in
geographic information systems (ACM-GIS), pp. 23–28.
Chen C., Knoblock C.A., Shahabi C., 2006. "Automatically Conflating Road Vector Data with
Orthoimagery". GeoInformatica 10 (4): 495–530.
Cho M.G., Li K.J., Cho H.G., 1996. "A Rubber Sheeting Method with Polygon Morphing".
Proceedings of the Seventh International Symposium on Spatial Data Handling, Advances in
GIS Research II, pp. 395-406.
Cobb M.A., Chung M.J., Foley H., Petry F.E., Show K.B., 1998, "A Rule-Based Approach for
Conflation of Attribute Vector Data". GeoInformatica, 2, 7–33.
Devogele T., Parent C., Spaccapietra S., 1998. "On Spatial Database Integration". International
Journal of Geographical Information Science (IJGIS), Special Issue on System Integration,
12, 335–352.
Doytsher Y., 2000. "A rubber sheeting algorithm for non-rectangular maps". Computers &
Geosciences, 26(9-10):1001-1010
Doytsher Y., Filin S., Ezra, E., 2001. "Transformation of Datasets in a Linear-Based Map
Conflation Framework". Surveying and Land Information Systems, 61, 159–169.
Doytsher Y., Dalyot S., Katzil Y., 2009. "Digital Terrain Models: a Tool for Establishing Reliable
and Qualitative Environmental Control Processes". In GeoSpatial Visual Analytics:

International Conference SDI 2010 – Skopje; 15-17.09.2010
195
Geographical Information Processing and Visual Analytics for Environmental Security,
Raffaele De Amicis, Radovan Stojanovic, Giuseppe Conti (Eds.), Springer Science and
Business Media, pp. 215-234, ISBN 978-90-481-2897-6
Economic Studies Division of Alpha Bank, 2007. "Environmental Protection: For a Long-term
Sustainable Development". In: Economic Report of Alpha Bank, vol. 103: 3-21, URL:
http://www.alpha.gr/files/infoanalyses/oikon_deltio_103.pdf (in Greek).
Enemark S., 2007. "Integrated Land-Use Management for Sustainable Development".
Proceedings of the Joint FIG Commission 3, UN/ECE Working Party on Land Administration
and UN/ECE Committee on Housing and Land Management Workshop, Sounio, Greece.
Enemark S., 2009. "Facing the Global Agenda-Focus on Land Governance". Proceedings of the
FIG Working Week 2009, Eilat, Israel, http://www.ortra.com/fig/
Filin S., Pfeifer N., 2006. "Improved Segmentation of Airborne Laser Surfaces Using Adaptive
Distance Based Neighborhood". ISPRS journal of Photogrammetry and Remote Sensing,
60(2):71–80.
Gerke M., Heipke C., Straub B.M., 2001. "Building Extraction from Aerial Imagery Using a
Generic Scene Model and Invariant Geometric Moments". Proceedings of the IEEE/ISPRS
joint Workshop on Remote Sensing and Data Fusion over Urban Areas, November 8-9th
2001, University of Pavia, Rome (Italy), pp. 85-89.
Gruen A., 1997. "Automation in Building Reconstruction". Photogrammetrische Woche. pp. 175-
186. www.ifp.uni-stuttgart.de/publications/phowo97/gruen.pdf.
Gruen A., Wang X., 1998. "CC-Modeler: A Topology Generator for 3D City Models". ISPRS
Journal of Photogrammetry & Remote Sensing, 53(5): 286-295.
Gruen A., Wang X., 2001. "News from CyberCity Modeler". Automatic Extraction of Man-Made
Objects from Aerial and Space Images (III), Balkema Publishers, Lisse, The Netherlands, pp:
93–101.
Gulch E., Muller H., Labe T., 1999. "Integration of Automatic Processes into Semi-Automatic
Building Extraction". International Archives of Photogrammetry and Remote Sensing, Vol.
(32) 3-2W5, pp: 177–186.
Habib A., 2009. "Integration of Photogrammetric and LIDAR Data for Accurate
Reconstruction/Visualization of Urban Environments". Proceedings of FIG COM3 Workshop
on Spatial Information for Sustainable Management of Urban Areas, Mainz, Germany
Laurini R., 1998. "Spatial Multi-Database Topological Continuity and Indexing: A Step Towards
Seamless GIS Data Interoperability". International Journal of Geographical Information
Science, 12(4):373-402.
Laurini R., Yetongnon K., Benslimane D., 2002. "GIS Interoperability, from Problems to
Solutions". Encyclopedia of of Life Support Systems (EOLSS) (Eolss Publishers).
Lavedan P., 1926. "Histoire de l’ Architecture Urbaine", t.1, H. Laurence, Paris.
Martin R., 1956. "L’ Urbanisme dans la Grece Antique", A & J. Picard, Paris.
Mega V., 1990. "Topography and Development of Ancient City-States in Greece". Journal
Arxaiologia, http://www.arxaiologia.gr/assets/media/PDF/migrated/588.pdf (in Greek).
Morgan M., Habib A., 2002. "Interpolation of LiDAR Data and Automatic Building Extraction".
Proceedings of 2002 ACSM Annual Conference.
Neiling M., Lenz H.J., 2000. "Data Fusion and Object Identification". Proceedings of the SS-
GRR2000.
Oda K., Takano T., Doihara T., Shibaski R., 2004. "Automatic Building Extraction and 3-D City
Modeling from LiDAR Data Based on Hough Transform". International Archives of
Photogrammetry and Remote Sensing, 35(B3):277–281.
Oriot H., Michel A., 2004. "Building Extraction from Stereoscopic Aerial Images". Applied
Optics, 43(2): 218-226.

International Conference SDI 2010 – Skopje; 15-17.09.2010
196
Parent C., Spaccapietra, S., 2000. "Database Integration: The Key to Data Interoperability".
Advances in Object-Oriented data modeling (MIT Press).
Potsiou C., 2008. "Unplanned Urban Development and the Need for Good Spatial Information
Infrastructure". Proceedings (CD) of the FIG Commission 3 Workshop on ‘Spatial
Information Management toward Environmental Management of Mega Cities’, Valencia,
Spain.
Potsiou C., 2009. "Tools for Legal Integration and Provision of Environmental Improvements in
Informal Settlements in Europe – A case study from Albania and Greece". Global Land Tool
Network, UN HABITAT, (to be published)
Pu S., Vosselman G., 2009. "Building Facade Reconstruction by Fusing Terrestrial Laser Points
and Images". Sensors, 9:4525-4542
Rau J.Y., Chen L.C., 2003. "Robust Reconstruction of Building Models from Three Dimensional
Line Segments". Photogrammetric Engineering & Remote Sensing, 69(2): 181-188.
Rottensteiner F., 2006. "Consistent Estimation of Building Parameters Considering Geometric
Regularities by Soft Constraints". International Archives of the Photogrammetry, Remote
Sensing and Spatial Information Sciences, 36(3):13–18.
Rottensteiner F., Trinder J., Clode S., Kubik K., 2005. "Automated Delineation of Roof Planes
from LIDAR Data". International Archives of the Photogrammetry, Remote Sensing and
Spatial Information Sciences, 36(3/W19):221–226.
Ruther H., Martine H., Mtalo E,G., 2002. "Application of Snakes and Dynamic Programming
Optimisation Technique in Modeling of Buildings in Informal Settlement Areas". ISPRS
Journal of Photogrammetry & Remote Sensing, 56(4): 269-282.
Saalfeld A., 1988. "Conflation-Automated Map Compilation". International Journal of
Geographical Information Science (IJGIS), 2, 217–228.
Samal A., Seth S., Cueto K., 2004. "A Feature Based Approach to Conflation of Geospatial
Sources". International Journal of Geographical Information Science (IJGIS), 18, 459–489.
Schwalbe E., 2004. "3D Building Model Generation from Airborne Laserscanner Data by
Straight-Line Detection in Specific Orthogonal Projections". International Archives of
Photogrammetry and Remote Sensing, 35(3):249–254.
Sester M., 2009. "The Potential of Geosensor Networks for Sustainable Management of Urban
Areas". Proceedings of the Workshop on Spatial Information for Sustainable Management of
Urban Areas, Mainz, Germany
Shragai Z., Barnea S., Filin S., Zalmanson G., Doytsher Y., 2005. "Automatic Image Sequence
Registration Based on a Linear Solution and Scale Invariant Keypoint Matching", BenCOS -
ISPRS Workshop in conjunction with ICCV 2005 on 'Towards Benchmarking Automated
Calibration, Orientation and Surface Reconstruction from Images', Beijing, China,
International Archives of Photogrammetry and Remote Sensing. 36(3/W36): 5-11.
Tassios T., 2009. "The Archaeological Park of Samos", TO BHMA online, 23rd August 2009
http://www.tovima.gr/ default.asp?pid=2&ct=122&artid=284737&dt=23/08/2009
Tsenkova S., Potsiou C., Badyina A., 2009. "Self-Made Cities – In Search of Sustainable
Solutions for Informal Settlements in the United Nations Economic Commissions for Europe
region". United Nations Economic Commission for Europe (UNECE), United Nations
Publications, ISBN 978-92-1-117005-4, Geneva, p. 113.
Voegtle T., Steinlle E., Tovari D., 2005. "Airborne Laserscanning Data for Determination of
Suitable Areas for Photovoltaics". International Archives of the Photogrammetry, Remote
Sensing and Spatial Information Sciences, 36(3/W19):215–220.
Vosselman G., Dijkaman S., 2001. "3D Building Model Reconstruction from Point Clouds and
Ground Plans", IAPRS - the International Archives of Photogrammetry and Remote Sensing,
34(3/W4)
Wang Z., 1998. "Extracting Building Information from LIDAR Data". International Archives of
Photogrammetry and Remote Sensing, 32(3/1):279–284.

International Conference SDI 2010 – Skopje; 15-17.09.2010
197
Wiederhold G., 1999. "Mediation to Deal with Heterogeneous Data Sources". Proceedings of the
Interoperating Geographic Information Systems, pp. 1–16.
Wilbanks T.J., Romero Lankao P., Bao M., Berkhout F., Cairncross S., Ceron J.P., Kapshe M.,
Muir-Wood R., Zapata-Marti R., 2007. "Industry, Settlement and Society". Climate Change
2007: Impacts, Adaptation and Vulnerability. Contribution of Working Group II to the Fourth
Assessment Report of the Intergovernmental Panel on Climate Change, Cambridge University
Press, Cambridge, UK, 357-390.
Zhilin L., Qing Z., Qung Z., and Gold C., 2005, Digital Terrain Modeling – Principles and
Methodology, CRC Press, ISBN-13: 9780415324625.
6. BIOGRAPHICAL NOTES OF THE AUTHORS
Dr. Chryssy Potsiou, Assist. Prof., teaching Cadastre, Land
Management, Valuation, and Spatial Information Management at
the School of Rural and Surveying Engineering of the National
Technical University of Athens (NTUA) in Greece, is a surveying
engineer graduated in 1982 from the same School. She received her
PhD in the field of “Cadastral Spatial Information Collection and
Management” in 1995, also from NTUA. In parallel, since 1982 she
works as a private consultant, mainly in cadastral, photogrammetric,
urban planning and regeneration projects. She is the chair of FIG
Commission 3 on “Spatial Information Management”, for the period 2006-2010. She
has been an elected member of the UN-ECE WPLA Bureau for the periods 2001-2011.
Prof. Dr. Yerach Doytsher graduated from the Technion - Israel
Institute of Technology in Civil Engineering in 1967. He received a
M.Sc. (1972) and D.Sc. (1979) in Geodetic Engineering also from
the Technion. Until 1995 he was involved in geodetic and mapping
projects and consultation within the private and public sectors in
Israel. Since 1996 he is a faculty staff member in Civil and
Environmental Engineering at the Technion, and is currently the
Dean of the Faculty of Architecture and Town Planning. He also
heads the Geodesy and Mapping Research Center at the Technion. He is the chair-elect
(and chair for the period 2011-2014) of FIG Commission 3 on “Spatial Information
Management”.
International Conference SDI 2010 – Skopje; 15-17.09.2010
198
THE INFRASTRUCTURE FOR SPATIAL INFORMATION IN
THE EUROPEAN COMMUNITY VS. REGIONAL SDI: THE
SHORTEST WAY FOR REACHING ECONOMIC AND SOCIAL
DEVELOPMENT
Mauro SALVEMINI1
ABSTRACT
Geographic information, GIS and new ICT developments paved already the way for
developing new services for the communities based on the integration of e-government
and geo-information. European Union jointly with the surrounding nations already
invested important effort and achieved solid results by some specific Directives such as
PSI and INSPIRE directive and presently achieving the role of a reference point for
whom is intending to developing SDIs at national and sub-national level. The author
discusses the finding of geo-government as specific technique for tackling present
societal challenges of geo-information and services. Nevertheless some further
investigation and solutions are expected for fulfilling the user-needs of citizen-
communities who are looking for better and more efficient services given in the right
place at the right moment in all possible circumstances and specifically when
emergency is arising.
Furthermore the paper, posing some references about the institutional situation, traces
how the design and development of SDIs match the present trends.
Acronyms mostly used:
EU European Union - EC European Commission - ESDI European Spatial Data
Infrastructure - EUROGI EUROpean umbrella organisation for Geographic
Information - GI Geographic Information - GIS Geographic Information System(s) -
INSPIRE Infrastructure for Spatial Information in Europe - MS Member State – NGO
Non Governmental Organization - PA Public Administration - SDI Spatial Data
Infrastructure .
1. SOME HISTORICAL AND THEORICAL REFERENCES ABOUT
INFRASTRUCTURES
Infrastructures have always represented the most efficient system for achieving effective
control over and management of territory and for the development of society. Since
infrastructures may be based on different patterns and they develop according to the
native characteristics of the places and of the societies to which they belong, history has
1
Prof. Ing. Mauro SALVEMINI, [email protected]
President of EUROGI, www.eurogi.org - Sapienza University of Rome, Italy, www.labsita.org
Tel: +39 0649918830, Fax: +39 0649918873

International Conference SDI 2010 – Skopje; 15-17.09.2010
199
many examples of infrastructure, among which may be recalled : the roads in the
Roman empire that constituted a transportation infrastructure covering most or the
whole Europe and more, the churches and the abbeys during the medieval period which
were reference points of European territory, the roads of the INCA empire for managing
the all territory , “the ways of songs” of Australian natives for their nomadic settling of
the territory. These are just some few examples to highlight the relevance of the
infrastructure as part of the human being and his development. Today the cloud of
internet is only the present phase of the materialization of the need to be connected by
the world population. This characteristic of connecting for reciprocal benefit is a global
view shared by all nations and hopefully may represent within each nation and globally
as well, the way forward for helping to achieve some of the goals of our society.
The basic reason why infrastructures have played globally a relevant role directly
connected with the development and the sustainability of the territory is to be found in
the main characteristic of the infrastructure of allowing and meeting of the sharing of
different cultures and behavior making them understandable to each other and
facilitating overall physical and non-physical exchanges.2 Connecting people, regions,
nations through infrastructures has the interoperability on the basis of its functioning.
The interoperability itself provides for some specific aspects to be addressed (hardware,
software, data and semantic) in order to achieve the effective functioning of the
infrastructure.
Spatial Data Infrastructures (SDI) are specifically defined as having metadata, spatial
data sets and spatial data services, network services and technologies, agreements on
sharing, access and use, coordination and monitoring mechanisms, processes and
procedures.3
2. SPATIAL DATA INITIATIVES IN EUROPE
The meaning of Europe needs some explanations. The “European Union” (EU) refers to
the current political association of 27 Member States (MS) which form an economic
and political union. It should be openly recognized that in the EU the peculiarities and
the diversity of historical, political and social aspects, which characterize each MS
,generally divided into sub national areas with their own identity and power, make it
very difficult to have a single European view of anything.
Nevertheless it is possible to record a common attitude of the MS governments in
treating specific aspects which have been addressed and agreed upon at EU level such
as, in the specific dominion treated by this paper, the e-government, environmental
issues and Geographic Information (GI) and other related techniques.
2
This has been discussed in the theorem demonstrating the existence of the Data Infrastructures and Spatial
Data Infrastructures even in absence of ICT infrastructure which I presented and was then discussed at 2006
IGU Conference in Brisbane.
3
SDI has an evolving definition as Williamson says : •“The SDI concept is still evolving. However a key
component of SDIs is that they are dynamic in nature due to the intra- an inter-jurisdictional partnerships
they are based on. “ . Some different aspects are highlighted by several entities : GSDI (Global Spatial Data
Infrastructure) association privileges the access to data, protocols and standards ; EU INSPIRE directive is
mainly aiming to data and interoperability; some authors are euphoric of Web GIS services; some authors
address the complexity and public administration / user needs (capacity building) ; some authors address basic
theories ( semantics, cognition, grid computing, ubiquitous, etc.) .
International Conference SDI 2010 – Skopje; 15-17.09.2010
200
It is worth knowing that the EU acts with MS through Directives which after being
approved by the EU Parliament must be transposed and implemented into each national
legislation through a specific national act. Being in default of implementing EU
directives may open infringement procedures on the part of the EU itself against the
defaulting MS.
The European Commission (EC) (formally the Commission of the European
Communities) is the executive branch of the European Union. The body is responsible
for proposing legislation, implementing decisions, upholding the Union's treaties and
the general day-to-day running of the Union.
The most relevant and recent directive regarding GI has been passed by the EU
Parliament and came into force on 15 May 2007: it is named INSPIRE( Infrastructure
for SPatial InfoRmation in EUROPE)4. The Directive sets a general framework for a
Spatial Data Infrastructure (SDI) for environmental policies and for policies with clear
impact on the environment. INSPIRE aims to improve the interoperability and the
access to spatial information across the EU at local, regional, national and international
level, to facilitate the sharing of GI between public authorities and the improvement of
public access to spatial information.
INSPIRE is also complementary to related policy initiatives, such as the Directive on
the re-use and commercial exploitation of Public Sector Information. INSPIRE is based
on the premise that the European spatial data infrastructure shall be built upon the
national infrastructures that have been established and operated by the MS. Five key
principles have been highlighted since the signature of agreement among three
Commissioners of the EU Government and they represent the pillars of the initiative
which started more than five years ago and is nowadays consolidated into the Directive.
1. Spatial data have to be stored, made available and maintained at the most appropriate
level. 2. It should be possible to combine spatial data from different sources across the
community in a consistent way and share them among several users and applications. 3.
It should be possible for spatial data collected at one level of public authority to be
shared among other public authorities. 4. Spatial data are made available under
conditions which do not unduly restrict their extensive use. 5. It should be easy to
discover available spatial data, to evaluate their suitability for a given purpose and to
know the conditions which apply to their use.
These principles clearly address the ambitiousness of INSPIRE which intends to trigger
the creation of a European spatial information infrastructure that delivers to the users
integrated spatial information services to the users. These services should allow the
users to identify and access spatial or geographical information from a wide range of
sources, from the local level to the global level, in an inter-operable way and for a
variety of uses. The target users of INSPIRE include policy-makers, planners and
managers at European, national and local level and the citizens and their organizations.
Some examples of possible services are the visualization of information layers, the
overlay of information from different sources, spatial and temporal analysis, etc.
4 http://eur-lex.europa.eu/JOHtml.do?uri=OJ:L:2007:108:SOM:EN:HTML translation in
all EU languages may be found at this reference.

International Conference SDI 2010 – Skopje; 15-17.09.2010
201
The Directive has a key part in three annexes5 which cover the priority data themes to
which the Directive is addressed and they are covered by its daughter legislation which
take the form of Implementing Rules (IR) for specific aspects.
At the moment these IR cover five major issues : Metadata , Interoperability of spatial
data sets , Network services , Data and service sharing, Monitoring and reporting. They
will become legally binding as a EU decision through a comitology process set up at EU
level as part of the legislation.
The Directive transposition time expired in May 2009 but it has to be said that, in spite
of the wide consensus and strong support that has been received since the initial phase
from the majority off the scientific and technical communities and the public
administrations, after two years from the date of entering into force only a minority of
the MS have already ended the transposition phase. Nevertheless the adoption phase of
the IR , which runs parallel to the transposition process, will last until 2012 with phased
compliance between 2010 and 2012.
In spite of the delay in transposing the Directive into the national legislations, the
Directive itself has influenced and is continuously influencing the sub national level of
public authorities. This gives a multiplier factor to spatial information in many final
user oriented services provided by central and local public authorities.
3. LESSON LEARNED: ROLE OF PUBLIC ADMINISTRATION AND
OF END USER
Along with and in support of the INSPIRE Directive and ever since the early decision of
taking this initiative to set up an EU infrastructure for spatial data, the European
Commission (EC) has established a number of activities. Research projects, thematic
networks and pilot industrial projects have been financed in order to set up scientific,
technical, operational solutions and practices together with exploring and setting up
adequate and sustainable models for maximizing and exploiting the use of GI within the
EU. It is worth mentioning some of the most recent and relevant projects in the area just
to show the effort which the European community has made and is continuing to make
as regards the issue.
5
ANNEX I - SPATIAL DATA THEMES REFERRED TO IN ARTICLES 6(A), 8(1) AND 9(A) : 1.
Coordinate reference systems ; 2. Geographical grid systems ; 3. Geographical names ; 4. Administrative units
; 5. Addresses ; 6. Cadastral parcels ;7. Transport networks ; 8. Hydrography ; 9. Protected sites .
ANNEX II - SPATIAL DATA THEMES REFERRED TO IN ARTICLES 6(A), 8(1) AND 9(B) :
1. Elevation ; 2. Land cover ; 3. Orthoimagery ; 4. Geology
ANNEX III - SPATIAL DATA THEMES REFERRED TO IN ARTICLES 6(B) AND 9(B) :
1. Statistical units ; 2. Buildings ; 3. Soil ;4. Land use ;5. Human health and safety ; 6. Utility and
governmental services ; 7. Environmental monitoring facilities ; 8. Production and industrial facilities ; 9.
Agricultural and aquaculture facilities ; 10. Population distribution — demography ; 11. Area
management/restriction/regulation zones and reporting units ;12. Natural risk zones ;13. Atmospheric
conditions ; 14. Meteorological geographical features ; 15. Oceanographic geographical features ;16. Sea
regions ;17. Bio-geographical regions 18. Habitats and biotopes ;19. Species distribution ; 20. Energy
resources ;21. Mineral resources

International Conference SDI 2010 – Skopje; 15-17.09.2010
202
The EU Project HUMBOLDT6 (Towards the Harmonisation of Spatial Information in
Europe) intends to contribute to the implementation of a European Spatial Data
Infrastructure (ESDI). The main goal of the project is to enable organizations to
document, publish and harmonize their spatial information, by facilitating and
automating the necessary processes as far as possible. An essential element of the
project is the development of thematic scenarios in which the different components are
applied and tested under realistic conditions.
The ORCHESTRA7 project, recently ended, has produced the specifications for a
service oriented spatial data infrastructure for improved interoperability among risk
management authorities in Europe, which will enable the handling of more effective
disaster risk reduction strategies and emergency management operations. The main
result of the project is the Reference Model-ORCHESTRA Architecture (RM-OA),
open and based on standards, which is now an OGC Best Practice.
eSDI-NET+8 is a thematic network project aiming to the promotion of cross border
dialogue and exchange of best practices on SDIs throughout Europe, bringing together
key stakeholders of European SDIs and to realizing a platform for communication and
exchange of knowledge at all levels, from local to global. Currently the network
involves 21 participants all over Europe and includes Associations, Institutes,
Universities, Private Companies whose work is related with Geographic Information,
and promotes dialogue between them.
EURADIN 9 (EURopean ADdress Infrastructure) aims at constituting a Best Practice
Network in order to promote the European Address harmonization regarding the
definition, registration and access to the European Address Data. The project main
result will be the proposal for the European addresses Infrastructure and the
implementation, testing, and validation of a pilot solution.
Projects receive financial support through the European Union Framework Programs for
Research, which bundle all research-related EU initiatives together under a common
roof playing a crucial role in reaching the goals of growth, competitiveness and
employment, and specific programs such as e-Contentplus10 which provides measures to
make digitalcontentin EUROPE more accessible, usable and explotable. These projects
are defining specifications, common data models, guidelines, best practices as well as
services to access and download relevant data models in a number of vertical domains
corresponding to several themes of the Annex I to III of the Directive, ranging from
geology to natural areas from planning to addresses, from places names to marine and
coastal areas, etc.
INSPIRE Directive is technically based and geared by five motors represented by the
previously mentioned IR. But in the framework of the IR some other rules and models
to be applied to data listed in the three annexes of the Directive are expected. These
finalized and thematic models represent the real challenge of putting the interoperability
to work at EU level and even at national level. The large number of the data types
considered by the Annexes together with the user definitions which span from semantic
to technical native interpretation is absolutely making hard to assume that a world of
6
http://www.esdi-humboldt.eu 7
http://www.eu-orchestra.org 8
http://www.esdinetplus.eu 9
https://www.euradin.eu 10
http://ec.europa.eu/information_society/activities/econtentplus/index_en.htm

International Conference SDI 2010 – Skopje; 15-17.09.2010
203
interoperable SDIs might support the European decision making process in few years.
Nevertheless the impact of INSPIRE, his Annexes, the best practices of SDI, the
pervasion of GI in e-government already had an impressive and in some sense
unforeseen impact to the information society and to the services delivered to the
citizens.
The INSPIRE Directive has been perfectly on time to systemize the tremendous impact
of GI in the public administration. The use of GI has been in place for quite some time
but has not been characterize by any interoperability. In order to achieve the SDI task, it
is necessary to make sustainable the usage of GI within the Public Administration
processes. Sustainability for using GI means that concrete results should be achieved
and integrated into real services offered to the inhabitants and then be used efficiently
by them.
Interoperability standards offer effective solutions which need some refinements,
technical community acceptance and integration in the software engineering process.
But what is really needed is to insure that Public Administration employees have the
attitude and the skills for using the solutions mentioned above. If not : it is possible to
foresee catastrophic situations due to wasted resources ( money, skills , data , services ,
etc.) , the frustration of the achievements of expected and required services and un-
readiness to manage severe situations. It has to be said that the issue of setting adequate
skills in the field of advanced GI and mainly the SDIs has been recognized as relevant
in several ongoing research and best practice projects of the 6th and 7th European Union
Framework Program. Moreover some other projects focus on the criteria evaluation of
SDIs in order to check the real effectiveness of the GI services offered by the Public
Administrations and to grade them. The findings of several projects and researches state
that no user community may be built and/or convinced to use a specific technical
solution without motivating and training the users to join. Therefore it is highly
advisable to set up a platform containing a training package assisted by a training
framework to support the enhancement of the skills necessary to use services and GI in
an interoperable way. To this regard it is worth recalling the European Computer
Driving License – GIS11. The program, developed by LABSITA and AICA which is
Italian branch of ECDL Foundation , has been developed to satisfy the demand for basic
GIS knowledge and technical GIS skills, the ECDL Foundation launched and endorsed
this Certification in 2008.
11
www.ecdlgis.com --The EDCL GIS Certification process includes three modules that
certify a professional has demonstrated his/her skills in basic concepts of IT used in GIS; the components of
GIS; geodesy and topography applied to GIS; concepts and techniques of digital cartography; and the
techniques of analysis and viewing in GIS. These skills are tested using multiple choice questions and
practical tests applied to the most common GIS software (ESRI and Intergraph and some open source
software). The three modules are: Cartography (Module 1); GIS Systems (Module 2); and the Use of the GIS
Software (Module 3). The real strength of the certification is the vendor neutrality which is a requirement that
was set by the ECDL Foundation. While it is designed to be vendor neutral and covers many common tasks
used in different types of GIS software, the third module verifies the candidate’s knowledge and ability to use
GIS software packages.

International Conference SDI 2010 – Skopje; 15-17.09.2010
204
4. THE LOCAL DIMENSION OF SDI AND THE ROLE OF NON-
GOVERNMENTAL ORGANIZATIONS
As already mentioned since each MS of the EU is characterized by a very high number
of local PA the robustness of National SDI is based on how and how much the local
communities are involved in the process of participation in SDI. This is takes place
under the subsidiarity principle which is intended to ensure that decisions are taken as
closely as possible to the citizen and that constant checks are made as to whether action
at European and/or central or upper level is justified in the light of the options available
at national, regional or local level.
According to the attention locally given to the opportunity to have and to store data for
several communities INSPIRE represents not only a European directive but also a way
to further the development of knowledge and capability, to achieve results and put into
reality their own policies. It has been monitored in Europe that since INSPIRE has come
into force the SDI practice has demonstrated its utility by bringing local authorities and
citizens closer together and by clarifying and systemising the dependencies and links of
local authorities from the central or major order institutions ( region, nation, etc.) . The
SDI itself, being a contemporary infrastructure, boosts the interconnections among
different players, supports democratisation and public participation, offers opportunities
to the economy driven by the private sector, facilitates the opportunity for exploring
innovative ways of participation between public and private. The SDI, due to this
complexity, opens a large perspective to be complemented by side actions performed by
non governmental organisations.
The concept and praxis of complementarity is very much present specially in complex
actions where many stakeholders, subjects , functions and models co-exist. Some of the
main tasks of the complementing process aim to complete the main object, to provide
what the official partners lack and to maximise what they provide. In this respect it may
be taken as example the action performed by the EUROpean umbrella organisation for
Geographic Information (EUROGI) as non governmental organisation to complement
the realisation, the transposition and the evolution of INSPIRE undertaken by the
institutional activities of the EC and the EU Member States. Acting as a complement of
public institutions is a relevant issue of the mission of any non-governmental
organisation and this is largely recognised nowadays in several domains of present
culture and society.
The complementing effort concretizes through the principles which drive the methods
and the activities which are put in place for pursuing the desired effects.
INSPIRE principles have a long history and may be considered in the framework of the
European policies which have been finalised to manage national sovereignty and
multiculturalism while recalling some universal concepts and values. Geographic data
have been and are the focus of the knowledge, the management and the sovereignty of
the Member States and therefore, one of the main principles of Inspire, even if treated
through the technical approach of standardisation, is the sharing of geographic data.
Sharing is a relevant principle as it represents the will that applies universal values to
the communities. This may provoke some conflicts and at of course this is not trivial to
achieve due to the complexity of the societies and their own organisation. In terms of
principles an NGO firstly supports the ideas and concepts underlying the institutional
decisions and subsequent acts (e.g. INSPIRE directive) if they match its mission and
subsequently operates in the definition phase supporting the process directly and
through its members ( e.g. in the case of EUROGI the National Member Associations).

International Conference SDI 2010 – Skopje; 15-17.09.2010
205
INSPIRE technical methods are clear and effective. They mainly refer to standards used
as the main leverage for creating consensus, for managing and homogenising national
and multicultural differences. Methods are often seen as pure technical tools dedicated
to smooth, integrate and eliminate differences through the application of technicalities
finalised to adapt diversities. In reality the application of methods is always filtered
through cultural approaches. In the case of geographic data, more than technical aspects
related to data format and information technologies, the semantic, cultural,
governmental and organisational aspects play a fundamental role and unfortunately
sometimes represent uneasy frictions or obstacles. Regarding methods, there is
worldwide, a dramatic need for capacity building within public administrations and
society. This can only be achieved by institutional measures together with NGO efforts.
With respect to this an NGO as e.g. EUROGI should experience its attitude and try to
realise a number of initiatives for capacity building in the widest sense. This has to be
further developed using the opportunities and the tools that are offered by international
and national policies. In this area falls also the educational and professional training
initiatives which have been briefly mentioned before ( see ECDL in footnote 10).
The process of acting as complement of institutional initiatives from on the part of an
NGO has been named the evangelisation process in order to emphasize the fact that
human resources of adequate quality are invested for disseminating knowledge among
different communities and directly to the citizens. Awareness raising and capacity
building are the most relevant evangelization results. They are widely recognised as
representing the foundation of every action aiming to develop a society. The practical
instruments of evangelization are the activities based on principles and methods and
they represent the terminals of the process. Unless they take the form of workshops,
conventions, forums, websites, white papers and reports, face to face meetings or
participation in events and publications, for complementing SDI some specific tools
should be set up and used. Among them it is worth recalling the user needs analysis and
monitoring, data model verifying against multiculturalism, specific tools for traditional
and automated training and education.
5. THE WAY FOR ACHIEVING AND SOCIAL DEVELOPMENT: GEO-
GOVERNMENT
It has been largely demonstrated12 that the value of geo-information as perceived by the
buyer, the user and the citizen (as final free-of charge user) depends on a variety of
factors. Some of them are strictly related to the functioning and internal structure of the
public and/or private organization in which the spatial data are going to be used. Others
depend on the specific application areas and finally some relevant factors are related to
how they are perceived and used by the final user that may be easily identified as the
final user of the service chain using GI. It has also to be taken into account that the
value and the quality of geo-information are codependent as also it has to be taken into
account the fact that the availability, specially on the world wide web, of a large amount
12 EUROGI recently organized the workshop PPP4SDI Public Private Partnerships for
building Spatial Data Infrastructures: Summary and recommendations Report --
http://www.epsiplus.net/media/files/ppp4sdi_report_part1_v1_1_final

International Conference SDI 2010 – Skopje; 15-17.09.2010
206
of free remote sensed and satellite images together with some cartography strongly
influence the way how the GI is perceived and used. 13
Even though the GI is pervading directly and indirectly our everyday life social and
economic development may be achieved only if there are clear plans for the usage of
spatial information in achieving services for the direct benefit of society.
Just to mention some of the dominions where digital GI has already played a role with
the direct participation of the citizens we have to consider: Tourism and traveling,
Agriculture, Environment, Natural hazards and security, Land ownership , Housing and
planning. But it should also be honestly pointed out that all these application areas and
several more technical and specific ones have already benefited for a long time from
traditional cartography.
Therefore what more may be offered by the infrastructure of spatial data and how much
better?
Since we are mainly a digital oriented society it has to be considered that geo-
information is becoming a major constituent of many activities and of human life
generally speaking. It has also to be considered that in the process of public authorities
devolving missions, competencies and responsibilities to other authorities most of them
at local level GI is playing the role of homogenizer of information precisely because of
univocity of the geographic address for a large quantity of information. As the tendency
of many nations and public administrations is to go from central to local for services
offered to the population and vice versa to go from local managed monitoring systems
to centralized archive, the trend within the user community is to share the personal
micro-knowledge of the territory on the internet. The so called micro-geography is the
most appreciated by the end user even if macro-geography (so easy to access nowadays
through satellite images and the web) has some new appeal as a living atlas. But the
easiness of micro-knowledge generates the paradox that, even though the systems
facilitate the access and the view of geographic information, real and deep knowledge
is not fully transferred. It remains a fact that the citizen is the only one who knows very
well the vicinities to which he is customer.
The added value of the SDI resides in ensuring the circulation, the access, the
availability of data stored by different users in different locations, the seamless
integration of data and in the possibility of sharing the micro geographic information
through a macro system providing services to the users.
The SDI may be effective for economic and social development through the government
of the territory and the e-government. This is the natural trend of using GI but it may be
13
Report of International Workshop on Spatial Data Infrastructures’ Cost-Benefit Return on
Investment ;Ispra, Italy 12-13 January 2006
http://www.ec-
gis.org/sdi/ws/costbenefit2006/reports/report_sdi_crossbenefit%20.pdf
The Socio-Economic Impact of the Spatial Data Infrastructure of Catalonia P. G.Almirall, M.
M.Bergadà, P. Q. Ros - Universitat Politècnica de Catalunya Centre of Land Policy and Valuations - M.
Craglia (Editor) - European Commission - Joint Research Centre Institutefor Environment and Sustainability
http://inspire.jrc.ec.europa.eu/reports/Study_reports/catalonia_impact_stu
dy_report.pdf

International Conference SDI 2010 – Skopje; 15-17.09.2010
207
achieved only if public administrations are able to achieve and guarantee geo-
government services.
The geo-government (geo-gov) is the ability of public authorities to use geo information
for managing , controlling, planning human activities and the nature of the territory.
Geo-gov concretizes if the geo-information is bundled within the public administration
initiatives in a way that the final user (generally the inhabitant but it might also be the
environment and the wildlife) gets advantages which may not be achieved without using
geo-information and SDI .
In my opinion, in order to maximise the effectiveness of the results, our attention has to
be turned to Spatial Data Infrastructures as a comprehensive system which satisfies the
need of the users (citizens, inhabitants) to be placed at the centre of the scene. The
spatial component of data in the infrastructures has always been present but sometimes
it was hidden and/or bundled in the data and information collected and stored in systems
and or simply provided to decision making process. Therefore the real strength of the DI
(Data Infrastructures) has been and is based still on the infrastructure itself.
What does an infrastructure represent for the public administration in the concrete
dominion? In physical terms the infrastructure goes from the premises hosting
employees , visitors and archives to the roads and paths, cables and networks allowing
the circulation of papers , forms, certificates and information .In the intangible
dominion the infrastructure is represented as the set of rules , procedures , specifications
, data and information which govern the production, the distribution and the usage of
the services and the functioning of the infrastructure itself.
6. CONCLUSIONS AND RECOMMENDATIONS
This paper has demonstrated that Europe has already established and is operating
relevant developments towards the SDI and that many European institutions 14 are
playing key roles in contributing to it. Europe is also aware that SDIs generate financial,
political, socio-economic, commercial and technical benefits and because of this it is
investing at Community and at MS level.
It has also to be considered for the sake of clarity that the mentioned activities are part
of a common approach to SDIs which is globally pervading our earth. It has already
been largely demonstrated that the success and the efficiency of SDI is strictly
dependent on how it has been designed, organized, populated by data, how it satisfies
the need of end users, how it is locally dependent and centrally related. According to
this, the idea of having a unique model for setting up an SDI is far from being truly
sustainable. Having the same ingredients each SDI has its own characteristics insuring
its absolute interoperability. Therefore each SDI (national, regional, local) should have
the status of full partner of major level SDI and not the one of the client of an already
established Supra or Global SDI.
This is absolutely demonstrated by the fact that the geo-services offered and/or
supported by SDI are used locally by end users that have their own identity reflected in
the services requested and that the geo-gov acts locally as already experienced by the e-
gov. The approach of providing services where they are requested helps to reduce the
digital divide and de-facto facilitates social and economic development.
14
The institutions already mentioned in the paper are only part of the number of stakeholders involved in the
process. In order to find more references the INSPIRE web site and related ones should be visited.

International Conference SDI 2010 – Skopje; 15-17.09.2010
208
Nowadays the way in which, Europe acts shows some very interesting peculiarities in
the sense that it individuates one Directive for removing inefficiencies and improving
value and quality in the provision, sharing and use of GI. To let collaborate together
National SDIs developed by the Member States under the aegis of a common agreed
Directive and then to proceed through implementing technical rules and common data
models it is seems the most effective way for maximizing the results respecting the
identities and the peculiarities of each nation and his territory.
The strength and applicability of a subsidiarity model for developing SDI is largely
demonstrated by the fact that it is applied in the majority of the European nations
between the central and the local level (nation-regions , nation-provinces, region-
provinces, etc.). The issue of relationships between central SDI and local SDI is
becoming even more important in the political trend of devolution to local governments
in the EU and represents foundations for collaboration with countries from other
continents.
It should be clear also that the way of achieving social and economic development
should be consistently based on academic education, research and training institutions
able to produce not only GI specialists and GI users and products but also specialized
professionals for designing and developing geo-services.
After some profitable years of investigation and technical and scientific findings mostly
based on the axiom of interoperability it is now time to overturn the SDI praxis shifting
the effort mainly of public administrations from the technology driver to the social and
economic drivers in order to ensure the development of society by offering finalized and
locally-based services based on GI and technological achievements. This may be
achieved by a strict analysis of real user needs, an effective design process and investing
adequate resources in the framework of capacity building of the users.
7. BIOGRAPHICAL NOTES
Internationally recognized expert in applied informatics to spatial
planning, environment and e-government. Pioneer of spatial data
infrastructure.
Engineer since 1972, professor of applied computer technology in
planning and urban design professor at Sapienza University of
Rome and at Italian and foreign universities. UN expert in 2009
was invited to join to the small group of world experts to
implement the UN World Conference on Geographic Information Management. Expert
of the European Commission for e-government and the spatial information , he has been
involved since the beginning in the INSPIRE directive of European Union. Head of
Laboratory of Geographic and Environmental Information Systems, University of Rome
and president of Italian Association AMFM GIS Italy and of European Association
EUROGI. Former President of AGILE European association of research laboratories
for spatial information, he taught in American universities, Spanish and Egyptian. He
is member of Global Advisory Committee of OGC. Head of research for public and
private organizations, designer and project manager of major public contracts in the
field of information systems and digital mapping. Author of more than eighty
publications, most presented at international conferences. Member of national and
European committees, already director of public corporations , he is settled in Italy
between Rome and Anzio.

International Conference SDI 2010 – Skopje; 15-17.09.2010
209
REGIONAL GI CLUSTER IN SUPPORT TO THE SDI
DEVELOPMENT
Anders ÖSTMAN1, Jan BJERKMAN2 ABSTRACT Cluster development has received political interest due to its contribution to regional development. This is also visible in the EU policies for research as well as regional development. Future Position X (FPX) is a GIS cluster based in Gävle Sweden. Its aim is to promote regional development by supporting the growth of GIS businesses. Spatial Data Infrastructure at the local level is mainly possible to larger cities. In order to provide equal opportunities also to smaller cities, some kind of coordinated actions are required. Regional GIS cluster initiatives may here play a substantial role in fulfilling these political ambitions, by taking a leading role in the development of regional SDI’s. During recent years, the FPX cluster has achieved substantial results in terms of business development in the region. The annual turnover among the GIS SME’s have for instance increase by 98 % during the last two years, according to independent audits. The employment rate has also increased. During the past two years, FPX has been the leading actor in implementing a regional SDI. By doing this, GI services are available also to citizens and companies in rural areas and small municipalities. The regional SDI have substanially decreased the operation costs for the parties involved. In the coming years, the cluster development will be focussed on the commercialisation of R&D results, the spread of GI technolgies to other sectors and international cooperation. The regional SDI is still in development phase, but it is expected that its financing will be sustainable and that new applications will be introduced in large as well as small municipalities. Key word: GIS clusters, Spatial Data Infrastructures, GIS portal.
1. INTRODUCTION Based on the work in economic science by Michael Porter, the concept of regional business clusters has gained importance (Sölvell et.al, 2003). The theory states that if, in a certain region, there is a substantial amount of people working in a specific sector, the potential for business growth is substantial. Depending on the sector and other regional
1 Prof. Dr Anders Östman, [email protected] University of Gävle, www.hig.se Tel.: +46 26 648436, Gsm.: +46 706 491975, Fax: +46 26 648585. Kungsbäck, SE-80176 Gävle, Sweden. 2 Mr. Jan Bjerkman, [email protected] Future Position X, www.fpx.se Tel.: +46 26 614400, Gsm.: +46 704 140633 Box 975, SE-80133 Gävle, Sweden.

International Conference SDI 2010 – Skopje; 15-17.09.2010
210
factors, the size of this critical mass varies. But the basic idea is that you need a concentration of resources within a limited area (for instance 1 hour of travel time), in order to fulfill one of the requirements of Porter’s cluster theory. In 2001, the Swedish government announced the idea of supporting innovation systems, both within research as within regional development (Sveriges Riksdag 2001a, Sveriges Riksdag 2001b). These innovation systems were based on the Triple Helix model where industry, academia and the political sphere cooperate for business and regional development (figure 1). The consequence of this initiative was that some, not all, research funding agencies also had to consider scientific excellence as well as the regional and economical impact of research initiatives. Since the initiative was operational in 2003, around 25 different Swedish cluster initiatives have received support for development. One of these initiatives is Future Position X. This cluster is based in Gävle and its aim is to strengthen the GIS business in the region.
Figure 1. The Triple Helix model. The private companies consume knowledge and create monetary resources. The academia consumes monetary resources and produce knowledge. The political sector is here acting as a facilitator. It provides basic resources like infrastructure (roads, air traffic, rail, internet etc) as well as well educated human resources that enter the system. It should also be mentioned, that the idea of regional clusters also has been introduced within the European programs. In the seventh research framework program (FP7), there is a new action item for “Regions of knowledge” (European Commission, 2009). This program supports the development and integration of research-driven regional clusters, operating according to the Triple Helix model. The first call, released in July 2009, was aimed for health-related economy. The next call, planned to be released in July 2010, is aiming at sustainable transport. The concept of Spatial Data Infrastructure (SDI) was given a wide attention with the announcement of the presidential decree in 1993 (Federal Register, 1993). Here it was stated that the US federal agencies should share their geospatial information by using internet based services. As a response, although quite late, the European Commission
International Conference SDI 2010 – Skopje; 15-17.09.2010
211
launched the INSPIRE initiative in 2001 (CEC, 2002). This initiative resulted as a directive in 2007 (European Commission, 2007), stating that each member state shall provide specific geospatial data according to certain specifications. Although most European municipalities are not directly affected by the INSPIRE directive, there is a considerable interest in creating such local SDI’s also at a municipal level. Improved services to the citizens and to the business sector, as well as cost reductions within the public administration are some of the driving forces for this development. But municipalities vary a lot in size and economical resources. In order to provide opportunities for SDI development also within smaller municipalities, some kind of coordinated development is preferred. Since this is a matter of regional policies, regional GIS clusters can make considerable contributions to this type of development. To summarize, we have a political development where the concepts of regional clusters based on the Triple Helix model are gaining importance. In addition, we have a continuous development of local SDI’s at the municipal level. But since some agencies, like the regional rescuing service, are operating at a regional (county) level, the development of local SDI’s should be harmonized. From a political point of view, people living in small municipalities should for instance have equal access to rescuing services as people living in larger municipalities. GIS clusters, like Future Position X (FPX) in Gävle, are well suited to deal with both these issues. The objective of this paper is to describe the operations of FPX and the results it has achieved, with respect to business development and the development of local SDI’s. 2. FUTURE POSITION X Since the National Land Survey has its main office in Gävle, GIS has early been recognized as an important sector in the region. In order to share resources for development, Future Position X (FPX) was established as a non-profit organization in 2004. Its statues state that FPX is a regional GIS cluster, aiming to promote the regional development by promoting the local GIS-related industry. Its membership consists currently of around 30 organizations, mainly SME’s. The members can roughly be grouped into four categories, namely
• Traditional GIS companies like ESRI S-Group, GeoIntel (distributor of SuperMap software from China) and SWECO Position (GIS consultancy).
• IT-related companies, applying GIS technology for specific sectors, like OpenCare (health), Fiberdata (networks, hosting etc) etc.
• Public authorities like the National Land Survey of Sweden (Lantmäteriet), City of Gävle and the University of Gävle.
• Large enterprises, being GIS users. Examples in this category are Korsnäs (forestry) and Sandvik (steel).
In 2008, FPX received financial support (EU structural funds, regional funds etc) for building up the cluster activities. During the years 2008 – 2009, main attention has put on providing business opportunities for the members and to strengthen the international

International Conference SDI 2010 – Skopje; 15-17.09.2010
212
collaboration. When evaluating the results presented below, it should be noted that Gävle is a quite small city. The city of Gävle has around 94000 inhabitants. The population in the entire county (Gävleborg) is around 276000. Based on external auditing, the following results have been reported.
• 156 companies / organizations have participated in the cluster activities • The gender distribution among the participants is fair, but not entirely equal.
Around 34 % of the participants are female. • Agreements with 6 non-Swedish partner clusters have been signed. • 8 new companies established • 42 new services have been developed • 254 new business contacts for the members (leading to new businesses) • 9 companies have entered the international market • Annual turnover among the SME’s increased by 98 % • Employment among the SME’s have been increased by 79 %.
According to regular surveys by ULI, the market has increased by 25% annually, for nearly 20 consecutive years (ULI, 2005). The growth among the SME members in the FPX cluster is however much higher. But due to the limited period for comparison (only two years), these figures may only serve as an indication of the success of the FPX cluster. Due to changes in the regional policies, the size of the region is expected to increase within a few years. The new region, which will correspond to the NUTS level 2, will consist of 3 old regions. This means that the new region will cover 41 municipalities instead of the current 10. But since the cluster theory assumes also a geographical focus, the GIS cluster will still be based in Gävle. However, other major cities in the new region also have their clusters, for instance the ITS cluster in Borlänge and the paper packaging cluster in Karlstad. An increased cooperation between these sector clusters is however to be expected. When analyzing the needs of the GI-sector, the following driving forces may be observed
• For the time being, a massive attention is currently focused on the SDI development. However, the users and potential users of SDIs, within the public sector as well as among private companies, are neither familiar with the potential of external geo-information nor with the value added which may be yielded. In addition, the technology providers are also new to this changing market.
• There is a fast growing amount of geospatial data from many sources worldwide. From the private sector we can now obtain data from companies such as GeoContent, Navteq, Teleatlas and Blom. They are all large companies acting on the global market. Also within the satellite data sector we see new initiatives, for instance RapidEye and GeoEye.
• The sensor development has also resulted in many different dataset related to weather, traffic, environmental data, observation of critical infrastructures etc.

International Conference SDI 2010 – Skopje; 15-17.09.2010
213
• New directives at the European level, such as INSPIRE, the Public Sector Information directive (PSI), the SEIS initiative and environmental directives like the Water Framework Directive (WFD) creates new demands and opportunities for the sector. In addition to this, there are also some additional EU programs that contributes to this development such as Galileo and GMES
• There is an intensive on-going standardization work, lead by the Open Geospatial Consortium (OGC). Their specifications (industry standards) are then usually adopted by the formal standardization bodies like ISO and CEN.
• The leading software industries in the field of geo-technology have recently launched new developments, such as Microsoft and their Virtual Earth Platform, Google with Google Maps and Google Earth and Yahoo with Yahoo-Maps. In addition to this, many providers of database software are integrating spatial data types in their relational database systems like Oracle, Microsoft SQLServer, Postgres/PostGIS, mySQL etc.
• GI technologies are increasingly used in mainstream products, for instance for navigation, GPS, mobile devices, geo-social-networking etc.
• The virtualization of hardware and software platforms provides a potential of considerable cost reductions. This development is sometimes called Infrastructure as a Service (IaaS) within the cloud computing community.
Considering this massive development, it is obvious that commercial companies must have deep insight in the technological development, the political or societal trends as well as the changing needs of their customers. This is not an easy task to fulfill for SME’s and local governments, which usually have limited resources. Seen in that perspective, the role of FPX as business facilitators and knowledge providers will increase in the future. 3. LOCAL AND REGIONAL SDI’S In the late 1990’s, the city of Gävle started to coordinate its geographical information in order to create what we today would call a local SDI. One of the driving forces was the realization that the social sector had very large costs but also a large potential for improved efficiency. In order to support the development of IT systems in the social sector, basic spatial information had to be made available. As a result, some very simple but also very efficient applications were built, for instance the one dealing with the availability of doctors and nurses (figure 2). This is special importance during the summer vacation period, when some health care providers are closed and clients must be redirected to other places nearby. Other successful applications deal with crime statistics, planning of bus transport for school children, digital archive of detailed plans, demographic statistics, land ownership and environmental concerns like radon emission.

International Conference SDI 2010 – Skopje; 15-17.09.2010
214
Figure 2. Early application showing access to primary health care. Due to the success of the local SDI in Gävle, requests for similar solutions but on a regional level were raised in 2004. There is a large variation in resources among the municipalities in Gävleborg County, but all have similar needs. In order to share investment costs, a regional SDI was established, consisting mainly of a shared database with geospatial data (cX database). Since the city of Gävle was the one having most experiences and resources, they were selected to host and maintain the database. An enlargement of the regions is currently being considered by the Swedish government. If and when such an enlargement takes place, the new region will be increased to 41 municipalities as compared with the current 10 municipalities. The main part of this new region is to be characterized as rural. In order to achieve an effective regional SDI, a new shared database with corresponding applications has to be developed. This new initiative should of course be based on the cX database but also considering the systems implemented in the other cities too. A new project (GIS-Arena) was initiated in 2008. It has been supported by various regional funds but also the structural funds of the European Union. The purpose is to provide detailed spatial information to all actors in the society (citizens, companies, authorities, non-governmental organizations etc). The aim is not to produce data, but to make existing data available. In this sense it is similar to the implementation of the

International Conference SDI 2010 – Skopje; 15-17.09.2010
215
INSPIRE directive at the national level. However, the main difference is that the INSPIRE directive is a legal act, while the regional SDI is based on volunteer cooperation. This means that the financial conditions are different. Another difference is that the INSPIRE directive mainly deals with national data which may have quite low resolution sometimes. The regional SDI deals with high resolution urban data, sometimes with cm accuracy. The GIS-Arena project has been split into three major tasks, namely the establishment of a basic geospatial database and associated web services, secondly the establishment of shared applications for urban and regional planning and thirdly the dissemination of information and results. The project was finalized in 2009 and the objectives were reached within budget as well as time (GIS-Arena 2010). The main problems which occurred during the project were related to communication among the participants and late delivery of basic data from major data providers. Also some problems in software development have been recognized. What also should be noted is the increased interest in application development that has been observed. Due to the wide use of the SDI, new applications like flood prevention planning and on-line submission of building permissions are under development. Also the smaller cities do now have access to applications that earlier were only available at the larger cities, for instance about primary health care, bus routes etc. There is also a substantial interest from local industries to develop new applications, related to for instance logistics. 4. PERSPECTIVES ON THE FUTURE There are several challenges that lie ahead of the FPX cluster. The rapid technological development is one such factor. Shifts in the macro-economical climate as well as other climate and environmental changes will give new opportunities as well as new problems to solve. The current cluster development activities are along three lines, namely
• Commercialization of research and development projects. One such example is the GeoTest project, where procedures for testing GI services have been developed (Östman et.al, 2009 and Östman, 2010). This type of tests are required for the implementation of the INSPIRE directive, but are also essential for the development and tuning of regional and local SDI’s.
• Widening the scope of GI development and the use of geospatial information. Future Position X has recently received funding for a new project (daGIS), aiming to widen the use of geospatial information to new sectors in the society and to increase the involvement of the academic sector in the regional development.
• There is a need to improve the international contacts, mainly among the business partners of the cluster. For this reason, a series of international GI cluster conferences have been organized. The first conference was held in Gävle in 2008 and the second one in Biloxi (USA) in January 2010 (Directions Magazine, 2010). Future similar conferences are expected, where cluster development issues are discussed

International Conference SDI 2010 – Skopje; 15-17.09.2010
216
The regional SDI as implemented by the GIS-Arena project is now going to be based on a sustainable base. Initial estimates shows that the annual cost for operating the entire system is around 0.25 € per inhabitant. This is about 0.15 % of the total tax income for the participating municipalities. Combined with the expectation that the benefits will be larger than the costs, this hardly visible budget line is not believed to be a major obstacle. The current system is built on web technologies. There is a new trend on virtualization, or cloud based solutions. According to Östman (2010) there are some not fully reliable cost analysis which claims that the operational costs may be cut by a factor of up to 50 % by going cloud based. To what degree these claims are based on real facts or wishes, remains to be seen. But there certainly is a potential for reducing the operational costs further. By cooperating and making use of the scaling advantages is one successful way to go. 5. CONCLUSIONS The conclusions of this paper may be summarized as follows
• Cluster development is of high political interest today, due to its potential to promote regional development. The Triple Helix model is here essential.
• GIS clusters have a great role to play in the establishment and development of local and regional SDI’s.
• Regional SDI’s have a potential of reducing the operational costs for GI systems as well as increasing the usage of geographic information within various sectors in the society.
• During recent years, the FPX cluster has achieved substantial results in terms of business development in the region.
• In the coming years, the cluster development will be focussed on the commercialisation of R&D results, the spread of GI technolgies to other sectors and international cooperation. The regional SDI is still in development phase, but it is expected that its financing will be sustainable and that new applications will be introduced in large as well as small municipalities.
6. ACKNOWLEDGEMENTS This work described in this paper has been sponsored by the structural funds of the European Union, VINNOVA, Lantmäteriet, City of Gävle, University of Gävle and Region Gävleborg 7. REFERENCES CEC (2002): Commission of the European Communities, Memorandum of Understanding between Commissioners Wallstrom, Solbes and Busquin: Infrastructure for Spatial Information in Europe (INSPIRE), Brussels, European Commission (www.ec-gi.org/inspire/). Directions Magazine, 2010. GIS Clusters From Around the Globe Gather in Mississippi for 2nd International GIS Cluster Conference. http://newsletter.directionsmag.com/link.php?M=89458&N=2468&L=30109

International Conference SDI 2010 – Skopje; 15-17.09.2010
217
European Commision, 2007. Directive 2007/2/EC of the European Parliament and of the Council of 14 March 2007 establishing an Infrastructure for Spatial Information in the European Community (INSPIRE). http://www.ec-gis.org/inspire/directive/l_10820070425en00010014.pdf European Commission, 2009. Regions of Knowledge. http://cordis.europa.eu/fp7/capacities/regions-knowledge_en.html Federal Register, 1993. Coordinating Geographic Data Acquisition and Access: The National Spatial Data Infrastructure. Federal Register, Vol. 59, No. 71 Wednesday, April 13, 1993. http://www.archives.gov/federal-register/executive-orders/pdf/12906.pdf GIS-Arena 2010. Projekt GIS-Arena. http://gisarena.fpx.se/info/info.htm Östman A, Abugessaisa I, Tanzilli S, He X, El-Mekawy M, 2009. GeoTest: A Testing Environment for Swedish Geodata. Paper presented at the GSDI 11 World Conference, Rotterdam, June 15-19, 2009. http://www.gsdi.org/gsdi11/papers/pdf/234.pdf Östman A, 2010. Network for testing GI services. Invited paper to the GIS Ostrava 2010 Symposium, January 24-27 2010. Sölvell Ö, Lindqvist G, Ketels G, 2003. The Cluster Initiative Greenbook. Ivory Tower AB. http://www.cluster-research.org/greenbook.htm Sveriges Riksdag, 2001a. En politik för tillväxt och livskraft I hela landet. Regionalpolitisk proposition 2001/02:4. http://www.sweden.gov.se/content/1/c4/21/04/e3e0daba.pdf Sveriges Riksdag, 2001b. FoU och samverkan i innovationssystemet. Forskningspolitisk proposition 2001/02:2. http://www.sweden.gov.se/content/1/c4/21/09/a7c6f100.pdf ULI, 2005. Geografisk information i Sverige, 2003. ULI-rapport 2005:1. http://www.geoforum.se/page/158/180/1295
6. BIOGRAPHICAL NOTES OF THE AUTHORS
Anders Östman is currently professor in geomatics at the University of Gävle. He made his PhD in Photogrammetry at KTH in 1986. He then worked for Intergraph Sweden, before returning back to academia and a professorship in Geographic Information Technology at Luleå University of technology. His current research interest is Spatial Data Infrastructures and the quality and usabiloity of geospatial data.
Jan Bjerkman has since 1996 worked as a business developer at the city of Gävle. The work has mainly been aimed at supporting the establishment of new serviceoriented companies in a wide meaning. Since 2004 he is full time working with supporting Future Position X in Gävle. Here he has the role of a senior cluster developer and is currently occupied by strengthening the cooperation according to the Triple Helix model and long term financial support. Before 1996 he was working with regional policies and employment issues for more than 30 years.

International Conference SDI 2010 – Skopje; 15-17.09.2010
218
SOME ISSUES TO BE TAKEN INTO CONSIDERATION WHILE
DEVELOPING A NSDI IN THE REPUBLIC OF MACEDONIA
Dimo TODOROVSKI 1
ABSTRACT
For most developed nations the problem today may be how to make their geo-
information applicable in a much more efficient way, share the geo-information via
appropriately developed National Spatial Data Infrastructures (NSDI). In developing
world, on contrary, the problems start with making geo-information available. At the
same time these countries are confronting problems of accessibility and applicability -
development of their NSDI’s. Experiences from other countries could be very useful
and they could be utilized when developing NSDI for a particular country, in the case of
the Republic of Macedonia too.
It is recommendable not to work in isolation, share the knowledge and experience and
learn from each other. This would result with ‘not inventing a wheel’ for the second
time, avoiding repetition of the same mistakes and development of better NSDI. From
the lessons learned from countries that already developed their NSDI but also from the
scientific gatherings where the NSDI topic is observed, explored and discussed, the
following issues is recommendable to be taken into consideration: problems when
introduce the concept of sharing spatial data, difficulties when exchanging data between
databases, types of heterogeneity, workflow and workflow management, etc.
Finally this paper concludes that being aware of the issues above could be useful while
developing a strategy for development of NSDI in the Republic of Macedonia, an
implementation plan should have them included and task force appointed for
implementation of NSDI should be familiar with them but also they should be taught
with experiences, examples how other countries tackled solving the mentioned
problems.
Key words: NSDI, geo-information, sharing data, exchange data, heterogeneity,
workflow
1 Dimo TODOROVSKI, MSc, [email protected], [email protected]
Researcher in Land Administration Domain
Mob.: +389 70 461 450,
Pavle Ilik 2/3-12, 1000 Skopje, Republic of Macedonia.

International Conference SDI 2010 – Skopje; 15-17.09.2010
219
1. INTRODUCTION
This paper addresses some of the important issues that should be taken into
consideration while developing NSDI in the Republic of Macedonia, identified as
possible problems in the experiences of the countries that already developed their
NSDI’s.
At the beginning this paper presents background and objectives that NSDI’s are based
on and objectives that they tackle and try to improve. It continues with description of
the status of geo-information in the developing world. Possible models for development
of NSDI strategy based on lessons learned from other countries experiences are
presented in Chapter 4. Important issues like: problems when introduce data sharing
concept, difficulties when exchange data between databases, types of heterogeneity,
workflow and workflow management are discussed in Chapter 5. At the end this paper
finalizes with deriving some conclusions and recommendations.
2. BACKGROUND AND OBJECTIVES OF NSDI’s
The notion of a data infrastructures as a mechanism to provide more effective access to
geospatial data first emerged in early 1980 in Canada (Groot and McLaughlin, 2000).
The objective of NSDI is to support the availability and access to geo-information, and
facilitate the data sharing by connecting different geo-information provider
organizations together (Groot, 2000).
In order to combat the negative effects of multiple data collection, storage and
dissemination, data sharing is a solution. This means that government bodies at all
levels use data that is collected by one of them and that they don’t spend money, on
collection the same data by themselves. In fact this is the main challenge of the concept
of the NSDI’s (Molen, 2005).
When setting the objectives for development of NSDI it is recommendable to be
acquainted with the basic concepts, cases and good practices of NSDI and in case of the
Republic of Macedonia the INSPIRE directive.
If we summarize in general which goals are meant to be achieved by creation of a
certain NSDI, we can extract the following list of objectives:
• increase data sharing / exchange;
• increase and control quality of public geo-information;
• reduce data duplication and duplication of activities;
• enhance organizational cooperation;
• reduce transaction cost to find, create, acquire, assess, appraise, exchange geo-
information;
• improve use of geo-information;
• sustainable development.

International Conference SDI 2010 – Skopje; 15-17.09.2010
220
If we observe the list above more carefully, it can be concluded that almost in all
objectives the data or geo-information component is present. From here reveals the
importance of the geo-information factor as one of the most important, most basic parts
of a NSDI.
3. GEO-INFORMATION IN DEVELOPING WORLD
Although NSDI’s have a substantial component of ICT, the most fundamental asset is
the data itself, because without data there is nothing to have access to, to be shared,
exchanged or to be integrated (Molen, 2005).
For most developed nations the problem today may be how to make their geo-
information applicable in a much more efficient way, share the geo-information via
appropriately developed NSDI. In developing world, on contrary, the problems start
with making geo-information available. At the same time these countries are
confronting problems of accessibility and applicability - development of their NSDI’s
(Borrero and Lemmen, 2002).
If we observe carefully Chapters and Act in the INSPIRE Directive (INSPIRE, 2007)
regarding the spatial data component there are very precise directions, what could be
important for the development of the Macedonian NSDI in the General Provisions are:
spatial data should be in electronic format and that the directive does not require
collection of new spatial data set.
The following findings are from the cases of the status of the geo-information in the
developing world, and these topics require specific attention and improvement in order
to have a functional and operable NSDI:
• not 100% percentage of the geo-information themes required are in digital form;
• geo-information is not developed in appropriate formats and data models;
• file based storage of the geo datasets not database concept in use;
• metadata catalogues not developed;
• standards/protocols not fully implemented;
• organization of the spatial data in geo-data bases;
• security mechanisms required;
• copyrights also required;
• introduction of sharing, exchange and integration of geo-information;
• development of methods for distribution geo-information via standardized digital
channels.
This paper finds the geo-information component within the NSDI as one of its key
elements, that’s why it is recommendable to put a specific attention to this issue and the
quality analyses of this component. After performed analyses redesign of existing data
models and design of new ones could be made which would result with more effective
and efficient data sharing and exchange.
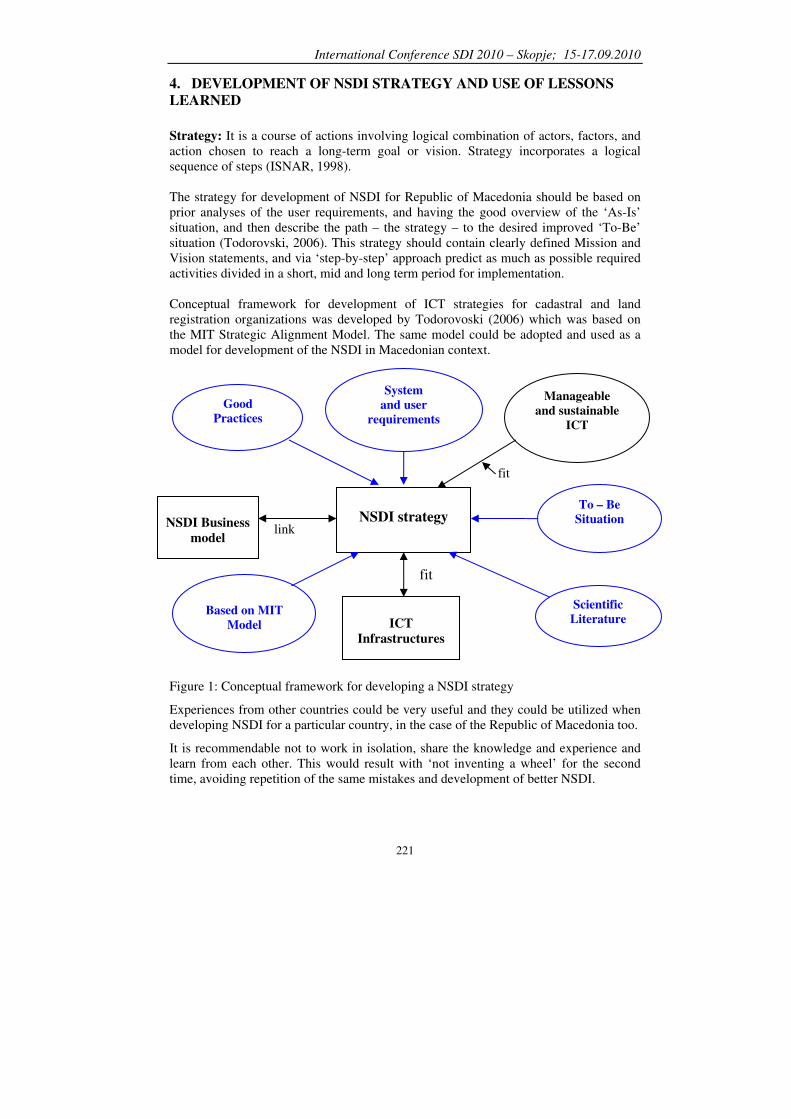
International Conference SDI 2010 – Skopje; 15-17.09.2010
221
4. DEVELOPMENT OF NSDI STRATEGY AND USE OF LESSONS
LEARNED
Strategy: It is a course of actions involving logical combination of actors, factors, and
action chosen to reach a long-term goal or vision. Strategy incorporates a logical
sequence of steps (ISNAR, 1998).
The strategy for development of NSDI for Republic of Macedonia should be based on
prior analyses of the user requirements, and having the good overview of the ‘As-Is’
situation, and then describe the path – the strategy – to the desired improved ‘To-Be’
situation (Todorovski, 2006). This strategy should contain clearly defined Mission and
Vision statements, and via ‘step-by-step’ approach predict as much as possible required
activities divided in a short, mid and long term period for implementation.
Conceptual framework for development of ICT strategies for cadastral and land
registration organizations was developed by Todorovoski (2006) which was based on
the MIT Strategic Alignment Model. The same model could be adopted and used as a
model for development of the NSDI in Macedonian context.
Figure 1: Conceptual framework for developing a NSDI strategy
Experiences from other countries could be very useful and they could be utilized when
developing NSDI for a particular country, in the case of the Republic of Macedonia too.
It is recommendable not to work in isolation, share the knowledge and experience and
learn from each other. This would result with ‘not inventing a wheel’ for the second
time, avoiding repetition of the same mistakes and development of better NSDI.
NSDI Business
model
ICT
Infrastructures
NSDI strategy
fit
fit
link
Scientific
Literature
Based on MIT
Model
Good
Practices
Manageable
and sustainable
ICT
To – Be
Situation
System
and user
requirements
International Conference SDI 2010 – Skopje; 15-17.09.2010
222
5. SOME ISSUES TO HAVE IN CONSIDERATION WHILE
DEVELOPING A STRATEGY FOR NSDI IN REPUBLIC OF
MACEDONIA
From the lessons learned from countries that already developed their NSDI but also
from the scientific gatherings where the NSDI topic is observed, explored and
discussed, the following issues is recommendable to have into consideration:
5.1 Problems when introduce the concept of sharing spatial data
From the experiences of the countries that have in place functional NSDI’s we could list
some of the problems that they faced when introduced concept of sharing spatial data:
• Lack of culture for data sharing and the supporting regulations and policies
• Lack of mechanisms to advertise the data in a standard form
• Lack of standards for data exchange
• Lack of supporting tools to extract data from remote databases, re-structure
harmonize data
• Lack of adequate use of ICT and database technologies to support information
management within the organizations providing Geo-Information (Radwan, 2005).
5.2 Difficulties when exchanging data between databases
Here follows a list of difficulties when exchanging data between databases:
• Different rules for real world object’s categorization and definition
• Different database models and data structures
• Data sets are collected, processed and presented by different standards and methods
• Hosted by in different GIS platforms
• Different institutional constraints for data access, right of use, cost of data and
many more (Radwan, 2005).
5.3 Types of heterogeneity
A geospatial database is a computer representation of a real world features or
phenomena using various abstraction mechanisms. Heterogeneity problem occur when
different communities want to share their data with each other have to contend with
different views on a real world features, different modeling schemas, and different tools
to represent, store, process and manage geospatial data sets (Groot and McLaughlin,
2000). Bishr (1997) describes these heterogeneity issues as syntactic, schematic and
semantic heterogeneity.
• Syntactic heterogeneity refers to the differences in software and hardware
platforms, data base management systems, and the representation of geospatial
objects (raster or vector, co-ordinate system, geometric resolution, quality of
geometric representation, methods of acquisition, etc.)

International Conference SDI 2010 – Skopje; 15-17.09.2010
223
• Schematic heterogeneity refers to differences in database models or schemas, e.g. a
particular feature may be classified under different object classes in different
databases, or an object in one database may be considered as an attribute of
another. The classes, attributes and their relationship can vary within or across
disciplines.
• Semantic heterogeneity is the way a same real world entity may have several
meanings in different databases. This will also influence the geometrical
representation of objects, because abstraction of the world is based on semantics of
each discipline. It is intimately tied to the application context or discipline for
which the data is collected and used (Bishr, 1997).
5.4 Workflow and workflow management
A workflow is an automation of a process, in whole or part, where tasks are assigned
and documents and data are passed from one to another for action, according to the
procedural rules (Morales, 2005). It is recommendable that workflows should be
introduced and accepted as part of activities for improvement of the performance of all
key stakeholders in the future NSDI. First an inventory and analyses of the current
workflow processes should be done. Standards should be developed and according to
them further development of standardized workflows should proceed. UML could be
used as a standard modeling language when representing the workflows into diagrams.
When basic working processes are standardized in workflows they are easier to be
managed, better and faster chaining of the current working processes is possible and
development of new flows is more feasible. ICT processes should be also standardized
and represented with workflows.
A workflow management (WFM) is a technique to manage the flow of works such that
the work is done at the right time by the right resource (Morales, 2005). Having
standardized workflows is a precondition to develop WFM within one organization.
WFM is integrating the processes resources and applications or matching the tasks with
adequate staff which can finish the job with the required application. Automation of
WFM results with workflow management system which is able to interact with
workflow participants, keep the tract of the progress of the work and, if required, invoke
data tools and applications. Motivations and benefits from implementation of WFM are:
improved efficiency, improved control on business processes and ability to manage
processes.
Technology and standards could help introduction of WFM as a regular part of the
working future NSDI stakeholders. WFM could improve performance of each single
stakeholder in the NDSI environment and it would allow flexible integration of internal
and external data producers.
6. CONCLUSIONS
This paper made an overview of the background and objectives of existing and in
development NSDI’s, description of the status of geo-information in the developing
world and some possible models for development of NSDI strategy based on lessons
learned. Important issues like: problems when introduce data sharing concept,

International Conference SDI 2010 – Skopje; 15-17.09.2010
224
difficulties when exchange data between databases, types of heterogeneity, workflow
and workflow management were also explored.
Finally this paper concludes that being aware of the issues above could be useful while
developing a strategy for development of NSDI in Republic of Macedonia, an
implementation plan should have them included and task force appointed for
implementation of NSDI should be familiar with them but also they should be taught
with experiences, examples how other countries tackled solving the mentioned
problems.
REFERENCES:
Bishr, Y., (1997). Semantics Aspects of Interoperable GIS, ITC Publication, No. 50.
Borrero, S. and Lemmen, C., (2002). Take Advantage of Best Proven Practices -
Interview with Santiago Borrero, GIM International Interview, pp. 8-10.
INSPIRE, (2007). Act adopted under the EC treaty for establishing the INSPIRE
directive, on 14 March 2007, Official Journal of the European Union. Brussels,
EU.
ISNAR, (1998). Strategic Planning. Annex 1: Glossary and Support Reference
Materials. ISNAR.
Groot, R., (2000). Corporatisation of national mapping agencies: challenges and
opportunity. In: the 15tht UN regional cartographic conference for Asia and the
Pacific, Kuala Lumpur, Malaysia.
Groot, R and McLaughlin, J.D., (2000). Geo Spatial Data Infrastructures. Oxford
University Press.
Molen, P.v.d., (2005). Authentic Registers and Good Governance. FIG Working Week
2005 and GSDI-8, Cairo, Egypt.
Morales, J., (2005). Workflow Management, Module 11: Organisational Development,
GIM 2/3 2005. International Institute for Geo-Information Science and Earth
Observations, Enschede, the Netherlands.
Radwan, M., (2005). Spatial Data Infrastructires, Module 6: Developing GIM Strategies
in GDI context, GIM 2/3 2005. International Institute for Geo-Information
Science and Earth Observations, Enschede, the Netherlands.
Todorovski, D. (2006). A framework for developing an ICT strategy in Cadastral and
Land Registration Organisations, XXIII FIG Congress, Munich, Germany.
BIOGRAPHICAL NOTES OF THE AUTHOR
Dimo Todorovski holds a diploma as a surveying engineer from
the University of Kiril and Metodij, R. Macedonia and obtains MSc
degree in Geo-Information Management at International Institute
for Geo-Information Sciences and Earth Observation ITC, the
Netherlands in 2006. He is a head of digitizing department, at the
Agency for real estate cadastre, R. Macedonia, and has a practical
experience in fields of land surveying and digital mapping,
cadastral information systems development, ICT and ICT
Strategies. He is a Macedonian delegate of FIG Commission 7 and from
September 2008 President of: Mak Holl Nuffic Alumni Association,
association of Macedonian students which studied in the Netherlands.

International Conference SDI 2010 – Skopje; 15-17.09.2010
225
His current research interest focuses on land management/administration,
analyses of users/system requirements, cadastral systems, system modeling and
development of Spatial Data Infrastructures.

International Conference SDI 2010 – Skopje; 15-17.09.2010
226
DEPLOYING SMEs ENGAGEMENT IN SDI
IMPLEMENTATION
Luka JOVIČIĆ 1
ABSTRACT
Impact of the influence of small and medium enterprises (SMEs) on the spatial data infrastructure
(SDI) was the leading motive for writing of this paper. The significance of the necessity for more
thorough approach in inclusion of SMEs in SDI was presented through framework established by
institutions identified as stakeholders in the field of geospatial technologies. Validation of this
thesis is shown through best practice case demonstrating the availability and benefits of tools and
means of geographical information system (GIS) implemented into existing production processes
of one representative small bureau.
Paper shows overview of current situation concerning today’s presence of geospatial data in
business environment. In the first place standards and the environment in which GIS users operate
are analyzed with SMEs as focal point. Possibility of GIS realisation is considered, bearing in
mind outlines set by SDI and, simultaneously, respecting needs for a specific local use of spatial
data in daily activities of SMEs. Furthermore practical use of acquired conclusions and routes for
deploying engagement of SMEs in SDI implementation is shown. As an all-inclusive outcome,
model of GIS architecture and the example of its implementation is presented according to
identified needed characteristics of GIS modules, standardisation requests, interoperability and
openness.
Outcomes of the presented material ought to emphasize current constellation concerning SMEs in
market of South East European countries which are still in process of establishing spatial data
infrastructure. Recommendations for better adoptions are given, as well as the conclusions for
further engagement in this course.
Key words: SMEs, SDI, GIS standards, open source GIS software, service orientated GIS
architecture, road infrastructure construction
1. INTRODUCTION
Looking at the first geoportals, as mediums for open access to spatial data, service
quality improvement led to the level at which use of global geoportals became
significant at the local level for the daily activities of small and medium enterprises.
Spatial data infrastructure in that sense put through interactive relations among spatial
data, metadata, users and software tools. Purpose of such initiative aims at
decentralisation and interoperability of spatial data and metadata managing, by which
user is lead straight forward to the data source.
1
MSc. Luka Jovičić, [email protected]
GMP GRAMONT-NS Ltd., Civil Engineering Company
Tel.: +38163500866, Gsm.: +38163500866
Ilije Birčanina 27, 21000 Novi Sad, Serbia

International Conference SDI 2010 – Skopje; 15-17.09.2010
227
From the early beginning the reasons behind SDI initiatives were undisputed since they
considered several crucial points (Woldai, 2002):
� developing the neglected spatial data potential and stimulate economic activity,
� distributing spatial data to the widest possible range of users through the use of
standards,
� encouraging the new profitable services through enabling better interaction of data
from multiple sources,
� improving quality and reducing costs related to spatial data,
� increasing benefits of new way of data integration and establishing cooperation
with states, regions, academic and private sector for the overall enhancement of the
field of spatial data use, and
� decrease redundancy in data production and effort involved in it.
In order to accomplish the stated objectives and purposes, SDI needs to be organized in
such way that it can meet all the requirements concerning data sets, regulations and
related aspects. In any application field, the types of shareable data have to be known
and identified to apply it. Data forming the desired spatial infrastructure can be divided
in two categories concerning its purpose: fundamental and application data. (Groot and
McLaughlin, 2000)
Fundamental data provide essential base information upon which other organizations
can create datasets by overlaying with other data. These include: data that can show
geographic reference systems, topographic data sets that can serve as geometric
references, common codes, etc. on which other thematic data sets can be built on. The
basic spatial data producers are those that are mandated at the national level for
collecting, processing and disseminating spatial data and other related data at large.
These include land administration authorities, surveying and mapping authorities,
planning departments. Their task is tied to the foundation data and as such deal with: the
national positioning system, the national digital topographic maps, digital elevation
model, geographic names, administrative units, common codes, etc.
Application data includes theme specific data sets such as, land use, land cover,
vegetation, etc. being not as extensively as the fundamental data sets. Nevertheless, they
are also required by many organizations to produce other derived data sets, which are
important for spatial decision making. Application-specific data include data collected
for a very specific duty, and particular application area. Most of these institutions use
the baseline information to come up with their own value-added outputs. Depending
upon their thematic responsibility (e.g., geology, land use, land cover, vegetation, etc.),
they produce and use geo-data of different nature on an ad-hoc basis (rather than taken
as a regular duty) primarily to fulfil their jurisdiction. Unlike the spatial information
basic users, most of these companies and their departments have a need of getting more
up to date data on their subject. Concentrated on meeting their own internal information
need and not being core stakeholder in SDI there is no adopted general mechanism to
facilitate data access to other interested users. Therefore, unless it is a luckily informed
user, no one can easily know what type of data they have, no matter how valuable their
data are.

International Conference SDI 2010 – Skopje; 15-17.09.2010
228
This is the situation where SMEs reside in the early stages of SDI implementation and
the reasons why countries and regions where SDI operates for years confronted with
serious issues about private sector inclusion. The demand driven approach should be
more represented since the categories of users are still not well identified, nor are their
specific needs well surveyed. In such environment, where market is not enough
developed, analysis of spatial data market, users and their needs is the first step of
creating the approach for overcoming the mentioned issue among SMEs and SDI.
Bearing this in mind, following text is about to include this topic discussing the region
of South East Europe (SEE) and offer answer for several questions. What is the
constellation in which SMEs in the region operate? What is the position of SMEs, their
needs and issues they confront in such environment? What are the current possibilities
for improving the situation?
2. SMEs WITHIN SDI FRAMEWORK
2.1. SDI framework
Since the Geographic Information Network In Europe project which had the objective
of creating overall geoinformation strategy in Europe and creation of some of today’s
European spatial key players (Infrastructure for spatial Information in Europe -
INSPIRE), it was declared that political and institutional support is crucial for the
development SDI. Hence, the most important standardisation organisations in the spatial
field today represent the benchmarkers in the field of spatial information. They
represent the focal point in reaching the goal of establishing successful infrastructure
and satisfying user needs.
For the purpose of this paper, it will be given only the overview of the field that
International Standardisation Organisation, Open Geospatial Consortium, INSPIRE и
European Committee for Standardisation as the stakeholders in the spatial information
in Europe cover.
ISO developed group of standards in the field of geomatics, concerning digital
geographic information, promoted through the technical committee ISO/TC 211 with
the aims of (Henry, 2009):
� support and use of spatial information,
� assuring availability, integration and exchange of spatial information,
� enabling interoperability of spatial orientated computer systems,
� contribution to integrated approach to global ecological and humanitarian
problems,
� simplifying of establishing spatial infrastructures on local, regional and global
level,
� contribution to sustainable development.
To summarize, it brings standards and specifies methods, tools and services for
management of geographic information, including the definition, acquisition, analysis,
access, presentation, and transfer of such data in digital/electronic form between
different users, systems and locations.

International Conference SDI 2010 – Skopje; 15-17.09.2010
229
Parallel with the work of ISO, group of interested parties in the field from all over the
world and from different spheres of working with spatial data, gathered for cooperation
in overcoming the existing common problems. Different development teams were
formed with aim to make available open source GIS software, solve interoperability
issues which demanded more than openness of the software. This was the initial mission
of the Open Geospatial Consortium, Inc. Today their specifications and standards
support interoperable solutions, which enable geospatial domain to services like World
Wide Web and give users the means for manipulating complex spatial information for
creating services available for all sorts of specific applications.
Already mentioned INSPIRE initiative of the European Commission for development of
European SDI which enables to the public sector of Europe, nationwide, regionally,
locally and also to the private sector, researchers, nongovernmental organizations and
citizens, the discovery, access and gathering of spatial data from various sources in
interoperable way, for different needs, without restrictions. In that sense it is adopted
that European SDI ought to be assembled from operational, growing local, national and
regional SDI. INSPIRE refers to technical standards and protocols, organisational and
coordination topics, policies of data management, including access, creating and
maintaining the spatial data. (INSPIRE, 2001)
The spatial standardisation environment functions in a way in which framework for
standards and technical issues are covered by ISO standards and OGC specifications.
European Committee for Standardisation is in charge for implementation in the field of
digital geographic information in the context of the European Union legislative, with
close cooperation with ISO, whereas the INSPIRE directive aims to create a European
Union spatial data infrastructure. This will enable the sharing of environmental spatial
information among public sector organisations and better facilitate public access to
spatial information across Europe.
The desired SDI includes interactive relationship of spatial data, metadata, users and
tools with the aim of effective and flexible use of spatial data. It strives towards
decentralisation of data and metadata managing, guiding users directly to the data
sources. With described standardisation of the tools, services and computer networks it
enables availability, exchange and effective use of information.
2.2. Issues with SMEs
Although the purpose of described stakeholders is to support sustainable policy, major
barriers still affecting the availability and accessibility of relevant data. These barriers
include: (Craglia, 2010)
� Inconsistencies in spatial data collection, where spatial data is often missing or
incomplete or redundant
� Lack or incomplete documentation of available spatial data
� Lack of compatibility among spatial datasets that cannot therefore be combined
with others
� Cultural, institutional, financial, and legal barriers preventing or delaying the
sharing of existing spatial data

International Conference SDI 2010 – Skopje; 15-17.09.2010
230
Concerning South East Europe, European SDI stakeholders’ focus was put on
engagement of relevant public institutions which ought to take responsibility in
developing national and regional SDI. For example in the republic of Serbia the
Ministries, the Republic Geodetic Authority should engage as relevant public
institutions. However, although process of implementing standards and creating
spatially enabled systems lasts for more than five years, coordinating institution, such as
National Spatial Data Infrastructure agency has been established at the end of 2009. So
far Ministry of Environment and Spatial Planning and the Republic Geodetic Authority
went the furthest in Serbia, concerning spatial data use legislative and reforms in digital
spatial data use. Although these encouraging results show systematic approach to
developing national SDI, there are segments in which there is still much work to do.
Traditional bureaucracy and administrative obstacles still play significant role in
restraining availability of spatial data. In addition, low public conscientiousness in this
field is present. Therefore, several main objectives emerged as terms for successful
interaction between data sources and end users: (Pavlova, Boes, Roccatagliata and
Luzet, 2003.)
� cooperation with European organisational initiatives in this area,
� forming spatial data infrastructures,
� supporting awareness about the importance and use of spatial data in public,
� implementation of adopted legislation,
� stimulation of SMEs in wider use of spatial data.
This paper focuses on the last of the stated objectives as SMEs are to be the most
significant group of commercial users of spatial data, concerning the potential of their
influence on expansion of geoinformation technologies. Since the described national
conditions, with slight differences, can be applicable for the whole SEE region, it will
be of significant interest to further elaborate findings about possibilities of SMEs
stimulation for further engagement in this course.
3. SMEs AS STAKEHOLDER IN SDI
Experience from USA national SDI tells that urge for securing the role of private sector
in SDI came from the rising of the consumer demand for spatial information which
triggered a major shift toward local government and commercial providers. In addition,
it is common knowledge that the collection and management of geospatial data are
considered to be the costliest components of a GIS with almost 80% share in GIS total
costs. Yet, being focused merely on providing geospatial information the federal
government lacked to devote enough attention to coordinating and managing geospatial
data and facilitating partnerships among fastly expanding number of producers and
consumers of geospatial information. This was the new orientation they had to
prioritise, which required huge engagement and still is an issue for resolving, because it
brought stated barriers which affect the availability and accessibility of relevant data.
The role of federal government (except coordinating function) therefore switched from
being provider to the consumer side. (Folger, 2009)
SDI initiatives in South East Europe as it was mentioned before devote primary
attention to governmental institutions as data providers and neglect private sector as
natural stakeholder in the spatial market. Exceptions may be huge companies that
cooperate with governmental institutions in producing data, but the accent here is on

International Conference SDI 2010 – Skopje; 15-17.09.2010
231
SMEs, which remained isolated isles in this environment, with occasional inclusion in
spatial data exchange. Bearing this in mind, it could be concluded that similar path to
the USA experience is taken in the concept of conducting SDI. This is one more reason
to react towards SMEs more active engagement in SDI.
Issues that need to be addressed must be accessed carefully since the clues for proving
readiness of SMEs to be stakeholders in SDI are not always obvious. An example of
this could be the case of identified lack of private industry data sharing. But if one
consider commercial remote sensing companies, there will be identified the need of
significant capital investment required to place in space imaging satellites and ground
stations to capture the imagery to produce the first deliverable product. Thus, some of
the underlying data sharing assumptions are not well articulated. Next obstacle could be
licensing and other intellectual property arrangements in need of being defined. (STIA,
2001)
SMEs demand for the SDI can be characterized as:
General demand - considers framework data to be available nationwide. However,
differences exist in the resolution, quality, coverage, currency and other characteristics
depending on the source of the data.
Data providers - who also are part of the private sector. These companies sell software
solutions and data content, hardware, and consulting services, etc. Their inclusion to any
program fostering increased private sector participation is essential. They bring rich data
sets, lists of current and prospective customers and success stories to the equation.
Within SMEs, participation in SDI has been limited even though the need for data has
only grown. Many private sector companies have built their own data or purchased it
and spent a lot in improving this data for their own needs. This data is not widely shared
and may not conform to SDI standards.
Therefore, issues that need to be addressed to increase SMEs participation are:
� Communication between SDI and SMEs – starts from the very basic lack of private
sector awareness of the SDI, inexistence or low inclusion of the private sector in the
planning for the SDI, still underdeveloped of understanding about the drivers for
private sector participation like revenue, profits, liability protection and intellectual
property protection and confusion about the purpose of the SDI and whether it
serves the interests of private sector companies.
� Data adequacy – firstly there is little synchronization amongst data sets used in
SMEs, a great potential for redundant data in the SDI because different groups
create data at different resolutions, question of ways of satisfying data accuracy
since it determines customer satisfaction, liability and revenue issues; Tools must
be employed to make the design and accessibility of data more user friendly.
� Legal issues - State and local laws relative to freedom of information, privacy,
disclosure and intellectual property can hamper data sharing, especially when
companies consider their information part of the assets or worth of their companies.
Described constellation serves as a ground for SMEs engagement in overriding
identified problems and positioning in long term period with respect to SDIs planned
development. This brings out the questions of possible solutions for SMEs deployment

International Conference SDI 2010 – Skopje; 15-17.09.2010
232
in described environment. In that sense paper analyses the most suitable ways of putting
through acquired goals.
Next part presents the approach that will show the best practise case for one SMEs
representative using means that are least disturbing for production process having at the
same time maximal effects on production outcome. It respects described standards and
stakeholder institutions, SMEs needs and motivation for engagement in SDI and
available models and tools for realisation of the GIS.
4. SMEs AND GIS WITH AVAILABLE TECHNOLOGIES
OGC enabled its information system architecture framework (OGC Reference model), which
documents interoperability of geospatial data processing from simple single processor computer
systems to open environment which enables communication of spatial information without
obstacles in WWW. Model considers methods of architecture development, standards,
specifications and system components with their interaction within system’s architecture. (OGC,
2010)
Stated implies that open system carries the best characteristics for meeting the required terms of
incorporating GIS in SDI outlines. Open systems are the ones which function and interact through
open interface as a way for connecting and communicating of the software components. The key
of openness is building the interface whose use and functionality will not depend on specific
producer and in that way keep the software which uses that interface isolated. In that way users
are not limited on use of just one specific producer application.
Further on open interface creates the possibility that the data format which is used for
communication among systems is not an obstacle in communication. Moreover, openness enables
converting of just the necessary part of data during communication, speeding up the process of
transformation of different data types. Today this concept is applied through XML since OGC
developed Geography Markup Language which does spatial data conversion to spatially enabled
XML.
Currently concepts, standards and technology for implementing GIS interoperability are based on
integration of standardized GIS Web services. Web services avoid the issues and complications of
GIS applications being tied to the spatial schema of a specific RDBMS vendor and allow GIS
vendors to manage their own data using the best methods and formats for their tools in whatever
database environment they choose. In addition, Web services allow server-to-server sharing of
data and services, as opposed to integration only happening at the client level as it does with
standards that are focused on the DBMS. Web services mean that each GIS vendor can build and
manage its own GIS data and readily provide GIS services (data, maps, and geoprocessing) to a
larger audience in a common environment. (ESRI, 2003)
With all this means available for building GIS, open source systems could be competitive with
almost any commercial software. In another words, today’s open source systems have sufficient
modularity, user community, supporting documentation and development team to assure their
competitiveness.
Adopting web services as a centre point of the GIS gives great effectiveness in sense of system
expansibility and components interoperability. This statement also represent basic concept of the
Service-oriented Architecture (SOA) GIS. SOA enables creation of flexible GIS, which can easily
adopt changes in organisation needs of a company. Mechanism of integration like web services

International Conference SDI 2010 – Skopje; 15-17.09.2010
233
preserves modularity of the system and ensures technological independence of the components it
is consisted of.
5. CASE STUDY
Important part of this analysis is segment that validates exposed premises and shows
practical use of acquired conclusions and routes for deploying engagement of SMEs in
SDI implementation. As an all-inclusive outcome, model of GIS architecture is
presented according to identified needed characteristics of GIS modules, standardisation
requests, interoperability and openness.
The objective was to implement GIS, as the applied solution for production process of a
road infrastructure project bureau operating in the Republic of Serbia. In all phases it
considered discussed topics and serves as a validation of the conclusions stated in the
previous segments of the paper.
Sector of the road infrastructure was chosen as a good representative of SMEs whose
use of spatial data is insufficient comparing to their needs and capabilities.
Confirmation lays in authors’ personal engagement in the field for more than five last
years. It is the field with the necessity for spatial information from several domains:
plan decisions based on topographic data, determining the priority of road construction
and maintenance, analysis of traffic and transport, managing objects correlated with
road infrastructure, etc. That information could be found in various forms coming from
different sources. Usually the most reliable are ones taken by the company itself or
bought from other SME more specialised in the field of data acquisition. This situation
implies on the issues identified earlier as major barriers still affecting the availability
and accessibility of relevant data.
For the purpose of this paper data flow of the typical project of the bureau was chosen
as an example of implementing SDI recomandations without disturbing production
process and with implementing open source technologies. Practicaly it meant in the first
place incorporating commercial software used for road construction projects - Autodesk
AutoCAD in GIS. AutoCAD is software that has big share in the field of road
constructioning and generaly in the field of civil engineering in Serbia. Incorporating
AutoCAD in GIS validation of possibilty to implement efficiant and effective GIS
concerning companies production process.
Although Autodesk thought about interoperability of the supplied data formats, it is
mainly supported within the companies products and a few open data formats (.dxf,
.shp, .gml) as well as technologies which enable data formats compatibility and working
with web services (Feature Data Object, MapGuide open source, RealDWG).
Furthermore there is multilateral cooperation with other commercial software suppliers
(like Oracle or Bentley). One more way that can satisfy the need for interoperability is
the use of standards and protocols like ODBC. On the market other third party software
products which support and manipulate with Autodesk’s data formats can also be found.
The first challange in incorporating AutoCAD in SOA was to analyse supported data
formats interoperable by the standardisation organisations protocols. After, interaction

International Conference SDI 2010 – Skopje; 15-17.09.2010
234
with spatial database needed to be established with the same framework of standards.
Secondly there was issue in communicating with client aplications through web
services.
Picture 1. Implemented SOA GIS
First major data format supported in AutoCAD is vector format. Such data can be
published on the web server and become available to other applications through the
spatial database or directly if it is supported through web service libraries. Open source
database PostgreSQL was used spatialy enabled through its extension PostGIS.
Aplication used for exporting data to spatial database also came in open source
environment - DXF2PostGIS, although there are other solutions from commercial range
too. Further comunicating (for example to import data or view queries) with spatial
database is available through ODBC. To send vector data directly to web server
AutoCAD needs to export it in web service used libraries supported format, like .shp,
which can be done through open source or third party commercial software.
Second important data format is raster images which could be created in AutoCAD by
raster drivers and manipulated with basic functions (copy, cut, move, etc.). Alternatevly
this kind of data can be imported in AutoCAD for manipulation and later used by other
applications in GIS. In treated project, raster file which was used was in .tiff format,
open and supported by web sevices.
Choosing and including components in the GIS is projected bearing in mind SOA and
its central component web services. This, middle layer, placed between described data
producer applications on one and client (viewing and manipulating) software
applications on the other, enables data exchange as the communication channel between
layers of the GIS. Thus, interoperability is limited here to the number of supported data

International Conference SDI 2010 – Skopje; 15-17.09.2010
235
formats by web services. Although open data formats theoreticaly can satisfy the needs
of the market, still often proprietary data formats are required when projecting GIS. In
this case data format interoperability was solved by using open source data format .shp
for vector data presentation and imported .tiff for raster data, as described above. Web
services use them through GDAL (for raster files) and OGR (for vector data) libraries
and communiaction with spatial database is implemented through ODBC/JDBC, as seen
on the Picture 1.
As described, AutoCAD comunicates with web services through spatial database and
available protocols as channels of communications. Some other Autodesk products
already have direct support with web services. This trend goes in favour of data
interoperability and openness because even the proprietary technology is becoming
more and more open.
Web server distributes data to client applications in various formats and with specific
capabilities which allow different rights of viewing, managing and editing data by client
applications. Client applications used in observed example are shown on the Picture 1.
5.1. System implementation
In treated example in the field of road construction described arhitecture was
implemented in the following way. For the location of the project an traffic area near
public object was planned. As input, topographic map of area in the .tiff format was
used. Existing comunal installations and road infrastructure was drawn in AutoCAD in
.dwg format. Both raster and vector data were uploaded on the server and became
available for all the components of the GIS.
GIS was used to analyse this information by reviewing influence of existing communal
installation on projected new road infrastructure on the location. Rewieving was done
through the client application uDig, with presentation by overlaying of all data layers in
Google Earth. Few inconsistences were noticed concerning position of instalations
compared to projected road and those were corrected in spatial database through client
application uDig.
This updated communal installation positions were again available in AutoCAD
through the spatial database. This was the validation that all GIS modules were
interoperabile and funcioning as required in all segments of SOA.
6. CONCLUSION
In flexible and open service architecture based on ISO and OGC standards and used in a
way proposed by INSPIRE initiative, AutoCAD was successfully implemented in
projected GIS, proving that existing production process of SMEs representative was
uninterrupted and in the same time efficiently incorporated in SDI as conclusions of
analyzed framework proposed. Since this was just simple example extracted from one
typical project of the civil engineering bureau, it presented possible realization of GIS
architecture. Modules of GIS may vary in number and way of interaction of components
depending on specific production system needs and proposed ways of its use.

International Conference SDI 2010 – Skopje; 15-17.09.2010
236
Concrete results that were the outcome of SDI flavored bureau project, showed benefit
to the production process in following aspects:
� planning and control of road infrastructure objects could be analyzed much faster
and more efficient if such system was in use and if available data was updated
regularly on the market where company operates,
� updating and exploatation of data coming from different sources (public and
private, general and specific),
� contribution to development of conducting project in road infrastructure planning
technology.
This case study was designed to emphasize the need of maximizing participation in the
SDI by the private sector with focus on SMEs. The example shown summarizes and
implements the findings of the teoretical recommandations described in chapters 1-4 of
the paper with respect to the current status and issues with SMEs participation in SDI
and adopted standards from relevant organisations. Hopefully this paper has prooven
not just the importance of thorougher engaging of SMEs in SDI, but also proposed and
validated ways of conducting these proposals.
Although presented solutions are already available and easily implemental, SMEs, in
resolving these issues, will disengage if bureaucracy suppresses the efforts. Since
proposed actions do not depend on occasional activism of some SMEs, but on
systematic approach to solving described issues, SMEs will also lose interest in
solutions that take too long to implement. In that sense, interest parties should not be
just state institutions as SDI coordinators, but also SMEs as active participant in
implementation.
Some of the issues cannot be resolved by the private sector. Legislative bodies and state
SDI institutions must resolve them. The private sector can address these issues and
participate in the educational process to bring about change. Other issues were analysed
in this paper and attempt to make the step out their current static situation is made.
Further awareness should be encouraged, more effort showing benefits and possibilities
for SME participating should be made and additional advanced analysis should be
conveyed to find mutual drivers of public and private sector towards successful SDI.
After the overview of SDI organizations’ outlines and after presenting the approach and
actions available to SMEs, several points came out as drivers of SMEs engagement in
SDI:
� simple economic drivers like increased revenues and decreased costs,
� data quality issues like security, completeness, availability, ease of use and
accuracy,
� expectations of geospatial providers and end-users,
� SDI should lead process of SMEs inclusion in process and defining it’s role,
� SDI should complement the private sector’s activities,
� establish a SMEs advisory group to tackle the higher level issues,
� seek private sector consultations and input on SDI initiatives.
As the private sector engagement in spatial information exploitation grows, the roles of
the public and private sector will have to evolve. In order to secure that, the rising of

International Conference SDI 2010 – Skopje; 15-17.09.2010
237
SMEs market demands should be met by public sector SDI initiatives and more
concrete measures will be needed from SDI implementation organisations for more
direct engagement of SMEs within SDI.
7. REFERENCES
Woldai, T. (2002), Geospatial Data Infrastructure: The Problem of Developing Metadata for
Geoinformation in Africa, Netherlands: International Institute for Geo-information Science &
Earth Observation (ITC)
Groot, R. and McLaughlin, J. (2000), Geospatial Data Infrastructure: Concepts, cases and good
practice. Oxford University press.
Henry, T. (2009), ISO/TC 211 Geographic information/Geomatics,
http://www.isotc211.org/Outreach/Overview/Overview.htm
INSPIRE (2001), INSPIRE History, http://inspire.jrc.ec.europa.eu/index.cfm/pageid/4
Craglia, M. (2010), INSPIRE: The Spatial Data Infrastructure for Europe
http://www.esri.com/news/arcnews/spring10articles/building-inspire.html
Pavlova, R., Boes, U., Roccatagliata, E. and Luzet C. (2003.), Geographic Information Systems
Technology and Market in South East Europe, http://www.gisig.it/gisee/
Folger, P. (2009), Geospatial Information and Geographic Information Systems (GIS): Current
Issues and Future Challenges, Congressional Research Service, CRS Report for Congress, 7-570
STIA (2001), Phase I Report, Increase private sector awareness of, and enthusiastic participation
in, the National Spatial Data Infrastructure (NSDI), Washington: SPATIAL TECHNOLOGIES
INDUSTRY ASSOCIATION
OGC (2010), About OGC, Open Geospatial Consortium, Inc., http://www.opengeospatial.org/ogc
ESRI (2003), Spatial Data Standards and GIS Interoperability An ESRI White Paper,
www.esri.com/library/whitepapers/pdfs/spatial-data-standards.pdf
8. BIOGRAPHICAL NOTES OF THE AUTHOR
Luka Jovičić was born in Novi Sad, Republic of Serbia in 1981. Did
master thesis in January 2009. on the Faculty of Technical Sciences,
University of Novi Sad, department of Industrial Engineering. Works
since 2005. as System Engineer in civil engineering bureau, GMP
GRAMONT-NS Ltd., Novi Sad, Serbia. Field of interest is
Geoinformation Technologies.

International Conference SDI 2010 – Skopje; 15-17.09.2010
238
INCREASING ACCESSIBILITY AND INTEROPERABILITY OF
SOIL DATA BY BUILDING UP AN INSPIRE COMPLIANT
EUROPEAN SPATIAL DATA INFRASTRUCTURE
Katharina FEIDEN, Fred KRUSE1
Zhenya VALCHEVA, Georgi GEORGIEV2
ABSTRACT
The access, reuse and exploitation of digital environmental information have become an
important concern for public and private bodies in recent years. Especially within the discussion
of climate change this issue became more and more important world wide and particularly in
Europe. The European Environmental Information Directive (COM 2003), the Directive for
establishing an Infrastructure for Spatial Information (INSPIRE, COM 2007) as well as further
initiatives of the EU like the Shared Environmental Information System (SEIS) emphasizes the
need to make digital environmental information within Europe more accessible, usable and
exploitable.
While INSPIRE and its Implementing Rules (IR) give the framework to establish a European
spatial data infrastructure, vital obstacles in reference to harmonization and interoperability of
data and services as well as in reference to the organisational structure are not removed yet. The
project GS Soil “Assessment and strategic development of INSPIRE compliant Geodata-Services
for European Soil Data” aims to make a contribution to remove these obstacles. Within the
project 34 partners from 18 European member states are involved and the project is co-funded by
the European Community programme eContentplus. The project duration is from June 2009 until
May 2012.
The project GS Soil aims to contribute to improve the access to spatial soil data in terms of
INSPIRE by establishing a European network for soil information. A central component of this
network is the GS Soil Portal, a European web portal for soil data and metadata of the involved
project partners. As basic technology for the GS Soil Portal, the software of the well established
German Environmental Information Portal PortalU® will be used. Within the project the existing
technology will be modified and communication interfaces will be added depending on the
demands of the network.
Key words: Environmental information, Soil data, INSPIRE, European spatial data
infrastructure, Spatial Data Interest Community
1 Dipl.-Geogr. Katharina FEIDEN, Dr. Fred KRUSE [email protected]
Coordination Center PortalU at the Lower Saxony Ministry for Environment and Climate Protection,
www.portalu.de
Tel.: +49 (0)511 120 3451
Archivstr. 2, 30169 Hannover, Germany. 2 Dipl. –Inf. Zhenya VALCHEVA, Dipl. –Eng. Georgi GEORGIEV, [email protected]
Infologica Ltd., www.info-logica.com
Tel.: +359 888 94 16 83
blvd. Tsar Boris III No 215 GEOPLANPROEKT building, floor 10, office 8, 1618 Sofia, Bulgaria.

International Conference SDI 2010 – Skopje; 15-17.09.2010
239
1. INTRODUCTION
The project is co-funded by the European Community
programme eContentplus with 4.1 M €. It is a programme from
the European Commission DG Information Society and Media
with the objective to make digital content in Europe more accessible, usable and
exploitable. GS Soil is thereby allocated to the area of geographic information, where
the focus is set on the aggregation of existing national datasets into cross border
datasets, which will serve to underpin new information services and products, in
particular with a view to reducing barriers related to one or more of the specific themes
mentioned in annexes I-III of the INSPIRE Directive (European Union 2007). The focus
of GS Soil is thereby set on soil and soil related data. In the eContentplus programme,
GS SOIL is defined as a Best Practice Network for Geographic Information. The project
duration is from June 2009 until May 2012.
The project consortium comprises 34 partners from 18 EU member states. Project
Coordinator is the coordination center PortalU at the Lower Saxony Ministry of
Environment and Climate Protection (Germany). Overall 24 partners out of the
consortium are soil data providers and will make the data available for the project.
Hence, a complex and high quality data basis in a European context is assured. The
focus will be on data provided by national and regional institutions. Beyond that,
European institutions are also involved via the advisory board.
The project GS Soil aims at establishing a European network to improve the access to
spatial soil data for public sector bodies, private companies and citizens. The project
considers aspects of data organization, data harmonization as well as semantic and
technical interoperability in order to produce seamless geospatial information and to
improve the data access for a wide community of different user groups. The structural
specification for the description and harmonization of spatial soil data within Europe as
well as the operation of a corresponding spatial infrastructure are main objectives of GS
Soil.
The partners will establish and operate a network of services for spatial datasets and
metadata. This network includes distributed services for data transformation, discovery,
view and download. The final result of the project will be a central Soil Portal, where
European soil data from heterogeneous sources will be bundled. In order to ensure
cross-border usability of the portal and related services, aspects of multilingualism and
data interpretation will be considered thoroughly. In this respect the harmonization of
metadata is also a key topic within the project work.
The project will extensively support the implementation of the INSPIRE requirements
on basis of available experience in selected European countries and regions on different
organisational levels. Users will be able to discover, view and download soil data across
Europe. The results of the project will be:
− A consolidated soil-related theme catalogue and consolidated soil-related theme
content-framework standards,

International Conference SDI 2010 – Skopje; 15-17.09.2010
240
− An INSPIRE compatible metadata profile for spatial soil datasets, dataset series
and services,
− Generic application schemes for soil information,
− A web portal (GS Soil Portal) which provides access to all project soil data,
including,
o a view service which provides access to spatial soil data,
o discovery and view of the INSPIRE conform metadata for the
provided soil maps,
o interoperable spatial soil datasets (for exemplary soil products),
o case studies on cross-boarder delivery of harmonised soil data access,
o Best practise guidelines for
� creating and maintaining metadata for soil database,
� and for data harmonisation.
In the following chapters the achievements out of the first year of project
implementation will be summarized with a special focus on the GS SOIL portal
prototype and its network.
2. GS SOIL THEME CATALOGUE AND DATA INVENTORY
The soil and soil related data available in the participating countries and at involved data
providers were analyzed according to the kind, format, and intellectual property rights
applied. By elaboration of best practice guidelines the provided and specific datasets
will be systematically harmonized during the project running time. The improved access
to soil information through the GS Soil Portal and the user requirements identification
are the main objectives. This is the long-term perspective of the GS Soil Portal.
At the beginning of the project specific and generic requirements for soil information,
services and products were identified by a range of user communities and stakeholders
in the 18 participating countries. This requirement analysis resulted in a soil inventory
and theme catalogue, which documents the current state and ability of data providers to
meet the goal of data harmonization.
3. GS SOIL METADATA PROFILES
Information contained in the Implementing Rules for INSPIRE metadata is not
sufficient enough to describe all spatial data theme specific aspects. Therefore, it has
been planned, that each data specification should contain a metadata profile which is
made with respect to those specific aspects of the spatial data theme (i.e. soils). A soil
oriented metadata structure profile for soil geographic datasets, series and data services
were developed following the INSPIRE IR for metadata, other international, and
national standards (like the ISO 19100 series standards), and the needs of the data users.
On the other hand, there has been cooperation with the eContentplus project
OneGeology-Europe to ensure that metadata structure for the soils will be tightly
connected to the metadata structure for geology since these two themes are tightly
connected.

International Conference SDI 2010 – Skopje; 15-17.09.2010
241
The focus was also on data quality that is necessary for the soil spatial data theme. The
results are directly defined in the soil metadata profiles. Additionally, recommendations
were defined since this second part is not compliant to the existing ISO structure.
Metadata structure developed in this project contains an example of the XML encoding
soil specific resource.
4. HARMONISATION ACTIVITIES
Harmonization requires technically interoperable soil data, clear definitions of the
parameters, and type and/or coding of the parameter values and possibly a minimum
dataset that comprises any auxiliary information needed for meaningful or valid
harmonization procedures. Based on the above described soil data and soil data types,
data transfer structures have been developed that address technical interoperability by
allowing the unambiguous exchange of soil data and their metadata. In a first step, soil
feature types (soil-related object classes that can be described by attributes) have been
identified. The second step has been to specify codification in data transfer files.
In the context of data harmonization this provides the framework to link up existing soil
datasets from one country to another.
The level of spatial data consistency depends to a large proportion on provider-level
harmonization efforts. Technically interoperable data with clear definitions can
subsequently be semantically harmonized if harmonization procedures can be developed
that transform datasets into a common parameter and codification space (both at the
user and data provider level). For analytical data, this would require e. g. comparative
studies between analytical methods or techniques. For soil profile descriptions,
transformation would need translation of one description language into another. Examples for such transformations will be thoroughly analyzed in order to identify, to
which degree pre-harmonization is needed and how it can be implemented. Exemplary
services will be developed with the objective to present homogeneous and meaningful
data portrayal. The focus is on soil map legends and soil inventory data, because
attribute and property data are crucial for developing evaluation and transformation
services. The results will enter in a best practice guideline for soil data specification
development under INSPIRE.
5. THE GS SOIL PORTAL (PROTOTYPE) AND ITS NETWORK
In the project work package 5 is responsible to set-up the GS Soil Portal and network of
distributed services, using the existing technical infrastructure of the PortalU as basis.
In the GS Soil Portal all soil related information from web pages, over data bases to data
catalogues will be made available and accessible. Search results will be ranked and
listed in shared result lists and spatial soil data from OGC compatible Web Mapping
Services (WMS) and Web Feature Services (WFS) will be visualized in a map viewer.

International Conference SDI 2010 – Skopje; 15-17.09.2010
242
InGrid-iPlugs
Lucene Index
InGrid-iBus
Transformation Services
Open Search Interface
CSW Interface
API Interface
GEMET
Geo-names
- Ser-vice
InGrid-Catalog
CSW External Interface
Metadata Databases
via DSC
HTTP Interface Websites
WMS External
Rights Management Portal Surface InGridEditor
Download Map Viewer
WFS External
Figure 1: The architecture of the GS Soil portal (GS SOIL consortium, 2009)
The project results will enter in a best practice guideline for soil data specification
development under INSPIRE. For all tasks within the project the GS Soil Portal will be
used as platform for an improved access to the soil data.
GS Soil Portal has been built in an iterative cycle, adopting the relevant INSPIRE
Implementing Rules (Network Services and related) and implementing the results of the
other project work packages (general use cases and requirements, data specifications
and application profiles / schemas, metadata). At the same time, general open tools and
services will be provided for re-use by the project partners (data / service providers) and
later technical integration (and testing) of services and underlying geospatial data sets.
Particular focus will be placed on mutual harvesting (CS-W) with external systems.
The main activities covering the technical preparation for deployment and operational
exploitation are divided into sub-tasks, which will be described in the following sub-
chapters.
5.1 Definition and technical specification of the GS Soil Portal and network
architecture
At the beginning of the project the design specifications of the GS Soil portal and its
integrated network was defined as the technical framework for the portal and considered
INSPIRE services as discovery, view, download and transformation services. In the
overall process the view of the project data providers regarding their requirements and
needs on the functionalities of the GS SOIL framework software via a questionnaire
were collected.

International Conference SDI 2010 – Skopje; 15-17.09.2010
243
After the feedback of the partners the general functional design of necessary tools and
services was specified and design specifications for all SW and communication
interfaces (portal and network services) were defined accordingly. Of major importance
especially for the soil data providing partners was the identification of requirements on
the services concerning rights management. While implementing the WMS and
information these conditions need to be fulfilled also technically.
At this early stage already a set up a number of possible options for data transformation
and harmonization was defined, which will be evaluated during project implementation
and adopted to the necessary requirements. With special regards to the development of
the GS SOIL portal the design specification also comprises information on the German
Environmental Information Portal “PortalU”, which builds the technical basis for the
GS SOIL portal. Included are also use cases, established requirements (functional,
software, hardware) and technical details.
5.2 Establishment of the GS Soil Portal
Based on the above described design specification, the GS SOIL portal prototype was
established. The system is based on the software InGrid which is used to operate the
German environmental portal “PortalU”. The software is build on single components
which communicate via internal interfaces based on TCP/IP.The task will set up multi-
lingual portal user interface, catalogue systems, search functionalities and web mapping
viewer. All interfaces to web services are be developed with regards to the INSPIRE
Directive, the relevant implementing rules and technical guidance documents prepared
and published by the European Commission. They are also based on the required ISO
and OGC standards.
5.3 Provision of open tools and INSPIRE services for data providers
The objective of this task is to provide INSPIRE compliant services for data providers.
A recommendation will be made for the implementation of GeoFOSS tools by the
involved partner. For the collection and maintenance of metadata there are two options
for the involved partners: the InGridEditor and GeoNetwork.
GS SOIL Portal will implement the following INSPIRE network services:
• Discovery service will make possible the search for spatial data sets and
services on the basis of the content of the corresponding metadata and to
display the content of the metadata. The discovery service interfaces are
intended to allow users or application software to find information that exists
in multiple distributed computing environments, including the World Wide
Web (WWW) environment.
• View service will make possible, as a minimum, to display, navigate, zoom
in/out, pan, or overlay viewable spatial data sets and to display legend
information and any relevant content of metadata. As an additional option view
service will attempt to implement a harmonized portrayal of soil data from all
different providers through applying the WMS functionality Styled Layer
Description (SLD).

International Conference SDI 2010 – Skopje; 15-17.09.2010
244
• Download service will enable copies of spatial data sets, or parts of such sets,
to be downloaded. Data sets will be pre-defined according to the view area and
users will receive links to zip files that they will download.
The implementation of transformation services is discussed, which will enable spatial
data sets to be transformed with a view to achieving interoperability. From an INSPIRE
point of view, only the external transformation is of interest since the internal one is
only visible to the data provider. Nevertheless the option of internal transformation
seems much more applicable within the GS Soil project because of performance reasons
on one hand and the need for very special transformation on the other hand.
It will be proved to apply a rights management system to the mentioned services. Thus,
rights management extends those services by additional functionality such as access
control and licensing, as required by the INSPIRE directive in Articles 13 and 14(4).
The general functionalities of rights management-enabled service will provide rights
management metadata, check authentication of requests, authorize requests.
5.4 Establishment of semantic service
This task considers aspects of the establishment of semantic interoperability in order to
produce seamless geospatial information with improved data access for a wide
community of different user groups. Semantic web service will aim to interchange of
semantic data and to combine data from different sources and services without losing
meaning.
Keywords and geographic names provided by thesaurus and gazetteer will play a
decisive role in the search functionality of the GS SOIL Portal. The backbone of GS
SOIL semantic service will be an external semantic service with an API to support
thesaurus (GEMET) and gazetteer (GeoNames, GeoHash, OpenStreetMaps) items. It is
connected to the software InGrid and the GS Soil Portal by an extended XML-interface.
The GS SOIL project thus follows herein the requirements of the Directive 2007/2/EC
(INSPIRE) for the establishment of search criteria specified in art. 11 and in the
INSPIRE Implementing Rule for Metadata-Content for the provision of key attributes
and corresponding thesauri for multilingual searches.
5.5 Continuous integration of services and information
The task encompasses all activities related to the hosting, administration and integration
of central services and customization of open tools.
5.6 Deployment and operational exploitation
This task covers all additional and preparatory activities for the deployment and
operational use and maintenance of the GS Soil Portal:
• Preparation of guidelines and procedures for system administration and
maintenance, including aspects related to quality control and metadata
validation as well as rights and access control.

International Conference SDI 2010 – Skopje; 15-17.09.2010
245
• Configuration interfaces, technical activities for deployment and operational
use.
6. TESTING SCENARIOS AND INVOLVEMENT OF TARGET
GROUPS
Another purpose is to identify the requirements of data provision for different target
groups (e.g. public sector bodies, private companies and citizens) related to
environmental issues/problems on different levels (metadata, application in planning
procedures etc.). The general activities in the project to achieve it will be:
• to elaborate testing scenarios for target groups (within and outside the project
consortium);
• to define evaluation criteria and key success factors for technical improvement
of the GS SOIL Portal as well as for the practical implementation for target
users.
Testing scenarios will provide user testing on practical application (for example: search
for metadata using keywords, search for maps using keywords).
The results will obtain information about:
• requirements of data provision for different target user groups;
• advantages and disadvantages of the web portal;
• problems and gap analysis in comparison to the target user needs.
Based on the collected results, evaluation measures will be assessed and proposed for
the improvement and quality check of the GS SOIL Portal.
In addition, a long-term operational plan assuring practical sustainability, further
development of the GS SOIL Portal on European level, considering personal, technical,
financial and content aspects will be developed.
7. DISSEMINATION AND ARENESS RISING
The project consortium aims to capture, integrate and transfer knowledge and
experience gained during the project. Activities under this umbrella are related to the
dissemination of the project achievements to a wider audience. In terms of
dissemination different types of materials as leaflets, brochures, newsletters, etc. will be
produced to inform actual and potential users about project progress and forthcoming
events. These are target to a wider audience such as stakeholders, business people, etc.
The most important tool for dissemination is the project website: www.gssoil.eu.
Activities for awareness rising are focused on potential target users of project results
and members of the network, providing the basis for a tangible contribution to the
processes of validation and best practice documentation. Also, clustering activities are
foreseen as a tool for sharing knowledge, experiences and good practices with other
related eContentplus-projects (e.g. OneGeology-Europe, Nature-SDIplus) as well as
other EU-initiatives (e.g. INSPIRE, SEIS).

International Conference SDI 2010 – Skopje; 15-17.09.2010
246
7.1 Multilingualism
The GS SOIL Portal, in which European soil data from heterogeneous sources will be
bundled, will also ensure aspects of multilingualism. The currently implemented portal
surface supports 10 EU languages (English, German, Portuguese, Dutch (fm. Belgium),
Czech, Hungarian, Slovak, Bulgarian, Greek, Slovene) with an option to include any
language of the project partners.
The support of the search by semantic and spatial functionalities will also be further
developed to provide multilingualism.
8. CONCLUSION
Already the first year of implementing the eContentplus project GS SOIL “Assessment
and strategic development of INSPIRE compliant geodata services for European soil
data” by the large project consortium of 34 project partners out of 18 European member
states already lead to powerful deliverables.
Major advances for the establishment of a European spatial data infrastructure for soil
data by setting up the GS SOIL portal and network were made. In the following time
period the consortium will further focus on the GS SOIL data specification and
harmonization of test cases to provide interoperable and easy assessable data. The
technical basis is already provided, but will be further adjusted to the needs of the user
and target groups.
Finally, the GS SOIL consortium supports experts in the recently established INSPIRE
Thematic Working Group (TWG) to develop data specification for the theme soil of the
annex III of the INSPIRE Directive. The project provides and will further provide
relevant reference material for discussion in the TWG.
10. REFERENCES
COM 2008. Communication from the Commission to the Council, the European Parliament, the
European Economic and Social Committee and the Committee of the Regions – Towards a
Shared Environmental Information System (SEIS), SEC 2008 111, SEC 2008 112, 0046 final.
European Union 2007. Directive 2007/2/EC of the European Parliament and of the Council of 14
March 2007 establishing an Infrastructure for Spatial Information in the European Community
(INSPIRE) – in: Official Journal of the European Union L 108, 50.
Feiden, K., 2009. THE eContentplus-PROJECT „GS SOIL”: Assessment and strategic
development of INSPIRE compliant Geodata-Services for European Soil Data. Hungarian Journal
of Landscape Ecology, Tájökológiai Lapok 7 (2): 485–487 (2009).
Feiden, K., Klenke, M., Kruse, F., Konstantinidis, S., 2009. Building a Soil Information Portal for
Europe based on the PortalU® Technology. In: Proceedings of EnviroInfo 2009, 23rd
International Conference on Informatics for Environmental Protection Volumne 1, 09.-
11.09.2009, Berlin.

International Conference SDI 2010 – Skopje; 15-17.09.2010
247
Konstantinidis, S., Klenke, M., Kruse, F. 2009. Building a Soil Information Portal for Europe
Based on the PortalU® Technology. GSDI 11 World Conference 2009 & 3rd European INSPIRE
conference, Rotterdam, 15.-19.06.2009
Kruse, F., Konstantinidis, S., Klenke, M. 2009. PortalU®, a Tool to Support the Implementation
of the Shared Environmental Information System (SEIS) in Germany. EnviroInfo 2009, 23rd
International Conference on Informatics for Environmental Protection, Berlin, 09.-11.09.2009
Uhrich, S., Klenke, M., Kruse, F., Giffei, C. 2009. Approach to Build a Soil Information Portal
for Europe Based on the PortalU® Technology. In: Proceedings of the European conference of
the Czech Presidency of the Council of the EU ”TOWARDS eENVIRONMENT. Opportunities
of SEIS and SISE: Integrating Environmental Knowledge in Europe", Prague, March 25-27, p.
265-268.
11. BIOGRAPHICAL NOTES OF THE AUTHORS
Mrs. Feiden is Diplom Geographer (University of Göttingen,
Germany) and experienced coordinator in international project
management. She gained specific experiences in the field of
sustainable development, water management, spatial planning
and geo-data issues in the last 8 years. She has valuable
experience in building up transnational cooperation in the
South East European Space and Central Europe due to her
previous occupation as consultant in the framework of the EU-
INTERREG-programme. As chief project manager at the Coordination Center PortalU
Mrs. Feiden is in charge for the eContentplus-project GS SOIL “Assessment and
strategic development of INSPIRE compliant Geodata-Services for European Soil Data”
since 2009. She is responsible for the overall scientific coordination as well as the
coordination of the 34 involved project partners out of 18 EU member states.
Mr. Kruse, who holds a PhD in physics (University Bremen,
Germany), is head of the coordination centre PortalU in the
Lower Saxony Ministry of Environment and Climate Protection.
The German Environmental Information Portal
(www.portalu.de) PortalU is a federal state cooperation from the
German environmental administration to provide common
access to public environmental information. Dr. Kruse is
responsible for the overall coordination of the PortalU project
partners (German federal government and 16 federal states), technical development of
the portal and the presentation of the project to international partners. PortalU is
mentioned as national best practice example within the EU Commission
Communication towards SEIS to implement SEIS. Dr. Kruse represents the
Cooperation Centre in the INSPIRE process as a technical expert for metadata.
Mrs. Valcheva has a Diploma in Informatics (Sofia University
“Kliment Ohridski”, B) and is experienced expert in IT
technologies. As a manager of IT department in InfoLogica
Company she is responsible for developing and implementing of
information systems. Her previous occupation as Bulgarian PCP
and NRCs for Information Systems in Bulgaria for the European

International Conference SDI 2010 – Skopje; 15-17.09.2010
248
Environment Agency and Management of Bulgarian reporting to EEA via Reportnet
brought a valuable experience in building Information system especially in the field of
environment. Mrs. Valcheva is part of Infologica team which is partner in a project GS
SOIL “Assessment and strategic development of INSPIRE compliant Geodata-Services
for European Soil Data” and is in charge of building and setting up of technology
solutions for INSPIRE and thesaurus services.
Mr. Georgi Georgiev is MSc of Information Science (Technical
University, Sofia) and is a Managing Director of InfoLogica
Company. He has more than 15 years experience in IT systems
and strategy development. He has extensive experience in system
engineering and good professional skill for design, realization and
integrations of high technology solutions in networking and its
systems. As Managing Director of InfoLogica he has gained
valuable experience in project management and co-ordination for
development projects of ICT Systems, design, development and maintenance of
Information Systems based on technologies such as Relational Data Base Management
Systems ,Data warehouse Technology, GIS systems, Expert and Knowledge Based
System. In working on a number of projects for air pollution monitoring, permits issuing
and reporting system, water monitoring systems Georgi Georgiev has gained valuable
experience in development and implementation of Information Systems in the
environment sector. Mr. Georgiev represents the Infologica company in INSPIRE
project GSSOIL as a technological provider.
Acknowledgment
The work presented in this paper is the joint effort of the GS SOIL consortium. The
authors are representatives of the project coordinator and members of the work package
on the technical establishment of the GS SOIL portal. They are solely responsible for
the content. The paper does not represent the opinion of the European Community and
the European Community is not responsible for any use that might be made of
information contained therein.
For further information on the project please visit the website: http://www.gssoil.eu/.

International Conference SDI 2010 – Skopje; 15-17.09.2010
249
KOSOVO FOREST INVENTORY PROJECT 2002-2003
Ferim GASHI1
ABSTRACT
Following the 1999 war, returning foresters compiled available information on forest resources in
Kosovo. These data stemmed from the period before and during first half of 1990. The total forest
area was estimated at about 430, 000 ha, or approximately 40% of the total land area. Of this area,
low forest originating from stool-shoots (coppice) constituted the major part, covering more than
60%. High forest was estimated at about 25%. The growing stock in high forest was estimated at
about 17 – 18 million m³, and total standing volume at approximately 30 million m³ for all types
of forests, 62% of all forest was considered state owned, while the remaining 38% was classified
as private or community owned. By the Kosovo Forest Agency, the annual allowable cut was
initially estimated at 70, 000 m³ from coppice forests.
The previous assessments were carried out by the state forest company Serbia Forest. Since
available information was scarce and referred to the situation before the conflict, validation of the
data with regard to the present situation could only be done through a new Kosovo – wide forest
inventory. Previous assessments were also mainly focusing on State forest, while inventory
results from private forests have been negligible or non – existing. In this way, e new Kosova –
wide inventory would be the first one ever or for a very long time that assessed and compiled the
data from public and private forests, using the same methodology. Previous assessments were
based on the aggregation of data from stand – wise management plans. The new NFI project has
been based on a different concept, namely the systematic sample plot inventory. The main
objective is to promote a sustainable forest management by assessing the total forest resources
and the annual sustainable harvest level.
The project was started in February 2002 and finalized in December 2003. After a short test
period in the autumn of 2002, the major part of the fieldwork took place from March – November
2003
Key word: INSPPIRE, NSDI, GIS portal, Forest Inventory
1. INTRODUCTION
Forest information in Kosovo has existed before and during 1990s, since then all the
plans have been described only for the public properties. After the year 1999, one of the
urgent identified actions has been the verification of the data and reinstallment of the
capacities of the leading measurement of the forest resources in entire Kosovo. This
kind of information is crucial for different strategic decisions in an environment, the
sector of forest policies and for monitoring and managing forests. Considering this as an
1 MSc. Ferim Gashi, Ph.D. Candidate [email protected]; [email protected];
Institution, Kosovo Forest Agency, www.mbpzhr-ks.org
Tel.: +381 38 484, Gsm. +377 44 114674, Fax: +381 38 212 905.
Address: Str. Zenel Salihu No: 2 1/A 10 000 Prishtine, Kosova

International Conference SDI 2010 – Skopje; 15-17.09.2010
250
immediate need, the government of Norway has accepted to finance the forest resources
measurement together with the main objective of the building forest information system
in Kosovo.
Specified objectives of the project have been reviewing of existing forest system and
ensuring compatibility with international definitions, calculation of the area and the
volume in feet according to the determined classes and property category as well as
building capable organization to lead national stocktaking of the forests.
Existing orthophotos and cartographic maps are used for initial classification of the
surfaces. The aim of the previous classification was identifying forest areas that require
measures and creation of orientation maps. Another issue was to make possible previous
classification of the land usage class and a rapid classification of the forests and other
forest areas in a limited number of classes. All forest areas classified as” forests” or as
‘’Other Forest Areas’’ should have been visited in the terrain for detailed measures and
classifications. Since the beginning it was expected that it would be impossible for all
the areas to be visited, thus the interpretation of the aerial photographs of the non visited
areas makes possible calculations according to the classes of the total used area of
Kosovo, as well as securing test areas in the specific type of forest which would
increase the evaluation of the volume expansion for the non visited areas of the terrain.
2. PROJECT OBJECTIVES
With the support of FAO for the forest sector in Kosovo and from a study done by the
Norwegian Foresters Group (NFG), installing measurement capacities and forest
resources monitoring in Kosovo level. .
These two elements have included: The interpretation and classification of the area from
photogrametry in general, accompanied with the system of forest monitoring, building
the net of the permanent test areas in the line of National Forest Stocktaking.
Detailed measurements of the terrain for gathering information of the terrain
specifications utilized for the managing operative plans.
The main objective of the project has been building the forest information system in
Kosovo level for the Kosovo forest resources. Main objectives are:
• Relevant training for staff
• Creating a new capable structure to lead National Stocktaking of forests including
results monitoring and presentation
• Review of the existing system of classification as to the system of classification of
the region countries compatible with the international definitions (UN-ECE/FAO);
• The calculation of the area according to the determined classes and category of the
property;
• The calculation of volume for 1 acre and the total for the property categories and
the determined classes;
• The calculation of the main part and position of the wastelands and degraded land
that after the investments could convert to plantations

International Conference SDI 2010 – Skopje; 15-17.09.2010
251
• The potential for cutting the existing forest in the future as well as investing for the
rehabilitation of the forestry ;
Indirectly the sector of forests, including the forest owners, the government and the
industry of wood processing, will benefit from the possession of the more accurate
information of planning and decision taking. Except this, the project objective is the
contribution in the sustainable development of the forest resources and economy in
general.
2.1 Existing data for the forests
In the terms of forest land, some autochthonal species of leaves dominate, European
beech (Fagus Silvatica) is broadly expanded and it has a considering economic
importance. European silver fir (Abies Alba), European spruce (Picea Abies) and The
scots pine (Pinus Silvestris) are conifer species grown in a natural way in great
elevation. European Black Pine/Austrian Pine (Pinus Nigra) is an important species that
is dominant in low altitudes.
After the 1999 war, foresters have gained available information of forest resources. This
information dates from the early period and during the first half year of 1990. The total
forest area was approximately 430 000 ha, or circa 40% of the total area. In this area,
low regenerated forests cover the vast part or more than 60% of the total forest area.
High forests are estimated to be 25%. The volume of the forests in cubic meters in the
woods has been estimated to be 17-18 million m3 and the total volume in cubic meters
approximately 30 million m3 for all kinds of forests. 62% of the total forests is
considered to be as public property, while the remaining 38% is classified as private
property forests. Kosovo Forest Agency (KFA) allows 70 000 m³ of the public high
forests to be cut and 130 000 m³ from low forests.
2.2 Compiling of the existing information, barriers in the usage of information
The project has ensured seven sets of equipment for the stocktaking form the Swedish
supplier Skogma AB (the project was selected for the GPS). The digjital aerial photos
(2D) and topographic maps are basic data used for the classification of the area. The
project has obtained the aerial photos form Kosovo Cadastral Agency (KCA) which
covers approximately 80% of the total area. This was developed from aerial photos with
a resolution of the terrain 40cm taken during 2000 and 2001. Each photo covers an area
of 1km2. Digital orthophotos were form the Gauss-Krüger system used in former
Yugoslavia. The copies of topographic maps of the scale 1:25,000 (Dy sets) consisting
of 100 seperate maps. These maps were produced in former Yugoslavia in the 1970s.
The Eastern EU, satelite center fpr Kosovo offers geo-cod digital geographic
information in there bands which offer analyse and visualisation of Kosovo in the
variable scale from 1:1 000 000 till 1:5 000. The civil defence directorate has offered
digjital data provided by UN mine action coordination centre. Some areas have been
identified as dangerous areas as for unidentified mines and explosive.
Kosovo Forest Agency has enabled forests maps of scale 1:50 000 in the managing

International Conference SDI 2010 – Skopje; 15-17.09.2010
252
forest plans. Maps offer information for the forests classes, the quality of location, and
other publik forests. A vast majorit of the maps are invalid. For instance in the
forbidden flying area along the Serbia border in the northeast and northwest, for which
orthophotos are missing (20% of the total area), and the images taken from India satelite
IRS LISS were tested but they were useless due to the small resolution.
Eighty-seven areas interpreted as forests and forest land have been classified in forests
during work in the terrain. We can clearly see that there is an existing reasonable state
in terms of comparing covering information about forests in the old topographic maps
and current situation. This shows that usage of the land has been relatively konstant
during the period. Orthophotos are aplicable for the period 6-8 years, However their
usage has been limited only for the project.
3 THE STOCKTAKING RESULTS
The distribution of forest area according to the origin, species classes, their age and the
handling possibility. The project has estimated the total forest area 464 800 (ha), which
is approximately 35 000 ha bigger than the previous. The reason for this deviation might
be different factors used during the classification of the land as the transformation of the
arable land into forest land. Stocktaking has also classified 28 200 ha as other forest
land. This category or other similar categories have not been used in the other
stocktaking in Kosovo. Wasteland on the other hand some which may be suitable for
forestry consist of 23400 ha. Pastures are the other classes which cover 153 200ha.
Some of the area has been eroded as a result they have only a thin soil layer. Despite to
their poor quality, some of these areas might be suitable for forestry or other ways of
usage.
Table 1. The total area of Kosovo in accordance with the usage classes
Area usage Area (ha)
Forest land 464 800
Other foerts land 28 200
Wasteland 23 400
Agricultural land 342 400
Pastures and meadows 153 200
Urban areas and buildings 40 000
Water 4 600
Unclassified 41 600
Total 1 098 200

International Conference SDI 2010 – Skopje; 15-17.09.2010
253
The total area corresponds approximately same with the existing official figures. This is
an excuse that the system is distributed in a good way. According to the above chart out
of the overall area 464 800 ha, 278 880 ha or 60% has been classified as publik forest
land. The rest 40% (185 920 ha) is a private property. These figures differ from the old
statistical data and the cadastral data.
Data source Public forets Private forest Total
Old statistics 266 000 162 000 428 000
Cadastral data 2004 196 000 198 000 394 000
Stocktaking data: Visited area 202 800 176 400 379 200
Non visited area 76 080 9 520 85 600
Total 278 880 185 920 464 800
The figures from the cadastral data (198 000) are much higher than the old statistical
data from 162 000 ha, and therefore should be checked. Taking into consideration the
distributing result of the test area which they show a total area of 176 400 ha as private
forest property of the total forest of 464 800 ha where we have the expansion of 40%
private forest land and 60% public forest land, the total area of private forest land has
been estimated of 185 920 ha and public forest property of 278 880 ha. All this is a
consequence of 88% of the non visited area in the terrain which is in public property.
The vast area of non visited land is the mined area in North Mitrovica in the border area
where it is impossible to penetrate. This fact supports the assumption that the non
visited area is a public property.
Table 2. Forest area according to the origin and property class (ha).
The pile origin Public Private Total
Without trees 22 200 10 000 32 200
Natural seeding 89 200 82 000 171 200
Forestry or artificial seeding 1 800 400 2 200
Stumps, forestry 17 600 19 000 36 600
Stumpy area 62 000 53 800 115 800
Stumps 10 000 11 200 21 200
Total forestlands surveyed 202 800 176 400 379 200
Non visited Forest area (no information) 76 080 9 520 85 600

International Conference SDI 2010 – Skopje; 15-17.09.2010
254
Total forest area visited and non visited 278 880 185 920 464 800
Total area in percentage 60 40 (100)
Comments:
• 32 200 ha is classified as „woodless“. This area may include a high productivity
forests, suitable for artificial regeneration;
• 171 200 ha is a forest created through natural seeds and therefore classified as a
high wood with >16 m;
• 115 800 ha is classified as stumpy forest. The main area is in the central part of
Kosovo;
• Stumpy forest with standards are low forests, however there are with high woods
(21 200 ha);
• Only 2 200 ha is registered as forested wood are. This figure does not correspond
well to the forested data, that show a total forested area between 15 000 – 20 000
ha. Some forested woods might be registered under the class “Mixed stumpy
area/seedy or forested’’, nevertheless it is clear that a vast forested area is missing.
The majority of public forests is situated in the elevation between 600-800 m.
Table 3 shows the public forestry area according to its origin and elevation.
Table 3. Public forest area according to its origin and elevation (ha)
Pile origin
Elevation
No
records
TOTAL 200-
400
400-
600
600-
800
800-
1000
1000-
1200
1200-
1400
1400-
1600
>1600
Without trees 400
6
000 9 800 4 400 800 600 200 22 200
Natural
seeding
1
400
4
400
16
800
22
600
10
200
13
000 9 400
11
400 89 200
Forestry or
artificial
seeding
1
600 200 1 800
200
4
000 3 000 2 000 4 800 2 000 1 000 600 17 600

International Conference SDI 2010 – Skopje; 15-17.09.2010
255
Stumps
800
7
600 21400 25000 2 800 2 600 1 400 400 62 000
Cungishte me
standarde 3 000 5 000 2 000 10 000
No
information 76 080 76 080
Total
2
800
23
600
54
000
59
000
20
600
18
400
12
000
12
400 76 080 278 880
Total area in
percent 1 8 19 22 8 7 4 4 27 100
Comments:
• Classified area as “without trees” is expanded in low altitudes. It may be assumed
that this area is more possible to be penetrated and this is the reason that it has been
a subject of many illegal cutting
• More than 60% of the piles created by natural regeneration are expanded in the
altitude between 600 – 1 000 meters. These forests in many cases have a good
growth , have high quality and are used for technical logs;
• 50% of the total forest area is expanded in the altitude lower than 1 000 m;
• Non visited area is classified through the photo interpretation. The kinds of trees
have been classified as leafy unclassified (see table 4).
Public forests in general are expanded in a higher altitude comparing to private forests
that are expanded in lower altitudes.
Table 4 represents the distribution according to origin and elevation in private forests
Table 4. Private forest area according to the origin and elevation (ha)
Pile origin
Elevation
No
records
TOTAL 200-
400
400-
600
600-
800
800-
1000
1000-
1200
1200-
1400
1400-
1600
>1600
Without trees
1
000
3
000
5
000 800 200 9 000
Natural seeding 800
5
200
41
400
23
400 6 000 2 400 2 200 600 82 000

International Conference SDI 2010 – Skopje; 15-17.09.2010
256
Forestation or
artificial
seeding 400 400
Stumps, seeding
or forestry
(mixed)
1
000
10
400
2
800 3 400 800 200 400 19 000
Stumps
5
000
10
200
22
000
13
600 1 800 1 000 200 53 800
Standard
stumps 600
3
000 5 600 1 200 800 11 200
No records 9 520 9 520
Total
7
800
29
400
74
200
47
200 9 800 4 600 2 800 600 9 520 185 920
The percentage
of total area 4 16 40 26 5 3 1 - 5 100
Comments:
• Stumpy forests and piles created by natural seeding dominate
• There is only a small forestation area, this is justified through forestation
programmes which have been concentrated in the public forest lands;
• A small part of stumpy forest with standards is higher than the public forests. This
shows us that management of private forests is better than the management of
public forests thus unlike public forests, private forests are not aimed to be cut
• 86% of private forests is expanded in the elevation lower than 1 000 m.
Table 5. Public forest area according to species classes and forest structures
(ha)
Class of
species
Forest structures
No
records
Total Under
regeneration Annual
high
trees Annually
duration
Without
woods
1 600 400
2 000
(1%)

International Conference SDI 2010 – Skopje; 15-17.09.2010
257
Coniferous 5 000 1 400 8 400
14 800
(5%)
Leafy 2 600
117
400 11 200 52 800
184 000
(66%)
Mix 200 1 800
2 000
(1%)
No
information 76 080
76 080
(27%)
Total 4 200
123
000 12 600 63 000 76 080 278 880
Table 5 shows public forests according to the classes of species and the structure of the
forests. Coniferous forests include pine and fir tree while leafy forests are dominated by
the leaves and the types of beech.
Comments:
• Leafy forests cover (defined and undefined) more than 90 % of the forest area.
• Leafy forests cover more than 90% of the forest area
• 5% is defined as coniferous forest. These forests mainly are expanded in the west of
Kosovo
• A considerate area of the forest has been classified as annual duration forest or
taller woods.
• More 50% of annual duration is coniferous forests.
4. CONCLUSIONS
The main conclusions elicited across the project course are:
• 379 200 ha is classified as forest area through the interpretation of the aerial
photography and terrain studies. 85 600 ha has been classified as forested area
through interpretation of aerial photography, but they have not been visited due to
the mine areas and their logistics difficulties. The total area which was calculated
from the visited area and non visited area there have been 278 880 ha of public
forests and 185 9920 ha private forests. This total area of (464 800 ha) is bigger
(6-8%) than the earlier measures;
• Leafy forests created form natural seeds cover more than 90%. Dominant species of
the leafy forests are Beeches and Oak trees. Coniferious forests cover 7% of the
total forest area and are dominated by Abies alba, Picea abies and Pinus sp.;

International Conference SDI 2010 – Skopje; 15-17.09.2010
258
• The total volume in m³ in the public forests is estimated approximately 33.5 million
m3. Out of this volume 25.9 m3 is wood with a diameter of >7 cm. In the private
forests the total volume in m3 is estimated to be approximately 19.5 million m3 out
of which 14.5 million m3 is wood with a diameter of >7 cm;
• Annual growth of the woods in the visited area and the woods with a diameter >7
cm, is estimated to be 1.165 million m3. None visited forest areas 85 600 ha are
expanded in the locations near mined and inaccessible areas so it has been foreseen
that these areas should not be included in the area that could be used.
• Based on the actual status of the forests, the annual possibility of the usage has
been estimated 900 000 m3 that corresponds to 77% of the growth of the forest in
the visited areas. Circa 700 000 m3 can be cut in high forests (> 16 m) and
approximately 200 000 m3 in low forests. These calculations are in gross thus they
include the peak of the trees, tree branches and thickness. To achieve this utility of
volume requires modification in the management and so far usage.
• 40% of public forest area and 29% of private forest area are subjected to illegal
uncontrolled cutting although with all standards these figures are very high. The
situation is very critical in the coniferous forests where the overall existing surface
will be in risk if immediate actions are not taken. Stocktaking results also confirm
the expert’s opinion that the stumpy forests especially public forests are exposed to
cutting.
5. REFERENCES
Kosovo Forest Agency (2010), Forest stocktaking 2002/2003; Pristine, Kosovo
6. BIOGRAPHICAL NOTES OF THE AUTHORS
Mr. Ferim Gashi holds a MSc in European Spatial Planning and
Regional Development (Blekinge Institute of Technology,
Sweden). He is Acting Director of the Coordinating Acting
Director of the Coordination Directorate at the Kosovo Forest
Agency in Prishtina, Kosovo (www. http://www.ks-
gov.net/mbpzhr/).
Kosovo Forest Agency is responsible for matters related to forests and forest land,
public land forests administration and management as well as National Parks in Kosovo
except those issues which in a special way, law determines other authority than the
Government. Mr Ferim Gashi is responsible for executing general policies of
development and strategic intentions on the sustainable management basis of the wood
and non wood resources and wild fauna in the level of the KFA office. Coordinating
activities and plan supervision and maintenance of the infrastructure, equipment, tools

International Conference SDI 2010 – Skopje; 15-17.09.2010
259
and objects for the efficient protection of forest resources from fire, illnesses and forest
deleterious.
Presently Mr. Ferim Gashi has enrolled a PhD at the University of Tirana in Albania
with the research theme “GIS role in Spatial and Urban Planning, development
challenges that directly impact in Spatial Planning.”

International Conference SDI 2010 – Skopje; 15-17.09.2010
259
OVERVIEW ON GLOBAL MAP
AS CONTRIBUTOR OF GSDI
Bashkim IDRIZI 1,
Murat MEHA2, Pal NIKOLLI
3, Ismail KABASHI
4
ABSTRAKT
Global mapping is an international collaborative initiative through voluntary participation of
national mapping organizations of the world, aiming to develop globally homogeneous
geographic data set at the ground resolution of 1km, and to establish concrete partnership among
governments, NGOs, private sectors, data providers and users to share information and
knowledge for sound decision-making.
The primary objective of Global Mapping project is to contribute to the sustainable development
through the provision of base framework geographic dataset, which is necessary to understand the
current situation and changes of environment of the world.
Nowadays in the web site of ISCGM are available four GM datasets, named as GM V0, GM VX,
GM V1/V2 (national and regional version) and GM V1 (global version), by following the ISO/TC
211 standards for geographic information. The GM specification consist the standards of GM
V1/V2 and GM V1, both of them as most popular and most utilized GM data. GM V1 (global
version) is available within the Google Earth also.
The research for utilization of GM data resulted with some limitations in wide utilization for
spatial analyses in international level. Problems detected as data overlapping, gaps, spatial
discontinuity of data, non-homogeneous accuracy of whole data, utilization of UNK as value for
unknown data ext., make GM dataset with limited utilization for wide spatial analyses. The lack
of cartographic key (cartographic symbols), lack of cartographic/graphic representation, and
absence of defined map projection prove that global map oneself does not contain the basic
elements characterize a map, but it is just GIS database.
Results from the research are in accordance with paragraph 6 of the GM specification 2, where
suggestions from GM users are required, hoping that they will be taken into account in the next
revision of GM specification.
1 Prof.Dr.sc. Bashkim IDRIZI, [email protected]
State University of Tetova, www.unite.edu.mk
Tel.: +389 2 2612-492, Gsm.: +389 75 712-998, Fax: +389 44 334-222
Str. Dzon Kenedi, 25-4-20, 1000 Skopje, Republic of Macedonia. 2 Prof.Dr.sc. Murat MEHA, [email protected],
University of Prishtina, www.uni-pr.edu
Gsm.: +377 44 120-958.
Prishtina, Republic of Kosova. 3 Prof.Dr.sc. Pal NIKOLLI, [email protected]
Tirana University, Department of geography, www.fhf.edu.al
Gsm.: +355 69 2472-451
Elbasan street, Faculty of History and Philology, Tirana, Albania. 4 Prof.Dr.sc. Ismail KABASHI, [email protected],
University of Prishtina, www.uni-pr.edu
Gsm.: +377 44 325-819.
Prishtina, Republic of Kosova.

International Conference SDI 2010 – Skopje; 15-17.09.2010
260
Key word: global map, vector data, raster data, GM V1/V2 national and regional version, GM
V1 global version.
1. INTRODUCTION
Global Mapping is a process/project for the development of spatial database for the
surface of the Earth that corresponds to the scale 1:1.000.000 for vector data and 30”
spatial resolution for raster data, consistent with the specifications adopted by the
International Steering Committee for Global Mapping (ISCGM). GM has accomplished
through cooperation between national agencies for Cartography (National Mapping
Organizations - NMO) as country participants in the project. The main purpose of this
global project is to gather intelligence from all countries interested organizations to
develop and easy access to spatial data in digital form at the global level.
Collaboration between participants in different levels is essential to sound decision -
making for sustainable economic development of society and environment. This will be
used for implementation of global/international conventions and agreements for
environment protection, to oversee major phenomena of the environment and encourage
economic growth within a sustainable context. GM also contributes to the development
of global spatial data infrastructure (GSDI - Global Spatial Data Infrastructure) and to
global observation systems on Earth (GEOSS - Global Earth observation system of
systems).
The GM data primarily is aimed for:
- Monitoring and early warning systems for natural disasters;
- Monitoring and management of natural resources;
- Assessment of the trends of environment changes;
- Local, national and multinational physical development planning; and
- Informed decision-making of policy makers with a strategic database.
GM with steady of data quality and standards can be used as tool for monitoring of the
environmental status in regional and global level. Utilization of GM data enables
analysis of the data pertaining to everyday life in different situations. GM data might
have limited use in national and local level. They are necessary to monitor global,
regional and international issues, as well as national issues if the country has a large
area. Some potential applications of GM data are given bellow:
- Global Environmental Assessments (Ozone, Intergovernmental panel on climate
change IPCC, Global Climate Models etc.)
- Global/Regional/National perspective and contextual information
- Developing ecosystem, drainage basins framework for environmental assessment
- Quantifying trans boundary issues
- Rapid response capability/early warning
- Environmental priority setting, analytical studies over large areas.
For these reasons, international organizations and institutions around the globe provide
and share Global Map information about the state of the globe and its changes. The
“Earth Summit” - the United Nations Conference on Environment and Development
(UNCED) - in Rio in June 1992 addressed the issue of information access. The report of
this session includes mention of the need for global mapping, stressing the importance
of public access to information and international cooperation in making it available. It is
therefore essential that we have access to the most accurate and up-to-date maps of
important environmental features, if we are to properly understand our global

International Conference SDI 2010 – Skopje; 15-17.09.2010
261
environment. At present, available maps of the entire globe originate from various
sources and therefore their accuracy is inconsistent, mainly because of irregularities in
source material, lack of up-to-date data, gaps in the data, etc. Insufficient circulations of
existing map information and a concern for national security have also reduced the
availability of maps at a global scale.
Despite the maps prepared in local/national standards, GM dataset enable (Idrizi, 2006):
- all data of Earth to be in one place,
- with the same attributes,
- in the same format,
- in the same coordinate system,
- in the same scale, and
- with similar accuracy.
The process of GM developing is directly supported by the United Nations, from which
in 1998 was put down the letter addressed to all National mapping organizations around
the world with invitation for participating in the project.
“Initiatives and partnerships for global mapping,” were strongly encouraged in the
Johannesburg Plan of Implementation following the World Summit on Sustainable
Development in 2002. The Global Map project was subsequently registered as an
initiative following this summit with the goal of completing global coverage by the year
2007 (GM specification 2, 2009).
2. GLOBAL MAP DATA
Spatial features of global map dataset are organized into thematic layers in either vector
or raster formats with each layer containing logically related geographic information.
Global Map contains four kinds of datasets:
- Global Map V.0
- Global Map V.X
- Global Map V1/V2 (national and regional version) and
- Global Map V1 (global version).
The GM V.0 is based in Vmap level 0 data, Global Land Cover Characterization
(GLCC), and GTOPO 30 elevation data set. All listed datasets are existing global
geographic datasets, without any validation of any NMO. It contains four raster layers
(vegetation, land cover, land use and elevation), all of them in TIFF and BIL raster
formats, except elevation which is only in BIL raster format.
The GM V.X is based in existing global geographic datasets, as the previous one (GM
V0), tentatively developed with expectance to be improved in GM V1/V2.
The GM V1/V2 national and regional version is most popular and most utilized global
map dataset, produced by National Mapping Organizations of respective countries
under their responsibility, without any responsibility assume of ISCGM for the contents
of these data. In addition to the official VPF/GML and BIL formats, Shape and TIFF
formats are available for the Global Map V.1/V.2 (National and Regional version) also.
It contains eight layers, four vector layers (populations centers, drainage, transportations
and boundaries) represented in VPF, Shape and/or GML formats, and four raster
(elevation, land cover, land use and vegetation) layers in TIFF and/or BIL format.
The GM V1 global version was developed as additional raster data aimed to replace
existing raster layers (land cover, land use and vegetation) in future GM V2. The data
were created by using MODIS data observed in 2003 (TERRA Satellite). It contains

International Conference SDI 2010 – Skopje; 15-17.09.2010
262
two raster layers, Land cover and Vegetation (Percent tree cover), all of them available
on BIL and TIFF formats, with the same spatial resolution as raster data of national and
regional version. They are uploaded and available in Google Earth also (figure 1).
Figure 1. Global map V1 (global version) in Google Earth
2.1. Global Map V1/V2 – national and regional version
The global map V1/V2 national and regional version, is most utilized and known
version of global map, in which all participant NMOs give their efforts for its
developing. This global map dataset includes both types of data, vector and raster data,
provided by NMOs based on their level of participation. The list of layers is given in the
next table 1.
Table 1. Global Map V1/V2 data set layers - national/regional version
Vector Layers Raster Layers
Transportation Elevation
Boundaries Land Cover
Drainage Land Use
Population Centers Vegetation
Figure 2. Global Map V1/V2 data set - national/regional version

International Conference SDI 2010 – Skopje; 15-17.09.2010
263
2.1.1. Vector data of GM V1/V2 – national and regional version
The features of the vector data are represented by the three basic spatial objects: points,
edges (lines) and faces (polygons), allocated a category number for linking the
geometrical with attribute data. GM vector data stored as edges and faces are
individually structured, which means that GM vector data is partly topologically
structured. The intense of GM vector data is to keep the logical consistency of data, and
non duplicate features.
The structure of GM vector data is adapted to ISO/TC 211 standards. Vector layers and
the associated feature types are shown in the following table 2 (GM specification 2,
2009).
Table 2. Feature class, name, type and inclusion of vector layers
Layer Feature Name Feature Type Inclusion Abbreviation
Transportation Airport point optional airp
Railroad Station point optional rstatp
Port point optional portp
Railroad edge mandatory raill
Road edge mandatory roadl
Trails and Tracks Line edge mandatory traill
Ferry route edge optional ferryl
Boundaries Political Boundary point mandatory polbndp
Coast Line edge mandatory coastl
Political Boundary Line edge mandatory polbndl
Political Boundary Area face mandatory polbnda
Drainage
(Hydrography)
Miscellaneous
(Dam/Weir/Island/Spring
/Water-Hole)
point optional miscp
Miscellaneous
(Dam/Weir)
edge optional miscl
Aqueduct/Canal/Flume/
Penstock
edge optional aquel
Water Course edge mandatory riverl
Inland Water face mandatory inwatera
Population
Centres
Built-up area point optional builtupp
Built-up area face optional builtupa
The vector data of Global Map V1/V2 (national and regional version) can be
downloaded in VPF (Vector Product Format), SHAPE and GML (Geography Markup
Language) formats. VPF is a standard format, structure, and organization for large
geographic databases that are based on a geo-relational data model, combinatorial
topology and set theory, and are intended for direct use (Idrizi, 2007a). Because the
utilization of VPF files is so limited by the existing GIS software’s, on October 10th
2008 the existing GM vector data (national/regional version) has been published in
SHAPE format also, which is more simple and user-friendly format. On October 25th
2009, the GML (standardized in ISO19136) format has replaced former VPF as the

International Conference SDI 2010 – Skopje; 15-17.09.2010
264
official distribution format of GM data, which provides a standard format for
transferring digital geographic data (Idrizi, Nikolli, Hyseni, 2010).
The file names of shape and GML data are different. The names of shape files consists
the identifying letters of layer, and in the end of name letter of geometrical type of data
(p for point, l for line and a for polygons), given in next table 3. The names od vector
data stored in GML format have a file name of the form wwww_xxx_y.zzz or
wwww_xxx.zzz where:
- wwww - identifies the abbreviation of the feature shown in table 2,
- xxx - identifies the country code from ISO 3166 Nation Code,
- y - shows the Unique ID if a territory is divided in two or more tiles, and
- zzz - is the extension identifying the data (gml).
Table 3. Names of shape files of GM V1/V2 (national and regional version)
and features within them
Shapefile Features
transp.shp Airport, Rail yard
transl.shp
Railroad, Road, Trails and tracks line, Structures (bridge,
tunnel, ferry route)
bndp.shp Political boundary
bndl.shp Political boundary line, Coast line
bnda.shp Political boundary, Ocean/Sea
hydrop.shp Miscellaneous (Dam/Weir, Island, Spring/Water-hole)
hydrol.shp Aqueduct/Canal/Flume/Penstock, Water course
hydroa.shp Inland water
popp.shp Builtup area, Miscellaneous population
popa.shp Builtup area
Table 4. Excample of names of gml files of GM V1/V2 (national and regional version)
Name of GML files Description
builtupa_mkd_1.gml When country is divided in two ore more tiles
builtupa_mkd.gml When the whole country is within one tile
2.1.2. Raster data of GM V1/V2 – national and regional version
The raster data grid cells are organized and accessed by rows and columns with the cell
size (spatial resolution) 30”x30”, with the origin on the north-west corner of the tile. Its
area represented by a square grid cell is computed from the length of its side called
spatial resolution. The attribute of each cell represent a characteristic that is dominant
nearby the center point of cell. The characteristics of the raster layers of Global Map
data will be shown in the following text.
Elevation Layer – contain the vertical distance between the surface of the earth and the
mean sea level that the nation has defined. The elevation layer is in a Band Interleaved
Line (BIL) format with 16-bit elevation value and 30” horizontal grid spacing. The
values of elevation are represented in meters, in which the codes -9999 are areas
masked with the sea.

International Conference SDI 2010 – Skopje; 15-17.09.2010
265
Land Cover Layer - Land cover is the observed (bio) physical cover on the earth’s
surface (Di Gregorio and Jansen, 1998). In Global Map specification the codes of Land
Cover Characteristics of GM V1/V2 national/regional version is adopted for
International Geosphere-Biosphere Programme (IGBP). IGBP has 17 Land Cover
classes.
Land Use Layer - Land Use is a series of operations on land, carried out by humans,
with the intention of obtaining products and/or benefits through using land resources (de
Bie 2000). For Land Use legend, simplified GLLC with 9 classes is adopted. There is a
proposal to drop this layer from the next version 2 of GM national/regional as this being
almost derived from Land Cover data.
Vegetation Layer - For Vegetation layer, a modified water legend with 20 classes is
adopted. Changing of this layer based on percent tree cover for GM V1 global version
is proposed also.
Table 5. Types of raster data of GM V1/V2 national and regional version
Land Cover Land Use Vegetation
Description Code Description Code Description Code
Evergreen Needleleaf
Forest
1 Forest
10 Tropical rainforest
10
Evergreen Broadleaf
Forest
2 Mixture
20 Hydrotropic forest
20
Deciduous Needleleaf
Forest
3 Grassland/shrub
30 Grassland in tropical or
sub-tropical zone
30
Deciduous Broadleaf
Forest
4 Agricultural area
40 Semi desert in tropical or
sub-tropical zone
40
Mixed Forest 5
Wetland 50 Desert in tropical or sub-
tropical zone
50
Closed Shrublands 6
Barren area 60 Evergreen thick-leaved
forest
60
Open Shrublands 7
Built-up area 70 Evergreen broad-leaved
forest
70
Woody Savannas 8
Drainage/water 80 Deciduous broad-leaved
forest
80
Savannas 9
Ocean 90 Grassland in temperate
zone
90
Grasslands 10
Semi-desert in temperate
zone
100
Permanent Wetlands 11 Desert in temperate zone 110
Croplands 12
Northern coniferous
forest
120
Urban and Built-Up 13 Tundra 130
Cropland/Natural
Vegetation Mosaic
14
Water body
140
Snow and Ice 15 Ice and snow 150
Barren or Sparsely
Vegetated
16
Wetland
210
Water Bodies 17 Mixed forest 220
Mixed land 230
Non natural 240
Unclassified 250
Global Map raster data is in simple binary raster format without the embedded header –
BIL (Band Interleaved by Line) format, pixel information stores band by band for each

International Conference SDI 2010 – Skopje; 15-17.09.2010
266
line, or row, of the image. Vegetation, Land Cover and Land Use are in 8 bit unsigned
data and the elevation data in 16 bit signed in Motorola (big-endian) byte order.
On October 10th 2008 the existing GM raster data (national/regional version) has been
published in TIFF format also, which is more simple and user-friendly format.
All layers are identified with two letters, which explain the name of layer (table 6). The
file names have the form ww_xxx.zzz where
- ww identifies the theme,
- xxx identifies the country code which is defined at ISO 3166 Nation Code, and
- zzz is the extension identifying the data (bil or tiff) or the header (hdr).
Table 6. Identifiers of raster layers within GM V1/V2 (national/regional version)
Identifier Theme
el Elevation
lc Land Cover
lu Land Use
ve Vegetation
2.2. Global Map V1 – global version
The Global Version is developed by using satellite imagery with cooperation between
participating NMOs and supporting stakeholders, which covers only the vegetation and
land cover layers. The ground truth data are collected by Center for Environmental
Remote Sensing (CEReS), Chiba University in cooperation with National Mapping
Organizations (NMO).
Cell size for raster data is the same as national/regional version, 30 arc-seconds by 30
arc-seconds with the origin being the north-west corner of the tile. The data format of
global map V1 global version is the same as national/regional version also.
File names of global version of raster data have a form wwyy.zzz, where:
- ww - indentifies the theme,
- yy - identifies the file number, and
- zzz - is the extension identifying the data (bil) or the header (hdr).
2.2.1. Land cover – global version
MODIS data of 2003 with 1km tile (10 deg. by 10deg.) from United States Geological
Survey (USGS) have been used as the source satellite data for developing the Land
cover – global version. Classification of land cover data was made in two ways: one was
global classification and the other was national/regional classification. The main
classification method was decision tree method applied to MODIS data.
Land cover global version dataset contain 20 land cover classes, and another additional
class with code 255 which represent the areas without data (table 7). In table 7 are
represented the comparison between the Land cover classes in national/regional with 17
and global version with 20 classes (Tateishi, 2005).
One of the reasons of creating of Land cover global version with 20 classes is the
intention to drop the land use layer from the next version 2 of GM national/regional,
because it’s being derived from Land Cover data.

International Conference SDI 2010 – Skopje; 15-17.09.2010
267
Table 7. Comparison between classes of
Land cover global and national/regional versions
Land cover global version Land cover – national and regional version
1. Broadleaf Evergreen Forest 2. Evergreen Broadleaf Forests
2. Broadleaf Deciduous Forest 4. Deciduous Broadleaf Forests
3. Needleleaf Evergeen Forest 1. Evergreen Needleleaf Forests
4. Needleleaf Deciduous Forest 3. Deciduous Needleleaf Forests
5. Mixed Forest 5. Mixed Forests
6. Tree Open 8. Woody Savannas
9. Savanna
7. Shrub 6. Closed Shrublands
7. Open Shrublands
8. Herbaceous, single layer 10. Grasslands
9. Herbaceous with Sparse and Tree/Shrub
10. Sparse Herbaceous/Shrub 16. Barren
11. Cropland (herbaceous crops except rice) 12. Croplands
12. Rice, paddy
13. Cropland/Natural Vegetation Mosaic 14. Cropland/Natural Vegetation Mosaics
14. Tree-Water (Brackish to Saline) 11. Permanent Wetlands
15. Wetland
16. Bare area, consolidated (gravel, rock) 16. Barren
17. Bare area, unconsolidated (sand)
18. Urban 13. Urban and Built-up
19. Snow/Ice 15. Snow and Ice
20. Water Bodies 17. Water Bodies
2.2.2. Vegetation (percent tree cover) – global version
Vegetation (percent tree cover) layer of global version is developed by using the
MODIS data of 2003, which has been used for global estimation of percent tree cover
data. The decision tree method was applied for estimation of percent tree cover.
The data within this layer contains an integer value from 0 to 100 which describes the
percent of coverage with trees, except the cells with value 254 which represent the areas
masked as water bodies, and cells with value 255 which represent the areas without
data.
The percent tree cover data can be effectively used to discriminate forest and “tree
open” during the process of land cover classification.
2.3. Mathematical elements of Global Map
The reference coordinate system of Global Map is ITRF94, and its longitudes and
latitudes are defined in GRS80 Ellipsoid, stored in decimal degrees to a minimum of
three decimal points as geographic coordinates with southern and western hemispheres
having a negative sign for latitude and longitude. Since the difference between
ITRF94+GRS80 and WGS84 is negligible in spatial resolution and scale of Global
Map, WGS84 can be used also.
The positional accuracy of spatial data based on the composite errors from three
sources: which are the positional accuracy of source material, errors due to conversion

International Conference SDI 2010 – Skopje; 15-17.09.2010
268
processes, and errors due to the data processing. For horizontal accuracy, 90% of points
need to be within ±2km of their actual location, and in the case of data obtained from
satellite images, the maximum error is less than or equal to 0.5km. In other site vertical
accuracy is notionally ±150m for 90% of points.
GM data is in use of GEOREF tiling naming system, which does not allow overlaps or
gaps between the tiles, with the the reference for their southwest corner. It uses two
pairs of letters. The first pair of letters represents the coarsest, 15° by 15° standard
GEOREF division, and represents the first coordinate pair identifying the tile name. The
second pair of letters represents the 1° by 1° standard GEOREF divisions, and
represents the second coordinate pair of the tile name.
In the other site, the tiling system of GM V1 global version uses the dividing system of
30° x 30° starting from the equator and the Greenwich meridian (Idrizi, 2007b).
2.4. Metadata of Global Map
Metadata is data about the contents, quality, condition and other characteristics of the
data, which also describes the lineage, process and accuracy of the data set. The
contents of global map metadata follow the ISO 19115 standard of metadata, described
in English language and supplied separately for each layer, by using ISO 19139 for
encoding.
A metadata files of GM data accompanies each layer of the data set separately, as XML
file with utf8, named after the relevant theme and have the extension “*.met” in the
form: wwww_xxx.zzz where:
- wwww - identifies the abbreviation (table 2),
- xxx - identifies the country based on ISO 3166 Nation Code, and
- zzz - is the extension ‘met’.
2.5. Downloading and copyright for usage of Global Map data
Downloading of Global Map data is available for non-commercial use, via internet and
free of charge, for all registered users. GM data can be downloaded through the “Global
Map download service” in the GM web site www.iscgm.org as:
- all national and regional version in VPF and BIL formats,
- all national and regional version in SHAPE and TIFF formats,
- land cover data of global version in BIL format,
- percent tree cover data of global version in BIL format, and
- only one selected layer of national and regional version in VPF or BIL format.
This data basically is for non-commercial use only! If anybody intends to use the Global
Map data for commercial purpose, it is necessary to get permission from responsible
institution of its country, according to defined data policy by each NMO’s. Any
unauthorized use of these data for any commercial purposes is in violation of
international copyright laws and strictly forbidden.
In the next figure 3 is given the scheme of standards for data developing defined in
global map specifications.

International Conference SDI 2010 – Skopje; 15-17.09.2010
269
Figure 3. Scheme of Global Map data
3. PARTICIPATION
Based on fact that the GM project is for noncommercial purposes, participation in it is
voluntary. Eligible for participation has only the national mapping organizations, which
are the governmental responsible institutions for mapping and spatial data developing
on national level, and probably they should have source of information of core
geographical data as a result of their original duty.
Involvement by an organization in the project in generally is categorized in three levels,
i.e. as Level A, B and C. Level A means that institution will prepare the data set of own
country and other countries, the Level B mean that institution will prepare the data set of
own country, and the Level C mean that institution will give all necessary data,
preparation will be done by ISCGM.
Currently, 180 countries and regions have participated in global mapping project, from
which 75 countries (table 8) have already released their data and they are available for
downloading in the web site of ISCGM. From the European countries who almost
participate in the EuroGLobalMap project powered by EuroGeographics, 23 of them
participate in the GM through the EuroGlobalMap, and 12 others participate directly
and through EuroGlobalMap. The progress on developing of GM data is given in the
figure 4, and the dynamic of releasing of GM data from year 2000 till May 2010 is
given in figure 5.
SHAPE
TIFF
GML
ISO 19136
ISO 19115

International Conference SDI 2010 – Skopje; 15-17.09.2010
270
Figure 4. Progress of Global Mapping
Table 8. List of countries
Year of
publishing
Country/region Year of
publishing
Country/region
2000 Japan 2007 Saudi Arabia
2000 Lao People's Democratic
Republic
2007 Algeria
2000 Nepal 2007 Lebanon
2000 Thailand 2007 Sudan
2000 Sri Lanka 2007 Brazil
2000 Philippines 2007 India
2001 Colombia 2007 Indonesia
2001 Australia 2007 Niger
2001 Bangladesh 2007 Uruguay
2001 Mongolia 2007 Dominica
2002 Panama 2008 Mozambique
2002 Kenya 2008 Georgia
2003 Botswana 2008 China, Hong Kong SAR
2003 Burkina Faso 2008 Romania
2003 Kazakhstan 2008 Chile
2003 Kyrgyz 2008 Palestine
2003 Mexico 2008 Brunei Darussalam
2003 Myanmar 2008 Pakistan
2004 Swaziland 2008 Papua New Guinea
2004 Samoa 2008 Oman
2005 Iran 2008 Belize
2006 The Former Yugoslav Republic
of Macedonia
2008 Dem.Rep. of Congo
2006 Latvia 2008 Honduras
2006 Tristan da Cunha 2008 Saint Lucia
2006 Argentina 2008 Nicaragua
2006 Antarctica 2008 Ethiopia
2006 Jordan 2008 Senegal

International Conference SDI 2010 – Skopje; 15-17.09.2010
271
2006 Japan (version 1.1) 2008 Congo
2007 Bangladesh (version 1.1) 2008 Guinea-Bissau
2007 Ghana 2008 St. Vincent and the
Grenadines
2007 Viet Nam 2008 Republic of Moldova
2007 Malaysia 2008 United States of Amerika
2007 South Africa 2008 Bhutan
2007 Bahrain 2008 Syrian Arab Republic
2007 Canada 2008 Azerbaijan
2007 Singapore 2008 Tunisia
2007 New Zealand 2009 Mauritius
2007 Cuba 2009 Bulgaria
2007 Guatemala 2010 Bulgaria (version 2)
Figure 5. Progress of releasing the Global Map data (2000-May 2010)
From the upper list it is so clear that Macedonia is the first European country who has
published its own GM data. Other European countries which have already released their
GM data are Latvia, Republic of Moldova, Romania and Bulgaria. The data of the other
35 European countries which participate through EuroGlobalMap are under the
verification, countries filled with green color in figure 4.
Beside the 180 participants, other 10 countries/regions are in the list of considering
countries/regions: Ascension Island, Bahamas, Djibouti, Eritrea, Lesotho, Paraguay,
Qatar, Rwanda, Turkey and Turkmenistan, which considers as potential participants of
Global Mapping project in a Global Map V1/V2 national and regional version,
represented by their NMO’s.
4. SOME ISSUES TO BE CONSIDERED FOR THE FUTURE OF
GLOBAL MAP
The idea for developing the global map was lunched as a result of unsuccessful
completing the IMW (International Map of the World in scale 1:1.000.000) and
contemporary trends that imposed information technology in the last decade of last
century for preparing the digital maps. Based on this idea, global map has had to replace
the IMW with a new map in digital form with the homogeneous standards for entire
globe. But if we take a look to the structure of global map since the beginning till today,

International Conference SDI 2010 – Skopje; 15-17.09.2010
272
namely its standards listed in its specifications, it is so clearly that global mapping is not
designed as a standard map, but it represents the GIS database format with specific
defined standards. The lack of cartographic key (cartographic symbols), the lack of
cartographic/graphic representation, and absence of defined map projection are the main
arguments which prove that global map it isn’t map but it is GIS database, i.e. global
map oneself does not contain the basic elements that characterize a map. Based on these
details, comes the expression mapping element which should be subject for GM
revising in the next period by orienting the project in this regard.
Our efforts for utilization the GM data from different countries for mapping and spatial
analyses resulted that data of each countries within itself follows all the standards set
global mapping project, but in a case of preparing a map of two neighboring countries
by using GM data as well in a case of spatial analysis of a wider geographical region
consists by two or more countries, using of global map data is quite limited. Example
which prove the above two deficiencies are shown in the next figure 6, example along
the borderline between Bulgaria and Romania. In the figure clearly is shown that in
some places have overlapping and in some gaps between the two border lines released
by Bulgaria and Romania. Besides the overlaps and gaps, between two databases there
is no spatial continuity of objects of the road network, railway, rivers, lakes, coastline,
etc. Absence of spatial continuity condition and appearance of overlaps and gaps
prevents the utilization of this database for spatial analysis of hydrography,
transportations, the coastal line, state boundary, etc. Such situation is a result of several
factors as:
- Utilization of source data with different scale, accuracy and entireness;
- Utilization of source data with different period of collecting and non up-to-date data,
- Utilization of tendentiously data,
- Accuracy of the transformation of coordinate system,
- Data generalization,
- Lack of bilateral agreements between neighboring states to the border line,
- Various conflicts between neighboring countries for boundary line,
- Non-recognition of States between themselves, etc.
Above mentioned problems are of different natures from the technical up to the
political, accumulated in many decades-centuries, which cannot be overcome so easily.
Figure 6. Part of GM data along the borderline between Bulgaria and Romania

International Conference SDI 2010 – Skopje; 15-17.09.2010
273
Regarding to the accuracy, the GM specification allows GM data to have a different
accuracy depending on the source materials (for 90% of points ±2km, and ±0.5km if the
data comes from satellite images), where the difference can be up to four times. This
accuracy in some way allows overlaps, gaps, and non spatial continuity of data not only
between different countries, but the data within a country and between different
layers. This allows to each participant to use different sources with different quality for
different areas of their countries and for different layers. If we convert dimensions of
both errors, they are 2mm to 0.5mm in map, which are values much larger than the
standards for mapping in scale 1:1.000.000.
Non-homogeneous accuracy is one of the generators of overlaps, gaps and non spatial
continuity, which in other site means that GM dataset is a database without strong
topology. Topology of GM as defined in its specification "Vector data in the Global
Map will be partially topologically structured. Features stored as edges and faces will be
individually structured”, does not allow full spatial joint between objects in different
layers and objects between two data bases.
Of big importance is the relation between the data of raster and vector layers, for which
such as example we have analyzed the overlapping of lakes, seas and oceans with DEM
(digital elevation model). The differences are much larger than projected accuracy
(0.5km to 2km) and resolution of the DEM (1km), as can be seen in overlapped
situation between the coastline of the Black Sea and DEM, shown in figure 7.
Figure 7. Differences between the coastline and DEM
From the analysis on global map, utilization of UNK attribute about the unknown data
for us is somewhat unreasonable. This conclusion comes from the fact that participants
for developing the GM database for own countries are NMO’s, which according to legal
obligations on their countries they should possess native spatial data and their
accompanying attributes. On the existing GM data available for download, we found a
large number of data with this attribute. Probably the NMO’s have used the given
opportunity by the GM specification, and not really that their institution or other
country institutions don’t have information they possess.

International Conference SDI 2010 – Skopje; 15-17.09.2010
274
All the above suggestions can be treated as a point for which appropriate solutions must
be found in the next version of GM, in accordance with paragraph 6 of the specification
where suggestions of GM users are required.
5. CONCLUSIONS
From the above text it can be concluded that global mapping project is a project that had
a tendency to replace IMW with a digital map of whole globe with homogeneous
standards. Ten years after first publication of the dataset of Japan, the progress of GM
results with less than 50% released datasets of the participating countries and over 10
non participating countries in the project. Despite the recommendation letter of the
United Nations in 1998 and the Johannesburg Plan of Implementation following the
World Summit on Sustainable Development in 2002, to date is not reached with
completing of global map.
Global Map mainly characterized by national/regional and global versions, both of them
downloadable from the website of ISCGM. Beside them there are also two other global
datasets named as V0 and VX, which nowadays do not represent attractive database for
wider usage. Global map V1/V2 national and regional version consist raster and vector
data, despite other versions that contains only raster data. Intention of the global map
version two is to change the raster data structure, by replacing layers of land cover,
vegetation and land use of GM V1/V2 (national and regional version) with land cover
and percent tree cover layers of GM V1 (global version). Beside the essential changes in
raster layers, in the vector data only the format of the VPF has been replaced with GML,
as well as the metadata standards have been change into ISO 19115.
In order to approach the global map data to a larger number of users, GM data of
national and regional version V1/V2 can be downloaded in shape and TIFF formats, as
more appropriate formats and much wider use, despite the standard GM formats VPF
for vector and BILL for raster data. Setting global map data of global version V1 in
Google Earth tends to approach the data to users of various levels.
Global mapping basically is aimed to develop globally homogeneous geographic data
set, for better managing with the environment in global level, as well as to contribute
the development of GSDI and to GEOSS. Theoretically utilization of global map data
should give opportunity to make spatial analyses in regional, continental,
intercontinental and global levels, by downloading all needed data from one place – web
site. According to our research on the usage of GM data at international level, some
problems which make very limited its wide utilization have been recognized. The
problems as overlapping, gaps, spatial discontinuity of data, big differences in accuracy,
unknown data attributes, non topologically structured data ext., have to be new
challenges of global mapping project for the better future of global map. We hope that
all above mentioned issues to be considered for the future of global map, will be
accepted with open hands by the ISCGM and GM working groups, as positive and
fruitful suggestions for changes/corrections of Global Mapping specification.

International Conference SDI 2010 – Skopje; 15-17.09.2010
275
6. REFERENCES De Bie C.A.J.M. 2000. Comparative performance analyses of agro-systems. Enscheda.
Netherland. PhD dissertation no75. ITC.
Di Gregorio A. Jansen L., 1998. Land cove classification system: Classification concepts and user
manual. Rome. Italy. Food and agriculture organization of the United Nations.
Idrizi B., 2006. Developing of globally homogeneouses geographic data set through global
mapping project. Zagreb. Croatia. Cartography and geoinformation.
Idrizi B., 2007a. Monitoring and menagament with the environment in an international level.
Skopje. Macedonia. Seminar of Nikodinovski.
Idrizi B., 2007b. Globaly understanding the current situation and changes of environment of the
world. Skopje. Macedonia. Acta Lingua Geographica.
Idrizi B., 2010. Kosova in Global Map. Nessebar, Bulgaria. 3rd ICCGIS.
ISCGM. 2009. Global Map specification version 2; www.iscgm.org.
Tateishi R. (2005): Report of the ISCGM working group 4 on raster data development; Cairo.
Egypt. Twelfth meeting of ISCGM.
http://
www.iscgm.org
www.globalmap.org
www.cr.chiba-u.jp/
7. BIOGRAPHICAL NOTES OF THE AUTHORS
Bashkim IDRIZI, was born on 14.07.1974 in Skopje, Macedonia. He
graduated in geodesy department of the Polytechnic University of
Tirana-Albania in 1999year. In 2004, hot the degree of master of
sciences (MSc) in Ss.Cyril and Methodius University-Skopje. In 2005
he had a specialization for Global Mapping in Geographical-Survey
Institute (GSI) of Japan in Tsukuba-Japan. On year 2007, he held the
degree of Doctor of sciences (PhD) in Geodesy department of Ss.Cyril
and Methodius University–Skopje. He worked in State Authority for Geodetic Works
from May 1999 until January 2008. From October 2003 up to January 2008, he worked
as a outsourcing lecturer in State University of Tetova. From February 2008, he works
as a cartography& GIS Professor at the State University of Tetova–Tetova. He continu
with working as outsourcing lecturer in geodesy department of the University of
Prishtina-Kosova. He is the author of three cartography university books, and 56 papers
published and presented in national and international scientific conferences related to
geodesy, cartography, GIS & remote sensing.
Murat Meha is a University Professor and Deputy Head of the state
Border Demarcation Commission. He has been teaching at the
University of Prishtina - Kosovo since 1988. He has also taught for
ten years at Tetova University (FYR of Macedonia). He worked for
five years as Manager of SEO Ferronikeli, for three years as a CEO of
Kosova Cadastre Agency, in different funded EAR projects, USAID
project, KTA etc. His teaching and research concern survey, cadastre,
Land Administration and Land management. and related educational
and capacity building activities. He is currently the member of Kosova Surveyor
Association. Main publications of Mr Meha are on survey, cadastre, Land

International Conference SDI 2010 – Skopje; 15-17.09.2010
276
Administration and Land management. He published two University books, two books
for Kosovo Cadastre Agency, one book translated, and several school geographic
atlases and maps. More than 80 professional and science papers in different
professional magazines, symposiums, conferences etc. Most of those articles are
available on Internet at: FIG, ICC, Euro Geographic, WPLA, CELKCenter, FAO GIM
International etc.
Pal NIKOLLI. Graduated at the Geodesy branch of Engineering
Faculty, Tirana University. In 1987 has been nominated lecturer in
the Geodesy Department of Tirana University. In 1994 has been
graduated Doctor of Sciences in cartography field. During this period,
have taught the following subjects: “Cartography” (for Geodesy and
Geography students) and “Geodesy” (for Civil engineering &
Geology students). Actually he is lecturer and tutor of the following
subjects: “Elements of Cartography” (for Geography students), GIS
(for Geography students, diploma of first and second degree) “Interpretation of Arial
Photographs” (for Geography students, diploma of first degree), “Satellite Images” (for
geography students, diploma of second degree) “Thematic Cartography” (for
Geography students, diploma of second degree) and “Topography-GIS (for the
Geophysics students, diploma of second degree). Mr. Nikolli is the author and co-author
8 textbooks (Elements of Cartography and Topography, Elements of Cartography,
Geographic Information Systems, Processing of satellite images, Cartography, etc), 3
monographs (History of Albanian Cartography, Mirdita on Geo-Cartographic view,
etc), more than 40 scientific papers inside and outside of the country, more 40 scientific
& popular papers, etc. Has participated in several post graduation courses of
cartography and GIS outside of the country (1994, 2000 - Italy), etc.
Ismail KABASHI, was born on 08.08.1965 in Prishtina, Kosova. He
graduated in geodesy department of the University of Saraevo-Bosnia
and Hercegovina in 1992year. In 2003 year, he held the degree of
Doctor of sciences (PhD) in Geodesy engineering department of TU
Wienn–Vienna. Currently he is employee in Vermessung ANGST
GmbH ZT as project manager for Planning and execution of Cadastre
and Geomonitoring Projects. From year 2004, he works as a geodesy
engineering Professor at the University of Prishtina-Kosova. He is the author of many
papers published and presented in national and international scientific conferences
related to geodesy and engineering geodesy, as well as the author of script for students
in geodesy engineering field.

International Conference SDI 2010 – Skopje; 15-17.09.2010
277
SOME ALTERNATIVE SOLUTIONS FOR OPEN SOURCE S.D.I
Arnaud DELEURME 1
ABSTRACT
The INSPIRE directive sets up a new diffusion model of geographical information. This aims at
setting up Spatial Data Infrastructures (SDI) in each country of the European Union and using
new technologies applications and new architectures of the Internet domain.
Usually, Geographical Information was used on desktop and software, but nowadays more and
more Open source tools are available. Public institutions often resort to free tools for their
applications thanks to new users and developers communities. The Internet and new behaviors of
European citizens explain these new trends. Geographical information storage becomes more
complex with the increasing of Internet applications. That’s the reason why today we can observe
a variety of “open” technologies, tools and online applications that users can adapt according to
their needs. New licenses using this kind of applications are developed for the personal use of
Internet users.
In that sense, we notice new tools and applications for management of geographical data. Users
networks and developers communities are growing up. Hence its significant impact on Geospatial
Monitoring and new technical solutions for setting up Spatial Data Infrastructures. They show the
dynamic nature of the Web : interactive applications which are changing for the Geospatial web
(geoweb) services are installed on servers.
It is not utopian to think that SDI projects might be built using Open Source technologies and
tools. The INSPIRE directive enables an implementation of an interoperable application,
contributing to better data exchange in Europe. This presentation gives a pragmatic view of some
alternative solutions for an Open SDI.
In conclusion, the implementation of INSPIRE does not represent a technical problem; it is a
matter of organization and political decisions. It is, above all, a question of responsibility since
complete Open Source architecture is available for SDI projects.
Key words: SDI, Open Source, architecture, interoperability, client.
1. INTRODUCTION
The concept of Spatial Data Infrastructure (SDI) is relatively recent with an occurrence
at the end of 80's. It was appeared as a tool, able to centralize spatial data of a territory
for the best transmission, broadcast and sharing them to the partners of an organism. It
was existed in Australia and in the United Stated with the US FGDC: United States
Federal Geographic Data Committee.
1 Msc. Arnaud DELEURME, [email protected]
evkartenn - Geomatics services , www.evkartenn.com
Tel.: +30 693 772 63 75,
Kritis 76,TK 54646 Thessaloniki, Greece.

International Conference SDI 2010 – Skopje; 15-17.09.2010
278
In 1994, the Clinton Executive Order was involved for the needs of a system for the
coordinating geographical data acquisition and the access. It's a first step for setting up
a National SDI (NSDI) in United States.
In 1996, 11 countries responded to Global Spatial Data Infrastructure Association
(GSDI Association) survey and they recognized a project like a National SDI. GSDI
identifies 53 countries in the world with a project of NSDI (13 in Europe and 21 in
America).
The interest to set up an infrastructure like this had grown up in the world and 120
countries were at the seventh GSDI conference in Budapest in 2002.
It's a strategic question to set up a NSDI for the national spatial planning policies in
Europe. The creation of EUROGI in 1993 permitted to relay the monitoring actions.
The Open Geospatial Consortium (OGC) takes part as a partner because it's supported
now by 400 companies in the world. It defines the world interoperability geospatial
standards for a common functionality.
The INSPIRE Directive 2007/2/EC was published in the Official Journal of the
European Communities (OJEC) on 25 April 2007 and was entered into force on 15 May
2007. It aims to promote the production and the exchange of data necessary to the
various European Union policies in the wider environmental range. It proposes to
establish an infrastructure of a spatial information in the european member countries
and it bases on interoperability beyond the boundaries.
All this context explains the greatest interest to set up a NSDI in the world. It's a
response adapted by few needs to modernize the working methods for a greater quality
in the daily activities devoted to the use of digital data.
Parallel to this evolution, it's growing up new dynamics encouraged by a remarkable
increase of internet users. Communities and projects have been increased and as a result
new tools have been created on basis of open source softwares, defined by specific
licenses : GNU General Public License.
The first part of this document treats a general SDI architecture and the second part
refers to the solutions of open source softwares for the implementation of this
architecture. It will be concluded by a synthesis part about some examples of SDI which
are built on open source technologies.
2. ARCHITECTURE OF SPATIAL DATA INFRASTRUCTURE
The concept of Spatial Data Infrastructure is recent and able to store the geographical
databases. This can take place with the first new applications. In the beginning, it has
not been built with a fixed architecture but nowadays it is appeared as a regular model
of Spatial Data Infrastructure.
2.1. The concept of Spatial Data Infrastructure
Firstly, it's necessary to present what is a Spatial Data Infrastructure.
“A spatial data infrastructure (SDI) is a framework of spatial data, metadata, users and
tools that are interactively connected in order to use spatial data in an efficient and
flexible way.

International Conference SDI 2010 – Skopje; 15-17.09.2010
279
They are available by internet and they respect interoperability specifications : norms,
specifications, protocols... It permits to use services beyond a web explorer and to
combine different available services by the SDI” (sources: Wikipedia).
This framework of spatial data is interactively connected on the web and it works on
basis of interoperable system. Interoperability is an important concept that it is more
famous now with the INSPIRE directive implementation beyond the european members
boundaries.
The INSPIRE Directive 2007/2/EC was published in the Official Journal of the
European Communities (OJEC) on 25 April 2007 and was entered into force on 15 May
2007. It aims to promote the production and the exchange of data necessary to the
various European Union policies in the wider environmental range. Its transposition into
national law of each country is scheduled for May 2009.
The incorporation into the national law of the INSPIRE Directive shall take place in
each country of the European Union. It involves the rules with precision to facilitate
exchange and broadcoast of the geographical data in relation with the environmental
theme. The European Commission is working up the implementing rules with aim to
apply them uniformly in each EU country.
2.2. Architecture
Spatial Data Infrastructure (SDI) is a framework of spatial data and metadata and it
manages the data with interactively connected applications. It is composed by:
- Client applications ( spatial data viewer, catalog metadata...)
- Middleware ( cartographic engine, web services... )
- Servers (databases and geographical databases)
Figure 1. General SDI Architecture

International Conference SDI 2010 – Skopje; 15-17.09.2010
280
Sources: GRISI project, http://www.grisi.org
The SDI Architecture (table 1) is depended principally from the user needs and the uses
of their partners. That's why it is necessary to present the regular needs for setting up a
SDI :
− to collect and to acquire spatial data
− to build, to concentrate and centralize a geographical database
− inventory, catalog and storing of data
− control, harmonization and standardization of data
− development of services for queries, views, visualization and download the
spatial data
− to access the geographical data from a unique web portal
SDI architecture must be conformed of particular specifications for storing the
geographical data, for using the webservices and managing the metadata. The
interoperability capacities of a SDI are depended of the OGC norms. The web services
are:
− Web Map Service (WMS),
− Web Feature Service (WFS)
− Web Catalog Service (CS-W).
− Web Featured Service Transactional (WFS-T)
A general SDI architecture is proposed by the Open Source GeoNetwork community
with this scheme:

International Conference SDI 2010 – Skopje; 15-17.09.2010
281
Figure 2. Open source SDI Architecture
Sources: http://geonetwork-opensource.org
It identifies four different elements (client applications, interfaces, services, databases)
like the precedent scheme (figure 1) on basis of Open source softwares.
2.2.1 Client applications
They are easily available by the SDI users. They work with a simple web explorer from
the computer desktop. Generally, the SDI uses a particular environment with a specific
client application for launching the spatial data.
2.2.2 Interfaces
Interface assures a link between a client's application and a database where the spatial
data of the SDI is stored. It permits a direct access to the application of the client and it
manages the information stream from the web services (icons, raster, data, metadata...).
2.2.3 Services
They transmit the information from the database of SDI to the user. They have an
important place in the SDI architecture because they transmit information by an

International Conference SDI 2010 – Skopje; 15-17.09.2010
282
adaptable interpretation of the user queries while it uses the client's application. There is
an analysis of this query in a specific response.
3. TECHNOLOGY OF OPEN SOURCE SOFTWARES FOR S.D.I
It is more important to present the components of a Spatial Data Infrastructure in order
to discuss about the technology of open source software that is used by an S.D.I.
This part shows how the general technology is used for every functionality of an S.D.I.
In this way, it is justified that the open source technology steers from a standard
construction.
3.1 Discover the data
The client applications permit to discover the data in SDI. In relation with the last
paragraph, the client applications are composed of two parts. The first is available to the
SDI's user and these client's applications are independent of the SDI architecture. They
are helpful tools for using again the spatial data.
Other client applications are directly connected with the SDI architecture and they are
totally depended of this system.
The search of spatial data in a SDI is available with different open source softwares and
these applications are often used like :
− Mapbuilder, cartoweb, ka-Map, pmapper
− OpenLayers
They are interfaces between the user and the SDI content. A good interface permits a
better use of the SDI. There are many open source client applications using a
cartographic engine like Mapserver. Technically it is a Simple Object Access Protocol
architecture (SOAP) and it is largely used in the SDI architectures. It is a robust
technology and it is presented like the most famous application to respond at the needs
of setting up a SDI. Many editors software companies use this technology for their
cartographic engine solutions.
3.2 Exchange of metadata
A SDI proposes access to the geographical data and metadata. These metadata are
implemented in a SDI by a standard profile certified in international organizations like
the ISO (http://www.iso.org/). A lot of open source tools are ready-to-use for archiving the metadata. Their origin
appears from non-governmental organizations necessities (ONU, UNICEF...).
These tools are GeoNetwork, MDWEB, GeoSource (basis of Geonetwork), EXPIRE,
Reports...
The functionalities of these tools are very specific and they are according to the
international specifications of interoperability norms. In this case, they are available to
be connected with others external metadata catalogs for harvesting them data.

International Conference SDI 2010 – Skopje; 15-17.09.2010
283
Users and developers are strongly implicated by these open source communities. They
identify the necessities and they intervene dynamically for an evolution of the tools.
That's why, the GeoNetwork open source metadata catalog is especially completed to
the ONU needs. It is a precious software to fit out a National SDI (NSDI) for example.
3.3 Interoperability
The interoperability is a key-word in the domain of the SDI. The SDI necessities are
explained by spatial data exchange and a transversal approach. In this case, SDI must be
adapted for connections and access to the others SDI. It is not depended of the
application level : National, regional or local.
Each SDI must be interoperable with every other SDI without constraint of location,
language or framework system.
Open source softwares solutions use international standards like the OGC web services
The metadata profiles are used by the metadata catalogs where they are according to
the ISO-19115 and ISO-19119 norms like the INSPIRE implementation specifications.
The rules of metadata harvesting between the open source metadata catalogs are
conformed with the international interoperable standards : OGC web service CS-W.
A perfect compatibility of open source softwares with the international specifications,
explains exactly that more and more SDI projects are set up with these alternative
solutions and not with ''ready-to-use'' softwares.
4. EXAMPLES OF ALTERNATIVE OPEN SOURCE SOLUTIONS
The next part presents some examples of S.D.I which is built with open source tools.
The previous part was also important; however it presented the common practices for a
right open source S.D.I. The following sections make a treatment of the pragmatic
project which uses open source tools. In this way, it is justified that it is possible to
build a National or Regional SDI with an open source technology.
4.1 Open Source National SDI
Furthermore, there are organisms which prefer the enterprise packaged solutions in
response of their needs to setting up a NSDI. But also, it is remarkable to note an
important increase of open source softwares solutions that are used for the new SDI
project. It is a new tendency as this trend didn't exist a few years ago.
Effectively, more and more SDI projects use open source solutions and they are
presented at the international and national geomatics conferences. A first example is the
SDI of Venezuela (http://www.geoportal.gob.ve) which was built with open
source tools from the Representational State Transfer (REST) technology. It uses the
OpenLayers (View Service client) solution like the SDI pilot of Finland
(http://www.paikkatietoikkuna.fi )

International Conference SDI 2010 – Skopje; 15-17.09.2010
284
These two projects use the same solutions for their spatial data storage: PostgreSQL-
PostGIS. Metadata management works with GeoNetwork (the catalog metadata of the
Finnish SDI http://www.paikkatietohakemisto.fi).
In parallel with these characteristics, each project works with others open source
solutions in relation with its specific need. That's why, SDI of Venezuela uses
OpenLayers like client application and it's implemented in a Mapfish framework.
TileCache tool is added for a better management of the rasters files in the client
application. Finally, it's a Mapserver solution that is the cartographic engine with a
connection to the GeoNetwork and to the GeoServer. This tool is in the responsibility of
OGC web services generation: WMS et WCS.
Another example is the pilot NSDI of Finland. It regroups 20 themes and 50 layers of
spatial data. Technically, Shibboleth solution will manages the user rights of the SDI
and the basic CMS portal software is Liferay: This last tool is an open source solution
which manages the interface and the discovering data functionalities of the SDI.
These two examples present clearly the capacity of setting up a robust SDI with open
source solutions. They are so much robust that they could fit on National SDI.
4.2 Open source regional SDI
A part from NSDI, many regional projects exist like pilot opportunities for setting up
SDI on a territory, like a Regional SDI with new tools based on open source solutions.
It is the case of the project of Brittany's Region in France. This project is named of
GeoBretagne and it is based on open source solutions like Mapfish (Application client).
This SDI is under construction but it is available now in a source forge with the name
GeOrchestra (http://demo.georchestra.org/). As it is under construction, it will be
freely available to download from the website.
This practice to store the packages of the solution is a new trend. It is an example of
participating share with web communities.
Some European projects like eSDI Net+ in 2007 or GRISI (http://sdi.grisi.org) aim
to set up SDI. The last and the CASCADOSS project (http://www.cascadoss.eu)
use open source softwares solutions for local SDI. In Greece, the INTERREG IIIB
MEDOCC project has permitted to set up a Regional SDI
(http://www.ideunivers.eu/) on basis of only open source softwares solutions :
− a metadata catalog GeoNetwork,
− a client application based on the Mapserver engine,
− a OGC webservice (WMS) for connecting the two previous applications .
4.3 Communities and SDI projects
A few years ago there was a specific period with many new projects of open source
tools which were sponsored by users, developers and companies. They intervene

International Conference SDI 2010 – Skopje; 15-17.09.2010
285
generally for one solution that it can be a client solution and it forms an element of an
SDI architecture.
Nowadays, a new tendency is appeared with packaged solutions. In this case, it is a
global solution with a few tools that they build a software solution like a SDI project. It
proposes an easy installation of a software solution like the SDI. For example, the
easySDI project proposes to set up a SDI on basis of an universal open source tool : the
Content Management System Joomla! The EasySDI project can profit of a great
community, this is Joomla! This open source solution is based on modules in addition of
a general engine: Joomla! It aims to set up a geoportal and each module is :
− a user right management service
− a metadata catalog service
− a spatial data viewer
− a data management service(download...)
− a security management service for web services
− a data publish service for web services
This new project is an example of a new trend because the previous projects are open
source solutions that they don't cover all the SDI functionalities. For example, there
were softwares like ETL (Extract, Transform, Load) software or catalog metadata that
can manage the metadata, a spatial data viewer and webservices.
Now, a project like easySDI is more progressive because it covers more needs and it
offers a global solution for setting up a complete SDI for each territory.
5. CONCLUSION
The open source solutions are the alternative solutions for the broadcast of the products.
They are valid on the market of GIS and geomatics, that’s why many companies are
emerging from the traditional business of selling proprietary software. Indeed, they
provide exclusively a service on basis of the integration of open source solutions. It is a
new dynamic with the strong development of the “open source” community. It is
explained from a research of economics and abilities to be freed from all the licenses
and company’s rights. These rights are generally exploited by many big companies of
GIS software.
“Open source” community is more mature today with a sufficiently large variety of
tools which are supported by dynamic communities and a technical support.
Many solutions which are composed in a open source SDI architecture depend on the
user needs but it is clear that a demarcation line shows between editors softwares and
open source softwares. The first is ready to use but the second recommends a period of
development in order to be ready and totally operational.
These last solutions involve many sponsors with a both ways approach for development
monitoring and the tool customizations.
Maybe the sponsors desire this and as a result it could explain the open source success.
Generally, sponsor wants a participatory approach for setting up its SDI project.

International Conference SDI 2010 – Skopje; 15-17.09.2010
286
5. REFERENCES Arnaud DELEURME, 8th -10th July 2009, L'opportunité des outils libres au sein de l'entreprise
grecque Infodim, International Opensource Geospatial Research Symposium OGRS 2009,
Nantes, France.
Arnaud DELEURME, 27th March 2009, A variety of technologies for setting up an Inspire S.D.I:
an alternative solution, Skopje, F.Y.R.O.M.
Antti Rainio, 24th september 2009, INSPIRE Implementation – Building SDI in Finland, Nordic
GIS Conference, Stockholm.
J.V Higon, Infraestractura de datos espaciales de Venezuela, una IDE 100% de software libre,
http://www.sigte.udg.edu/jornadassiglibre/uploads/Presentacions/Comuni
cacions/a5.odp
Ian Masser, 2005, Global and Regional Spatial Data Infrastructure Initiatives, GSDI Association,
http://www.ec-gis.org/ginie/final_conference/masser.pdf.
Douglas S. Noonan, Paul M.A. Baker, and Nathan W. Moon, 2008, Open Source Software
potential index (OSPI) : Development considerations, considerations, RedHat / Georgia Tech
OSPI Project, http://www.redhat.com/f/pdf/OSSI_Research.pdf .
JRC - CSPV - University of Catalunya, 2007, Study of the socio-economic impactof the Spatial
Data Infrastructure in the Region of Catalunya: Executive summary, Barcelona, Spain. Online
report : http://www.idee.es/resources/leyes/SDI_Catalunya_Execsummary.pdf .
GRISI Project, 2008, GRISI Best practices report, Toulouse, France,
http://cap.grisi.org/index.php?option=com_docman&task=doc_download
&gid=94&Itemid=67. JRC, 2007, Draft guidelines - INSPIRE metadata Implementating rules based on ISO 19115 and
ISO 19119,
http://inspire.brgm.fr/Documents/MD_IR_and_ISO_20080425.pdf .
Wikipedia, 25 april 2009, Definition of Open Geospatial Consortium,
http://fr.wikipedia.org/wiki/Open_Geospatial_Consortium .
Wikipedia, 25 april 2009, Definition of Spatial Data Infrastructure,
http://en.wikipedia.org/wiki/Spatial_data_infrastructure .
OGC, 25 april 2009 Definition of the standards OGC,
http://www.opengeospatial.org/standards .
Wikipedia, 26 april 2009, Definition of Global Monitoring for Environment and Society,
http://en.wikipedia.org/wiki/Global_Monitoring_for_Environment_and_
Security
GINIE, Geographic Information Network in Europe, IST-2000-29493, http://www.ec-
gis.org/ginie/doc/PG_SDI_fr.pdf
6. BIOGRAPHICAL NOTES OF THE AUTHORS
Arnaud Deleurme, was born in France and lives in Thessaloniki (Greece).
He is a graduate of the Geography Department of the University of High-
Brittany Rennes 2 in France. He also is a graduate of the Department of
Planning and Regional Development of the University of Thessaly
(Volos) in Greece. His graduate degrees include a Master of “GIS and

International Conference SDI 2010 – Skopje; 15-17.09.2010
287
Cartography” (University of Rennes 2, France) and a Master of Rural Planning
(University of Thessaly).
He has worked in different public authorities in France for setting up GIS applications.
He was an assistant of the Project Manager for the GRISI European Project and he
worked about different European projects in relation with the interoperability of the
spatial data like GRISI, PYRED in the Chamber of Commerce of Gers in France (CCI
Gers).
He is specialized in geomatics with the webmapping technologies on basis of the Open
Source tools. He has worked in a greek company in Thessaloniki (Greece) for setting up
Geographical On-line applications. Now, he is a freelancer as a Geomatics consultant
(evkartenn) for the Balkans areas with a particular interest in Open source geospatial
technologies. He furnishes advices and consultancy services for implementation of
geographical applications in public authorities (universities...) and private organizations.
Its activity as a consultant permits to make training sessions and cartographic works in
relation with the personal needs of efficients solutions and spatial data management.

International Conference SDI 2010 – Skopje; 15-17.09.2010
288
GEOPORTAL SOLUTIONS BASED ON ESRI GIS PLATFORM
IN SOUTHEAST EUROPE
Dejan KRSTEVSKI 1
ABSTRAKT
The concept of spatial data infrastructure (SDI) has emerged and continues to advance as a
framework for organizing institutions and technology to support such geospatial information
sharing. SDIs—constructed with building blocks that include enabling policy, regulatory
permissions, standards, organizational structures and workflows, technical architectures,
stakeholder geospatial data, metadata services, and other constituent elements—are now being
implemented within and among organizations and governments throughout the world.
ESRI has long focused its technology development path on the creation of solutions that
contribute to building and positioning the world's geospatial information resources for responsible
and effective use. Its geoportal technology in particular has evolved to provide a technical
mechanism for posting, discovering, and exchanging existing geospatial information resources in
support of both broadly based SDIs and more narrowly framed local and organization-specific
data-sharing communities.
As envisioned by ESRI, the role of a geoportal is to connect geospatial data producers and users
by enabling producers of geospatial information resources to create and post metadata records
(citations describing their information resources) and enabling users of geospatial information
resources to search for and discover metadata records that cite the particular resources that will be
helpful to them.
Overall, the ESRI vision is informed by the view that a geoportal is not only a mechanism for
connecting parties and information but also a crossroads of technical diversity that needs to be
interoperable in the sense that it enables the posting, discovery, and access of information
resources regardless of underlying structures. A range of standards-based metadata formats and
Web communication protocols needs to be supported, and within the geoportal itself, most
mapping formats and projections should be viewable and graphically combinable.
The Republic of Croatia and Republic of Montenegro have simplified access to countrywide
geographic data through an online geoportal, a type of Web site that makes it easier for citizens,
government, and private-sector users to find and access vast quantities of geographic information
and related services.
Key word: INSPIRE, ESRI, NSDI, GIS portal
1. INTRODUCTION
This paper describes how ESRI's ArcGIS® products and solutions-in concert with select
technologies developed by ESRI business partners in Europe-provide the technical
building blocks required to activate the European Union's (EU) vision for a European
1 Dejan Krstevski, [email protected]
Institution, www.gisdata.com
Tel.: +389 2 3135-578, Gsm.: +389 70 276-615, Fax: +389 2 3135-578.
Str. Koco Racin, 13, 1000 Skopje, Macedonia.

International Conference SDI 2010 – Skopje; 15-17.09.2010
289
geospatial information sharing infrastructure. The information presented is intended to
provide a basic overview and frame of reference for further technical inquiry and
discussion.
The generic concept of spatial data infrastructures (SDI) and the EU vision for a
European spatial data infrastructure are both outlined at the outset of this paper. An
overview of ArcGIS SDI-building software and solutions, including ArcGIS extension
technologies developed in Europe that have specific applicability to the EU vision, is
presented in that context.
The term spatial data infrastructure was coined in 1993 by the U.S. National Research
Council to denote a framework of technologies, policies, and institutional arrangements
that together facilitate the creation, exchange, and use of automated geospatial data and
related information resources across an information-sharing community. Such a
framework can be implemented narrowly to enable the sharing of geospatial
information within an organization or more broadly to enable the sharing of geospatial
information at a national, regional, or global level. In all cases, an SDI will provide an
institutionally sanctioned, automated means for posting, discovering, evaluating, and
exchanging geospatial information by participating information producers and users.
A European SDI—known formally as the Infrastructure for Spatial Information in
Europe (INSPIRE)- is envisioned and chartered by an EU directive that binds EU
Member States in a common SDI-building effort.
The underlying INSPIRE concept is for an Internet-accessible infrastructure of
technologies and permissions that will tie European geospatial information producers
and users together in a single geospatial information-sharing community to improve
decision making and operations at all levels of endeavor in service of a productive and
sustainable Europe. The target users of INSPIRE include European policy makers,
planners, and managers and their organizations along with the general European public.
2. ESRI GEOPORTAL TECHNOLOGY
Recent years have witnessed the rapid development and expanding use of automated
mapping, geographic information system (GIS), and spatial data communication
technologies and standards.
Such progress—along with the associated growth in geospatial data collection activity
by organizations and governments throughout the world—has helped create a global
reservoir of electronically enabled geospatial information that has real potential for
improving decision making and operations at all levels of endeavor in service of a
productive and sustainable future for everyone.
To help realize this potential, geospatial information resources must be positioned both
institutionally and technologically for wide discovery, exchange, and use.
The concept of spatial data infrastructure (SDI) has emerged and continues to advance
as a framework for organizing institutions and technology to support such geospatial
information sharing. SDIs—constructed with building blocks that include enabling
policy, regulatory permissions, standards, organizational structures and workflows,
technical architectures, stakeholder geospatial data, metadata services, and other
constituent elements—are now being implemented within and among organizations and
governments throughout the world.
ESRI has long focused its technology development path on the creation of solutions that
contribute to building and positioning the world's geospatial information resources for

International Conference SDI 2010 – Skopje; 15-17.09.2010
290
responsible and effective use. Its geoportal technology in particular has evolved to
provide a technical mechanism for posting, discovering, and exchanging existing
geospatial information resources in support of both broadly based SDIs and more
narrowly framed local and organization-specific data-sharing communities.
As envisioned by ESRI, the role of a geoportal is to connect geospatial data producers
and users by enabling producers of geospatial information resources to create and post
metadata records (citations describing their information resources) and enabling users of
geospatial information resources to search for and discover metadata records that cite
the particular resources that will be helpful to them.
Further—and importantly—ESRI envisions that the role of such a portal is also to
provide the means for users to preview and access geospatial information resources
cited by the metadata records, regardless of where or how those information resources
are maintained. Figure 1 illustrates this basic concept.
Figure 1
A Geospatial Information Portal as a Federated Service
ESRI's vision assumes that the discoverable information resources cited in the geoportal
will likely consist of a wide range of information resource types. These may include not
only Web-accessible maps and GIS application services but also physical maps,
documents, and other information resource types that are not necessarily Web
accessible.
ESRI's vision also assumes that those cited and discoverable information resources that
are Web accessible will be made available to portal users by their producers in a variety
of forms and will use a variety of communication protocols. A geoportal's functionality,
therefore, needs to anticipate and support a variety of technologies and standards.

International Conference SDI 2010 – Skopje; 15-17.09.2010
291
Overall, the ESRI vision is informed by the view that a geoportal is not only a
mechanism for connecting parties and information but also a crossroads of technical
diversity that needs to be interoperable in the sense that it enables the posting,
discovery, and access of information resources regardless of underlying structures. A
range of standards-based metadata formats and Web communication protocols needs to
be supported, and within the geoportal itself, most mapping formats and projections
should be viewable and graphically combinable.
ESRI's approach to supporting the portal-based exchange of geospatial data resources
via the Web is based on an understanding that every portal will operate in unique
circumstances and will be developed to address implementation-specific objectives.
In line with this basic understanding, ESRI's root concept has been to create generic
software consisting of standard core functionality organized into a framework of
components that are configurable by design to address each unique circumstance—and
to complement that software with optional technology transfer services intended to help
implementing organizations configure both the software and supporting architectures in
a way that addresses their own specific needs.
The software product ESRI has developed in the context outlined above is packaged and
supported by ESRI as a core ESRI product on the standard ESRI maintenance-based
model.
The software itself consists of a suite of Web-based and desktop software components
collectively called the ArcGIS Server Geoportal extension. This geoportal-building
software provides a generic functionality base that, by design, anticipates
implementation-specific configuration in order to enable conformance to the specific
environment where it is being installed, creation of a host-specific look and feel for the
interface, and activation of host-selected functionality options.
In addition to standard annual maintenance purchased with the product, ESRI provides a
number of service options as follows: a developer support package designed to provide
remote information and advice to licensees who seek to modify underlying software
code to meet requirements that may not have been anticipated by the standard software
package, a custom-scheduled on-site installation training and technology transfer
program that supports the implementation of underlying architectures and helps with
implementation-specific ArcGIS Server Geoportal extension configuration using out-of-
the-box software.
3. ARCGIS SERVER GEOPORTAL EXTENSION FUNCTIONALITY
Functionality for End Users
The components of the ArcGIS Server Geoportal extension work together and
individually to enable end users to:
Discover geospatial data resources produced by others—The ArcGIS Server
Geoportal extension implements functionality that enables geoportal users to discover
and select information resources that are of particular interest to them. Searching uses
term-based criteria entered by the user and geographic location criteria the user
designates on a map.
The results of any ArcGIS Server Geoportal extension search are displayed as summary
statements derived from the metadata records citing each found information item. The
user can then elect to display more detailed descriptions of each information item or the
full metadata record itself.

International Conference SDI 2010 – Skopje; 15-17.09.2010
292
From either the summary or detailed results displays, the ArcGIS Server Geoportal
extension includes functionality that enables the user to link directly to the Web site that
hosts the cited information item if that option is made available by the information item
publisher, preview the information item if it is a "live" map available from a service
maintained by the information item publisher, or download the information item from
within the portal if that option is made available by the information item publisher.
Preview geospatial data resources produced by others—The ArcGIS Server
Geoportal extension provides inline map service preview functionality that enables
users to discover and view mapped data maintained on Web-accessible map services
(live maps) without launching a map viewer. This ability to preview a live map is
provided by a Preview button that automatically appears together with the text
description of each live map.
The information the ArcGIS Server Geoportal extension requires to enable this
capability is included in validated and published metadata records—if the cited
information item consists of live data or maps and if it is maintained as described in the
metadata on a Web-accessible server.
If users elect to examine information items other than live data or maps (for example,
document files or mapped data viewable only by using an application maintained on the
publisher's Web site), they can link to the Web site where a data item is maintained if
that opportunity is provided by the publisher.
Make maps that combine geospatial resources produced by others using a variety
of map viewer technologies—The ArcGIS Server Geoportal extension provides the
capability for the implementer to plug in a map viewer technology of choice to provide
end users with mapmaking functionality that integrates with other ArcGIS Server
Geoportal extension functions. Map viewer technologies that can be used include Java™
Application Development Framework (ADF), JavaScript™, Flex™, and Silverlight™, to
name a few.
The integration of any of these map viewers enables end users to combine mapped data
from different live map sources they discover using ArcGIS Server Geoportal extension
functionality, then view the composite map during the same geoportal session. The
functionality available to the end user will depend on the specific map viewer that has
been selected and integrated.

International Conference SDI 2010 – Skopje; 15-17.09.2010
293
Figure 2
Default ArcGIS Server Geoportal Extension Search Interface
Obtain geospatial data resources produced by others—Any information item that is
cited in metadata published on a geoportal based on the ArcGIS Server Geoportal
extension is obtainable if the publisher of the information item makes it available. The
information items can be obtained using the option to link externally to the publisher's
Web site or the option to download the data from within the portal interface itself via an
internal link provided by the data producer.
Search and obtain geoportal metadata records directly from external
applications—The ArcGIS Server Geoportal extension includes a REST API that
enables external access to geoportal metadata records. Such external access provides
users with the ability to access the metadata records from a variety of applications such
as RSS readers, content management systems such as SharePoint or Joomla, and wikis.
Precoded geoportal search and discovery tools have been created and are packaged with
the ArcGIS Server Geoportal extension and available separately from the ESRI Web
site for insertion into ArcGIS Explorer and ArcMap™ desktop applications.
Receive automatic notification of new geospatial data resources that meet
preestablished criteria—The ArcGIS Server Geoportal extension functionality
provides end users with the ability to subscribe to a GeoRSS feed that automatically
notifies the user whenever a metadata record describing a new geospatial data resource
that meets user-specified criteria is published in the geoportal.
Expose one's own geospatial data resources for discovery by others—The ArcGIS
Server Geoportal extension functionality enables Web-based geospatial information

International Conference SDI 2010 – Skopje; 15-17.09.2010
294
producers to publish metadata describing their information if they are authorized to do
so by a geoportal administrator.
Publishers on a geoportal that is built using the ArcGIS Server Geoportal extension
have three basic options for posting their metadata. They can create their metadata using
ArcCatalog™ or an independent XML editor and upload the records to the target
geoportal, create their metadata and post it using an online metadata entry form
integrated into the geoportal, or make their metadata available on a Web server and
register for external harvesting by the geoportal's metadata harvesting tool.
The ArcGIS Server Geoportal extension includes out-of-the-box functionality that can
be engaged to automatically validate submitted metadata records against a variety of
standard metadata formats (Federal Geographic Data Committee [FGDC] Best
Practices, Dublin Core, ISO 19139/19119 Web Services, ISO 19139/19115 Data Sets,
and ESRI ISO) and profiles (North American Profile and Infrastructure for Spatial
Information in Europe [INSPIRE]). In addition, custom metadata formats can be
created, and standard metadata formats can be modified or detailed for use and
validation. Publishers are informed of metadata records that fail this automatic
validation. The ArcGIS Server Geoportal extension also provides functionality that
enables a geoportal administrator to review and approve all technically validated
metadata records before they become accessible for search and discovery.
Register as a portal user—ArcGIS Server Geoportal extension functionality provides
the option for integration with external LDAP authentication solutions to enable users to
register. By design, ArcGIS Server Geoportal extension functionality does not require
user registration for basic search and search results viewing. The option to register via
LDAP solutions, however, is provided to enable the managers of a geoportal to
customize access to advanced functionality.
Functionality for Geoportal Management
Two principal management roles are anticipated by ArcGIS Server Geoportal extension
functionality:
Administrator—A suite of ArcGIS Server Geoportal extension functionalities has been
designed for the exclusive use of a geoportal administrator or manager. The
administrator functionality enables the person or persons who manage a geoportal to
approve or disapprove metadata prior to its release and undertake other related aspects
of portal operations. Administrators are required to be registered users, and
administrator function options are provided on the administrator's home page upon login
based on the administrator's User-ID and password.
Publisher—Publisher functionality enables publishers to post and manage their
metadata records using special ArcGIS Server Geoportal extension functions available
only to them. Publishers are required to be registered users, and publisher function
options are provided on the publisher's home page upon login based on the publisher's
User-ID and password.
Functionality for Geoportal Data Security
The ArcGIS Server Geoportal extension provides functionality that enables
authentication of users via most LDAP solutions and the authentication options those
solutions provide. In addition, the ArcGIS Server Geoportal extension provides the
option for simple authentication of a single portal administrator (with access to all
geoportal functionality) if that is preferred.
Functionality for Geoportal Interoperability
A fundamental objective of the ArcGIS Server Geoportal extension is to provide a
means for referencing and accessing geospatial information that is distributed and made

International Conference SDI 2010 – Skopje; 15-17.09.2010
295
available using a variety of technologies. To this end, ArcGIS Server Geoportal
extension functionality supports all principal metadata standards and electronic data
communication standards. It also has capabilities that integrate data made available in a
large variety of formats. Figure 3 indicates the principal points of communication and
the associated data communication standards, protocols, and formats that are supported.
Figure 3
ArcGIS Server Geoportal 9.3.1 Extension Standards Support
Functionality for Interface Customization
The ArcGIS Server Geoportal extension anticipates customization and
internationalization of the user interface elements (including both graphics and text) and
implementation-specific configuration to a basemap, geocoding service, and other
services. In addition, ArcGIS Server Geoportal extension components are easily
configurable to fit together with supporting software and database elements within the
host's unique architecture.
4. REQUIRED TECHNOLOGY
A geoportal needs supporting hardware and software in its underlying operational
environment.
The specification of hardware requirements for support of a geoportal will necessarily
be tied to the existing architecture of the hosting organization and the intended level of
use. In general, however, common practice for running all geoportal software
components is to use a minimum of two dedicated servers with Internet connectivity
along with at least one desktop computer with Internet connectivity. In addition,
provision of database servers within the hosting organization will be required to serve
data maintained by the organization itself. Networking hardware and capacities will be
dependent on the intended scale of operations for the geoportal and on the size and
location of the stakeholder community.Underlying software required to support a

International Conference SDI 2010 – Skopje; 15-17.09.2010
296
geoportal built with ESRI's ArcGIS Server Geoportal extension is detailed in the online.
Organizations contemplating implementation of a geoportal often already have licenses
for much of the needed underlying software. Nevertheless, a review of an organization's
existing software and architecture, together with a review of the specific software
required to support a geoportal, is recommended to determine the level of effort and
expense that will be involved in preparing for implementation of a geoportal.
A geoportal is of no use without data.
To serve its purpose, a geoportal needs accessible GIS data services and high-quality,
complete metadata that describes those services. Data services and other GIS data items
must be maintained as described by the associated metadata. This means that data and
data services must be cataloged systematically according to a metadata standard and
schema designated by the geoportal host organization or stakeholder community. This
data cataloging and maintenance work is ongoing, and the associated costs reflect the
amount and type of data that is published using the geoportal. Since a geoportal is really
about data, this data inventorying and maintenance element of geoportal support is the
single most important investment required. If the metadata describing data is faulty, and
if the data described is out-of-date, wrong, or only available sporadically, a perfectly
functioning geoportal will be of little use. Though data can be maintained and
associated metadata can be created and published on a geoportal by entities other than
the portal's host organization (depending on the designated breadth of the stakeholder
community), the host organization will be responsible for reviewing metadata prior to
publication to ensure its completeness and conformity to established standards and
schemas. Prior to geoportal installation, it is recommended that a host organization's
management conduct an inventory and review of the data it currently maintains (and
that its stakeholder community maintains) in order to understand the level of effort that
will be involved in installing and maintaining a viable and useful geoportal.
A geoportal needs staff support.
Significant staff time is required to maintain and use a geoportal. Geoportal
management requirements will vary depending on a hosting organization's intentions
and the extent to which the COTS functionality of the geoportal is engaged (i.e.,
uniquely customized geoportal code will require more staffing to support it than a
COTS-based geoportal). In all cases, however, people will be needed to perform the
following roles:
• Chief information officer
• Geoportal operations manager
• Geoportal content administrator
• Geoportal metadata publishers (external and internal)
• End users
These roles need to be formalized in the context of each hosting organization's staffing
arrangements and with a view toward the breadth and frequency of geoportal use. The
costs of dedicating time for the geoportal management and user responsibilities can be
balanced against the efficiencies realized by a fully functioning mechanism for
discovery and exchange of geospatial information and the extent to which that can
support the central mission and workflows of the organization itself.
A geoportal needs a training program.
A formal training program for geoportal managers and users is essential to success.
Such a program will consist of both installation-phase technology transfer and the
ongoing training of general users. Installation training for geoportal managers and

International Conference SDI 2010 – Skopje; 15-17.09.2010
297
operations personnel is normally three to five days. User training is normally one day at
the outset, with refresher sessions over time. This basic training program may be
supplemented by training in cataloging
(metadata creation) or other specialized geoportal-related activities. Promotion of
acceptance for the geoportal at the initial stages—including provision of clear direction
on how management intends the geoportal to support the work of stakeholders in the
context of their workflows—can be effectively undertaken as part of a formal training
program as well.
In summary, the following basic management actions are recommended prior to
installing a geoportal in an organization:
• Establish an executive charter or sponsorship.
• Designate a base of operations.
• Authorize funding.
• Plan a prelaunch user outreach strategy.
• Review the required technology environment.
• Review the required data environment.
• Provide required staffing.
• Anticipate technology transfer and training.
Each organization contemplating the installation of a geoportal will need to tailor its
decision-making and preparation activities to its own policies and practices. This list of
recommended actions is intended to introduce such organizations to a scope of generic
management issues that may inform their decision making and program for geoportal
installation and operation.
5. SUGGESTIONS FOR SUCCSESFUL GEOPORTAL
IMPLEMENTATION
Clear objectives based on anticipated business processes and an anticipated user
population are essential to a successful geoportal implementation. The objectives are
most effective when developed at a high level and independently of the question, What
can the ArcGIS Server Geoportal extension software do? When objectives are clear, the
capabilities of the ArcGIS Server Geoportal extension can be understood in the context
of the workflow-related benefits it can provide, and it will be evident whether a
geoportal built with the ArcGIS Server Geoportal extension can help provide the
solution that is sought.
Fundamental to a successful ArcGIS Server Geoportal extension deployment is a clear
understanding of geoportal hosting and management requirements at the outset of
implementation efforts. Such requirements include underlying host system software and
hardware infrastructure, the technical personnel and organizational charter for
supporting it, and the dedication of appropriate management resources to maintain
geoportal content both at the installation stage and during operations. The availability of
the proper support resources and the willingness and funds to support them within an
organization are essential to the successful development and hosting of a geoportal by
an organization.
A geoportal implementation is accomplished atop a variety of essential building blocks
that provide the underpinning for the successful installation, configuration, and

International Conference SDI 2010 – Skopje; 15-17.09.2010
298
operation of the software. As is true with any geoportal, a geoportal based on the
ArcGIS Server Geoportal extension can only succeed when these elements are in place:
Organizational sponsorship is required to initiate consideration of a geoportal and
development of a plan for implementation.
People must be in place and trained appropriately to manage and grow the geoportal.
Data is required to support ArcGIS Server Geoportal extension functions and must be
prepared and available in a form and technical circumstance that feeds the geoportal
seamlessly.
Underlying hardware/software infrastructure must be in place and configured
appropriately to support effective use of the portal.
Funds must be in place or budgeted to support the ongoing operation of the portal.
These principal elements, along with a plan for the scheduling and critical path
sequencing of their implementation, represent the scope of endeavor that an
organization will necessarily undertake when implementing and operating a successful
geospatial information portal based on the ArcGIS Server Geoportal extension.
6. ESRI-BASED SOLUTIONS IN SOUTHEAST EUROPE TODAY
National Geo-portal for Croatia
The Croatian State Geodetic Administration (SGA) is responsible for establishing a
National Spatial Data Infrastructure (NSDI). The establishment of the NSDI will
promote the development of national databases and their connection into a single
information system that will allow agencies to use the data effectively and complement
it with their own data. To fulfill these requirements, SGA is establishing a geoportal.
Supported by the Government and based on state of art concept & technology, SGA
geoportal initially provides five data sets, metadata service and many functionalities.
The first release of SGA's geoportal includes the Central Registry of Spatial Units, a
1:5,000-scale orthophoto map, the 1:5,000 scale Croatian basemap, cadastral maps in
raster form, and the Database of Permanent Geodetic Control Points.

International Conference SDI 2010 – Skopje; 15-17.09.2010
299
Figure 4: GPT-Based SGA Geoportal Geospatial Information Search Page
(Bačić, 2007)
JIS – Joint Information System of Land Registry and Cadastre, is planned to be
introduced in the 2nd phase of Geoportal, while the realization of first inter-institutional
NSDI based networking of systems is scheduled for mid 2009. SGA geoportal will be
public driver and window of Croatian SDI and central tool for pilot projects and further
development.
The Republic of Croatia has simplified access to countrywide geographic data through
an online geoportal, a type of Web site that makes it easier for citizens, government, and
private-sector users to find and access vast quantities of geographic information and
related services. The geoportal has already proven its value as an essential component of
the country's Organized Land Project, which streamlines and regulates the real property
registration of land in the republic. By making data more accessible, the average time
for processing changes to land titles has dropped from a 400-day average to 37 days.

International Conference SDI 2010 – Skopje; 15-17.09.2010
300
Figure 5: Geoportal Geospatial Information Sample Search
(http://www.dgu.hr, March 2009)
Gis Web portal for Montenegro - Real Estate Administration Department(READ)
Objective of Project Description is to give guidelines for the design and development of
GIS Web Portal for the READ. GIS Web portal is the application solution that
facilitates exchange of data between READ and the users of its services.
Following regulation forms the basis for this project description:
- Law on national survey and real estate cadastre („Službeni list RCG“, br.
29/07),
- Strategy for development of information society of Montenegro,
- Midterm program for national survey and establishment of real estate cadastre
for the period 2008. – 2013.
- Instruction on digital plans, READ, 2004.
- INSPIRE directive ( L 108 Volume 50, 25.04.2007.)
As a methodology for development of project specification, ISO standard Reference
Model for Distributed Information Systems RM-ODP (Reference Model – Open
Distributed Processing) is used. This model aligns with the architecture of proposed
system, following the fact that system is highly distributed. RM-ODP is standardized by
ISO and accepted by OpenGIS Consortium. Model describes system through so called
views. Following views describe the system:
• Enterprise View – where the business logic of the system is described, along
with organization and interaction between actors in the system. procedures for
data exchange as well as general layout of GUI (Graphical User Interface) of
system web pages.
• Information View – describes structure and statical data model for the data the
Portal operates upon.
• Computational View – serves the purpose of describing the system as a
composition of distinct functionalities.
• Technology View – defines mapping of functionalities of the Portal to different
hardware and software components.
Figure 6 shows the architecture of the system. System is organized in four layers:
• Client layer – the application that user uses to communicate with the system,
• Presentation layer – the set of applications that generate controls for the client
layer,

International Conference SDI 2010 – Skopje; 15-17.09.2010
301
• Service layer – the set of services that define business logic for the system, that
is the elementary services that are available to the user and other components
in the system,
• Data layer – represents the system for persistence of data that portal operates
upon.
Besides that, three components represent important integral part of the solution:
• System for management of geospatial data and cartographic processing –
represents the set of tools needed for seamless input of various data in the
system and quality assurance, but also the representation of data through
advanced cartographic techniques.
• External services – system should be capable to consume geospatial web
services served from the external users, and make them integral part of the
whole system.
• Services to external consumers – the system is part of the overall e-government
system of Montenegro, and therefore should enable access to geospatial
services for other government applications through geospatial web services.
Figure 6 - Architecture of the system
Client Layer
Client layer represents an application that client uses to communicate with the system.
GIS Web Portal is based on web interface, meaning that the client layer is fully based
on modern web browsers such as Internet Explorer, Firefox, Opera etc. Client layer is
fully based on HTML and JavaScript and does not require any plug-in.
Due to high interactivity of web pages that show dynamic maps, client layer makes
extensive use of AJAX ((Asinchronous JavaScript and XML) techniques in order to
eliminate the need for the whole page to refresh upon each request to the server. These
techniques enable partial page refresh and reduces communication with the server to the
minimum.

International Conference SDI 2010 – Skopje; 15-17.09.2010
302
Presentation Layer
Presentation layer represents set of applications that generate controls for the client
layer. Presentation layer uses standard HTTP communication mechanism with the client
layer. Presentation layer communicates with the service layer through SOAP web
services, enabling simple interaction and ability to expand solution by introducing new
functionalities in the form of services.
Presentation layer is composed of two main web applications:
• User Pages are composed of three main web pages:
- Introduction page – contain basic information about Portal, links to
other pages, interface for registering and logging users, as well as
language selection (Montenegrin or English).
- Map Browser – contains interactive map of Montenegro with required
layers and tools to navigate and query map,
- Metadata Browser – contains tools for browsing/searching metadata
for datasets and services, as well as visual map view of the metadata.
This interface enable selection of appropriate datasets and services
and their display on Map Browser.
Apart from these basic pages, User Pages application contains pages for loging
existing users and registering new users.
• Administration Pages are composed of pages for managing users and
pages for managing metadata.
Presentation layer is based on Java Server Pages (JSP) technology and should be
implemented on Tomacat open source Servlet container.
Service Layer
Service layer represents the set of services that define the business logic of the system,
that is the elementary services that available to users and the other components of the
system. Following services are implemented as part of GOS We Portal:
• Security Service – provides the security of all other services from unauthorized
access. Service is based on WSS (Web Security Service) standard.
• Authorization Service – provides authorization of users and implementation of
all the policies when users access all the other services within the system. This
service is based on WAS (Web Authorization Service) standard.
• Map Service – provides rendering of interactive maps and query functionality,
as well as implementation of logic for map navigation and data searching.
Service is based on OGC WMS standards and ArcGIS Server SOAP Map
Service. WMS supports GML Simple Feature Profile as a format for serving
vector data.
• Geodata Service – provides direct access to the geospatial data through web
service interface, as well as data querying and update of locally stored data.
Service is based on OGC WFS and WCS standards. WFS supports GML
simple feature profile as a format for vector data.
• Metadata Catalog Service – provides access, search, browsing, editing and
maintenance of metadata. Service is based on OGC CS-W standard.
Data Layer
Data layer represents the system for storage all the data that Portal operates. There are
three main types of data that comprise this layer:
• Geospatial data – represent READ data that READ has decided to make
available to the external users.

International Conference SDI 2010 – Skopje; 15-17.09.2010
303
• Metadata – represent data that describe READ data, but also the the data of
other organizations that want to make them available for the users of the GOS
Web Portal.
• User Data – represent data needed for user authentication. User identification
data is stored here, but also data that describe policies for service and data use
by user groups.
.
Figure 7 - Introduction page layout
Data Management and Cartographic Processing
System for management of geospatial data and cartographic processing represent the set
of tools needed for seamless input of various data into the system and data quality
assurance, but also the representation of data through advanced cartographic techniques.
Consuming External Services
System is capable of consuming geospatial web services published and served by
external users, and make the available as integral part of the system. For users that make
their services available through the portal, Portal enables input of metadata. External
services can be embedded in map services as layers of the interactive map.
Portal is capable for consuming all the standard OGS web services (WMS, WFS,
WCS), as well as ArcGIS Server SOAP services.
Providing Services for External Users
System represents a component of the overall e-government system of Montenegro, and
therefore should provide integration with other government services and applications
through geospatial web services. Such services are secured through Security Service in
order to enable access only to authorized users.
Portal is capable of serving all the standard OGS web services (WMS, WFS, WCS), as
well as ArcGIS Server SOAP services.

International Conference SDI 2010 – Skopje; 15-17.09.2010
304
Figure 8 - Advanced metadata search
7. CONCLUSIONS
To be successful for a hosting organization, a geoportal requires clear executive
sponsorship. Both the dedication of resources required at the outset for geoportal
installation and the dedication of resources required for the ongoing vitality and growth
of the geoportal will be highly dependent on such sponsorship. Likewise, the ready
adoption and use of the geoportal by staff members to support their daily workflows and
realize associated efficiencies will be greatly encouraged if management backing is
understood.
To provide clear executive sponsorship, the host organization's management must first
be convinced of the value of hosting a geoportal by reviewing the breadth of
requirements and outcomes that it can expect. This paper provides a checklist of issues
that have a bearing on the adoption and maintenance of a geoportal by an organization
and is intended to provide a starting point for management.
8. REFERENCES
• Bačić, Z 2007, Presentation - Croatian Geoportal - Cornerstone of Groatian
NSDI, GDUC 2007, Opatija, Croatia
• http://www.dgu.hr, March 2009
• Pichler, G 2007, ESRI® Technology and INSPIRE, An ESRI ® White Paper,
ESRI Europe, Rotterdam, Netherlands
• http://geoss.esri.com/geoportal/catalog/main/home.page
• http://www.esri.com/software/arcgis/geoportal/index.html
• http://www.esri.com/library/whitepapers/pdfs/

International Conference SDI 2010 – Skopje; 15-17.09.2010
305
8. BIOGRAPHICAL NOTES OF THE AUTHORS
Dejan Krstevski,. Bachelor of Science in Department for
computers science, informatics and automatization.During
his 9 years professional engagement, in GISDATA DOOEL
Skopje, he accomplished different working tasks, starting as
a GIS Specialist, via GIS web application develop to the
actual position of Senior GIS Consultant/Project manager in
GISDATA. He attended many local, international and
European conferences regarding implementation of GIS in
various markets and presenting achievement of projects done
by GISDATA.
At the position of Senior GIS Consultant/Project Manager in GISDATA, he is
providing technical support for clients, developing solutions, system planning,
supervising, project development and GIS Trainer for ESRI instructor-led training
courses. He is also working on business development and increasing of public
awareness about the importance of the spatial information for better management, better
decision making and development.

International Conference SDI 2010 – Skopje; 15-17.09.2010
306
HOMOGENEOUS COORDINATE FRAMES VS. EXISTING
INHOMOGENEOUS DATA
Gerhard NAVRATIL 1
Ismail KABASHI 2
Michaela RAGOSSNIG-ANGST 3
ABSTRACT
Nowadays, the vast majority of data are captured with Global Navigation Satellite Systems
(GNSS) or remote sensing. Both methods use homogeneous reference frames, i.e., there are no
local distortions in the geometry of the reference frame implementation. This is different from
data collected previously. Traditional data capture for mapping (including cadastral mapping) is
based on terrestrial reference frames based on local observations. Although these observations
were linked to each other in networks and contradictions eliminated with suitable mathematical
methods, local deviations were inevitable. As a result these data are based on inhomogeneous
reference frames.
Combining data in a homogeneous reference frame with data in an inhomogeneous one shows the
deviations between the reference frames. These deviations need to be eliminated in order to
provide a consistent reference frame. In this paper we first show the historic reasons for the
inhomogeneities using the Austrian case as an example. Then we present some approaches to deal
with the deviations.
Key word: GNSS, Coordinate Frame, Cadastre, Inhomogeneity
1. INTRODUCTION
The problem of databases containing data captured during a long time is keeping a unique
coordinate frame. Coordinate frames in the 19th and 20th century were typically defined by
reference points. Their coordinates were determined by ground surveys (typically triangulation or
trilateration) and astronomical observations. Approximate homogeneity was achieved by least
squares adjustment. This, however, was not always possible, e.g., in Austria. Today coordinate
frames are realized by Global Navigation Satellite Systems (GNSS) like the American GPS or in
future the European GALILEO. This difference creates problems when converting data from one
system to the other. Local inhomogeneities have to be addressed and compensated. Typical
1 Gerhard NAVRATIL, [email protected] Vienna University of Technology, Institute for Geoinformation and Cartography, A-1040 Wien, Gusshausstr. 27-29 2 Ass.Prof.Dr. Ismail Kabashi, [email protected], [email protected] University Prishtina, Department for Geodesy, Faculty for Civil Engineering und Architecture Vermessung Angst ZT GmbH, A-1020 Wien, Mayergasse 11 3 Michaela Ragoßnig-Angst, [email protected] Vermessung Angst ZT GmbH, A-1020 Wien, Mayergasse 11

International Conference SDI 2010 – Skopje; 15-17.09.2010
307
approaches to deal with this problem include triangulation with affine transformation in each
triangle and residual grids. Each of these approaches has its own strengths and weaknesses, which
we discuss in the paper.
In this paper we present examples from Austria showing the effect of the difference for
engineering tasks like building tunnels. These situations have been deal with and we show how it
was done. We then discuss other possible solutions and show their advantages and problems. We
then extend the discussion to whole datasets like cadastral maps, which are basic building blocks
for Spatial Data Infrastructures. Surveys for these data sets are also typically conducted using
satellite technology, i.e., using GPS. This again leads to the problem of inhomogeneous data sets.
The problem of inhomogeneous reference frames should therefore be addressed as early as
possible to achieve consistent base data for both, data updates and external use of data for
engineering projects.
The remainder of the paper is structured as follows. In section 2 we present a brief history of the
Austrian reference frame since its beginning in the 19th century. We then show practical examples
for problems occurring when combining data based on this reference frame with measurements
taken with modern equipment. Finally, we show some mathematical concepts that can deal with
these problems and discuss their properties and the suitability for international endeavours like
INSPIRE.
2. A BRIEF HISTORY OF THE AUSTRIAN REFERENCE FRAME AND
DERIVED DATA
The current reference point network in Austria is based on measurement campaigns started in
1862 (Sommer 1967; Zeger 1993). Some of the stabilized points have already been used in earlier
campaigns, e.g., for the 1st Austrian military triangulation network started in 1806, however the
old observations were not used. The scale for the triangulation network was derived from a
distance observation near Josefov in the Czech Republic. Originally it was planned to adjust all
observations using the least squares method (Ghilani and Wolf 2006). However, this was not
possible due to a lack of computational resources. The network was divided into several parts and
these were adjusted separately. Small deformations in the overlapping parts of the sub-networks
were inescapable. Another problem was that conditional adjustment was used. The network itself
had holes and with conditional adjustment it was not possible to model this geometry. Figure 1
shows such a hole (marked with ‘I’) and its effect on the result of the adjustment. The triangles
south east of the hole are not connected as they should be. This was later corrected locally. The
resulting network was called the Austrian military triangulation.

International Conference SDI 2010 – Skopje; 15-17.09.2010
308
Figure 1. Effects of the holes in the Austrian network in the part of the network between the
Buschberg in Austria and Josefov in the Czech Republic (Sommer 1967)
In 1907 a new adjustment was started because
• the holes have been filled and
• too large triangles have been split into smaller ones.
Both activities should have improved the result of the adjustment. It should have also eliminated
the problem with the holes. However, World War I stopped the computation and it was never
resumed. 40 points of the highest quality level in the current Austrian network are still based on
this network. These points form the legal Austrian reference frame together with triangulation
points from consolidation networks of 2nd to 5th order and inserted points.
Several activities to assess and improve the quality of the network were initiated. The quality
assessment activities include
• the analysis of the residuals of the angular sums in the triangles of the network for the
observations before the World War I (Rohrer 1935),
• the analysis of contradictions in the 1st order network (Bretterbauer 1967), and
• a readjustment of the original observations and comparison with the coordinates in use
(Litschauer 1974; Litschauer 1979) in connection with the Réseau Européen
Trigonométrique (RETrig) campaign.
Activities to improve the quality include campaigns in connection with European or international
efforts to create high quality reference frames. These activities include work done for the
European Datum 1977 (ED77) and the European Terrestrial Reference Frame 1989 (ETRS89). In
parallel starting in the mid 1990ies a GNSS reference framework for Austria was created,
consisting of the Austrian Geodynamic Reference Frame (AGREF) and the Austrian Reference
Frame (AREF) (Döller, Höggerl et al. 1996; Erker, Stangl et al. 1996). The deviations between
the Austrian network and the ETRS89 show a systematic effect. The difference vectors have a
length of up to 2 m and rotate around two centres. One is located in the western Tyrol and the
other in the eastern part of Austria (Erker 1997; Höggerl and Imrek 2007).
I

International Conference SDI 2010 – Skopje; 15-17.09.2010
309
The elimination of these deviations for the reference points is possible. Austria has currently
approximately 60,000 triangulation points and 270,000 points determined with other methods. A
complete readjustment is possible since the original observations are available in digital form.
The amount of data may require careful preparation but these challenges are solvable.
The task is much more complex for data based on these reference points. Data for cadastral and
topographic maps, spatial planning, and many large constructions are based on the existing
reference points because for decades all measurements were taken with respect to the reference
point network. Only after GPS became operational and equipment with sufficient measurement
quality became available, measurements could be taken without using the reference points. This
clearly shows deviations between the GNSS reference frame and the Austrian reference frame,
i.e., it is impossible to determine legally valid data like cadastral boundaries by GNSS without a
transformation of the results to the local system.
There is a second reason for deviations between Austrian cadastral data and the Austrian
reference frame. The collection of the cadastral data started long before the triangulation network
was measured. The cadastral mapping was based on its own triangulation network. However, the
cadastral triangulation had several flaws (Rohrer 1934):
• The triangulation was computed in 7 plane coordinate systems with its own scale and
orientation.
• The computation was only done in form of an approximation.
• Triangulation and detailed survey were done in parallel. Thus local observations had a
strong influence on the quality of the whole triangulation
• The triangulation of the lowest quality was done in graphical form only.
• The reference points used were not adequately stabilized. Sufficient stabilization in
parts of Austria was done 30 years after the survey. At that time 12% of the points were
already destroyed. In the southern parts of Austria the reference points were never
stabilized.
Thus the original cadastral data has a different reference frame than the network of reference
points. Still the reference point network is nowadays used to determine cadastral boundaries. In
that case there is not only a deviation between the European reference system and the Austrian
reference system but also between the Austrian reference system and the reference system used to
determine geometry of the data. Since many other data sets in Austria (e.g., for spatial planning)
are based on the cadastral data, these differences must be taken into account when using modern
measurement technologies like GNSS.
Another problem with cadastral data emerges from the necessary processing steps since the
original creation of the Austrian cadastre. Because the original mapping was done using plane
coordinate systems, the change to the Gauß-Krüger-projection required a reprojection and thus
redrawing of the maps. The same was necessary when the original scales of 1:1440 and 1:2880
were changed to 1:1000 and 1:2000. Finally, in the 1990ies the cadastral map was digitized. Each
of these steps allow the occurrence of drawing errors. Thus today’s digital cadastral map in
Austria itself has limited accuracy (compare Navratil, Hafner et al. 2010).
3. EFFECTS OF THE INCONSISTENCIES FOR ENGINEERING
PROJECTS

International Conference SDI 2010 – Skopje; 15-17.09.2010
310
Two examples from engineering projects shall illustrate the practical implications of the problem
in engineering applications. In both cases the streets were constructed and homogeneous networks
were necessary for planning, implementation, and documentation. Cadastral registration of the
streets requires a connection to the reference frame used for the cadastre. Modern construction
machines, however, use GNSS-receiver for automatic or semi-automatic control. Thus, a
connection to a homogeneous network is necessary, too, for planning and implementation.
The first project is a network for a 40 km section of a river in the Tyrol. The network consists of
22 points, which were determined by 104 GPS-vectors (Figure 2). A constraint-free adjustment of
the observations provides estimates for the quality of the observations. The maximum standard
deviation for the coordinates of the points in the network is 1.3 mm and the maximum standard
deviation for the components of the GPS-vectors is 1.7 mm. This shows that networks measured
with GPS-equipment have a high internal accuracy. Since the longest observed GPS-vectors were
longer than 14 km, the network is homogeneous.
Figure 2. Network layout for a river survey project in the Tyrol, Austria (© Vermessung
Angst ZT GmbH)
The alignment of the network with the reference points was performed with a Helmert-
transformation. It resulted in residuals of up to 18 cm. This is 10 times the internal accuracy of the
network.
The second project is a road section of similar size in Upper Austria. This network also consists
of 22 points, which were determined by similar number of GPS-vectors as in the first example
(Figure 3). The quality of the network is also comparable to the first example. The alignment of
the network with the reference points was performed with a Helmert-transformation. It resulted in

International Conference SDI 2010 – Skopje; 15-17.09.2010
311
the residuals shown in Table 1. It is evident that the internal accuracy of the network is much
better than the accuracy of the reference frame. The residuals of the transformation are up to
7 cm. This is too much for many engineering applications where constraints have to be fulfilled at
specific points (e.g., there must be a smooth transition at the ends of the street segment and
possible on-/off-ramps).
Table 1. Residuals dX, dY, and dZ of the network points after the Helmert-transformation in [mm]
(data: Vermessung Angst ZT GmbH)
Pt. dX dY dZ Pt. dX dY dZ
1 13.4 2.5 44.7 9 11.3 -7.6 68.3
2 8.0 -8.4 32.0 10 3.6 42.1 59.2
3 -5.1 -38.7 -33.7 11 -11.8 -12.3 -31.9
4 28.5 5.3 27.0 12 52.8 0.1 30.9
5 -22.2 3.7 -31.7 13 -23.8 -10.5 -2.8
6 -17.0 5.2 -16.5 14 35.5 15.4 -23.6
7 -16.6 -28.5 -20.9 15 -55.0 16.3 -49.9
8 31.5 21.2 -16.3 16 -33.0 -5.8 -67.5
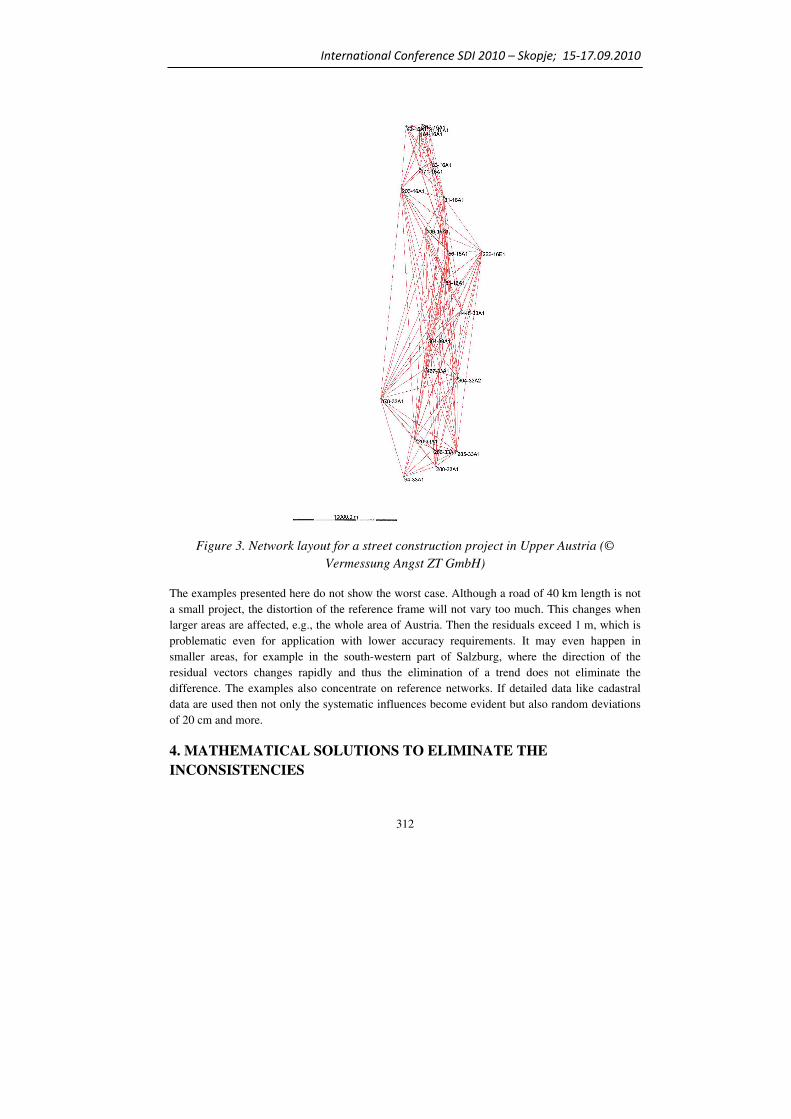
International Conference SDI 2010 – Skopje; 15-17.09.2010
312
Figure 3. Network layout for a street construction project in Upper Austria (©
Vermessung Angst ZT GmbH)
The examples presented here do not show the worst case. Although a road of 40 km length is not
a small project, the distortion of the reference frame will not vary too much. This changes when
larger areas are affected, e.g., the whole area of Austria. Then the residuals exceed 1 m, which is
problematic even for application with lower accuracy requirements. It may even happen in
smaller areas, for example in the south-western part of Salzburg, where the direction of the
residual vectors changes rapidly and thus the elimination of a trend does not eliminate the
difference. The examples also concentrate on reference networks. If detailed data like cadastral
data are used then not only the systematic influences become evident but also random deviations
of 20 cm and more.
4. MATHEMATICAL SOLUTIONS TO ELIMINATE THE
INCONSISTENCIES

International Conference SDI 2010 – Skopje; 15-17.09.2010
313
There are several approaches how inconsistencies can be dealt with. There are two ways to
classify the approaches. Firstly, there is a separation between geometric and stochastic approaches
and secondly, there are exact methods and approximations. We will first give examples for
geometric and stochastic approaches and then discuss the difference between exact and
approximate implementations.
4.1. Simple Approaches vs. Residual-free Fitting
The simplest way to map data from one reference frame to another reference frame is the
similarity transformation. Assuming we have points in a coordinate system (x,y) and need it in
another system (X,Y) there formula is
−+
=
y
xm
b
a
Y
X
αα
αα
cossin
sincos.
The transformation parameters a, b, m, and α can be computed if the coordinates of two points are
known in both reference frames. Such points are called control points. If there are more than two
pairs of coordinates in both reference frames then a parameter estimation is necessary and the
model is called Helmert-transformation.
The advantage of this type of mapping is that it is simple, bijective, and exact. The idea behind
the mapping is simple. There are just two shifts (a and b), a rotation (α), and a scale factor (m).
This leaves geometries unchanged, i.e., parallel lines remain parallel and circles remain circles.
Since the mapping is bijective reversing the mapping is no problem and because it is an exact
solution the mapping can be done back and forth multiple times without changing the result.
However, in practice small deviations may happen due to implementation issues.
The disadvantage of the Helmert-transformation is that it cannot deal with inhomogeneous
reference frames. If the reference frame is distorted then the transformation parameters will vary
with the geographic position. This cannot be modelled with one Helmert-transformation. Thus,
after mapping the control points the resulting coordinates will deviate from the given ones. These
deviations are called residuals. They show the ‘goodness of fit’ for the control points.
An expanded version of the similarity transformation is the affine transformation. Here it is
assumed that there are different scales mx and my for the two coordinate axis and the angle
between the axis is not the same in both reference frame, resulting in two rotations α and β.
.cossin
,sincos
ymxmbY
ymxmaX
yx
yx
βα
βα
++=
−+=
The affine transformation requires three control points because there are six parameters. Again
more control points can be used and lead to a standard problem of parameter estimation. The
affine transformation can deal with some distortions between the reference frames. It can handle
systematic distortions like scale differences. It cannot handle, however, local deviations. Thus
when using more than three control points the affine transformation leads to the same problems as
the Helmert-transformation.

International Conference SDI 2010 – Skopje; 15-17.09.2010
314
However, there is a method to map a set of points in one reference frame to another reference
frame using the affine transformation without residuals (Figure 4). The idea is to split the area
into triangles with control points forming the corners of the triangles. The control points a to e are
used to create a triangular tessellation of the space. For each of the triangles a separate set of
parameters for an affine transformation are specified. This requires three control points and has an
unambiguous solution. The point 1 is then mapped using the parameters determined by b, d, and
e. The point 2 lies on the boundary between two triangles. It can thus be mapped using the affine
transformation defined for both triangles. Both transformations lead to the same result. Point 3,
however, constitutes a problem. It requires an extending of the area covered by the control points.
Using the transformation parameters determined by the points b, d, and e may provide a
reasonable result but this it neither checked not guaranteed. Another problem of this solution is
that it is not possible to check the correctness of the control points. Erroneous control points (e.g.,
the point was relocated and the coordinates in one reference frame describe the point before the
relocation whereas the coordinate in the other reference frame describe the point after the
relocation) can then introduce previously non-existing inconsistencies.
Figure 4. Example for a residual-free affine transformation
Another method to eliminate the residuals is the multi-quadratic interpolation proposed for
geodetic applications by Wolf (1968) and Hardy (1971; 1972). Based on the residual vector r
corrections uj for each point j are computed by
uj=sjTS-1r
with the quadratic and symmetric matrix S containing the distances between the control points
and the vector sj containing the distances between the point j and the control points. This approach
can also be expanded to a stochastic method. The methods described so far are purely
geometrical. Geometric properties are used to define the parameters of the mapping. This
approach ignores that the coordinates of the control points are not error-free. These coordinates
emerge from observation processes and such processes are described as stochastic processes. The
result of a stochastic process varies for each repetition because random deviations influence the
result. The random deviations are typically modelled by normal distribution with estimate zero
and a specified variance. This information can be used to eliminate the residuals. The elements
describing the interrelation between the control points are then based on the correlation and not
1
2
3
a b
c
e
d

International Conference SDI 2010 – Skopje; 15-17.09.2010
315
the geometric distance. Such approaches typically utilize covariance functions, which map a
specific distance to a covariance value.
4.2. Exact vs. Approximate Implementation
The implementation of the methods discussed so far can be done by programming the necessary
formulae. This is no problem if the amount of computations work only depends on the number of
points that need to be mapped. This is not the case for all methods presented here. The multi-
quadratic interpolation, for example requires a matrix computation and the dimensions of the
matrix and vectors depend on the number of control points. Although the term S-1r has to be
determined one only and can be reused for each point that shall be corrected, the costs of the
necessary scalar product depends on the number of control points. Thus for large control point
networks the correction is computationally expensive. The same is true for the triangular
tessellation.
A way out of this dilemma is the use of approximation methods. The idea is that the corrections
are not computed precisely. The approximations can be based on pre-computed values. An
example for such a method is the residual grid. Precise corrections for points in a regular grid are
pre-computed. When corrections for a specific point are needed, these pre-computed corrections
are used to estimate approximate them. Figure 5 shows the basic principle. Corrections for point 1
are needed but only corrections for the points a to d have been pre-computed since they are part
of the grid. In a first step the grid cell containing point 1 is determined. The grid points a to d with
known residuals are then used to approximate the residuals of point 1.
Figure 5. Principle of the residual grid
The interpolation is not without problems. Four points do not necessarily lie on a plane. Thus
linear interpolation is not possible. Still, some instruments use it in the following way: First the
values for the points x and y are determined by linear interpolation between (a,c) and (b,d)
respectively. Then the values for the point 1 are interpolation between (x,y). In addition the
surface approximated by the grid needs not to be a plane. In this case any linear interpolation
method causes a linearization error. This error may lead to problems when data are frequently
mapped back and forth between two systems. Each mapping process introduces a small error. If
1
a b
c d
x y

International Conference SDI 2010 – Skopje; 15-17.09.2010
316
this error is not fully compensated by the reverse mapping (which it will not be completely) then
the errors may add up to significant amounts.
5. DISCUSSION AND CONCLUSIONS
A practical application for these ideas has been presented by Grillmayer (2010). The problem was
controlling construction vehicles using GPS for a road construction. The quality requirements and
the residuals did not allow a single transformation, e.g., a Helmert-transformation. In order to
fulfil the quality requirements 7 different sets of transformation parameters would have been
necessary. This solution presented two practical problems: Firstly, the machine operator would
have to select the correct parameter set and would have to change the parameter set when crossing
the border where the current parameter set becomes invalid. Secondly, the parameter sets did not
match exactly at the boundaries. These deviations would have to be evened during the
construction work leading to slight unsteadiness in the path of the street. He used the solution of
the residual grid, which was loaded into the GPS-receivers. This solution worked well.
The INSPIRE initiative aims at improving the interoperability of data throughout the European
Union. This inevitably leads to situations where data from homogeneous sources (GNSS, satellite
imagery, etc.) need to be combined with data from inhomogeneous sources (base on traditionally
surveyed networks of reference points). The necessity of adaption arises if the quality
requirements of the application exceed the errors introduced by the inhomogeneities. In Austria
the inhomogeneities add up to a maximum of approximately 2 m. Thus applications like a general
statistics on land cover of public lands or mapping of traffic density on transit routes will not be
significantly influenced. Other applications like applying for agricultural subsidies, however,
might not be able to tolerate this deviation.
The direction of correction also depends on the application. It may, for example, be required by
law that data are mapped on cadastral data even if these data are based on an inhomogeneous
reference frame. This may be the case if data have to be correlated with land owners or other data
that is related to the cadastre like data on spatial planning. This will reduce the quality of the
mapped data which may be inappropriate for other applications. Thus official services should
provide a method to map the data to a different reference frame. This shall guarantee that the data
are mapped only once and possible problems with approximation methods are avoided. For the
Austrian case two different target systems seem feasible: The Austrian cadastral system and the
European Terrestrial Reference Frame (ETRF).
6. REFERENCES
Bretterbauer, K. (1967). "Eine Statistik der Dreieckswidersprüche im österreichischen Netz 1.
Ordnung." Österreichische Zeitschrift für Vermessungswesen 55(2): 29-34.
Döller, H., N. Höggerl, et al. (1996). GPS-Grundnetz von Österreich. Angewandte Geographische
Informationsverarbeitung, Salzburg, Universität Salzburg, Institut für Geographie.
Erker, E. (1997). "Die Homogenisierung des österreichischen Festpunktfeldes im internationalen
Rahmen." Österreichische Zeitschrift für Vermessung und Geoinformation (VGI) 85(2):
109-116.

International Conference SDI 2010 – Skopje; 15-17.09.2010
317
Erker, E., G. Stangl, et al. (1996). "The Austrian Geodynamic Reference Frame (AGREF)
Motivation and Results." Österreichische Zeitschrift für Vermessung und
Geoinformation (VGI) 84(3): 293-298.
Ghilani, C. D. and P. R. Wolf (2006). Adjustment Computations: Spatial Data Analysis.
Hoboken, New Jersey, John Wiley & Sons, Inc.
Grillmayer, E. (2010). Baumaschinensteuerung in inhomogenen Koordinatenrahmen. Presentation
27. Jan. 2010, Austrian Society for Surveying and Geoinformation.
Hardy, R. L. (1971). "Multiquadratic Equations of Topography and other Irregular Surfaces."
Journal of Geophysical Research 76: 1905-1915.
Hardy, R. L. (1972). "Geodetic Applications of Multiquadratic Analysis." Allgemeine
Vermessungs-Nachrichten (AVN) 79(10): 398-406.
Höggerl, N. and E. Imrek (2007). "Recent Steps towards the Introduction of ETRS89 in Austria."
Geodetski Vestnik, Journal of the Association of Surveyors of Slovenia 51(4): 742-750.
Litschauer, J. (1974). "Der österreichische Anteil am RETrig I." Österreichische Zeitschrift für
Vermessungswesen und Photogrammetrie 62(4): 145-157.
Litschauer, J. (1979). "Das österreichische Dreiecksnetz 1. Ordnung in ED 77." Österreichische
Zeitschrift für Vermessungswesen und Photogrammetrie 67(2): 57-74.
Navratil, G., J. Hafner, and D. Jilin (2010). Accuracy Determination for the Austrian Digital
Cadastral Map (DKM). Fourth Croatian Congress on Cadastre, Zagreb, Croatian
Geodetic Society.
Rohrer, H. (1934). "Zum neuen Projektionssystem Österreichs." Österreichische Zeitschrift für
Vermessungswesen 32(5/6): 89-97, 116-123.
Rohrer, H. (1935). "Die Ausgestaltung des Dreiecksnetzes I. Ordnung." Österreichische
Zeitschrift für Vermessungswesen 33(5): 101-106.
Sommer, L. (1967). Die Abänderung des Gradmessungsnetzes für die Zwecke des Katasters. 150
Jahre österreichischer Grundkataster. R. Messner. Wien, Bundesamt für Eich- und
Vermessungswesen: 147-158.
Wolf, H. (1968). Ausgleichungsrechnung nach der Methode der kleinsten Quadrate. Bonn,
Ferdinand Dümmler.
Zeger, J. (1993). Die historische Entwicklung der staatlichen Vermessungsarbeiten
(Grundlagenvermessung) in Österreich. Band IV: Neutriangulierung. Wien, Bundesamt
für Eich- und Vermessungswesen.
7. BIOGRAPHICAL NOTES OF THE AUTHORS
PD DI Dr. Gerhard NAVRATIL holds a position as an assistant at the
Vienna University of Technology, Institute for Geoinformation and
Cartography. He is deputy head of the institute.
He was born on 25.08.1969 in Vienna, Austria. He graduated as a surveying
engineer at the Vienna University of Technology in 1998. In 2002 year he
received the Doctor of technical sciences (PhD) from the same University. In
July 2007 he received the venia docendi (right to teach) in the field of geoinformation from the
same University. Since 1998 he is employed by the Institute of Geoinformation and Cartography

International Conference SDI 2010 – Skopje; 15-17.09.2010
318
at the Vienna University of Technology as a teaching and research assistant. He published over 30
reviewed papers at national and international scientific conferences and in national and
international journals related to geo-information and geodesy. He published five books in the
book series of the institute and the Springer series “Lecture Notes in Geoinformation and
Cartography”.
Ass.Prof. Dr. Ismail KABASHI is a member of the University Pristine,
Department for Geodesy, Faculty for Civil Engineering und Architecture. He is
employed at the graduated consulting engineering company Vermessung Angst
ZT GmbH in Vienna/Austria. He was born on 08.08.1965 in Pristine, Kosova.
He graduated in the department of geodesy at the University of Sarajevo
(Bosnia and Herzegovina) in 1992. In 2003, he received the Doctor of technical
sciences (PhD) at the department of engineering geodesy of Vienna University
of Technology. Currently he is employed at Vermessung Angst ZT GmbH as a project manager
for planning and execution of cadastre and geo-monitoring projects. Since 2004, he works as a
geodesy engineering Professor at the University of Pristine (Kosova). He is author of many papers
published and presented at national and international scientific conferences related to geodesy and
engineering geodesy, as well as the author of script for students in geodesy engineering field.
DI Michaela Ragoßnig-Angst, MSc. (OU), is managing director of the
graduated consulting engineering company Vermessung Angst ZT GmbH in
Vienna/Austria. She was born on 09.09.1970 in Vienna, Austria. She graduated
as a surveying engineer at the Vienna University of Technology in 1996. In 1998
she got her diploma for Master of Science in Engineering Management at the
Oakland University Detroit and the Vienna University of Technology. Since May
2000, she is a Graduated Consulting Engineer for Surveying and since 2002 she
is managing director of the graduated consulting engineering company Vermessung Angst ZT
GmbH in Vienna/Austria. She is lecturer at the University of Applied Science “FH Campus
Wien” for surveying and member of the Advisory board for Urban Planning of the City of
Vienna.

International Conference SDI 2010 – Skopje; 15-17.09.2010
319
THE COORDINATE REFERENCE SYSTEMS OF SPATIAL
DATA INFRASTRUCTURES IN ALBANIA
Pal NIKOLLI1, Bashkim IDRIZI
2
ABSTRACT One of the basics of geoinformation systems is to guarantee an unambiguous spatial reference of the stored information. The spatial reference can be given by coordinates or by geographic identifiers. Coordinates are unambiguous when the reference system to which those coordinates are related has been fully described. The standardization activities since the nineties in the frame of the European standardization organization CEN and of the international standardization organization ISO for GIS included the spatial reference aspect as a central topic. The coordinate reference system (CRS) is an aggregate class with the component classes datum and coordinate system; geodetic datum, vertical datum and engineering datum are subclasses to the datum. In Albania, many organizations have collections of spatial data. Few institutions have operational GIS databases. Except Municipality of Tirana, there are not online spatial data bases. Spatial data are created by several agencies as per their needs. Some realities of spatial data are: relevant data is often hard to find, frequently it is not in compatible forms, information describing data is often non-existent, framework data does not exist for broad geographic areas, data sharing across organizations is inconsistent etc. Therefore we need to do: common language, common reference system and common framework. In this paper we give some knowledge about coordinates references systems that are used in Albania to which are related the coordinates of spatial reference. Three common coordinate systems used in GIS in Albania are Geographic coordinate system (Lat-Long), planar (Cartesian) georeferenced coordinate system (easting, northing, elevation) which includes projection from an ellipsoid to a plane with origin and axes tied to the Earth surface, planar non - georeferenced coordinate system, such as image coordinate system with origin and axes defined arbitrarily (e.g. image corner) without defining its position on the Earth and projection.
Key word: ALBANIA, INSPPIRE, NSDI, GIS, CRS, CEN, ISO 1. INTRODUCTION The realization of a geoinformation system requires that the geodetic reference system is defined and the measurements are carried out in the chosen system. In every Geographic Information Systems (GIS) project, the user must choose whether to analyze and display data in geographic coordinates or a map projection. There are potentially critical differences between these two ways of measuring the world. In other hand for building up a Spatial Data Infrastructure (SDI), one condition is that all spatial data (geodata) which are used for a specific purpose need to use the same Coordinate Reference Systems (CRS) simultaneously. For that, the definition of each CRS and their relations has to be known. In order to facilitate the exchange and use of geospatial data
1 Prof.Dr.sc. Pal NIKOLLI, [email protected] Tirana University, Department of geography, www.fhf.edu.al Gsm.: +355 69 2472-451 Elbasan street, Faculty of History and Philology, Tirana, Albania. 2 Prof.Dr.sc. Bashkim IDRIZI, [email protected] State University of Tetova, www.unite.edu.mk, www.geocities.com/hartografia/ut.html Tel.: +389 2 2612-492, Gsm.: +389 75 712-998, Fax: +389 44 334-222 Str. Xhon Kenedi, 25-4-20, 1000 Skopje, Republic of Macedonia.

International Conference SDI 2010 – Skopje; 15-17.09.2010
320
by different individuals and organizations, it is important to have a common framework and structure for expressing spatial referencing information. To further this goal, the specification of coordinate reference systems and their components conforms to the International Organization for Standardization (ISO) standard 19111:2003 entitled Spatial Referencing by Coordinates. The high level abstract model for spatial referencing by coordinates is shown in the diagram below (fig 1).
Fig. 1. The abstract model for spatial referencing by coordinates
New methods of acquiring spatial data and the advent of geographic information systems (GIS) for handling and manipulating data mean that we no longer must rely on paper maps from a single source, but can acquire, combine, and customize spatial data as needed. To ensure quality results, however, one must fully understand the diverse coordinate frameworks upon which the data are based. Datums and Map Projections provides clear, accessible explanations of the terminology, relationships, transformations, and computations involved in combining data from different sources. The paper focuses on different coordinate systems and datums that are used in Albania. 2. COORDINATE REFERENCE SYSTEMS (CRS)
Geographic locations in a geospatial object are specified in terms of the object’s coordinate reference system (CRS). A CRS associates a coordinate system with an object by means of a datum (fig 2). Therefore, a CRS definition must encompass a definition of a coordinate system and a datum. In the context of ISO 19111 a CRS is defined by its datum. Three types are important in the context of this paper:
• Geodetic CRS – a CRS based on a geodetic datum (e.g. WGS 84 or ETRS 89 - note that both these names are also names of geodetic datums)
• Projected CRS – a CRS derived from a geodetic CRS by means of a map projection. The datum is expressed by the geodetic datum of the base geodetic CRS from which the projected CRS is derived (e.g. Albanian National Grid)
source target
inputs outputs
Coordinate Tuple(for example X,Y,Z)
Coordinate System
(X,Y,Z)
Coordinate Reference System(for example ETRS89)
is referenced to
Datum
(ETRS89)and
is comprised of
Coordinate Tuple(for example φ,λ,h)
Coordinate System
(φ,λ,h)
Coordinate Reference System(for example WGS 84)
is referenced to
Datum
(WGS 84)and
is comprised of
Coordinate Operation(ETRS89 to WGS 84)

International Conference SDI 2010 – Skopje; 15-17.09.2010
321
• Vertical CRS – a one dimensional CRS based on a vertical datum (e.g. MSL Depth). It is the definition of the CRS that must be supplied with a spatial dataset in order that a full understanding of the meaning of the coordinates in the data can be gained. By extension the CRS should also be expressed in full on any map products that are produced.
Fig. 2. A coordinate reference system combines a coordinate system with a datum, which gives the relationship of the coordinate system to the surface and shape of the Earth
A coordinate system (CS) is a sequence of coordinate axes with specified units of measure. A coordinate system is an abstract mathematical concept without any defined relationship to the earth. Coordinate systems generally have not been explicitly described in geodetic literature, and they rarely have well-known names by which they are identified. The historic colloquial use of ‘coordinate system' usually meant coordinate reference system. A datum specifies the relationship of a coordinate system to the earth, thus ensuring that the abstract mathematical concept can be applied to the practical problem of describing positions of features on or near the earth’s surface by means of coordinates (fig.3). Coordinate reference systems, coordinate systems and datums are each classified into several subtypes. Each coordinate system type can be associated with only specific types of coordinate reference system. Similarly each datum type can be associated with only specific types of coordinate reference system. Thus, indirectly through their association with CRS types, each coordinate system type can only be associated with specific types of datum. In Europe there exist a very lot of different Coordinate Reference Systems (CRS), and new CRS are defined (table 1). This collection of European Coordinate Reference Systems collects a lot of paneuropean, regional and national CRS information.

International Conference SDI 2010 – Skopje; 15-17.09.2010
322
Fig. 3. The definitions of CRS, datum and coordinate system
Tab. 1. Different Coordinate Reference Systems (CRS) in Europe
CRS-EU
Information and Service
System for Coordinate Reference
Systems in Europe
EVRS
Information System for the
European Vertical Reference System
It contains: • description of national
Coordinate Reference Systems • description of pan-
European Coordinate Reference Systems • description of
transformation parameters from national Coordinate Reference Systems to pan-European Coordinate Reference Systems including
o quality of transformation
o verification data of transformation
o possibility for online conversion and transformation of single points for test and verification purposes
It contains: • definition of EVRS • description of
realizations of EVRS - EVRF2000 and EVRF2007
• projects and products for EVRS (UELN, EUVN, EUVN-DA)
• references for EVRS (resolution, papers, bibliography)

International Conference SDI 2010 – Skopje; 15-17.09.2010
323
(position) • links to the National
Mapping Agencies of the European Countries
2.1. Coordinate Reference System subtypes.
Geodetic survey practice usually divides coordinate reference systems into a number of sub-types. The common classification criterion for sub-typing of coordinate reference systems can be described as the way in which they deal with earth curvature. This has a direct effect on the portion of the earth’s surface that can be covered by that type of CRS with an acceptable degree of error. The following types of coordinate reference system are distinguished: Geographic (Geographic 2D, Geographic 3D), Geocentric (ISO 19111 classifies both geographic and geocentric coordinate reference systems as geodetic CRSs), Vertical, Projected, Engineering and Compound (in historic geodetic practice, horizontal and vertical positions were determined independently). It is established practice to combine the horizontal coordinates of a point with a height or depth from a different coordinate reference system. This has resulted in coordinate reference systems that are horizontal (2D) and vertical (1D) in nature, as opposed to truly 3-dimensional. The coordinate reference system to which these 2D+1D coordinates are referenced combines the separate horizontal and vertical coordinate reference systems of the horizontal and vertical coordinates. Such a system is called a compound coordinate reference system (CCRS). It consists of a non-repeating sequence of two or more single coordinate reference systems). For spatial coordinates, a number of constraints exist for the construction of compound CRSs. Coordinate reference systems that are combined shall not contain any duplicate or redundant axes. Valid combinations include: Geographic 2D + Vertical, Geographic 2D + Engineering 1D (near vertical), Projected + Vertical, Projected + Engineering 1D (near vertical), Engineering (horizontal 2D) + Vertical, Engineering (1D linear) + Vertical.
2.2. Coordinate System subtypes. Datum subtypes
The coordinates of points are recorded in a coordinate system (CS). Each CS type may be associated with only specific types of CRS. The following types of coordinate system are distinguished: ellipsoidal, Cartesian, affine, gravity-related, linear, spherical, polar, and cylindrical. A "Datum" is a standard representation of shape and offset for coordinates, which
includes an ellipsoid and an origin. A datum implies a choice regarding the origin and orientation of the coordinate system. It is the datum that makes the coordinate system and its coordinates unambiguous. We recognize three types of datum – geodetic, vertical and engineering (fig. 4).

International Conference SDI 2010 – Skopje; 15-17.09.2010
324
Fig. 4. The coordinate reference system (CRS) is an aggregate class with the component classes
datum and coordinate system, geodetic datum, vertical datum and engineering datum are
subclasses to the datum
There are a vast amount of datums, some used for measurements all over the world, and other local datums defined so they fit very well with a local area. Some common ones are: World Geodetic Datum 1984 (WGS84), European Datum 1950 (ED50) and North American Datum 1983 (NAD83) etc. The most well-known is WGS84 used by the GPS systems today. It is a good approximation of the entire world and with fix-points defined almost all over the world. When it was defined they forgot to include points in Europe though, so the Europeans now have their own ETRS89, which is usually referred to as the “realization of WGS84 in Europe”. The problem here was solely because of continental drift, so they defined some points relative to WGS84 in 1989, and keeps track of the changes. In most use-cases it is of no real importance and we can use one or the other. People often refer to having their data in WGS84, and we see now why this doesn’t make sense. All we know from that is that the data is defined using the WGS84 datum, but we don’t know which coordinate system it uses. A vertical datum defines the relationship of a gravity-related coordinate system to the earth. An engineering datum defines the relationship of a coordinate system used for engineering purposes to the earth. For both vertical and engineering types the most important attribute is the datum name, which implies the relationship. A geodetic datum defines the relationship of a geographic or geocentric coordinate system to the earth. In addition to the datum name (which again implies the relationship), essential attributes of a geodetic datum are the chosen model of the earth – the ellipsoid – including details of name and defining parameter values, together with the details of the zero or prime meridian from which longitudes are reckoned.
3. COORDINATE DATUMS
Since coordinate reference systems are idealized abstractions, they can only be accessed through their physical materialization (or realization) called reference frames or datums. The datum effectively defines the origin and orientation of the coordinate reference system at a certain epoch, generally by adopting a set of station coordinates. Over time, different techniques with varying levels of sophistication have been used to define the

International Conference SDI 2010 – Skopje; 15-17.09.2010
325
shape of the Earth’s surface, resulting in the adoption of many different datums. Here we briefly describe some of the datums used by spatial professionals today. The International Terrestrial Reference Frame (ITRF) is the most precise earth-centered, earth-fixed datum currently available and was first introduced in 1988. It is maintained by the International Earth Rotation and Reference Systems Service (IERS) and realized by an extensive global network of accurate coordinates and their velocities derived from geodetic observations using GPS, Very Long Baseline Interferometry (VLBI), Satellite Laser Ranging (SLR), Lunar Laser Ranging (LLR) and Doppler Orbitography and Radiopositioning Integrated by Satellite (DORIS) (Altamimi et al., 2007). These coordinates are based on the GRS80, a geocentric ellipsoid designed to approximate the geoid on a global scale. The ITRF is a dynamic datum and changes according to temporal variations of its network coordinates and their velocities due to the effects of crustal motion, earth orientation, polar motion and other geophysical phenomena such as earthquakes and volcanic activity (Bock, 1998). It is updated regularly in order to account for the dynamics of the Earth and now sufficiently refined to ensure that the change between successive ITRF versions is in the order of 1-2 cm. So far the following versions have been released: ITRF88, ITRF89, ITRF90, ITRF91, ITRF92, ITRF93, ITRF94, ITRF96, ITRF97, ITRF2000 and ITRF2005. A new version, ITRF2008, is anticipated to be released in the near future. Coordinates given in any of the ITRF realizations are referred to a specific epoch in order to enable appropriate consideration of the Earth’s dynamics. The most popular global coordinate system used by the GPS navigation system is WGS 84. The World Geodetic System 1984 (WGS84) was developed for the U.S. Defense Mapping Agency (DMA), later named NIMA (National Imagery and Mapping Agency) and now called NGA (National Geospatial-Intelligence Agency), and is the nominal datum used by GPS (NIMA, 2004). It is based on the WGS84 ellipsoid which can generally be assumed identical to the GRS80. The WGS84 datum was introduced in 1987 based on Doppler observations and has since been refined several times to be closely aligned with the ITRF in order to prevent degradation of the GPS broadcast ephemerides (i.e. orbit parameters) due to plate tectonics (True, 2004). The first refinement was introduced in 1994 to align the WGS84 with ITRF91 and included a revised set of station coordinates for the tracking network, based entirely on GPS observations (Malys and Slater, 1994). It is known as WGS84 (G730) where G stands for ‘GPS’ and 730 denotes the GPS week number when NGA started expressing their derived GPS precise ephemerides in this frame, i.e. 2 January 1994. Swift (1994) estimated that the refined WGS84 agreed with the ITRF92 at the 10 cm level. The second refinement, WGS84 (G873), occurred on 29 September 1996 and resulted in coincidence with the ITRF94 at better than 10 cm (Malys et al., 1997). It should be noted that the GPS Operational Control Segment did not implement the WGS84 (G730) and WGS84 (G873) coordinates until 29 June 1994 and 29 January 1997, respectively. The latest refinement, WGS84 (G1150), was introduced and implemented on 20 January 2002 based on 15 days of GPS data collected during February 2001 at six U.S. Air Force monitoring stations, 11 NGA stations and several additional global tracking stations. After this alignment with the ITRF2000, it was shown that the WGS84 coincides with the ITRF within a few centimeters at the global level (Merrigan et al., 2002). For all mapping and charting purposes, the WGS84 and the most current ITRF can therefore be assumed identical (NIMA, 2004). However, it should be noted that the level of agreement worsens as the time gap between WGS84 (G1150) and the latest realization of ITRF grows.

International Conference SDI 2010 – Skopje; 15-17.09.2010
326
In order to move to a geocentric (i.e. GPS-compatible) datum, the European Terrestrial Reference System 1989 (ETRS89) was introduced in 1989. This datum is based on the GRS80 ellipsoid, coincident with ITRF89 at epoch 1989.0 and realized by an extensive permanent GPS station network across Europe (Boucher and Altamimi, 1992). The ETRS89 has undergone several realizations, denoted European Terrestrial Reference Frames (ETRF), relating it to more recent versions of the ITRF. The latest realization, known as ETRF2000, has been derived from the ITRF2000 through a set of known transformation formulae (Altamimi and Boucher, 2002). While many European countries continue to use their individual national datums, an increasing number of these are linked to the ETRF.
4. PROJECTION COORDINATES
In practice, it is often required to express positions on a flat surface in the form of grid coordinates, i.e. in a 2-dimensional Cartesian coordinate system such as Easting and Northing. Here we briefly reviews map projections and introduces the principle of grid coordinates. 4.1 Map Projections
Map projections are used to represent a spatial 3dimensional surface (e.g. the Earth) on a plane 2dimensional surface (e.g. a paper map) according to a recognized set of mathematical rules, resulting in an ordered system of meridians (lines of constant longitude) and parallels (lines of constant latitude). It is therefore necessary to project the Earth onto a developable surface that can be cut and flattened, i.e. a plane, cylinder or cone, resulting in an azimuthal, cylindrical or conic projection, respectively. This projection surface is located tangent or secant to the Earth and its axis is either coincident with the Earth’s axis (polar or normal aspect), at right angles to it (equatorial or transverse aspect) or at an arbitrary angle (oblique aspect). The projection parameters needed to convert curvilinear coordinates to grid coordinates are derived either geometrically or mathematically. It is impossible to convert a 3D surface into a 2D surface without introducing distortions. Several hundred map projections have therefore been developed in order to satisfy certain cartographic properties, i.e. the preservation of shape locally (conformal projection), scale (equidistant projection) or area (equal-area projection). Thus it is possible to eliminate certain distortions at the expense of others or to minimize all types of distortions, but some distortion will always remain. On a conformal map, meridians and parallels intersect at right angles, and the scale at any point on the map is the same in any direction, although it will vary from point to point. Conformal maps therefore allow the analysis, control or recording of motion and angular relationships. Two well known conformal projections are the Gauss Kryger and the Transverse Mercator projection, which are used extensively in Albania as a basis for grid coordinates.
4.2. UTM Projection
The Transverse Mercator projection is mathematically derived and utilizes a cylinder that is tangent to a chosen meridian, called the central meridian (CM). The scale is therefore true along the central meridian but increases with increasing distance from it, thereby causing a growing distortion in scale. The Transverse Mercator projection is
International Conference SDI 2010 – Skopje; 15-17.09.2010
327
most appropriate for regions exhibiting a large north-south extent but small east-west extent. However, by splitting up the area to be mapped into longitudinal zones of limited extent and merging the resulting plane maps, the entire world can be mapped with minimal distortion. The Universal Transverse Mercator (UTM) projection utilizes a zone width of 6° and ensures that the scale is very close to unity across the entire zone by defining a central scale factor of 0.9996 for the CM which results in a scale of 1.0010 at the zone boundary located 3° away from the CM. The UTM projection divides the world into 60 zones, zone 1 having a CM at longitude 177°W, while the latitudinal extent of each zone is 80°S and 84°N, indicated by 20 bands labeled C to X with the exclusion of I and O for obvious reasons. All latitude bands are 8° wide, except the most northerly (X) which is 12° wide to allow Greenland to be mapped in its entirety. For a UTM map of the world, the reader is directed to http://www.dmap.co.uk/utmworld.htm. The increasing distortion in scale evident at high latitudes is caused by the north-south gridlines not converging at the poles, i.e. the poles would be projected as lines rather than points. The Albania is located in zone 34S and 34T. Note that while the latitude extent is generally part of the coordinate display in most GNSS receivers, in a GIS environment it is often replaced by N or S to indicate the hemisphere when a global UTM system is used. 4.3. Grid Coordinates
In each UTM zone, the projected grid coordinates, i.e. Easting and Northing, are initially referenced to the origin defined by the intersection of the CM and the equator, resulting in negative Easting coordinates west of the CM and negative Northing coordinates in the southern hemisphere. In order to ensure positive coordinate values across the entire zone, the UTM system applies false coordinates to the origin by adding 500,000 m to the true Easting and, in the southern hemisphere, 10,000,000 m to the true Northing. It should be noted that variations of this global UTM convention are used in numerous national mapping datums, applying different zone widths, false coordinates and central scale factors. The Military Grid Reference System (MGRS) is a two-dimensional grid that uniquely identifies a square meter anywhere on the earth. The MGRS attempts to represent the entire surface of the Earth on a worldwide grid. The grid is based on the UTM (between 80°S and 84°N latitudes) and UPS (Universal Polar Stereographic) systems. The MGRS coordinate consists of seven parameters: Datum (as applied to MGRS), Zone number, Band letter, Column letter, Row letter, MGRS Easting and MGRS Northing 5. VERTICAL DATUM A vertical datum defines a reference for elevation comparisons and is essential for a wide range of spatial applications such as floodplain management, waterway navigation management, roadway and drainage design, agricultural management and surveying in general. Most countries utilize an approximation of the orthometric height system related to the geoid as reference for vertical coordinates. Generally, vertical datums are based on MSL. However, MSL has been specified differently in different countries, resulting in a multitude of zero-levels. The history of and the various relationships between the many existing national vertical datums is a very complex topic.

International Conference SDI 2010 – Skopje; 15-17.09.2010
328
5.1. Transformation of Heights
Positions obtained by GPS include heights referred to a reference ellipsoid. These heights are purely based on the geometry of the ellipsoid and therefore have no physical meaning. In practice, however, heights are generally required that correctly reflect the flow of water, e.g. for drainage and pipeline design. National height datums are therefore based on orthometric heights, referenced to the geoid or an approximation thereof. Ellipsoidal heights (h) can be converted into orthometric heights (H) by applying the geoid undulation (N), also known as geoid-ellipsoid separation, geoid height (not to be confused with the height above geoid, i.e. the orthometric height) or N value: H = h – N where h and N are measured along the ellipsoid normal, while H is measured along the curved plumb line, i.e. the direction of the gravity vector (Fig. 5).
Figure 5: Relationship between ellipsoidal height (h), orthometric height (H) and geoid undulation (N), courtesy of M. Kuhn, Curtin University of Technology 6. COORDINATE REFERENCE SYSTEMS (CRS) USED IN ALBANIA The ability to successfully change from one datum to another requires knowledge of: a. Geoids b. Ellipsoids c. Coordinate Systems d. Geodetic Height e. Geodetic Datums f. Coordinate Systems g. Methodology to shift from one datum to another From second half of XIX century, in Albanian territory are made some coordinate reference systems especially to support mapping of Albanian ground territory. Thus, we distinguish coordinate references following: • The Triangulation Network that was established by Military Geographic Institute of
Vienna (MGIW) during 1860-1873, in the framework of the construction of the geodetic basis is done for mapping of Balkan at 1:75000 scale. We have not any detailed information about, but we know that in the 1918 the geodetic coordinates of the points of triangulation were calculated on Bessel ellipsoid (dimensions determined by Friedrich Wilhelm Bessel, based on several meridian arcs and other data of continental geodetic networks of Europe, Russia and the British Survey of India), Gauss-Krüger cylindrical projection, with origin the intersection of the Equator by the meridian of Ferro.

International Conference SDI 2010 – Skopje; 15-17.09.2010
329
Reference parameters of the Coordinative Reference established by Military Geographic Institute of Vienna (MGIW) in the 1860-1873 period are: Ellipsoid: Bessel 1841, non geocentric Ellipsoid origin of north: Earthy equator, Ellipsoid origin of east: Ferro Meridian (-17.50 in west of Greenwich) Projection: Polyconic of Bonn
• The geodetic coordinates of the points of triangulation that carried out by Military Geographic Institute of Italy (IGM), in the 1927-1943 period, were calculated on Bessel ellipsoid, Bonn projection with central meridian Lo=20', as origin was determined the astronomical point of Lapraka, Tirana. At the same time, IGM carried out the Leveling Net (about 150-170 km). The origin for Heights System was chosen the MSI, of Adriatic Sea, determined with a temporary tide gauge very short recording time (one month). Reference parameters of the Coordinative Reference established by Military Geographic Institute of Italy (IGM), in the 1927-1943 period are: Ellipsoid: Bessel 1841, non geocentric Ellipsoid origin of North: Earthy Equator (φ = 00), Ellipsoid origin of East: Meridian λ0 = 200 Projection: Bonn False origin of North: 0.000 m False origin of East: 0.000 m Scale of deformation in central meridian (λ0 = 200): k0=1
• In the 1955, the specialists of Military Topographic Group of Albania carried out the reconstruction and the densification of the IGM Net in order to grant the request for mapping at 1: 25 000 scale. At the same time, the first- order network was transformed from the IGM. System (1934) into the 1942 coordinate system, which based on Krassovsky ellipsoid, Gauss-Krüger projection with central meridian Lo=21'. Reference parameters of the Coordinative Reference established by of Military Topographic Group of Albania with Russian help in 1955 year are: Ellipsoid: Krasovski 1945, non geocentric Ellipsoid origin of North: Earthy Equator (φ = 00), Ellipsoid origin of East: Central Meridian λ = 210 Projection: Gauss-Kryger (Mercator Transversal) False origin of North: 0.000 m False origin of East: 500 000.000 m, in west of meridian λ = 210 Scale of deformation in central meridian (λ0 = 210): k0=1
• The New Albanian Net, which constituted from Triangulation and Leveling was designed, rebuilt, measured and calculated from Military Topographic Institute of Albania (MTI) during 1970-1985 (fig. 6). Leveling Networks, were designed, measured and calculated at the same time as the triangulation, during 1970-1985, from Military Topographic Institute (MTI). Reference parameters of the Coordinative Reference established by of Military Topographic Institute of Albania in the 1970- 1985 period are: Ellipsoid: Krasovski 1945, non geocentric Ellipsoid origin of North: Earthy Equator (φ = 00), Ellipsoid origin of East: Central Meridian λ = 210 Projection: Gauss-Kryger (Mercator Transversal) False origin of North: 0.000 m

International Conference SDI 2010 – Skopje; 15-17.09.2010
330
False origin of East: 500 000.000 m, in west of meridian λ = 210 Scale of deformation in central meridian (λ0 = 210): k0=1
TIRANA
ELBASANI
DURRESI
KORÇA
VLORA
SARANDA
SHKODRA
KRUMA
Fig. 6. First class of Albanian Triangulation Net The Datum of the elevation system was chosen the MSL of Adriatic Sea, determined from recordings of tide gauge for 1958-1977, which was establish since before second world war from Military Geographic Institute of Florence, Italy. From this tide gauge was establish the Fundamental Bench Mark (FBM) of the First Order Leveling (FOL). The cadastral maps that were done for about 40 years by using the classical methods (tachymetry) are a scale of 1:2500 and 1:5000. The maps were used not only for cadastral purposes but also for different considerations such as land irrigation systems, land management, and so forth. Two co-ordinate systems for cadastral maps production are applied: (1) one system based on the Bessel ellipsoid is used to produce maps at a scale of 1:2500; (2) and the other system based on the

International Conference SDI 2010 – Skopje; 15-17.09.2010
331
Krasowski ellipsoid is used to generate maps at a scale of 1:5000. The Gauss-Kruger projection is used for both systems; for the first system the central meridian is 20°, and for the second it is 21°. The maps at the scale of 1:2500 in the Bessel co-ordinate system are based on a map sheet layout system unique to Albania. Map sheets produced in the Krasowski system are referenced by geographic coordinates. Immovable Property Registration Office (IPRO), Ministry of Justice: IPRO, as part of its property registration scope, has produced a cadastral layer that includes coverage for all the eight cities. The cadastral borders are in AutoCAD DWG/DXF format, while the attribute data resides partly in a relational database, and partly in hard-copy format. The spatial data is acceptably accurate at scales of 1:500-1:1,000 in urban areas, and at 1:2,500 scale in rural areas. The data is spatially referenced in the Albanian National Coordinate System (Gauss-Kruger, Krasovski/Pulkovo 1942). IPRO is at present in the midst of a large-scale modernization project, which will produce a highly automated property registration updating procedure, as well as a GIS-compatible cadastral database. This database will be of vital importance for any regulatory planning initiative, and so the solving of the coordinate conversion issues is of utmost importance.
• A Global Positioning System (GPS) geodetic control network survey was performed in Albania during October 1994 in collaboration with United States Defense Mapping Agency Aerospace Center (DMAAC). The purpose of the survey was to establish World Geodetic System 1984 (WGS 84) positions on 35 existing stations within the Albanian geodetic control network. The selection of the stations to be included in the survey was made by M.T.I. personnel. The objective of GPS measurements campaign of February 98 in collaboration with University of Wisconsin, Florida, USA was: Connect the Albanian Geodetic Network to the International Terrestrial Reference System (ITRF) and define the inter-relationship between the local and international reference frameworks. It was proposed to occupy stations included in US National Imagery and Mapping Agency (NIMA) GPS network of 1994, thus it would be possible to re-adjust the NIMA network data. The fiducially network included the IGS stations GRAZ, MATERA, SOFIA and PENC and stations KAMZA, KORCA, SHKODRA. The final coordinates are referenced to ITRF 96, Epoch 1998.0, also the final WGS 84 geodetic coordinates. The final co-ordinates for the new EUREF stations were performed by fixing the co-ordinates of four ITRF stations (Wettzell1202) and are given in the International Terrestrial The Military Institute of Albania is responsible for producing a variety of cartographic products, including hard-copy topographic maps at the following scales: 1:10,000, 1:25,000, 1:50,000, and 1:100,000. All of these products are spatially referenced in the Albanian National Coordinate System. In addition, the Institute distributes 1:50,000 scale hard-copy maps produced in collaboration with the USA agency NIMA (National Image and Mapping Agency – now called NGA: National Geospatial-Intelligence Agency). These products are spatially referenced in the UTM (WGS84) coordinate system. The Institute’s 1:25,000 and 1:50,000 scale series may be suitable background cartographic material for city-based GIS projects, since they exhibit a standard graphic “language”, as well as indicate the regional context of the city. Reference parameters of the Coordinative Reference established by of Military Topographic Institute of Albania after 1994 year are: Ellipsoid name: WGS 84 Ellipsoid origin of North: Earthy Equator (φ = 00),

International Conference SDI 2010 – Skopje; 15-17.09.2010
332
Ellipsoid origin of East: Central Meridian λ = 210 E Map Projection name: UTM zone 34 N False northing, in grid units: 0.000 m False easting, in grid units: 500 000.000 m, in west of meridian λ = 210 Scale factor at natural origin in central meridian (λ0 = 210): k0=0.9996 Magnitude of projection zone: 60, Projection Zone: 34 Projected CRS axes units name: meter
• Albanian National Grid (ANG) is the national standard CRS for land mapping in Albania. The components of the CRS are as follows:
1. Base Geodetic CRS – WGS 84 2. Geodetic Datum – WGS 84 3. Ellipsoid – WGS 84 4. Prime Meridian – Greenwich 5. Coordinate System - Ellipsoidal 6. Projection Parameters – ANG 7. Projection Method – Transverse Mercator 8. Coordinate System – Cartesian
ANG was originally created using classical techniques. The geodetic datum was realized by triangulation using physical monuments (Trig Points). However, the realization of the datum is now performed through the use of the coordinate transformation. Numerous mathematical techniques have been developed to convert coordinates between Albanian System 1987 (ALB87) (Krasovski Ellipsoid and Gauss-Kryger Projection) and UTM, WGS 84. These techniques include a variety of multiple-parameter and multiple-regression transformation equations. 7. CONCLUSIONS In order to facilitate the exchange and use of geospatial data by different individuals and organizations, it is important to have a common framework and structure for expressing spatial referencing information. Coordinates are the foundation of GIS, cartography, and surveying, to name just a few fields. Coordinate systems, covering ellipsoids, datums, and plane coordinates are used in GIS and GPS. There are thousands of horizontal geodetic datums and Cartesian coordinate systems currently sanctioned by governments around the world to describe our planet electronically and on paper. In Albania we distinguished coordinate reference systems that based on: • Bessel ellipsoid and Bonn polyconic projection; • Krasovski ellipsoid and Gauss-Kryger projection; • WGS 84 ellipsoid and UTM projection. The Datum of the elevation system in Albania was chosen the MSL of Adriatic Sea, determined from recordings of tide gauge for 1958-1977, which was establish since before second world war from Military Geographic Institute of Florence, Italy. From this tide gauge was establish the Fundamental Bench Mark (FBM) of the First Order Leveling (FOL)

International Conference SDI 2010 – Skopje; 15-17.09.2010
333
The INSPIRE theme Coordinate reference systems (CRS) provides a harmonized specification for uniquely referencing spatial information. Numerous algorithms and programs are developed to convert coordinates between Albanian System 1987 (ALB87) (Krasovski Ellipsoid and Gauss-Kryger Projection) and UTM, WGS 84. But, till now algorithms and programs are not developed to convert coordinates between coordinate reference system (Bessel ellipsoid and Bonn polyconic projection) and other coordinate reference systems. 8. REFERENCES
1. Doyle, D., 1992, High Accuracy Reference Networks; Development, Adjustment and Coordinate Transformation, Presented at the American Congress on Surveying and Mapping Annual Conference, New Orleans, Louisiana, February 15 - 18.
2. Strange, W. and Love, J., 1991, High Accuracy Reference Networks; A National Perspective, Presented at the American Society of Civil Engineers Specialty Conference - Transportation Applications of GPS Positioning Strategy, Sacramento, California, September 18 - 21.
3. Bugayevskiy, Lev M. and John P. Snyder. 1995. Map Projections: A Reference
Manual. London: Taylor and Francis. 4. Clarke, Keith C. 1995. Analytical and Computer Cartography, 2nd ed. Englewood
Cliffs, NJ: Prentice Hall. 5. Defense Mapping Agency. 1991. World Geodetic System 1984 (WGS 84) 6. Iliffe, J., and Lott, R., 2008, Datums and Map Projections for Remote Sensing, GIS and
Surveying, 2nd edition (Dunbeath: Whittles Publishing). 7. Maling, D.H. 1992. Coordinate systems and map projections. 2nd ed. New York:
Pergamon Press. 8. Robinson, Arthur H., Joel L. Morrison, Phillip C. Muehrcke, A. Jon Kimerling, and
Stephen C. Guptill. 1995. Elements of Cartography. 6th ed. New York: John Wiley and Sons, 41-58, 91-111.
9. Snyder, John P. 1987. Map Projections: A Working Manual. Washington, DC: US Government Printing Office.
10. Eduart I.: The First-Order Triangulation Network of Albania, October 1993. 11. Geodesy and Geophysics Department of DMAAC: GPS Geodetic Control Network
Survey in Albania, October 1994. 12. The Land Market Development Project, University of Wisconsin-Madison, USA:
Establishment of Geodetic Infrastructure and Integrated Property Surveying and Mapping, April 1998,
13. ALTINER Y., SCHLÜTER W., SEEGER H.: BKG Frankfurt/Main: The results of the
EUREF98 GPS Campaign in Albania, Symposium of EUREF99, Prague 1999. 14. QEMAL SKUKA, NEKI KUKA: The conversion from Albanian Coordinate System to
WGS84 and vice versa, Revista Gjeodezike 4/1997 15. Altamimi, Z., and Boucher, C., 2002, The ITRS and ETRS89 Relationship: New
Results from ITRF2000. In EUREF Publication No. 10, edited by J. Torres and H. Hornik (Frankfurt: Verlag des Bundesamtes für Kartographie und Geodäsie), 49-52.
16. Altamimi, Z., Collilieux, X., Legrand, J., Garayt, B., and Boucher, C., 2007, ITRF2005: A New Release of the International Terrestrial Reference Frame Based on Time Series of Station Positions and Earth Orientation Parameters. Journal of Geophysical
Research, 112, B09401, doi: 10.1029/2007JB004949. 17. Baker, L. S., 1974, Geodetic Networks in the United States. Canadian Surveyor, 28,
445-451. 18. BKG, 2006, Quasigeoid of the Federal Republic of Germany GCG05,
http://www.bkg.bund.de (accessed 9 Nov 2009).

International Conference SDI 2010 – Skopje; 15-17.09.2010
334
19. Bock, Y., 1998, Reference Systems. In GPS for Geodesy, edited by P. J. G. Teunissen and A. Kleusberg (Berlin: Springer), 1-42.
20. Bomford, A. G., 1967, The Geodetic Adjustment of Australia 1963-1966. Survey
Review, 19, 52-71. 21. Boucher, C., and Altamimi, Z., 1992, The EUREF Terrestrial Reference System and its
First Realizations. Veröffentlichungen der Bayerischen Kommission für die Internationale Erdmessung, Heft 52, München, 205-213.
22. Bowring, B. R., 1985, The Accuracy of Geodetic Latitude and Height Equations. Survey Review, 28, 202-206.
23. Bugayevskiy, L. M., and Snyder, J. P., 1995, Map Projections: A Reference Manual (London: Taylor and Francis).
24. Collier, P., 2002, Development of Australia’s National GDA94 Transformation Grids. Consultant’s Report to the Intergovernmental Committee on Surveying and Mapping, University of Melbourne, Australia.
25. Craymer, M. R., 2006, The Evolution of NAD83 in Canada. Geomatica, 60, 151-164. 26. CRS, 2008, Information and Service System for European Coordinate Reference
Systems, http://crs.bkg.bund.de/crs-eu (accessed 9 Nov 2009). 27. Dawson, J., and Steed, J., 2004, International Terrestrial Reference Frame (ITRF) to
GDA94 coordinate transformations, http://www.ga.gov.au/image_cache/GA3795.pdf (accessed 9 Nov 2009).
28. Denker, H., Barriot, J.-P., Barzaghi, R., Fairhead, D., Forsberg, R., Ihde, J., Kenyeres, A., Marti, U., Sarrailh, M., and Tziavos, I. N., 2008, The Development of the European Gravimetric Geoid Model EGG07. In Observing Our Changing Earth, IAG Symp. Vol. 133, edited by M.G. Sideris (Berlin: Springer), 177-185.
29. EUREF, 2008, Reference Frame Sub Commission for Europe, http://www.euref.eu/ (accessed 9 Nov 2009).
30. Featherstone, W. E., 2002, Attempts to Unify the Australian Height Datum between the Mainland and Tasmania. In Vertical Reference Systems, edited by P. Drewes, A. Dodson, L. P. Fortes, L. Sanchez, and P. Sandoval (Berlin: Springer), 328-333.
31. Featherstone, W. E., 2007, Absolute and Relative Testing of Gravimetric Geoid Models using Global Positioning System and Orthometric Height Data. Computers &
Geosciences, 27, 807-814. 32. Featherstone, W. E., Claessens, S. J., Kuhn, M., Kirby, J. F., Sproule, D. M.,
Darbeheshti, N., and Awange, J. L., 2007, Progress Towards the New Australian Geoid-Type Model as a Replacement for AUSGeoid98. Proceedings of SSC2007, Hobart, Tasmania, edited by V. Janssen and M. Russell, 243-261.
33. Featherstone, W. E., Kirby, J. F., Kearsley, A. H. W., Gilliland, J. R., Johnston, G. M., Steed, J., Forsberg, R., and Sideris, M. G., 2001, The AUSGeoid98 Geoid Model for Australia: Data Treatment, Computations and Comparisons with GPS-levelling Data. Journal of Geodesy, 75, 313-330.
34. Featherstone, W. E., and Kuhn, M., 2006, Height Systems and Vertical Datums: A Review in the Australian Context. Journal of Spatial Science, 51, 21-42.
35. Featherstone, W. E., and Olliver, J. G., 2001, A Review of Geoid Models over the British Isles: Progress and Proposals. Survey Review, 36, 78100.
36. Fok, H. S., and Iz, H. B., 2003, A Comparative Analysis of the Performance of Iterative and Non-Iterative Solutions to the Cartesian to Geodetic Coordinate Transformation. Journal of Geospatial Engineering, 5, 61-74.
37. Parker, W. and Bartholomew, R., Issues in Automating the Military Grid Reference
System, IN: The Fifth International Geodetic Symposium on Satellite Positioning, Vol.
II, 903-913. 38. Parker, W.S., and Bartholomew, R.G., 1988, Mapping, Charting, and Geodesy in the
DoD Standard GPS Receivers, IEEE Plans Record, 145-152.

International Conference SDI 2010 – Skopje; 15-17.09.2010
335
9. BIOGRAPHICAL NOTES OF THE AUTHORS
Asoc.Prof.Dr.Eng. Pal Nikolli. Graduated at the Geodesy branch of Engineering Faculty, Tirana University. In 1987 has been nominated lecturer in the Geodesy Department of Tirana University. In 1994 has been graduated Doctor of Sciences in cartography field. During this period, have taught the following subjects: “Cartography” (for Geodesy and Geography students) and “Geodesy” (for Civil engineering & Geology students). Actually he is lecturer and tutor of the following subjects: “Elements of
Cartography” (for Geography students), GIS (for Geography students, diploma of first and second degree) “Interpretation of Arial Photographs” (for Geography students, diploma of first degree), “Satellite Images” (for geography students, diploma of second degree) “Thematic Cartography” (for Geography students, diploma of second degree) and “Topography-GIS (for the Geophysics students, diploma of second degree). Mr. Nikolli is the author and co-author 8 textbooks (Elements of Cartography and Topography, Elements of Cartography, Geographic Information Systems, Processing of satellite images, Cartography, etc), 3 monographs (History of Albanian Cartography, Mirdita on Geo-Cartographic view, etc), more than 50 scientific papers inside and outside of the country, more 40 scientific & popular papers, etc. Has participated in several post graduation courses of cartography and GIS outside of the country (1994, 2000 - Italy), etc.
Ass.Prof.Dr.Eng. Bashkim IDRIZI, was born on 14.07.1974 in Skopje, Macedonia. He graduated in geodesy department of the Polytechnic University of Tirana-Albania in 1999year. In 2004, hot the degree of master of sciences (MSc) in Ss.Cyril and Methodius University-Skopje. In 2005 he had a specialization for Global Mapping in Geographical-Survey Institute (GSI) of Japan in Tsukuba-Japan. On year 2007, he held the degree of Doctor of sciences (PhD) in Geodesy
department of Ss.Cyril and Methodius University–Skopje. He worked in State Authority for Geodetic Works from May 1999 until January 2008. From October 2003 up to January 2008, he worked as a outsourcing lecturer in State University of Tetova. From February 2008, he works as a cartography& GIS Professor at the State University of Tetova–Tetova. He continu with working as outsourcing lecturer in geodesy department of the University of Prishtina-Kosova. He is the author of three cartography university books, and 56 papers published and presented in national and international scientific conferences related to geodesy, cartography, GIS & remote sensing.

International Conference SDI 2010 – Skopje; 15-17.09.2010
336
DEVELOPMENT AND IMPLEMENTATION OF NEW IT
SYSTEM FOR REAL ESTATE CADASTRE OF THE REPUBLIC
OF MACEDONIA
Dušan FAJFAR 1, Vasja KAVČIČ
2, Damijan RAVNIK
3
ABSTRACT
This paper presents development and implementation of new IT system for Real Estate Cadastre
of the Republic of Macedonia. The Agency for Real Estate Cadastre, Skopje (former State
Authority for Geodetic Works, Republic of Macedonia) is an individual state body in charge of
conducting the geodetic works and registering the real estate rights. According to the strategic
business plan and Information and Communication Technology Strategy the Agency for Real
Estate Cadastre started the project for new IT system for Real Estate Cadastre in 2007. The
primary goal of this new system was to develop efficient system for registration of technical and
legal (ownership, rights) information about real estates. The old Real Estate Registry system was
very outdated, technologically very limited (based on file system) and it covered only the
descriptive Cadastral and Real Estate Rights data. Not only that the new Real Estate Cadastre
system is developed on modern technology based on central Oracle database and WEB Java
application but also with the workflow system supporting registration procedures for maintenance
of Real Estate Cadastre data. The development of the new Real Estate Cadastre system started in
January 2008 and finished in May 2009 including 6 month intensive testing of the system by the
project implementation group established specially for this purpose from the side of Agency for
Real Estate Cadastre. Also intensive training for the end users was done with special attention to
the front-desk users that works with customers. At the end of the project the extensive acceptance
test was made; more than 300 different procedures covered almost all possible cases, taken from
the current production, were done. Test was executed by the end users from all departments that
participate in the process of Real Estate Cadastre data maintenance and data issue. From May
2009 the system is in the phase of test production where all procedures for limited number of
cadastral units are performed parallel in old and new system. The results are very good, so the
plan is to start production on whole territory of sector Skopje with the June 1st of 2010.
Key word: Real Estate Cadastre, IT system, cadastre registration procedures, Land Cadastre,
Buildings cadastre, Oracle, Java, Workflow, web application, digital certificates
1 Dušan FAJFAR, [email protected]
IGEA d.o.o., www.igea.si
Tel.: +386 1 2007-609, Gsm.: +386 41 371-531, Fax: +386 1 2567-867.
Koprska 94, 1000 Ljubljana, Slovenia. 2.Vasja KAVČIČ, [email protected]
e-NEP d.o.o.,
Tel.: +386 1 2007-618,
Tičnica 24, 1360 Vrhnika, Slovenia. 3 Damijan RAVNIK, [email protected]
IGEA d.o.o., www.igea.si
Tel.: +386 1 2007-620, Fax: +386 1 2567-867.
Koprska 94, 1000 Ljubljana, Slovenia.

International Conference SDI 2010 – Skopje; 15-17.09.2010
337
1. INTRODUCTION
The Agency for Real Estate Cadastre (AREC), Skopje (former State Authority for
Geodetic Works, Republic of Macedonia) is an individual state body in charge of
conducting the geodetic works and registering the real estate rights. Real estates are
land, buildings, special parts of buildings and other objects, as well as other real estates
which are registered in the real estate cadastre in compliance to the law. Real estate
cadastre is a public book in which are registered the ownership rights and other real
property rights, the real estate data as well as other rights and facts whose registration is
stipulated by law.
In the past period, the Government of the Republic of Macedonia took a loan for the
reforms of the real estate cadastre from the World Bank, thus enabling additional
income for the introduction of the real estate cadastre in Republic of Macedonia. This
project was focused to establish efficient real estate cadastre on the entire territory of the
Republic of Macedonia. In the Strategic Plan of the Real Estate Cadastre Agency 2009-2013
(Real Estate Cadastre Agency of the Republic of Macedonia, 2008) the efficient IT system for
the maintenance of collected data in the real estate cadastre is one of the most important
tasks to be done. The current Real Estate Registry IT system, that covers only the
descriptive Cadastral and Real Estate Rights data, is very outdated and technologically
very limited. Especially security of data in the current IT system is critical; while based
on the file system, there is no log of transactions and no information on executed
procedures. So the goal was to establish integrated electronic cadastral information
system, unique in the Republic of Macedonia that enables managing, updating,
distribution and access to updated data from the Real Estate Cadastre. Based on ICT
Strategy (State Authority for Geodetic Works, 2007) the AREC started with the project for
new IT system for Real Estate Cadastre in 2007, while public tender was published. The
primary goal of this new system was to develop efficient system for registration of
technical and legal (ownership, rights) information about real estates based on new
modern technology.
2. FUNCTIONALITY OF THE SYSTEM
The IT system for the Real Estate Cadastre was designed with the vision to obtain the
next goals:
• to enable registration and supervision of cadastral procedures through the
appropriate workflow system,
• to enable clients of AREC to be informed about the status of their case through the
Internet,
• upgrading of existing cadastral system for maintenance of real estate cadastre data
with improved data model with data integrity and application based on central
database, web application and security standards and provide integration with
workflow,

International Conference SDI 2010 – Skopje; 15-17.09.2010
338
• to check and redefine workflow of existing cadastral procedures to obtain more
efficient processing and security of data,
• the system developed and implemented for the AREC real estate center Skopje
must be prepared to be used by other offices through the whole Macedonia.
At the start of the project the data model of existing system was analyzed first. The
findings were that the current data model considering real estate data content for the
basic entities (parcels, building, owners, encumbrances) is good, simple and efficient
and enables interoperability between technical and legal aspect of data. Within the new
data model moved from the file system to the relational database all these good things
were preserved. Inside of the new data model first data reference integrity was assured
consistently to protect system from discrepant data on the lowest database level. More
structured data was involved for the parts of buildings and for encumbrances (leases,
mortgages, restrictions, easements, etc.). Beside these improvements the history of data
changes was involved into the data model; the data in this tables are filled automatically
with the execution of the cadastral procedures inside the workflow module. Also what is
very important is that in the new data model can be migrated all data from existing
system, so no data will be lost when the new system will replace the existing system.
The second part of the new data model that didn’t exist in the old system is data model
for the workflow that store data about cadastral procedures.
In the existing system was no data about execution of cadastral procedures, so the next
step was to design module for registration of these procedures. In 2008 the new Law on
Real Estate Cadastre (Law on Real Estate Cadastre, 2008) was adopted that changed
some existing procedures, so the analysis of current cadastral procedures and the new
law was a base for design of the workflow system. All the procedures were described
and visualized in flow-chart diagrams. Sample of these diagrams from Project final
report (IGEA, 2009) is presented in figure 1.

International Conference SDI 2010 – Skopje; 15-17.09.2010
339
Figure 1: Sample of visualization of cadastral procedures – step 1: acceptance of application from
customer
The workflow system supports all current cadastral procedures and covers all steps from
the acceptance of the case from a customer to preparation of a final solution. The main
steps in the procedure are:
• Acceptance of an application from customer at front-office; this consists of opening
of a case with data about the customer, selecting of the objects (one or more
parcels, part of buildings, encumbrances, etc.) and the type of procedure, calculate
the tax and keep a record of the attached documents. At the end written
confirmation for acceptance of the application is prepared by the system with all
important data printed and paper case folder is prepared to keep all the documents
linked to this procedure.
• Allocation of the case for solving to a corresponding officer in back-office is based
on the type of procedure and location (cadastral community) corresponding to the
internal organization of working groups.
• By maintaining of the data the system is very opened with minimum limitations and
allows user very flexible work by entering of necessary changes in the system. The
system helps user with presentation of old and new data at the same time in the
very structured forms with additional controls on content, so the possibility of
mistakes is minimized. The sample mask of application that presents old and new
data is presented in figure 2. All changes are not entered to the valid database of the
system but they are stored in database of workflow. At any moment the user can
generate list of changes where old and new data are displayed and all changes
clearly marked.

International Conference SDI 2010 – Skopje; 15-17.09.2010
340
• Also workflow support exchanging of the case between the officers or departments
if there is more subjects that participate in solving of the case. Before confirmation
of changes detailed explanation for final confirmation is entered.
• By confirmation of data changes at the same time the data are stored in the valid
database and the old data are moved to history tables. Beside this the documents for
final confirmation and list of changes are prepared. Also, these digital documents
are stored in the system linked to the executed procedure.
• With this the formal procedure is finished and the case can be stored in archive.
Figure 2: Sample of application that shows old and new data in the process of data changing
The system has integrated powerful modules for searching and viewing both the
cadastral data and data about procedures; figure 3 shows application mask for searching
procedures. Both are very frequently used in all phases of work. Also statistical module
is developed for supervision of execution of cadastral procedures. The customer can
follows the solving of his case through the internet application.

International Conference SDI 2010 – Skopje; 15-17.09.2010
341
Figure 3: Sample of application that shows searching of the cadastral procedures in different
status and presentation of results
3. SYSTEM ARHITECTURE
The new IT system for Real Estate Cadastre is designed and developed on modern
technology based on central Oracle database and WEB Java application where special
attention was put on security. Multilevel system is presented in figure 4 - Project final
report (IGEA, 2009).
The core of the IT system for Real Estate Cadastre is central Oracle database. The
Oracle 10 Database Standard Edition is used and for high availability the Real
Application Cluster is implemented with data stored on SAN. Scanned documentation
and documents generated through the application are stored on file system on SAN,
also. Backup and recovery plan is prepared that enable the database can be restored to
the last finished transaction. Data and documents backup is provided with DLT units
that stores data on magnetic tapes, additional copy of database is periodical done on
SAN and Oracle mechanism is used to log all transactions. By designing of the system
also graphical data were taken in mind (even they are not part of this new system); it is
planned to use ESRI ArcSDE for Oracle as database storage for graphical data.

International Conference SDI 2010 – Skopje; 15-17.09.2010
342
Figure 4: Generic schema of IT architecture
WEB application is developed corresponding to J2EE technology. To get high
responsibility of the system all the business logic is defined through the PL/SQL
procedures stored in the database itself. Oracle JDeveloper was used for developing java
code that mostly cover user interface of the application. For generation of documents
the Jasper report tool is used. Application is deployed on Oracle iAS servers, where
Java virtual machine is created. At the moment 2 application servers runs and incoming
requests are distributed between them through the HW Load Balancer. Figure 5 shows
deploy of application on Oracle iAS application servers.

International Conference SDI 2010 – Skopje; 15-17.09.2010
343
Figure 5: Deploy of application on Oracle iAS application servers
The security of the system is very important, so the 3 level security is included:
• The first level is authorization in the Oracle database itself. Access is allowed only
for the application and for oracle DBA administrators.
• The second level is system of user rights management. Special system developed
enable management of user and users groups and their rights into the system.
Prepared interfaces return user rights to application for each user automatically
recognized on the base of digital certificate and additionally verified with user
password.
• The third level is using of digital certificates on USB PKI keys. Digital certificates
used in the system are internal certificates of AREC and generated by AREC
administrators. User must insert the USB PKI key in the workstation and enter the
PIN of the key for the start of work with the system. On the base of digital
certificate the system recognizes the user and request to enter password. System
permanently checks for USB PKI key and in the case that is removed from the
computer, the application stop to work.
All IT infrastructure that is designed to support 24x7 work is located at the AREC Head
Quarters. Access to the system for the end users all around Macedonia is assured
through the rented communication lines. For sector Skopje optical line capacity of 10
Mbit is provided. Because of reliability additional backup communication is provided
through the internet that will still enable work but with lower performance. In figure 6
physical configuration of the IT infrastructure is presented - Project final report (IGEA,
2009).

International Conference SDI 2010 – Skopje; 15-17.09.2010
344
Figure 6: Physical configuration of the IT infrastructure
4. IMPLEMENTATION
In the project the implementation was focused only to sector Skopje. Implementation of
IT system for Real Estate Cadastre practically started with final testing and verification
of developed system. For this purpose project implementation group was established
from the side of Agency for Real Estate Cadastre. This group participates in the testing
of the system from the first versions of developed system in the end of 2008 and on
daily base communicates with the development team. In April 2009 intensive training
for the end users was done with special attention to the front-desk officers that works
with customers. Training of the end user was done on selected typical procedures that
ware taken from real cases that were in solving at this time. At the end of the project in
May 2009 the extensive acceptance test was made; more than 200 different real cases
with more than 300 different procedures that covers almost all possible cases, taken
from the current production, ware done. Test was executed by more than 60 end users
from all departments that participate in the process of Real Estate Cadastre data
maintenance and data issue. The result of this verification shows that only 5 procedures
can not be done through the system and some small upgrades to the system must be
done through the regular maintenance of the system.
From May 2009 the system is in the phase of test production where all procedures for
limited number of cadastral units are performed parallel in old and in new system.
Through this entire time AREC project implementation group supports users in test
production and executes additional training of new and existing users. The longer work

International Conference SDI 2010 – Skopje; 15-17.09.2010
345
in test production shows that before the real production some upgrades to the system
should be done, to make system more efficient and more user friendly. These changes
are linked primary on more detailed structure of mortgage, encumbrance and loads of
real estates, some simplification in execution of cadastral procedures, new document
templates and searching the history data. The development of these upgrades were
finished in May 2010, so the start production on whole territory of sector Skopje was
started on May 31st of 2010. After successful start of production in sector Skopje, that
covers almost 40% of all cases, the implementation of the system will start in other
offices all around Macedonia.
5. CONCLUSIONS
The development and implementation of IT system for Real Estate Cadastre is long
term process that starts in 2007 and as the situation stands at the moment it will be
finished in 2011 with implementation of the system in all offices around Macedonia.
The new system with detailed structure of all information, integrity of data, storing data
about cadastral procedures, security of data and transactions, etc. means important step
forward to the trustworthy of the Real Estate Cadastre in the Republic of Macedonia.
Used modern web technology based on Oracle database and application servers, Java
application and powerful IT infrastructure gives an assurance for the long term reliable
work of the system and easy upgrading to the new requests. Also, the system is
designed in the open way so that the further integration with the other systems and
changes of cadastral procedures can be made very easy. In the future integration with
central register of physical and legal subjects is planned and integration with graphical
module for maintenance of graphical data must be done in very near future. Also
integration of work of notaries and survey companies in part of preparation of data
changes for the system is planned.
6. REFERENCES Real Estate Cadastre Agency of the Republic of Macedonia, 2008, Strategic Plan of the Real
Estate Cadastre Agency 2009-2013
State Authority for Geodetic Works (Agency for Real Estate Cadastre), 2007, ICT Strategy
IGEA d.o.o., 2009, Information system for electronic cadastre for the needs of AKN – Project
final report
Law on Real Estate Cadastre, Official Gazette of R. Macedonia #40/08, 2008
7. BIOGRAPHICAL NOTES OF THE AUTHORS
Dušan Fajfar, M. Sc. of Computer and Information Science, is IT Expert
with more than 20 years experiences working on state level projects in
Slovenia and international projects. As a project manager or project
member there were conducted works in area of road management, public
transport, real estate registers, emergency planning, civil protection and

International Conference SDI 2010 – Skopje; 15-17.09.2010
346
disaster relief and other areas connected to spatial management like spatial planning, spatial data
infrastructure, etc. Main responsibilities are IT architecture, top level system design with solution
based on Oracle database and Java web technology, geographic information system, IT system
implementation and project management.
Vasja Kavčič, B. Sc. of Geodesy, works more than 15 years in the field of
spatial data, especially real-estate cadastres in Slovenia and internationally.
He worked as a consultant in the fields of land management and
administration, and also as expert in the projects of informatization of land
cadastre, building cadastre, and other registers of spatial data.
Damijan Ravnik is IT specialist working primary with Oracle from
Database and Spatial Data to pl/sql and Java development for past 15 years.
He is working in different parts of the world as a programmer, system
analyzer and as a consultant. His specialty is public transport and real
estate register, especially land cadastre and building register. Today main
responsibilities are leading IT development groups, system design, IT
infrastructure, database model design, data migration, Oracle pl/sql and
Java programming, testing and IT system implementation.

International Conference SDI 2010 – Skopje; 15-17.09.2010
347
SPATIAL DATA INFRASTRUCTURE FOR REAL ESTATE
ADMINISTRATION BASED ON SATELLITE DATA
Subija IZEIROSKI 1, Igor NEDELKOVSKI
2, Pece GORSEVSKI
3,
Kujtim XHILA 4
ABSTRACT
This paper explores the methodology for creating a model of integrated RS/GIS system for
administration of urban geospatial data connected to attribute data. The main objective of such
kind of RS/GIS system is efficiently to manage and query the geospatial data connected with
attribute tables. The main goal of this paper is to be created an easy to use integrated RS/GIS
system for managing of real estate data and to be made also an efficient decision making system
regarding such kind of issues.
The proposed modelling approach is illustrated using a case study. The study area is an urban
settlement in the city of Bitola, Republic of Macedonia. The mentioned urban settlement consists
of about 260 parcels with constructed individual objects on them. An existing and scanned old
map in raster format of the urban settlement and a preprocessed Google Earth mosaicing raster
image have been used as a raw data for developping of the proposed GIS. Both of them have been
digitized (vectorized) with the open source RS/GIS software ILWIS. The digitized geospatial data
represent polygons of parcels and objects built on them. The obtained data of parcels and objects
are represented with polygons, segments and labeled points, and all of them are connected with
two attribute tables with alphanumerical informations of parcels and objects in an unique SDI
database.
After completing of spatial data infrastructure of the setlement it is obtained a comprehensive GIS
application which is ready to use as a practical tool for easy and visually effective representing of
urban data .
After completing, the GIS application is rendered on the Internet in order to be accessible for
public use. This has been done with the aim of Map Server. It was used Map Server for Windows
(MS4W) for this purpouse. With the Map Server have been created map images with use of CGI
script using the geospatial data and attribute tables of the application. The application was set on
the local host on the WEB in order to show how it works.
1 MSc. Subija IZEIROSKI, [email protected]
Public enterprise Makedonija Pat, Section in Struga,
Phone.: +389 46 788-781, Gsm.: +389 70 212-211, Fax: +389 46 781-578.
Str. Crni Drim, 7, 6330 Struga, Macedonia. 2 PhD. Igor NEDELKOVSKI, [email protected]
Faculty of Technical sciences, St. Kliment Ohridski university Bitola, www.tfb.edu.mk
Phone.: +389 47 207-723, Gsm.: +389 75 237-626, Fax: +389 47 203-370.
Str.Ivo. L. Ribar, bb, 7000 Bitola, Macedonia. 3 PhD. Peter V. GORSEVSKI, [email protected]
Bowling Green State University,Bowling Green, OH, USA, www.bgsu.edu.
Phone.: 419-372-7201, Fax: 419-372-7205.
190 Overman Hall, Bowling Green, OH, U.S.A. 4 Kujtim XHILA, BSc [email protected]
Secondary school ,,Niko Nestor,, - Struga
Phone.: +389 70 464 449
Str. Proleterski Brigadi 49, 6330 Struga, Macedonia.

International Conference SDI 2010 – Skopje; 15-17.09.2010
348
Tre results shows some geometrical distorsions regarding the accuracy of parcels and objects.
This is because we used Google Earth immage. In order the application to be more accurate we
should use satellite or ortophoto immages which should be geometrically corrected. With use of
high resolution satellite images (IKONOS, QUICK BIRD and others) can be monitored also Land
Use and Land Cover changes on parcels which have been occurred in certain period of time.
Monitoring changes can serve furthermore as a good decision-making tool for efficient
management of parcels in the future.
Key words: Remote Sensing, GIS, Spatial data, Attribute data, ILWIS, Map Server for
Windows, Cadastral parcels.
1. INTRODUCTION
This research focuses on how an integrated Remote Sensing/GIS system has been
applied to establish, maintain, and analyse urban and land use information of local
government at municipality level. The common understanding of real estate
administration is, that it is a form of land information system-LIS (Turker&Kocaman,
2003).
Such system provides information about the land, resources and objects on it and can
also refers to changes made on the land parcels.
An old cadastral map usually shows the shapes of land parcels and their attribute data
(such as ID number, owner,s name, area etc). It is drawn on A3/A4 size paper and only
presents the cadastral information of small parcel blocks. The purpose of this paper is to
develop the method of integrated Remote sensing/GIS system for efficient establish of
the Spatial Data Infrastructure(SDI) for managing of real estate properties for public
use.
The diversity of data brings the complexity in data management and requires using a
realational database management system-RDBMS (Turker&Kocaman,2003). The
research is focused on method for establish and implementation of SDI in the integrated
RS/GIS system as a general tool for public use.
In this paper SDI is composed of geographical spatial data for land parcels and
attribute data regarding the owners, area of parcels as well as a set of other useful data.
Such infrastructure of spatial data is integrated in a RS/GIS system enabling efficient
management and visualisation of real estate .
Data that may appear in a land information system include geometric data (coordinates,
maps), land use, property adresses, information of real property, the nature of the tenure,
details about the constructed buildings on parcels, land taxation values and many others
depending of the needs (ESRI,2006).
For this purpose have been used two sources of data: old scanned cadastral map and
mosaicing image obtained with Google earth. As a case study is taken the settlement
,,Lavcanska naselba,, in the city of Bitola, south-west part of Republic of Macedonia .
The settlemnt as an urban part of the city consists of about 260 land parcels.
With the digitizing of raster map (either old cadastral scanned map or raster mosaicing
immage) can be obtained a vector geospatial dataset, which is connected with two tables
with attribute data regarding the parcels and their owners.
With such integrated GIS database, can be easily edited and updated all kind of changes
which has been occured at the parcels or their owners. The geospatial vector database of
the study area is set up with use of the open source GIS software ILWIS. The detailed

International Conference SDI 2010 – Skopje; 15-17.09.2010
349
attribute data of the owners are fictitious (due to the law for protection of personal
information).
Two different attribute tables are created and used inside the ILWIS GIS software
package. As a geospatial data is used an old cadastral map of the study area wich was
scanned and imported into ILWIS . Also is used an mosaicing Google raster image of
the study area. Both are used as a backgroung images for digitizing of parcels in order
to be made vectorized segment map of the parcels and objects separatelly. The
attribute database is connected to the spatial vectorized data. With the integration of
spatial and attribute data has been made infrastructure of spatial data as an integral part
of a RS/GIS application for managing of real estate property.
With the established infrastructure of spatial data in the RS/GIS application can also be
made a plenty of querry procedures regarding the shape of a land parcels, ownership
changes on land parcels, changes regarding the tax collection of parcels and others.
2. MODEL OF INTEGRATED REMOTE SENSING/GIS SYSTEM
FOR MANAGING OF REAL ESTATE
2.1. Study area
The city of Bitola is located in the south-west part of Republic of Macedonia. As a case
study is taken the settlement ,,Lavcanska naselba,, in the city of Bitola. As a background
layer is used a scanned map of the settlement which is of poor graphic quality, and a
mosaicing Google earth image, Figure.1. and Figure 2.
Figure 1. The scanned cadastral map of Lavcanska Settlement in Bitola (Izeiroski,2008)

International Conference SDI 2010 – Skopje; 15-17.09.2010
350
Figure 2. Mosaicing image of Lavcanska settlement in Bitola (Izeiroski,2008)
The settlement is located at the west part of the city on the foot base of the Pelister
mountain. It has not large elevation differences and is with a relatively flat hozonatal
terrain at the altitude of around 700m above sea level. The settlement is one of the
newer ones in the city, and is also well urbanised. Therefore the study area in this paper
is mentioned as a tipical case for a modern urban settlement as a part of the city.
Both immages were first appropriatelly preprocessed and saved in uncompressed .tiff
format, and then imported in the GIS software for further analysis.
2.2. Establish of the SDI
A spatial database is a regular database with support for geometry data types. It
typically contains functions to manipulate the geometries and perform spatial queries
(Sherman E.Gary , 2008)
Spatial database design is very important in the development of planning support
systems, since GIS must be built on standard components, starting with spatial database
as the foundation, then editing, analysis, simulation and visualisation (Putra et all.,
2003).
The Spatial data Infrastructure used in an intergrated RS/GIS aplication is a
combination of geospatial data (usualy satellite images, aerial orthophotos or scanned
old hard copy maps) and different attribute data in many tables which are connected in a
unique relational database management system (RDBMS).
Using a scanned hard copy map or satellite raster image of an area of interest as a
background layer, with digitization (vectorisation) can be made a vector graphic file of
the area. The obtained vector file represents different geospatial entities or feature
classes: land parcels, objects, forest area, watershed area, streams, road and railway
infrastructure and others.
On the other hand, the attribute data can be obtained administrativelly at the
municipality level . These data usually refers to the owners of parcels with their
personal ID numbers , personal data, residental adresseses, phone numbers and others.
Beside these can also be made or calculated other attribute data regarding the
geometrical features of parcels and real estate such: area and perimeter of parcels, area

International Conference SDI 2010 – Skopje; 15-17.09.2010
351
of objects, type of built objects on parcels, approximate marcet values of parcels,
amount of tax collection for parcels and objects etc.
On the basis of the above mentioned concept, the Spatial data Infrastructure (SDI) is
composed of two main integral part of data: geospatial SDI and attribute SDI : Figure
3.
Figure 3. Schematic representation of integrated Real estate SDI.
The geospatial SDI composed of scanned map and Google earth raster image can be
easily vectorized with use of GIS software. With the digitizing of geospatial data of a
raster map or image can be made many vector files composed of points, lines and
poligons. The digitized files are presented as point, segment, or polygon maps, and
represent different kind of geospatial data entities (land parcels, objects, roads, rivers
and other feature items).
The geometrical, morphological and other geographical features of entities are
described in separate attribute tables. It can also be used separate attribute tables with
ownership rights, personal data of the owners of parcels, their adresses as well as other
usefull information data.
The geospatial SDI and attribute SDI are then joined in a integrated unique Spatial
Data Infrastructure of the area. The Spatial Data Infrastructure then can be
implemented in an integrated RS/GIS application for managing of real estate. In the
GIS system the geospatial SDI is connected to the attribute SDI in a unique Spatial
database or Spatial Data Infrastructure .
With the implemented SDI into GIS can be obtained many kinds of querry
procedures of the data in order to get a plenty of useful informations about land parcels,
objects, owners, and many others. Usually these querry procedures are made with script
commands inside the GIS application. The output procedures of such querry procedures
can be shown graphically in separate layers or with alphanumeric values.
Scanned paper map Google earth raster
image
Geospatial SDI
Table 1 Table 2 Table 3
Attribute SDI
Real estate
Spatial Data Infrastructure (SDI)

International Conference SDI 2010 – Skopje; 15-17.09.2010
352
2.3. Spatial Data Modelling Methodology
2.3.1. Defining of the coordinate system for the study area
All locations on the earth are defined with a coordinate system. A geographical
coordinate system (GCS) uses a
three dimensional spherical surface to define locations on the Earth (ESRI, 2004). Each
point in the earth is referenced by its longitude and latitude value. Longitude and
latitude are angles measured from the earth,s center to a point on the earth,s surface. The
Geographic coordinate system and Cartesian coordinate system used on the Earth,s
surface are most common examples of coordunate systems.
To correctly represent the curved earth,s surface on a flat map we need a map projection
which is a method of portraying the curved surface of the earth on a flat surface
(ILWIS, 2001). A map projection defines the relationship between the map coordinates
and the geographic coordinates, latitude and longitude. With the help of a map
projection, geographic coordinates are converted into a two dimensional metric
coordinate system, measuring the X and Y coordinates in meters (ILWIS,2001). Each
map projection has a set of parameters that should be defined. The parameters specify
the origin and customize a projection for a particular area of interest. Angular
parameters use geographic coordinate system units, while linear parameters use the
projected coordinate system units (ESRI,2004).
Today , one of the most used system is the Universat Transverse Mercator coordinate
system which is a specialized application of the Transverse Mercator cylindrical
projection (ESRI,2004). The globe is divided into 60 north and south zones, and each
spanns 6 degrees of longitude from west to east direction.
The UTM system is very suitable for representation of small shapes of area. It has also
minimal distorsion of a larger shapes within the same zone.
Moreover, because the maps or images obtained with Google Earth are mostly defined
with latitude-longitude coordinates or metric coordinates, it is suitable to be used the
UTM for both images (the scanned cadastral map and Google Earth mosaicing image).
The zone number for the study area is 34-Nord, the Datum is WGS 1984, and Elipsoid
WGS84.
The use of the UTM coordinate system causes in the study area some distosions and
errors regarding the spatial accuracy of the parcels and objects of the urban settlement.
Therefore, the use of this SDI GIS application should be mostly for public use, and can
not be used for accurate cadastral planning (Izeiroski,2008).
If we want to use the application professionally for cadastral purposes at municipality
level we should obtain maximum spatial accuracy of the geospatial entities (parcels,
objects and other resources). In such case we should use more acurate ortorectifyed air-
photos or satellite images with high resolution and precision (less than 0.5m which can
be purchased ). For such professional aplication furthermore we should use also the
state co-ordinate system of Republic of Macedonia based on Bessel,s elipsoid and
Gauss-Kruger map projection ).
2.3.2. Georeferencing of the raster images
Before starting with vectorisation (digitization) of parcels, it is necessary the map to be
georeferenced. The georeference is a service object, which stores the relation between

International Conference SDI 2010 – Skopje; 15-17.09.2010
353
the rows and columns in raster map and the ground-coordinates X,Y (ILWIS 3.0,
2001).
In the study area it is used method for georeferencing with tiepoints (ground control
points). With GPS receiver or directly in Google Earth are peciselly defined several
points (usualy around 10) with their X and Y coordinate values. For each tiepoint, the
values of X and Y are written in the table of the georeference editor. Beside X and Y
values, for each point is also defined in which row and column is located, and with
mathematical calculation it is calculated the value of distorsion for each point in the
procedure of georeferencing.
The correction of distorsion can be done with different type of mathematical
transformation. Mainly it is used the s.c. affine transformation of first order (ILWIS
3.0, 2001) which is given with the equations (1) and (2):
nn caraax 210 ++= (1) nn cbrbby 210 ++= (2)
Where: rn is the number of row, cn is the number of column, and x,y are coordinates of
the point in the map.
The accuracy of the transformation is defined with Sigma parameter which is defined
with the RMSE (Root mean square error). After the georeferencing of the immage,
when the mouse is moved around on the display, at the status line in the bottom of the
screen are shown X and Y or Lat-Lon coordinate values of the pixels. Fig. 4.
Figure.4. Georeference editor in ILWIS . (Izeiroski,2008)
After the defining of projection and making georeferencing of the scanned paper map or
mosaicing immage, the parcels, roads and all objects can be digitized (vectorized).

International Conference SDI 2010 – Skopje; 15-17.09.2010
354
2.3.3. Creation of Geospatial SDI
For the study area has been used the open source GIS software ILWIS (Integrated land
and water information system). It is a GIS system with possibilities of image
processing. It allows input, managing, analysis and presentation of image geographic
data (ILWIS 3.0, 2001).
The settlement “Lavcanska” consists of parcels, constructed objects on them as well as
other infrastructure objects: streets and other geospatial entities.
The workflow operations of the vectorization encompasses the following steps:
1. Creating of segment map of the parcels.
In this phase all contours of the parcels have been vectorized with aim of the scanned
paper maps as a background layer. First have to be defined the name of segment file and
the domain, then ILWIS opens the segment editor, and with manual on screen digitizing
have been digitized all parcels. After the finishing of digitizing, the segments are
checked for errors (self overlaps, dead ends and intersections).
2. Creating of point map with ID numbers of Parcels.
In this phase has been created a point map with ID numbers of all parcels in the
settlement . This point map is connected to poligons of parcels.
3. Creating of polygon map of parcels.
Now all segment parcels have to be poligonized in order to be connected with the point
map. On the basis of the point map, all poligons will be labeled with the same ID
number as the label points in the point map.
In the similar way and order is formed also the segment map, point map and polygon
map of the all objects which are on parcels. Some parcels are empty because there is no
any object built on them.
After finishing of the vectorisation of all parcels and objects it is obtained a final vector
file of the settelement with parcels, objects and streets , Figure. 5 & Figure. 6.
Fig 5. Map window in ILWIS with segment files of
parcels, objects and roads. (Izeiroski,2008)

International Conference SDI 2010 – Skopje; 15-17.09.2010
355
Fig 6. Map windopw in ILWIS with polygons of
Parcels and objects. (Izeiroski,2008)
2.3.4. Creation of the attribute SDI
The creation of attribute tables in ILWIS is simple and easy for updating and editing of
data records. A table in ILWIS can be created directly with the command “create
table” from operation list in the main window.
In the case study have been created two attribute tables, one for parcels and one for
objects with personal data of the owners.
The table of parcels consists of main ID column with ID numbers of parcels same as in
the scanned cadastral map and three additional columns: Type of parcel, Area, and
Value of the parcel.
The second table of object has the same main column with ID numbers of parcels, and
the following additional columns : Type of object, Owner, Adress, Personal ID number
of the owner etc. There can be also added more columns according to the need for
additional data.
With ILWIS is possible automatically to be calculated the area of each parcel in square
metres. In order to be made this, all vectorized polygons of parcels have to be rasterized
with the operation “Polygon to Raster” and then with the operation “Area
numbering” automatically ILWIS creates a table with calculated values of the area of
all parcels in square metres (m2). The error in calculating of the area of parcels depends
on the choosen cell resolution during the rasterization process of the parcels. If it is
used smaller cell resolution the accuracy of the calculation of the area will be more
precise. The column with the ID numbers of parcels is fullfiled with the same numbers
of parcels as in the existing cadastral map. The column with values of parcels is
fictitious and should serve just as a formal information. We can easily add more
columns in the table of parcels depending of the needs for additional attribute
informations regarding the parcels.

International Conference SDI 2010 – Skopje; 15-17.09.2010
356
The second table of objects consists of the same main ID column with ID numbers of
parcels same as in the scanned cadastral map. The information of the other columns in
this table describe the type of objects which are built on each parcel, the owner with
personal identity number, adress and other informations depending of the purpose of use
of the spatial data infrastructure of both tables. All information of owners can be
obtained from municipality and cadastral institution at the local level. The information
of owners in the case study are fictitious and are used just for description of possibilities
of use of such data for different purposes.
After the creation of the attribute SDI with both tables, there can be made a plainty of
querry procedures in order to be obtained useful informations.
In order to be made query procedures with data on both attribute tables, they have to be
joined. For joining of tables it is necessary to have at least two or more tables. It is
important for both tables that have to be joined to have a common column with same
domain of values. In such case the domains of both tables serv as a keys for joining of
the tables and make a relational database system. In the proposed case of study, the
table of parcels and the table of objects have the same ID domain. Both tables are
joined through the column with ID numbers of the parcels, which is main column of
each table, Figure 7.
Fig 7. Joining tables with same domain (ID of parcels are used as key columns).
(Izeiroski,2008)

International Conference SDI 2010 – Skopje; 15-17.09.2010
357
Besides automatic calculation of the area of Parcels, also can be made many other
calculations with the atribute data in both tables.
We can use many arithmetic, relational, logical and other operators as well as many
conditional IFF functions with the values in columns of the both tables.
For example, the area of a parcel can be expressed also in hectares . For this reason it
can be used the equation (3)
Value=Area/10000 (3)
Using many different operators can be created new columns with information of
interest. For example, if has to be defined: Which objects are garages, this can be done
with the following expression in the command line of the table window in ILWIS,
equation (4)
Result1=IFF(object type=,,Garage”, object type,?) Enter (4)
With the command (4) is formed a new additional column in the table of objects with
records showing garage objects only, in all other cases stands the sign “?” in the
column.
In order to be determined, which object(s) belongs to certain owner, this can be done
with the following equation (5)
Result2=IFF(owner=,,Nikolov Nikola”, owner,?) Enter (5)
In such a way there is shown only the name of that person which is owner of hisown
real estate (house, garage or something else).
If we like to know, if some owner has exactly defined type of object, this can be done
with the following
equation (6)
Result3=(vidobjekt=”kukja-1kat”)and(sopstvenik=”Izeiroski Subija”) Enter (6)
The use of operations and functions is endless. Hier are given only a few examples of
such query procedures for extraction of useful data.
After completing of the above mentioned querry procedures in the basic table of parcels
are added additional columns of informations according to the executed querry
procedures and functions Figure 8.

International Conference SDI 2010 – Skopje; 15-17.09.2010
358
Fig 8. The table of parcels with additional columns:Result1,Result2,…
(Izeiroski,2008)
ILWIS has also a special tool for simoultaneously exploring of data of particular
locations in the polygon maps which are connected to attribute tables. This useful tool
of ILWIS is so called Pixel information window. Fig. 9. This tool allows an
interactive view of coordinates, class name, ID number of the particular parcel as well
as other information of the marqued parcel on the display.
Fig.9. Display of the polygon map of parcels with pixel
information window. (Izeiroski,2008)
Position of the mouse and
display of informations
with pixel information
window.

International Conference SDI 2010 – Skopje; 15-17.09.2010
359
With additional statistical functions can be made also more complicated analyses with
the spatial data such as: Regression, Corealtion and Convolution analysis in order to get
more specific informations from the relational spatial database infrastructure.
As it is seen from above explanations, ILWIS delivers a wide range of features
including import/export of files with different file extensions, digitizing, editing,
geospatial analysis, and eficient display of data as a base for appropriate decision
making regarding land record issues.
3. SETTING UP OF THE SDI APPLICATION ON THE WEB
3.1. Setting up the Map Server
The Map Server is a software tool for rendering of GIS and other Geospatial
applications (as a specific complex graphic database consisted of graphical and attribute
files) on the WEB. Map Server works in WEB environment as a CGI-common gateway
interface script and also through the application based on other programming
languages (Perl, Python, PHP) (Bill Kropla,2005).
Map Server creates map images using geospatial data in digital form from other GIS
packages. It supports many raster and vector formats of graphic files. It can work in
two ways, as a CGI or as a map script.
The Map Server is based on templates. At the background it has support by a WEB
server. Usually at the installation it is installed together with the Appache WEB server.
The principle of work of the Map Server is shown in Figure 10 (Tyler Mitchell , 2005).
First the WEB server receives a map request for presenting of graphical maps with data.
Such request send the WEB server to the Map Server. Then the Map Server reads the
configuration map file created with CGI script commands in the Map Server. With this
map file are described all layers with geospatial data as well as all other data of the map
which schoul be presented. The Map Server reads then one or more HTML templates
which are defined in the map file .
Fig.10. A diagram showing the basic operations of a MapServer application (Tyler Mitchell ,
2005)
Map Server
Program Map
file
Remote data
Databases
Databases
WEB Server
Map request Resulting map

International Conference SDI 2010 – Skopje; 15-17.09.2010
360
In the Map Server are used also other templates for efficient execution of querry
procedures in order to be extracted all necessary attribute data from the graphical maps.
Such defined map images with implemented templates determines and forms a complete
geospatial database set on the WEB environment, which can be viewed and used
through the Internet.
Before can be used, the Map Server should be first configured for the platform of the
operating system (Tyler Mitchell , 2005). Because most used operating system today is
Windows , Map Server has to be configured to work properly in the Windows platform.
The Map Server for Windows is known as MS4W. Map Server together with the
Appache WEB server and other accompanied tools is installing mainly on a separate
folder C:\ms4w\ . After installation is executing test of the proper functionality of the
Map Server.
3.2. Preparation and Setting up of the SDA GIS application on the WEB.
As it is seen previously, the spatial data infrastructure was creadet in ILWIS software.
Because ILWIS use itsown format extensions for data, first there have to be exported
all spatial and nonspatial data in appropriate format which can be used by the
MapServer. All spatial data in vector and raster format have been exported to separate
folder C:\ms4w \apps\lavci with extension .shp for vector and .tiff, .gif, or .jpg format
for raster data. All attribute data from tables have been exported and defined with .dbf
format. After that has been created a map file with CGI script language together with
the basic HTML templates which is used for initialisation of the application on the
WEB and for defining of other parameters of the application. With a separate group of
templates will be executed querry procedures for extraction of data from different data
layers. All templates are located in C:\ms4w \apps\lavci\templates . It is also defined
s.c. Alias name for access to all files, which shows the WEB server where the URL
adress of the application is located. This should be defined in C:\ms4w
\Apache\conf\httpd location. The alias is defined with enter of the following settings in
the httpd.conf file: Alias /lavci "/ms4w/apps/lavci/"
<Directory "/ms4w/apps/lavci">
AllowOverride None
Options Indexes Multiviews
Order allow,deny
Allow from all
</Directory>
With properly executed configuration, the Map Server is ready for use for the
application. The setting of the application is done at the local host:
http://127.0.0.1/lavci/index.html. The initial display of the application is shown in
figure 11.

International Conference SDI 2010 – Skopje; 15-17.09.2010
361
Fig.11. Initial start of the application with Microsoft Internet Explorer (Izeiroski,2008)
After clicking on the Lavci Demo button , the MapServer reads all data from the map
file, HTML templates, as well as HTML templates for query procedures. Then sends
Map Server the content of template files to the Appache WEB server, and this sends
them further to the browser. The map file is initialising on the basis of the URL
location, and it is shown then the application on the display, figure 12.
Fig.12. Display of the application in WEB environment (Izeiroski,2008)
At the left side is shown the frame of vectorized spatial data including parcels, objects
and streets of the settlement. On the right side of the display is shown a small raster
image of the settlement, the map scale, map extent in the determined coordinate sytem
as well as x and y coordinate values of a certain location on the map. All spatial data
are defined with four layers which can be put on or off depending of the user needs.
There are also created couple of tools for manipulation with the spatial part of the
application (pan. zoom in , zoom out etc.).
In the map mode beside the browsing through the spatial part of the map, there can be
made also a lot of query procedures. After the activation of a query procedure with a
single click on some object or parcel on the map it is shown at the display the particular
object in different colour and is shown also the particular row with atttribute data of
the selected parcel or object , figure 13.

International Conference SDI 2010 – Skopje; 15-17.09.2010
362
Fig.13. Display of the particular parcel with attribute data in WEB environment
(Izeiroski,2008)
Beside this , in Map Server can be made a plenty of more specific querry procedures for
obtaining of different informations which are subject of interest.
With the support of other programming languages can be also made any SDI/GIS
application with more sophisticated graphic user interface with a plenty of additional
tools for browsing, querrying and manipulation with the spatial data infrastructure on
the WEB.
4. CONCLUSIONS
In this paper has been developed methodology for creation of integrated RS/GIS system
for administration of real estate. The proposed aerial RS image based real estate GIS
information querry system has a character of low cost, short constructing period and
simple practical function in the area of administration with the spatial data
infrastructure. The raster RS image and old cadastral map have relativelly good
matching with the digitized vector layers of parcel, object and roads of the settlement.
For more accurate and professional use of spatial data regarding the real estate should
be used ortorectifyed aerial photos and sattellite images with high resolution, high
accuracy and best matching with the geometry boundaries of parcels and objects.
The future researches of the spatial data for real estate managing based on satellite data
should be directed toward the development of complete solutions for spatial selecting
and clipping the data in the perspective space, with capabilities for managing large
volume of spatial information as a real-time application. The future application in this
area should also ensure an eficient change detection of spatial entities in real time with
comparation of remote sensing satellite images of the same area in two time sequence
intervals. Further application should not be limited only to real estate, but also
applicable toward the eficient city planning, environmental resource detection etc.

International Conference SDI 2010 – Skopje; 15-17.09.2010
363
5. REFERENCES Bill Kropla, 2005, Begining Map Server–Open source GIS Development, Apress ESRI, 2006. GIS best practices - Land Records and cadastre. www.esri.com/cadastre [acessed May-2008] ESRI, 2004. Understanding Map Projection , Esripress ILWIS 3.0 Academic User's Guide, May 2001, Unit Geo Software Development, Sector Remote Sensing & GIS IT Department - International institute for Aerospace Survey and Earth Sciences (ITC) Enschede, The Netherlands, www.itc.nl/ilwis [acessed March-2008] Izeiroski Subija, 2008. Raster based integrated Remote Sensing GIG system gor managing of
real estate , Master thesis, University ,,St.Kliment Ohridski”-Bitola, Faculty of technical sciences
– Bitola .
Putra Simon Yanuar, Li Wenjing, Yang Perry Pei-Ju, 2003. Object-oriented GIS Data
Modelling for Urban Design, Map Asia Conference 2003.
Shahab Fazal, 2008. GIS Basics , New age Limited International publishers.
Sherman E.Gary , 2008. Desktop GIS, Mapping the Planet with Open Source Tools, The
Pragmatic Bookshelf
Turker Mustafa & Kocaman Sultan, 2003. The Design and Implementation od a Cadastral
Database with a Spatiotemporal Modeling Approach in Turkey, Map Asia Conference 2003. Tyler Mitchell , June 2005 ,Web Mapping Illustrated :– O’Reilly William E Guxhold, Eric M. Fowler, Brian Parr,2004.ArcGIS and the Digital city- A hands on approach for local government, EsriPress http://mapserver.gis.umn.edu.[acessed May-2008] .
6. BIOGRAPHICAL NOTES OF THE AUTHORS
M-r. Subija Izeiroski, was born on 05.09.1964 in Struga, Republic of
Macedonia. He graduated at the Faculty of electrical engineering &
computer sciences at the University in Ljubljana, Slovenia in 1990. From
1990 to 1993 worked in Ljubljana in a company specialized for
measurements of electric supply and projecting of alarm systems and
sensors. Since 1995 posess hisown agency for translating from Slovenian,
German & English language into Macedonian language and viceversa. In
2008 he received degree of master of sciences (MSc) at ,,St.Kliment
Ohridski,, University in Bitola. His master thesis was ,,Raster web based
integrated Remote Sensing/GIS system for managing of real estate,,. Since the beginning of 2008
is employed in the public enterprise ,,Makedonija pat,, section in Struga as a leader engineer for
technical and investment tasks. He is author of two papers presented in national scientific
meetings, and during the year 2009 has also made two applications for scientific projects (one
between Macedonia and Slovenia, and the other IPA project Macedonia-Albania). Currently he is
a Ph.D candidate at ,,St.Kliment Ohridski,, University in Bitola.
Dr. Igor Nedelkovski received a Ph.D degree in Technical sciences in
1997 from the University "St. Kliment Ohridski"-Bitola, Faculty of
Technical sciences-Bitola, Macedonia / Warsaw University of Technology,
Institute of Heat Engineering – Warsaw, Poland , Master of Technical
Sciences in 1993 from the University of Belgrade, Faculty of Mechanical
Engineering - Belgrade, Serbia, and B.S. Graduate Mechanical Engineer
(dipl.ing) in 1990 from the University "St. Kliment Ohridski" - Bitola,
Faculty of Technical Sciences - Bitola, Macedonia. He is currently
Professor of Computer graphics and Multimedia, Engineering Expert
Systems, at the Faculty of Technical Sciences - Bitola. His research interests include also
GIScience Analysis and Spatial Modeling, and CAD/CAM.

International Conference SDI 2010 – Skopje; 15-17.09.2010
364
Dr. Peter Gorsevski received a Ph.D. degree in Natural Resources from
the University of Idaho (2002), an M.S. in Forest Engineering from Oregon
State University (1996) and a B.S. in Forestry from Ss. Cyril and
Methodius University, Republic of Macedonia (1992). He is currently an
Assistant Professor in Geospatial Sciences at the Bowling Green State
University in the School of Earth, Environment & Society. His research
interests include GIScience Analysis and Spatial Modeling, Terrain and
Watershed Modeling, Spatial Decision Support Systems and Remote
Sensing and Airborne Sensor Development.
Kujtim Xhila is geodetic engineer. He graduated at the University
,,St.Kiril i Metodij,, in Skopje, Republic of Macedonia. Currently is
employed in the midle school ,,Niko Nestor,, in Struga as a teacher of the
subjects in the area of geodesy .

International Conference SDI 2010 – Skopje; 15-17.09.2010
365
MULTIPURPOSE LAND INFORMATION SYSTEMS - AN
ALBANIAN PERSPECTIVE
Pal NIKOLLI
1, Bashkim IDRIZI
2,
Ismail KABASHI3, Sonila PAPATHIMIU
4
ABSTRACT
The need for more, better, and integrated land information and the availability
of technology to meet this need, have set the stage for the development of Multipurpose
Land Information Systems (MPLIS). In the paper we note that the cadastral maps being
produced in Albania would be part of the graphic material of an MPLIS and the
property register information (such as registry books, tapi, etc) would be included as
part of the attribute record in text form. The MPLIS is a relatively complex system, but
it covers many needs of both government and the private sector. We recognize the
current need to focus on cadastre as part of Land Market Action Plan. The Government
of Albania has begun planning for the future as the needs for an MPLIS are increasing
and the free trade economy is making such a system economically feasible. Therefore,
we suggest the development of an MPLIS for Albania.
Key word: Albania, Land Information Systems, Multipurpose Land Information
Systems, cadastre, cadastre maps, reference frameworks.
1. INTRODUCTION
Vital components for human life are land, access to land and managing the
land. The land is fundamental for humankind because it carries all things on it such as;
roads, buildings, animals, the air above, the water and the minerals within its surface.
The land means to many people the space for their activities and the different forms of
holding and managing its resources.
1 Prof.Dr.sc. Pal NIKOLLI, [email protected]
Tirana University, Department of geography, www.fhf.edu.al
Gsm.: +355 69 2472-451
Elbasan street, Faculty of History and Philology, Tirana, Albania. 2 Prof.Dr.sc. Bashkim IDRIZI, [email protected]
State University of Tetova, www.unite.edu.mk,
Tel.: +389 2 2612-492, Gsm.: +389 75 712-998, Fax: +389 44 334-222
Str. Xhon Kenedi, 25-4-20, 1000 Skopje, Republic of Macedonia. 3 Dr. Eng. Ismail KABASHI, [email protected] University of Pristina, Dept. of Geodesy, Pristina, Kosovo; 4 Msc. Sonila PAPATHIMIU, [email protected] Tirana University, Department of geography, www.fhf.edu.al Gsm: 00355693754033
Elbasan street, Faculty of History and Philology, Tirana, Albania.

International Conference SDI 2010 – Skopje; 15-17.09.2010
366
Conventionally cadastral systems have supplied spatial information for land
administration, spatial planning, billing for cost recovery from services etc. New
approaches to spatial information and land information management are required to
upgrade and manage cadastral parcels. Automated land information systems are being
proposed and developed throughout world. Because many, if not most, of these systems
are being developed with public funds, it is essential that methodologies be developed
that can be used to evaluate the effectiveness of these expenditures.
We use the term Multipurpose Land Information Systems to refer to a system
in which “the fundamental means of organizing data is the cadastral parcel or
proprietary land unit”, which main objective is “the provision of institutional data
concerning land ownership, value and use”. It is built to support a wide variety of
applications. The underlying data should be accurate enough to support the envisioned
applications, compatible so that data sets can be used in combination with each other
and comprehensive so that current and appropriate data are available when they are
needed.
A fully implemented Multipurpose Land Information System should be
incorporated into an environment that provides:
1. The fundamental land base;
2. Data features on or near the Earth’s surface;
3. The means to interpret and manage these data – increasingly computer
software;
4. The media upon which data and management techniques reside, increasingly
computer hardware;
5. The means to represent and disseminate data and information;
6. People organized to oversee the system operations;
7. Procedures for using and maintaining the system.
Such a system would permit data to be used conveniently and accurately
through spatial analyses, such as polygon overlay, area and distance calculations. It
would also use interrelationships among data sets for tying maps to a common spatial
reference system and for linking records through common identifiers.
The variety of land necessitates a system capable of integrating different
information and improving the flow of information between different organizations.
This different information can be classified into four major categories:
- environmental or natural information,
- infrastructure/utility information,
- legal/fiscal, “cadastral” information; concerned with land tenure and land use,
- socio-economic information.
A Multipurpose Land Information System is capable of integration these
different kinds of information and serves different purposes. This different information
can be viewed as different layers within an MPLIS.
The types of information mentioned above, have been created and developed
also in Albania, but only in some particular institutions and departments, working apart
from each other and for their own purposes. In the absence of a consolidated Spatial
Data Infrastructure (SDI) and when the standardized geographic information does not
exist, it emerges the obligation to improve and stabilize the use of SIG in the institutions
and departments that do manage this information, on purpose to build and develop
MPLIS also in Albania.
In Albania, it constitutes a basic and critical resource at the economical, social
and affective levels. Investors consider that among economic speculations the land is

International Conference SDI 2010 – Skopje; 15-17.09.2010
367
seen as the most profitable and secured investment. The relationship between Albanian
owners and lands is the ownership. The study of Albanian cadastre enables a discussion
of beneficial aspects of this system to support land management matters. The
establishment of a cadastral system, in Albania, is widely linked to the progress of the
activities of three fundamental components: juridical cadastre, national cadastre, and
national land agency. The objective of this paper is to note the role of the components to
establish the Albanian Multipurpose Land Information System.
2. IMMOVABLE PROPERTY REGISTRATION IN ALBANIA
The need for a registration and cadastral information system has a long history.
Since the Assyrian – Babylonian and ancient Egyptians eras, the concept of “publicity”
of a transaction was important. The Roman emperor, Diocletianus, mandated an
imperial cadastre for fiscal purposes. Similar projects took place in China (circa 700
AD) and in southern India, under Raja the Great in 1000 AD. In England, William the
Conqueror created a written national inventory in 1085 which resulted in the creation of
the “Doomsday Book”, which is considered the origin of the concept of the “cadastre”.
Incredibly, that work was completed in only one year. It was not until the end of the 16-
th century, however, that technologies for land surveying and mapping were developed.
In Western Europe, all the cadastres are based, on the French system (l’ancient
cadastre), defined by Napoleon at the beginning of the 19-th century. The cadastres
contain two principal elements. One is the written description. The other is a map which
shows the location and the boundaries of all units of land. Each unit has an individual
cadastral number in order to join the two sources of information. Originally, the
cadastres were used for tax collection
The historic evolution of the land structures in Albania has passed through the
Turk land organization (timar and çiflik). After the independence proclamation, the land
structures has not changed very much in spite the several efforts done by the
governments in charge during the period 1912 -1945. Before and during the Second
World War 27% (or 106300 ha) of the arable land was latifudndial property, and the
main land owners were the farmers. We should underline that in this big group, we can
find many cases and sub groups, the forest and pasture land were generally property of
the community. The main turnover in the land structures of the country has happened
after the second war with the power of the Communist Party. The agrarian reform has
been begun on 1945 with the approbation of the law “About the agrarian reform”.
During the application of the reform was distributed a surface of 147.340 ha, to the poor
families and beneficent 145.000 families. The main arable land was organized in little
farms with a surface in average of 2.2 ha. The land surface of the ex owners in the first
version of the law were limited on 40 ha and in the second version in 5 ha. The impact
of the reform were not very long lasting because in 1946 the communist Party, begun
the socialization of the agriculture that meant also the forced socialization of the land.
After an intensive and very hard policy of collectivization, the private land was
reduced only in house yards, in 1967. The main land organizations during the period
1970-1990 were the state farmers and the socialist cooperatives. These organizations
presented respectively 24.1% and 71.6% of the arable land. It is important to underline
the role and the organization of the socialist cooperatives. Legally these organizations
were group property but in their activity the group didn’t had the possibility to decide

International Conference SDI 2010 – Skopje; 15-17.09.2010
368
the economic policy and to establish the agricultural plants and the market where to
place the production.
Since the late 1980’s, a massive transformation of land management is
occurring in Eastern Europe including Albania, and Eurasia. Prior to 1989, State
institutions were responsible for the management of land, that is, State agencies made
the decisions about how to use the land and about who would profit from that use.
In Western market economies, special institutions to deal with the
identification of “true owners” have existed for hundreds of years, but in the
completely “socialized” countries as was nearly the case in Albania after 1975, there
was no use of such entities, since land and buildings were not privately owned. Land
administration agencies registered the use of properties such as land and buildings for
the state users (different ministries and institutions), or private occupiers, such as
apartments and houses.
But even during the “socializing” period of property ownership following
World War II, land administration institutions from the previous political economic
model continued to operate, such as the “Hipoteka” offices in most cities which
recorded deeds of sale when sales were allowed, as well as deeds of mortgage and
inheritance arrangements when these transactions occurred. In the 1920’s, Albanians
had adopted the French institution of “Hipoteka” offices, which recorded deeds of
mortgage and sale and inheritance documents pertaining to land, houses, and
businesses, but only for the main urban areas of the country. Similarly, the Cadastral
Offices recorded the results of the 1948 land reforms which distributed much of the
agricultural lands previously held by the large landowners to the peasantry. Following
the adoption of the 1975 Constitution in Albania, which recognized only State and
collective ownership of land and buildings, the Hpoteka offices gradually closed. The
cadastral offices had already shifted from the recording of rights to land, to recording of
the uses of agricultural land in support of the collective agricultural enterprises
established after 1950.
With the end of private property in 1975, there was no reason to keep the
Ipoteka offices open, and the last one, in Tirana, was closed in 1980.
Land distribution done during 1991, faced the Albanian agriculture with
different problems of farm organization as well as land structures. The main problems
of land structures can be summarized on these points:
- The extreme land fragmentation
- The security, “ insecurity about the property”
- The land policies and the confrontation of the agriculture versus the other
economic activities (tourism and urbanization)
Originally the Eastern Europe countries had traditional cadastres, but these
have been used recently for environmental purposes or for agricultural land
management. Currently there is a movement to “re-invent” the cadastres, with projects
such as the one in Albania. Albanians decided to make the transition to a market
oriented political economy, based on the private ownership of land and buildings.
Private ownership rights include the right of the owners to sell their properties to other
private persons through contractual agreements between buyers and sellers. Markets in
land linked to markets in capital and labor are central to market economies. Land
markets in the market oriented economies are important mechanisms for deciding who
has access to land and how the land is used, instead of the planned political economy's
State institutions which has exercised these functions for previous decades.

International Conference SDI 2010 – Skopje; 15-17.09.2010
369
As the management of land becomes privatized, the institutions of land
administration (understood as the processes of recording and disseminating information
about the ownership, use and value of land) must also change from serving the needs of
State agencies, to serving the needs of private managers of land.
Privatization of land and buildings does not happen overnight. Land of
different types have different requirements for shifting into private ownership,
according to the policies of the transition. In Albania, the privatization of immovable
property was carried out through a variety of programs, including: (1) the distribution of
the ex-cooperative agricultural land to rural households, mostly in 1991 and 1992; (2)
the distribution of ex-state farm land also to households, approved in November, 1992;
(3) the sale of business sites mostly in 1991-92 to individual owners; (4) the sale of
housing units in state constructed apartment buildings to adult residents begun in 1993;
(5) the restitution of mostly urban properties to their owners prior to state acquisition, or
to their heirs, also begun in 1993; (6) the privatization of enterprises; (7) transfer of
artist studios to their artist occupants in ownership. De facto privatization of agricultural
land began in 1990, as rural people began taking land previously managed by
cooperatives.
The Immovable Property Registration (IPRO) in Albania was designed as a
unified, comprehensive and parcel based title registration system because of its
applicability to a defined parcel of immovable property and the flexibility it has in being
able to be utilized for a multitude of immovable property and mapping related purposes.
The procedures for immovable property registration attempted to establish the technical
and organizational basis for the future development of computer based information
systems which unify geographic (map) and attribute (kartela) information, and linking
these components of a registration information system which opens the door for the
creation of a Geographical Information System that could be of significance for the future
development of Albania.
Central concepts used in the construction of the IPRO in Albania are the
following:
Kartela: A page of information prepared for each immovable property, including
information about its: a) geographical location; b) general description, such as area, type
of property, whether within urban boundaries or not, and whether a part of a building; c)
who holds different ownership rights over the property; d) who rents, leases, uses, has a
servitude, or holds a restrictive agreement over the property; and e) what mortgages,
court decisions, or other restrictions on changing ownership exist. A paper kartela is
filled out for each property, and a digital copy made of the information recorded on the
paper kartela.
Registry Index Map: A comprehensive map of all parcels of land with kartelas.
Scales of maps include 1:2500 for most agricultural parcels and 1:1000 for most urban
parcels. A digital copy of the Index Map is produced, following the completion of the
field surveys.
Registration Zone: A geographically defined area, usually a District, which is the
administrative responsibility of an Immovable Property Registration Local Office (also
known as a local Registry). A zone may be smaller than a District such as in the case of a
large city (originally Tirana had two local Registration Local Offices), or may include two
or more Districts if the Chief Registrar determines that there are not enough properties or
transactions in a District to justify a Registration Local Office in each District.
Cadastral Zone: A geographically defined area, usually a village in rural areas, or
a neighborhood in cities, which is small enough to be able to locate parcels relatively

International Conference SDI 2010 – Skopje; 15-17.09.2010
370
easily, usually containing no more than 1500 immovable properties. There are no more
than 200 Cadastral Zones in any Registration Zone, and usually fewer.
Immovable Property Number: Each immovable property in Albania has a unique
number, composed of the Cadastral Zone number and within that zone, a unique number.
For agricultural parcels this unique number within a zone is usually composed of the old
field number followed by a “slash” and a subdivision number. For example, the number
1289 11/32 refers to subdivision 32 of old field 11 in Cadastral Zone 1289. For
apartments, the number is composed of the Cadastral Zone number and within that zone a
unique number, which is usually the old building number, stairway number and apartment
number.
The Albanian IPRO manages a combination of paper based information and digital
information. The IPRO in Albania is composed of Registration Local Offices in each
District which record and display information about the rights that people and/or agencies
hold in immovable properties. The IPRO (and the laws that protect such rights) should
provide significant psychological security to the holders of property rights, and is, thereby, a
central institution for assuring societal stability.
The IPRO also enables people and agencies to engage in transactions involving such
properties without physically exchanging them (a necessity for “immovable” properties!).
That characteristic of the IPRO distinguishes it from market institutions which structure
transactions in reference to commodities and to labor, and even fundamentally the
institutions, which structure the market transactions involving capital (money).
Digital copies of the Kartelas and Index Maps are supposed to be produced for
archival purposes and for supporting the operations of the Registration Local Offices (for
example, owner name indices, the production of updated Index Maps). In those Registration
Zones with proper conditions, more of the registration operations can be gradually
computerized.
Any action which changes the information contained on a kartela or on the index
map by law must be registered, that is, the parties responsible for the change must apply to
have the change introduced into the kartelas and/or index maps which comprise two of the
most important elements of the IPRO information system. This means that if the change
has to do with information on the Kartela, the change must be made in the physical kartela
and should also be made in the digital database copy of that Kartela. If a change involves a
boundary change (subdivision of an existing parcel or merging of two existing parcels, or
correction of an error on the index map), it must be recorded on the physical index map
and should also be incorporated into the digital copy of that index map.
3. CADASTRAL SURVEYING AND CADASTRAL MAPS IN ALBANIA
The production of cadastral maps was done for about 40 years by using the
classical methods (tachymetry) at a scale of 1:2500 and 1:5000. About 1,070,000
hectares, or about one-third of the entire area of the country, were surveyed with this
method, including 629,000 hectares of cultivated agricultural land, or 90 percent of all
agricultural land. These surveys were mainly in the lowland areas of the country. The
maps were used not only for cadastral purposes but also for different considerations
such as land irrigation systems, land management, and so forth. Two co-ordinate
systems for cadastral maps production are applied:
- one system based on the Bessel ellipsoid is used to produce maps at a scale
of 1:2500;

International Conference SDI 2010 – Skopje; 15-17.09.2010
371
- and the other system based on the Krasowski ellipsoid is used to generate
maps at a scale of 1:5000. The Gauss-Kruger projection is used for both systems; for the
first system the central meridian is 20°, and for the second it is 21°.
The maps at the scale of 1:2500 in the Bessel co-ordinate system are based on
a map sheet layout system unique to Albania. All the Albanian territory is covered with
map sheets starting from each side of the 20° central meridian and all the sheets are
referenced by their orthogonal grid values. Map sheets produced in the Krasowski
system are referenced by geographic coordinates. All surveying at the scale of 1:2500
and 1:5000, which is used for producing cadastre maps, is done using the tachymetry
method with different kinds of instruments.
Most of the maps for urban areas were done using the Krasowski system.
These maps cover 42 cities surveyed at a scale of 1:500 with a total area of about 14,400
hectares.
Maps produced at Military Topographic Institute (today-Military Geographic
Institute) are, in general, at a small scale and are not suitable for the production of
cadastre base maps. However, some of these maps, at a scale of 1:10,000 and 1:25,000,
will serve for the registration of forests, pastures, and other large parcels of land.
In Albania there are considerable and useful mapping data which vary in
quality and availability. This information is used to speed up the map-producing process
in places where project work is under way. The data come from three main resources:
- cadastre maps of agricultural land produced by the Land Research Institute at
a scale of 1:5000;
- maps of urban areas produced by the Geology and Geodetic Enterprise,
Ministry of
Construction, at the scale of 1:500 or 1:1000; and
- small-scale maps produced by the Military Topographic Institute.
Unlike many other less developed countries, Albania has a dense network of
geodetic control points (approximately 4 Km density) which in many instances are
clearly demarcated by means of tall tripod signals. Provisional tests using GPS (MSI
1992) confirm that this network has been surveyed to a high degree of accuracy.
In previous years all surveying work was done through the government and
there is no private sector surveying industry. The substantial set of maps that currently
exist in Albania, especially at larger scales (1:500 - 1:10,000), provides a valuable base
of land information on which to build an effective cadastre. The cadastral surveying
approach that is currently being followed is to enlarge the 1:5,000 base maps to a scale
of 1:2,500. The individual land parcels are then mapped relative to topographic map
features with the aid of taped field distances. Very few monuments are used to define
parcel boundaries and for the most part small water furrows or crop lines are used to
differentiate adjacent parcels.
Most of cadastre maps that are currently used in Albania are based on the
Krasowski ellipsoid and Gauss-Kruger projection. The UN Ad Hoc Group of Experts on
Cadastral Surveying and Land Information Systems reached the following conclusion:
Cadastral maps and other land information systems should always be based on a
network of homogeneous control points, preferably connected to the national geodetic
control. Although the primary concern is that the position of each parcel must be correct
relative to its immediate surroundings, longer-term considerations indicate that it also
should be correct in its absolute position in space in respect of the national co-ordinate
system.

International Conference SDI 2010 – Skopje; 15-17.09.2010
372
The national triangulation network covers the entire nation’s territory and is
composed of three orders. The standard error between the positions of the two closest
points is less than 0.125 meter, which satisfies normal accuracy specifications for maps
at a scale of 1:2000.
The national triangulation network is densified in order to provide the survey
control for maps at a scale of 1:2500 and 1:5000. The frequency of point densification
corresponds with mapping scale; the distance between points varies from 0.7 kilometer
to 1.7 kilometers. The proportional accuracy of fixation of adjacent control points is
better than one part in 700, which means they provide adequate control for vertical-staff
tachymetry.
The privatization process has resulted in extensive land fragmentation that is
difficult to depict on the existing 1:5000 scale cadastral maps. Therefore, it was decided
that all the cadastre maps for intensive agriculture areas, which will be managed by the
registration offices, will be at a scale of 1:2500. Cadastral maps for both city-urban and
village-urban areas will be at a scale of 1:500 and 1:1000. The transformation of
cadastral maps at a scale of 1:5000 to 1:2500 will be done by photographic enlargement
of 1:5000 sheets dividing them into four parts. The new cadastral maps consist of a
combination of the original topographic maps and the updated, traced copies prepared
by the district cadastre offices.
The maps for urban areas of villages are integrated with the base index maps of
properties depending on the density of buildings and other features. Maps with a scale
larger than 1:2500 are used in those cases where greater clarity is needed to show the
boundaries and positions of parcels.
In urban areas, index maps are at a scale of 1:500 using existing maps. These
maps have not been up-dated so they often do not show the current situation. Since they
were produced 20–25 years ago, field up-dating together with identification of owners is
required.
Most of the western lowlands, about 4000 kilometers2 are photographed using
aerial photography at a scale of 1:10,000. Aerial photography are used for the
production of new photo maps at a scale of 1:2500 for rural areas. Urban areas included
in the area are photographed at a scale of 1:2500 so that 1:1000 maps can be prepared.
Aerial photography is also taken in those areas where maps are very old and
were done under the Bessel system. This includes one of the most intensively cultivated
agricultural areas and one of the main areas for tourism and infrastructure development.
Since new technology permits the production of photo maps at a scale of 1:2500 from
photographs taken at a scale of 1:20,000, photographs that were produced by the
Military Topographic Institute during 1980–1990 is used for map production in those
mountain areas where changes have been minimal and where little fieldwork is needed.
A combination of photogrammetric surveying and field surveying is used
Aerial photography does not show all property elements, only those that are
visible from the air on the photograph; this does depend on the scale of the
photography. In those cases where physical boundaries are not visible and where the
land is all cultivated with the same crops, fieldwork will be needed in order to complete
the survey.

International Conference SDI 2010 – Skopje; 15-17.09.2010
373
4. MULTIPURPOSE LAND INFORMATION SYSTEM - THE
ADEQUATE TOOL TO SUPPORT REFORM PROCESS IN ALBANIA.
4.1. The Multipurpose Cadastre
Over the last hundred years, cadastral systems have been increasingly
developed. The evolution of modern systems began in Europe in the 19th century to
serve taxation and fiscal purposes. The Napoleonic cadastre in France is a prime
example. Since then, other countries, particularly in the English-speaking world, such as
Canada, USA, and Australia, started to establish their specific systems. In the mid-1970,
cadastral systems began to assume a more diverse role. In 1998, the working group
attached to the commission 7 of the International Federation of Surveyors (FIG)
elaborated a vision for a future cadastral system, called cadastre 2014, for the next 20
years. This project emphasizes the role of cadastral systems being multipurpose and
responding all public and private interests. The multipurpose cadastre is defined as a
system implemented by the following steps:
− Establishment of a cadastral survey base consisting of two interrelated
elements, which are a spatial control framework and a graphical base,
− Establishment of a cadastral survey system that permits to create and
maintain a series of cadastral maps showing the size, shape, and location of parcels,
− Establishment of a cadastral records system that contains two kinds of
information, which are information concerning public and private ownerships legally
recognized in lands and information concerning the historical development of these
rights.
In 1980, the US Committee on Geodesy, in the National Research Council,
established a new project concerning the urgent need of implementing a multipurpose
cadastre for the USA. The study asserted that the multipurpose cadastre is a framework
supporting continuous, readily and comprehensive land information at the parcel level
by implementing the followings components:
− A reference framework consisting of a geodetic network,
− A series of current, accurate large-scale maps,
− A cadastral overlay delineating all cadastral parcels,
− A unique identifying number assigned to each parcel that is used as a
common index of all land records in information systems,
− A series of land data files, each including a parcel identifier for information
retrieval and links to other data files.
The multipurpose cadastre provides comprehensive information on land and
presents all information at the parcel level. It is built around a reliable and accurate
spatial framework: base maps, a cadastral overlay linked to juridical information of
properties, and a linkage to land information generated by many offices and users. It
supports both the legal and fiscal purposes. Data are used for facilities management,
base mapping, value assessment, land use planning and environmental impact
assessment. The significant advantage of the existing cadastral system in Albania is the
nature of its registration and titling regime and administrative structure. The registration
and titling process and the surveying activities are performed actually at the local level
by a unique agency called The Immovable Property Registration (IPRO). This structure
guarantees the best co-ordination between the Service of Cadastre and the Service of

International Conference SDI 2010 – Skopje; 15-17.09.2010
374
Land Registry responsible for all cadastral functions. The basis of all surveying
operations is a unique reference geodetic network in spite of its several difficulties
regarding its update and maintenance.
Geographical information systems enable to modernize all operational and
functional processes of the cadastre. New approaches and methodologies are conceived
to modernize the existing systems. The government administration, as a landowner,
needs to establish an efficient system of cadastre to increase the security on
landownership and facilitate land administration. This will permit the monitoring of
land market, the improvement of planning in urban and rural areas, the regulation of
legal framework and statutes of land, and the introduction of new technology to
maintain land reform such as redistribution, consolidation, valuation, and assessment. In
addition, the multipurpose cadastre will ensure within the society a minimum level of
quality and establish a uniform land information system based on properties and parcels.
4.2. Multipurpose Land Information System
The goal of the Land Market Action Plan is to create dynamic land markets
that are socially and environmentally sustainable. Land markets based on the private
ownership of tradable rights to land and buildings function more fluidly within an
Immovable Property Registration System (IPRS). The IPRS provides security to
potential buyers that the sellers are indeed the true owners with rights to sell the
immovable property. The IPRS also enables the linkage of capital and immovable
property markets by providing opportunities and guarantees for the mortgaging of
immovable property, thereby facilitating property owners’ access to long-term
investment capital.
The first model of Multipurpose Land Information System was essentially
basic. Its purpose was to launch the development of a multipurpose cadastre for North
America. The second model, developed by the committee on Geodesy, was adapted to
the new conditions of the USA cadastral system. This project determined the
responsibilities of each organization concerned by land data and defined the role of the
federal government in establishing this system. The committee established guidance in
terms of cooperation, organization, and standards at federal, state, and local levels. The
first configuration seems not adequate to Albanian conditions for the two following
reasons. Firstly, the Albanian cadastral system has its national geodetic network as a
cadastral survey base. Secondly, the land titling system is the unique reference enabling
the registration of land ownerships and the historical development of these rights. The
cadastral system and land titling system deal together with cadastral records and
cadastral operations such as delineation and demarcation of properties and parcels.
Many cadastral maps are created and maintained in each cadastre to report titled
properties. In the second model, we retain the second and third components add two
new characteristics. The first one is the production of a series of current, accurate large-
scale maps keeping the new cadastre continuously updated. The second characteristic is
a generalized cadastre across the USA to serve as a land information system. From the
analysis of the two visions developed in Albania, the two approaches in North America,
the statements of the new visions cadastre 2014, and the current, nature, and needs of
the Albanian cadastre, the following components are proposed to serve as the basis of a
new vision to develop and implement a multipurpose cadastre and Multipurpose Land
Information System:

International Conference SDI 2010 – Skopje; 15-17.09.2010
375
− A global geodetic network as a reference framework,
− A series of regular cadastral sections located and monumented as a basic cadastral
grid for cadastral overlays,
− A series of large-scale maps of natural and physical features,
− A unique judicial cadastre dealing both with titling, registration, and surveying tasks,
− A computerized cadastral information system.
The development of a multipurpose land information system requires the
contribution of many different departments to execute the fundamental components of
the system. Both the governmental and private institutions are involved concurrently to
integrate all items of the new system. The implementation of each component belongs
to a specific institution at national, regional, and local level. The multipurpose land
information system provides not only land ownerships and property information but
also a large variety of land information such as land use, land zoning, infrastructure
information, building, property, and address. The new multipurpose land information
system enables progressively a systematic registration and overcome difficulties of the
ancient system such as long time to update registers, high registration costs per
property, and absence of an exhaustive overview of existing parcels and properties
within an area. The new system aims to support land planning, land administration, land
taxation, and agricultural development projects. The Albanian government as well as
the private sector has an important role in the implementation of a multipurpose land
information system. According to the five components of the multipurpose land
information system and to the five requirements discussed above, the future
organization of the Immovable Property Registration (IPRO) focuses on a hierarchical
structure including three fundamental levels: national, regional, and local. At the
national level, all different departments, offices, and agencies contribute to develop a
wide multipurpose cadastre. The first basic component, the global geodetic network, is a
national activity. The responsibility of a series of regular cadastral sections located and
monumented as a basic cadastral grid for cadastral overlays and a series of large-scale
maps of natural features is assigned to the regional level. At the local level, a unique
judicial cadastre deals with titling, registration, and surveying tasks and the
development of a computerized cadastral information system. This system requires
important efforts and commitments from the government.
Moreover, the IPRS provides security to owners of immovable property that
they or their heirs will benefit tomorrow from investments made today, thereby
providing those people with entrepreneurial motivation and incentive to acquire
properties or to use more intensively those they already possess. This security in a
psychological sense will emerge only after people acquire confidence in the new
institutions and learn what the practical limits of their new rights to land are. However,
the very act of creating the IPRS in the ways devised in Albania is a stabilizing
influence, as will be shown below.
Land markets built on a solid base of accurate and legally protected registration
of rights to properties should function efficiently to encourage market dynamism as well
as productive investments. Yet, in reality, other phenomena can condition and re-direct
the expected effects, giving rise to problems:
- under conditions of unequal accessibility of capital, those with such access will
be able to acquire properties while the disadvantaged sectors of the population
will be excluded from access through the markets, leading to wider gaps
between the rich and the poor;

International Conference SDI 2010 – Skopje; 15-17.09.2010
376
- under conditions of cultural and political inequalities of access to immovable
property, discriminated groups (ethnic groups as well as women in some
countries) will not be able to experience the benefits of immovable property
markets;
- under conditions of economic or political risk, when formal security may be
inadequate to produce subjective feelings of confidence, even formally secure
owners may decide to extract the maximum economic benefits in the shortest
amount of time, leading to environmental degradation and loss of a sustainable
economic base; and
- with political or historical factors that eliminate valuable and valued
immovable properties from the market (such as restrictions on the buying and
selling of certain types of property, declarations of protected areas for parks or
environmental preserves, or pending but unresolved claims of ex-owners to
urban land), people who strongly desire land for housing or business may be
driven to illegally acquire land outside of areas designated for these purposes,
thus leading to the loss of productive agricultural land and increased costs of
infrastructural services as well as environmental and public health degradation.
Multipurpose Land Information Systems (MLIS), including the cadastral
component, are intended to coordinate and integrate all routinely maintained records
concerning the land such that they can be identified and accessed with respect to the
unique portion of the earth to which they refer. Such systems are beginning to appear in
Albania and indications are that the rate of their adoption is increasing. This is a
function of (1) the increasing responsibilities placed upon local government for land
management, and (2) the application of new technologies to meet these responsibilities.
The creation of a functional MLIS, although promising effective benefit/cost rations in
the long term, represents a potentially significant investment. Because these systems are
often public, methods of evaluation need to be developed.
A land cadastre of Multipurpose Land Information System/Geographic
Information System (MPLIS/GIS) is the adequate tool to support reform process of
property registry system in Albania.
For a variety of purposes, policy makers need to have reliable data such as:
1. Topography,
2. Land tenure,
3. Location of boundaries,
4. Location of roads,
5. Right to public access and public roads,
6. Availability and location of electric cables,
7. Availability and location of telephone wires,
8. Water, gas and sewage pipes,
9. Size of lots,
10. Zoning,
11. Address information,
12. Location of police services,
13. Access to educational and health sevices,
14. Location of natural water and rivers,
15. Soil quality,
16. Current lot owner.
Unfortunately, a central source of information related to all of the above mentioned
data generally does not exist. Managers require time to collect all necessary data, for

International Conference SDI 2010 – Skopje; 15-17.09.2010
377
example, to create a strategy for a new (urban) housing development or to renovate a
pre-existing one. Policy makers need the basic information to:
1. Identify limitations and opportunities,
2. Monitor a project’s progress,
3. Evaluate progress and failure,
4. Correct problems as soon as possible,
5. Provide transparency of transactions,
6. Increase level of public participitation in the community and the private sector,
7. Create public – private associations (network, guilds) to stimulate access to
land,
8. Prevent public and private land invasions.
In Albania there are some GIS data, especially about Country Border,
Communes, Castles, Churches, Mosques, Temples, Rivers, Roads, Sites, Villages,
Water-major, etc., but is need to integrate this data to create the Multipurpose Land
Information System.
5. CONCLUSIONS
The need for more, better, and integrated land information and the availability
of technology to meet this need, have set the stage for the development of Multipurpose
Land Information Systems (MPLIS). The cadastral maps that are produced in Albania
would be part of the graphic material of an MPLIS and the property register information
(such as registry books, tapi, etc) would be included as part of the attribute record in text
form. The production of cadastral maps was done for about 40 years by using the
classical methods (tachymetry) at a scale of 1:2500 and 1:5000. The maps were used not
only for cadastral purposes but also for different considerations such as land irrigation
systems, land management, and so forth.
In Albania there are considerable and useful mapping data which vary in
quality and availability. In other hand, most of the western lowlands, about 4000
kilometers2 are photographed using aerial photography at a scale of 1:10,000. Aerial
photography are used for the production of new photo maps at a scale of 1:2500 for
rural areas. Urban areas included in the area are photographed at a scale of 1:2500 so
that 1:1000 maps can be prepared. In Albania there are GIS data about Country Border,
Communes, Castles, Churches, Mosques, Temples, Rivers, Roads, Sites, Villages,
Water-major, etc.
Multipurpose Land Information Systems (MLIS), including the cadastral
component, are intended to coordinate and integrate all routinely maintained records
concerning the land such that they can be identified and accessed with respect to the
unique portion of the earth to which they refer. Such systems are beginning to appear in
Albania and indications are that the rate of their adoption is increasing. A land cadastre
of Multipurpose Land Information System/Geographic Information System
(MPLIS/GIS) is the adequate tool to support reform process of property registry system
in Albania.
6. REFERENCES
1. Barnes, G., D. Moyer, B. Chaplin, M. Sartori, R. Shrestha and E. DesRoche
(1994). "The Design and Comparative Evaluation of a GPS Methodology for

International Conference SDI 2010 – Skopje; 15-17.09.2010
378
Cadastral Surveying and Mapping in Albania." Final Report prepared for the
Land Tenure Center, University of Wisconsin, Madison, 87p.
2. Barnes, G., M. Sartori and B. Chaplin (1995). "A GPS Methodology for
Surveying and Mapping Cadastral Parcels in Albania." Proceedings of ACSM-
ASPRS Annual Convention, Charlotte, N.C.
3. Barnes, G., M. Eckl and B. Chaplin (1996). "A Medium Accuracy GPS
Methodology for Cadastral Surveying and Mapping." Surveying and Land
Information Systems Journal, 56 (1), pp. 3-12
4. Barnes, G. and M. Eckl (1996). "A GPS Methodology for Cadastral Surveying
in Albania: Phase II." Final Report submitted to Land Tenure Center,
University of Wisconsin, Madison, 26p.
5. MSI (1992). "Geodetic Overview for Land Registration/Mapping in Albania."
Report prepared for Land Tenure Center, University of Wisconsin, Madison,
10p.
6. Isufi, Eduard. 1993. “Boletino di geodesia e scienza affini” / The first new
order triangulation in Albania. Revista dell Instituto Geografico Militare, no. 4.
7. Larsson, G. 1991. Land Registration and Cadastral Systems: Tools for Land
Information and Management. Harlow, Essex, England: Longman Scientific
and Technical.
8. Cowie, T. (1999) The development of a local land records system for informal
settlements in the Greater Edendale Area, MSc thesis, University of Natal
(forthcoming).
9. Dale, P. and J. McLaughlin (1988) Land Information Management ,
Clarendon.
10. Fourie, C. (1996) The Role of Local Land Administrators and Land Managers
in Decentralisation, Land Delivery, Registration and Information Management
in Developing Countries, Paper presented at International Conference on Land
Tenure and Administration, Orlando, Florida, USA (12-14 November, 1996).
11. Groot, R. (1997) Spatial data infrastructure (SDI) for sustainable land
management, ITC 3(4).
7. BIOGRAPHICAL NOTES OF THE AUTHORS
Asoc.Prof.Dr.Eng. Pal Nikolli. Graduated at the Geodesy branch
of Engineering Faculty, Tirana University. In 1987 has been
nominated lecturer in the Geodesy Department of Tirana University.
In 1994 has been graduated Doctor of Sciences in cartography field.
During this period, have taught the following subjects:
“Cartography” (for Geodesy and Geography students) and
“Geodesy” (for Civil engineering & Geology students). Actually he
is lecturer and tutor of the following subjects: “Elements of
Cartography” (for Geography students), GIS (for Geography students, diploma of first
and second degree) “Interpretation of Arial Photographs” (for Geography students,
diploma of first degree), “Satellite Images” (for geography students, diploma of second
degree) “Thematic Cartography” (for Geography students, diploma of second degree)
and “Topography-GIS (for the Geophysics students, diploma of second degree). Mr.
Nikolli is the author and co-author 8 textbooks (Elements of Cartography and

International Conference SDI 2010 – Skopje; 15-17.09.2010
379
Topography, Elements of Cartography, Geographic Information Systems, Processing of
satellite images, Cartography, etc), 3 monographs (History of Albanian Cartography,
Mirdita on Geo-Cartographic view, etc), more than 50 scientific papers inside and
outside of the country, more 40 scientific & popular papers, etc. Has participated in
several post graduation courses of cartography and GIS outside of the country (1994,
2000 - Italy), etc.
Ass.Prof.Dr.Eng. Bashkim IDRIZI, was born on 14.07.1974 in
Skopje, Macedonia. He graduated in geodesy department of the
Polytechnic University of Tirana-Albania in 1999year. In 2004, hot the
degree of master of sciences (MSc) in Ss.Cyril and Methodius
University-Skopje. In 2005 he had a specialization for Global Mapping
in Geographical-Survey Institute (GSI) of Japan in Tsukuba-Japan. On
year 2007, he held the degree of Doctor of sciences (PhD) in Geodesy
department of Ss.Cyril and Methodius University–Skopje. He worked in State Authority
for Geodetic Works from May 1999 until January 2008. From October 2003 up to
January 2008, he worked as a outsourcing lecturer in State University of Tetova. From
February 2008, he works as a cartography& GIS Professor at the State University of
Tetova–Tetova. He continu with working as outsourcing lecturer in geodesy department
of the University of Prishtina-Kosova. He is the author of three cartography university
books, and 56 papers published and presented in national and international scientific
conferences related to geodesy, cartography, GIS & remote sensing.
Ass.Prof.Dr.Eng. Ismail KABASHI, was born on 08.08.1965 in
Prishtina, Kosova. He graduated in geodesy department of the
University of Saraevo-Bosnia and Hercegovina in 1992year. In 2003
year, he held the degree of Doctor of sciences (PhD) in Geodesy
engineering department of TU Wienn–Vienna. Currently he is
employee in Vermessung ANGST GmbH ZT as project manager for
Planning and execution of Cadastre and Geomonitoring Projects. From
year 2004, he works as a geodesy engineering Professor at the University of Prishtina-
Kosova. He is the author of many papers published and presented in national and
international scientific conferences related to geodesy and engineering geodesy, as well
as the author of script for students in geodesy engineering field.
MA. SONILA PAPATHIMIU
Pedagogue, Master in Human Geography. She is author and coauthor
of some papers (Tourism and environment in Divjaka-Karavasta
area, a contradictory relationship or a supplementary one, The
importance and the management of the wetlands (study case “The
Karavasta wetlands”), The impact of the industrialization in the
socio-economic and environmental developments of Lushnja town,
The sustainable development of the Karavasta & Narta wetlands
(tourism, agriculture & fishing), The impact of post-communist reforms to the use of
agricultural land in municipality of Divjaka and commune of Qendër, etc

International Conference SDI 2010 – Skopje; 15-17.09.2010
380
THE CREATION OF INFORMATION SYSTEM FOR THE
UNFINISHED LAND CONSOLIDATION OF 1983/89 IN KOSOVO
Murat MEHA1, Bashkim IDRIZI
2
ABSTRAKT
First preparations for land consolidation in Kosovo had started in 1979. Land consolidation
program was one of the main activities in order to raise the production capacities in agricultural
lands, that directly were related to the irrigation system which also was a system increasing. The
implementation of land consolidation started in 1983 and continued up to 1989. During this
period, 100 cadastral zones were involved in the territory of 8 municipalities of Kosovo. In 1989
the project was aborted without a definite finalization. Since year 2000, new circumstances for
Kosovo’s economical development enabled a special treatment to agricultural development.
Important factors to agricultural development were treatment and analysis of the unfinished land
consolidation during years 1983/89. The research of unfinished land consolidation condition, was
done through ALUP project (Agriculture Land Utilization Project – EU founded project), during
2006-2008. Through ALUP3 project, experts Niels O. Haldrup and Murat Meha researched and
presented the actual condition of the unfinished land consolidation from terrain. Changes
registered of the terrain condition and between the foreseen conditions were various. Completed
researches for property’s condition in land consolidation of 1983/39 project proved that:
according to land consolidation none of the properties were registered in cadastral documentation,
the property work is done according to consolidation maps and records, meanwhile the ownership
remains with the old documentation before land consolidation; property exploitation is back again
in the old state which means land consolidation is ruined. Property exploitation and its
documentation are partially with land consolidation and partially with the state before land
consolidation, the lack of information system for cadastral data from land consolidation.
These researches have encouraged the Ministry of Agriculture in Kosovo to undertake safe steps
for the improvement of conditions and for the clarification of juridical property reports of farmers
for their lands in unfinished land consolidation. If land consolidation in Kosovo was developed
during 1983/89, now approximately after 25 years should be done definitely anything for it to be
applicable or to be removed entirely from the agenda.
GIS creation for the unfinished land consolidation through the project which the Ministry of
Agriculture is developing, offers property exploitation and clarification of juridical ownership
reports, by registering it in IPRR. This will be a part of the cadastral information system of lands
in Kosovo, based on the law of immovable property registration. Until now there has not been any
information system for land consolidation in Kosovo.
The article presents the development of land consolidation in Kosovo, its legislation, beginning of
its implementation after 25 years and creating the information system for land consolidation.
Key word: land consolidation, GIS, KCLIS,IPRR
1 Prof.Dr.sc. Murat MEHA, [email protected],
University of Prishtina, www.uni-pr.edu
Gsm.: +377 44 120-958.
Prishtina, Republic of Kosova. 2 Prof.Dr.sc. Bashkim IDRIZI, [email protected]
State University of Tetova, www.unite.edu.mk, www.geocities.com/hartografia/ut.html
Tel.: +389 2 2612-492, Gsm.: +389 75 712-998, Fax: +389 44 334-222
Str. Xhon Kenedi, 25-4-20, 1000 Skopje, Republic of Macedonia.

International Conference SDI 2010 – Skopje; 15-17.09.2010
381
1. INTRODUCTION
Land consolidation is a technical agrarian process with the purpose to regulate the form
of land parcels, providing the road system to create possibilities of land’s rational
exploitation. Land consolidation is directly related to land administration (Meha 2004).
Agriculture in Kosovo is not much developed, parcels are extremely small for this
purpose, and this is why the term existential agriculture dominates over the agricultural
development strategy.
The change in agricultural land use, especially the transition of agricultural land into
building land until now has been a vulnerable process. Efforts to control the process
until now have been unsuccessful. This has resulted in unnecessary loss of large
surfaces of agricultural lands and on inefficient urban development.
Except agricultural lands in Kosovo, there are also other lands that need land
consolidation especially forest lands, for example in Scandinavian states: Sweden,
Norway, etc.
2. LEGAL BASIS OF LAND CONSOLIDATION IN KOSOVO
Legal basis for land regulation and land consolidation in Kosovo has started since 1976,
with law 32/76. In 1987 land consolidation law was compiled, meanwhile it is a
fulfillment and elaboration of a unique segment of the prior law 32/76. Land
consolidation law was declared in Kosovo’s one newspaper on October 3d 1987 and it
has strengthened and has regulated land consolidation issues, which at that period of
time was developed only in some cadastral zones of Kosovo’s municipalities. This land
consolidation lasted until 1987 but, because of the political circumstances it was not
registered in the cadastral documentation and, the new ownership remained
unconfirmed after land consolidation.
Having the focus over land consolidation in ALUP project which was financed by EAR
(European Agency for Reconstruction) 2006-2008, MAFRD has declared land
consolidation as a priority for Agriculture in Kosovo See “ARDP-2007-2013” at
www.mbpshr-ks.org.
It was necessary to prepare the Law of Agricultural Land (LAL) 2006, developed during
2004-2005 from MAFRD – approved by UNMIK (July 2006). In this law is the new
basis for a first land consolidation in Kosovo.
- Administrative Instructions (AI) are developed by detailing further the LAL.
AI 35/2006 describes rules and procedures for land consolidation and the
explanatory that are developed for all the AI, including even an annex in land
consolidation management.
- Law article 27.2 of LAL, with the administrative instruction issued by the
ministry regulates the activities and works of land consolidation commission,
review and observation of agricultural lands’ regulation projects, electing the
mayor, members and their substuition.
- With the law of IPRR UNMIK reg. 2002/22 is regulated the registration
manner of immovable properties rights.
- The cadastre law L-35/2003 foresees measurements and the way of property’s
creation. According to property creation by any kind must be based on the
frameworks of cadastral measurements.

International Conference SDI 2010 – Skopje; 15-17.09.2010
382
- MAFRD based on the framework of legal work has developed the national
strategy for land consolidation which is considered as its politics.
Considering that land consolidation in Kosovo could be developed through two types as
a peroration of the unfinished land consolidation and the development of voluntary land
consolidation has prepared the law project for consolidation. This law project – draft
must be approved in Kosovo’s Assembly to be strengthened for consolidation’s
implementation. The new law for land consolidation foresees the purpose, objectives,
strategy and implementation of land consolidation as a whole. Some explanations about
land consolidation taken from the law with some little improvements are shown in the
following.
2.1. The purpose of land consolidation in Kosovo
Land consolidation of agricultural land, forests, forest land and other lands that are
related with land consolidation (in the further text: lands) it is implemented with the
reason of regulating land surfaces to create big parcels by grouping small parcels.
Grouping the parcels is done to regulate the agricultural land for rational and
economical exploitation of land, creating better conditions of dwellings with
agricultural character, building agricultural roads and other roads, hidormeliruese
objects and equipments for developing other works in land implementation.
2.2. Implementation field
Land consolidation law regulates the procedures for implementation of land
consolidation, implementation time, and conditions for implementation, competent
authorities of implementation, manners and conditions of separation creating of the
involved complex in land consolidation, investment expenses for consolidation and
other important issues for land consolidation implementation.
2.3. Reasons for land consolidation
Land consolidation priorities in Kosovo are agricultural lands, but always with the
possibility of continuance of land consolidation with other lands. In land consolidation
law are given the reasons of implementing land consolidation, shown in the following:
- Because of great segmentation of parcel and irregular forms of cadastral
parcels,
- Because of the construction of irrigation system and land drainage,
- Because of the construction of road field network,
- Building large infrastructural objects (public roads, railways, irrigation
accumulations, etc)
- Regulating of river bed.
These reasons and other ones about land consolidation clarify that land regulation in
general should be extended as for its maintenance and also for its increase of production
and employment. Land consolidation impact in Kosovo’s economical development is
multidimensional (Meha, 2005). Reasons and procedures of land consolidation
development throughout agricultural lands and, its importance in country’s economical
development are shown also in FAO manuals (FAO 2006).
In order to ensure that land consolidation will solve problems in rural areas in the
sustainable way see Land Consolidation Strategy 2010-2020, it is advisable that

International Conference SDI 2010 – Skopje; 15-17.09.2010
383
during implementation of land consolidation projects the following measures are
considered:
• Rational sustainable use of natural resources.
• To create conditions for the use of land for public needs.
• To ensure the planning and implementation of measures for a
sustainable environment.
• To plan development of local infrastructure.
• To create conditions for preservation of biodiversity, to strengthen
conservation of cultural heritage and typical landscapes for the area.
• To develop alternative agricultural activities.
• To coordinate land consolidation projects with the selection of
comprehensive plans or spatial planning documents for that territory
(Municipal Development Plans).
• The implementation of land consolidation projects can also include
projects such as: (roads, water supply, sewage, electricity lines, spaces
for public needs and in some cases protective areas).
3. DATA BASE CREATION FOR LAND CONSOLIDATION
In some cases, the data are missing because they have been taken away or were never
prepared, and some data are uncompleted. In recent years progress has been made in the
process of systematic property registration. Now the system has been established for
identification and registration of property rights. Projects are underway to increase the
efficiency of property records and to improve data quality, even though the quality of
current data still remains generally poor. Cadastral maps and possession lists, yet in
many places reflect the situation in the 80’s. Some cadastral maps dating back to 1959
have been digitalised and there are ortophotos of the end of 2004 showing current
situation on the ground.
The creation of new land administration system, are clarified and solved many
irregularities which help the agrarian reform and land privatization. The cadastral
information system of lands where the data from land consolidation will be registered,
simplify land administration as a process where land and information about land are
managed effectively.
Land Property as it is registered in cadastre in the Immovable Property Rights Register
(IPRR) is not updated on the required level, and so it remains inappropriate for the
present transactions. Properties that have been involved in land consolidation during
1983/89 were presented only in analogue basis, but also in the old coordinate system of
Gauss-Kruger projection. This initially has created difficulties in the process of data
incorporation from land consolidation in Kosovo’s digital cadastre that was created after
2003. The lack of accurate data basis for agricultural land has lead to land market
impoverishment. The lack of cadastral digital data, the assessment and determination of
agricultural land price are not transparent and do not reflect the production capacity. For
more, the land lease system of land is not functional and transparent.
The tax for rural land does not exist, with which the farmers disagree and they consider
it unwanted. After all the tax would increase the use of agricultural land and would help
the municipalities to have budget for rural development. The presence of taxes

International Conference SDI 2010 – Skopje; 15-17.09.2010
384
(appropriate and modest ones) is a good tool of the land to stimulate the use of
agricultural land, land market and to create the cadastral information system of
agricultural lands. In table 1 are presented systemized data from each municipality
where during the years 1983/89 land consolidation was developed. These data are
registered during the period of ALUP project from the authors Murat Meha and Niels O.
Haldrup. In table 1 is shown the lack of data which in some cases must be impregnated
with new geodesic measurements in order to create the documentation of actual
condition. Completion of the data from properties in land consolidation has influence in
further development of the cadastral information system (Niels, 2007).
The data system for each property of the owner is done according to the condition
“before” and “after” of land consolidation with the draw of surfaces shown in Table 2.
The owners have agreed about this during the period of public discussions. The
condition of properties, their form and their size before land consolidation are shown in
Figure 1. Meanwhile the data basis is created with its all features after land
consolidation which is shown in Figure 2. This data basis should also be in Kosovo’s
WebGIS.
Table 1. Colected data from unfinished land consolidation of period 1983/89
MU
NIC
IPA
LIT
Y
CZ
in
LC
Are
a in
LC
Sta
tus
of
do
cum
enta
ti
on
in
L
C
Cad
astr
e
issu
es P
.L
and
Co
py
pla
n f
rom
LC
or
no
t.
Fie
ld
situ
atio
n i
s
bas
ed o
n
LC
No
of
Ow
ner
s
No ha % By year % %
1 2 3 4 5 6 8 7
1 Drenas 21 5266 80 usable by LC
12 CZ (over
90%)
7 CZ (70 -
80%)
2 CZ about
40% 2700
2 Gjakova 16 7375 90 usable
7 by LC .
9 before LC
10 CZ
(100%)
5 CZ (
80%)
1 CZ without
LC 1000
3 Kastriot 6 ? ? ? ?
4 Mitrovica 4 ? old situation Partially ?
5 Prizreni 6 930
Entirely
usable
2 by LC
4 from
1965&1984
2 CZ ( 100%)
4 CZ ( 80%) 1300

International Conference SDI 2010 – Skopje; 15-17.09.2010
385
6 Rahoveci 11 3115
95 under
LC
4 CZ
before LC.
7 by LC
4 before LC,
4 CZ (100%)
3 CZ (70 -
90%)
4 CZ without
LC 2300
7 Viti 10 3954
Documents
partially
usable
Documentation
before LC
7 CZ (90%)
2 CZ (75%)
1 CZ (35%) 1300
8 Vushtrri 23 5204 90 usable ? ? 5000
Total 97 25844 13600
Table.2. Data “before ” and “after” land consolidation
Fig. 1. Field situation before land consolidation

International Conference SDI 2010 – Skopje; 15-17.09.2010
386
Fig. 2. Arranged data “after”land consolidation
4. THE IMPACT OF CADASTRAL INFORMATION SYSTEM ON
POLITICAL IMPLEMENTATION FOR RURAL LAND
MANAGEMENT
MAFRD has prepared the strategy for political implementation of rural development in
Kosovo’s territory. Based on the previous projects of MAFRD and challenges with
which has been confronted because of the lack of the cadastral information system in
this article, the objectives are given for coordination between the cadastral system and
MAFRD. Updates of cadastral information system especially updates of IPRR are very
necessary. This process requires systematical time and investments. Land consolidation
should necessarily be combined and coordinated with the cadastral update of IPRR and
KCLIS. Such a process has started to be applied in three municipalities (Rahovec,
Prizren, and Gjakove) and then to continue with the municipality of Vushtrri. This
program is still continuing in 2010. By studying the issue of judicial procedures
associated with Municipal Courts, follows that the judicial procedures are more
complicated than cadastral update itself. However, having the attempt to complete the
unfinished land consolidation of years 1980/89, and with the attempt to create KCLIS
(CADASTRAL INFROMATION SYSTEM OF LANDS IN KOSOVO) with actual
data, the coordination is done:
- Land consolidation commission
o With the municipal cadastre
o With the municipal assembly and
o With ministry,

International Conference SDI 2010 – Skopje; 15-17.09.2010
387
in order that every property registration to be a transparent process, approved by farmers
themselves and with the actual data about the property. Cadastral data as an integral part
of KCLIS are shown in Table 1 and 2, also in Figures 1 and 2 of this article.
The main areas of good land management based on IPRR and KCLIS would reflect
positively with quick results as:
- The reduction of unplanned constructions in rural zones where a real activity is
needed because there is no sufficient matching between the Law of Spatial
Planning and the Law of Agricultural Land, related with land management to
change the use of agricultural land.
- Village zoning in limitation of properties for construction and no construction.
This was proven in pilot in Klina (Zajm Village). However, at the beginning of
2008 the efforts to make MAFRD and the Ministry of Environment and Spatial
Planning (MESP) to create a mutual work group in order to develop this tool
further and, then to apply it into national scale were unsuccessful.
- Privatization or selling of agricultural land as large properties must be oriented
more at farmers that wanted to increase the size of their possession more than
to investors.
- Environmental pollution from industrial/mine wastes, plastics, wastewater
discharge and other wastes could be registered in land information system that
could be controlled at every moment. Inventory in KCLIS requires validity in a
central level (MAFRD) and in a local level (Municipality-community) even for
polluted rural land surfaces, production of management plans of rural lands,
action plans for environment and preparations for their exploitation.
The realization of a model works even in Kosovo’s integrated WebGIS, would be a
great institutional step for both public and private land management.
5. CONCLUSIONS
Kosovo aims entering the EU, which requires approximation of its legislation and in
land consolidation’s field to be ranged with acquis communaitaire. The legislation has
been completed and improved, but still some additions are required especially of land
consolidation law and for land registration from consolidation itself. In a specific
manner it is required “the regulative politic and framework to be prepared in support of
land sustainable reform, meanwhile agricultural land protection to be done from the
unplanned urban development”. Planning rural land is a priority as an addition of urban
planning. Through this, many big family farm businesses will be influenced and the
existential agriculture will be reduced. This requires an improved structure of the farm,
including land concentration and increase size of the farm. In this context MAFRD has
declared land consolidation as a first priority. On the other hand, rehabilitation and
improvement of irrigation is a second priority of the ministry.
Security of efficient management of immovable property, transparent planning as well
as environmental and natural resource protection is done by listing the digital data
inside of the public administration framework. Defining legal and technical standards
for spatial data infrastructure in general, where also land consolidation takes place it
completes the national infrastructure of spatial data (National Spatial Data Infrastructure
– NSDI). Property registration from the unfinished land consolidation of years
1983/1989 in the information system must be updated urgently. This process is ongoing
in some cadastral zones of some municipalities as: Gjakova, Prizren, Rahovec, and
Vushtrri where land consolidation has remained unfinished until now. The ongoing land

International Conference SDI 2010 – Skopje; 15-17.09.2010
388
consolidation in Kosovo should necessarily be according to the law but with the
possibility of voluntary land consolidation. However, the cadastral information system
must be completed with another addition from land consolidation.
6. REFERENCES FAO Land Tenure Training Materials on Land Consolidation Pilot Projects, Version 1.0. May
2006. Rome, Italy.
Law on Agriculture Land 02/L26 /2006,
Law on Land arondation, consolidation and parcels fragmentation (“Official Gazette KSAK”
32/1976,
Law on Land Consolidation (“Official Gazette KSAK” 31/1987,
Law on Cadastre L-2003/25
Law on IPRR, UNMIK Reg. 2002/22.
Land Consolidation Strategy 2010-2020. Ministry of Agriculture, Forestry and Rural
Development. Draft version, Prishtina 2009.
Meha, M. 2004.: Land Administration Before and After The War (1999) in Kosovo.
Symposium on Land Administration In Post Conflict Areas, FIG. Commission 7. Geneva 29-
30th April 2004. www.fig.net Swiss.
Meha, M. 2005.: Analysis of Economic Influence of Land Consolidation in Kosovo.
International Land Consolidation Conference. CELKCenter, Budapest, Hungary. 1-2
December 2005.
Niels O.H. Meha M. Andersen N. 2007: Completing Unfinished Land Consolidations, - Main
Activities, ALUP Technical Paper nr 31,
www.mbpzhr-ks.org “ARDP-2007-2013”
6. BIOGRAPHICAL NOTES OF THE AUTHORS
Murat Meha is a University Professor and Deputy Head of the state Border
Demarcation Commission. He has been teaching at the University of Prishtina
- Kosovo since 1988. He has also taught for ten years at Tetova University
(FYR of Macedonia). He worked for five years as Manager of SEO
Ferronikeli, for three years as a CEO of Kosova Cadastre Agency, in different
funded EAR projects, USAID project, KTA etc. His teaching and research
concern survey, cadastre, Land Administration and Land management. and
related educational and capacity building activities. He is currently the
member of Kosova Surveyor Association. Main publications of Mr Meha are on survey,
cadastre, Land Administration and Land management. He published two University books, two
books for Kosovo Cadastre Agency, one book translated, and several school geographic atlases
and maps. More than 80 professional and science papers in different professional magazines,
symposiums, conferences etc. Most of those articles are available on Internet at: FIG, ICC, Euro
Geographic, WPLA, CELKCenter, FAO GIM International etc.
Bashkim IDRIZI, was born on 14.07.1974 in Skopje, Macedonia. He
graduated in geodesy department of the Polytechnic University of Tirana-
Albania in 1999year. In 2004, hot the degree of master of sciences (MSc) in
Ss.Cyril and Methodius University-Skopje. In 2005 he had a specialization for
Global Mapping in Geographical-Survey Institute (GSI) of Japan in Tsukuba-
Japan. On year 2007, he held the degree of Doctor of sciences (PhD) in
Geodesy department of Ss.Cyril and Methodius University–Skopje. He
worked in State Authority for Geodetic Works from May 1999 until January

International Conference SDI 2010 – Skopje; 15-17.09.2010
389
2008. From October 2003 up to January 2008, he worked as a outsourcing lecturer in State
University of Tetova. From February 2008, he works as a cartography& GIS Professor at the
State University of Tetova–Tetova. He continu with working as outsourcing lecturer in geodesy
department of the University of Prishtina-Kosova. He is the author of three cartography university
books, and 56 papers published and presented in national and international scientific conferences
related to geodesy, cartography, GIS & remote sensing.

International Conference SDI 2010 – Skopje; 15-17.09.2010
390
ADMINISTRATIVE PROTECTION OF THE
CONFIDENTIALITY OF SPATIAL INFORMATION IN THE
REPUBLIC OF MACEDONIA
Тemelko RISTESKI1
ABSTRACT
The protection of the confidentiality (secrecy) of the spatial information have a
great importance in the prevention of maleficent activities from the part of the unasked
persons against security of the Republic of Macedonia, defense, public security, security
of the citizens, economy and other social values. It is generaly regulated by Law on
Classified Information.
In the paper the problems linked with the classification of the spatial
information, and its administrative protection according the degree of the confidence
(secrecy) will be analyzed, as: receipt and recording of classified data; storing, handling
and control of classifieed information; reproductions, translations and extracts making
from the documents which contains classified information; distribution and
dissemination of documents; transmission of documents: disposal and destruction of
classified information and measures which should be taken in the cases of
compromises, unauthorized release and breaches of security of documents which
contains classified spatial information.
Administrative protection of spatial information is regulated by the Decree on
Administrative Security of Classified Inforamtion
Special Law (Lex specialis) which contains the enactment for protection of the
spatial inrformation is the Law on Real Estate Cadastre. Acording this Law, competent
state body for the protection of those information is the The Agency for Real Estate
Cadastre. Acording the Law, the Agency shall undertake legal, organizational and
technologic procedures and measures to secure the paper and electronic Geodetic-
Cadastral information System (GCIS) information in order to prevent illicit acquisition,
processing, safeguarding, use or transfer of data, accidental or intentional change or
destruction of the data, as well as illegal reallocation of the data outside the Agency’s
premises.
The Law does not contain any enactment wnich refer to use the Law on
Classified Information and the Decree on Administrative Security of Classified
Inforamtion. But, autor consider that this Law and Decree can be used in as general
regulation (lex generalis) of administrative protection of the confidentiality of spatial
information
Key words: directive, law, decree, confidentiality, degree of confidentiality,
classification, spatial information, documents, evidence, protection, security.
1 Prof. Temelko Risteski, PhD [email protected],
FON University, www.fon.edu.mk,
tel. +389 2 2445 568, mob. +389 71341 508,
Bulevar Vojvodina, b.b. Skopje.

International Conference SDI 2010 – Skopje; 15-17.09.2010
391
INTRODUCTION
The protection of the confidentiality of the information is very important for
the security of the social activities when the confident information are used. All of those
information are of the interest of the state. Information of the interest of Republic of
Macedonia are is “any information produced by a state body, body of a unit of the local
self-government, public enterprise, public institution and service, legal entity and
natural person, as well as foreign state body, foreign legal entities and natural persons,
related to the security and defense of the state, its territorial integrity and sovereignty,
constitutional order, public interest, freedoms and rights of the human and the citizen”.2
The spatial information are especially of the great importance for national defense and
security system of the state. As such information those are legally protected by law.
That is the Law on Classified Information
All confident spatial informations of the interest of the Republic of Macedonia
are subjected to clasificaition which is regualte by national Law on Clasified
Information. Before the Law on Classfied Information was passed, the issue on
proteciotin of classified inforamtion was mainly regulated by by-laws related to defence
and security, as well as to other areas of particular interest to the national security of the
State.
The passing of the Law on Clasisfied Information with by-laws regulation on
the protection of the confidentiality of the information signify the finalization of the
legal and sublegal framework conserning the potection of the clasified information in
the Republic of Macedonia. The standard of the directives on the European Union have
been properly built in all of that regulation and they correspond to the related regulation
in most of the European countries.
Among other European Union directives, in macedonian Law’s and by-laws
normative regulation, the standards of the Directive 200/2/ EC of the European
Parliament and of the Council on establilshing an Infrastructure for Spatial Information
in the European Community (INSPIRE) are incorporated.
Acording article 13 of the Directive, Member States may limit public acces to
many spatial data sets and services where such access would adversely affect any of
the foloving state or social vallues: the confidentiality of proceedings of public
authorities where such confidentiality is provided by law; international relations, public
security or national defence; the course of justice, the ability of any person to receive a
fair trail or the ability of a public authority to conduct an enquiry of a criminal or
disciplinary nature; the confidentiality of commercial or industiral information, where
such confidentiality is provided by national or Community law to protect a legitimate
economic interest, including the public interest in maintaining statistical confidentiality
and tax secrecy; intellectual property rights; the confidentiality of personal data and/or
files relating to a natural person where that person has not consented to the disclosure of
the information to the public, where such confidentiality is provided by national or
Community law; the interests or protection of any person who suplied the information
requested on a voluntary basis without being under, or capable of being put under, a
2 Definition from the Law on Classified Information, Official Gazette of the Republic of
Macedonia” no. 9/2004.

International Conference SDI 2010 – Skopje; 15-17.09.2010
392
legal obligation to do so, unless that person has consented to the release of the
information conserned; the protection of the environment to which such information
relates, such as the location of rare species.
Acoridng the Law of Classified Information by link with Law on Real Estate
Cadastre (article 33) the protecction of the confident spatial information include the
measures on administrative security, measures on physical security, measures of
personal security, measures on information security, and measures on industrial
security.3
The Law on Real Estate Cadastre proscribe legal security of information.
Administrative security is a form of legal secuirty. It contains the normative regulation
on the measures of the protection of confidential information, and the measures on
administrative security.
1. Normative regulation on the measures of the proteciotn of
confidential information
Normative regulation on the measures of the protection of confidential
information in the Republic of Macedonia is in the competence of the Gowerment of the
Republic as a higher political, executive and adminsitrative state body.4 The
Govwerment is empowered by law to pass decrees on administrative security of
classified information, on physical security, on personal security,on information
security and decree on industirial security on classified information. The Gowerment
have pased this normative acts.
By Decree on Administrative Security of Clasified Information,5 the measures
and activities for administrative security of classified information, to be implemented by
the state bodies, public institutions and services, organs of the units of the local self-
government and other legal entities and natural persons are regulated. Those measures
are elaborated by this paper.
Decree on Physical Security of Classified Information6 regulates the measures
and activities for physical security for protection of classified information, such as
assessment of the possible security infringement of classified information with intrusion
and unauthorized access to, use and disposal of the classified information; establishing
a security area around the facility; definition of security and administrative zones;
organizing physical security and application of technical and other security devices for
buildings and rooms where classified information is held; issuing clearances for access
to buildings and rooms; control of entry, movement and exit of individuals and vehicles
for transportation of classified information and transportation of those information
outside the security zones.
Decree on Personal Security of Classified Information7 is dedicated to
regulation on the measures and activities for security of personnel using classified
information, such as, identification of authorized persons for work and handling
3 Article 25 – 29 of the Law on Classified Information 4 Ibid, Article 30. 5 “Official Gazette of the Republic of Macedonia”, no.84/04 6 Ibid.
7 “Official Gazette of the Republic of Macedonia”, no.84/04
9. Ibid, no. 16/05.

International Conference SDI 2010 – Skopje; 15-17.09.2010
393
classified information; responsible handling of classified information; security vetting;
issuing security clearances; issuing access permits for classified information; and
verifying and evaluation of the ability to handle classified information.
By Decree on Information Security8 (INFOSEC) the Government regulates the
measures and activities for information security of classified information in electronic
forme, as: certification of communication and information systems and processes;
assessment for possible security infringement of the classified information by intrusion
in the information system, and use and destruction of the classified information
processed and stored in communication and information systems; definition of methods
and security procedures for reception, processing, transmission, storing and archiving of
electronic classified information; protection of the information in the course of the
processing and storing of classified information in the communication and information
systems and suchlike
Decree on Industrial Security of Classified Information9 regulates the measures
and activities for industrial security of those information, such as protection from
misplacing or compromising of classified information contained in industrial
agreements; protection from misplacing or compromising of classified information in
consortia and mixed enterprises with foreign legal entities and natural persons; ensure
protection during transportation of classified information etc.
2. Administrative security of spatial information
Administrative security of the conffidentiality of spatial information in the
Republic of Macedonia bases on the general norm in article 33 of the Law on Real
Estate Cadastre10 and on the special norms of the Law on Classified Information and on
the Decree on Administrative Security of Classified Information.11 Acording to the
Law on Classified Information and the Decree, administrative security contains the
measures of clasification of the confidential information and mesures of protecting of
the clasified information.
2.1. Classification of the information
Clasification of the information is administrative proces with whom the level
of protection of the information that should match the degree of the damage that would
result for the Republic of Macedonia from unauthorized access to that information or its
unauthorized use.12 Direct result of the clasificiation of the confidential information are
8 Ibid.
10 According this article the Agency for Real Estate Cadastre shall undertake legal,
organizational and technologic procedures and measures to secure the paper and
electronic GCIS data in order to prevent illicit acquisition, processing, safeguarding, use
or transfer of data, accidental or intentional change or destruction of the data, as well as
illegal reallocation of the data outside the Agency’s premises. 11 “Official Gazette of the Republic of Macedonia” no. 87/04. 12 See, Article 3, of the Law on Classified Information, “Official Gazette of the
Republic of Macedonia”, no. 9/04.
13. Article 5, point 3.

International Conference SDI 2010 – Skopje; 15-17.09.2010
394
the information with a legal status of clasified information. Acording the Law, clasified
information is any information determined to require protection against unauthorized
access or use and which has been so designated by a security classification.13
Object of the clasification are the information that particularly refer to: public
security; defense; foreign affairs; security, intelligence and counter intelligence
activities of the state administration bodies of the Republic of Macedonia; systems,
devices, projects and plans of importance for the public security, defence, foreign
affairs; scientific research; technological, economic and financial affairs of importance
for the Republic.
According the Law, the classification of confidential information are granted
according to its contents.
The levels of classification are follows: “Top Secret”, “Secret”, “Confidential”
and “Restricted”.
The information classified “Top Secret” is an information the unauthorized
disclosure of which would put in jeopardy and cause irreparable damage to the
permanent interests of the Republic of Macedonia, such as: to threaten directly the
constitutional order, independency and territorial integrity of the Republic; to threaten
directly the internal stability of the Republic; to lead to massive loss of human lives; to
cause irreparable damages to the operative efficiency or security of the Republic or to
the efficiency of particularly valuable defense, security or intelligence related operations
or to operations conducted to handle unconventional threats, especially terrorism;
irreparable damages to the basic freedoms and rights of the man and the citizen, the
democracy and rule of law; irreparable damages to the development and progress of the
economy in the Republic, to the protection of property, freedom of markets and
entrepreneurship, humanism, social justice and solidarity; irreparable damages to the
protection and development of the living environment of the Republic; to inflict severe
and long consequences to the promotion and development of the local self-government
in the Republic; and to impose a direct threat against the achievement of the aims of the
international politics of the Republic or to cause irreparable damages to the international
relations of the Republic or to the relations of a foreign country or an international
organization with the Republic of Macedonia.
Competent state bodies for classification the information with a level of “Top
Secret” are the President of the Republic of Macedonia, the President of the Assembly
of the Republic, the President of the Government of the Republic, the President of the
Constitutional Court of the Republic, the President of the Supreme Court of the
Republic of Macedonia, the ministers within their sphere of activity, the Public
Prosecutor of the Republic of Macedonia, the Chief of the General Staff of the Army of
the Republic, the Director of the Intelligence Agency, the Director of the Directorate for
Security of Classified Information and the persons authorized by them in written.14
Information classified by the level “Secret” can be the information whose the
unauthorized disclosure or use of which would damage the vital interests of the
Republic, such as: to cause exceptionally serious damages to the independence and
territorial integrity of the Republic; exceptionally serious damages to the state identity
of the Republic by free expression of the ethnical identity of all citizens; to threaten
directly the life or to affect exceptionally seriously the public order or the personal
14 Article 10 of the Law on Classified Information.

International Conference SDI 2010 – Skopje; 15-17.09.2010
395
security and freedom of the man and the citizen; to cause exceptionally serious damages
to the operative efficiency or security of the Republic or to the efficiency of particularly
valuable defence, security or intelligence related operations or to operations conducted
to handle unconventional threats, especially terrorism; exceptionally serious material
damages to the financial, monetary and economic interests of the Republic;
exceptionally serious damages to the living environment in the Republic; exceptionally
serious damages to the promotion and development of the local self government in the
Republic; exceptionally serious damages to the achieving of the aims of the
international politics or the international relations of the Republic or to the relations of a
foreign country or an international organization with the Republic of Macedonia; and to
cause pressure by the international community on the Republic.15
The classification of the information with the level “Secret” is in the
competence of state bodies, bodies of the units of the local self-government and other
institutions that is of interest to the public security, defence, foreign affairs and the
security, intelligence and counter intelligence activities of the state administration
bodies of the Republic of Macedonia.
The information classfied “Confidential” is an information created by the state
bodies, bodies of the units of the local self gowermment and other institutions that is of
interest to the public security, defence, foreign affairs and the security, inteligence and
counter intelligence activities of the state administration bodies of the Republic of
Macedonia. The unauthorized disclosure of those information would result in serious
damage to the interests of importance for the Republic of Macedonia.
With a classfication level “Confidental” can be classified informaiton the
unauthorized disclosure or use of which would damage the important interests of the
Republic of Macedonia, such as: to cause serious damages to the peace, democratic
foundations of the legal state and the development of the multiethnic society; to the life,
health, property and personal security or the freedom of the man and the citizen; to the
operative efficiency or security of the Republic or to the efficiency of valuable defence,
security or intelligence related operations or to operations conducted to handle
unconventional threats, especially terrorism; serious damages or to be significantly in
contradiction with the financial, monetary and economic interests of the Republic;
serious damages to the living environment in the Republic; to the promotion and
development of the local selfgovernment in the Republic; serious damages or to be
significantly in contradiction with the political and defence integration of the Republic
in NATO, with the economic and security integration in the European Union or in other
collective defense systems; to prevent seriously the development or the operations
determined in the international agreements that the Republic has concluded with foreign
countries or international organizations; to cause serious material damages to the
international relations of the Republic, by initiating formal demonstrations or other
sanctions; and to stop or significantly prevent in other way the important activities of
the Republic at the international sphere or the activities of a foreign country, of an
international organization related to the cooperation with the Republic of Macedonia.16
The information classified “Restricted” are information the unauthorized
disclosure of which would result in damage of the work of the state bodies, bodies of
the units of the local self-government and other institutions that is of interest to the
15 Article 2, paragraph 4 of the Decree on Administrative Security of Classified
Information 16 Article 2, par. 5 of the Decree.

International Conference SDI 2010 – Skopje; 15-17.09.2010
396
public security, defense, foreign affairs and the security, intelligence and counter
intelligence activities of the state administration bodies of the Republic of Macedonia.
The restricted clasification level can be be assigned only to the information the
unauthorized disclosure or use of which would damage the work and efficiency of the
organs in the Republic of Macedonia, such as: to cause damages or to affect the
conditions for enhancing and maintaining the internal political stability, security and
operational efficiency of the Republic; significant suffering of people; to damage the
developing of a righteous, social state with equal possibilities for all citizens; to
downgrade the political, financial, monetary, economic and commercial negotiations of
the Republic; to stop the development or the operations determined with the bilateral or
multilateral agreements that the Republic has concluded with foreign countries or
international organizations; to cause financial losses or enable inappropriate
achievements or advantages of the legal entities or natural persons; to have a negative
influence on the preserving and protection of the living environment; to undermine the
activities of the Republic related to the maintaining and enhancing peace, stability,
security and all other forms of cooperation with the neighbours, in the region, in Europe
and in the world, as well as the activities related to the prevention and development of
instruments for early warning of tensions and crises in order to enable their timely and
efficient resolution by peaceful means; to undermine the activities of the Republic for
preserving and development of the international order based on righteousness, mutual
respect of the international order founded on the international law, as well as the
political and economic equality of the countries; and to have a negative influence on the
international relations of the Republic or on the relations of a foreign country or
international organization with the Republic of Macedonia.17
The clasification for the informaiton and the assignement of the level of
clasification exercise by the proposal of its immediate originator. All users of the
information have to be informed about the classification of the unclassified information,
as well as about the reclassification and declassification of the classified information.
About it, on the classified document, the originator of the classified information has to
indicate the date or the period after which the contents of the classified information
contained therein may be reclassified or declassified.
The Law on Classified Information proscribe legal possibility for protecting
information which can not be classified according above named criteria for
classification, but the disclosure of those information can result in decreased efficiency
of the work of the state bodies. Those inforamiton shall be marked with “For Limited
Use”. We can nominate those posibility as aditional level of clasification. In cadastral
working with a spatial information there are a number of information for which are not
intended for public use, and which can not bi classified acording criteria for
classification.The officials in cadastrial area can use this legal posiblitty to create an
administrative base for protection those information.
17 Article 2, paragraph 6 of the Decree on Administrative Security of Classified
Information

International Conference SDI 2010 – Skopje; 15-17.09.2010
397
2.2. Measures of administrative protecting of classfied
information
Measures of administrtive protecting of clasified information in the Repubic
of Macedonia are enumerated bu the Law on Clasified Informtion and detaily
prescribed by the Decree of Administrative Security of Classified Information. The Law
on Real Estate Cadastre did not proscribe special measures for administrative protecting
of clasified spatial information. Using the metod of extensive interpretation of the
article 33 of this law We can use the norms contained in the Law on Classified
Information and in the Decree on Administrative Security of Classified Information
Acoridnig the Law on Clasified Information those measures are folowing:
receipt and recording of the classified information; safekeeping of and handling;
reproductions, translations and excerpts of the classified information and designation of
the number of copies and the users; control and handling of the classified information
during its dissemination and distribution; prevention of unauthorized takeout, disclosure
and security breaching; prevention of compromises and disposal and destruction of the
classified information.
2.2.1. Receipt and recording of the classified information
Acording the Decree, receipt and recording of classified information produced
in the Republic of Macedonia shall be done by the organizational units of the organs
authorized to work with classified information. Receipt and recording of classified
information released to the Republic by foreign countries or international organizations
or the one that the Republic has released to foreign countries or international
organizations shall be done by the Directorate for Security of Classified Information and
the registries and control points as organizational units of the organs (“organizational
units”).
Classified information have to be registered in a special log-book, which is a
book for keeping basic records.
The “Top Seccret” and “Secret” information should be registered in one log-
book, and the information classified “Confidetnial” and “Restricted” in another log-
book.
Besides in the log-book, classified information should also be registered in
supplementary record books. Supplementary record books are: inventory of documents,
register, internal delivery book, book for registered mail and book for location.
The unclassified information produced in the Republic of Macedonia, as well
as the foreign unclassified information, shall be recorded in a separate logbook, set
aside from the other information without classification level.
2.2.2. Storing, handling and control of classified information
Classified information produced in the Republic of Macedonia or released to
the Republic by a foreign country or an international organization or which the Republic
has released to a foreign country or an international organization, shall be handled,
stored and controlled by the organizational units of the competent state bodies.
The organizational units shall keep records of the receipt, transmitting and
destruction of the classified information that they have been authorized to handle.

International Conference SDI 2010 – Skopje; 15-17.09.2010
398
The title of the organizational unit or the name of the natural person in
possession of that classified information should be indicated in the log-book.
Classified information may be stored in paper copy, as microfilm or on
computer storage media.
Natural persons and juristic persons who use and handle shall to have a
security clearance for using and handling confidential information. Directorate for
Security of Classified Information issues security clearances to natural and juristic
persons for an appropriate level of classified information after submitted a written
request to the Directorate and after previous security vetting.18
Information classified by“Top Secret” have a special regime for handling,
storing and control. Those information shall be handled with, stored and controlled by
the competent organizational units, particularly authorized for handling, storing and
control of such classified information.
The organizational units authorized to handle, store and control information
classified “Top Secret” shall appoint authorized persons to control the classified
information.
According to the special regime of storing and control to those information at
least once a year, the organizational units shall make an inventory of all information
classified “Top Secret” at their availability.
Availability of a document classified “Top Secret” means: such document to
be physically present in the organizational unit and to contain the precise number of
pages; to have a receipt confirmation by another competent organizational unit to which
the document has been transmitted; and to have a confirmation about the change of
classification level or the declassification of the document, or about its destruction.
Annual report of the inventory results concerning the foreign information
classified “Top Secret” should be submitted to the state’s Directorate for Security of
Classified Information.
2.2.3. Reproductions, translations and extracts of classified
information (documents)
The Decree regulate that copies, reproductions and translations of documents
classified “Secret” and below may be produced by the user and under his constant
supervision. The number of copies, reproductions and translations shall be determined
under observation of the need-to know principle. Security measures laid down for
the original document should be applied to such copies, reproductions and translations.
If classified “Secret”, each copy shall be marked with identifying copy numbers. The
18
Security clearance for access to and use of classified information of any level of
classification, without previous security vetting, for the purpose of accomplishing the
official function from the day of election until the end of the mandate, shall be issued to:
the President of the Republic of Macedonia, the President of the Assembly of the
Republic of Macedonia, the President of the Government of the Republic of Macedonia,
the Deputy of the President of the Government of the Republic of Macedonia, the
President of the Constitutional Court of the Republic of Macedonia and the President of
the Supreme Court of the Republic of Macedonia.

International Conference SDI 2010 – Skopje; 15-17.09.2010
399
number of reproductions and/or translations and their copy numbers shall be recorded as
well.
Acording to special regime of storing, handling and control, Information
classified “Top Secret” shall not, except in exceptional cases, be copied. Extra paper
copies of such information shall normally be obtained, in paper copy, from the
originator.
In exceptional cases, paper copies or translations of information classified
“Top Secret”, including extracts and copies to or from machine readable media may be
made for urgent mission purposes, provided that the copies or translations: are
authorized by the authorized person for control of information classified “Top Secret” in
the organizational units authorized to handle such classified information; are reported
for recording to the organizational units authorized to handle such classified
information; bear the reference and copy number of the original information together
with the title/name of the originating authority and the title of the organizational unit
authorized to handle such classified information where the copy of the information has
been made; are marked with an identifying reproduction copy number locally assigned
by the element making the reproduction or translation; display the “Top Secret”
marking of classification and all other markings of the original information; and are
brought under control of the authorized person in the organizational unit authorized to
handle such classified information, and reported in the annualinventory along with other
“Top Secret” information.
2.2.4. Distribution and dissemination of classified information.
Acording the Decree, classified information shall be distributed to individuals
who have a personnel security clearance at least commensurate to the classification
level of the information made available to them, according to the need-to-know
principle.
For this aim the originator shall make the initial list of identified users for
distribution of the classified information.
The authorized persons in the organs responsible for the security of the
classified information shall make lists of users, including higher officials and employees
to whom, due to the nature of their official duties and based on the acts on the
systematization of the positions in the organs, information classified “Secret” and above
shall be distributed, according to the need-to-know principle.
Regarding documents classified “Secret” and lower those documents may be
distributed from the initially indicated addresses, i.e. users, according to the need-to-
know principle.
All possible restrictions on further distribution of such classified information
shall be marked on the document itself. The marking of the caveat for further
distribution shall be added immediately under the classification level, separated by a
line.
In case of such a caveat, the initially identified users may distribute the
documents to other users, provided authorization by the originator has been obtained.
Documents classified “Top Secret” shall be distributed through the competent
organizational units that meet the standards required and that have been authorized to
work with information classified “Top Secret”.

International Conference SDI 2010 – Skopje; 15-17.09.2010
400
2.2.5. Transmission of classified information
Transmision is very dangerous activity for the security of clasified information.
It shall be: internal (within sites or establishments); external (outside sites or
establishments); in the country and
outside the country.
To prevent undesirable events Decree prescribe that documents classified
“Restricted” and above shall be transmitted in opaque cover, put in double envelopes.
The inner envelope shall be marked with security classification commensurate
to the classification of the document and, if possible, it shall be appended with complete
information on the position of the user and the address.
A receipt for the document to be distributed shall be prepared and placed in the
inner envelope. The receipt, which shall not be classified, shall quote the reference
number, date and copy number, but no reference to the contents of the document.
The inner envelope shall be placed in an outer envelope that shall bear the
designation and the address of the addressee and the dispatch number of the
letter/package. The outer envelope shall not indicate the security classification of the
document to be transmitted.
Beside that, Decree prescribe a control measures on the packages with clasified
documents.The person authorized to control the letters/packages shall exercise control
of the letters/packages containing classified information in the organizational unites and
that person may open the inner envelope and the receipt for the documents being
transmitted, except in cases when the letter/package is addressed to personal name.
The person authorized to control the letters/packages may open only the outer
envelope, while the inner envelope and the receipt for the documents may be opened
only by the addressee.
The receipt of the letters/packages containing information classified
“Restricted” and above shall be confirmed in a delivery book of the couriers and
delivery officers with a signature of the person authorized for receipt, under the
reference number of the letter/package.
In a site or an establishment, internal transmission of a classified document
shall be done in a sealed envelope that quotes only the name of the addressee and it
shall be carried by a person who has a security certificate for access to classified
information with a security level at least commensurate to the classification level of the
document being transmitted.
Inside the country, information classified “Top Secret” and lower, duly packed,
shall be transmitted through an official delivery service or through persons with
authorized access to information classified “Top Secret” and lower, who have a special
authorization for transmission of such information.
Acording the special regime of the protecting, the delivery service for
transmission of information classified “Top Secret” should be manned appropriately to
ensure that the transmission of letters/packages is under constant and direct supervision
by the persons authorized for transmission.
In exceptional cases, documents classified “Top Secret” shall be transmitted
outside a site or establishment by other officials, who are not couriers or who do not
belong to an official delivery service, when there is a need for their use by other organs
with a seat in the same location, provided: the deliverers of the classified information
have authorized access to information classified “Top Secret”; the transmitting is in line
with the regulations on transmission of such classified information; that person

International Conference SDI 2010 – Skopje; 15-17.09.2010
401
constantly escorts the classified information; and arrangements are designed for
transmission of the classified documents to the organs authorized to handle such
classified information in order to regulate their storage and recording in the log-books
and to check the recorded data when the classified documents are returned back.
Outside the country, documents classified “Top Secret” and lower shall be
transmitted through: diplomatic pouch, military courier, official service of the
Directorate or via electronic means, for information classified “Top Secret”. Personal
carriage of such classified information outside the country shall be prohibited;
diplomatic pouch, military courier, official service of the Directorate, another specially
authorized delivery service, personal carriage or via electronic means, for information
classified up to “Secret”.19
The person carrying the classified documents has to be briefed on the internal
instructions of the organ for transmission of classified information.
2.2.6. Disposal and destruction of classified information
Decree ragulated the measures for elimination of clasified information about
those are not need od posibility to be in use.
Acording the Decree classified information which is no longer required for
official purposes, including surplus or superseded information or physically damaged
that cannot be used any longer, have to be destroyed according to the list of classified
documented material with timelines for its storage.
Classified information should be destroyed in such a manner as to ensure that it
cannot be reconstructed. Before destruction it should to prepare them. The preparation
for destruction and the procedures for it should be done in accordance with the Law on
Classified Information, the Law on Archive Material and other related regulations.
An inventory list have to be made for the classified documented material
prepared for destruction that will quote all the relevant data for identification of the
classified information.
The destruction should be confirmed by a certificate to be kept together with
the destruction inventory list. This certificates and inventory lists should be made in a
manner to enable possible damage assessment or conduct a security investigation into
the compromise or loss of classified information.
19
Transmission of classified document outside the country requires: official stamp on
the package, i.e. the package to be packed in a manner to indicate that it is an official
consignment and it should not undergo customs or security scrutiny; the courier shall
carry a courier certificate recognised by the nation(s) where he is travelling through,
clearly identifying the package and authorising him to carry the package; the courier’s
travelling arrangements shall ensure avoidance of countries that represent a risk for his
life or personal security and for the package, as well as of risky transportation and
transportation means. In exceptional cases, those restrictions may be waived if urgent
operational requirements cannot be otherwise met.

International Conference SDI 2010 – Skopje; 15-17.09.2010
402
2.2.7. Measures in the case of compromis, unauthorized release
and breches of security of information
All breaches of security of classified information should be reported in written
form to the authorized person in the organ responsible for protection of such
information - the Security Officer.
There are specialised security offiicers in the organizational structure of the
Ministry of Defense and of the Ministry of Interior, but there are not in other state
bodies. State bodies in the area of Defencde use for those issues securituy officers from
the Ministry of Defence, other state bodies use security officers from the Ministry of
Interior.
The Security Officer shall immediately inform the official/head of the organ
responsible for protection of such information for the breach of security of the classified
information. Consequently the official shall decide on the determination of the degree of
the breach of security of the classified information and the possible unauthorized
disclosure, compromise or release.
The determining of the degree of the breach of security of the classified
information shall be investigated by individuals who have security and investigative
experience, and who are independent of those individuals immediately concerned with
the breach of security of the classified information.
If the procedure for determining the degree of the breach of security of the
classified information confirms that the breach of security of the information has not
caused damages, the official/head of the organ responsible for protection of such
information, may decide to stop further investigations for the breach of security of the
information.
The breach of security should be reported to the originator at the same time. If
the originator is not known, or it is difficult to be determined, the obligation to inform
him shall be transferred to the official/head of the organ responsible for protection of the
classified information that has been subject to the breach, i.e. the Directorate for
Security of Classified Information.
The final report on the breach of security of the classified information shall be
forwarded to the official/head of the organ responsible for protection of the classified
information subject to compromise, i.e. to the Directorate.
The report to the originator of the classified information for its compromising,
unauthorized release and breach of security shall be comprehensive in order to enable
him to make a threat assessment and to undertake the necessary or regular remedial
activities.
The report of the assessment of the type and extent of the damage and of the
taken remedial activities and corrective measures shall be forwarded to the official/head
of the organ responsible for protection of the classified information subject to
compromise, i.e. to the Directorate.
When the final report of the investigation shows that a classified document has
been irretrievably lost and that has not caused any damages, the official/head of the
organ responsible for protection of the classified information, may grant relief from
accountability to the persons responsible for the protection of the classified information.

International Conference SDI 2010 – Skopje; 15-17.09.2010
403
Conclusions
The proteciotn of the confidental spatial information is very complex and very
important activity in the cadastrial working. It contains very complexe end very
composed measures, such as measures for regular classification of the spatial
information, according the degree of the confidentiality (secrecy), measures for secure
receipt and recording of classified data; secure storing, handling and control of
classifieed information; secure reproductions, translations and extracts making from the
documents which contains classified information; secure distribution and dissemination
of documents; secure transmission of documents disposal and destruction of classified
information and measures which should be taken in the cases of compromises,
unauthorized release and breaches of security of documents which contains classified
spatial information.
Administrative protection of the confidentiality of the spatial information
contains the administrative procedures of of those measures which the competent state
bodies undertake acording the Law on Classified Inforamtion and The Decree on
Administrative Security of Classified Information.
The standards for adminstrative protection of the confidential information
proscribed by Law and the Decree are quiite compatible with standards have been
prescribed by a number of regulation and ratified international documents, especialy
with a directives of the European Union such is Directive of the European Parliamnet
and of the Council for Establishing an Infrastructure for Spatial information in the
European Community (INSPIRE).
In the Law and Decree, Republic of Macedonia has very quality normative
regulation for an effective administrative protection of the clasified information from
all areas of social life, and normaly for effective protection of spatial information.
There are many confidential spatial information, especialy in the area of public
security and national defence. The regulations for administrative protection contained in
the Law and Decree is completely acorded with the needs for porotection of confidential
information in those areas of social life in the Republic of Macedonia, registered by
relevant cadastres.
The Law of Real Estate Cadastre contains the normes for protection of the
informaiton contained in it. Those norms enable completely use of the regulations
contained in the Law and Decree for adminsitrative protection of the cofidential spatial
information.
Having in wiew above exposed statements, we may conclude without doubt,
that Republic of Macedonia has a completely aranged normative regulation system for
administrative protection of the confidential information in the area of the cadastral
evidence of the spatial informaiton.
LITERATURE
1 Ѓорѓиев В.: Современ катастар, Градежен факултет, Скопје, 2006.
2. Idrizi B., Meha M., Skenderi F., Hamiti R., Skenderi R.: Developing of National
Spatial Data Infrastructure of Macedonia According to Global Standardization
(INSPIRE & GSDI) and Local Status, International Scietific Conference,- Proceedings,
“Importance of Developing National Spatial Data Infrastructure of the Republic of

International Conference SDI 2010 – Skopje; 15-17.09.2010
404
Macedonia Based on INSPIRE Directive, 27 narch 2009, FON University, Skopje,
Macedonia.
3. Directive 2007/2/EC of the Europeen Parliament and of the Council, of 14 march
2007, for establishing an Infrastructure for Spatial Information in the European
Community (INSPIRE), “Official Journal of the European Union, from 25. 4.2007.
4. Дирекција за безбедност на класифицирани информации, Збирка на прописи од
областа на класифицираниtе информации, Скопје, 2005.
5. Кузев С.: Збирка на документи од областа на безбедноста и одбраната, Југореклам, Скопје, 2002.
6.Oxford dictionray of Law, Oxford University Press, Fifth Edition, 2002.
8.Ристески Т.: Специфичностите на управната функција во областа на одбраната, докторска дисертација, Правен факултет, Скопје, 1998.
9. Ристески Т.: Правните аспекти на компатибилноста на националната инфраструктура на просторни податоци на Република Македонија со
инфраструктурите на земјите членки на Европската унија, International Scietific
Conference,- Proceedings, “Importance of Developing National Spatial Data
Infrastructure of the Republic of Macedonia Based on INSPIRE Directive, 27 narch
2009, FON University, Skopje, Macedonia.
10. Pusić E.: Društvena regulacija, Globus, Zagreb, 1989.
11. Vojna Enciklopedija, Tom -10, Vojna Tajna, Redakcija Vojne Enciklopedije, 1975.
12. Закон за катастар на недвижности, „Службен весник на РМ“, број 40/2008.
13. Закон за класифицирани иинформации
13. Закон за одбрана, „Службен весник на РМ“, број 42/01
BIOGRAPHICAL NOTES OF THE AUTHOR
Dr. Temelko Risteski is professor of administrative law and
normative activities at the Law Faculty of the FON
University, Skopje. Before that, as an active officer (colonel)
worked on command and administrative duties in the Army,
was a judge of the court-martial and a longtime professor of
Military Law (administrative, criminal, civil, humanitarian)
of the Military akadmija in Skopje. His interest is subject to
problems in administration (the administration) as well as
problems in the area of legislation. So far has published over
fifty scientific papers and equally applicable professional
articles in various journals, collections and scientific
meetings. It uses English, French and all South Slavic languages.
International Conference SDI 2010 – Skopje; 15-17.09.2010
405
SPATIAL CLASSIFICATION OF LAND PARCELS
IN LAND ADMINISTRATION SYSTEMS
Halil Ibrahim INAN1, Arif Cagdas AYDINOGLU
2,
Tahsin YOMRALIOGLU3
ABSTRACT
Types of land parcels in Land Administration Systems (LAS) are mostly classified differently in
different countries or in different regions of the same country. Different classification systems
may be caused by the related legal framework, the parties involved in the process or even
different customs. However, they are mainly caused by the fact that there is no standardization for
such a classification. Standardization of classes of land parcel type may be possible and may
increase its multipurpose use. In fact, in Turkey, it is strongly needed to separate land use/cover
classes and annexes of the land parcel in the classification of land parcel types. However, this will
not be a complete resolution in terms of multipurpose use within spatial data infrastructures
(SDI). In this study, a new style of spatial classification is proposed. The proposed solution
requires further development of land administration systems towards the basic building block of
SDI. The solution proposes to store different land use/cover classes with permanent boundaries
within land parcels with their own geometries which are topologically dependent on the land
parcel. The solution is especially functional for agricultural policy implementation in rural areas
and has the potential to be effective also for other multi-purposes such as the production of
precise descriptive statistical data, planning, land development, construction of engineering
structures and other land management activities.
Key word: Land administration, land management, land parcel type, land use/cover,
classification, standardization.
1. INTRODUCTION
Land Parcels which is accepted as the basic spatial unit for Land Administration
Systems (LAS) (Dale and McLaughlin, 1988; 1999), in the majority of cases, cannot
easily be used for other applications or especially SDIs as the basic spatial unit. There
may be several reasons responsible for this. Yet, one of the most important reasons
among these is the so-called idea that land parcel boundaries represent only legal
situation and cannot appropriately be used for other purposes. In accordance with that
1 Dr. Halil Ibrahim INAN, [email protected]
Institution, www.ktu.edu.tr
Tel.: +90 462 3773653, Gsm.: +90 536 3039398, Fax: +90 462 3280918.
KTU, Muhendislik Fak., Harita Muh. Bol., 61080 Trabzon, Turkey. 2 Dr. Arif Cagdas AYDINOGLU, [email protected]
Institution, www.itu.edu.tr
Tel.: +90 212 2853782.
ITU, Ayazaga Kampusu, 34469 Istanbul, Turkey. 3 Prof. Dr. Tahsin YOMRALIOGLU, [email protected]
Institution, www.itu.edu.tr
Tel.: +90 212 2853782.
ITU, Ayazaga Kampusu, 34469 Istanbul, Turkey.

International Conference SDI 2010 – Skopje; 15-17.09.2010
406
idea, types of land parcels are classified differently in different countries or even in
different regions of the same country. More interestingly, this type of classification is
done by mixing/piling/considering both the type of land use (arable land, grass land,
olive, none productive etc.) and the annexes (3 storey house, pool, garage, etc) existing
in a land parcel. This may be caused by the facts that land parcels in LAS is only subject
to homogenous rights (UN-ECE, 2004) and there is no need to register different objects
in a land parcel in a robust way which makes possible to reach information on each
object in a land parcel.
For a possible multipurpose use of land parcel information in LAS, especially for the
establishment of SDI, considering land parcel conventionally as the only basic spatial
unit may hinder proper classification of land parcel types and separation of annexes
from the classification. If it is strongly needed, traditional classification of land parcels
may be preserved in LAS, yet some advancement is needed for the multipurpose use of
spatial data in LAS. In this context, establishing a new classification method by defining
appropriate spatial land cover/use classes (sub-parcels) within land parcels may be a
good solution.
2. LAND PARCEL AND ITS MULTIPURPOSE USE
Land parcel is the most important spatial component of a LAS. It may be defined as a
single closed area (or volume) that is determined geographically by its boundaries,
contains land under homogeneous property rights and is held in one ownership.
With homogeneous property right, all types of property rights apply to all shareholders
proportionate to their share (all shares in a land parcel forms one single ownership). So,
determination or registration of different rights specific to one share holder is not
required to secure the right. This may be interpreted that, in LAS, there is no need for
the identification of different objects or land use types in a land parcel for the
management of property rights. Yet, it may be required for other purposes within or
outside LAS.
In reality a land parcel is a volume of space (a 3D object) subject to different rights on,
above and below the surface (Figure 1). However, in the majority of cases, it is spatially
represented by its surface area as a polygon feature in LAS. Only when it is strongly
required (for the management of urban land) and technically possible it is represented as
a 3D space as a volume feature.

International Conference SDI 2010 – Skopje; 15-17.09.2010
407
Figure 1. The Land Parcel (Dale and McLaughlin, 1988)
In the last decade, during the implementation of agricultural policy in the European
Union (EU), the possibility of use of land parcels (cadastral parcels) in LAS was raised
in the majority of the countries in the EU. However, together with many other reasons,
the so-called different philosophy or complexity of LAS prevented the use of land
parcel data for the implementation of agricultural policy (see Milenov and Kay, 2006;
Zielinski and Sagris, 2008). Similarly, land parcel as the basic spatial unit of LAS
cannot also be used as the basic spatial unit for the implementation of the initiative
Infrastructure for Spatial Information in Europe (INSPIRE), rather it is included as an
independent (or partly integrated) spatial unit specific to LAS. The relation between
INSPIRE and land parcels (cadastral parcels) are explained in detail in INSPIRE Data
Specification on Cadastral Parcels (see INSPIRE, 2010). This recently published
document demonstrates possible spatial relation with land parcels for the management
of environmental data within the scope of INSPIRE and also addresses potential
problems with this relation.
LAS may be regarded as complex systems with many different aspects (technical, legal,
social, economical, administrative etc.). However, there is no need to mix up all aspects
together; rather, every aspect should be threaded separately when needed. For example,
technically, the basic spatial unit (land parcel) of LAS can be threaded differently for
different purposes. Beyond that, representation of land parcels, its boundaries, land
use/cover types and annexes should technically be represented, stored and managed in a
simplified way, rather than managing a land parcel as one single complex object. Any
possible simplification will increase the use of spatial data for other purposes inside or
outside LAS.

International Conference SDI 2010 – Skopje; 15-17.09.2010
408
3. CLASSIFICATION OF LAND PARCEL
3.1. Traditional Classification
Land parcels in LAS are traditionally classified for the specific needs within LAS. In
some cases, even a real classification method is not applied, only types of land parcels
are determined with mixing up main land use type and annexes in a land parcel (as in
Turkey). This type of classification makes impossible to distinguish different types of
land parcels. For example, in a study conducted in Macka county of Trabzon Province
in Turkey by Uzun and Inan (2007), about 1400 different types of land parcels out of
30000 land parcels is determined. With that study, it is also determined that many types
of land parcels are very similar, but classified differently due to the lack of
standardization in classification.
3.2. Classification for Multipurpose Use
In this study, the classification of land parcels is focused. In this context, it is a fact that
certain standardization is required in order to increase the multipurpose use of land
parcel data. However, an overnight dramatic advancement in the classification of land
parcel should not be expected because LAS is a living system which has long been
affected by the type of administration, social life and also traditions. Therefore, a
gradual advancement in the classification of land parcels in LAS should be expected,
and measures should be done accordingly. In this context, two stages of advancement
are approved in this study. One is the standardization on the classification of land parcel
types and the other is the standardization on the classification of land parcel spatially by
defining spatial sub-parcels with different land use/cover type in land parcels.
3.2.1. Classification of Land Parcel Type
Land Parcel Type may traditionally be determined as a combination of all different land
use/cover types and, in some cases, also some annexes (natural or manmade features
except for land use/cover) in land parcel. For this study, however, it is defined as a
single dominant or generalized land use/cover type of a land parcel. If it is strongly
required, it may also be very well defined combination of multiple land use/cover.
As the first stage of standardization on the classification of land parcels;
• defining standardized domains for the determination of land parcel types,
• developing methods for the registration of annexes in land parcels as independent
objects from land parcel types will be a vise/practical solution to the problem.
However, this will not be a complete solution in terms of multipurpose use within
spatial data infrastructures (SDI) because this first stage will only make the
differentiation of main/basic land parcel type of land parcels and their annexes. This
first stage of standardization may contribute to the multipurpose use of land parcel data
in some extent. In fact, INSPIRE Data Specification on Cadastral Parcels suggests this
solution. However, this may be regarded as an interim solution. So, a robust solution is
still required.

International Conference SDI 2010 – Skopje; 15-17.09.2010
409
3.2.2. Spatial Classification of Land Parcel
It is a fact that land parcels may include one or several land use/cover types. The
determination and registration of every single land use/cover type in land parcels may
not be technically possible. Yet, a standardized method for the classification of basic
land use/cover classes in land parcels and their registration may be possible. For such a
classification, the classes should be meaningful in terms of the possibility of their
registration and their maintenance/update.
Figure 2. Land Parcel (Cadastre Parcel) and Sub-Parcel Data Model
In this study, each standardized class of different land use/cover types in land parcels is
called as Sub-Parcel (see Figure 1). So, Sub-Parcel is defined as a basic subdivision of a
land parcel in LAS. The term sub-parcel is used in previous literature for the
implementation of agricultural policy with a slightly different meaning (see Perez,
2003). Similarly, this concept was presented as a general classification of land parcels
by Inan et al. (2008). That classification included only three basic classes – Cultivated,
Planted and NonAgricultural.
In the classification of sub parcel types, special attention is given to the permanence of
boundaries considering the previously defined basic rule of the possibility of their
registration and their maintenance/update. In fact, relatively few changes in the
boundaries of the seven main sub-parcel types (see Table 1) are expected. Sub-Parcel
data model and spatial representation (geometry and topology) of sub-parcel boundaries
is defined in Figure 2, the data model is also shown in Figure 3 as UML class diagram.
Establishment of such boundaries may be done during cadastral surveys or it may be
done later in time using ortho photography/imagery by the responsible authorities.
(a) Building
(c)
(b)
(d)
(a) and (d): Non Agricultural Area
(b): Permanent Crop
(c): Arable Land
: Land Parcel Corner Point
: Sub Parcel Corner Point
Cadastre Parcel*: The area composed of
connecting Land Parcel Corner Points.
Sub Parcel*: Each area composed of connecting
Land Parcel Corner Points and/or Sub Parcel Corner
Points. The total area of sub parcels equals to the
area of the land parcel.
* Parcels are defined by boundaries, which are
specified by connecting corner points.

International Conference SDI 2010 – Skopje; 15-17.09.2010
410
class Land Use/Cov er Types_for_SDI_Skopje20...
ReferenceParcel
VersionedObject
«FeatureType»
SubPARCEL::SubParcel
+ spID: Oid
+ area: Measure
+ typeSubParcel: SubParcelType
«CodeList»
SubPARCEL::
SubParcelType
+ arableLand
+ permanentCrop
+ permanentPasture
+ semiNaturalGrassLand
+ oliveTrees
+ otherTrees
+ nonAgricultural
LA_SpatialUnit
«FeatureType»
SpatialU::LA_Parcel
0..* 1
Figure 3. UML diagram of Sub-Parcel Data Model
The sub-parcel data model provides the functionality to register some important land
use/cover classes as independent objects in relation (topologically) with the land parcel
where they coincide. These independent objects as the basic land use/cover classes may
be used for different purposes inside or outside the scope of LAS. They can especially
be used for SDIs as important spatial environmental information on land use/cover.
These independent objects may be used directly for large scale applications (1:1000 –
1:10000) and may be generalised for other small scale applications.
As for the topological structure of sub-parcels, they must be inside land parcels, they
cannot overlap, and there must be no gaps between them. Registered buildings and other
main annexes must be inside nonagricultural sub-parcels. Sub-parcel corner points can
not cause any splits along the edges of land parcels (see Figure 2). This topological
structure should be maintained dynamically by checking topological rules after every
related maintenance/update. This check operation should be operated mutually (in each
direction – parcel to sub-parcel or sub-parcel to parcel). As a result, topological
consistency and thus spatial data integrity in the system can be guaranteed.
In this study, seven types of sub-parcels are classified only for rural areas and especially
for the application of agricultural policy. Names of main sub-parcel types and their
description are presented in Table 1.
Table 1. Main land use types for sub parcels
Main Types Descriptin of the Type
Arable Land Includes agricultural areas cultivated with yearly crops. Types of
agricultural products within these areas are quite varying.
Vegetable gardens and set-aside areas (fallow land) are also
included in this type of agricultural land. Permanent greenhouses
may be classified as a separated main type.
Permanent Crop Includes agricultural areas planted with some kind of agricultural
permanent crops except for threes (e.g. Vineyards)
Permanent Pasture Grazing land in private or public ownership whose land cover has
not changed over years.

International Conference SDI 2010 – Skopje; 15-17.09.2010
411
Semi Natural Grass
Land
Grazing land in private ownership whose land cover is changeable
over years.
Olive Trees Olive Groves
Other Trees Fruit Orchards, and Forests
Non Agricultural The areas not subject to any agricultural production. Urban land,
rocky areas, areas with brushwood, roods are some examples.
4. DISCUSSION and CONCLUSIONS
Sub-parcel data model proposed with this study provides a spatial classification of land
use/cover within land parcels, and clearly distinguishes annexes as different types of
objects which should be registered independently from land use/cover classes. The
application of sub-parcel data model is proposed with this study, especially, in order to
increase the potential multipurpose use of land parcel data of LAS in different areas of
application. The proposed data model adds power to land parcel data in terms of spatial
representation of different objects within the boundaries of a land parcel. The model
also suggests dynamic data integrity by defining and checking topology rules, which
makes possible to keep a constant spatial relation between land parcels and sub-parcels
(land use/cover data). Beyond that, the model removes the notion that land parcel data
represents only legal situation. In fact, sub-parcels are beyond the legal situation, they
represent different main land use/cover types within land parcels which, in legal terms,
are homogeneously shared by shareholders.
Currently the sub-parcel data model is especially functional for agricultural policy
implementation in rural areas and has the potential to be effective also for other multi-
purposes such as the production of precise descriptive statistical data, planning, land
development, construction of engineering structures and other land management and
environmental activities. The model may also contribute to INSPIRE Data Specification
on Cadastral Parcels. However, it is in its development stage and should be further
shared with scientists and adequately discussed.
The implementation of proposed sub-parcel data model may not easily be possible in
current conventional LAS. So, at the first stage, standardization of land parcel types
may be an interim solution. This will help the distinction of annexes and initiation of
standardization initiative for the classification of land parcels. At, the second stage,
application of sub-parcel model requires both the advancement of LASs and other
systems (SDIs) needing information from LAS. So, instant implementation will not be
possible. Instead, pilot applications should be carried out in order to discover the
applicability of the proposed data model, which gives the chance to further develop to
proposed model before a fully fledged implementation.
The registration and/or update of sub-parcels may be either within LAS or in another
system which properly communicate with LAS. In either case, the capacity (technical,
staff, managerial etc.) of responsible authority should be increased by collaborating with
main potential user organizations.

International Conference SDI 2010 – Skopje; 15-17.09.2010
412
Seven sub-parcel types as the basic land use/cover classes which are determined in this
study are specific to rural areas and agricultural policy implementation. Therefore, for
the implementation of the presented data model further study is required for the
refinement of the classes to cover urban areas and other areas of application.
With this proposed method, contribution to the multipurpose use of LAS data is aimed.
National or international initiatives for the modernization and standardization in the area
of LAS and also initiatives for integrating separate data infrastructures may be used as
good opportunities to implement this spatial classification method.
5. REFERENCES Dale, P. F. and McLaughlin, J. D., 1988. Land Information Management, Clarendon Press,
Oxford, ISBN 0-19-858404-0.
Dale, P. F. and McLaughlin, J. D., 1999. Land Administration Systems, Oxford University Press,
Great Clarendon Street, Oxford OX2 6DP, ISBN 0-19-823390-6.
Inan, H. I, Yomralioglu, T., van Oosterom, P. and Zevenbergen, J., 2008. On the Level of
Cooperation between Agricultural and Cadastral Parcel Registration, FIG Working Week 2008,
14-19 June 2008, Stockholm, Sweden.
INSPIRE, 2010. D2.8.1.6 INSPIRE Data Specification on Cadastral Parcels – Guidelines.
Milenov, P and Kay, S., 2006. Status of the Implementation of LPIS in the EU Member States,
Proceedings of the 12th MARS PAC Annual Conference, Toulouse, 27-29 November, 2006.
Perez, J. M., 2003, The Use of Spanish Cadastre for the Control and Monitoring of EU-CAP
Subsidies, WPLA Workshop, Athens 28-31 May 2003.
UN-ECE, 2004. Guidelines on Real Property Units and Identifiers, New York and Geneva, 68 p.
Uzun, B. and Inan, H. I., 2007. Kadastral Verilerin CBS Ortamına Aktarılması ve Parsel–
Mülkiyet Analizleri, TMMOB CBS Kongresi 2007, Trabzon, 30 Ekim – 02 Kasım 2007.
Zielinski, R. and Sagris, V., 2008. Summary Results of the LPIS Survey 2008, Workshop 'LPIS
Application and Quality', Sofia, 17-18 September 2008. http://mars.jrc.it/mars/Bulletins-
Publications/Summary-results-of-the-LPIS-survey-2008, accessed on 18 May 2010.
6. BIOGRAPHICAL NOTES OF THE AUTHORS
Halil Ibrahim INAN worked and completed his MSc (in 2004) and
PhD study (in 2010) at the Department of Geomatics Engineering
Karadeniz Technical University, Trabzon, Turkey, and recently
moved to the same department at Erciyes University, Kayseri,
Turkey. His research interests are agricultural policy, land
administration, SDI and GIS.
Arif Cagdas AYDINOGLU works at the Department of
Geomatics Engineering of Istanbul Technical University (ITU),
Turkey. He completed his MSc study in 2003 and his Phd study in
2009. His research interests are GIS, GDI, and Semantic
Interoperability of geo-data.

International Conference SDI 2010 – Skopje; 15-17.09.2010
413
Tahsin YOMRALIOGLU works as a professor at the Department
of Geomatics Engineering of Istanbul Technical University (ITU),
Turkey. He completed his Phd study in 1994. His research interests
are GIS, GDI, land administration and land management.

INTERNATIONAL SCIENTIFIC CONFERENCE
“INTERNATIONAL CONFERENCE ON SPATIAL DATA INFRASTRUCTURES 2010”
15-17 September 2010, FON University, Skopje, Macedonia
http://sdi2010.evkartenn.com; [email protected]
414
General sponsors:
FON University – Skopje, Macedonia
Evkartenn – Thessaloniki, Greece
Silver sponsors:
Intergraph
ESRI
Media sponsors:
Geoconnexion International Magazine
GIM International
Vector1Media
Evkartenn– Thessaloniki, Greece
Sponsors:
Geoinformatika – Skopje, Macedonia
NIKO computers – Skopje, Macedonia
Remark: The last update of the list of all type of sponsors is 15/08/2010.

INTERNATIONAL SCIENTIFIC CONFERENCE
“INTERNATIONAL CONFERENCE ON SPATIAL DATA INFRASTRUCTURES 2010”
15-17 September 2010, FON University, Skopje, Macedonia
http://sdi2010.evkartenn.com; [email protected]
415
CIP – Каталогизација во публикација
Национална и Универзитетска библиотека „СВ. Климент Охридски ‘’ Скопје
91(063)
INTERNATIONAL conference on spatial data
infrastructures (2010, Skopje)
Proceedings / INTERNATIONAL conference on spatial data
Infrastructures 2010, 15-17 September 2010, FON University, Skopje,
Macedonia; editors Bashkim Idrizi, Dimo Todorovski., - Skopje : Alfa 94, 2010 –
415стр,: илустр.; 25cm
фусноти кон текстот
ISBN 978 – 9989 – 936-32-6
1. Гл. Ств. Насл.
а) Географија – собири
COBISS.MK-ID 84544010
South-East European Research Association on Geo Sciences “Geo-SEE”
www.geo-see.org
str. Dzon Kenedi, 25/1-d3;
1000 Skopje;
MACEDONIA.