Probing the volume changes during voltage gating of Porin 31BM channel with nonelectrolyte polymers
10
Probing the volume changes during voltage gating of Porin 31BM channel with nonelectrolyte polymers Carlos M.M. Carneiro a , Petr G. Merzlyak a , Liliya N. Yuldasheva a , Leandro G. Silva a , Friedrich P. Thinnes b , Oleg V. Krasilnikov a, * a Laboratory of Membrane Biophysics, Department of Biophysics and Radiobiology, Federal University of Pernambuco, 50670-901, Recife, PE, Brazil b Max-Plank Institute of Experimental Medicine, Go ¨ttingen, Germany Received 4 September 2002; received in revised form 13 February 2003; accepted 4 April 2003 Abstract To probe the volume changes of the voltage-dependent anion-selective channel (VDAC), the nonelectrolyte exclusion technique was taken because it is one of the few existing methods that may define quite accurately the rough geometry of lumen of ion channels (in membranes) for which there is no structural data. Here, we corroborate the data from our previous study [FEBS Lett. 416 (1997) 187] that the gross structural features of VDAC in its highest conductance state are asymmetric with respect to the plane of the membrane, and state that this asymmetry is not dependent on sign of voltage applied. Hence, the plasticity of VDAC does not play a role in the determination of lumen geometry at this state and the asymmetry is an internal property of the channel. We also show that the apparent diameter of the cis segment of the pore decreases slightly from 2 to 1.8 nm when the channel’s conductance decreases from its high to low state. However, the trans funnel segment undergoes a more marked change in polymer accessible volume. Specifically, its larger diameter decreases from f 4 to 2.4 nm. Supposing the channel’s total length is 4.6 nm, the apparent change in channel volume during this transition is estimated to be about 10 nm 3 , i.e. about 40% of the channel’s volume in the high conductance state. D 2003 Elsevier Science B.V. All rights reserved. Keywords: Ion channel; Lipid bilayer; VDAC; Volume change 1. Introduction Protein pores (ion channels) possess several properties such as conductance, selectivity and gating. There are growing indications that the electrical properties of single ion channels, called ‘‘gating’’, are correlated with its structural modifications. All geometric models developed to describe this behavior can be roughly divided into two classes: ‘‘blocking’’ and ‘‘rearrangement’’. It appears that voltage-dependent K + channels are a striking example of the first model of gating [1], while voltage-dependent anion-selective channel (VDAC) [2,3] and gap junction [4] are representatives of the second model of gating. Measurement of the changes in the internal channel volume is very helpful in distinguishing between these two classes of models. However, there are few methods available for channels for which there is no structural data [2,5]. Given the interest in this area, it is of fundamental importance to develop new methods to measure changes in internal channel volume with channel opening and closing. Here we introduce an approach that bases on nonelectro- lyte exclusion method, developed recently to define the internal geometry of pores [6]. Bovine muscle porin (Porin-31BM channel) was used in our investigation. Based on the channel geometry in high and low conduc- tance states, the apparent change in the channel volume during this transition is estimated to be of f 10 nm 3 . The 0005-2736/03/$ - see front matter D 2003 Elsevier Science B.V. All rights reserved. doi:10.1016/S0005-2736(03)00113-5 * Corresponding author. Depto. de Biofisica e Radiobiologia, Centro de Ciencias Biologicas, Universidade Federal de Pernambuco, Cidade Universitaria, Av. prof. Moraes Rego, S/N, Recife, Pernambuco, CEP 50670-901, Brazil. Tel.: +55-81-327-18535; fax: 55-81-327-18560. E-mail address: [email protected] (O.V. Krasilnikov). www.bba-direct.com Biochimica et Biophysica Acta 1612 (2003) 144 – 153
-
Upload
independent -
Category
Documents
-
view
0 -
download
0
Transcript of Probing the volume changes during voltage gating of Porin 31BM channel with nonelectrolyte polymers
www.bba-direct.com
Biochimica et Biophysica Acta 1612 (2003) 144–153
Probing the volume changes during voltage gating of Porin 31BM
channel with nonelectrolyte polymers
Carlos M.M. Carneiroa, Petr G. Merzlyaka, Liliya N. Yuldashevaa, Leandro G. Silvaa,Friedrich P. Thinnesb, Oleg V. Krasilnikova,*
aLaboratory of Membrane Biophysics, Department of Biophysics and Radiobiology, Federal University of Pernambuco, 50670-901, Recife, PE, BrazilbMax-Plank Institute of Experimental Medicine, Gottingen, Germany
Received 4 September 2002; received in revised form 13 February 2003; accepted 4 April 2003
Abstract
To probe the volume changes of the voltage-dependent anion-selective channel (VDAC), the nonelectrolyte exclusion technique was
taken because it is one of the few existing methods that may define quite accurately the rough geometry of lumen of ion channels (in
membranes) for which there is no structural data.
Here, we corroborate the data from our previous study [FEBS Lett. 416 (1997) 187] that the gross structural features of VDAC in its
highest conductance state are asymmetric with respect to the plane of the membrane, and state that this asymmetry is not dependent on sign of
voltage applied. Hence, the plasticity of VDAC does not play a role in the determination of lumen geometry at this state and the asymmetry is
an internal property of the channel.
We also show that the apparent diameter of the cis segment of the pore decreases slightly from 2 to 1.8 nm when the channel’s
conductance decreases from its high to low state. However, the trans funnel segment undergoes a more marked change in polymer accessible
volume. Specifically, its larger diameter decreases from f 4 to 2.4 nm. Supposing the channel’s total length is 4.6 nm, the apparent change
in channel volume during this transition is estimated to be about 10 nm3, i.e. about 40% of the channel’s volume in the high conductance
state.
D 2003 Elsevier Science B.V. All rights reserved.
Keywords: Ion channel; Lipid bilayer; VDAC; Volume change
1. Introduction the first model of gating [1], while voltage-dependent
Protein pores (ion channels) possess several properties
such as conductance, selectivity and gating. There are
growing indications that the electrical properties of single
ion channels, called ‘‘gating’’, are correlated with its
structural modifications. All geometric models developed
to describe this behavior can be roughly divided into two
classes: ‘‘blocking’’ and ‘‘rearrangement’’. It appears that
voltage-dependent K+ channels are a striking example of
0005-2736/03/$ - see front matter D 2003 Elsevier Science B.V. All rights reserv
doi:10.1016/S0005-2736(03)00113-5
* Corresponding author. Depto. de Biofisica e Radiobiologia, Centro de
Ciencias Biologicas, Universidade Federal de Pernambuco, Cidade
Universitaria, Av. prof. Moraes Rego, S/N, Recife, Pernambuco, CEP
50670-901, Brazil. Tel.: +55-81-327-18535; fax: 55-81-327-18560.
E-mail address: [email protected] (O.V. Krasilnikov).
anion-selective channel (VDAC) [2,3] and gap junction
[4] are representatives of the second model of gating.
Measurement of the changes in the internal channel
volume is very helpful in distinguishing between these
two classes of models. However, there are few methods
available for channels for which there is no structural data
[2,5]. Given the interest in this area, it is of fundamental
importance to develop new methods to measure changes in
internal channel volume with channel opening and closing.
Here we introduce an approach that bases on nonelectro-
lyte exclusion method, developed recently to define the
internal geometry of pores [6]. Bovine muscle porin
(Porin-31BM channel) was used in our investigation.
Based on the channel geometry in high and low conduc-
tance states, the apparent change in the channel volume
during this transition is estimated to be of f 10 nm3. The
ed.
C.M.M. Carneiro et al. / Biochimica et Biophysica Acta 1612 (2003) 144–153 145
procedure should be applicable to other ion channels and to
related structures.
2. Materials and methods
2.1. Materials
VDAC was isolated from bovine muscle by using meth-
ods described elsewhere [7] for VDAC from human tissue.
Pure phosphatidylcholine and cholesterol were purchased
from Sigma Chemical Co., St. Louis, MO. Polyethylene
glycols, such as PEG300 and PEG400 (Sigma), PEG600
(Riedel de Haen, Quimibras Industrias Quimicas, S.A.,
Brazil), PEG1000 and PEG1450 (Sigma), PEG2000,
PEG3000 and PEG4000 (Loba Chemie, Mumbai, India),
PEG8000 and PEG12000 (Sigma) were used. The hydro-
dynamic radii of PEGs determined by viscometry were taken
from [8]. The authors used a glass capillary viscometer
with low stream of solution to avoid the deformation of the
polymer shape by the shear forces and found the following
values to hydrodynamic radii: 0.60F 0.03 nm PEG300;
0.70F 0.03 nm PEG400; 0.80F 0.04 nm PEG600;
0.94F 0.03 nm PEG1000; 1.05F 0.03 nm PEG1450;
1.22F 0.03 nm PEG2000; 1.44F 0.03 nm PEG3000;
1.92F 0.03 nm PEG4000; 2.1F 0.03 nm PEG4600. The
number average (Mn) and weight average (Mw) molecular
masses of the polymers were determined by gel permeation
chromatography. The ratio Mw/Mn indicates the mass distri-
bution of a polymer and it was found to increase with
molecular mass of a polymer from 1.08 (for PEG400) to
1.18 (for PEG4600). This is indicative of moderate dispersi-
bility of PEGs that, notwithstanding, does not apparently
hamper channel sizing experiments [9]. Other chemicals
were of analytical grade.
Fig. 1. Original recordings of VDAC insertion (A) and the transitions of the sing
zero current level. The dotted line indicates the zero voltage level. Current and
HEPES, pH 7. VDAC was added in the cis compartment. In experiments wit
experiments (B) the voltage protocol is shown in the figure. The arrow indicates
switched to 50 mV. This forced the channel to go to a low conductance state. In o
and the back to 50 mV again.
3. Methods
3.1. General aspects
Double distilled water was used to prepare all aqueous
solutions. Unless stated otherwise, standard solution used
in the bilayer experiments contained 1.15 M KCl and 5
mM HEPES and the pH was adjusted to 7.0 with 1.0 M
KOH. In channel sizing experiments, this solution also
contained 20% (w/v) of an appropriate molecular weight
PEG. Black lipid membranes (BLM) were formed at
room temperature 25F 2 jC by the Mueller method
[10] from a phosphatidylcholine–cholesterol mixture
(3:1, mass/mass). Bilayer experiments were performed
under voltage-clamp conditions in essentially the same
manner that has been described recently [11]. Bilayers
were not rebuilt when VDAC was already present in the
bathing solution.
The amplifier signal was monitored with a storage oscil-
loscope (Model 201, Nicolet Technologies, Madison, WI) as
well as with the IBM-compatible 486/487 100 MHz com-
puter with DT01-EZ 12 bit A/D converter board (Data
Translation). Whole Cell Electrophysiology Program
(WCP V1.7b, J. Dempster) software was used. Upward
current steps (Fig. 1A) were measured and single channel
conductances were estimated by dividing the single channel
current by the voltage imposed through the membrane.
Cumulative histograms of the events at all experimental
conditions were made. The histograms were not uniform.
A sum of two to three theoretical normal distributions was
needed to fit its. Microcal Origin software was utilized for
this aim. Mean value of the main pool of the channel events
was used for subsequent analysis.
In most experiments, positive (10 or 50 mV) voltage
pulses were applied to the cis compartment of the chamber,
le channel to the low conductance state (B). The dashed lines indicate the
time scales are given in the figure. Solution contains 1.15 M KCl, 5 mM
h VDAC insertion (A) potential was + 10 mV. For the channel closing
the moment of the channel insertion at + 10 mV. Then the potential was
rder to reopen the channel, the potential was transiently switched to 0 mV
C.M.M. Carneiro et al. / Biochimica et Biophysica Acta 1612 (2003) 144–153146
which was defined as the side of Porin 31BM addition. The
polarity was chosen to simulate the conditions in the outer
mitochondrial membrane, where a positive value of poten-
tial is expected on the side of protein insertion, because
VDAC is synthesized in the cytoplasm and only then
incorporated into the outer mitochondrial membrane [12].
In a separate set of experiments the negative voltage pulses
were used to verify whether the direction of the electric field
affects the lumen geometry of VDAC channel in its high
conductance state. In our previous work [11] and this study
VDAC channels appeared to have a similar orientation in
membranes because the established asymmetry in the lumen
geometry is only possible if VDAC channels are invariably
oriented. Our observations are in accordance with data
obtained with channels formed by other mammalian porin,
e.g. Porin 31HL, in lipid bilayers [13] where the authors had
noted that in response to positive and negative voltage
pulses ‘‘the current decreased in a somewhat asymmetric
fashion which suggested asymmetric insertion of the chan-
nels into the membrane’’.
These and several other publications contradict the
widely accepted point of view that VDAC inserts into planar
lipid bilayers in random orientation. The reason of this
discrepancy is not clear now and is not a topic of this study.
3.2. Sizing of VDAC
To find changes in internal channel volume with channel
opening and closing, one needs to know the parameters of
the channel lumen at these two states. Geometric parameters
of the Porin 31BM channel in high conductance state were
taken from our previous study [11], which was additionally
improved (as regards to access resistors correction) and
completed with new results obtained with opposite (neg-
ative) sign of voltage pulses (� 10 mV) on the side of
protein addition.
To analyze the channel lumen geometry in low conduc-
tance state, the bilayer was initially clamped at 10 mV.
When a channel appeared, its conductance was measured
and the potential was changed to 50 mV. This caused VDAC
to switch to its low conductance state. To reopen the channel
to its high conductance state, the transmembrane potential
was transiently set to 0 mV and then back again to 50 mV
(Fig. 1B). Experiments with different PEGs placed in
contact with one of the openings of the channel were done.
The low conductance values for each individual channel
were determined, and the results obtained for different
channels under the same conditions were summarized in
the cumulative histogram and analyzed in the same manner,
as was done for the case of VDAC in high conductance
state.
Because several theoretical issues concerning polymer
partitioning into a channel pore are still unresolved even in
the case of symmetric polymer addition, we used here an
empirical approach to analyze polymer partitioning under
asymmetrical conditions. We assumed that if the PEG
hydrodynamic radius is smaller than the opening of the
channel, PEG partitions freely into the pore and occupies
(with a concentration proportional to its bulk concentration)
all the space available before the narrowest constriction
prevents the polymer from partitioning further into the pore.
If the PEG hydrodynamic radius is larger than the pore’s
radius at the opening, it cannot partition into the pore. Thus,
if PEGs enter the channel lumen of a given channel, the
conductance of that channel decreases. On the other hand,
molecules that do not enter the lumen should not signifi-
cantly alter single channel conductance.
In the asymmetric addition of polymer system used here,
the bulk conductivity of the solutions and the activity of
ions on both sides of the membrane were identical. The
slight difference in osmolalities should not generate a strong
water flow through the channel or a detectable transmem-
brane potential [14].
The mean values of the main pool of single channel
conductances and bulk conductivities are used to establish
the filling (F) of the channel with PEG through one of it
openings (see below). The geometrical features of the
VDAC lumen were established using a two-step procedure.
First, the VDAC single channel conductance data were used
to calculate the filling of the channel with PEG as described
elsewhere [15] and the sizes of the cis and the trans open-
ings were estimated from the dependence of F on the
hydrodynamic radius of the polymer.
Second, the single channel conductance data were cor-
rected for the access conductance ( gacc), which was calcu-
lated in accordance with Hall [16] for each opening:
gacc ¼ 4rv
where r is the radius for the channel opening and v is the
solution conductivity.
The corrected conductance data were used throughout
this study to calculate the channel filling F with PEG using
following equation:
F ¼ g0 � gi
gi
� �v0 � vi
vi
� ��
where g0 is the single channel conductance in the polymer-
free solution; gi is the single channel conductance in the
presence of PEG with access to the channel interior on one
side only ( gicis or gi
trans ) while PEG4600 was on the other
side; v0 and vi are the conductivities of the polymer-free
solution and the solution containing 20% (w/v) of a given
polymer, respectively.
The filling parameter, F, is plotted against the hydro-
dynamic radius of PEG, and the geometry of VDAC lumen
was finally deduced from this dependence. Small PEGs
penetrate the VDAC channel. Increasing the size of the PEG
produces a decrease in F until a constant lower limit is
attained. The intercept between the linear inverse relation
and the invariant lowest portion of the parameter F on the
hydrodynamic radius of PEG was assumed to be the
C.M.M. Carneiro et al. / Biochimica et Biophysica Acta 1612 (2003) 144–153 147
maximum radius of the channel opening. In addition, a
change in the slope of the inverse linear relation between F
and PEG hydrodynamic radius was assumed to reflect a
change in geometry of the channel along its lumen. This
method provides an estimate for the maximum size of both
channel openings with F 0.1 nm accuracy. The length of
the channel segments with different geometries can be
determined with less precision.
The polymer-exclusion method assumes the absence of
interaction between PEG and a channel wall (but see Refs.
[9,17,18]) and gives the correct values for channel geometry
only if this assumption is true [6,9]. Although we used a
relatively high concentration of the electrolyte, F was
smaller than 1 for VDAC channel in high conductance state
at symmetric (data not shown) and asymmetric nonelectro-
lyte addition. F for VDAC in low conductance state was
over 1, but the excess was not large. This suggests the
absence of sizeable nonspecific hydrophobic interactions
between PEG and the channel lumen wall under the con-
ditions used in this study.
4. Results
4.1. Testing of hypothesis of VDAC plasticity in high
conductance state
As has been demonstrated recently [11], Porin 31BM
channel in high conductance state looks like an asymmet-
rical channel. If we assume that the channel’s total length is
4.6 nm, the cis side of the pore (the side to which VDAC is
added) appears roughly as a f 2.5-nm-long cylinder with a
diameter of f 2.0 nm. In contrast, the trans side of the pore
has a funnel-like shape that seems f 4 nm in diameter at
the pore’s opening and that tapers to f 2 nm in diameter
further inside the lumen. This information was drawn from
the analysis of F� r dependence with ion channel conduc-
tance established at + 10 mV. Large portions of the VDAC
protein (localized in different parts of the molecule) move
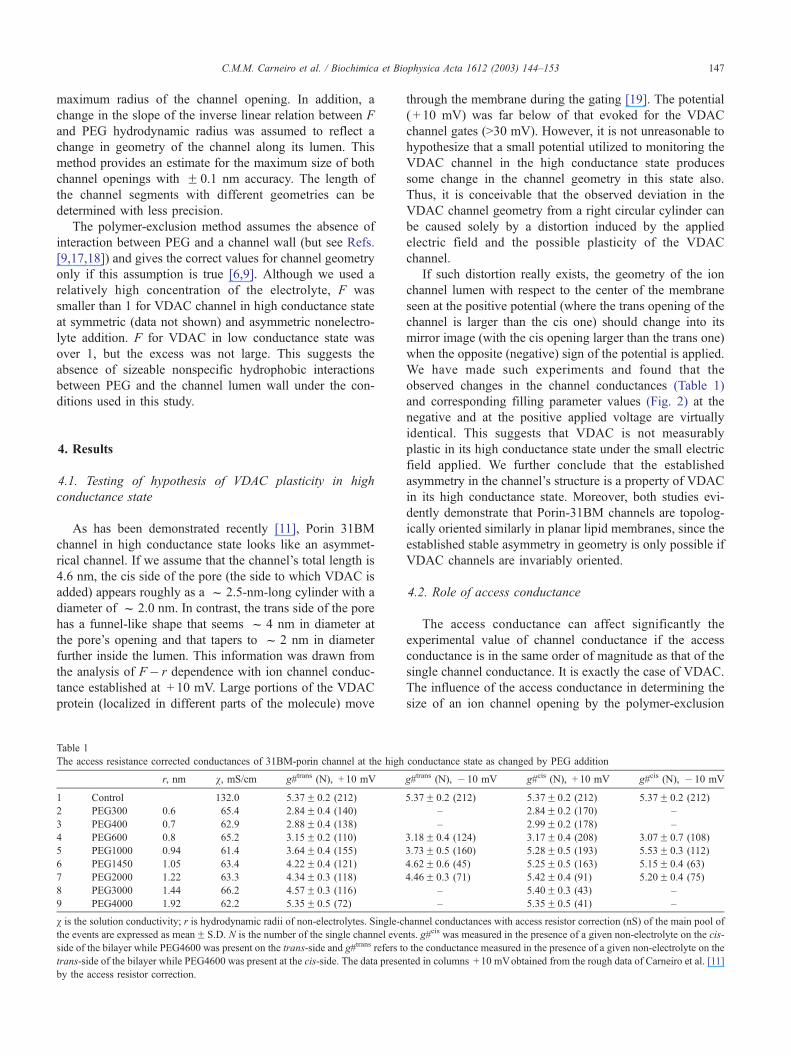
Table 1
The access resistance corrected conductances of 31BM-porin channel at the high
r, nm v, mS/cm g#trans (N), + 10 mV
1 Control 132.0 5.37F 0.2 (212)
2 PEG300 0.6 65.4 2.84F 0.4 (140)
3 PEG400 0.7 62.9 2.88F 0.4 (138)
4 PEG600 0.8 65.2 3.15F 0.2 (110)
5 PEG1000 0.94 61.4 3.64F 0.4 (155)
6 PEG1450 1.05 63.4 4.22F 0.4 (121)
7 PEG2000 1.22 63.3 4.34F 0.3 (118)
8 PEG3000 1.44 66.2 4.57F 0.3 (116)
9 PEG4000 1.92 62.2 5.35F 0.5 (72)
v is the solution conductivity; r is hydrodynamic radii of non-electrolytes. Single-c
the events are expressed as meanF S.D. N is the number of the single channel even
side of the bilayer while PEG4600 was present on the trans-side and g#trans refers to
trans-side of the bilayer while PEG4600 was present at the cis-side. The data presen
by the access resistor correction.
through the membrane during the gating [19]. The potential
( + 10 mV) was far below of that evoked for the VDAC
channel gates (>30 mV). However, it is not unreasonable to
hypothesize that a small potential utilized to monitoring the
VDAC channel in the high conductance state produces
some change in the channel geometry in this state also.
Thus, it is conceivable that the observed deviation in the
VDAC channel geometry from a right circular cylinder can
be caused solely by a distortion induced by the applied
electric field and the possible plasticity of the VDAC
channel.
If such distortion really exists, the geometry of the ion
channel lumen with respect to the center of the membrane
seen at the positive potential (where the trans opening of the
channel is larger than the cis one) should change into its
mirror image (with the cis opening larger than the trans one)
when the opposite (negative) sign of the potential is applied.
We have made such experiments and found that the
observed changes in the channel conductances (Table 1)
and corresponding filling parameter values (Fig. 2) at the
negative and at the positive applied voltage are virtually
identical. This suggests that VDAC is not measurably
plastic in its high conductance state under the small electric
field applied. We further conclude that the established
asymmetry in the channel’s structure is a property of VDAC
in its high conductance state. Moreover, both studies evi-
dently demonstrate that Porin-31BM channels are topolog-
ically oriented similarly in planar lipid membranes, since the
established stable asymmetry in geometry is only possible if
VDAC channels are invariably oriented.
4.2. Role of access conductance
The access conductance can affect significantly the
experimental value of channel conductance if the access
conductance is in the same order of magnitude as that of the
single channel conductance. It is exactly the case of VDAC.
The influence of the access conductance in determining the
size of an ion channel opening by the polymer-exclusion
conductance state as changed by PEG addition
g#trans (N), � 10 mV g#cis (N), + 10 mV g#cis (N), � 10 mV
5.37F 0.2 (212) 5.37F 0.2 (212) 5.37F 0.2 (212)
– 2.84F 0.2 (170) –
– 2.99F 0.2 (178) –
3.18F 0.4 (124) 3.17F 0.4 (208) 3.07F 0.7 (108)
3.73F 0.5 (160) 5.28F 0.5 (193) 5.53F 0.3 (112)
4.62F 0.6 (45) 5.25F 0.5 (163) 5.15F 0.4 (63)
4.46F 0.3 (71) 5.42F 0.4 (91) 5.20F 0.4 (75)
– 5.40F 0.3 (43) –
– 5.35F 0.5 (41) –
hannel conductances with access resistor correction (nS) of the main pool of
ts. g#cis was measured in the presence of a given non-electrolyte on the cis-
the conductance measured in the presence of a given non-electrolyte on the
ted in columns + 10 mVobtained from the rough data of Carneiro et al. [11]
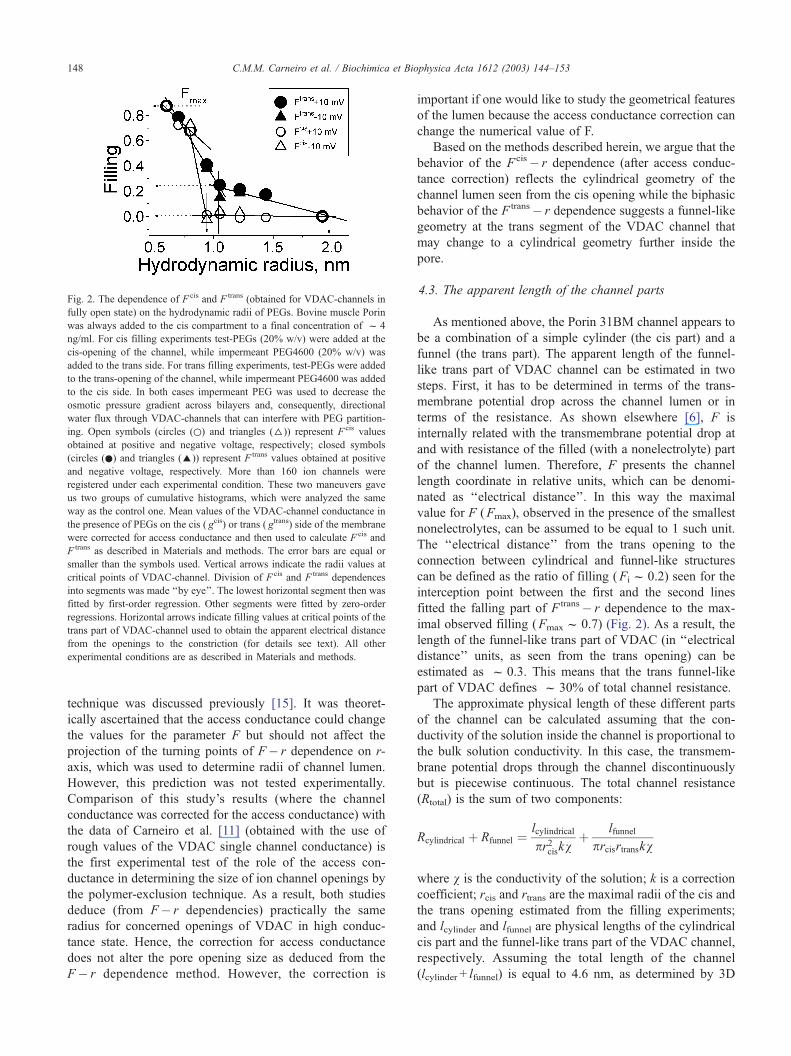
Fig. 2. The dependence of F cis and F trans (obtained for VDAC-channels in
fully open state) on the hydrodynamic radii of PEGs. Bovine muscle Porin
was always added to the cis compartment to a final concentration of f 4
ng/ml. For cis filling experiments test-PEGs (20% w/v) were added at the
cis-opening of the channel, while impermeant PEG4600 (20% w/v) was
added to the trans side. For trans filling experiments, test-PEGs were added
to the trans-opening of the channel, while impermeant PEG4600 was added
to the cis side. In both cases impermeant PEG was used to decrease the
osmotic pressure gradient across bilayers and, consequently, directional
water flux through VDAC-channels that can interfere with PEG partition-
ing. Open symbols (circles (o) and triangles (D)) represent F cis values
obtained at positive and negative voltage, respectively; closed symbols
(circles (.) and triangles (E)) represent F trans values obtained at positive
and negative voltage, respectively. More than 160 ion channels were
registered under each experimental condition. These two maneuvers gave
us two groups of cumulative histograms, which were analyzed the same
way as the control one. Mean values of the VDAC-channel conductance in
the presence of PEGs on the cis ( gcis) or trans ( gtrans) side of the membrane
were corrected for access conductance and then used to calculate F cis and
F trans as described in Materials and methods. The error bars are equal or
smaller than the symbols used. Vertical arrows indicate the radii values at
critical points of VDAC-channel. Division of F cis and F trans dependences
into segments was made ‘‘by eye’’. The lowest horizontal segment then was
fitted by first-order regression. Other segments were fitted by zero-order
regressions. Horizontal arrows indicate filling values at critical points of the
trans part of VDAC-channel used to obtain the apparent electrical distance
from the openings to the constriction (for details see text). All other
experimental conditions are as described in Materials and methods.
C.M.M. Carneiro et al. / Biochimica et Biophysica Acta 1612 (2003) 144–153148
technique was discussed previously [15]. It was theoret-
ically ascertained that the access conductance could change
the values for the parameter F but should not affect the
projection of the turning points of F� r dependence on r-
axis, which was used to determine radii of channel lumen.
However, this prediction was not tested experimentally.
Comparison of this study’s results (where the channel
conductance was corrected for the access conductance) with
the data of Carneiro et al. [11] (obtained with the use of
rough values of the VDAC single channel conductance) is
the first experimental test of the role of the access con-
ductance in determining the size of ion channel openings by
the polymer-exclusion technique. As a result, both studies
deduce (from F� r dependencies) practically the same
radius for concerned openings of VDAC in high conduc-
tance state. Hence, the correction for access conductance
does not alter the pore opening size as deduced from the
F� r dependence method. However, the correction is
important if one would like to study the geometrical features
of the lumen because the access conductance correction can
change the numerical value of F.
Based on the methods described herein, we argue that the
behavior of the F cis� r dependence (after access conduc-
tance correction) reflects the cylindrical geometry of the
channel lumen seen from the cis opening while the biphasic
behavior of the F trans� r dependence suggests a funnel-like
geometry at the trans segment of the VDAC channel that
may change to a cylindrical geometry further inside the
pore.
4.3. The apparent length of the channel parts
As mentioned above, the Porin 31BM channel appears to
be a combination of a simple cylinder (the cis part) and a
funnel (the trans part). The apparent length of the funnel-
like trans part of VDAC channel can be estimated in two
steps. First, it has to be determined in terms of the trans-
membrane potential drop across the channel lumen or in
terms of the resistance. As shown elsewhere [6], F is
internally related with the transmembrane potential drop at
and with resistance of the filled (with a nonelectrolyte) part
of the channel lumen. Therefore, F presents the channel
length coordinate in relative units, which can be denomi-
nated as ‘‘electrical distance’’. In this way the maximal
value for F (Fmax), observed in the presence of the smallest
nonelectrolytes, can be assumed to be equal to 1 such unit.
The ‘‘electrical distance’’ from the trans opening to the
connection between cylindrical and funnel-like structures
can be defined as the ratio of filling (Fif 0.2) seen for the
interception point between the first and the second lines
fitted the falling part of F trans� r dependence to the max-
imal observed filling (Fmaxf 0.7) (Fig. 2). As a result, the
length of the funnel-like trans part of VDAC (in ‘‘electrical
distance’’ units, as seen from the trans opening) can be
estimated as f 0.3. This means that the trans funnel-like
part of VDAC defines f 30% of total channel resistance.
The approximate physical length of these different parts
of the channel can be calculated assuming that the con-
ductivity of the solution inside the channel is proportional to
the bulk solution conductivity. In this case, the transmem-
brane potential drops through the channel discontinuously
but is piecewise continuous. The total channel resistance
(Rtotal) is the sum of two components:
Rcylindrical þ Rfunnel ¼lcylindrical
pr2ciskvþ lfunnel
prcisrtranskv
where v is the conductivity of the solution; k is a correction
coefficient; rcis and rtrans are the maximal radii of the cis and
the trans opening estimated from the filling experiments;
and lcylinder and lfunnel are physical lengths of the cylindrical
cis part and the funnel-like trans part of the VDAC channel,
respectively. Assuming the total length of the channel
(lcylinder + lfunnel) is equal to 4.6 nm, as determined by 3D
C.M.M. Carneiro et al. / Biochimica et Biophysica Acta 1612 (2003) 144–153 149
electron microscopy reconstruction of the channel [20], and
keeping in mind that Rfunnel/(Rcylindrical +Rfunnel) = 0.3, the
exact values of the length of two parts of the channel can be
calculated. The lengths of the cylindrical cis part and the
funnel-like trans part of VDAC in high conductance state
were estimated to be f 2.5 and f 2.1 nm, respectively.
4.4. Sizes of the openings of the channel in low conductance
state
Porin 31BM channels, as the other members of the
VDAC family [2,3], are voltage-gated. Specifically, the
channel switches to a low conductance state when the
applied potential exceeds 30 mV. Several lines of evidence
indicate that this transition involves the movement of large
portions of the protein [2,19,21]. In agreement with pre-
vious results, we observed that when the transmembrane
voltage was repeatedly changed from 10 to 50 mV, the
single channel currents decreased to different levels, corre-
sponding to a predominant low conductance ‘‘state’’ of the
channel. The states with lower conductance did not appear
at our experimental conditions.
The low conductance values for each individual channel
were calculated and the data obtained on different channels
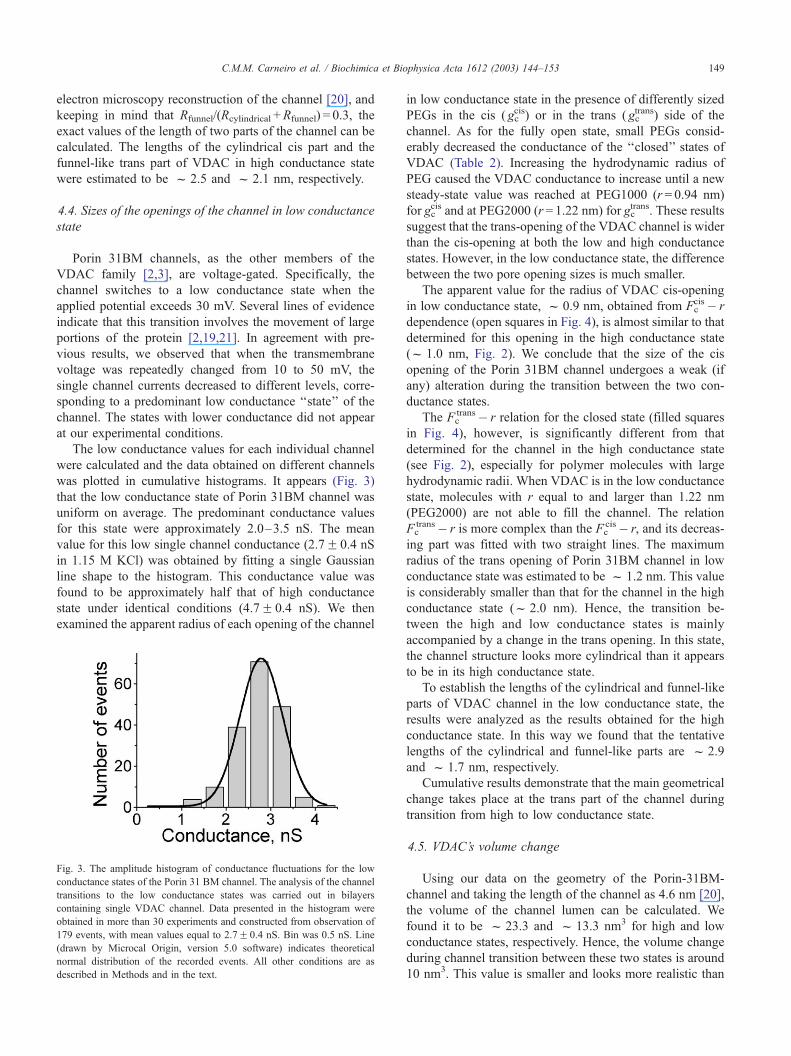
was plotted in cumulative histograms. It appears (Fig. 3)
that the low conductance state of Porin 31BM channel was
uniform on average. The predominant conductance values
for this state were approximately 2.0–3.5 nS. The mean
value for this low single channel conductance (2.7F 0.4 nS
in 1.15 M KCl) was obtained by fitting a single Gaussian
line shape to the histogram. This conductance value was
found to be approximately half that of high conductance
state under identical conditions (4.7F 0.4 nS). We then
examined the apparent radius of each opening of the channel
Fig. 3. The amplitude histogram of conductance fluctuations for the low
conductance states of the Porin 31 BM channel. The analysis of the channel
transitions to the low conductance states was carried out in bilayers
containing single VDAC channel. Data presented in the histogram were
obtained in more than 30 experiments and constructed from observation of
179 events, with mean values equal to 2.7F 0.4 nS. Bin was 0.5 nS. Line
(drawn by Microcal Origin, version 5.0 software) indicates theoretical
normal distribution of the recorded events. All other conditions are as
described in Methods and in the text.
in low conductance state in the presence of differently sized
PEGs in the cis ( gccis) or in the trans ( gc
trans) side of the
channel. As for the fully open state, small PEGs consid-
erably decreased the conductance of the ‘‘closed’’ states of
VDAC (Table 2). Increasing the hydrodynamic radius of
PEG caused the VDAC conductance to increase until a new
steady-state value was reached at PEG1000 (r = 0.94 nm)
for gccis and at PEG2000 (r = 1.22 nm) for gc
trans. These results
suggest that the trans-opening of the VDAC channel is wider
than the cis-opening at both the low and high conductance
states. However, in the low conductance state, the difference
between the two pore opening sizes is much smaller.
The apparent value for the radius of VDAC cis-opening
in low conductance state, f 0.9 nm, obtained from Fccis� r
dependence (open squares in Fig. 4), is almost similar to that
determined for this opening in the high conductance state
(f 1.0 nm, Fig. 2). We conclude that the size of the cis
opening of the Porin 31BM channel undergoes a weak (if
any) alteration during the transition between the two con-
ductance states.
The Fctrans� r relation for the closed state (filled squares
in Fig. 4), however, is significantly different from that
determined for the channel in the high conductance state
(see Fig. 2), especially for polymer molecules with large
hydrodynamic radii. When VDAC is in the low conductance
state, molecules with r equal to and larger than 1.22 nm
(PEG2000) are not able to fill the channel. The relation
Fctrans� r is more complex than the Fc
cis� r, and its decreas-
ing part was fitted with two straight lines. The maximum
radius of the trans opening of Porin 31BM channel in low
conductance state was estimated to be f 1.2 nm. This value
is considerably smaller than that for the channel in the high
conductance state (f 2.0 nm). Hence, the transition be-
tween the high and low conductance states is mainly
accompanied by a change in the trans opening. In this state,
the channel structure looks more cylindrical than it appears
to be in its high conductance state.
To establish the lengths of the cylindrical and funnel-like
parts of VDAC channel in the low conductance state, the
results were analyzed as the results obtained for the high
conductance state. In this way we found that the tentative
lengths of the cylindrical and funnel-like parts are f 2.9
and f 1.7 nm, respectively.
Cumulative results demonstrate that the main geometrical
change takes place at the trans part of the channel during
transition from high to low conductance state.
4.5. VDAC’s volume change
Using our data on the geometry of the Porin-31BM-
channel and taking the length of the channel as 4.6 nm [20],
the volume of the channel lumen can be calculated. We
found it to be f 23.3 and f 13.3 nm3 for high and low
conductance states, respectively. Hence, the volume change
during channel transition between these two states is around
10 nm3. This value is smaller and looks more realistic than

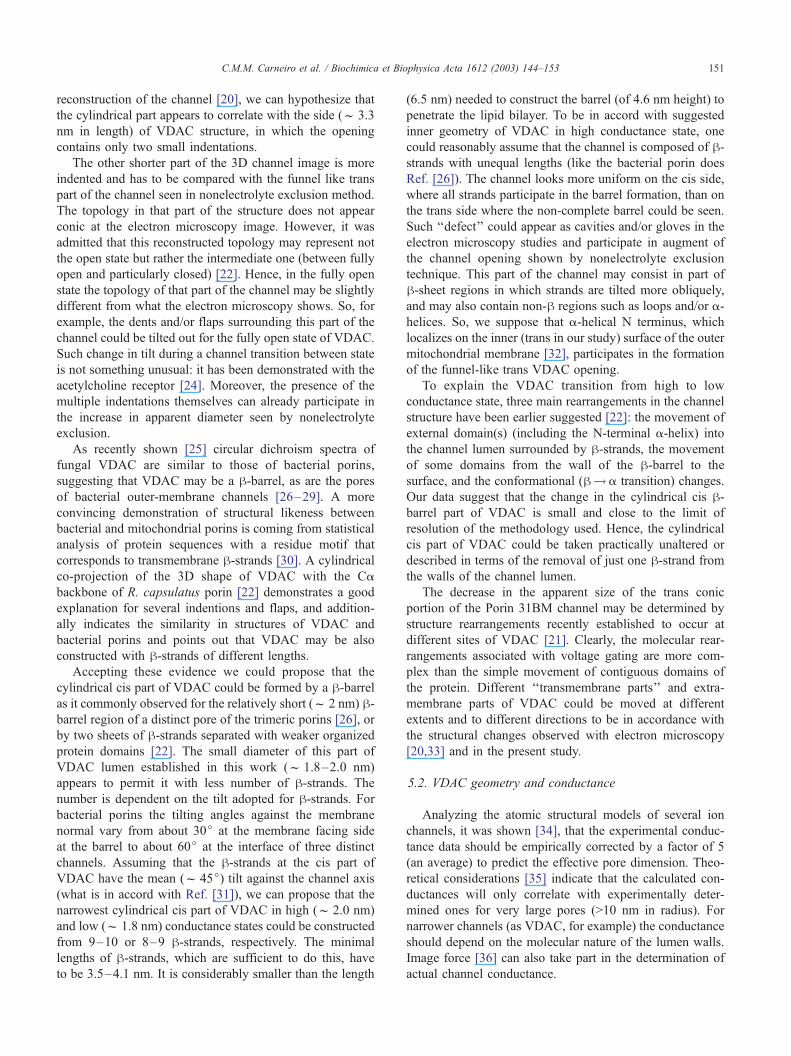
Fig. 5. An inside view on the VDAC channel lumen at high and low
conductance states. L is the channel length starting from the cis entrance (0
nm) and ending at the trans entrance (4.6 nm). The outer diameter of VDAC
channel was taken from the electron microscopy studies [22]. Dashed line
represents the central axis of the lumen. Arrows and numbers indicate
apparent diameters of the channel openings in high and low conductance
states. Dotted lines with arrows indicate the starting point of the funnel part
of the channel in high and low conductance states.
Table 2
Conductances of 31BM-porin channel at the low conductance state as
changed by PEG addition
Rough data Access corrected
gctrans (N) gc
cis (N) gc#trans gc#
cis
1 Control 2.72F 0.41 (169) 2.72F 0.41 (169) 3.02 3.02
2 PEG300 1.27F 0.26 (117) 1.19F 0.21 (141) 1.40 1.31
3 PEG400 1.39F 0.10 (108) 1.40F 0.13 (217) 1.55 1.57
4 PEG600 1.66F 0.26 (56) 1.98F 0.43 (231) 1.90 2.33
5 PEG1000 1.93F 0.42 (123) 2.38F 0.47 (143) 2.26 2.91
6 PEG1450 1.96F 0.14 (90) 2.34F 0.31 (143) 2.30 2.85
7 PEG2000 2.38F 0.18 (45) 2.39F 0.33 (97) 2.90 2.92
8 PEG3000 2.33F 0.34 (17) 2.33F 0.37 (78) 2.83 3.16
Conditions are as described in Methods and in the legend to Table 1.
C.M.M. Carneiro et al. / Biochimica et Biophysica Acta 1612 (2003) 144–153150
the volume decrease inferred from analysis of C14 glucose
flux through VDAC at high and low conductance states
(f 16 nm3, calculated with assumption of cylindrical geom-
etry of VDAC lumen from data Kulkarni [5]) and from
effects of osmotic pressure on mitochondrial VDAC closure
(20–40 nm3 [2]).
From these data the model depicted in Fig. 5 emerges as
a geometrical representation of high and low conductance
states of the Porin 31BM channel. In high conductance state
the radius of the cylindrical part is about 1.0 nm and the
length is f 2.5 nm. The smaller radius of the conic portion
is equal to the radius of the cylindrical part. The larger
Fig. 4. The dependence of Fccis (5) and Fc
trans (n) (obtained for VDAC-
channels in low conductance state) on the hydrodynamic radii of PEGs.
More than 30 membranes were used and more than 120 transitions of the
ion channels to low conductance state were registered under each
experimental condition. The cumulative histograms of low conductance
states were built and analyzed as high conductance events. Mean values of
the VDAC-channel conductance in the presence of PEGs on the cis ( gccis) or
trans ( gctrans) side of the membrane were corrected for access conductance
and then used to calculate Fccis and Fc
trans as described in Materials and
methods. The error bars are equal or smaller than the symbols used. Vertical
arrows indicate values of the radii of VDAC-channel at critical points.
Division of Fccis and Fc
trans dependences into segments was made ‘‘by eye’’.
The lowest horizontal segment then was fitted by first-order regression.
Other segments were fitted by zero-order regressions. Horizontal arrows
indicate filling values at critical points of the trans part of VDAC-channel
used to estimate the apparent electrical distances from the openings to the
constriction (for details see text). All other experimental conditions are as
described in the legend to Fig. 1 and in Materials and methods.
radius of the funnel (f 2.0 nm) is observed at the trans
opening of the channel. The length of this portion of the
channel is estimated to be 2.1 nm.
It appears that the channel transition to low conductance
state is accompanied by a small decrease in the radius (from
f 1.0 to f 0.9 nm) and an increase in the length (from
f 2.5 to f 2.9 nm) of the cylindrical part of the channel at
the expense of the trans funnel-like part.
5. Discussion
5.1. Comparison with electron microscopy studies and with
b-barrel structure
Considerable information about VDAC’s structure has
been derived from electron microscopic studies [20,22,23].
Fourier-filtered electron microscopic images suggest that
VDAC could be approximated by a nonideal cylinder
normal to the membrane plane with a height of f 4.6
nm, an outer diameter of about 4.8 nm and an inner diameter
of about 2.8 nm. The improved technique allowed revealing
the somehow asymmetric pore with several irregular fea-
tures in the walls [20,22]. Our finding about asymmetry in
the geometry of VDAC lumen is generally in accord with
these data. In our study VDAC appears to contain two parts:
cylindrical (f 2.5–2.9 nm in length and f 2.0 nm in
diameter) and funnel-like (1.7–2.1 nm in length and f 4
nm in diameter at the pore’s opening tapering to f 2 nm in
diameter further inside the lumen). Comparing our finding
with the 3D image obtained from electron microscopic
C.M.M. Carneiro et al. / Biochimica et Biophysica Acta 1612 (2003) 144–153 151
reconstruction of the channel [20], we can hypothesize that
the cylindrical part appears to correlate with the side (f 3.3
nm in length) of VDAC structure, in which the opening
contains only two small indentations.
The other shorter part of the 3D channel image is more
indented and has to be compared with the funnel like trans
part of the channel seen in nonelectrolyte exclusion method.
The topology in that part of the structure does not appear
conic at the electron microscopy image. However, it was
admitted that this reconstructed topology may represent not
the open state but rather the intermediate one (between fully
open and particularly closed) [22]. Hence, in the fully open
state the topology of that part of the channel may be slightly
different from what the electron microscopy shows. So, for
example, the dents and/or flaps surrounding this part of the
channel could be tilted out for the fully open state of VDAC.
Such change in tilt during a channel transition between state
is not something unusual: it has been demonstrated with the
acetylcholine receptor [24]. Moreover, the presence of the
multiple indentations themselves can already participate in
the increase in apparent diameter seen by nonelectrolyte
exclusion.
As recently shown [25] circular dichroism spectra of
fungal VDAC are similar to those of bacterial porins,
suggesting that VDAC may be a h-barrel, as are the pores
of bacterial outer-membrane channels [26–29]. A more
convincing demonstration of structural likeness between
bacterial and mitochondrial porins is coming from statistical
analysis of protein sequences with a residue motif that
corresponds to transmembrane h-strands [30]. A cylindrical
co-projection of the 3D shape of VDAC with the Ca
backbone of R. capsulatus porin [22] demonstrates a good
explanation for several indentions and flaps, and addition-
ally indicates the similarity in structures of VDAC and
bacterial porins and points out that VDAC may be also
constructed with h-strands of different lengths.Accepting these evidence we could propose that the
cylindrical cis part of VDAC could be formed by a h-barrelas it commonly observed for the relatively short (f 2 nm) h-barrel region of a distinct pore of the trimeric porins [26], or
by two sheets of h-strands separated with weaker organized
protein domains [22]. The small diameter of this part of
VDAC lumen established in this work (f 1.8–2.0 nm)
appears to permit it with less number of h-strands. The
number is dependent on the tilt adopted for h-strands. Forbacterial porins the tilting angles against the membrane
normal vary from about 30j at the membrane facing side
at the barrel to about 60j at the interface of three distinct
channels. Assuming that the h-strands at the cis part of
VDAC have the mean (f 45j) tilt against the channel axis
(what is in accord with Ref. [31]), we can propose that the
narrowest cylindrical cis part of VDAC in high (f 2.0 nm)
and low (f 1.8 nm) conductance states could be constructed
from 9–10 or 8–9 h-strands, respectively. The minimal
lengths of h-strands, which are sufficient to do this, have
to be 3.5–4.1 nm. It is considerably smaller than the length
(6.5 nm) needed to construct the barrel (of 4.6 nm height) to
penetrate the lipid bilayer. To be in accord with suggested
inner geometry of VDAC in high conductance state, one
could reasonably assume that the channel is composed of h-strands with unequal lengths (like the bacterial porin does
Ref. [26]). The channel looks more uniform on the cis side,
where all strands participate in the barrel formation, than on
the trans side where the non-complete barrel could be seen.
Such ‘‘defect’’ could appear as cavities and/or gloves in the
electron microscopy studies and participate in augment of
the channel opening shown by nonelectrolyte exclusion
technique. This part of the channel may consist in part of
h-sheet regions in which strands are tilted more obliquely,
and may also contain non-h regions such as loops and/or a-
helices. So, we suppose that a-helical N terminus, which
localizes on the inner (trans in our study) surface of the outer
mitochondrial membrane [32], participates in the formation
of the funnel-like trans VDAC opening.
To explain the VDAC transition from high to low
conductance state, three main rearrangements in the channel
structure have been earlier suggested [22]: the movement of
external domain(s) (including the N-terminal a-helix) into
the channel lumen surrounded by h-strands, the movement
of some domains from the wall of the h-barrel to the
surface, and the conformational (h!a transition) changes.
Our data suggest that the change in the cylindrical cis h-barrel part of VDAC is small and close to the limit of
resolution of the methodology used. Hence, the cylindrical
cis part of VDAC could be taken practically unaltered or
described in terms of the removal of just one h-strand from
the walls of the channel lumen.
The decrease in the apparent size of the trans conic
portion of the Porin 31BM channel may be determined by
structure rearrangements recently established to occur at
different sites of VDAC [21]. Clearly, the molecular rear-
rangements associated with voltage gating are more com-
plex than the simple movement of contiguous domains of
the protein. Different ‘‘transmembrane parts’’ and extra-
membrane parts of VDAC could be moved at different
extents and to different directions to be in accordance with
the structural changes observed with electron microscopy
[20,33] and in the present study.
5.2. VDAC geometry and conductance
Analyzing the atomic structural models of several ion
channels, it was shown [34], that the experimental conduc-
tance data should be empirically corrected by a factor of 5
(an average) to predict the effective pore dimension. Theo-
retical considerations [35] indicate that the calculated con-
ductances will only correlate with experimentally deter-
mined ones for very large pores (>10 nm in radius). For
narrower channels (as VDAC, for example) the conductance
should depend on the molecular nature of the lumen walls.
Image force [36] can also take part in the determination of
actual channel conductance.
C.M.M. Carneiro et al. / Biochimica et Biophysica Acta 1612 (2003) 144–153152
It is widely accepted that hydrophilic as well as hydro-
phobic molecules are covered by water molecules, forming
the so-called hydration water layer. This layer has different
properties than the bulk water. It is not active osmotically and
is not able to solve ions. The thickness of this layer is around
0.3–0.4 nm. Assuming the presence of this layer of hydration
water at the lumen wall (that decreases the effective pore size
ion transport), the calculation (made on base of geometrical
features established in this study) gives the conductance
values for both states of VDAC (5.3 and 3.1 nS) that are
very close to the experimental ones preliminarily corrected
for access resistors (5.4 and 3.0 nS for high and low
conductance state, respectively). The application of the latter
approach to other weakly selective channels with known
geometry of water lumen (formed by alpha-toxin of Staph-
ylococcus aureus, or by cytolysin of Vibrio cholerae) gave
also an excellent agreement (within 5–10%) between meas-
ured and calculated conductances (unpublished data).
Hence, the obtained results demonstrate a good correla-
tion between geometry and conductance for VDAC as well
as for other weakly selective channels.
5.3. Method limitations
Measurement of a channel’s conductance in the presence
of differently sized linear nonelectrolyte polymers—poly-
mer exclusion method—has been used to estimate channel’s
diameter and to probe asymmetries in its structure [6]. This
method is a variation of a technique developed earlier [8] to
determine the diameter of larger opening of an ion channel.
Although the interpretation of these experiments is based on
several simplifying assumptions [14,17,37], the application
the HOLE program [34] to directly compare the three-
dimensional crystal structure of the cholera toxin B-subunit
pentamer channel [38] and the data obtained with polymer
exclusion method [39] demonstrates the reliability of the
polymer exclusion method.
This approach requires the use of relatively high con-
centrations of nonelectrolytes (15–20%), which demands
special precautions. First of all, polymer-nonelectrolyte
behavior at such concentrations (known as the semi-dilute
regime) gives relatively poor understanding of polymer
physics and one has to utilize mainly empirical approach
to analyze the data. The conditions, where there is no
nonspecific interaction between nonelectrolyte and the
channel wall, have to be chosen. One has to pay attention
to possible interference by impurities in the polymer, to
effects on ionic activity, to the streaming potentials and to
osmotic stress action. Despite these reservations, the
approach appears to be very helpful in defining the geom-
etry of the lumen of the channels (and pores) for which there
is no structural data. So, a variation of the polymer exclu-
sion method [15] was used to deduce the internal geometry
of S. aureus a-hemolysin (aHL) ion channel [9] and the
channel formed by V. cholerae cytolysin [40]. The results
are in good agreement with the crystallographic data for a-
HL [31] and with electron microscopy data for V. cholerae
cytolysin [41]. Recently a new very attractive approach for
obtaining the internal dimensions of transmembrane pore
was suggested [42], combined cysteine mutagenesis and
chemical modification. However, it is currently applicable
only to pores with known crystallographic structure.
5.4. Concluding remarks
Nonelectrolyte exclusion appears as a reliable method in
our study. It allowed us to establish that lumen geometry of
VDAC in high conductance state is indeed asymmetric with
respect to the center of the membrane. The established
asymmetry is virtually independent of the sign of the
applied potential. Cumulative data demonstrate that Porin-
31BM channels are invariably oriented in planar lipid
membranes, and that the internal plasticity of VDAC-chan-
nel that can be seen during voltage induced VDAC tran-
sition to low conductance state (see, for example, Ref. [21])
does not play a role in determination of the lumen asym-
metry at high conductance state.
We also show that the trans side of VDAC channel’s
lumen undergoes the greatest change in size during the
voltage-induced transition to the low conductance state. The
apparent change in channel volume during this transition is
f 10 nm3.
It appears that taking into account the physical size of the
VDAC lumen minus f 0.35 nm of hydration water layer at
the lumen wall gives a possibility to calculate the channel
conductance with a good agreement with measured values.
There is clearly much yet to be learned about the
structural states and gating of VDAC. However, we expect
that although the suggested model for VDAC may be an
oversimplification, it will help to develop a more detailed
and less controversial picture of the structure and gating of
this interesting and important channel.
Acknowledgements
This work was supported by Conselho Nacional de
Desenvolvimento Cientifico e Tecnologico, CNPq, an
agency of the Brazilian Government devoted to funding
science and technology. We thank Dr. John J. Kasianowicz
for helpful comments.
References
[1] J.M. Gulbis, M. Zhou, S. Mann, R. MacKinnon, Structure of the
cytoplasmic h subunit-T1 assembly of voltage-dependent K+ chan-
nels, Science 289 (2000) 123–127.
[2] J. Zimmerberg, V.A. Parsegian, Polymer inaccessible volume changes
during opening and closing of a voltage-dependent ionic channel,
Nature 323 (4) (1986) 36–39.
[3] C. Doring, M. Colombini, Voltage dependence and ion selectivity of
the mitochondrial channel, VDAC, are modified by succinic anhy-
dride, J. Membr. Biol. 83 (1–2) (1985) 81–86.
C.M.M. Carneiro et al. / Biochimica et Biophysica Acta 1612 (2003) 144–153 153
[4] P.N.T. Unwin, P.D. Ennis, Two configurations of a channel-forming
membrane protein, Nature 307 (1984) 609–613.
[5] S.V. Kulkarni, Sizing the closed state of the mitochondrial channel,
VDAC, Thesis, Department of Zoology, University of Maryland,
College Park, Maryland, 1984.
[6] O.V. Krasilnikov, Sizing channel with polymers, in: J.J. Kasianowicz,
M.S.Z. Kellermayer, D.W. Deamer (Eds.), Structure and Dynamics of
Confined Polymers, Kluwer Publishers, Dordrecht, 2001, pp. 73–91.
[7] L. Jurgens, P. Ilsemann, H.D. Kratzin, D. Hesse, K. Eckart, F.P.
Thinnes, N. Hilschmann, Studies of human porin: IV. The primary
structures of ‘‘Porin 31 HM’’ purified from human skeletal muscle
membranes and of ‘‘Porin 31 HL’’ derived from human B lymphocyte
membranes are identical, Biol. Chem. Hoppe-Seyler (Berlin) 372
(1991) 455–463.
[8] R.Z. Sabirov, O.V. Krasilnikov, V.I. Ternovsky, P.G. Merzlyak, Rela-
tion between ionic channel conductance and conductivity of media
containing different non-electrolytes. A novel method of pore size
determination, Gen. Physiol. Biophys. 12 (1993) 95–111.
[9] P.G. Merzlyak, L.N. Yuldasheva, C.G. Rodrigues, C.M.M. Carneiro,
O.V. Krasilnikov, S.M. Bezrukov, Polymeric nonelectrolytes to probe
pore geometry: application to the alpha-Toxin transmembrane chan-
nel, Biophys. J. 77 (1999) 3023–3033.
[10] P. Mueller, D.O. Rudin, H.T. Tien, W.C. Wescott, Methods for the
formation of single bimolecular lipid membranes in aqueous solution,
J. Phys. Chem. 67 (1963) 534–535.
[11] C.M.M. Carneiro, O.V. Krasilnikov, L.N. Yuldasheva, A.C. Campos
de Carvalho, R.A. Nogueira, Is the mammalian porin channel, VDAC,
a perfect cylinder in high conductance state? FEBS Lett. 416 (1997)
187–189.
[12] R. Pfaller, R. Kleene, W. Neupert, Biogenesis of mitochondrial porin:
the import pathway, Experientia 46 (2) (1990) 153–161.
[13] R. Benz, E. Maier, F.P. Thinnes, H. Gotz, N. Hilschmann, Stud-
ies on Human Porin: VII. The channel properties of the human
B-lymphocyte membrane-derived ‘‘Porin 31HL’’ are similar to
those of mitochondrial porins, Biol. Chem. Hoppe-Seyler 373
(1992) 295–303.
[14] S.M. Bezrukov, I. Vodyanoy, Probing alamethicin channels with
water-soluble polymers: effect on conductance of channel states, Bio-
phys. J. 64 (1993) 16–25.
[15] O.V. Krasilnikov, J.B. Da Cruz, L.N. Yuldasheva, R.A. Nogueira, A
novel approach to study the geometry of the water lumen ion channel.
Colicin Ia channels in lipid bilayers, J. Membr. Biol. 161 (1) (1998)
83–92.
[16] J.E. Hall, Access resistance of a small circular pore, J. Gen. Physiol.
66 (1975) 531–532.
[17] S.M. Bezrukov, I. Vodyanoy, R.A. Brutyan, J.J. Kasianowicz, Dy-
namics and free energy of polymers partitioning into a nanoscale pore,
Macromolecules 29 (1996) 8517–8522.
[18] S.M. Bezrukov, J.J. Kasianowicz, The charge state of an ion channel
controls neutral polymer entry into its pore, Eur. Biophys. J. 26 (1997)
471–476.
[19] L. Thomas, E. Blachly-Dyson, M. Colombini, M. Forte, Mapping
of residues forming the voltage sensor of the voltage-dependent
anion-selective channel, Proc. Natl. Acad. Sci. U. S. A. 90 (1993)
5446–5449.
[20] X.W. Guo, P.R. Smith, B. Cognon, D. D’Arcangelis, E. Dolginova,
C.A. Mannella, Molecular design of the voltage-dependent, anion-
selective channel in the mitochondrial outer membrane, J. Struct.
Biol. 114 (1995) 41–59.
[21] J. Song, C. Midson, E. Blachly-Dison, M. Forte, M. Colombini,
The sensor region of VDAC is translocated from within the mem-
brane to the surface during the gating processes, Biophys. J. 74
(1998) 2926–2944.
[22] C.A. Mannella, Conformational changes in the mitochondrial channel
protein, VDAC, and their functional implications, J. Struct. Biol. 121
(1998) 207–218.
[23] X.W. Guo, C.A. Mannella, Conformational change in the mitochon-
drial channel, VDAC, detected by electron cryo-microscopy, Biophys.
J. 64 (1993) 545–549.
[24] N. Unwin, A. Miyazawa, J. Li, Y. Fujiyoshi, Activation of the nic-
otinic acetylcholine receptor involves a switch in conformation of the
alpha subunits, J. Mol. Biol. 319 (5) (2002) 1165–1176.
[25] L. Shao, K.W. Kinnally, C.A. Mannella, Circular dichroism studies of
the mitochondrial channel, VDAC, from Neurospora crassa, Bio-
phys. J. 71 (2) (1996) 778–786.
[26] M.S. Weiss, A. Kreusch, E. Schiltz, U. Nestel, W. Ewelte, J. Weck-
esser, G.E. Schulz, The structure of porin from Rodobacter capsulatus
at 1.8 A resolution, FEBS Lett. 280 (2) (1991) 379–382.
[27] M.S. Weiss, G.E. Schulz, Structure of porin refined at 1.8 A resolu-
tion, J. Mol. Biol. 227 (1992) 493–509.
[28] S.W. Cowan, T. Schirner, G. Rummel, M. Steiert, R. Ghosh, R.A.
Pauptit, J.N. Jansonius, J.P. Rosenbusch, Crystal structures explain
functional properties of two E. coli porins, Nature 358 (1992)
727–733.
[29] T. Schirmer, T.A. Keller, Y.F. Wang, J.P. Rosenbusch, Structural basis
for sugar translocation through maltoporin channels at 3.1 A resolu-
tion, Science 267 (1995) 512–514.
[30] C.A. Mannella, A.F. Neuwald, C.E. Lawrence, Detection of likely
transmembrane h-strand regions in sequences of mitochondrial pore
proteins using the Gibbs Sampler, J. Bioenerg. Biomembr. 18 (2)
(1996) 163–169.
[31] L. Song, M.R. Hobaugh, C. Shustak, S. Cheley, H. Bayley, J.E.
Gouaux, Structure of staphylococcal a-hemolysin, a heptameric trans-
membrane pore, Science 274 (1996) 1859–1866.
[32] S.A. Konstantinova, C.A. Mannella, V.P. Skulachev, D.B. Zorov, Im-
munoelectron microscopic study of the distribution of porin on outer
membranes of rat heart mitochondria, J. Bioenerg. Biomembr. 27
(1995) 93–99.
[33] C.A. Mannella, Structural analysis of mitochondrial pores, Experien-
cia 46 (1990) 137–145.
[34] O.S. Smart, J. Breed, G.R. Smith, M.S.P. Samsom, A novel method
for structure-based prediction of ion channel conductance properties,
Biophys. J. 72 (1997) 1109–1126.
[35] C.A. Pasternak, C.L. Bashford, Y.E. Korchev, T.K. Rostovtseva, A.A.
Lev, Modulation of surface flow by divalent cations and protons,
Colloids Surf. 77 (1993) 119–124.
[36] S.C. Li, M. Hoyles, S. Kuyucak, S.H. Chung, Brownian dynamics
study of ion transport in the vestibule of membrane channels, Bio-
phys. J. 74 (1) (1998) 37–47.
[37] V.I. Ternovsky, G.N. Berestovsky, Effective diameter and structural
organization of reconstituted calcium channels from the Characeae
algae Nitellopsis, Membr. Cell Biol. 12 (1) (1998) 79–88.
[38] R.G. Zhang, D.L. Scott, M.L. Westbrook, S. Nance, B.D. Spangler,
G.G. Shipley, E.M. Westbrook, The three dimensional crystal struc-
ture of cholera toxin, J. Mol. Biol. 251 (1995) 563–573.
[39] O.V. Krasilnikov, J.N. Muratkhodjaev, S.E. Voronov, Y.V. Yezepchuk,
The ionic channels formed by cholera toxin in planar bilayer lipid
membranes are entirely attributable to its B-subunit, Biochim. Bio-
phys. Acta 1067 (1991) 166–170.
[40] L.N. Yuldasheva, P.G. Merzlyak, A.O. Zitzer, C.G. Rodrigues, S.
Bhakdi, O.V. Krasilnikov, Lumen geometry of ion channels formed
by Vibrio cholerae EL Tor cytolysin elucidated by nonelectrolyte
exclusion, Biochim. Biophys. Acta 1512 (2001) 53–63.
[41] A. Zitzer, M. Palmer, U. Weller, T. Wassenaar, C. Biermann, J. Tra-
num-Jensen, S. Bhakdi, Mode of primary binding to target mem-
branes and pore formation induced by Vibrio cholerae cytolysin
(hemolysin), Eur. J. Biochem. 247 (1997) 209–216.
[42] L. Movileanu, S. Cheley, S. Howorka, O. Braha, H. Bayley, Location
of a constriction in the lumen of a transmembrane pore by target
covalent attachment of polymer molecules, J. Gen. Physiol. 117
(2001) 239–251.