PROBABILITY FOR LINGUISTS John GOLDSMITH1 résumé
26
Math. & Sci. hum. / Mathematics and Social Sciences (45 e année, n ◦ 180, 2007(4), p. 73–98) PROBABILITY FOR LINGUISTS John GOLDSMITH 1 résumé – Probabilités pour les linguistes Nous présentons une introduction à la théorie des probabilités pour les linguistes. À partir d’exem- ples choisis dans le domaine de la linguistique, nous avons pris le parti de nous focaliser sur trois points : la différence conceptuelle entre probabilité et fréquence, l’utilité d’une évaluation de type maximum de vraisemblance dans l’évaluation des analyses linguistiques, et la divergence de Kullback-Leibler. mots clés – Bigramme, Entropie, Probabilité, Unigramme summary – This paper offers a gentle introduction to probability for linguists, assuming little or no background beyond what one learns in high school. The most important points that we emphasize are: the conceptual difference between probability and frequency, the use of maximizing probability of an observation by considering different models, and Kullback-Leibler divergence. keywords – Bigram, Entropy, Probability, Unigram 1. INTRODUCTION Probability is playing an increasingly large role in computational linguistics and machine learning, and I expect that it will be of increasing importance as time goes by. 2 This presentation is designed as an introduction, to linguists, of some of the basics of probability. If you’ve had any exposure to probability at all, you’re likely to think of cases like rolling dice. If you roll one die, there’s a 1 in 6 chance—about 0.166—of rolling a “1”, and likewise for the five other normal outcomes of rolling a die. Games of chance, like rolling dice and tossing coins, are important illustrative cases in most introductory presentations of what probability is about. This is only natural; the study of probability arose through the analysis of games of chance, only becoming a bit more respectable when it was used to form the rational basis for the insurance industry. But neither of these applications lends itself to questions of linguistics, and linguists tend to be put off by examples like these, examples which seem to suggest that we take it for granted that the utterance of a word is a bit like the roll of a die—which it’s not, as we perfectly well know. 1 Modèles, Dynamiques, Corpus (MoDyCo), CNRS UMR 7144, Université Paris X Nanterre and the University of Chicago, [email protected] 2 This paper is based on an informal presentation, and I have maintained some of that style in the present write-up, as you will see.
-
Upload
khangminh22 -
Category
Documents
-
view
1 -
download
0
Transcript of PROBABILITY FOR LINGUISTS John GOLDSMITH1 résumé

Math. & Sci. hum. / Mathematics and Social Sciences (45e année, n◦ 180, 2007(4), p. 73–98)
PROBABILITY FOR LINGUISTS
John GOLDSMITH1
résumé – Probabilités pour les linguistesNous présentons une introduction à la théorie des probabilités pour les linguistes. À partir d’exem-ples choisis dans le domaine de la linguistique, nous avons pris le parti de nous focaliser surtrois points : la différence conceptuelle entre probabilité et fréquence, l’utilité d’une évaluation detype maximum de vraisemblance dans l’évaluation des analyses linguistiques, et la divergence deKullback-Leibler.
mots clés – Bigramme, Entropie, Probabilité, Unigramme
summary – This paper offers a gentle introduction to probability for linguists, assuminglittle or no background beyond what one learns in high school. The most important points that weemphasize are: the conceptual difference between probability and frequency, the use of maximizingprobability of an observation by considering different models, and Kullback-Leibler divergence.
keywords – Bigram, Entropy, Probability, Unigram
1. INTRODUCTION
Probability is playing an increasingly large role in computational linguistics andmachine learning, and I expect that it will be of increasing importance as time goesby.2 This presentation is designed as an introduction, to linguists, of some of thebasics of probability. If you’ve had any exposure to probability at all, you’re likelyto think of cases like rolling dice. If you roll one die, there’s a 1 in 6 chance—about0.166—of rolling a “1”, and likewise for the five other normal outcomes of rolling adie. Games of chance, like rolling dice and tossing coins, are important illustrativecases in most introductory presentations of what probability is about. This is onlynatural; the study of probability arose through the analysis of games of chance, onlybecoming a bit more respectable when it was used to form the rational basis forthe insurance industry. But neither of these applications lends itself to questions oflinguistics, and linguists tend to be put off by examples like these, examples whichseem to suggest that we take it for granted that the utterance of a word is a bit likethe roll of a die—which it’s not, as we perfectly well know.
1Modèles, Dynamiques, Corpus (MoDyCo), CNRS UMR 7144, Université Paris X Nanterre andthe University of Chicago, [email protected]
2This paper is based on an informal presentation, and I have maintained some of that style inthe present write-up, as you will see.

74 j. goldsmith
The fact is, there are several quite different ways to think about probabilisticmodels and their significance. From a historical point of view, the perspective thatderives from analyzing games of chance is the oldest. It assumes that there is astochastic element in the system that we are interested in modeling. In some cases,linguists adopt such a point of view; variable rules may be best viewed in such alight.
The second way that probability enters into scientific models—second, in achronological sense (starting in the late 18th century)—is when we acknowledgethat there is noise in the data, and we want to give a quantitative account of whatthe relationship is between the actual observations and the parameters that we inferfrom it. This is probability the most familiar view of probability for anyone whohas used probability and statistics in the context of the social sciences.
The third way is only as old as the 20th century, and it will lie behind what wedo here. It is closely tied to information theory, and is linked to two notions—twonotions whose relationship is not at all obvious. First of all, we use probability theoryin order to talk in an explicit and quantitative way about the degree of certainty, oruncertainty, that we possess about a question. Putting it slightly differently, if wewanted to develop a theory of how certain a perfectly rational person could be of aconclusion in the light of specific data, we’d end up with something very much likeprobability theory. Second of all—though we will not explicitly discuss this in thepresent paper—probability can be associated with the computational complexity ofan analysis. Let’s focus on the first of these two.
Many of the linguistic examples we consider will be along the lines of what aspeech recognition system must deal with, which is to say, the task of deciding (orguessing) what word has just been uttered, given knowledge of what the precedingstring of words has been coming out of the speaker’s mouth. Would you be willingto consider the following suggestions?
Let us suppose that we have established that the person is speaking English. Canwe draw any conclusions independent of the sounds that the person is uttering atthis moment? Surely we can. We can make an estimate of the probability that theword is in our desk-top Webster’s Dictionary, and we can make an estimate of theprobability that the word is the, and an estimate of the probability that the wordis—let’s choose another word—telephone. We can be quite certain, in fact, thatthe is the most likely word to be produced by an English speaker; as much as fivepercent of a speaker’s words may be thes. As this rather stark example suggests, theapproach we will take to linguistic analysis will not emphasize the difference betweena speaker’s knowledge and that application to the real world of speech. Needless tosay, that is a classic distinction in linguistics, from the time of de Saussure downto our own day, by way of Chomsky, but it is one that will not play a role in whatwe do here. Put another way, we are looking for the structure of language as it isspoken, and if that is different from the structure of language as it is known, thenso be it. At least the outline of what we will be doing is clear.3
3If you are interested in seeing a discussion of the some of the general issues that emerge fromthis point of view, you are welcome to take a look at [Goldsmith, 2007].

probability for linguists 75
2. SOME BASICS
Let’s take a look at—or review—some of the very basics of probability.
We’re going to try to look at language from the roll-of-the-die point of view fora little while. It’s not great, but it might just be the best way to start.
The very first notion to be familiar with is that of a distribution: a set of (non-negative) numbers that add up to 1.0. In every discussion of probability, distribu-tions play a central role, and one must always ask oneself what is being treated asforming a distribution. Probabilities are always members of a distribution.
Let’s consider the roll of a die. There are six results of such a roll, and we typicallyassume that their probabilities must be equal; it follows that their probabilities mustbe 1/6, since they add up to 1.0: they form a distribution. We call a distributionin which all values are the same a uniform distribution. We always assume thatthere is a universe of basic outcomes, and each outcome has associated with it aprobability. The universe of basic outcomes is normally called the sample space.The sum of the probabilities of all of the outcomes is 1.0. Any set of the outcomeshas a probability, which is the sum of the probabilities of the members of the subset.Thus the probability of rolling an even number is 0.5.
In this simplest case, we took the universe of outcomes to consist of 6 members,the numbers 1 through 6. But this is not necessary. We can take the universe ofoutcomes to be all possible outcomes of two successive rolls of a die. The universethen has 36 members, and the outcome “The first roll is a 1” is not a single member ofthe universe of outcomes, but rather it is a subset consisting of 6 different members,each with a probability of 1/36. These six are:
• The first roll is 1 and the second is 1;
• The first roll is 1 and the second is 2;
• The first roll is 1 and the second is 3;
• The first roll is 1 and the second is 4;
• The first roll is 1 and the second is 5;
• The first roll is 1 and the second is 6.
The probability of each of these 6 is 136
, and they add up to 16.
It is not hard to see that if a universe consists of N rolls of a die (N can be anypositive number), the number of outcomes in that universe will be 6N . (And theprobability of any particular sequence is
(16
)N , if the distribution is uniform).
Be clear on the fact that whenever we pose a question about probability, wehave to specify precisely what the universe of outcomes (i.e., the sample space) isthat we’re considering. It matters whether we are talking about the universe of allpossible sequences of 6 rolls of a die, or all possible sequences of 6 or fewer rolls ofa die, for example. You should convince yourself that the latter universe is quitea bit bigger, and hence the probability of any die-roll that is 6 rolls long will have
76 j. goldsmith
a lower probability in that larger universe than it does in the universe consistingonly of 6 rolls of a die. We will shortly change our perspective from rolling dice touttering (or emitting) words, and it will be important to bear in mind the differencein the probability of a 5-word sequence, for example, depending on whether we areconsider the universe of all 5-word sequences, or the universe of all word sequencesof length 5 or less.
We have just completed our introduction to the most important ideas regardingprobabilistic models. Never lose sight of this: we will be constructing a model of aset of data and we will assign a distribution to the basic events of that universe. Wewill almost certainly assign that distribution via some simpler distributions assignedto a simpler universe. For example, the complex universe may be the universe of allways of rolling a die 6 or fewer times, and the simpler universe will be single rollsof a fair, six-sided die. From the simple, uniform distribution on single rolls of a diewe will build up a distribution on a more complex universe.
A word on notation, or a bit more than notation: It should always be possibleto write an equation summing probabilities over the distribution so they add up to1.0:
∑i
pi = 1.0. You should be able to write this for any problem that you tackle.
We can imagine the universe to consist of a sequence of rolls of a die anywhere inlength from 1 roll to (let us say) 100. The counting is a little more complicated, butit’s not all that different. And each one of them is equally likely (and not very likely,as you can convince yourself). As we look at sample spaces with more and moremembers, the probabilities of each member will tend to get smaller and smaller.When we look at real linguistic examples, the probabilities that we calculate willbe very small, so small that we will have to use scientific notation. This does notmean that something is going wrong! Quite the contrary: when a model assigns alot of small probabilities, that is our quantitative way of saying that there are a lotof possibilities out there, and since we know that the number of things that we cansay in a language is large—and really, infinite—it should not be at all surprisingthat the probabilities we assign to any particular utterance will be quite small.
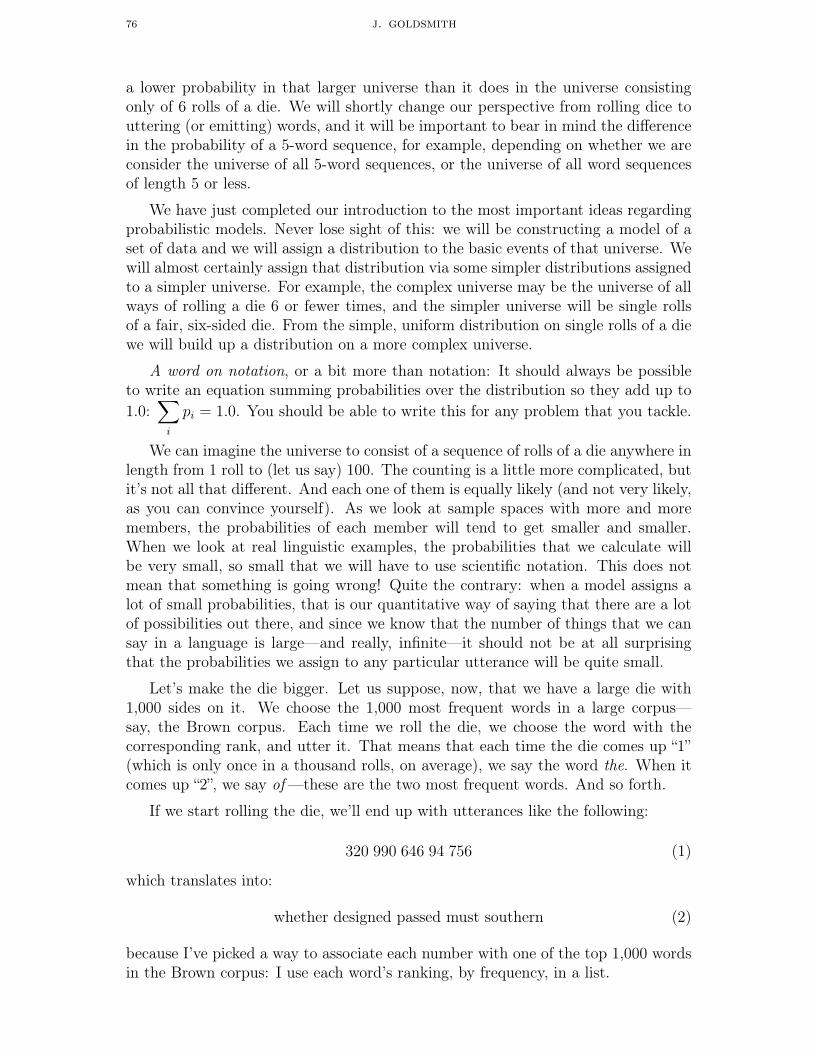
Let’s make the die bigger. Let us suppose, now, that we have a large die with1,000 sides on it. We choose the 1,000 most frequent words in a large corpus—say, the Brown corpus. Each time we roll the die, we choose the word with thecorresponding rank, and utter it. That means that each time the die comes up “1”(which is only once in a thousand rolls, on average), we say the word the. When itcomes up “2”, we say of —these are the two most frequent words. And so forth.
If we start rolling the die, we’ll end up with utterances like the following:
320 990 646 94 756 (1)
which translates into:
whether designed passed must southern (2)
because I’ve picked a way to associate each number with one of the top 1,000 wordsin the Brown corpus: I use each word’s ranking, by frequency, in a list.

probability for linguists 77
That’s what this worst of random word generators would generate. But that’s notwhat we’re thinking about grammars probabilistically for—not at all. Rather, whatwe’re interested in is the probability that this model would assign to a particularsentence that somebody has already uttered. Let’s use, as our example, the sentence:In the beginning was the word. There are six words in this sentence, and it just sohappens that all six are among the 1,000 most common words in the Brown corpus.So the probability that we might assign to this sentence—if we assume a uniformdistribution over these 1,000 words, which means, if we assign a probability equalto 0.001 to each word— is 1
1000× 1
1000× 1
1000× 1
1000× 1
1000× 1
1000, which can also be
expressed more readably as 10−18. There are 1,000 = 103 events in the universe ofstrings of one word in length, and 1, 000, 000 = 106 events in the universe of stringsof 2 words in length, and 1018 events in the universe of strings of 6 words. That iswhy each such event has a probability of the reciprocal of that number. (If thereare K events which are equally likely, then each has the probability 1/K.)
I hope it is already clear that this model would assign that probability to anysequence of six words (if the words are among the lexicon that we possess). Is thisgood or bad? It’s neither the one nor the other. We might say that this is a terriblegrammar of English, but such a judgment might be premature. This method willassign a zero probability to any sequence of words in which at least one word doesnot appear in the top 1000 words of the Brown corpus. That may sound bad, too,but do notice that it means that such a grammar will assign a zero probability to anysentence in a language that is not English. And it will assign a non-zero probabilityto any word-sequence made up entirely of words from the top 1,000 words.
We could redo this case and include a non-zero probability for all of the 47,885distinct words in the Brown Corpus. Then any string of words all of which appear
in the corpus will be assigned a probability of(
147,885
)N
, where N is the number ofwords in the string, assuming a sample space consisting of sentences all of lengthN. A sentence of 6 words would be assigned a probability of (1/47, 885)6, which justso happens to be about (2.08× 10⁻⁵)6, or 8.3× 10⁻²⁹. We’ll get back to that (verysmall) number in a few paragraphs.
Or—we could do better than that (and the whole point of this discussion is sothat I can explain in just a moment exactly what “doing better” really means inthis context). We could assign to each word in the corpus a probability equal toits frequency in the corpus. The word the, for example, appears 69,903 out of thetotal 1,159,267 words, so its probability will be approximately .0603—and otherwords have a much lower probability. Leaders occurs 107 times, and thus would beassigned the probability 107
1,159,267= .000 092 (it is the 1,000th most frequent word).
Is it clear that the sum of the probabilities assigned to all of the words adds up to1.00? It should be.
Pause for important notation. We will use the notation CountC(a) to mean thenumber of times the symbol a occurs in the corpus C, and when we want to use lessspace on the page, we will use the bracket notation [x]C to mean exactly the samething. When it is perfectly clear which corpus we are talking about, we may leaveout the C and write Count(a) or [x].

78 j. goldsmith
word count frequency word count frequency1 the 69903 0.068271 11 for 9472 0.0092512 of 36341 0.035493 12 it 9082 0.0088703 and 28772 0.028100 13 with 7277 0.0071074 to 26113 0.025503 14 as 7244 0.0070755 a 23309 0.022765 15 his 6992 0.0068296 in 21304 0.020807 16 on 6732 0.0065757 that 10780 0.010528 17 be 6368 0.0062198 is 10100 0.009864 18 s 5958 0.0058199 was 9814 0.009585 19 I 5909 0.00577110 he 9799 0.009570 20 at 5368 0.005243
Table 1. Top of the unigram distribution for the Brown Corpus.
This is very important, and most of what we do from now on will assume com-plete familiarity with what we have just done, which is this: we have a universe ofoutcomes, which are our words, discovered empirically (we just took the words thatwe encountered in the corpus), and we have assigned a probability to them which isexactly the frequency with which we encountered them in the corpus. We will callthis a unigram model (or a unigram word model, to distinguish it from the paral-lel case where we treat letters or phonemes as the basic units). The probabilitiesassigned to each of the words adds up to 1.0.
(Note that “s” is the possessive s, being treated as a distinct word).
Now let’s ask what the probability is of the sentence “the woman arrived.” Tofind the answer, we must, first of all, specify that we are asking this question inthe context of sentence composed of 3 words—that is, sentence of length 3. Second,in light of the previous paragraph, we need to find the probability of each of thosewords in the Brown Corpus. The probability of the is 0.068 271; pr(woman) = 0.00023; pr(arrived) = .000 06. These numbers represent their probabilities where theuniverse in question is a universe of single words being chosen from the universe ofpossibilities—their probabilities in a unigram word model. What we are interestedin now is the universe of 3-word sentences. (By the way, I am using the word“sentence” to mean “sequence of words”—use of that term doesn’t imply a claimabout grammaticality or acceptability.) We need to be able to talk about sentenceswhose first word is the, or whose second word is woman; let’s use the followingnotation. We’ll indicate the word number in square brackets, so if S is the sentencethe woman arrived, then S[1] = “the”, S[2] = “woman” and S[3] = arrived. Wemay also want to refer to words in a more abstract way—to speak of the ith word,for example. If we want to say the first word of sentence S is the ith word of thevocabulary, we’ll write S[1] = wi.
We need to assign a probability to each and every sequence (i.e., sentence) ofthree words from the Brown Corpus in such a fashion that these probabilities addup to 1.0. The natural way to do that is to say that the probability of a sentence is

probability for linguists 79
the product of the probabilities: if S = “the woman arrived” then
pr(S) = pr(S[1] = the)× pr(S[2] = woman)× pr(S[3] = arrived) (3)
and we do as I suggested, which is to suppose that the probability of a word isindependent of what position it is in. We would state that formally:
For all sentences S, all words w and all positions i and j:
pr(S[i] = wn) = pr(S[j] = wn). (4)
A model with that assumption is said to be a stationary model. Be sure you knowwhat this means. For a linguistic model, it does not seem terribly unreasonable, butit isn’t just a logical truth. In fact, upon reflection, you will surely be able toconvince yourself that the probability of the first word of a sentence being the isvastly greater than the probability of the last word in the sentence being the. Thusa stationary model is not the last word (so to speak) in models. It is very convenientto make the assumption that the model is stationary, but it ain’t necessarily so.
Sometimes we may be a bit sloppy, and instead of writing “pr(S[i] = wn)” (whichin English would be “the probability that the ith word of the sentence is word numbern”) we may write “pr(S[i])”, which in English would be “the probability of the ith
word of the sentence”. You should be clear that it’s the first way of speaking whichis proper, but the second way is so readable that people often do write that way.
You should convince yourself that with these assumptions, the probabilities ofall 3-word sentences does indeed add up to 1.0.
exercise 1. Show mathematically that this is correct.As I just said, the natural way to assign probabilities to the sentences in our universeis as in (1); we’ll make the assumption that the probability of a given word isstationary, and furthermore that it is its empirical frequency (i.e., the frequency weobserved) in the Brown Corpus. So the probability of the woman arrived is 0.068271 × 0.000 23 × .00006 = 0.000 000 000 942 139 8, or about 9.42× 10⁻¹⁰.
What about the probability of the sentence in the beginning was the word? Wecalculated it above to be 10−18 in the universe consisting of all sentences of length6 (exactly) where the words were just the 1,000 most frequency words in the BrownCorpus, with uniform distribution. And the probability was 8.6 × 10⁻²⁹ when weconsidered the universe of all possible sentences of six words in length, where thesize of the vocabulary was the whole vocabulary of the Brown Corpus, again withuniform distribution. But we have a new model for that universe, which is to say, weare considering a different distribution of probability mass. In the new model, theprobability of the sentence is the product of the empirical frequencies of the wordsin the Brown Corpus, so the probability of in the beginning was the word in ournew model is:
.021× .068× .00016× .0096× .021× .00027
= 2.1× 10−2 × 6.8× 10−2 × 1.6× 10−4 × 9.6× 10−3 × 2.1× 10−2 × 2.7× 10−4
= 1243× 10−17 = 1.243× 10⁻¹⁴.

80 j. goldsmith
That’s a much larger number than we got with other distributions (remember,the exponent here is -14, so this number is greater than one which has a morenegative exponent.)
The main point for the reader now is to be clear on what the significance of thesetwo numbers is: 10−18 for the first model, 8.6 × 10⁻²⁹ for the second model, and1.243 × 10−14 for the third. But it’s the same sentence, you may say—so why thedifferent probabilities? The difference is that a higher probability (a bigger number,with a smaller negative exponent, putting it crudely) is assigned to the sentencethat we know is an English sentence in the frequency-based model. If this resultholds up over a range of real English sentences, this tells us that the frequency-basedmodel is a better model of English than the model in which all words have the samefrequency (a uniform distribution). That speaks well for the frequency-based model.In short, we prefer a model that scores better (by assigning a higher probability) tosentences that actually and already exist—we prefer that model to any other modelthat assigns a lower probability to the actual corpus.
In order for a model to assign higher probability to actual and existing sentences,it must assign less probability to other sentences (since the total amount of prob-ability mass that it has at its disposal to assign totals up to 1.000, and no more).So of course it assigns lower probability to a lot of unobserved strings. On thefrequency-based model, a string of word-salad like civilized streams riverside promptshaken squarely will have a probability even lower than it does in the uniform distri-bution model. Since each of these words has probability 1.07×10⁻⁵ (I picked themthat way –), the probability of the sentence is (1.07 × 10⁻⁵)6 = 1.4 × 10⁻³⁰.That’sthe probability based on using empirical frequencies. Remember that a few para-graphs above we calculated the probability of any six-word sentence in the uniform-distribution model as 8.6×10⁻²⁹; so we’ve just seen that the frequency-based modelgives an even smaller probability to this word-salad sentence than did the uniformdistribution model—which is a good thing.
You are probably aware that so far, our model treats word order as irrelevant—itassigns the same probability to beginning was the the in word as it does to in thebeginning was the word. We’ll get to this point eventually.
3. PROBABILITY MASS
It is sometimes helpful to think of a distribution as a way of sharing an abstract goocalled probability mass around all of the members of the universe of basic outcomes(that is, the sample space). Think of there being 1 kilogram of goo, and it is cut upand assigned to the various members of the universe. None can have more than 1.0kg, and none can have a negative amount, and the total amount must add up to 1.0kg. And we can modify the model by moving probability mass from one outcometo another if we so choose.
I have been avoiding an important point up till now, because every time wecomputed the probability of a sentence, we computed it against a background (thatis, in a sample space of) other sentences of the same length, and in that context, itwas reasonable to consider a model in which the probability of the string was equal

probability for linguists 81
to the product of the probabilities of its individual words. But the probability massassigned by this procedure to all words of length 1 is 1.0; lilkewise, to all words oflength 2 is 1.0; and so on, so that the total probability assigned to all words up tolength N is N—which isn’t good, because we never have more than 1.0 of probabilitymass to assign altogether, so we have given out more than we have to give out.
What we normally do in a situation like this—when we want to consider stringsof variable length—is to first decide how much probability mass should be assignedto the sum total of strings of length n—let’s call that λ(n) for the moment, butwe’ll be more explicit shortly—and then we calculate the probability of a word onthe unigram model by divide the product of the probabilities of its letters by λ(n).We can construct the function in any way we choose, so long as the sum of the
λ’s equals 1:∞∑
n=1
λ(n) = 1. The simplest way to do this is to define λ(n) to be
(1− a)n−1
a, where a is a positive number less than 1 (in fact, you should think of
a as the probability of a white space). This decision makes the probability of all ofthe words of length 1 be 1
a, and then ratio of the total probability of words whose
length is k + 1 to the total probability of words whose length is k is always 11−a
.This distribution over length overestimates the density of short words, and we cando better—but for now, you need simple bear in mind that we have to assume somedistribution over length for our probabilities to be sensible.
An alternative way of putting this is to establish a special symbol in our alphabet,such as # or even the simple period ‘.’ and set conditions on where it can appearin a sentence: it may never appear in any position but the last position, and itmay never appear in first position (which would also be the last position, if it wereallowed, of course). Then we do not have to establish a special distribution forsentence length; it is in effect taken care of by the special sentence-final symbol.
4. CONDITIONAL PROBABILITY
I stressed before that we must start an analysis with some understanding as towhat the universe of outcomes is that we are assuming. That universe forms thebackground, the given, of the discussion. Sometimes we want to shift the universe ofdiscussion to a more restricted sub-universe—his is always a case of having additionalinformation, or at least of acting as if we had additional information. This is theidea that lies behind the term conditional probability. We look at our universe ofoutcomes, with its probability mass spread out over the set of outcomes, and wesay, let us consider only a sub-universe, and ignore all possibilities outside of thatsub-universe. We then must ask: how do we have to change the probabilities insidethat sub-universe so as to ensure that the probabilities inside it add up to 1.0 (tomake it a distribution)? Some thought will convince you that what must be doneis to divide the probability of each event by the total amount of probability massinside the sub-universe.
There are several ways in which the new information which we use for our con-ditional probabilities may come to us. If we are drawing cards, we may somehow

82 j. goldsmith
get new but incomplete information about the card—we might learn that the cardwas red, for example. In a linguistic case, we might have to guess a word, and thenwe might learn that the word was a noun. A more usual linguistic case is that wehave to guess a word when we know what the preceding word was. But it should beclear that all three examples can be treated as similar cases: we have to guess anoutcome, but we have some case-particular information that should help us comeup with a better answer (or guess).
Let’s take another classic probability case. Let the universe of outcomes be the52 cards of a standard playing card deck. The probability of drawing any particularcard is 1/52 (that’s a uniform distribution). What if we restrict our attention to redcards? It might be the case, for example, that of the card drawn, we know it is red,and that’s all we know about it; what is the probability now that it is the Queen ofHearts?
The sub-universe consisting of the red cards has probability mass 0.5, and theQueen of Hearts lies within that sub-universe. So if we restrict our attention tothe 26 outcomes that comprise the “red card sub-universe,” we see that the sumtotal of the probability mass is only 0.5 (the sum of 26 red cards, each with 1/52probability). In order to consider the sub-universe as having a distribution on it, wemust divide each of the 1/52 in it by 0.5, the total probability of the sub-universe inthe larger, complete universe. Hence the probability of the Queen of Hearts, giventhe Red Card sub-Universe (given means with the knowledge that the event thatoccurs is in that sub-universe), is 1/52 divided by 1/2, or 1/26.
This is traditionally written: p(A|B) = probability of A, given B = pr(A & B)pr(B)
5. GUESSING A WORD, GIVEN KNOWLEDGE OF THE PREVIOUS WORD
Let’s assume that we have established a probability distribution, the unigram dis-tribution, which gives us the best estimate for the probability of a randomly chosenword. We have done that by actually measuring the frequency of each word in somecorpus. We would like to have a better, more accurate distribution for estimatingthe probability of a word, conditioned by knowledge of what the preceding wordwas. There will be as many such distributions as there are words in the corpus(one less, if the last word in the corpus only occurs there and nowhere else.) Thisdistribution will consist of these probabilities:
pr(S[i] = wj given that S[i− 1] = wk), (5)
which is usually written in this way:
pr(S[i] = wj|S[i− 1] = wk) (6)
The probability of the in an English corpus is very high, but not if the precedingword is the—or if the preceding word is a, his, or lots of other words.
I hope it is reasonably clear to you that so far, (almost) nothing about lan-guage or about English in particular has crept in. The fact that we have consideredconditioning our probabilities of a word based on what word preceded is entirely

probability for linguists 83
word count count / 69,936 word count count / 69,9360 first 664 0.009491 same 629 0.00899 11 way 239 0.003422 other 419 0.00599 12 old 234 0.003353 most 419 0.00599 13 last 223 0.003194 new 398 0.00569 14 house 216 0.003095 world 393 0.00562 15 man 214 0.003066 united 385 0.00551 16 next 210 0.003007 state 271 0.00418 17 end 206 0.002958 two 267 0.00382 18 fact 194 0.002779 only 260 0.00372 19 whole 190 0.0027210 time 250 0.00357 20 American 184 0.00263
Table 2. Top of the Brown Corpus for words following the.
word count count / 36,388 word count count / 36,3881 the 9724 0.267 11 her 252 0.006932 a 1473 0.0405 12 our 251 0.006903 his 810 0.0223 13 its 229 0.006294 this 553 0.01520 14 it 205 0.005635 their 342 0.00940 15 that 156 0.004296 course 324 0.00890 16 such 140 0.003857 these 306 0.00841 17 those 135 0.003718 them 292 0.00802 18 my 128 0.003529 an 276 0.00758 19 which 124 0.0034110 all 256 0.00704 20 new 118 0.00324
Table 3. Top of the Brown Corpus for words following of.
arbitrary; as we see in Table 4, we could just as well look at the conditional proba-bility of words conditioned on what word follows, or even conditioned on what theword was two words to the left. In Table 5, we look at the distribution of wordsthat appear two words to the right of the. As you see, I treat punctuation (comma,period) as separate words. Before continuing with the text below these tables, lookcarefully at the results given, and see if they are what you might have expected ifyou had tried to predict the result ahead of time.
What do we see? Look at Table 2, words following the. One of the most strik-ing things is how few nouns, and how many adjectives, there are among the mostfrequent words here—that’s probably not what you would have guessed. None ofthem are very high in frequency; none place as high as 1 percent of the total. InTable 3, however, the words after of, one word is over 25%: the. So not all wordsare equally helpful in helping to guess what the next word is. In Table 4, we seewords preceding the, and we notice that other than punctuation, most of these areprepositions. Finally, in Table 5, we see that if you know a word is the, then theprobability that the word-after-next is of is greater than 15%—which is quite a bit.

84 j. goldsmith
word count count / 69,936 word count count / 69,9361 of 9724 0.139 11 from 1415 0.02022 . 6201 0.0887 12 that 1397 0.01993 in 6027 0.0862 13 by 1349 0.01934 , 3836 0.0548 14 is 799 0.01145 to 3485 0.0498 15 as 766 0.01096 on 2469 0.0353 16 into 675 0.009657 and 2254 0.0322 17 was 533 0.007628 for 1850 0.0264 18 all 430 0.006159 at 1657 0.0237 19 when 418 0.0059710 with 1536 0.0219 20 but 389 0.00556
Table 4. Top of the Brown Corpus for words preceding the.
word count count / 69,936 word count count / 69,9361 of 10861 0.155 11 for 598 0.008552 . 4578 0.0655 12 were 386 0.005523 , 4437 0.0634 13 with 370 0.005294 and 2473 0.0354 14 on 368 0.005265 to 1188 0.0170 15 states 366 0.005236 ’ 1106 0.0158 16 had 340 0.004867 in 1082 0.0155 17 are 330 0.004728 is 1049 0.0150 18 as 299 0.004289 was 950 0.0136 19 at 287 0.0041010 that 888 0.0127 20 or 284 0.00406
Table 5. Top of the Brown Corpus for words 2 to the right of the.
exercise 2. What do you think the probability distribution is for the 10th wordafter the? What are the two most likely words? Why?
Conditions can come from other directions, too. For example, consider the rela-tionships of English letters to the phonemes they represent. We can ask what theprobability of a given phoneme is—not conditioned by anything else—or we can askwhat the probability of a phoneme is, given that it is related to a specific letter.
6. MORE CONDITIONAL PROBABILITY: BAYES’ RULE
Let us summarize. How do we calculate what the probability is that the nth wordof a sentence is the if the n− 1st word is of ? We count the number of occurrencesof the that follow of, and divide by the total number of of s.
Total number of of : 36,341Total number of of the: 9,724
In short,
pr(S[i] = the |S[i− 1] = of) =9724
36341= 0.267 (7)

probability for linguists 85
What is the probability that the nth word is of, if the n + 1st word is the? Wecount the number of occurrences of of the, and divide by the total number of the:that is,
pr(S[i] = of |S[i + 1] = the) =9, 724
69, 903= 0.139 (8)
This illustrates the relationship between pr(A|B) “the probability of A given B”and pr(B|A) “the probability of B given A”. This relationship is known as Bayes’Rule. In the case we are looking at, we want to know the relationship between theprobability of a word being the, given that the preceding word was of —and theprobability that a word is of, given that the next word is the.
pr(S[i] = of |S[i + 1] = the) =pr(S[i] = of & S[i + 1] = the)
pr(S[i + 1] = the)(9)
and also, by the same definition:
pr(S[i] = the |S[i− 1] = of) =pr(S[i] = of & S[i + 1] = the)
pr(S[i− 1] = of)(10)
Both of the preceding two lines contain the phrase:
pr(S[i] = of & S[i + 1] = the).
Let’s solve both equations for that quantity, and then equate the two remainingsides.
pr(S[i] = of |S[i + 1] = the)× pr(S[i + 1] = the) = pr(S[i] = of & S[i + 1] = the)
pr(S[i] = the |S[i− 1] = of)× pr(S[i−] = of) = pr(S[i] = of & S[i + 1] = the)
Therefore:
pr(S[i] = of |S[i + 1] = the)× p(S[i + 1] = the) (11)= pr(S[i] = the |S[i− 1] = of)× pr(S[i− 1] = of)
And we will divide by “pr(S[i + 1] = the )”, giving us:
pr(S[i] = of |S[i + 1] = the) =pr(S[i] = the|S[i− 1] = of)× p(S[i− 1] = of)
pr(S[i + 1] = the)(12)
The general form of Bayes’ Rule is: pr(A|B) = pr(B|A)pr(A)pr(B)

86 j. goldsmith
7. THE JOY OF LOGARITHMS
It is, finally, time to get to logarithms—I heave a sigh of relief. Things are muchsimpler when we can use logs. Let’s see why.
In everything linguistic that we have looked at, when we need to compute theprobability of a string of words (or letters, etc.), we have to multiply a string ofnumbers, and each of the numbers is quite small, so the product gets extremelysmall very fast. In order to avoid such small numbers (which are hard to deal within a computer), we will stop talking about probabilities, much of the time, and talkinstead about the logarithms of the probabilities—or rather, since the logarithm of aprobability is always a negative number and most human beings prefer to deal withpositive numbers, we will talk about -1 times the log of the probability, since that isa positive number. Let’s call that the positive log probability, or plog for short. Ifthe probability is p, then we’ll write the positive log probability as p. This quantityis also sometimes called the inverse log probability.
notation. If p is a number greater than zero, but less than or equal to 1:p = − log p. If E is an event, then E = − log pr(E).
As a probability gets very small, its positive log probability gets larger, but ata much, much slower rate, because when you multiply probabilities, you just addpositive log probabilities. That is,
log( pr(S[1])× pr(S[2])× pr(S[3])× pr(S[4]) ) (13)
= −1× (S[1] + S[2] + S[3] + S[4]) (14)
And then it becomes possible for us to do such natural things as inquiring aboutthe average log probability—but we’ll get to that.
At first, we will care about the logarithm function for values in between 0 and1. It’s important to be comfortable with notation, so that you see easily that thepreceding equation can be written as follows, where the left side uses the capital pito indicate products, and the right side uses a capital sigma to indicate sums:
log
[4∏
i=1
pr( S[i] )
]=
4∑i=1
log pr( S[i] ) (15)
We will usually be using base 2 logarithms. You recall that the log of a numberx is the power to which you have to raise the base to get the number x. If our logsare all base 2, then the log of 2 is 1, since you have to raise 2 to the power 1 to get2, and log of 8 is 3, since you have to raise 2 to the 3rd power in order to get 8 (youremember that 2 cubed is 8). So for almost the same reason, the log of 1/8 is -3,and the positive log of 1/8 is therefore 3.
If we had been using base 10 logs, the logs we’d get would be smaller by a factorof about 3. The base 2 log of 1,000 is almost 10 (remember that 2 to the 10th power,or 210, is 1,024), while the base 10 log of 1,000 is exactly 3.
It almost never makes a difference what base log we use, actually, until we getto information theory. But we will stick to base 2 logs anyway.

probability for linguists 87
exercise 3. Express Bayes’ Rule in relation to log probabilities.Interesting digression. There is natural relationship between the real numbers R(both positive, negative, and 0) along with the operation of addition, on the onehand, and the positive real numbers R along with operation of multiplication:
Reals Rexp
��
OO
log
ks +3 operation : addition
exp
��
OO
log
Positive reals R+ ks +3 operation : multiplication
And it is the operations of taking logarithms (to a certain base, like 2) and raisingthat base to a certain power (that is called exponentiation, abbreviated exp here)which take one back and forth between these two systems.
We call certain combinations of a set and an operation groups, if they satisfythree basic conditions: there is an identity operator, each element of the set has aninverse, and the operation is associative. Zero has the special property with respectto addition of being the identity element, because one can add zero and the resultis unchanged; 1 has the same special property (of being the identity element) withrespect to multiplication. Each real number r in R has an additive inverse (a numberwhich you can add to r and get 0 as the result); likewise, each positive real r in R+
has a multiplicative inverse, a number which you can multiply by r and get 1 as theresult. The exp and log mappings also preserve inverses and identities.
So there’s this natural relationship between two groups, and the natural relation-ship maps the identity element in the one group to the identity element in the other—and the relationship preserves the operations. This “natural relationship” maps anyelement x in the “Positive reals + multiplication” group to log x in the “reals + ad-dition” group, and its inverse operation, mapping from the multiplication group tothe addition group is the exponential operation, 2x. So: a×b = exp (log(a)+log(b)).And similarly, and less interestingly: a + b = log( exp(a) exp(b) ).
Reals Rexp
��
OO
log
ks +3 operation : addition
exp
��
OO
log
ks +3 identity : 0
exp
��
OO
log
Positive reals R+ ks +3 operation : multiplication ks +3 identity : 1
This is a digression, not crucial to what we are doing, but it is good to see whatis going on here.
exercise 4. Explain in your own words what the relationship is between logarithmsand exponentiation (exponentiation is raising a number to a given power).
8. ADDING LOG PROBABILITIES IN THE UNIGRAM MODEL
The probability of a sentence S in the unigram model is the product of the probabili-ties of its words, so the log probability of a sentence in the unigram model is the sumof the log probabilities of its words. That makes it particularly clear that the longer

88 j. goldsmith
the sentence gets, the larger its log probability gets. In a sense that is reasonable—the longer the sentence, the less likely it is. But we might also be interested in theaverage log probability of the sentence, which is just the total log probability of thesentence divided by the number of words; or to put it another way, it’s the average
log probability per word =1
N
N∑i=1
S[i]. This quantity, which will become more and
more important as we proceed, is also called the entropy—especially if we’re talkingabout averaging over not just one sentence, but a large, representative sample, sothat we can say it’s (approximately) the entropy of the language, not just of someparticular sentence.
We’ll return to the entropy formula, with its initial1
Nto give us an average,
but let’s stick to the formula that simply sums up the log probabilities:N∑
i=1
S[i].
Observe carefully that this is a sum in which we sum over the successive words ofthe sentence. When i is 1, we are considering the first word, which might be the,and when i is 10, the tenth word might be the as well.
In general, we may be especially interested in very long corpora, because it isthese corpora which are our approximation to the whole (nonfinite) language. Andin such cases, there will be many words that appear quite frequently, of course. Itmakes sense to re-order the summing of the log probabilities –because the sum isthe same regardless of the order in which you add numbers—so that all the identicalwords are together. This means that we can rewrite the sum of the log probabilitiesas a sum over words in the vocabulary (or the dictionary—a list where each distinctword occurs only once), and multiply the log probability by the number of times itis present in the entire sum. Thus (remember the tilde marks positive logs):
sum over words in string :N∑
i=1
S[i] (16)
=V∑
j=1
count(wordj) wordj (17)
If we’ve kept track all along of how many words there are in this corpus (callingthis "N"), then if we divide this calculation by N, we get, on the left, the average
log probability, and, on the right:V∑
j=1
count(wj)
Nwj. That can be conceptually sim-
plified some more, because count(wj)
Nis the proportional frequency with which word
wj appears in the list of words, which we have been using as our estimate for aword’s probability. Therefore we can replace count(wj)
Nby pr(wj), and end up with
the formula:
V∑j=1
pr(wordj) wordj (18)

probability for linguists 89
which can also be written as
−V∑
j=1
pr(wordj) log pr(wordj) (19)
This last formula is the formula for the entropy of a set, and we will return toit. We can summarize what we have just seen by saying, again, that the entropy ofa language is the average plog of the words.
9. LET’S COMPUTE THE PROBABILITY OF A STRING
Let’s express the count of a letter p in a corpus with the notation [p] (as I promisedwe would do eventually), and we’ll also allow ourselves to index over the letter of thealphabet by writing li—that is, li represents the ith letter of the alphabet. Supposewe have a string S1 of length N1. What is its probability? If we assume that theprobability of each letter is independent of its context, and we use its frequency asits probability, then the answer is simply:
∏l∈A
([li]
N1
)[li]
(20)
Suppose we add 10 e’s to the end of string S1. How does the probability of thenew string S2 compare to S1? Let’s call S2’s length N2, and N2 = N1 + 10. Theprobability of S2 is: ∏
l∈A, l 6=e
([li]
N2
)[li] ( [e] + 10
N2
)[e]+10
(21)
Let’s take the ratio of the two:
∏l∈A
([li]
N1
)[li]
∏l∈A, l 6=e
([li]
N2
)[li] ( [e] + 10
N2
)[e]+10(22)
=
pr1(e)[e]N
[e]−N1
1
∏l∈A,l 6=e
[li][li]
pr1(e)[e]+10N
[e]+10−N1
2
∏l∈A, l 6=e
[li][li]
(23)
but N2 = N1 + 10, so this equals(pr1(e)
pr2(e)
)[e]
(pr2(e))−10
(N1
N2
)[e]−N1
(24)
taking logs:[e]∆(e)− 10 log pr2(e)− (N1 − [e])∆(N) (25)

90 j. goldsmith
where the ∆ function is the log ratio of the values in the before (= State 1)and theafter (= State 2) condition (state 1 in the numerator, state 2 in the denominator).This is a very handy notation, by the way—we very often will want to comparea certain quantity under two different assumptions (where one is “before” and theother is “after”, intuitively speaking), and it is more often than not the ratio of thetwo quantities we care about.
Putting our expression above in words:
the difference of the log probabilities is the sum of three terms, each weighted by thesize of the parts of the string, which are: the original e′s; 10 new e′s; and everythingelse. The first is weighted by the ∆ function; the second by the information contentof the new e′s; and the last by a value of approximately [e] bits!
exercise 5. When x is small, loge(1 + x) is approximately x, where e is the baseof the natural logarithms, a number just slightly larger than 2.718. (“loge” is alsowritten conventionally ln.) You can see this graphically, since the first derivativeof the loge or ln function is 1 at 1, and its value there is 0. If that’s not clear,just accept it for now. Changing the base of our logarithms means multiplying bya constant amount, as we can see in the following. alogax = x, by definition. Also,a = eln a by definition. Plugging the second in the first, we see that (eln a)logax = x.Since the left-hand side also equals e(ln a)(loga x), we see that e(ln a)(logax) = x. Takingnatural logarithms of both sides, we have (ln a)(logax) = ln x, which was what wewanted to see: changing the base of a logarithm from c to d amounts to dividing bylogc d. Can you change find the expression that generalizes loge(1 + x) ≈ x to anybase, and in particular express the approximation for log2(1 + x)? If you can, thenrewrite (25), replacing ∆ with the result given by using this approximation.
10. MAXIMIZING PROBABILITY OF A SENTENCE, OR A CORPUS
We will now encounter a new and very different idea, but one which is of capitalimportance: the fundamental goal of analysis is to maximize the probability of theobserved data. All empirical learning centers around that maxim. Data is important,and learning is possible, because of that principle.
When we have a simple model in mind, applying this maxim is simple; when themodels we consider grow larger and more complex, it is more difficult to apply themaxim.
If we restrict ourselves at first to the unigram model, then it is not difficult toprove—but it is important to recognize—that the maximum probability that can beobtained for a given corpus is the one whose word-probabilities coincide preciselywith the observed frequencies. It is not easy at first to see what the point is of thatstatement, but it is important to do so. There are two straightforward ways to seethis: the first is to use a standard technique, Lagrange multipliers, to maximize aprobability-like function, subject to a constraint, and the second is to show that thecross-entropy of a set of data is always at least as great as the self-entropy. We willleave the first method to a footnote for now.4
4For a large class of probabilistic models, the setting of parameters which maximizes the proba-

probability for linguists 91
Let us remind ourselves that we can assign a probability to a corpus (which is,after all, a specific set of words) with any distribution, that is, any set of probabilitiesthat add up to 1.0. If there are words in the corpus which do not get a positive valuein the distribution, then the corpus will receive a total probability of zero (remindyourself why this is so!), but that is not an impossible situation. (Mathematicians,by the way, refer to the set which gets a non-zero probability as the support of thedistribution. Computational linguists may say that they are concerned with makingsure that all words are in the support of their probability distribution.)
Suppose we built a distribution for the words of a corpus randomly—ensuringonly that the probabilities add up to 1.0. (Let’s not worry about what “randomly”means here in too technical a way.) To make this slightly more concrete, let’s saythat these probabilities form the distribution Q, composed of a set of values q(wordi),for each word in the corpus (and possibly other words as well). Even this randomlyassigned distribution would (mathematically) assign a probability to the corpus. Itis important to see that the probability is equal to
multiplying over words in string:N∏
i=1
q(S[i]) (26)
bility assigned to a corpus is derived from using the observed frequencies for the parameters. Thisobservation is typically proved by using the method of Lagrange multipliers, the standard methodof optimizing an expression given a constraint expressed as an equation. There is a geometricintuition that lies behind the method, however, which may be both more interesting and moreaccessible. Imagine two continuous real-valued functions f and g in Rn; f(x) is the function wewish to optimize, subject to the condition that g(x) = c, for some constant c. In the case weare considering, n is the number of distinct symbols in the alphabet A = {ai}, and each dimen-sion is used to represent values corresponding to each symbol. Each point in the (n-dimensional)space can be thought of as an assignment of a value to each of the n-dimensions. Only thosepoints that reside on a certain hyperplane are of interest: those for which the values for eachdimension are non-negative and for which the sum is 1.0. This statement forms our constraint g:g(x) =
∑ni=1 xi = 1.0, and we are only interested in the region where no values are negative. We
have a fixed corpus C, and we want to find the set of probabilities (one for each symbol ai) whichassigns the highest probability to it, which is the same as finding the set of probabilities whichassigns C the smallest plog. So we take f(x) to be the function that computes the plog of S, that
is, f(x) =n∑
i=1
CountS(ai) plog(xi).
The set of points for which g(x) = c forms an n-1 dimensional surface in Rn (in fact, it is flat),and the points for which f(x) is constant likewise form n-1 dimensional surfaces, for appropriatevalues of x. Here is the geometric intuition: the g-surface which is optimal must be tangent tothe f -surface at the point where they intersect, because if they were not tangent, there would bea nearby point on the f -surface where g was even better (bigger or smaller, depending on whichoptimum we are looking for); this in fact is the insight that lies behind the method of Lagrangemultipliers. But if the two surfaces are tangent at that optimal point, then the ratio of thecorresponding partial derivatives of f and g, as we vary across the dimensions, must be constant;that is just a restatement of the observation that the vectors normal to each surface are pointingin the same direction. Now we defined g(x) as a very simple function; its partial derivatives areall 1 (i.e., for all i, ∂g
∂xi= 1), and the partial derivations of f(x) are ∂f
∂xi= −CountS(ai)
xifor all i.
Hence at our optimal point, CountS(ai)xi
= k for some constant k, or xi = k CountS(ai), which isto say, the probability of each word is directly proportional to its count in the corpus, hence mustequal CountS(ai)P
j CountS(aj).

92 j. goldsmith
and this, in turn, is equal to
multiplying over words in vocabulary:V∏
j=1
q(wordj)count(wordj) (27)
Make sure you understand why this exponent is here: when we multiply togetherk copies of the probability of a word (because that word appears k times in acorpus), the probability of the entire corpus includes, k times, the probability ofthat word in the product which is its probability. If we now switch to thinkingabout the log probability, any particular word which occurs k times in the corpuswill contribute k times its log probability to the entire sum which gives us the(positive) log probability:
V∑j=1
count(wordj)wordj (28)
What should be clear by now is that we can use any distribution to assign aprobability to a corpus. We could even use the uniform distribution, which assignsthe same probability to each word.
Now we can better understand the idea that we may use a distribution for a givencorpus whose probabilities are defined exactly by the frequencies of the words in agiven corpus. It is a mathematical fact that this “empirical distribution” assigns thehighest probability to the corpus, and this turns out to be an extremely importantproperty. (Important: you should convince yourself now that if this is true, thenthe empirical distribution also assigns the lowest entropy to the corpus.)
exercise 6. Show why this follows.It follows from what we have just said that if there is a “true” probability distributionfor English, it will assign a lower probability to any given corpus that the empiricaldistribution based on that corpus, and that the empirical distribution based on onecorpus C1 will assign a lower probability to a different corpus C2 than C2’s ownempirical distribution. Putting that in terms of entropy (that is, taking the positivelog of the probabilities that we have just mentioned, and dividing by N , the numberof words in the corpus), we may say that the “true” probability distribution forEnglish assigns a larger entropy to a corpus C than C’s own empirical distribution,and that C1’s empirical distribution assigns a higher entropy to a different corpusC2 than C2’s own empirical distribution does.
These notions are so important that some names have been applied to theseconcepts. When we calculate this formula, weighting one distribution D1(like anobserved frequency distribution) by the log probabilities of some other distributionD2, we call that the cross-entropy ; and if we calculate the difference between thecross-entropy and the usual (self) entropy, we also say that we are calculating theKullback-Leibler (or “KL”) divergence between the two distributions. Mathemat-ically, if the probability assigned to wordi by D1 is expressed as pr1(wordi) (and

probability for linguists 93
likewise for D2—its probabilities are expressed as pr2), then the KL divergence is
V∑j=1
pr1(wordj) log pr1(wordj)− pr1(wordj) log pr2(wordj) (29)
The tricky part is being clear on why pr1 appears before the log in both termsin this equation. It is because there, the pr1, which comes from D1, is being usedto indicate how many times (or what proportion of the time) this particular wordoccurs in the corpus we are looking at, which is entirely separate from the roleplayed by the distribution inside the log function—that distribution tells us whatprobability to assign to the given word.5
The KL divergence just above can be written equivalently as
V∑j=1
pr1(wordj) logpr1(wordj)
pr2(wordj)(30)
A common notation for this is: KL(D1||D2). Note that this relationship is notsymmetric: KL(D1||D2) is not equal to KL(D2||D1).
Here’s one direct application of these notions to language. Suppose we have a setof letter frequencies (forming distributions, of course) from various languages usingthe Roman alphabet. For purposes of this illustration, we’ll assume that whateveraccents the letters may have had in the original, all letters have been ruthlesslyreduced to the 26 letters of English. Still, each language has a different set offrequencies for the various letters of the alphabet, and these various distributionsare called Di. If we have a sample from one of these languages with empiricaldistribution S (that is, we count the frequencies of the letters in the sample), wecan algorithmically determine which language it is taken from by computing the KLdivergence KL(S||Di). The distribution which produces the lowest KL divergenceis the winner—it is the correct language, for its distribution best matches that ofthe sample.
11. CONDITIONAL PROBABILITIES, THIS TIME WITH LOGS
We have talked about the conditional probability of (for example) a word w, given itsleft-hand neighbor v, and we said that we can come up with an empirical measureof it as the total number of v +w biwords, divided by the total number of v’s in thecorpus:
pr(S[i] = w|S[i− 1] = v) =pr(vw)
pr(v)(31)
Look at the log-based version of this: .
log pr(S[i] = w|S[i− 1] = v) = log pr(vw)− log pr(v) (32)
5Solomon Kullback and Richard Leibler were among the original mathematicians at the NationalSecurity Agency, the federal agency that did not exist for a long time. Check out the page inKullback’s honor at http://www.nsa.gov/honor/honor00009.cfm

94 j. goldsmith
12. ESSENTIAL INFORMATION THEORY
Suppose we have given a large set of data from a previously unanalyzed language,and four different analyses of the verbal system are being offered by four differentlinguists. Each has an account of the verbal morphology using rules that are (indi-vidually) of equal complexity. There are 100 verb stems. Verbs in each group usethe same rules; verbs in different groups use entirely different rules.
Linguist 1 found that he had to divide the verbs into 10 groups with 10 verbs ineach group. Linguist 2 found that she had to divide the verbs into 10 groups, with50 in the first group, 30 in the second group, 6 in the third group, and 2 in each of7 small groups. Linguist 3 found that he had just one group of verbs, with a set ofrules that worked for all of them. Linguist 4 found that she had to divide the verbsinto 50 groups, each with 2 stems in it.
Rank these four analyses according how good you think they are—sight unseen.
Hopefully you ranked them this way:
Best: Linguist 3Linguist 2Linguist 1
Worst: Linguist 4
And why? Because the entropy of the sets that they created goes in that order.That’s not a coincidence—entropy measures our intuition of the degree of organiza-tion of information.
The entropy of a set is −∑
pr(ai) log pr(ai) , where we sum over the probabilityof each subset making up the whole—and where the log is the base2 log.
• The entropy of Linguist 1’s set of verbs is−1×10× 110×log 1
10= log(10) = 3.32.
• The entropy of Linguist 2’s set of verbs is −1 × 12× log 1
2+ 0.3 × log(0.3) +
0.06× log(0.06) + 0.14× log(0.02)) = 0.346 + 0.361 + 0.169 + 0.548 = 1.42.
• The entropy of Linguist 3’s set of verbs is −1× 1× log(1) = 0.
• The entropy of Linguist 4’s set of verbs is −1× 50× 150× log(0.02) = 3.91.
Thus, in some cases—very interesting ones, in my opinion—the concept of en-tropy can be used to quantify the notion of elegance of analysis.
13. ANOTHER APPROACH TO ENTROPY
The traditional approach to explaining information and entropy is the following. Alanguage can be thought of as an organized way of sending symbols, one at a time,from a sender to a receiver. Both have agreed ahead of time on what the symbolsare that are included. How much information is embodied in the sending of anyparticular symbol?
Suppose there are 8 symbols that comprise the language, and that there is nobias in favor of any of them— hence, that each of the symbols is equally likely atany given moment. Then sending a symbol can be thought of as being equivalent to

probability for linguists 95
be willing to play a yes/no game—essentially like a child’s Twenty Questions game.Instead of receiving a symbol passively, the receiver asks the sender a series of yes/noquestions until he is certain what the symbol is. The number of questions that isrequired to do this—on average—is the average information that this symbol-passingsystem embodies.
The best strategy for guessing one of the 8 symbols is to ask a question alongthe lines of “Is it one of symbols 1, 2, 3, or 4?” If the answer is Yes, then ask “Isit among the set: symbols 1 and 2?” Clearly only one more question is needed atthat point, while if the answer to the first question is No, the next question is, “Isit among the set: symbols 5 and 6?” And clearly only one more question is neededat that point.
If a set of symbols has N members in it, then the best strategy is to use eachquestion to break the set into two sets of size N
2, and find out which set has the
answer in it. If N = 2k, then it will take k questions; if N = 2k + 1, it may take asmany as k+1 questions.
Note that if we did all our arithmetic in base 2, then the number of questions itwould take to choose from N symbols would be no more than the number of digitsin N (and occasionally it takes 1 fewer). 8 = 10002, and it takes 3 questions toselect from 8 symbols; 9 = 10012, and it takes 4 questions to select from 9 symbols;15 = 11112, and it takes 4 questions to select from 15 symbols.
Summarizing: the amount of information in a choice from among N possibilities(possible symbols, in this case) is log N bits of information, rounding up if necessary.Putting it another way—if there are N possibilities, and they each have the sameprobability, then each has probability 1/N, and the number of bits of informationper symbol is the positive log probability (which is the same thing as the log of thereciprocal of the probability).
exercise 7. Why is the positive log probability the same thing as the log of thereciprocal of the probability?But rarely is it the case that all of the symbols in our language have the sameprobability, and if the symbols have different probabilities, then the average numberof yes/no questions it takes to identify a symbol will be less than log N. Supposewe have 8 symbols, and the probability of symbol 1 is 0.5, the probability of symbol2 is 0.25, and the probability of the other 6 is one sixth of the remaining 0.25,i.e., 1/24 each. In this case, it makes sense to make the first question be simply,“Is it Symbol #1?” And half the time the answer will be “yes”. If the answer is“No,” then the question could be, “Is it Symbol #2?” and again, half the time theanswer will be “Yes.” Therefore, in three-fourths of the cases, the average number ofquestions needed will be no greater than 2. For the remaining six, let’s say that we’lltake 3 more questions to identify the symbol. So the average number of questionsaltogether is (0.5× 1)+ (0.25× 2)+ (0.25× 5) = 0.5+0.5+1.25 = 2.25. (Make sureyou see what we just did.) When the probabilities are not uniformly distributed,then we can find a better way to ask questions, and the better way will lower theaverage number of questions needed.

96 j. goldsmith
All of this is a long, round-about way of saying that the average information persymbol decreases when the probabilities of the symbols is not uniform. This quantityis the entropy of the message system, and is the weighted average of the number ofbits of information in each symbol, which obeys the generalization mentioned justabove: the information is -1 times the log of the probability of the symbol, i.e., thepositive log probability. The entropy is, then:
−∑
i
pr(xi) log pr(xi)
14. MUTUAL INFORMATION
Mutual information is an important concept that arises in the case of a samplespace consisting of joint events: each event can be thought of as a pair of morebasic events. One possible example would be the input and the output of somedevice (like a communication channel), and this was the original context in whichthe notion arose; another, very different example could be successive letters, orsuccessive words, in a corpus. Let’s consider the case of successive words, which ismore representative of the sort of case linguists are interested in.
The joint event, in this case, is the occurrence of a biword (or bigram, if youprefer). of the is such an event; so is the book, and so on. We can compute theentropy of the set of all the bigrams in a corpus. We can also consider the separateevents that constitute the joint event: e.g., the event of the occurring as a left-handmember of a biword. That, too, has an observed frequency, and so we can computeits entropy—and of course, we can do that for the right-hand words of the set ofbigrams. We want to know what the relationship is between the entropy of the jointevents and the entropy of the individual events.
If the two words comprising a biword are statistically unrelated, or independent,then the entropy of the joint event is the sum of the entropies of the individualevents. We’ll work through that, below. But linguistically, we know that this won’tin fact be the case. If you know the left-hand word of a bigram, then you know alot about what is likely to be the right-hand word: that is to say, the entropy ofthe possible right-hand words will be significantly lower when you know the left-hand word. If you know that the left-hand word is the, then there is an excellentchance that the right-hand word is first, best, only (just look at Table 2 above!).The entropy of the words in Table 2 is much lower than the entropy of the wholelanguage. This is known as the conditional entropy : it’s the entropy of the jointevent, given the left-hand word. If we compute this conditional entropy (i.e., right-hand word entropy based on knowing the left-hand word) for all of the left-handwords of the biword, and take the weighted mean of these entropies, what you havecomputed is called the mutual information: it is an excellent measure of how muchknowledge of the first word tells you about the second word (and this is true for anyjoint events).
Mutual information between two random variables X, Y , where X can take onthe different values xi, and Y can take on the different values yi (don’t be fooled if

probability for linguists 97
the name we use to label the index might change):∑i
pr(xi)∑
j
−pr(yj|xi) log pr(yj|xi) (33)
(While we’re at it, don’t forget that p(yj|xi) =pr(xiyj)
pr(xi)= pr(bigram)
pr(word))
It is certainly not obvious, but the following is true: if you compute the condi-tional entropy of the left-hand word, given the right-hand word, and compute theweighted average over all possible right-hand words, you get the same quantity, themutual information. Mutual information is symmetric, in that sense.
There is a third way of thinking about mutual information which derives fromthe following, equivalent formula for mutual information, and this way of thinkingof it makes it much clearer why the symmetry just mentioned should be there:∑
i,j
pr(xiyj) logpr(xiyj)
pr(xi)pr(yj)(34)
where pr(xi) is the probability of xi, which is to say,∑
j pr(xiyj). This last expres-sion, (34), can be paraphrased as: the weighted difference between the informationof the joint events (on the one hand) and the information of the separate events (onthe other). That is, if the two events were independent, then pr(xiyj)
pr(xi)pr(yj)would be
1.0, and the log of that would be zero.
So far, all of our uses of mutual information have been weighted averages (weoften find it handy to refer to this kind of average as an ensemble average, whichborrows a metaphor from statistical physics). However, in computational linguisticsapplications, it is often very useful to compute pr(xiyj)
pr(xi)pr(yj)for individual bigrams.
The most straightforward way to use it is to compare the log probability assignedto a string of words under two models: (1) a unigram model, in which each wordis assigned a plog, a positive log probability (remember this formula from above—N∑
i=1
− log pr(S[i])—and (2) a bigram model, in which each word is assigned a positive
log probability, conditioned by its left-hand neighbor. We can’t write the follow-
ingN∑
i=1
− log pr(S[i] | S[i− 1]),6 since we do not seem to have a zero-th word to
condition the first word on. The usual thing to do (it’s perfectly reasonable) is toassume that all of the strings we care about begin with a specific symbol that oc-curs there and nowhere else. Then we can perfectly well use the following formula:N∑
i=2
− log pr(S[i] | S[i− 1])
We will end all of this on a high note, which is this: the difference betweenthe plog (positive log) probability of a string on the unigram model and the plogof the same string on the bigram model is exactly equal to the sum of the mutual
6This is a good example of abusing the notation: I warned you about that earlier, and now it’shappened.

98 j. goldsmith
informations between the successive pairs of words. Coming out of the blue, thisseems very surprising, but of course it isn’t really. For any string S, the differencebetween the unigram plogs (given by the first overbrace) and the bigram plots (givenby the second overbrace) is:︷ ︸︸ ︷[ ∑
− log pr(S[i])]−
︷ ︸︸ ︷[∑− log pr(S[i] | pr(S[i− 1])
]=
∑ [− log pr(S[i]) + log
pr(S[i− 1]S[i])
pr(S[i− 1])
]=
∑log
pr(S[i− 1]S[i])
pr(S[i− 1])pr(S[i])
(35)
And the last line is just the sum of the mutual information between each of thesuccessive pairs.
15. CONCLUSION
My goal in this paper has been to present, in a form convivial to linguists, anintroduction to some of the quantitative notions of probability that have playedan increasingly important role in understanding natural language and in developingmodels of it. We have barely scratched the surface, but I hope that this brief glimpsehas given the reader the encouragement to go on and read further in this area.
references
goldsmith j. a., Towards a new empiricism, J. Brandão de Carvalho (éd.), RecherchesLinguistiques à Vincennes, vol. 36, 2007.stuart g., johnson m., “Probability and statistics in computational linguistics, a briefreview”, Mathematical foundations of speech and language processing 138, 2003, p. 1-26.Available at http://www.cog.brown.edu/ mj/papers/Review.pdf , 2003.