midlands state university faculty of social sciences department ...
Upload
khangminh22Category
view
2download
0
i
INDUSTRIAL ATTENDANCE MANAGEMENT SYSTEM
Prisca Memory Nyari (R146266G)

ii
Industrial Attendance Management System
BY
PRISCA MEMORY NYARI (R146266G)
Submitted in partial fulfilment of the requirements for the degree of
BSC HONOURS INFORMATION SYSTEMS
DEPARTMENT OF COMPUTER SCIENCE AND INFORMATION SYSTEMS
in the
Faculty of Science and Technology
at the
Midlands State University
Gweru
May 2018
Supervisor: Ms Mugoniwa

i
Abstract
Industrial attendance management system is a software application that is developed for
Zimbabwe Power Company Bulawayo Power Station to allow employees to log in and out of
the organisation and also calculate their overtime automatically. The problem that arose with
the current system was the difficulty in handling employee clock in details manually. The
developed system overcomes the problems that were associated with the current manual
system such as too much bottlenecks. In-house development was chosen as the best
alternative to introduce this system in the organisation. Feasibility analysis was carried out in
terms of social, economic and technical aspects to see whether developing the system is a
viable decision. Interviews, questionnaires, observations and document review were the
information gathering methodologies that were used to identify the problems of the current
system. Tools that were used in developing the system are Php, Dreamweaver and MySQL.
Adaptive maintenance was chosen because it allows the system to adapt to environmental
changes of the software and hardware. Implementation strategy used in implementing the
system is the pilot changeover strategy since it is less risky compared to other changeover
strategies. For the future recommendations, the system must be developed further for it to be
used in all power stations and have a server for the system that will manage all power stations
employee activities.

ii
Declaration
I, PRISCA MEMORY NYARI, hereby declare that I am the sole author of this dissertation.
I authorize the Midlands State University to lend this dissertation to other institutions or
individuals for the purpose of scholarly research.
Signature_________________________________ Date ___________________________

iii
Approval
This dissertation entitled “INDUSTRIAL ATTENDANCE MANAGEMENT SYSTEM FOR
ZIMBABWE POWER COMPANY BULAWAYO POWER STATION” by PRISCA
MEMORY NYARI meets the regulations governing the award of the degree of BSC
HONOURS INFORMATION SYSTEM of the Midlands State University, and is approved
for its contribution to knowledge and literal presentation.
Supervisor …………………………………………………….
Date …………………………………………………….

iv
Acknowledgements
First and foremost I would like to give thanks to God who gave me the strength to complete
this project in its entirety. I would want to thank the ZPC family for giving me the
opportunity to work with them whilst I was developing the project. Their cooperation is
greatly valued because it made this project a success. I also want to thank my family at large
who supported me with all the required resources and morale. I want to thank my friends who
supported me in doing this project and all the members of the Science and Technology
department who made sure that this project is up to standard. Further thanks go to my
supervisor Ms B Mugoniwa who sacrificed her time helping me in order for the project to be
a success. Your support is greatly appreciated.
God bless you all

v
Dedication
It goes to my father who continuously contributed notably to my welfare and resources and
whose inspiration is my source of motivation. May the Lord continue to bless him. Thank
you for your overwhelming support.

vi
Table of contents
ABSTRACT I
DECLARATION II
APPROVAL III
ACKNOWLEDGEMENTS IV
DEDICATION V
TABLE OF CONTENTS VI
LIST OF ACRONYMS X
LIST OF TABLES XI
LIST OF FIGURES XII
LIST OF APPENDICES XIV
CHAPTER 1: INTRODUCTION 1
1.1 INTRODUCTION ............................................................................................................................... 1
1.2 BACKGROUND OF THE STUDY ............................................................................................................. 1
1.2.1 BACKGROUND OF THE ORGANISATION ................................................................................................ 2
1.2.1.1 Bulawayo Power Station ........................................................................................................ 3
1.2.2 ORGANISATIONAL STRUCTURE .......................................................................................................... 3
1.2.3 VISION ........................................................................................................................................ 4
1.2.4 MISSION ..................................................................................................................................... 5
1.3 PROBLEM DEFINITION ....................................................................................................................... 5
1.4 AIM .............................................................................................................................................. 5
1.5 OBJECTIVES .................................................................................................................................... 6
1.6 INSTRUMENTS AND METHODS ............................................................................................................ 6
1.7 JUSTIFICATION ................................................................................................................................ 7
1.8 CONCLUSION .................................................................................................................................. 8
CHAPTER 2: PLANNING PHASE 9
2.1 INTRODUCTION ............................................................................................................................... 9
2.2 BUSINESS VALUE .............................................................................................................................. 9
2.3 FEASIBILITY ANALYSIS ..................................................................................................................... 11
2.3.1 TECHNICAL FEASIBILITY ................................................................................................................. 11

vii
2.3.1.1 Hardware specifications ....................................................................................................... 11
2.3.1.2 Software specifications ........................................................................................................ 12
2.3.1.3 Technical expertise .............................................................................................................. 12
2.3.2 ECONOMIC FEASIBILITY ................................................................................................................. 12
2.3.2.1 Benefits ............................................................................................................................... 13
2.3.2.1.1 Tangible benefits............................................................................................................... 13
2.3.2.1.2 Intangible benefits ............................................................................................................ 13
2.3.2.2 Costs .................................................................................................................................... 13
2.3.2.2.1 Tangible costs ................................................................................................................... 14
2.3.2.2.2 Intangible costs ................................................................................................................. 14
2.3.2.2.3 Development cost ............................................................................................................. 14
2.3.2.3 Cost benefit analysis (CBA) ................................................................................................... 14
2.3.2.4 Return on investment (ROI) ................................................................................................. 16
2.3.2.6 Net present value (NPV) ....................................................................................................... 17
2.3.3 SOCIAL FEASIBILITY ...................................................................................................................... 17
2.3.4 OPERATIONAL FEASIBILITY ............................................................................................................. 17
2.4 RISK ANALYSIS .............................................................................................................................. 18
2.4.1 TECHNICAL RISK .......................................................................................................................... 18
2.4.2 STAKEHOLDER RISK ...................................................................................................................... 18
2.4.3 ECONOMIC RISK .......................................................................................................................... 18
2.5 STAKEHOLDER ANALYSIS.................................................................................................................. 19
2.6 WORK PLAN ................................................................................................................................. 20
2.7 CONCLUSION ................................................................................................................................ 22
CHAPTER 3: ANALYSIS PHASE 23
3.1 INTRODUCTION ............................................................................................................................. 23
3.2 INFORMATION GATHERING METHODOLOGIES ...................................................................................... 23
3.2.1 INTERVIEWS ............................................................................................................................... 23
3.2.2 OBSERVATIONS ........................................................................................................................... 25
3.2.3 DOCUMENT REVIEW .................................................................................................................... 27
3.2.4 QUESTIONNAIRES ........................................................................................................................ 28
3.3 ANALYSIS OF THE CURRENT SYSTEM ................................................................................................... 30
3.4 PROCESS ANALYSIS ......................................................................................................................... 30
3.4.1 ACTIVITY DIAGRAM OF THE CURRENT SYSTEM .................................................................................... 31
3.5 DATA ANALYSIS ............................................................................................................................. 33
3.5.1 CONTEXT DIAGRAM ..................................................................................................................... 33
3.5.2 DATA FLOW DIAGRAM OF THE CURRENT SYSTEM ................................................................................ 35
3.6 WEAKNESSES OF THE CURRENT SYSTEM .............................................................................................. 36
3.7 EVALUATING ALTERNATIVES ............................................................................................................. 36
3.7.1 IMPROVEMENT ........................................................................................................................... 37
3.7.2 OUTSOURCING ........................................................................................................................... 37
3.7.3 IN-HOUSE DEVELOPMENT .............................................................................................................. 37
3.8 REQUIREMENT ANALYSIS ................................................................................................................. 38
3.8.1 FUNCTIONAL REQUIREMENTS ......................................................................................................... 38
3.8.2 NON-FUNCTIONAL REQUIREMENTS.................................................................................................. 39
3.9 CONCLUSION ................................................................................................................................ 39

viii
CHAPTER 4: DESIGN PHASE 40
4.1 INTRODUCTION ............................................................................................................................. 40
4.2 SYSTEM DESIGN ............................................................................................................................ 40
4.2.1 CONTEXT DIAGRAM ..................................................................................................................... 41
4.2.2 DATA FLOW DIAGRAM .................................................................................................................. 41
4.3 ARCHITECTURAL DESIGN.................................................................................................................. 44
4.4 PHYSICAL DESIGN........................................................................................................................... 46
4.4.1 HARDWARE REQUIREMENTS .......................................................................................................... 47
4.4.2 SOFTWARE REQUIREMENTS ........................................................................................................... 47
4.5 DATABASE DESIGN ......................................................................................................................... 47
4.5.1 REASONS FOR USING DATABASE MANAGEMENT SYSTEM ....................................................................... 47
4.5.2 ARCHITECTURAL VIEW OF THE DATABASE DESIGN ................................................................................ 48
4.5.3 DATABASE TABLES ....................................................................................................................... 50
4.5.4 ENHANCED ENTITY RELATIONSHIP DIAGRAM ..................................................................................... 51
4.6 PROGRAM DESIGN ......................................................................................................................... 52
4.6.1 PACKAGE DIAGRAM ..................................................................................................................... 53
4.6.2 CLASS DIAGRAMS ........................................................................................................................ 53
4.6.3 SEQUENCE DIAGRAMS .................................................................................................................. 55
4.7 INTERFACE DESIGN ......................................................................................................................... 56
4.7.1 MENU DESIGN ............................................................................................................................ 57
4.7.2 INPUT DESIGN ............................................................................................................................. 57
4.7.3 OUTPUT DESIGN.......................................................................................................................... 61
4.8 PSEUDO CODE .............................................................................................................................. 62
4.8.1 CREATING EMPLOYEE ACCOUNT ...................................................................................................... 62
4.8.2 USER LOGIN FORM....................................................................................................................... 62
4.8.3 USER CLOCK OUT FORM ................................................................................................................ 63
4.9 SECURITY DESIGN ........................................................................................................................... 63
4.10 CONCLUSION .............................................................................................................................. 64
CHAPTER 5: IMPLEMENTATION PHASE 65
5.1 INTRODUCTION ............................................................................................................................. 65
5.2 CODING ....................................................................................................................................... 65
5.3 TESTING ....................................................................................................................................... 67
5.3.1 UNIT TESTING ............................................................................................................................. 68
5.3.2 INTEGRATION TESTING .................................................................................................................. 69
5.3.3 SYSTEM TESTING ......................................................................................................................... 69
5.3.3.1 Objectives versus system testing .......................................................................................... 70
5.3.3.2 Defective testing .................................................................................................................. 73
5.3.4 ACCEPTANCE TESTING .................................................................................................................. 74
5.3.5 VALIDATION ............................................................................................................................... 75
5.3.6 VERIFICATION ............................................................................................................................. 75
5.4 INSTALLATION ............................................................................................................................... 76
5.4.1 USER TRAINING ........................................................................................................................... 76
5.4.2 DATA MIGRATION........................................................................................................................ 76
5.4.3 SYSTEM CHANGEOVER STRATEGIES .................................................................................................. 77

ix
5.4.3.1 Direct changeover ................................................................................................................ 77
5.4.3.2 Parallel changeover.............................................................................................................. 77
5.4.3.3 Pilot changeover .................................................................................................................. 78
5.4.3.4 Phased changeover .............................................................................................................. 78
5.4.3.5 Recommended changeover strategy .................................................................................... 78
5.5 MAINTENANCE.............................................................................................................................. 78
5.5.1 CORRECTIVE MAINTENANCE ........................................................................................................... 79
5.5.2 ADAPTIVE MAINTENANCE .............................................................................................................. 79
5.5.4 PERFECTIVE MAINTENANCE ............................................................................................................ 79
5.5.4 PREVENTIVE MAINTENANCE ........................................................................................................... 79
5.5.5 RECOMMENDATIONS ON THE MAINTENANCE STRATEGY ....................................................................... 79
5.6 RECOMMENDATIONS FOR FUTURE OR FURTHER DEVELOPMENT ............................................................... 80
5.7 CONCLUSION ................................................................................................................................ 80
REFERENCE LIST 81
APPENDICES 84
APPENDIX A: USER MANUAL 84
APPENDIX B: INTERVIEW CHECKLIST 89
APPENDIX C: QUESTIONNAIRE CHECKLIST 90
APPENDIX D: OBSERVATION SCORE SHEET 91
APPENDIX E: SNIPPET OF CODE 92

x
List of acronyms
ARR – Average Rate of Return
BPS – Bulawayo Power Station
CBA – Cost Benefit Analysis
C.E.O – Chief Executive Officer
DFD – Data Flow Diagram
GB – Gigabyte
GHz – Gigahertz
HP – Hewlett Packard
MySQL – Structured Query Language
NPV – Net Present Value
PHP – Personal Homepage
RAM – Random Access Memory
ROI – Return on Investment
SMART – Specific, Measurable, Attainable, Realistic and Time framed
ZESA – Zimbabwe Electricity Supply Authority
ZPC – Zimbabwe Power Company

xi
List of tables
Table 2.1 Hardware specifications 11
Table 2.2 Software specifications 12
Table 2.3 Development costs 14
Table 2.4 Cost benefit analysis 15
Table 2.5 Time schedule 21
Table 4.1: Table employee 50
Table 4.2: Table department 50
Table 4.3: Table clock in 50
Table 4.4: Table clock out 51

xii
List of figures
Figure 1.1 Aerial view of Bulawayo Power Station. 3
Fig 1.2 Organisational structure of BPS 4
Fig 2.1 Waterfall model 20
Fig 2.2 Gantt chart 21
Fig 3.1 Activity diagram 32
Fig 3.2 Context diagram of the existing system 34
Fig 3.4 DFD of the current system 35
Fig 4.1 Context diagram 41
Fig 4.2 Data flow diagram 43
Fig 4.3 Client server architecture 45
Fig 4.4 Network architecture design 45
Fig 4.5 Physical design 46
Fig 4.6 Ansi sparc diagram 48
Fig 4.7 Enhanced entity relationship diagram 52
Fig 4.8 Package diagram of the industrial attendance management system 53
Fig 4.9 Class diagrams 55
Fig4.10 Sequence diagrams 56
Fig 4.11 Menu design of the system 57
Fig 4.12 login form 58
Fig 4.13 Registration form 59

xiii
Fig 4.14 Clock in form 60
Fig 4.15 Clock out form 60
Fig 4.16 Summary of employee attendance 61
Fig 4.17 Employee report form 62
Fig 5.1 System testing process diagram 68
Fig 5.2 Unit testing diagram 69
Fig 5.3 Clock In form 70
Fig 5. 4 Overtime form 71
Fig 5.5 Tracking form 71
Fig 5.6 Report form 72
Fig 5.7 Absenteeism form 72
Fig 5.8 Defect Life Cycle 73
Fig 5.9 Acceptance testing 74
Fig 5.10 Validation form 75
Fig 5.11 Verification form 76

xiv
List of appendices
Appendices 84
Appendix A: User manual 84
Appendix B: Interview checklist 89
Appendix C: Questionnaire checklist 90
Appendix D: Observation score sheet91
Appendix E: Snippet of code 92

1
Chapter 1: Introduction
1.1 Introduction
Nowadays the world of business is always dynamic meaning that it is ever changing due to
information technology systems as such organisations needs to implement these information
systems in order for the organisation to remain very effective and efficient. As such
ZIMBABWE POWER COMPANY BULAWAYO POWER STATION should adopt an
online attendance management system. An electronic attendance management system
automates and streamlines the login process of employees in an organisation. The project will
focus on managing the entire login and log out flow process. The chapter will concentrate on
the benefits that are brought by the proposed system and these merits should outweigh those
of the existing system, conduct a study of the organisational background, and highlight the
objectives of the proposed system and the reasons behind its development.
1.2 Background of the study
According to Alleyne (2015) a background study refers to a process of carrying out a mere
review of some part of the organisation under study or being looked into in terms of existing
adequate information which is around the problem trying to be solved.
The problems faced by ZIMBABWE POWER COMPANY BULAWAYO POWER
STATION (ZPC BPS) involve a poor time in management system. Hence there is need of a
computerised system in recording the time in of employees. The system will enable the
company to run outstandingly and efficiently in order to upgrade with the dynamic changes in
technology that are constantly changing for the better resulting on an electronic time in and
time out attendance system. The existing system give employees the ability to record their
time in at work using a manual system that is the employees have to queue in the gate while
the loss control officer on duty at the gate records each employee’s name and surname,
station number and the department. This helps the proposed system to combine all the
activities on a global scale in which employees enter time without wasting much of their
time. Also employees record their time out at the station hence it takes time for them also to
queue especially at half past four in the afternoon were most employees dismiss from the
work station. It is also difficult to notice that an employee did not come to work.

2
1.2.1 Background of the organisation
According to Yago, Asai and Ito (2015), an organisational background states how and why
was the business implemented, how the organisation must be run and setup, the land which it
covers, ethics which the organisation bases on also including the community support and its
relationship that it has with the organisation.
Zimbabwe Power Company is a subsidiary of Zimbabwe Electricity Supply Authority
(ZESA). ZESA Holdings is a fully Government owned parastatal. It is responsible for the
generation of electricity in Zimbabwe. ZPC was fully established in the 1996’s as a driver too
lure investors for ZESA in the generation of power and it became operational in 1999. The
Act 13:19 of 2002 which involved electricity saw the birth of ZESA subsidiaries which
resulted in ZPC being given the responsibility of generating power in the country. ZPC was
authorised to own, operate, construct and maintain the generating power stations. ZPC
consists of five power stations that is four thermal power station and one hydro power station
with their capacities stated. These are in
1. Hwange - 920MW.
2. Harare - 100MW.
3. Munyati - 100MW.
4. Kariba - 1960MW.
5. Bulawayo - 90MW.

3
1.2.1.1 Bulawayo Power Station
Figure 1.1 Aerial view of Bulawayo Power Station.
The commissioning of the station occurred between 1948 and 1957. From 1948 up to 1960
the plant was connected to a local network within the Bulawayo area.
1.2.2 Organisational structure
Shtub and Karni (2010) explains saying a structure of an organisation provides a guideline on
the activities that management function accordingly. These management processes include
the determination of power, how responsibilities and roles are assigned, how the departments
are coordinated, how activities controlled, conducted and the coordination of information
involving the levels of management. It also identifies different processes that include
allocation of tasks, integration of activities and monitoring of these activities with the aim of
meeting the goals of the organisation.
The organisational structure of Bulawayo Power Station which falls under ZPC is as follows:

4
Fig 1.2 Organisational structure of BPS
1.2.3 Vision
King, Case and Avery (2012) states that a vision is known as a description which is
inspirational in terms of what an organisation foresees, expects and wishes to have
accomplished in the midterm or near future according to. Also it is described as a picture of
how the organisation wishes to be known for and what it wants to become. He continues to
say that in most organisations it is used as a clear guide which helps in selecting current and
future methods of running the organisation hence guiding the organisational management to
make sound decisions in line with the organisational vision.
Zimbabwe Power Company vision is “To be a leading supplier of energy and any related
services in the region.”
Head office
KARIBA HARARE BULAWAYO HWANGE MUNYATI
FINANCE HR MAINTEINANCE CHEMICAL
SERVICES
LOSS
CONTROL
OPERATIONS
SENIOR
FOREPERSON
MECHANICAL
MANTEINENCE
ENGINEER
SYSTEMS
ADMINISTRATOR
MAINTENANCE
ENGINEER
FOREPERSON CIVILS
AND SERVICES
SENIOR
FOREPERSON
ELECTRICAL,
CONTROL AND
INSTRUMENTAT
ION
WORKERS

5
1.2.4 Mission
Every organisation has got a mission statement. Shtub and Karni (2010) say that a mission
statement is a document that is written which highlights the businesses focus and its main aim
that usually is not changed over a period of time. A mission also states and explains the
organisational reason for existence.
Zimbabwe Power Company’s mission states “To be the supplier of energy and generate
electricity related products through the use of environmentally friendly technologies.”
1.3 Problem definition
Problems being faced by ZPC Bulawayo power station due to the current manual time in
attendance system are explained further. The existing system is not flexible because early in
the morning workers usually come maybe ten minutes early before the start time and for one
loss control officer to write each and every employee that enters the premises at the same
time takes some time resulting in employees being late whilst they are waiting to clock in at
the gate. It is a tedious process to constantly write the name of the worker, surname, station
number and the department of the employee as they enter the station everyday in the morning
and sometimes also visitors thus resulting in plenty of time that is wasted unnecessarily and
because of this some of the employees might just pass because of the congestion at the gate
and the loss control officer may not notice because they may be busy login employees as such
employees may not have the patience to wait a little longer and be part of the process as they
will be in a hurry to and start work for the day. More paper work is carried out since visitors
have their own log book, human resources department have its own and the other
departments use the same book hence each book does not last and having many books is done
to enable easy tracking in the future. This usually results in loss of data because the records
are maintained manually. Paper work is prone to a high risk of due to the fact that it is a
difficult process storing them for a longer period of time without them being lost or damaged.
Hence the loss of data which is valuable may occur due to these conditions and the lack of
proper security of the data.
1.4 Aim
The system’s aim is developing a system that is a tracking management system and web
based using Php in order to enable easy recording of time in by employees and also time out
of the employees

6
1.5 Objectives
Objectives refers to what the organisation aims at achieving or what it wants to attain using
the system being developed and these objectives are supposed to be measurable, specific,
realistic, time framed and attainable (SMART) according to Shtub and Karni (2010). The
objectives of the attendance management system are:
1) Implementing a system that allows employees and visitors to clock in and clock out of
the work station
2) To implement a system that calculates overtime hours and overtime amount of
employees
3) To help in easy tracking of records.
4) To enable easy generating of reports.
5) To enable in identifying absent employees.
1.6 Instruments and methods
PHP
PHP is a software program used for developing web applications according to (Zandstra
2013). It is an open source software hence it is easy to get help for the developers. It is easy
to develop. Thus the application can be made publicly available.
MySQL
Shelly and Rosenblatt (2012) say that MySQL refer to a language that is mostly used for
developing databases; it is structured. It’s also referred as a database management system
which is relational. MySQL is a language compatible with most of the operating systems for
example windows 7, windows XP and windows 10 among other operating systems. The
structured query language which is a property of MySQL is easy to understand and support
for users is always available anytime due to the many users and developers. It is also
protected meaning it offers security for the data because of the encryption of passwords
which result in the reduction of hackers and intruders.
Apache
According to Zandstra (2013) apache is software that is a web server. It is compatible with
almost every operating system and hardware. It is open source software therefore technical
support is readily available.

7
Methods
These are the data collection techniques that are going to be used when gathering data.
Interviews
This refers to a form of a conversation where the interviewer asks questions the interviewee
in order to gain information. Interviews can be formal or informal, structured or unstructured.
They can be conducted one to one or in groups, face to face or by telephone, Skype or email.
Questionnaires
These are a research technique that consists of a series of questions. It is also known as set of
printed or written questions with a choice of answers, usually devised for the purposes of a
survey or statistical study.
Focus groups
This is a form of qualitative research in which a group of people are asked about their
perceptions, opinions, beliefs and attitudes towards a product or a service, concept,
advertisement, idea or packaging. Questions are asked in a group setting where participants
are free to talk with other group members.
1.7 Justification
It enables employees in entering their details that is employee station number, name, surname
and other details thus simplifying the process hence resulting in an efficient and effective
workflow. It results in a quick clock in attendance process that is faster and it is not time
consuming.
The attendance management system provides an effective and efficient method of logging in
to employees. It is a very efficient process due to the fact that it is easier to keep records of all
the employee login details without misplacing them or losing the records. Accuracy is also
increased since the validity of data is ensured because errors are minimised because of the
automatic system. Attendance system provides accurate time in and time out details because
the employee data entries are not done manually
The system ensures that the organisation stays in line and keeps up with the changes in the
world of IT and adapting to the changes easily since the real time environment is dynamic
that is, it is ever changing.
8
Convenience is achieved because the system allows employees not to bypass the process. It
provides an interactive platform hence being user friendly as such employees can learn to use
within a short space of time through the use of training sessions that enable to equip
employees with the required knowledge and technical skills.
Manual data entry process is minimised if not eliminated by the system because the system is
computerised and there is a reduction in paperwork. A number of details of employees can be
entered once at a time. The system is quite capable to enter data at peak hours when
employees come to work and the dismissal time.
1.8 Conclusion
The first chapter has identified that the system will greatly be of paramount importance in
helping the users of the system. Efficiency and effectiveness is going to be brought by the
proposed system because of the objectives that are SMART. The objectives identified solve
the current problems that are being encountered because of the existing system.

9
Chapter 2: Planning phase
2.1 Introduction
The planning phase aims at mapping a way in which the project will be conducted. According
to Youssef (2011), he says that planning involves the process which determines the most
perfect or accurate time in which the project will take place and also identifying or
determining all the different processes that are conducted at a certain time. The planning
chapter is of paramount importance and forms a very important part when conducting a
project because this is where one carries out an analysis on the project thus determining its
economic feasibility, social feasibility, operational feasibility and technical feasibility. Also
analysis of stakeholders, analysis of risk will be conducted.
2.2 Business value
McDonald (2013) states that a business value of the organisation identifies benefits of the
proposed system which are going to be brought by and added into the organisation and the
business values are categorised into different categories which are going to be discussed
further below.
Managerial value
McDonald (2013) continues to say that managerial value results in the best quality services
that will be provided to the valued employees of the organisation. The system which is being
developed will provide room for it to be easy to be edited and improved in the years to come
for it to continue meeting the dynamic technological changes. Managerial value ensures that
security in the operation of the business is also increased in order to ensure that all users that
are not authorised to gain access to the system are blocked. Only authorised users will have
the authority to access the system.
Organisational value
Zimbabwe Power Company will be able to attract more investors thus ensuring that their
main goal of powering Zimbabwe into the future is met hence resulting in more efficient
decisions being made thus also ensuring the organisational integrity in turn.
Employee knowledge
Motivation is of importance to employees in an organisation. Worker morale will be
increased because there will be no need to write down ones credentials as they enters the

10
work premises. Manual data entry will be minimised if not eliminated hence resulting in a
reduced workload. Information that is accurate about the attendance of the employees and
their overtime statistics will be obtained easily hence making the work easier to conduct.
Improved productivity will be the end result because of efficiency, effectiveness and time
saving that will be the end result from the implementation of the system.
Customer value
Efficiency in conducting work is going to be brought by the new system. Clients who come
to offer their services their time will be saved because of not waiting for so long at the gate so
that they get approval from the human resources manager.
Societal value
The system will make sure that the society is well abreast with the technological changes.
The society in general will advance in terms of technology hence this will make sure that
information technology is taught from the grade zero students in order for them to grow up
well acquainted with technology for change.
Supplier value
Those who supply services to the organisation will see a drastic change in the way in which
the new system operates. The system will have a records of suppliers hence there will b no
time wasted trying to get approval from the human resources department, instead the human
resources department will notify the loss control officer so that they know that there is a
supplier on the way.
Channel partner value
Channel partner value will be achieved by the organisation because of this new system. This
will allow the organisation to offer this service on behalf of other organisations hence
increasing their business value in the industry.
Shareholder value
Shareholder value will be increased due to the fact that their investment will be utilised in
terms of productivity. Efficiency and effectiveness will in turn result to increased
productivity. Employees will no longer waste production time at the gate whilst waiting to
clock in.

11
2.3 Feasibility analysis
According to Wolfe (2018) feasibility analysis aims and focuses on fulfilling the systems aim
and objective and identifying the benefits and limitations of the proposed system which will
be uncovered by the research which will be conducted by the developer. Also a forecast on
the tools, equipment and machinery required in order for the system to be developed
successfully is very important. It aims at identifying if the proposed project is of real value or
not. They continue to state that is the project really SMART that is are the objectives going to
be met in a specified timeframe and is the project feasible smart and are the objectives really
attainable or is it just a waste of time and resources.
2.3.1 Technical feasibility
Technical feasibility refers to identifying if the technical aspects involved in the development
of the project are available or not. Orsmond and Cohn (2015) say that its aim or goal is
analysing the available resources technically that is both the hardware and software that is
required in the system development. Also the technical expertise is evaluated to see if it is
feasible enough and will help in the successful development of the system. It also focuses on
identifying whether the required resources needed for the system to be a success are of the
exact quality needed in order to make sure that the need of the organisation is met.
2.3.1.1 Hardware specifications
These are the hardware tools that are needed in the development of the proposed system for
the organisation. The technical aspects of hardware that are required in the successful
development and implementation of the system are found in table 2.1 below:-
Table 2.1 Hardware specifications
Device Specifications
3 laptops For installing the programming language and documentation
1 printer HP115, 8 GB RAM, 64bit computing, core i5, 2,9 GHz
processor
Network cables For the internet

12
2.3.1.2 Software specifications
Software specifications refer to the different software’s that are going to be required dur ing
the development of the software. On table 2.2 there are purposes of each software required
for the development of the proposed system.
Table 2.2 Software specifications
Purpose software
Operating system Windows 8
Documentation Microsoft Office
Database creation MySQL
Writing code php
Software and computer security Antivirus
2.3.1.3 Technical expertise
According to Orsmond and Cohn (2015), technical expertise is the knowhow of software and
hardware aspects by the users of the system. The system developer must be acquitted with the
necessary expertise and software technical aspects that are going to be used meet certain
requirements. The end user of the system being developed that is the employee should have
the knowledge and expertise about using computers. The top management must also be
equipped with the expertise of how the system operates.
2.3.2 Economic feasibility
Economic feasibility sums up the costs which are going to be incurred during development of
the system. it includes carrying out an analysis that is in depth which is future based and
depending on the activities that are going to be conducted and these should not overuse the
resources available says (Wolfe 2018). If the available resources, tools, equipment are of
higher value than the project cost then the project is viewed as economically feasible enough
to be implemented. It also includes comparing the costs, benefit and profits that are going to
be provided by the successful development of the system.

13
2.3.2.1 Benefits
Kleynhans (2016) say that the word benefit refers to the advantages and gains that are got by
the organisation in the successful implementation of the system proposed. These benefits are
what make the proposed system to be economically feasible. The benefits are categorised into
tangible and intangible benefits.
2.3.2.1.1 Tangible benefits
Tangible advantages refer to the merits which are physical in nature says (Kleynhans 2016)
and these include:-
Reduction in the time spent when an employee is clocking in and clocking out at the
organisation workplace.
Elimination of the manual system which consumes a lot of paperwork.
Reduced of time wastage.
2.3.2.1.2 Intangible benefits
These advantages cannot be seen by the physical eye because they are not physical in nature
meaning that they cannot be touched, (Kleynhans 2016). Intangible merits are the opposite of
tangible benefits and these include:-
Fast and simple layered and consistent routines improve worker morale hence
increasing efficiency and productivity
Job satisfaction is improved as hectic tasks are eliminated from the current system
Back up facility ensures that there is no loss of data hence giving room for reference
in the future
Security since data will not be accessed by unauthorised users
2.3.2.2 Costs
Kleynhans (2016) state that costs is the amount or value given to each and every resource or
activity that will be incurred in the development of the system. When developing the system,
there are cost incurred and these include maintenance, development and operational costs.
These costs are incurred when the project has recently started in its first phase.

14
2.3.2.2.1 Tangible costs
They are identified and estimated according to their value. They include:-
Incurred expenses in the system development process.
Conducted staff training sessions
Maintenance expenses
Expenses that were incurred when acquiring software and hardware tools.
2.3.2.2.2 Intangible costs
They are not measured in terms of monetary value.
The delays in starting other activities results in loss of time.
Costs are usually incurred during the transition process that is moving from the old
system to a new system being developed
2.3.2.2.3 Development cost
These are expenses that are met during the whole development of the system that is from the
start to the end.
Table 2.3 development costs
Item Cost estimated
Software 100
Hardware 600
Labour and training sessions 1 000
unexpected expenses 500
Total 2 200
2.3.2.3 Cost benefit analysis (CBA)
Brent (2017) says that a Cost Benefit Analysis roughly estimates the benefits and limitations
that can be encountered during the project. These include the activities which enable the
comparison of the total sum over total gains. The table below that is table 2.4 identifies the
CBA.

15
Table 2.4 cost benefit analysis
Year 1
$
Year 2
$
Year 3
$
Benefits
Tangible benefits
Stationary 150 50 40
Storage space 100 40 30
Intangible benefits
Worker morale (motivation) 400 200 1500
Information availability 150 150 150
Reduction in errors 200 100 100
Quality of decisions made 200 250 270
Total benefits 1200 790 2090
Expenses (costs)
Tangible costs
Development process costs _ _ _
Setup expenses 150 _ _
Operation expenses 200 250 250
Insurance _ 150 100
Intangible costs
Operation commencement delay 100 20 20
Total costs ( 450) (420) (370)
Net benefit / (costs) 750 370 1720

16
2.3.2.4 Return on investment (ROI)
According to Kleynhans (2016), Return on Investment (ROI) is responsible for measuring
the total performance of a project to enable evaluation and analysis of all the available
alternatives to make an appropriate. ROI is determined by the sum of all the benefits that is
attained by adding all the benefits and by dividing them by the sum with the capital total
expense. The Return of Investment percentage identifies the profitability of the project and it
is also referred to as the Average Rate of Return (ARR). The project is feasible enough if the
return of investment is high. It is calculated as follows:
1st year
Return of Investment = (total benefits – total expenses) x 100
Total expenses
= (1 200 – 750) * 100
1 850
= 24%
2nd
year
ROI = (total benefits – total costs) * 100
= (790 - 420) * 100
420
= 88%
3rd
year
ROI = (total benefits – total costs) * 100
Total costs
= (2 090 - 370) * 100
370
= 100%
17
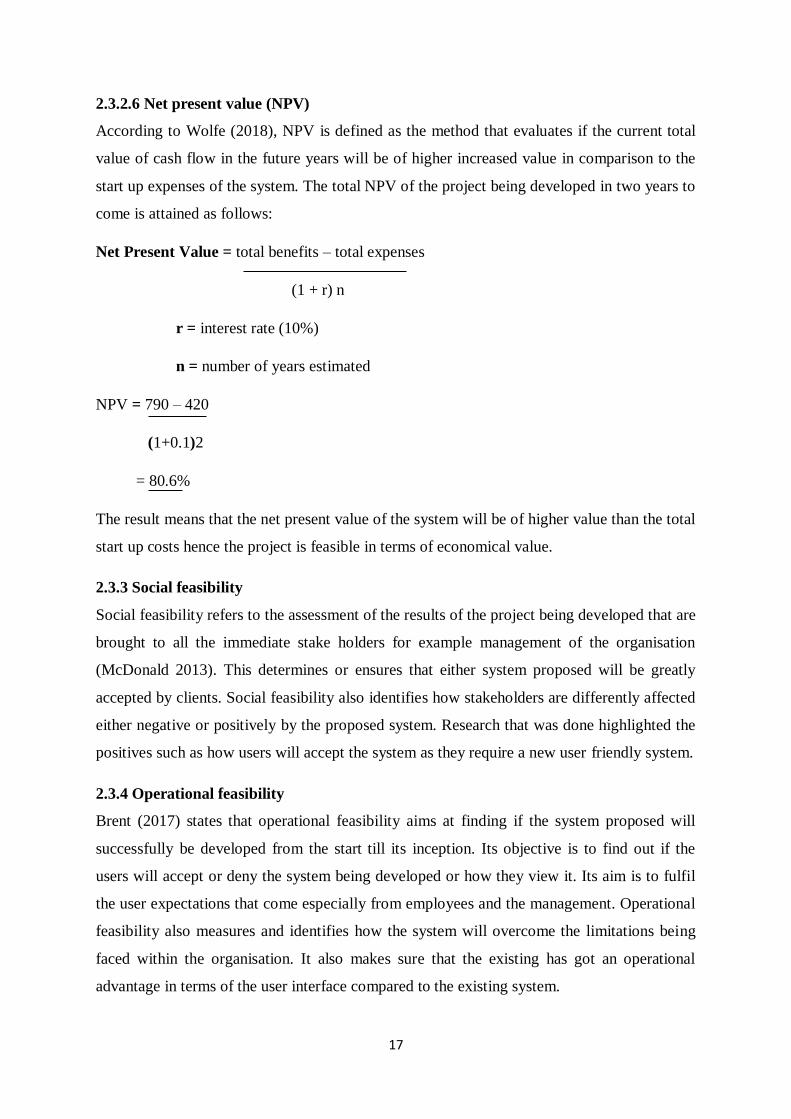
2.3.2.6 Net present value (NPV)
According to Wolfe (2018), NPV is defined as the method that evaluates if the current total
value of cash flow in the future years will be of higher increased value in comparison to the
start up expenses of the system. The total NPV of the project being developed in two years to
come is attained as follows:
Net Present Value = total benefits – total expenses
(1 + r) n
r = interest rate (10%)
n = number of years estimated
NPV = 790 – 420
(1+0.1)2
= 80.6%
The result means that the net present value of the system will be of higher value than the total
start up costs hence the project is feasible in terms of economical value.
2.3.3 Social feasibility
Social feasibility refers to the assessment of the results of the project being developed that are
brought to all the immediate stake holders for example management of the organisation
(McDonald 2013). This determines or ensures that either system proposed will be greatly
accepted by clients. Social feasibility also identifies how stakeholders are differently affected
either negative or positively by the proposed system. Research that was done highlighted the
positives such as how users will accept the system as they require a new user friendly system.
2.3.4 Operational feasibility
Brent (2017) states that operational feasibility aims at finding if the system proposed will
successfully be developed from the start till its inception. Its objective is to find out if the
users will accept or deny the system being developed or how they view it. Its aim is to fulfil
the user expectations that come especially from employees and the management. Operational
feasibility also measures and identifies how the system will overcome the limitations being
faced within the organisation. It also makes sure that the existing has got an operational
advantage in terms of the user interface compared to the existing system.

18
2.4 Risk analysis
Risk analysis refers to the process of finding out any possibilities of errors that may arise
during the system development according to (Brent 2017). Therefore it is of paramount
importance to conduct risk analysis when developing a system in an organisation. These are
risks below that were identified and the counter measures were also found out to ensure
successful implementation without any hiccups.
2.4.1 Technical risk
This occurs when the project fails to meet needs which employees and the top management
need. This can be caused by limitations such as the lack of resources and equipment needed
in general.
Mitigation strategy – the system developer can indulge use from the start until completion
of the project. Users can directly air their opinions and expectations regarding the system
being developed.
2.4.2 Stakeholder risk
Stakeholder usually occurs when the system objectives do not meet with stakeholder needs.
Different types of stakeholders include investors, top management, employees, government
and clients. Investors usually do not want projects which over use the budget as expected and
they may end the project if it does so or pull out the investment.
Mitigation strategy – the developer need to always work in line with the goal and aim of the
system. There is also need to work with the available budget and resources in order to make
sure that they do not overspend.
2.4.3 Economic risk
The issue of cash shortages that is being encountered in the Zimbabwean economy is a great
risk in terms of fear of investment. The cash shortages are a great disadvantage because only
fewer investors can take a chance. This may result in shortage of funds and it may hinder the
development of the system.
Mitigation strategies – the need for contingency planning will be conducted and the
developer has put in place ways of acquiring more funds.

19
2.5 Stakeholder analysis
According to Wolfe (2018), stakeholder analysis refers to an activity of determining the users
of the system and its effects to the users. These effects can be either positive or negative thus
having an effect on users directly or indirectly. The process conducts an analysis on users to
find out how they will respond to the new system. Is used to evaluate or analyse how the
stakeholders will react to the proposed system. The user’s views and evaluations can be used
to conduct alterations. Stakeholder analysis ensures that stakeholder requests are taken into
consideration and make sure that the system fulfils the needs of all stakeholders so that it is
successfully implemented thus the importance of working hand in hand with the users in the
development of the system. The following are the stakeholders of the project:
Employees: uncertainty by most employees usually causes them not to accept change that is
the result of the proposed system. The development of the system can cause employees to be
unsecure in terms of their jobs. This is so because they will feel that their jobs are in danger
because of the system and it has come replace them. Ensuring that employees accept change
is of paramount importance hence conducting training sessions should be done so that
employees are informed on how the new system will work and how it will make their jobs
easier.
Management: Bulawayo power station management thought about giving the proposed
system a try and see if it is really going to benefit the organisation. The proposed system will
bring about an easy way of logging in to the system when employees arrive at work hence
making it easier on keeping a database on the employee’s attendance. Employee workload
would be reduced hence it will be easier to carry out work by the loss control officer thus
motivating employees. It was identified that the project would help in generating overtime
hours of each employee and also helping in identifying absent and late workers.
Suppliers: the suppliers viewed the system as feasible operational because it allows them to
come and offer their services without wasting much time at the entrance writing their address
of work. The suppliers viewed the implementation of the system as a great and noble idea
that will smoothen the flaw of services provided by the organisation.
Stakeholder analysis came with a conclusion that most users agreed to the continued
development of the system since it had more benefits than limitations.

20
2.6 Work plan
A work plan is the process that facilitates the identification of different phases on how the
system will be developed and also determining the time that will be taken to complete the
project according to (Youssef 2011). The electronic attendance system will be developed
with the use of waterfall model. The waterfall model has distinct phases and each phase has
its own deliverables thus it has well defined stages which give room for departmental control
and also easy to plan. The diagram below identifies stages involved in the waterfall model:
Fig 2.1 Waterfall model
Source: waterfall model- Wikipedia
The above waterfall model phases are usually
Planning
Analysis
Design
Implementation
Maintenance
The time schedule drafted below identifies how the project will be completed as per the
activities and processes as shown by table 2.5 below:
Requirement analysis
System design
Implementation
Testing
Deployment
Maintenance

21
Table 2.5 time schedule
Phase Start End Duration (weeks)
Project Proposal 27 June 2017 4 July 2017 1
Introduction 20 August 2017 27 August 2017 1
Planning 28 August 2017 4 October 2017 1
Analysis 1 March 2018 14 March 2018 2
Design 15 March 2018 22 March 2018 1
Implementation 23 March 2018 04 April 2018 2
1st draft 05 April 2018 Ongoing 1 +++
Final documentation 10 April 2018 Ongoing 1+++
A Gantt chart shows how the phases are linear as shown in the following diagram:-
Duration (weeks) 1 2 3 4 5 6 7 8 9 10 11
Proposal of the project
Introduction
Planning
Analysis
Design
Implementation
1st draft
Final documentation
Fig 2.2 Gantt chart
KEY
Number of weeks

22
2.7 Conclusion
The above second chapter of the project conducted an analysis on the business value of ZPC
BPS. Other activities that were carried out in this chapter were feasibility analysis which
aided in seeing whether the project being conducted is economic, social, technical and
operational feasible to continue. Creation of a work plan was done to identify the software
development model which was chosen by the developer and deduct a time plan. Risk analysis
was also conducted in order to identify the possibilities of any uncertainties and come up with
counter solutions. The next chapter is going to be the analysis phase according to the
waterfall model.

23
Chapter 3: Analysis phase
3.1 Introduction
Chapter three according to waterfall model is known as the analysis phase and it focuses
mainly on the existing system in order to enable in identifying the limitations, (Youssef
2011). The limitations were drawn from the gathering of information through the use of
different techniques which included interviews, observations and questionnaires. A context
and data flow diagram of the existing system will be drawn up in order for the developer to
get an understanding of the flow of data of the current system. This will also help the
developer to conduct a requirement analysis that will enable in identifying the functionalities
of the system being developed.
3.2 Information gathering methodologies
These are techniques used to gather information according to (Eid 2015). For one to gain an
in-depth knowledge of the existing system and come up with its limitations there is need to
conduct research. The developer carried out all the different gathering methodologies in order
to gain the correct information and they were:
Interviews
Observations
Questionnaires
3.2.1 Interviews
Eid (2015) states that it refers to the process whereby the interviewee that is the one asking
questions asks the respondents a series of questions in a conversation manner setting with the
aim of getting information from the questions being asked. Interviews are classified into
structured and unstructured interviews.
Structured interviews
Questions are asked by the interviewee in an orderly manner and must not deviate
from the line of questions.
The interview questions are well planned in advance prior to the day of the interview
The set of asked questions are uniform

24
Unstructured interviews
Unstructured interviews are also referred to an interview that is not formal
It is the opposite of structured interviews
They include questions that are open ended and they are usually asked in a manner
that is random
Group interviews
The interviewee asks questions to a group of people not individually.
The people being interviewed must be grouped and asked as a group and that’s what
the interviewee did.
Interview used
After an in depth analysis and evaluation of the interview methods, structured interview was
decided upon by the developer. A sample of ten employees was interviewed and these
employees were selected randomly across all the departments since all of the employees use
the current system. These types of interviews and interview questions were planned prior
before the day of the interview in order to ensure that the interviewee did not ask unnecessary
questions. Structured interviews are all similar and they are close to accurateness though they
have got their own limitations. Most employees showed concern regarding the current system
and they were not satisfied with it.
Benefits
They were very close to accurateness because some of the questions did not require
explanations only on word that is either a yes or a no
Some of the interviewees were able to highlight their concerns and speak their minds
due to the fact that it was a group interview.
A better understanding of the current system was gained by the developer since they
were in a position to keeping asking until they felt that they have got all the answers
they require.
Flexibility was a result because the person conducting the interviews could also add
their questions which they felt that they should also ask hence helping the developer
in analysing and evaluating the current system
Group interviews gave room to each and every employee to participate in the process
because of the group interviews thus they were very time consuming.

25
The process of analysing and evaluating the results obtained was very easy because it
required less effort to summarise the results which included a one word answer that is
a yes or a no
Biased information was limited because first hand information was obtained by the
developer
Limitations
Some of the employees did not collaborate and they were very reluctant to participate
It was expensive due to constant meetings were being conducted most of the time by
the interviewee so that they could obtain the necessary.
The developer required some skills needed when conducting an interview in some
cases so that one knows what to do in some situations for example when the
respondent is bored.
Good communication skills were required by the developer to ensure that they acquire
the information in a correct way without boring the interviewees.
Results obtained
Structured interviews aided the interviewer to get important information of the existing
system. Most of the users of the existing system showed concern about the ineffectiveness of
the system being used. They raised concern about the need of acquiring a new system that is
user friendly. The current ordering system was also time consuming because employees had
to spend more time at the gate for them to clock in at morning due to long queues since all
workers will be coming to work.
3.2.2 Observations
According to Eid (2015), observation refers to an inspection, the monitoring or the viewing
which one conducts a certain activity sing surveillance cameras or watching. The types of
observations which were conducted involved participatory and non-participatory
observations.
Participatory observations
A participatory observations occurs or refers to the process whereby the one conducting the
observation becomes part of a group being monitored hence limiting the chances of acquiring
biased information says (Linman 2011). This includes the total participation of the one
conducting the observation to be part of every activity that must be monitored on a daily basis

26
for some short period of time. The developer was able to take a closer look at ZPC BPS for a
few days. The aim of the observation was to identify how the employees clock in and clock
out, how the clock in process is conducted and how long does it take for each employee to
clock in manually, how they track their employee overtime records and how the loss control
officer manages to cope when there are many employees clocking in especially at peak hours.
The observer was in a position to acquire the details that were needed.
Non participatory observations
It is referred to as a direct observation. Eid (2015) says that a non-participatory observation
refers to the process were an observer closely monitors the activities without having any
interaction with the employees being observed. Room for interaction is allowed but it’s
limited. Also the people being observed must not know anything. The one monitoring the
activities views the activities from a distance without anyone getting suspicious of the
activities taking place and records the findings. Direct monitoring aided the observer to
obtain profound and an understanding of the clock in system at ZPC Bulawayo.
Type of observation used
The developer decided to use non participatory observations. The developer closely
monitored the process of employees clocking in at the work station without making the
employees un secure or notice an unfamiliar behaviour. This was conducted the whole week
in order to try and find the correct information and the behaviour of employees.
Benefits
Observation proved to be useful because it helped in answering the unanswered
questions which were part of the interview questions especially disadvantages of the
existing system
obtaining biased information was limited since not even a single employee was aware
of the process
observations helped the observer to get answers from activities which were difficult
for employees to explain during interview sessions
observations proved to be less costly than interviews because there was no need to
acquire a lot of resources
Necessary and important data was acquired since the developer was involved in the
observation process.

27
Limitations
For the successful observation analysis, the developer had to observe for a longer
period thus being very time consuming
some of the activities that were being carried out were difficult to analyse and
evaluate hence personal commitment by the observer was required for it to be
successful
if the targeted group by any chance noticed the activities that were taking place,
chances of the respondents acting otherwise is very high and this might have led to
inappropriate information being obtained.
Results obtained
The developer found out that every morning there were long queues when employees
reported for work and wanted to clock in. Some employees passed by the queue without
clocking in due to the long queues. The response of the users to the system was very poor and
this highlighted that the existing system was not very efficient and effective.
3.2.3 Document review
Another method of data gathering which was used is document review. The developer took a
closer look and analysed important documents of the organisation which they use to record
clock in times due to the fact they use an attendance system which is manual. The developer
was in a position to evaluate employee clock in time, employee clock out time, employee
overtime, current reports, employee absenteeism rate and recorded past and current employee
attendance which were closely analysed.
Benefits
the developer was able to gather first-hand information because sources such as
reports were being used and as such there was no bias
it was less costly because of the use of the organisations past and current reports and
records
Limitations
the process to evaluate the reports and come to a decision was very hard because of
the many books and records

28
other documents and reports where not found hence the difficulties were encountered
when trying to validate the available information and trends
Document review findings
The process of coming up with an analysis of the overtime statistics was a hard
process to conduct since the existing system is a manual one; as such it was not easy
to track the database of the employees and that of overtime statistics.
Standardised and systematic processes were not available, clock in and clock out
records were not recorded in a pattern manner as such this resulted in difficulties of
coming up with a report or conclusion.
Loopholes in the clock in system were found out since the existing attendance
management process did not have a smooth flow of processes.
A review conducted by the developer on available documents helped in coming with a
good evaluation because of the credibility of the records being used and this made it
easier to create a Data Flow Diagram (DFD) of the existing system.
3.2.4 Questionnaires
According to Linman (2011), a questionnaire is a technique also used to gather data and here
the respondents are given questions on sheets of paper and they have to answer on the spaces
available and they are supposed to submit them before the due date stated. Questionnaires can
also include one word answers such as yes or no and open questions which may need an
explanation. Different types of questionnaire were used and these are as follows:
format questionnaire
closed format questionnaire
Open format questionnaire
Open format questionnaires are referred to as open ended questionnaires since they allow
respondents to freely highlight their opinions and explanation in their own manner. The
respondent is able to respond in their own way and according to their understanding.
Closed format questionnaires
Linman (2011) says that closed format questionnaires refer to a technique that includes
questions which do not allow respondents to explain in detail and they are limited to a yes or
a no or true or false.

29
Type of questionnaire used
The developer decided to use closed format questionnaires. The developer obtained data
which most of it showed that the employees were not happy with the system. The system was
being under rated. They aided the developer to get the required data and the process of
analysing the data was easy due to the fact that the answers were limited to one word answers
were users ticked the correct answer.
Benefits
It was a bit easier to analyse the questionnaires due to the use of the closed technique
which did not allow users to elaborate further.
Anonymity helped respondents in freely answering questions and as such there was
no bias.
Time to respond to the questionnaires was given to the respondents hence they were
able to respond correctly expressing their views.
The process was not hard as there was no need for interview skills needed required
There was no time wasted in evaluating the questionnaires and coming up with a
report or a conclusion.
Limitations
Other questionnaires were partly answered hence it was difficult to come up with
statistics when evaluating the data.
Omissions to other questions were identified due to the lack of clarity in some
questions.
An interpretation of other questions was not what the developer intended asking hence
results were not correct.
It was a long process to analyse the data that was obtained and come up with
conclusions.
Other questionnaires were not submitted back and others were torn apart or spoiled
hence making it difficult to evaluate the data on them.

30
Results obtained
The developer was able to acquire data which was difficult to get through interviews hence
anonymity helped in a great way. Respondents freely expressed themselves due to anonymity
thus resulting in data about the disadvantages of the existing system being obtained.
Respondents also showed concerned about the time wasted with the existing system.
The developer was able to acquire the data which was very important and necessary in the
development of the DFD and the context diagram.
3.3 Analysis of the current system
Zimbabwe Power Company is currently using a manual system in all the power stations and
these are Harare power station, Hwange power station, Munyati power station and Bulawayo
power station when employees are clocking in. If an employee arrives at the entrance the loss
control officer requests for an organisational ID. The loss control officer then checks the
department were the employee works under on the ID of the employee. The loss control
officer then looks for the book written the department name. Each department has its own
book where employees record their clock in times. After the employee records his/her clock
in time, it is then accounted for and recorded by the loss control officer. The employee then
clock outs when they leave the organisation stating their time of departure. Visitors also
produce their national IDs when they visit the organisation and they leave it at the entrance
with the loss control officer. The loss control officer then notifies the department where the
visitor is looking for and then clock outs when they leave the organisation.
3.4 Process analysis
Grossmann and Rinderle-Ma (2015) process analysis refers to the methods which are being
conducted by the system developers and these processes are the ones which determine how
the system will operate. It also determines how the data will flow in the system including
identifying the activities conducted. The processes of the current system include:
Inputs
Employee details
Employee station number
Visitor details

31
Processes
Clock in time
Overtime processing
Employee tracking
Clock out time
Output
Employee register
Visitor register
3.4.1 Activity diagram of the current system
An activity diagram is a diagram which represents a linear or chronological way in which
activities are conducted in the system according to Shelly and Rosenblatt (2012). It helps the
programmer to refer to the current system and come up with new and easier way of
conducting activities. It is easier to study how the existing system operates. The diagram
below represents an activity diagram of the existing system.

32
Yes
No Yes
No
Fig 3.1 Activity diagram
Key
- start or end of an activity
- represents processes that change input to output
Start
Enquiry from the loss
control officer
Is it a
visitor
?
Does the
visitor
want to
clock in?
Record visitor to the
visitors register
Clock in the
employee
Process the record
Employee or visitor
clock out
Finish

33
- represents a decision that makes the activities flow
- represents the flow of the data
3.5 Data analysis
This is a logic method for evaluating and carrying out an analysis of the data. These methods
are:
Context diagram
Data flow diagram.
3.5.1 Context diagram
Grossmann and Rinderle-Ma (2015) says that a context diagram is referred to either a level 0
DFD or the context level DFD responsible for highlighting the interaction of the existing
system with external parties. The diagram below shows the current system context diagram.
It helps in identifying the boundaries of the system being modelled and identifying the
relationship between the internal and external entities. In order to come up with a context
diagram the developer needs to interact with the users in order to come up with the current
activities of the existing system. The diagram below shows the context diagram of the
existing system.

34
Employee details
Clock in time
Overtime employee details
Clock in time
Employee total hours worked visitor clock out time
Overtime hour’s
visitor details clock out time
Clock in time
Fig 3.2 Context diagram of the existing system
Key
- Entities
- shows flow of data
- represents the system
Employee Loss control
officer
Attendance
management
system
Human resources Visitor

35
3.5.2 Data flow diagram of the current system
Clock in 01 employee details
D1 employee
Clock in enquiry clock in details
details clock in details
D2 clock in
Clock in details clock in details visitor details
Clock in
Department department name
D4 human resource
Identify department
Clock in completed
Fig 3.4 DFD of the current system
Key
Flow of data
Entity
Employee/
visitor Clock in
enquiry
Loss control officer
Clock in
generation
Department
identification Human
resources
Process clock
in
Clock in done
D3
1
2
3
4
5

36
Processes
Data store
The diagram above highlights how the data flows in the current system. It shows how
entities, processes and the database interact together in order to produce output according to
the activities.
3.6 Weaknesses of the current system
1. The existing system needs users that is the employees to try and write the correct data
when clocking in. as such it is very difficult in most cases as employees that will be
clocking in would be many at peak hours hence the loss control officer the loss
control officer will be under pressure to try and reduce congestion at the entrance.
2. Inconsistency is the result because of the manual data entry system. Thus a lot of
mistakes occur when clocking in or clocking out an employee and this may lead to a
lot of difficulties when making reports.
3. It is very time consuming when tracking records because a lot of books are used thus
making it take a lot of time when analysing the data to produce a report.
4. It is very costly to conduct monthly or yearend reports since it takes a lot of time and
resources to produce a report for a year because of a lot of paperwork
5. There is need to recheck details that have been recorded to reduce the number of
errors made
6. There is usually a tendency of repeating or writing data or details which are already
there for example names, department name etc.
7. Security is always a problem. Any user which is not authorised to have access to the
documents of the current system can have access as the records are not strongly
protected. The records can be destroyed by a fire, rains or stolen as such it is always
difficult to have a backup facility for recovery when using a manual system.
3.7 Evaluating alternatives
There was need for the developer of the system to explain and analyse why other alternatives
such as outsourcing or in-house development were not taken into consideration during the
feasibility analysis.
37
3.7.1 Improvement
Muhammad, Matias and Markku (2010) say that improvement of the existing system is when
only certain functionalities or processes which are not being provided by the current system
are added to the system. This is also known as upgrading thus integrating new functionalities
with the existing system. This method was not implemented because of:
The difficulties of upgrading the manual existing system. in this case there is need to
develop a completely new computerised system in order to make the organisation
advance in terms of technology and move up with the changing times
Maintenance costs of the system upgraded were going to increase and constantly
required because of more errors and problems that may continue to hinder the manual
attendance management system
3.7.2 Outsourcing
Outsourcing refers to the process were a part of a system or the whole system is acquired
from outside the organisation and the developer just implements the system developed by
external developers according to (Muhammad et al 2010). They continue to say that the
system is not developed by developers within the organisation; they are only taught how the
system works. The developer of the system did not outsource the system because it was very
costly to purchase the system and not feasible enough. Also there were not enough resources.
The reasons for not outsourcing are:
The need for technical experts will be required to train the organisational employees
also resulting in increased costs
Maintenance expenses in years in years to come will also be high because there will
be need to outsource the service from those developers of the system to come and
conduct the maintenance process of the system.
The system outsourced may not meet the user requirements because the developer
may not have a clear insight of what the employees really require or expect
Also there is a possibility of the system not solving the current problems that are
being brought because of the existing manual system being used in the organisation
There might be the need to modify the outsourced system hence increasing costs.
3.7.3 In-house development
According to Muhammad et al (2010) it refers to the process where the whole system or part
of the system is developed within the organisation by the employees. This is the total

38
opposite of outsourcing because everything or every process in the development is done
internally within the organisation. This development method was chosen because of:
It is a method were a system that meets the user expectations and needs can be
developed because of an in-depth knowledge of the developer on how things are done
within the organisation
Communication between the developer and employees can result in problem solving
because employees can form part of the development team hence they can be able to
air their views and grievances about the system being developed.
Ownership of the system can be claimed by the organisation because they are the ones
who would have developed it as compare to outsourcing were the organisation does
not gain ownership of the system
Less costs are incurred because of the availability of most of the resources in the
organisation
Labour costs are minimum because all the employees are from within the organisation
There is a direct link of the system being developed because the developers have the
knowledge of what needs to be done and otherwise
3.8 Requirement analysis
According to Adam and Kevin (2015) requirement analysis is the process of identifying user
requirements of the system being developed. In order to be able to determine the user
expectations there should be communication between the development team and the end
users of the system.
3.8.1 Functional requirements
According to Adam and Kevin (2015), it refers to the process which identifies all the
activities that a system should conduct or fulfil. These include
Accessibility of the system
Should alert the user that the current activity that they have been doing has been
completed for example having a pop up message when the employee have
successfully clocked in to the system
There should be a facility that enables employees to edit the data anytime so that it is
always up-to-date
It should be a system that is secured enough in order to make sure that only
authorised users can have and encryption should be put as a measure to secure data

39
As soon as the user clocks in or edits the user profile, there should be changes
instantly as per the activity conducted
The system should give room for accountability and be easy to track records so that
it is easier to deduce a report
3.8.2 Non-functional requirements
It refers to the functionalities that are integrated with the system in order to ensure that it
meets user expectations and requirements according to Adam and Kevin (2015). These
include
Privacy – the system should ensure that users are given room to conduct their
activities privately. An employee should not be able to log in onto another
employee’s profile. Each employee should have their unique details and user
accounts
Data backup – if there is a hiccup in the in the system’s processes such as data being
lost, deleted or tempered with inappropriately, the IT department must be able to
recover that data or it must be obtained from the back up facility
Error handling – when there is an error, it should not affect or hinder other
operational activities being conducted by other employees. The system should
ensure virtual operational accessibility
User interface – the system must easier for users to work with especially those who
do not have much knowledge for example the interface must have easy navigation
bars
Security – encryption methods should be injected into the system in order to ensure
that the system is very much protected and not all users can have access to the
system
3.9 Conclusion
The chapter highlighted how the developer gathered information and explained all the
methods used for gathering information. The logical flow diagram and the context diagram
were drawn up so that there is a clear view on how the existing system operates. Diagrams
such as the activity diagram were created in order to see all the processes that are conducted
in the system. Alternatives used for developing the system where also explained and why in
house development was chosen.

40
Chapter 4: Design phase
4.1 Introduction
The phase shows how the system is going to function and it identifies all the processes of the
system being developed. Also, the software and hardware interaction and how they are going
to be integrated will be explained in detail. Context diagram and the data flow diagram will
be designed in order to identify how the processes and data will flow in the system. The
interface design of the will also be designed and all the tables in the system will be identified.
An entity relationship diagram and an enhanced entity relationship diagram will be drawn in
order to identify entities and their relationships. This chapter in general will explain in detail
how the system will work and all the activities will be explained in further detail.
4.2 System Design
According to Mark and Levin (2015).It is the process which identifies the systems
architecture, its components, modules, interface and all the requirements which are needed
for the system to be a success thus meeting its aims and goals highlighted in the first chapter.
This process also includes the identification of data and the input processes of the system in
detail. This enables in identifying that the system being developed is going to meet the user
expectations and needs. System design ensures that system being developed will in the future
be modifiable or allow alterations to continue to be made in order to ensure the system
continue to be usable according to dynamic changes in technology says Claudius (2014). This
helps to develop a system that effectively and efficiently responds to the user requirements
and produce the desired output. Security is another objective of system design in order to
protect the organisations data and ensure that it is secured for privacy.
The system will aid and have a platform which allows the administrator to add employees to
the database or to edit or delete the employee. The system will ensure easy clock in and clock
out of users into and out of the organisation. The time will be determined automatically y the
system. The activity will be processed and stored by the system. After the process is
complete, a pop up message will appear with the conformation of the activity which has been
completed. The system will be very effective in that all employees will be able to clock in
much easily and hence making it easier to track records and reports of the employee
attendance. Privacy will be enhanced since employees have different user names and for an
employee to be able to clock in they should have a username and password. Security will be
ensured because of unique passwords with strong requirements.

41
4.2.1 Context diagram
Wiegers (2017) says that a context diagram is a tool that shows the relationship that a system
has with other entities especially external entities for example databases. It is also known as a
scope model, a context level DFD or level O DFD. It involves activities that explain every
process and also explain how the system receive and send information between its entities.
The diagram below is the context diagram of the system.
Clock out time overtime details
Clock in time clock out time
Clock in time
Employee details employee details
Employee details
Overtime details
Department name
Fig 4.1 Context diagram
Key
Data flow
Entity
4.2.2 Data flow diagram
A DFD helps in mapping the flow of data or information in a system according to Jens,
Lienig and Hans Bruemmer (2017).It helps in providing a diagrammatically architecture of
how the system operates and it is very easier to analyse and understand the activities.
Employee attendance
management system
Employee Loss control officer
Human resources

42
Claudius (2014) also says that a DFD identifies how the data is processed in a system. It
identifies how the data is transmitted from the entity to the data store and how the output is
generated. The order in which activities and processes should occur is also provided or shown
in the DFD.
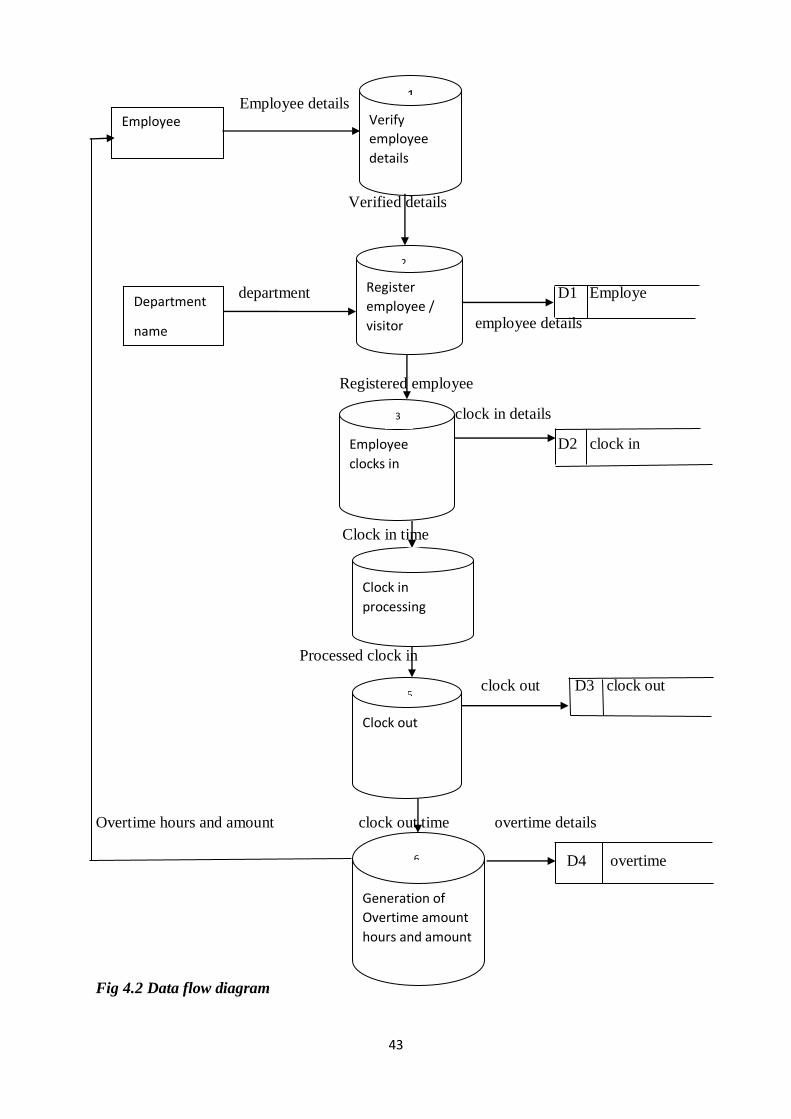
43
Employee details 11
Verified details
department D1 Employe
employee details
Registered employee
clock in details
D2 clock in
Clock in time
Processed clock in
clock out D3 clock out
Overtime hours and amount clock out time overtime details
D4 overtime
Fig 4.2 Data flow diagram
Employee Verify
employee
details
Employee
clocks in
Register
employee /
visitor
Clock in
processing
Clock out
Generation of
Overtime amount
hours and amount
Department
name
1
2
3
4
5
6

44
Key
Flow of data
Entity
Processes
Data store
4.3 Architectural design
Scammel and Umanath (2017) defines architectural design as the “process that encompasses
the components of a system structure and unifies them into a coherent and functional whole
according to a particular approach in achieving the objectives under the given constraints or
limitations. Each project is unique in its own way hence the architectural design differs
according to the functionalities of the system. Below are the components of the architectural
design of the industrial attendance management system.
Network cables – used to connect two or more devices in order to facilitate the
sharing of resources for example printer. They will help in transferring information or
data between devices in a Local area network or in a wider area network.
Client – this is the computer that is used to access he services that will be made
available by the server. It will be used to connect and get access to the resources of a
remote computer in a network.
Printer – it will be used to produce reports since it is an output device and it
produces a hardcopy of data stored in an electronic device such a computer.
Server – it will be used to process request and send data to another device via the
internet on a Local area network
The diagram below shows the client server architecture.

45
Fig 4.3 Client server architecture
Source: client server model-Wikipedia
The diagram below shows the network architecture design of the industrial attendance
management system.
Fig 4.4 Network architecture design
Source: conceptdraw.com
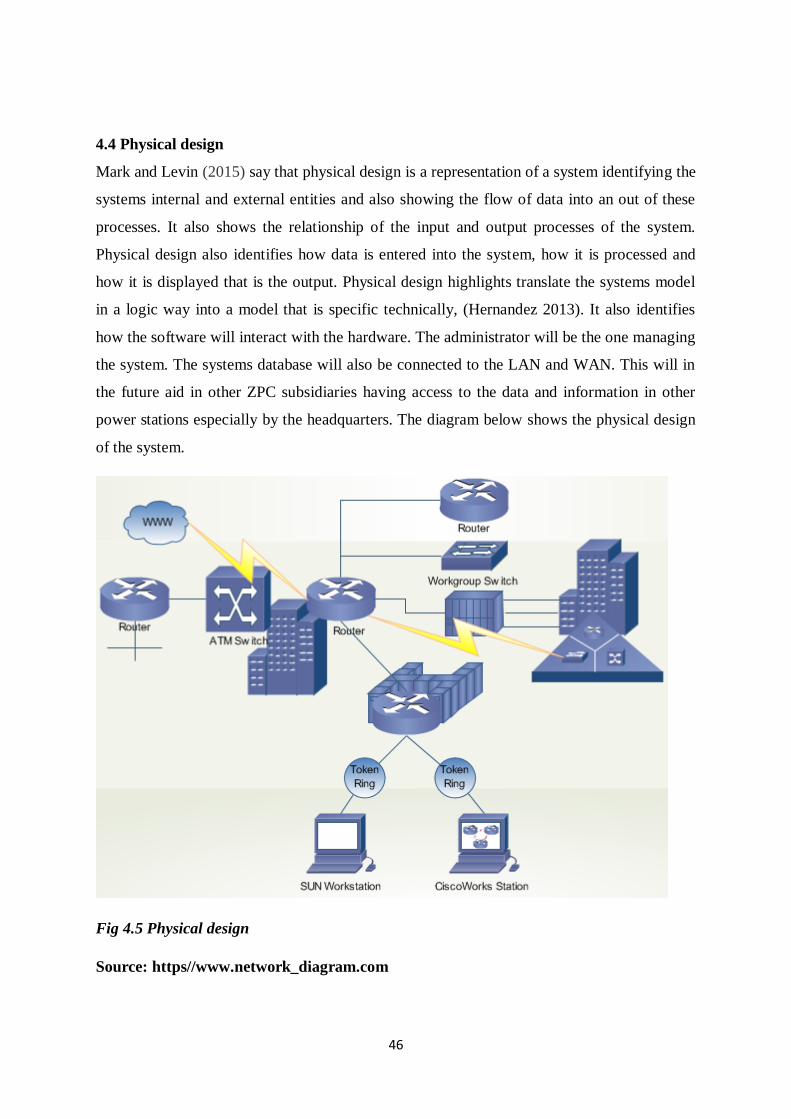
46
4.4 Physical design
Mark and Levin (2015) say that physical design is a representation of a system identifying the
systems internal and external entities and also showing the flow of data into an out of these
processes. It also shows the relationship of the input and output processes of the system.
Physical design also identifies how data is entered into the system, how it is processed and
how it is displayed that is the output. Physical design highlights translate the systems model
in a logic way into a model that is specific technically, (Hernandez 2013). It also identifies
how the software will interact with the hardware. The administrator will be the one managing
the system. The systems database will also be connected to the LAN and WAN. This will in
the future aid in other ZPC subsidiaries having access to the data and information in other
power stations especially by the headquarters. The diagram below shows the physical design
of the system.
Fig 4.5 Physical design
Source: https//www.network_diagram.com

47
4.4.1 Hardware requirements
Printer
Network cable
PC or desktop computer
Switches
Routers
4.4.2 Software requirements
Operating system that is windows 8 or 8.1
Microsoft office
Google chrome
MySQL
Windows defender
Dreamweaver
4.5 Database design
Database design is the process which identifies how data is presented in the database,
(Hernandez 2013). The database is the one that manages data hence resulting in a fast
retrieval and storage process of data in the database. The process is successful because of the
availability of the database management system and has MySQL. A database management
system helps in maintaining and the creation of the database. It ensures that there is data
normalisation that is first normal forma, second normal form etc., integrity of data and
security.
4.5.1 Reasons for using database management system
Validation is always ensured because data is always checked before being entered in
the database hence data is always consistent
Costs of labour and resources are always reduced because data is combined into a
database which is single
Data redundancy is reduced if not eliminated because of file integration
Accurateness of data is ensured because the database ensures that data which is being
stored is correct and valid and it is achieved through the use of integrity constraints
Data stored is secured because unauthorised users do not have the ability to access the
database since it is secured through the use of encryption, passwords and unique
usernames.

48
Multiple users can have access to the database at the same time without disturbing or
affecting other users.
4.5.2 Architectural view of the database design
Hernandez (2013) says that architectural design refers to the way in which data is presented
and this is done through the use of database layers. The layers are referred to as database
schemas and they form part of the database design. The layers of the database are:
External layer
Conceptual layer
Physical layer
Internal layer
Below is the diagram that highlights the architectural view of the database diagrammatically
Fig 4.6 Ansi sparc diagram
Source: https://www//Ansi_sparc_achitecture.org

49
External view
According to Scammel and Umanath (2017), the external view of the database is where end
users can have access and can also interact with the system. The external view has got many
views which are different in the database that is one user is allocated a single view. This
enables the user to have access to the data they need freely without inconveniencing other
users since they have got different views. Data abstraction is also represented on this level.
Conceptual level
It is known also as community view. The conceptual view takes a holistic representation of
data and it is an overview of the database. Claudius (2014) says that it shows how the
database was logically structured. It identifies the relationship between the members of the
database. The level identifies the relationship between members of the database. The
conceptual level also shows exactly the data stored in the database and what the use will
require in order to use it. It also acts as an intermediary between the external and internal
level of the ansi sparc. The complexity of the database is hidden here and how the data is
actually stored. The level is only modified by the administrator since all the operational
activities are conducted on the conceptual view.
Internal level
The internal level highlights the physical representation of the data. It is the lowest level of
the ansi sparc architecture. According to Hernandez (2013), the level is concerned about how
the data stored in the database will be presented to the end user. Also how data is organised
and stored is conducted in this level. This level is very essential and, most important part of
the model. Data is stored in the database by firstly identifying the following factors and these
are:
Correct space allocation technique
Data compression technique
Security
Data encryption
Retrieval of data
This ensures that data uses storage space that is minimal.

50
4.5.3 Database tables
Database tables are also known as relational databases. A database table consists of data that
is related and is kept in a database, Hernandez (2013). This is where data in the database is
stored hence the importance of the database tables. A database is made up of a single or more
tables. These tables are made up of a row and a column.
Table 4.1: Table employee
Attributes Data types
Email Varchar
Password Varchar
Name Varchar
Surname Varchar
Designation Varchar
Table 4.2: Table department
Attributes Data type
Department name Varchar
Table 4.3: Table clock in
Attributes Data types
Time date
Date Date
Email Varchar

51
Table 4.4: Table clock out
Attributes Data types
Time date
Date date
Email Varchar
4.5.4 Enhanced Entity Relationship Diagram
It is also known as an extended ER model since they are similar to ER diagrams. According
to Claudius (2014), EER diagrams represent complex databases with complex requirements.
It represents diagrammatically the super and sub classes, generalisation and specialisation,
aggregation, category and union attribute and relationship inheritance.
Super types –it consist of a single or more subtypes
Subtypes – belong to a sub group of entities with unique attributes
Generalisation – it is defined by a general entity type from a collection of
specialised entity types
Specialisation – it defines the sub type of the super type and determines the
relationship between the two
Disjointness constraints – a super type instance maybe a member of 2 or more
subtypes at the same time.
Completeness constraints – an entity in a super type must belong to a sub class.

52
Fig 4.7 Enhanced entity relationship diagram
Key
-The flow of information
- represents the entity
- - represents the relationship
- - represents the attributes
4.6 Program design
According to McGuirre (2016), program design is the way or method that an organisation
uses to come up or develop an application. The waterfall model includes the program design
under the system design of the project. It highlights the specifications of what the system
should fulfil. Plain language is used when writing the design of a program or system. This is
done before coding takes place in order to understand and identify the flow of activity. It is

53
conducted by the use of class diagrams, package diagrams and sequence or collaboration
diagrams.
4.6.1 Package diagram
Scammel and Umanath (2017) state that a package diagram is structured architectural
diagrams that show relationships between objects and packages. They also represent a
namespace. They identify all the multiple views of a system for example multi tiered model.
The package diagram also helps in simplifying the complexity of class diagrams. The
diagram below shows a package diagram of the industrial attendance management system in
understandable terms.
Fig 4.8 Package diagram of the industrial attendance management system
4.6.2 Class diagrams
According to Seidl, Scholz, Huemer and Kappel (2015), class diagrams are used when
illustrating data models regardless of the simplicity or complexity of the system. Class
diagrams are a type of UML that is Unified Modelling Language. They are also known as
static diagrams. Class diagrams help in the creation and construction of code for the system.
Employee details
ADMINISTRATOR
Clock in details
Clock out details
PHP
MySQL
Dream weaver
DATABASE
MANAGEMENT
SYSTEM

54
They help in identifying the constraints that can be found in the system. The purpose of class
diagrams are as follows:
Reverse and forward engineering
Identify objectives of a system
Design and analyse the static view of an application.
Class diagrams are the mostly used in UML diagrams when modelling object oriented
systems.

55
1 … m
------------Overlap------------------------ 1 … m
m…m
m … m 1 …m
Fig 4.9 Class diagrams
4.6.3 Sequence diagrams
According to Seidl et al (2015), sequence diagrams are used to model systems in a dynamic
format. Sequence diagrams also fall under UML. A sequence diagram interacts with all
Employee
Id <PK>
email: Varchar
name: Varchar
surname: Varchar
Add employee details
edit employee details
delete employee details
Department
name: <PK>
edit department details
delete details
Attachee Contractor Permanent
Station
number<PK>
Add or delete
details
Clock in
Email<PK>
date: Varchar
time: Varchar
Delete clock in
details
Clock out
Email<PK>
date: Varchar
time: Varchar
Delete clock out
details

56
objects of the system. It helps in making it easier to understand the processes involved
diagrammatically. They are also used for analysis and design of the system. They identify the
behaviour of objects and classes. They act as a platform used to visualise and validate errors
as they occur. The benefits of sequence diagrams are as follows:
Use case details are presented through the use of sequences
Functions and operations of classes and objects are modelled
They identify the interaction of objects and their relationships
Source:
Fig4.10 Sequence diagrams
4.7 Interface design
According to Shelly and Rosenblatt (2012), interface design refers to the phases that are
undertaken when developing a system such as the web page design, software applications and
devices which will be used for communication such as computers with a goal of ensuring
interaction between users. Interface design enables users to interact with the system or the
software application. It ensures effective and efficient interaction between users and the
application.

57
Tidwell (2011) also says that interface design is a continuous process in which commands are
in phases and are known. The user must be familiar with the commands in order to enable
easy communication with the application. Hence developers must develop a system that gives
room for user involvement in order to ensure that user needs are met. Interfaces must be user
friendly. Training costs are reduced if a good interface is developed thus making sure that
there will be no need for user manuals. The structure of the program is highlighted by
identifying the input and output of the system.
4.7.1 Menu design
According to Tidwell (2011) a menu design is the interface that pops up or a web page that
appears firstly when a user accesses the program or application. The diagram below identifies
the menu design of the system.
Fig 4.11 Menu design of the system
4.7.2 Input design
Input design is an intermediary between the system and it users, (Scammel and Umanath
2017). It focuses on the identification of the necessary input required, control of errors,
avoiding any delays due to problems that may arise and minimising the processes or phases
that are undertaken when accepting input to the system.
Tidwell (2011) also says that input design includes input forms. The input forms enable easy
capturing of data into the system. The duty of the administrator will be to add users to the
system and to manage it. The database will be the one responsible for storing data and
ZPC BPS LOGO
ZIMBABWE POWER COMPANY BULAWAYO POWER STATION INDUSTRIAL
ATTENDANCE MANAGEMENT SYSTEM
Sign in below!
About this system ! SIGN UP
Email Password
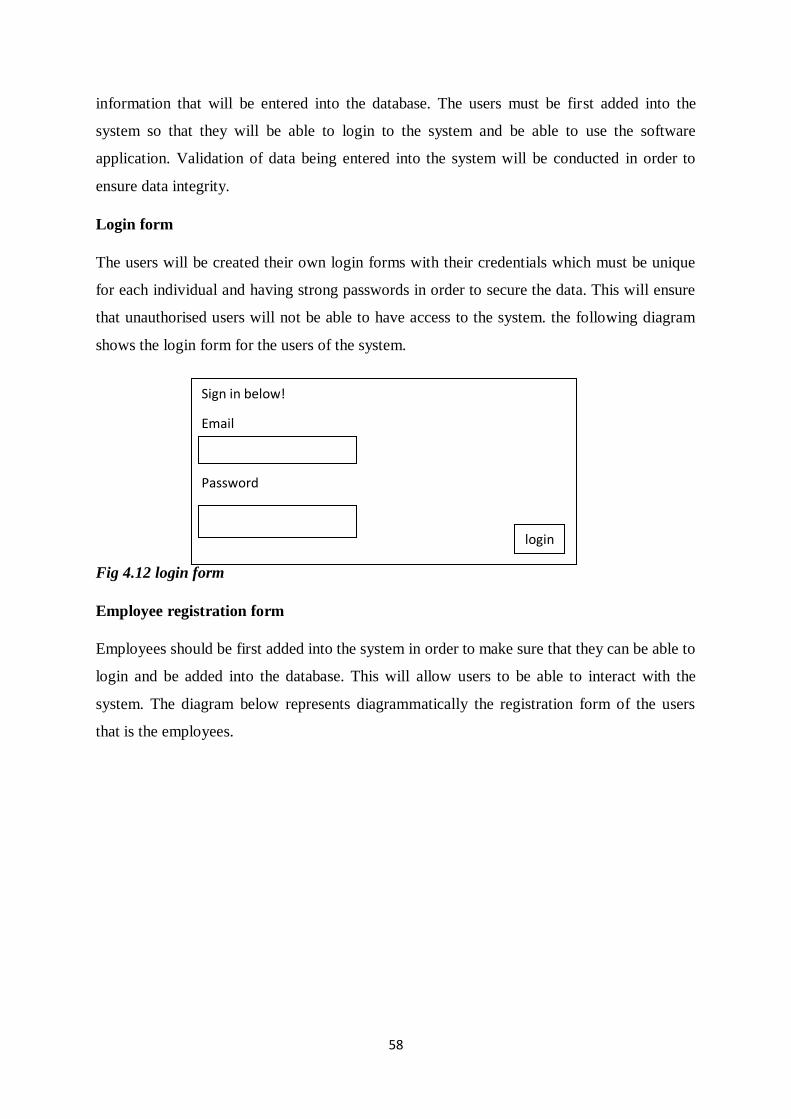
58
information that will be entered into the database. The users must be first added into the
system so that they will be able to login to the system and be able to use the software
application. Validation of data being entered into the system will be conducted in order to
ensure data integrity.
Login form
The users will be created their own login forms with their credentials which must be unique
for each individual and having strong passwords in order to secure the data. This will ensure
that unauthorised users will not be able to have access to the system. the following diagram
shows the login form for the users of the system.
Fig 4.12 login form
Employee registration form
Employees should be first added into the system in order to make sure that they can be able to
login and be added into the database. This will allow users to be able to interact with the
system. The diagram below represents diagrammatically the registration form of the users
that is the employees.
Sign in below!
Password
login

59
Fig 4.13 Registration form
Clock in form
The clock in form is where the employees clock in or indicate their time of arrival at the work
station.
Sign in Below!
First name
Last name
--Select Department--
Designation
Password
Confirm Password
Register here
Powered by Prisca
Login

60
Fig 4.14 Clock in form
Clock out form
The clock out form is where employees enter the details and time of when they leave the
work station or when they dismiss from work. Each employee is mandated to clock in and
clock out each time they enter or leave the work station.
Fig 4.15 Clock out form
Welcome user
Clock in Below!
Department name
Date
Time
Clock in
Welcome user
Clock out Below!
Department name
Date
Time
Clock out

61
4.7.3 Output design
The process whereby data inputted into the system and has been processed and produces a
certain result is called the output design according to Shelly and Rosenblatt (2012). Interface
forms should be created and these will enable in displaying output after it has been processed
to the employees. High quality of the output should be ensured in order to meet user
expectations. This will ensure that the output is presented in an accurate manner to the users.
Also the output design should include pop up messages for example if an employee has
successfully clocked into the system there should be a confirmation message that pops up
immediately after the process. Below are the output forms of the industrial attendance
system.
Summary of employee attendance
The output form shows all the employee clock in time and clock out times. It also identifies
all the days the employees showed up for work including their clock in times. The diagram
below shows the employees attendance summary report.
Fig 4.16 Summary of employee attendance
Employee report form
The output form identifies all the information that has successfully been processed by the
system. The employee report form summarises the results that will have been processed by
the system
Email address Date Time in Time out

62
Fig 4.17 Employee report form
4.8 Pseudo Code
Pseudo code is the code which is understandable by the end users, Shelly and Rosenblatt
(2012. The code helps the users to have a better understanding on how the system functions.
Statements in English form are the one used in explaining the system processes. Below is the
pseudo code for the industrial attendance system.
4.8.1 Creating employee account
Start
Open create sign up form
Enter employee details and click register here button
If the data is correct then click ok
Else if data is not correct begin the process
Then re enters the details and click register here button again
End
4.8.2 User login form
Start
Enter login details that is the username and password and click log in button
If details are correct then the user has automatically successfully clocked in
Clock in Clock out Reports Logout Welcome user
Reports
Department From (date) To (date) Search
Email address Date Time in Time out

63
Else if, details are not correct
Then failed to login message appears
The user has to start the login process
End
4.8.3 User clock out form
Start
Click the logout button
Message appears stating logout successful
End
4.9 Security design
Security design refers to the process whereby the developer puts security measures in place
during the software development process according to (Shostack 2014). This is done in order
to ensure that the system is protected and secure that no unauthorised user will be able to
access the system. The security design process was conducted through network, operational
and physical security.
Network security
Meeuwisse (2017) says that network security refers to the process which includes ensuring
data integrity, data security, accurateness and reliability of data thus resulting in the
protection of data. The software maybe affected by some malware functionalities, viruses,
spyware etc. Therefore the system needs to be protected from these activities hence the need
for data encryption, use of firewalls and antivirus such as windows defender in order to
protect information and restrict unauthorised users to have access to the network. Also there
is need for establishing a remote secure access point such as the virtual private network so
that it is strongly protected.
Operational security
This refers to the process whereby software is protected whilst users are having access to the
services provided by the system and this is known as operational security, (Meeuwisse 2017).
Measures of online security of the system should be put in place and the developer so that
there is no interruption of user activities by hackers. The protection processes include
64
Physical security
The process that includes protecting a system from situations that are physical in nature
which can result in damaging the software, hardware and all the peripherals through natural
disasters such as winds, floods, lightning, theft, fire and burglary is called physical security,
(Shostack 2014). The server of the system will be kept in a storage room that will be under
protection and the authorised user such as the system administrator will be the ones able to
have access to the server room.
4.10 Conclusion
The design phase identified how the system would function through the use of DFDs and the
context diagram. Architectural design and database design were conducted and they helped in
coming up with the enhanced entity relationship diagram and the class diagram. Program
design and the interface design were carried out and also security design was done in order to
identify how the system will be protected.

65
Chapter 5: Implementation Phase
5.1 Introduction
The chapter focuses on the completion and delivery of the system to the end user. This is
where the code is written and the testing phase is conducted on this chapter. Youssef (2011)
says that the implementation phase is where the developer makes sure that all the objectives
are met and all the system tests are conducted. The system installation is carried out here and
all the necessary training sessions are carried out including the system changeover strategies
and data migration techniques.
5.2 Coding
According to Ford (2015) code refers to a set of instructions that are executed by a computer
in a programmable manner with the main aim of producing certain commands and programs.
Below are the set of codes.
<script language="javascript">
functionlettersOnly(evt) {
evt = (evt) ? evt : event;
varcharCode = (evt.charCode) ? evt.charCode : ((evt.keyCode) ? evt.keyCode :
((evt.which) ?evt.which : 0));
if ( (charCode< 65 || charCode> 90 ) &&
(charCode< 97 || charCode> 122)) {
if(charCode != 8){
alert("Enter letters only.");
return false;
}}
return true;
}
</script>
<script type="text/javascript">

66
functionVerifyNum(textBox){
varnvalid = parseFloat(textBox.value) ;
if ( isNaN(nvalid) ) {
alert ("please enter numbers only !");
textBox.value = "" ;
return (false);
}else{
return (true);
}}
</script>
<script language="javascript" type="text/javascript">
function check(e) {
varkeynum
varkeychar
varnumcheck
// For Internet Explorer
if (window.event) {
keynum = e.keyCode;
}
// For Netscape/Firefox/Opera
else if (e.which) {
keynum = e.which;
}
keychar = String.fromCharCode(keynum);

67
//List of special characters you want to restrict
if (keychar == "." || keychar == "0" || keychar == " " || keychar == "1" || keychar == "2" ||
keychar == "'" || keychar == "3" || keychar == "4" || keychar == "5" || keychar == "6" ||
keychar == "7" || keychar == "8" || keychar == "9" || keychar =="!" || keychar =="@" ||
keychar =="#" || keychar =="$" || keychar =="%" || keychar =="^" || keychar =="&" || keychar
=="*" || keychar =="(" || keychar ==")" || keychar =="-" || keychar =="_" || keychar =="+" ||
keychar =="=" || keychar =="/" || keychar =="~" || keychar =="<" || keychar ==">" || keychar
=="," || keychar ==";" || keychar ==":" || keychar =="|" || keychar =="?" || keychar =="{" ||
keychar =="}" || keychar =="[" || keychar =="]" || keychar =="¬" || keychar =="£" || keychar
=='"' || keychar =="\\") {
return false;
} else {
return true; }
}
The code above is for signing up a user.
5.3 Testing
Hooda and Chhillar (2015) state that software testing is the process whereby errors are
identified before the implementation of the system. Bugs are detected in order to identify and
remove them before the installation process is conducted. Software testing is conducted in
order to analyse and verify whether the system is functioning according to the objectives and
if meets the user expectations. The industrial attendance management system was verified
and analysed prior to its implementation process and as such some errors were debugged. The
diagram below identifies the stages carried out in system testing.

68
Fig 5.1 System testing process diagram
5.3.1 Unit testing
Seland (2013) states that unit testing refers to a process whereby software being developed is
tested in its smallest parts and these parts are known as units and these units are
independently verified in order to see whether they are functioning properly. Unit testing can
be conducted automatically or manually. If the units of the system have now been scrutinized
and errors have been corrected, and the developer is satisfied by the performance of the
system then the units are integrated together. Unit testing was conducted through the use of
white box testing method. Unit testing was conducted for the system and all units were tested
independently and errors found were corrected by the developer. The diagram below shows
unit testing for the login form.
Unit
testing
Integratio
n
testing
System
testing
Acceptanc
e testing
Individual
components
Component
groups
System as a
whole
System as a
whole –
customer
requirements

69
Fig 5.2 Unit testing diagram
5.3.2 Integration testing
Integration testing is the process where individual modules or parts which are testable are
combined and are tested as a whole, (Hooda and Chhillar2015). This process is conducted
after unit testing. The main aim is to identify errors in the interaction of the integrated units or
modules. Integration testing can be carried out through the use of the bottom to up approach
or the top to down approach. Also functionality testing is conducted in order to see if the
system functions accordingly with the systems objectives.Integration testing was conducted
and the modules or units which were tested in unit testing were combined together and tested
as a whole. Errors were identified and they were debugged by the developer.
5.3.3 System testing
System testing occurs when the integrated software and the whole system is tested altogether
according to (Seland 2013). This is done to ensure that the system functions as per the
objectives that is to see if it meets the user requirements. It is performed after integration
testing. It is conducted through identifying the System Requirement Specification (SRS) and
the Functional Requirement Specification (FRS). It is done in order to verify the functional
and non functional requirements. Software testing is conducted through White box testing
and Black box testing.
White box testing – it involves testing the code that is the internal part of a software.
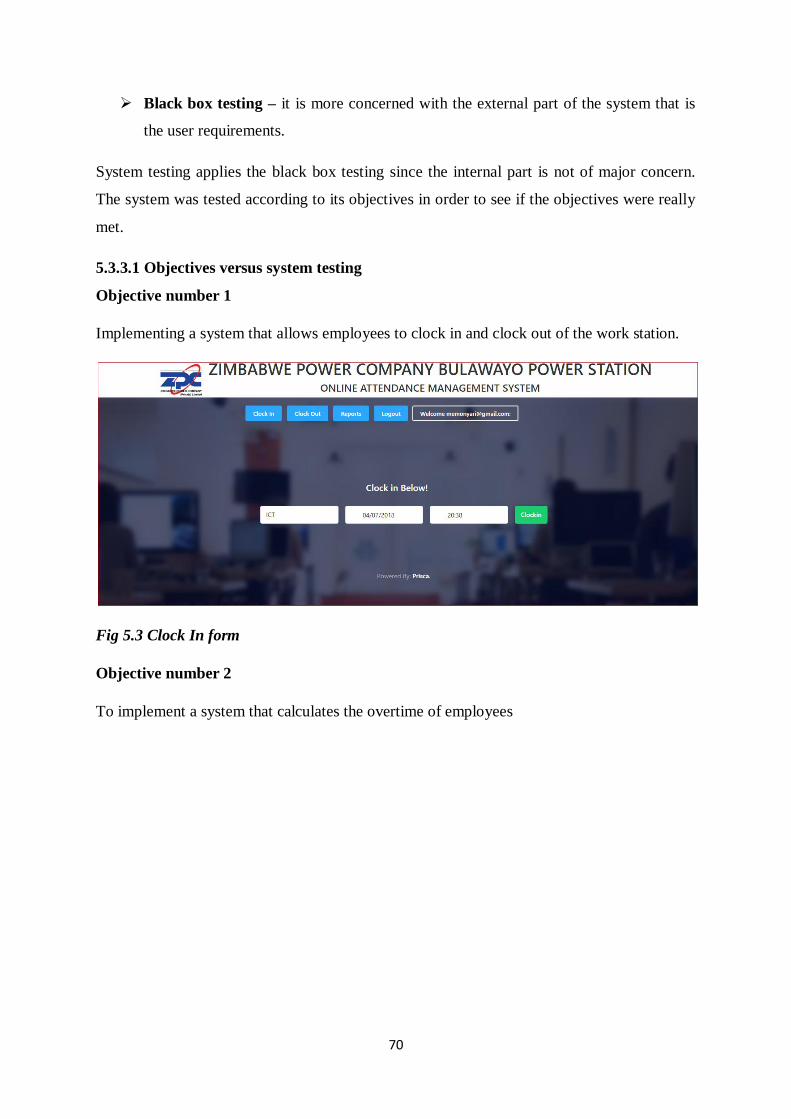
70
Black box testing – it is more concerned with the external part of the system that is
the user requirements.
System testing applies the black box testing since the internal part is not of major concern.
The system was tested according to its objectives in order to see if the objectives were really
met.
5.3.3.1 Objectives versus system testing
Objective number 1
Implementing a system that allows employees to clock in and clock out of the work station.
Fig 5.3 Clock In form
Objective number 2
To implement a system that calculates the overtime of employees

71
Fig 5. 4 Overtime form
Objective number 3
To help in easy tracking of records.
Fig 5.5 Tracking form

72
Objective number 4
To enable easy generating of reports
Fig 5.6 Report form
Objective number 5
To help in identifying absent employees.
Fig 5.7 Absenteeism form
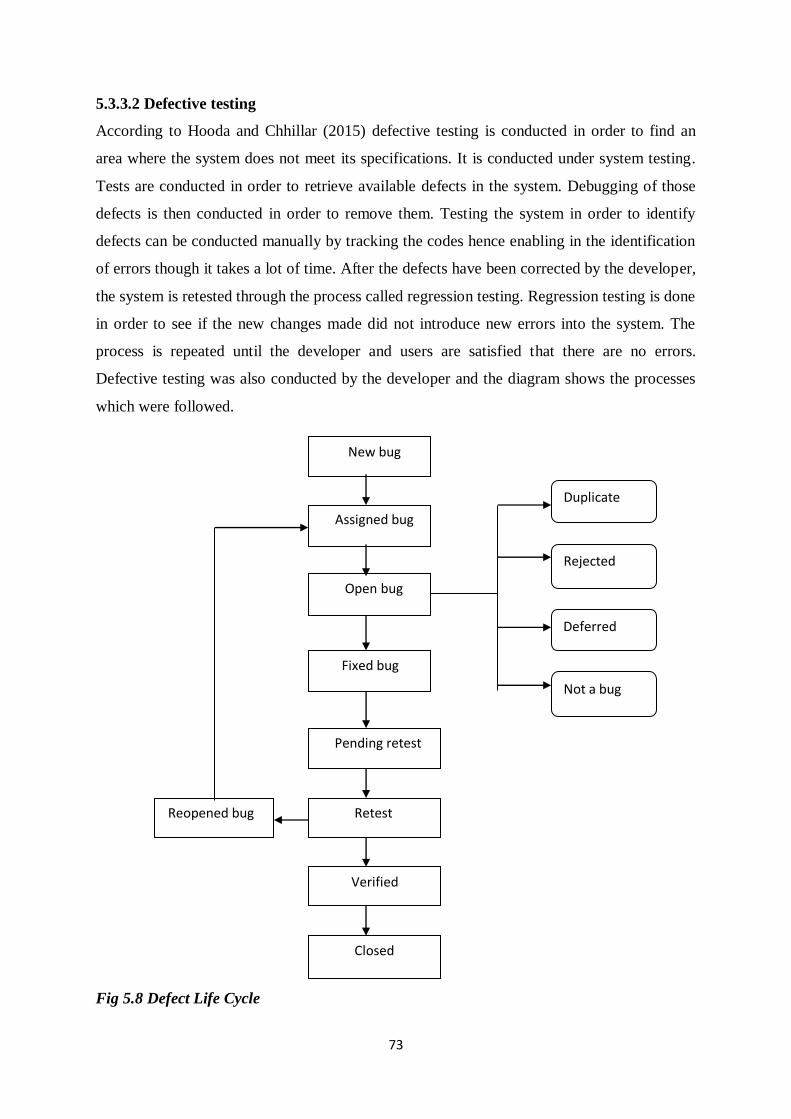
73
5.3.3.2 Defective testing
According to Hooda and Chhillar (2015) defective testing is conducted in order to find an
area where the system does not meet its specifications. It is conducted under system testing.
Tests are conducted in order to retrieve available defects in the system. Debugging of those
defects is then conducted in order to remove them. Testing the system in order to identify
defects can be conducted manually by tracking the codes hence enabling in the identification
of errors though it takes a lot of time. After the defects have been corrected by the developer,
the system is retested through the process called regression testing. Regression testing is done
in order to see if the new changes made did not introduce new errors into the system. The
process is repeated until the developer and users are satisfied that there are no errors.
Defective testing was also conducted by the developer and the diagram shows the processes
which were followed.
Fig 5.8 Defect Life Cycle
New bug
Assigned bug
Open bug
Fixed bug
Pending retest
Retest
Verified
Closed
Reopened bug
Duplicate
Rejected
Deferred
Not a bug

74
5.3.4 Acceptance testing
According to Seland (2013) acceptance testing is conducted by the users or any entity for
acceptability purposes. The result to this test is either pass or fail meaning if it does not
perform according to the user expectations. The aim of acceptance testing is to analyse and
determine whether the software is functioning as per the user expectations and can be
delivered. The procedure for this testing is usually done in an ad hoc manner. It is the last
phase of software testing and it is conducted before implementing the system. The different
types of acceptance testing consist of alpha testing and beta testing. It was conducted through
the use of alpha testing and beta testing in order to see if the users are going to accept the
system after delivery.
Alpha testing
Alpha testing is a validation technique. It is an internal acceptance testing technique which is
conducted by the development team and testing team according to (Hooda and Chhillar2015).
It is conducted in order to identify bugs before issuing the system to its users. It simulates the
users of the system through the use of black box and white box testing. The ones who test the
system are usually the users of the system. It is conducted before beta testing. The diagram
below shows diagrammatically were alpha testing is conducted.
Acceptance testing can be categorised into alpha and beta testing.
Fig 5.9 Acceptance testing
Beta testing
It is conducted after the alpha test process. According to (Hooda and Chhillar 2015) beta
testing is conducted by the real end users in a real environment. It is considered as an
example of external user acceptance testing. A beta version of the system is given to a few
end users in order to be able to obtain the feedback on the operations of the software. This
process reduces the risk of failure since the end users are the ones who test the system and
also give their thoughts either positive or negative on how the system operates. This is the
final test phase done before implementing the system to all the users. Beta testing enabled to
Unit
testing
Integrated
testing
System
testing
Alpha
testing
Beta testing

75
test the system in real time environment and also obtaining feedback from the real users of
the software.
5.3.5 Validation
Validation is the process of determining whether the system conforms to the user
requirements and if conducts some functions which were stated in the system functionality
procedure, Engel (2010). It is conducted at the end of the development process and is done
after the verification process. It ensures that the data or information being entered into the
system conforms to the specifications that are being required for example if a password
requires password requires six characters letters and a number then this is known as
validation. If a user does not enter the password with the required specification then a pop up
message will appear stating that invalid password. The diagram below shows validation by
not allowing a user to sign up without an @ character.
Fig 5.10 Validation form
5.3.6 Verification
According to Engel (2010) verification is the process of double checking or proof reading
data that is entered into the system. Verification is conducted in order to ensure data
accuracy, correctness and data integrity. The system ensures data integrity through
verification by allowing users to repeat their passwords before submitting them as shown by
the diagram below:

76
Fig 5.11 Verification form
5.4 Installation
Seland (2013) says that installation is the process of making software ready for use. The
system is deployed to a server in order to ensure that users can be able to access the software
and be able to use it. It is defined also as the process responsible for creating and extracting
all the program files so that they are installed and can run on a computer for use. During
installation, the following installation strategies where taken into consideration.
5.4.1 User training
According to Hodgins (2016) user training refers to the process where all the end users of the
software will be given the software or application and be taught it operates. It is very
essential to draft a training plan which will guide in training the end users of the system.
Training sessions were conducted for the employees and all the management so that they
were acquainted with all the necessary knowledge they may require in order for them to be
able to use the system. The process was conducted until the developers felt that the users had
grasped the necessary concepts. These training sessions were conducted within the
organisation.
5.4.2 Data migration
It refers to the process whereby information is transferred between computer storage units
according to (Hooda and Chhillar 2015). It is transferring the new system to a computer in

77
general. It is a very important aspect during system implementation. Data being transferred
should be extracted and loaded accurately. To ensure this, data verification is done in order to
identify if the data was transferred accurately. Data extraction and data loading are key
aspects of data migration. Before conducting data migration, checking of the operational
environment was done in order to ensure that all the software, hardware peripherals required
for the running of the software are functioning correctly before migrating data.
5.4.3 System changeover strategies
Robertson (2018) says that system changeover refers to the process of removing a software or
system that is old or out of date. It is placing a new application or a program whilst removing
the software which is out dated. The old system is replaced by the new system. The
changeover strategies include parallel changeover, direct changeover, phased changeover and
pilot changeover. These strategies are discussed further below.
5.4.3.1 Direct changeover
On this changeover strategy, the new system is implemented and it starts being operational
immediately whilst the old system is completely removed, (Robertson 2018). Basically, if the
new system starts functioning the old system is shut down. This changeover strategy is very
risky because if there is a mishap with the new system, the organisation as a whole will be at
a standstill that is the whole organisation suffers though it is the least expensive strategy.
5.4.3.2 Parallel changeover
According to Robertson (2018) parallel changeover is a strategy where the old system and the
new system will operate simultaneously at the same time. Both systems will be operating
fully for a certain period of time. This gives room for the management and the development
team to analyse and evaluate the efficiency of the new system. Once the development team
and the management become satisfied about the way the new system operates then the old
system is terminated leaving the new system to operate on its own. Risk is very low due to
the fact that if the new system does not operate correctly, there are no disruptions
encountered since the users are able to continue operations using the old system. However, it
is very costly since there is need to input data in both the systems. High workload for the
employees is usually the result since in most cases have to use both systems.

78
5.4.3.3 Pilot changeover
Pilot changeover is when the new system is tried at a test site before implementing it in the
whole organisation says Robertson (2018). The new system is given to a part of the
organisation that is a branch or a department to first try it out. The part of the organisation
were the new system is implemented is known as the pilot site. The old system continues to
be operational in the whole organisation as well as in the pilot site. If the new system proves
to be functional at the pilot site, it is the implemented at the whole organisation. Pilot
changeover is also known as a combination of parallel changeover and direct changeover
strategies. Pilot sites reduce the risk of failure of the system and it is less costly compared to
parallel changeover. Any failures of the new system are dealt with at the test site before
implementing the system in the whole organisation.
5.4.3.4 Phased changeover
Robertson (2018) also says that phased changeover implementation strategy refers to the
process whereby a unit of the old system is changed through the replaced of the new unit
system. The units are implemented one phase at a time. Also it is a combination of direct
changeover and parallel changeover. Only a unit of the system is provided to a few users to
try it out. Risk is limited since it affects the part were a new unit was implemented. It is less
costly compared to the full parallel changeover strategy. However it can be costly if the new
system consists of a lot of separate units which will need to be implemented individually in a
phases. The units being implemented will be replacing the old ones automatically.
5.4.3.5 Recommended changeover strategy
The changeover strategy in which the new system will be implemented with is the pilot
strategy. This technique is cheaper compared to all the other changeover strategies. It is less
risky since the new system will implemented only to the pilot site. If the system proves that it
is successful then it will be implemented to the whole organisation.
5.5 Maintenance
Garrido (2017) says maintenance is the continuous modification of the software and updates
made thus improving the software performance. Software simulates the real world. If there
are changes in technology the system also needs to upgrade in order to keep up with the
dynamic changes in technology. It includes activities such as error correction and
enhancement or modification of existing functionalities. Maintenance consists of different

79
types which include corrective maintenance, adaptive maintenance, perfective maintenance
and preventive maintenance.
5.5.1 Corrective maintenance
These are modification or updates made because of error identification by end users
according to (Garrido 2017). If an error is identified then the subsequent cause of the error is
also identified and rectified. The anomaly detected is then correct in order to resume
operations. Due to these errors the equipment can be damaged hence resulting to an increase
in costs.
5.5.2 Adaptive maintenance
This is a type of maintenance were modifications to the system and updates are conducted in
order to ensure that the system or the software product remains up to date according to
(Garrido 2017). This ensures that the system remains in line with the technological
advancements and the operational environment. The system is usually upgraded if there are
compatibility issues with the new hardware or other software’s that enable the software to
operate efficiently. The system can be upgraded by adding other functionalities so that it
continues to function instead of being discarded.
5.5.4 Perfective maintenance
Perfective maintenance is when modifications and updates are conducted in order to ensure
that the software system continues to be functional over a long period of time, (Garrido
2017). This includes adding new functionalities to the system. Also user expectations should
always be taken into consideration and be met in order to be able to improve the systems
efficiency and effectiveness.
5.5.4 Preventive maintenance
On preventive maintenance, modifications and updates are conducted in order to prevent
future problems of the software system occurring according to (Garrido 2017). The problems
which maybe attended to currently may not be significant after the implantation of the system
but my start causing serious problems in the future. Preventive maintenance tries to foresee
these errors and prevent them from occurring in the future.
5.5.5 Recommendations on the maintenance strategy
Adaptive maintenance is the recommended strategy. It was selected after outweighing the
benefits and the limitations of the other maintenance strategies. Adaptive maintenance will be

80
carried out in order to ensure that the system continues to operate in the real world
environment even in the future and continues to be updated according to the technological
changes. Other strategies maybe implemented if their need arises for example if there are
errors identified, corrective maintenance can be implemented in order to correct the errors.
5.6 Recommendations for future or further development
The following are the recommendations which were stated by the developer for further
development in the future and these are:
Employees should be able to clock in on their individual work machines.
Training of end user should be carried out constantly in relation to the changes made
on perfective or adaptive maintenance strategies.
Security of the system should also be constantly revisited in order to continue making
the system more secure.
Maintenance strategies should also be conducted periodically in order to continue
fulfilling user expectations.
5.7 Conclusion
The chapter marked the last stage of the project development. System testing was conducted
in order to ensure that there are no errors before its implementation. Installation of the system
was done during this phase and a changeover strategy was chosen. Maintenance strategies
were also explained in detail. This phase showed that the implementation was a success.

81
Reference list
Adam and Kevin (2015) Non-functional Requirements in Systems Analysis and Design.
Springer international publishing, Switzerland.
Alleyne, S (2015) A step by step on how to do a background study for a thesis. Demand
Media.
Brent, R. J. (2017) Advanced Introduction to Cost Benefit Analysis. Edward Elgar
Publications, USA.
Claudius, P. (2014) System design, Modelling and Simulation using Ptolemy II. Ptolemy.org.
Eid, M. (2015) Requirement Gathering Methods.
https://www.umsl.edu/~sauterv/analysis/F2015/Requirement%20Gathering%20Methods.
Accessed (15/02/2018).
Engel, A. (2010) Verification, Validation, and Testing of Engineered Systems. Wiley Online
Library.
Ford, P. (2015) What is code? Bloomberg, Newyork.
Garrido, S.(2017) http://www.mantenimientopetroquimica.com/en/typesofmaintenance.html
Accessed (09/04/2018)
Grossmann, W. and Rinderle-Ma, S. (2015) Fundamentals of Business Intelligence, Data-
Centric Systems and Applications. Springer-Verlag, Berlin Heidlberg
Pp245-274
Hodgins, L. I. (2016) Identifying End-User Training Best Practices for Enterprise Systems:
Improving User Adoption. University of Oregon Eugene.
Hooda, I. and Chhillar, R.S. (2015) Software Test Process, Testing Types and Techniques.
International Journal of Computer Applications, Volume 111 – No 13.
Hernandez, M. J. (2013) Database design: A hands on Guide to Relational Database Design.

82
3rd
Edition; Addison Wesley Professional.
King, D. Case, C and Avery, G. C. (2012) An International Mission Statement Comparison:
Academy of Strategic Management. United States, France,
Germany, Japan and China; Journal 11 (2) pp93-119.
Kleynhans, L. (2016) What are the tangible and intangible benefits of ERP system?
LinkedIn, Online library.
Linman, D. (2011) Four Methods for Gathering Information on Projects. My Mnagement
Gude.com.
Mark, S. and Levin (2015) Modular system design and evaluation. Springer International
Publishing, Switzerland.
McDonald, K. J. (2013) What Is Business Value and How Do You Measure It? TechWell
Insights.
Meeuwisse, R. (2017) Cyber security for beginners. 2nd
Edition; Cyber simplicity Limited.
Muhammad, Matias and Markku (2010) Product-Focused Software Process Improvement.
Limerick, Ireland.
Ormsond, G. I. and Cohn, E. S (2015) The Distinctive Features of a Feasibility Study:
Objectives and Guiding Questions. Article 19. Sage Publishing.
Robertson, T. (2018) Changeover techniques:
http://smallbusiness.chron.com/changeover-techniques-34890.html,
Accessed(9/4/2018).
Scammell, R. W. and Umanath, N. S. (2017) Data modelling and Database design. 1st
Edition; Course Technology.
Seidl, M. ; Scholz, M. ; Huemer, C. and Kappel, G. (2015), UML @Classroom, An
Introduction to Object Oriented Modelling. Springer

83
International Publishing, Switzerland.
Seland, J. (2013) Introduction to Software Testing. Geilo, Sintef ICT.
Shostcak, A. (2014) Threat Modelling: Designing for security. 1st Edition, Amazon.
Shtab, A. and Karmi, R (2010) The dynamics of Supply Chain and Process Management.
Springer, Japan.
Wiegers, K. (2017) Defining project scope: Context and Use case Diagram
Wolfe, L. (2018) How to Write a Feasibility Study Step by Step.
https://www.thebalance.com/what-is-a-feasibility-study-3514853
Accessed (05/10/2017).
Yago, K. Asai, Y and Ito, M (2015) History of the IMF Organisation Policy and Market.
Springer, Japan.
Youssef, B. (2011) A Simulation Model for the Waterfall Software Development Life
Cycle. Beirut, Lebanon
Zandstra, M. (2013) PHP Objects, Patterns and Practises. Third Edition, Apress.

84
Appendices
Appendix A: User manual
The user manual informs users on how the application operates. It also helps them to get a
little understanding of the system before using it. The user has to first register before login to
the system. The user is registered by the administrator.
User registration form
The administrator is the one responsible for monitoring employee registration. The users
include employees. If the user is not registered, they cannot access the services. The diagram
below shows the registration form. The arrows shows were the users in order to input the
required details that are their first name, last name, department, designation, email address
and the password. After entering their details, the user should click the register button. The
arrows were users should input their login details.
The arrows shows were the user should click after filling all the credentials needed.
Login form
The login form is where the users and the administrator login in order to be able to access the
services provided by the system.

85
The arrows show were the user should enter their login details that is the email address and
their password.
Clock in visitor
This form will be accessed by the user with administrator rights. The form is used to clock in
a visitor.
When clocking in a visitor there is need to enter their full name and reason for visit were the
arrows indicate. Date and time will be automatically indicated by the system as shown by the
diagram below.

86
Clock out visitor
When the visitor wants to leave the station, the form below is used to indicate their time out
at the work station.
The user with administrator rights then selects the visitor name and the date will be
automatically indicated and clicks the clock out button.
Report form
The form is used to access a summary of employee attendance. It is accessed by the
administrator when they want to view employees or visitors who entered the organisation.
The administrator is supposed to select the department they want to view.

87
Log out form
When the administrator wants to logout, they click the logout button which is indicated by the
arrow below.
Logout button
Employee report form
On this form, any user can have access to it if they want to view their overtime hours and
overtime amount. The user firstly must click on the report button then select the department
name, date or period one wants to check reports on and the window below will then appear.

88
Clock out form
The form is used by users when they want to clock out from the work place. The user clicks
the clock out button and then confirms the clock out time and clicks the clock out button.

89
Appendix B: Interview checklist
Interview questions
1. How do you record the clock in and clock out time of the employees?
…………………………………………………………………………………………
…………………………………………………………………………………………
……………………
2. What type of system do you use to maintain employee attendance records?
…………………………………………………………………………………………
…………………………………………………………………………………………
…………
3. How do you monitor activities around your organisation?
…………………………………………………………………………………………
…………………………………………………………………………………………
………………
4. What procedures do your employees follow when clocking in to the organisation?
…………………………………………………………………………………………
…………………………………………………………
5. How do you deal with identifying records that are not yet processed for overtime
hours and the amount?
…………………………………………………………………………………………
…………………………………………………
6. Do you have a way of being able to track records that have been made in order to
prepare reports?
…………………………………………………………………………………………
…………………………………………………………………………………………
7. Do you think the current system if effective?
…………………………………………………………………………………………
…………………………………………………………………………………………
………
8. Do you have journals in your library? How do the members/users access them?
…………………………………………………………………………………………
…………………………………………………………………………………………
…………………………………………………………………………………………
………………………
9. Roughly, how many employees or an average of them who usually record their
attendance?
…………………………………………………………………………………………
…………………………………………………………………………………………
…………………………………………………………………………………………
…………………………..
Name of interviewer …………………………………………………………………….
Name of company ……………………………………………………………………..

90
Appendix C: Questionnaire checklist
Questionnaires
1. Do you have a system to record the attendance of employees?
YES NO
2. Are you planning on changing the current system?
YES NO
3. Does the system you are using motivate you as employees?
YES NO
4. What method do you use to maintain records?
MANUAL COMPUTERIZED
5. Are the employees able to view their overtime hours and amount?
YES NO
6. How do you record new employees?
MANUALLY COMPUTERISED
7. Do you find the system effective?
YES NO
8. Do you feel that a computerized industrial attendance management system would be
of use to this organization?
YES NO
9. How would you rate your current management system?
EXCEELENT GOOD SATISFACTORY NEEDS IMPROVING
Name of interviewer …………………………………………………………………..
Name of company …………………………………………………………………….

91
Appendix D: Observation score sheet
Observation guideline
1) Brief explanation on the current system?
…………………………………………………………………………………………
…………………………………………………………………………………………
…………………………………………………………………………………………
…………………………………………………………………………………………
…………………………………………………………………………………………
…………………………………………………….
2) Weaknesses of the current system?
…………………………………………………………………………………………
…………………………………………………………………………………………
…………………………………………………………………………………………
…………………………………………………………………………………………
…………………………………………………………………………………………
………………………………………
3) Strengths of the current attendance system?
…………………………………………………………………………………………
…………………………………………………………………………………………
…………………………………………………………………………………………
…………………………………………..
4) Areas that need to be improved on the current attendnace system?
…………………………………………………………………………………………
…………………………………………………………………………………………
…………………………………………………………………………………………
…………………………………….
Name of observer …………………………………………………………………….
Name of company ……………………………………………………………………..

92
Appendix E: Snippet of code
Code for logging in
<?php
error_reporting(0);
?>
<?php
include 'opendb.php';
$fname = mysql_real_escape_string($_POST["fname"]);
$lname = mysql_real_escape_string($_POST["lname"]);
$dpt= ($_POST["dpt"]);
$desgination= ($_POST["desgination"]);
$mail = ($_POST["mail"]);
$password = mysql_real_escape_string($_POST["password"]);
$cpassword = mysql_real_escape_string($_POST["cpassword"]);
mysql_select_db('zpc',mysql_connect('localhost','root',''))or die(mysql_error()); $queryf = mysql_query("select * from users where mail='$mail'");
javascript:history.go(-1)
$query ="INSERT INTO
users(`access`,`fname`,`lname`,`mail`, `desgination`, `password`, `department`)
VALUES ('Employee','$fname','$lname', '$mail','$desgination','$password', '$dpt')";
$row1="mysql_num_rows($query)"; $rowa =
mysql_num_rows($queryf); if($rowa>
echo("<SCRIPT LANGUAGE='JavaScript'> window.alert('User Already Exist, Try Again
with a diffrent name' </SCRIPT>"); exit;
}
// Import PHPMailer classes into the global namespace
// These must be at the top of your script, not inside a function
mysql_query($query)or die(mysql_error());
if(mysql_affected_rows()>=1)
{
echo "<script>alert('Successfully registered')</script>";
echo "<script>location.href='index.php'</script>";
}
else{

93
echo "<script>alert('User not successfully added')</script>";
echo "<script>location.href='index.php'</script>";
}
?>
Copyright © 2022 FDOKUMEN