West Midlands Local Transport Plan - Solihull Council
304
West Midlands Local Transport Plan Making the Connections 2011 – 2026 Detailed Topic Areas Relating to the Ten Long Term Themes Local Transport Strategy Appendices
-
Upload
khangminh22 -
Category
Documents
-
view
2 -
download
0
Transcript of West Midlands Local Transport Plan - Solihull Council
West Midlands Local Transport Plan Making the Connections
2011 – 2026
Detailed Topic Areas Relating to the
Ten Long Term Themes
Local Transport Strategy
Appendices

204 Policy List and Centro’s Delivery Partners
12 1: REGENERATION, THRIVING CENTRES, CORRIDORS AND GATEWAYS
13 Land Use, Transport and Regeneration
18 High Speed Rail
24 Coach Travel to Centres and Major Attractions
29 Birmingham Airport
32 National Exhibition Centre
34 2: MAKING BEST USE OF THE HIGHWAY NETWORK
35 Highway Network Management, including relationship with
the Highways Agency Regional Network
51 Urban Traffic Management and Control
57 Smart Routes – Developing a Strategic Network
70 3: MODAL TRANSFER AND THE CREATION OF SUSTAINABLE TRAVEL PATTERNS
71 Car Parking
75 Demand Management and Reducing the Need to Travel
81 Changing Travel Behaviour and Smarter Choices
(including Active Travel)
98 Waterways
104 4: ASSET MANAGEMENT AND MAINTENANCE – A FOUNDATION FOR GROWTH
105 Asset Management Plans (AMPS)
113 Carriageway (Road Pavement)
126 Footways & Cycleways
135 Structures
147 Street Lighting
156 Procurement and Commissioning
Contents Appendices –
Detailed Topic Areas
relating to the 10
Long Term Themes

3168 5: A RAIL AND RAPID TRANSIT NETWORK “BACKBONE FOR DEVELOPMENT”
169 Passenger Rail (Network Rail and Centro Schemes)
180 Metro and Rapid Transit
188 6: IMPROVED LOCAL ACCESSIBILITY AND CONNECTIVITY
189 Accessibility Planning
201 Bus
211 Complementary travel services
218 7: SUSTAINABLE AND EFFICIENT FREIGHT TRANSPORT
219 Sustainable Freight Distribution – Road and Rail
238 Sustainable Freight Distribution - Air and Water Freight
244 8: EFFECTIVE AND RELIABLE TRANSPORT INTEGRATION
245 Park & Ride
248 Public Transport Information and Integration
254 Taxis and Private Hire Vehicles
262 9: IMPROVED SAFETY AND SECURITY
263 Road Safety
276 Powered Two Wheeler Safety
285 Public Transport Safety
290 10: IMPROVED ENVIRONMENT AND REDUCED CARBON THROUGH NEW TECHNOLOGIES
291 Supporting Accelerated Development of Low Carbon Technology
295 Carbon Reduction, Climate Change Adaptation, Safeguarding the
Natural Environment, Air Quality and Noise
4Policy Centro’s Implementation Partners
LTT1 REGENERATION, THRIVING CENTRES, CORRIDORS AND GATEWAYS
LTT2 MAKING BEST USE OF THE HIGHWAY NETWORK
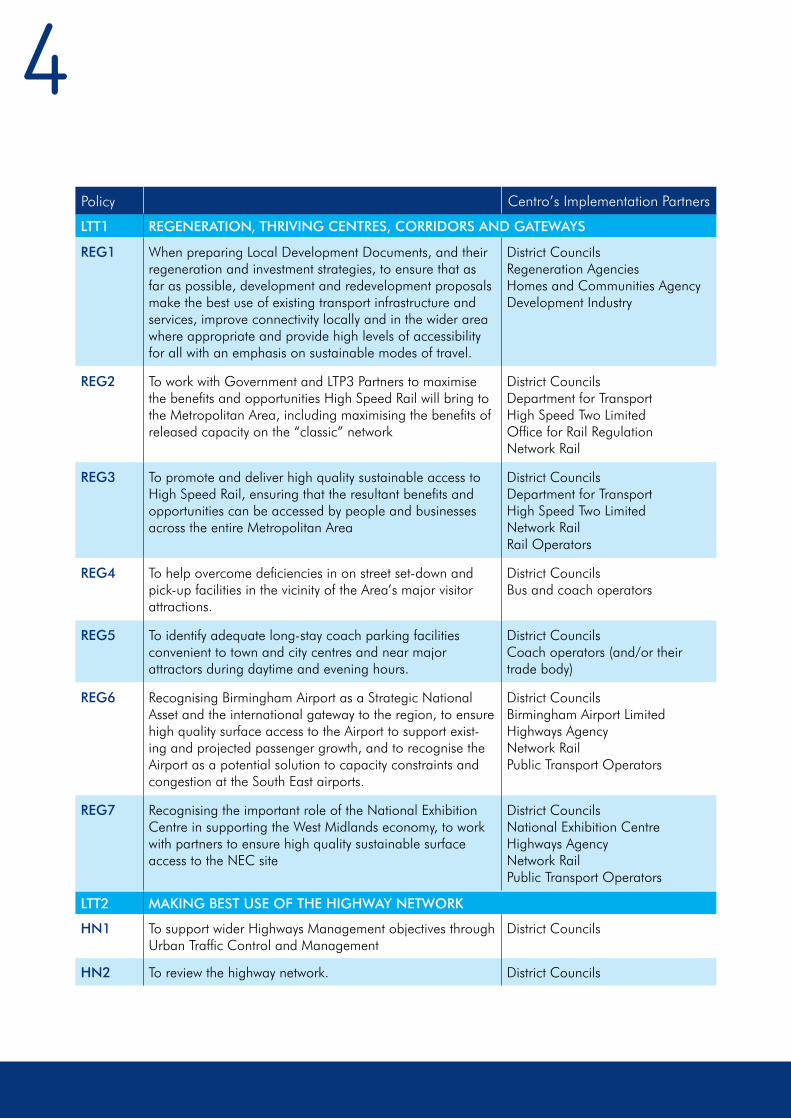
REG1 When preparing Local Development Documents, and their regeneration and investment strategies, to ensure that as far as possible, development and redevelopment proposals make the best use of existing transport infrastructure and services, improve connectivity locally and in the wider area where appropriate and provide high levels of accessibility for all with an emphasis on sustainable modes of travel.
District CouncilsRegeneration AgenciesHomes and Communities AgencyDevelopment Industry
REG2 To work with Government and LTP3 Partners to maximise the benefits and opportunities High Speed Rail will bring to the Metropolitan Area, including maximising the benefits of released capacity on the “classic” network
District CouncilsDepartment for TransportHigh Speed Two LimitedOffice for Rail RegulationNetwork Rail
REG3 To promote and deliver high quality sustainable access to High Speed Rail, ensuring that the resultant benefits and opportunities can be accessed by people and businesses across the entire Metropolitan Area
District CouncilsDepartment for TransportHigh Speed Two LimitedNetwork RailRail Operators
REG4 To help overcome deficiencies in on street set-down and pick-up facilities in the vicinity of the Area’s major visitor attractions.
District CouncilsBus and coach operators
REG5 To identify adequate long-stay coach parking facilities convenient to town and city centres and near major attractors during daytime and evening hours.
District CouncilsCoach operators (and/or their trade body)
REG6 Recognising Birmingham Airport as a Strategic National Asset and the international gateway to the region, to ensure high quality surface access to the Airport to support exist-ing and projected passenger growth, and to recognise the Airport as a potential solution to capacity constraints and congestion at the South East airports.
District CouncilsBirmingham Airport LimitedHighways AgencyNetwork RailPublic Transport Operators
REG7 Recognising the important role of the National Exhibition Centre in supporting the West Midlands economy, to work with partners to ensure high quality sustainable surface access to the NEC site
District CouncilsNational Exhibition CentreHighways AgencyNetwork RailPublic Transport Operators
HN1 To support wider Highways Management objectives through Urban Traffic Control and Management
District Councils
HN2 To review the highway network. District Councils

5Policy Centro’s Implementation Partners
HN3 To co-ordinate expeditious traffic movement within and across Metropolitan District boundaries
District Councils (Traffic Managers)Police and Fire ServicesHighways AgencyPublic Transport OperatorsUtility Companies
HN4 To provide dynamic travel information District CouncilsPolice and Fire ServicesHighways AgencyPublic Transport OperatorsUtility CompaniesBusiness
HN5 To upgrade Legacy Urban Traffic Management and Control Systems and progress proposals for integrated management of the network
District Councils
HN6 To co-ordinate the development and implementation of a Smart Route network, including a common assessment of problems, joint consultation, common design and procurement activities
District CouncilsBus OperatorsUser GroupsBusinessResidents
LTT3 MODAL TRANSFER AND THE CREATION OF SUSTAINABLE TRAVEL PATTERNS
MT1 To ensure car parking policies and provision support the LTP3 aims of encouraging sustainable transport patterns across the Metropolitan Area and promote vitality of centres. Such policy interventions may include availability and car park pricing.
District CouncilsBusinessResidents
MT2 To seek to manage travel demand through a mix of hard and soft measures to encourage sustainable travel patterns, including:•Carparkingpolicies•Prioritisingtheuseofthehighwaynetwork•EncouragingSmarterChoices•Landuseplanningpolicies•Encouragingpeopleandbusinesstoreducetheneed
to travel via virtual travel and co-location of facilities through the land use planning process
District CouncilsHighways AgencyBusiness and Employers
MT3 To promote modal shift towards sustainable travel modes for work, school and leisure journeys through the application of targeted and intensive Smarter Choices measures
District CouncilsHighways AgencyACT TravelWiseBus OperatorsHomes & Communities AgencyJob Centre PlusSustransPrimary Care Trusts and Successor BodiesBritish Waterways
6Policy Centro’s Implementation Partners
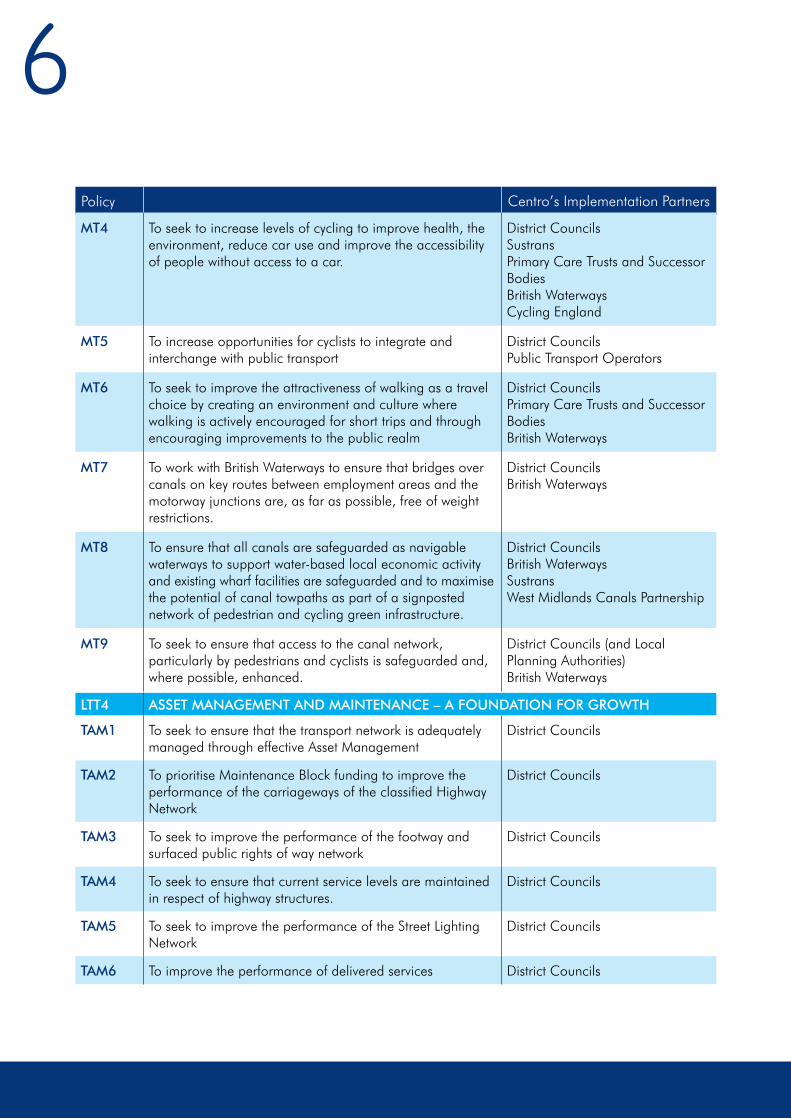
MT4 To seek to increase levels of cycling to improve health, the environment, reduce car use and improve the accessibility of people without access to a car.
District CouncilsSustransPrimary Care Trusts and Successor BodiesBritish WaterwaysCycling England
MT5 To increase opportunities for cyclists to integrate and interchange with public transport
District CouncilsPublic Transport Operators
MT6 To seek to improve the attractiveness of walking as a travel choice by creating an environment and culture where walking is actively encouraged for short trips and through encouraging improvements to the public realm
District CouncilsPrimary Care Trusts and Successor BodiesBritish Waterways
MT7 To work with British Waterways to ensure that bridges over canals on key routes between employment areas and the motorway junctions are, as far as possible, free of weight restrictions.
District CouncilsBritish Waterways
MT8 To ensure that all canals are safeguarded as navigable waterways to support water-based local economic activity and existing wharf facilities are safeguarded and to maximise the potential of canal towpaths as part of a signposted network of pedestrian and cycling green infrastructure.
District CouncilsBritish WaterwaysSustransWest Midlands Canals Partnership
MT9 To seek to ensure that access to the canal network, particularly by pedestrians and cyclists is safeguarded and, where possible, enhanced.
District Councils (and Local Planning Authorities)British Waterways
LTT4 ASSET MANAGEMENT AND MAINTENANCE – A FOUNDATION FOR GROWTH
TAM1 To seek to ensure that the transport network is adequately managed through effective Asset Management
District Councils
TAM2 To prioritise Maintenance Block funding to improve the performance of the carriageways of the classified Highway Network
District Councils
TAM3 To seek to improve the performance of the footway and surfaced public rights of way network
District Councils
TAM4 To seek to ensure that current service levels are maintained in respect of highway structures.
District Councils
TAM5 To seek to improve the performance of the Street Lighting Network
District Councils
TAM6 To improve the performance of delivered services District Councils

7Policy Centro’s Implementation Partners
LTT5 A RAIL AND RAPID TRANSIT NETWORK “BACKBONE FOR DEVELOPMENT”
RR1 To expand local rail network capacity to meet forecasted growth in patronage, delivering the schemes and objectives of the Regional Rail Development Plan. This will include maximising capacity of the ‘classic’ rail network derived from High Speed Rail
District CouncilsNetwork RailTrain operating companiesPassenger Focus
RR2 To work with DfT, ORR, Network Rail, Local Authorities, Train Operating Companies and Rail Freight Operators to identify and develop schemes on the rail network to increase capacity and reliability for both passenger and freight services
District CouncilsOffice for Rail RegulationNetwork RailTrain operating companiesRail freight operators
RR3 To work with Local Authorities, Network Rail and Train Operating Companies to deliver high levels of services standards and accessibility which delivers an inclusive network accessible to everyone
District CouncilsNetwork RailTrain operating companies
RR4 To expand the rapid transit network, with an appropriate form of rapid transit for each individual corridor in the network
District CouncilsPublic Transport Operators
RR5 To ensure that future rapid transit will be ultra low emission at source with an aspiration target for Zero Emission as technology permits
District CouncilsTravel Midland Metro
RR6 To identify rapid transit alignments and develop interim rapid transit to improve access in and around Birmingham City Centre
Birmingham City CouncilBusiness Improvement Districts
LTT6 IMPROVED LOCAL ACCESSIBILITY AND CONNECTIVITY
LA1 To ensure that Accessibility Planning is embedded within planning and strategy documents and continue to encourage service providers to embed accessibility considerations within their service delivery investment programmes.
District Councils
LA2 To ensure the access needs of groups defined in the Equalities Act 2010 are met as far as practicable.
All Partners
LA3 To secure socially necessary local bus services to complement commercially provided services so that residents have the best possible access to local facilities.
District CouncilsBus operatorsInterest groups
LA4 To keep local bus service networks and provision under review, in partnership with the main operators and the relevant District Authority, with the aim of improving service levels and accessibility for all to essential services and facilities.
District CouncilsBus operatorsInterest groupsResidentsBusiness
8Policy Centro’s Implementation Partners
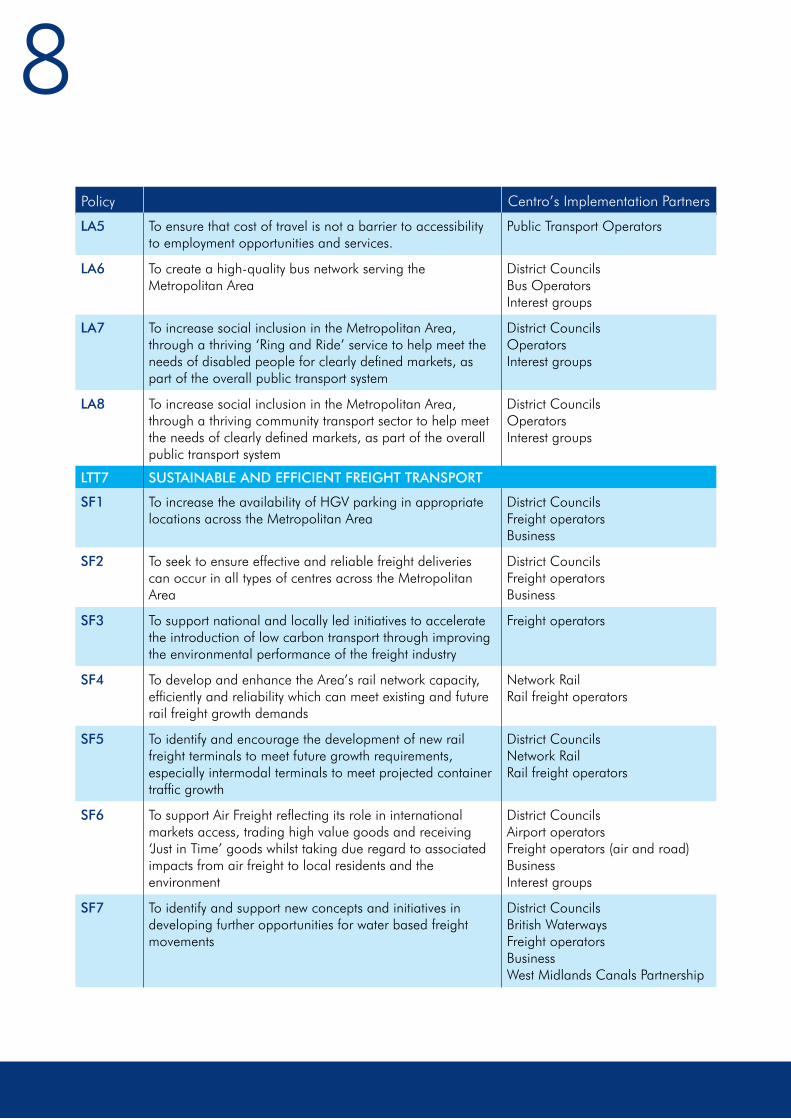
LA5 To ensure that cost of travel is not a barrier to accessibility to employment opportunities and services.
Public Transport Operators
LA6 To create a high-quality bus network serving the Metropolitan Area
District CouncilsBus OperatorsInterest groups
LA7 To increase social inclusion in the Metropolitan Area, through a thriving ‘Ring and Ride’ service to help meet the needs of disabled people for clearly defined markets, as part of the overall public transport system
District CouncilsOperatorsInterest groups
LA8 To increase social inclusion in the Metropolitan Area, through a thriving community transport sector to help meet the needs of clearly defined markets, as part of the overall public transport system
District CouncilsOperatorsInterest groups
LTT7 SUSTAINABLE AND EFFICIENT FREIGHT TRANSPORT
SF1 To increase the availability of HGV parking in appropriate locations across the Metropolitan Area
District CouncilsFreight operatorsBusiness
SF2 To seek to ensure effective and reliable freight deliveries can occur in all types of centres across the Metropolitan Area
District CouncilsFreight operatorsBusiness
SF3 To support national and locally led initiatives to accelerate the introduction of low carbon transport through improving the environmental performance of the freight industry
Freight operators
SF4 To develop and enhance the Area’s rail network capacity, efficiently and reliability which can meet existing and future rail freight growth demands
Network RailRail freight operators
SF5 To identify and encourage the development of new rail freight terminals to meet future growth requirements, especially intermodal terminals to meet projected container traffic growth
District CouncilsNetwork RailRail freight operators
SF6 To support Air Freight reflecting its role in international markets access, trading high value goods and receiving ‘Just in Time’ goods whilst taking due regard to associated impacts from air freight to local residents and the environment
District CouncilsAirport operatorsFreight operators (air and road)BusinessInterest groups
SF7 To identify and support new concepts and initiatives in developing further opportunities for water based freight movements
District CouncilsBritish WaterwaysFreight operatorsBusinessWest Midlands Canals Partnership
9Policy Centro’s Implementation Partners
LTT8 EFFECTIVE AND RELIABLE TRANSPORT INTEGRATION
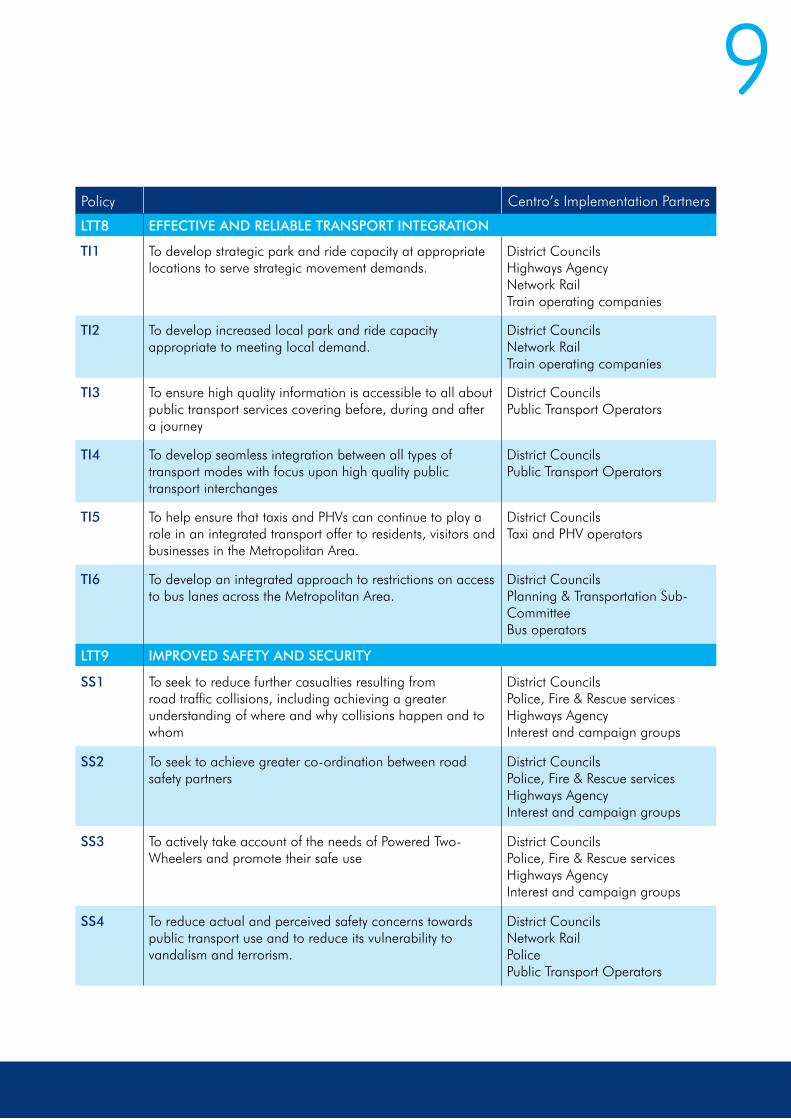
TI1 To develop strategic park and ride capacity at appropriate locations to serve strategic movement demands.
District CouncilsHighways AgencyNetwork RailTrain operating companies
TI2 To develop increased local park and ride capacity appropriate to meeting local demand.
District CouncilsNetwork RailTrain operating companies
TI3 To ensure high quality information is accessible to all about public transport services covering before, during and after a journey
District CouncilsPublic Transport Operators
TI4 To develop seamless integration between all types of transport modes with focus upon high quality public transport interchanges
District CouncilsPublic Transport Operators
TI5 To help ensure that taxis and PHVs can continue to play a role in an integrated transport offer to residents, visitors and businesses in the Metropolitan Area.
District CouncilsTaxi and PHV operators
TI6 To develop an integrated approach to restrictions on access to bus lanes across the Metropolitan Area.
District CouncilsPlanning & Transportation Sub-CommitteeBus operators
LTT9 IMPROVED SAFETY AND SECURITY
SS1 To seek to reduce further casualties resulting from road traffic collisions, including achieving a greater understanding of where and why collisions happen and to whom
District CouncilsPolice, Fire & Rescue servicesHighways AgencyInterest and campaign groups
SS2 To seek to achieve greater co-ordination between road safety partners
District CouncilsPolice, Fire & Rescue servicesHighways AgencyInterest and campaign groups
SS3 To actively take account of the needs of Powered Two-Wheelers and promote their safe use
District CouncilsPolice, Fire & Rescue servicesHighways AgencyInterest and campaign groups
SS4 To reduce actual and perceived safety concerns towards public transport use and to reduce its vulnerability to vandalism and terrorism.
District CouncilsNetwork RailPolicePublic Transport Operators
10Policy Centro’s Implementation Partners
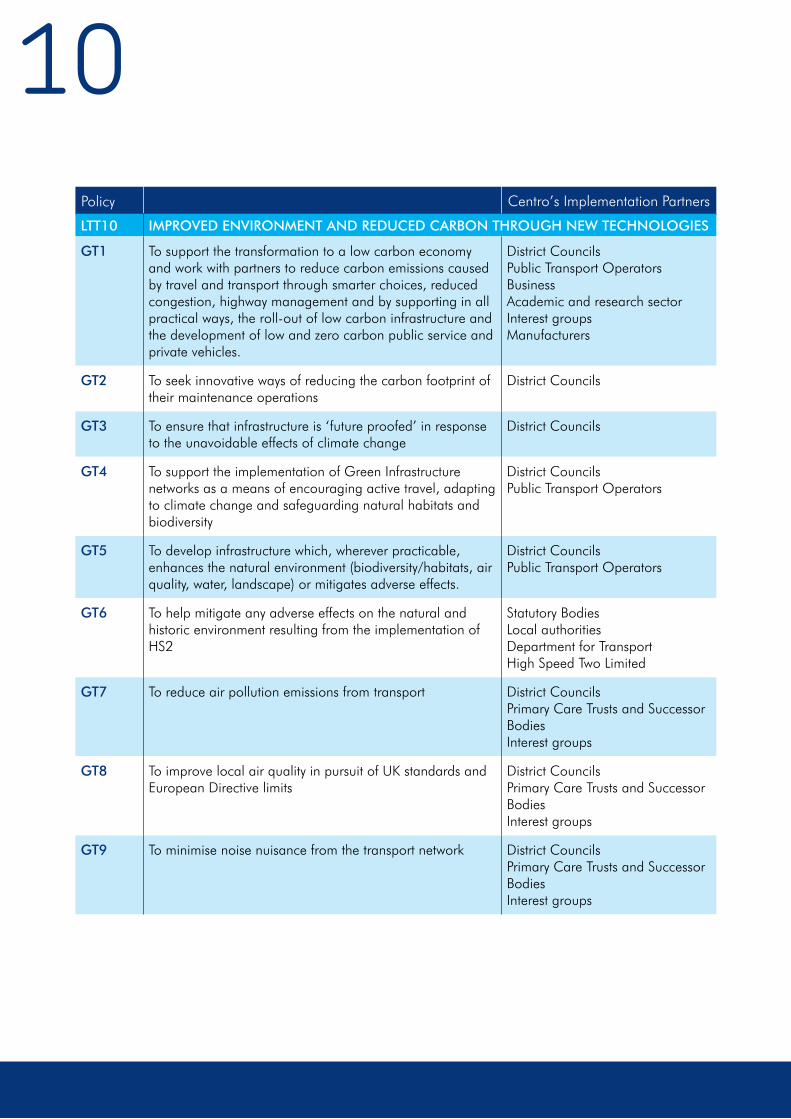
LTT10 IMPROVED ENVIRONMENT AND REDUCED CARBON THROUGH NEW TECHNOLOGIES
GT1 To support the transformation to a low carbon economy and work with partners to reduce carbon emissions caused by travel and transport through smarter choices, reduced congestion, highway management and by supporting in all practical ways, the roll-out of low carbon infrastructure and the development of low and zero carbon public service and private vehicles.
District CouncilsPublic Transport OperatorsBusinessAcademic and research sectorInterest groupsManufacturers
GT2 To seek innovative ways of reducing the carbon footprint of their maintenance operations
District Councils
GT3 To ensure that infrastructure is ‘future proofed’ in response to the unavoidable effects of climate change
District Councils
GT4 To support the implementation of Green Infrastructure networks as a means of encouraging active travel, adapting to climate change and safeguarding natural habitats and biodiversity
District CouncilsPublic Transport Operators
GT5 To develop infrastructure which, wherever practicable, enhances the natural environment (biodiversity/habitats, air quality, water, landscape) or mitigates adverse effects.
District CouncilsPublic Transport Operators
GT6 To help mitigate any adverse effects on the natural and historic environment resulting from the implementation of HS2
Statutory BodiesLocal authoritiesDepartment for TransportHigh Speed Two Limited
GT7 To reduce air pollution emissions from transport District CouncilsPrimary Care Trusts and Successor BodiesInterest groups
GT8 To improve local air quality in pursuit of UK standards and European Directive limits
District CouncilsPrimary Care Trusts and Successor BodiesInterest groups
GT9 To minimise noise nuisance from the transport network District CouncilsPrimary Care Trusts and Successor BodiesInterest groups

11

LTT1: REGENERATION, THRIVING CENTRES AND GATEWAYS (REG)
12
The linkages between land use, spatial planning,
regeneration and transport are well established,
with a clear imperative to ensure an integrated
and co-ordinated approach across both space
and time, based on a common understanding of
the issues and the evidence.
An overall Policy is required to ensure that the
priorities for regeneration and land use planning
within the Metropolitan Area, both inform the
development of our transportation policies and, in
turn, is informed by them. Transport interventions
can be the catalyst to unlock investment and
regeneration and in doing so make a major
ITA
The ITA’s role is limited to that of providing influence in this area. It is a partner within the Planning &
Transportation Sub-Committee, which seeks to co-ordinate strategic planning and transport matters of
mutual interest across the Metropolitan Area.
Local Authorities
The seven Districts are statutory Local Planning Authorities, who have a duty to exercise plan-making and
development management powers and responsibilities. The Districts prepare Development Plan Documents,
including Core Strategies (jointly, in the case of the Black Country Authorities) and Area Action Plans.
Ensuring that Local Development Documents are fully aligned with LTP proposals is first and foremost the
responsibility of the District Councils in drawing up their Core Strategies i.e. Birmingham, Coventry and
Solihull and Joint Core Strategy for the Black Country. The preparation of Area Action Plans and other
Development Plan Documents are also likely to have transportation implications.
A. Role of Land Use, Transport and Regeneration
B. Roles and Responsibilities
13Land Use, Transport and Regeneration
contribution to bridging the area’s output gap
and make a positive contribution towards the
creation of sustainable settlements. Sensible land
use planning, integrated with the appropriate
transport solutions can play a major role in
reducing carbon emissions and mitigating the
effects of climate change.
Reducing the need to travel, reducing the length
of journeys and promoting the most sustainable
modes of travel has a major beneficial effect on
the quality of life and the promotion of well-being
amongst communities.

14Neighbourhoods and Communities
The Localism Bill proposes to provide Communities,
Parishes and Neighbourhood Forums with a right
to produce their own Neighbourhood Plans in
conformity with Core Strategies and National
Planning Policy. There is intended to be a duty
on Local Planning Authorities to support and
co-operate with communities wishing to produce
Neighbourhood Plans. These Plans may well have
transport implications and it will be important for
Centro and the District Councils to get involved to
ensure that any transport implications are properly
considered.
Other Agencies
Regeneration activity is primarily the responsibility
of the District Councils but with other agencies
such as the Homes and Communities Agency,
having a crucial role to play across the
Area. The partnership approach which has
underpinned this LTP between Centro, the
Districts, the Regeneration Agencies, transport
and infrastructure providers, stakeholders and
developers stands us in the very good stead
to ensure the maximum integration between
planning, regeneration and transport policies.
C. Progress and Successes from LTP2
LTP2 was formulated under previous planning legislation and was not as proactive in this area as LTP3
seeks to be.
15
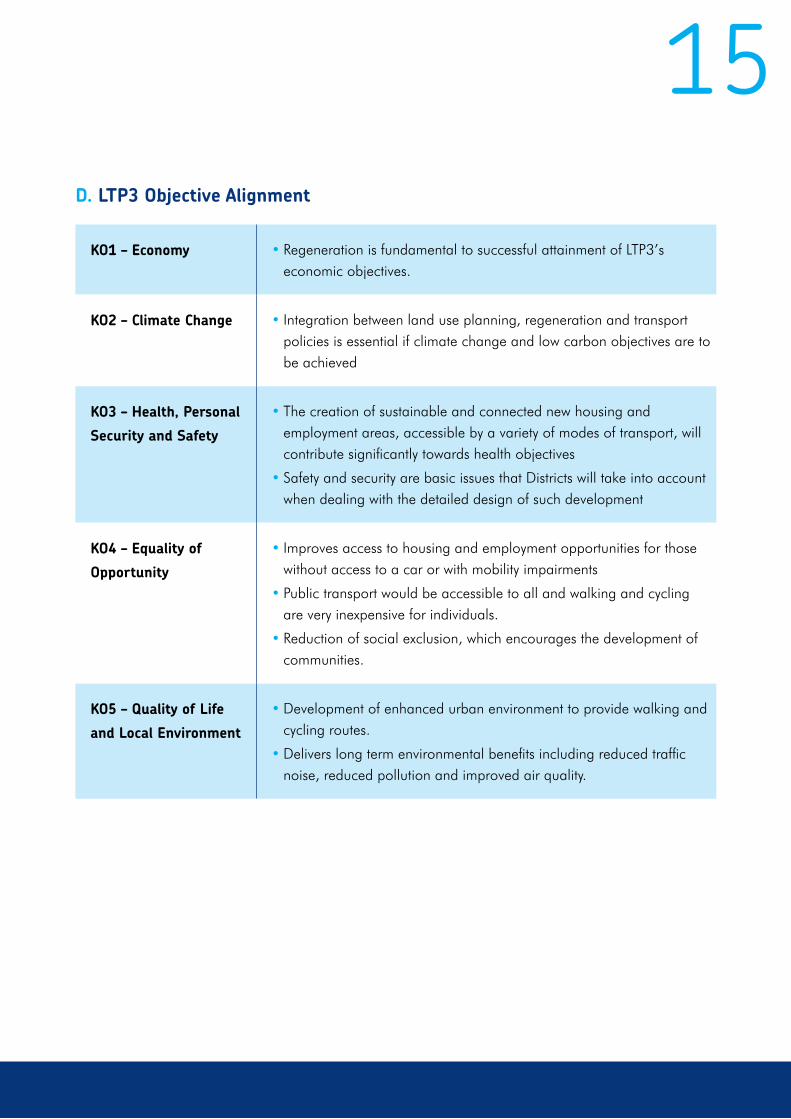
KO1 – Economy • Regeneration is fundamental to successful attainment of LTP3’s economic objectives.
KO2 – Climate Change • Integration between land use planning, regeneration and transport policies is essential if climate change and low carbon objectives are to be achieved
KO3 – Health, Personal
Security and Safety
• The creation of sustainable and connected new housing and employment areas, accessible by a variety of modes of transport, will contribute significantly towards health objectives
• Safety and security are basic issues that Districts will take into account when dealing with the detailed design of such development
KO4 – Equality of
Opportunity
• Improves access to housing and employment opportunities for those without access to a car or with mobility impairments
• Public transport would be accessible to all and walking and cycling are very inexpensive for individuals.
• Reduction of social exclusion, which encourages the development of communities.
KO5 – Quality of Life
and Local Environment
• Development of enhanced urban environment to provide walking and cycling routes.
• Delivers long term environmental benefits including reduced traffic noise, reduced pollution and improved air quality.
D. LTP3 Objective Alignment

16E. Major Influences on LTP3 Land Use, Transport and Regeneration Policies
An Integrated Sustainability Appraisal (ISA) has
been undertaken to support the preparation of
LTP3, which includes an analysis of all relevant
plans, policies and programmes from international
through to local level and assesses their
implications for LTP. This has included reviewing
the current position in relation to the land use
planning system and the changes envisaged in the
Localism Bill.
As part of their localism agenda the Government
has announced the intended revocation of
Regional Spatial Strategies and the promotion
of neighbourhood plans as the ‘building blocks’
of the new planning system. Statements have
been made that there will be nothing between
the national and local levels although there will
be a duty on Authorities to co-operate when
issues of greater than local significance need to
be tackled. This is especially relevant for a highly
complex metropolitan area, such as the West
Midlands, where infrastructure and transportation
interventions often affect several authorities, with
an impact well beyond the locality. Consequently
the West Midlands Authorities have co-operated
in the preparation and adoption of a Position
Statement on Strategic Spatial Planning in
the West Midlands Metropolitan Area, which
demonstrates that all partners remain committed
to Urban Renaissance, confirms that all Authorities
are committed to the principle of collaboration
and co-operation, and provides a coherent spatial
context to underpin LTP3.
The ISA acknowledges that a considerable amount
of work was undertaken as part of the Regional
Spatial and Economic Strategies, to produce a
common and credible evidence base regarding
the housing, economic and social needs of the
Metropolitan Area. In the absence of any other
more robust information, this has been reviewed
as part of the Sustainability Appraisal and used
to inform and assess our strategy, options and
policies.
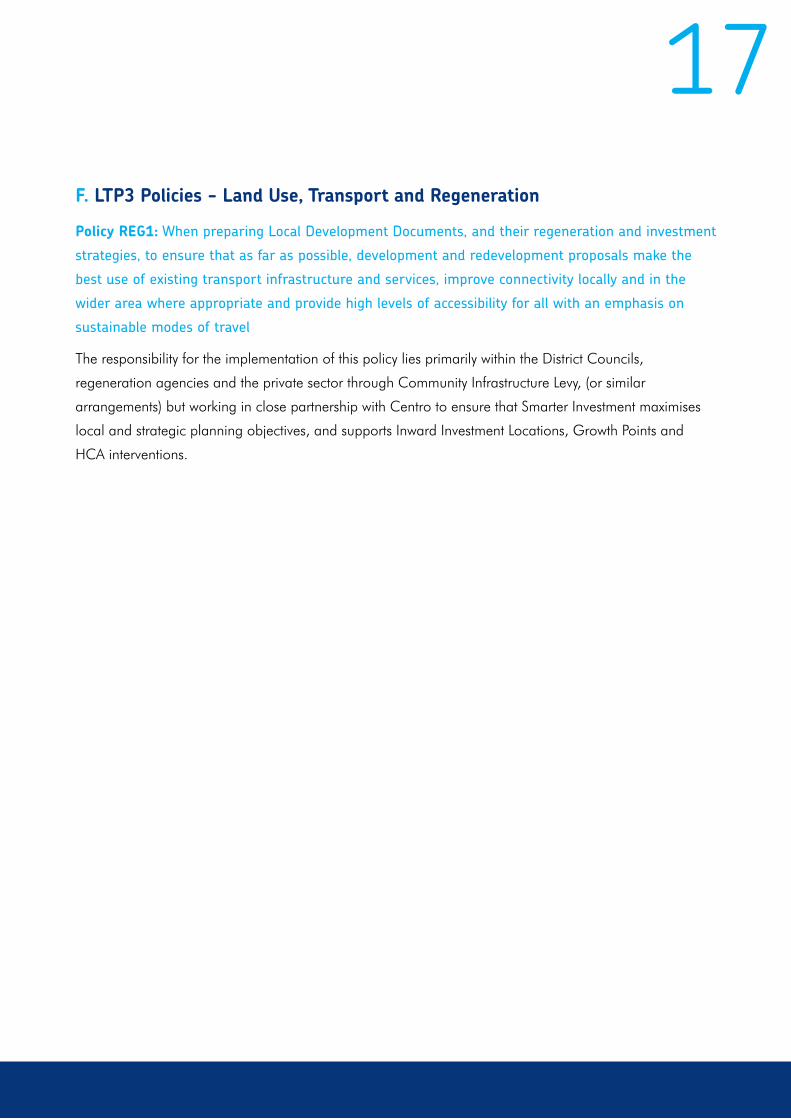
17Policy REG1: When preparing Local Development Documents, and their regeneration and investment
strategies, to ensure that as far as possible, development and redevelopment proposals make the
best use of existing transport infrastructure and services, improve connectivity locally and in the
wider area where appropriate and provide high levels of accessibility for all with an emphasis on
sustainable modes of travel
The responsibility for the implementation of this policy lies primarily within the District Councils,
regeneration agencies and the private sector through Community Infrastructure Levy, (or similar
arrangements) but working in close partnership with Centro to ensure that Smarter Investment maximises
local and strategic planning objectives, and supports Inward Investment Locations, Growth Points and
HCA interventions.
F. LTP3 Policies - Land Use, Transport and Regeneration
18High Speed Rail
In January 2009, DfT established the HS2
Company, tasked to develop proposals for a new
high-speed railway line between London and the
West Midlands and to consider the case for HS rail
services linking London and the West Midlands with
northern England and Scotland. The first phase of
the network is focused on the link between London
and the West Midlands with High Speed trains
connecting onto the existing West Coast Main Line
near Lichfield and running on the conventional rail
network north of Birmingham to cities such as
Manchester and Leeds.
The long term aspiration for the network proposed
is for a Y shaped high speed rail network serving
both the west and east coasts of the UK with the
route split occurring north of Birmingham leading
to a single spine between Birmingham and
London.
The key principles of the proposed route in the
Metropolitan Area are:
•A terminal station in Birmingham city
centre at Fazeley Street on Eastside,
adjacent to Moor Street station
•An Interchange station at Birmingham
Airport / National Exhibition Centre,
located to the east of M42 Junction 6
•Stabling of High Speed trains to occur in
Birmingham at Washwood Heath directly
providing high value jobs for the region
•HS2 accessing Birmingham city centre via
the existing Water Orton corridor which will
minimise land take requirements
Proposed travel times from Birmingham city centre
to London Euston would be 49 minutes and 38
minutes from Birmingham Airport Interchange.
Connectivity to Heathrow via the Cross Rail
Interchange would bring Heathrow Airport to
within an hour of the centre of Birmingham, and
around 45 minutes of Birmingham Airport.
Additionally, a review is being undertaken to
examine the potential for direct connectivity to
High Speed One and therefore the European
High Speed networks via the Channel Tunnel. Such
High Speed connectivity is expected to reduce the
need to use domestic and/ or short international
flights reducing carbon emissions overall.
High Speed Rail has a pivotal role in supporting
the policy objectives of LTP3 and will contribute
more to Birmingham and the Metropolitan Area
than simply improved travel times.
High Speed Rail will provide Birmingham and
the Metropolitan Area with high capacity, fast
and reliable connectivity across the UK. This
connectivity will provide huge economic benefits
to Birmingham allowing people to live and work in
a greater range of places across the High Speed
network within the journey to work area increasing
their access to employment opportunities.
A. Role of High Speed Rail
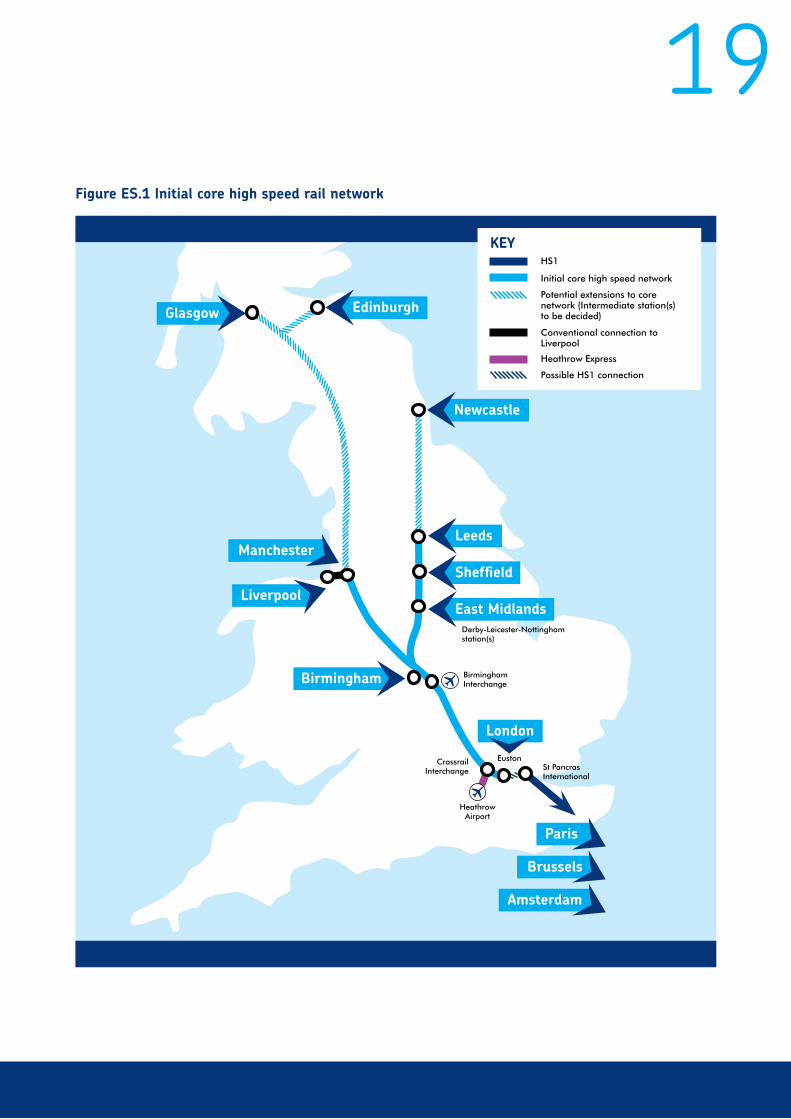
19Figure ES.1 Initial core high speed rail network
Glasgow
Manchester
Birmingham
Edinburgh
Newcastle
Leeds
Sheffield
East Midlands
London
Liverpool
Paris
Brussels
Amsterdam
Birmingham Interchange
St Pancras International
Heathrow Airport
EustonCrossrail Interchange
Derby-Leicester-Nottingham station(s)
HS1
KEY
Initial core high speed network
Potential extensions to core network (Intermediate station(s) to be decided)
Conventional connection to Liverpool
Heathrow Express
Possible HS1 connection
20
Department for Transport (DfT)
DfT sets the overall strategic policy framework and
strategy for High Speed Rail and will principally
provide public funding for High Speed rail
development and delivery. DfT also established
the High Speed Two Company (see below).
Office for Rail Regulation (ORR)
Created through the Railways Act 2005
(previously to which existed as an independent
rail regulator), is an independent statutory
body, which regulates Network Rail, secures
compliance with relevant health and safety law,
licenses operators of railway assets and enforces
competition law in the rail sector. The ORR has a
key role in the contractual framework for the rail
industry, undertaking periodic reviews of access
‘charges’ and overseeing the 5-year business
planning process, which determines funding levels
and outputs.
At the same time, businesses will have access to a greater employment pool allowing them to recruit
and grow; improve their own productivity as well as having access to national and international markets.
High Speed Two is therefore expected to be highly attractive to businesses wishing to access the London
economy as well as the major northern cities such as Manchester leading to inward significant investment
into Birmingham and the Metropolitan Area.
High Speed Rail therefore has an important role in delivering LTP3 Strategy objectives towards supporting
economic growth; reducing carbon emissions and; reducing road congestion and is strongly supported by LTP3.
B. Rail Partners: Roles and Responsibility
Centro
Centro is the promoter of rail in the Metropolitan
Area and works with stakeholders to identify,
develop and implement rail schemes and
strategies across the Metropolitan Area.
Centro funds incremental improvements to rail
services and has a statutory role to work with
stakeholders up to 25 miles outside the metropolitan
area to promote rail schemes which can benefit
or influence rail within the metropolitan area.
Centro will work with partners to maximise the
benefits of high speed rail including developing
high quality public transport access to the High
Speed Rail stations, improvements in connectivity
with the public transport network, and maximising
the additional capacity generated by HS2 on the
conventional rail network.
High Speed Two Limited
High Speed Two Limited (HS2 Ltd) is the company
set up by the Government to consider the case
for new high-speed rail services between London
and Scotland. HS2 Ltd will identify, develop and
deliver High Speed Rail across the UK.
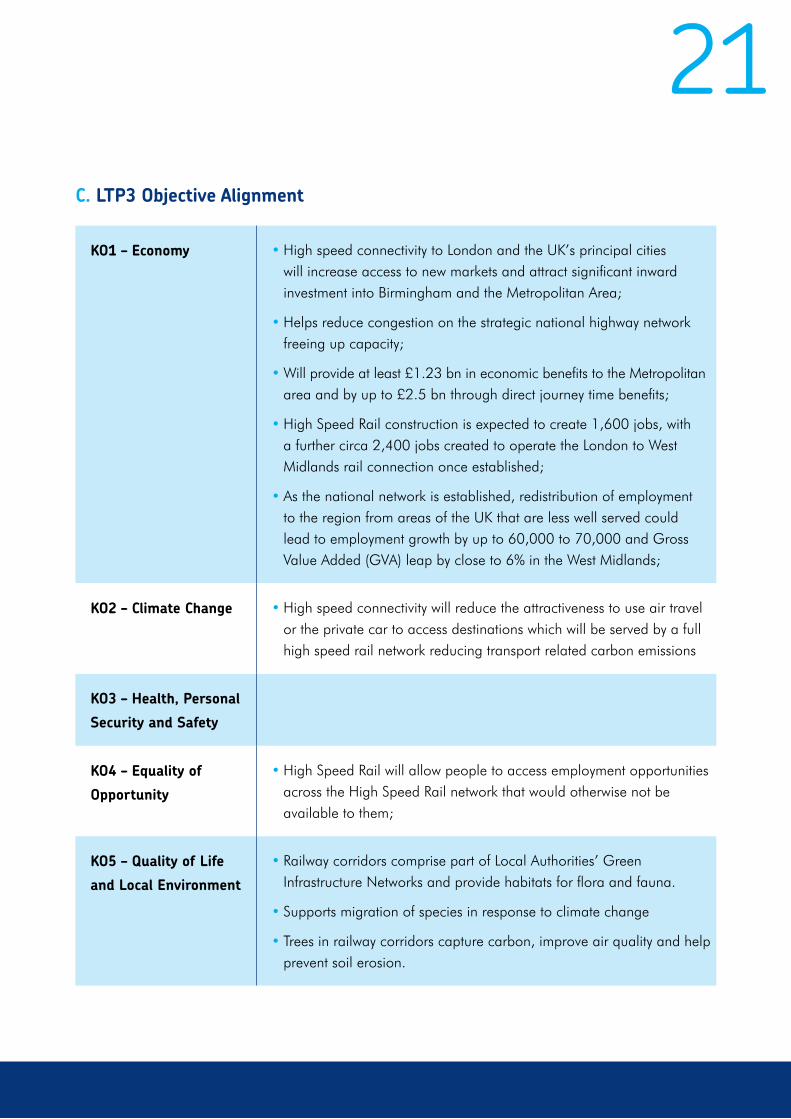
21C. LTP3 Objective Alignment
KO1 – Economy • High speed connectivity to London and the UK’s principal cities will increase access to new markets and attract significant inward investment into Birmingham and the Metropolitan Area;
• Helps reduce congestion on the strategic national highway network freeing up capacity;
• Will provide at least £1.23 bn in economic benefits to the Metropolitan area and by up to £2.5 bn through direct journey time benefits;
• High Speed Rail construction is expected to create 1,600 jobs, with a further circa 2,400 jobs created to operate the London to West Midlands rail connection once established;
• As the national network is established, redistribution of employment to the region from areas of the UK that are less well served could lead to employment growth by up to 60,000 to 70,000 and Gross Value Added (GVA) leap by close to 6% in the West Midlands;
KO2 – Climate Change • High speed connectivity will reduce the attractiveness to use air travel or the private car to access destinations which will be served by a full high speed rail network reducing transport related carbon emissions
KO3 – Health, Personal
Security and Safety
KO4 – Equality of
Opportunity
• High Speed Rail will allow people to access employment opportunities across the High Speed Rail network that would otherwise not be available to them;
KO5 – Quality of Life
and Local Environment
• Railway corridors comprise part of Local Authorities’ Green Infrastructure Networks and provide habitats for flora and fauna.
• Supports migration of species in response to climate change
• Trees in railway corridors capture carbon, improve air quality and help prevent soil erosion.

22An Integrated Sustainability Appraisal (ISA) has
been undertaken to support the preparation of
LTP3, which included an analysis of relevant plans,
policies and programmes from international
through to local level and their implications for
LTP3, including rail. In addition to the policy
framework identified for Rail by the ISA, the
following have been identified as major influences
to rail over the period of LTP3:
High Speed Rail Route Review
In June 2010, the Sectary of State for Transport
announced that the High Speed Two Company
had been tasked to review the proposed phase one
route to re-examine options for a direct Heathrow
connection and direct connection to the existing
HS1 route. The route alignment in Birmingham
and the West Midland is not to be reviewed and
is expected to remain as proposed. However, the
proposed route revisions may in turn lead to longer
development times or more expensive options
delaying the overall delivery of High Speed Two.
On the basis of information available on 7th
December 2010, Coventry City Council objected
to the existing proposal for HS2. However, during
the life of the Implementation Plan, these concerns
may be alleviated by improving the classic rail
network, and investigating options for relocation of
the Birmingham Interchange station, as part of the
consultation process.
Therefore, in future, as a result of improved
information which may become available through
the formal consultation process to be undertaken
later in 2011, and through the results of future
research studies, Coventry’s concerns could be
overcome.
Regional Rail Development Plan
Centro, in conjunction with Local Authority partners
and the Regional Rail Forum, have developed
the Regional Rail Development Plan (RRDP).
The RRDP outlines patronage drivers along rail
corridors, aspirational service provisions as well
as the required network enhancements to deliver
the additional capacity and/ or increased service
reliability. The RRDP outlines aspirational rail
service provisions based upon the released rail
capacity, which will be gained from High Speed
Rail. The RRDP is vital for the Metropolitan Area
to demonstrate how the economic and transport
benefits of High Speed Rail can be maximised
across the Metropolitan Area.
D. Major Influences on LTP3 High Speed Rail
23E. LTP3 Policies – High Speed Rail
Within the context of LTP3 Objectives, ISA and
the major influences to LTP3 rail outlined above,
the following LTP3 High Speed Rail policies
have been developed. The specific interventions
required to deliver each policy during LTP3 are
outlined in the Implementation Plan.
Policy REG2 - High Speed Rail:
To work with Government and LTP3 Partners to
maximise the benefits and opportunities High
Speed Rail will bring to the Metropolitan Area,
including maximising the benefits of released
capacity on the “classic” network
The economic, transport and environmental
benefits of the proposed High Speed Rail network
are well established and provide an opportunity to
make a significant positive impact to Birmingham
and the Metropolitan Area. High Speed Rail will
boost Birmingham City Centre’s economy by at
least £1.23 bn, and the wider West Midlands
Metropolitan area by £2.5 bn through direct
journey time benefits alone.
High Speed Rail is a transformational, once-in-
a-generation project that can make a significant
change and improvement to the West Midlands’
connectivity with both London and the South East,
and the Northern Cities, as well as a potential
fast train link direct to European cities. This
additional connectivity can also release capacity
on the classic rail network, which will create
additional benefits for capacity and connectivity
enhancements.
Centro will work with all partners to promote
the West Midlands as part of a High Speed Rail
network and ensure the full benefits of it are
realised for the Metropolitan Area.
Policy REG3 - High Speed Rail
Sustainable Access:
To promote and deliver high quality sustainable
access to High Speed Rail, ensuring that the
resultant benefits and opportunities can be
accessed by people and businesses across the
entire Metropolitan Area
Maximising the benefits of High Speed Rail for
the Metropolitan Area will be hindered if residents
and businesses cannot easily access High Speed
Rail stations and is not integrated into wider
transport networks such as public transport nor
is easily accessible by sustainable means
principally walking.
High quality, High Speed Rail sustainable
access, cannot be delivered by one rail partner
individually, and many authorities and operators
have a role to play. Therefore Centro will work
with Local Authorities, Network Rail, High Speed
Two Ltd to deliver high levels of accessibility,
which allows High Speed Rail to be inclusive and
which is accessible to everyone by differing modes
of transport.
24Coach Travel to Centres and Major Attractions
Role of Coaches
Coaches carry large numbers of passengers at
low cost and statistics show that, environmentally,
they are the most efficient mode of travel. They
are comparable with buses as efficient users of
road space and they provide both operators and
passengers with flexibility in routing and in the
selection of origin and destination points. Their
most obvious role is the provision of scheduled
inter-city and inter-urban services. Coaches
also play a major role in supporting the tourism
industry, partly because they are a relatively
inexpensive way to travel, but also because
they are a convenient way of moving groups of
people and of keeping these groups together
and under control (with regard to groups that
require supervision or guidance, such as children
or foreign visitors). Some coach operators also
provide contracted home-to-school services as
well as vehicles for school trips.
In fulfilling these roles, coaches either offer
scheduled or private hire services. Unlike local
bus services, scheduled coach services are not
registered (with the Traffic Commissioner) and
have no obligations to provide timetables or
to operate in accordance with them.
However, for obvious commercial reasons, coach
operators market their services, publish timetables
and operate their services as best possible in
accordance with those timetables.
Coach parking is a serious issue for the private-
hire sector of the coach industry and an issue
across the Metropolitan Area. It is a significant
issue in city centres. Birmingham, which has
few formal setting-down and pick-up points in
the city core despite the large number of hotels
and entertainment, conference and other visitor
facilities. The National Indoor Arena (NIA),
International Convention Centre and Symphony
Hall, in Birmingham, which often attract
international and national audiences, many of
whom cannot or do not wish to travel by car.
Up to ninety coaches and 5,000 customers may
arrive by coach, depending on the events taking
place. This situation will be exacerbated by the
planned new Aquatic and Leisure centre with its
fifty-metre pool, located close to the NIA.
Coach stopping and parking is also an
issue in Wolverhampton city centre with the
redevelopment of the bus station reducing its
size with no provision for any coaches.

25
Although scheduled services will be able to use
Pipers Row for setting down and picking up
passengers, this could change if the Midland
Metro is extended through the city centre. The
Faulkland Street coach park is not convenient
for many areas of the city.
In Coventry, tourist coaches mainly visit the
Cathedral and set down their passengers in front
of the building before moving away to a layover
area for the 45 minutes or so that is normal for
the visit. There are currently two coach spaces
in Priory Street and more are being sought on
street in Fairfax Street. Tourist coaches can use
the Pool Meadow facilities or wait on street in
Fairfax Street.
It not practical to meet the all needs for coach
operations within bus stations and, therefore, it is
important to identify other suitable pick up / set
down facilities in all major locations.
The Airport Company places great importance
of coach services and it is considered one of the
most effective ways of increasing the Passenger
Public Transport Mode Share. The Airport’s Surface
Access Strategy incorporates policies targeted to
increase the use of coaches by passengers.
Provision of Coach Facilities
Where coach facilities are provided, they need to:
•Be within easy access for passengers to
primary destinations
•Be welcoming for passengers
•Have sheltered waiting facilities
•Have adequate information
•Have excellent connections with other
public transport
•Be close to short stay parking
•Have convenient access to the primary
road network
•Be safe and secure for passengers
•Have driver rest facilities (where
appropriate)
26In providing facilities, there is a need to recognise that continental coaches bringing in tourists from
Europe pick up and set down on the opposite side of the coach compared with domestic vehicles.
Greater integration between modes, in terms of organisation, information and ticketing, would enable
coach services to link better with other modes and, thus, provide improved connectivity. Facilities for
integrating coaches are needed at the Area’s main railway stations and airports. Facilities should also
be targeted at integrating local bus and rail services with longer-distance scheduled coach services.
Additionally, this could help to justify:
•New bus priority measures for key corridors, including trunk roads
•Consistency in their inclusion in bus priority measures
•Integration into wider fares and ticketing structures which could include Smart ticketing
Partners: Roles and Responsibilities
Coach operators, principally National Express
for scheduled services, but also a myriad of other
operators, are responsible for providing the
services. Some of these also provide scheduled
services, sometimes under contract to National
Express, but most offer private hire services.
Other scheduled service providers include
Stagecoach, trading as ‘MegaBus’, and Thandi
Coaches. Private hire services include ad-hoc
or regular trips to leisure facilities for residents
to locations within or beyond the Metropolitan
Area; others are aimed at bringing people from
outside the Metropolitan Area to facilities in our
Area. Companies that offer private hire services
that operate within the Metropolitan Area are
often, therefore, based outside it – mostly in the
surrounding Shire areas.
The local highway authorities are responsible
for finding appropriate locations for visiting
coaches to set down and pick up passengers
and for coach parking, preferably with facilities
for drivers waiting to pick-up their passengers.
Centro manage the Bus Stations, some of which
have provision for scheduled coach services.
National Express own and manage Birmingham’s
Coach Station, in Digbeth, whilst other scheduled
services use on-street stops in Birmingham or
elsewhere across the Metropolitan Area.

27Progress and Success from LTP2
In December 2009, National Express opened
the newly redeveloped Digbeth Coach Station,
a five-minute walk from the heart of Birmingham
city centre and served by a number of local bus
services. There are adjacent facilities for quick
‘drop offs’ and short-stay parking, a taxi rank and
a multi-storey car park for longer-stay parking
nearby. The Coach Station has sixteen bays for
coaches and handles 1½ million arrivals and
departures annually.
Formerly an old bus garage, the £15 million new
coach station is a striking building as part of the
regeneration of the Digbeth Quarter, showing
how transport investment can support wider
objectives. It contains a spacious airport-style
waiting area with a selection of major retailers
separated from the coach bays by glass walls and
automatic doors. Above the building are offices,
bringing new employment to Digbeth.
During the development process, National Express
allocated an additional £366,000 for public art to
be incorporated into the overall project. A public
art ‘Boundary’ is an iconic 181 linear array of 320
steel haunch sculptures forming the perimeter fence
around the coach area and is designed to reflect
the area’s history and heritage. Its development
involved community engagement. Inside the
passenger foyer is the ‘Irish Quarter Visual Art’
feature, a 10 x 7.5 metre textual installation,
the first visual representation of Birmingham’s
Irish Quarter. In this way, the new Coach Station
contributes to quality of the urban environment.
KO1 – Economy • Coaches provide direct access to and between centres, interchanges and other major trip generators.
• The coach industry provides direct employment and supports employment in other sectors, for example - leisure and tourism.
• As an alternative to travel by car, coaches contribute towards congestion-reduction objectives.
D. Major Influences on LTP3 High Speed Rail

28
LTP3 Policies: Coaches
Policy REG4: To help overcome deficiencies in on street set-down and pick-up facilities in the vicinity
of the Area’s major visitor attractions.
Policy REG5: To identify adequate long-stay coach parking facilities convenient to town and city centres
and near major attractors during daytime and evening hours.
KO2 – Climate Change • Coach travel is the greenest travel option in the UK today. It is twice as efficient as rail, nearly four times more efficient than car and six times more efficient than air travel. Most express coaches carry between 49 and 65 people and therefore move large numbers of people around in relatively little road space compared to car travel. Coaches used for private hire are usually matched with the group’s number and thus emissions per passenger are minimised. Coaches can, therefore, help reduce congestion and assist with air quality issues.
KO3 – Health, Personal
Security and Safety
• National statistics show that coach travel has an excellent safety record.
KO4 – Equality of
Opportunity
• Birmingham is a hub for National Express scheduled inter-city coach services with links to most major cities across the country, providing affordable travel opportunities especially for people with limited incomes
• Most coaches are relatively modern. Since 2005, all new express service coaches have been fully accessible and over 50% now are. By 2012 nearly 100% will be accessible.
KO5 – Quality of Life
and Local Environment
• Coaches provide a convenient, economical and efficient means of travel for many people.
• Group coach travel provides opportunities for visits enhancing quality of life for many people, especially those without access to a car.
29Birmingham Airport
BHX is a Strategic National Asset, the region’s principal airport and plays a vital role in supporting the
regional economy.
•Securing the future role and development of BHX is essential to the regional economy by
way of supporting business, commerce and industry, stimulating inbound tourism, attracting
inward investment, fostering international trade and enhancing cultural and educational links
•There are a number of infrastructure issues that need to be considered to carry-forward into LTP3
•BA generates significant traffic which impacts on local transport networks, especially in the
eastern part of the conurbation
B. Partners – Roles and Responsibilities
Birmingham Airport
BHX’s ownership structure is:
51% private
49% Metropolitan Authorities
The Airport Company operates the Airport
and therefore has the most significant role and
responsibility.
Districts
The Metropolitan Authorities jointly own 49% of
BHX. In addition to their roles and responsibilities
as a joint owner, Solihull MBC is the Highway and
Local Planning Authority for the Airport area.
A. Role of Birmingham Airport (BHX)
Centro
Centro has a major role to play as ITA in working
with BHX and the relevant Districts to implement
the Airport’s Surface Access Strategy, in respect of
both public and private transport.
Network Rail and Train Operating Companies
A key element of the Surface Access Strategy
is rail, via Birmingham International Station.
Therefore, Network Rail and the TOCs have a
role and responsibility in this respect.
Bus and Coach Operators
Bus and Coach Operators have a role and
responsibility in terms of passenger access to
BHX and the achievement of the Airport Surface
Access Strategy.
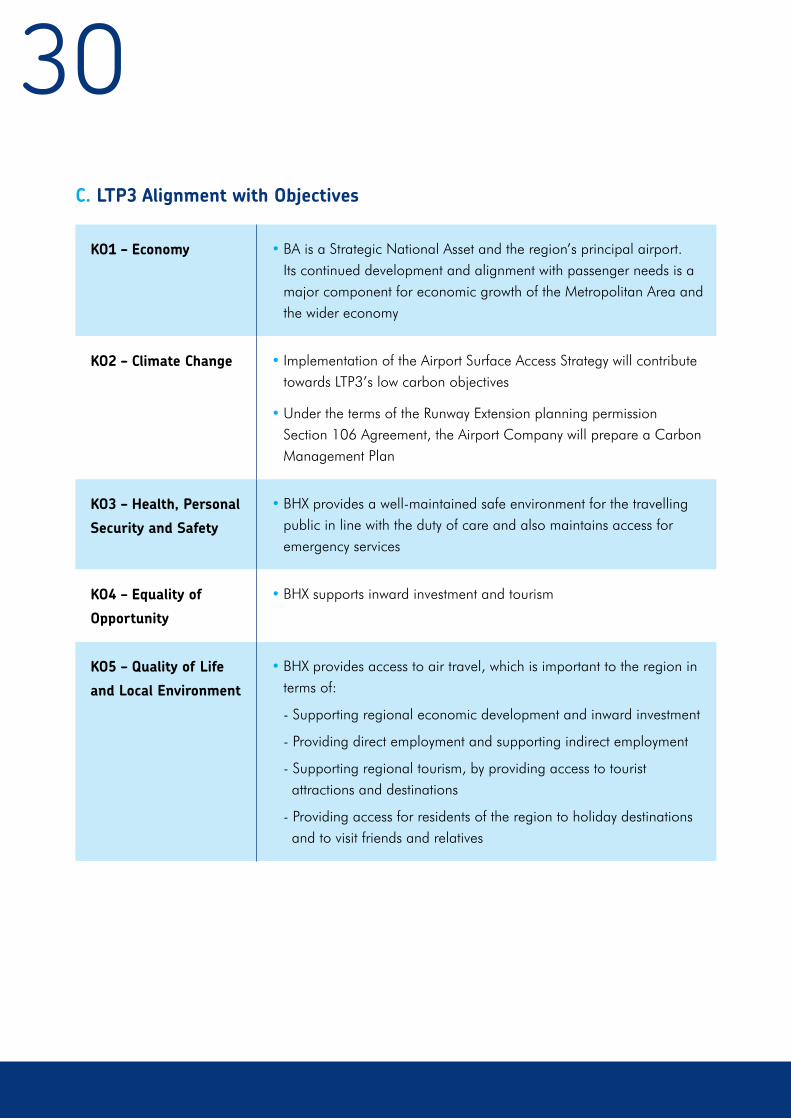
30C. LTP3 Alignment with Objectives
KO1 – Economy • BA is a Strategic National Asset and the region’s principal airport. Its continued development and alignment with passenger needs is a major component for economic growth of the Metropolitan Area and the wider economy
KO2 – Climate Change • Implementation of the Airport Surface Access Strategy will contribute towards LTP3’s low carbon objectives
• Under the terms of the Runway Extension planning permission Section 106 Agreement, the Airport Company will prepare a Carbon Management Plan
KO3 – Health, Personal
Security and Safety
• BHX provides a well-maintained safe environment for the travelling public in line with the duty of care and also maintains access for emergency services
KO4 – Equality of
Opportunity
• BHX supports inward investment and tourism
KO5 – Quality of Life
and Local Environment
• BHX provides access to air travel, which is important to the region in terms of:
- Supporting regional economic development and inward investment
- Providing direct employment and supporting indirect employment
- Supporting regional tourism, by providing access to tourist attractions and destinations
- Providing access for residents of the region to holiday destinations and to visit friends and relatives

31D. Progress and Successes from LTP2Since LTP2, major improvements have been made in terms of access arrangements and the Passenger Terminal buildings, through the early stages of implementation of the Airport Master Plan and the Airport Surface Access Strategy. E. Major IssuesProposed Runway Extension
Solihull MBC has granted planning permission. Work has to commence on site by 2016. The S106 Agreement attached to the planning permission requires BHX to produce a Carbon Management Plan. This is currently being worked on by BHX.
A45 Improvement
There is now a £32m A45 Transport Corridor Improvement Scheme. The Economic Assessment for the A45 Scheme goes beyond BHX to include NEC, Land Rover and other economic assets and has links to, inter alia the East Birmingham/North Solihull regeneration area.
The planning permission allows for implementation in phases. The works will accommodate Metro.
ANITA
BHX and NEC have committed to provide contributions to enhance local bus services serving BA/NEC over a three-year period. 3 bus routes are being focused on:
•97 Birmingham – Chelmsley Wood (extend
to airport/NEC)
•900 Bham City Centre – Coventry City
Centre via BHX/NEC (increase frequency/
hours of operation)
•966 Solihull – Erdington via BHX/NEC
(increase frequency/hours of operation)
There are strong links between ANITA and the East Birmingham North Solihull Regeneration Strategy.
BHX/Surface Access Strategy
DfT are currently in discussion with airports about DfT’s “Low Carbon Surface Access Strategy to Airports.”
HS2
HS2 creates an opportunity for BHX’s future development. There is a need for a land-use plan (Area Action Plan), which should also address surface access issues.
A45 Westbound Bridge
There is a need to improve the westbound railway bridge on the A45, to the east of BHX. A Project Board is now meeting and there is close liaison with BHX/NEC/SMBC. There is an issue of timing in respect of implementation, to avoid disruption on A45.
Policy REG6: Recognising Birmingham Airport as
a Strategic National Asset and the international
gateway to the region, to ensure high quality
surface access to the Airport to support
existing and projected passenger growth, and
to recognise Birmingham Airport as a potential
solution to capacity constraints and congestion
at the South East airports.
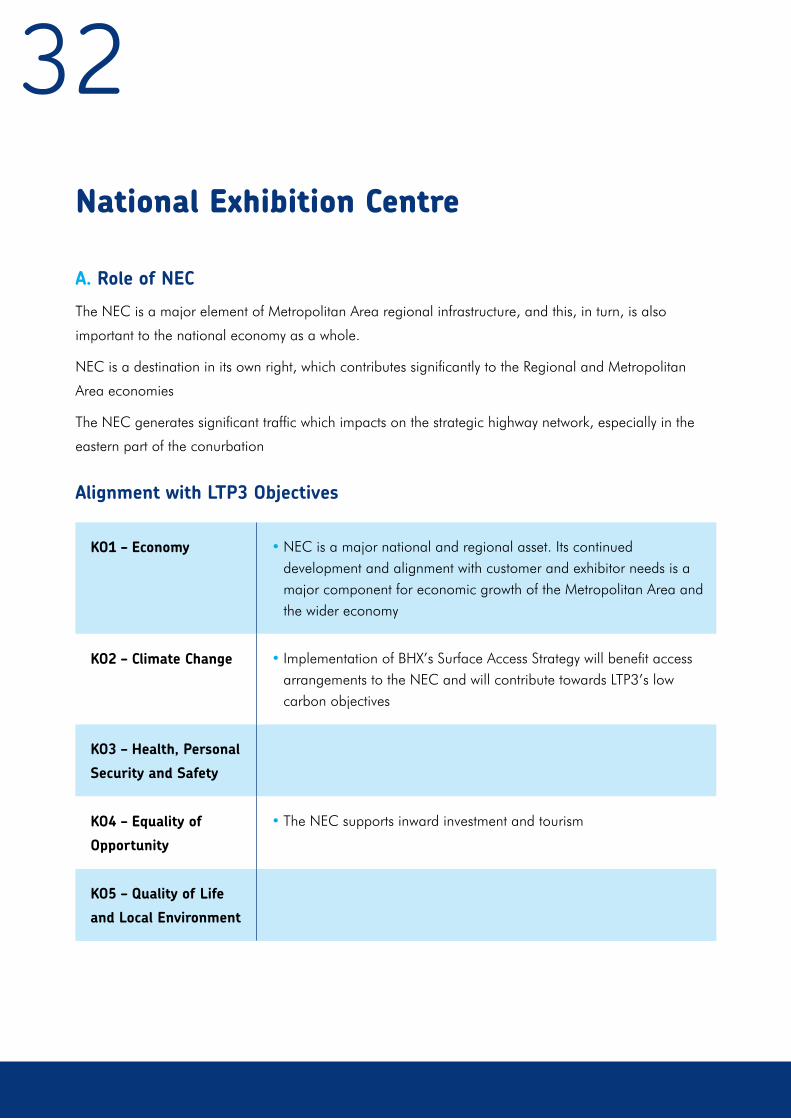
32National Exhibition Centre
A. Role of NEC
The NEC is a major element of Metropolitan Area regional infrastructure, and this, in turn, is also
important to the national economy as a whole.
NEC is a destination in its own right, which contributes significantly to the Regional and Metropolitan
Area economies
The NEC generates significant traffic which impacts on the strategic highway network, especially in the
eastern part of the conurbation
Alignment with LTP3 Objectives
KO1 – Economy • NEC is a major national and regional asset. Its continued development and alignment with customer and exhibitor needs is a major component for economic growth of the Metropolitan Area and the wider economy
KO2 – Climate Change • Implementation of BHX’s Surface Access Strategy will benefit access arrangements to the NEC and will contribute towards LTP3’s low carbon objectives
KO3 – Health, Personal
Security and Safety
KO4 – Equality of
Opportunity
• The NEC supports inward investment and tourism
KO5 – Quality of Life
and Local Environment

33
Policy REG7: Recognising the important role of the National Exhibition Centre in supporting the West
Midlands economy, to ensure high quality sustainable surface access to the NEC site

LTT2: MAKING BEST USE OF THE HIGHWAY NETWORK (HN)
34

35
Future’. This contains evidence about rising
traffic levels and the threat this poses to the
Area’s growth ambitions. Given continuing
trends in car ownership and trip length, an extra
469,000 car journeys each day are forecast
on the Area’s roads over the 20 years 2001 to
2021, increasing congestion by 22% (costing the
Metropolitan Area an additional £205 million
every year) and jeopardising jobs. The current
economic downturn has provided a respite,
which enables us to reassess the way we
tackle congestion.
Public transport operators provide 450 bus
routes covering 135m bus service kilometres
(8% of which are subsidised by the ITA, who also
manage 12 bus stations and over 13,000 bus
stops). The highway network also provides access
to a total of 6,091 rail based car parking spaces
at 37 rail stations for park and ride.
The Highway Authorities manage some 7,600
km of highway (including associated bridges,
footpaths, pedestrian area, bus lanes, cycle
tracks, etc), and are responsible for 650 traffic
controlled junctions, and control the use of over
100,000 publicly available parking spaces in city
and town centres.
A. Role of the Highway Networks
On a typical workday the Area’s highway network
carries a total of circa 8 million trips. Most
journeys use more than one mode of travel.
This total will inevitably increase as a result of
economic recovery and urban regeneration.
To manage this demand, transport needs are
served by complex networks that interact and
are managed by a range of Authorities and
organisations. However, as far the user is
concerned, these networks operate irrespective
of Authority boundaries.
Demand is time dependant and weekday
peak periods have long been associated
with congestion. Over time the length of the
morning and evening peaks has grown, the area
affected has increased and some locations are
experiencing congestion at weekends. This affects
accessibility, making journey times longer and
uncertain, and our ability to achieve the wider
LTP3 objectives.
Limiting congestion is essential to regeneration
and economic growth. However, the implications
of the growth agenda, taken together with
pressures of increasing car usage, threaten
this aim. The most comprehensive study yet of
congestion in the Metropolitan Area is ‘Gridlock
or Growth – Choices and Challenges for the
Highways Network Management
36The utility and communication companies also
make use of the highway footprint to carry their
networks of gas, electricity, water, communications
and drainage.
The disparate demands placed on the Highway
Network necessitate a managed approach
to ensuring best use of available capacity.
Managing in a way that continues to serve the
needs of the whole community by tackling journey
time reliability and the whole journey experience
requires a high degree of understanding and
collaboration between the Metropolitan Districts
and adjacent highway and planning authorities,
Highways Agency, emergency services, utility
companies, users and other stakeholders.
The travelling public make personal decisions
on when, where and how to travel, based on
their life styles, needs and their perception of the
options available to them. Similarly, businesses
and employers also make decisions regarding
their location, hours of operation, delivery times,
provision of employee parking, firm’s cars, etc.,
to maximise their efficiency. Collectively, these
decisions create demand on networks. We can
take a lead through our Sustainable Travel
Promotion, TravelWise and school travel plans
etc, ensuring that these decisions are as fully
informed, in a clear and consistent manner, of the
wider consequences and the options available.
Over the LTP3 period there will be options for
the scale, location and design of development
and for associated transport policies, which
have implications for our transport and wider
objectives. Engagement with stakeholders
provides valued input and context to the
development of policies and their participation
through ‘Quick Wins programmes’, ‘Freight
Partnerships’, ‘Travel Planning’ car parking
provision, etc is encouraged.
The needs of the emergency services are
crucial. These are considered through liaison
arrangements in the management of the transport
system, in design of projects and through experiments
such as Birmingham’s ‘Blue Routes’ pilot.
Operators make commercial decisions to provide
services for travel, parking and the movement of
goods for the general public and organisations.
They also tender for and operate passenger
services deemed socially necessary by the District
Councils and Concessionary travel schemes.
The maintainers of the transport system ensure
that it continues to operate efficiently. These
include the West Midlands Police and a range
of groups acting on behalf of local authorities
including Civil Enforcement Officers, the
operators of the Urban Traffic Management
Control (UTMC) systems, and the highway
contractors of the Authorities (and Highways
Agency). Utility Companies (who are also users
of the highway network) also have an impact on
congestion when maintaining or improving their
equipment, or with new installations. Liaison
arrangements are in place to ensure programme
priorities are aligned.
37Local Authorities also have regulatory means of influencing decisions directly. These include development
control, management of the highway network and traffic signal strategies, parking provision and
charging. The ITA, as well as developing this LTP3, influences the provision of public transport options
through negotiating and funding concessionary fares and contracts for operators to provide socially
necessary services to complement those which are commercially viable. It promotes public transport
services and develops major public transport facilities such as light rapid transit routes, bus stations and
park and ride.
Centro and partners will undertake appropriate engagement with stakeholders to ensure expeditious
movement of traffic, including pedestrians and cyclists, and minimise congestion.
B. Progress and Successes from LTP2
The approval of the Urban Traffic Management
Major Scheme (UTMC) and the associated
adoption of Intelligent Transport Systems
during the LTP2 period are key to managing
the congestion and journey time reliability
that constrains LTP3’s wider objectives. UTCM
seeks to upgrade the various systems to enable
strategic integration and to deliver reliable, 24/7,
best practice transport network management
throughout the Area. It sets the platform for
integrated management as it enables the
understanding of the dynamics and pressures on
the network through a co-ordinated approach
facilitated by active communication and
Intelligent Transport Systems.
Such systems enable Traffic Managers to
undertake their role more effectively, by
receiving and being able to respond to real time
intelligence on the performance of the network,
and to enable dissemination of information to the
travelling public.
Notwithstanding the development of local systems
and solutions against the background of stand
alone local UTMC centres, it was recognised that
more efficient management of the network, by
integrating cross boundary management, could
be achieved by an integrated strategic Central
Database (CDB) and Command and Control
System based upon the adoption of UTMC
compliant systems and service
The UTCMS sets a series of challenging actions to
be delivered during the LTP3 period.
Policy HN1: To support wider Highways
Management objectives through Urban Traffic
Management and Control
38
This £26.6m major scheme is being implemented
over 5 years and is currently the biggest
single investment of this kind in UK. A UTMC
operational “Centre of Excellence” has been
established at the Highways Agency Regional
Control Centre in Quinton, Birmingham.
The scheme establishes a UTMC compliant
system across a defined road network. It
will deploy up to 40 variable message signs
(VMS), support MATTISSE, develop a common
‘Command & Control’ system’ and pioneer
innovative use of control strategies at peak
demand periods (utilising SCOOT and MOVA).
The scheme builds upon existing investment made
during the LTP2 period and is a major contributor
towards fulfilling the requirements of the Network
Management Duty imposed by the Traffic
Management Act 2004.
The scheme will deliver the following:
• Region-wide replacement of life-expired
equipment with UTMC compliant systems
and services
•Additional traffic monitoring facilities
•Improved signalised junction efficiency
utilising SCOOT and MOVA adaptive
control techniques
•A common platform that incorporates
existing bus priority measures
Action UTMC 1: Deliver the West Midlands Urban Traffic Control Major Transport Scheme
•Enhanced real time traveller information
•Improved driver information from extensive
use of Variable Message Signs
•Additional environmental monitoring
facilities
•More comprehensive, distributed CCTV
facilities
•The potential for 24/7 UTMC control
•UTMC strategic management facility co-
located with the Highways Agency Regional
Control Centre (RCC) at Quinton
•Regional command and control network
•Region-wide traffic management plans
utilising Decision Support Tool technology
•Performance Indicator based management
philosophy
In addition to local aspirations, specific drivers are:
•The need to make the most effective use
of the skills and local knowledge of a
dwindling pool of UTMC operators and
technical staff
•The need to integrate a set of disparate
UTMC systems and achieve economies
of scale
•The obsolescence of the current BT-based
network communications technology.

39
There will be an ability to react to planned
and unplanned events exploiting the use of
the off-line Decision Support Tool provided
by UTMC. This enables the development of
Network Management strategies in an off line
environment that mimics the on line systems and
environment based upon VISSIM models. This
allows the Network Manager to model and assess
numerous network strategies or scenarios before
implementation within the live system. The output
will be a growing “library” of strategies and
interventions that can be invoked, either manually
or automatically, by UTMC operators that enable
a rapid response to incidents and events on the
network.
EU and UK standards and targets are being set &
enforced for traveller information based on Real
Time Information.
Management of signalised junctions that seek
to make due allowance for pedestrian crossing
phases that minimise disruption to vehicular traffic
and enhance the safety of pedestrians.
Action UTMC 2: Develop A Network
Intervention Strategy
Action UTMC 4: Develop traveller
information systems
Action UTMC 3: Apply the Network
Management Duty to all modes of travel

40C. LTP3 Objective Alignment
KO1 – Economy • Underpins the economic revitalisation of the West Midlands Metropolitan Area thereby encouraging regeneration.
• Helps reduce congestion on the highway network freeing up capacity for essential vehicle movements
KO2 – Climate Change • Enables a move towards a more sustainable pattern of development and growth
KO3 – Health, Personal
Security and Safety
• Reduction in congestion leads to improving air quality, transport accessibility and road safety.
KO4 – Equality of
Opportunity
• Ensuring that transport contributes towards social inclusion by increasing accessibility for everyone
• Increasing access to travel through a range of measures including improved and affordable public transport, greater personal travel safety, and arrangements for inclusion of those with mobility and other difficulties
KO5 – Quality of Life
and Local Environment
• Delivers long term environmental benefits including reduced traffic noise, reduced pollution and improved air quality.
• Enabling a move towards a more sustainable pattern of development and growth
41The functional network complies with an
established national classification. The main
strategic transport corridors accommodate a
broad range of activities, including the movement
of people, goods and pedestrians, parking
and loading/unloading, and other demands
generated by those who live, shop and work
within and beyond the corridor. It is therefore
vital to adopt a coherent, efficient and effective
approach to route enhancements to balance
competing needs and priorities.
This approach has led to the development of the
Smart Routes network.
A review of the Highway Network focuses on
aspects associated with:
•Prioritising Use
•Network and user hierarchies
•Freight demands
• Incidents and contingency planning
•Adoption of enforcement powers
Links within the network are classified to enable
the various associated service demands to be
delivered. Functional networks include national
classifications, such as motorways and primary
routes, which are principally related to longer
distance inter city travel, and local distributors that
provide connectivity to the national networks and
internal local access. Typically, such classifications
enable determination of winter maintenance regimes
and associated gritting priority routes, which
include local characteristics such as steep hills.
There are also restricted access links such as
pedestrianised areas, bus lanes and cycleways, and
advisory freight delivery routes that seek to better
manage usage for particular categories of user.
In addition, to assist in focussing on LTP3’s wider
objectives, recognition has been given to the
extensive work done in defining new housing
and employment sites and ‘Investment Impact
Locations’ (IILs), together with work by the
Districts in developing their Local Development
Frameworks. This has enabled a hierarchy of
routes to be defined, which reflects local needs
and the characteristics of our area.
D. Functional Network - Road Hierarchy
Policy HN 2: To review the highway network

42Action HN 1: Prioritising Use of the
Highway Network
Action HN 3: Take account of Freight needs
in user hierarchies
Authorities will review the performance of the
local highway network and in consultation with
frontagers, bus operators, police etc., consider
giving priority to buses, modifying traffic orders to
give exemption for eco-friendly freight vehicles at
particular times of day, allowing cyclists to have
contra flow use of one way streets to encourage
active modes, etc.
In establishing the User and Network hierarchies,
we will take into account the work and outputs
of our Freight Quality Partnerships (FQPs). Their
principal aims are to agree and review a strategic
transport network for the region for distribution
purposes that addresses constraints on the
network, address route signing and information,
promote sustainable distribution, pursue traffic
management techniques, promote industry best
practice, and share information and research on
the movement of freight in the Area.
Engagement with the ESDAL (Electronic Serviced
Delivery for Abnormal Loads) enables more
efficient routing of abnormal loads by using its
innovative mapping system that takes on board
the work of the West Midlands Commercial
Vehicle Drivers Road Atlas promoted in 2005,
in identifying important details such as weight
and height restrictions. Hauliers can plot the
route they need to take, get full details of all the
organisations they must notify before making
the movement, and also deliver fully compliant
notifications. Hauliers can also perform an
appraisal of the route for an indication of the
suitability of their vehicle. Police, Road and Bridge
authorities can manage incoming notifications
using ESDAL and routes can be appraised for an
indication of suitability. Additional functionality
provides self-management of structures by owners
Action HN 2: Network and User
Hierarchies
The network hierarchy is the basis for an effective
highway demand strategy. It also reflects the
needs, practice and actual use (see HN1) of
each road within the network. These may be
determined by importance in terms of traffic flow
or access to key facilities, environmental factors
(e.g. shopping centres, residential etc), or by
non-vehicular factors such as pedestrian usage.
Footway priorities may sometimes conflict with
carriageway priorities and it is therefore necessary
to also define footway and cycle route hierarchies.
In taking forward Smart Routes and the
implementation of UTMC, a strategic route plan
has been developed that seeks to co-ordinate
these disparate activities.

43and a facility for both police and highway authorities to add constraints such as roadworks.
The FQP Forum is raising awareness of the need for parking and facilities for HGV vehicles and drivers
and encouraging the development of purpose built safe and secure facilities. It has helped secure the
introduction of speed limit repeater signs in the immediate vicinity of safety camera sites and continues
to identify congestion hotspots and potential improvements. Such improvements, where they are low cost
and can be implemented within the carriageway footprint, are implemented through a programme of
Quick Wins.
E. Management of Network
The Traffic Management Act 2004 (TMA)
places network management duties on Highway
Authorities and it requires them to secure the
expeditious movement of traffic (including of
cyclists and pedestrians) on the Authority’s road
network and on adjacent road networks. It
requires each Highway Authority to appoint
a Traffic Manager who is responsible for
meeting this duty.
Each of the Metropolitan Authorities has
appointed a Traffic Manager to oversee
the progressive implementation of network
management within individual authorities
and, through inter-authority working, across
authority boundaries. They work in partnership,
strengthening co-operation and collaboration and
links with the community and other stakeholders,
including the WM Police, emergency services,
Highways Agency, bus operators and utility
Policy HN 3: To co-ordinate expeditious traffic movement within and across
Metropolitan District boundaries
companies. Each Authority will maintain a
‘Traffic Management Plan’ that sets out how
their responsibilities under the TMA are being
discharged.
The powers that the TMA gives to Highway
Authorities will be important in delivering LTP3,
as they facilitate the maximisation of road space
and keep traffic moving. It also provides tools
to better manage parking policies, enforcement
of moving traffic and the co-ordination of street
works. Specifically, the TMA sets out a number of
additional duties:
•Development of plans for taking
action deemed necessary for network
management
•Establishing the means for actioning
these plans
44
Action NM 1: Districts to develop Regional
Network Management Plans
•Establishment of processes to identify
current causes of congestion and other
forms of disruption to the movement of
traffic
•Establishment of parallel processes to
identify events and circumstances with
potential to cause congestion and other
forms of disruption to the movement of
traffic, providing that the effect is likely to
be significant
Network management focuses on aspects
associated with:
•Regional Network Management Plans
•Network Management Plans
•Co-ordinating cross boundary streetworks
• Integration of wider travel to work area
The West Midland Traffic Managers Group have
adopted a Regional Network Management
Template that enables production of local
Network Management Plans and the effective
coordination of planned and unplanned events.
This has been particularly evidenced in inter-
authority coordination with the Highways Agency
and the roll out of managed motorways around
the Birmingham Box, where a large number of
motorway night closures have and continue to be
implemented to complete the motorway work with
diversions onto local network. Regular stakeholder
co-ordination meetings are held to co-ordinate
diversions and various local authority works (Red
Routes, A41 GSI etc) inevitably on the diversion
routes as well as implementing measures to deal
with motorway traffic on the local network.
Action NM 2: Districts to develop Network
Management Plans
Network Management Plans are underpinned by
journey time information provided by DfT. This
enables changes to congestion to be monitored
across the network, congestion ‘hot–spots’ to
be identified and the effectiveness of schemes/
policies to be analysed.
Each Authority will maintain a Network
Management Plan that sets out how their
responsibilities are being discharged. It is implied
that, in discharging its Network Management
duty, the Authority should bear in mind the need
for monitoring its organisation, processes, and
resources with a view to continuous improvement
and achievement of best value.
Typically such a plan may consider:
• Managing demand – promoting ‘Smarter
Choices’, park & ride, public transport, bus
priority, parking restriction, privilege access
e.g. freight access, setting appropriate
road hierarchies
45• Improving the efficiency and
appropriateness of the network, through
the Smart Routes programme and the
enhancement of UTMC compliant systems
and services
• Improving traveller information through
the continued development of the
MATTISSE system
• Making public transport attractive and
supporting modal shift, through promoting
‘Network West Midlands’ branding, and
supporting socially necessary services
• Managing congestion at rail & bus
terminals
• Considering actions by Authorities’ other
departments that have traffic implications,
where the Authority does not have powers
of direction, e.g. Civil Contingency /
Emergency Plans. Internal agreements and
protocols will be established
• Reviews of Traffic Regulation Orders:
extent, appropriateness, duration and
periods of operation.
• Reviews of directional signing and
associated street clutter
• Car park charging
• Freight – routing, parking delivery
arrangements
• Working with the police in incident
management and traffic control
• Involving Centro and bus operators -
who have a major role in improving the
efficiency of network usage - in planning
measures to reduce disruption to their
services from events on the network
• Managing works in the street – utilities,
the Authority’s own road works, disruption
from impediments such as skips and
scaffolding, and giving no preference to
the Authority’s works (parity principle)
• Being aware at all times of activities on the
network and disseminating information
to those road users who are likely to be
affected, where this will assist in avoiding
delay to their journeys
• Performing appropriate management of
planned events
46Action NM 3: Integrate Traffic Management with the Highways Agency
Action NM 4: Develop Regional template
for Incidents and Contingency Planning
Action NM 5: Consider the adoption of
Enforcement Powers
A key role of Network Management is integration with the Highways Agency, reflecting the critical
interaction between the Strategic and Urban road networks as identified in the Route Management
Strategy of the Motorway Box. The Highways Agency support closer working on Traffic Management, the
management of planned and unplanned events and the provision of information to the travelling public.
Implementation of Active Traffic Management, which includes access control and revised junction strategies,
cannot be done without the full cooperation of the Highway Authorities. HA support traffic control needs to
be in place, with close working between the HA Regional Control Centre and the UTMC Systems.
The Network Management Plan template
enables a regional approach, setting framework
arrangements to meet local needs in terms of
incident management and contingency planning.
Multi-agency groups already exist to consider
and respond to planned events, in accordance
with the ‘safety first’ policy adopted by ACPO
and recognised by the West Midlands Joint
Committee. These groups meet on a regular basis
as Safety Advisory Groups and include emergency
service representatives. Additionally the Authorities
have in place detailed contingency plans that
encompass emergency planning, highway
maintenance, winter maintenance and asset
management plans.
We are increasing our powers of enforcement
based upon civil parking enforcement. This is
a primary element in providing enforcement
measures for the Bus Showcase, Red Route
network and other powers assumed under the
Traffic Management Act. Currently all Districts
operate civil parking enforcement and Coventry
have secured powers to administer moving
traffic offences.
47
The sharing of dynamic traffic and travel
information between the highway authorities,
UTMC Centres, Police Control Rooms, public
transport operators, the media, and the travelling
public is made through the MATISSE platform.
Provision of dynamic travel information focuses on
aspects associated with MATTISSE.
Action NM 6: Metropolitan Highway Authorities will co-ordinate cross-boundary streetworks
working with neighbouring Highway Authorities and develop cross-boundary working to integrate
the wide Travel to Work Area
Systems to record and co-ordinate both planned utilities works and planned road works have been
established that have the capability to display events such as street works, and provide a valuable aid to
both the operators of the network and to the public. The wider travel to work area also has a significant
impact on the dynamics of the conurbation strategic network.
F. Travel Information
Policy HN 4: The LTP3 Partners will provide dynamic travel information
Action TI 1 : Review the MATTISSE system
MATTISSE is a unique system that allows
instantaneous access to travel information. The
system is UTMC compliant, based on the latest
technologies and standards, and represents a
significant investment and ongoing development
since 1996, with an original focus on the
provision of coordinated online information
between our UTMC centres and subsequently
for the travelling public via web-based services.
The Metropolitan Authorities have, together with
Leicestershire County Council, Leicester City
Council and Telent, through a unique partnering
agreement, developed it as partners and technical
consultants in a joint venture.
The diagram below illustrates the way in which
data from a number of sources is taken into the
system and output in two formats:
• A web based format on the public “facing”
travel information web site “help2travel.
co.uk”
• A data repository of traffic and travel
information for analysis, network
monitoring and decision support

48MATTISSE Data Flow Diagram
• Urban Traffic Control Centres
• City and Metropolitan Councils
• Streetworks
• National Traffic Control Centre
• West Midlands Police
• Leicester ATC
• Trafficlink
• SCOOT Systems
• Car Parks
• Rail (ATOC)
• Bus (ACIS)
...Public Internet
...Secure Internet
...Hand-held Devices
...Public Display Screens
MATTISSE (managed by
telent)
• Urban Traffic Control Centres
• City and Metropolitan Councils
• Media Companies
• National Traffic Control Centre
• Police Control Centres
• Neighbouring Local Authorities
• The Public
Real-Time Inputs Receivers
Manual
Processed traffic and travel information flow via...
Automatic
49easy identification of the different networks by the
Traffic Managers and wide range of operators
and stakeholders. MATTISSE will also form part of
the evidence gathering procedure for the network
by providing a data capture and reporting facility
for planned and unplanned incidents and events
on the network.
MATTISSE currently provides a common map
based platform and will continue to be developed
to manage and display: Streetworks UTMC /
Traffic Signals fault / status data Strategy Integrator
- impact analysis & response. Congestion and
disruption can be caused by planned events such
as sporting events, demonstrations, carnivals,
parades and street markets. Dedicated plans are
already in use for effective event planning and
management processes that involve specific
traffic signal strategies and take into account
known road works.
To meet Traffic Management requirements and
to provide accurate estimations of journey time
reliability for reactive travel information, indicators
of performance are required.
MATTISSE draws data from existing urban traffic
and public transport systems, supplemented by
data on traffic events sent from the Highways
Agency and police command and control
systems. It processes this raw information so that
real-time traffic and travel information may be
delivered to the travelling public via a range of
channels (including Internet, kiosks, mobiles) to
provide an informed picture of traffic and travel
conditions. One of the many benefits is to enable
local authorities to manage the road network
better through use and delivery of information
that is timely and relevant. By providing real-
time regional traffic monitoring and traveller
information covering motorways, urban routes
and public transport, MATTISSE operates as a
one-stop information point for all forms of travel
information.
The system is designed for simplicity of
information exchange between the partners
and contributors and this remains a primary
requirement for the technical specification. As
a common platform across the Authorities,
MATTISSE will continue to be developed to
manage or display the impact of planned events
and link to the Network Management Plans to
identify the road types and hierarchies that are
established e.g. by the Red Route network, freight
and existing network hierarchies. This will allow
Action TI 2: Develop Indicators that enable
measurement of Journey time monitoring,
response times, Incident & event
management, Streetworks disruption
50
• Provision of additional Park and Ride
spaces at rail stations
• Roll out of improved on-street bus
information
• Redevelopment of bus stations /
interchanges
• Partnership working with Bus Operators to
improve services and increase patronage
on selected routes
• Partnership working within Smart Routes
• On-going programmes of bus shelter
renewal, bus and rail real time information
provision and improvements to security on
the public transport system
• Patronage Management of concessionary
fares
G. Supporting Actions
Actions and policies to support demand management and tackle congestion are a thread that runs
through LTP3. Centro are planning to invest in:
• Supporting the West Midlands Travel
Information service
• Projects such as TravelWise and Work
Wise which endeavour to change attitudes
to travel
• Marketing of PT services as an alternative
to private transport
• Provide funding to enhance local rail
services in the Metropolitan Area over and
above that specified by DfT
• Station Travel Plans
• SMART Routes as a holistic approach to
corridor based improvements
51Urban Traffic Management and Control
A. Role of Urban Traffic Control
Management of the Highway Network is reliant
on Urban Traffic Management and Control
(UTMC) Systems that support the Traffic Manager
in the Network Management Duty.
UTMC systems enable the coordination of
traffic signal timings across an Authority’s area,
as determined by experience of the dynamics
of the network and the need to respond to
planned events and incidents. Current systems
rely on hardwired communication networks from
individual signals to a local control centre. By
coordinating traffic signals across an area, the
total delay to vehicles can be managed.
In the Metropolitan Area, Traffic Managers use
Urban Traffic Management and Control (UTMC)
to better manage their road networks, and
currently these centres are managed at a District
level through local stand alone UTMC Centres.
Whilst these support the local movement of
traffic, enabling information to be disseminated
to the local road user through variable message
signs and other systems, they do not facilitate
movement in other areas – this process relying on
liaison between the appropriate Traffic Managers.
The rising level of demand and the constraints
on network capacity mean that efficient
management of the strategic network, particularly
integration of the strategic junctions, is vital to
reduce delays, and a more reactive, integrated,
approach through enhanced system connectivity
is necessary.
In undertaking the Network Management Duty,
the Districts operate a number of legacy Intelligent
Transport Systems (ITS) - all currently utilise
UTMC systems, and a number also operate car
park guidance, Variable Message Signs, Route
Management Strategies, MATTISSE, CCTV and
associated systems. In addition, Centro operates
an area-wide AVL / RTPI system.
A further role of the local centres is to manage
UTMC operations, typically maintenance of
UTMC equipment (chiefly traffic signals and
signalled pedestrian and cycle facilities).
Operators manage operations from the Traffic
Control Centre, typically using CCTV cameras
and data from the UTMC systems themselves.
These operators also direct maintenance using, in
the first instance, in-house maintenance personnel
and then, if necessary, a number of specialist
maintenance contractors.
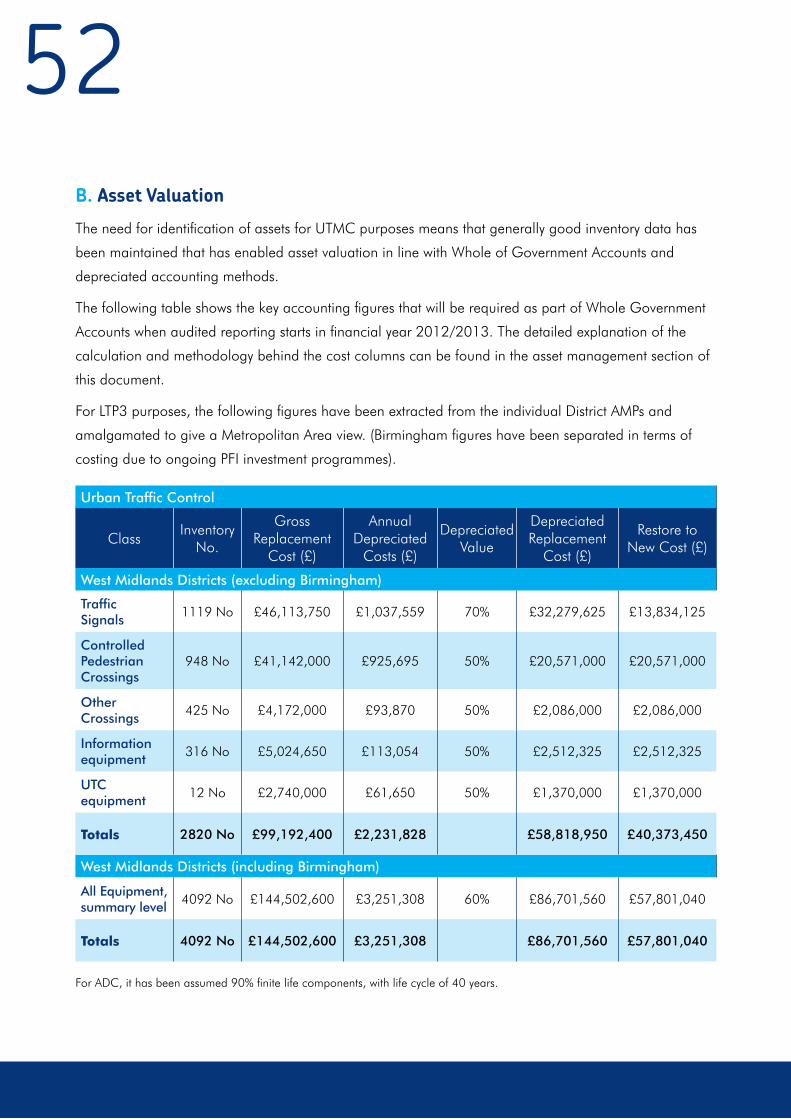
52B. Asset Valuation
The need for identification of assets for UTMC purposes means that generally good inventory data has
been maintained that has enabled asset valuation in line with Whole of Government Accounts and
depreciated accounting methods.
The following table shows the key accounting figures that will be required as part of Whole Government
Accounts when audited reporting starts in financial year 2012/2013. The detailed explanation of the
calculation and methodology behind the cost columns can be found in the asset management section of
this document.
For LTP3 purposes, the following figures have been extracted from the individual District AMPs and
amalgamated to give a Metropolitan Area view. (Birmingham figures have been separated in terms of
costing due to ongoing PFI investment programmes).
ClassInventory
No.
Gross Replacement
Cost (£)
Annual Depreciated
Costs (£)
Depreciated Value
Depreciated Replacement
Cost (£)
Restore to New Cost (£)
Urban Traffic Control
West Midlands Districts (excluding Birmingham)
West Midlands Districts (including Birmingham)
Traffic Signals
1119 No £46,113,750 £1,037,559 70% £32,279,625 £13,834,125
Controlled Pedestrian Crossings
948 No £41,142,000 £925,695 50% £20,571,000 £20,571,000
Other Crossings
425 No £4,172,000 £93,870 50% £2,086,000 £2,086,000
Information equipment
316 No £5,024,650 £113,054 50% £2,512,325 £2,512,325
UTC equipment
12 No £2,740,000 £61,650 50% £1,370,000 £1,370,000
Totals 2820 No £99,192,400 £2,231,828 £58,818,950 £40,373,450
All Equipment, summary level
4092 No £144,502,600 £3,251,308 60% £86,701,560 £57,801,040
Totals 4092 No £144,502,600 £3,251,308 £86,701,560 £57,801,040
For ADC, it has been assumed 90% finite life components, with life cycle of 40 years.
53Asset Summary
The Metropolitan Area network, excluding
Birmingham (under PFI arrangements), consists of
UTMC apparatus with a gross replacement asset
value of over £99 million.
Maintaining the asset for its target life
Maintaining UTMC assets over their target life
requires a maintenance regime and life cycle
plan that addresses the timely treatment of those
component parts of the asset group that have a
finite life – being followed by the replacement
of the asset at the end of its target life. Being
heavily reliant on communication technology, the
asset life is more based on continuing availability
of supporting systems that may necessitate a
change in approach, unrelated to asset life, but
nevertheless important in securing operation – this
is not taken into account.
Annual Depreciated Cost
The Annual Depreciated Cost of the UTMC
assets, a costing element required under the
new CIPFA code, indicates what is required to
enable the asset to achieve its target life, whilst
maintaining full service potential, notwithstanding
the technology issues indicated above.
The level of investment required (cost per
annum) to maintain a full service potential (non
PFI) over the life cycle of the assets amounts to
circa £2.2 million per annum for the six Districts
(Birmingham excluded, due to their PFI investment
programmes).
Restore to New
The restore to new costs (at present technology)
for the West Midlands UTMC stock, excluding
Birmingham, is over £40 million, which equates
to approximately £6.6 million per District.
C. Progress and Successes from LTP2
Opportunity has been taken during the LTP2 period to upgrade street and associated equipment as
opportunities have arisen.
A substantial base of expertise had been developed through the implementation of systems to improve
the performance and management of the network, such as MATTISSE.
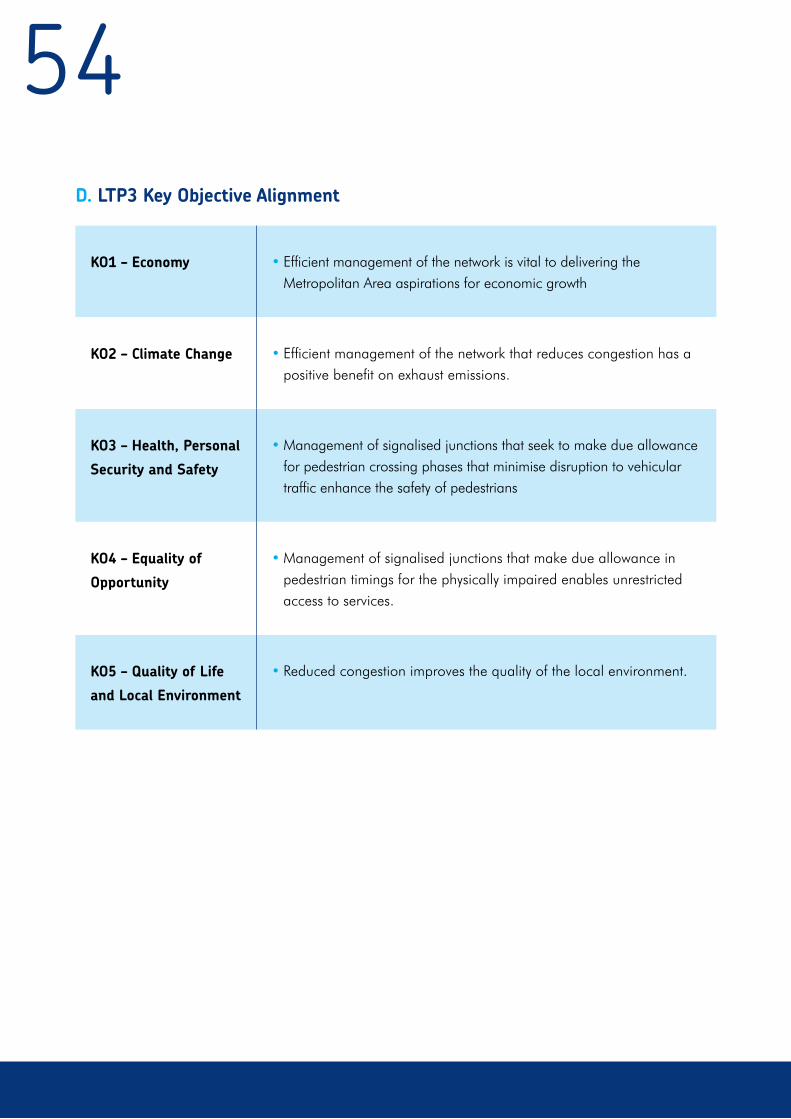
54D. LTP3 Key Objective Alignment
KO1 – Economy • Efficient management of the network is vital to delivering the Metropolitan Area aspirations for economic growth
KO2 – Climate Change • Efficient management of the network that reduces congestion has a positive benefit on exhaust emissions.
KO3 – Health, Personal
Security and Safety
• Management of signalised junctions that seek to make due allowance for pedestrian crossing phases that minimise disruption to vehicular traffic enhance the safety of pedestrians
KO4 – Equality of
Opportunity
• Management of signalised junctions that make due allowance in pedestrian timings for the physically impaired enables unrestricted access to services.
KO5 – Quality of Life
and Local Environment
• Reduced congestion improves the quality of the local environment.
55E. Major Influences on Network management
Communications
The on street UTMC Networks have developed incrementally over a long period and extensively utilise BT
fixed wire circuits that use out dated technology. These networks now face the threat of withdrawal due to
legacy issues with the transmission equipment. This is allied to a high level of maintenance skills required
from BT, which are no longer relevant to modern communications systems. In light of this there is a need
to consider the eventual withdrawal of this system and plan for the future, recognising that BT platforms
are changing to Internet Protocol (IP) based digital networks.
The next generation of UTMC relies on IP communication to enable integration of new digital equipment
on street and in control centres, enabling better information collection and dissemination. Services
need to be manageable and configurable in line with emerging and future “smart city” needs, to
accommodate future system demands.
Policy TAM6: To upgrade Legacy Urban Traffic
Management and Control Systems and progress
proposals for integrated management of the
network
The UTMC Major Scheme sets the actions
through individual work streams
Actions
The UTMC Major Scheme provides a foundation
that will be built upon during the LTP3 period
enabling legacy assets to be upgraded to deliver
a UTMC compliant system across the strategic
road network. This approach will be built upon to
enable efficient management of assets and ensure
their optimum use and efficiency is maintained.
Action UTMC 1: To ensure that strategic
UTMC assets are fit for purpose
Action UTMC 2: In undertaking routine
maintenance opportunity to be taken to
adopt current standards and methodologies
56Action UTMC 4: Review existing urban
communication platforms and build a
solution to deliver an IP-ready, flexible
and scalable communications solution for
present and future needs
Action UTMC 3: Migrate to low energy
devices for signals
To allow for the potential redundancy of
legacy systems and enhanced management
control required from on street equipment, the
opportunity to be taken through maintenance
regimes to upgrade equipment to current/future
standards.
Communication networks are vitally important to
the management of the network and the delivery
of relevant, timely and accurate information.
Effective and sustainable communication
platforms are increasingly important to deliver our
aspirations for greater traveller engagement and
enhanced network management.
The introduction of low voltage devices such
as LED signals and ELV controllers will reduce
energy consumption and associated carbon
footprint. This will also impact upon maintenance
measures as use of LED signal heads, where
6-year warranty periods are typical, removes the
requirement for bulk lamp changes and failure
will be gradual degradation of light output.

57
of a holistic approach has meant that competing
needs and demands within a given corridor are
not always best addressed. Moreover, schemes
have often been implemented piecemeal, as and
when funding has been available.
Following on from the Transport Innovation Fund
Studies, the ‘3 Point Plan’ was developed. One
of its elements is tackling congestion and, as part
of this, the Smart Routes concept was developed
as a holistic approach to corridor-based
improvements. Under the tacking congestion
element of the 3 Point Plan, initiatives include:
A. Role of Smart Routes
Most main transport corridors across the
Metropolitan Area accommodate a broad range
of activities, including the movement of people,
goods and pedestrians, parking and loading/
unloading, and other demands generated by
those who live, shop and work within and beyond
the corridor. The strategy must therefore provide a
coherent, efficient and effective approach to route
enhancements in a way that balances competing
needs of users and differing priorities.
Historically, a mode-focused approach has been
adopted whereby schemes were identified to
meet a single specific modal objective. This lack
Smart Routes – Developing a Strategic Network
• Bus Showcase - a high quality bus journey experience, transforming key bus routes with
comprehensive improvements to vehicles, bus priority measures and at-stop infrastructure
enhancements
• Red Routes – a comprehensive package of traffic management measures on strategic routes
aimed at making journeys for everyone quicker, more reliable and safer
• Congestion Target Delivery Routes – a co-ordinated and wide ranging set of measures on an
agreed network of routes focused on achieving delivery of the congestion target

58• Urban Traffic Management and Control Major Scheme
• Bus Partnership Initiatives – Transforming Bus Travel/Local Area Agreements/Network Reviews
• The TravelWise campaign and promoting cycling and walking for short journeys
• Quick Wins – a joint initiative with the Metropolitan Area business community to deliver small
scale highway improvements which complement other programmes and improve overall
highway efficiency
Smart Routes aim to build on the successes
of these individual programmes and focus on
coordination, to ensure maximum benefits from
increasingly limited resources. The opportunity to
create a consistent branding and communications
strategy for network initiatives, similar to the
Network West Midlands brand, is also an
important element.
Smart Routes represent an innovative approach,
putting the Metropolitan Area at the forefront of
best practice. It has been developed to provide
an attractive transport network that tackles
congestion, at the same time making the most
efficient use of the existing highway, to benefit all
users. This is fully in accord with both the Smarter
Management and the Smarter Choices Strategic
Principles that underlie LTP3.
The definition of Strategic Transport Corridors
underpins the strategic network and performs
a dual function, both as key transport links and
as places where people live and work (the ‘Link
and Place’ principle). Smart Routes represent the
cornerstone of this new strategy.
Objectives for the Smart Routes network are:
• An integrated package of improvements
combining the best of existing programmes
into a single route strategy/implementation
plan, making best use of available highway
space
• An equitable allocation of road space
between users (the ‘Link and Place’
principle)
• To provide vibrant safe and attractive
centres and secure improvements to the
public realm
• That all modes of transport are actively
considered during route strategy
development and the subsequent
implementation
• Sustainable travel solutions are integral
(Smarter Choices & Active Travel)
• Effective integration with stakeholders
throughout
59Furthermore, a number of guiding principles have
been identified:
• A corridor approach to development and
delivery with clearly defined corridor
strategies
• Improved governance and ownership
• Collaborative working between partners
and stakeholders
• Integrated communication
• Improved utilisation of resources
(financial and staff)
These are based on the principles of “Link
and Place.” This assumes that streets are two-
dimensional, having a link-dimension based
on through-movement, and a place-dimension
based on the street as a destination in its own
right. Different parts of the network have a
different balance between Link and Place status,
which then defines priorities and reflects the users.
English Heritage’s “Streets for All – West
Midlands” provides some useful examples and
identifies best practice in terms of improving the
public realm and built environment.
http://www.english-heritage.org.uk/publications/
streets-for-all-west-midlands/
By adopting the Smart Routes approach, the
following benefits are expected, compared to the
single-mode focused approach:
• Balanced and coordinated corridor
solutions that address the identified issues
and opportunities and consider the needs
of all street users at the same time
• Better opportunities to engage with the
public and key stakeholders
• A performance-led approach and a
monitoring regime to assess the impact of
measures that are implemented against
the agreed strategy
• Transparency in establishing the sometimes
difficult balance for competing demands on
frequently limited road space
• Improved visibility of larger programmes
and policies (National, Regional and Local
Level) and associated opportunities for
advance planning and co-ordination of
street works, resulting in less disruption
• Improved prospects for incorporating
sustainability and environmental objectives
• Efficiencies in the administration and
implementation of schemes through the
increased use of collaborative working
practices
• The most effective and efficient use of the
finite resources applied to any particular
corridor

60Local Authorities
Local Authorities, as Highway Authorities, support
and help improve bus services by delivering
highway priority measures, through a variety of
tools including bus lanes, Red Routes and junction
improvements using Smart Route principles. As
Planning Authorities, improvements to passenger
facilities including bus stations and bus stops
must also be supported and approved. Local
Authorities are also responsible for future highway
enhancements, which aim to improve overall
highway efficiency, improving bus reliability where
this aligns with overall corridor strategies and
undertake improvements that benefit walking and
cycling. Local Authorities also have a vital role to
play through the development of Smarter Choices
initiatives, including Company TravelWise.
Traffic Commissioner
The West Midlands Traffic Commissioner is
responsible for regulating bus and heavy
goods vehicles operations. In relation to
bus operations, the Traffic Commissioner
grants Operating (‘O’) Licenses to people or
companies that are competent, financially
sound and of ‘good repute.’ Anyone with an
‘O’ license who wishes to operate a local bus
service must register the details of the service
with the Traffic Commissioner. Thereafter, the
Traffic Commissioner can take action against
B. Partners: Roles and Responsibility
Centro
Centro works in partnership with Local Authorities
on the development of the Smart Routes
programme and to implement improvements
across the entire Area. Centro also coordinates
the other initiatives that support Smart Routes, i.e.
Quick Wins.
Bus Operators
Most bus services in the Area are operated on
a commercial basis by private bus companies.
The remainder of these services, those deemed
to be socially necessary and affordable, is
operated under contract to Centro by private bus
companies. The commercial network carries over
90% of bus passenger journeys. Commercial
and contracted services are operated by over 60
operators with National Express West Midlands/
Coventry being the dominant operator, with
approximately 80% of the market, and Diamond
Buses carrying approximately 10% of total
passenger numbers.

61C. Progress and Successes from LTP2
The Smart Routes concept is relatively new.
However, the individual programmes that are
included within it have demonstrated significant
successes over the LTP2 period.
Bus Showcase
As a result of the various Bus Showcase initiatives,
customers have expressed high levels of
satisfaction with the ease and comfort of using
Showcase buses, the convenient location of stops
and the frequency and speed of services.
Bus Showcase has also made significant
contributions towards achieving key LTP2 bus-
based targets, which include:
• Passenger increases of up to 30% on
several Bus Showcase routes against a
target of 9%
• Journey time reductions of up to 17%
• Increased punctuality by as much as 40%,
outperforming other bus routes
• Service satisfaction amongst Showcase
passengers of 86%, well above the 60%
LTP2 target.
• 78% of Bus Showcase passengers are
satisfied with on-bus security and 71% felt
safe in their waiting environment, higher
than for the general bus network
an operator that fails to run the bus service as
registered or if they fail to meet the competency,
financial or ‘good repute’ requirements of their
‘O’ license. This may happen if an operator uses
un-roadworthy buses.
Passenger Focus
Passenger Focus is an independent public body
set up by the Government to protect the interests
of Britain’s rail passengers and England’s bus
passengers outside London, coach passengers on
scheduled domestic services and tram passengers.
Although funded by DfT, their independence is
guaranteed by Act of Parliament. Their mission is
to get the best deal for passengers, with a strong
emphasis on evidence-based campaigning and
research. They use their knowledge to influence
decisions on behalf of passengers and work with
the public transport providers, passenger groups
and Government to secure journey improvements.
They are responsible for the National Rail
Passenger Survey.
Rail Industry
Smart Routes is not just about improvements to
the highway network, and in recognition of this
the rail industry will play an important role in their
development, through an integrated package
of improvements along those key corridors
where rail contributes significantly to passenger
movements.

62Red Routes
Red Routes were first introduced in the
Metropolitan Area in 2003 to make journeys
quicker, more reliable and safer for everyone.
Since then, a total of 14 Red Routes (66 km of the
highway network) have been fully implemented.
The results are encouraging and clearly
demonstrate that Red Routes make a positive
contribution to the achievement of LTP Objectives.
In particular, the following outcomes have been
recorded:
• Reduced journey times for overall traffic of
over 8%
• Reliability improvements on key routes of
up to 40%
• Bus journey time reductions and reliability
improvements of up to 21% and 30%
respectively
• Illegal parking reduced by over 60%
• Evidence of increases in pedestrian footfall
• Initial analysis indicates a reduction in
accidents of around 8%
Quick Wins
The Quick Wins programme was developed
in 2008 in partnership with the West Midlands
Chambers of Commerce. These have been
small-scale schemes within existing road-space
to improve capacity and efficiency of the network
for all traffic. Quick Wins complement other
network-wide schemes (e.g. Bus Showcase/
Red Routes/Congestion Target Routes) and are
implemented by individual district councils as part
of wider Integrated Transport programmes.
Congestion Target Routes
In accordance with the LTP2 Congestion Target
Delivery Plan, significant improvements have been
delivered on 19 key corridors. The impact of
these schemes ensured that we remained on track
to achieve the LTP2 target of:
“On target routes in the AM Peak (07:00-10:00) accommodate an expected increase in travel of 4% with a 5% increase in journey times between 2005 and 2011” As a result, we were successful in securing further
tranches of reward funding from DfT. Further
schemes have subsequently been identified to
further improve performance. The table below
provides details of the number of schemes to be
implemented and the level of funding required:
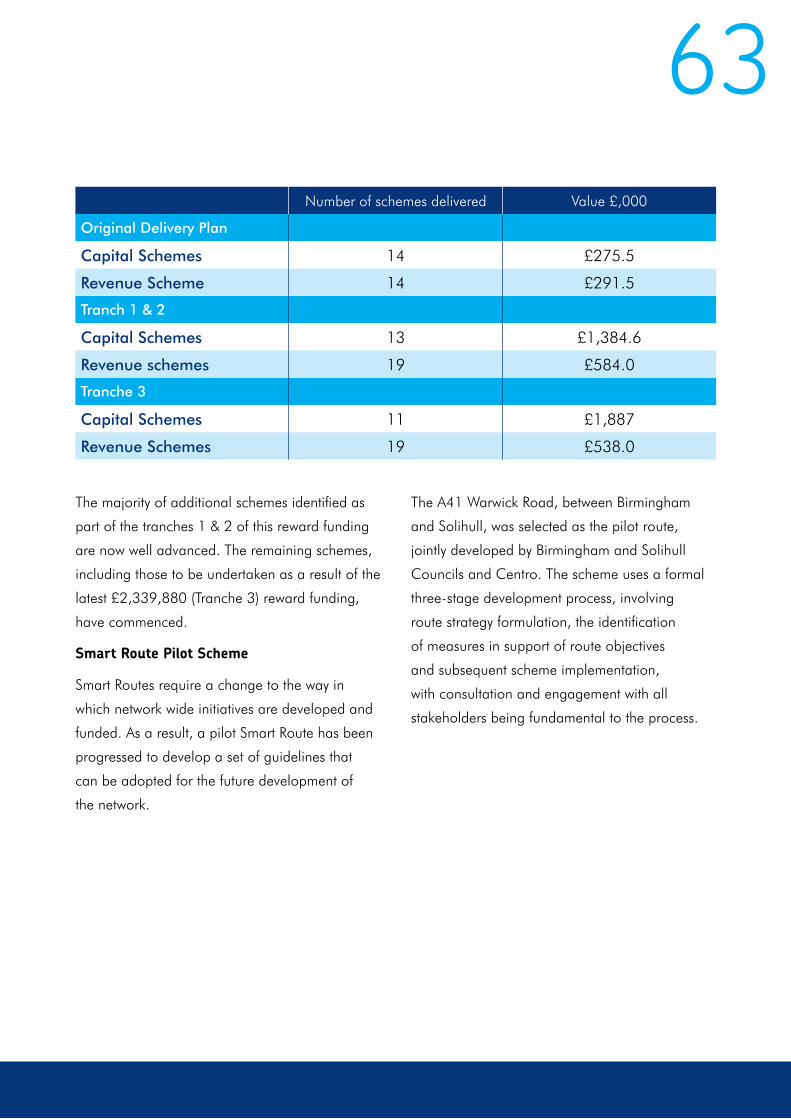
63Number of schemes delivered Value £,000
Original Delivery Plan
Capital Schemes 14 £275.5
Revenue Scheme 14 £291.5
Tranch 1 & 2
Capital Schemes 13 £1,384.6
Revenue schemes 19 £584.0
Tranche 3
Capital Schemes 11 £1,887
Revenue Schemes 19 £538.0
The majority of additional schemes identified as
part of the tranches 1 & 2 of this reward funding
are now well advanced. The remaining schemes,
including those to be undertaken as a result of the
latest £2,339,880 (Tranche 3) reward funding,
have commenced.
Smart Route Pilot Scheme
Smart Routes require a change to the way in
which network wide initiatives are developed and
funded. As a result, a pilot Smart Route has been
progressed to develop a set of guidelines that
can be adopted for the future development of
the network.
The A41 Warwick Road, between Birmingham
and Solihull, was selected as the pilot route,
jointly developed by Birmingham and Solihull
Councils and Centro. The scheme uses a formal
three-stage development process, involving
route strategy formulation, the identification
of measures in support of route objectives
and subsequent scheme implementation,
with consultation and engagement with all
stakeholders being fundamental to the process.
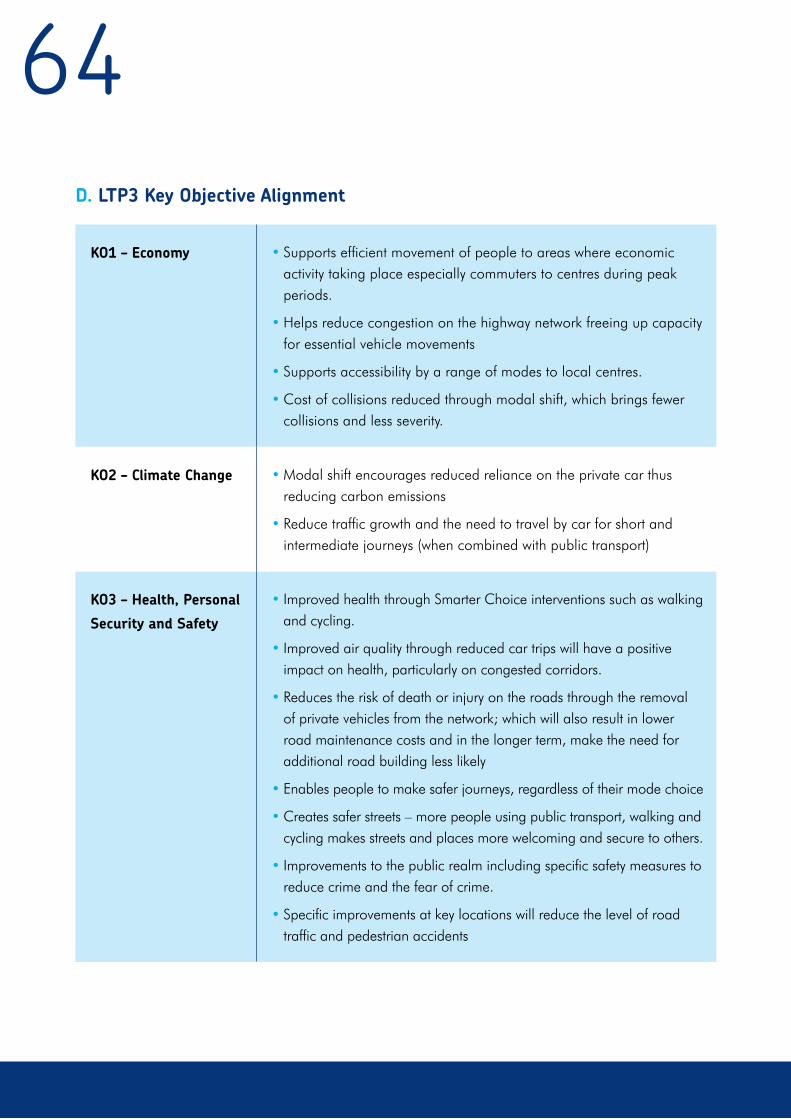
64D. LTP3 Key Objective Alignment
KO1 – Economy • Supports efficient movement of people to areas where economic activity taking place especially commuters to centres during peak periods.
• Helps reduce congestion on the highway network freeing up capacity for essential vehicle movements
• Supports accessibility by a range of modes to local centres.
• Cost of collisions reduced through modal shift, which brings fewer collisions and less severity.
KO2 – Climate Change • Modal shift encourages reduced reliance on the private car thus reducing carbon emissions
• Reduce traffic growth and the need to travel by car for short and intermediate journeys (when combined with public transport)
KO3 – Health, Personal
Security and Safety
• Improved health through Smarter Choice interventions such as walking and cycling.
• Improved air quality through reduced car trips will have a positive impact on health, particularly on congested corridors.
• Reduces the risk of death or injury on the roads through the removal of private vehicles from the network; which will also result in lower road maintenance costs and in the longer term, make the need for additional road building less likely
• Enables people to make safer journeys, regardless of their mode choice
• Creates safer streets – more people using public transport, walking and cycling makes streets and places more welcoming and secure to others.
• Improvements to the public realm including specific safety measures to reduce crime and the fear of crime.
• Specific improvements at key locations will reduce the level of road traffic and pedestrian accidents
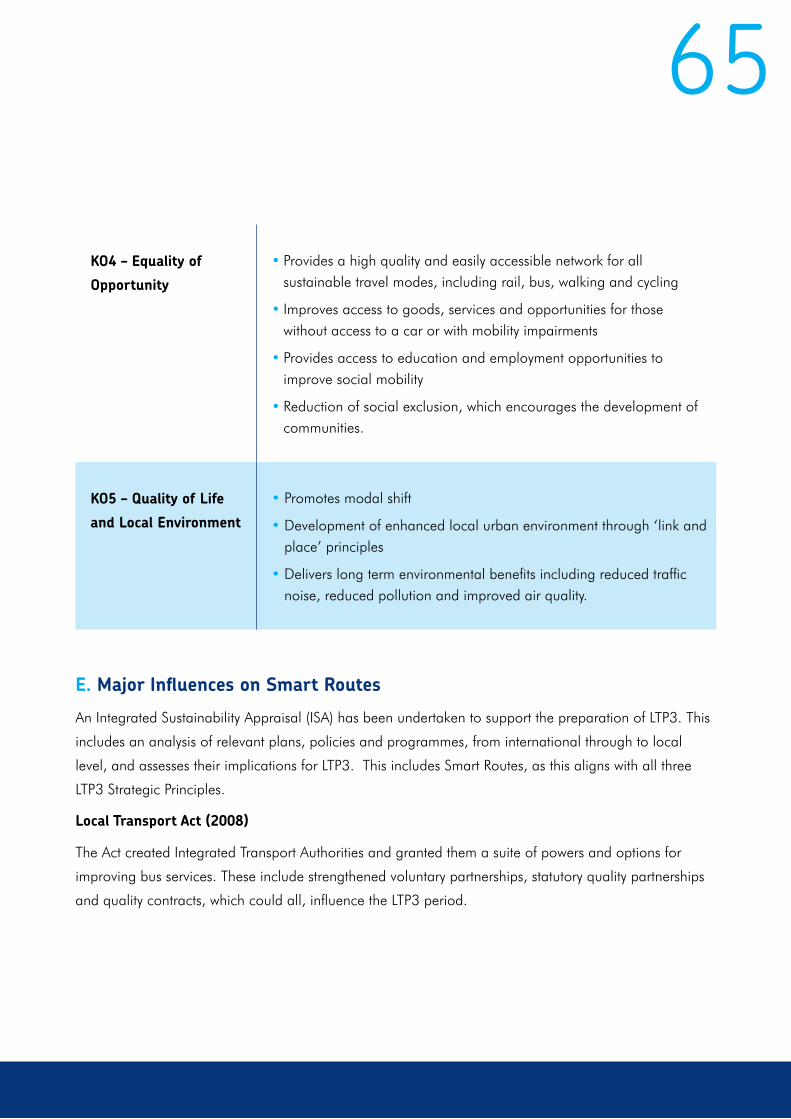
65
KO4 – Equality of
Opportunity
• Provides a high quality and easily accessible network for all sustainable travel modes, including rail, bus, walking and cycling
• Improves access to goods, services and opportunities for those without access to a car or with mobility impairments
• Provides access to education and employment opportunities to improve social mobility
• Reduction of social exclusion, which encourages the development of communities.
KO5 – Quality of Life
and Local Environment
• Promotes modal shift
• Development of enhanced local urban environment through ‘link and place’ principles
• Delivers long term environmental benefits including reduced traffic noise, reduced pollution and improved air quality.
E. Major Influences on Smart Routes
An Integrated Sustainability Appraisal (ISA) has been undertaken to support the preparation of LTP3. This
includes an analysis of relevant plans, policies and programmes, from international through to local
level, and assesses their implications for LTP3. This includes Smart Routes, as this aligns with all three
LTP3 Strategic Principles.
Local Transport Act (2008)
The Act created Integrated Transport Authorities and granted them a suite of powers and options for
improving bus services. These include strengthened voluntary partnerships, statutory quality partnerships
and quality contracts, which could all, influence the LTP3 period.
66Strengthened Voluntary Partnerships
The Act gives bus operators and Local Transport
Authorities more scope to negotiate non-
statutory agreements, with less risk of falling
foul of competition law. The Act also gives
Traffic Commissioners greater power to protect
voluntary arrangements from predatory or low
quality competition and to enforce performance
standards.
Statutory Quality Partnerships
Statutory Quality Partnerships (SQPs) allow for
binding agreements to be voluntarily entered
into between ITAs and bus operators. Under an
SQP, an ITA can provide improved infrastructure
(such as bus priority measures) on a corridor, and
negotiate the arrangements for the use of that
infrastructure by bus operators. SQPs can cover
vehicle standards, maximum fares, frequencies
and timings.
Quality contracts
Under Quality Contracts, private bus operators
would be invited to bid to operate a specified
network. Once an operator was appointed, it
would face no on-road competition and would
be free to concentrate on developing the local
market for bus travel, in partnership with the ITA.
Integrated Public Transport Prospectus &
Transforming Bus Travel
Centro, in conjunction with partners, has
developed the Integrated Public Transport
Prospectus (IPTP) which outlines the long term
vision for public transport across the Metropolitan
Area which takes into account housing growth
areas, regeneration zones in addition to existing
and future major developments. The principles
underlying the development of the IPTP are
supported by Smart Routes
The LTP3 period will bring significant quality
improvements to local bus services using the TBT
principles to address the needs and expectations
of current and future passengers. Building on
existing high levels of use for local journeys,
the aim is to achieve a local and international
reputation for innovative, forward-looking
provision, which is popular with customers. This
means that bus industry advances in vehicles,
planning, operation and customer service will
have a natural home in our Area.

67F. LTP3 Policies – Smart Routes
Within the context of LTP3 Objectives, the ISA and
the major influences to Smart Routes as outlined
above, the following Smart Routes policy has
been developed. A Sustainable Smart Package
bid will be made for funding from the new Local
Sustainable Transport Fund, incorporating Smart
Route and Smarter Choices development.
The criteria for determining the routes which
form the Smart Routes Strategic Network have
been developed using LTP3 guidance (DfT) which
states: “identifying the key local hubs (e.g. local
town centres, major employment and industrial
areas, retail centres, large housing developments),
strategic corridors (local main roads and main bus
routes) and any significant gateways”
The resulting Smart Routes Strategic Network
comprises approximately 5% of the total road
network in the Metropolitan Area, but carries a
significant proportion of all traffic. The draft Smart
Routes Strategic Network is shown below:
Policy HN6 – Smart Routes Network: To co- ordinate the development and implementation of a Smart Route network, including a common assessment of problems, joint consultation, common design and procurement activities

68A prioritisation process is being developed to identify
which routes should be taken forward, building on
techniques developed for the Pilot. This will consider
criteria such as regeneration/jobs, journey time,
congestion relief, impact on carbon emissions and
increasing public transport use.
Districts and Centro will develop a common
approach, as a framework for developing specific
proposals for individual corridors, with an emphasis
on gaining information on issues and challenges
Work by the Project team
Stage 1 - Developing the Smarter Route Strategy
Member Involvement
• Route and ‘impact area’ definition • Selection of stakeholder group • Setting of vision
• Segmentation of the route using Link/Place methodology • Route inspections • Gathering existing performance data • Producung ‘Issues and Opportunities’ drawings
• Identify route/segment priorities • Potential projects • Delivery Framework
• Revise ‘Issues and Opportunities’ drawings to incorporate feedback • ‘Before’ monitoring - SMART* + User Perception Surveys • Data analysis
Stakeholder / Public Engagement
in the proposed corridors, through effective local
engagement.
The delivery of a Smart Route will follow a three-
stage process:
• Stage 1 – Developing a
Smart Route Strategy;
• Stage 2 – Developing Route Measures; and
• Stage 3 – Implementation and Monitoring.
This key stages of this process are detailed below:
Confirmation from members
Feedback from Stakeholders
Take part in identifying ‘Issues and ‘Opportunities’
Public / Stakeholder engagement in gathering ‘Issues and opportunities’ information
Confirm and finalise Route Strategy
Review and Approve

69Work by the Project team
Stage 2 - Developing Route Measures
Stage 3 - Implementation and Monitoring
Member Involvement
• Developing of scheme options • Early contractor involvement
• Implementation
• Monitoring and evaluating
• Options appraisal
• Detail Design of preferred options
• Setting of monitoring and evaluation requirements
Stakeholder / Public Engagement
Member Engagement
Public /Stakeholder engagement in design development
Review and Approve projects
Review and Approve
Public / Stakeholder consultation on route measures
Confirm Route measures to proceed
Advise members of outcomes
Advising public of site works
Advising public & press of outcomes
Future Smart Routes will follow this approach, with a level of detail bespoke to the individual nature of
the route being considered.

LTT3: MODAL TRANSFER AND THE CREATION OF SUSTAINABLE TRAVEL PATTERNS (MT)
70
71
seek to work with the District Councils to ensure
a balanced parking policy is established within
the Metropolitan Area, to promote the vitality
of centres, support modal shift and act as an
appropriate form of demand management.
Increased on-street parking can have adverse
impacts on road safety, especially for pedestrians
and cyclists, with social inclusion and equality
implications. Inappropriate and obstructive
car parking can also increase general traffic
congestion as well as creating difficult access
conditions for emergency and refuse collection
vehicles and bus services. Residential parking
policies need to address these issues at the
local level.
A. Role of Car Parking
The availability of car parking is a significant
factor in influencing peoples’ choice of travel
mode. Therefore its provision, control and
management is fundamental to the development
of a balanced transport strategy, both in ensuring
economic centres remain vibrant, and also,
through resident parking initiatives, promoting
residential areas as attractive places to live.
Parking policy can also support Smarter Choices
initiatives, through providing dedicated car
parking spaces for Car Club members.
Car park design, location and access
arrangements, alongside their provision, charging
regimes and general management, are an
important factor in delivering LTP3. The ITA will
Car Parking
B. Car Parking: Roles and Responsibilities
Local Authorities
The District Councils, as Local Planning Authorities, have a major role in determining how new car
parks and new development with parking facilities contribute to these Objectives.
Centro
Centro operate a number of public transport-related car parks and therefore also has a major
role to play.
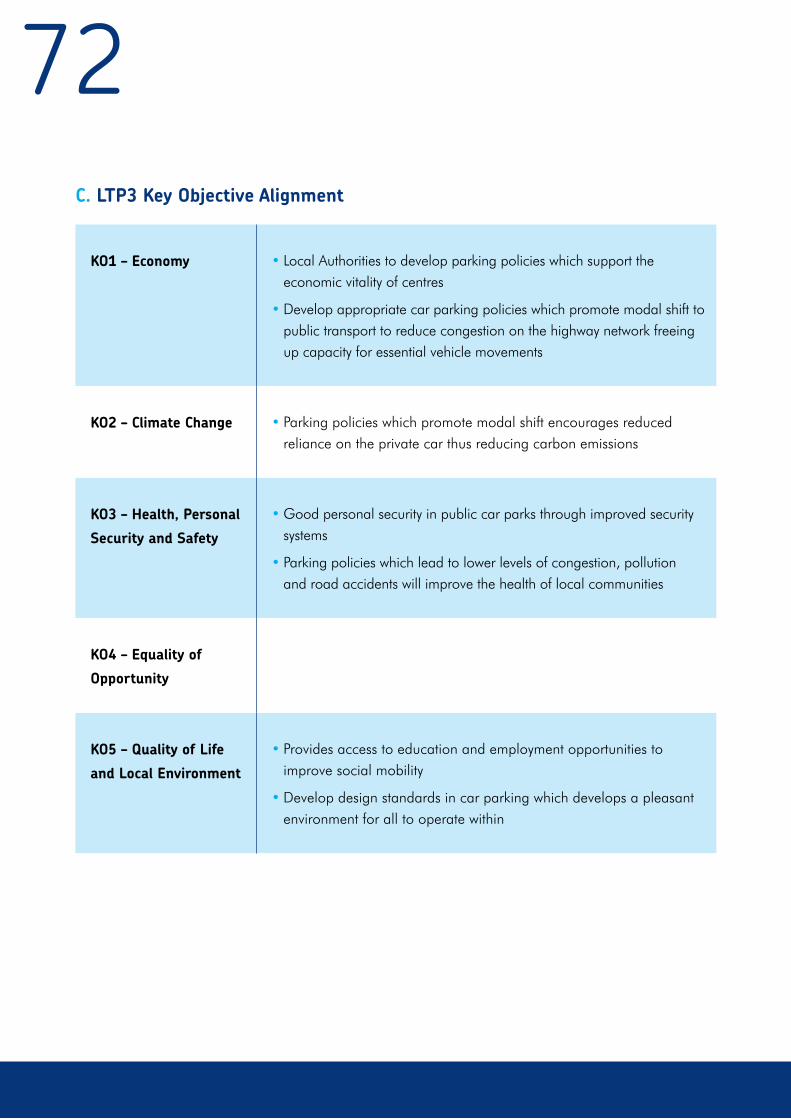
72C. LTP3 Key Objective Alignment
KO1 – Economy • Local Authorities to develop parking policies which support the economic vitality of centres
• Develop appropriate car parking policies which promote modal shift to public transport to reduce congestion on the highway network freeing up capacity for essential vehicle movements
KO2 – Climate Change • Parking policies which promote modal shift encourages reduced reliance on the private car thus reducing carbon emissions
KO3 – Health, Personal
Security and Safety
• Good personal security in public car parks through improved security systems
• Parking policies which lead to lower levels of congestion, pollution and road accidents will improve the health of local communities
KO4 – Equality of
Opportunity
KO5 – Quality of Life
and Local Environment
• Provides access to education and employment opportunities to improve social mobility
• Develop design standards in car parking which develops a pleasant environment for all to operate within

73
• Ensure that, as part of a package of
planning and transport measures, levels
of parking provided in association with
development will promote sustainable
transport choices
• Not require developers to provide more
spaces than they themselves wish, other
than in exceptional circumstances which
might include for example where there
are significant implications for road safety
which cannot be resolved through the
introduction or enforcement of on-street
parking controls
• Encourage the shared use of parking,
particularly in town centres and as part of
major proposals - for example offices and
leisure uses (such as cinemas) might share
parking because the peak levels of use do
not coincide, provided adequate attention
is given at the design stage
D. Major Influences On LTP3 Car Parking
An Integrated Sustainability Appraisal (ISA) has been undertaken to support the preparation of LTP3. This
includes an analysis of relevant plans, policies and programmes and their implications for LTP3, including
parking. Building on the policy framework identified for parking by the ISA, the following have been
identified as major influences on parking over the LTP3 period.
Planning Policy Guidance PPG13 remains the main focal point for parking policy in LTP3, along with PPS3.
This outlines the following:
• Take care not to create perverse incentives
for development to locate away from
town centres or threaten future levels of
investment in town centres. While greater
opportunities exist to reduce levels of
parking for developments in locations
with good access by non-car modes,
Local Authorities should be cautious in
prescribing different levels of parking
between town centres and peripheral
locations, unless they are confident that
the town centre will remain a favoured
location for developers. Advice in PPG6
makes clear that good quality secure
parking is important to maintain the vitality
and viability of town centres and to enable
retail and leisure uses to flourish
• Require developers to provide designated
parking spaces for disabled people in
accordance with current good practice
74E. LTP3 Policies – Car Parking
Policy MT1 – Car Parking: To ensure car parking
policies and provision support the LTP3 aims
of encouraging sustainable transport patterns
across the Metropolitan Area and promote
vitality of centres. Such policy interventions may
include availability and car park pricing
The ITA has primarily an influencing role in the
implementation of this policy. It will ensure that its
own car parking policies and provision in respect
of its own facilities support the development of
sustainable travel patterns. Furthermore, it will
encourage its District Council Partners to ensure
that their car parking policies meet the same
objectives.
• Where appropriate, introduce on-street
parking controls in areas adjacent to major
travel generating development to minimise
the potential displacement of parking
where on-site parking is being limited
• Generate development to minimise the
potential displacement of parking where
on-site parking is being limited
• Require convenient safe and secure cycle
parking in development at least at levels
consistent with the cycle strategy in the
local transport plan
• Consider appropriate provision for
motorcycle parking
75
Centro
Centro works with stakeholders to identify,
develop, implement and review bus and rail
schemes and strategies, including concessionary
travel and supported services, across the
Metropolitan Area. Centro, together with Local
Authority partners, encourages more sustainable
travel to be considered rather than car use.
A. Role of Demand Management
Travel patterns reflect the different journeys people make in their daily lives. With the majority of services
and businesses being located in large centres, travel demand (both private and public transport) tends
to be focused on key corridors. Where demand for highway and junction capacity exceeds supply, this
leads to congestion, meaning longer and less reliable journeys whilst slow, regularly stopping traffic
reduces air quality. The impact on the local economy alone is estimated at between £1.5-2.5 billion
per annum. To reduce pressures on the network, demand management measures are used to influence
travel behaviours: to encourage people to travel at different times, by different modes or to travel shorter
distances or, indeed, to evaluate their need to travel at all.
B. Demand Management: Roles and Responsibility
Demand Management and Reducing the Need to Travel
Local Authorities
Local Authorities have powers to develop and
implement most demand management measures,
such as those based around Local Authority
owned assets, for example policies regulating
the use of the highway network (traffic regulation
orders), pricing of local/ strategic centre car
parks, duration of on-street parking, and longer
term measures associated with land use planning.

76
C. Progress and Successes from LTP2
West Midlands Transport Innovation Fund (TIF)
LTP2’s approach to demand management
focused on TIF. Centro, in partnership with the
Local Authorities, developed proposals centred
upon using central TIF resources to help fund a
package of transport initiatives, including high
quality public transport provision and highway
improvements. Under the terms of TIF, some of the
resources required would be paid for using road
pricing based demand management measures.
The report concluded that road pricing was not
the right solution to tackle traffic congestion in the
Metropolitan Area at that time. It demonstrated
that whilst the road pricing designs tested would
produce reductions in congestion, they would not
meet the conditions laid down by the Metropolitan
Area authorities. In particular, the work showed that:
Highways Agency
The Highways Agency (HA) manages motorway traffic to reduce congestion and address air quality
issues. Their ‘Influencing Travel Behaviour’ programme seeks to promote sustainable travel and reduce
congestion on England’s strategic road network. Through this, the HA aims to cut congestion by
influencing travel behaviour, providing access to information to help people make smarter travel choices
and introducing demand management measures in congestion-prone areas, such as access controls
(ramp metering). The HA is a statutory consultee in the planning process, both in the formulation of
development plans and in the consideration of planning applications, with respect of impacts on the
strategic road network. The HA also work with developers and employers on Travel Planning.
Businesses and Employers
Businesses, especially those with large numbers of employees, have a role in that they can adopt
Workplace Travel Plans to encourage staff to travel by more sustainable means, or at times outside the
peak periods or to reduce overall travel demand. This can involve establishing car-share arrangements,
providing facilities for cyclists, helping with the cost of public transport season tickets, being flexible over
working hours and allowing home-working. Reviewing business travel arrangements, for example to
encourage more use of public transport instead of the car, is another form of demand management.

77• Road pricing would deliver very mixed
results in terms of reducing congestion.
There would be either no, or a negligible
benefit, to Coventry, Wolverhampton
and the Black Country. In Birmingham,
although some benefits would be realised,
future ‘vehicle hours’ would be reduced
only to current levels;
• There would be only a marginal gain for
business as the costs to companies would
almost equal the benefits they would attain
through increased journey times;
• The most suitable pricing scheme would
be based on time, distance and place,
although currently the technology is not yet
available, and may not be until 2021;
• Both business and residents acknowledged
that whilst congestion must be tackled,
they expressed doubts that road pricing
was the best solution;
• The Government had not set a national
road pricing strategy
The extensive research undertaken by the TIF
study has informed LTP3 development towards
demand management as outlined below.
Smarter Choices
There have been a number of successes within the
broader Smarter Choices programme, including
TravelWise initiatives such as Company TravelWise
and the regional TravelWise campaign.
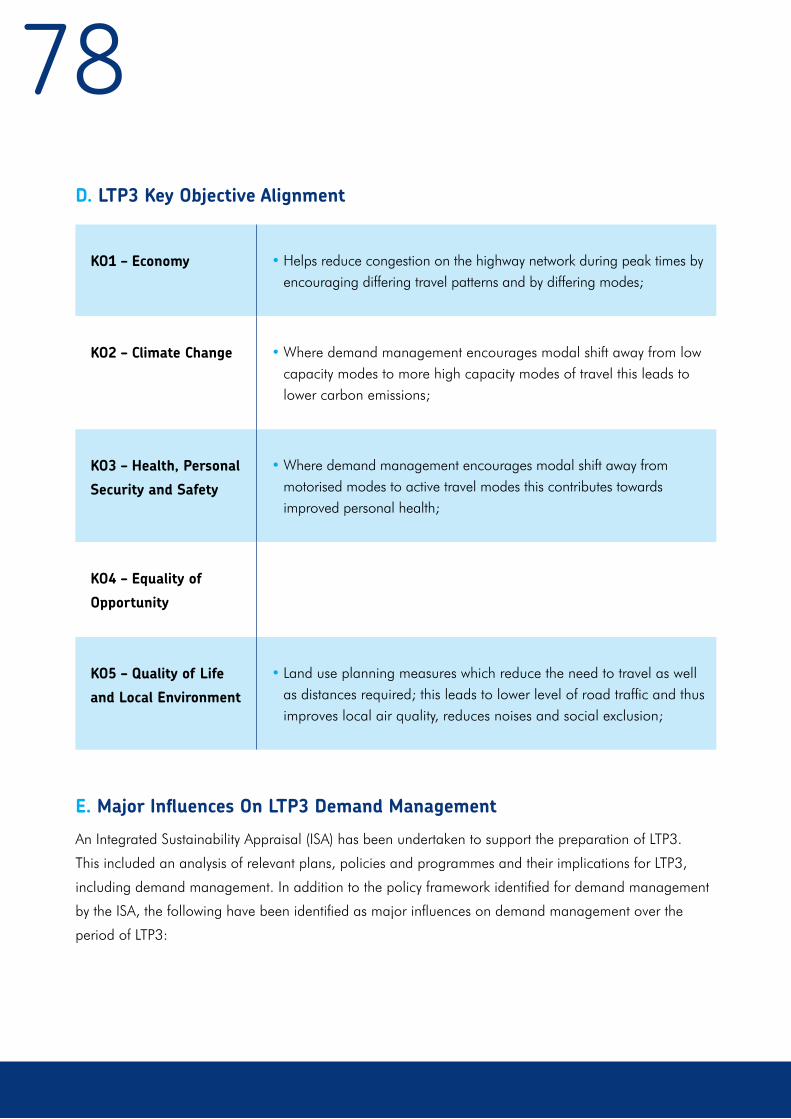
78D. LTP3 Key Objective Alignment
KO1 – Economy • Helps reduce congestion on the highway network during peak times by encouraging differing travel patterns and by differing modes;
KO2 – Climate Change • Where demand management encourages modal shift away from low capacity modes to more high capacity modes of travel this leads to lower carbon emissions;
KO3 – Health, Personal
Security and Safety
• Where demand management encourages modal shift away from motorised modes to active travel modes this contributes towards improved personal health;
KO4 – Equality of
Opportunity
KO5 – Quality of Life
and Local Environment
• Land use planning measures which reduce the need to travel as well as distances required; this leads to lower level of road traffic and thus improves local air quality, reduces noises and social exclusion;
E. Major Influences On LTP3 Demand Management
An Integrated Sustainability Appraisal (ISA) has been undertaken to support the preparation of LTP3.
This included an analysis of relevant plans, policies and programmes and their implications for LTP3,
including demand management. In addition to the policy framework identified for demand management
by the ISA, the following have been identified as major influences on demand management over the
period of LTP3:

79Low Emission Towns and Cities Programme
European Directives on air quality have been
translated into Part IV of the Environmental Act
1995. This introduced a national framework for
air quality management. The framework required
Local Authorities to assess air quality, identify
concerns, designate Air Quality Management
Areas (AQMA) and develop an action plan to
improve air quality.
To meet AQMA targets and objectives, the seven
Metropolitan Authorities are developing proposals
for a Low Emission Town and Cities Programme
(LETCP), with the following five strands:
1. Development of a Low Emission Strategy
2. Development of a Regional Low Emission
Strategy Supplementary Planning Document
3. Regional Best Practice Guidance on
Procurement
4. Development of urban centre Low Emission
Zone model
5. Low Emission Strategy Assessment Report
Of relevance to LTP3 is the development of the
Low Emission Strategy and Low Emission Zone(s).
These will be drawn up and implemented to meet
environmental objectives, whilst ensuring high
quality public transport access and appropriate
freight access.
E. LTP3 Policies – Demand Management
Within the context of LTP3 Objectives, the ISA and
the major influences on LTP3 outlined above, the
following LTP3 Demand Management policy has
been developed. The specific interventions will be
detailed in the Implementation Plan.
To reduce congestion on the highway network,
LTP3 focuses on the development of high quality
public transport and encourages sustainable
travel patterns. However, such an approach also
needs to be appropriately balanced with demand
management. In the short term, Districts and
Centro will continue on-going measures balanced
around localised needs and priorities such as car
park charging, road space reallocation and land
use planning.
Policy MT2 - Managing Travel Demand:
To seek to manage travel demand through a
mix of hard and soft measures to encourage
sustainable travel patterns, including:
• Car parking policies
• Prioritising the use of the highway network
• Encouraging Smarter Choices
• Land use planning policies
• Encouraging people and business to reduce
the need to travel via virtual travel and co-
location of facilities through the land use
planning process

80In the longer term, the Metropolitan Area is
forecast to generate significant additional trips,
due to economic and housing growth. Forecasts
from DfT, Metropolitan Area authorities and the
RAC all point to long-term growth in car kilometres
(DfT 28% by 2025 from 2003, Metropolitan Area
Authorities 33% by 2021 from 2001 and RAC 32%
increase for the region by 2041 from 2005). With
spatial planning policies focusing development
on centres, additional trips will subsequently be
focused on major transport corridors, adding to
existing pressures on these networks.
Therefore, the District Authorities and Centro will
ensure appropriate demand management measures
are delivered across the Metropolitan Area which
help meet LTP3 Objectives but do not adversely
impact on the economy of the Area nor reduce
people’s ability to make their journeys, but rather
encourage sustainable travel patterns overall.
Such measures include:
Parking Policies
• Parking policies regarding the availability
and pricing of spaces related to duration
and different times of day, including
provision for secure overnight parking of
freight vehicles and rest period parking will
be kept under review and co-ordinated by
the metropolitan authorities.
Prioritising Use of the Highway Network
• Authorities will review the performance
of the local highway network and, in
consultation with frontagers, bus operators,
police and others, consider giving priority to
buses as a high capacity mode; modifying
traffic orders to give exemption for eco
friendly freight vehicles at particular times
of day to improve the local environment;
cyclists having contra flow use of one way
streets to encourage active modes; etc
Encouraging Smarter Choices
• A principal aim of Smarter Choices is
to discourage use of the car for those
journeys that can be undertaken by a more
sustainable mode. This would reduce
congestion, improve reliability of journey
times, reduce air pollution and support
reallocation of capacity to more active
modes such as providing additional cycle
lanes and pedestrian crossings.
Planning Policies
• The formulation of appropriate spatial
planning policies by the Local Planning
Authorities, and their subsequent
application through the Development
Management process, can have a
significant positive impact, both upon
demand management and upon the
adoption of Smarter Choices initiatives.
Such policies will be appropriate to
future Development Plan Documents,
including Core Strategies and Area Action
Plans relating to specific areas such as
city, town and district centres, and to
future employment and housing sites.
Furthermore, it is acknowledged that some
existing documents, such as the Black
Country Joint Core Strategy already have
policies relating to demand management
and Smarter Choices.
81
A. Role of Smarter Choices (Including Active Travel – walking and cycling)
As part of the TIF work and the West Midlands Sustainable Travel Cities bid, a package of Smarter
Choice measures was researched and developed. This consists of a range of initiatives to change
individuals’ travel behaviour in favour of the more sustainable modes and also to question the need to
travel in the first place. It is one of the three Strategic Principles of LTP3. These include:
Changing Travel Behaviour and Smarter Choices
• Providing better information about travel
options
• Actively marketing sustainable travel
options
• Improving transport services to better meet
people’s needs
• Providing options that reduce the need to
travel at all.
These are implemented through measures such as:
• Workplace travel plans
• Travel awareness campaigns such as
TravelWise
• School travel plans (for addressing the
‘School Run’)
• Personalised travel planning
• Public transport marketing
• Travel awareness campaign
• Smarter working techniques such as
teleworking and home working
• Introducing cycling and walking schemes
and initiatives
• Establishing car clubs and car sharing
schemes
• Cycle training in schools and the
Integrated Training Programme for Cycling
and Cycle Training West Midlands
The evidence base shows that they can deliver the
following important benefits:
• Reduce modal share of single occupancy
cars and increase the modal share of
public transport, walking, cycling and car
sharing;

82• Play a role in addressing the ‘School Run’
• School Travel Planning can influence the
travel attitudes of future generations
• Improve health and safety
• Reduce the overall number of car trips; and
• Change the timing of travel, in particular
reduce car travel during peak periods
Alongside these transport benefits, Smarter
Choices play a significant role in delivering wider
environmental, economic and societal benefits
including:
• Physical health and fitness benefits from
an increase in active travel modes (walking
and cycling);
• Improved accessibility to workplaces,
schools and community services and hence
reduce social exclusion;
• Reduce staff absenteeism and improve staff
retention;
• Reduce land take for car parking provision;
• Improve safety and security; and
• Improve local environmental quality.
In July 2004, DfT published a major research
report, ‘Smarter Choices – Changing the Way
We Travel’ based on 24 UK case studies and
a worldwide literature review into the effects of
such measures. It suggested that a combination
of behavioral measures alone could reduce peak
period urban traffic by up to 21%.
Recent results from the DfT initiative, ‘Sustainable
Travel Towns’ Projects (Darlington, Peterborough
and Worcester) indicate reductions in traffic
of over 10% and similar increases in public
transport, walking and cycling over 2 years.
The work conducted as part of ‘Gridlock or
Growth – Choices and Challenges for the Future’
estimated that widespread use of such initiatives
here in the Metropolitan Area could reduce daily
car trips by 4% and increase public transport use
and cycling by 10%.
Transport for London (TfL) has completed
extensive work, developing and implementing
workplace and school travel plans across London.
Results for workplace travel plans show an
average 13% mode shift away from car journeys.
The monitoring of school travel plans is showing
a 6% mode shift away from car and towards more
sustainable modes of travel.
Smarter Choice initiatives are not only about
getting people out of their cars and onto public
transport – they also encourage active travel such
as walking and cycling. These active modes play
a vital role in a sustainable transport strategy and
can make a positive contribution towards the
achievement of the LTP3 Objectives.
Walking and cycling are a simple way for people
to incorporate more physical activity into their
lives and are also important for increasing access
to jobs, education and services for many people.
However, in England we have some of the lowest
rates of walking and particularly cycling in

83Europe. Cycling also provides benefits for physical
fitness and health, which can be significant
against the current background of rising obesity
levels, particularly among children. A recent
study has estimated that by 2050, 60% of the UK
population could be obese, with the economic
cost of obesity reaching £49.9 billion at
today’s prices.
Over recent decades, increasing prosperity, car
ownership and demand (in particular for longer
trips) has seen overall car mileage grow and
demand for rail travel increase. However at a
national level, trips by walking and cycling have
been in long-term decline, to the point where
only 2% of trips are cycled. The number of
walking trips has also been in decline, although
overall distance travelled is largely unchanged,
suggesting that when walking, people are taking
fewer but longer trips.
At a time when public finances are coming under
increased pressure, focus must be placed on the
potential of low-cost, sustainable measures like
walking and cycling to contribute to tackling these
challenges. In particular, as we are in the grip
of an obesity epidemic, we cannot afford to miss
the opportunity to get more people walking and
cycling. The evidence is clear: integrated walking
and cycling strategies can get more people active
and deliver significant benefits, offering high value
for money.
More active travel can also bring business benefits
– a healthier, more active workforce means
reduced absenteeism and increased productivity,
and reduced congestion means better journey
time reliability. This also benefits the environment
– journeys made on foot or by bike rather than
car reduce emissions and contribute to a better
local environment.
Walking and cycling are not viable options for all
journeys, but are appropriate for many journeys
under 5 miles that are currently made by car.
• 66% of all trips are of less than 5 miles
(a distance which can many people could
cycle in half an hour); more than half of
these are made by car.
• 22% of trips are of less than 1 mile (about
20 minutes’ walk), 20% of which are made
by car.
There is also potential for walking and cycling to
be integrated into longer journeys e.g. integration
with sustainable modes such as public transport
would support mode shift from the private car.
Regular physical activity of moderate intensity,
such as walking or cycling, can bring about major
health benefits and an improved quality of life.
People who are physically active can significantly
reduce their risk of developing major chronic
diseases – such as coronary heart disease, stroke
and type 2 diabetes – by up to 50%, and the risk
of premature death by about 20–30%.

84
1 Foresight Tackling Obesities: Future Choices, Government Office of Science, 2007
Much work has been undertaken by Centro
and the District Councils, to develop and
deliver Smarter Choices solutions. Through the
Network West Midlands and TravelWise brands,
sustainable travel teams have been delivering
travel plans to schools, workplaces, residential
areas and rail stations to encourage modal shift
away from the private car.
It is recognised that continued growth in car
traffic will create air and noise pollution which
discourages active travel and detracts from
the quality of urban space. Through Smarter
Choices, reduced road traffic and increased
use of active travel increases levels of social
interaction, social networks and quality of urban
life thereby attracting and retaining investment
and supporting regeneration.
Smarter Choices also have a role to play in land
use planning by providing locational policies to
ensure that developments are put in the right
place, with the right sustainable transport links to
maximise use of public transport and active travel.
Both Smarter Choices and active travel are often
cheaper and easier to deliver than infrastructure-
based transport schemes. Emerging work shows
very high value for money from Smarter Choices
solutions. They also are more easily scaleable and
have shorter delivery times, meaning they can be
quickly adapted to suit changing circumstances or
uncertain levels of funding.
B. Partners: Roles and Responsibility
Centro
Centro and the Metropolitan Authorities work
together on developing and implementing
Smarter Choices. This is primarily through
providing public transport information, promoting
public transport and supporting the public
transport aspects of businesses and schools
that have set up travel plans. Centro works in
partnership with operators (under the Network
West Midlands brand) to develop integrated
ticketing that meets customer needs. Centro
also provides a range of concessionary fares
for children, the elderly and disabled travellers.
Alongside this, it negotiates discounts on
public transport season tickets for sale through
the Company TravelWise scheme and is also
responsible for developing www.letzgogreen.org,
an educational resource for schools and pupils to
learn about sustainable travel.
Local Authorities
The Metropolitan Authorities have Sustainable
Travel Teams, working with schools, businesses
and communities to develop and implement travel
plans. They are also responsible for the delivery of
walking and cycling infrastructure improvements.
The Districts are also responsible for development
control and can stipulate the inclusion of travel
plans and other sustainable travel measures
through planning conditions. They provide

85training and promotion of walking and cycling
and work closely on the Regional TravelWise
campaign and support initiatives such as
Company TravelWise. A number of Metropolitan
Authorities are working in partnership with
Living Streets and CTC on walking and cycling
initiatives. They are also responsible for Rights of
Way Improvements Plans.
Highways Agency (HA)
The Highways Agency works in partnership
with Centro and the Districts to develop their
Influencing Travel Behaviour programme, which
includes Area Travel Plans around business/
industrial parks in close proximity to the
motorway network.
ACT TravelWise
ACT TravelWise is the UK’s premier network for
all organisations working to promote sustainable
travel. It promotes a society in which people
and organisations can meet their travel needs in
ways that protect and enhance the environment,
improve public health and support community
well being. It provides support to members, by
means of a regional structure, through learning
opportunities, partnership working, marketing
support and networking events, all with a specific
focus on building expertise and experience in
travel planning and other cost-effective demand
management measures.
Bus Operators
Most bus services in the Area are operated on
a commercial basis, by private bus companies.
The remainder of these services, those deemed
to be socially necessary and affordable, is
operated under contract to Centro by private bus
companies. The commercial network carries over
90% of bus passenger journeys. Commercial
and contracted services are operated by over 60
operators with National Express West Midlands/
Coventry being the dominant operator, with
approximately 80% of the market, and Diamond
Buses carrying approximately 10% of total
passenger numbers.
Homes and Communities Agency (HCA)
The Homes and Communities Agency is the
national housing and regeneration delivery
agency for England. Their role is to create
thriving communities and affordable homes.
Through the HCA, housing development sites
are developed near public transport services and
include provision of walking and cycling routes.
Job Centre Plus
Centro in partnership with Job Centre Plus and
other partners deliver the WorkWise scheme in
Birmingham, Dudley, Sandwell, North Solihull,
Walsall and Wolverhampton. This initiative
helps jobseekers overcome travel barriers to
employment by offering free travel together
with advice on sustainable transport options for
getting to job interviews.

86If successful in those interviews they can then
obtain free travel to their new job for the first three
months of employment.
Sustrans
Sustrans provides creative, innovative and
practical solutions to the transport challenges
affecting us all. By working with communities,
Local Authorities and many other organisations,
Sustrans creates change by putting people at the
heart of activities, enabling many to travel in ways
that benefit their health and the environment.
Primary Care Trusts (PCTs) and successor
bodies
Centro works in partnership with PCTs on the
common objective of improving the health and
wellbeing of the people they serve. PCTs can
encourage sustainable and healthy ways of
travelling to their sites, such as by cycling or
walking.
British Waterways
Canal towpaths are becoming more popular as
‘green’ routes for walking and cycling. British
Waterways are responsible for access points to the
canal network and for towpath maintenance.
C. Progress and Successes from LTP2
The targets set as part of LTP2 for the number of
school and workplace travel plans are on track to
be met. These were defined as:
•100% of schools to have travel plans by
2011.
•30% of all employees to work in
organisations committed to work place
travel plans by 2011.
The Metropolitan Area is on track to meeting
these targets due to the success of its school and
workplace travel planning. For 2010, the school
census figures for the Metropolitan Authorities show
a car-use percentage figure which is 1.5% lower
than the figure for 2009. Alongside this, there
have been successes in establishing car sharing
schemes. In 2008, the West Midlands won the ACT
TravelWise region of the year in recognition of the
work done on sustainable travel. In addition, the
Regional TravelWise portal has been set up (www.
travelwisewestmids.org.uk), as well as associated
individual websites such as School TravelWise,
Company TravelWise, Residential TravelWise, and
Community TravelWise.
87The LTP2 target for cycle use was “a 1% increase
in the cycling index between 2003/4 and
2010/11”. At the end of 2009/10, an increase of
23% had been achieved over the baseline figure.
The profile of Smarter Choices has continued to
rise over the LTP2 period, are recognised as an
integral element of the LTP3 strategy, and remain
a high priority.
A corridor based Smarter Choices strategy has
been developed. The principles of this were used
to develop the West Midlands Sustainable Travel
Cities bid. Alongside this, the Network West
Midlands (NWM) brand has been developed
and positioned as a strong unified consumer and
campaign vehicle for all forms of sustainable
travel and Smarter Choices work across the region.
Centro and the Metropolitan Authorities have
worked together to develop an integrated
communications strategy, which defines the
relationship between NWM and TravelWise,
and seeks to influence travel behaviour, both
through broad awareness campaigns, using mass
media, and through targeted corridor initiatives
supported by the advisory and travel planning
services provided by the Sustainable Travel teams.
In terms of active travel, much more emphasis
has been placed on the importance of this,
particularly through the health sector. Department
for Health and local PCTs have been involved in
establishing the health benefits of active travel.
The West Midlands Physical Activity Network (PAN
– WM) was established in 2006 and supports the
development of active lifestyles.
The introduction of the WorkWise initiative has
seen significant success. This helps to overcome
very real transport barriers experienced by people
seeking employment. Achievements have been
recognised both locally and nationally e.g.
the 2007 Guardian Public Services award for
Service Delivery (Transport category) and the
National Transport Award (Accessibility Category).
Monitoring has shown that 89% employees have
continued to use public transport after 6 months.
These achievements are a result of the successful
partnership approach favoured by Centro and the
commitment of our partners. WorkWise is seen
as a valuable asset, not only to the individuals
assisted by the scheme, but also to local
communities and employers.

88D. LTP3 Key Objective Alignment
KO1 – Economy • Supports efficient movement of people to areas where economic activity taking place especially commuters to centres during peak periods.
• Helps reduce congestion on the highway network freeing up capacity for essential vehicle movements
• Active modes make the best use of space and are unaffected by motor vehicle congestion.
• Business journeys made by active travel are more reliable and consistent because origin to final destination times are more dependable.
• Walking and cycling are resilient to disruption of travel networks through (e.g.) vehicle collisions/crashes, transport worker strikes and road repairs.
• Lower traffic levels and associated noise and air pollution and physical dominance of urban space create a higher quality urban environment, which promotes regeneration and the attraction and retention of investment.
• Increased oil prices and supply fluctuations have no impact on active travel modes.
• Small scale walking and cycling schemes, training and promotion can have high cost benefit analysis and offer greater value for money.
• Active employees are healthier, more productive and less likely to take time off sick.
KO2 – Climate Change • Modal shift encourages reduced reliance on the private car thus reducing carbon emissions
• Reduce traffic growth and the need to travel by car for short and intermediate journeys (when combined with public transport)
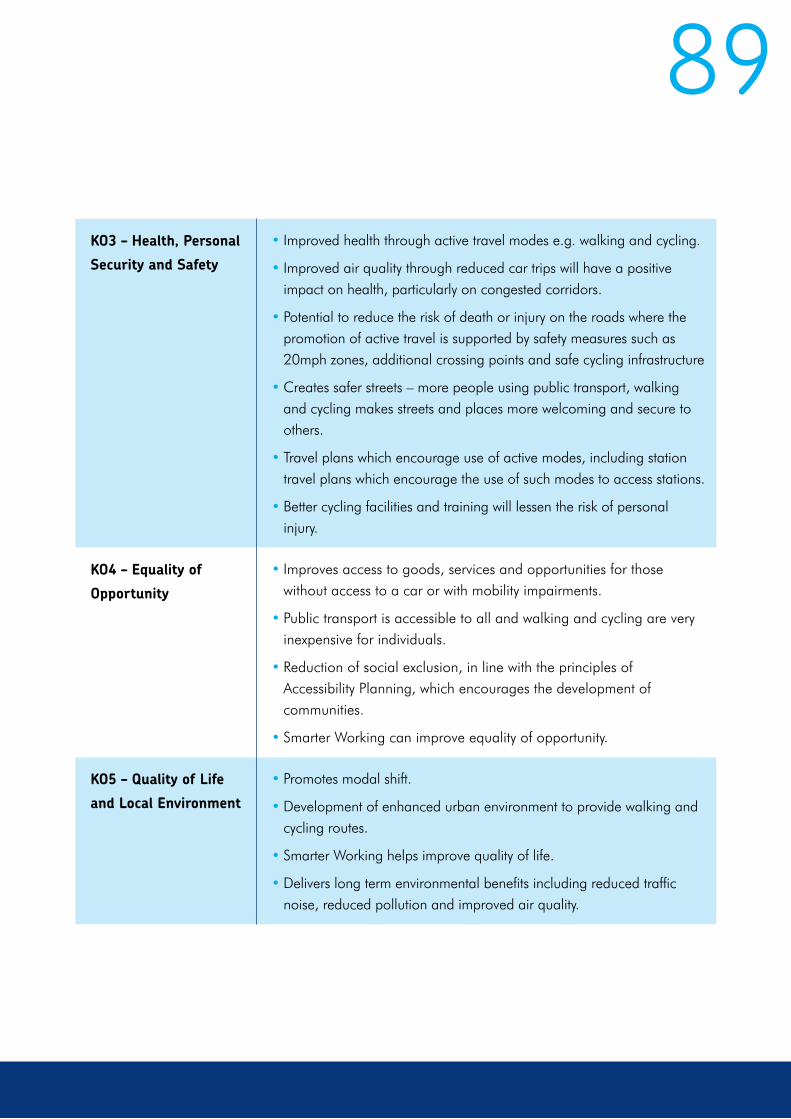
89
KO3 – Health, Personal
Security and Safety
• Improved health through active travel modes e.g. walking and cycling.
• Improved air quality through reduced car trips will have a positive impact on health, particularly on congested corridors.
• Potential to reduce the risk of death or injury on the roads where the promotion of active travel is supported by safety measures such as 20mph zones, additional crossing points and safe cycling infrastructure
• Creates safer streets – more people using public transport, walking and cycling makes streets and places more welcoming and secure to others.
• Travel plans which encourage use of active modes, including station travel plans which encourage the use of such modes to access stations.
• Better cycling facilities and training will lessen the risk of personal injury.
KO4 – Equality of
Opportunity
• Improves access to goods, services and opportunities for those without access to a car or with mobility impairments.
• Public transport is accessible to all and walking and cycling are very inexpensive for individuals.
• Reduction of social exclusion, in line with the principles of Accessibility Planning, which encourages the development of communities.
• Smarter Working can improve equality of opportunity.
KO5 – Quality of Life
and Local Environment
• Promotes modal shift.
• Development of enhanced urban environment to provide walking and cycling routes.
• Smarter Working helps improve quality of life.
• Delivers long term environmental benefits including reduced traffic noise, reduced pollution and improved air quality.
90E. Major Influences on Smarter Choices & Active Travel
An Integrated Sustainability Appraisal (ISA) has
been undertaken to support the preparation of
LTP3, which includes an analysis of relevant plans,
policies and programmes and their implications
for LTP3. This includes Smarter Choices as this is
identified as one of the three Strategic Principles
that form the basis for the LTP3 Strategy.
Integrated Public Transport Prospectus
Centro, in conjunction with partners, has
developed the Integrated Public Transport
Prospectus (IPTP). This outlines the long-term
vision for public transport across the Area,
taking into account existing and future major
development. The principles underlying the IPTP
are supported by Smarter Choices.
West Midlands Sustainable Travel Cities Bid
Centro, on behalf of the Metropolitan Authorities,
co-ordinated the West Midlands Sustainable
Travel Cities (WMSTC) bid to DfT, setting out
a package of targeted corridor-based Smarter
Choice measures, which would be developed in
conjunction with infrastructure improvements (e.g.
Showcase, Red Routes etc). The bid evolved from
the Smarter Choices Strategy that was developed
as part of the 3 Point Plan following the Transport
Innovation Fund work.
F. LTP3 Policies – Smarter Choices (Including Active Travel)
Within the context of LTP3 Objectives, the
Sustainability Appraisal and the major influences
on Smarter Choices outlined above, the following
policies have been developed. The specific
interventions required to deliver each policy
during LTP3 are outlined in the Implementation
Plan. LTP3’s approach builds on existing activities
and work undertaken in developing the 3-Point
Plan Smarter Choices Strategy and Sustainable
Travel Cities bid. A Sustainable Smart Package
bid will be made for funding from the new Local
Sustainable Transport Fund. This will incorporate
Smart Route and Smarter Choices development.
The features of the Smarter Choices approach are:
• A targeted best value approach on our
Smarter Choices programme through
our radical programme of Smart Routes,
Bus Showcase and Red Route corridors
as well as other planned infrastructure
improvements to lock in the benefits of
Smarter Choices.
• A clear and consistent Smarter Choices
programme with six workstreams:
marketing and information, personalised
travel planning, education, business &
employment, residential & community and
supporting measures
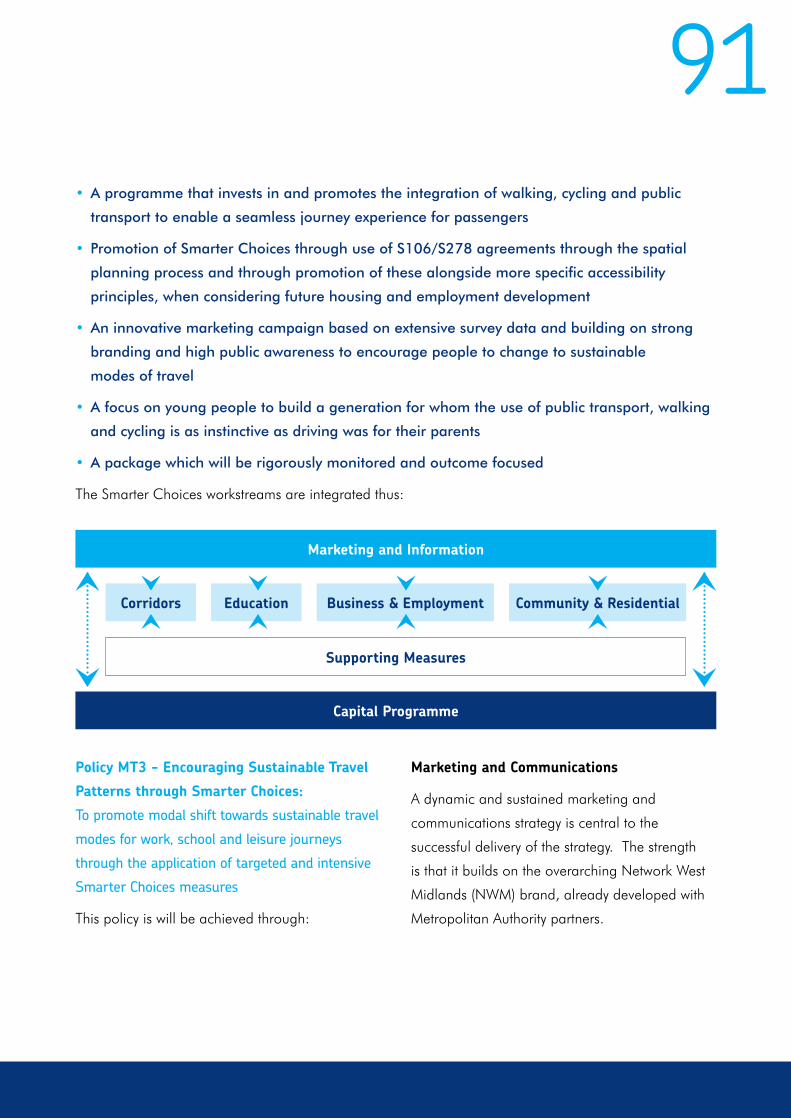
91• A programme that invests in and promotes the integration of walking, cycling and public
transport to enable a seamless journey experience for passengers
• Promotion of Smarter Choices through use of S106/S278 agreements through the spatial
planning process and through promotion of these alongside more specific accessibility
principles, when considering future housing and employment development
• An innovative marketing campaign based on extensive survey data and building on strong
branding and high public awareness to encourage people to change to sustainable
modes of travel
• A focus on young people to build a generation for whom the use of public transport, walking
and cycling is as instinctive as driving was for their parents
• A package which will be rigorously monitored and outcome focused
The Smarter Choices workstreams are integrated thus:
Policy MT3 - Encouraging Sustainable Travel
Patterns through Smarter Choices:
To promote modal shift towards sustainable travel
modes for work, school and leisure journeys
through the application of targeted and intensive
Smarter Choices measures
This policy is will be achieved through:
Marketing and Information
Capital Programme
Supporting Measures
Corridors Education Business & Employment Community & Residential
Marketing and Communications
A dynamic and sustained marketing and
communications strategy is central to the
successful delivery of the strategy. The strength
is that it builds on the overarching Network West
Midlands (NWM) brand, already developed with
Metropolitan Authority partners.
92Personalised Travel Planning
To increase journeys by bus, rail, cycling, walking
and car sharing, and to promote the use of local
services, Personalised Travel Planning will be
provided to households along key corridors. Each
person within the targeted area is encouraged to
think about how they currently travel for each trip
they make and how they might make those trips in
more sustainable ways. Nationally, PTP has been
reported to reduce car driver trips typically by
11% (amongst the targeted population) and the
distance travelled by car by 12%.
Education Focus
Influencing the travel behaviour of young people,
including those over 16, now will impact on their
future travel decisions. To do this, we also need
to work with parents. The education focus builds
on work already undertaken by School Travel
Advisors and links with the health agenda through
encouraging active and safe lifestyles which will
combat childhood obesity. The initiatives that will
be developed include enhanced school travel
planning, school bus brokerage, bus monitors,
school travel plan grants and the ‘Bike It’ officers.
Robust monitoring is an integral element so
outcomes can be identified and will build on
the existing established data sources such as the
Schools Census. Benefits of changes to public
transport and active modes will be locked in
through supporting infrastructure improvements.
There are also opportunities to target car-
travelling children and families who live close to
schools.
Business and Employment Focus
The journey to work is one of the hardest to
tackle. Time pressures make it difficult for people
to switch from the car to more sustainable modes.
On average, 35% of all trips made into the 9
Metropolitan Centres during the AM peak are
made by public transport. There is significant
scope to increase this percentage further.
Providing sustainable travel options for employees
and customers makes good business sense.
Implementing Smarter Choices for businesses
can be a valuable part of an organisation’s
‘Corporate Social Responsibility Policy’ (CSR)
and also improve staff efficiency and productivity.
Robust monitoring will be an integral element to
enable outcomes to be identified. The initiatives
include enhanced workplace travel plans, on-line
audit tools, employer travel plan grants, Company
TravelWise, WorkWise and Smarter Working.
Benefits of modal switch to public transport and
active travel will be locked in through supporting
infrastructure improvements.
Community and Residential Focus
A Residential Travel Plan is a package of
measures designed to reduce car use originating
from new housing by supporting alternative forms
of transport and reducing the need to travel in
the first place. They are an important tool to
help deliver accessible, sustainable communities
and offer clear benefits to all parties involved –
public, private and the community. They require
meeting the access needs of residents in a new
93way and entail partnership between developers,
Local Authorities, communities and new residents.
Community TravelWise will continue to be
developed to support this focus area.
Supporting Measures
The strategy includes supporting measures that
will strengthen each of the workstreams above.
These initiatives facilitate modal shift through:
•On line and on-the-move journey planning
•Public transport information centres
•Car clubs and car sharing
It is also acknowledged that hard infrastructure
can also have a role to play within Smarter
Choices, through enhancing walking and cycling
facilities and improving bus and Metro stops.
Policy MT4 - Increasing Levels of Cycling
To seek to increase levels of cycling in the West
Midlands to improve health, the environment,
reduce car use and improve the accessibility of
people without access to a car
The Metropolitan Area offers a wide range of
cycling opportunities for leisure, commuting and
the club cyclist. Besides the road network, there
is a variety of off-road paths, some shared with
pedestrians, and others specifically for cyclists.
The Metropolitan Area also has a number of
canals where towpaths offer cycling opportunities
on largely level routes. Cycling provides the
following benefits:
• Direct, door-to-door journeys
• Cheap, sustainable transport and free
parking
• Health benefits whilst travelling to work,
school or to local facilities
• Cycling can be the quickest mode of
transport for urban journeys under 5
miles in length
Cycling is an important element of the LTP3
Strategy. The Metropolitan Authorities and Centro
are working towards this through:
• Cycle infrastructure and urban/highway
design (including Smart Routes)
• Training (including maintenance)
• Marketing and Communications
These areas of activity aim to raise levels of
cycling to help tackle road congestion and air
quality problems (via mode shift from cars),
enhance accessibility and social inclusion (cycling
is quick over relatively short distances and
affordable) and to increase personal health.
All Metropolitan Authorities have, or are
developing, local cycling strategies with the
involvement of local communities and other
interested parties.
94Cycle Infrastructure
The focus will be on improving networks of routes
of up to five miles linking residential areas to
centres, employment areas, schools, railway
stations, Metro stops, leisure facilities and other
destinations.
Improvements can be achieved through highway
schemes and opportunities arising from new
development. Ongoing improvements will be
complemented by providing dedicated cycle
infrastructure, such as cycle lanes, cycle tracks,
crossings, advance stop lines, and other measures
that give cyclists advantages over vehicle traffic.
Other schemes will contribute towards improved
cycling conditions, including traffic calming,
junction treatment, 20 mph zones, shared space
initiatives and exemptions for cyclists at road
closures. Focus will be on removing barriers to
cycle use.
Training
Cycle training can provide the skills and
confidence to cycle for leisure and commuting
trips. Centro and the Metropolitan Authorities are
working with local organisations such as Sustrans
and Primary Care Trusts to provide and promote
cycle training to adults and children.
In March 2007, Cycling England launched
‘Bikeability’, the new national cycle training
standards for children and adults, viewed as
the new Cycling Proficiency for the 21st century.
By 2012 Cycling England would like to see all
children have the chance to achieve Bikeability
to Level II. We will work towards this aspiration in
the Metropolitan Area, and offer cycle training to
adults. In the long term, Level II will be sufficient
for all journeys, but in the meantime training
to Level III skills will enable more people to use
the existing highway network. Centro and the
Metropolitan Authorities will continue to build on
the work already undertaken on Bike It, Bikeability
and Cycle Training West Midlands.
We will also seek to improve training on cycle
maintenance. We will work with local cycle
groups and local authorities to provide cycle
maintenance training across a range of groups.
Marketing and Communications
More people are likely to consider cycling to
public transport points if they are aware of the
options and it is easy to do. Providing clear,
relevant information, promotion and marketing of
the benefits of walking and cycling are key to this.
Centro and the Metropolitan Authorities currently:
• Produce a range of printed leaflets and
online information to help people walk,
cycle and use public transport
• Provide incentives such as free cycling
packs (including maps, guides and
accessories such as bike saddle covers)
• Provide cycle planners
• Hold regular events and competitions to
encourage people to try cycling as a mode.
95Research indicates that cycling levels are lower
among women and ethnic minority communities
and people on lower incomes. We will develop
targeted campaigns and promotions to
encourage increased activity among these groups.
We will work with cycling organisations and
Metropolitan Authorities to provide cycle journey
planning information.
Rights of Way Improvement Plans
Enhancing facilities and routes for active travel
can be achieved through the development of
Rights of Way Improvement Plans, which are the
responsibility of the Metropolitan Authorities.
Policy MT5 - Increasing Cycle
Integration with Public Transport
To increase opportunities for cyclists to integrate
and interchange with public transport
Combining cycling with public transport provides
a viable alternative to the private car for many
medium and long distance journeys. Public
transport operators are increasingly recognising
the potential of encouraging cycling to and from
their stations.
Centro and the Metropolitan Authorities are
working together to provide cycle racks and
lockers at town and city centres, local centres,
train stations, Metro stops and bus stations
across the Network West Midlands area. In
conjunction with rail companies, we will promote
the existing cycle storage facilities and consider
where additional storage is required so people
can safely park their bikes before continuing with
their journeys. We will ensure that public transport
interchanges are easily accessible via cycle routes
and that new and existing cycle parking is well
signposted so people are aware of its location at
public transport facilities.
We will promote train operator policies to cyclists,
so they know the best times to travel on the train
with their bikes. Centro will monitor international
experience of carriage of bikes on buses and
rail and rapid transit vehicles to see if there are
potential applications in the Metropolitan Area.
We want to encourage more people to travel by
rail – over 70% of people in the Metropolitan
Area live within one mile of a rail station.
However, lack of awareness on how to reach the
station, poor cycling routes or facilities, as well as
overcrowding at car parks can discourage many
potential passengers. Centro is therefore piloting
a ‘Rail Station Travel Plan’ at Kings Norton to
encourage more local residents to use the station
and increase the number of passengers travelling
to the station by foot, bike, bus or even car
sharing.
Once the pilot at Kings Norton rail station is
completed in 2011, Centro will identify other
potential stations that could benefit from such
Travel Plans. We will then introduce schemes to
help people travelling to these rail stations.
96Policy MT6 - Increasing Levels of Walking
To seek to improve the attractiveness of walking
as a travel choice by creating an environment
and culture where walking is actively encouraged
for short trips
All of the Metropolitan Authorities encourage
walking to work through improved pedestrian
routes to employment destinations and by
working in partnership with employers, schools,
communities and health professionals to develop
walk to work initiatives as part of company, school
and community travel plans. Walking is also
an integral part of highway and infrastructure
improvements under Smart Routes principles.
All Authorities have, or are developing, local
walking strategies with the involvement of local
communities and other interested parties. These
build on:
• Promotion of health and environmental
benefits of walking, the Safer Routes to
School and Walk to School initiatives,
Travel Plans and work with Primary Care
Trusts and other stakeholders.
• Undertaking Walking Audits to provide a
focus for future investment in pedestrian
facilities.
• Improving conditions for pedestrians in
residential areas by managing traffic
volumes and speeds, for example through
traffic calming and 20 mph zones.
• Considering issues of clear pedestrian
areas, quality of materials, and
maintenance.
• Improving facilities for pedestrians in
town and city centres to reduce accidents
and to create a cleaner, more pleasant
environment that can act as a stimulus for
investment and economic regeneration.
• Improving street lighting. The street
lighting maintenance and replacement
programme will seek to provide upgraded
lamps with better colour rendition to
provide better illumination of the footway
for pedestrians.
• Enhancing pedestrian crossing facilities
that consider existing pedestrian desire
lines, proximity to schools and reducing
potential conflict between pedestrians and
motor vehicles.
• Safe, secure and direct pedestrian access
to public transport stops / stations and
car parks and to other locations of high
pedestrian demand, for example through
the Safe Routes to Stations programme.
97• Targeting particular neighbourhoods and
known problem sites where barriers to
walking can be removed. The focus will be
on Smart Routes and improving pedestrian
routes of up to two miles linking residential
areas to centres, employment areas,
schools, railway stations, Metro stops,
leisure facilities and other destinations
• Addressing security issues and the
partnership work with Centro and
operators will address problems on public
transport vehicles.
• Implementing traffic signal improvements
to provide full pedestrian crossing provision
at new and upgraded installations,
including appropriate facilities for disabled
persons.
• Removing unattractive pedestrian subways
where safe at-grade alternatives can be
provided.
• Ensuring a regular footway maintenance
regime is in place that minimises disruption
to pedestrians during the street works
and addresses the problems of tripping,
‘ponding’ and controls the growth of
vegetation that may hinder walking.
• Reducing footway obstructions by acting
against inappropriate shop displays,
removing extraneous street furniture and
enforcing against illegal parking on the
pavement
• Wayfinding – providing direction and
information signing for pedestrians in
town and city centres, to local shops,
public transport nodes and leisure routes,
for example via street name plates, street
maps, information boards, fingerpost signs,
and audio wayfinding for blind users.
• Providing new pedestrian routes and
footways where need is identified.
• On going development of the urban
walking route planner www.walkit.com
• Supporting promotional initiatives such as
Fitter Walking with partners such as Living
Streets across the Metropolitan Area.

98
B. Partners: Roles and Responsibilities
British Waterways own, maintain, manage and,
where possible, enhance the canals within the
Area. They own the bridges over canals, as well
as aqueducts over other watercourses and roads.
Most of their bridges are historic structures and
some are protected. This can lead to capacity
issues if the structures do not comply with current
weight requirements for vehicles passing over
a canal. They monitor use of the network, both
by boats and pedestrians. The following British
Waterways statistics illustrate use of specific locks
and towpaths within the Area.
A. Role of Waterways
The Metropolitan Area has a significant network
of canals, a legacy of the Industrial Revolution
period and important today not only as a
reminder of our past and its important heritage
value but also for leisure, environmental,
transportation and surface water drainage
purposes. Whilst their original purpose has
declined, it is important that their transport
role continues to be recognised. LTP3 seeks to
optimise the use of canals for walking, cycling,
boating and recreational use and as green
corridors in support of its objectives for improved
prosperity, health and environment.
Waterways
Canal Location Count
Staffs & Worcestershire Lock 31, Compton, Wolverhampton 4,661
Birmingham & Fazeley Lock 1, Minworth 2,166
Birmingham & Fazeley Farmers Bridge, Birmingham 1,944
Birmingham Lock 17, Wolverhampton 1,797
Grand Union Lock 3, Camp Hill, Birmingham 1,469
Rushall Lock 2, Rushall, Walsall 270
Use of Locks, 2009
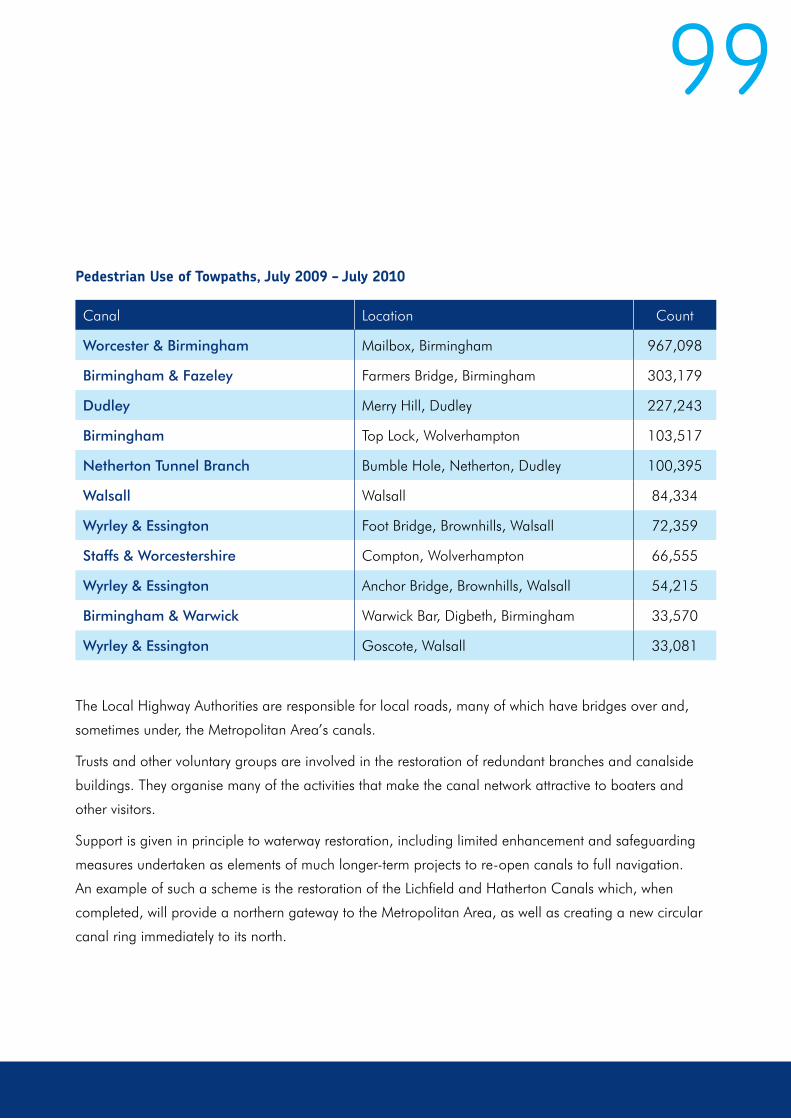
99
Canal Location Count
Worcester & Birmingham Mailbox, Birmingham 967,098
Birmingham & Fazeley Farmers Bridge, Birmingham 303,179
Dudley Merry Hill, Dudley 227,243
Birmingham Top Lock, Wolverhampton 103,517
Netherton Tunnel Branch Bumble Hole, Netherton, Dudley 100,395
Walsall Walsall 84,334
Wyrley & Essington Foot Bridge, Brownhills, Walsall 72,359
Staffs & Worcestershire Compton, Wolverhampton 66,555
Wyrley & Essington Anchor Bridge, Brownhills, Walsall 54,215
Birmingham & Warwick Warwick Bar, Digbeth, Birmingham 33,570
Wyrley & Essington Goscote, Walsall 33,081
Pedestrian Use of Towpaths, July 2009 – July 2010
The Local Highway Authorities are responsible for local roads, many of which have bridges over and,
sometimes under, the Metropolitan Area’s canals.
Trusts and other voluntary groups are involved in the restoration of redundant branches and canalside
buildings. They organise many of the activities that make the canal network attractive to boaters and
other visitors.
Support is given in principle to waterway restoration, including limited enhancement and safeguarding
measures undertaken as elements of much longer-term projects to re-open canals to full navigation.
An example of such a scheme is the restoration of the Lichfield and Hatherton Canals which, when
completed, will provide a northern gateway to the Metropolitan Area, as well as creating a new circular
canal ring immediately to its north.
100bridges over the railway) and this is can cause
problems in agreeing reasonable terms for
many authorities that are attempting to upgrade
bridges to carry 44 tonne vehicles. Many canal
bridges and other structures are listed or of
heritage interest and there are considerable cost
implications arising from the need to bring them
up to standards that require an increased loading
capacity. There is also a need to recognise the
role of canals both as drainage conduits and as
potential flooding risks, especially where they are
on raised embankments.
Canal towpaths often provide valuable links in
the pedestrian network. There is potential for joint
working between the Local Highway Authorities
and British Waterways to explore how towpaths
might be assimilated into each Authority’s Rights
of Way Improvement Plans. Irrespective of this,
regard must be had to how to make towpaths
accessible for all, including people with mobility
difficulties, without adversely affecting the heritage
features that are important to the continued
attraction of canals.
C: Waterways Policy Context for LTP3
There is no over-riding policy context for
waterways. Most recently, Defra issued a
consultation paper, ‘Waterways for Everyone’,
December 2009. The 2010 change of
Government and increased focus on fiscal matters
appears to have put back publication of their
response to the consultation responses until after
the autumn Comprehensive Spending Review.
Roads crossing over canal bridges are a crucial
part of the local highway network and there
are many instances where bridges are on the
approaches to employment areas. Also, some
canal aqueducts over roads are an accessibility
constraint, having been built in an era of less
traffic and smaller vehicles. These are important
factors in maintaining and improving access
to employment areas, examples of which are
associated with the regeneration of the designated
Strategic Development Area in Darlaston, Walsall.
There are no nationally formatted agreements
between Highway Authorities and British
Waterways on restrictions for the use of canals
(unlike those in place with Network Rail for road

101D. LTP3 Key Objective Alignment
KO1 – Economy • Existing and potential visitor and local community use of canals contribute to leisure, heritage and tourism industries
• Canals enhance the setting of visitor attractions.
• Potential for carriage of bulky materials.
KO2 – Climate Change • Towpaths provide off-road routes that could attract more walking and cycling and thus, indirectly, address this Objective.
• Emissions arising from a boat-based holiday are very much lower than a car-based touring holiday and significantly less than air travel for a foreign-based holiday.
• Lock-free lengths of canals within and into the Metropolitan Area provide opportunities for sustainable movement of bulky freight.
KO3 – Health, Personal
Security and Safety
• Walking and cycling along towpaths contributes towards improved personal health.
• Active use of towpaths and canals and the provision of new canal-side built development, and temporary and residential moorings, improve natural surveillance and, thus, personal security.
• A canal holiday provides active and healthy outdoor physical recreation. The slow pace and friendly atmosphere helps people unwind and promotes good mental health.
KO4 – Equality of
Opportunity
• Towpaths are open to all providing opportunities for walking and cycling for either specific journeys or for leisure purposes.
• Many charity-operated boats offer trips and longer holidays to the disabled, elderly, infirm and disadvantaged youngsters.
KO5 – Quality of Life
and Local Environment
• The canal network is an integral part of the Area’s cultural heritage.
• Canals provide ‘green’ corridors through densely built-up areas giving the opportunity for local communities to access the natural environment as well as ‘habitats’ for fauna and flora.
• Some sections of the canal network could provide opportunities for use as an alternative to lorry movements, especially in sensitive locations, for building, demolition and excavation materials.
102E: LTP3 Policies
Policy MT7: To work with British Waterways to
ensure that bridges over canals on key routes
between employment areas and the motorway
junctions are, as far as possible, free of weight
restrictions.
Policy MT8: To ensure that all canals are
safeguarded as navigable waterways to support
water-based local economic activity and existing
wharf facilities are safeguarded and to maximise
the potential of canal towpaths as part of a
signposted network of pedestrian and cycling
green infrastructure.
Policy MT9: To seek to ensure that access to
the canal network, particularly by pedestrians
and cyclists is safeguarded and, where possible,
enhanced.

103

LTT 4: TRANSPORT ASSET MANAGEMENT – A FOUNDATION FOR GROWTH (TAM)
104
105
Good Asset Management is a vital factor in building sustainable local communities and we have recently
adopted an ‘Asset Management Planning’ (AMP) approach to support the effective management of
infrastructure assets. This will achieve two things: firstly, it will set out the strategic approach, which can
be closely integrated with local transportation management; and secondly, it will enable the true costs
of holding and maintaining those assets to be understood. This includes promoting long-term financial
planning, budgeting and the robust articulation of the maintenance demands to be made to deliver
service improvements and efficiency savings. Historically, the maintenance of the transport network and
associated structures that we rely on has suffered relative to other policy priorities.
The seven Highways Asset Management Plans define how the Metropolitan District Councils will manage
their transportation and highway assets along well-disciplined principles, essential for high quality service
delivery to meet the needs of current and future customers. The plans are based on a generic model
developed for the Metropolitan Area to provide a uniform approach:
A. Role of Asset Management
Asset Management Plans (AMPS)
Introduction - Sets the scene and introduces
the concept of asset management
Business Processes - Identifies and reviews
the processes currently used to manage
highway assets
Levels of Service - Defines current and
target levels of service
Service Options - Outlines how the options
available for dealing with the ongoing
demands placed on the network are
identified and evaluated
Life Cycle Planning - Documents how all
assets are managed and identifies current and
future needs in terms of works and funding
Financial Management & Valuation –
Describes how financial projections related
to the service options are determined and
where funding comes from, it also holds
detailed asset valuation information
Risk Management – Describes the risk
associated with the management and
ownership of the road network asset and the
process that is used to manage those risks
Forward Work Programme – Describes
how the forward works programme is
constructed and updated and the level of
confidence held in its predictions
106Performance Monitoring - Describes how performance will be monitored and measured
Improvement Action Plan – Outlines improvements planned for this AMP in the future
Appendices – Contain supporting detail and will be updated annually or more frequently
The District Councils have developed their service provision in support of LTP3 and are further revising
these provisions to meet the strategic aims and deliver on the five Objectives.
B. Asset Valuation and the CIPFA Assets Infrastructure Code
The recently CIPFA code introduced a requirement
for Highway Authorities to gain a comprehensive
knowledge of their highway assets. Districts
have therefore included within their AMPs,
comprehensive inventory and condition data,
which has enabled them to prepare for asset
valuation in line with Whole of Government
Accounts and depreciated accounting methods.
This measures the cost of economic benefits
embodied in an asset and quantifies the level of
asset consumption during an accounting period.
The asset valuation figures appertaining to the
asset groups can be found in the Appendices
relevant to each asset group.
The seven District Councils have been collecting
inventory and condition data, preparing for
asset valuation, assessing depreciated costs
and developing long-term maintenance plans.
The individual asset group valuation tables
detailed in the relevant appendices show the
accumulative position in the Metropolitan Area
with regard to the requirements of the new code,
where each column in the tables are explained
below. The following section details an asset
valuation glossary, for Carriageways, Footways &
Cycleways, Structures, Highway Lighting, Traffic
Management, Street Furniture and Land asset
groups.
Inventory
Is measured according to the appropriate unit
and separated out by road class
Gross Replacement Cost (GRC)
The gross replacement cost is the total admissible
cost of replacing the existing highway asset with a
new equivalent.
Annual Depreciated Costs (ADC)
This is the aggregate cost of all the capital
replacements / treatments needed to maintain
/ restore its service potential over the life cycle,
spread over the estimated number of years in
the cycle.

107The core objective of asset management is to
maintain the assets in a good, safe condition,
whilst preventing deterioration, i.e. to maintain a
steady state. Historically the level of investment
in the network has generally been below that
required to maintain a steady state, which has
resulted in deterioration. The net effect has been
to stifle transportation and safety improvements,
be less able to withstand the vagaries of utility
workings & extremes of weather and require much
higher levels of reactive expenditure to ward off
insurance claims for trips and potholes.
To maintain a steady state we need to:
1) evaluate both the condition of our
highways assets and the cost of
maintaining them to a standard that
will prevent deterioration.
2) ensure the correct level funding to
meet the requirements of the annual
depreciation costs.
Condition
An accepted measure of the condition of the
asset, which indicates the amount or percentage
of deterioration and hence the level of
replacement required (depreciated value).
Depreciated Replacement Cost (DRC)
A method of valuation, which provides the
current cost of replacing an asset with its
modern equivalent, less deductions for all
physical deterioration and all relevant forms of
obsolescence and optimisation.
Restore to New Cost
This is cost to restore the asset to new, i.e. to
replace the deteriorated sections and is calculated
by subtracting the DRC from the GRC.
The result of under funding asset maintenance
costs over many years has resulted in a varying
level of depreciation across the Metropolitan
Area. Prioritisation methods have generally meant
that principal roads have been better maintained,
but at the expense of lower category roads, with
all hierarchies of footways also suffering. The
individual authorities transport asset management
plans and the appendices in this document
specific to the asset groups, show the levels of
deterioration, equated to restore to new costs for
all groups and hierarchies. A deteriorated network
will stifle economic growth, provide access
difficulties and result in public dissatisfaction.
Careful assessment needs to be given to
the restore to new indications to ensure that
Authorities embark on a programme of restoring
to new, to enable steady state to be maintained
and to set the network up for the longer term.
Asset Summary
The District AMPs contain all of the above data
relevant to the transport assets, and also the
lifecycle plans for each group and its associated
features. All relevant aspects of each Authority’s
strategy are encompassed within either the main
body of the plan or the associated life cycle plans.
The AMPs define how the assets will be managed
over the long term, where the list of assets to be
managed is as follows:

108Carriageways, incorporating:
• Infrastructure
• Line marking
• Traffic Improvement Features
• High Friction Surfacing
• Highway Drainage
Footways and Cycleways
• Infrastructure
• Street Cleansing
• Cycle ways
Structures, incorporating:
• Bridges
• Subways
• Sign gantries
• Retaining walls
• Embankments
• Highway steps
Street Lighting, incorporating:
• Infrastructure
• Illuminated Signs
• Keep Left Bollards
Traffic Management
• Traffic Signals
• UTMC Infrastructure
Street Furniture, incorporating:
• Pedestrian guard rails
• Non-illuminated signs
• Street name plates
Horticultural Maintenance, incorporating:
• Grass verges
• Planted areas
• Fencing
Arboricultural Maintenance, incorporating:
• Trees
• Hedges
Winter Service, incorporating:
• Gritting routes
• Grit bins
• Gritting plant
Invest to Save
Under investment creates a critical cycle of
a deteriorating network, which needs a high
level of reactive maintenance. This, in turn,
results in less funds being available for planned
maintenance, which then causes the network
to further deteriorate. LTP3 seeks to ensure a
sufficient level of funding in the early part of
the Plan period to facilitate a core investment
programme on the network, which will enable
steady state maintenance and a reduction in
reactive expenditure.
109C. Progresses and Successes from LTP2
Asset Management Approach
LTP2 supported the development of an asset management approach, both through promoting the need
for districts to adopt a strategic approach and in providing funding for data collection, to compliment
that provided by DfT for asset management. All Districts now have a working asset management plan
and have adopted an asset management approach to maintaining the network. Data collection has
progressed: carriageway assets inventories are complete and good condition data is available, which will
enable us to plan for the long term. Further development of the management tools and systems required
are currently in progress.
Sustainable Materials
To support the life cycle plan approach,
consideration has to be given to ensuring
that materials and processes used are both
sustainable and have been designed to provide
maximum life span. This will result in reduced
costs in the long term and a contribution towards
LTP3’s low carbon objective.
Asset Condition
The AMPs detail the condition of assets.
Knowledge of condition is key to good asset
management and it is evident that there are
varying degrees of deterioration across the
asset groups. For example, principal roads have
the least deterioration at an average of 5.3%
(National Indicator 168), whilst unclassified roads
have an average 17.5% (NI 169), indicating that
a larger percentage of unclassified roads need
structural attention. As the size of the unclassified
network is four times that of the principal
network, the resulting deteriorated element of the
unclassified network is some 15 times that of the
principal network.
Other assets such as footways and street lighting
are also suffering due to lack of long term
planned maintenance, with the exception of
those Authorities that have undergone street
lighting PFIs in recent years. However, it can
be established through the annual depreciated
costs and restore to new costs, that the Area can
achieve similar goals through correct levels of
funding as indicated, without resorting to PFIs.

110D. LTP3 Key Objective Alignment
KO1 – Economy • An ‘Asset Management Planning’ (AMP) approach to deliver effective maintenance of highways assets, will achieve a level of service to meet the needs of current and future customers.
• A well maintained network will ensure confidence in the local area, better access for all and stimulate economic growth.
KO2 – Climate Change • Develop life cycle planning to extend the life of highways assets and build increased recycling into all processes in order to reduce carbon emissions and combat climate change.
KO3 – Health, Personal
Security and Safety
• Enhanced customer focused street care service that addresses the needs of stakeholders, whilst ensuring enforcement of statutory obligations.
KO4 – Equality of
Opportunity
• Promote accessibility and ensure that people are not disadvantaged by where they live.
KO5 – Quality of Life
and Local Environment
• An asset management approach will ensure that all transport assets are well maintained, which will lead to an enhanced street scene, improved local environment and better quality of life.
E. Major Influences on Asset ManagementUnder Investment
Historical under investment has resulted in a deteriorating network. However, only recently through asset
management have we started to appreciate the scale of funding required to hold and maintain transport
assets. The cost of this is an under performing network, which cannot cope with current demand and, in
particular, will not be able to respond to future growth and transport and travel demands.
Stakeholder Engagement
Transport asset management takes into account the perception and aspirations of stakeholders.
Authorities now have in place measures to bring about good communication between those who
manage the asset and those who use it. Typically, Authorities follow a model which makes it easier to
access local services, where authorities work with citizens, partners, local organisations and community
groups to provide citizens with choice in the way council services are delivered.

111F. LTP3 Policies
Policy TAM1: To seek to ensure that the transport network is adequately managed through effective Asset Management
Over the LTP3 period, it is envisaged that there
will be an increase in population, development
and activity. Given the emphasis on maximising
the use of existing transport infrastructure,
it is imperative that the transport network is
adequately maintained through effective asset
management planning.
To deliver the full asset management approach in
line with CIPFA and Government requirements,
the Metropolitan Districts will continue to develop
their asset management plans and accounting
processes in line with the Transport Infrastructure
Code. Through funding secured through this
plan the metropolitan authorities will continue to
develop asset management processes as follows
in line with Whole of Government Accounting:
• Collect a complete set of inventory and
condition data for all transport assets.
• Develop annual depreciation regimes for
all transport assets.
• Prepare cost effective long term
maintenance and renewal programmes
• Deliver efficiency savings and service
improvements
• Produce financial information that is
compliant with IFRS and meet the need of
Whole of Government Accounts
Data capture has been prioritised for those assets
that have been identified as critical from a risk
management perspective. Whilst datasets are
substantially complete, there is an ongoing need
to collect/update data, through detailed surveys
as and when funding becomes available.
Action 1: To undertake Asset Management
in accordance with the profile established
by the CIPFA Infrastructure Asset
Management Code and Whole of
Government Accounts
Action 2a: Data capture using local
knowledge and recently implemented asset
maintenance or new scheme installation
information.

112
Inventory and condition data will be collected
in association with other duties and works, for
example where there is reliable local knowledge,
where maintenance works or improvement
schemes have been recently carried out and there
are “as-built” drawings available.
The recently introduced Transport Asset
Infrastructure Code, the principles of which are
supported and have been adopted, has been
developed to enable the compilation of consistent
asset management data to meet the requirements
of Whole of Government Accounts.
Where non-critical areas and assets have been
identified, inventory and condition data will
be collected over future years as and when
maintenance or improvement works are
carried out.
Action 2b: Financial Data to be collected in
line with providing information for Whole of
Government Accounts.
Action 2c: Data capture from renewals
programmes.
113
their carriageway assets. A strategic approach
that involves infrastructure management driven
by levels of service and life cycle planning sets
out the most economic way of delivering an
acceptable level of service over the long term.
The strategic aims of LTP3 in relation to
carriageway maintenance are to ensure that the
network is maintained in a safe and serviceable
condition and provide a sound infrastructure for
long-term growth. This will create an attractive,
well-maintained highway environment, which in
turn will contribute to an efficient local economy.
Key to the success of this is to have life cycle
planned programmes that maximise the return on
a given level of investment to reduce the amount
of unplanned, reactive maintenance.
The attractiveness of bus transport will increase
if passenger comfort can be enhanced by more
predictable ride quality. The effects of poorly
maintained highways are greatly accentuated for
bus passengers and the extensive use by buses of
minor routes clearly requires quality infrastructure
across much more than just the principal road
network. Similarly reallocating highway space
to cyclists must necessarily be accompanied by
a surface that is of a consistently high quality, if
increased use is to be accompanied by reduced
accident levels.
A. Role of Carriageway Infrastructure
The carriageway infrastructure network plays a
pivotal role in connectivity and is also the most
valuable asset that each Highway Authority owns.
The local network distributes all traffic to and from
the national network and provides local access for
employment, commercial and leisure needs.
An effective, well maintained carriageway
contributes significantly to the character and
environment of the area that it serves. There
is growing awareness, reflected by public
satisfaction surveys, of how well maintained
highways can improve the living environment,
as everyone has some contact with the highway
network on a daily basis. Knowledge and
expectation about carriageway condition and
performance is high on the public agenda and is
increasingly becoming an area of concern, when
those expectations are not met.
Whilst the Code of Practice ‘Well Maintained
Highways’ now fully embraces the wider
issues involved in maintaining carriageways,
expectations remain largely unmet and the
Highway Authorities have a duty to ensure the
safety of the travelling public and therefore have a
significant management role to play. Through the
Transport Asset Management Plans the Highway
Authorities have generated in-depth information
on the condition and rate of deterioration of
Carriageway Infrastructure
114B. Asset Valuation and the CIPFA Assets Infrastructure Code
The CIPFA code has introduced a formal
requirement for Highway Authorities to gain
a comprehensive knowledge of their highway
assets. Districts have developed comprehensive
inventory and condition data, which has enabled
them to prepare for asset valuation in line with
Whole of Government Accounts and depreciated
accounting methods. This data measures the cost
of the economic benefits embodied in an asset
and quantifies the level of asset consumption
during an accounting period.
The following table shows the accounting
figures that will be required as part of Whole of
Government Accounts when audited reporting
starts in financial year 2012/2013. The detailed
explanation of the calculation and methodology
behind the cost columns can be found in the asset
management section of this document.
The Asset Valuation Policy is to produce asset
valuation in line with Whole of Government
Accounts. As this work is ongoing, the valuation
figures shown have been calculated using a
“broad brush” approach adopting the principles
in the proposed code. Accordingly, the calculation
of depreciation costs has been undertaken
manually using the indicative formulae and
tables available from CIPFA.
The figures have been developed from the
individual district asset management plans and
amalgamated to show a Metropolitan Area wide
view. (Birmingham has been separated in terms
of costing due to the ongoing PFI investment
programme).
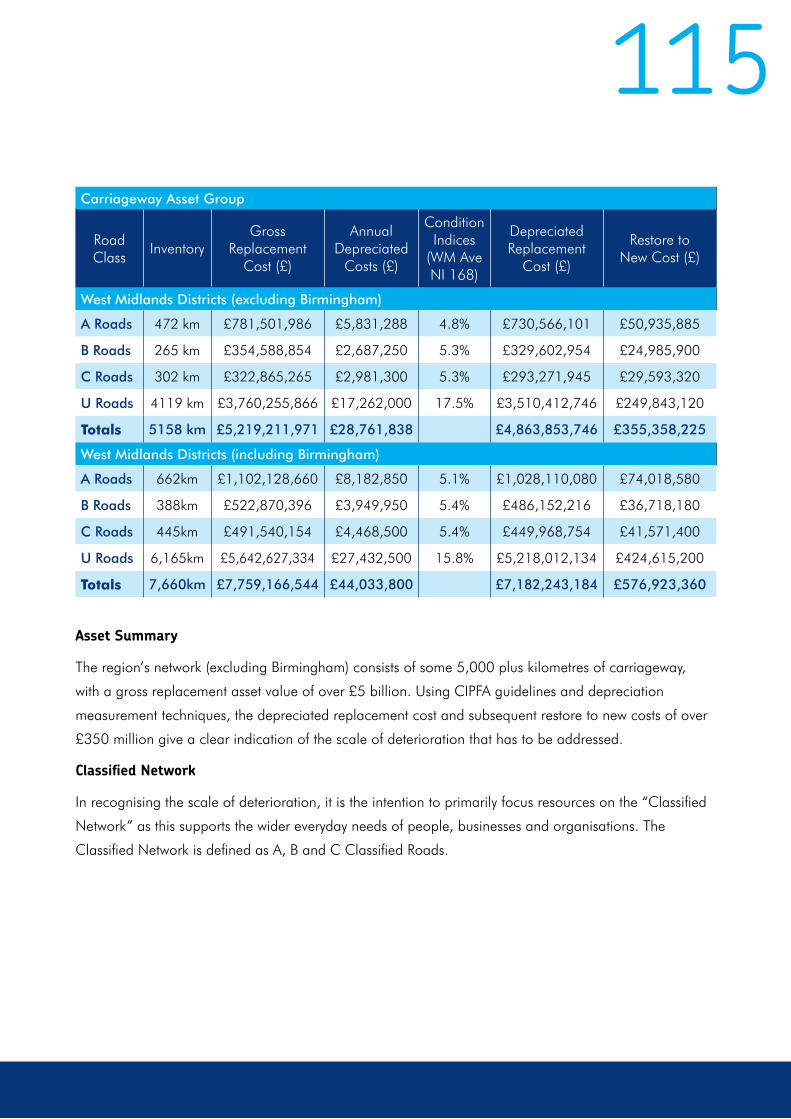
115
Road Class
InventoryGross
Replacement Cost (£)
Annual Depreciated
Costs (£)
Condition Indices
(WM Ave NI 168)
Depreciated Replacement
Cost (£)
Restore to New Cost (£)
Carriageway Asset Group
West Midlands Districts (excluding Birmingham)
West Midlands Districts (including Birmingham)
A Roads 472 km £781,501,986 £5,831,288 4.8% £730,566,101 £50,935,885
B Roads 265 km £354,588,854 £2,687,250 5.3% £329,602,954 £24,985,900
C Roads 302 km £322,865,265 £2,981,300 5.3% £293,271,945 £29,593,320
U Roads 4119 km £3,760,255,866 £17,262,000 17.5% £3,510,412,746 £249,843,120
Totals 5158 km £5,219,211,971 £28,761,838 £4,863,853,746 £355,358,225
A Roads 662km £1,102,128,660 £8,182,850 5.1% £1,028,110,080 £74,018,580
B Roads 388km £522,870,396 £3,949,950 5.4% £486,152,216 £36,718,180
C Roads 445km £491,540,154 £4,468,500 5.4% £449,968,754 £41,571,400
U Roads 6,165km £5,642,627,334 £27,432,500 15.8% £5,218,012,134 £424,615,200
Totals 7,660km £7,759,166,544 £44,033,800 £7,182,243,184 £576,923,360
Asset Summary
The region’s network (excluding Birmingham) consists of some 5,000 plus kilometres of carriageway,
with a gross replacement asset value of over £5 billion. Using CIPFA guidelines and depreciation
measurement techniques, the depreciated replacement cost and subsequent restore to new costs of over
£350 million give a clear indication of the scale of deterioration that has to be addressed.
Classified Network
In recognising the scale of deterioration, it is the intention to primarily focus resources on the “Classified
Network” as this supports the wider everyday needs of people, businesses and organisations. The
Classified Network is defined as A, B and C Classified Roads.

116LTP3 recognises that unclassified roads within the
network, have more local requirements and are
to be addressed at a local level. Key bus routes
account for approximately 25% of the unclassified
road network and carriageway condition has
an influence on the quality of public transport.
Accordingly, the potential to make additional
funding available to improve surface quality
is to be examined as part of the approach to
enhancing Bus Partnerships.
Restore to New Costs
To fulfil optimum service potential and good
economic asset management, the sections of
the network at the end of their useful life need
to be replaced. Using broad calculations, based
on national condition indicators and interpreting
data available, there are depreciated values of
an average of 49% on the classified network and
58% on unclassified roads.
The “restore to new” costs as defined in the new
CIPFA code show the estimated costs of removing
the backlog of deteriorated network, which will
allow a return to maintaining a “steady state” thus
arresting further deterioration. Achieving this is
subject to the correct level of capital investment
being made in the first 6 years of LTP3 to embark
on a programme of replacement of life expired
components. The restore to new costs for the
entire carriageway, again excluding Birmingham,
amounts to £355m - approximately £59
million per annum over a 6-year investment
period (the optimum core investment period).
The restore to new costs for the classified network
equates to approximately £105m - £17.5
million per annum over a 6-year period.
Restore to new costs have been calculated using
the table for converting condition to a depreciated
value from Technical Note 46 Financial
Information to Support Asset Management and
based on the average condition of that road class
across the Metropolitan Area.

117Example: Converting CCI to accumulated depreciation percentage
100
90
80
70
60
50
40
30
20
10
0
100%
90%
80%
70%
60%
50% D%
40%
30%
20%
10%
0%
0 5 10 15 20 25 30
CCI
NI
Age (years)
Depreciated Value - 50%
Deterioration Depreciation
Maintaining a steady state requires a maintenance regime and life cycle plan that addresses timely
treatment, to ensure that those component parts of a carriageway with a finite life reach that life target,
and are planned to be replaced at the end of that life. It also relies on those component parts being in an
“as-new” condition prior to the commencement of that life cycle plan. The Annual Depreciated Cost of
the carriageway asset, a costing element required under the new CIPFA code, indicates what is required
to achieve a steady state maintenance regime for all road classes. This cost has been determined based
on the guidelines in the code, where the treatment deemed to be required is an absolute minimum in
terms of type, frequency and estimated cost in order to maintain the service potential of the asset over the
course of a forty year lifespan.
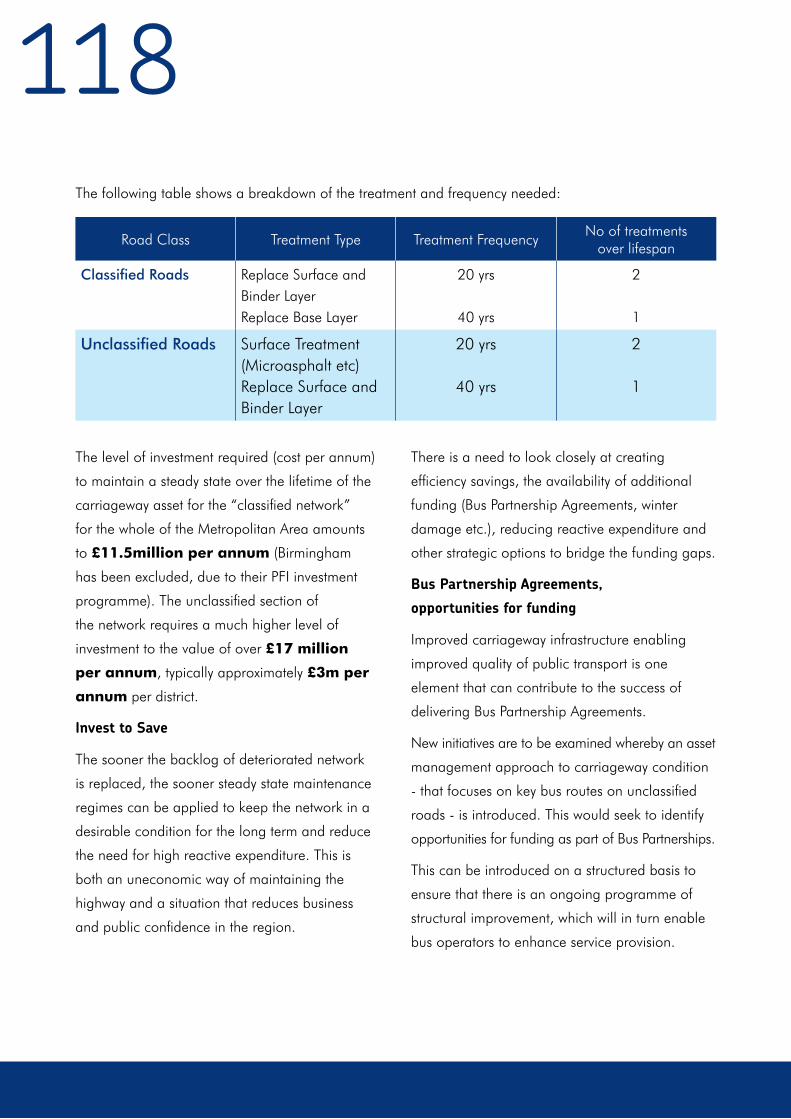
118
Road Class Treatment Type Treatment FrequencyNo of treatments
over lifespan
Classified Roads Replace Surface and Binder LayerReplace Base Layer
20 yrs
40 yrs
2
1
Unclassified Roads Surface Treatment (Microasphalt etc)Replace Surface and Binder Layer
20 yrs
40 yrs
2
1
The following table shows a breakdown of the treatment and frequency needed:
The level of investment required (cost per annum)
to maintain a steady state over the lifetime of the
carriageway asset for the “classified network”
for the whole of the Metropolitan Area amounts
to £11.5million per annum (Birmingham
has been excluded, due to their PFI investment
programme). The unclassified section of
the network requires a much higher level of
investment to the value of over £17 million
per annum, typically approximately £3m per
annum per district.
Invest to Save
The sooner the backlog of deteriorated network
is replaced, the sooner steady state maintenance
regimes can be applied to keep the network in a
desirable condition for the long term and reduce
the need for high reactive expenditure. This is
both an uneconomic way of maintaining the
highway and a situation that reduces business
and public confidence in the region.
There is a need to look closely at creating
efficiency savings, the availability of additional
funding (Bus Partnership Agreements, winter
damage etc.), reducing reactive expenditure and
other strategic options to bridge the funding gaps.
Bus Partnership Agreements,
opportunities for funding
Improved carriageway infrastructure enabling
improved quality of public transport is one
element that can contribute to the success of
delivering Bus Partnership Agreements.
New initiatives are to be examined whereby an asset
management approach to carriageway condition
- that focuses on key bus routes on unclassified
roads - is introduced. This would seek to identify
opportunities for funding as part of Bus Partnerships.
This can be introduced on a structured basis to
ensure that there is an ongoing programme of
structural improvement, which will in turn enable
bus operators to enhance service provision.

119C. Progress and Successes from LTP2
Funding
Funding for carriageways in recent years has been significantly lower than that suggested by Whole of
Government Accounting principles. This has resulted in deteriorated networks that have been unable
to survive harsh, wet winters without suffering further degradation. Whilst LTP2 provided funding for
capital repair programmes, this only enabled management of deterioration rather than taking an asset
management approach to restore the network to new and maintain a steady state. These constraints on
capital resources are increasingly impacting on reactive/routine maintenance budgets,
Asset Management Approach
LTP2 supported the development of an asset
management approach, both through promoting
the need for Districts to adopt a strategic approach
and in providing funding for data collection, to
complement that provided by the DfT.
All Districts now have a working asset
management plan and have adopted an
asset management approach. Data collection
has progressed such that carriageway assets
inventories are complete and condition data is
available, which will enable us to plan for the
long term. Further development of management
tools and systems is currently underway, which will
ensure that we can continue to apply a strategic,
whole life costed approach.
Sustainable Materials
Recycling technology is developing rapidly and
a number of materials development initiatives
have been promoted associated with reusing
existing materials or alternative methodologies for
maintenance activities.
Most recycling, unless done in-situ, involves
substantial use of fuel for transporting, storing,
processing (crushing, cleaning, grading, mixing,
etc.) and re-transporting, before the product can
be incorporated into highway works, and a system
of assessing CO2 balance has been established.
Carriageway Condition
Throughout LTP2, the key measure for carriageway
condition has been the relevant BVPI scores
by road class. These have shown a fluctuating
position, with no clear trend and it has not been
possible to assess with any confidence the change
in condition over the life of LTP2. This is due to:
• Lack of uniformity of BVPI parameters and
measures from one year to the next
• Fragile infrastructure that is prone to
severe impairment, resulting from severe
winter conditions and extremes of weather
• Over reliance on reactive / potholing
treatments to ward off insurance claims at
the expense of well planned and correctly
financed asset management.

120D. LTP3 Key Objective Alignment
KO1 – Economy • Provides critical links between industrial, commercial and retail centres. Providing access to and enabling flourishing and diverse economies.
• Well-maintained infrastructures reduce network stress through the provision of convenient and desirable routes and support the Transport Vision associated with aspirations for economic growth.
• Maximise efficiency in highway maintenance operations to maintain or improve reliability and predictability of journey times
• Ensuring local transport networks are able to cope with adverse weather and other incidents on the network
KO2 – Climate Change • Developing carbon emissions reduction strategy across all asset groups, using innovative materials and processes where applicable.
• The timing of maintenance and the methods and materials used has implications for carbon emissions.
KO3 – Health, Personal
Security and Safety
• Well-maintained infrastructures secure safety of the travelling public in line with the duty of care and also maintain access for emergency services
• Appropriate use of materials can prevent skidding and excessive noise pollution.
KO4 – Equality of
Opportunity
• Enhancing asset management operations and ensuring the delivery of a safer and more inviting environment for vulnerable transport users.
KO5 – Quality of Life
and Local Environment
• Carriageway infrastructure provides an essential connection to education, health, commercial and recreational areas. Improving access to jobs and essentials for day-to-day life.
121The highway network must meet the needs of
its users including cars and vans, heavy goods
vehicles, public transport vehicles, motorcyclists,
cyclists. In summary these requirements are for
networks which:
•Are free of defects such as potholes,
uneven surfaces, ponding water and
•Minimise skidding and slipping
•Are free of ice and snow
•Are adequately illuminated to ensure safety
and prevent fear of crime
•Are not obstructed by vegetation which
causes obstruction and has safety
implications
It is not only highway users who are affected by
the way the transport network is maintained. It
impacts on other areas as listed below.
Local residents: Require minimum disturbance
from noise, vibration and light pollution, which
are influenced by surfaces, materials and
equipment used.
Carbon emissions: The timing of maintenance
measures and methods used have an impact on
carbon emissions. The network also needs to be
maintained in such a way as to be adaptive to
inevitable climate change.
E. Major Influences on Carriageway Maintenance
Statutory Undertakers
Highways provide corridors for statutory
undertakers’ plant, necessitated by the difficulty of
access to equipment in private land.
The condition of carriageway infrastructure is
prejudiced by the Statutory Undertakers’ need to
respond to both the condition of their apparatus
within the highway, and the need to provide
new and improved services to industry and
commerce. This is exacerbated by significant
renewals programmes currently ongoing to
address deterioration of time expired cast iron
mains which contribute to weakening the network,
particularly where multiple mains are replaced at
a single location.
Under Investment
The impact of the statutory undertakers is
compounded by, due to under investment, an
inability to carry out preventative maintenance
treatments on all sections of the network, which
would ensure that carriageways can successfully
achieve their life cycle targets. Under investment
in the network means a policy of the “treating
the worst” and ignoring the rest of the network.
Asset management is giving us a clear steer that
we cannot continue to ignore that percentage of
the network that sits in the “amber and green”
categories, because they are rapidly becoming
the next “red alerts”.
122Stakeholder Engagement
Carriageway maintenance needs to take into account the perception and aspirations of stakeholders,
and Authorities now have in place measures in place to bring about good communication between those
who manage the asset and those who use the asset.
F. LTP3 Policies – Carriageway Asset Maintenance
Each district Highways Asset Management
Plan will clearly establish its overall strategy for
carriageway infrastructure in line with the Policies
set out below and as circumstances and
funding permit.
Policy TAM2: To prioritise Maintenance Block
funding to improve the performance of the
carriageways of the classified highways network
Highway maintenance policies set the value
of the street scene and are high on people’s
agenda as it is a major influence on the quality
of their local environment. Over the LTP3 period,
it is envisaged that there will be an increase
in population, development and economic
activity. Given the emphasis on maximising
the use of existing transport infrastructure,
it is imperative that the transport network is
adequately maintained. As such we should be
moving towards restoring the network to new and
following up with preventative maintenance and
investing to save.
Action 1 is a proactive policy for
carriageways asset maintenance:
To undertake carriageway asset
maintenance in accordance with the
principles established by the CIPFA
Infrastructure Asset Management Code,
local prioritisation processes and subject
to the limitations of the levels of funding
indicated for years 1 & 2 of the LTP3
Implementation Plan.
Actions

123Service Level Options for Carriageway
Asset Maintenance
Investment needs to be planned, effectively
managed and supported by technical and
management systems facilitated by an asset
management approach. The service level option
for the classified network will be a policy whereby
funding is spread across the classified network as
required, thus enabling priorities to be determined
locally to suit network condition and strategic
importance. There are a number of techniques for
establishing this such as:
•Condition Surveys
•Safety Inspections and complaints history
•Enquiries and complaints from elected
members, the general public and other
stakeholders
•Third party insurance claims
•Priorities can then be allocated at three
different sub-levels such as:
•Strategic level
•Transport level
•Maintenance level
Through life cycle planning undertaken on Dudley
MBC’s network (a typical Metropolitan Area
authority in terms of size and condition), where
deterioration profiling has been carried out, it
can be demonstrated that the indicated level of
funding could start to address the back log on
the classified network, which is demonstrated
on the graph below. The graph assumes that
future funding levels will be at least equal to
that of years 1 & 2 of the implementation plan.
Obviously any increases in funding will see further
improvement in the B & C class roads, whereas
lower levels would see the condition worsen
over time.
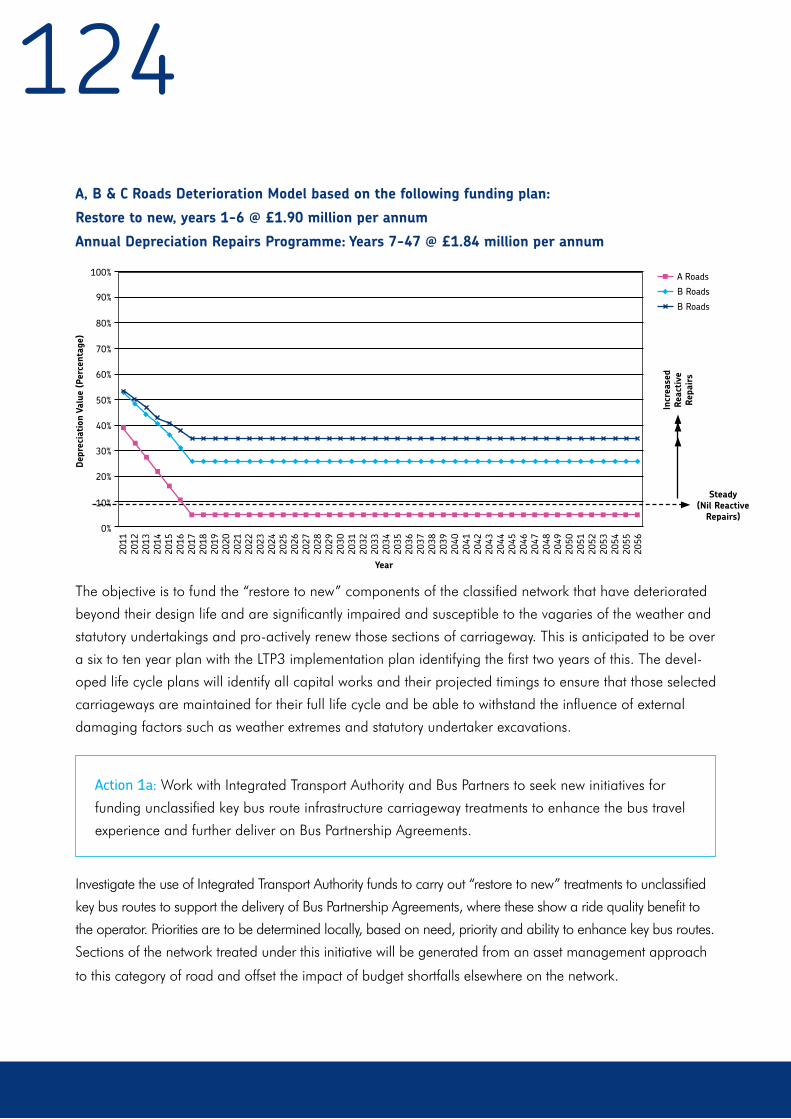
124A, B & C Roads Deterioration Model based on the following funding plan:
Restore to new, years 1-6 @ £1.90 million per annum
Annual Depreciation Repairs Programme: Years 7-47 @ £1.84 million per annum
The objective is to fund the “restore to new” components of the classified network that have deteriorated
beyond their design life and are significantly impaired and susceptible to the vagaries of the weather and
statutory undertakings and pro-actively renew those sections of carriageway. This is anticipated to be over
a six to ten year plan with the LTP3 implementation plan identifying the first two years of this. The devel-
oped life cycle plans will identify all capital works and their projected timings to ensure that those selected
carriageways are maintained for their full life cycle and be able to withstand the influence of external
damaging factors such as weather extremes and statutory undertaker excavations.
Investigate the use of Integrated Transport Authority funds to carry out “restore to new” treatments to unclassified
key bus routes to support the delivery of Bus Partnership Agreements, where these show a ride quality benefit to
the operator. Priorities are to be determined locally, based on need, priority and ability to enhance key bus routes.
Sections of the network treated under this initiative will be generated from an asset management approach
to this category of road and offset the impact of budget shortfalls elsewhere on the network.
Action 1a: Work with Integrated Transport Authority and Bus Partners to seek new initiatives for
funding unclassified key bus route infrastructure carriageway treatments to enhance the bus travel
experience and further deliver on Bus Partnership Agreements.
100%
90%
80%
70%
60%
50%
40%
30%
20%
10%
0%
2011
2012
2013
2014
2015
2016
2017
2018
2019
2020
2021
2022
2023
2024
2025
2026
2027
2028
2029
2030
2031
2032
2033
2034
2035
2036
2037
2038
2039
2040
2041
2042
2043
2044
2045
2046
2047
2048
2049
2050
2051
2052
2053
2054
2055
2056
Dep
reci
atio
n Va
lue
(Per
cent
age)
Incr
ease
d Re
acti
ve
Repa
irs
Year
A Roads
B Roads
B Roads
Steady (Nil Reactive
Repairs)
125
Action 2a: To integrate planned
maintenance with Strategic Corridor
Investment
Prioritising maintenance where it can be
combined with schemes to improve strategic
corridors. This will ensure that investment in
improving the corridors can be delivered by
ensuring that carriageway infrastructure is capable
of accommodating the improvements. Extend
this approach to upgrade the carriageway, when
carrying out other LTP3 schemes such as safety
improvements or public transport improvement
schemes. This will be dependent on sufficient
funds being built into strategic corridor investment
schemes to facilitate associated carriageway
maintenance.
Considerable data is being generated across the
Metropolitan Area where reactive maintenance
and expenditure is highlighting structural failure of
the carriageway. Reactive maintenance is a highly
inefficient way of using highway maintenance
Embark on a programme of treating more roads
with low cost treatments, which with pre-patching
will stave off structural failure in the short term.
Action 3 sets out carbon efficiency action
Metropolitan Transport Authorities, though the
Highway Maintenance Group and its various
subgroups work collectively to establish to trial new
technologies associated with carbon reduction.
Dudley has worked in conjunction with the
industry to develop a Carbon Calculator to
enable emission levels to be calculated on the
basis of materials used. For routine maintenance,
new techniques have been trialled, which reduce
carbon emissions, for example using infra red
patching and warm and half warm asphalts.
Action 2b: Analyse highway inspections to
establish where repeat reactive maintenance
is highlighting a structural problem
Action 2c: Carry out an increased level of low
cost maintenance treatments to temporarily
hold off the onset of structural failure
Action 3: A common carbon calculator
will be developed to assist authorities in
sourcing and using the most carbon
efficient materials and methods.
Actions 2a – 2c, set out further policies that
seek to improve the network or maintain safety,
where there are insufficient planned renewal/
annual maintenance funds to carry out a full
asset management approach.
resources. Selecting roads for treatment where
structural failure is highlighted, regardless of pre-
determined status and hierarchy within the overall
network, will ensure that structural integrity can be
maintained.

126Footway Infrastructure
A. Role of Footway Infrastructure
As a highly visible community asset, the network
of footway infrastructure plays an important role
in providing an alternative transport option to
the car and is a vital link to public transport. The
local network provides pedestrian access for
employment, commercial, shopping and leisure
requirements. It also provides a link to all multi
modal transport options that the local community
rely on heavily for their daily movements.
An effective, well maintained footway contributes
significantly to the character and environment
of the area that it serves, particularly so in
supporting multi-modal travel. Footways that are
defect free, well lit and safe become an attractive
and healthy alternative transportation option for
all age groups, but especially for elderly people
who will continue to form an ever-increasing
proportion of the population. This strategy
seeks to encourage modal change particularly
to healthier walking, which will only increase if
they are enjoyable experiences, and that means
footways free from potholes and with good
facilities at crossing points.
There is growing awareness, reflected by public
satisfaction surveys, of how well maintained
footways can improve the environment, as
everyone has contact with the footway network
on a daily basis. Through Transport Asset
Management Plans, the Districts have generated
in-depth information on the condition and rate of
deterioration of footway assets.
Footways comprise a variety of surface types,
hierarchy and status depending on pedestrian
traffic and the surrounding environment.
B. Asset Valuation and the CIPFA Assets Infrastructure Code
The CIPFA code has introduced a formal requirement for local highway authorities to have a
comprehensive knowledge of their footway assets. There is comprehensive inventory data contained
in the TAMPS, with varying levels of condition data across the Metropolitan Area. All authorities are
embarking on collecting more robust condition data, which includes some authorities carrying out more
DVI (detailed visual inspection) surveys of footways and others carrying out the new FNS (footway network
survey) across their areas.

127The following table shows the accounting figures required as part of Whole of Government Accounts when
audited reporting starts in the financial year 2012/2013. The detailed explanation of the calculation and
methodology behind the cost columns can be found in the asset management section of this document.
The Asset Valuation Policy is to produce asset valuation in line with Whole of Government Accounts. As this
work is ongoing, the valuation figures shown have been calculated using a “broad brush” approach, adopting
the principles in the proposed code. Accordingly the calculation of depreciation costs has been undertaken
manually using the indicative formulae and tables available from CIPFA. The figures have been developed
from the individual district asset management plans and amalgamated to show a Metropolitan Area wide
view. (Birmingham has been separated in terms of costing due to the ongoing PFI investment programme).
Footway Hierarchy
InventoryGross
Replacement Cost (£)
Annual Depreciated
Costs (£)
Condition Indices
Depreciated Replacement
Cost (£)
Restore to New Cost (£)
Footway Asset Group
West Midlands Districts (excluding Birmingham)
West Midlands Districts (including Birmingham)
1A 24 km £10,381,494 £32,427 20.8% £10,111,701 £269,793
1 422 km £59,445,472 £721,820 20.8% £54,707,949 £4,737,523
2 776 km £100,711,733 £1,394,443 20.8% £92,013,811 £8,697,922
3 2,128 km £245,942,065 £2,873,193 20.8% £230,005,422 £15,936,643
4 5,780 km £637,304,988 £7,752,301 20.8% £594,305,556 £42,999,432
Totals 9,130 km 1,053,785,75,2 £12,774,184 £981,144,439 £72,641,313
1A 49 km £21,069,851 £65,813 23% £20,464,376 £605,475
1 545 km £76,790,147 £931,824 23% £70,025,221 £6,764,926
2 1,196 km £155,378,852 £2,151,919 23% £140,534,373 £14,844,479
3 4,741 km £548,556,392 £6,400,837 23% £509,297,923 £39,258,469
4 7,525 km £831,362,626 £10,108,456 23% £769,364,093 £61,998,533
Totals 14,056 km £1,633,157,868 £19,658,849 £1,509,685,986 £123,471,882
Depreciated replacement costs based on condition indices have been adjusted upwards by a factor of 25% to allow for amber sections and higher condition indices expected for hierarchy 3 & 4 footways
128Asset Summary
The Metropolitan Area network, excluding
Birmingham, consists of some 9,000 plus
kilometres of footway network, with a gross
replacement asset value of over £1 billion.
Restore to New Costs
To fulfil their potential and arrive at good
economic asset management, the deteriorated
section of the footway network needs to be
replaced. To plan and programme for this is
a requirement of the new CIPFA code, where
authorities need to transparently show the true
costs of removing the backlog. Hence there is a
need to embark on a programme of replacement
of those finite life components of the footway
network that are already life expired.
The restore to new costs for the Metropolitan
Area footway network, again excluding
Birmingham, is over £72 million, which equates
to approximately £12 million per district
before being able to revert to steady state levels.
Once restored to new, investment levels can be
maintained at Annual Depreciated Cost, with
a significantly reduced reactive and pothole
maintenance regime.
Restore to new costs are based on depreciated
replacement cost, which have been calculated
using the Red, Amber, Yellow and Green
condition criteria, where those footways within the
red band require reconstruction as they are now
at the end of their finite life. Varying treatments
and frequencies are then programmed for the
amber and yellow bands, with the green band
not requiring any treatment, but requiring to be
programmed in the long term on the basis of
Annual Depreciated Cost.
Funding for footways in recent years has been
significantly lower than that required for a
full asset management approach, which has
resulted in deteriorated networks that have not
encouraged people to switch to walking as an
alternative to car travel.
Maintaining a steady state
The following table shows a summary level
breakdown of a life cycle plan for typical footways
including expected life of the component parts,
and the subsequent frequency of the treatments
needed to maintain the service potential of the
component over its useful life.
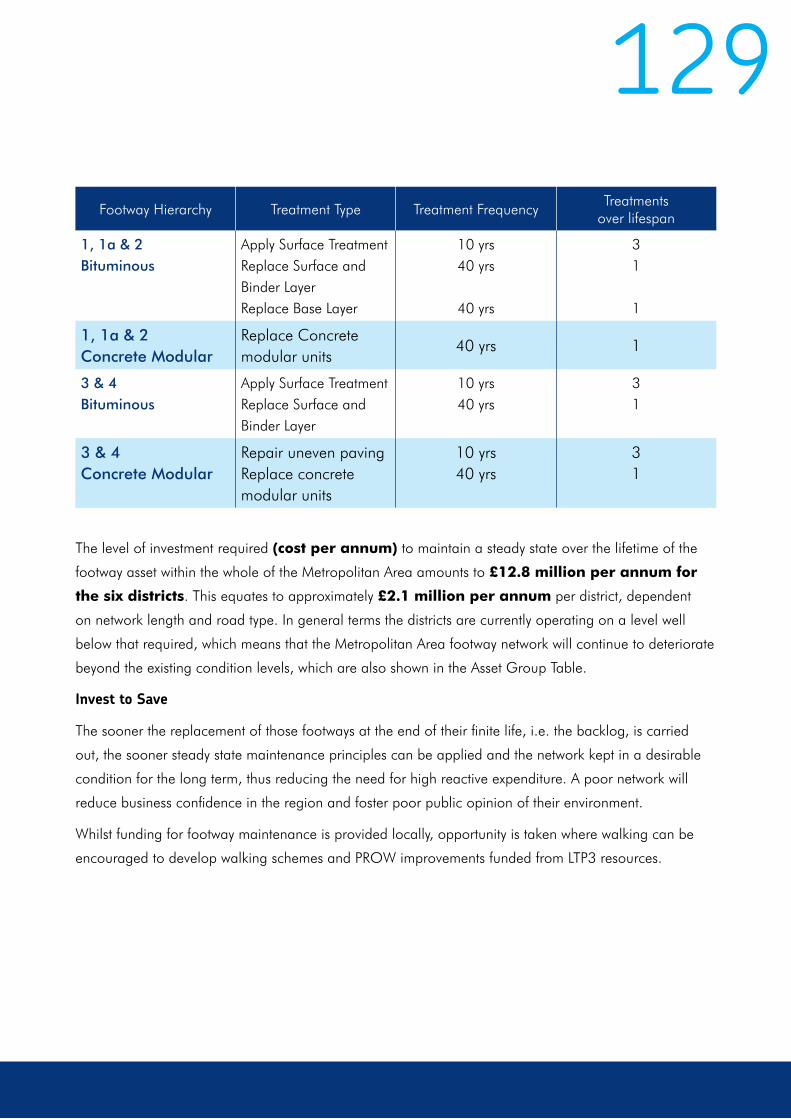
129Footway Hierarchy Treatment Type Treatment Frequency
Treatments over lifespan
1, 1a & 2Bituminous
Apply Surface TreatmentReplace Surface and Binder LayerReplace Base Layer
10 yrs40 yrs
40 yrs
31
1
1, 1a & 2Concrete Modular
Replace Concrete modular units
40 yrs 1
3 & 4Bituminous
Apply Surface Treatment Replace Surface and Binder Layer
10 yrs40 yrs
31
3 & 4Concrete Modular
Repair uneven pavingReplace concrete modular units
10 yrs40 yrs
31
The level of investment required (cost per annum) to maintain a steady state over the lifetime of the
footway asset within the whole of the Metropolitan Area amounts to £12.8 million per annum for
the six districts. This equates to approximately £2.1 million per annum per district, dependent
on network length and road type. In general terms the districts are currently operating on a level well
below that required, which means that the Metropolitan Area footway network will continue to deteriorate
beyond the existing condition levels, which are also shown in the Asset Group Table.
Invest to Save
The sooner the replacement of those footways at the end of their finite life, i.e. the backlog, is carried
out, the sooner steady state maintenance principles can be applied and the network kept in a desirable
condition for the long term, thus reducing the need for high reactive expenditure. A poor network will
reduce business confidence in the region and foster poor public opinion of their environment.
Whilst funding for footway maintenance is provided locally, opportunity is taken where walking can be
encouraged to develop walking schemes and PROW improvements funded from LTP3 resources.
130C. Progress and Successes from LTP2
Funding
LTP2 has provided the capability for funding for
limited footway resurfacing on principal roads in
conjunction with major carriageway works, which
has helped in those areas. The wider approach
of funding to other footway hierarchies, i.e. estate
and link footways, has not been funded through
LTP2, hence the management of deterioration by
treating the worst footways has been employed,
rather than taking a full asset management
approach.
Asset Management Approach
LTP2 supported the development of an asset
management approach, both through promoting
the need for districts to adopt a strategic
approach and in providing funding for data
collection, to complement that provided by DfT.
Data collection has progressed such that
footway asset inventories are complete. Good
condition data is available, particularly on the
hierarchy 1, 1a and 2 footways, knowledge of
the condition of footways 3 and 4 is becoming
increasingly important, so that we can apply an
asset management approach and enable us to
plan for the long term. Further development of
the management tools and systems required is
underway, which will ensure that we can continue
to apply a strategic, whole life costed approach.
Sustainable Materials
Re-use of footway surface materials has largely
been restricted to concrete modular paving,
where paving slabs or block pavers can be re-laid
as long as they have not suffered vehicle damage.
Some work has been done on recycling technology
and a number of materials development initiatives
have been promoted associated with reusing
existing materials or alternative methodologies for
maintenance activities.
Footway Condition
Throughout the course of LTP2, the measure of
footway condition has been the relevant BVPI
scores on hierarchy 1, 1a & 2 footways. These
have shown a fluctuating position, with no clear
trend and it has not been possible to assess with
any confidence the change in condition over the
life of LTP2. This is due to a number of reasons
including:
• Lack of uniformity of BVPI parameters and
measures from one year to the next
• Fragile infrastructure that is prone to
severe impairment, resulting from severe
winter conditions and extremes of weather
• Over reliance on reactive / potholing
treatments to ward off insurance claims at
the expense of well planned and correctly
financed asset management.
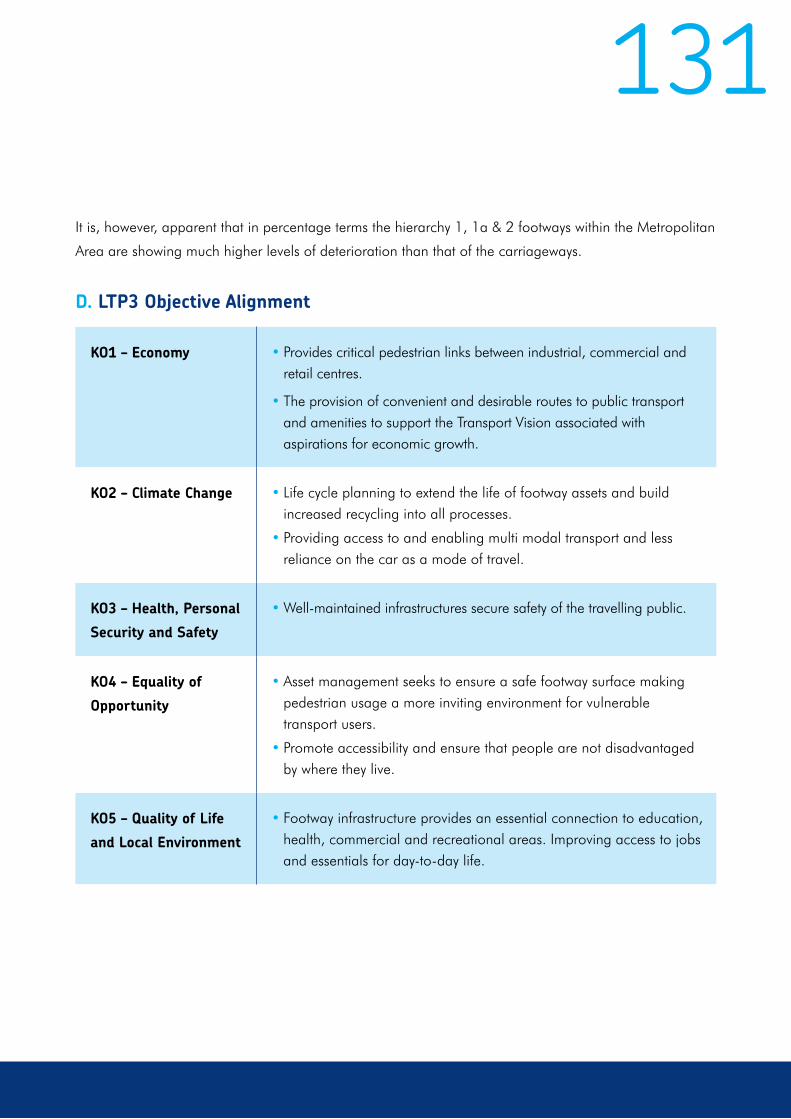
131It is, however, apparent that in percentage terms the hierarchy 1, 1a & 2 footways within the Metropolitan
Area are showing much higher levels of deterioration than that of the carriageways.
D. LTP3 Objective Alignment
KO1 – Economy • Provides critical pedestrian links between industrial, commercial and retail centres.
• The provision of convenient and desirable routes to public transport and amenities to support the Transport Vision associated with aspirations for economic growth.
KO2 – Climate Change • Life cycle planning to extend the life of footway assets and build increased recycling into all processes.
• Providing access to and enabling multi modal transport and less reliance on the car as a mode of travel.
KO3 – Health, Personal
Security and Safety
• Well-maintained infrastructures secure safety of the travelling public.
KO4 – Equality of
Opportunity
• Asset management seeks to ensure a safe footway surface making pedestrian usage a more inviting environment for vulnerable transport users.
• Promote accessibility and ensure that people are not disadvantaged by where they live.
KO5 – Quality of Life
and Local Environment
• Footway infrastructure provides an essential connection to education, health, commercial and recreational areas. Improving access to jobs and essentials for day-to-day life.

132E. Major Influences on Footway Maintenance
Statutory Undertakers
Footway excavations are constantly taking place that contribute to weakening the footway infrastructure.
Footways are particularly vulnerable due to the average width of 1.8 metres, which means that linear
utility excavations can account for a high percentage of the area of the footway, thus affecting structural
stability, even with a good reinstatement process.
Under Investment
Under investment in the network means a policy of the “treating the worst” and ignoring the rest of the
network. Asset management is giving us a clear steer that we cannot continue to ignore that percentage
of the network that sits in the “amber and green” categories, because they are rapidly becoming the next
“red alerts”.
Stakeholder Engagement
Footway maintenance needs to take into account the perception and aspirations of stakeholders, and
authorities now have in place measures in place to bring about good communication between those
who manage the asset and those who use the asset. Footways are of particular importance, as virtually
every member of the community will use a footway on a daily basis for either access to other modes
of transport or for a complete journey. Whilst footways have different hierarchical value or volumes of
traffic, which may make them of greater importance to the strategic network, even the lower category and
trafficked footways will be important to some one in the community.

133F. LTP3 Policies – Footway Maintenance
Policy TAM3: To seek to improve the
performance of the Footway and surfaced Public
Rights of Way Network
Each District’s Asset Management Plan will
clearly establish its overall strategy for footway
infrastructure management in line with the actions
set out below with complementary funding sought
through this Plan.
Action 1 is a proactive policy based on an asset
management approach to footway maintenance.
Action 1: To undertake footway maintenance
in accordance with the principles
established by the CIPFA Infrastructure Asset
Management Code and Whole Government
Accounts, but subject to the limitations of
local resources, albeit complemented where
possible by walking schemes developed as
part of LTP3 delivery.
Footways provide a significant contribution to
the local environment and, allied to the costs of
personal injury arising from slips, trips and falls,
prompt the need for a high standard of surface
condition. It is important that the footway network
is well maintained through an asset management
approach, as investment needs to be planned,
effectively managed and supported by technical
and management systems.
The objective is to fund annual depreciated costs
(maintain steady state) as identified, in order to
carry out a strategic maintenance approach.
The locally developed life cycle plans will identify
capital works and their projected timings to
endeavour to maintain footways for their full life
cycle and be able to provide a sound basis for
multi modal travel in future years. However to
pro-actively treat all sections of the network at the
time and level designed to maximise efficiency
over the life cycle will not be possible due to
limited funding.
Local prioritisation enables identification of those
footways that are of a higher priority in terms of
securing an integral surface, ensuring that high
priority footways are maintained for users and that
the asset value of a proportion of the network is
sustained.
The prioritisation process to be carried out will be
based on the following:
•Condition surveys
• Walked safety inspections and
complaints history
• Enquiries and complaints from elected
members, the general public and other
stakeholders.
• Third part insurance claims
134
Supporting another of the objectives of LTP3
by carrying out footway maintenance and
improvements where they are implemented as
part of other schemes to improve walking and
accessibility. This will ensure that investment in
improving footways can be delivered by ensuring
that the improvement of the footway infrastructure
is incorporated into the improvements, thus
providing an environment that promotes walking.
Embark on a programme of treating more
footways with low cost treatments, which with
pre-patching will stave off structural failure in the
short term.
Priorities can then be allocated at three different
levels:
•Strategic Level
• Accessibility to local services and public
transport.
•Maintenance Level
Actions 2a – 2c, set out further policies that
seek to improve the network or maintain safety
where there are insufficient planned renewal/
annual maintenance funds to carry out a full asset
management approach.
Supporting one of the objectives of LTP3 by
prioritising footway maintenance where it can
be combined with other schemes to provide a
co-ordinated development of strategic corridors.
This will ensure that investment in improving the
corridors can be delivered by ensuring that the
footway infrastructure is capable of facilitating
the improvements and providing an environment
that will deliver significant economic growth.
This action can be further extended to major
carriageway works, where funds are available
and it would be detrimental to carry out only
carriageway works.
Action 2a: To integrate planned footway
maintenance with Strategic Corridor
Investment and major carriageway works.
Action 2b: Carry out planned footway
maintenance and improvement schemes in
association with Walking and Public Rights of
Way schemes identified in LTP3 under Long
Term Theme 6 – Improved Local Accessibility
and Connectivity
Action 2c: Carry out an increased level of low
cost maintenance treatments to temporarily
hold off the on set of structural failure
135Highway Structures
A. Role of Highway Structures
The highway network is dependent on a broad
range of structures, which are owned by
Highway Authorities and Third Parties. Within the
Metropolitan Area there are over 1,500 highway
bridges, including subways and culverts, larger
than 1.5m span, with the type and age of the
bridges varying enormously. They range from
500-year-old masonry arches to modern complex
steel and reinforced concrete structures. A third
of the structures are on primary roads. Many are
impressive features of the urban landscape that
are of heritage interest and support the character
of an area. However, many are more discreet and
easily overlooked by the road user; in particular
those that serve industrial areas. These structures
may be taken for granted and potentially could
isolate an area because of loading constraints.
The LTP3 strategy rehearses the economic
arguments associated with under capacity bridges.
Equally important are highway-supporting
features such as reinforced earth embankments
and retaining walls. For those that are owned by
a third party, the highway authority under Section
167 of the Highways Act 1980 is required to take
action where a structure is liable to endanger
persons using the highway.
Lastly there are culverts, tunnels, footbridges,
safety fences and signal gantries and other
miscellaneous structures that nevertheless
fulfil a vital role in enabling pedestrian access
(footbridges), land drainage (culverts) or
informing/protecting the travelling public.
Bridges form a key link between local
communities and economies, and therefore it is
essential these routes remain unrestricted in terms
of width or weight limits. However, it is sometimes
necessary to implement such measures, as a last
resort, where no viable or affordable alternative
can be delivered. Where this occurs it is often
to the detriment of economic growth, reducing
carbon emissions and improving the quality of life.
Over the past 30 years there have been a number
of changes to the maximum lorry and axle weights
permitted on UK roads, with an increase from
32.5 tonnes in 1982 to 44 tonnes in 2001.
Since 1982, the maximum weight limit has been
amended five times, providing a significant
challenge to bridge management strategies, as
each structure is designed to the standards of
the day and therefore has varying load carrying
capacities. This, in turn, has necessitated weight
limits as an interim measure on a number of
structures, pending eventual strengthening works.

136Circular Roads 2/91 set out the methodology by which Local Authorities were to assess bridge load
capacities and identify the need for strengthening works against the new limits. Where strengthening
works were identified and could be afforded these were progressed; however there is a legacy of
bridgeworks still outstanding. There remain a number of bridges that serve ‘Impact Investment Locations’
and provide access to industrial areas that have not been strengthened and are a major concern.
Whilst the main role of a road bridge is to span a valley, road, body of water, or other physical
obstacle, for the purpose of providing safe passage over that obstacle, this can be a challenge for the
management of the obstacle crossed and its impact on the bridge.
The development of Smart Routes has not only focused on surface route enhancements to balance the
needs of users, but also provided a strategic context for investment. A number of bridges situated on
the Smart Route corridors are increasingly not fit for purpose insofar as loading criteria are concerned:
if assessed loading criteria were applied there would be significant and unsustainable disruption to
the strategic network. This would have a long-term adverse impact on economic sustainability through
restricting accessibility to freight and public transport.
B. Third Party Structures
Within the Area there are over 400 road bridges
owned by Third Parties such as Network Rail and
British Waterways. The statutory obligations on
these owners are far less onerous than those of
the highway authority, particularly with respect to
their load carrying capacity.
Notwithstanding the legacy loading liability, there
is much concern with the Government’s proposal
to reposition British Waterways with charitable
status in the third sector (a sector between state
and private sectors) which may result in a transfer
of undertakings to Local Highway Authorities in
accordance with section 116(3) of the Transport
Act 1968 (as modified in 2002), increasing the
demand on already limited resources. In the
Metropolitan Area, Highway Authorities are not
in a position to take on the liability without the
provision of a significant and ongoing increase
in resources.
Whilst the Metropolitan Councils will work with
British Waterways to ensure that bridges on key
routes are free of weight restrictions (as set out in
policy MT7) this can only be sustained if funding
is made available to British Waterways for the
necessary work. Many British Waterways structures
are of historic interest and attract a premium
when works are undertaken.
There is also concern over Network Rail’s “Asset
Management Policy – March 2010” and the
implications of a potential policy option of
“allowing assets to deteriorate until intervention
is essential to maintain safety standards” as
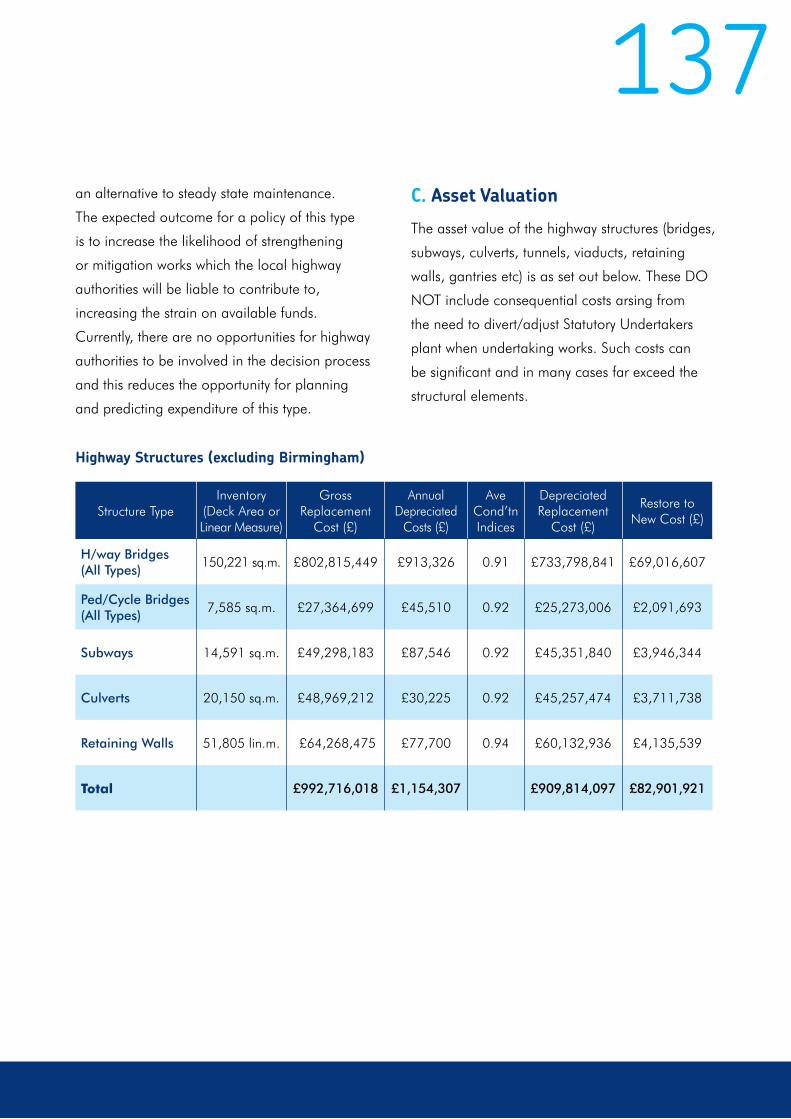
137an alternative to steady state maintenance.
The expected outcome for a policy of this type
is to increase the likelihood of strengthening
or mitigation works which the local highway
authorities will be liable to contribute to,
increasing the strain on available funds.
Currently, there are no opportunities for highway
authorities to be involved in the decision process
and this reduces the opportunity for planning
and predicting expenditure of this type.
C. Asset Valuation
The asset value of the highway structures (bridges,
subways, culverts, tunnels, viaducts, retaining
walls, gantries etc) is as set out below. These DO
NOT include consequential costs arsing from
the need to divert/adjust Statutory Undertakers
plant when undertaking works. Such costs can
be significant and in many cases far exceed the
structural elements.
Structure TypeInventory
(Deck Area or Linear Measure)
Gross Replacement
Cost (£)
Annual Depreciated
Costs (£)
Ave Cond’tn Indices
Depreciated Replacement
Cost (£)
Restore to New Cost (£)
H/way Bridges (All Types)
150,221 sq.m. £802,815,449 £913,326 0.91 £733,798,841 £69,016,607
Ped/Cycle Bridges (All Types)
7,585 sq.m. £27,364,699 £45,510 0.92 £25,273,006 £2,091,693
Subways 14,591 sq.m. £49,298,183 £87,546 0.92 £45,351,840 £3,946,344
Culverts 20,150 sq.m. £48,969,212 £30,225 0.92 £45,257,474 £3,711,738
Retaining Walls 51,805 lin.m. £64,268,475 £77,700 0.94 £60,132,936 £4,135,539
Total £992,716,018 £1,154,307 £909,814,097 £82,901,921
Highway Structures (excluding Birmingham)

138
Structure TypeInventory
(Deck Area or Linear Measure)
Gross Replacement
Cost (£)
Annual Depreciated
Costs (£)
Ave Cond’tn Indices
Depreciated Replacement
Cost (£)
Restore to New Cost (£)
H/way Bridges (All Types)
437,135 sq.m. £2,308,159,497 £2,622,810 0.91 £2,099,122,040 £209,037,457
Ped/Cycle Bridges (All Types)
11,304 sq.m. £44,205,019 £67,824 0.92 £40,553,161 £3,651,858
Subways 21,947 sq.m. £83,577,563 £131,682 0.92 £77,180,888 £6,396,675
Culverts 33,551 sq.m. £74,751,961 £50,326 0.92 £69,040,453 £5,711,508
Retaining Walls 52,014 lin.m. £67,209,303 £78,021 0.93 £62,690,124 £4,339,178
Total £2,577,723,343 £2,950,663 £2,348,586,666 £229,136,677
Highway Structures (including Birmingham)
Restore to New Cost
The restore to new costs for the Metropolitan Area Structures, again excluding Birmingham, is over £82
million, which equates to approximately £14 million per district over the period of LTP3. Restore to new
costs have been calculated using typical replacement costs of structural elements.
An analysis of bridge replacements undertaken over the last 20 years indicate, based on the ageing
bridge stock, that it will be 60 years before a structure can be considered for replacement. This is a
particular concern for the structures constructed during the post war building boom that are now 50
years old, were not designed for, nor built to, current standards and have inherent maintenance liabilities
associated with the mode of construction.

139Annual Depreciated Cost
Referring to the report ‘Funding for Bridge
Maintenance’, produced by the County
Surveyors Society now the Association of
Directors of Environment, Economy, Planning
and Transportation in February 2000, and also
CIPFA Guidance on annual replacement costs
(that take account of component replacement
costs) structural assets in the Area (excluding
Birmingham) would require funding at a level of
around £1,154,307 a year in order to maintain
them in a serviceable condition. This figure does
not include the extraordinary costs required for
assessments, strengthening, upgrading, and any
contributions for work to bridges owned by others.
Adopting the principles of Asset Management
is fundamental to the effective long-term
management and preservation of these assets,
and the need to develop tools and procedures
to support effective Asset Management of
highway structures is widely recognised. The CSS
“Guidance Documents for Bridge Inspection
Reporting and Evaluation of the Bridge Condition”
has been adopted by the Metropolitan Authorities.
However, a Condition Indicator alone will not be
sufficient to measure the overall performance,
or fitness for purpose, of a stock of highway
structures, as this does not take account of
loading criteria.
The dynamic associated with Asset Management
of Structures is complex given the range of
disparate components. Whilst the annual
depreciated cost is the cost to maintain in
serviceable condition (from new condition), this
will combine with the restore to new cost as
components reach their life expectancy.
D. Progress and Successes from LTP2
Section 31 Grant was made available in LTP2 to complete the strengthening of structures on the Primary
Route Network. However, reductions in 2010/11 Grant mean that not all bridges/structures on the
Primary Route Network have been upgraded to current standards.
Funding for bridges for the Metropolitan Area in recent years has been lower than that suggested by
the Whole of Government Accounts. This situation has been exacerbated by the need also to carry
out extraordinary works in connection with the assessment and strengthening programme. Spending
on bridge maintenance seeks only to manage deterioration, rather than undertake renewal work.
Opportunities for intervention reduce with the passage of time.
140All bridges, with the exception of a few not owned by the highway authorities, have now been assessed,
and the strengthening programme is now stalled because of limited funding availability. Further pressure
on funds comes from Third Parties whose policies allow for controlled deterioration, with a view to long-
term replacement, and thus increase the likelihood of contributions from Local Authorities.
Resource constraints are not only limiting Districts’ ability to address renewal work requirements, but also
increasingly impacting on both routine and reactive maintenance elements.
The experience gained from works already carried out in strengthening bridges owned by Network Rail
(NR) has shown that in some cases the costs to the highway authorities were initially underestimated with
the result that planned work and funding needs identified in LTP2 were prejudiced. This has resulted in
work to a number of bridges that require strengthening being deferred.
The information regarding retaining walls is variable. Some maintenance has been carried out on major
structures on strategic routes, but little or no maintenance has been carried out on many others. The
quality of records is being improved, as inspections and assessments of these structures proceed.
Many Third Party structures impact on the public highway and, with passage of time, structures that were
considered to be marginal are becoming inadequate to support the loadings placed on them. Such
matters are often beyond the capability of many Third Parties to fund. This may arise, for example, from
developers who have retained ownership ceasing to trade, or residential property owners who have an
unaffordable liability. In this circumstance, liability may pass by default to the Highway Authority and,
whilst efforts are made to recover costs, this is both time consuming and costly and, in the case where a
charge is put on a property, costs may not be recovered for many years.

141E. LTP3 Objective Alignment
KO1 – Economy Provides critical links between industrial, commercial and retail centres. Providing access to and enabling flourishing and diverse economies.
Well-maintained, unrestricted structures reduce network stress through the provision of convenient and desirable routes.
By securing structural integrity of the Highway Network supports the Transport Vision associated with aspirations for economic growth.
More particularly enables movement of Freight to industrial and commercial areas
KO2 – Climate Change Where bridges meet loading criteria avoiding excess carbon emissions arising from diversion routes
Unrestricted structures enable shorter journeys and enable free flow conditions reducing vehicle emissions
KO3 – Health, Personal
Security and Safety
Well-maintained structures secure safety of the travelling public in line with the duty of care and also maintain access for emergency services
Risks to construction operatives and the travelling public can be reduced through pro-active asset management and lifecycle planning with reduced intervention frequencies
KO4 – Equality of
Opportunity
Bridges provide access to all to local facilities
Footways associated with structures need where appropriate to be DDA compliant.
KO5 – Quality of Life
and Local Environment
Bridges provide an essential link to education, health services, commercial and recreational areas. Improving access to jobs and essentials for day-to-day life.
Bridge aesthetics influence local residential areas and the sense of prosperity if not maintained.
Diversions associated with loading restrictions can have an adverse affect on local community
142F. Major Challenges to Highway Structures
•Changes to European standards and traffic growth on network
•Flooding arising from rising river levels
•Changing needs of local communities such as prioritised bus routes.
• Inability of third parties to maintain structures
G. LTP3 Policies – Highway Structures
Each Council’s Highways Asset Management Plan
will clearly establish its overall strategy for bridge
maintenance, in line with the Policies set out
below, as circumstances and funding permit.
Policy TAM4: To seek to ensure that current
service levels are maintained in respect of
highway structures
In a fiscally challenging environment, bridges and
ancillary highway structures will be maintained to
provide the required service level by the most cost
effective means possible.
Whilst the funding methodology also needs
to take account of historic structures and the
demands placed on renewal by the historic
significance of the structure to the surrounding
environs, it is the case that where this imposes
a significant premium, temporary works may be
necessary.
Whereas the following criteria are considered
in drawing up programmes and priorities for
the maintenance and strengthening of highway
structures, structural integrity and safety
considerations will take precedence:
•The overall policies and objectives of this LTP
The strategic importance of the highway
taking into account:
Whether on the Primary Route Network
• Links to and between local industrial,
commercial and retail centre
• Existing traffic flows and future
requirements especially with respect to
lorries and public transport
• Availability of suitable alternative routes
• Community linkages
• The integrity of the structure and
associated risks to the highway user
Cost effectiveness and value for money
especially where funding fails to meet
requirements and consideration needs to be
given to:
• The benefits of carrying out several low
cost schemes as opposed to one high cost
scheme strategy low cost strengthened RFA
143• Economic and environmental benefits
from maximising the number of weight
restrictions and associated diversions that
can be removed
The feasibility of imposing permanent weight
restrictions or other measures taking into
account:
• Impact on the highway network as a whole
• Effects on the local community and economy
• Problems of enforcement and
consequential effectiveness
• Disruption to the highway network whilst
carrying out the work and the need for
co-ordination with works being carried
out by others such as the Highways
Agency, neighbouring authorities, statutory
undertakers and developers
Environmental issues such as:
• Local congestion
• Land drainage flooding Surface Water
Management Plans maintain flood risk
assessment
The requirements of other outside parties:
• Statutory Transport bodies (railways and
waterways)
• Neighbouring authorities
• Abnormal load routing
The continuity of funding, as works to
structures may extend over more than one
financial year.
Action 1: Return and maintain the asset
to steady state by the use of maintenance
activities that will retain performance levels
and extend the remaining life of existing assets
To fulfil optimum service potential and arrive at
good economic asset management, the backlog
of current outstanding deterioration needs to
be addressed.
Maintaining serviceability over the life cycle
requires a maintenance regime and life cycle plan
that addresses timely treatment to ensure that
those component parts of a structure with a finite
life reach that life target.
Where possible when carrying out maintenance
work, the opportunity is taken to upgrade various
elements of a structure where funding permits. An
example of this would be the replacement of a
sub-standard parapet that has become severely
corroded with one that complies with current
requirements.
It must be recognised that an incremental
approach through maintenance regimes, whilst
securing the integrity of the component being
replaced, does not offer best value in terms of
maintaining the whole structure, as revisits
may be necessary.
144Action 2: Maintenance Programmes to be
inspection based to ensure structural integrity
Maintenance programmes are drawn up based
on the findings of the inspections. The main
objectives are to ensure structural integrity and
preserve the bridge’s load carrying capacity for
the prescribed design life. To ensure best value,
maintenance work should include the repair of
any damage (caused through ageing or more
increasingly through accident or vandalism) plus
measures to remove the causes of the damage,
such as re-waterproofing. In many cases, due
to insufficient resources, this is not possible and
the scope of the work has had to be limited to
address more immediate issues such as safety.
Allied to this is the need to address sub standard
Third Party structures as, ideally, the assessment
and strengthening of privately owned bridges
and structures requires close liaison and co-
ordination. However, degenerated structures can
necessitate urgent attention that precludes the
consultation process and incurs an unfunded cost
liability on behalf of the highway authority, to be
recharged where possible to the owner of the
structure.
Action 3: Inspections to be based on
national standards
Where it is judged that an existing assessment
is unrealistically pessimistic, additional work
is likely to improve significantly the theoretical
load carrying capacity of a bridge and, where
there are likely to be overall cost savings, further
assessment work is carried out.
When considering the need to strengthen a
bridge this can have a major impact on the
carriageway as such Bridge works may necessitate
a road closure. Accordingly, works of this nature
are subject to particular consideration as the
economic argument associated with a full
closure, and the economic disbenefits that may
accrue associated with commercial activity, have
to be weighed against the additional costs of
construction by lane closure.
Where it is not affordable to strengthen a bridge,
or where service conditions suggest that a weight
restrictions is sustainable, appropriate local
consultation with bus operators, businesses,
residents and others affected by the proposals is
carried out (eg the Freight Quality Partnership).
Action 4: Where Bridge works will affect
operation of the carriageway consultation
with bus operators, emergency services,
public utilities, businesses, and residents to
be undertaken
145This often influences the measures taken,
especially where a weight restriction is being
considered and it is found that local businesses
would be adversely affected. One-way working
or restricted width, to restrict deck loading, may
impact less on commercial activity than a weight
restriction.
Risk assessments have been carried out at all
such sites in accordance with the document
‘Road Vehicle Incursion Risk Ranking (Version
9)’. The results of the scoring associated with risk
assessments are used as a basis for determining
the scope and priority of work considered
necessary. However, highway authority priority
may differ from that of NR, arising from the
incompatibility between transport bodies.
Liaison amongst the Metropolitan Authorities
takes place on a regular basis through ADEPT -
West Midlands Area Bridge Conference, in order
to share experience and learn from each other.
Dialogue with the statutory transport undertakers,
DfT and the Highways Agency is continuing and
being developed.
Safety issues have been identified in connection
with subways. Many suffer from vandalism and
are used for anti-social behaviour. They are often
perceived by the public as being unsafe, generally
due to their secluded nature, poor lighting and
lack of maintenance. Many subways are being
infilled and replaced with alternative facilities,
as part of other programmes. However, subways
often provide the safest routes for pedestrians to
cross roads, and a number of Authorities have
a programme of works to improve them, to
encourage their use and reduce vandalism.
Action 5: Where funding permits, Vehicle
Incursion measures to be undertaken where
deemed appropriate by risk assessment and
as identified by maintenance prioritisations
Action 7: Maintenance programmes for
subways to enhance the environment and
include vandal and fire resistant treatments
Action 6: The Bridge Group and the West
Midland Area Bridge conference to be
supported to enable dissemination and
adoption of, best practice.
146
Although the assessment of the load carrying
capacity of road bridges is substantially complete,
there are a number of bridges in the Black
Country that serve industrial areas that have
failed their initial assessment and, as a result, are
considered sub-standard. Case studies have been
undertaken that indicate the bridges in question
and the associated economic impacts.
Bridges that do not meet their loading criteria
have to be proactively managed in accordance
with national guidelines until they have been
strengthened, permanently restricted, propped
or proven by further more rigorous assessment
to be adequate to carry the increased loads
required. In a number of instances, the safety
Action 8: A Major Scheme comprising a
number of bridges in the Black Country
to be developed that seeks to address the
accessibility constraints imposed by bridges
that require loading restrictions that impact
on commercial activity
Action 9: Where required loadings do
not meet current standards implement
interim measures to secure the safety of
the travelling public until such time as
strengthening works are affordable and are
considered to be good value for money
factors associated with the assessment process
may be prejudiced, and in this circumstance more
rigorous inspection regimes are implemented.
This position is unsustainable in the longer term.
When considering the final measures to be
carried out on a sub-standard bridge, the
imposition of a permanent weight restriction is
usually found to be unacceptable because of the
resultant detrimental economic affects that would
occur, but may be unavoidable where factors of
safety are severely prejudiced. In almost all cases
within the Area, strengthening is the only option if
local and national objectives are to be achieved.
The measures being carried out associated with
accidental wheel loadings, namely prevention of
access to edge of decks or temporary barriers,
are a short-term solution, which does not resolve
the Highway Authority’s liabilities.
Whilst implementation of the Asset Management
methodology and practises based on bridge
condition indicators are to be used to determine
the needs and priorities for resources, the nature
of the bridge stock in terms of overall condition,
availability for works (rail possession), limitations
imposed by statutory undertakers, plant access
requirements and safety considerations restrict
the ability to rely on this indicator as a
determinant of performance.
Action 10: Bridge Condition Indicator to be
used as performance measure
147
A. Role of Street Lighting
Good street lighting helps create a better,
safer environment to support the movement of
vehicular and pedestrian traffic. The increased
safety, security and enhancement afforded by
modern street lighting are widely acknowledged.
Accordingly, the role of street lighting is to:
• Provide a safe highway network for all
road users during the hours of darkness
• Minimise the environmental impact of
street lighting whilst enhancing the night
time ambience
• Ensure that public lighting is in keeping
with and properly integrated into the
highway infrastructure
• Help reduce crime and the fear of crime
In providing the street lighting service,
opportunities will be taken to adopt best practice
and deliver in a cost effective manner.
Street Lighting
Commercial, industrial and residential growth
will be assisted if street lighting and signage is
effective and provides a positive visible impact on
the quality of the local street scene. Numbers and
severity of road accidents can be reduced through
smart and efficiently managed lighting and
signing. Improvements in street lighting have been
seen as a key instrument in reducing both the fear
of crime and crime itself.
Also included within this asset group are
illuminated signs, ‘Keep Left’ bollards and other
associated assets. Illuminated signs for both traffic
purposes and advance direction play a part in
accessibility and supporting economic wellbeing.

148B. Asset Valuation and the CIPFA Asset Infrastructure Code
The need for identification of street lighting assets for power consumption purposes means that good
inventory data has historically been kept on street lighting assets. The CIPFA code has introduced a
formal requirement for Highway Authorities to gain a more comprehensive knowledge of their highway
assets insofar as street lighting is concerned. Districts have developed comprehensive inventory
and condition data, to prepare for asset valuation in line with Whole of Government Accounts and
depreciated accounting methods.
The following table shows the accounting figures that will be required as part of Whole of Government
Accounts when audited reporting starts in the financial year 2012/2013. The detailed explanation of
the calculation and methodology behind the cost columns can be found in the asset management
section of this document.
For LTP3 purposes, the following figures have been developed from the individual District AMPs and
amalgamated to give a regional total. (Birmingham, Walsall and Coventry figures have been separated
in terms of costing due to ongoing PFI investment programmes).
Inventory (Number of
Units)
Gross Replacement
Cost (£)
Annual Depreciated
Costs (£)
Depreciated Replacement
Cost (£)
Restore to New Cost (£)
Street Lighting Columns
110,585 £123,529,700 £4,117,656 £65,882,516 £57,647,184
Illuminated Bollards
4,484 £4,737,307 £157,909 £2,526,576 £2,210,731
Illuminated Signs
12,975 £14,694,267 £489,808 £7,836,954 £6,857,316
Total 128,044 £142,961,274 £4,765,373 £76,246,046 £66,715,231
Street Lighting (excluding Birmingham, Coventry and Walsall)

149Inventory
(Number of Units)
Gross Replacement
Cost (£)
Annual Depreciated
Costs (£)
Depreciated Replacement
Cost (£)
Restore to New Cost (£)
Street Lighting Columns
260,972 £277,344,650 £9,244,821 £147,917,176 £129,427,474
Illuminated Bollards
11,935 £12,366,257 £412,208 £6,595,346 £5,770,917
Illuminated Signs
38,637 £47,998,379 £1,608,945 £25,599,148 £22,399,234
Total 310,199 £337,709,286 £11,265,974 £180,111,670 £157,597,625
Street Lighting (including Birmingham, Coventry and Walsall)
Depreciated value based on age profile is an average of 14 years useful life consumed
Asset Summary
The Metropolitan Area network excluding
Birmingham, Coventry and Walsall (under PFI
arrangements) consists of circa 110,000 street
lighting columns, 4,400 illuminated bollards
and 13,000 illuminated signs with a gross
replacement asset value of over £142 million.
Restore to New
In 2004 Walsall were the first to address the
deteriorated lighting stock through a street
lighting PFI. This enabled the replacement all
of the lighting stock within the five year core
replacement programme and established
a methodology to maintain street lighting.
Birmingham and Coventry have followed suit with
a PFI and are embarking on similar replacement
programmes over the coming years.
The remaining Authorities still have backlog
issues with regard to column replacement and
to achieve good economic asset management
this needs to be addressed. The restore to new
costs are a requirement of the new CIPFA code,
where the true costs of removing the backlog of
the deteriorated columns needs to be expressed.
There needs to be a programme of replacement
of those lighting columns that are life expired and
are deemed to be high risk.
The restore to new costs for the Metropolitan
Area street lighting, signing and illuminated
bollards stock, excluding Birmingham, Walsall
and Coventry, is over £66 million, which
equates to approximately £16 million per
district.
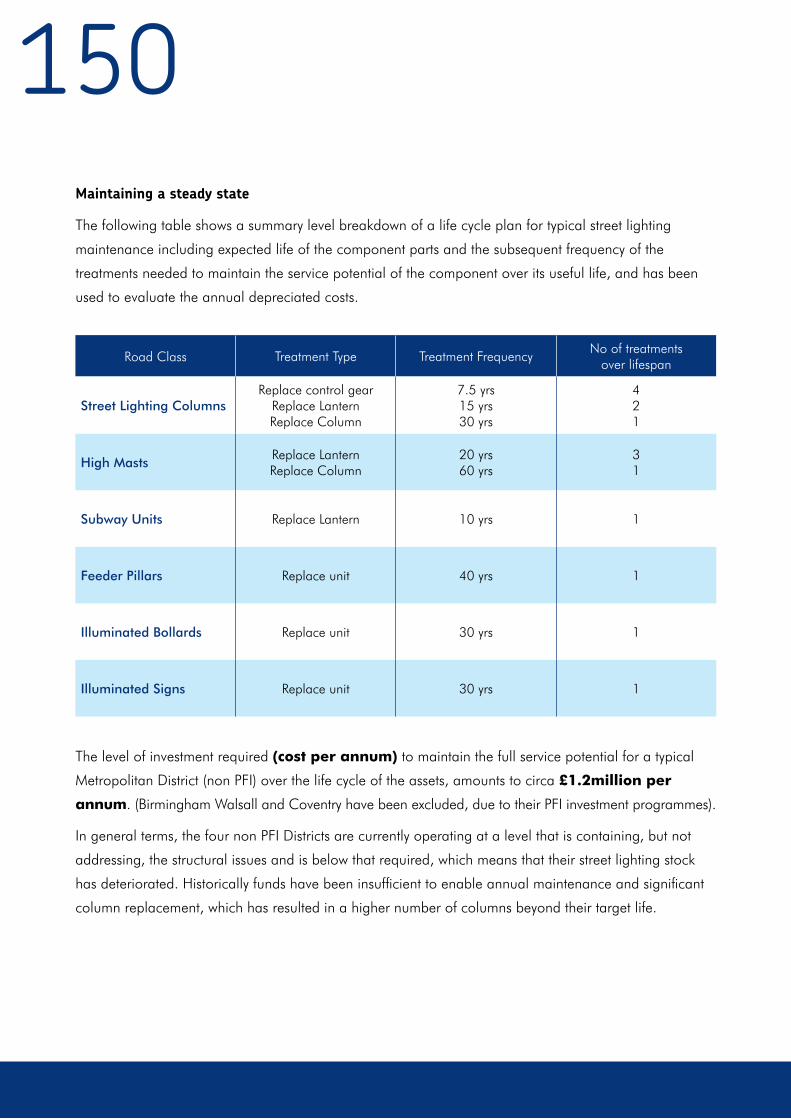
150Maintaining a steady state
The following table shows a summary level breakdown of a life cycle plan for typical street lighting
maintenance including expected life of the component parts and the subsequent frequency of the
treatments needed to maintain the service potential of the component over its useful life, and has been
used to evaluate the annual depreciated costs.
The level of investment required (cost per annum) to maintain the full service potential for a typical
Metropolitan District (non PFI) over the life cycle of the assets, amounts to circa £1.2million per
annum. (Birmingham Walsall and Coventry have been excluded, due to their PFI investment programmes).
In general terms, the four non PFI Districts are currently operating at a level that is containing, but not
addressing, the structural issues and is below that required, which means that their street lighting stock
has deteriorated. Historically funds have been insufficient to enable annual maintenance and significant
column replacement, which has resulted in a higher number of columns beyond their target life.
Road Class Treatment Type Treatment FrequencyNo of treatments
over lifespan
Street Lighting ColumnsReplace control gear
Replace LanternReplace Column
7.5 yrs15 yrs30 yrs
421
High MastsReplace LanternReplace Column
20 yrs60 yrs
31
Subway Units Replace Lantern 10 yrs 1
Feeder Pillars Replace unit 40 yrs 1
Illuminated Bollards Replace unit 30 yrs 1
Illuminated Signs Replace unit 30 yrs 1

151D. Progress and Successes from LTP2
With the onset of asset management
improvements over recent years, we have
collected good inventory data and a number
of processes for determining condition and
deterioration, and are now in a better position to
establish what is needed and to carry out future
life cycle planning.
Funding
Funding from Government for the replacement
of street lighting stock has been made primarily
through the PFI funding stream. Although in
recent years, funding has been made through
the LTP Maintenance Block, which has enabled
replacement of columns deemed to be at high
risk. This funding has been matched by some
Districts through prudential borrowing, enabling
some backlog issues to be addressed.
Asset Management Approach
Inventory and visual condition data for the street
lighting stock is fairly comprehensive across the
Area. Further development of the management
tools and systems required is underway, which will
ensure that we can continue to apply a strategic,
whole life costed approach.
Sustainable Street Lighting
As a major consumer of electricity, more efficient
lighting operations, enabling carbon reduction at
the source of power generation, is probably the
most significant aspect of sustainability. A number
of initiatives are currently being examined:
• Reducing street lighting CO2 emissions, by
the use of energy saving technology kits
installed on streetlights.
• Dimming Trials have been carried out,
whereby LED street lights are mounted
on new or existing columns, which
automatically dim by 40% between
midnight and 6.00am.
• Investigation and use of Central
Management Systems to make associated
resource savings
• Switching from illuminated bollards to their
non-illuminated equivalents, dependant on
future legislation.
152E. LTP3 Objective Alignment
KO1 – Economy Enhances amenity value of an area.
KO2 – Climate Change Developing carbon emissions reduction strategy contributes to climate change agenda.
KO3 – Health, Personal
Security and Safety
Reduces the number of criminal and anti-social incidents.Improve community and neighbourhood safety & social cohesion.
KO4 – Equality of
Opportunity
Improves general travel opportunities for all, particularly by ensuring good street lighting at accesses and routes to multi-modal exchange points.
KO5 – Quality of Life
and Local Environment
Contributes to amenity value of an area.
F. Major Influences on Street Lighting
The arguments regarding structural deterioration have been rehearsed having been addressed by three of
the seven Metropolitan Districts using the PFI approach to replace their lighting stock.
Safety
For many years it has been acknowledged that the reduction of nighttime accidents and the subsequent
increase in safety of road users is a major benefit to be gained by the provision of street lighting. It is well
documented that good street lighting can reduce nighttime road accidents by 30%.
Road safety is not the only benefit to the community from the provision of street lighting. Over the past
decade over 16 lighting and crime evaluations have been carried out in major towns and cities in the
UK. One of the most sophisticated evaluations was carried out in the Metropolitan Area. This provided
clear and reliable evidence showing that targeted, improved street lighting can reduce all types of crime
and disorder, depending on the context into which it is introduced. A cost benefit analysis revealed that
street lighting improvements paid for themselves in one year, in relation to savings in crime reduction.

153The Crime and Disorder Act places an obligation
on Local Authorities to develop and implement
Safer Community Strategies. The provision of
modern street lighting, designed to the correct
standard, is a very tangible way to demonstrate
our commitment to the provision of a safer and
more attractive community.
Obtrusive Light
Obtrusive light (also referred to as light pollution)
has the potential to impact on human mental and
physical health, including disturbed sleep patterns,
resulting in fatigue, increased anxiety, and stress.
Obtrusive light is extremely costly in terms of
energy wastage, particularly with regard to the
non-beneficial upward direction of some lighting.
With some estimates suggesting that lighting
consumes one quarter of all energy expended
worldwide, consumption and associated wastage
also has significant consequences in terms of
carbon emissions.
Obtrusive light is an avoidable consequence
of poor interior and exterior lighting design,
often exacerbated by poor installation and
maintenance. Careful design to ensure
appropriate light levels, where and when it
is needed, can yield benefits which include
environmental and ecological restoration,
improved human well being, reduced energy
wastage and financial cost, and reduced
interference with astronomy.
Climate Change Act
The Climate Change Act of 2008 was introduced
as the main United Kingdom response to the
Kyoto Protocol. The main provisions of the Act
are to enforce the reduction of carbon emissions,
caused by power generation or other sources,
by 80% of their 1990 levels by 2050, and, with
an intermediate reduction by 34% by 2020.
Further the Government also announced the
Carbon Reduction Commitment Energy
Efficiency Scheme (CRCEE). (See Appendix
for procurement strategy).
154The objective is to fund the restore to new element
of the street lighting stock in order to carry out a
strategic maintenance approach. The life cycle
plans identify all columns and illuminated signs
that are beyond their design life, or at risk in
line with ILP Technical Report TR22. This means
to pro-actively renew street lighting equipment
through a prioritised asset management
approach, enabling a targeted replacement
programme to be funded in line with available
resources.
The objective is to fund the annual depreciated
costs to maintain a steady state, to carry out a
strategic maintenance approach. The developed
life cycle plans will identify all capital works and
their projected timings, to ensure that street
lighting equipment is maintained for the full life
cycle, and able to withstand the influence of
damaging factors such as weather extremes and
other external influences.
G. LTP3 Policies – Street Lighting
The Districts’ Highways Asset Management Plans
will clearly establish overall strategy for street
lighting infrastructure maintenance in line with the
policies set out below and as circumstances and
funding permit.
Policy TAM5: To seek to improve the
performance of the Street Lighting Network
Actions
Actions 1a and 1b are policies based on
investment needs for street lighting.
In order to fulfil its potential, it is crucial that the
street lighting stock is well maintained and there
is a clear need to achieve an asset management
approach. Investment needs to be planned,
effectively managed and supported by technical
and management systems.
Action 1a: To undertake street lighting
renewals in accordance with the profile
established by the CIPFA Infrastructure Asset
Management Code, but limited to the funds
identified in both LTP3 and locally available
funding through prudential borrowing
Action 1b: To undertake annual street
lighting maintenance in accordance with
the Well Lit Highways Code of Practice and
to deliver the strategies as set out in this
document.
155Actions 2a – 2b set out reactive policies.
The following reactive actions will follow an
approach that will manage a limited number of
column replacements, by identifying additional
funds that may be available through LTP3 and
assessing where the stock can be expected to
safely outlive its design life.
Supporting LTP3 by prioritising maintenance
where it can be combined with schemes to
improve strategic corridors. This will ensure
that investment in improving the corridors can
be delivered by ensuring that street lighting
infrastructure is capable of facilitating the
improvements, and provide an environment that
will deliver significant economic growth.
This approach will be extended to upgrading
street lighting when carrying out other LTP3
schemes, such as holistic carriageway and
footway schemes, safety improvements or public
transport improvements.
Action 2a: To integrate street lighting
column renewal in conjunction with
Strategic Corridor Investment or other
major scheme works
Action 2b: Carry out a structural testing
regime and other condition inspections to
isolate individual columns that need to be
targeted for replacement and to establish
the stock, which can be safely extended
beyond its design life
Embark on a programme of structural testing in
order to maintain structural integrity, by facilitating
individual column replacements and identifying
equipment that can be safely sustained beyond its
design life.
156
A. Role of Procurement/Commissioning
Procurement / Commissioning
The pursuit of better, more efficient transportation
services is a driver in how the Area intends
to drive forward procurement efficiencies, as
procurement of professional and contracted work
underpins delivery of LTP3.
Construction is the biggest single area of Local
Authority capital expenditure and LTP3 provides
the resources to fund a significant proportion of
that expenditure through work on, and associated
with, highway infrastructure.
The benefit of getting it right first time, delivering
defect and dispute free contracts, not only adds
value but also enhances public recognition
of service delivery. The Area is committed to
excellence in service delivery.
Procurement ranges from small, low value, but
highly specialised work, to major construction
schemes, together with associated professional
services. Each has its own procurement approach,
from spot pricing to term contract arrangements
and scheme specific arrangements. Increasingly,
however, the benefits of long-term frameworks are
being recognised in delivering the commissioning
of services, in particular where the contractor is
engaged as part of the design process.
In the current economic climate, where Authorities
are seeking to achieve more with less resource,
there is a strong focus on how procurement can
deliver savings through more efficient back office
processes, support commissioning and assist
local businesses.
Against the background of the above, the
Authorities have established the Procurement
Group to review and take forward approaches
that reduce the administrative burden of
procurement, whilst at the same time achieving
more effective service delivery, typically through
the development frameworks of collaborative or
joint working.
The Government, in its publication National
Procurement Strategy – Final Report published in
April 2008, sets out a number of procurement
priorities, which it expects Local Authorities to
consider. Whilst these matters fall specifically to
Authorities through their Standing Orders and
Financial Management Regimes, the support
the development of areas of mutual benefit, to
identify where collaborative Districts procurement
arrangements could add value and efficiencies.

157B. Procured Services
LTP3 will be delivered by a combination of in house provision and contracted services. Even allowing
for the current fiscal constraints, a considerable value of procurement activity is undertaken associated
with delivering the LTP, that offers potential efficiencies with smarter procurement techniques and
collaborative working.
C. Progress and Successes from LTP2
Highway Maintenance
Substantial benefits are gained by working
together to develop a consistent approach to
the management of the highway network in the
Area, in particular through the joint procurement
of specialist services. The Highway Infrastructure
Management Group (HIMG) have established
specialist groups, to allow officers to share
knowledge and experience, identify and promote
good practice, benchmark services, identify
opportunities for joint procurement, and co-
ordinate programmes of work.
To support joint working, a number of specialist
groups reporting to HIMG have been established,
including:
•Pavement Management
•Winter Service
•Technology
•Highway Structures
•Street Lighting
•Asset Management
Working together and identifying a lead role for
integration with national initiatives has allowed
the Districts to share knowledge, expertise
and costs, and to ensure that consistent data
is produced across the Area for use in the
development of this LTP.
Joint working is actively encouraged, and a wide
range of services have been jointly procured.
Initially this was done to ensure cost effective
access to a number of shared services, such
as the provision and maintenance of transport
statistics through the long standing Joint Data
Team, based in Solihull.
Discussions with local businesses through Think
Local initiatives identified that in respect of small
value specialist services, individual contracts
by each Authority did not provide an economic
package (notwithstanding the duplication of
procurement). Accordingly, provision of services
has been aggregated across Authorities, to form
a package that offers economies of scale, for
example:

158•Skid resistance measuring procured by Dudley.
•Carriageway Scanner surveys procured by Solihull.
•Coarse visual inspections and detailed visual inspections procured by Walsall.
•Weather forecasting procured by Dudley.
• ICELERT weather display information procured by Sandwell
•Salt procured by The Black Country Purchasing Consortium.
•The Metropolitan Area Traffic model PRISM and other data support procured by
CEPOG’S Core Support Team.
•The Project Management System procured by Dudley
Implementation of the above has demonstrated
the benefits of undertaking joint procurement,
giving much greater ‘buying power’ through
packaging contracts to make them more attractive
to suppliers, thereby achieving more competitive
prices. In addition, significant savings are made
in administrative costs and staff time by having
one Authority manage each contract, rather
than each Authority going through the same
process of contract preparation, tendering, tender
assessment, award and contract management.
By combining contract mechanisms into a single
integrated service delivery process, we have
rationalised demands on public sector resources
by eliminating wastage and creating efficiency
savings through economies of scale. This
demonstrates commitment to the collaborative
working approach in line with Sir John Egan’s
principles “Rethinking Construction” and Sir Peter
Gershon’s review of public sector efficiency.
In respect of Transport Asset Management, joint
working has ensured a consistent approach
across the Area. This has secured consistency
of data collection, improved reliability of data
coverage, increased accuracy and confidence
in our digitised networks and the exploration of
deterioration modelling techniques.
Collaborative working has fostered improved
flexibility for responding to local data collection
priorities, particularly when meeting specific
project driven targets, such as Birmingham’s
Highway Maintenance Public Finance Initiative
(PFI). It has also created a framework for
delivering bespoke staff training programmes and
developing survey formats which target the parts
of the network previously neglected by BVPI’s.
159In financial terms alone it is estimated that the
joint procurement arrangements associated with
Highway Maintenance, presently in place, save
the Area’s Authorities circa £150,000 each year,
with the prospect of much greater savings in
the future from the new initiatives that are
being developed.
Highway Improvements
The initiatives set out above offered efficiencies
for provision of specialist, but nevertheless
straightforward (insofar as contractual matters are
concerned) services. A more difficult area for joint
working is in the area of construction associated
with improvements to the highway, where complex
contractual issues and conflicts between local
practices can arise.
Analysis demonstrates that there was considerable
duplication of procurement processes associated
with minor improvements in each of the 4 Black
Country Authorities - a potential workload of
circa £20m that could be accommodated in a
singly procured framework arrangement. Against
this background, a Black Country Contract
Group was established to work collaboratively
to agree a common format for Standard
Details, Specification, Method of Measurement
and Conditions of Contract. The contractual
provisions were modelled on a Framework
Arrangement developed over many years by
Dudley and recognised as good practice by the
Audit Commission in their report Modernising
Construction. This enabled a single host to have
oversight of the Framework, with individual
components of work being managed and
controlled locally.
Sandwell were in a position to extend their
current term contract by 12 months and host
the establishment of the Black Country Minor
Works Framework Contract through a full OJEU
process for work in the Black Country – including
Centro activities.
Black Country Minor Works Framework
This seeks to achieve back office savings in the
procurement of works (typically Smart Routes,
Local Safety Schemes, and Minor Improvements
etc) by development of a collaborative working
contract both for works to circa £500k, and in
delivery of cross boundary schemes. The contract
also seeks to deliver a greater level of confidence
in programme delivery by avoiding delays in
procurement occasioned when projects are
tendered on an individual basis.
The framework contract that comprises a basket
of rates that underpin local instructions has 2
categories of work: -
1. From £0 to £50,000 based on a
simplified Conditions of Contract with a
simple call off order.
2. From £50,000 to £500,000 based on the
ICE Minor Works Contract.
160The contract is between Sandwell Council and
each individual contractor with the remaining
three councils and Centro having rights under
the Contracts (Rights of Third Parties) Act 1999 to
require the Contractor to carry out works orders
under the terms of the overarching framework.
The new contract commenced on 21st January
2010 and is now fully operational. The framework
of 6 contractors is administered by a management
board with representatives from each authority,
which seeks to drive up performance, ensure a
consistency of approach, ensure equitable use
of contractors between authorities and improve
programme delivery by regular dialogue with
contractors on potential future workload and
ensuring no contractor becomes overstretched.
Cross Boundary Working
Administrative boundaries can be artificial
when considering schemes that cross authority
boundaries and a joint working approach can
deliver efficiencies.
Programme Management
During the LTP2 period a Capital Programme
Monitoring system, IMPREST, recognised by DfT as
good practice, has been procured and developed
to provide Members of the P&T Monitoring
Group with contemporaneous information for
Major Schemes. In addition, the system has been
used to monitor in detail the UTC Major Scheme
and some Authorities are using it as their sole
source of information for project and programme
management system.
D. LTP3 Objective Alignment
KO1 – Economy •Understanding, and actively engaging with, local markets enables stimulation of the local economy.
•Rationalised demands on public sector resources by use of combined contracts across the Metropolitan Area assists local business.
•Use of local contractors supports local economy.
•Authorities have signed up to a concordat for small and medium enterprises in the community

161KO2 – Climate Change •Sustainable procurement seeks to take on board climate change
typically through recycling of aggregates to reduce the use of natural resources.
• Retread processes for Highway Surfacing reduce the use of bitumen products, virgin aggregates and energy
•Through Asset Management Planning, where resources permit, whole life costs to be taken account of in construction techniques.
•Monitoring progress with development/ implementation of cool asphalts
KO3 – Health, Personal
Security and Safety
•The procurement of contractors through a quality appraisal process that takes on board their approach to dealing with the travelling public whilst undertaking works on the public highway has a beneficial impact on the safety of the travelling public.
•Health & Safety Records are assessed through RIDDOR and performance compared to stated policies.
•Proactive management of works on the highway secures safety of the visually and physically impaired.
KO4 – Equality of
Opportunity
•Embedded in procurement processes is the requirement for contractors to have equal opportunity policies and demonstrable practices.
•A number of major contracts have implemented training schemes to assist the unemployed youth and integration of offenders.
KO5 – Quality of Life
and Local Environment
•Works on the highway can have a significant impact on the local environment through creation of dust noise and restricted access a number of contracts engage with the Considerate Contractor Scheme that monitors the working methods and recommends improvement.
•Positive encouragement by the contractor of interactive with pollution control colleagues.
•Works undertaken to avoid peak traffic to reduce congestion.
162E. Major Influences on Procurement
Understanding the market for construction contracts enables effective packaging of work. By developing
larger collaborative contracts, there is opportunity to smooth workflow and achieve economies of scale
by avoiding peaks and troughs of demand.
F. LTP3 Policies – Procurement
The WMs through the WM Procurement Group
is developing a Procurement Strategy to identify
how:
• Performance can be improved
• Partnership working can be delivered
• Modern procurement techniques can be
developed
• Capacity can be built to deliver the policy
objectives
• Working with local businesses can be
developed.
• Sustainable procurement can be supported
• Colleagues and service users can be
consulted and trained
Policy TAM6: To improve the performance of
delivered services
Actions
In the current economic climate, whilst funding
may be reduced, there is an even greater need
to ensure delivery on time and to budget and to
make the best use of scarce resources.
Delivery, performance and making best use of
resources is a matter that is high on the Members’
Agenda, and the LTP3 Monitoring Committee
(LTP3MC) has been established to monitor and
scrutinise delivery performance, receiving reports
from IMPREST – the Capital Programme Monitoring
System. This identifies financial and project progress,
together with an alert on risk status. By this means
opportunities for re-profiling the delivery of
projects can be considered and measures put in
place to ensure best use of resources.
The suitability for purpose of IMPREST is being
kept under review to ensure that the most
appropriate programme management techniques
and systems are being utilised.
The Procurement Group is a catalyst for the
sharing of best practice. Typically, contract
formats are considered such as the Minor Works
Framework, drawing on experience with the
successful Dudley Framework and LEAN review
currently underway in Walsall.
Action 1: Proactively monitor and manage
delivery

163The LEAN review is an approach that seeks
to eliminate waste in the process under
consideration. In the case of the Walsall, the
review challenged existing processes associated
with reactive maintenance, seeking to drive out
non value-added activity.
The Minor Works Framework developed during
the LTP2 period has enabled savings from joint
procurement and, as local contracts expire, the
Minor Works Framework is being adopted for
work in the Black Country Authorities’ area.
The Major Works Framework (MWF) is intended
to facilitate the design, construction and delivery
of local transport schemes comprising highway
improvements in excess of £500k, together with
works on bridges and structures. The contractual
model is that individual schemes utilising the
Major Works Framework will be procured under
the NEC Option C Contract, namely Target Price
with an incentivised Pain/Gain shared between the
contractor and employer. The contracting authorities
will be all of the Metropolitan Authorities, together
with Telford and Wrekin Council and Centro.
Action 2: Continue to develop the Black
Country Minor Works Framework
Action 3: Implement the Major Works
Framework
The contract is seen as key to achieving efficiency
savings in delivering the Implementation Plan
and specialist Cost Consultancy Support from
a practice that holds extensive local cost data
is essential to taking the contract forward. An
essential component in managing the MWF is the
proactive management, control and structured
approach to risk.
The benefits that could be achieved by operating
a single framework include:
• Consistency of approach and process for
the delivery of the projects that deliver the
objectives of the LTP.
• Sharing of technical knowledge and cost
intelligence for development of a Major
Works Frameworks Estimating database
• Increased awareness of risk and
opportunity
• Stimulation of innovation and continuous
improvement through the Framework
Community Group consisting of
participating authorities and Panel
Contractors (more than one to be awarded)
• Potential to share risk of cost overrun
utilising a risk reserve administered by
the Project Board (whilst this applies
initially to cross boundary Smart Route
implementation there is potential upon
greater devolvement of transport funding
to apply this to disparate Major Schemes)
164It is considered that the above approach takes
forward the benefits of partnership working to
the next level recognising the issues that have
emerged over 12 years of using this approach.
The Major Works Framework seeks to modernise
the contracting approach, however, it is
recognised that the commercial environment
can be volatile with opportunities presented and
potentially lost as market conditions change.
In managing programmes of work it is essential,
therefore, that a mixed economy is promoted to
ensure on going value for money it is proposed
that award of contracts will be monitored typically:
• Analysing a mix of arrangements to
demonstrate value for money.
• Develop details of spend analysis.
• Identify current and potential commodity
Contracts (i.e. salt)
• Assess the impact of Birmingham PFI on
Market conditions not only on availability
of contracting resource but also on
potential draw down of arrangements.
• Maintaining the competitive element
through MINI Competitions involving Panel
Contractors.
• Provide a vehicle for immediate tender
action to address delivery issues arising
from delays elsewhere in the LTP
programme.
• Access to a panel of suitably qualified
contractors who have been selected using
a Quality and Price criteria.
• Authorities will be able to introduce specific
quality criteria that may be appropriate to
work in their area.
• A proposal to be investigated that gives
encouragement to individual Panel
Contractors to adopt a framework
alliance approach rewarded by financial
gain, triggered by the overall successful
delivery of the MWF in proportion to their
measured individual contribution to the
overall success of all schemes carried out
under the framework (this concept is in an
embryo stage of conceptual development)
In broad terms the procurement philosophy,
enabled by a greater funding resource than can
be achieved at a local authority level, draws on
the benefits of partnership working generated
by the Early Contractor Involvement approach
with modifications to incorporate a competitive
element and potentially recognition of
successful delivery.
Action 4: Take into consideration market
conditions
165
A number of national and regional commodity
contracts are in place and these are to be
supported where economically advantageous.
Transportation services are delivered under a mix
of in house resource and external consultants. In
the current climate there is a need to maximise
available resource, and establishment of the
Implementation Plan will enable a resource
alignment exercise to be undertaken to explore
the in house resource capacity that is available to
deliver programmes. It is anticipated that this will
enable retention of skills vital not only to support
authority’s intelligent client role but also to deliver
services across authority boundaries.
The Metropolitan Authorities are working together
to review the use of consultancy services with
the objective of determining those that could
potentially be resourced through the use of spare
capacity (where this offers best value against
consultancy provision).
Action 5: Support involvement in national
and regional commodity contracts
Action 6: Explore the opportunities to build
capacity through joint working and exploring
better utilisation of existing internal resources
across the Metropolitan Authorities
Shared services are therefore being explored
adopting the guiding principles that:
• Service change should be underpinned
by an appropriate business case, with a
realistic assessment of all associated costs
and benefits, infrastructure requirements,
timescales and risks.
• Irrespective of any service delivery change,
participating Councils should retain an
appropriate level of control and oversight.
• The exercise should recognise the need
for transparency and fairness in relation to
shared costs and benefits.
• Shared service proposals should take
account of each Council’s strategic
direction, policy initiatives and
improvement plans.
• All Councils should be required to play an
important role in championing identified
proposals
• All activities should be supported by
effective engagement with staff, elected
members, trade unions, customers and the
general public.

166
It is recognised that there will be a need for a
range of specialist consultancy services and
Centro is leading on engaging with the Highway
Agency’s Framework Consultancy arrangements.
In terms of professional services procured from
external resources, a number of arrangements are
currently in place:
• The Joint Data Team Contract includes
provision for commissioned services
• The Highway Agency Project Support
Framework Contractual arrangements
have been used for employment of
consultants.
• Authorities have a number of local
arrangements in place.
• The Major Works Framework includes
provision for design services to support
delivery of schemes.
The adoption of a collaborative procurement
framework agreement should result in best value
procurement both in terms of:
• Establishing best practice specifications and
services provision.
• Benefiting from collective economies of
scale through large volume procurement
requirements.
Action 7: Progress the collaborative
procurement of professional services
These services (framework agreements) would be
accessed where services cannot be provided by
other Local Authorities, or where they do not offer
best value over and above framework estimates.
A number of initiatives are in place to support
local business:
• ‘Find It in Sandwell’
•The Black Country Procurement Portal,
• ‘Think Walsall’.
• Birmingham working with local business
linked to regeneration.
The contribution of LTP funded works to the
local economy is valued and assistance is made
available to main contractors to find local supply
chain partners ensuring healthy competition,
value for money and a potential to reduce the
carbon footprint. The use of local businesses and
appointment and development of local labour is
monitored within contracts.
This will be further developed in particular
through the supply chain of the Major Works
Framework.
Action 8: Support Local Businesses where
appropriate
167
Sustainability is built into local procurement
strategies, processes and contracts to ensure that
the most appropriate approach is adopted.
The way in which authorities purchase goods and
services can influence the CO2 balance resulting
from its highway maintenance activities.
The introduction of price/quality tendering is one
way in which contractors can be encouraged
to innovate in service design. For example,
if a tender evaluation model were to show a
significant proportion of the assessment being
directly attributable to the volume of CO2 that
would be emitted from the contractor’s proposed
service, then contractors would be more likely to
readily invest in the development of low carbon
technology.
Action 9: Take full account of sustainability
issues in service delivery
Action 10: Take full account of sustainability
in the procurement of goods and services
Although barriers exist in the form of European
trading laws, encouragement of local purchasing
and local employment could have a major impact
on the volume of fuel burnt in getting labour,
plant and materials to the location of works in
this vein such an approach supports PROC5 –
Support local Businesses.
New materials that require less energy in their
manufacture use may not necessarily be the
cheapest, especially during early years of
their development. Ways of encouraging the
development and testing of such materials will
be explored.
168LTT5: A RAIL AND RAPID TRANSIT NETWORK AS A “BACKBONE FOR DEVELOPMENT” (RR)
168
169169Passenger Rail (Network Rail and Centro Schemes)
A. Role of Rail
The rail network has a pivotal role in supporting
the policy objectives of LTP3. The Metropolitan
Area lies at the heart of the UK rail network,
which supports both passenger and freight, and
this provides both challenges and opportunities
for LTP3.
Passenger rail provides high capacity, fast and
reliable connectivity across local, regional and
national networks. This allows people to live and
work in a greater range of places within the Travel to
Work Area, increasing their access to employment
opportunities. At the same time, businesses have
access to a greater employment pool allowing
them to recruit and grow, improve their own
productivity and have wider access to markets.
The fast, reliable and accessible attributes of
passenger rail are highly attractive and encourage
more sustainable travel patterns, whilst rail travel
carbon emissions per kilometre are lower than
private car travel. Passenger rail therefore has
an important role in delivering LTP3 Strategy
objectives towards supporting economic growth,
reducing carbon emissions and reducing road
congestion.
B. Rail Partners: Roles and Responsibility
Department for Transport (DfT)
DDfT sets the overall framework and strategy for railways and provides public funding in England and
Wales. It procures and oversees private Train Operating Companies’ delivery of the 16 rail franchises in
England and Wales and also defines outputs and funding for the rail industry on a five-year cycle, known
as Control Periods.
Office for Rail Regulation (ORR)
Created through the Railways Act 2005 (previously to which existed as an independent rail regulator), this is
an independent statutory body, which regulates Network Rail, secures compliance with relevant health and
safety law, licenses operators of railway assets and enforces competition law in the rail sector. It has a key
role in the contractual framework for the rail industry, undertaking periodic reviews of access ‘charges’ and
overseeing the 5-year business planning process, which determines funding levels and outputs.
170Centro
Centro is the promoter of rail in the Area and
works with stakeholders to identify, develop and
implement rail schemes and strategies. It funds
incremental improvements to rail services and has
a statutory role to work with stakeholders up to 25
miles outside the Metropolitan Area to promote
rail schemes which can benefit or influence
rail within the Area. Centro has developed the
Integrated Public Transport Prospectus, which
outlines an aspirational rail network, which has
been used to inform LTP3. It also develops,
implements and operates local rail Park & Ride
across the Area, as well as promoting strategic
Park & Ride.
Network Rail (NR)
Network Rail, a company limited by guarantee,
owns and operates Britain’s fixed rail
infrastructure, including rail stations, which it
leases to train operators with the exception
of Birmingham New Street, which Network
Rail operates directly. It also has responsible
for the reliability of the network and leads on
performance and industry planning. DfT provides
grant funding, and Train Operating Companies
pay Network Rail track access charges.
Train Operating Companies (TOCs)
Train Operating Companies operates franchises
as tendered by the DfT, typically for 7 years
although longer franchises are being proposed.
London Midland is the principal TOC in the Area,
initially until 2015, operating all suburban rail
services. Additional TOCs cover other regional
services, the Cross Country network and the
West Coast Main Line network.
Rolling Stock Leasing Companies
Rolling Stock Leasing Companies (ROSCOs) own
the majority of rolling stock which is then leased
by the TOCs.
Passenger Focus
Passenger Focus is a statutory body funded by
DfT to protect passengers’ interests by ensuring
that passengers’ views are represented whenever
decisions are taken that affect the rail network. It
is responsible for the National Passenger Survey.
C. Progress and Successes from LTP2
Rail Patronage in the Metropolitan Area
During LTP2, rail patronage across the Area has continued a long-term growth trend reaching 37.6M
in 2008/09, up from 19.7M in 1994/95. This equates to 1.4M passenger journeys per 100,000 of
population, the second highest figure of the major urban areas outside London, after Merseyside.

171
Rail Successes
Rail patronage growth during LTP2 can be directly attributed to the policies and schemes delivered by
Centro, Local Authorities and the rail industry, which include the following:
i Park & Ride Expansion
Centro delivered over 600 additional Park & Ride up spaces across the Area during the LTP2 period,
from 5587 at the start of LTP2 to 6200 at the end of LTP2. Park & Ride occupancy was at 95% during
2008/09 compared to 80% in 2005/06.
Department for Transport
Rolling stock
leasing companies
Passenger train
operating companies
Office of Rail Regulation1
Network Rail Owns and operates the rail infrastucture
Passengers Passenger Focus2 Contractors
Subsidies & performance payments Franchise premiums
and performance payments
Operating Licences
Track access charges
Performance payments & access compensation
Lease Trains
Fare revenue
Statutory Guidance and directions
Safety and economic regulator of Network rail
Payments for renewals and enhancement work
Network grant
Structure of Rail industry in England2
2 Source: Increasing Rail Capacity (2010) National Audit Office
172ii New West Midlands Rail Franchise
In 2008, London Midland was awarded the new
rail franchise covering the local rail network.
Enhancements resulting from the new franchise
include new trains (inc. the Parry People Mover),
additional passenger capacity from new services,
longer trains and increasing reliability. Such
factors have increased the attractiveness of rail.
iii West Coast Main Line Upgrades
During LTP2, Network Rail completed the upgrade
of the West Coast Main Line which provided
a significant step forward for rail, including
increased rail capacity, reduced journey times,
additional rail services, improved reliability and
increased access to the network during off-peak
times.
iv Real Time Information
Centro, in partnership with London Midland, has
now installed Real Time Information at all local
rail stations across the Metropolitan network,
ensuring passengers have accurate information
about their services and this contributes towards
increasing levels of rail passenger satisfaction with
services.
v Resignalling and Network Enhancements
Network Rail have undertaken a series of
resignalling programmes and wider rail network
enhancements to increase the capacity and
reliability of the Metropolitan Area rail network.
Schemes included:
•Coventry Area resignalling;
•Gibbet Hill line doubling;
•Tyseley Junction remodelling;
•Stratford Line resignalling and enhancements
Committed Rail Schemes
Given the longer term nature of rail scheme
development processes, the following major
rail schemes developed during LTP2 will begin
implementation during Control Period 4 (2009-14)
and therefore during the timeframe of LTP3:
i New Street Station Gateway
In 2010, following preparation works, full works
began on the redevelopment of Birmingham New
Street. This is one of Europe’s busiest rail stations,
handling 140,000 people per day, over twice its
original design capacity, and is being redeveloped
to provide a world-class gateway to Birmingham
city centre and the Metropolitan Area.
Network Rail, Birmingham City Council and
Centro are working together to deliver the £600M
redevelopment. Birmingham New Street Gateway
will deliver the following benefits:

173•A new concourse that is three and a half
times bigger than at present
•Increased passenger handling capacity
to meet forecasted demand over the next
30-40 years;
•Increased accessibility for all users to and
within the station;
•£2bn of economic benefits including
10,000 jobs across the Metropolitan Area;
•Catalyst for regeneration of the south side
of Birmingham city centre
ii Cross City South Extension & Bromsgrove
Rail Station Redevelopment
Cross City South is the busiest local rail corridor
in the Metropolitan Area and is served by 10
min frequency service patterns. Between 2005
and 2008 there was a 26.9% increase in AM
peak loadings. The route runs between from
Longbridge to Birmingham city centre, with 2
trains per hour running from Redditch.
Bromsgrove and Redditch are two major towns
within the Travel to Work Area and thus have
significant flows into Birmingham and the Area as
a whole. Just two trains per hour serve Redditch,
resulting in an unattractive service pattern, as well
as overcrowding on existing services. Bromsgrove
only has an hourly off-peak service and no direct
link to Longbridge.
Providing additional rail capacity at Bromsgrove
Station is limited by the length of platforms,
notably the northbound platform, which is
constrained by road crossings and the base of the
Lickey incline. Trains with more than 3 coaches
cannot serve the existing station. Additionally,
there is limited car parking provision, again
limiting rail access, as well as contributing to high
levels of on street parking in the adjacent area.
NR, Centro and Worcestershire County Council
are working together to promote a new station at
Bromsgrove, located to the south of the existing
one, which will include a 300 space Park & Ride
facility. The new station would be served by Cross
City South services resulting from electrification of
the route between Barnt Green and Bromsgrove.
Upon completion, both Redditch and Bromsgrove
will be served by 3 trains per hour and have
platforms able to handle 6 coach trains.

174
KO1 Economy • Supports efficient movement of people to areas where economic
activity taking place especially commuters to centres during peak
periods.
• Helps reduce congestion on the highway network freeing up capacity
for essential vehicle movements
• Supports the economic regeneration of Longbridge;
KO2 Climate Change • Modal shift encourages reduced reliance on the private car thus
reducing carbon emissions
KO3 Health, Personal
Security and Safety
• Complementary station travel plans to encourage use of active modes
to access stations.
• Continued investment in security measures, including increasing
passenger capacity to reduce overcrowding, to reduce crime and fear
of crime.
• Likelihood of personal accident lower amongst rail users.
KO4 Equality of
Opportunity
• Improves access to goods, services and opportunities for those
without access to a car or with mobility impairments.
KO5 Quality of
Life and Local
Environment
• Railway corridors comprise part of local authorities’ Green
Infrastructure Networks and provide habitats for flora and fauna.
• Supports migration of species in response to climate change
(K02 also)
• Trees in railway corridors capture carbon, improve air quality and
help prevent soil erosion. (K02 and K03 also)
D. LTP3 Key Objective Alignment
175E. Major Influences on LTP3 Rail
An Integrated Sustainability Appraisal (ISA) has been undertaken to support the preparation of LTP3.
This includes an analysis of relevant plans, policies and programmes from international through to local
level and their implications for LTP3, including rail. In addition to the policy framework identified for Rail
by the ISA, the following have been identified as major influences on passenger rail over the LTP3 period:
Integrated Public Transport Prospectus
Centro, in conjunction with partners, has developed the Integrated Public Transport Prospectus (IPTP),
which outlines the long-term vision for public transport across the Area, taking into account existing and
future major development. It includes a rail and Rapid Transit network, which provides a “backbone”
for rapid, high capacity public transport which provides access across the Metropolitan Area, as well
as providing connectivity to the wider Travel to Work Area. The rail network outlines new passenger rail
corridors and new stations to help meet the growing demand for rail travel. The rail and rapid transit
map is outlined below and informs the development of LTP3 Rail.
Regional Rail Development Plan
Local Authorities of the West Midlands Region and Centro, in conjunction with the Regional Rail Forum,
have developed the Regional Rail Development Plan (RRDP). This outlines patronage drivers along rail
corridors, aspirational service provision, and the required network enhancements to deliver additional
capacity and/ or increased service reliability. Aspirational rail service provision takes into account the
released rail capacity which will be gained from High Speed Rail.
Making the Right Connections
In 2010, Centro investigated the opportunities to deliver world-class rail services across the Area through
enhancing rail travel through a ‘whole journey’ approach. Whilst the RRDP outlines enhancement of
rail services and network requirements, Making the Right Connections focuses on the requirements and
aspirations of passengers and how Centro could enhance station facilities and infrastructure to deliver
world class services.

176
Lond
on
Banb
ury
Read
ing,
Lond
on
COVE
NTR
YN
orth
ampt
onLo
ngBu
ckby
Rugb
y
War Mem
orial P
ark
Cannon Park
Universi
ty of W
arwick
New
Rd
Cind
er B
ank
Pedm
ore
Rd
Cana
l St
Wat
erfro
nt
Mer
ry H
illBR
IERL
EY H
ILL
Stou
rbrid
ge To
wn
Stou
rbrid
ge J
unct
ion
Hag
ley
Blak
edow
n
Kidd
erm
inst
er
Har
tlebu
ry
Dro
itwic
h Sp
a
Wor
cest
er N
orth
/ F
ernh
ill H
eath
Worceste
r
Foreg
ate Str
eet
Worceste
r
Shrub H
ill
Malvern Lin
k
Great M
alvern
Lye
Crad
ley
Hea
thOld
Hill
Row
ley
Regi
s
Lang
ley
Gre
en
Brom
sgro
ve
Alv
echu
rch Re
dditc
h
Smet
hwic
k G
alto
n Br
idge
Sand
wel
l &D
udle
y
Dud
ley
Port
Sedg
ley
Rd
Birm
ingh
am N
ew R
d
Tipto
n Rd
Stat
ion
Driv
e
DU
DLE
Y TO
WN
CEN
TRE
Floo
d St
Tipto
n
Cose
ley
The
Roya
l
Wol
verh
ampt
on S
t Geo
rge’
sBu
s St
atio
n
Bilb
rook
Cods
all
Alb
right
on
Cosf
ord
Shifn
al
Telfo
rd C
entra
l
Oak
enga
tes
Wel
lingt
onSh
rew
sbur
y Pa
rkw
ay
Shre
wsb
ury
Brin
sfor
d
Penk
ridge
Staf
ford
Ruge
ley
Tren
t Val
ley
Lichfi
eld
Tren
t Val
ley
Ruge
ley
Tow
n
Hed
nesf
ord
Cann
ock
Land
ywoo
d
Blox
wic
h N
orth
Pels
all
Brow
nhill
s
Blox
wic
h
Ald
ridge
WA
LSA
LLW
illen
hall
WO
LVER
HA
MPT
ON
Prie
stfie
ldTh
e Cr
esce
ntBi
lsto
n Ce
ntra
lBi
lsto
n U
rban
Vill
age
Loxd
ale
Brad
ley
Lane
Gre
at B
ridge
Roa
dW
edne
sbur
y Pa
rkw
ayW
edne
sbur
y G
reat
Wes
tern
St
Wed
nesb
ury
Bus
Stat
ion
Plec
k
Gol
ds H
ill
Gre
at B
ridge
Hor
sele
yRd
Hea
th To
wn
New
Cro
ss H
ospi
tal
Reed
swoo
d
Wal
sall
Willenhall
Wednes
field
Wol
verh
ampt
on U
nive
rsity
Scie
nce
Park
I54
Busi
ness
Par
k
Junc
tion
3
Edgb
asto
n
Bear
woo
d In
terc
hang
e
Five
Way
s
Smet
hwic
kRo
lfe S
t
Fran
kley
Uni
vers
ity H
ospi
tal
Uni
vers
ity
Selly
Oak
Five
Way
s
Mos
eley
King
s H
eath
Haz
elw
ell
Long
brid
ge
Nor
thfie
ldKing
s N
orto
n
Barn
t Gre
en
Blac
k La
keH
ill To
p
Dartmouth St
Lodge R
d / To
wn Hall
WES
T BRO
MWICH CEN
TRAL
The H
awthornsHandsw
orth Booth St
Winson G
reen
Outer Circ
le
Soho Ben
son Rd Je
wellery
Quarte
r
St Pa
uls
Bord
esle
y
Smal
l Hea
thTy
sele
y
Sprin
g Rd
Hal
l Gre
en
Yard
ley
Woo
d
Shirl
ey
Whi
tlock
s En
d
Wyt
hall
Earls
woo
d
The
Lake
s
Woo
d En
d
Dan
zey
Hen
ley-
in-A
rden
Woo
tton
Waw
en
Wilm
cote
Stra
tford
Par
kway
Stra
tford
-upo
n-Av
on
Hat
ton
War
wic
kPa
rkw
ayW
arw
ick
Leam
ingt
on S
pa
Keni
lwor
th
Lapw
orth
Dor
ridge
Wid
ney
Man
or
SOLI
HU
LL
Aco
cks
Gre
en
Olto
n
Swan Ya
rdley
Sheld
on
Elmdon
Lea H
all
Bordes
ley G
reen
Adderley
Park
Stech
ford
Fort
Park
way
Cast
le V
ale/
Cast
le B
rom
wic
h
Wat
er O
rton
Cole
shill
Par
kway
Dud
dest
on
Ast
on
Witt
onG
rave
lly H
ill
Erdi
ngto
n
Ches
ter R
d
Wyl
de G
reen
SUTT
ON
CO
LDFI
ELD
Four
Oak
s
Butle
rs L
ane
Blak
e St
Shen
ston
e
Lichfi
eld
City
Besc
ot S
tadi
um
Tam
e Br
idge
Park
way
Ham
stea
dPe
rry
Barr
New
tow
n
Bradford
Place
Great B
arr
Burto
n-up
on-T
rent
Wiln
ecot
e
King
sbur
y
Nun
eato
n
Berm
uda
Park
Bedw
orth
Rico
h A
rena
Kere
sley
New
land
s
Prol
ogis
Par
k
Park
and
Rid
e N
orth
Chel
msl
eyW
ood Birm
ingh
amBu
sine
ss P
ark
BIRM
ING
HA
MIN
TERN
ATIO
NA
L
Mar
ston
Gre
en
Ham
pton
-in-A
rden
Berk
swel
l
Canl
ey
Tile
Hill
Canl
ey N
orth
Tile
Hill
Tany
ard
Farm
Who
berle
yH
ears
all
Com
mon
Pool
Mea
dow
Bus
Sta
tion
Stok
eWyk
en
Wal
sgra
veH
ospi
tal
Ans
ty
Swan
swel
l
Fole
shill
Spon En
d
Dud
ley
St G
un V
illag
e
BIRM
ING
HA
MCI
TY C
ENTR
E
P+R
P+R
Wor
cest
ersh
irePa
rkw
ayP+
R
P+R
P+R
P+R
P+R
Tam
wor
thP+
R
P+R
P+R
P+R
P+R
P+R
P+R
Bour
nvill
e
Key
Rail
Line
with
sub
urba
n se
rvic
es
Rail
Line
with
nat
iona
l/re
gion
alse
rvic
es o
nly
Mid
land
Met
ro
Ultr
a Lig
ht R
ail
Rapi
d Tr
ansi
t(s
tops
are
indi
cativ
e)
Prop
osed
Sta
tion
/ St
op
Inte
rcha
nge
Stat
ion
/ St
op
Mai
n Bu
s In
terc
hang
e
Stat
ion
with
regu
lar
natio
nal/
regi
onal
ser
vice
s
Exis
ting
/ Po
tent
ial P
ark
and
Ride
loca
tion
serv
ing
a st
rate
gic
mov
emen
t dem
and
P+R
Wes
t Mid
land
s Lo
ng T
erm
Rai
l and
Rap
id T
rans
it N
etw
ork
P+R
P+R
Colwall
Ledbury
Hereford
Clav
erdo
nBe
arle
y
Ches
ter,
Mid
Wal
es
Crew
e, S
toke
Der
by
Leic
este
r
Eves
ham
,Lo
ndon
Chel
tenh
am S
pa
P+R
Calif
orni
a
P+R
P+R
Meadway
Kidd
erm
inst
er P
arkw
ayP+
R
Bartl
ey G
reen
Dar
last
on
Sutto
n Co
ldfie
ld S
PL
Stre
etly
Wal
mle
y
P+R
All Saints
177Rail Industry Value for Money Study
Sir Roy McNulty was appointed by the previous Government to undertake a fundamental review of the
costs and value for money of rail in the UK. This was in response to the very high costs that exist in the
industry, which affect the affordability of rail services. The review is likely to lead to significant changes
in some areas of the industry and this will inevitably impact on the delivery of LTP3. It is hoped that the
fundamental outcome will be increased affordability. Government is also reviewing other aspects of rail
policy, such as franchise policy, and this could also lead to changes in how rail services are delivered
over the LTP3 period.
Route Utilisation Strategies (RUS) and CP5 Business Plan
The rail industry is currently developing its business plan for Control Period 5 (2014-19), and this will
take the outputs and recommendations of the various Route Utilisation Strategies as a key input. The
West Midlands and Chilterns RUS is the main document for the Area, and it outlines the interventions the
industry considers necessary to deliver predicted growth. The five-yearly business planning cycle is the
main process through which Government funds the rail industry, and therefore ensuring that the business
plan properly reflects the requirements of the Area is essential. Centro is working closely with NR and
other industry partners to ensure that there is close alignment between the LTP3 strategy and the RUS.
E. LTP3 Policies - Rail
Within the context of LTP3 Objectives, ISA and the
major influences outlined above, the following
LTP3 rail policies have been developed.
Policy RR1: Expanding Rail Network Capacity:
To expand local rail network capacity to meet
forecasted growth in patronage, delivering the
schemes and objectives of the Regional Rail
Development Plan. This will include maximising
capacity of the ‘classic’ rail network derived from
High Speed Rail
The West Midlands Regional Planning Assessment
assesses long-term patronage, opportunities
and challenges for the Metropolitan Area rail
network over the next twenty years in the context
of forecast changes in population, the economy
and travel behaviour, and associated spatial
policy and strategy. It has forecasted a long-term
patronage growth range of 30%-60% (individual
rail corridors vary) between 2011 and 2026,
reflecting different rates of employment and
varying levels of economic growth.
178terms of new services, reduced journey times and
improved reliability. This released capacity will
help meet forecasted long term demand up to
2026 and beyond. Centro will therefore work with
rail industry partners to develop and implement
schemes within the RRP, including maximising
released capacity derived from the opening of HS2.
Policy RR2: Making the Most of the
Existing Network: To work with DfT, ORR,
Network Rail, Local Authorities, Train Operating
Companies and Rail Freight Operators to identify
and develop schemes on the rail network
to increase capacity and reliability for both
passenger and freight services
In the longer term, additional train services and
new rail lines will be required to meet patronage
demands. New rail lines require long term
planning and development which means the
bulk of future patronage growth will need to
be handled by the existing network. To deliver
additional rail services in existing rail corridors,
the rail network must operate as effectively as
possible, maximising capacity and services to
meet growth. Ensuring this network efficiency is
even more important given that many of the rail
corridors in the Area are mixed traffic between
fast, slow, passenger and freight services.
DfT’s policy response for rail patronage growth
up to 2014 is for the industry to provide longer
platforms to cater for longer trains, along with
supporting infrastructure such as additional
depot capacity as required. Longer trains will be
provided through 1300 additional carriages,
which will provide for an additional 20% increase
in seating capacity across the network, forecast
to cater for demand up to 2014. Therefore,
whilst patronage growth can be accommodated
by train lengthening of existing services, long
term additional demand generated primarily
by population growth areas and economic
regeneration, can only be delivered through
additional rail services along existing corridors or
from new rail corridors.
Similar attention needs to be focused on rail
stations themselves, if we are to deliver world-
class rail services across the Area. To this
end, Centro is working with DfT, Network Rail
and London Midland to transfer ownership of
Metropolitan rail stations to Centro. This will
complement Centro’s existing role within rail
infrastructure ownership and development,
allowing Centro to deliver world-class rail
services.
High Speed Two (HS2) presents a major
opportunity to deliver an expanded and enhanced
rail network across the Area through the transfer
of existing rail services off the existing network
and onto High Speed services. This presents a
significant opportunity for Centro and rail partners
to deliver a step change in local rail services in
179Therefore, Centro will work with rail industry
partners to identify and develop schemes on the
rail network to increase capacity and reliability
for both passenger and freight services. This is
in alignment with the LTP3 principle of Smarter
Management through making the best use of
existing infrastructure.
To deliver a world class rail network, it is vital that
enhancement to service provision, stations and
rolling stock are complemented by high quality
rail standards and network accessibility covering
the time before, during and after a rail journey.
Rail accessibility includes both physical access to
rail stations, by all modes, as well as delivering
inclusive access to rail use such as tackling
barriers to use such as fare levels or off-peak
service availability.
Policy RR3: Passenger Rail Standards and
Network Accessibility: To work with Local
Authorities, Network Rail and Train Operating
Companies to deliver high levels of services
standards and accessibility which delivers an
inclusive network accessible to everyone
Customer Satisfaction surveys undertaken by
Centro as well as rail passenger champion
Passenger Focus demonstrates a high level of
satisfaction with the overall rail product available
across the Metropolitan Area.
High quality rail standards and network
accessibility cannot be delivered by one rail
partner individually and many Authorities and
operators have a role to play. Therefore, Centro
will work with Local Authorities, Network Rail and
Train Operating Companies to deliver high levels
of services standards and accessibility, which
delivers an inclusive network which is accessible
to all.
180Metro and Rapid Transit
A. Role of Rapid Transit
Rapid Transit is a key component of the Integrated
Public Transport Prospectus, which includes
outlined aspirations for a rail and rapid transit
network. This outlines new Rapid Transit stops and
routes to provide a “backbone” for rapid, high
capacity public transport, which provides high
quality connectivity across the Metropolitan Area.
Rapid Transit corridors have been identified as
high volume corridors which cannot be served by
rail and, subsequently, provide an integrated rail
and Rapid Transit network.
The fast, reliable and highly accessible attributes
of Rapid Transit encourage more sustainable
travel patterns, whilst Rapid Transit carbon
emissions per kilometre are lower than private
car travel and, in the case of Light Rail, are
zero emission at point of use. Rapid Transit, as
part of the rail and Rapid Transit network has
an important role in delivering LTP3 Objectives
towards supporting economic growth, reducing
carbon emissions, reducing social exclusion and
reducing road congestion.
Rapid Transit can be delivered using three
different mode types:
• Light Rail: Delivered using trams and
currently operating in the Metropolitan
Area as Midland Metro
• Bus Rapid Transit: bus based rapid transit
mode, proposed to be branded in the
Metropolitan Area as Sprint
• Tram Train: vehicles which can operate on
both the classic rail network and on light
rail routes;
The principal attributes of Rapid Transit are:
• Speed: forms of public transport that
are faster than local bus services, to
enable longer journeys to be made within
acceptable times, often taken as 45
minutes journey time.
• Capacity: forms of public transport
which have a higher capacity than local
bus services for key flows of movement,
typically for corridors of over 12,000 public
transport passengers per day
• Permanence: fixed permanent links,
to shape land use plans and provide
security on which to invest in sustainable
developments
• Integration: to enable journeys to be
easily made easily through use of more
than one mode or service, with convenient
availability of local bus services to make
the initial or final connections on a journey
181• Accessibility: the provision of accessible
infrastructure, information and services,
supported by staff with disability awareness
training
These attributes are supported by operational
aspects to deliver quality through:
• Frequency: “turn up and go” frequencies
of at least every 8 to 10 minutes which,
market research shows, remove the
constraint of organising personal time
around the timetables of public transport
services
• Reliability: reliability, through effective
operational management and significant
segregation from general traffic flow, lends
itself to people having confidence in, and
so selecting, public transport as a mode of
choice
• Operating hours: as employment and
leisure patterns change, so an 18-hour
operating day should be a minimum
standard for the rapid transit. This is
alongside an aspiration for 24-hour service
where demand warrants it.
• Image: quality features and strong positive
image help rapid transit modes in their
impressive performance for modal shift in
the corridors where they operate.
B. Rapid Transit Partners: Roles and Responsibility
Centro
Centro is the promoter of rapid transit and
owns the existing Metro Line One route between
Wolverhampton and Birmingham city centres.
Travel Midland Metro
Travel Midland Metro currently operates Metro
Line One as a concession contract on behalf of
Centro.
Local Authorities
Local Authorities are partners in the development
of Rapid Transit across the Metropolitan Area.
Firstly, Local Authorities are responsible for spatial
planning which provides the protection of rapid
transit routes and alignments, which is critical to
allow future Rapid Transit to be delivered, along
with providing a foundation for wider sustainable
land use planning. Secondly, as Highway
Authorities, Local Authorities work with Centro
to develop and deliver schemes and supporting
measures on the highway network.
182C. Progress from LTP2
The only Rapid Transit route currently operating
in the Area is Metro Line One. Patronage during
the period of LTP2 has remained constant at 5M
journeys per annum. Reliability of Metro Line One
remains consistently high with overall reliability
(measured as a percentage of actual mileage run
compared to scheduled mileage) of 99.7% during
2008/09. There are 538 Park & Ride spaces
associated with Metro Line One, which during
2008/09 had an occupancy rate of 94% in the
AM peak compared to 74% in 2006/07. Metro
takes an estimated 1.2 million car journeys off the
roads per annum whilst 14% of passengers using
Metro formerly used cars for the same journey
and 30% of passengers have a car available for
their journey.
Rapid Transit Progress
During LTP2, Centro, Local Authorities and
partners have developed and delivered the
following schemes and initiatives:
i Real Time Information
Centro, in partnership with Travel Metro, has
now installed RTI at all Metro stops, ensuring
passengers have accurate information about their
services which contributes towards increasing
levels of passenger satisfaction.
Committed Rapid Transit Schemes
The following major schemes developed during
LTP2 will begin delivery during LTP3:
i Birmingham City Centre Extension
Midland Metro has demonstrated its contribution
to encouraging sustainable travel patterns,
supporting redevelopment, reducing carbon
emissions and increasing accessibility, particularly
within the Black Country. Therefore, extending the
Midland Metro network has been recognised as
Regional Transport Priority. At the same time, the
existing Midland Metro trams are constraining
patronage growth and the scheme will see the
introduction of a larger fleet or larger trams to
provide capacity to meet existing and future demand.
In February 2011, DfT confirmed funding to
extend Metro Line One from Snow Hill Station
to redeveloped New Street Gateway station,
connecting economic growth points within
Birmingham city centre as well as improving
access to Birmingham. The £127M scheme
will provide significant benefits to Birmingham
and Black Country residents as well providing
infrastructure to extend Metro further across
Birmingham and the Metropolitan Area. Key
benefits include:
• Increased access to employment,
particularly from the Black Country, whilst
linking major employment points across
Birmingham city centre
•Supporting or creating 1,300 jobs
•Increasing GDP by £50m per annum,
contributing to reducing the GVA output gap
•Releasing rail capacity at Snow Hill by
allowing Platform 4 to be returned to rail use
•Increasing Metro passenger handling
capacity and attracting new patronage
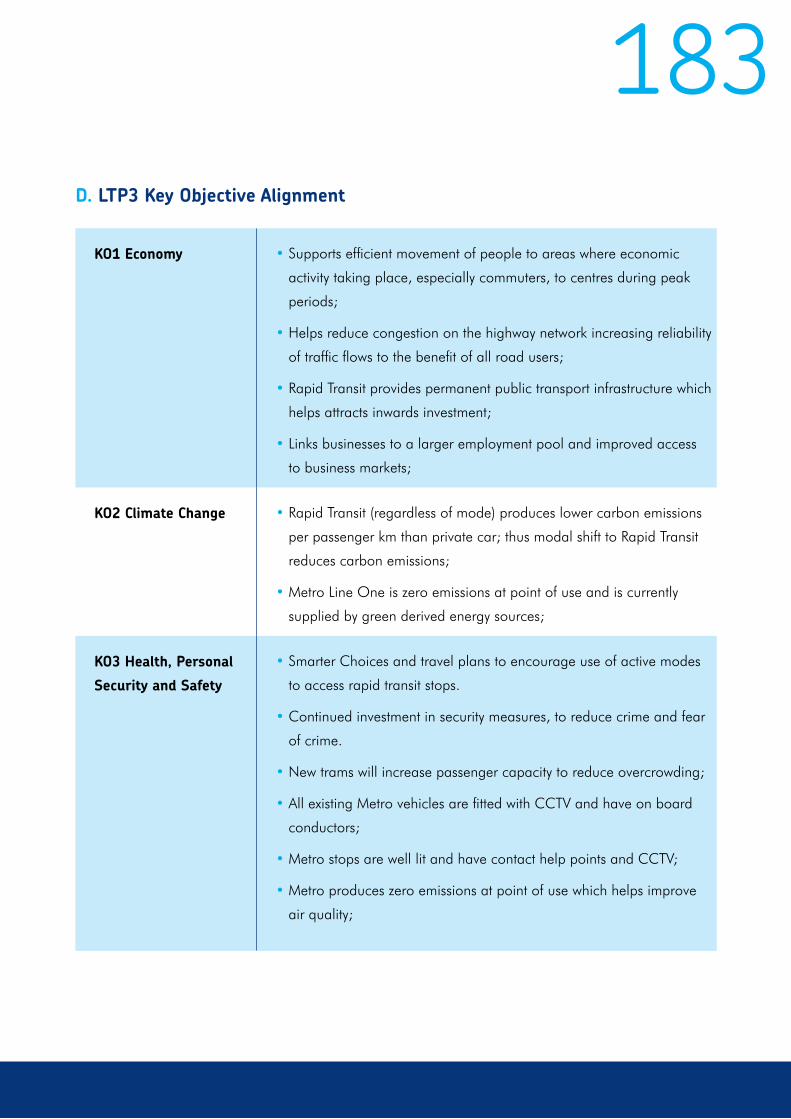
183
KO1 Economy • Supports efficient movement of people to areas where economic
activity taking place, especially commuters, to centres during peak
periods;
• Helps reduce congestion on the highway network increasing reliability
of traffic flows to the benefit of all road users;
• Rapid Transit provides permanent public transport infrastructure which
helps attracts inwards investment;
• Links businesses to a larger employment pool and improved access
to business markets;
KO2 Climate Change • Rapid Transit (regardless of mode) produces lower carbon emissions
per passenger km than private car; thus modal shift to Rapid Transit
reduces carbon emissions;
• Metro Line One is zero emissions at point of use and is currently
supplied by green derived energy sources;
KO3 Health, Personal
Security and Safety
• Smarter Choices and travel plans to encourage use of active modes
to access rapid transit stops.
• Continued investment in security measures, to reduce crime and fear
of crime.
• New trams will increase passenger capacity to reduce overcrowding;
• All existing Metro vehicles are fitted with CCTV and have on board
conductors;
• Metro stops are well lit and have contact help points and CCTV;
• Metro produces zero emissions at point of use which helps improve
air quality;
D. LTP3 Key Objective Alignment
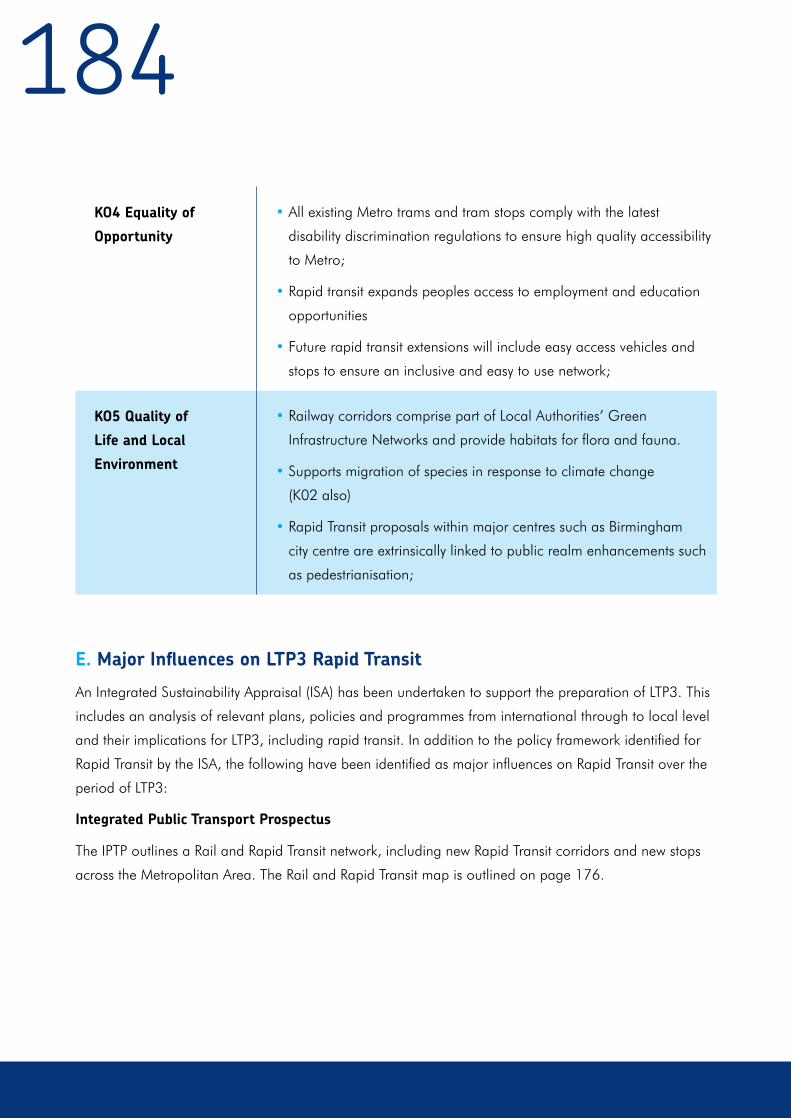
184
E. Major Influences on LTP3 Rapid Transit
An Integrated Sustainability Appraisal (ISA) has been undertaken to support the preparation of LTP3. This
includes an analysis of relevant plans, policies and programmes from international through to local level
and their implications for LTP3, including rapid transit. In addition to the policy framework identified for
Rapid Transit by the ISA, the following have been identified as major influences on Rapid Transit over the
period of LTP3:
Integrated Public Transport Prospectus
The IPTP outlines a Rail and Rapid Transit network, including new Rapid Transit corridors and new stops
across the Metropolitan Area. The Rail and Rapid Transit map is outlined on page 176.
KO4 Equality of
Opportunity
• All existing Metro trams and tram stops comply with the latest
disability discrimination regulations to ensure high quality accessibility
to Metro;
• Rapid transit expands peoples access to employment and education
opportunities
• Future rapid transit extensions will include easy access vehicles and
stops to ensure an inclusive and easy to use network;
KO5 Quality of
Life and Local
Environment
• Railway corridors comprise part of Local Authorities’ Green
Infrastructure Networks and provide habitats for flora and fauna.
• Supports migration of species in response to climate change
(K02 also)
• Rapid Transit proposals within major centres such as Birmingham
city centre are extrinsically linked to public realm enhancements such
as pedestrianisation;
185F. LTP3 Policies – Rapid Transit
Within the context of LTP3 Objectives, ISA
and the major influences on LTP3 rail outlined
above, the following LTP3 rail policies have been
developed. The specific interventions required to
deliver each policy during LTP3 are outlined in the
Implementation Plan.
Policy RR4 -
Expanding the Rapid Transit Network:
To expand the rapid transit network with an
appropriate form of rapid transit for each
individual corridor in the network
The Rail and Rapid Transit network outlines
new rapid transit stops and routes to provide
a “backbone” for rapid, high capacity public
transport, which provides high quality connectivity
across the Area. Whilst the Area can demonstrate
a comprehensive local bus network, the ability
for the local bus network to deliver connectivity
for a “live anywhere, work anywhere” economy
is limited. Additionally, the ability to deliver
additional rail corridors is limited by cost and land
availability. This impacts on businesses’ ability
to attract the calibre of workforce it needs and
limits people’s ability to access employment and
education opportunities.
Rapid Transit therefore provides the missing
strategic connectivity required to support
economic, population and housing growth across
the metropolitan area. The Rapid Transit corridors
identified in the Rail & Rapid Transit Network are
all high volume corridors, which cannot otherwise
be served by rail services. Rapid Transit schemes
require long term planning to identify, develop,
fund and deliver schemes as well as ensuring that
Rapid Transit routes are embedded into the land
use planning process.
As the Rail and Rapid Transit network represents
a long term aspirational network, it is realistic to
assume that over the lifetime of LTP3 the entire
rapid transit network will not be fully delivered
and scheme delivery will need to be focused
upon priority corridors linked to future growth
and regeneration. Centro and Local Authority
partners will work with partners to identify
priorities and expand the Rapid Transit network
reflecting funding availability and wider LTP3
Objectives and principles.
Policy RR5 - ‘Ultra Low Carbon’ Rapid Transit:
To ensure that future rapid transit will be ultra
low emission at source with an aspiration target
for Zero Emission as technology permits
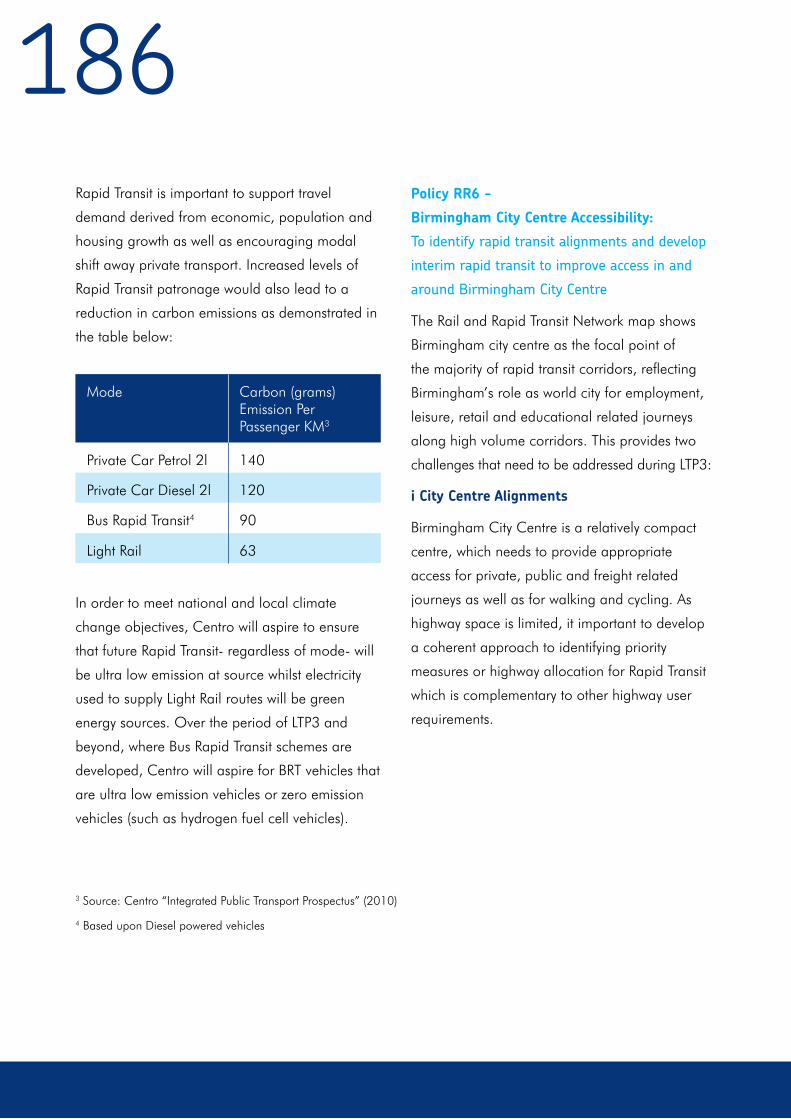
186Policy RR6 -
Birmingham City Centre Accessibility:
To identify rapid transit alignments and develop
interim rapid transit to improve access in and
around Birmingham City Centre
The Rail and Rapid Transit Network map shows
Birmingham city centre as the focal point of
the majority of rapid transit corridors, reflecting
Birmingham’s role as world city for employment,
leisure, retail and educational related journeys
along high volume corridors. This provides two
challenges that need to be addressed during LTP3:
i City Centre Alignments
Birmingham City Centre is a relatively compact
centre, which needs to provide appropriate
access for private, public and freight related
journeys as well as for walking and cycling. As
highway space is limited, it important to develop
a coherent approach to identifying priority
measures or highway allocation for Rapid Transit
which is complementary to other highway user
requirements.
Rapid Transit is important to support travel
demand derived from economic, population and
housing growth as well as encouraging modal
shift away private transport. Increased levels of
Rapid Transit patronage would also lead to a
reduction in carbon emissions as demonstrated in
the table below:
Mode Carbon (grams) Emission Per Passenger KM3
Private Car Petrol 2l 140
Private Car Diesel 2l 120
Bus Rapid Transit4 90
Light Rail 63
In order to meet national and local climate
change objectives, Centro will aspire to ensure
that future Rapid Transit- regardless of mode- will
be ultra low emission at source whilst electricity
used to supply Light Rail routes will be green
energy sources. Over the period of LTP3 and
beyond, where Bus Rapid Transit schemes are
developed, Centro will aspire for BRT vehicles that
are ultra low emission vehicles or zero emission
vehicles (such as hydrogen fuel cell vehicles).
3 Source: Centro “Integrated Public Transport Prospectus” (2010)
4 Based upon Diesel powered vehicles
187ii Cross City Rapid Transit
Rapid Transit development and delivery is a
longer-term process. During this period there is
growing demand, especially from the business
community, for interim cross city rapid transit
to provide the level of accessibility across
Birmingham City Centre that would be derived
as a consequence of a expanded rapid transit
network. However, in order to ensure value for
money, proposals should provide infrastructure
that can be adapted for use by the proposed
rapid transit network routes.
Therefore, in order to meet these complementary
challenges, the ITA, Birmingham City Council
and the Business Improvement Districts will work
together to identify rapid transit alignments and
develop interim rapid transit to improve access in
and around Birmingham City Centre, which will
provide infrastructure that will act as a first phase
towards wider rapid transit network routes.

188LTT6: IMPROVED LOCAL ACCESSIBILITY AND CONNECTIVITY (LA)
189
What is ‘Accessibility Planning’?
Accessibility is a concept concerned with people’s
ability to get to facilities and services that they
need. It is something that is often taken for
granted unless, of course, it is difficult to get
somewhere. Such difficulties are usually greater
for people without access to a car. However,
whilst the car is seen as giving universal
accessibility, this is not always true with issues
relating to congestion, stressful driving conditions
and parking at the destination affecting the ease
of using a car.
Any aim for maximising accessibility by car needs
to take into account safety, congestion and
environmental issues relating to increasing car use
and social factors, including the needs of those
who cannot use a car. There is a need to take
account of active modes of travel such as walking
and cycling. Also, there is growing awareness of
the negative health and environmental effects of
car use, which means that some people who have
a car want to minimise its use.
Accessibility Planning
Ideally everything that anyone needs access to
would be ‘just around the corner’. Obviously,
this is never likely to be achieved and has
been exacerbated, in recent years, by the
‘centralisation’ or rationalisation of services,
creating larger supply centres or ‘centres of
excellence’. This has resulted in fewer locations
and/or de-centralised locations. Both can
increase the need to travel and thus the possibility
of accessibility problems.
Accessibility Planning addresses issues concerned
with the location of facilities and services, which
can be influenced by spatial land-use planning
decisions, and by the availability of suitable
transport services to link people with facilities and
services. It is clearly closely linked with national
and local social inclusion, road safety and
equalities objectives.

190National statistics show that households in the lower income quintiles have the lowest car availability, as
might be expected. The following table shows the variations above and below the average (100 on the
graph) for the five income quintiles (1 = the lowest and 5 = the highest income quintile).
250
Walk Bus Other Pt Rail
200
150
100
50
01 2 3 4 5
It is no surprise, therefore, that people in households with the lower incomes walk more or make greater
use of public transport, and especially buses and other public transport which includes taxis, private
hire vehicles and community transport, than people with greater incomes. The following table shows the
variations above and below the average (100 on the graph) for the five income quintiles.
250
No Car One Car 2+ Cars
200
150
100
50
01 2 3 4 5
191Research into Indices of Deprivation shows that households with the lowest incomes are prevalent in
many areas of the Metropolitan Area, notably across the Black Country, inner city Birmingham, north
Solihull and parts of Coventry. This reinforces the need to consider accessibility, both in terms of walking
distances and bus journey travel times, for these areas in particular.
Good accessibility not only helps people and families without a car, but also helps those who have a car
but who would prefer to travel in a more sustainable way. Improving accessibility for everyone supports
the ‘Smarter Choices’ agenda and works in harmony with TravelWise and Sustainable Travel initiatives.
Partners: Roles and Responsibilities
The issue of accessibility is so multi-faceted that
the range of ‘partners’ is immense. It includes all
service providers, firstly those offering educational
opportunities, health services and food shops.
All employers are, technically, ‘partners’ because
most working-age people need access to a
job. Providers of personal banking services,
post offices and of leisure services, including
libraries, should be included. All these should be
encouraged to consider accessibility when making
service delivery decisions that affect how people
can access their services.
The Metropolitan District Councils play an
important role, both as the local planning
authority for their area, and as providers of many
of the services that people want or need to use.
The Councils also have Accessibility Planning
Officers who can help assess accessibility issues.
Each Council has ‘Accession’ software that
can plot travel times to specified facilities or
locations. ‘Accession’ can use public transport
and population data, including subsets of various
social factors, to produce maps to illustrate the
statistics.
Centro also uses ‘Accession’ in work that takes a
strategic overview of accessibility issues and works
with partners to improve accessibility. Centro’s
‘flagship’ project is ‘WorkWise’, developed
in partnership with the relevant Authority and
JobCentre Plus, to help unemployed people get to
job interviews and for the first few weeks of their
employment in a new job.
Progress and Successes from LTP2
Progress has been based on two broad areas
– raising awareness of Accessibility Planning as
‘good practice’ and working towards tackling the
various accessibility barriers.
The ‘raising awareness’ aspect has included
getting Accessibility Planning into the heart of
each local planning authority’s development
plan process. This will lead on to decisions on
new development having to take greater account
of accessibility issues, particularly with regard to
access by people who do not have a car.

192As an example of the above, the Black Country
Joint Core Strategy identifies Strategic Centres
and Regeneration Corridors as the areas
of growth where there is greatest access to
employment, services and other facilities by
walking, cycling and public transport in order
to make employment and services accessible to
all. Work was undertaken to map out accessible
areas and to resist development in inaccessible
areas unless it can be shown that the level of
public transport services can be brought up to
acceptable standards. Policy HOU2 seeks to
locate residential development in accessible
locations, building on the work on residential
accessibility carried out on behalf of the
Metropolitan Authorities’ Accessibility Planning
Working Group. Birmingham City Council’s
emerging Core Strategy has a similar emphasis.
Tackling the various accessibility barriers has
included identifying them as well as taking actions
to reduce their impact. There are a number of
barriers to travel that are frequently quoted in
market research reports. These affect perceptions
of ease of travel and, thus, accessibility. However,
they are often difficult to quantify or evaluate
within modelling work. They include: -
(a) Ability to use public transport: factors
such as disability, travelling with luggage
or small children reduce people’s ability
to board vehicles and/or interchange
between services.
(b) Affordability: the cost of bus, tram or rail
fares can be a barrier, especially if the
journey is multi-modal or involves more
than one operator.
(c) Anti-social behaviour: some people are
discouraged from using public transport
because of fear of crime. Indeed, this is
a high priority in public opinion and is a
clear barrier to increasing patronage.
(d) Availability: local bus, Metro and rail
services are not available throughout the
night and there are often reduced service
levels on Sundays; also many services
do not start early enough or operate late
enough for people who need to travel
outside ‘normal’ hours, for example shift
workers.
(e) Certainty: local bus services can be
changed, by the operator, without
notifying the public and with just 56 days’
notice to the Area Traffic Commissioner
(the industry ‘regulator’) which can leave
people unsure of if, when and where a
bus goes.
(f) Information: vital for infrequent
public transport users or for regular
passengers using a different route or
service and includes information about
routes, location of bus stops or stations,
frequency, fares and ticketing availability.

193(g) Language: important for some foreign
visitors but also for some residents for
whom English is not their first language.
(h) Ticketing: the normal seven day (or
longer) season tickets do not help regular
part-time public transport users, who may
only need to travel two or three days a
week, for example people with part-time
or job-share employment.
(i) Unreliability: this undermines people’s
confidence, especially for bus use at stops
without real-time information displays and
particularly for time-critical journeys such
as to work or college or for health or other
appointments.
A great deal of progress has been made during
the last five years in tackling these ‘barriers’
and the following paragraphs illustrate some
examples.
The national requirement that all new buses be
low-floor and the gradual phasing out of stepped-
access buses is making using buses easier for
people with mobility difficulties, including people
in wheelchairs and carers with children in push-
chairs or buggies. Approximately 85% of all buses
operating in the Metropolitan Area are low floor
and wheelchair accessible, the highest proportion
of a bus fleet in the metropolitan areas outside
London. Measures to reduce barriers on ordinary
local bus services benefit not only people with
mobility difficulties but most other passengers as well.
For those who cannot use conventional public
transport services, Centro supports ‘Ring & Ride’
which provides bookable ‘door-to-door’ travel.
Affordability is not an issue for senior citizens and
people with specific disabilities who qualify for
a national concessionary travel pass, although
the concessionary passes are not valid for travel
before 09.30 Mondays to Fridays. Additionally,
Centro has maintained the extra benefits for
Metropolitan Area (Centro) concessionary pass
holders of being able to travel on Metro and local
rail services and after the national 23:00 end of
weekday free travel.
Access at railway stations has been improved
with lifts or ramps at three-quarters of the
stations within the Metropolitan Area and almost
all are staffed. There are still issues for people
in wheelchairs having to book assistance for
boarding the train and there are stations in the
travel-to-work area surrounding the Metropolitan
Area that do not yet have step-free access.
Centro’s ‘getting around access guide’
explains what services are available across
the Metropolitan Area and how to use them.
Although aimed primarily at those who need
‘accessible public transport’, it is a useful guide
for anyone who is not familiar with using public
transport or with the Area.
The ‘Safer Travel Team’ of police and community
support officers have had a major impact on
reducing anti-social behaviour on buses and at
bus stops.

194Crime levels on public transport are generally low
and reducing but, unfortunately, surveys show that
the perception of crime has risen.
Centro has carried out a number of area reviews
of local bus service provision, in partnership with
the main operators, the relevant District Authority
and stakeholders such as major trip attractors.
Each area review has involved discussions with
the operators about the findings and how these
fit with the companies’ business plans, resulting
in operators choosing to change their services
where the review has shown advantages in terms
of increased patronage and/or more efficient use
of their bus fleet. The ‘headline’ outcome has
been an increased focus on a simpler network
with consolidation of some lower frequency routes
into turn-up-and-go frequency services, operating
along a consistent route. Whilst simpler networks
help with people’s understanding, the loss of some
off-main road services has highlighted the potential
tension between profitability and accessibility.
Where services have been lost, Centro has looked
to persuading other companies to provide services
when required to maintain access to bus services,
or as a last resort to provide a subsidised service.
Centro spends some £8½ million annually
(excluding support for ‘Ring & Ride’) providing
‘socially-necessary’ local bus services at times
and to places that are not served commercially
by the local bus operators. Within financial
constraints, this expenditure endeavours to ensure
that residents have a bus service to their nearest
centre at all reasonable hours.
However, the last departure times from
Birmingham city centre are generally a few
minutes after midnight with some being as
early as eleven o’clock. Elsewhere, ‘last’ buses
can be earlier, with few departures much
after eleven o’clock. Experiments have been
undertaken regarding the provision of night
buses in Birmingham, but these services have not
attracted enough patronage to become financially
sustainable. The situation is similar with our local
rail services; for example - the last weekday train
from Birmingham city centre to some stations
within the Metropolitan Area is shortly after
eleven o’clock with no train departures at
all after midnight.
Centro has worked with the local bus service
operators to minimise the number of changes to
timetables and routes so that the public can have
greater confidence in their local bus services.
When changes do take place, Centro works
closely with operators to ensure appropriate
information is provided to customers.
To help people who have difficulty communicating
in English, ‘Language Line’ which is a telephone
interpreting service for people, is available at
New Street Station to provide assistance with
timetables, public transport routes and ticket
sales. This service enables access to telephone
interpreters in over 150 languages, 24 hours a
day, seven days a week. ‘Language Line’ is also
available to help access Centro’s services.

195Recently, three major studies have been
commissioned to improve our understanding of
accessibility issues, as listed below: -
•Residential Accessibility across the
Metropolitan Area
•Commercial Accessibility across the
Metropolitan Area
•Food Access in the West Midlands Region
The first two of these were commissioned by
CEPOG and led by a Wolverhampton City
Council Officer on behalf of the Metropolitan
Authorities’ Accessibility Planning Working
Group (APWG). The third was commissioned by
Government Office for the Metropolitan Area with
a Steering Group of health and local authority
officers, including representatives of the APWG.
Residential Accessibility across the
Metropolitan Area Studies
This work was commissioned in order to provide
‘evidence’ to help guide the development of
accessibility standards that can inform planning
policy concerning the location of developments.
It was intended that the research outcomes should
be available to the individual local planning
authorities to assist with the formulation of
Strategic Housing Land Availability Assessments
and Development Plan Documents.
In the Literature Review part of this work, the
focus was on walking and public transport
access comparing different distances to facilities
– principally to local centres/shops, schools and
work. This led to the adoption of an assessment
of ‘high’ ‘medium’ and ‘low’ accessibility, in terms
of journey times (in minutes), as shown below: -
Using the above standards, overall accessibility
was calculated as follows: -
• ‘High’ to all facilities = ‘High’
•At least ‘Medium’ to all facilities = ‘Medium’
•At least ‘Low’ to all facilities = ‘Low’
•Beyond ‘Low’ to any facility is not included.
The outcome of this research is not only a
recommended ‘accessibility’ standard but also
a set of ‘Accession’ plots that illustrate and
rank accessibility to key facilities for families
and households without children. These plots
are designed either to help guide residential
development to the most appropriate locations in
terms of accessibility or to identify what facilities
would be needed to make a proposed residential
development meet appropriate accessibility
standards.
‘High’ ‘Medium’ ‘Low’
GP facility 10 15 20
Shopping centres 10 15 20
Shopping centres 10 15 20
Secondary school 15 20 25
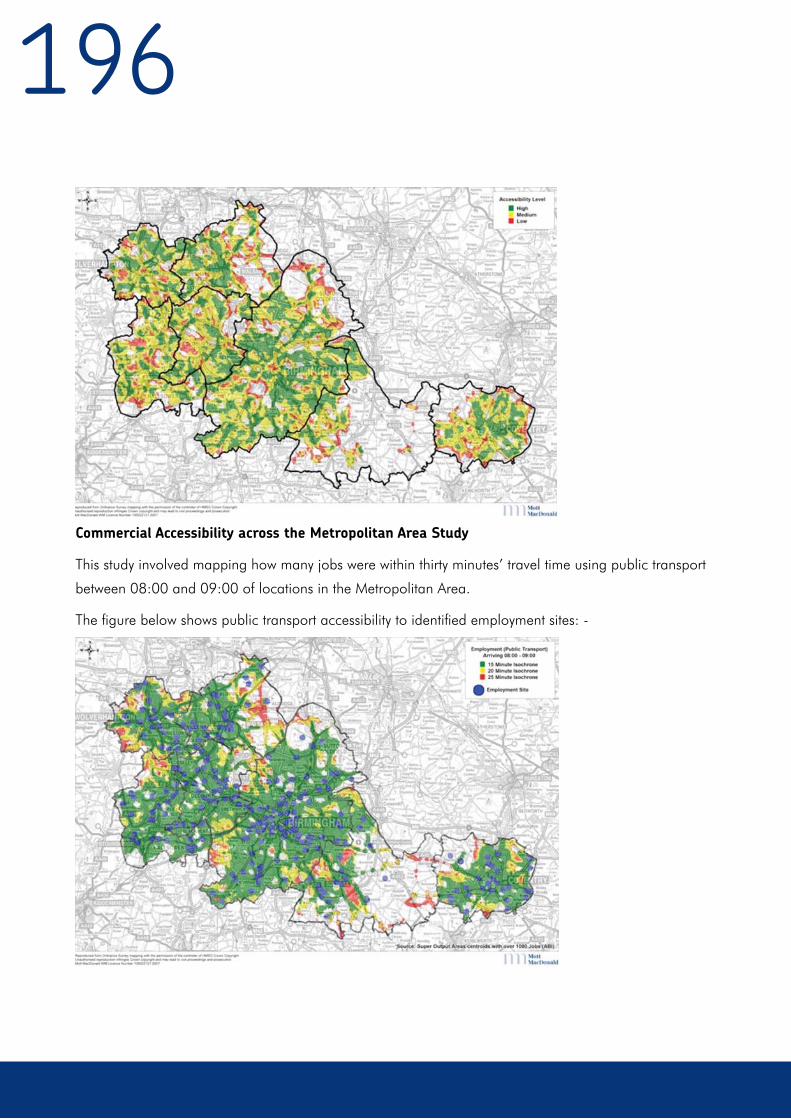
196
Commercial Accessibility across the Metropolitan Area Study
This study involved mapping how many jobs were within thirty minutes’ travel time using public transport
between 08:00 and 09:00 of locations in the Metropolitan Area.
The figure below shows public transport accessibility to identified employment sites: -
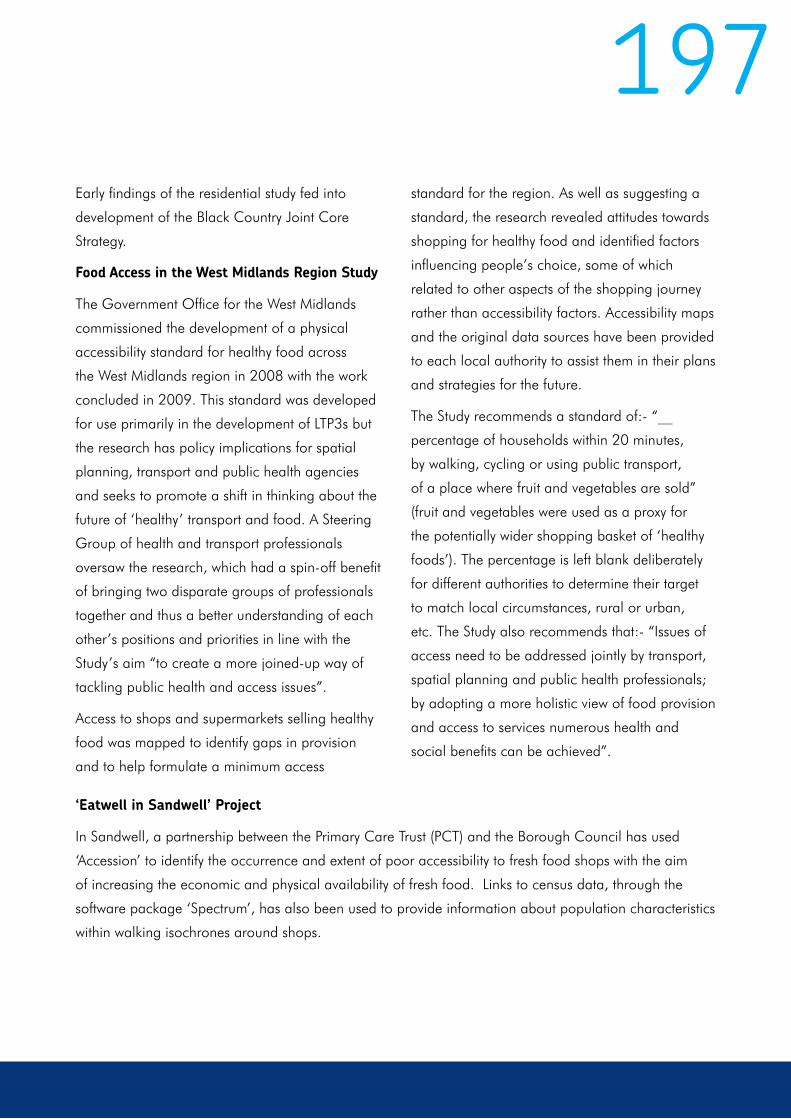
197Early findings of the residential study fed into
development of the Black Country Joint Core
Strategy.
Food Access in the West Midlands Region Study
The Government Office for the West Midlands
commissioned the development of a physical
accessibility standard for healthy food across
the West Midlands region in 2008 with the work
concluded in 2009. This standard was developed
for use primarily in the development of LTP3s but
the research has policy implications for spatial
planning, transport and public health agencies
and seeks to promote a shift in thinking about the
future of ‘healthy’ transport and food. A Steering
Group of health and transport professionals
oversaw the research, which had a spin-off benefit
of bringing two disparate groups of professionals
together and thus a better understanding of each
other’s positions and priorities in line with the
Study’s aim “to create a more joined-up way of
tackling public health and access issues”.
Access to shops and supermarkets selling healthy
food was mapped to identify gaps in provision
and to help formulate a minimum access
standard for the region. As well as suggesting a
standard, the research revealed attitudes towards
shopping for healthy food and identified factors
influencing people’s choice, some of which
related to other aspects of the shopping journey
rather than accessibility factors. Accessibility maps
and the original data sources have been provided
to each local authority to assist them in their plans
and strategies for the future.
The Study recommends a standard of:- “__
percentage of households within 20 minutes,
by walking, cycling or using public transport,
of a place where fruit and vegetables are sold”
(fruit and vegetables were used as a proxy for
the potentially wider shopping basket of ‘healthy
foods’). The percentage is left blank deliberately
for different authorities to determine their target
to match local circumstances, rural or urban,
etc. The Study also recommends that:- “Issues of
access need to be addressed jointly by transport,
spatial planning and public health professionals;
by adopting a more holistic view of food provision
and access to services numerous health and
social benefits can be achieved”.
‘Eatwell in Sandwell’ Project
In Sandwell, a partnership between the Primary Care Trust (PCT) and the Borough Council has used
‘Accession’ to identify the occurrence and extent of poor accessibility to fresh food shops with the aim
of increasing the economic and physical availability of fresh food. Links to census data, through the
software package ‘Spectrum’, has also been used to provide information about population characteristics
within walking isochrones around shops.

198Planning easy access to fresh food within a reasonable walking distance contributes to sustainable
communities. This supports Regional Spatial Strategy policies regarding the social infrastructure,
inequalities in health and the provision of services.
Using ‘Accession’, walking distance isochrones for over forty local shops were superimposed onto the ten
minutes public transport isochrones for supermarkets in and around Sandwell. This has helped the PCT
to prioritise which local shops will be contacted about taking part in the ‘Eatwell’ programme. The work
has been documented in Sandwell’s LDF Annual Monitoring Report for the past four years.
The above figure shows walking distances of up
to 600 metres around ‘Eatwell’ stores and public
transport distances for journey times of up to ten
minutes duration around major supermarkets.
Approximately fifty neighbourhood shops have
signed up to the Neighbourhood Renewal Fund
‘Eatwell in Sandwell’ (October 2008). These
shops have committed to work in partnership with
the PCT to improve access to, and the demand
for, healthier food in Sandwell.
Policy Context for LTP3
The concept of Accessibility Planning was
formalised by the Government’s Social Exclusion
Unit (SEU) in their report ‘Making the Connections’,
published in 2003. The SEU were asked to explore,
and make recommendations to overcome, the
problems experienced by people facing social
exclusion in reaching work and services.

199The report sets out the relationship between
transport, accessibility and social exclusion
and presents a cross-Government strategy for
improving access to jobs and services. The key
issue is that for services to be accessible, people
must be able to get to them in reasonable time, at
reasonable cost and with reasonable ease.
Accessibility Planning focuses on promoting social
inclusion by tackling the accessibility problems
experienced by those in disadvantaged groups
and areas. However, it is also about improving
accessibility for all and is a requirement in
the creation of sustainable communities. It
concentrates on access to those opportunities that
are likely to have the most impact on life chances:
employment, education, health care and fresh
food shops. The premise of Accessibility Planning
is that the accessibility needs of local communities
can be better met by policy development and
service delivery that is more evidence-based and
which is implemented through coordinated action
across a variety of agencies.
The LTP3 Strategy is linked to the Government’s
five transport goals, one of which relates to the
promotion of equality of opportunity. The formal
LTP3 Guidance defines this goal in terms of two
types of ‘Challenge’: -
Cross Network Challenge
(a) Enhance social inclusion by enabling
disadvantaged people to connect with
employment opportunities, services, social
networks and goods through improving
accessibility, availability, affordability
and acceptability.
Cities and Regional Networks Challenges
(b) Enhance social inclusion and the
regeneration of deprived or remote areas
by enabling disadvantaged people to
connect with employment opportunities,
local services, social networks and
goods through improving accessibility,
availability, affordability and acceptability.
(c) Contribute to the reduction in the gap
between economic growth rates for
different regions.
Whilst Challenges (a) and (b) are similar, the first
relates to national issues whilst the second more
directly relates to our LTP3. Challenge (c) is about
the equality of opportunity of our Area in terms
of economic prosperity compared with other
areas and national average economic indicators.
The outcomes of Accessibility Planning can help
employment investment decisions and highlight
barriers to providing access to the local labour
market.

200LTP3 Accessibility Policies
Policy LA1: To ensure that Accessibility Planning
is embedded within planning and strategy
documents and continue to encourage service
providers to embed accessibility considerations
within their service delivery investment
programmes
Centro will also review and share accessibility
data with people and groups who may have an
interest in them and publicise any results that are
of wider interest.
Policy LA2: To ensure the access needs of
groups defined in the Equalities Act 2010 are
met as far as practicable
The ‘Age Proofing Toolkit’ provides an invaluable
reference document in ensuring these needs are
met.
Policy LA3: To secure socially necessary local
bus services to complement commercially
provided services so that residents have the best
possible access to local facilities
Policy LA4: To keep local bus service networks
and provision under review, in partnership with
the main operators and the relevant District
Authority, with the aim of improving service
levels and accessibility for all to essential
services and facilities
Policy LA5: To ensure that cost of travel is
not a barrier to accessibility to employment
opportunities and services

201Bus
A. Role of Bus
The bus network has a major role to play in delivering the objectives of LTP3. An important transport
objective is to bring about a significant modal shift away from the car towards more sustainable forms
of transport. For the vast majority of residents, the main alternative will be the bus. LTP3 recognises the
importance that increased mobility has for a modern and prosperous society. Growing levels of travel,
however, have also generated significant environmental impacts. Delivering a modern bus network that
transforms the quality of travel will bring significant environmental benefits and greatly contribute to tackling
climate change, reducing congestion, sustaining economic growth and increasing social inclusion.
Our aim is to bring about significant quality improvements through a customer-focused transformation
that addresses the concerns, needs and expectations of current and future passengers. Research
shows that passengers no longer want just a bus trip but an end-to-end travel experience that provides
perceived value. Passengers will assess this perceived value through simple signals, such as the quality of
the vehicle and the professionalism of the driver. Achieving sustained growth in bus patronage is possible
if perceived value is delivered to the customer through improvements in quality. This should ensure that
the bus product attracts new passengers and builds long-lasting loyalty from existing ones.
B. Bus Partners: Roles and Responsibilities
80% of the market, and Diamond Buses carrying
approximately 10% of total passenger numbers.
Centro
Centro subsidises bus services to operate at
times when operators have decided that they
are not commercially viable, and this equates to
approximately 8% of the bus network. Centro
issues tenders to bus operators to cover ‘socially
necessary’ services, many of which run early in
the morning, late evening or on Sundays.
Bus Operators
Most bus services in the Area are operated on a
commercial basis by private bus companies. The
remaining services, those deemed to be socially
necessary and affordable, are operated under
contract to Centro by private bus companies.
The commercial network carries over 90% of bus
passenger journeys. Commercial and contracted
services are operated by over sixty operators
with National Express West Midlands/Coventry
being the dominant operator, with approximately
202These provide essential access to employment,
shops, health and leisure. Centro manages all the
12 bus stations across the Area and over 13,000
passenger stops and shelters, whilst ensuring
passenger information provision, including Real
Time Information, is kept up to date and provided
at all facilities.
Local Authorities
Local Authorities, as the Highway and Planning
Authorities, support and help improve bus services
by delivering highway priority measures. This is
done through a variety of tools including bus
lanes, Red Routes and junction improvements
using Smart Route principles. As Local Planning
Authorities, improvements to passenger facilities,
including bus stations and bus stops, must also be
supported and approved for delivery.
Traffic Commissioner
The West Midlands Traffic Commissioner is
responsible for regulating bus and heavy goods
vehicles operations. In relation to bus operations,
the Traffic Commissioner grants Operating
(‘O’) Licenses to people or companies that are
competent, financially sound and of ‘good repute.’
Anyone with an ‘O’ license who wishes to operate
a local bus service must register the details of the
service with the Traffic Commissioner. Thereafter,
the Traffic Commissioner can take action against
an operator that fails to run the bus service as
registered or if they fail to meet the competency,
financial or ‘good repute’ requirements of their
‘O’ license. This may happen, for example, if an
operator uses un-roadworthy buses.
Passenger Focus
Passenger Focus is an independent public body
set up by the Government to protect the interests
of Britain’s rail passengers and England’s bus
passengers outside London, coach passengers on
scheduled domestic services and tram passengers.
Although funded by DfT, Act of Parliament
guarantees their independence. Their mission is
to get the best deal for passengers, with a strong
emphasis on evidence-based campaigning and
research. They use their knowledge to influence
decisions on behalf of passengers and work with
the public transport providers, passenger groups
and Government to secure journey improvements.
They are responsible for the National Rail
Passenger Survey.
C. Progress and Successes from LTP2
The objectives for bus in LTP2 were to achieve
modal shift to public transport in order to reduce
congestion and enable people without access to
a car to reach services including work, training,
education, leisure and food and health provision.
Significant progress has been made against
these objectives, including a reversal of the year-
on-year decline in bus usage in 2008/09 and
one of the highest usage rates of bus of all the
Metropolitan Areas in England outside London.
Some of the successes are detailed below:

203Bus Showcase Programme Review and
Implementation
The Bus Showcase initiative has improved a
number of bus corridors to ensure passengers
receive a high quality bus journey experience
by transforming key routes with comprehensive
improvements to vehicles, roads and
infrastructure. The features are:
• Highway improvements: consistent and
more reliable journey times
•Safe and well lit walking routes to bus
stops/routes
•Upgraded waiting environments, with easy
access and better information including
Real Time Information (RTI) at key stops
•High quality low floor buses with on vehicle
CCTV and RTI
•High standards of customer care
Following a review of the Bus Showcase delivery
programme in 2006, a new approach to
implementing schemes was recommended. This
provided a focus for investment and has helped
deliver the outcomes set out below:
• Patronage increases of up to 30% on
several Showcase routes (eg. Route 51
Walsall Road)
• Journey time reductions of up to 17% on
Showcase corridors (eg. Route 51 Walsall
Road)
• Punctuality increases of up to 40%
• Passenger satisfaction levels of up to 86%,
well above the 60% LTP target
• Levels of satisfaction with on-bus security
significantly higher than general bus
network
Development of Smart Route Principles
‘Smart Routes’ corridor strategies aim to improve
journey reliability for all road users by identifying
traffic issues and developing solutions for
corridors in a comprehensive manner. A Pilot
‘Smart Route’, on the A41 Warwick Road between
Birmingham and Solihull is currently underway
with the intention of developing a series of route
improvements on the A41 to help make travelling,
living, working and shopping along the Warwick
Road route easier and more enjoyable. Future
Smart Routes will be developed as part of a
Sustainable Smart Package.
Transforming Bus Travel
In December 2008, Centro published a strategy
document entitled ‘Transforming Bus Travel’ (TBT),
which sets out a vision on how to improve bus,
services to better meet current and future needs
of passengers. TBT was developed in partnership
between Centro and bus operators to ensure
a shared understanding of arrangements is in
place between all stakeholders to encourage
more people to travel by bus through providing
passengers with a total quality journey experience
that make buses the mode of choice and a
realistic alternative to the private car.
204TBT supports LTP3 and recognises the importance
that increased mobility has for a modern
and prosperous society whilst addressing
environmental impacts.
As part of ‘Transforming Bus Travel’, a
comprehensive review led to the proposed
reorganisation of local bus services to the
following six groups:
•Birmingham centred - These are
generally high frequency routes running
throughout the day and week.
•Inter-urban - These are also high
frequency routes running throughout
the day and week that link towns and
communities
•Orbital - These services are moderate to
high frequency. They link suburban local
centres with estates off the radial routes.
Good interchange with radial and local
services is particularly important.
•Urban - These generally high frequency
routes link the main towns and cities
(particularly Walsall, West Bromwich,
Wolverhampton and Coventry) with their
nearby housing estates.
•Local - Local routes provide the links not
met by the above and relate generally to
smaller towns and secondary attractors.
•Customised low frequency - These routes
are limited in number and provide links not
covered by the groups above.
This segmentation of services has formed the basis
of a series of Bus Network Reviews, outlined below.
Bus Network Reviews and Voluntary
Partnership Agreements
Following the publication of TBT, National Express
West Midlands (NXWM – formerly known as Travel
West Midlands), as the main operator of commercial
bus services in the Metropolitan Area, and others
signed up to the principles of TBT and are working
in partnership with Centro to deliver a series of bus
network reviews on an area-by-area basis. The aim
is to provide a better network of high quality services
to the benefit of existing and prospective users,
leading to increased bus patronage.
One of the weaknesses of the current bus network
is its complexity and relatively density, with a
large number of low frequency routes. Therefore,
one of the focuses is to provide a more modern,
less complicated network of services that makes
travelling by bus easier and more attractive.
Research has identified that key elements for
better bus services include an easy to understand
network and improvements in quality. Centro
is leading a review of the commercial and
subsidised bus networks in each defined area,
alongside Local Authorities and bus operators,
as directed within the Local Transport Act 2008,
to ensure that passenger benefits are maximised
within each network.
This process has so far been undertaken in
Dudley, South Solihull, North Walsall and South
and West Birmingham. In each area it has been
accompanied by a series of improvements in
205
KO1 Economy • Supports efficient movement of people to areas where economic activity takes place including commuters to centres in peak periods
• Helps reduce congestion on the highway network freeing up capacity for essential vehicle movements
KO2 Climate Change • Modal shift encourages reduced reliance on the private car thus reducing carbon emissions
KO3 Health, Personal
Security and Safety
• Improving the environmental performance of the bus sector will lead to improved air quality
• Continued investment in security measures to reduce crime and fear of crime
passenger information and some simplification of
services, such as ensuring that evening and Sunday
service numbers match those of the daytime
services. The review has already led to increased
bus patronage in Dudley and in South Birmingham
it has resulted in a much easier to understand
network of services. Reviews are currently being
rolled out, including a revised network for East
Birmingham / North Solihull and the country’s
first Multi-Operator Bus Partnership Agreement
has now been delivered in North Walsall.
Infrastructure improvements
In order to meet the aspirations of the passenger,
waiting and interchange facilities need to be
maintained and upgraded. Through the LTP2
period, Halesowen Bus Station, Chelmsley Wood
Interchange and Wolverhampton Bus Station have
or are being improved or rebuilt to create first
class passenger facilities.
Increased RTI rollout
Real Time Information (RTI) has proved extremely
popular with passengers providing certainty of
when their next bus will be arriving. Studies in the
Metropolitan Area show that 85% of passengers
feel Real Time Information to be beneficial
to their journey. RTI is now accessible from
approximately 5,000 bus stops and approximately
800 (16%) of these bus stops are equipped with
Real Time Displays. Nearly half of these have
been installed within the last two years. Since
2003, National Express West Midlands has
equipped approximately 44% of its bus fleet with
RTI tracking devices as part of the approach
developed by Centro. In delivering TBT, Centro
are now expanding and updating RTI within a
rolling programme of works.
D. LTP3 Key Objective Alignment

206
E. Major Influences On LTP3 Bus Strategy
An Integrated Sustainability Appraisal (ISA) has been undertaken to support the preparation of LTP3. This
includes an analysis of relevant plans, policies and programmes from international through to local level
and their implications for LTP3, including bus. In addition to the policy framework identified for bus by
the ISA, the following have been identified as major influences on bus strategy over the period of LTP3:
Statutory Quality Partnerships
Statutory Quality Partnerships (SQPs) allow for
binding agreements to be voluntarily entered
into between LTAs and bus operators. Under
SQP, improved infrastructure (such as bus priority
measures) can be provided on a corridor with
arrangements for the use of that infrastructure
by bus operators that provide improved services.
SQPs can cover vehicle standards, maximum
fares, frequencies and timings.
Quality Contracts
Under Quality Contracts, private sector bus
companies would be invited to bid to operate a
specified network and, once appointed, it would
face no on-road competition, being free to
concentrate on developing the local market for
bus travel in partnership with the LTA.
Local Transport Act, 2008
This gave transport authorities a new suite
of powers and options for improving bus
services. These include strengthened voluntary
partnerships, statutory quality partnerships and
quality contracts, which could all influence LTP3.
Strengthened Voluntary Partnerships
The Act gives bus operators and Local Transport
Authorities (LTAs) more scope to negotiate non-
statutory agreements between themselves with less
risk of falling foul of competition law. It also gives
the Traffic Commissioners more power to protect
voluntary arrangements from predatory or low
quality competition and to enforce performance
standards.
KO4 Equality of
Opportunity
• Improves access to goods, services and opportunities for those without access to a car or with mobility impairments
KO5 Quality of
Life and Local
Environment
• Provides access to education and employment opportunities to improve social mobility
• Reduction of social exclusion which encourages the development of society

207‘Integrated Public Transport Prospectus’ &
‘Transforming Bus Travel’
Centro, in conjunction with partners, has
developed the ‘Integrated Public Transport
Prospectus’ (IPTP) which outlines the long term
vision for public transport across the Metropolitan
Area, taking into account existing and future
major developments. In respect of buses, the IPTP
includes
•Principal Bus Corridors – direct high
frequency bus services connecting centres,
as shown overleaf
•Local Bus Networks – ensure local
communities have good access to jobs,
shops and services
The LTP3 period will bring about significant
quality improvements to local bus services
using the principles of TBT to address the
needs and expectations of current and future
passengers. Building on existing high levels
of use for local journeys, it seeks to achieve a
local and international reputation for innovative,
forward-looking provision, which is popular
with customers. This will mean that bus industry
advances in vehicles, planning, operation and
customer service will have a natural home in the
Metropolitan Area.
Smart Routes
Smart Routes corridor strategies aim to improve
journey reliability for all road users by identifying
traffic issues and developing solutions for
corridors in a comprehensive manner. The
successful implementation of this initiative will
have a significant role in delivering the objectives
of LTP in relation to bus.
Smartcard
The LTP3 period will see the implementation of
Smartcard on the Area’s public transport network.
Centro have installed more than 2,300 machines
for bus operators and provide administrative and
technical support for the equipment. The project,
roll-out of which commenced in Spring 2010,
will enable passengers to make seamless and
convenient interchange between any bus operator
and other mode of public transport.
Cross-Boundary Services
In addition to the six groups of services outlined in
TBT within the Metropolitan Area, there are also
significant local and medium distance bus links to
surrounding urban areas. These include links from
Walsall to the South Staffordshire/Cannock area
and Coventry to Warwickshire. Important sub-
regional corridors in this category include:
•Birmingham – Redditch
•Birmingham – Tamworth
•Birmingham – Stratford-upon-Avon
•Birmingham – Kidderminster
•Birmingham Airport/NEC local bus network
•Coventry- Nuneaton
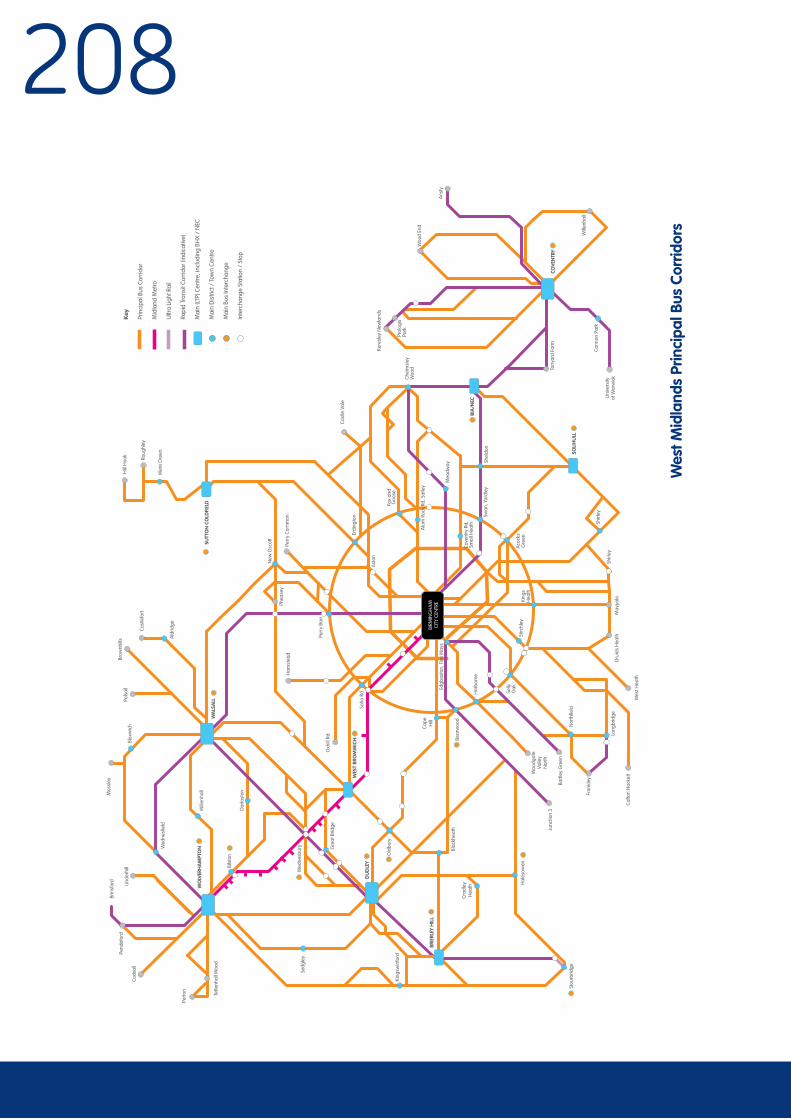
208
COVE
NTR
Y
BRIE
RLEY
HIL
L
Stou
rbrid
ge
Hal
esow
en
Junc
tion
3
Blac
khea
th
Crad
ley
Hea
th
Old
bury
Har
born
e
Gre
at B
ridge
DU
DLE
Y
Dar
last
on
Tette
nhal
l Woo
d
Perto
n
Cods
all
Pend
efor
d
Brin
sfor
d
Blox
wic
h
Ald
ridge
WA
LSA
LL
WO
LVER
HA
MPT
ON
Bils
ton
Wed
nesb
ury
Will
enha
llMos
sley
Pels
all
Brow
nhill
s
Cast
lefo
rt
Oxh
ill R
d
Bear
woo
d
Soho
Rd
Edgb
asto
n, F
ive
Way
s
Cape
Hill
Wes
t Hea
th
Long
brid
ge
Nor
thfie
ld
King
sH
eath
Bartl
ey G
reen
WES
T BR
OM
WIC
H
Alu
m R
ock
Rd, S
atle
y
Shirl
ey
Tany
ard
Farm
Uni
vers
ityof
War
wic
k
Cann
on P
ark
Will
enha
ll
Cove
ntry
Rd,
Smal
l Hea
th
Shel
don
Swan
, Yar
dley
SOLI
HU
LL
Ast
on
Erdi
ngto
n
SUTT
ON
CO
LDFI
ELD
Mer
e G
reen
Ham
stea
d
Perr
y Ba
rr
Perr
y Co
mm
on
New
Osc
ott
BIA
/NEC
Cast
le V
ale
Chel
msl
eyW
ood
Kere
sley
New
land
s
Woo
d En
d
Ans
ty
Prol
ogis
Pa
rk
BIRM
ING
HA
MCI
TY C
ENTR
E
W
est M
idla
nds
Prin
cipa
l Bus
Cor
ridor
s
Aco
cks
Gre
en
Und
erhi
ll
Sedg
ley
King
swin
ford
Wed
nesfi
eld
Shirl
ey
Selly
Oak
Fran
kley
Cofto
n H
acke
ttWoo
dgat
eVa
lley
Nor
th
Dru
ids
Hea
thM
aypo
le
Fox
and
Goo
se
Stirc
hley
Key
Prin
cipa
l Bus
Cor
ridor
Mid
land
Met
ro
Ultr
a Lig
ht R
ail
Rapi
d Tr
ansi
t Cor
ridor
(ind
icat
ive)
Mai
n (LT
P) C
entre
, inc
ludi
ng B
HX
/ N
EC
Mai
n D
istri
ct /
Tow
n Ce
ntre
Mai
n Bu
s In
terc
hang
e
Inte
rcha
nge
Stat
ion
/ St
op
Phea
sey
Roug
hley
Hill
Hoo
k
Mea
dway

209•Coventry - Leamington Spa
•Coventry – Rugby
•Coventry – Leicester
•Walsall – Rugeley
•Walsall – Lichfield
•Wolverhampton- Bridgnorth
•Wolverhampton – Cannock
•Wolverhampton- Telford
•Wolverhampton- Stafford
Particular issues for these corridors are the
need to ensure common customer information
and ticketing provision across administrative
boundaries.
The proposed new networks will reflect modern
travel demands, arising from such issues as
changes to hospital provision and employment
locations. They will not only enhance existing
core routes by better serving the vast majority of
current travel needs, but also attract a wide range
of new users by creating networks that are:
•More frequent
•More efficient
•Of a higher quality (with focused
investment in modern facilities)
•Simpler to understand
•Easier to promote
•More Customer-Oriented
F. LTP3 Policies - Bus
Policy LA6: To create a high-quality bus network
serving the Metropolitan Area
A high-quality bus network will help deliver the five
objectives of LTP3. A number of opportunities to
deliver this network will evolve throughout the plan
period. The principles of TBT and the IPTP will
be applied through partnership with operators to
deliver modal shift, an improved environment and
an integrated public transport network.
Attractive and Induces modal shift
For the vast majority of residents, the main
alternative to the car will be bus. Ensuring buses
are readily accepted as the mode of choice lies
at the heart of TBT. Strong partnership with bus
operators is fundamental to the successful delivery
of the quality end-to-end services and experience
that passengers expect.
Environmental performance
The aim for local bus services is to have fleet
with very low carbon emissions. Centro will work
with commercial operators to evolve current
bus vehicle fleets so that hybrid technology and
sustainably produced bio-fuels are phased in a
manner that is financially viable for commercial
operators.

210Integration with rail and rapid transit networks
Access to the rail and rapid transit network is enhanced by bus interchange. Key interchanges between
rapid transit and main bus routes have been identified, of which many currently exist as bus stations.
Further measures to promote seamless travel at quality interchanges will be programmed with rapid transit
development. Some principal bus corridors are particularly important because they serve areas that will
not have rail or rapid transit provision. Many of these have had Bus Showcase quality corridor investment
over the last ten years.
Within rapid transit corridors, local bus provision will be adapted to complement the Metro or ‘SPRINT’
BRT service, in partnership with operators. Depending on local conditions in individual corridors, this
means either a reconfiguration of bus services to rapid transit interchanges, less frequent bus services or a
similar level of service, with rapid transit seen as an additional layer of provision.
211
A. Role of Complementary Travel Services
Complementary travel services are services
provided to ensure a comprehensive public
transport system meets the needs of people with
mobility difficulties, and areas and markets of low
demand. These services are defined as ‘Ring and
Ride’, community transport and travel training.
Bespoke school transport measures are considered
under the ‘Smarter Choices’ topic area.
Improved local accessibility for socially excluded
communities is a high priority. Complementary
travel services have an important role to play in
realising these improvements.
The role of ‘Ring and Ride’ is:
• Door-to-door service for people who
find it difficult or impossible to use public
transport, with a booking system operates
on a first come first served basis
• Provision of access to fresh food, health,
leisure activities
Complementary Travel Services
• Improved mobility for users, reducing
dependence on local authorities and health
providers
The role of community transport is:
• Provision of demand responsive services
as part of an integrated public transport
system in appropriate areas of low demand
• Group transport and private hire for groups
and clubs
• Statutory travel (special education, schools,
adult social services)
• Some DRT transport and voluntary car
schemes; prison visiting transport
• Provision of access to fresh food, health,
leisure activities
• Improved mobility for users, reducing
dependence on local authorities and health
providers
B. Partners: Roles and Responsibilities
‘Ring and Ride’
Centro’s role is as a service commissioner, setting out a specification in a contract for the provision of
‘Ring and Ride’ door-to-door services for people who find it difficult or impossible to use conventional
public transport services.

212C. Progress and Successes from LTP2
‘Ring and Ride’
The ‘Ring and Ride’ service has been operating
in the Metropolitan Area for over 25 years. It
is operated by West Midlands Special Needs
Transport, a registered charity, which receives
grant funding from Centro. The service has
expanded to provide over 1.8 million journeys per
annum, making it the largest service of its type in
the UK, utilising over 130 vehicles. WMSNT have
successfully diversified into operating contracted
services for other Local Authorities, operating
services for Education Departments.
A review by Centro and WMSNT in 2007
concluded that the grant paid to WMSNT was
used in an efficient and effective manner and
methods of operation compare well with similar
operators. Benefits are calculated across a wide
range of services and were valued at £28 million
per annum (2006/07). ‘Ring and Ride’ increases
personal mobility, independence and quality of
life, reducing the reliance on Local Authorities
and on the reducing resources available for
domiciliary care, provision of council transport,
residential care and for health treatment.
Following the work carried out in 2009, a three
year Business Plan was put in place, which set
out how Centro and WMSNT will work together
to develop the service to meet some of the issues
raised above. As well as providing WMSNT with
longer-term financial security, it set developments
to ensure the service is maximising the use of
The role of West Midlands Special Needs
Transport (WMSNT) is as a contractor: a non-
commercial operator contracted to provide the
‘Ring and Ride’ service for Centro.
Centro and Ring and Ride work in partnership to
develop a strategic approach to provision.
Community Transport
Centro’s role in community transport provision is
as:
- A service commissioner, for example
commissioning the 360 service in Walsall,
operated by Walsall Community Transport
- A facilitator of the development of the sector,
leading the establishment of a new West
Midlands Community Transport Forum.
The role of District Authorities is to procure
the transport services required for journeys for
Education and Adult and Social Care purposes.
The role of community transport operators is to
provide for some transport demands not met by
other forms of public transport.

213resources, operating efficiently and providing more
trip opportunities for registered users.
In summary they are –
• Improved fleet utilisation. Developing and
implementing innovative new ‘Smarter
Scheduling’ technology linked to on-
vehicle navigation/information systems to
maximise use of resources, increasing trip
opportunities and quality of service and
reducing operational costs such as fuel and
driver training.
•Improving links for users to public transport
network, piloting services enabling ‘Ring
and Ride’ users to make longer distance
trips via high quality and frequent services
on Smart Routes.
•Some schools contracts operated on
behalf of local authorities enable use of
vehicles in downtime to provide more
‘Ring and Ride’ trips and daytime transport
opportunities for schools.
•Growing use of service by younger disabled
people for access to education, training
or work. Tailored marketing developed to
cater for the requirements of this market.
Community Transport
There are a number of operators providing
community transport; the main one being the
Community Transport National Charity, which has
projects based in six of the seven Metropolitan
District Council areas. In total across all
operators, around 116 vehicles are utilised which
collectively provide 500,000 passenger trips
per annum. Many operators provide services
under contract to local authorities to operate
journeys for Education and Adult and Social
Care purposes. Operators are under increasing
pressure to reduce contract costs and, with the
gradual withdrawal of many grants provided by
Local Authorities, the sector is under pressure to
maintain both turnover levels and fleet quality.
Centro works with operators to provide some
local shoppers’ services to older people
and younger parents with children, typically
operating two or three days a week. Additionally,
‘Community Transport Birmingham’ operates
the Prison Visiting Service for Metropolitan
Area families of inmates at prisons outside
the Area in order to maintain family links and
help reduce re-offending rates. ‘Shencare’ in
southwest Birmingham has successfully operated
the ‘Community Insiders’ project with support
from Centro and Birmingham City Council. This
enables access to fresh food shopping, leisure
activities and other services offering increased
health and wellbeing.
Grant funding has been in decline over recent
years as Local Authorities move towards provision
on a service level agreement or contract basis. It
is likely that grant funding will continue to decline;
coupled with a competitive local market for
schools and social care contracts, this provides
considerable financial uncertainty for the operation
of traditional community transport services.

214
KO1 Economy • Complementary travel services help increase the mobility of labour
markets when assisting with trips to employment or training
KO2 Climate Change • Use of greener fuel vehicles will help reduce carbon emissions
KO3 Health, Personal
Security and Safety
KO4 Equality of
Opportunity
• Complementary travel services enhance access to services and other
desired destinations thus improving equality of opportunity for all and
social inclusion
KO5 Quality of
Life and Local
Environment
• Improved access improves people’s wellbeing
West Midlands Community Transport Forum
The Forum has recently been formed, which comprises membership from Centro and community
transport operators. Its role includes developing closer working relationships, links to statutory
organisations with an interest in community transport, responding to consultations, identifying best
practice and developing quality standards in service provision.
D. LTP3 Key Objective Alignment

215
Year 1992 1997 2002 2007 2012 2017 2022 2027 2031
UK Average 15.8 15.9 15.9 16 17.2 18.4 19.4 20.8 22.2
Birmingham 15.1 14.8 14.3 13.5 13.2 13.2 13.4 14 14.6
Coventry 15.8 15.5 15.2 14.9 15 15.3 15.7 16.3 17
Dudley 15.3 16.3 16.9 17.7 19.2 20.5 21.4 22.4 23.6
Sandwell 16.6 16.5 16.3 15.9 16 16.3 16.6 17.5 18.6
Solihull 14.8 16.1 17 17.5 18.9 19.9 20.3 21.4 22.5
Walsall 14.6 15.6 16.4 17.1 18.1 18.9 19.5 20.5 21.5
Wolverhampton 15.7 16.4 16.9 16.9 17.4 18.3 19.1 20.3 21.4
West Midlands Average 15.4 15.9 16.1 16.2 16.8 17.5 18 18.9 19.9
E. Major Influences for LTP3
Integrated Public Transport Prospectus
This sets out the long-term vision for public transport serving the Metropolitan Area. Complementary
travel services are one of four integrated tiers of public transport.
Demographic changes
Demand for community transport and ‘Ring and Ride’ services is expected to grow significantly due to
demographic changes. Population ageing will see will see the number of people aged 60 and over rise
from 1.2 million in 2006 to 1.4 million by 2018, and to 1.7 million by 2029. Unless the ‘Ring and
Ride’ service is tailored to meet this forecast change, it is likely that the average number of trips currently
enjoyed by each passenger will reduce.
Percentage of the Population aged 65 and over by Metropolitan Authority 1992 – 2031

216
The Personalisation Agenda
The Government’s Personalisation agenda is changing the way that services are provided by adult and
social care departments. Focus is moving away from the state provision of services towards the recipient
having greater control over their own care and services – ‘Person-Centred Support’. Personal budgets
are now allocated to users dependent on their personal circumstances and requirements for care and
services. The private and third sector will have more opportunity to provide services rather than directly
state operated.
Transport will be key to people being able to access services that are likely to be provided in the majority
away from traditional day-centres to locations more widespread in the community. It is unclear at present
as to what impact this will have on existing door-to-door services but it is likely that users of services will
make more use of public transport, putting additional pressure onto transport services. Local Authorities
that will set social care policy and strategy will need to consider and consult on transport provision that
will be required in their areas.
Percentage of the Population aged 65+
101992
Birmingham Dudley Solihull Wolverhampton
Coventry Sandwell Walsall West Midlands Average
1997 2002 2007 2012Years
%
2017 2022 2027 2031
11
12
13
14
15
16
17
18
19
20
21
22
23
24
25
217F. LTP3 Policies
Complementary Travel Services: Ring and Ride
Policy LA7: To increase social inclusion in the Metropolitan Area, through a thriving ‘Ring and Ride’
service to help meet the needs of disabled people for clearly defined markets, as part of the overall
public transport system
Complementary Travel Services: Community Transport
Policy LA8: To increase social inclusion in the Metropolitan Area, through a thriving community
transport sector to help meet the needs of clearly defined markets, as part of the overall public
transport system
To achieve these policies there will be a need for more effective brokerage of commissioned accessible
transport services in the West Midlands Metropolitan Area. Commissioning bodies will need to embrace
the principles behind Greater Manchester Passenger Transport Executive’s “Integrated Social Needs
Transport Project”. This seeks to match underused transport capacity to unmet demand for transport,
particularly by those unable to use conventional public transport services. This is through work with the
operators of accessible transport, including local authorities, the third sector, and the ambulance service
to develop mechanisms that can make these assets more readily available to people who have limited
transport alternatives.
How fleet vehicle standards can be improved as part of the commissioning process also needs to be
considered.
Centro will also need to consider the role of demand responsive services serving low demand areas, as
part of an integrated public transport system, when reviewing its bus access standards for the provision of
subsidised socially necessary bus services.
218218LTT7: SUSTAINABLE AND EFFICIENT FREIGHT TRANSPORT (SF)
219Sustainable Freight: Road and Rail Freight
Movement of freight is a natural reflection on
the strength of a regional economy reflecting the
demand for manufactured goods, commerce as
well as retail and commercial demands.
The Sustainable Freight Strategy for Road and Rail
Freight defines freight as the movement of finished
goods, raw materials, deliveries and freight
logistics. It covers all aspects of freight movements
from the start of a journey, along transport
networks and end point loading/ unloading
by road and rail, reflecting their primary roles
in freight movements. Water and airfreight are
covered within the LTP3 Water and Air Freight
Strategy.
A. Role of Freight
Within the West Midlands region, nearly 600,000
(25%) people are employed in manufacturing
out of a working population of 2.4M. The West
Midlands region accounts for 11% of all UK
manufacturing and 25% of manufacturing exports.
The Metropolitan Area, as the economic driver of
the regional economy, is the originator of many
of these exports and imports. There is also a
significant service and knowledge based economy
and this, combined with the presence of a large
logistics sector present within the wider region
- due to its strategic location at the centre of
the UK transport networks – results in significant
levels of freight in and out as well as through the
Area. Freight therefore has a significant impact on
national, regional and local transport networks.
LTP3 provides the policy framework to support
the freight industry by providing reliable, efficient
transport networks, whilst developing schemes
and initiatives to help support freight deliveries
across the Metropolitan Area in support of the
wider region. With these in place, the West
Midlands as a whole will benefit from a reliable
and efficient freight industry that supports
existing businesses and generates further
inward investment whilst supporting wider policy
objectives of LTP3.
Road Freight
Road freight is the dominant form of freight
transport both nationally and locally and this is
reflected by its high profile in LTP3. Road freight
movements in the Area are primarily focused on
regional and national road networks which are
heavily congested at peak times and which also
come under further pressure through our position
at the centre of the national road network.
Supporting the road freight sector is a high
priority for LTP3 and, by providing reliable
journeys in and around the Metropolitan Area
and providing efficient reliable access to the
national road network, this will allow businesses
to trade more effectively and reach new markets,
both at home and abroad.
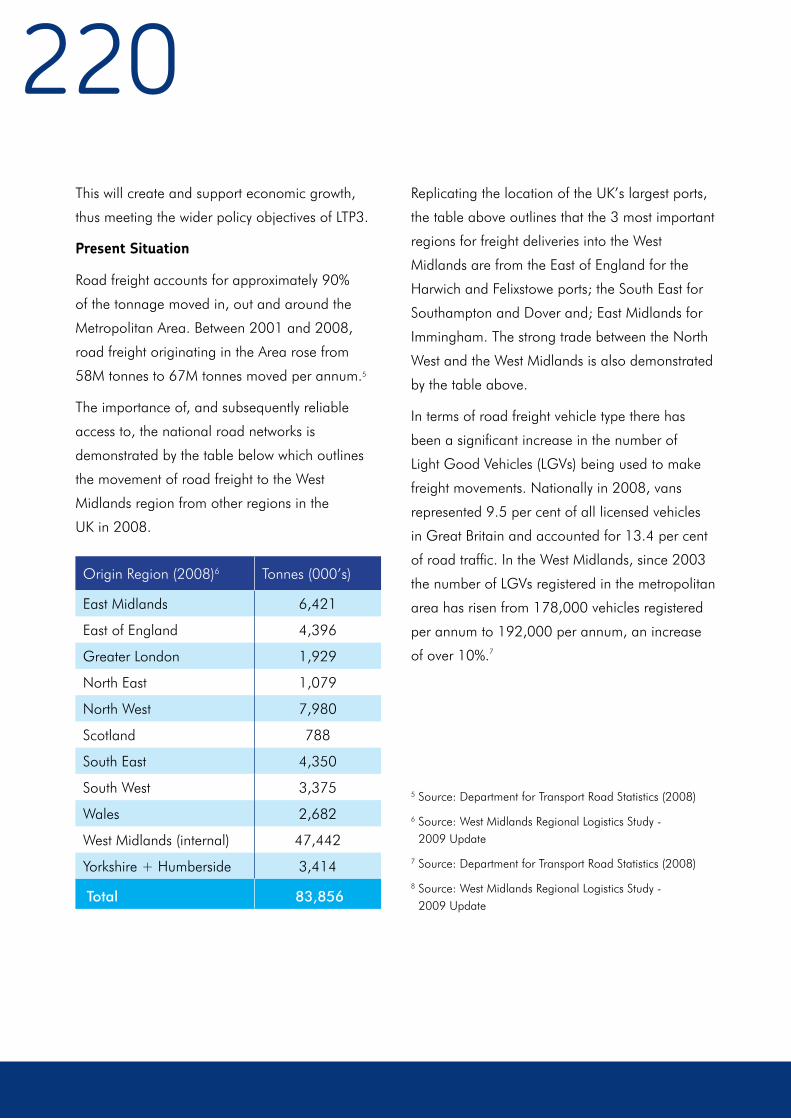
220This will create and support economic growth,
thus meeting the wider policy objectives of LTP3.
Present Situation
Road freight accounts for approximately 90%
of the tonnage moved in, out and around the
Metropolitan Area. Between 2001 and 2008,
road freight originating in the Area rose from
58M tonnes to 67M tonnes moved per annum.5
The importance of, and subsequently reliable
access to, the national road networks is
demonstrated by the table below which outlines
the movement of road freight to the West
Midlands region from other regions in the
UK in 2008.
Replicating the location of the UK’s largest ports,
the table above outlines that the 3 most important
regions for freight deliveries into the West
Midlands are from the East of England for the
Harwich and Felixstowe ports; the South East for
Southampton and Dover and; East Midlands for
Immingham. The strong trade between the North
West and the West Midlands is also demonstrated
by the table above.
In terms of road freight vehicle type there has
been a significant increase in the number of
Light Good Vehicles (LGVs) being used to make
freight movements. Nationally in 2008, vans
represented 9.5 per cent of all licensed vehicles
in Great Britain and accounted for 13.4 per cent
of road traffic. In the West Midlands, since 2003
the number of LGVs registered in the metropolitan
area has risen from 178,000 vehicles registered
per annum to 192,000 per annum, an increase
of over 10%.7
Origin Region (2008)6 Tonnes (000’s)
East Midlands 6,421
East of England 4,396
Greater London 1,929
North East 1,079
North West 7,980
Scotland 788
South East 4,350
South West 3,375
Wales 2,682
West Midlands (internal) 47,442
Yorkshire + Humberside 3,414
Total 83,856
5 Source: Department for Transport Road Statistics (2008)
6 Source: West Midlands Regional Logistics Study - 2009 Update
7 Source: Department for Transport Road Statistics (2008)
8 Source: West Midlands Regional Logistics Study - 2009 Update
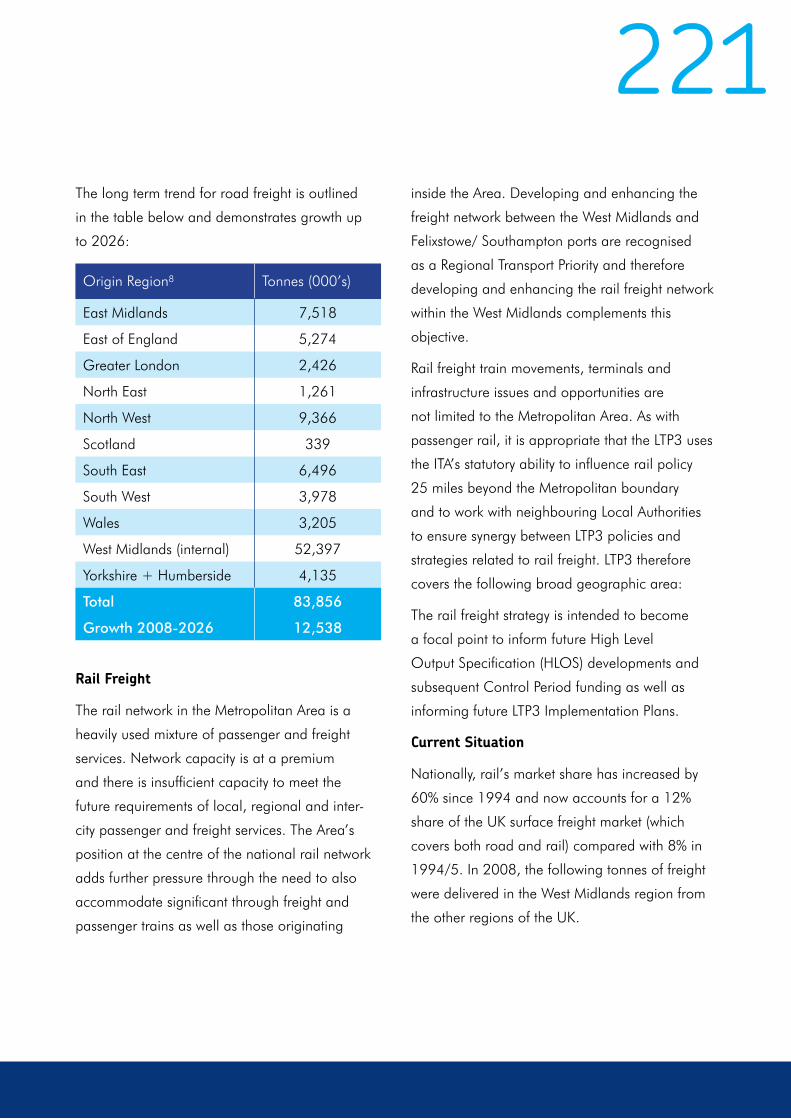
221
Origin Region8 Tonnes (000’s)
East Midlands 7,518
East of England 5,274
Greater London 2,426
North East 1,261
North West 9,366
Scotland 339
South East 6,496
South West 3,978
Wales 3,205
West Midlands (internal) 52,397
Yorkshire + Humberside 4,135
Total 83,856
Growth 2008-2026 12,538
The long term trend for road freight is outlined
in the table below and demonstrates growth up
to 2026:
Rail Freight
The rail network in the Metropolitan Area is a
heavily used mixture of passenger and freight
services. Network capacity is at a premium
and there is insufficient capacity to meet the
future requirements of local, regional and inter-
city passenger and freight services. The Area’s
position at the centre of the national rail network
adds further pressure through the need to also
accommodate significant through freight and
passenger trains as well as those originating
inside the Area. Developing and enhancing the
freight network between the West Midlands and
Felixstowe/ Southampton ports are recognised
as a Regional Transport Priority and therefore
developing and enhancing the rail freight network
within the West Midlands complements this
objective.
Rail freight train movements, terminals and
infrastructure issues and opportunities are
not limited to the Metropolitan Area. As with
passenger rail, it is appropriate that the LTP3 uses
the ITA’s statutory ability to influence rail policy
25 miles beyond the Metropolitan boundary
and to work with neighbouring Local Authorities
to ensure synergy between LTP3 policies and
strategies related to rail freight. LTP3 therefore
covers the following broad geographic area:
The rail freight strategy is intended to become
a focal point to inform future High Level
Output Specification (HLOS) developments and
subsequent Control Period funding as well as
informing future LTP3 Implementation Plans.
Current Situation
Nationally, rail’s market share has increased by
60% since 1994 and now accounts for a 12%
share of the UK surface freight market (which
covers both road and rail) compared with 8% in
1994/5. In 2008, the following tonnes of freight
were delivered in the West Midlands region from
the other regions of the UK.

222Origin Region (2008)9 Tonnes (000’s)
East Midlands 0
East of England 1,132
Greater London 0
North East 1
North West 3
Scotland 39
South East 900
South West 2
Wales 82
West Midlands (internal) 1
Yorkshire + Humberside 0
Total 2,161
The major focus of rail freight movements are
between the West Midlands and the East of
England and the South principally reflecting
freight movements as a result of the ports at
Harwich, Felixstowe and Southampton. Freight
trains generally enter/ leave the West Midlands
rail network via the following corridors:
• Southampton ports: (3 main routes) 1)
Leamington Spa - Tyseley, 2) Leamington
Spa - Coventry - Nuneaton - Water Orton,
3) Leamington Spa - Coventry - Stechford -
Bescot - Sutton Park Line
•Harwich/ Felixstowe via North London:
(2 main routes) 1) Rugby - Coventry
- Nuneaton - Water Orton, 2) Rugby -
Coventry - Stechford - Bescot - Sutton Park
Line
•North East: (2 main routes) 1) Leicester
- Nuneaton - Water Orton, 2) Burton -
Tamworth - Water Orton
•North West: (2 main routes) 1) Stafford
- Wolverhampton, 2) Rugeley - Cannock –
Walsall
•South West: (2 main routes) 1) Barnt
Green - Kings Norton - Landor Street, 2)
Droitwich - Stourbridge
Long term, DfT predict a 30% increase on goods
lifted by rail nationally between 2007-15, whilst
Network Rail has predicted long term growth
of 75% in container traffic by 2030, although
national projections for coal rail freight sees a
20% reduction by 2030 as the UK moves away
from coal powered power stations. The West
Midlands region saw a 420% increase in inbound
trains from UK deep-sea ports between 1997 and
2006 and this growth in expected to continue
into the long term. Rail freight growth projected
on the West Midlands rail network is focused
on movements between the West Midlands and
the deep-sea ports at Southampton, Felixstowe,
Harwich and Thames Gateway (when built).
Network Rail’s long term projections currently
exclude the additional rail freight, which would be
generated from the proposed Deep Sea Port at
Portishead near Bristol.
9 Source: West Midlands Regional Logistics Study - 2009 Update

223In the West Midlands, the following rail freight movements from the other UK regions into the West
Midlands are predicted by 2026:
10 Source: West Midlands Regional Logistics Study - 2009 Update
Origin Region (2026)10 Tonnes (000’s)
East Midlands 0
East of England 2,454
Greater London 5
North East 27
North West 33
Scotland 665
South East 1,439
South West 42
Wales 15
West Midlands (internal) 0
Yorkshire + Humberside 2
Total 4,682
Growth 2008-2026 2,521
B. LTP3 Road and Rail Freight: Roles and Responsibilities
West Midlands Freight Quality Partnership
The West Midlands Freight Quality Partnership (FQP) was formed following the publication of the DfT’s
Sustainable Distribution Strategy and subsequent Good Practice Guide 335. It provides a forum for
freight companies, the seven Local Authorities, ITA, Network Rail and the Highways Agency to identify
problems and develop solutions to enhance transport networks for the freight industry. Freight operator’s
views are represented by organisations such as the Road Hauliers Association and Freight Transport
Association, as well as by individual operators. The FQP is therefore suitably placed to support and
lead on specific schemes and initiatives delivery outlined in LTP3 Long Term Theme 7 “Sustainable and
Efficient Freight” as well as monitoring the Action Plan.
224Integrated Transport Authority (ITA)
The Local Transport Act (2008) placed
responsibility for strategic freight policy with the
ITA. The ITA is also responsible for promoting
freight schemes, in partnership with stakeholders,
which have rail network implications or require a
Metropolitan wide perspective. Local Authorities
will also implement schemes on the highway
network, as Highway Authority.
Local Authorities
Local Authorities are responsible for the
promotion and implementation of freight schemes
and initiatives outlined in LTP3 that impact on
local transport networks. Local Authorities will
also implement any strategic schemes on the
highway network, as Highway Authority.
Network Rail
Network Rail owns and operates the UK’s rail
infrastructure and is a key stakeholder. Rail freight
schemes will be promoted in partnership between
the ITA, Local Authorities and Network Rail, whilst
the latter will lead on subsequent delivery of rail
freight schemes.
Freight Operators
Freight operators, both road and rail, are key
stakeholders as they undertake freight movements
on the transport networks. It is crucial to the
success of LTP3’s Freight Strategy that operators
are stakeholders in identifying problems and
developing solutions.
Since the West Midlands FQP was formed,
it has championed the following freight
successes:
2003 – 2005
• Resigning of main radial routes,
Birmingham and Coventry reviews
commenced;
• Supported production of Regional
Freight Strategy
2004
• Ensured that the introduction of
red routes had specific facilities for
loading and unloading;
• Agreed revised primary route network
for West Midlands – published in
Regional Planning Guidance;
• Identified quick wins to reduce
congestion
2005
• Published The West Midlands
Commercial Vehicle Driver’s
Road Atlas, in collaboration with
Birmingham City Council;
• Led a Lorry Parking Study for the West
Midlands;
• Led the development of Regional
Freight Strategy
2008
• Online version of the 2005 West
Midlands Commercial Vehicle
Driver’s Road Atlas;
225C. Progress and Successes from LTP2
Brewery Street Lorry and Coach Park
During 2010, Birmingham City Council
delivered a new Lorry and Coach Park in
Birmingham city centre, holding up to 50 HGVs
or coaches in a secure environment with facilities
available for drivers.
West Coast Main Line to Felixstowe (via
Peterborough) Gauge Upgrade
Network Rail is upgrading the gauge capability of the
rail route from the West Coast Main Line at Nuneaton
to Felixstowe (via Peterborough). The £68M
scheme will enable the route to accommodate
9’6” high shipping containers (the international
norm) on standard platform height wagons.
The scheme will be completed in 2011 and will
increase the Area’s economic competitiveness
by allowing businesses to more easily send and
receive standard size international shipping
containers via rail, improving access to
commercial markets outside the UK.
West Coast Main Line to Southampton
Gauge Upgrade
Network Rail is upgrading the gauge capability
of the rail route from the West Midlands
to Southampton to enable the route to
accommodate 9’6” high shipping containers on
standard platform height wagons. The £70M
scheme will be completed in 2011 and will
increase the Area’s economic competitiveness
by allowing businesses to more easily send and
receive standard size international shipping
containers via rail, improving access to
commercial markets outside the UK.
Nuneaton North Chord
Network Rail is currently developing the Nuneaton
North Chord scheme which aims to allow freight
trains travelling between the North West and
Felixstowe to pass over the West Coast Main Line
in a segregated manner rather having to enter
the West Coast Main Line directly or pass through
Nuneaton station. This will improve freight journey
times and reliability.
West Coast Main Line to Felixstowe
(via Peterborough) Capacity Upgrade
Following on from the W10 gauge clearance
project, it is anticipated that demand for train
paths on the route via Peterborough will grow
significantly. A scheme is being developed in
response to this requirement, which will seek to
tackle the principal capacity pinch-points along
the corridor with new infrastructure solutions
where appropriate. Development work is also
underway for a scheme to enable the operation
of longer trains on the corridor, which will enable
more efficient asset and train-path utilisation.
West Coast Main Line to Southampton
Capacity Upgrade
As for the West Coast Main Line to Felixstowe (via
Peterborough), schemes are being developed to
improve capacity on the route from Southampton
to the West Midlands / West Coast Main Line and
to enable the operation of longer trains.
226Birch Coppice Rail Freight Terminal
Birch Coppice Business Park was opened in 2000 on the site of the former Birch Coppice colliery and is
occupied by significant logistics companies. In 2006 the Birmingham International Freight Terminal (BIFT)
opened on the site acting as an inland container terminal and received freight trains from Felixstowe,
Southampton and Ipswich and will benefit from the West Coast Main Line to Felixstowe and Southampton
gauge and capacity upgrade schemes.
KO1 Economy • Efficient and reliable freight movements will support the economy
through improved delivery times between businesses thus attracting
inward investment and maximising the West Midlands strategic
position at the centre of the national transport networks
• Efficient and reliable traffic flows will help reduce the estimated
£2.3bn lost by business per annum as a result of road congestion
across the metropolitan area
• Efficient and reliable road and rail freight networks will allow
businesses to reach new markets locally, regionally, nationally and
internationally allowing businesses to expand whilst attracting inward
investment creating more high value employment
KO2 Climate Change • Efficient and reliable road freight movements reduce carbon emissions
when compared to road freight caught in congestion
• Increased levels of freight moved by rail emit less carbon emissions
than the equivalent movements by road;
KO3 Health, Personal
Security and Safety
• Improving the environmental performance of the freight sector will
lead to improved air quality;
D. LTP3 Key Objective Alignment
227KO4 Equality of
Opportunity
• Road and Rail freight allows access to goods and markets which
might not otherwise be accessible to businesses of the Metropolitan
Area supporting economic diversity
KO5 Quality of
Life and Local
Environment
• Railway corridors comprise part of Local Authorities’ Green
Infrastructure Networks and provide habitats for flora and fauna.
• Supports migration of species in response to climate change
• Trees in railway corridors capture carbon, improve air quality and help
prevent soil erosion.
E. Major Influences on Road and Rail Freight
An Integrated Sustainability Appraisal (ISA) has been undertaken to support the preparation of LTP3,
including an analysis of relevant plans, policies and programmes from international through to local level
and their implications for LTP3 Road and Rail Freight.
F. LTP3 Policies – Road and Rail Freight
Policy SF1 - Lorry Parking: To increase the
availability of HGV parking in appropriate
locations across the Metropolitan Area
The Area currently suffers a chronic lack of safe
and secure HGV parking. This is a concern of the
road freight industry including the Freight Hauliers
Association (FHA) and was identified as an issue
for road freight in the West Midlands Regional
Freight Strategy. This has major impacts on freight
logistics both regionally and nationally and is
amplified by the central location of the Area. This
also affects the ability of our businesses to expand
or to attract inward investment.
Currently parking occurs in three ways: in lay-bys,
on industrial parks or in specialist HGV facilities.
HGV facilities are provided by the private sector,
although in recent years a number of HGV parks
in or around the Metropolitan Area have closed.
Whilst Birmingham City Council opened facilities
in Brewery Street in the city centre during 2010,
a chronic shortage remains, with no further
new off-street overnight lorry parking facilities
currently proposed. Therefore, LTP3 seeks to
increase the availability of HGV parking across
the Metropolitan Area and to deliver the following
specific interventions:
2281. Deliver New Lorry Parking Facilities
LTP3 proposes that the ITA will work with Local
Authority partners, commercial Lorry Park
providers and the Freight Quality Partnership
to build upon the West Midlands Lorry Parking
Study (2005) findings, which identified new and
expandable lorry parking provision across the
Metropolitan Area.
2. Selective Use of Park & Ride Sites for
Lorry Parking
To provide additional overnight lorry parking
capacity, in alignment with the principle of
Smarter Management, the ITA will work with
partners to explore the potential use of selected
Park & Ride (P&R) sites close to motorway
junctions or national highway networks for
overnight lorry parking.
The majority of Centro’s P&R sites are generally
empty once the evening travel peak has ended
and, subject to modifications, could offer HGVs
secure overnight parking as all Centro P&R sites
hold the Police’s “Safer Parking” accreditation.
A trial will ascertain the demand for such sites as
well as the practicalities in terms of site access
requirements and car park surface maintenance.
Selected sites would not be close to residential
areas to minimise impacts to resident’s quality
of life.
Policy SF2 - Effective Delivery Access: To seek
to ensure effective and reliable freight deliveries
can occur in all types of centres across the
Metropolitan Area
The Metropolitan Area is home to many
different types of centres, each with their own
characteristics and therefore different delivery
challenges.
For example, busy vibrant strategic centres have
residential, retail and commercial buildings with
competing demands for kerb space. Delivery
vehicles such as HGVs or Light Good Vehicles
also compete with each other and other types of
vehicles when making deliveries using kerb side
loading bays, meaning adequate delivery space
may not be available. This creates air pollution,
congestion and is inefficient for both the delivery
companies and for customers.
This leads to problems in making deliveries to
customers. Delivery challenges occur to some
degree in all types of centre. The RFS outlined the
need to improve delivery access which is a priority
also identified by the FTA.
Additionally, Local Centres are a fundamental
element of the economy and their vitality is
underpinned by an ability to make and receive
deliveries. However, many Local Centres are
located on or adjacent to the strategic highway
network, causing conflicts between strategic traffic
movements and local delivery requirements,
which become most acute during peak travel
hours. This can lead to:
229• Impacts on the reliability of deliveries and
to the businesses they serve
•Inappropriate on-street deliveries that
cause local congestion which then affects
the reliability of other road users’ journeys
•Conflicts between delivery companies
and Local Authority Parking Enforcement
obligations
LTP3 seeks to ensure effective and reliable freight
deliveries can occur in all types of centre across
the Area and aims to deliver the following specific
interventions:
i Strategic Centres
1. Loading Facilities
Local Authorities will ensure appropriate loading
facilities are available in centres which are
available when deliveries are required and
located close to delivery points where practicable,
recognising the requirements of other road
users. Where appropriate, programmes will be
developed through Smart Routes.
2. Intelligence Transport Systems
Local Authorities and the ITA will explore the use
of Intelligent Transport Systems (ITS) to support
efficient and reliable deliveries in major centres,
for example to reserve loading bays for a specific
time window.
3. Review of Traffic Regulation Orders
The FQP will work with freight operators to
identify problems with undertaking deliveries
in strategic centres such as restrictive Traffic
Regulation Orders, noise abatement orders or
overnight delivery restrictions, to determine if
modifications to orders can be made to improve
delivery access without negative impacts to
neighbouring buildings or road traffic. This will
occur as part of the Quick Wins approach.
4. Quiet Deliveries
Local Authorities and the ITA will examine
the findings and outcomes of the DfT’s Quiet
Deliveries Demonstration Scheme.
ii Local Centres
1. Smart Routes
Developing solutions requires a holistic and
integrated approach, which takes into account the
needs of strategic and local traffic movements.
Smart Routes aim to provide reliable journeys
for all road users through a toolbox of different
schemes and initiatives on strategic corridors. In
relation to road freight, Smart Routes will ensure
that appropriately located loading facilities are
incorporated into corridor designs which provide
a balance between the needs of local centres and
strategic traffic movements.
2. Local Centre Delivery Access
Local Authorities will continue to work with
stakeholders to ensure that appropriate unloading
areas are provided which are supported by
TROs that reflect existing local centre opening
hours and traffic flows, and take into account the
impacts from noise during unsocial hours.

2303. Adoption of Loading/ Unloading Good
Practice
The Local Authorities will adopt principles of
the Loading/ Unloading Good Practice guide
published by the FTA. This aims to bring together
stakeholders to work collectively to improve
the competitiveness of local businesses and to
promote best practice amongst business, traffic
authorities and parking enforcement contractors
to find positive and effective solutions where
loading and unloading is a problem.
Congestion currently costs Metropolitan
businesses £2.3bn per annum. Efficient freight
movements ensure that deliveries occur on time
and that customers receive goods at a time to
suit their business. This can be achieved through
reliable road journeys in and around the Area, as
well as by reliable access to the National Highway
Networks. In line with the principals of Smarter
Management, the ITA and Local Authorities will
work to ensure the existing highway network
operates as reliably as possible to support road
freight movements across the Area and will seek
to deliver the following specific interventions:
1. Quick Wins
Quick Win programme aims to identify small
scale interventions which improve freight
movements and deliveries, including network and
junction reliability as well as interventions such
as updated Traffic Regulation Orders as a result
of land use change. The West Midlands FQP is
suitably placed to identify Quick Win schemes,
which will be implemented either through Smart
Routes or directly by the Local Authorities.
2. Route Signage
Local Authorities will undertake, where necessary,
Route Signage Revisions to ensure it provides
appropriate freight access and routings. The
revisions will take into account land use change
and any major new development.
Policy SF3 - Improving Environmental
Performance: To support national and locally
led initiatives to accelerate the introduction of
low carbon transport through improving the
environmental performance of the freight industry
Road freight accounts for 31%11 of total
carbon emissions related to the transport
sector nationally. Improving the environmental
performance of the road freight sector provides
an opportunity to contribute towards LTP3’s low
carbon Outcome. In addition, LTP3’s Long Term
Theme 10 supports the role of new technologies
in this. Therefore, supporting the freight
industry’s adoption of ultra low emission
freight vehicles is an important element of
developing sustainable freight.
Environmental performance of road freight is not
constrained solely to actual freight movements.
The types of vehicle engine, driver training, wider
logistics planning, and the actual day-to-day
operations of freight business all impact on the
environmental performance of the road freight
11 Source: Department for Transport (2009) “Low Carbon Transport: A Greener Future”
231industry. Therefore, LTP3 supports national
initiatives towards moving towards low carbon
transport and improving the environmental
performance of the freight sector. LTP3 aims to
deliver the following specific interventions:
1. Urban Freight Consolidation Centres
Urban Freight Consolidation Centres (UFCC) are
used in some major cities in Europe and provide
a facility for delivery vehicles to be unloaded
away from a major centre, with the use of smaller
and therefore lower emission vehicles. The centres
look to reduce the impacts of deliveries in city
centres such as kerb space delivery conflicts, air
quality, noise and road congestion. The DfT has
recently begun examining the potential benefits of
Urban Freight Consolidation Centres. In addition
to delivery focused UFCC’s, some cities such as
London have developed consolidation centres for
major construction works, with materials delivered
to a remote consolidation centre and thence to
the construction site by smaller vehicles.
The environmental benefits of such centres are
strengthened by the use of low/ zero emission
delivery vehicles, complemented by appropriate
traffic regulation orders. The attractiveness
of UFCCs could be strengthened by delivery
vehicles using bus priority measures such as
bus lanes or bus gates, thus ensuring quicker
and more reliable access to major centres
compared to conventional delivery access
means. By developing a package of measures to
support UFCCs, it will be quicker, more reliable
and potentially more time and cost effective
for delivery companies, whilst helping Local
Authorities meet carbon emission and road
congestion objectives.
Birmingham City Council has outlined aspirations
for a consolidation centre serving Birmingham city
centre and commissioned a study to identify the
benefits, potential sites and how the centre would
be operated. It concluded that an Urban Freight
Consolidation Centre would have significant
benefits for Birmingham.
LTP3 therefore proposes the following in relation
to Urban Freight Consolidation Centres:
•To build on the strong benefits identified
by the Birmingham Urban Freight
Consolidation Centre study and further
develop the Birmingham Consolidation
Centre scheme;
•Building on the Birmingham Urban Freight
Consolidation Centre study to implement a
Metropolitan-wide study with the objective
of identifying and developing multiple
consolidation centres serving major centres,
business or retail parks across the Area;
2. Environmental Fleet Assessments Schemes
Poor environmental performance affects the
freight industry directly through higher fuel bills,
increased maintenance costs and lost revenue
through inefficient freight movements. At the same
time, it can result in higher carbon emissions,
increased noise levels and worsening air quality.
It is therefore widely beneficially to improve the
environmental performance of road freight.

232To encourage improved environmental
performance across the freight sector, the ITA
and Local Authorities will work with freight and
logistics companies to encourage sign up to an
“environmental fleet assessment”. This will assess
companies and provide advice and solutions
to improve their environmental performance.
Companies are often then awarded a grade to
reflect their current performance. Such schemes
have proved successful in other parts of the UK
and membership is voluntary. The West Midlands
Quality Freight Partnership will lead on the
development of “environmental fleet assessment.”
3. Supporting Use of Electric Vehicles
Increased use of electric vehicles in the road
freight industry has many benefits and contributes
towards LTP3 Objectives through reducing carbon
emissions and improving air quality. Similarly,
electric vehicles are significantly cheaper to run
providing cost benefits to the companies that
use them.
Primarily, it is the role of national government to
implement policies, incentives and initiatives to
encourage the use of electric vehicles and for the
freight industry to adopt them. As a result, it is
the role of the Metropolitan Local Authorities to
put in place infrastructure to support this usage.
Therefore, Local Authorities and the ITA will
work with Government and the freight industry
to provide supporting policies and infrastructure,
such as charging points.
Rail Freight
Policy SF4 - Enhanced Rail Freight Network
Capacity: To develop and enhance the Area’s rail
network capacity, efficiently and reliability which
can meet existing and future rail freight growth
demands
The Rail Freight Network is a crucial element of
the national and local economy. Across the Area’s
rail network, freight train routings are affected by
train path availability and conflicts, route gauging
and by limitations on access to freight terminals.
This can result in freight trains being required to
undertake inefficient freight movements across
the network which impact on passenger services.
Tackling these issues are priorities within the DfT’s
Strategic Rail Freight Network document and
Network Rails Freight Route Utilisation Strategy.
The long-term trends of rail freight see an
increase of up to 80 additional trains per
day within the Area, which would need to be
accommodated on a primarily mixed-use network.
To ensure our rail network can meet existing
demand and future rail freight growth, Centro will
work with partners to identify and tackle inefficient
rail freight routings across the Area, as well as
identifying interventions to increase rail capacity
and reliability.
As owners of the rail network infrastructure,
providing additional rail freight capacity is
primarily the responsibility of Network Rail.
233However, Centro and partners have an important
role in promoting rail freight schemes and
providing support, as well as protecting proposed
schemes through the planning system. To this end,
the following interventions are proposed:
1. Walsall – Stourbridge Freight Line
Freight train movements across the regional rail
network are focused on passing through central
Birmingham, adding pressure to the congested
mixed-use network. Additionally, freight trains
heading to or from the Metropolitan Area from
the southwest need to operate on the 1 in 37
Lickey Incline between Bromsgrove and Barnt
Green or via Old Hill Bank (1 in 51) between
Old Hill and Rowley Regis. Many freight services
that use these routes require the use of a banking
locomotive to provide assistance. This is both
expensive and time consuming making this less
attractive to existing and potential rail freight
users.
The ITA and Network Rail aspire to reopen the
Walsall – Stourbridge freight line to increase
freight capacity on the regional rail network.
Key benefits include:
•Through running freight trains will be
able to by-pass the congested central
Birmingham area network which will
shorten journey times and provide
increased route flexibility;
•Freight trains will be able to by-pass the
Lickey Incline / Old Hill providing improved
freight train operations;
•Providing additional train paths provide
capacity to cater for long term rail freight
growth projections;
•Providing improved access to Bescot
Yard improving freight train access to the
site and allowing the freight industry to
maximise Bescot’s strategic potential;
•Providing additional capacity to cater
for generated rail freight traffic from
the proposed Avonmouth deep-sea port
proposal in Bristol. Rail freight movements
north from the proposed deep sea port at
Portishead would use the Bristol – West
Midlands corridor which otherwise see rail
freight traffic entering the Metropolitan
Area at either Stourbridge or Barnt Green;
In addition to rail freight benefits, the ITA
has additional aspirations to develop an
infrastructure-sharing rapid transit scheme on the
corridor between Stourbridge and Walsall, which
further strengthens the proposal to reopen the
freight route.
A critical element of the Walsall-Stourbridge
freight route is ensuring that the alignment is
protected, along with identifying and protecting
suitable rail freight terminal sites within the
corridor. Local Authorities will safeguard the route
alignment and potential rail freight sites within
their Local Development Frameworks. The freight
route is outlined within the Joint Black Country
Core Strategy.
234Whilst beyond the scope of LTP3, the predicted
growth in rail freight by 2030 may also lead
to the need to reopen the Walsall – Lichfield
rail freight route. To this end, Walsall MBC
has protected the alignment within the Local
Development Framework process.
The ITA, Network Rail and rail freight operators
are developing the business case for Walsall-
Stourbridge scheme.
2. Network Resignalling
Enhanced Rail Freight Network capacity and
reliability can also be delivered through effective
use of the existing network. Network Rail has a
long term resignalling programme for the Area,
which will reduce headways, provide faster
and more reliable journeys. Network Rail is
proposing the following area network resignalling
programmes (which will include the outlined
minor schemes) during LTP3:
SALTLEY RESIGNALLING
•Doubling at Park Lane Junction to create
capacity
•Closer signal spacing on Sutton Park Line
and 3-aspect vice 2
•Ground Frame to become powered points
at Daw Mill to encourage east-bound
departures
•4-aspect signalling Nuneaton -
Birmingham
WALSALL RESIGNALLING
•Pleck run-round for Rugeley PS Coal traffics
to keep traffic from the congested Bescot
area (scheme also provides the north-end
connections at Pleck Junction which will be
required to facilitate reinstatement of the
Walsall - Stourbridge Line).
•Reconnecting Down Fast (through line) at
Walsall to create capacity
•Crossover at Mid-Cannock to be
reversed to provide a facing connection
to Pentalver’s intermodal terminal (not
currently a rail user but interested in
developing a rail service).
NEW STREET RESIGNALLING
•Albion direct route into terminal
proposed subject to EMR funding some
complementary works
STOURBRIDGE RESIGNALLING
•New ability to run-round using loop at
Kidderminster
•Recontrol Round Oak permitting greater
access to freight to the terminal and also a
moderate Line speed increase.
3. Long Term Network Enhancements
Within the lifetime of the time span of LTP3
(up to 2026), there will be a continuing need
to further enhance the Metropolitan Area rail
235network to accommodate passenger and freight
growth. In addition to those schemes listed above,
the following schemes have been identified
to improve freight movements on the broader
Metropolitan Area rail network. The ITA will work
with Network Rail and Local Authorities to develop
these and other potential schemes:
•Whitacre Chord
Current freight train movements into Birch
Coppice/ Kingsbury terminals from Harwich/
Felixstowe and the West Coast Main Line require
freight trains either to run round on the network
in the Saltley area or to route into the central
Birmingham area on to Walsall and back towards
Water Orton via the Sutton Park Line.
These ‘run-round’ procedures have significant
impacts to the local rail network and will need to
be addressed in order to provide additional rail
freight capacity at the terminals and also provide
the capacity to implement the ITA’s proposed new
local passenger rail service and stations between
Birmingham and Tamworth.
Network Rail has identified a potential solution
which would be the development of a rail
chord to the west of Whitacre Junction, to allow
freight trains to directly run into Kingsbury/ Birch
Coppice rather than needing to enter the Water
Orton corridor or central Birmingham. This
scheme is not developed or funded. It is located
in Warwickshire and would need the support of
Warwickshire County Council to develop further.
•Improved Access to Kingsbury Oil Depot
and Birch Coppice
Kingsbury Oil Terminal and Birch Coppice (both
accessed via the same connection at Kingsbury
Branch Junction) have the potential to cater for
a significant amount of the predicted future rail
freight growth. To facilitate this, there will be a
need to provide additional rail infrastructure to
achieve access to the terminals.
Currently, due to the absence of a facing
connection at Kingsbury, freight trains accessing
the sites from the north are required to propel
off the main line into Kingsbury Branch Sidings.
This is time consuming and limits capacity along
the Tamworth corridor. This issue will need to
be addressed in order to provide capacity for
predicted rail freight capacity growth at the
terminals and also provide network capacity
to implement the ITA’s proposed new local
passenger rail service and stations between
Birmingham and Tamworth.
A potential solution identified by Network Rail,
currently not developed or funded, would be
a new reception siding with a north facing
connection to take freight trains off the Tamworth
line before needing to reverse into the freight
terminal sites.

236Policy SF5 - Expanding Rail Freight Terminal
Capacity: To identify and encourage the
development of new rail freight terminals to
meet future growth requirements, especially
intermodal terminals to meet projected container
traffic growth
The Regional Logistics Study 2009 Update
report outlined that the Metropolitan Area
Region would require a forecasted 811 ha of
additional Regional Logistics Site (RLS). This
equates to between six and eight new rail served
Regional Logistics Sites. Rail freight terminal
growth pressures are projected to be focused on
providing rail freight terminal capacity to handle
shipping containers, maximising the opportunities
of the Walsall-Stourbridge freight route and;
providing the RSS recommended Regional
Logistics Centre in Cannock.
Currently there are 4 major intermodal freight
terminals which handle shipping containers
located within the geographic area of LTP3,
they are:
•Birch Coppice (BIFT) near Nuneaton –
operated by Roadways Container Logistics
•Lawley Street Freightliner Terminal
in central Birmingham – operated by
Freightliner
•Daventry International Railfreight Terminal
(DIRFT), near Crick, Northants – operated
by Malcolm Group
•Hams Hall National Distribution Park near
Water Orton – operated by ABP
The Metropolitan Area Regional Logistics Study
forecasts that between 7 and 9 new intermodal
terminals will be required across the Metropolitan
Area region by 2026. Given that there are
currently 4 active intermodal terminals in the
region (Hams Hall, Lawley Street, Daventry and
Birch Coppice), this suggests a need for 3 to 5
new intermodal terminals by 2026. Lawley Street
and Birch Coppice currently operate at near
capacity whilst the others listed have recorded
significant growth and will be operating at or near
capacity within the LTP3 period.
The proposed deep-sea port at Portishead in
Bristol, will add additional pressure for intermodal
freight terminal capacity to be developed in the
Metropolitan Area, which will also allow it to
take advantage of the economic and logistics
benefits the Portishead terminal will bring. As
rail freight traffic from Portishead would enter
the Metropolitan Area through the southeast
corridor at Stourbridge there is logic to investigate
potential rail freight terminals options along
the corridor in the Black Country. Such a site
would be suitably located to industrial areas,
the national road networks and also be able to
receive container traffic from Felixstowe, Harwich
and Southampton through the existing rail freight
network.
237In addition to any potential Intermodal Rail
Freight Terminal along the corridor, there is the
opportunity to identify and protect land adjacent
to the corridor, which could be used by businesses
that require rail freight access. This would attract
inward investment and create new employment
opportunities. LTP3 seeks to deliver the following
specific interventions:
1. Intermodal Rail Freight Terminals
To provide the future required intermodal rail
freight terminal capacity LTP3 proposes that Local
Authorities, the ITA, Network Rail and rail freight
operators work together to identify how long term
container capacity can be handle in the longer
term. Solutions include expanding existing sites or
identifying new sites and these will subsequently
need protecting through Local Development
Frameworks.
2. Rail Freight Terminal Opportunities:
Walsall – Stourbridge Corridor
The proposed Walsall – Stourbridge rail freight
route scheme outlined above provides the
opportunity for the Black Country to capitalise
on the attractiveness of the corridor for industrial
development and to optimise the economic
benefits of the scheme. The corridor offers
potential for a new intermodal rail freight
terminal/ Regional Logistics Site. Local Authorities,
the ITA and Network Rail will work together
to identify potential rail freight terminal sites
and protect them through Local Development
Frameworks.
The sites can be promoted to potential companies
who would have the security to invest and expand
in the Black Country.
3. Regional Logistics Sites
The Regional Spatial Strategy Phase 2 Revision
outlined that the West Midlands region needs to
identify 345 hectares of rail served warehousing
to meet future demands. Five Regional Logistics
Sites were subsequently identified of which the site
at Cannock is within the geographic area of LTP3.
Local Authorities, the ITA and Network Rail will
identify the rail freight requirements, rail network
impact and road access requirements of the site
to optimise the economic benefits the Pentalver’s
Cannock site and to mitigate any impacts.

238Air and Water Freight
A. Role of Air and Water Freight
The overwhelming majority of freight movements
are by road or rail. However, specialist and niche
freight movements also occur by Air and Water
and make an important contribution to logistics.
In the case of air freight such freight movements
support highly valuable, long distance or just
in time logistic movements providing access to
goods and markers which could not otherwise be
accessible, noticeably long haul destinations.
Despite the West Midlands being at the core
of inland waterways and be well connected via
a comprehensive canal network, Water based
freight is an underused mode of freight which has
the potential to make a significant contributions to
the freight sector, especially for non time limited
bulk material movements such as waste, whilst
potentially delivering lower carbon emissions for
movements compared to other modes.
Air and Water freight movements therefore both
have an important role in the freight sector
and have an important role in delivering LTP3
Strategy objectives especially towards supporting
economic growth.
B. Air and Water Freight Partners: Roles and Responsibility
West Midlands Freight Quality Partnership
The mix of stakeholders and previous successes
of the FQP means that the FQP is suitably placed
to support and lead on specific schemes and
initiatives delivery outlined in LTP3.
Integrated Transport Authority
The Local Transport Act (2008) placed
responsibility for strategic freight policy
with the ITA. The ITA is also responsible for
promoting freight schemes, in partnership with
stakeholders, which have Metropolitan wide
network implications or require a Metropolitan
perspective.
Local Authorities
Local Authorities, as Highway Authority, are
responsible for the promotion and delivery of
schemes that occur on the public highways as well
as working with air and water freight stakeholders
to develop and deliver local schemes and
initiatives.
British Waterways
British Waterways own and maintain the majority
of waterways and associated towpaths or bridges
across the UK including the canal network across
the metropolitan area.

239
Airports
Birmingham Airport is the regional gateway to
and from international destinations. There are
long term aspirations to expand airfreight capacity
via either freight only flights or haulage on
passenger flights. Future growth of freight activity
at Birmingham Airport will largely be dependent
upon the runway extension and the additional
long haul traffic flown in passenger belly-holds
that it will permit, although the use of just in time
manufacturing techniques and export growth is
also likely to encourage continued growth in pure
freight operations.
Freight Operators
Air and Water Freight operators are partners and
are crucial in identifying related problems and
developing solutions. Freight operators are invited
to attend the Freight Quality Partnership (FQP).
C. Progress and Successes from LTP2
West Midlands Canal Freight Studies
In 2006, the FQP led the development of two
studies into the potential application of canal
based freight movements in i) Birmingham and the
Black Country and ii) Coventry and Warwickshire.
The broad objectives of both studies were:
• The identification of general factors and
constraints that will influence the viability of
the carriage of freight on the West Midland
Waterways;
• Investigation of businesses and sites which
may make use of canal freight potential,
together with origins and destinations of
such traffic; and
• Identifying canal-side locations suitable for
economic development and new freight
facilities.
The two studies identified multiple locations within
the studies areas that could be developed into
canal wharfs for freight transfer (noting they are
not protected). However, canal freight relies on
the desire of businesses to locate near canals and
wish to take advantage of them over other forms of
freight movement.

240
KO1 Economy • Air freight allows businesses to make or receive high value goods;
• Air freight helps support the ‘just in time’ logistics delivery principle for
certain types of goods;
• Air freight allows businesses to access new and long distance markets
to trade with;
• As the centre of national water networks, increased levels of water
freight in the Metropolitan Area offers opportunities to attract new
economic investment;
KO2 Climate Change • Air freight carried by long haul flights direct to Birmingham Airport will
remove the need to transport goods from airports such as Manchester
or from the South East reducing Carbon emissions;
• Water freight is extremely carbon efficient and thus freight movements
transferred to water would be more carbon efficient than other
principal modes;
KO3 Health, Personal
Security and Safety
• Transfer from road freight to water freight would contribute towards
improved air quality;
KO4 Equality of
Opportunity
• Air freight allows access to goods and markets which might not
otherwise be accessible to businesses of the Metropolitan Area
supporting economic diversity;
KO5 Quality of
Life and Local
Environment
• Enhancements to waterways/ canals would also benefit leisure trips as
well as benefiting active travel trips such as walking and cycling
D. LTP3 Key Objective Alignment
241E. Major Influences on Water and Air Freight
An Integrated Sustainability Appraisal (ISA) has been undertaken to support the preparation of LTP3. This
includes an analysis of relevant plans, policies and programmes from international through to local level
and their implications for LTP3 Air and Water Freight.
F. LTP3 Policies – Water and Air Freight
Policy SF6 - Supporting Air Freight: To support
Air Freight reflecting its role in international
markets access, trading high value goods and
receiving ‘Just in Time’ goods whilst taking due
regard to associated impacts from air freight to
local residents and the environment
Air Freight plays an important role in the wider
movement of freight to and from the Metropolitan
Area and is important to the Area by providing the
ability for businesses to trade with international
destinations especially for high value goods or
time expired goods required via for ‘just in time’
logistics.
However, currently air freight contributes only
a small amount of the total amount of freight
moved in the Metropolitan Area, in 2009
just 15,000 tonnes of freight moved through
Metropolitan Area airports12 compared to 47.4M
tonnes carried via road or 2.1M tonnes by rail.
The limited ability for the Metropolitan Area to
handle long haul services, which is restricted by
runway and airport capacity constrains, means
that currently the majority of air based freight
that starts or is received in the Metropolitan Area
is transferred from airports such as Manchester
International Airport via road. The vast majority of
airfreight that does arrive in the Metropolitan Area
is ‘belly hold’ freight from passenger services.
Air travel currently accounts for 1.9% of transport
sourced carbon emissions13. Whilst a relatively
small amount, airfreight is a carbon intensive
form of freight transport compared to other
modes. However mitigating against airfreight
carbon emissions is not the role of LTP3 and must
be led by national or international guidance.
Instead environmental mitigation of airfreight
will focus upon noise, road traffic impacts and
impacts from night flights.
12 Source: Department for Transport “Regional Transport Statistics” (2009)
13 Source: Department for Transport “Low Carbon Transport - A Greener Future” (2009)
242Therefore, recognising the important role of
airfreight and the constraints to existing long
haul flights, Local Authorities will work with
freight operators and Airport owners to support
Air Freight during LTP3 taking due regard of
associated impacts from airfreight on local
residents and the environment. In order to support
the Air & Water Freight Strategy, and in addition
to schemes and initiatives developed during the
course of LTP3, the following specific intervention
is proposed:
1. Birmingham Airport Runway Extension
Birmingham Airport has planning permission
from Solihull MBC for a runway extension.
Future growth of freight activity at Birmingham
Airport will be largely dependent upon the
runway extension and the additional long haul
traffic flown in passenger aircraft belly-holds that
it will permit, although the use of just in time
manufacturing techniques and export growth is
also likely to encourage continued growth in pure
freight operations. The extension of the runway is
a Regional Transport Priority.
Policy SF7 - Supporting Water Freight: To
identify and support new concepts and initiatives
in developing further opportunities for water
based freight movements
Water freight has the potential to contribute to the
objectives and is currently an underused resource
across the Metropolitan Area. The principal
benefit of water freight is the low carbon emissions
compared to road or rail freight, which are 63%
lower than for road freight and 25% lower than
for rail freight14. At the same time, development of
water freight, especially on canals, is constrained
by canal locks and the wider quality of canals as
well as practical issues such as the low availability
of canal wharfs or the attractiveness to businesses
and organisation to use water freight in terms of
cost or journey speed.
Funding and statutory limitations placed on
British Waterways restrict their ability to finance
canal upgrades. However, as a principle British
Waterways’ policy is to promote the canal network
as a sustainable transport route and encourage
‘access for all’ which is expected to continue.
The Metropolitan Area two Freight Canals Studies
identified practical applications for water freight,
notably for the use of low value non time restricted
freight movements such as domestic waste or
construction aggregates, as well as multiple
locations within each study area that could be
developed into canal wharfs for freight transfer.
14 Source: Select Committee on Environmental Audit in April 2006

243Solutions to the practical issues would therefore
require private sector partnership to deliver
schemes. Therefore, Local Authorities will
work with freight operators and public/ private
organisations in identifying and delivering
innovative concepts and initiatives to develop
and increase water freight movements. In order
to support the Water Freight Strategy, and in
addition to schemes and initiatives developed
during the course of LTP3, the following principal
intervention is proposed:
1. Protecting Canal Wharfs
The two Metropolitan Area Canal Freight
strategies highlighted that whilst the majority
of canals routes themselves were available for
freight movements, it was the lack of existing or
potential waterside wharves which was hindering
water freight. The two studies identified 49 sites
in Birmingham and 27 sites in Coventry that
offered potential for wharf locations. However,
the majority are not protected for freight related
activity in land use plans.
This lack of land use planning protection is a major
inhibitor for businesses and organisations from
developing water freight proposals. Additionally,
waterside locations are desirable for residential
and commercial development meaning costs for
industrial development can be prohibitively high.
Local Authorities, through the Local Development
Framework process, will identify and protect water
wharf sites that offer potential to be used for water
freight purposes.

244LTT8: EFFECTIVE AND RELIABLE TRANSPORT INTEGRATION (TI)
244

245
A. Role of Park and Ride
The role of Park and Ride is to encourage transport users to take public transport for a significant part
of their journey. We recognise that the car is essential for a portion of the population in order to start
and finish their journey – but it need not be necessary for the whole journey, especially if they want to
access central areas where congestion exists. Park and Ride is attractive where it offers seamless journey
integration for the customer from their car onto public transport (see below – modal integration). Park
and Ride in LTP3 includes both rail- and bus-based initiatives.
Park and Ride can be split into two offerings:
(1) Local Park and Ride – where customers can use a relatively local car park to make their
onward journey, via their local rail or metro station or bus network
(2) Strategic Park and Ride – this will usually be a larger car park with a more frequent public
transport service. These are usually easily accessible to commuters travelling from outside of
the Metropolitan Area into its centres.
Park and Ride supports many LTP3 Objectives, including modal transfer, reducing congestion and
improving air quality.
Park & Ride
B. Partners: Roles and Responsibilities
Centro has a key role in Park and Ride:
•Centro promotes an integrated public
transport network, providing safe, secure,
generally free car parking at stations and
using Network West Midlands branding
– 6500 spaces at 37 rail stations and 3
Metro stops, with only 2 of these charging
customers;
•Centro develops and operates park and
ride sites and promotes cycling to rail
stations through station travel plans and
secure cycle parking provision.
The role of operators is to co-ordinate their
services to best promote integration where this
has benefits for customers.
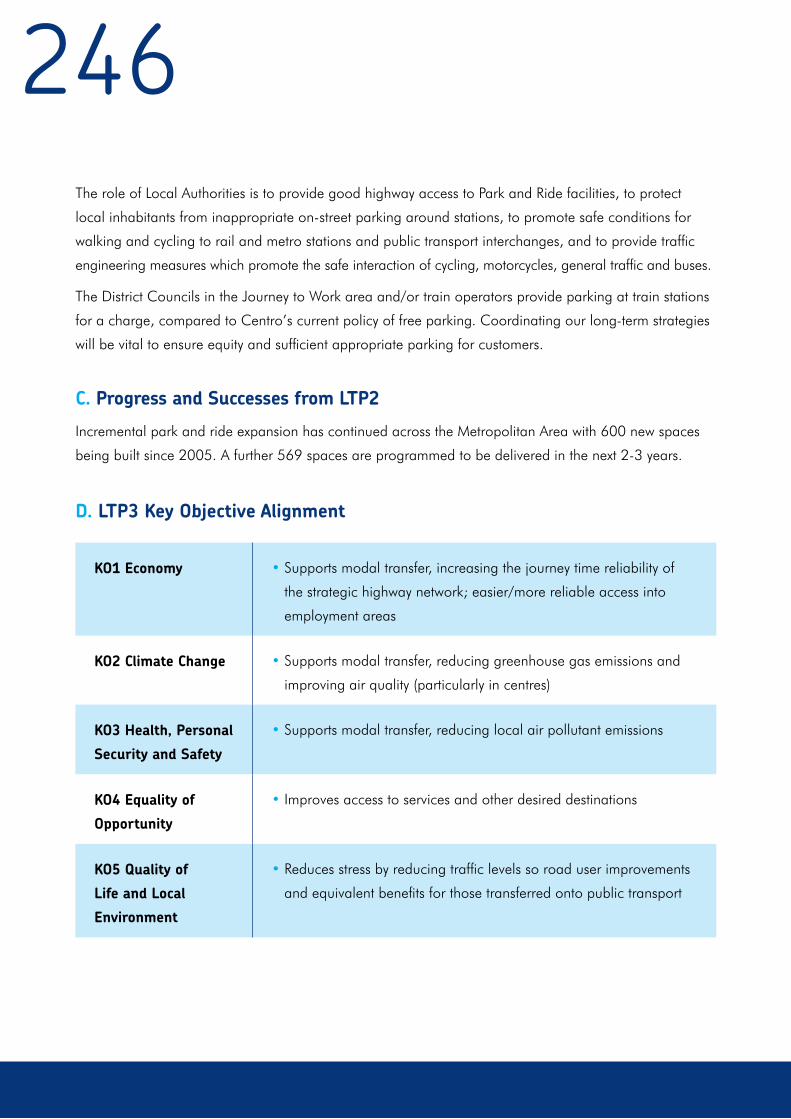
246The role of Local Authorities is to provide good highway access to Park and Ride facilities, to protect
local inhabitants from inappropriate on-street parking around stations, to promote safe conditions for
walking and cycling to rail and metro stations and public transport interchanges, and to provide traffic
engineering measures which promote the safe interaction of cycling, motorcycles, general traffic and buses.
The District Councils in the Journey to Work area and/or train operators provide parking at train stations
for a charge, compared to Centro’s current policy of free parking. Coordinating our long-term strategies
will be vital to ensure equity and sufficient appropriate parking for customers.
C. Progress and Successes from LTP2
Incremental park and ride expansion has continued across the Metropolitan Area with 600 new spaces
being built since 2005. A further 569 spaces are programmed to be delivered in the next 2-3 years.
D. LTP3 Key Objective Alignment
KO1 Economy • Supports modal transfer, increasing the journey time reliability of
the strategic highway network; easier/more reliable access into
employment areas
KO2 Climate Change • Supports modal transfer, reducing greenhouse gas emissions and
improving air quality (particularly in centres)
KO3 Health, Personal
Security and Safety
• Supports modal transfer, reducing local air pollutant emissions
KO4 Equality of
Opportunity
• Improves access to services and other desired destinations
KO5 Quality of
Life and Local
Environment
• Reduces stress by reducing traffic levels so road user improvements
and equivalent benefits for those transferred onto public transport
247E. Major Influences on LTP3
Centro Integrated Public Transport Prospectus
The Integrated Public Transport Prospectus sets
out the long-term vision for public transport
serving the Metropolitan Area. This vision is of a
4-tier network supported by integration measures,
including Park and Ride.
Park and ride development will take into account:
•Congestion benefits
•Frequency, capacity, and quality of the
public transport offer
•Environmental, design and traffic impact
•Potential for interchange with other public
transport services
•Implications for the wider public transport
network
Potential locations for park and ride sites serving
a strategic movement demand are identified in
the Prospectus. These potential locations are:
•Brinsford, north of Wolverhampton
•Worcester Parkway
•Bromsgrove
•Vicinity of M42, junction 3
•East of Shrewsbury
•Longbridge
•Vicinity of M5 junction 3
•North of Stratford-upon-Avon
•Telford
•Vicinity of Lichfield Trent Valley
•Vicinity of Kidderminster
•North Redditch
•Tamworth
•Castle Bromwich
Local Park and Ride also has a role to play for
short movements to local rail stations, Metro/
BRT stops and potentially some principal bus
corridors. Incremental expansion of local Park
and Ride facilities will continue where demand
exists and expansion is feasible – as above, 569
park and ride spaces are in the current capital
programme and due to be delivered within the
next 2-3 years. Further park and ride spaces
will continue to be added to build capacity and
encourage drivers to switch to rail and metro to
undertake their journeys.
Proposals for Strategic Park and Ride will be
considered against guidance in PPG2: Green
Belts if necessary and measures will be taken to
ensure that residents in the vicinity of Park and
Ride are not adversely afftected by light and noise
pollution; planting and landscaping will also
be incorporated as necessary so as to reduce
adverse visual impacts and enhance biodiversity.
F. LTP3 Policies
Policy TI1 – Strategic Park and Ride: To
develop strategic Park and Ride capacity
at appropriate locations to serve strategic
movement demands
Policy TI2 - Local Park and Ride: To develop
increased local Park and Ride capacity
appropriate to meeting local demand

248Public Transport Information and Modal Integration
A. Role of Public Transport Information and Modal Integration
i Public Transport Information
The role of public transport information is to
improve the experience of existing users and help
generate increased public transport use. This is
to help achieve wider LTP3 Objectives associated
with social inclusion and modal transfer. Public
transport information is an important tool
for improving integration of public transport,
delivered through the “Network West Midlands”
brand. A more integrated public transport system
allows wider journey possibilities and thus helps
increase public transport use.
ii. Modal Integration
Modal integration is defined as
• Integration of public transport services and
modes: bus, BRT, Metro, rail (interchanges,
integrated ticketing)
•Integration of car use and public transport
modes (Park and Ride)
•Integration of walking and public transport
modes
•Integration of cycling and public transport
modes (cycle and ride)
•Integration of taxis and public transport
modes
•Integration of motorcycles and public
transport modes
The role of modal integration is to increase public
transport use for people without access to a car
and to reduce some car mileage at congested
times without reducing people’s accessibility.
This is through journeys being comprised of
suitable services or modes for different legs of the
journeys. Modal integration will thus help achieve
wider LTP3 Objectives associated with modal
transfer.
B. Partners: Roles and Responsibilities
i Public Transport Information
Public transport information in the Metropolitan Area is provided through the “Network West Midlands”
brand. This is delivered through partnership working between bus, rail and metro operators and Centro.
249Supporting information sources are Traveline and
operators’ own websites and printed materials.
The role of Centro is to co-ordinate Network
West Midlands information provision. Centro
is responsible for the Network West Midlands
website and information provision at all 13,000
bus stops in the Metropolitan Area. This covers
printed information and real time information.
The role of bus operators is to supply Centro with
up-to-date information and fund provision. Rail
and Metro operators provide printed and real
time information for rail and metro services at
stations and stops.
ii. Modal Integration
Centro performs several modal integration roles:
•Promotes the presentation of an integrated
public transport network through Network
West Midlands branding.
•Develops and maintains small on-street
interchanges, bus-rail interchanges and
bus stations.
•Provides multi-modal and multi-operator
ticketing through the Network West
Midlands brand and is developing
smartcard in partnership with operators.
•Develops and operates park and ride
sites and promotes cycling to rail stations
through station travel plans and secure
cycle parking provision.
The role of operators is to co-ordinate their
services to best promote integration where this
has benefits for customers.
The role of Districts is to promote safe conditions
for walking and cycling to rail stations and public
transport interchanges and to provide traffic
engineering measures which promote the safe
interaction of cycling, motorcycles, general traffic
and buses. Districts also have an important role
to play with taxi stand provision at public transport
facilities and taxi/private hire vehicle licensing.
C. Progress and Successes from LTP2
Successes
i Public Transport Information
Network West Midlands (NWM)
Public transport information has been transformed
over the last few years. Prior to this had been
fragmented information provision, which had
been a deterrent to using public transport.
NWM was launched in 2006 as the unified,
customer-facing brand for the public transport
system across the conurbation. Its introduction
represented a clear response to providing what
customers required from their public transport
network, an integrated approach to providing all
public transport information. In 2009, the NWM
concept was extended to represent all forms of
sustainable travel, including walking, cycling and
car sharing.
250In partnership with the regional TravelWise group
it now includes our Smarter Choices work. This
development represents our commitment to an
integrated approach to transport in the region.
NWM has delivered major improvements in
passenger information including:
•A cohesive multi-modal brand identity
across all infrastructure, ticketing, signage,
Travel Shops, passenger information and
campaign publicity.
•Comprehensive passenger information at
more than 13,000 bus stops, shelters and
interchanges.
•New bus poles, shelters, information
points, refurbished bus stations and
improved signage.
•New computer systems to enable bus
services to be translated into customer
friendly on-street information.
•The significant roll out of Real Time
Information at all rail stations, Metro stops
and key bus stops.
•Interactive multi-modal mapping, real time
information and journey planning tools on
the web.
•Journey planning tools and real time
information via digital TV and mobile devices.
•Simple multi-operator printed timetables.
•Broadcast brand awareness campaigns
including TV, and door drops to 1.2 million
households.
ii. Modal Integration
LTP2 has seen implementation of a new bus
station at Halesowen and current construction of
a new Wolverhampton interchange.
Smartcard is currently being rolled out across the
Metropolitan Area, with initial use being for OAPs
concessionary passes.
Incremental Park and Ride expansion has
continued across the Metropolitan Area with 600
new spaces being built since 2005.
The Kings Norton Station travel plan pilot has
been implemented, with wider roll out of the
initiative planned.
Birmingham City Council has trialled the use of bus
lanes by Powered Two Wheelers and, in light of the
trials results, made the arrangements permanent.
Committed Schemes
i Public Transport Information
Information improvements programmed include
increased use of real time digital information, new
media technology and website development.
ii. Modal Integration
Smartcard is currently being rolled out across the
Metropolitan Area and is a committed Centro
capital scheme.
Park and ride expansion at selected rail stations is
also committed within Centro’s budgets, including
expansion at Tile Hill.
A new bus interchange at Stourbridge is a
committed scheme in Centro’s capital programme.
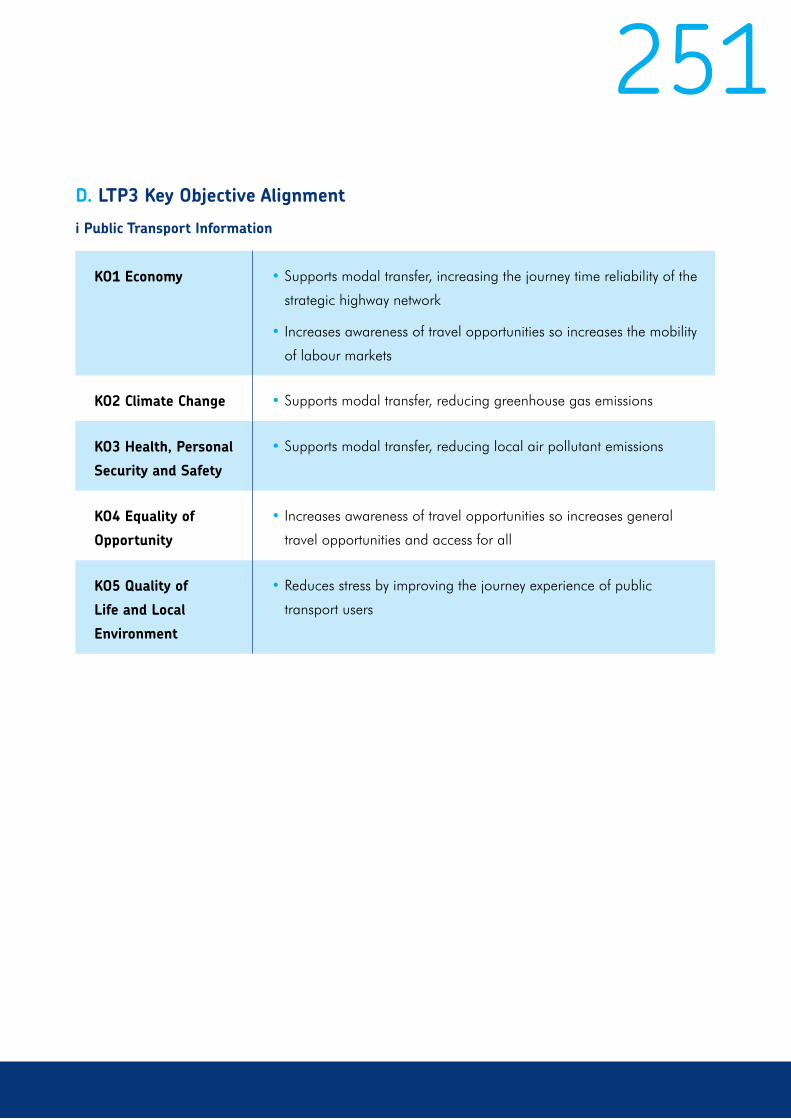
251D. LTP3 Key Objective Alignment
i Public Transport Information
KO1 Economy •Supports modal transfer, increasing the journey time reliability of the
strategic highway network
•Increases awareness of travel opportunities so increases the mobility
of labour markets
KO2 Climate Change •Supports modal transfer, reducing greenhouse gas emissions
KO3 Health, Personal
Security and Safety
•Supports modal transfer, reducing local air pollutant emissions
KO4 Equality of
Opportunity
•Increases awareness of travel opportunities so increases general
travel opportunities and access for all
KO5 Quality of
Life and Local
Environment
•Reduces stress by improving the journey experience of public
transport users
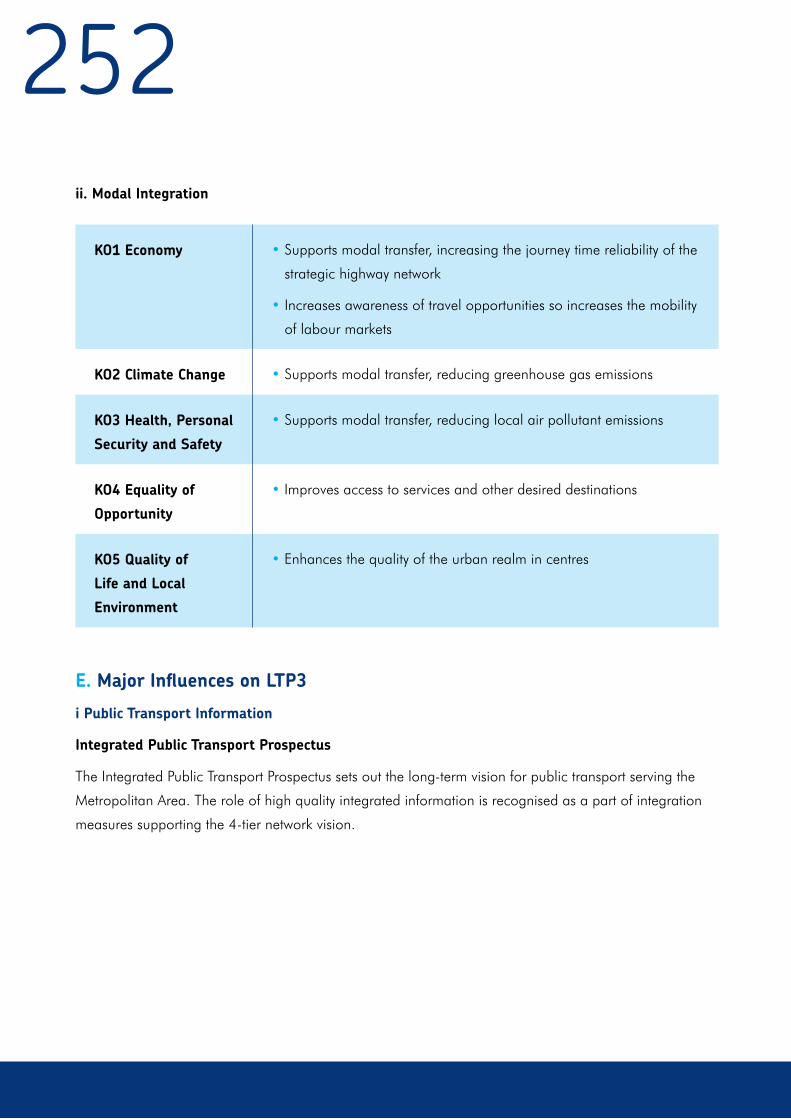
252
KO1 Economy •Supports modal transfer, increasing the journey time reliability of the
strategic highway network
•Increases awareness of travel opportunities so increases the mobility
of labour markets
KO2 Climate Change •Supports modal transfer, reducing greenhouse gas emissions
KO3 Health, Personal
Security and Safety
•Supports modal transfer, reducing local air pollutant emissions
KO4 Equality of
Opportunity
• Improves access to services and other desired destinations
KO5 Quality of
Life and Local
Environment
• Enhances the quality of the urban realm in centres
ii. Modal Integration
E. Major Influences on LTP3
i Public Transport Information
Integrated Public Transport Prospectus
The Integrated Public Transport Prospectus sets out the long-term vision for public transport serving the
Metropolitan Area. The role of high quality integrated information is recognised as a part of integration
measures supporting the 4-tier network vision.
253Integrated Passenger Information Strategy
Centro is currently developing its latest Integrated
Passenger Information Strategy. This will be a key
driver of further information improvements, based
on 10 principles:
1. Providing integrated, comprehensive and
accurate information
2. Delivering digital information “pre-trip”
3. Delivering digital information “on the
move”
4. Offering personalised travel information
5. Providing on vehicle information
6. Delivering information in person
7. Delivering help yourself services
8. Improved signage and way finding
9. Enhancing information at interchanges,
visitor attractions and businesses
10. Information for all
ii. Modal Integration
Integrated Public Transport Prospectus
The Integrated Public Transport Prospectus sets
out the long-term vision for public transport
serving the Metropolitan Area.
F. LTP3 Policies
i Public Transport Information
Policy TI3 - Public Transport Information: To
ensure high quality information is accessible
to all about public transport services covering
before, during and after a journey
ii. Modal Integration
Policy TI4 - Modal Integration: To develop
seamless integration between all types of
transport modes with focus upon high quality
public transport interchanges
254Taxis & Private Hire Vehicles
A. The Role of Taxis (Hackney Carriages) and Private Hire Vehicles (PHVs)
Taxis (Hackney Carriages) and Private Hire Vehicles (PHVs) perform an important role within an integrated
transport policy, by providing personalised public transport for individuals or small groups who arrive
by air, rail or coach and need to travel on to their ultimate destination. This is particularly significant in
relation to travel to local businesses or to conferences and other major events. Taxis and PHVs can seat
no more than eight passengers. Stretched limousines and other speciality vehicles may, subject to their
seating capacity, be licensed as PHVs.
There are clear differences between the way taxis and PHVs can offer their services to the public.
Taxis can be hailed on street and can wait for customers at designated taxi ranks, and can also carry
customers who have pre-booked, usually by telephone. PHVs can only carry customers who have pre-
booked, usually by telephone but customers may also go to the PHV company’s office. The advent of
mobile telephones enables customers to pre-book a taxi or a PHV from anywhere and there can be
instances of PHVs allegedly plying for hire on street and then asking the customer to telephone to make
the booking. This and other illegal practices can cause tension between taxi and PHV drivers and can
also affect the customer’s safety since the PHV’s insurance may be invalid or the vehicle or driver may not
be properly licensed.
The provision of taxi ranks, and availability of taxis at all reasonable times, at railway stations, main
coach stopping places, major event venues and in town and city centres is an important factor in the way
taxis serve the public. This is a particularly difficult issue in busy locations where there is competition with
other vehicles for kerb-side access. This is exacerbated by the increased number of taxis following the
removal of restrictions on the number of licences issued by the Authorities.
Taxis and PHVs provide publically available transport services at times when it is not economic for
conventional public transport to operate frequently or to or from locations too remote for adequate bus
or rail services. This helps improve personal accessibility and/or supports the nighttime economy both for
employers and customers.

255People who do not have access to a car often make use of taxis and PHVs; it is not unusual to take a bus
to a town or shopping centre and then use a taxi or PHV for the return trip with the shopping. A report by
the Office for Fair Trading (November 2003) found that; “on average, people in the lowest 20 per cent
of incomes use taxis and PHVs 40 per cent more often than those in the highest 20 per cent.”
Additionally, taxis and PHVs are used by vulnerable travellers (for example, unaccompanied children)
for a range of daily trips, including home-to-school journeys. By accommodating people in wheelchairs,
taxis can help contribute towards the personal accessibility of people with mobility difficulties. The same
OFT report also found that: “Taxis and PHVs are used more frequently by disabled people (67 per cent
more) than non disabled people.”
Taxis and PHVs may have negative effects on congestion and local and global emissions as their
journeys can often be twice the length of the actual passenger trip, by having to go empty to collect the
customer or return empty. This is especially so for journeys that cross Metropolitan District (licensing area)
boundaries since taxis are not permitted to ply for hire outside their licensing area. This may not be always
the case with PHVs or taxis that are using a central control booking system that enables them to move
from one job to another with less ‘dead’ mileage. The following tables show the numbers of licensed
Taxis & PHVs and the number of taxi ranks and the principal locations within each Metropolitan District.
Note: * Driver numbers include 187 who hold both licences (counted in both totals)
** Driver numbers include 343 who hold both licences (counted in both totals)
Licensing Authority Hackney Carriages Private Hire Vehicles
Vehicles Drivers Vehicles Drivers
Birmingham 1,465 5,562
Coventry 741 1,024 155 186
Dudley 252 473 461 769
Sandwell (*) 114 219 959 1,318
Solihull 234 218 1,422 1,615
Walsall (**) 128 382 625 1,339
Wolverhampton 144 270 579 1,039
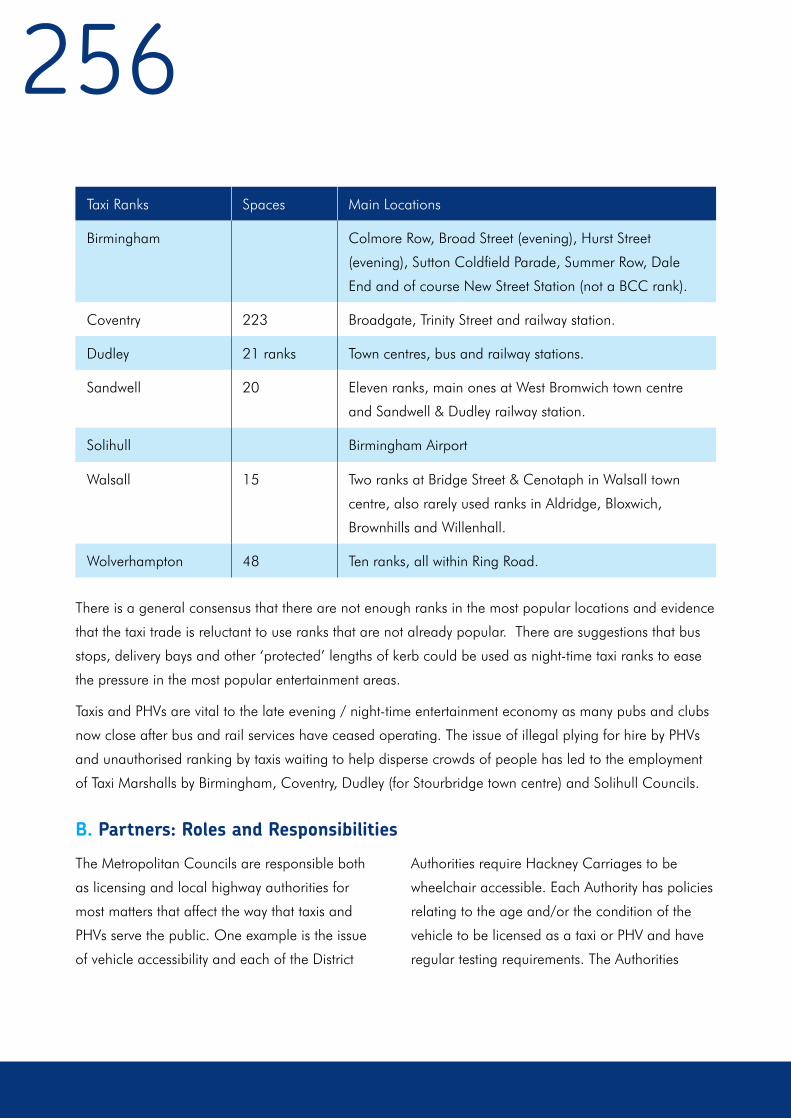
256
There is a general consensus that there are not enough ranks in the most popular locations and evidence
that the taxi trade is reluctant to use ranks that are not already popular. There are suggestions that bus
stops, delivery bays and other ‘protected’ lengths of kerb could be used as night-time taxi ranks to ease
the pressure in the most popular entertainment areas.
Taxis and PHVs are vital to the late evening / night-time entertainment economy as many pubs and clubs
now close after bus and rail services have ceased operating. The issue of illegal plying for hire by PHVs
and unauthorised ranking by taxis waiting to help disperse crowds of people has led to the employment
of Taxi Marshalls by Birmingham, Coventry, Dudley (for Stourbridge town centre) and Solihull Councils.
B. Partners: Roles and Responsibilities
The Metropolitan Councils are responsible both
as licensing and local highway authorities for
most matters that affect the way that taxis and
PHVs serve the public. One example is the issue
of vehicle accessibility and each of the District
Authorities require Hackney Carriages to be
wheelchair accessible. Each Authority has policies
relating to the age and/or the condition of the
vehicle to be licensed as a taxi or PHV and have
regular testing requirements. The Authorities
Taxi Ranks Spaces Main Locations
Birmingham Colmore Row, Broad Street (evening), Hurst Street
(evening), Sutton Coldfield Parade, Summer Row, Dale
End and of course New Street Station (not a BCC rank).
Coventry 223 Broadgate, Trinity Street and railway station.
Dudley 21 ranks Town centres, bus and railway stations.
Sandwell 20 Eleven ranks, main ones at West Bromwich town centre
and Sandwell & Dudley railway station.
Solihull Birmingham Airport
Walsall 15 Two ranks at Bridge Street & Cenotaph in Walsall town
centre, also rarely used ranks in Aldridge, Bloxwich,
Brownhills and Willenhall.
Wolverhampton 48 Ten ranks, all within Ring Road.
257also have strict policies concerning the issue
of licences to taxi and PHV drivers with checks
relating to driving and criminal records. However,
many precise requirements for drivers and
vehicles vary between the Districts.
As local highway authority, Local Authorities have
to balance demand for kerb-space in trying to
accommodate the taxi trade’s continuing demand
for more ranks or more space at existing ones.
Another issue is access to bus lanes by PHVs.
Generally, taxis are allowed in bus lanes across
the seven District areas but PHVs are excluded,
primarily for enforcement and recognition reasons.
There is strong pressure from PHV operators to
be allowed to use bus lanes, but this can lead to
opposition by taxi and bus operators. From a wider
perspective, in some areas the concentration of
taxis and PHVs is such that their use of bus lanes
has the potential to disrupt bus services, whilst in
others there is spare capacity. Whilst this might
suggest a site-specific approach to the issue,
this has the potential to cause confusion both
amongst drivers and enforcement officers.
Centro, as the integrated transport authority, has
a minor role through the contracting of socially
necessary local bus and associated services. One
example of the latter is the ‘Heart of England
Taxibus’ that operates in the rural part of the
Metropolitan Area between the M42 and A45 (the
Meriden Gap) during daytime hours, Mondays
to Saturdays. It links residents of this area with
Berkswell, Dorridge and Hampton-in-Arden
Stations and other locations within its operating
area and with Birmingham International,
Coventry, Marston Green, Solihull and Tile Hill
Stations just beyond.
The Metropolitan District Councils, as local
education and personal social services authorities,
have a significant interest in both taxis and PHVs –
frequently using then for client transport purposes,
including the transport of vulnerable people.
Centro also has a role at railway stations and
public transport interchanges to ensure that there
are adequate facilities for taxis to wait on ranks
and for PHVs to pick up pre-booked customers.
C. Progress and Successes from LTP2
The establishment of the West Midlands
Neighbouring Authorities Working Group
(subsequently re-named the Regional Taxi Licensing
Forum) gives licensing officers opportunities
to meet regularly and share best practice with
speakers inviting to discuss specific issues.
The licensing authorities have responded to the
Government’s wish to see restrictions on taxi
numbers relaxed or abandoned. It may be easier
now to find a taxi, especially at popular town and
city centre ranks, but the increased numbers (which
sometimes has been just a transfer from a PHV to
taxi licence) has led to severe over-crowding at the
most popular ranks, sometimes causing congestion
to other traffic. Birmingham City Council is re-
introducing a restriction on the number of Hackney
Carriage licences that it will issue.
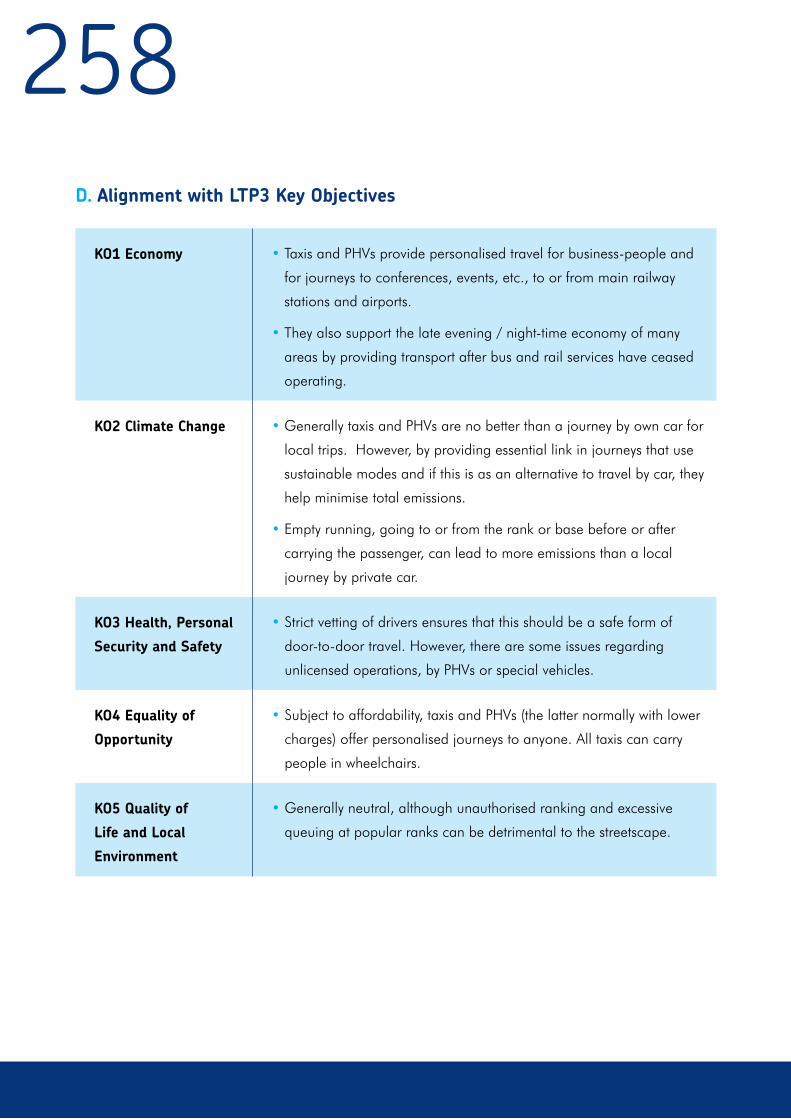
258
KO1 Economy • Taxis and PHVs provide personalised travel for business-people and
for journeys to conferences, events, etc., to or from main railway
stations and airports.
• They also support the late evening / night-time economy of many
areas by providing transport after bus and rail services have ceased
operating.
KO2 Climate Change • Generally taxis and PHVs are no better than a journey by own car for
local trips. However, by providing essential link in journeys that use
sustainable modes and if this is as an alternative to travel by car, they
help minimise total emissions.
• Empty running, going to or from the rank or base before or after
carrying the passenger, can lead to more emissions than a local
journey by private car.
KO3 Health, Personal
Security and Safety
•Strict vetting of drivers ensures that this should be a safe form of
door-to-door travel. However, there are some issues regarding
unlicensed operations, by PHVs or special vehicles.
KO4 Equality of
Opportunity
•Subject to affordability, taxis and PHVs (the latter normally with lower
charges) offer personalised journeys to anyone. All taxis can carry
people in wheelchairs.
KO5 Quality of
Life and Local
Environment
•Generally neutral, although unauthorised ranking and excessive
queuing at popular ranks can be detrimental to the streetscape.
D. Alignment with LTP3 Key Objectives

259E. Policy Context for LTP3
The licensed taxi and PHV market is highly
regulated. The regulations fall into four broad
categories: - quantity, quality, fares and drivers.
The licensing authorities have the ability to limit
the supply of taxis by imposing a cap on the
number of licences for taxi vehicles, but not for
PHVs. They also have powers relating to the
quality and safety of taxi and PHV vehicles with
regular inspection and testing regimes. Drivers are
assessed as to their suitability, including Criminal
Record Bureau checks. The authority determines
Hackney Carriage fares. The District Councils, as
local highway authority, are responsible for the
provision of taxi ranks for Hackney Carriages.
The Transport Act, 1985, required licensing
authorities not to restrict the issue of Hackney
Carriage ‘plates’ unless there was evidence that
there was no unmet demand in the relevant area.
This was a first step towards freeing the previously
restricted taxi market. In November 2003, the
Office for Fair Trading published a report ‘The
regulation of licensed taxi and PHV services in the
UK’ recommending that the quality restrictions be
lifted and that the quality and fares regulations be
reviewed in order to stimulate competition and,
thus, provide a better service to the public.
The Parliamentary Transport Select
Committee considered the OFT’s report and
recommendations and published their report
‘The Regulation of Taxis and Private Hire Vehicle
Services in the UK’ in February 2004. On the
main matter of whether or not taxi numbers
should be controlled by the Local Authority, the
Committee stated that; “we would expect far
more compelling evidence of market failure than
that produced by the OFT before local discretion
was removed. Our investigation has convinced
us that the Office of Fair Trading study is partial,
doctrinaire, sloppily conducted and does not
provide sufficient evidence to support any change
in the law which reduces local discretion”. The
Committee decided that the recommendations
on quantity control should be rejected.
The Government responded to the Select
Committee’s report in March 2004, setting out
what was described as an action plan, as follows:
•The removal of restrictions on the number
of taxi licenses that can be issued by a
licensing authority (except where removal
of such restrictions would lead to a
significant consumer detriment as a result
of local conditions);

260•The need to maintain quality in taxi and
private hire vehicle service provision,
particularly in relation to securing the
safety of the general public;
•The identification of maximum rather
than minimum fare levels, in order to
protect vulnerable consumers and allow
users to negotiate lower fares in certain
circumstances; and
•The need to establish single licensing
areas, in order to bring greater clarity to
areas where multiple zones exist.
In LTP2 Guidance, the Department for Transport
asked that LTPs “should be prepared in a way that
incorporates and explains local policies relating
to taxi and private hire vehicle services and should
specifically include explanations or justifications
of any restrictions imposed on the number of
licences by authorities in the LTP area”. The latter
part of this guidance actually relates to Hackney
Carriages, inasmuch that authorities have never
had the power to restrict the number of PHV
licences. This advice was taken to indicate
Government’s wish that authorities stop restricting
the issue of Hackney Carriage licences and the
Metropolitan Districts reacted accordingly.
F. LTP3 Policies for Hackney Carriages and Private Hire Vehicles
Policy TI5: To help ensure that taxis and PHVs
can continue to play a role in an integrated
transport offer to residents, visitors and
businesses in the Metropolitan Area
Policy TI6: To develop an integrated approach
to restrictions on access to bus lanes across the
Metropolitan Area

261

262LTT9: IMPROVED SAFETY AND SECURITY (SS)
262
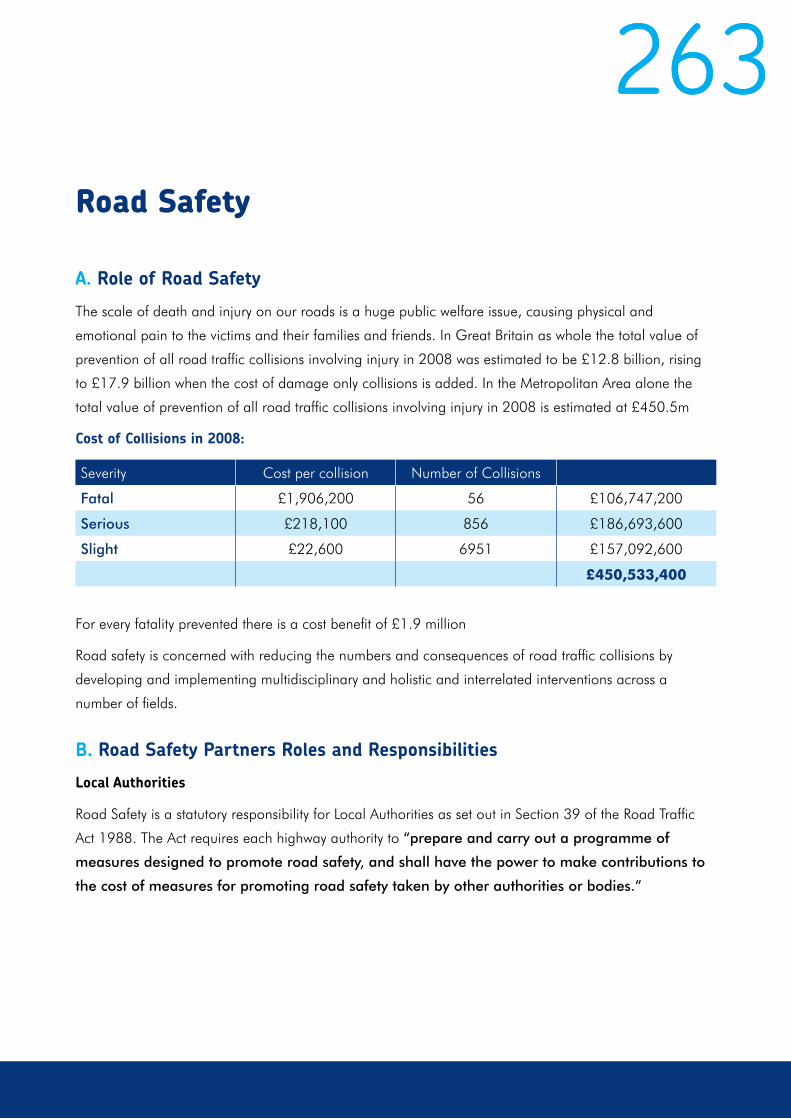
263
A. Role of Road Safety
The scale of death and injury on our roads is a huge public welfare issue, causing physical and
emotional pain to the victims and their families and friends. In Great Britain as whole the total value of
prevention of all road traffic collisions involving injury in 2008 was estimated to be £12.8 billion, rising
to £17.9 billion when the cost of damage only collisions is added. In the Metropolitan Area alone the
total value of prevention of all road traffic collisions involving injury in 2008 is estimated at £450.5m
Cost of Collisions in 2008:
For every fatality prevented there is a cost benefit of £1.9 million
Road safety is concerned with reducing the numbers and consequences of road traffic collisions by
developing and implementing multidisciplinary and holistic and interrelated interventions across a
number of fields.
B. Road Safety Partners Roles and Responsibilities
Local Authorities
Road Safety is a statutory responsibility for Local Authorities as set out in Section 39 of the Road Traffic
Act 1988. The Act requires each highway authority to “prepare and carry out a programme of
measures designed to promote road safety, and shall have the power to make contributions to
the cost of measures for promoting road safety taken by other authorities or bodies.”
263Road Safety
Severity Cost per collision Number of Collisions
Fatal £1,906,200 56 £106,747,200
Serious £218,100 856 £186,693,600
Slight £22,600 6951 £157,092,600
£450,533,400
264Police
The Roads Policing Strategy issued jointly by
the Association of Chief Police Officers, Home
Office and Department for Transport forms part
of the delivery of the National Policing Plan and
establishes as one of the actions ‘reducing road
casualties’.
Fire and Rescue Service
The Fires and Rescue Services Act 2004
recognised the broader role of the Fire and
Rescue Service and gave legal basis for
partnership arrangements to assist an authority
in discharging its responsibilities for dealing with
road traffic collisions and other emergencies.
Highways Agency
The Highways Agency is responsible for
operating, maintaining and improving the
strategic road network (motorways and major A
roads) in England.
Ambulance Service and hospital emergency
departments.
Effective treatment of casualties at the site of
road traffic collisions and in hospital emergency
departments.
Voluntary Sector and Campaign groups
Organisations such as RoSPA and Institute of
Advanced Motorists have a role in engaging with
all road users and promoting safer road use for all.
West Midlands Road Safety Partnership
In April 2007 the Government introduced Road
Safety Grant, and integrated funding for safety
cameras into the LTP system alongside other road
safety measures. This gave Local Authorities,
the police and other agencies greater flexibility
to pursue a locally agreed mix of road safety
measures. As a consequence, the West Midlands
Safety Camera Partnership was dissolved and
the West Midlands Road Safety Partnership was
formed with a much wider remit.
Membership of the West Midlands Road Safety
Partnership Board is predominately elected
Councillors from the seven Local Authorities along
with representatives of the police authority and
fire and rescue authority. Representation from the
Highways Agency, Her Majesty’s Courts Service
and strategic health authority is also invited. The
elected members ensure there is a democratic
mandate for The Board’s activities.
The Board is supported and advised by a
Technical Officers Group, made up of responsible
officers from the partner organisations who advise
on policy, and implementation. The tasks of the
Partnership Board are to:
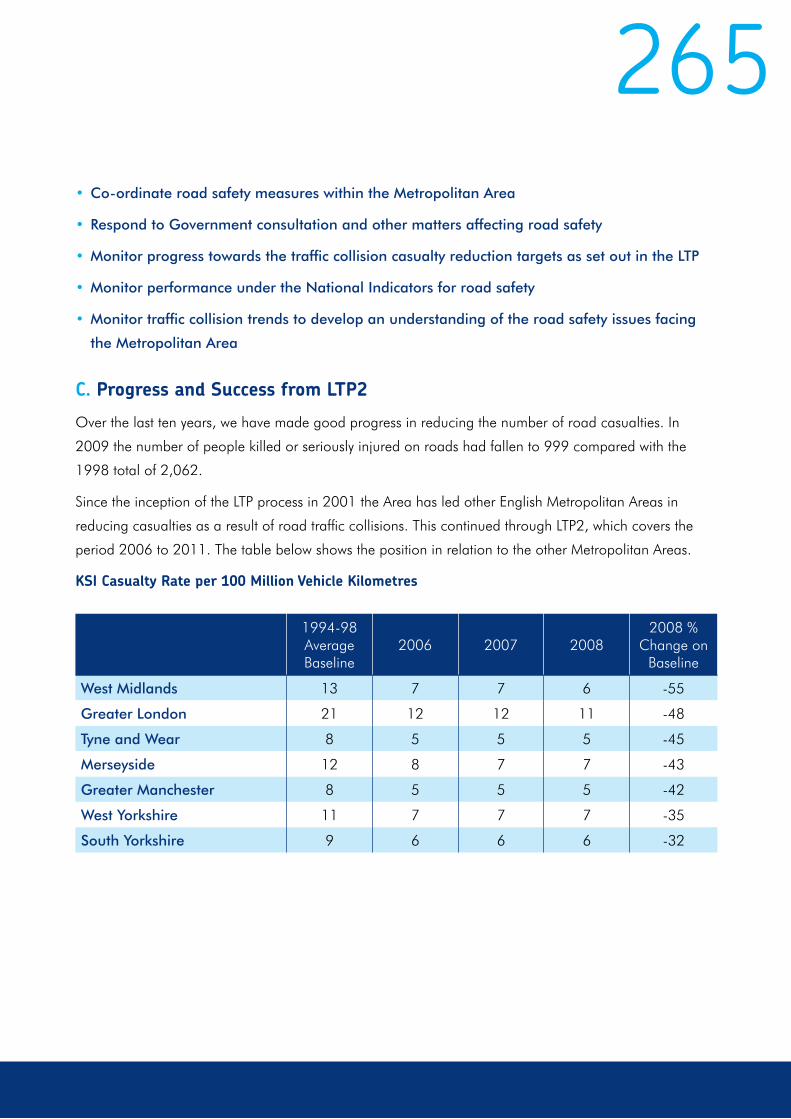
265•Co-ordinate road safety measures within the Metropolitan Area
•Respond to Government consultation and other matters affecting road safety
•Monitor progress towards the traffic collision casualty reduction targets as set out in the LTP
•Monitor performance under the National Indicators for road safety
•Monitor traffic collision trends to develop an understanding of the road safety issues facing
the Metropolitan Area
C. Progress and Success from LTP2
Over the last ten years, we have made good progress in reducing the number of road casualties. In
2009 the number of people killed or seriously injured on roads had fallen to 999 compared with the
1998 total of 2,062.
Since the inception of the LTP process in 2001 the Area has led other English Metropolitan Areas in
reducing casualties as a result of road traffic collisions. This continued through LTP2, which covers the
period 2006 to 2011. The table below shows the position in relation to the other Metropolitan Areas.
KSI Casualty Rate per 100 Million Vehicle Kilometres
1994-98Average Baseline
2006 2007 20082008 %
Change on Baseline
West Midlands 13 7 7 6 -55
Greater London 21 12 12 11 -48
Tyne and Wear 8 5 5 5 -45
Merseyside 12 8 7 7 -43
Greater Manchester 8 5 5 5 -42
West Yorkshire 11 7 7 7 -35
South Yorkshire 9 6 6 6 -32

266
Killed and Seriously Injured
The 40% reduction on 1994-98 average by 2010
was achieved in 2003. A more stretching target
of a further 30% reduction on the 2002-2004
average compared with the 2008-10 average
was set in 2006. Progress against the stretching
target has been more challenging. The number
of KSIs in 2009 was 999 compared with the
2002-04 baseline of 1,149. The number of
fatalities in 2009 was 73 which compared with
the 1994-98 average 101 indicates that fatalities
have fallen by less rapidly. This represents a 30%
reduction in fatalities compared with a 52% fall in
KSIs since the 1994-98 baseline.
However despite this progress, 73 people died on our roads in 2009.
In 2000 the Department for Transports road safety strategy ‘Tomorrow’s Roads – Safer for Everyone’ set
three national casualty reduction targets to be achieved by 2010 based on the 1994-1998 average.
They were:
•A 40% reduction in the number of people killed or seriously injured (KSI)
•A 50% reduction in the number of children killed or seriously injured
•A 10% reduction in the number of people slightly injured
Child Killed and Seriously Injured
The 50% reduction on 1994-98 average by 2010
was achieved by 2005. A more stretching target
of a further 35% reduction on the 2002-2004
average compared with the 2008-10 average
was set in 2006.
In 2009 the number of Child KSIs was 165, a
reduction of 61% from the 1994-98 baseline and
24% reduction on the 2002-04 baseline.
Slight Casualties
A 10% reduction between 2004 and 2010 was
achieved in 2008 and continued to show a
downward trend.
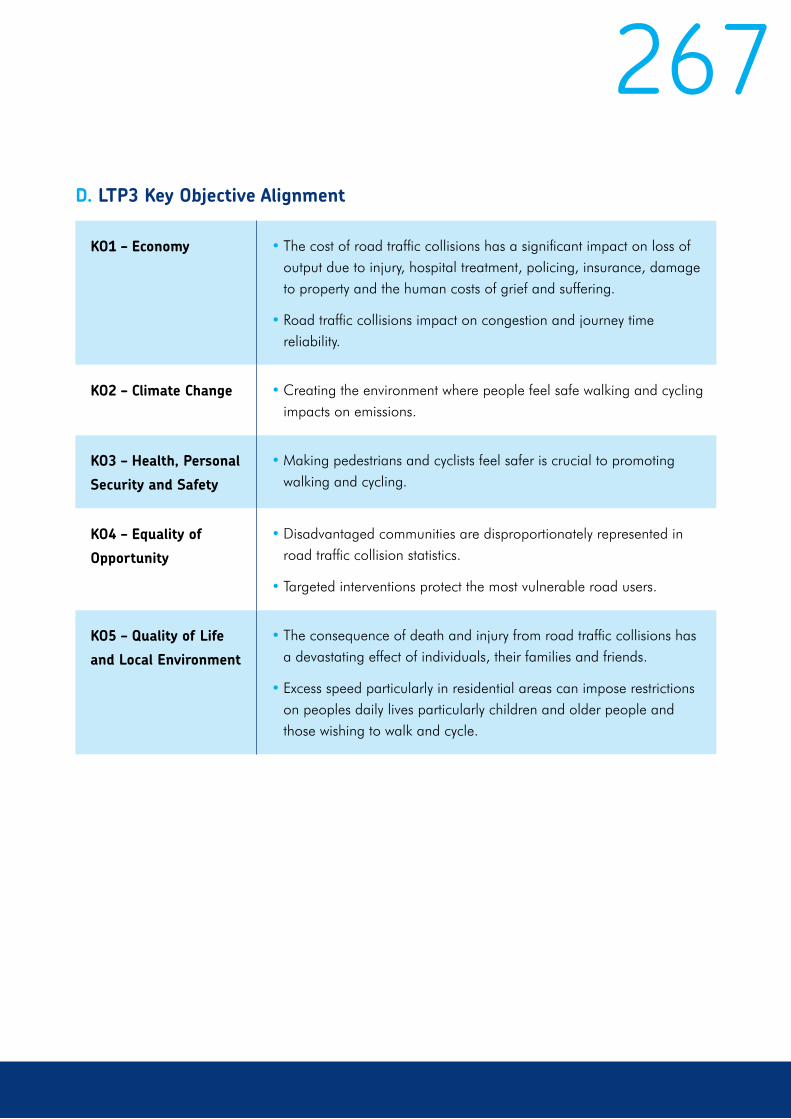
267D. LTP3 Key Objective Alignment
KO1 – Economy • The cost of road traffic collisions has a significant impact on loss of output due to injury, hospital treatment, policing, insurance, damage to property and the human costs of grief and suffering.
• Road traffic collisions impact on congestion and journey time reliability.
KO2 – Climate Change • Creating the environment where people feel safe walking and cycling impacts on emissions.
KO3 – Health, Personal
Security and Safety
• Making pedestrians and cyclists feel safer is crucial to promoting walking and cycling.
KO4 – Equality of
Opportunity
• Disadvantaged communities are disproportionately represented in road traffic collision statistics.
• Targeted interventions protect the most vulnerable road users.
KO5 – Quality of Life
and Local Environment
• The consequence of death and injury from road traffic collisions has a devastating effect of individuals, their families and friends.
• Excess speed particularly in residential areas can impose restrictions on peoples daily lives particularly children and older people and those wishing to walk and cycle.
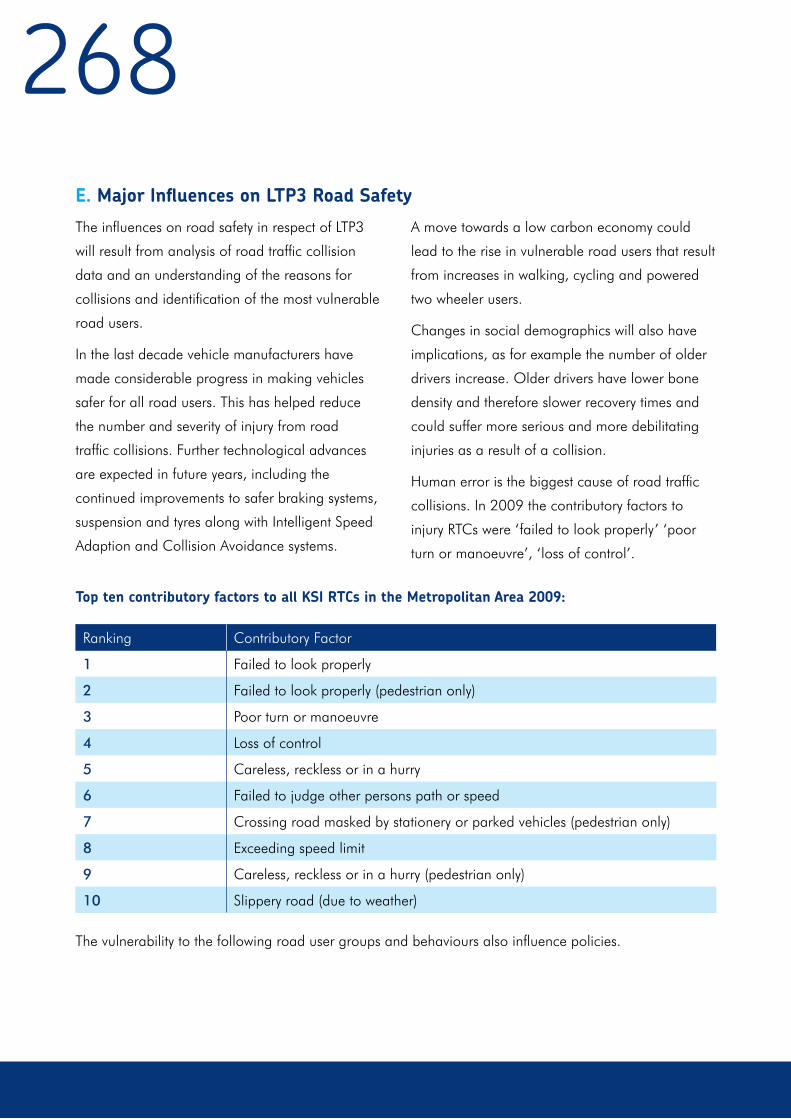
268The influences on road safety in respect of LTP3
will result from analysis of road traffic collision
data and an understanding of the reasons for
collisions and identification of the most vulnerable
road users.
In the last decade vehicle manufacturers have
made considerable progress in making vehicles
safer for all road users. This has helped reduce
the number and severity of injury from road
traffic collisions. Further technological advances
are expected in future years, including the
continued improvements to safer braking systems,
suspension and tyres along with Intelligent Speed
Adaption and Collision Avoidance systems.
E. Major Influences on LTP3 Road Safety
A move towards a low carbon economy could
lead to the rise in vulnerable road users that result
from increases in walking, cycling and powered
two wheeler users.
Changes in social demographics will also have
implications, as for example the number of older
drivers increase. Older drivers have lower bone
density and therefore slower recovery times and
could suffer more serious and more debilitating
injuries as a result of a collision.
Human error is the biggest cause of road traffic
collisions. In 2009 the contributory factors to
injury RTCs were ‘failed to look properly’ ‘poor
turn or manoeuvre’, ‘loss of control’.
Top ten contributory factors to all KSI RTCs in the Metropolitan Area 2009:
The vulnerability to the following road user groups and behaviours also influence policies.
Ranking Contributory Factor
1 Failed to look properly
2 Failed to look properly (pedestrian only)
3 Poor turn or manoeuvre
4 Loss of control
5 Careless, reckless or in a hurry
6 Failed to judge other persons path or speed
7 Crossing road masked by stationery or parked vehicles (pedestrian only)
8 Exceeding speed limit
9 Careless, reckless or in a hurry (pedestrian only)
10 Slippery road (due to weather)
269Pedestrians & Cyclists –
particularly in deprived communities
A significant barrier to encouraging walking
and cycling is poor or inconsistent facilities for
walking and cycling. Research suggests that
pedestrians struck at 30 mph have about a 1 in 5
chance of being killed. At 20 mph the chance of
a pedestrian dying is 1 in 40. We will therefore,
consider introducing 20 mph limits or zones
around schools, shops, markets, playgrounds
and other areas where pedestrian and cyclist
movements are high.
Such zones and limits will need to be largely
self-enforcing through an established toolkit of
engineering measures that moderate vehicle
speeds. These zones also have potential to
reduce pollution and improve public health by
encouraging walking and cycling. The limited
evidence gathered to date suggests that people
walk and cycle more in areas subject to 20 mph
zones.
Research shows a link between deprivation
and road safety risk. The most deprived areas
remain slightly over-represented in the casualty
population. In fact the link between casualties and
deprivation is largely due to pedestrian casualties,
particularly children. For example children from
Social Class V are five times more likely to die as
pedestrians in a road accident than children from
Social Class I. There are many associated causes,
which may include: poor environment dominated
by roads; lack of play facilities; truancy; lack
of understanding or appreciation of road
safety issues; lack of community facilities easily
accessible on foot; excess levels of through traffic.
There is an established range of measures to
assist in protecting pedestrians. This includes
infrastructure such as pedestrian crossings and
refuges. These kinds of interventions continue to
be made by highway authorities.
One area of success has been cyclist training.
Bikeability is cycling proficiency for the 21st
century, with levels one (off-road training), two
(basic in-road training) and three (more advanced
on-road training) designed for children of different
age groups, but also available for adults. Cycle
Training West Midlands (CTWM) was formed
to manage the organisation and delivery of
nationally accredited instructor-training courses.
CTWM is an informal partnership between the
seven Local Authorities, the fire service and
the police. It is run by local government road
safety professionals, specifically to provide cycle
instructor training for Local Authorities and other
government organisations across the UK. Training
is designed to meet and exceed the Bikeability
National Standards for cycle training.
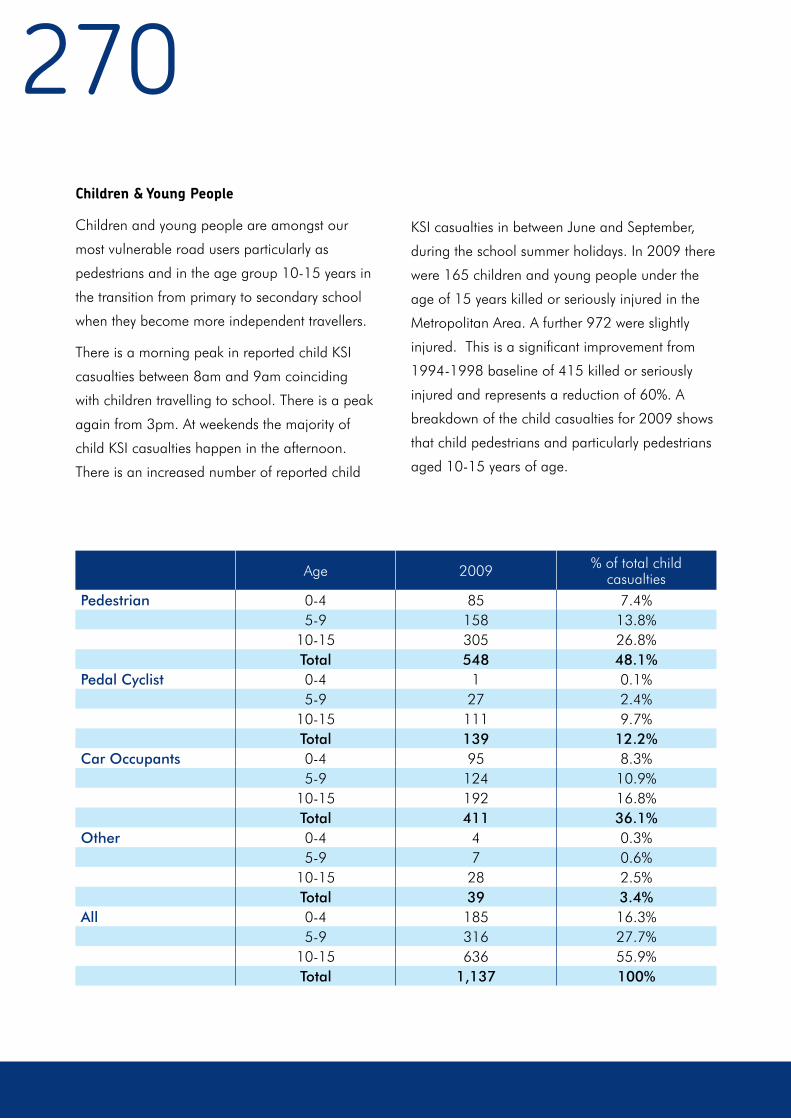
270KSI casualties in between June and September,
during the school summer holidays. In 2009 there
were 165 children and young people under the
age of 15 years killed or seriously injured in the
Metropolitan Area. A further 972 were slightly
injured. This is a significant improvement from
1994-1998 baseline of 415 killed or seriously
injured and represents a reduction of 60%. A
breakdown of the child casualties for 2009 shows
that child pedestrians and particularly pedestrians
aged 10-15 years of age.
Children & Young People
Children and young people are amongst our
most vulnerable road users particularly as
pedestrians and in the age group 10-15 years in
the transition from primary to secondary school
when they become more independent travellers.
There is a morning peak in reported child KSI
casualties between 8am and 9am coinciding
with children travelling to school. There is a peak
again from 3pm. At weekends the majority of
child KSI casualties happen in the afternoon.
There is an increased number of reported child
Age 2009 % of total child casualties
Pedestrian 0-4 85 7.4%5-9 158 13.8%
10-15 305 26.8%Total 548 48.1%
Pedal Cyclist 0-4 1 0.1%5-9 27 2.4%
10-15 111 9.7%Total 139 12.2%
Car Occupants 0-4 95 8.3%5-9 124 10.9%
10-15 192 16.8%Total 411 36.1%
Other 0-4 4 0.3%5-9 7 0.6%
10-15 28 2.5%Total 39 3.4%
All 0-4 185 16.3%5-9 316 27.7%
10-15 636 55.9%Total 1,137 100%

271children make to get to and from school by
making it safer, healthier, sustainable and more
interesting.
Powered Two Wheelers
Nationally Powered Two Wheelers are estimated
to make up 1% of the road traffic but suffer
around 20% of KSIs numbers. In 2009 in the
Metropolitan Area there were 166 KSIs involving
P2W riders or their passengers. This represented
nearly 17% of all KSIs. Powered Two Wheelers are
considered in more detail on page 276.
Rural Roads
Although predominantly urban in character the
Metropolitan Area does have some rural roads.
There are established measures, such as road
markings, junction treatments and barriers that
have improved the safety of rural roads, and
these will continue to be deployed with success by
highway authorities.
Promoting Better Understanding of the
Consequences of Poor or Inappropriate Road
User Behaviour
Education, training and publicity are central
to promoting positive messages tackling the
problems of poor road users such as failing to
wear a seat belt, mobile phone use, drink and
drug driving and are most effective when linked to
enforcement activity. Targeting has concentrated
on road users who persist in unacceptable
behaviour that causes death and serious injury:
Initiatives will include on-street training for
children, to improve their pedestrian and cycling
skills. Each Local Authority currently maintains its
own team of road safety officers who work with
schools. Support is provided through a range of
curriculum subjects in the form resources and
lesson plans, practical training, special events and
class visits.
School Crossing Patrols provided by the Local
Authorities ensure the safety of children, especially
on their journeys to and from school, with the
aim of reducing road traffic casualties whilst
encouraging active travel to school.
Across the Metropolitan Area pupils are offered
the opportunity to undertake cycle training in
order to encourage more pupils to cycle to school
safely. In the vast majority of schools training
takes place within the school timetable although
some schools refer training in school holidays and
at weekends.
All cycle training courses follow the guidelines
set out in Cycling England’s Bikeability scheme.
All instructors are qualified at, or are working
towards qualification at the Government
approved National Standard for cycle training.
Cycle training usually starts in primary school with
years 5 and 6 pupils.
In recent years schools have developed and
implemented School Travel Plans and Safer
Routes to School programmes. Together these
plans can make a difference to the journey

272Careless or dangerous driving
Driver improvement schemes can offer a more
constructive alternative to prosecution for some
drivers who commit relatively minor offences or
cause minor crashes. If it is clear that education
or further training would help the driver to avoid
a recurrence of the incident, then a place on
an improvement scheme can be offered (at the
discretion of the police) as an alternative to
prosecution. It should be emphasised that this is
not an easy option. The driver will have to pay for
the course and should the driver fail to participate
properly in it, then the prosecution could still be
pursued
Unlicensed and Uninsured Driving
There is a clear link between driving without a
licence, tax or insurance, and involvement in
collisions. The total cost of uninsured motoring in
the UK is estimated to be around £500 million,
which puts around £30 per year on each policy
of law-abiding drivers. Metropolitan areas like the
West Midlands are home to the most uninsured
drivers. The West Midlands Metropolitan Area as
a whole contains six out of the ten worst offending
postcodes with an estimated 127,000 uninsured
drivers. Half of the uninsured drivers are under
the age of 29.
Operation Velociraptor is a targeted roads
policing initiative by West Midlands Police which
has proved highly successful in clamping down on
fail to wear seat belts, mobile phone use, driving
with out a licence, tax or insurance.
Drink-driving - the number of positively tested
drivers involved in collisions has fallen from 317
in 2000 to 196 in 2009.This is due high profile
campaigning over many years that has made
drinking and driving socially unacceptable.
However, there remains a minority who put
themselves and others at risk. The age group
20-29 consistently form the largest group of
drivers involved in collisions and who test positive
for alcohol. In 2009 this age group accounted for
50% of the total.
Drug driving presents a significant danger.
Nationally around 18% of people killed in road
accidents have traces of illegal drugs in their
blood. This represents a six-fold increase since
the mid 1980’s. New tests are being developed
to ensure there is greater detection of drivers who
drive while under the influence of illegal drugs.
Seat Belts - Failure to wear a seat belt increases
the chance of death or serious injury. Recent
surveys by DfT suggest car driver wearing rates for
younger drivers were lower than for middle aged
or older drivers. Male drivers are likely to have
lower rates than female drivers.

273Illegal and Inappropriate Speed
Research shows a strong link between speed and
road casualties. Reducing the average speed of
traffic by 1 mph leads to an expected reduction of
5 per cent in the number of collisions. Reducing
the speed of the fastest drivers has the largest
effect on collisions. Speed limits are set at a level
to maintain public safety and there is a need to
improve compliance with limits if there is to be
an improvement in casualty reduction. A number
of traffic calming measures can be deployed to
reduce speed:
Central Islands can make wide roads seem
narrower, prevent overtaking and make it easier
for pedestrians to cross.
Road humps are used on roads with a speed
limit of 30mph or less. These can be unpopular
and cause problems for emergency services and
buses, especially where there is inappropriate
on-street parking.
Kerb build outs reduce roads to a single lane so
that drivers have to be prepared to give way to
oncoming traffic.
Gateways warn drivers that the character of a
road is about to change, for example entering a
20 mph zone.
The purpose of safety cameras is to change driver
behaviour. They are only used at sites where
there is a history of personal injury collisions and
where there is a history of drivers breaking the
speed limited. The Metropolitan Area currently
has a network of nearly 300 fixed safety camera
sites. This is supplemented by mobile enforcement
from a number of designated sites. Advances in
technology will necessitate a review of the current
network both in terms of size and a move to
digital cameras with are more efficient.
Interactive ‘SLOW’ signs which are blank until
activated by a vehicle travelling at or above a
particular threshold speed are also used in a
number of locations, to reduce speed often in
proximity to schools, playgrounds and other
locations where there may be issue with
speeding vehicles that present a hazard to
vulnerable road users.
In some parts of the Metropolitan Area, vehicle
activated signs have been placed immediately
before a safety camera site to reinforce the
message and give advance warnings of the
approach to a camera.
Mobile speed indicator display signs (SIDS) tend
to me smaller vehicle activated signs that flash
up the speed limit. Because they are smaller they
can be rotated between sites and can be used
to respond to community concerns. Evidence
suggests that such deployment is effective in
reducing speed for about four weeks before the
deterrent effect reduces. Nevertheless they can be
very effective at reducing speed by 1 or 2 mph
over a period of time.
Successful road safety delivery requires lots of
different people and organisations, working in a
range of different areas, to sign up to a common
vision or goal that we can all towards.

274• Pedestrian and cyclist casualties in our
towns and cities – particularly in deprived
communities.
• Children, particularly in deprived areas,
and young people, who are greatly over-
represented in the casualty statistics
• Motorcyclists, who are represent 16% of
road fatalities but just 1% of traffic
In achieving this we will target
• Poor road user behaviour amongst a
minority, where drink-driving and a failure
to wear a seatbelt remain a problem;
• Illegal and inappropriate speed; excessive
speed was recorded as a contributory
factor in 26% of road fatalities in 2007.
We will provide support to individuals within
partner organisations and within communities
to develop the local road safety expertise they
require in order to understand where and why
collisions happen, who is involved, what they are
doing, and which types of vehicles are involved.
This will enable more effective targeting of
resources. We will provide better information
to the public about road safety to inform,
educate and gain their support for community
led initiatives. We will need to better understand
the motivations behind the most dangerous
behaviours and characteristics of road users
who put themselves and others at risk.
F. LTP3 Road Safety Policies
Road Safety policies are set in the context of the
five LTP3 Objectives. They therefore consider
potential impacts on all of these. This means
that there is a balance between the need for the
mobility essential to communities and economy,
with an obligation to maintain public safety.
Policies continue to require effective partnership
between Local Authorities, police, fire service, the
voluntary sector and communities to ensure that
measures and initiatives are properly targeted to
achieve maximum road safety benefit.
Policy SS1: To seek to reduce further casualties
resulting from road traffic collisions, including
achieving a greater understanding of where and
why collisions happen and to whom
The overriding aim of our road safety strategy is
to ensure further reductions in road casualties in
order to make our roads the safest in Britain. We
aspire to reducing the overall numbers killed and
seriously injured and in particular the numbers
of children killed and seriously injured. We focus
on vulnerable road users, which account for the
largest number of casualties. These include:
275Policy SS2: To seek to achieve greater
co-ordination between road safety partners
Recognising that human beings make mistakes,
we will deliver a safe, holistic road safety system
where road design, vehicles and education
work in combination to reduce the chances of
mistakes on the roads having serious or fatal
consequences. We will move away from a ‘silo-
based’ approach that looks at engineering,
enforcement and education separately, to
considering the needs of an integrated road
safety system.
We will make better use of data, rigorous
evaluation, supporting information, and the
knowledge and skills of our partners, in order
to make informed decisions about those actions
which will deliver the greatest impact on reducing
casualties. We will enable Local Authorities
working together, to consider future priorities,
in the context of their contribution to casualty
reduction in the Metropolitan Area as a whole.
276
A. The Role of Powered Two Wheelers
Powered Two Wheelers (P2Ws) range from mopeds and scooters to large powerful motorbikes. They
offer a number of benefits to local communities and individuals by:
•Helping reduce congestion, generally taking less space on roads than cars
•Taking less space when parked
•Generally being a cheaper alternative to travel by car
• Improving personal accessibility and social inclusion
They are increasingly used by delivery businesses as a faster way of delivering small packages and
documents in busy urban areas.
B. Partners: Roles and Responsibilities
Powered Two Wheeler Safety
Local Authorities
As the highway authority there is an important
role to play in ensuring that road design, road
surfaces and road maintenance creates a safe
environment for P2Ws. In addition, Local Planning
Authorities should ensure adequate secure
parking provision in new developments, including
retail centres, employment and residential areas
and community facilities.
Centro
Adequate secure parking should be a feature for
P2Ws at transport interchanges to encourage the
use of P2Ws for short journeys that link to train,
tram or bus networks.
West Midlands Road Safety Partnership
The Partnership, through its Local Authority, police
fire service and Highways Agency members,
promotes safer riding behaviour.
Voluntary sector and campaign organisations
Organisations such as RoSPA, Institute of
Advanced Motorists, and West Midlands Police
BikeSafe scheme provides assessment and paths
to advanced riding skills for P2W riders.
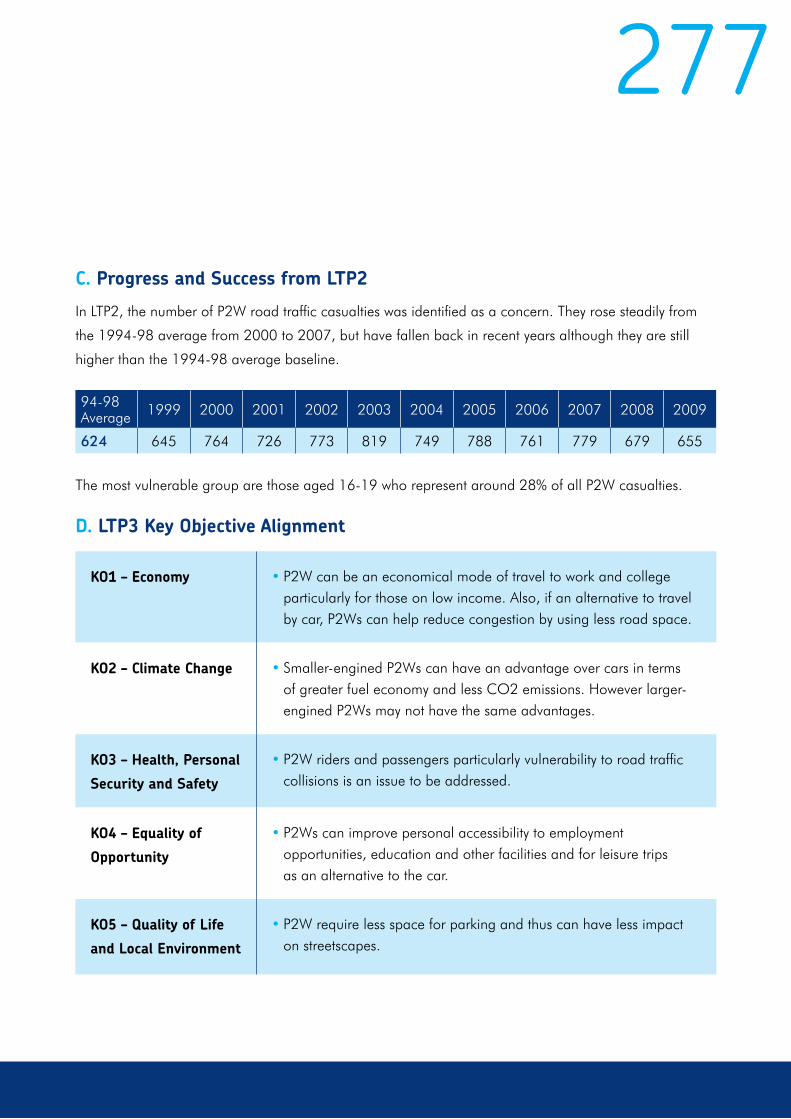
277
C. Progress and Success from LTP2
In LTP2, the number of P2W road traffic casualties was identified as a concern. They rose steadily from
the 1994-98 average from 2000 to 2007, but have fallen back in recent years although they are still
higher than the 1994-98 average baseline.
The most vulnerable group are those aged 16-19 who represent around 28% of all P2W casualties.
94-98Average 1999 2000 2001 2002 2003 2004 2005 2006 2007 2008 2009
624 645 764 726 773 819 749 788 761 779 679 655
D. LTP3 Key Objective Alignment
KO1 – Economy • P2W can be an economical mode of travel to work and college particularly for those on low income. Also, if an alternative to travel by car, P2Ws can help reduce congestion by using less road space.
KO2 – Climate Change • Smaller-engined P2Ws can have an advantage over cars in terms of greater fuel economy and less CO2 emissions. However larger-engined P2Ws may not have the same advantages.
KO3 – Health, Personal
Security and Safety
• P2W riders and passengers particularly vulnerability to road traffic collisions is an issue to be addressed.
KO4 – Equality of
Opportunity
• P2Ws can improve personal accessibility to employment opportunities, education and other facilities and for leisure trips as an alternative to the car.
KO5 – Quality of Life
and Local Environment
• P2W require less space for parking and thus can have less impact on streetscapes.
278The Government’s Motorcycling Strategy,
published in February 2005 and re-issued in June
2008, seeks to facilitate motorcycling as a choice
of travel within a safe and sustainable transport
framework.
On reducing congestion, the Strategy notes
research that found: “that this is a complex
issue. If the switch of mode was simply between
a single occupant car and motorcycle, then
there clearly would be congestion benefits. By
contrast, a switch simply from public transport
to motorcycling would add to the vehicles on
the road and so add to congestion. However,
where there are large numbers of motorcycles –
principally large urban areas – there is often also
better public transport and more choice between
modes, especially in peak hours when congestion
is most prevalent. In these circumstances a switch
from single occupancy cars to mass transport
could, overall, have a more significant impact
on addressing congestion whilst promoting
accessibility”.
E. Major Influence on LTP3 Powered Two Wheelers
On emissions, the Strategy notes that:
“Motorcycles have a clear advantage over cars in
terms of carbon dioxide (CO2) emissions and, the
smaller machines (e.g. engine capacity less than
400 cm3) that dominate the urban/commuter
sector, tend to have CO2 emissions per kilometre
travelled of less than half of those of the average
car due to their far greater fuel economy.
However, larger motorcycles can emit more CO2
than some cars kilometre by kilometre because
they offer far poorer fuel economy.”
With regard to issues affecting P2W users,
the Strategy notes that: “there are some
characteristics of motorcycles that do warrant
attention in the design of roads for particular
situations. These are principally related to the
susceptibility of two wheeled vehicles to the
nature of the road surface and the vulnerability
of riders if accidents do occur. Concerns include,
for example – manhole covers with inadequate
skid resistance or located in the carriageway
where motorcyclists could be leaning into a bend;
poor or infrequent maintenance; inadequate
reinstatement after works in the road, that leave
potholes or uneven surfaces which can destabilise
two wheeled vehicles; and safety barrier posts or
other street furniture located where there is a risk
of motorcyclists hitting them if they come off their
machines”.
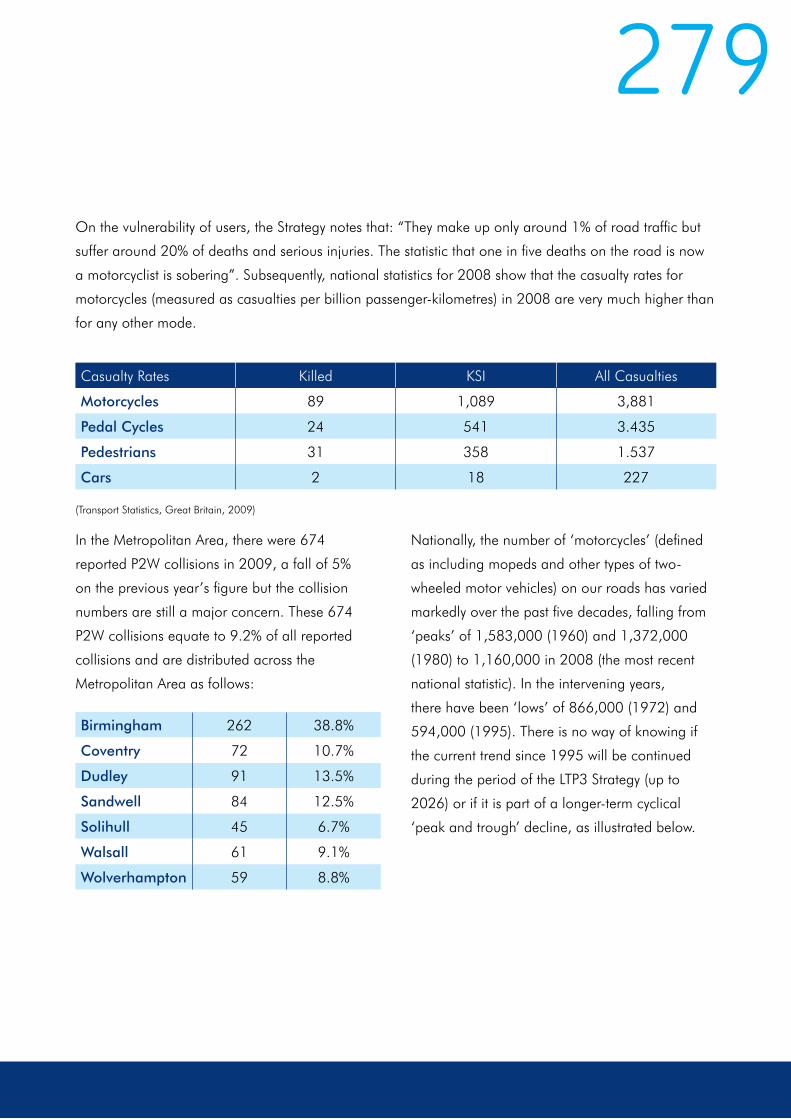
279
Casualty Rates Killed KSI All Casualties
Motorcycles 89 1,089 3,881
Pedal Cycles 24 541 3.435
Pedestrians 31 358 1.537
Cars 2 18 227
(Transport Statistics, Great Britain, 2009)
In the Metropolitan Area, there were 674
reported P2W collisions in 2009, a fall of 5%
on the previous year’s figure but the collision
numbers are still a major concern. These 674
P2W collisions equate to 9.2% of all reported
collisions and are distributed across the
Metropolitan Area as follows:
Birmingham 262 38.8%
Coventry 72 10.7%
Dudley 91 13.5%
Sandwell 84 12.5%
Solihull 45 6.7%
Walsall 61 9.1%
Wolverhampton 59 8.8%
Nationally, the number of ‘motorcycles’ (defined
as including mopeds and other types of two-
wheeled motor vehicles) on our roads has varied
markedly over the past five decades, falling from
‘peaks’ of 1,583,000 (1960) and 1,372,000
(1980) to 1,160,000 in 2008 (the most recent
national statistic). In the intervening years,
there have been ‘lows’ of 866,000 (1972) and
594,000 (1995). There is no way of knowing if
the current trend since 1995 will be continued
during the period of the LTP3 Strategy (up to
2026) or if it is part of a longer-term cyclical
‘peak and trough’ decline, as illustrated below.
On the vulnerability of users, the Strategy notes that: “They make up only around 1% of road traffic but
suffer around 20% of deaths and serious injuries. The statistic that one in five deaths on the road is now
a motorcyclist is sobering”. Subsequently, national statistics for 2008 show that the casualty rates for
motorcycles (measured as casualties per billion passenger-kilometres) in 2008 are very much higher than
for any other mode.

280Motorcycle numbers, 1960 – 2008
(Transport Statistics, Great Britain, 2009)
New registration numbers show a similar, although less clear long-term pattern, again falling from
a ‘peak’ of 332,000 (1959) to 138,000 in 2008 with an intermediate ‘peaks’ of 313,000 (1980)
and 183,000 (2000). However, this decade has seen new registrations drop by a quarter since 2000
although numbers of newly registered ‘motorcycles’ has been relatively stable in the most recent five
years, 2004 – 2008, as shown below.
1800
1600
1400
1200
1000
800
600
400
200
0

281Motorcycle new registrations, 1959 – 2008
(Transport Statistics, Great Britain, 2009)
The breakdown of ‘motorcycle’ numbers nationally shows that those with engines over 500cc dominate,
currently being 58% of all ‘motorcycles’ and having more than doubled in numbers between 1998 and
2008. The next highest growth, over this period, has been those with engines between 50cc and 125cc,
with growth of 57% over the same period and accounting for 19% of all ‘motorcycles’ in 2008. Over
one third of ‘motorcycles’, in 2008, had engines of less than 50cc but numbers have actually been
declining since 2004.
350
300
250
200
150
100
50
0
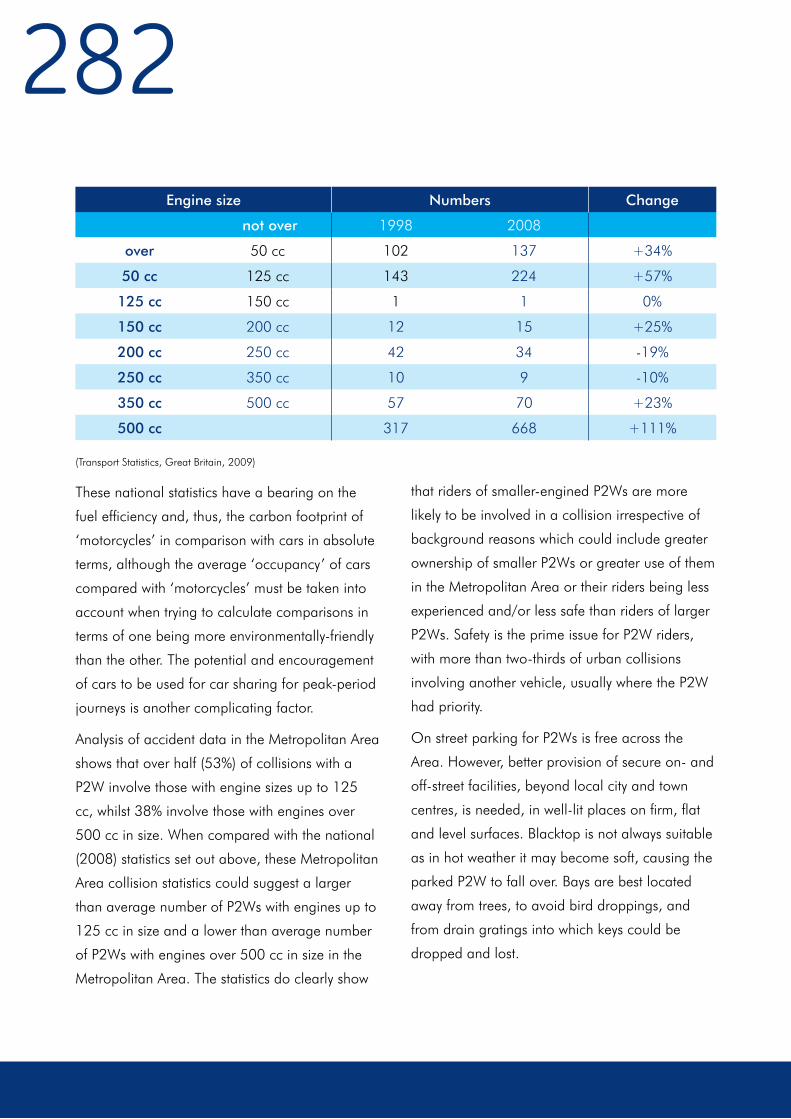
282
that riders of smaller-engined P2Ws are more
likely to be involved in a collision irrespective of
background reasons which could include greater
ownership of smaller P2Ws or greater use of them
in the Metropolitan Area or their riders being less
experienced and/or less safe than riders of larger
P2Ws. Safety is the prime issue for P2W riders,
with more than two-thirds of urban collisions
involving another vehicle, usually where the P2W
had priority.
On street parking for P2Ws is free across the
Area. However, better provision of secure on- and
off-street facilities, beyond local city and town
centres, is needed, in well-lit places on firm, flat
and level surfaces. Blacktop is not always suitable
as in hot weather it may become soft, causing the
parked P2W to fall over. Bays are best located
away from trees, to avoid bird droppings, and
from drain gratings into which keys could be
dropped and lost.
(Transport Statistics, Great Britain, 2009)
These national statistics have a bearing on the
fuel efficiency and, thus, the carbon footprint of
‘motorcycles’ in comparison with cars in absolute
terms, although the average ‘occupancy’ of cars
compared with ‘motorcycles’ must be taken into
account when trying to calculate comparisons in
terms of one being more environmentally-friendly
than the other. The potential and encouragement
of cars to be used for car sharing for peak-period
journeys is another complicating factor.
Analysis of accident data in the Metropolitan Area
shows that over half (53%) of collisions with a
P2W involve those with engine sizes up to 125
cc, whilst 38% involve those with engines over
500 cc in size. When compared with the national
(2008) statistics set out above, these Metropolitan
Area collision statistics could suggest a larger
than average number of P2Ws with engines up to
125 cc in size and a lower than average number
of P2Ws with engines over 500 cc in size in the
Metropolitan Area. The statistics do clearly show
not over 1998 2008
over 50 cc 102 137 +34%
50 cc 125 cc 143 224 +57%
125 cc 150 cc 1 1 0%
150 cc 200 cc 12 15 +25%
200 cc 250 cc 42 34 -19%
250 cc 350 cc 10 9 -10%
350 cc 500 cc 57 70 +23%
500 cc 317 668 +111%
Engine size Numbers Change

283P2Ws are vulnerable to greater levels of theft than
cars since they are more portable and easier to
hide. The risk of theft is much higher for mopeds
and bikes with small engines than for heavier,
larger-engine machines. Anchor posts or hitching
rails need to be provided to which to chain
the motorcycle. Ideally the bays should be in
locations where there is public activity and natural
surveillance and / or be covered by
CCTV cameras.
The condition of the road surface can be critical
to P2W use. Poorly maintained surfaces, smooth
utility covers, poorly designed traffic calming and
excessive use of road markings can contribute to
loss of control and potential personal injury.
Access to bus and other priority lanes, on radial
routes and/or in town and city centres, can
aid P2W accessibility. However, there is often
resistance to this, on the basis of potential
conflict between modes. The evidence is, at best,
inconclusive. A recent independent (TRL) study of
motorcycle safety when using specific bus lanes
in London compared with motorcycle collisions
along comparable (control) routes found more
collisions in the former compared with the latter
situations – this appeared to involve collisions
with cars that were turning into or emerging from
side roads.
The latter two of the following conclusions from
this study also provide concern with regard to
safety:
• “Bus speeds were unaffected by permitting
motorcycles access to the bus lanes.
• Non-priority traffic speeds remained
reasonably constant on the Main and
Control sites.
• Motorcycle speeds increased after they
were permitted access to the bus lanes.
• There was an increase in the percentage of
motorcycles exceeding the speed limit.”
(Assessment of TfL’s experimental scheme to allow
motorcycles onto with-flow bus lanes on the TLRN,
TRL, June 2010)
In September 2009 Birmingham City Council
approved the use of bus lanes across the city
by P2Ws. As a result of a trial on the A435
Alcester Road from November 2007 the Council
concluded that the use of the bus lane by P2Ws
had a broadly neutral impact on existing bus lane
users and a positive impact on P2W riders. There
was no change in bus or taxi journey times and
reliability, there was no change in the levels of
road traffic collisions in the vicinity of the bus lane
and no increase in the number of P2W collisions
connected with the use of bus lanes.
The report did conclude however that certain bus
lanes were unsuitable for P2W use due to the
number of buses and taxis manoeuvring from the
kerb and from heavily trafficked side roads.

284Speed is an issue, both in terms of road safety for riders and other road users and due to the intimidation
of pedestrians and cyclists. National statistics of speeds by different modes on roads in built-up areas
show more than a quarter of all observed ‘motorcycles’ travelling at over 35 mph in 30 mph zones (the
next highest being 18% of cars) and almost one fifth travelling at over 45 mph in 40 mph zones (twice
the percentage of cars). For the purposes of this research ‘motorcycles’ include mopeds and other types
of two-wheeled motor vehicles. Similar, albeit less dramatic, results are show for ‘motorcycle’ speeds on
motorways, dual carriageways and single carriageway roads, subject only to the national speed limit.
(Transport Statistics, Great Britain, 2009)
F. LTP3 Powered Two Wheeler Policy
Policy SS3: To actively take account of the
needs of Powered Two-Wheelers and promote
their safe use
(a) The Highway Authorities will continue
to consider measures that facilitate
motorcycling whilst not compromising
road safety. They will be encouraged
to take account of the needs of P2Ws
to implement the recommendations on
policy, travel planning, maintenance,
traffic engineering, road design and road
safety activity found in ‘Guidelines for
Motorcycling‘, published by the Institute of
Highway Engineers.
(b) Centro will provide secure and
appropriate parking facilities at its
public transport interchanges and local
railway stations and will encourage Train
Operating Companies and Network Rail
to adopt a similar policy at their stations.
(c) The Highway Authorities will continue
to take account of the on-street parking
needs of P2Ws
(d) The Local Planning Authorities will
encourage the provision of secure and
appropriate parking for P2Ws in new
development proposals.
(e) The Highway Authorities will be
encouraged to produce a P2W strategy,
either of their own design or based on
the template being produced by the West
Midlands Motorcycle Advisory Panel.
The West Midlands Road Safety Partnership
will continue to find ways of promoting safer
use of P2Ws, including the six-facet framework
covering: educating drivers; P2W-friendly wider
policies; training & publicity; P2W-friendly
road infrastructure; giving a voice to riders
and enforcement.

285
A. Role of Public Transport Safety
Actual and perceived safety and security is an
important factor in peoples’ choice of mode of
transport, particularly their use of public transport
or the decision to walk or cycle or indeed whether
to travel at all. Local Authorities and Centro
recognise the need to work in partnership with
other agencies to ensure a multidisciplinary
approach to maximise use of resources, and to
add value to each agency’s work. Safety and
security is essential to regeneration and LTP3
links with related strategies and funding regimes,
including national regeneration programmes and
Community Safety Plans.
Research by Centro conducted in 2008 confirms
that fears for personal security can be a real
barrier to the use of public transport and walking,
especially after dark. Concern is often greatest
when walking to and from the stop or station at
either end of the journey. The actual on board
element of the journey is perceived to be the
safest. Identifying improvements to the physical
and social environment at a neighbourhood level
is therefore crucial. In addition to this there is a
need to ensure safe walking routes, using the
principals of situational crime prevention through
environmental design, tackling issues such as the
effects of poor lighting and landscaping.
Public Transport Safety
There is a need to work with young people,
particularly those in school year 6 and 7 as they
are on the brink of independent travel. Initiatives
need to address the concerns of young people
themselves as well as those of adult passengers
and staff. As well as direct action to reduce crime
there is a need to address anti-social behaviour
and environmental issues. While these are not
necessarily defined as crimes they will improve the
environment, feelings of wellbeing and can lessen
people’s fear of crime. Encouraging more people
onto the streets reinforces confidence and can
break the cycle of fear.
Making our towns attractive and safe contributes
to the local quality of life, the local economy
and urban regeneration. Much has already been
done to make our town centres more attractive,
which combine the use of technology, design
and commercial vision but much more needs to
be done to ensure urban regeneration and the
economic health of our town centres.
286West Midlands Police & Safer Travel
Police Team
West Midlands Police is the second largest force
in the country. The Safer Travel Police team are a
group of officers and police community support
officers (PCSOs) who work on the bus network
and associated corridors of the Metropolitan
Area, focusing on crime reduction and community
safety. They are part funded by and work in
partnership with Centro.
British Transport Police
British Transport Police is the national police force
for the railways providing a policing service to rail
operators, their staff and passengers throughout
England, Scotland and Wales.
West Midlands Crime and Disorder
Partnerships
Responsible authorities have a statutory duty to
work with other agencies and organisations to
develop and deliver strategies to reduce crime
and disorder including anti social behaviour
B. Public Transport Safety: Roles and Responsibilities
that affects the local environment, as well as
the misuse of drugs. These partnerships bring
together the Police, Local Authorities and Primary
Care Trusts to enable delivery.
Centro
Centro work in partnership with the West
Midlands Crime and Disorder Partnerships,
West Midlands Police, British Transport Police
and operators to deliver a safer public transport
network. Centro provide CCTV at bus and rail
stations and rail and Metro Park and Ride car
parks. The images are monitored at the Network
Safety & Security Centre.
Local Authorities
Local Authorities, as Planning and Highway
authorities support and improve safety and
security through urban design principles, which
discourage anti-social behaviour and encourage
people to feel safe in their local environment
through provision of good street lighting.
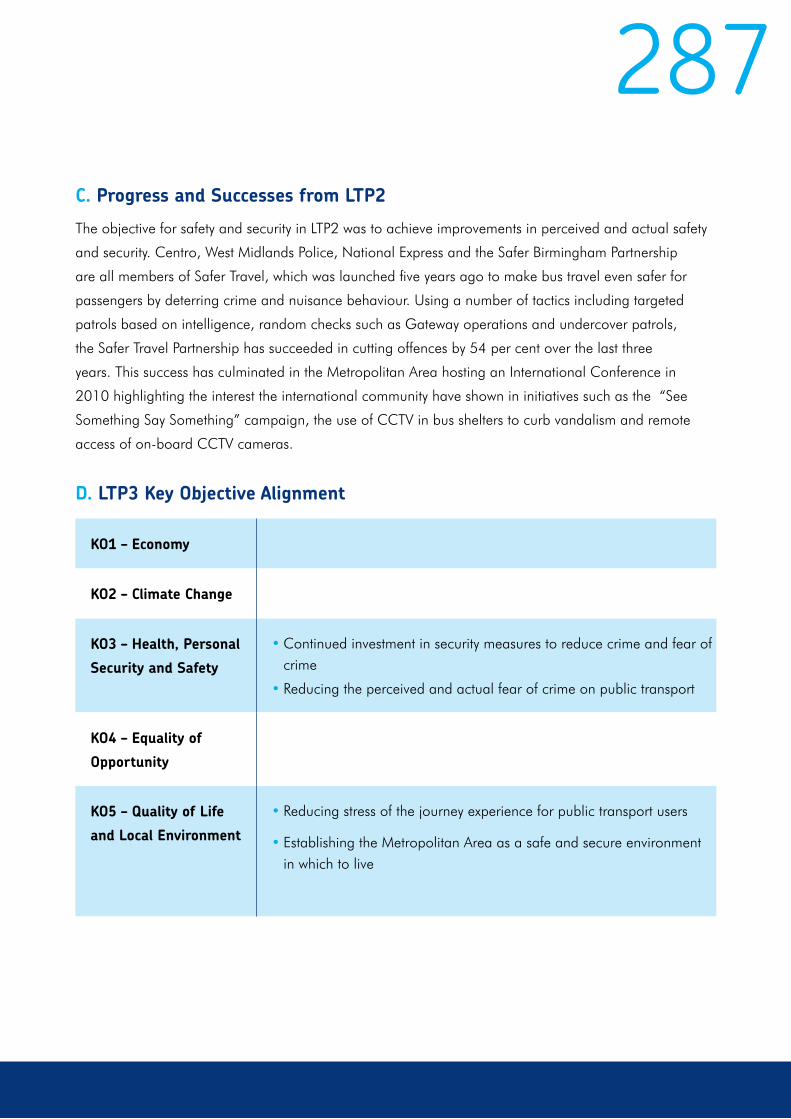
287C. Progress and Successes from LTP2
The objective for safety and security in LTP2 was to achieve improvements in perceived and actual safety
and security. Centro, West Midlands Police, National Express and the Safer Birmingham Partnership
are all members of Safer Travel, which was launched five years ago to make bus travel even safer for
passengers by deterring crime and nuisance behaviour. Using a number of tactics including targeted
patrols based on intelligence, random checks such as Gateway operations and undercover patrols,
the Safer Travel Partnership has succeeded in cutting offences by 54 per cent over the last three
years. This success has culminated in the Metropolitan Area hosting an International Conference in
2010 highlighting the interest the international community have shown in initiatives such as the “See
Something Say Something” campaign, the use of CCTV in bus shelters to curb vandalism and remote
access of on-board CCTV cameras.
D. LTP3 Key Objective Alignment
KO1 – Economy
KO2 – Climate Change
KO3 – Health, Personal
Security and Safety
• Continued investment in security measures to reduce crime and fear of crime
• Reducing the perceived and actual fear of crime on public transport
KO4 – Equality of
Opportunity
KO5 – Quality of Life
and Local Environment
• Reducing stress of the journey experience for public transport users
• Establishing the Metropolitan Area as a safe and secure environment in which to live

288An Integrated Sustainability Appraisal (ISA) has
been undertaken to support the preparation of
LTP3 and includes an analysis of relevant plans,
policies and programmes from international
through to local level and their implications for
LTP3, including safety and security. In addition
to the policy framework identified by the ISA, the
following have been identified as further major
influences on safety and security over the period
of LTP3.
The Local Authorities and Centro wish to see a
safe and secure environment for people to live
and travel in, whichever mode of travel they
choose. Fears for personal safety and security can
be a barrier to people travelling, especially by
public transport, walking and cycling. The LTP will
remove these barriers and encourage the use of
more sustainable modes of travel.
The Crime and Disorder Act requires the
various agencies to reduce crime and promote
community safety. Each Local Authority has a
Community Safety Plan. Centro’s Integrated Public
Transport Prospectus seeks to develop safe public
transport and measures have been developed
to combat vehicle crime, anti-social behaviour,
and to reduce the number of young people who
become involved in crime, as victims as well as
offenders. The bus, rail and Metro operators are
also committed to resolving problems of crime,
safety and security.
E. Major Influences on LTP3 Public Transport Safety
The priority of the West Midlands Police Is to
increase public trust and confidence through
various front line services which includes the Safer
Travel initiatives. A major initiative within LTP3 is
the continuation of the Safer Travel Police Team.
The British Transport Police West Midlands Area
policing plan identifies a safe railway environment
as a priority. This includes the reduction of
violence against the person, both travellers and
rail / metro staff and reduction in robberies
and car crime. With their partners they also
aim to achieve a railway environment free from
disruption caused by vandalism and other route
crime offences, efficient management of fatalities,
maintaining order of travelling football supporters
and reducing the number of level crossing
offences.
LTP3 seeks to target particular neighbourhoods
and known problem sites and areas. The focus
will be on the enhancement of street lighting,
particularly in residential areas and on the
approaches to public transport routes, which
feature in each Authority’s programme. Focus
will also be on strategic bus corridors, major
public transport hubs such as bus and rail stations
(including taxi ranks), and main pedestrian
thoroughfares to attractions such as town centres,
leisure and shopping facilities.

289The ‘whole journey’ approach has been adopted
in guidance documents. Similar principles are
being applied to the design of Metro, upgrading
of rail stations and Park & Ride sites. Public
transport and taxi policies are particularly relevant.
Local Authorities and Centro will seek to improve
the standard of car park security through the
‘Park Mark’ programme. Particular attention will
continue to be given to the Park and Ride sites
and car parks serving the Metro, bus and railway
stations to ensure the confidence of the motorist
and maximise the modal shift benefits of Park and
Ride. The cycling and walking strategies adopted
will address security issues and the partnership
work with Centro and operators will address
problems on public transport vehicles. Vehicle
and bicycle theft has a direct impact on people’s
travel decisions. Secure cycle parking facilities
will be given a priority as an integral part of the
cycle strategy.
Consideration for personal security along the
whole journey will be an integral element of
future plans to extend the Metro system in the
Metropolitan Area, particularly paying regard to
safety whilst walking to and from the Metro by
conducting both crime analysis and situational
crime prevention audits of stop locations.
F. LTP3 Policies – Public Transport Safety
As outlined above Safety and Security will play
an important role in achieving a number of LTP3
objectives. A number of opportunities to deliver
this will evolve throughout the plan period. To
support this LTP3 will adopt the following policy:
Policy SS4: To reduce actual and perceived
safety concerns towards public transport use
and to reduce its vulnerability to vandalism
and terrorism
290LTT10: IMPROVED ENVIRONMENT AND REDUCED CARBON THROUGH NEW TECHNOLOGIES (GT)
290
291
A. Role of Supporting the Accelerated Development of Low Carbon Technologies
There is a shared commitment amongst authorities and organisations across the Metropolitan Area and
the Region that a low carbon strategy is the only practical way forward if we are to contribute to tackling
climate change and meeting national targets, creating a stable economy, increasing prosperity and
providing a quality environment for all.
LTP3 reflects this shared commitment and is overtly a low carbon strategy, encouraging the most
sustainable land use patterns and modes of travel and transport. Support for low carbon technologies
both within the business and manufacturing sectors and in its application in the transport field, is a part of
our long-term commitments.
B. Development of Low Carbon Technologies: Roles and Responsibilities
Supporting the Accelerated Development of Low Carbon Technologies
The development of low carbon technologies
and their subsequent implementation on our
networks brings together many organisations
including academic and research organisations,
specialist businesses, manufacturers, government
organisations, funding bodies, transport operators
and network providers and Local Authorities.
The Metropolitan Area has already shown a
significant lead in the transition to a low carbon
and greener economy through the work of
many businesses, organisations and authorities
with particular support through European
and Government funding and via the work of
Advantage West Midlands and Sustainability West
Midlands. Advantage West Midlands focussed
their work on a number of activities:
•Low carbon market opportunities
•Low carbon innovation, research and
development
• Infrastructure
•Business support, and
•Skills
292The CABLED project is a further excellent example
of collaborative cross sector working which
involves a consortium of partners including Arup,
EoN, Aston University, Cenex and Birmingham
Chamber of Commerce, with funding from
Advantage West Midlands and the Technology
Strategy Board, providing the largest trial in the
UK based, in Birmingham and Coventry with over
100 electric vehicles and a network of public
charging points.
Centro is one of 3 core funders of Sustainability
West Midlands (SWM), which brings together
various public and private organisations to
promote all aspects of sustainability across the
region through a series of initiatives and projects
including:
•Low Carbon Economy Leadership
Programme
•Energy programme
•Green jobs and skills
•Climate adaptation
•Roadmap for a sustainable region by 2020
Centro will continue to work with and through
SWM to ensure that travel issues are looked at in
a holistic way and that transport plays its part in
supporting a low carbon and greener economy.
In particular, their successful joint bid to be a part
of the Knowledge and Innovation Community on
Climate Change (Climate KIC) brings together
Local Authorities, academic and business partners
to focus on a core programme of climate science,
low carbon cities, zero carbon production
processes and integrated water management. This
initiative will bring major benefits for the region
over the next 7 to 15 years and offers a significant
opportunity to ensure that transport policy plays its
part in the various projects.
Also of particular relevance is the Low Carbon
Vehicle Technology Project (as part of the
Midlands designation as a Low Carbon Area for
Advanced Automotive Engineering) to shape the
future of passenger transport. This brings together
partners from the manufacturing and academic
sectors to develop 15 Research and Development
work streams covering all aspects of vehicle
engineering from battery development, to light
weight materials to intelligent control systems
for efficient operation in urban environments.
Again it is important for Centro and the Local
Authorities to offer to support and input to the
various workstreams, particularly those involved in
public transport development and intelligent traffic
management systems.
293The West Midlands Metropolitan Area benefitted from Round One of the Governments’ Green Bus Fund
with funding to West Midlands Travel Ltd for 20 buses. Bids for Round Two have been invited by October
2010 and this offers a further opportunity to help ‘green’ the area’s bus fleet.
Due to the nature of developing low carbon solutions for the economy and the transport sector funding
packages from many sources including the Government, the European Union and the business and
academic sectors will continue to be the norm. The resources that LTP3 can bring to the table are likely to
be more in the areas of support for initiatives, infrastructure to support businesses and possibly providing
areas for pilots, tests and trials.
C. Progress and Successes from LTP2
This is a new area of intervention, developed since LTP2 was formulated.
D. LTP3 Key Objective alignment
KO1 – Economy •Can reduce fuel costs born by business in a broader context, beyond transport costs
•By reducing noxious emissions and improving air quality, sickness costs may be reduced
KO2 – Climate Change •The development of low-carbon technologies can have a significant positive impact upon LTP3’s climate change objectives
KO3 – Health, Personal
Security and Safety
• The improvement of air quality can have a positive impact upon health
KO4 – Equality of
Opportunity
• Alternative fuel technology may reduce the cost of transport, thus improving accessibility to opportunity for all
KO5 – Quality of Life
and Local Environment
• Successful implementation of this policy was have a major positive impact upon quality and life and improvement of the natural and built environment
294The Coalitions’ Programme for Government
indicates that ‘The Government believes that
climate change is one of the gravest threats we
face and that urgent action at home and abroad
is required. We need to use a wide range of
levers to cut carbon emissions, decarbonise
the economy and support the creation of new
green jobs and technologies. We will implement
a full programme of measures to fulfil our joint
ambitions for a low carbon and eco-friendly
economy.’ More particularly, in the Transport
section of the Programme for Government, the
Coalition indicates that ‘We need to make the
transport sector greener and more sustainable,
with tougher emission standards and support for
new transport technologies.’
E. Major Influences on Low Carbon Technology Development
Transport is a major contributor to CO2 emissions
and consequently has a major role to play in the
reductions needed to meet our carbon targets.
Whilst we cannot rely on technological solutions
alone, particularly in the short term, they clearly
have a very significant part to play and need to
be seen alongside and complimentary to other
LTP policies aimed at modal shift, smarter choices
and managing our current networks to get the
absolute most out of them. It is therefore vital
that, LTP3 supports the national and regional
agenda for low carbon transport with appropriate
infrastructure to support a low carbon economy if
our Outcomes are to be fully realised.
295
Air quality issues and carbon generation are closely related. Local air pollution and global climate
change share common sources, transport related emissions being a major one. Black carbon (particles
resulting from the inefficient burning of, amongst other things, diesel fuel) and ozone are key contributors.
The real difference is that “Greenhouse Gases” causing climate change are most active high up in the
atmosphere, whereas pollutants nearer the earth’s surface impinge on air quality.
It is vital that the approach to low carbon transport in the Metropolitan Area is compatible with its wider
strategy for carbon reduction. Sustainability West Midlands’ Low Carbon Vision 2020 sets out what is
possible now in terms of energy, transport, construction and demographic change to reach 2020 in a
framework that reduces current levels of carbon use.
Reduced Carbon
Carbon Reduction, Climate Change Adaptation, Safeguarding the Natural Environment, Air Quality and Noise
Policy GT1 – Accelerated Low Carbon
Technology: To support the transformation to
a low carbon economy and work with partners
to reduce carbon emissions caused by travel
and transport through smarter choices, reduced
congestion, highway management and by
supporting in all practical ways, the roll-out of
low carbon infrastructure and the development
of low and zero carbon public service and private
vehicles
LTP3 has a major role to play in reducing carbon
emissions through behavioural change and the
promotion and use of low carbon technologies.
It also needs to demonstrate that infrastructure
is resilient to unavoidable climate change. The
national policy framework is set by the Climate
Change Act (2008) and the Government’s 2010
Action Plan – Beyond Copenhagen. The UK
Low Carbon Transition Plan and Low Carbon
Transport: A Greener Future set out how carbon
reduction can be delivered.
To help reduce carbon emissions travel of the
future is likely to encompass:
296•Virtual travel
•Electric cars
•Smart logistics
• Improved coach and bus travel
•Bike and car sharing
• Increased home working and internet
shopping to reduce the demand for travel
• Up to date information and journey
planning facilities for public transport
The Metropolitan Area has Low Carbon Economic
Area status. 70% of all UK low carbon vehicle
research and development occurs in the region,
which includes the CABLED project between
Birmingham and Coventry to trial 100 electric
cars (the largest such trial in the UK). The recent
regional growth into low carbon economy study
has confirmed the green job opportunities for the
transport sector.
A key area will be to develop practical cross-
sector solutions through the Business Futures
network, sharing good practice between large
companies and business networks such as
Chambers of Commerce, including sustainable
business travel. Centro’s recently launched Green
Transport Charter for the West Midlands: Moving
Ahead will share good practice with operators.
Measures such as a charging point strategy
for electric vehicles will be needed to translate
national initiatives into local action in the
Metropolitan Area.
Maintenance operations, both in terms of their
timing and materials and methods used can
impact on carbon emissions. This is discussed
further in under the Long Term Theme: Transport
Asset Management – A Foundation for Growth.
Policy GT 2: To seek innovative ways of reducing
the carbon footprint of maintenance operations
Adapting to unavoidable climate change
Irrespective of the success of mitigation efforts,
there will still be some degree of unavoidable
climate change that needs to be accommodated.
The 2009 UK Climate Projections, which use
the Met Office Hadley centre’s modelling tools,
suggest an increase in temperature on the
warmest summer days of between 2.26 and 2.48
degrees centigrade. Changes in temperature
may have adverse implications for transport
infrastructure for example, deformation of asphalt,
hardcore underpinning and rail tracks buckling.
This can lead to delays and have adverse effects
on passenger and worker safety.
There is also an increased risk of flooding as the
number of high precipitation events is projected
to increase by the 2020s, as seasonal extreme
rainfall increases and the combination of
culverted watercourses and hard standing areas
represents a relatively high susceptibility to surface
water flooding during intense rainfall. Again this
has the potential to damage infrastructure and
cause delays and poses safety issues.
297New transport infrastructure, especially hard
standing areas such as roads and car parks needs
to be constructed in a manner that is resilient to
climate change in terms of their design and use of
materials and features, such as Sustainable urban
Drainage Systems (SUDS); maintenance activities
also need to take this into account.
Policy GT3: To ensure that infrastructure is
‘future proofed’ in response to the unavoidable
effects of climate change
Active Travel, namely walking and cycling,
are encouraged through policies for modal
transfer. Green Infrastructure Networks include
parks, open spaces, playing fields, woodlands,
allotments and private gardens and also Green
Corridors (rivers and canals including their
banks, road and rail corridors, cycling routes,
pedestrian paths, and rights of way) and are
being implemented through local authorities’
development plans. The benefits of Green
Infrastructure networks include:
•Places for outdoor relaxation and play
• Space and habitat for wildlife with access
to nature for people
• Climate change adaptation - for example
flood alleviation, cooling urban heat
islands and species migration.
• Improved health and well-being – lowering
stress levels and providing opportunities for
exercise
Transport proposals and investment offer
the opportunity to contribute towards Green
Infrastructure Networks and to provide additional
Green Infrastructure.
Policy GT4: To support the implementation of
Green Infrastructure networks as a means of
encouraging active travel, adapting to climate
change and safeguarding natural habitats and
biodiversity
Safeguarding the Natural Environment
The development of transport infrastructure and
travel behaviour can have adverse impacts on
the natural environment through habitat loss,
disruption and severance, loss of visual amenity
and pollution. There are, safeguards in the form
of local authorities’ planning polices that must be
adhered to and project scheme level regulatory
assessments such as Environmental Impact
Assessment. A statutory Habitats Regulations
assessment has been undertaken to accompany
this plan.
Careful design at the scheme development stage
can help mitigate adverse effects and indeed
enhance the environment. Centro has recently
published a ‘Sustainable Design Guide’, which
identifies the types of measures that can be
incorporated as schemes develop. This includes
measures to safeguard and enhance biodiversity
and habitats, sustainable drainage and water
conservation measures and sensitive design
and mitigation measures such as planting to
safeguard landscapes and townscapes.
298In terms of water quality, the European Water Framework Directive requires the production of River
Basin Management Plans that set out actions to ensure that all water bodies (rivers, canals, lakes, and
groundwater) do not deteriorate from a baseline position and indeed move towards good ecological
quality. Plans are being prepared for the Severn and Humber that cover the Metropolitan Area. Transport
infrastructure can potentially cause water quality deterioration through the likes of run off and also during
construction. Conversely, new infrastructure and maintenance measures can help rectify existing problems
and issues need to be considered on a scheme-by-scheme basis.
Policy GT5: To develop infrastructure which, wherever practicable, enhances the natural environment
(biodiversity/habitats, air quality, water, landscape) or mitigates adverse effects
The Regeneration, Thriving centres and Gateways Long Term Theme supports the principle of the High
Speed 2 rail link. The proposal is a national priority and is being led by High Speed Two Limited, a
limited company set up by Government to consider the proposals further and advice is being provided by
statutory environmental bodies as appropriate. It is acknowledged that there will be adverse impacts on
the natural and historic environment as a result of its implementation and that these need to be mitigated
wherever practicable.
Policy GT6: To help mitigate any adverse effects on the natural and historic environment resulting
from the implementation of HS2
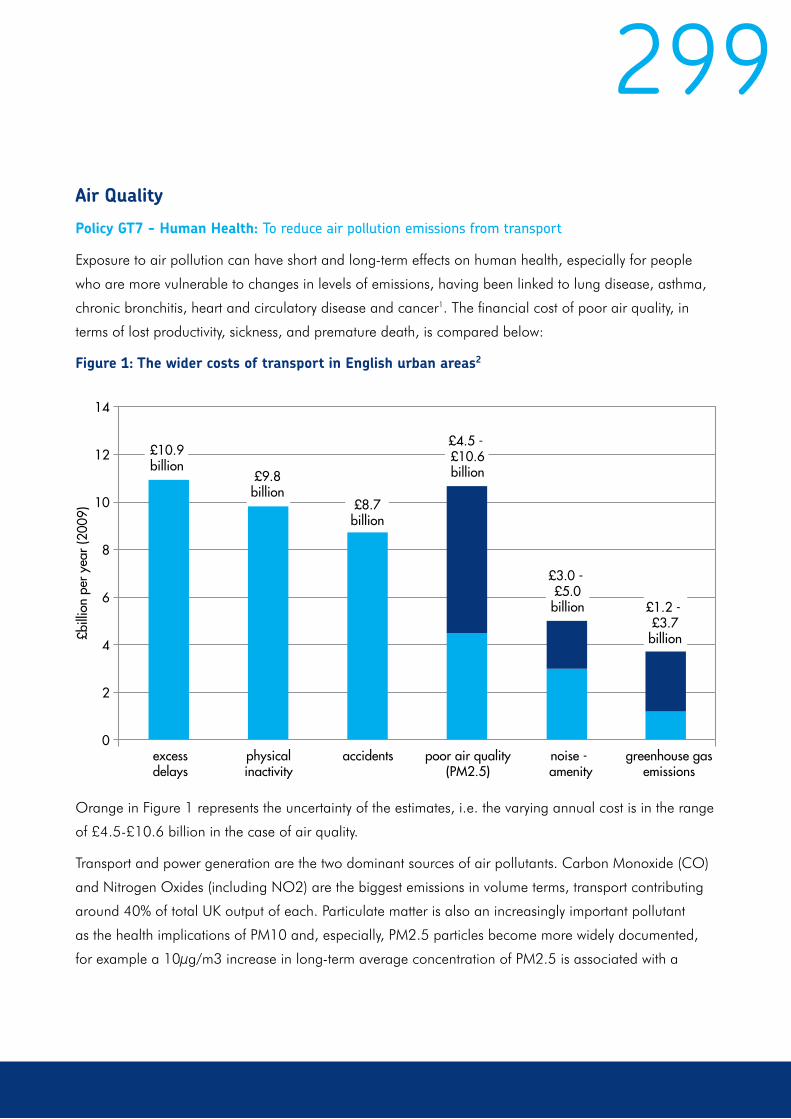
299Air Quality
Policy GT7 - Human Health: To reduce air pollution emissions from transport
Exposure to air pollution can have short and long-term effects on human health, especially for people
who are more vulnerable to changes in levels of emissions, having been linked to lung disease, asthma,
chronic bronchitis, heart and circulatory disease and cancer1. The financial cost of poor air quality, in
terms of lost productivity, sickness, and premature death, is compared below:
Figure 1: The wider costs of transport in English urban areas2
Orange in Figure 1 represents the uncertainty of the estimates, i.e. the varying annual cost is in the range
of £4.5-£10.6 billion in the case of air quality.
Transport and power generation are the two dominant sources of air pollutants. Carbon Monoxide (CO)
and Nitrogen Oxides (including NO2) are the biggest emissions in volume terms, transport contributing
around 40% of total UK output of each. Particulate matter is also an increasingly important pollutant
as the health implications of PM10 and, especially, PM2.5 particles become more widely documented,
for example a 10µg/m3 increase in long-term average concentration of PM2.5 is associated with a
14
12
10
8
6
4
2
0excessdelays
physicalinactivity
poor air quality(PM2.5)
noise - amenity
greenhouse gasemissions
accidents
£bill
ion
per y
ear (
2009
)
£10.9billion
£9.8billion
£8.7billion
£4.5 - £10.6billion
£3.0 - £5.0billion £1.2 -
£3.7billion

3006% increase in risk of death from cardiovascular disease. Reducing the levels of these pollutants in the
atmosphere will have a beneficial impact on the general health of the population.
High levels of NOX can have an adverse effect on vegetation, including leaf or needle damage and
reduced growth. Deposition of pollutants derived from NOX emissions contribute to acidification and/or
eutrophication of sensitive habitats leading to loss of biodiversity, often at locations far removed from the
original emissions.
Atmospheric pollution can also adversely affect the historic environment. Some major pollutants that
effect stonework include Carbon Dioxide (CO2), Sulphur Dioxide (SO2), Nitrogen Oxides (NOx) and
particulates such as smoke.
Figure 2: pollutant emissions from transport in the United Kingdom
(by United Nations Economic Commission for Europe source category): 20073
UK emissions (000 tonnes) 2007
Carbon Monoxide
Nitrogen Oxides
Particulates(PM10)
Sulphur Dioxide
Benzene Lead1,3-
butadiene
Road transport 785.7 441.3 24.7 2.3 2.2 1.7 1.3
Passenger cars 639.4 137.0 5.9 1.8 1.8 1.0 0.5
Light duty vehicles 44.7 54.7 4.4 0.2 0.2 0.2 0.1
Buses 4.4 46.9 0.8 - - - 0.1
HGVs 41.3 201.4 3.8 0.3 - 0.4 0.6
Mopeds & motorcycles 55.9 1.3 0.1 - 0.2 - 0.1
Automobile tyre & brake wear - - 9.6 - - - -
Gasoline evaporation - - - - 0.0 - -
Other transport, inc 64.9 165.7 9.1 52.1 1.2 0.9 0.2
Civil aviation 33.7 8.5 0.1 0.6 - - -
Railways 12.3 38.7 0.7 1.9 0.5 0.2 0.2
National navigation 11.2 109.3 7.9 48.9 0.6 0.6 -
Other mobile sources 1.8 4.8 0.4 0.4 - - -
All domestic transport 850.6 607.0 33.8 54.3 3.4 2.6 1.5
Total UK emissions 2,113.7 1,485.9 135.5 590.7 16.8 70.1 2.4

301Policy GT8 - Emissions Standards: To improve
local air quality in pursuit of UK standards and
European Directive limits
The standards that aim to identify “safe” levels
of pollutants are passed down to us from Europe
and Central Government. Breaches of the 40µg/
m3 standard for Nitrogen Dioxide (NO2) are the
most common trigger for declaring an Air Quality
Management Area (AQMA), within which an Air
Quality Action Plan will detail the measures to be
taken to reduce NO2. Borough-wide declarations
for average NO2 levels have been made in all
the Metropolitan Districts except Solihull, while
Birmingham has also declared an AQMA for
levels of PM10 particulates. The policies followed
by local Primary Care Trusts to tackle poor air
quality mirror those of the Local Authorities.
In August 2010 the seven West Midlands districts
were awarded a grant of £100,000 by Defra
to help implement a Low Emission Strategy for
the Met Area. It is intended that a 15-month
programme will start in April 2011 covering:
• The development of an overarching
regional Low Emissions Strategy including
transport and land use planning,
procurement and economic development
and bus and freight quality partnerships.
• The development of a regional LES
Supplementary Planning Document
• Regional best practice guidance on
procurement
• An investigation into the feasibility of Low
Emission Zones to restrict or deter the most
polluting vehicles.
These projects are aimed at reducing local NO2
levels from road transport with the ultimate goal
of achieving the National Air Quality Objective
Level, with the additional benefit of reducing
greenhouse gas emissions.

302Noise Pollution
Policy GT9 - Noise Nuisance: To minimise noise
nuisance from the transport network
The Noise Policy Statement for England (NPSE,
published March 2010) sets out the long-term
vision of Government noise policy, which is “to
promote good health and a good quality of life
through the management of noise within the
context of Government policy on sustainable
development.” The EU Environmental Noise
Directive (END), now transposed into UK law,
requires member states to undertake strategic
noise mapping to inform Action Plans to manage
noise from transport and industry. The Plans
encompass noise reduction and preservation
where it is already low. They set out a “direction
of travel” for managing noise, but do not yet
propose any mitigation measures. Responsibility
for implementing the plans falls on those bodies
that manage the infrastructure on which the
noise is generated (highway, rail and airport
authorities).
The local traffic-related noise problem is quite
serious. The Noise Action Plan for the West
Midlands states that over 2 million people within
the “agglomeration” are subject to some level of
traffic noise in a typical day. 9,000 are subject
to an average traffic noise level of a ringing
telephone for 18 hours a day. Equivalent figures
for Coventry are 313,000 and 1,000 respectively.
The EU 6th Action Programme “Environment
2010: Our Future, Our Choice” sets out an
aim for the noise climate of Europe: “to achieve
reduction of the number of people regularly
affected by long-term high noise levels from an
estimated 100 million people in the year 2000,
by around 10% in 2010 and by 20% in 2020.”
Priorities for Action:
•Clarifying the Metropolitan Area role in the
national policy context of electric vehicle
and other low carbon technology roll out
•Working with public transport operators
to ensure that carbon emissions are
minimised
•Centro and metropolitan districts will work
to ensure that infrastructure is ‘future
proofed’ in response to the unavoidable
effects of climate change
•Highways Authorities will continue to seek
innovative ways of reducing the carbon
footprint of their maintenance operations
•LTP partners will work to implement Green
Infrastructure networks as a means of
encouraging walking and cycling, adapting
to climate change and safeguarding
natural habitats and biodiversity
303•Centro will work with stakeholders to help
mitigate any adverse effects on the natural
and historic environment resulting from the
implementation of HS2
•Centro and LTP3 partners will work to
develop low carbon infrastructure which,
wherever practicable, enhances the natural
environment (biodiversity/habitats, water,
landscape) or mitigates adverse effects
•LTP3 supports the development of a Low
Emission Strategy for the Metropolitan Area
Sources of information:
1 House of Commons Environmental Audit Committee – Air Quality, 2010
2 The wider costs of transport in English urban areas in 2009, Cabinet Office
3 AEA Energy

If you require this document in a format more suited to your needs, please call 0121 214 7214 or email: [email protected]