Priority areas for watershed service conservation in the Guapi ...
21
RESEARCH Open Access Priority areas for watershed service conservation in the Guapi-Macacu region of Rio de Janeiro, Atlantic Forest, Brazil Vanesa Rodríguez Osuna 1,2* , Jan Börner 1 , Udo Nehren 2 , Rachel Bardy Prado 3 , Hartmut Gaese 1 and Jürgen Heinrich 4 Abstract Introduction: Land use intensification and urbanisation processes are degrading hydrological ecosystem services in the Guapi-Macacu watershed of Rio de Janeiro. A proposal to pay farmers to restore natural watershed services might be an alternative to securing the water supply in the long-term for the around 2.5 million urban water users in the study region. This study quantifies the costs of changing current land use patterns to enhance watershed services and compares these costs to the avoided costs associated with water treatment for public supply. Methods: We use farm-household data to estimate the opportunity costs of abandoning current land uses for the recovery of natural vegetation; a process that is very likely to improve water quality in terms of turbidity due to reduced inputs from erosion. Opportunity cost estimates are extrapolated to the watershed scale based on remote sensing land use classifications and vulnerability analysis to identify priority zones for watershed management interventions. To assess the potential demand for watershed services, we analyse water quality and treatment cost data from the main local water treatment plant. Results: Changing agricultural land uses for watershed services provision generally comes at high opportunity costs in our study area near to the metropolis of Rio de Janeiro. Alternative low cost watershed conservation options do exist in the livestock production sector. These options have the potential to directly reduce the amount of sediments and nutrients reaching the water bodies, and in turn decrease the costs of treatment needed for drinking water. Land cover changes at the scale needed to improve water quality will, nonetheless, likely exceed the cost of additional investments in water treatment. Conclusions: The state water utility company’s willingness to pay for watershed services alone will not be enough to induce provision of additional watershed services. We conclude that monetary incentives conditioned on specific adjustments to existing production systems could still have a complementary role to play in improving watershed services. However, we note that our willingness to pay analysis focusses on only one of the potentially wide range of ecosystem services provided by natural vegetation in the Guapi-Macacu watershed. Factoring these ecosystem services into the willingness to pay equation is likely to change our assessment in favour of additional conservation action, be it through PES or other policy instruments. Keywords: Water services; Drinking water treatment; Water quality; Incentive-based watershed management * Correspondence: [email protected] 1 Center for Development Research (ZEF), Department of Economic and Technological Change, University of Bonn, Walter-Flex-Str. 3, 53117 Bonn, Germany 2 Institute for Technology and Resources Management in the Tropics and Subtropics (ITT), Cologne University of Applied Sciences, Betzdorfer Str. 2, 50679 Cologne, Germany Full list of author information is available at the end of the article © 2014 Rodriguez Osuna et al.; licensee Springer. This is an Open Access article distributed under the terms of the Creative Commons Attribution License (http://creativecommons.org/licenses/by/4.0), which permits unrestricted use, distribution, and reproduction in any medium, provided the original work is properly cited. Rodríguez Osuna et al. Ecological Processes 2014, 3:16 http://www.ecologicalprocesses.com/content/3/1/16
-
Upload
khangminh22 -
Category
Documents
-
view
0 -
download
0
Transcript of Priority areas for watershed service conservation in the Guapi ...
Rodríguez Osuna et al. Ecological Processes 2014, 3:16http://www.ecologicalprocesses.com/content/3/1/16
RESEARCH Open Access
Priority areas for watershed service conservationin the Guapi-Macacu region of Rio de Janeiro,Atlantic Forest, BrazilVanesa Rodríguez Osuna1,2*, Jan Börner1, Udo Nehren2, Rachel Bardy Prado3, Hartmut Gaese1 and Jürgen Heinrich4
Abstract
Introduction: Land use intensification and urbanisation processes are degrading hydrological ecosystem services inthe Guapi-Macacu watershed of Rio de Janeiro. A proposal to pay farmers to restore natural watershed servicesmight be an alternative to securing the water supply in the long-term for the around 2.5 million urban water usersin the study region. This study quantifies the costs of changing current land use patterns to enhance watershedservices and compares these costs to the avoided costs associated with water treatment for public supply.
Methods: We use farm-household data to estimate the opportunity costs of abandoning current land uses for therecovery of natural vegetation; a process that is very likely to improve water quality in terms of turbidity due toreduced inputs from erosion. Opportunity cost estimates are extrapolated to the watershed scale based on remotesensing land use classifications and vulnerability analysis to identify priority zones for watershed managementinterventions. To assess the potential demand for watershed services, we analyse water quality and treatment costdata from the main local water treatment plant.
Results: Changing agricultural land uses for watershed services provision generally comes at high opportunity costsin our study area near to the metropolis of Rio de Janeiro. Alternative low cost watershed conservation options doexist in the livestock production sector. These options have the potential to directly reduce the amount ofsediments and nutrients reaching the water bodies, and in turn decrease the costs of treatment needed fordrinking water. Land cover changes at the scale needed to improve water quality will, nonetheless, likely exceedthe cost of additional investments in water treatment.
Conclusions: The state water utility company’s willingness to pay for watershed services alone will not be enoughto induce provision of additional watershed services. We conclude that monetary incentives conditioned on specificadjustments to existing production systems could still have a complementary role to play in improving watershedservices. However, we note that our willingness to pay analysis focusses on only one of the potentially wide rangeof ecosystem services provided by natural vegetation in the Guapi-Macacu watershed. Factoring these ecosystemservices into the willingness to pay equation is likely to change our assessment in favour of additional conservationaction, be it through PES or other policy instruments.
Keywords: Water services; Drinking water treatment; Water quality; Incentive-based watershed management
* Correspondence: [email protected] for Development Research (ZEF), Department of Economic andTechnological Change, University of Bonn, Walter-Flex-Str. 3, 53117 Bonn,Germany2Institute for Technology and Resources Management in the Tropics andSubtropics (ITT), Cologne University of Applied Sciences, Betzdorfer Str. 2, 50679Cologne, GermanyFull list of author information is available at the end of the article
© 2014 Rodriguez Osuna et al.; licensee Springer. This is an Open Access article distributed under the terms of the CreativeCommons Attribution License (http://creativecommons.org/licenses/by/4.0), which permits unrestricted use, distribution, andreproduction in any medium, provided the original work is properly cited.
Rodríguez Osuna et al. Ecological Processes 2014, 3:16 Page 2 of 21http://www.ecologicalprocesses.com/content/3/1/16
IntroductionOne of the biggest challenges of our time is to revert theongoing degradation of ecosystems while meeting the in-creasing demand for food and biomass (Thomas andCallan 2010; MEA 2005). Population and economic growthare increasing the demand for water resources and, at thesame time, amplifying the pressure on ecosystems that de-liver watershed services (Porras et al. 2008).The degradation of ecosystem services represents a
loss of widely undervalued natural capital assets (TEEB2009; Montes 2007); MEA 2005. While there is generalagreement that land use choices influence watershed ser-vice provision, the magnitude and nature of the effectsare highly context dependent and poorly understood intropical forest environments (Porras et al. 2008; Veiga2008; Calder 2005; van Noordwijk 2005).Land and water linkages are challenging to manage as
watershed services have a common good characteristic(Porras et al. 2008) and are generally unaccounted for inmonetary terms. As a result, they are often degradedand this is not reflected in traditional economic mea-sures, such as GDP (TEEB 2009; Costanza et al. 1997;FAO 2007). Land use patterns and land managementpractices by upstream landholders in a watershed deter-mine, to a great extent, quality and quantity of waterbodies (Porras et al. 2008). For example, unsustainableland use and agricultural practices can result in negativehydrological side-effects, or externalities, such as sedi-mentation (Veiga 2008; MEA 2005). As a result, the de-sign of policy measures that encourage farmers to adoptwatershed conservation measures and, at the same time,maintain or even increase productivity has become amajor research issue.Several policy options are available to enhance incen-
tives for the supply of ecosystem services. Command-and-control regulations, such as bans on forest clearing,have long been the preferred policy option to control en-vironmentally harmful land use changes (Boerner andVosti 2012; Porras et al. 2008; FAO 2007). More re-cently, mechanisms based on economic incentives ormarkets for ecosystem services are being proposed ascost-effective complementary tools to promote ecosys-tem service conservation (Porras et al. 2008; Engel et al.2008; FAO 2007). These incentive-based mechanisms in-clude payments for ecosystem services (PES) and pay-ments for watershed services (PWS), water qualitytrading markets and reciprocal or in-kind agreements(Bennett et al. 2013).Latin America registered a transaction value of USD
528.9 million in such investments between 2001 and 2011corresponding to 3.4 million hectares (Bennett et al.2013). PWS programmes are considered to be the “fastestgrowing” and most mature among all PES schemes inLatin America (Bennett et al. 2013; Balvanera et al. 2012;
Stanton et al. 2010). PWS in Latin America typicallyinvolve compensating upstream rural producers for pro-tecting and/or restoring natural forest ecosystems andhighland natural pastures (páramo) (Pria et al. 2013; Veigaand Galvadao 2011; Grieg-Gran et al. 2005). Such ecosys-tems are mostly located in strategic water productionareas, such as headwaters, riparian forest or water intakepoints for water supply (Pria et al. 2013; Veiga andGalvadao 2011). There is, however, little evidence on theeffectiveness of such schemes in meeting conservationand development goals in the peer-reviewed literature (seefor example Arriagada et al. 2012; Pattanayak et al. 2010).In Brazil, PWS are expanding and there are already 848
ecosystem service providers in the Atlantic Forest regionalone, mainly organised or supported within the NationalWater Agency’s Water Producer Programme (Veiga andGalvadao 2011; Santos et al. 2010). As of 2012, 41 PWSprojects had been implemented or were in preparation,covering an area of around 40,000 hectares. A project inthe state of Rio de Janeiro is currently in development, inthe Três Picos State Park, Municipality of Cachoeiras deMacacu (Guedes and Seehusen 2011). This State Park islocated in the mountainous area of the Guapi-Macacuwatershed, which contributes to the supply of drinkingwater for almost 2.5 million inhabitants of five municipal-ities, including the city of Niteroi (Pedreira et al. 2009)and this watershed is the focus of the present study. Themain drivers of degradation of water resources in thiswatershed are urbanisation processes, intensive agricultureand conversion of riparian vegetation.Managing watershed services requires solid knowledge
about (1) the costs of providing an additional unit ofwater quality or quantity (supply side) and (2) waterusers or intermediaries’ willingness to pay for an add-itional unit of water quality or quantity (demand side).The economic aspects of watershed services supply anddemand are particularly poorly studied and many PWSinitiatives begin operating without quantitative know-ledge of such parameters (Martin-Ortega et al. 2012). Toaddress this knowledge gap, we focus on two researchquestions within our study area of the Guapi-Macacuwatershed in the state of Rio de Janeiro:
1. What are the costs associated with shifting land usesto foster improved and enhanced watershed services(services supply)?
2. What are the treatment costs for the water supplycompany to improve water quality parameters suchas turbidity?
Our focus is on understanding the supply and environ-mental conditions that determine watershed serviceprovision. Particularly, we concentrate on the watershedservice related to water quality maintenance in terms of
Rodríguez Osuna et al. Ecological Processes 2014, 3:16 Page 3 of 21http://www.ecologicalprocesses.com/content/3/1/16
turbidity reduction for supplying drinking water. However,we also analyse factors that influence water treatment costs(related to services demand) based on land use changes.The remainder of this paper is structured as follows, sec-tion “Assessing watershed services supply and demand”presents our approach, addresses relevant literature andconcepts related to watershed service supply and demand,section “Methods” describes the study area and methodsused for this research, section “Results” presents our find-ings, section “Discussion” discusses these findings and con-textualises them with other studies and reviews the maincaveats. Finally, section “Conclusions” presents our mainconclusions and the policy implications for watershedservice management.
Assessing watershed services supply and demandThe supply of watershed servicesWatershed service provision is to a large extent deter-mined by land use and land cover. For example, unsus-tainable land use is frequently linked to a high surfacerunoff and an elevated concentration of suspended andsoluble loads in water bodies (Batchelor et al. 1998).Changes in land cover, such as forest to agriculture con-version, tend to increase superficial runoff and sedimentflux in rivers (FAO 2007; MEA 2005).Healthy forest and wetland ecosystems are considered
very effective at regulating water flow and improvingwater quality (Russi et al. 2013; TEEB 2010a,b). Main-taining water quality includes the control of sediment,nutrient (in particular phosphorous and nitrogen) andchemical loads, as well as salinity (TEEB 2010b). Inaddition, forest ecosystems can remove pathogenic mi-crobes, sequester and convert inorganic ions and trans-form persistent organic pollutants (TEEB 2010b).Watersheds with an important extension of forest tend
to offer better water quality than those subject to otherland uses, such as agriculture, pasture, industry andurban infrastructure, since the latter are associated withhigher discharges of diverse types of pollutants into soilsand water. In this way, the presence of forest could sub-stantially reduce the cost of water treatment for drinkingwater in most cases, thereby reducing the related costsfor water supply (Medeiros et al. 2011; Reis 2004).Cities such as Rio de Janeiro, Johannesburg, Tokyo,
Melbourne, New York and Jakarta all depend on pro-tected areas with forests to provide drinking water fortheir residents (Dudley and Stolton 2003). Moreover, athird of the hundred largest cities worldwide take a sig-nificant proportion of their drinking water from pro-tected forested areas (Dudley and Stolton 2003).Worldwide several examples show that well-managed
forests, wetlands and protected areas are very likely to sup-ply clean water at significantly lower costs than man-madereplacements, such as water treatment plants (Bennett et al.
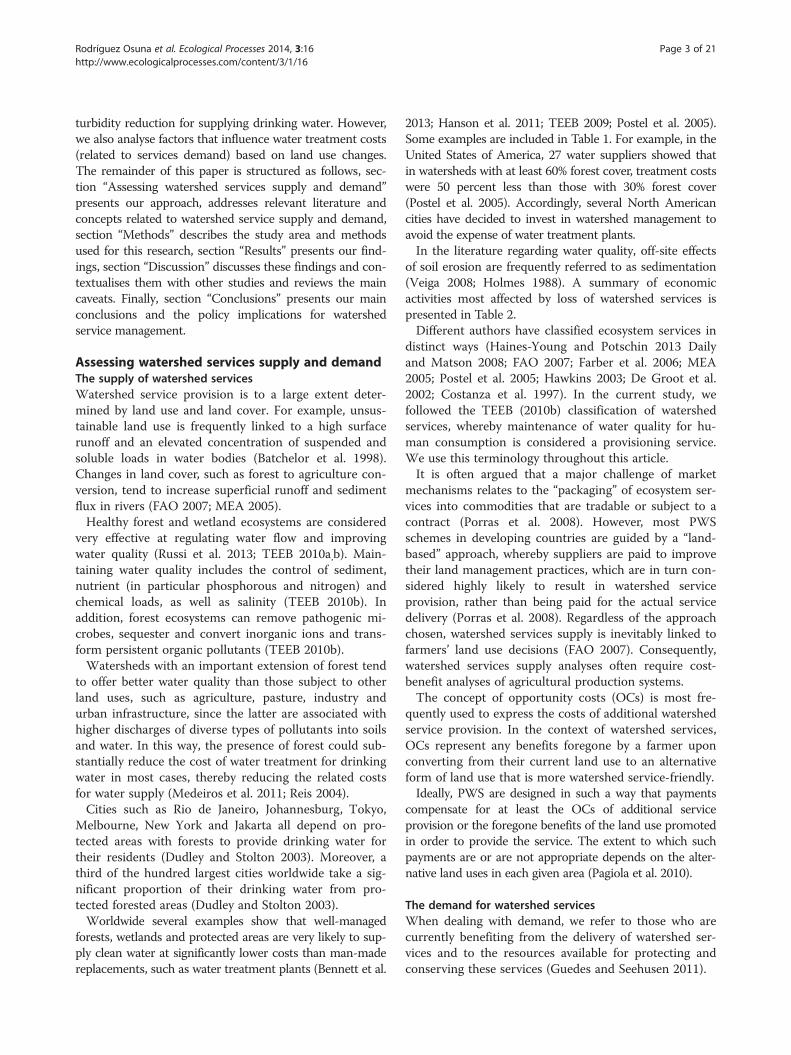
2013; Hanson et al. 2011; TEEB 2009; Postel et al. 2005).Some examples are included in Table 1. For example, in theUnited States of America, 27 water suppliers showed thatin watersheds with at least 60% forest cover, treatment costswere 50 percent less than those with 30% forest cover(Postel et al. 2005). Accordingly, several North Americancities have decided to invest in watershed management toavoid the expense of water treatment plants.In the literature regarding water quality, off-site effects
of soil erosion are frequently referred to as sedimentation(Veiga 2008; Holmes 1988). A summary of economicactivities most affected by loss of watershed services ispresented in Table 2.Different authors have classified ecosystem services in
distinct ways (Haines-Young and Potschin 2013 Dailyand Matson 2008; FAO 2007; Farber et al. 2006; MEA2005; Postel et al. 2005; Hawkins 2003; De Groot et al.2002; Costanza et al. 1997). In the current study, wefollowed the TEEB (2010b) classification of watershedservices, whereby maintenance of water quality for hu-man consumption is considered a provisioning service.We use this terminology throughout this article.It is often argued that a major challenge of market
mechanisms relates to the “packaging” of ecosystem ser-vices into commodities that are tradable or subject to acontract (Porras et al. 2008). However, most PWSschemes in developing countries are guided by a “land-based” approach, whereby suppliers are paid to improvetheir land management practices, which are in turn con-sidered highly likely to result in watershed serviceprovision, rather than being paid for the actual servicedelivery (Porras et al. 2008). Regardless of the approachchosen, watershed services supply is inevitably linked tofarmers’ land use decisions (FAO 2007). Consequently,watershed services supply analyses often require cost-benefit analyses of agricultural production systems.The concept of opportunity costs (OCs) is most fre-
quently used to express the costs of additional watershedservice provision. In the context of watershed services,OCs represent any benefits foregone by a farmer uponconverting from their current land use to an alternativeform of land use that is more watershed service-friendly.Ideally, PWS are designed in such a way that payments
compensate for at least the OCs of additional serviceprovision or the foregone benefits of the land use promotedin order to provide the service. The extent to which suchpayments are or are not appropriate depends on the alter-native land uses in each given area (Pagiola et al. 2010).
The demand for watershed servicesWhen dealing with demand, we refer to those who arecurrently benefiting from the delivery of watershed ser-vices and to the resources available for protecting andconserving these services (Guedes and Seehusen 2011).
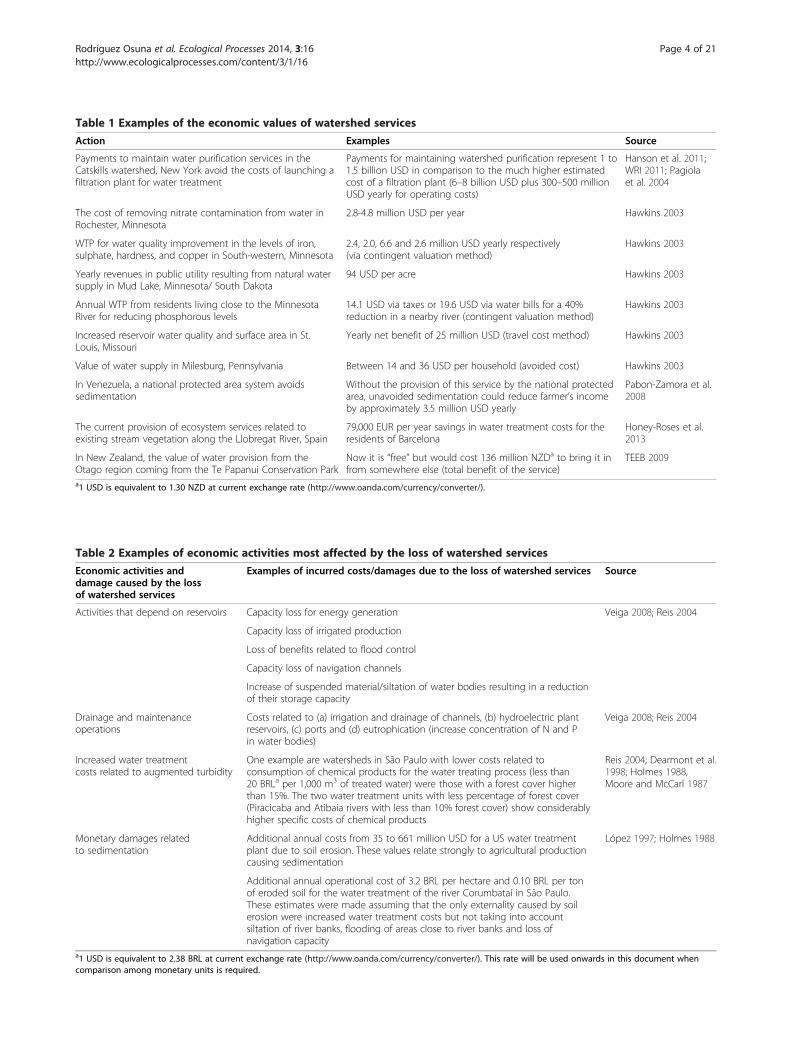
Table 1 Examples of the economic values of watershed services
Action Examples Source
Payments to maintain water purification services in theCatskills watershed, New York avoid the costs of launching afiltration plant for water treatment
Payments for maintaining watershed purification represent 1 to1.5 billion USD in comparison to the much higher estimatedcost of a filtration plant (6–8 billion USD plus 300–500 millionUSD yearly for operating costs)
Hanson et al. 2011;WRI 2011; Pagiolaet al. 2004
The cost of removing nitrate contamination from water inRochester, Minnesota
2.8-4.8 million USD per year Hawkins 2003
WTP for water quality improvement in the levels of iron,sulphate, hardness, and copper in South-western, Minnesota
2.4, 2.0, 6.6 and 2.6 million USD yearly respectively(via contingent valuation method)
Hawkins 2003
Yearly revenues in public utility resulting from natural watersupply in Mud Lake, Minnesota/ South Dakota
94 USD per acre Hawkins 2003
Annual WTP from residents living close to the MinnesotaRiver for reducing phosphorous levels
14.1 USD via taxes or 19.6 USD via water bills for a 40%reduction in a nearby river (contingent valuation method)
Hawkins 2003
Increased reservoir water quality and surface area in St.Louis, Missouri
Yearly net benefit of 25 million USD (travel cost method) Hawkins 2003
Value of water supply in Milesburg, Pennsylvania Between 14 and 36 USD per household (avoided cost) Hawkins 2003
In Venezuela, a national protected area system avoidssedimentation
Without the provision of this service by the national protectedarea, unavoided sedimentation could reduce farmer’s incomeby approximately 3.5 million USD yearly
Pabon-Zamora et al.2008
The current provision of ecosystem services related toexisting stream vegetation along the Llobregat River, Spain
79,000 EUR per year savings in water treatment costs for theresidents of Barcelona
Honey-Roses et al.2013
In New Zealand, the value of water provision from theOtago region coming from the Te Papanui Conservation Park
Now it is “free” but would cost 136 million NZDa to bring it infrom somewhere else (total benefit of the service)
TEEB 2009
a1 USD is equivalent to 1.30 NZD at current exchange rate (http://www.oanda.com/currency/converter/).
Table 2 Examples of economic activities most affected by the loss of watershed services
Economic activities anddamage caused by the lossof watershed services
Examples of incurred costs/damages due to the loss of watershed services Source
Activities that depend on reservoirs Capacity loss for energy generation Veiga 2008; Reis 2004
Capacity loss of irrigated production
Loss of benefits related to flood control
Capacity loss of navigation channels
Increase of suspended material/siltation of water bodies resulting in a reductionof their storage capacity
Drainage and maintenanceoperations
Costs related to (a) irrigation and drainage of channels, (b) hydroelectric plantreservoirs, (c) ports and (d) eutrophication (increase concentration of N and Pin water bodies)
Veiga 2008; Reis 2004
Increased water treatmentcosts related to augmented turbidity
One example are watersheds in São Paulo with lower costs related toconsumption of chemical products for the water treating process (less than20 BRLa per 1,000 m3 of treated water) were those with a forest cover higherthan 15%. The two water treatment units with less percentage of forest cover(Piracicaba and Atibaia rivers with less than 10% forest cover) show considerablyhigher specific costs of chemical products
Reis 2004; Dearmont et al.1998; Holmes 1988,Moore and McCarl 1987
Monetary damages relatedto sedimentation
Additional annual costs from 35 to 661 million USD for a US water treatmentplant due to soil erosion. These values relate strongly to agricultural productioncausing sedimentation
López 1997; Holmes 1988
Additional annual operational cost of 3.2 BRL per hectare and 0.10 BRL per tonof eroded soil for the water treatment of the river Corumbataí in São Paulo.These estimates were made assuming that the only externality caused by soilerosion were increased water treatment costs but not taking into accountsiltation of river banks, flooding of areas close to river banks and loss ofnavigation capacity
a1 USD is equivalent to 2.38 BRL at current exchange rate (http://www.oanda.com/currency/converter/). This rate will be used onwards in this document whencomparison among monetary units is required.
Rodríguez Osuna et al. Ecological Processes 2014, 3:16 Page 4 of 21http://www.ecologicalprocesses.com/content/3/1/16
Rodríguez Osuna et al. Ecological Processes 2014, 3:16 Page 5 of 21http://www.ecologicalprocesses.com/content/3/1/16
Besides PWS, which are carried out by national statesin Latin America, a user’s fee system can be an effectiveapproach to efficiently use water resources. The water-sheds of the rivers Piracicaba, Capivari and Jundiaí (PCJ)in the state of São Paulo have implemented such a user’sfee system with around 8.8 million of beneficiaries of theCantareira system (Veiga and Galvadao 2011). In thissituation, an Inter-Municipal Basin Committee wasformed to manage a watershed protection fund and con-tributions to the fund come from the municipal waterutility budgets.As a further alternative, some programmes in the Atlantic
Forest region are subsidised by the government, for ex-ample: “Bolsa Verde”, “ProdutorES de Água” and “MinaD’água” in the states of Minas Gerais, Espírito Santo andSão Paulo, which pay rural producers for conservation ac-tivities on their properties (Guedes and Seehusen 2011).These include the protection or restoration of native vege-tation areas with a focus on headwaters and riparian forests(Guedes and Seehusen 2011; Veiga and Galvadao 2011).Another significant source of finance for PWS in devel-
oping countries comes from the international public sectorfunding or development assistance (Porras et al. 2008). Akey provider to this funding is the Global EnvironmentalFacility (GEF), which acts as buyer on behalf of serviceusers for conserving global public services. Around 108million USD and 52 million USD have been made availableas World Bank (WB) loans and GEF grants respectively forWB/GEF-supported PWS projects (FAO 2007). For ex-ample, the World Bank has given loans to support the
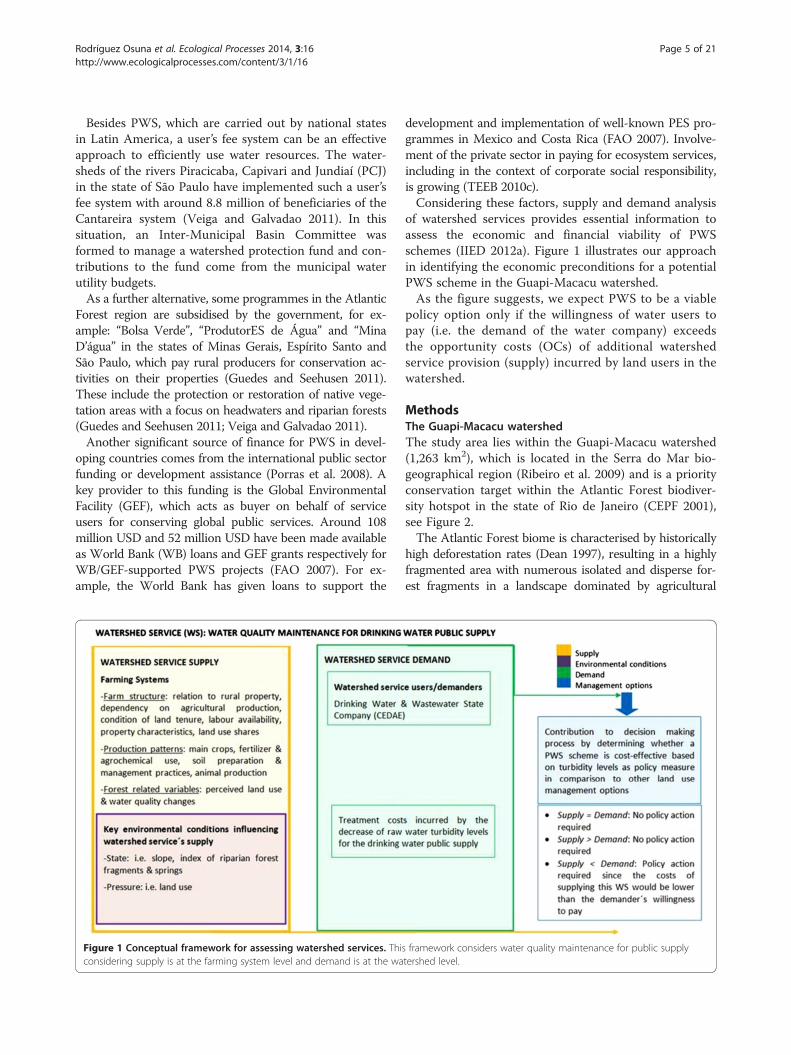
Figure 1 Conceptual framework for assessing watershed services. Thiconsidering supply is at the farming system level and demand is at the wa
development and implementation of well-known PES pro-grammes in Mexico and Costa Rica (FAO 2007). Involve-ment of the private sector in paying for ecosystem services,including in the context of corporate social responsibility,is growing (TEEB 2010c).Considering these factors, supply and demand analysis
of watershed services provides essential information toassess the economic and financial viability of PWSschemes (IIED 2012a). Figure 1 illustrates our approachin identifying the economic preconditions for a potentialPWS scheme in the Guapi-Macacu watershed.As the figure suggests, we expect PWS to be a viable
policy option only if the willingness of water users topay (i.e. the demand of the water company) exceedsthe opportunity costs (OCs) of additional watershedservice provision (supply) incurred by land users in thewatershed.
MethodsThe Guapi-Macacu watershedThe study area lies within the Guapi-Macacu watershed(1,263 km2), which is located in the Serra do Mar bio-geographical region (Ribeiro et al. 2009) and is a priorityconservation target within the Atlantic Forest biodiver-sity hotspot in the state of Rio de Janeiro (CEPF 2001),see Figure 2.The Atlantic Forest biome is characterised by historically
high deforestation rates (Dean 1997), resulting in a highlyfragmented area with numerous isolated and disperse for-est fragments in a landscape dominated by agricultural
s framework considers water quality maintenance for public supplytershed level.
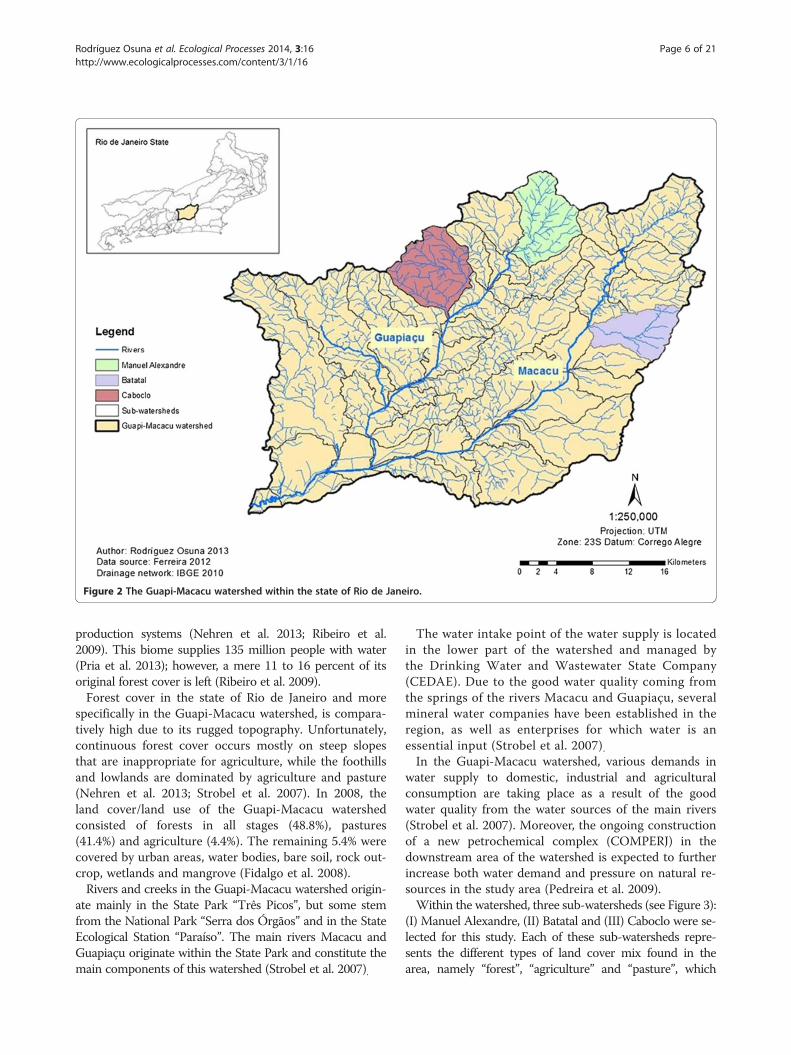
Figure 2 The Guapi-Macacu watershed within the state of Rio de Janeiro.
Rodríguez Osuna et al. Ecological Processes 2014, 3:16 Page 6 of 21http://www.ecologicalprocesses.com/content/3/1/16
production systems (Nehren et al. 2013; Ribeiro et al.2009). This biome supplies 135 million people with water(Pria et al. 2013); however, a mere 11 to 16 percent of itsoriginal forest cover is left (Ribeiro et al. 2009).Forest cover in the state of Rio de Janeiro and more
specifically in the Guapi-Macacu watershed, is compara-tively high due to its rugged topography. Unfortunately,continuous forest cover occurs mostly on steep slopesthat are inappropriate for agriculture, while the foothillsand lowlands are dominated by agriculture and pasture(Nehren et al. 2013; Strobel et al. 2007). In 2008, theland cover/land use of the Guapi-Macacu watershedconsisted of forests in all stages (48.8%), pastures(41.4%) and agriculture (4.4%). The remaining 5.4% werecovered by urban areas, water bodies, bare soil, rock out-crop, wetlands and mangrove (Fidalgo et al. 2008).Rivers and creeks in the Guapi-Macacu watershed origin-
ate mainly in the State Park “Três Picos”, but some stemfrom the National Park “Serra dos Órgãos” and in the StateEcological Station “Paraíso”. The main rivers Macacu andGuapiaçu originate within the State Park and constitute themain components of this watershed (Strobel et al. 2007).
The water intake point of the water supply is locatedin the lower part of the watershed and managed bythe Drinking Water and Wastewater State Company(CEDAE). Due to the good water quality coming fromthe springs of the rivers Macacu and Guapiaçu, severalmineral water companies have been established in theregion, as well as enterprises for which water is anessential input (Strobel et al. 2007).In the Guapi-Macacu watershed, various demands in
water supply to domestic, industrial and agriculturalconsumption are taking place as a result of the goodwater quality from the water sources of the main rivers(Strobel et al. 2007). Moreover, the ongoing constructionof a new petrochemical complex (COMPERJ) in thedownstream area of the watershed is expected to furtherincrease both water demand and pressure on natural re-sources in the study area (Pedreira et al. 2009).Within the watershed, three sub-watersheds (see Figure 3):
(I) Manuel Alexandre, (II) Batatal and (III) Caboclo were se-lected for this study. Each of these sub-watersheds repre-sents the different types of land cover mix found in thearea, namely “forest”, “agriculture” and “pasture”, which
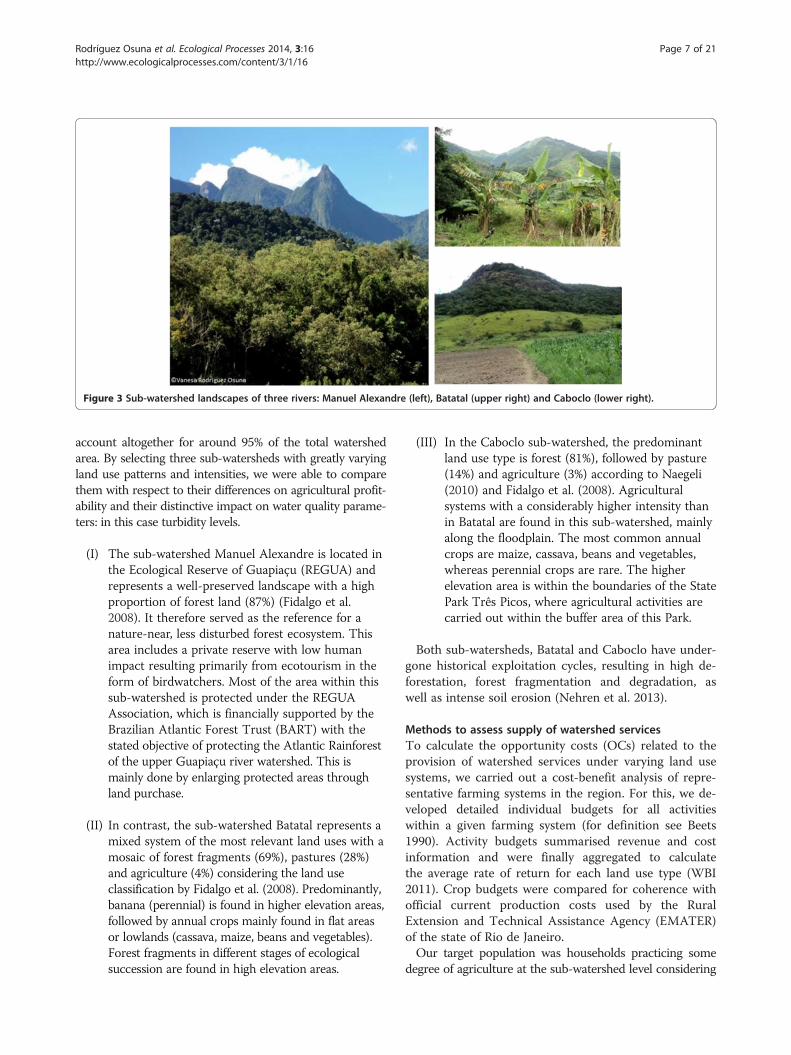
Figure 3 Sub-watershed landscapes of three rivers: Manuel Alexandre (left), Batatal (upper right) and Caboclo (lower right).
Rodríguez Osuna et al. Ecological Processes 2014, 3:16 Page 7 of 21http://www.ecologicalprocesses.com/content/3/1/16
account altogether for around 95% of the total watershedarea. By selecting three sub-watersheds with greatly varyingland use patterns and intensities, we were able to comparethem with respect to their differences on agricultural profit-ability and their distinctive impact on water quality parame-ters: in this case turbidity levels.
(I) The sub-watershed Manuel Alexandre is located inthe Ecological Reserve of Guapiaçu (REGUA) andrepresents a well-preserved landscape with a highproportion of forest land (87%) (Fidalgo et al.2008). It therefore served as the reference for anature-near, less disturbed forest ecosystem. Thisarea includes a private reserve with low humanimpact resulting primarily from ecotourism in theform of birdwatchers. Most of the area within thissub-watershed is protected under the REGUAAssociation, which is financially supported by theBrazilian Atlantic Forest Trust (BART) with thestated objective of protecting the Atlantic Rainforestof the upper Guapiaçu river watershed. This ismainly done by enlarging protected areas throughland purchase.
(II) In contrast, the sub-watershed Batatal represents amixed system of the most relevant land uses with amosaic of forest fragments (69%), pastures (28%)and agriculture (4%) considering the land useclassification by Fidalgo et al. (2008). Predominantly,banana (perennial) is found in higher elevation areas,followed by annual crops mainly found in flat areasor lowlands (cassava, maize, beans and vegetables).Forest fragments in different stages of ecologicalsuccession are found in high elevation areas.
(III) In the Caboclo sub-watershed, the predominantland use type is forest (81%), followed by pasture(14%) and agriculture (3%) according to Naegeli(2010) and Fidalgo et al. (2008). Agriculturalsystems with a considerably higher intensity thanin Batatal are found in this sub-watershed, mainlyalong the floodplain. The most common annualcrops are maize, cassava, beans and vegetables,whereas perennial crops are rare. The higherelevation area is within the boundaries of the StatePark Três Picos, where agricultural activities arecarried out within the buffer area of this Park.
Both sub-watersheds, Batatal and Caboclo have under-gone historical exploitation cycles, resulting in high de-forestation, forest fragmentation and degradation, aswell as intense soil erosion (Nehren et al. 2013).
Methods to assess supply of watershed servicesTo calculate the opportunity costs (OCs) related to theprovision of watershed services under varying land usesystems, we carried out a cost-benefit analysis of repre-sentative farming systems in the region. For this, we de-veloped detailed individual budgets for all activitieswithin a given farming system (for definition see Beets1990). Activity budgets summarised revenue and costinformation and were finally aggregated to calculatethe average rate of return for each land use type (WBI2011). Crop budgets were compared for coherence withofficial current production costs used by the RuralExtension and Technical Assistance Agency (EMATER)of the state of Rio de Janeiro.Our target population was households practicing some
degree of agriculture at the sub-watershed level considering
Rodríguez Osuna et al. Ecological Processes 2014, 3:16 Page 8 of 21http://www.ecologicalprocesses.com/content/3/1/16
the sub-watersheds of Batatal and Caboclo. A householdsurvey was carried out in two field campaigns in 2011 and2012 with the permanent support of key local producers,EMATER of the municipality of Cachoeiras de Macacu, theCity Council of this municipality and Embrapa Soils scien-tists. Expert interviews were carried out with the Directorof the REGUA Reserve and other staff members in ManuelAlexandre sub-watershed, to better understand land usehistory and recent management practices in the region.To define the sample universe, we created an inventory
using the indirect census technique following Forero(2002). This process consisted of a participatory mappingexercise based on recent aerial imagery provided by theCity Council of Cachoeiras de Macacu. This enabled us toassemble a list of all farm units within the sub-watersheds,which was confirmed by extensive field visits andsupported thoroughly by local experts including a memberof the Agricultural Department of the City Council(Cachoeiras de Macacu), the President of the FaraóFarmer’s Association (A.L.A.F.) in the sub-watershed ofBatatal, a member of the Rural Workers Union (in thesub-watershed of Caboclo) and the Director of the REGUAReserve (Manuel Alexandre sub-watershed). As a result, atotal of 32 households in Batatal and 60 in Caboclo wereidentified, of which 78 households within the two populatedsub-watersheds were interviewed using a semi-structuredsurvey. No interviews were made in the reference site ofManuel Alexandre sub-watershed. The sample size ob-tained is supported by Angelsen et al. (2011), who suggest aminimum sample size of 25–30 households from eachcommunity. This is valid for communities with 100 to 500families. The designed questionnaire was based on variousscientific publications and reports (see Rodriguez Osuna2013; Angelsen et al. 2011; WBI 2011; Gaese 2009; InstitutoTerra Mater 2009; Forero 2002).Throughout the course of our fieldwork, two survey
rounds were carried out. The first survey round included arandom sampling of farm units within each sub-watershedto define “representative farming systems”. Important se-lection criteria for these farming systems as suggested byZimmer et al. (2009) and local experts included mainly:farm size, land tenure, production programme and agricul-tural management practices, and average location of farmsin terms of metres above sea level (m.a.s.l.).Once such farming systems were defined, a second
survey round was launched to explore in-depth charac-teristics of farming systems with special attention to theinputs and outputs that are relevant to profitabilityamong such systems.In the sub-watershed of Batatal, we divided the farm-
ing systems by location in upland versus lowland, sincethis division significantly affects production patterns.Farm units in the uplands are located at an average alti-tude of 344 m.a.s.l. in contrast to those in the lowlands
located at ca. 83 m.a.s.l. Agricultural production in thelowlands of Batatal is comparable to those sub-watershedslocated along the Macacu River. The same occurs inCaboclo, which is representative for sub-watersheds alongthe Guapiaçu River (Figure 2).Subsequently, a cost-benefit analysis was carried out
for each farming system. The occurrence of each farm-ing system was estimated and validated through local ex-pert consultation as suggested by Angelsen et al. (2011).Our sampling strategy focused on capturing the diver-
sity of smallholder production systems in the region, yetour total sample size was too small to obtain a represen-tative sub-sample of the large cattle operations thatdominate in the lower part of the watershed. For thecost-benefit analysis of cattle production systems, wethus relied on additional in-depth interviews with agroup of livestock producers deemed representative byofficers of EMATER.Based on interviews with selected livestock producers
and secondary data on livestock systems in this area (seeQuintana 2012), we calculated livestock activity budgetsfor three slope categories: 1) ≤15°; 2) 16-25° and 3) >25°.These budgets were calculated under the assumptionthat profits for livestock production decreased with in-creasing slope, because of lower productivity of pasture,among other factors. This assumption is based on inter-views with local farmers.Once profits for agricultural and livestock systems were
obtained, they were extrapolated to the watershed levelusing a Landsat based land cover classification that identi-fied “agriculture” and “pasture” areas (Pedreira et al. 2009;Fidalgo et al. 2008). The agricultural profit calculated inthe selected sub-watersheds (only considering lowlandareas) was applied to all sub-watersheds in the same rivernetwork. In the sub-watershed of Batatal, we dividedfarming systems located in uplands and lowlands sincethis division influences significantly production patterns.This was not necessary in the Caboclo sub-watershed,where all farming systems are located in the lowlands.The profit derived from farming systems is equal to
the opportunity cost of converting agricultural or pas-toral lands to forest, thereby reducing turbidity. For ex-ample low OCs are associated with low profits fromcurrent land use. Per hectare OC estimates for each sub-watershed thus represent the weighted average per hec-tare profits from the respective land cover types.We relied on a spatial analysis of the vulnerability of
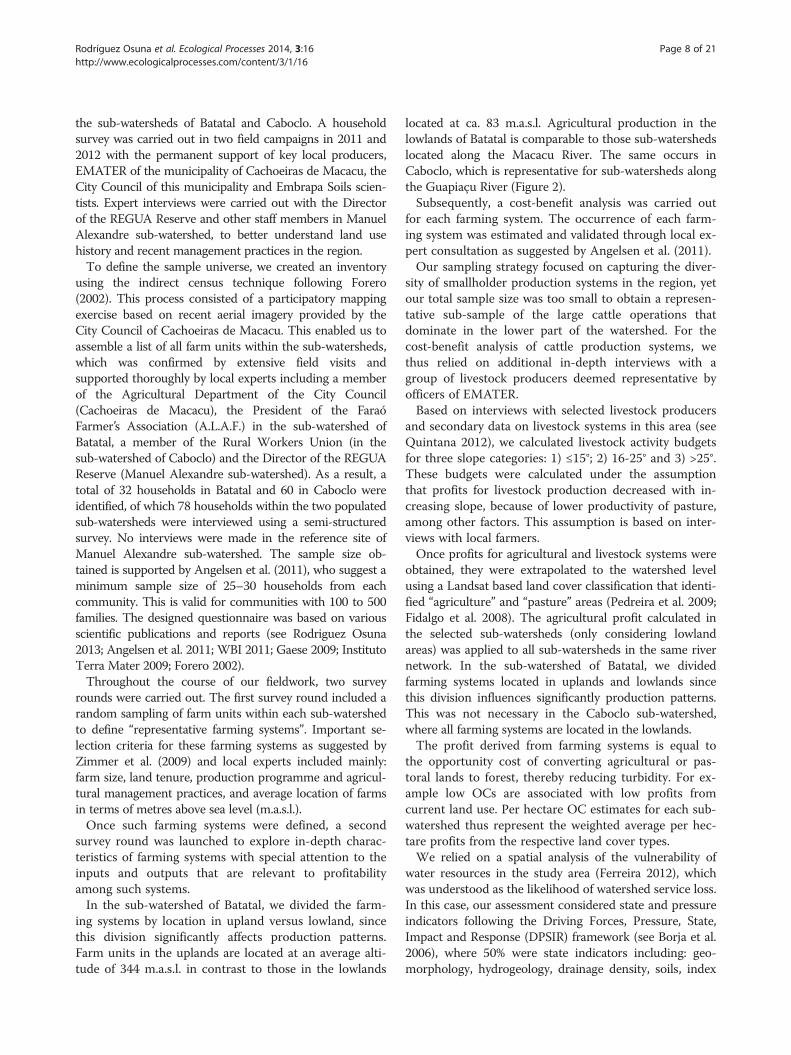
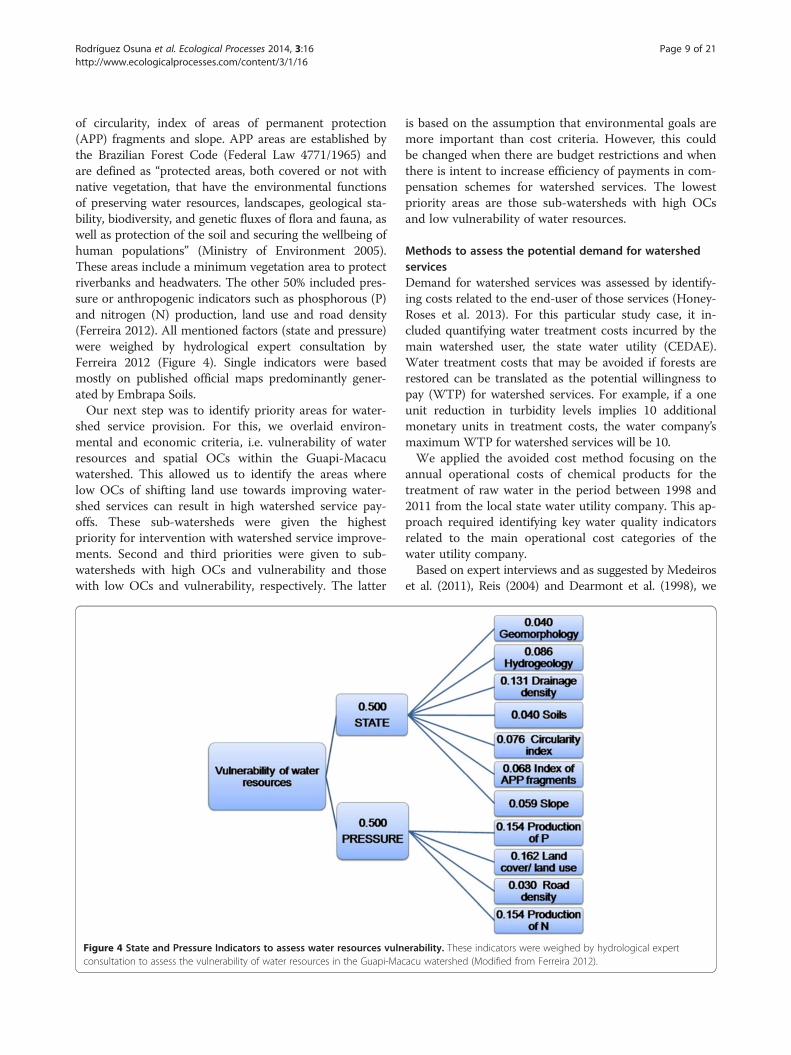
water resources in the study area (Ferreira 2012), whichwas understood as the likelihood of watershed service loss.In this case, our assessment considered state and pressureindicators following the Driving Forces, Pressure, State,Impact and Response (DPSIR) framework (see Borja et al.2006), where 50% were state indicators including: geo-morphology, hydrogeology, drainage density, soils, index
Rodríguez Osuna et al. Ecological Processes 2014, 3:16 Page 9 of 21http://www.ecologicalprocesses.com/content/3/1/16
of circularity, index of areas of permanent protection(APP) fragments and slope. APP areas are established bythe Brazilian Forest Code (Federal Law 4771/1965) andare defined as “protected areas, both covered or not withnative vegetation, that have the environmental functionsof preserving water resources, landscapes, geological sta-bility, biodiversity, and genetic fluxes of flora and fauna, aswell as protection of the soil and securing the wellbeing ofhuman populations” (Ministry of Environment 2005).These areas include a minimum vegetation area to protectriverbanks and headwaters. The other 50% included pres-sure or anthropogenic indicators such as phosphorous (P)and nitrogen (N) production, land use and road density(Ferreira 2012). All mentioned factors (state and pressure)were weighed by hydrological expert consultation byFerreira 2012 (Figure 4). Single indicators were basedmostly on published official maps predominantly gener-ated by Embrapa Soils.Our next step was to identify priority areas for water-
shed service provision. For this, we overlaid environ-mental and economic criteria, i.e. vulnerability of waterresources and spatial OCs within the Guapi-Macacuwatershed. This allowed us to identify the areas wherelow OCs of shifting land use towards improving water-shed services can result in high watershed service pay-offs. These sub-watersheds were given the highestpriority for intervention with watershed service improve-ments. Second and third priorities were given to sub-watersheds with high OCs and vulnerability and thosewith low OCs and vulnerability, respectively. The latter
Figure 4 State and Pressure Indicators to assess water resources vulnconsultation to assess the vulnerability of water resources in the Guapi-Mac
is based on the assumption that environmental goals aremore important than cost criteria. However, this couldbe changed when there are budget restrictions and whenthere is intent to increase efficiency of payments in com-pensation schemes for watershed services. The lowestpriority areas are those sub-watersheds with high OCsand low vulnerability of water resources.
Methods to assess the potential demand for watershedservicesDemand for watershed services was assessed by identify-ing costs related to the end-user of those services (Honey-Roses et al. 2013). For this particular study case, it in-cluded quantifying water treatment costs incurred by themain watershed user, the state water utility (CEDAE).Water treatment costs that may be avoided if forests arerestored can be translated as the potential willingness topay (WTP) for watershed services. For example, if a oneunit reduction in turbidity levels implies 10 additionalmonetary units in treatment costs, the water company’smaximum WTP for watershed services will be 10.We applied the avoided cost method focusing on the
annual operational costs of chemical products for thetreatment of raw water in the period between 1998 and2011 from the local state water utility company. This ap-proach required identifying key water quality indicatorsrelated to the main operational cost categories of thewater utility company.Based on expert interviews and as suggested by Medeiros
et al. (2011), Reis (2004) and Dearmont et al. (1998), we
erability. These indicators were weighed by hydrological expertacu watershed (Modified from Ferreira 2012).
Rodríguez Osuna et al. Ecological Processes 2014, 3:16 Page 10 of 21http://www.ecologicalprocesses.com/content/3/1/16
identified turbidity as the key indicator amongst all waterquality parameters, since an increase in turbidity impliesan increased concentration of suspended solids in surfacewaters and is likely to reduce the quality of raw water to betreated by the water utility. The conversion of forest toother land uses such as agriculture or pasture caused byfarming systems can result in higher turbidity values,which in turn correlate with higher water treatment coststo reduce the concentration of suspended solids for publicwater supply (Medeiros et al. 2011; Reis 2004; Dearmontet al. 1998).In addition Medeiros et al. (2011) and Reis (2004) sug-
gest that chemical products account for close to 60% ofannual operational costs in treatment plants in São Paulo(Reis 2004). These products are used to flocculate the sus-pended particles, measured as turbidity, that are found inraw water to fulfill regulations on drinking water qualityfor human consumption (maximum value of 5 NTU).
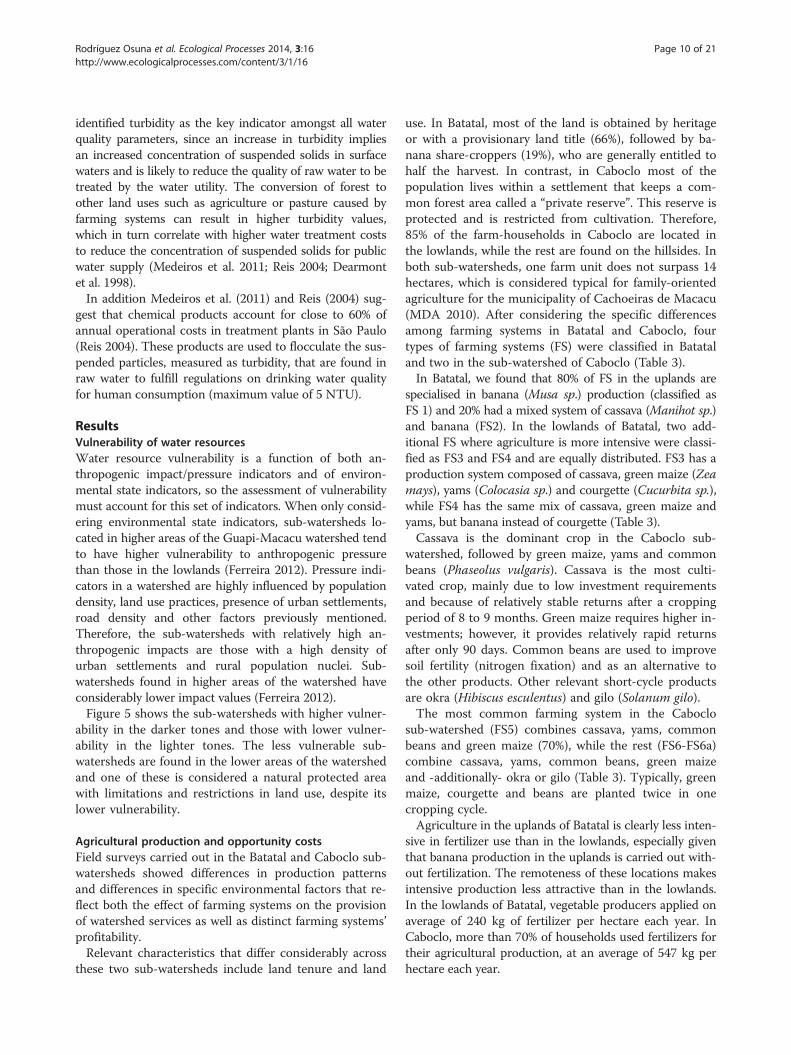
ResultsVulnerability of water resourcesWater resource vulnerability is a function of both an-thropogenic impact/pressure indicators and of environ-mental state indicators, so the assessment of vulnerabilitymust account for this set of indicators. When only consid-ering environmental state indicators, sub-watersheds lo-cated in higher areas of the Guapi-Macacu watershed tendto have higher vulnerability to anthropogenic pressurethan those in the lowlands (Ferreira 2012). Pressure indi-cators in a watershed are highly influenced by populationdensity, land use practices, presence of urban settlements,road density and other factors previously mentioned.Therefore, the sub-watersheds with relatively high an-thropogenic impacts are those with a high density ofurban settlements and rural population nuclei. Sub-watersheds found in higher areas of the watershed haveconsiderably lower impact values (Ferreira 2012).Figure 5 shows the sub-watersheds with higher vulner-
ability in the darker tones and those with lower vulner-ability in the lighter tones. The less vulnerable sub-watersheds are found in the lower areas of the watershedand one of these is considered a natural protected areawith limitations and restrictions in land use, despite itslower vulnerability.
Agricultural production and opportunity costsField surveys carried out in the Batatal and Caboclo sub-watersheds showed differences in production patternsand differences in specific environmental factors that re-flect both the effect of farming systems on the provisionof watershed services as well as distinct farming systems’profitability.Relevant characteristics that differ considerably across
these two sub-watersheds include land tenure and land
use. In Batatal, most of the land is obtained by heritageor with a provisionary land title (66%), followed by ba-nana share-croppers (19%), who are generally entitled tohalf the harvest. In contrast, in Caboclo most of thepopulation lives within a settlement that keeps a com-mon forest area called a “private reserve”. This reserve isprotected and is restricted from cultivation. Therefore,85% of the farm-households in Caboclo are located inthe lowlands, while the rest are found on the hillsides. Inboth sub-watersheds, one farm unit does not surpass 14hectares, which is considered typical for family-orientedagriculture for the municipality of Cachoeiras de Macacu(MDA 2010). After considering the specific differencesamong farming systems in Batatal and Caboclo, fourtypes of farming systems (FS) were classified in Batataland two in the sub-watershed of Caboclo (Table 3).In Batatal, we found that 80% of FS in the uplands are
specialised in banana (Musa sp.) production (classified asFS 1) and 20% had a mixed system of cassava (Manihot sp.)and banana (FS2). In the lowlands of Batatal, two add-itional FS where agriculture is more intensive were classi-fied as FS3 and FS4 and are equally distributed. FS3 has aproduction system composed of cassava, green maize (Zeamays), yams (Colocasia sp.) and courgette (Cucurbita sp.),while FS4 has the same mix of cassava, green maize andyams, but banana instead of courgette (Table 3).Cassava is the dominant crop in the Caboclo sub-
watershed, followed by green maize, yams and commonbeans (Phaseolus vulgaris). Cassava is the most culti-vated crop, mainly due to low investment requirementsand because of relatively stable returns after a croppingperiod of 8 to 9 months. Green maize requires higher in-vestments; however, it provides relatively rapid returnsafter only 90 days. Common beans are used to improvesoil fertility (nitrogen fixation) and as an alternative tothe other products. Other relevant short-cycle productsare okra (Hibiscus esculentus) and gilo (Solanum gilo).The most common farming system in the Caboclo
sub-watershed (FS5) combines cassava, yams, commonbeans and green maize (70%), while the rest (FS6-FS6a)combine cassava, yams, common beans, green maizeand -additionally- okra or gilo (Table 3). Typically, greenmaize, courgette and beans are planted twice in onecropping cycle.Agriculture in the uplands of Batatal is clearly less inten-
sive in fertilizer use than in the lowlands, especially giventhat banana production in the uplands is carried out with-out fertilization. The remoteness of these locations makesintensive production less attractive than in the lowlands.In the lowlands of Batatal, vegetable producers applied onaverage of 240 kg of fertilizer per hectare each year. InCaboclo, more than 70% of households used fertilizers fortheir agricultural production, at an average of 547 kg perhectare each year.
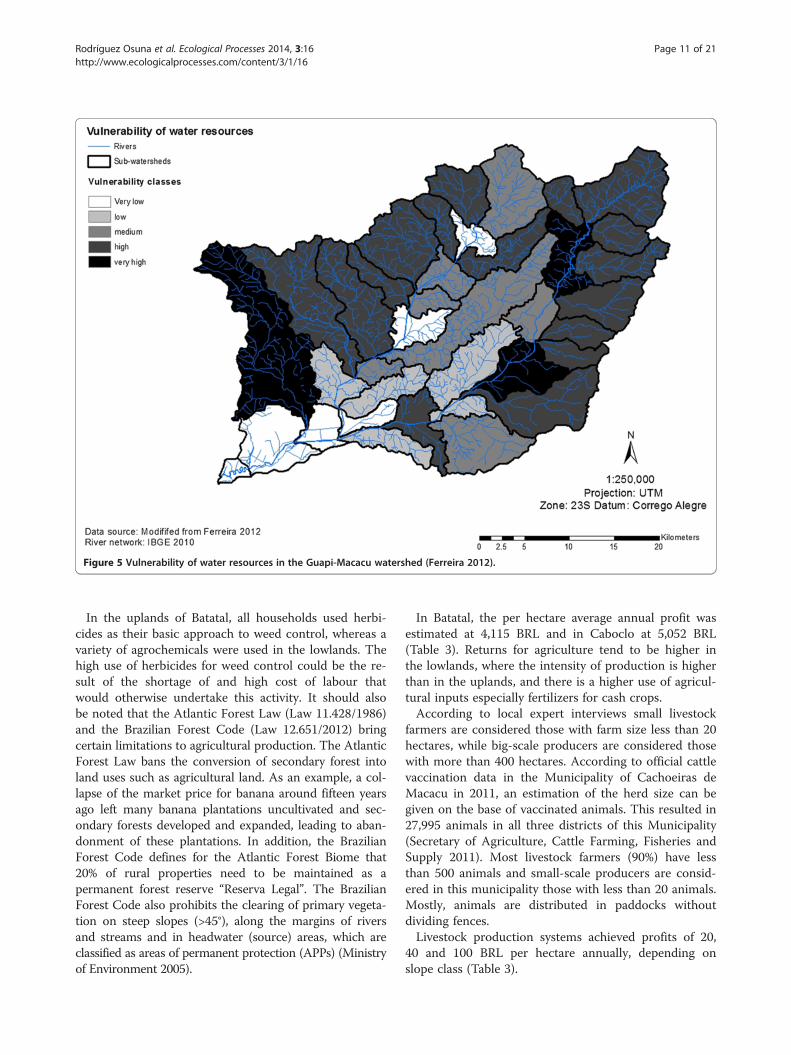
Figure 5 Vulnerability of water resources in the Guapi-Macacu watershed (Ferreira 2012).
Rodríguez Osuna et al. Ecological Processes 2014, 3:16 Page 11 of 21http://www.ecologicalprocesses.com/content/3/1/16
In the uplands of Batatal, all households used herbi-cides as their basic approach to weed control, whereas avariety of agrochemicals were used in the lowlands. Thehigh use of herbicides for weed control could be the re-sult of the shortage of and high cost of labour thatwould otherwise undertake this activity. It should alsobe noted that the Atlantic Forest Law (Law 11.428/1986)and the Brazilian Forest Code (Law 12.651/2012) bringcertain limitations to agricultural production. The AtlanticForest Law bans the conversion of secondary forest intoland uses such as agricultural land. As an example, a col-lapse of the market price for banana around fifteen yearsago left many banana plantations uncultivated and sec-ondary forests developed and expanded, leading to aban-donment of these plantations. In addition, the BrazilianForest Code defines for the Atlantic Forest Biome that20% of rural properties need to be maintained as apermanent forest reserve “Reserva Legal”. The BrazilianForest Code also prohibits the clearing of primary vegeta-tion on steep slopes (>45°), along the margins of riversand streams and in headwater (source) areas, which areclassified as areas of permanent protection (APPs) (Ministryof Environment 2005).
In Batatal, the per hectare average annual profit wasestimated at 4,115 BRL and in Caboclo at 5,052 BRL(Table 3). Returns for agriculture tend to be higher inthe lowlands, where the intensity of production is higherthan in the uplands, and there is a higher use of agricul-tural inputs especially fertilizers for cash crops.According to local expert interviews small livestock
farmers are considered those with farm size less than 20hectares, while big-scale producers are considered thosewith more than 400 hectares. According to official cattlevaccination data in the Municipality of Cachoeiras deMacacu in 2011, an estimation of the herd size can begiven on the base of vaccinated animals. This resulted in27,995 animals in all three districts of this Municipality(Secretary of Agriculture, Cattle Farming, Fisheries andSupply 2011). Most livestock farmers (90%) have lessthan 500 animals and small-scale producers are consid-ered in this municipality those with less than 20 animals.Mostly, animals are distributed in paddocks withoutdividing fences.Livestock production systems achieved profits of 20,
40 and 100 BRL per hectare annually, depending onslope class (Table 3).
Table 3 Summary of annual farming systems profits in the study area
Main crops Unit Batatal sub-watershed Caboclo sub-watershed Pasture land systemsoriented to beef productionconsidering slopea
Upland Lowland Lowland
FS1 FS2 FS3 FS4 FS5 FS6a FS6b ≤15° 16° to25°
>25°
Banana
(BRL)
972 972 983
Cassava −1,334 3,950 3,950 5,231 5,232 5,232
Green maize(summer)
2,371 2,371 2,066 2,067 2,067
Green maize (winter) 3,438 3,438 2,371 2,371 2,371
Yam 2,861 2,861 6,199 6,199 6,199
Courgette 3,633
Gilo 10,941
Okra 10,092
Beans (summer) 1,419 1,419 1,419
Beans (winter) 1,522 1,523 1,523
Occurrence (%) 80 20 50 50 70 15 15
Typical area and cropdistribution for eachfarming system (FS)
(ha) 10.310.3 (8.3 banana,2.0 cassava)
6.0 (2.0 cassava, 2.0 greenmaize, 1.0 yam, 1.0 banana)
6.0 (2.0 cassava, 2.0 greenmaize, 1.0 yam, 1.0 courgette)
4.0 (1.0 cassava,1.5 green maize,1.0 yam, 0.5 beans)
4.0 (1.0 cassava, 1.5green maize, 0.5 yam,0.5 okra or gilo, 0.5 beans)
Per hectare profit (BRL ha−1) 972 526 3,894 4,336 4,889.7 5,376.3 5,482.5 20 40 100
Average value forextrapolation atthe watershed level
(BRL ha−1)Macacu River lowland Guapiaçú River
4,114.8b 5,051.6 20 40 100
aAccording to expert interviews, there is a gain of 40 to 60 kg of live animal weight in high slope areas in contrast to those in lowlands with a gain in live animal weight of 120 to 150 kg in this particular watershed;bSince upland agriculture in the Batatal sub-watershed (FS1 and FS2) was not detected by the available land use classification (Naegeli 2010; Pedreira et al. 2009; Fidalgo et al. 2008), we were limited to using averageper hectare annual profits for lowland agriculture in Batatal (FS3 and FS4) resulting in an average annual per hectare value of 4,114.8 BRL.
RodríguezOsuna
etal.EcologicalProcesses
2014,3:16Page
12of
21http://w
ww.ecologicalprocesses.com
/content/3/1/16
Rodríguez Osuna et al. Ecological Processes 2014, 3:16 Page 13 of 21http://www.ecologicalprocesses.com/content/3/1/16
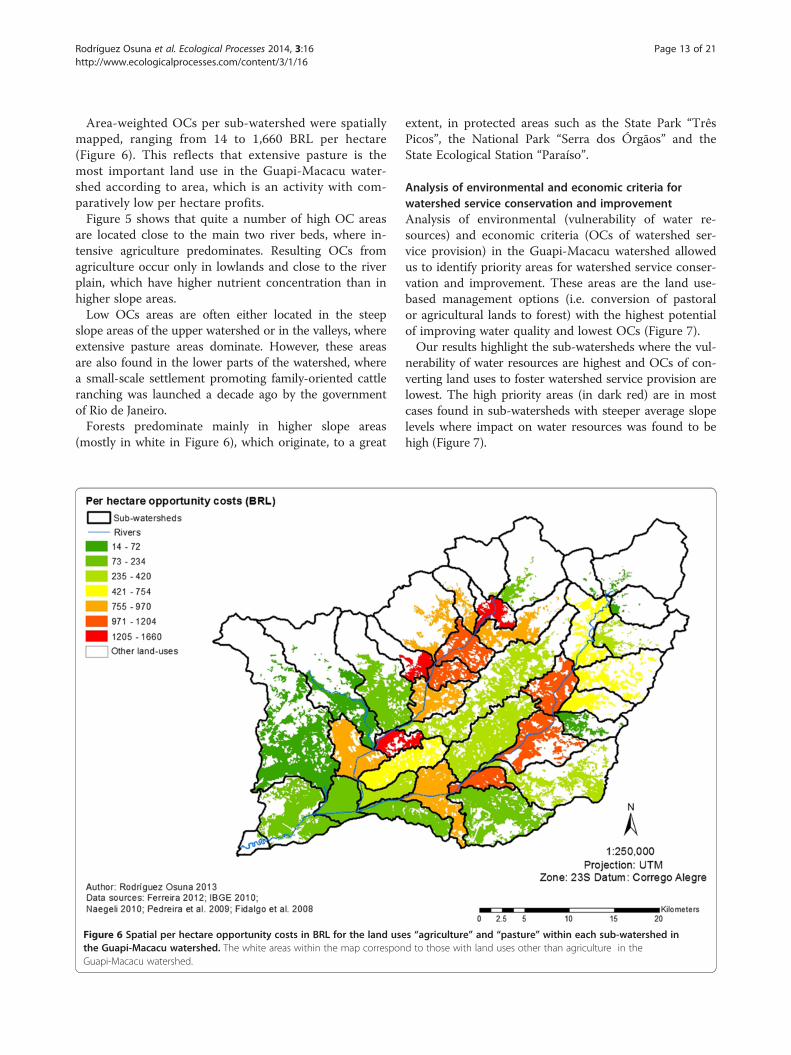
Area-weighted OCs per sub-watershed were spatiallymapped, ranging from 14 to 1,660 BRL per hectare(Figure 6). This reflects that extensive pasture is themost important land use in the Guapi-Macacu water-shed according to area, which is an activity with com-paratively low per hectare profits.Figure 5 shows that quite a number of high OC areas
are located close to the main two river beds, where in-tensive agriculture predominates. Resulting OCs fromagriculture occur only in lowlands and close to the riverplain, which have higher nutrient concentration than inhigher slope areas.Low OCs areas are often either located in the steep
slope areas of the upper watershed or in the valleys, whereextensive pasture areas dominate. However, these areasare also found in the lower parts of the watershed, wherea small-scale settlement promoting family-oriented cattleranching was launched a decade ago by the governmentof Rio de Janeiro.Forests predominate mainly in higher slope areas
(mostly in white in Figure 6), which originate, to a great
Figure 6 Spatial per hectare opportunity costs in BRL for the land usethe Guapi-Macacu watershed. The white areas within the map corresponGuapi-Macacu watershed.
extent, in protected areas such as the State Park “TrêsPicos”, the National Park “Serra dos Órgãos” and theState Ecological Station “Paraíso”.
Analysis of environmental and economic criteria forwatershed service conservation and improvementAnalysis of environmental (vulnerability of water re-sources) and economic criteria (OCs of watershed ser-vice provision) in the Guapi-Macacu watershed allowedus to identify priority areas for watershed service conser-vation and improvement. These areas are the land use-based management options (i.e. conversion of pastoralor agricultural lands to forest) with the highest potentialof improving water quality and lowest OCs (Figure 7).Our results highlight the sub-watersheds where the vul-
nerability of water resources are highest and OCs of con-verting land uses to foster watershed service provision arelowest. The high priority areas (in dark red) are in mostcases found in sub-watersheds with steeper average slopelevels where impact on water resources was found to behigh (Figure 7).
s “agriculture” and “pasture” within each sub-watershed ind to those with land uses other than agriculture in the
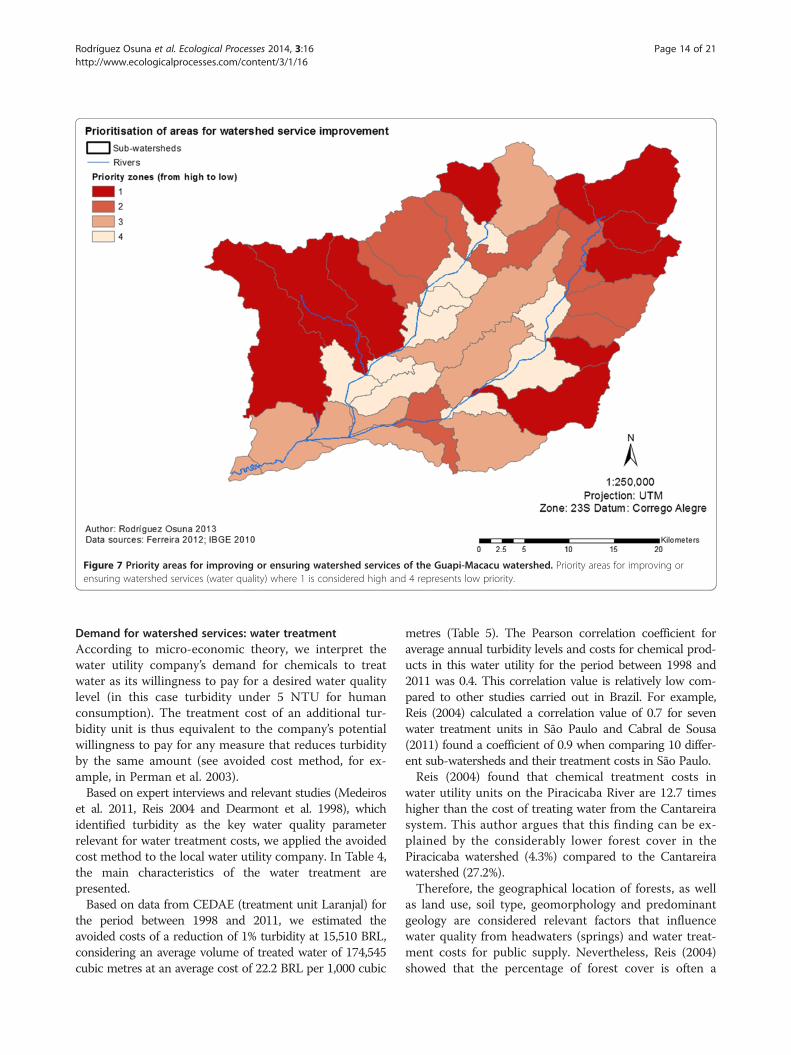
Figure 7 Priority areas for improving or ensuring watershed services of the Guapi-Macacu watershed. Priority areas for improving orensuring watershed services (water quality) where 1 is considered high and 4 represents low priority.
Rodríguez Osuna et al. Ecological Processes 2014, 3:16 Page 14 of 21http://www.ecologicalprocesses.com/content/3/1/16
Demand for watershed services: water treatmentAccording to micro-economic theory, we interpret thewater utility company’s demand for chemicals to treatwater as its willingness to pay for a desired water qualitylevel (in this case turbidity under 5 NTU for humanconsumption). The treatment cost of an additional tur-bidity unit is thus equivalent to the company’s potentialwillingness to pay for any measure that reduces turbidityby the same amount (see avoided cost method, for ex-ample, in Perman et al. 2003).Based on expert interviews and relevant studies (Medeiros
et al. 2011, Reis 2004 and Dearmont et al. 1998), whichidentified turbidity as the key water quality parameterrelevant for water treatment costs, we applied the avoidedcost method to the local water utility company. In Table 4,the main characteristics of the water treatment arepresented.Based on data from CEDAE (treatment unit Laranjal) for
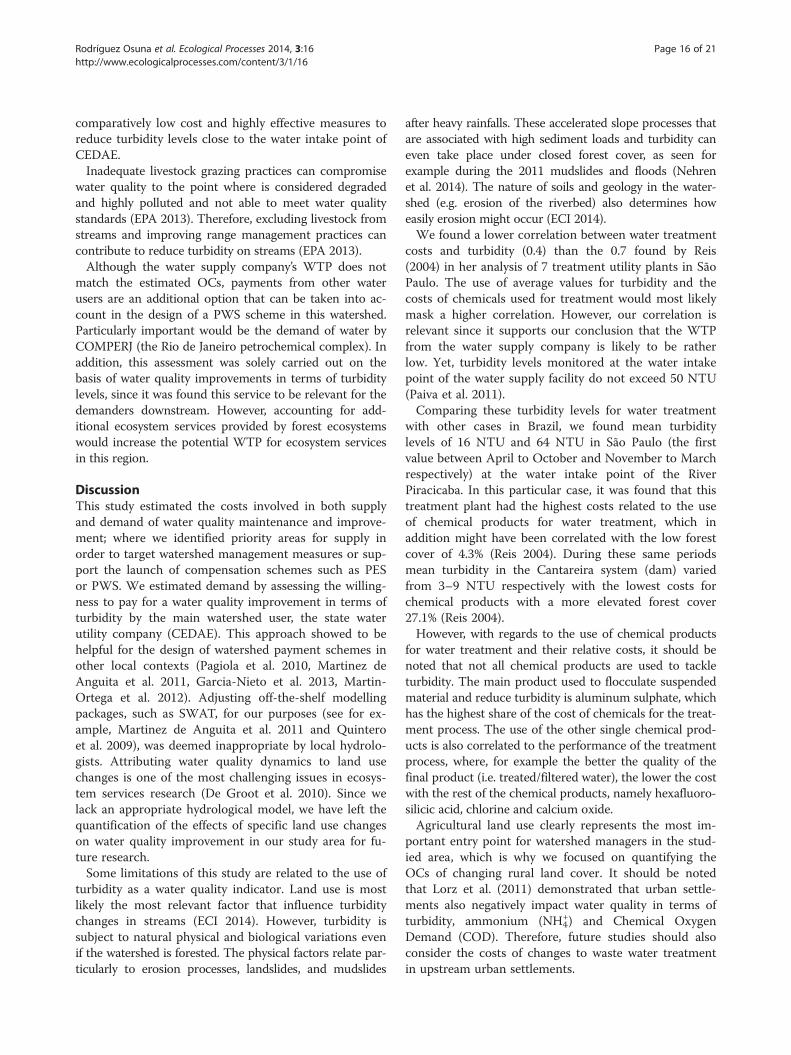
the period between 1998 and 2011, we estimated theavoided costs of a reduction of 1% turbidity at 15,510 BRL,considering an average volume of treated water of 174,545cubic metres at an average cost of 22.2 BRL per 1,000 cubic
metres (Table 5). The Pearson correlation coefficient foraverage annual turbidity levels and costs for chemical prod-ucts in this water utility for the period between 1998 and2011 was 0.4. This correlation value is relatively low com-pared to other studies carried out in Brazil. For example,Reis (2004) calculated a correlation value of 0.7 for sevenwater treatment units in São Paulo and Cabral de Sousa(2011) found a coefficient of 0.9 when comparing 10 differ-ent sub-watersheds and their treatment costs in São Paulo.Reis (2004) found that chemical treatment costs in
water utility units on the Piracicaba River are 12.7 timeshigher than the cost of treating water from the Cantareirasystem. This author argues that this finding can be ex-plained by the considerably lower forest cover in thePiracicaba watershed (4.3%) compared to the Cantareirawatershed (27.2%).Therefore, the geographical location of forests, as well
as land use, soil type, geomorphology and predominantgeology are considered relevant factors that influencewater quality from headwaters (springs) and water treat-ment costs for public supply. Nevertheless, Reis (2004)showed that the percentage of forest cover is often a
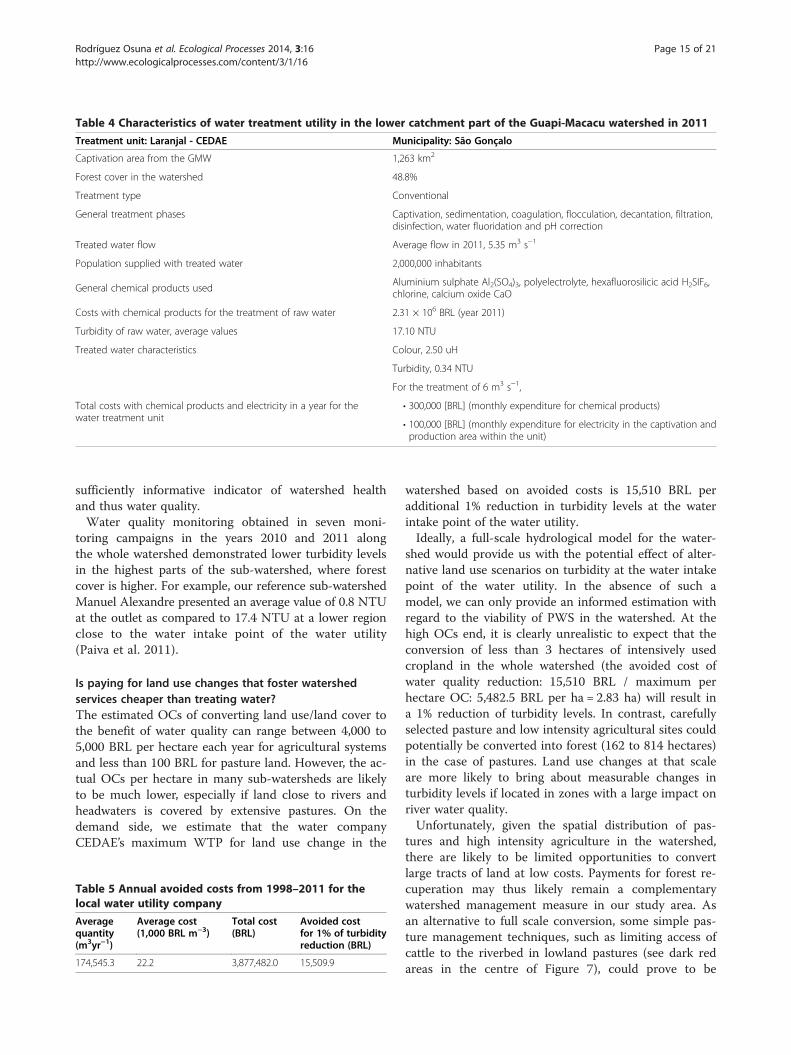
Table 4 Characteristics of water treatment utility in the lower catchment part of the Guapi-Macacu watershed in 2011
Treatment unit: Laranjal - CEDAE Municipality: São Gonçalo
Captivation area from the GMW 1,263 km2
Forest cover in the watershed 48.8%
Treatment type Conventional
General treatment phases Captivation, sedimentation, coagulation, flocculation, decantation, filtration,disinfection, water fluoridation and pH correction
Treated water flow Average flow in 2011, 5.35 m3 s−1
Population supplied with treated water 2,000,000 inhabitants
General chemical products usedAluminium sulphate Al2(SO4)3, polyelectrolyte, hexafluorosilicic acid H2SIF6,chlorine, calcium oxide CaO
Costs with chemical products for the treatment of raw water 2.31 × 10⁶ BRL (year 2011)
Turbidity of raw water, average values 17.10 NTU
Treated water characteristics Colour, 2.50 uH
Turbidity, 0.34 NTU
Total costs with chemical products and electricity in a year for thewater treatment unit
For the treatment of 6 m3 s−1,
• 300,000 [BRL] (monthly expenditure for chemical products)
• 100,000 [BRL] (monthly expenditure for electricity in the captivation andproduction area within the unit)
Rodríguez Osuna et al. Ecological Processes 2014, 3:16 Page 15 of 21http://www.ecologicalprocesses.com/content/3/1/16
sufficiently informative indicator of watershed healthand thus water quality.Water quality monitoring obtained in seven moni-
toring campaigns in the years 2010 and 2011 alongthe whole watershed demonstrated lower turbidity levelsin the highest parts of the sub-watershed, where forestcover is higher. For example, our reference sub-watershedManuel Alexandre presented an average value of 0.8 NTUat the outlet as compared to 17.4 NTU at a lower regionclose to the water intake point of the water utility(Paiva et al. 2011).
Is paying for land use changes that foster watershedservices cheaper than treating water?The estimated OCs of converting land use/land cover tothe benefit of water quality can range between 4,000 to5,000 BRL per hectare each year for agricultural systemsand less than 100 BRL for pasture land. However, the ac-tual OCs per hectare in many sub-watersheds are likelyto be much lower, especially if land close to rivers andheadwaters is covered by extensive pastures. On thedemand side, we estimate that the water companyCEDAE’s maximum WTP for land use change in the
Table 5 Annual avoided costs from 1998–2011 for thelocal water utility company
Averagequantity(m3yr−1)
Average cost(1,000 BRL m−3)
Total cost(BRL)
Avoided costfor 1% of turbidityreduction (BRL)
174,545.3 22.2 3,877,482.0 15,509.9
watershed based on avoided costs is 15,510 BRL peradditional 1% reduction in turbidity levels at the waterintake point of the water utility.Ideally, a full-scale hydrological model for the water-
shed would provide us with the potential effect of alter-native land use scenarios on turbidity at the water intakepoint of the water utility. In the absence of such amodel, we can only provide an informed estimation withregard to the viability of PWS in the watershed. At thehigh OCs end, it is clearly unrealistic to expect that theconversion of less than 3 hectares of intensively usedcropland in the whole watershed (the avoided cost ofwater quality reduction: 15,510 BRL / maximum perhectare OC: 5,482.5 BRL per ha = 2.83 ha) will result ina 1% reduction of turbidity levels. In contrast, carefullyselected pasture and low intensity agricultural sites couldpotentially be converted into forest (162 to 814 hectares)in the case of pastures. Land use changes at that scaleare more likely to bring about measurable changes inturbidity levels if located in zones with a large impact onriver water quality.Unfortunately, given the spatial distribution of pas-
tures and high intensity agriculture in the watershed,there are likely to be limited opportunities to convertlarge tracts of land at low costs. Payments for forest re-cuperation may thus likely remain a complementarywatershed management measure in our study area. Asan alternative to full scale conversion, some simple pas-ture management techniques, such as limiting access ofcattle to the riverbed in lowland pastures (see dark redareas in the centre of Figure 7), could prove to be
Rodríguez Osuna et al. Ecological Processes 2014, 3:16 Page 16 of 21http://www.ecologicalprocesses.com/content/3/1/16
comparatively low cost and highly effective measures toreduce turbidity levels close to the water intake point ofCEDAE.Inadequate livestock grazing practices can compromise
water quality to the point where is considered degradedand highly polluted and not able to meet water qualitystandards (EPA 2013). Therefore, excluding livestock fromstreams and improving range management practices cancontribute to reduce turbidity on streams (EPA 2013).Although the water supply company’s WTP does not
match the estimated OCs, payments from other waterusers are an additional option that can be taken into ac-count in the design of a PWS scheme in this watershed.Particularly important would be the demand of water byCOMPERJ (the Rio de Janeiro petrochemical complex). Inaddition, this assessment was solely carried out on thebasis of water quality improvements in terms of turbiditylevels, since it was found this service to be relevant for thedemanders downstream. However, accounting for add-itional ecosystem services provided by forest ecosystemswould increase the potential WTP for ecosystem servicesin this region.
DiscussionThis study estimated the costs involved in both supplyand demand of water quality maintenance and improve-ment; where we identified priority areas for supply inorder to target watershed management measures or sup-port the launch of compensation schemes such as PESor PWS. We estimated demand by assessing the willing-ness to pay for a water quality improvement in terms ofturbidity by the main watershed user, the state waterutility company (CEDAE). This approach showed to behelpful for the design of watershed payment schemes inother local contexts (Pagiola et al. 2010, Martinez deAnguita et al. 2011, Garcia-Nieto et al. 2013, Martin-Ortega et al. 2012). Adjusting off-the-shelf modellingpackages, such as SWAT, for our purposes (see for ex-ample, Martinez de Anguita et al. 2011 and Quinteroet al. 2009), was deemed inappropriate by local hydrolo-gists. Attributing water quality dynamics to land usechanges is one of the most challenging issues in ecosys-tem services research (De Groot et al. 2010). Since welack an appropriate hydrological model, we have left thequantification of the effects of specific land use changeson water quality improvement in our study area for fu-ture research.Some limitations of this study are related to the use of
turbidity as a water quality indicator. Land use is mostlikely the most relevant factor that influence turbiditychanges in streams (ECI 2014). However, turbidity issubject to natural physical and biological variations evenif the watershed is forested. The physical factors relate par-ticularly to erosion processes, landslides, and mudslides
after heavy rainfalls. These accelerated slope processes thatare associated with high sediment loads and turbidity caneven take place under closed forest cover, as seen forexample during the 2011 mudslides and floods (Nehrenet al. 2014). The nature of soils and geology in the water-shed (e.g. erosion of the riverbed) also determines howeasily erosion might occur (ECI 2014).We found a lower correlation between water treatment
costs and turbidity (0.4) than the 0.7 found by Reis(2004) in her analysis of 7 treatment utility plants in SãoPaulo. The use of average values for turbidity and thecosts of chemicals used for treatment would most likelymask a higher correlation. However, our correlation isrelevant since it supports our conclusion that the WTPfrom the water supply company is likely to be ratherlow. Yet, turbidity levels monitored at the water intakepoint of the water supply facility do not exceed 50 NTU(Paiva et al. 2011).Comparing these turbidity levels for water treatment
with other cases in Brazil, we found mean turbiditylevels of 16 NTU and 64 NTU in São Paulo (the firstvalue between April to October and November to Marchrespectively) at the water intake point of the RiverPiracicaba. In this particular case, it was found that thistreatment plant had the highest costs related to the useof chemical products for water treatment, which inaddition might have been correlated with the low forestcover of 4.3% (Reis 2004). During these same periodsmean turbidity in the Cantareira system (dam) variedfrom 3–9 NTU respectively with the lowest costs forchemical products with a more elevated forest cover27.1% (Reis 2004).However, with regards to the use of chemical products
for water treatment and their relative costs, it should benoted that not all chemical products are used to tackleturbidity. The main product used to flocculate suspendedmaterial and reduce turbidity is aluminum sulphate, whichhas the highest share of the cost of chemicals for the treat-ment process. The use of the other single chemical prod-ucts is also correlated to the performance of the treatmentprocess, where, for example the better the quality of thefinal product (i.e. treated/filtered water), the lower the costwith the rest of the chemical products, namely hexafluoro-silicic acid, chlorine and calcium oxide.Agricultural land use clearly represents the most im-
portant entry point for watershed managers in the stud-ied area, which is why we focused on quantifying theOCs of changing rural land cover. It should be notedthat Lorz et al. (2011) demonstrated that urban settle-ments also negatively impact water quality in terms ofturbidity, ammonium (NH4
+) and Chemical OxygenDemand (COD). Therefore, future studies should alsoconsider the costs of changes to waste water treatmentin upstream urban settlements.
Rodríguez Osuna et al. Ecological Processes 2014, 3:16 Page 17 of 21http://www.ecologicalprocesses.com/content/3/1/16
Moreover, we note that the land cover classificationused in our analysis does not distinguish between agri-cultural production systems and underestimates the totalland under production due to low resolution (Pedreiraet al. 2009; Fidalgo et al. 2008). Land use classificationswith higher resolution (based on SPOT 5) only exist forthe upper part of the Guapi-Macacu watershed, but suchdata would permit our OC analyses to be extrapolated inmore detail.Comparing our OC estimates to actual transfers in
existing PWS schemes in the Atlantic Forest, we findthat per hectare payment values range from 10 BRL an-nually to 566 BRL monthly (Veiga and Galvadao 2011).These include annual per hectare payments of 176 BRLin the municipality of Extrema, state of Minas Gerais;25–125 BRL in the watershed of PCJ in the state of SãoPaulo; 10–60 BRL in the watershed of Guandu, state ofRio de Janeiro; 80–340 BRL in the watershed Benevente,state of Espírito Santo; 80–340 BRL in the Guanduwatershed, states of Espírito Santo and Rio de Janeiro;75–563 BRL paid by the OASIS Foundation, states ofEspírito Santo and Paraná; and 175–577 BRL monthlypayments in the state of Santa Catarina (Veiga andGalvadao 2011).At the regional level in Latin America, we can com-
pare our estimates to well-known schemes, such as theCosta Rican PES programme (FAO 2007). Here, annualper hectare payments vary from 98 BRL for natural re-generation to 152 BRL for forest preservation and morethan 2,332 BRL for new forest plantations for a timeperiod over five years (Ecosystem Marketplace 2010).The National Programme for Hydrological Environmen-tal Services in Mexico (PSAH) pays between 57–90 BRLper hectare annually depending on the forest type con-sidering the OCs of land conversion (Ecosystem Market-place 2010; Muñoz-Piña et al. 2008). The EcuadorianPWS Programme in Pinampiro pays landowners around14–29 BRL per hectare annually (Wunder and Alban2008), while the Los Negros programme in Bolivia paysin-kind with beehive boxes for honey production(Asquith and Wunder 2008). Agricultural OCs in ourstudy area thus clearly exceed the average annual paymentin existing PWS schemes by more than a factor of 10.However, we note that payments made under the above
mentioned schemes may focus in other actions other thanconversion from agriculture or pastoral lands into forest.In the case of the Atlantic Forest schemes, mostly pay-ments are directed to protect headwater areas and restoreand conserve riparian forests. However, actions other thanconversion from agriculture or pastoral lands into forestcan be paid for (eg. soil conservation practices). The pricepaid to farmers in the PSAH Mexican scheme has been de-cided based on the assumption that corn production wouldbe an alternative to conservation (Ecosystem Marketplace
2010). The Pinampiro PWS programme pays for forest andpáramo protection and regeneration (Wunder and Alban2008), while the Los Negros programme compensates foravoided deforestation of cloud forests (IIED 2012b).Our results may prove useful for ongoing watershed con-
servation initiatives, such as the World Bank funded RioRural carried out by the State Secretary for Agriculture andLivestock in the state of Rio de Janeiro (RioRural 2013).This and many other initiatives in the Atlantic Forest re-gion have shown great interest in incentive-based water-shed management approaches. Furthermore, Brazilianlegislation has been supporting such approaches, such asthe Brazilian National Law on Water Resources (Law9433/1997), which allows for example the establishment ofwatershed service markets and permits charging for wateruse as it is taking place in some watersheds in Rio deJaneiro (Veiga 2008).Equally relevant is the more recent Law 9985/2000
“SNUC” that adopts the protector-receiver principle,which allows for rewards in exchange for good naturalresource stewardship (Strobel et al. 2007). Funding forincentive-based watershed management may be derivedfrom Brazil’s “ecological” tax system, which compensatesmunicipalities for conservation costs based on the value-added tax (ICMS) (Marques 2009; Veiga 2008).In addition, the decree No. 42029/2011 established the
Payment for Environmental Services mechanism underthe Rio de Janeiro State Programme for Conservationand Revitalization of Water Resources (PROHIDRO).This decree has given legal status to the PES Pro-grammes already underway in the state of Rio de Janeiro,such as the Lagos São João Committee through GoodPractices Fund (Funboas) and Guandu Committeethrough Water and Forest Programme implemented inthe municipality of Rio Claro.This study can potentially contribute to implementation
of these laws in the Guapi-Macacu watershed in a moreeffective way with respect to social, economic and envir-onmental aspects. Given that our study results take intoaccount these different aspects and are based on primarydata obtained in the watershed, our study can contributeby identifying limitations and opportunities related to eco-nomic watershed compensation programmes.
ConclusionsAssessing the economic scope of incentive-basedwatershed management requires knowledge of boththe costs of providing additional watershed servicesthrough land use and land cover change (service sup-ply) and the willingness to pay (demand) for such ser-vices. This study has quantified these two necessaryinputs to enable an informed decision-making processin the context of the Guapi-Macacu watershed in thestate of Rio de Janeiro, Brazil.
Rodríguez Osuna et al. Ecological Processes 2014, 3:16 Page 18 of 21http://www.ecologicalprocesses.com/content/3/1/16
With regard to supply, we found that land users’ OCsrange between 972–5,482 BRL per hectare for croplandand <100 BRL per hectare for pastures. At the sub-watershed level, zones that use a high proportion of pas-ture but low proportion of cropland in the land use mixwill accordingly have low area-weighted average OCsand vice versa. With regard to demand, we assessedwater treatment costs and found a 1% reduction in waterturbidity levels to be worth 15,510 BRL on average tothe water company, CEDAE.In absolute terms, only a relatively small share of land
in the watershed is cropland (5,560 hectares); the areacovered by pasture (52,374 ha) and forest (61,665 ha) ismuch larger. However, cropland covers a considerableamount of land with potential to provide watershed ser-vices and, as a result, high OCs become a critical limita-tion on strategies that aim to change land use for thebenefit of water quality.Nevertheless, given the spatial distribution of pastures
and high intensity agriculture in the watershed, we findthat payments for forest recuperation are likely to becost-effective in sub-watersheds with a high proportionof pasture land. Some of these sub-watersheds also hap-pen to exhibit high levels of water resources vulnerabilityand thus represent potential priority intervention zonesfor watershed management (Figure 6). In these areas,watershed planners may reap considerable benefits fromactive pasture management options, such as silvopas-toral systems or strategic fencing of riparian areas. Inaddition, sustainable agricultural and soil conservationpractices can bring additional benefits in terms of redu-cing and avoiding sedimentation, erosion, which in turnresult in improving water quality.To the extent that smallholders in the study area also
depend on subsistence production for their livelihoods,land use based watershed management strategies willhave to also consider food security issues, especially inthe upper part of the watershed.Our study area reflects watershed management is-
sues that are typical across many parts of the AtlanticForest region, which often have diverse agriculturalmosaics and thus highly variable OCs. Wherever in-tensively used cropland dominates in the vulnerablezones of large watersheds, land use planners will findit difficult to rely on the use of payments for water-shed services alone. Effective watershed managementwill then have to be combined with enhanced moni-toring and enforcement activities to ensure that theBrazilian Forest Law is complied with, particularlywith regard to riparian forests. Research designed witha bottom-up approach that quantifies the potentialcompliance costs of land users can clearly help policymakers to target both incentives and disincentives in acost-effective manner.
Competing interestsThe authors declare that they have no competing interests.
Authors’ contributionsVRO undertook the field work, carried out the analysis and wrote themanuscript under her PhD thesis at the University of Leipzig. JB and RBPsupported the conception of the research design and data analysis. JB, RBPand UN reviewed and commented on various versions on this manuscript.UN provided insights on ecosystem management aspects. HG and JHcontributed to the overall research design and gave valuable comments onaspects related to farming systems analysis and landscape ecology(respectively). All authors read and approved the final manuscript.
Authors’ informationVanesa Rodríguez Osuna is an Environmental Engineer with a M.Sc. Degreein Natural Resource Management and Technologies in the Tropics andSubtropics, currently finalising her PhD in Geography at the University ofLeipzig, Germany. She is a Senior Researcher at the Center for DevelopmentResearch (ZEF, University of Bonn, Germany) and the Cologne University ofApplied Sciences. Her research areas include ecosystem services, climatechange and integrated land and water resources management.Jan Börner is an agricultural and environmental economist with a Masters inInternational Agricultural Sciences and a PhD in Agricultural Science. He is aProfessor for Economics of Sustainable Resource Use at ZEF (University ofBonn, Germany), where he leads a research group focusing on the analysisof environmental and conservation policy tools for tropical forestconservation. Udo Nehren is a physical geographer with a Masters inEngineering and a PhD in Geography. He is a senior researcher and lecturerin landscape ecology at Cologne University of Applied Sciences, Germany.His research areas include quaternary landscape evolution, landscapevulnerability and resilience and ecosystem management with a strong focuson tropical environments. Rachel B. Prado is a Biologist with a PhD inEnvironmental Engineering Science. She is currently working as a ResearchScientist, focused on geotechnologies applied at environmental monitoringand management at Embrapa Soils, Rio de Janeiro, Brazil. Her research areasinclude water resources monitoring, watershed management and waterecosystem services modeling. Hartmut Gaese is an Agricultural Engineer withspecialisation on farming systems in the tropics and subtropics and irrigationsystems. He is a former Director of the Institute of Natural ResourceManagement and Technologies in the Tropics and Subtropics (ITT) atCologne University of Applied Sciences, Germany. Jürgen Heinrich is aPhysical Geographer with a PhD in Geography. He is a Professor inGeography at the University of Leipzig, Germany. His research focuses ongeomorphology, quaternary geology, soil science, plant geography,geoecology and environmental research.
AcknowledgementThe authors acknowledge financial support of the IPSWAT Programme(financed from the German Federal Ministry of Research-BMBF) and theDINARIO Project: “Climate Change, Landscape dynamics, Land use and NaturalResources in the Atlantic Forest of Rio de Janeiro”. We thank the support of theTeam of Researchers of MP2 Embrapa Soils of Rio de Janeiro and DINARIO. Inour study region, we specially thank Lenilson Biazatti (from the Rural WorkersUnion), Nicholas Locke (REGUA Association Director), Thabta Matos deMata from the City Council of Cachoeiras de Macacu, Jocemir Da Silva(Chief technical extension officer of EMATER in Cachoeiras de Macacu),Demerval Pereira de Sousa (President of A.L.A.F.), technical staff from thestate water utility company (CEDAE – Imunana Laranjal) and all farmerswho enriched this study with their valuable time. We are also very gratefulfor the proofreading of this text by Dr. Kylie Quinn and Meghan Doiron.
Author details1Center for Development Research (ZEF), Department of Economic andTechnological Change, University of Bonn, Walter-Flex-Str. 3, 53117 Bonn,Germany. 2Institute for Technology and Resources Management in the Tropicsand Subtropics (ITT), Cologne University of Applied Sciences, Betzdorfer Str. 2,50679 Cologne, Germany. 3Empresa Brasileira de Pesquisa Agropecuária(EMBRAPA Soils), Brazilian Enterprise for Agricultural Research, Geotechnologiesand Environmental Monitoring, Rua Jardim Botânico, CEP 22460-000 Rio deJaneiro, Brazil. 4Institute for Geography, Department of Physical Geography,University of Leipzig, Johannisallee 19a, 04103 Leipzig, Germany.
Rodríguez Osuna et al. Ecological Processes 2014, 3:16 Page 19 of 21http://www.ecologicalprocesses.com/content/3/1/16
Received: 5 February 2014 Accepted: 22 May 2014
ReferencesAngelsen A, Larsen HO, Lund J (2011) Measuring livelihoods and environmental
dependence: Methods for research and fieldwork. Routledge, LondonArriagada RA, Ferraro PJ, Sills EO, Pattanayak SK, Cordero-Sancho S (2012) Do
payments for environmental services affect forest cover? A farm-levelevaluation from Costa Rica. Land Econ 88(2):382–399
Asquith N, Wunder S (2008) Payments for Watershed Services. The BellagioConversations. Fundación Natura Bolivia, Bolivia
Balvanera P, Uriarte M, Almeida-Lenero L, Altesor A, DeClerck F, Gardner T, Hall J,Lara A, Laterra P, Pena-Claros M, Silva Matos DM, Vogl AL, Romero-Duque LP,Arreola LF, Caro-Borrero AP, Gallego F, Jain M, Little C, de Oliveira XR, ParueloJM, Peinado JE, Poorter L, Ascarrunz N, Correa F, Cunha-Santino MB,Hernandez-Sanchez PA, Vallejos M (2012) Ecosystem services research inLatin America: The state of the art. Ecosystem Services 2:56–70
Batchelor C, Cain J, Farquharson F, Roberts J (eds) (1998) Improving WaterUtilization from a Catchment Perspective, vol 4. SWIM Paper. InternationalWater Management Institute, Colombo, Sri Lanka
Beets WC (1990) Raising and Sustaining Productivity of Smallholder FarmingSystems in the Tropics. A Handbook of Sustainable AgriculturalDevelopment. A Handbook of Sustainable Agricultural Development. AgBePublishing, Holland
Bennett G, Carroll N, Hamilton K (2013) Charting New Waters. State of WatershedPayments. Forest Trends, Washington
Boerner J, Vosti S (2012) Managing Tropical Forest Ecosystem Services: AnOverview of Options. In: Muradian R, Rival L (eds) Governing the Provision ofEcosystem Service, vol 4. Springer, pp 21–46, http://www.springer.com/environment/environmental+management/book/978-94-007-5175-0
Borja A, Galparsoro I, Solaun O, Muxika I, Tello EM, Uriarte A, Valencia V (2006)The European Water Framework Directive and the DPSIR. A methodologicalapproach to assess the risk of failing to achieve good ecological status.Estuar Coast Shelf Sci 66(1):84–96
Calder I (2005) Blue revolution: Integrated land and water resourcesmanagement 2nd edition. Earthscan, London
CEPF (2001) Perfil do Ecossistema Mata Atlantica, Hotspot de Biodiversidade – Brazil.Critical Ecosystem Partnership Fund
Costanza R, d’Arge R, de Groot R, Farber S, Grasso M, Hannon B, Limburg K,Naeem S, O’Neill RV, Paruelo J, Raskin RG, Sutton P, van den Belt M (1997)The value of the world’s ecosystem services and natural capital. Nature 387(1):253–260
Daily GC, Matson PA (2008) Ecosystem services: From theory to implementation.Proc Natl Acad Sci 105(28):9455–9456
de Cabral Sousa WJ (2011) Pagamento por Servicos Ecossistemicos: Mata Ciliar,Erosao, Turbidez e Qualidade de Agua: Produtos Tecnicos 1. Projeto deRecuperacao de Matas Ciliares, Brazil., Available via Governo do Estado SãoPaulo www.ambiente.sp.gov.br/mataciliar Accesed 12 Jun 2010
De Groot RS, Wilson MA, Boumans RM (2002) A typology for the classification,description and valuation of ecosystem functions, goods and services. EcolEcon 41(3):393–408
De Groot RS, Alkemade R, Braat L, Hein L, Willemen L (2010) Challenges inintegrating the concept of ecosystem services and values in landscapeplanning, management and decision making. Ecol Complex 7(3):260–272
Dean W (1997) With Broadax and Firebrand: The Destruction of the BrazilianAtlantic Coastal Forest. University of California Press, United States of America
Dearmont D, McCarl BA, Tolman DA (1998) Costs of water treatment due todiminished water quality: a case study in Texas. Water Resour Res34(4):849–853
Dudley N, Stolton S (2003) Running Pure: The Importance of Forest ProtectedAreas to Drinking Water, The Arguments for Protection Series. WorldBank/WWF Alliance for Forest Conservation and Sustainable Use, UnitedKingdom, http://assets.panda.org/downloads/runningpurereport.pdf.Accessed 10 Jan 2011
ECI (2014) Chapter 3 – Streams. In: Total Suspended Solids and Turbidity inStreams. Department of Ecology, State Washington, http://www.ecy.wa.gov/programs/wq/plants/management/joysmanual/streamtss.html accessed7 may 2014
Ecosystem Marketplace (2010) Water Market: Mexico Payment for HydrologicalServices. Ecosystem Marketplace: A Forest Trends Initiative. The KatoombaGroup., http://www.ecosystemmarketplace.com/pages/dynamic/web.page.
php?section=water_market&page_name=crwb_market. Accessed13 Sep 2011
Engel S, Pagiola S, Wunder S (2008) Designing payments for environmental servicesin theory and practice: An overview of the issues. Ecol Econ 65(4):663–674
EPA (2013) Total Maximum Daily Loads (TMDLs) at Work: Arizona. CommittedLandowner Implements and Advocates Improved Grazing Practices inNutrioso Creek, Reducing Turbidity Levels to Attain Water Quality Standards.United States Environmental Protection Agency, http://water.epa.gov/lawsregs/lawsguidance/cwa/tmdl/nutriosocreek.cfm. Accessed 5 May 2014
FAO (2007) The State of Food and Agriculture: Paying Farmers for EnvironmentalServices. Food and Agriculture Organization of the United Nations, Rome
Farber S, Costanza R, Childers DL, Erickson J, Gross K, Grove M, Hopkinson CS,Kahn J, Pincetl S, Troy A (2006) Linking ecology and economics forecosystem management. Bioscience 56(2):121–133
Ferreira CEG (2012) Sistema de Suporte a Decisao Espacial Aplicado a Analise daVulnerabilidade dos Recursos Hidricos na Bacia Guapi-Macacu, Master Thesis.Universidade Estadual do Rio de Janeiro, Rio de Janeiro, Brazil
Fidalgo E, Pedreira B, Abreu MD, Moura ID, Godoy M (2008) Uso e Cobertura daTerra da Bacia Hidrografica do rio Guapi-Macacu, Serie Documentos 105.Embrapa Solos, Brazil, ISSN 1517–262
Forero FA (2002) Sistemas de producción rurales en la Región Andinacolombiana: análisis de su viabilidad económica, ambiental y cultural. GrupoSistemas de Producción y Conservación/ Instituto de Estudios Rurales (IER),Bogota, Colombia
Gaese H (2009) Demands for Interdisciplinary Research in Human-EcologicalSystems. In: Gaese H, Torrico JC, Wesenberg J, Schluter S (eds) Biodiversityand Land Use Systems in the Fragmented Mata Atlantica of Rio de Janeiro.Cuvillier Verlag, Gottingen, Germany
Garcia-Nieto AP, Garcia-Llorente M, Iniesta-Arandia I, Martin-Lopez B (2013)Mapping forest ecosystem services: From providing units to beneficiaries.Ecosystem Services 4(Special Issue on Mapping and Modelling EcosystemServices):126–138
Grieg-Gran M, Porras I, Wunder S (2005) How can market mechanisms for forestenvironmental services help the poor? Preliminary lessons from LatinAmerica. World Dev 33(9):1511–1527
Guedes FB, Seehusen SE (2011) Pagamentos por Servicos Ambientais na MataAtlanica: licoes aprendidas e desafios, vol 2, Serie Biodiversidade 42.Ministerio do Meio Ambiente-MMA, Brasilia, Brazil
Haines-Young R, Potschin M (2013) Proposal for a Common InternationalClassification of Ecosystem Goods and Services (CICES) for IntegratedEnvironmental and Economic Accounting, Report to the European EnvironmentAgency., Available via CICES. http://cices.eu/wp-content/uploads/2012/07/CICES-V43_Revised-Final_Report_29012013.pdf Access 21 Jul 2011
Hanson C, Talberth J, Yonavjak L (2011) Forests for Water: Exploring Payments forWatershed Services in the U.S. South. World Resources Institute, WRI IssueBrief. Available via WRI. http://www.wri.org/publication/forests-water.Accessed 04 Jul 2014
Hawkins K (2003) Economic Valuation of Ecosystem Services. University ofMinnesota, http://www.environmentalmanager.org/wp-content/uploads/2008/04/valuation%2520of%2520ecosystems.pdf. Accessed 04 Jul 2014
Holmes TP (1988) The offsite impact of soil erosion on the water treatmentindustry. Land Econ 64(4):356–366
Honey-Roses J, Acuna V, Bardina M, Brozovi N, Marce R, Munne A, Sabater S,Termes M, Valero F, Vega L, Schneider DW (2013) Examining the Demand foEcosystem Services: The Value of Stream Restoration for Drinking WaterTreatment Managers in the Llobregat River, Spain, vol 90:196.205. Elsevier BV
IIED (2012a) Paying for Watershed Services: An Effective Tool in the DevelopingWorld, IIED Briefing Papers., Available via IIED http://pubs.iied.org/17128IIED.Accessed 27 Aug 2012
IIED (2012b) Compensation for Hydrological Environmental Services in LosNegros Cloud Forest. Payments for Watershed Markets-Information onSchemes in Developing Countries., Available via IIED http://www.watershed-markets.org/casestudies/Bolivia_Los_Negros_E.html. Accessed 24 Mar 2014
Instituto Terra Mater (2009) Relatório da Análise de Percepção Ambiental e sobrePagamentos por Serviços Ambientais nas Microbacias do Moinho e Cancan.Produto 3. Serviços de monitoramento sócioconômico e de percepçãoambiental em microbacias piloto – “Projeto de pagamento de serviçosambientais”. Contrato no PRMC/GEF/BIRD, Piracicaba, Brazil
López A (1997) Análise dos Custos Privados e Sociais da erosão do solo- o casoda bacia do Rio Corumbatai, Doctoral Thesis. Escola Superior de Agricultura“Luiz de Queiroz” (ESALQ), University of São Paulo (USP), Piracicaba
Rodríguez Osuna et al. Ecological Processes 2014, 3:16 Page 20 of 21http://www.ecologicalprocesses.com/content/3/1/16
Lorz C, Abbt-Braun G, Bakker F, Borges P, Bornick H, Frimmel FH, Gaffron A,Hebben N, Hofer R, Makeschin F, Neder K, Roig HL, Steiniger B, Strauch M,Walde D, Weis H, Worch E, Wummel J (2011) Die Bedeutung vonLandnutzungsanderungen fur ein Integriertes Wasserressourcen-Management. Eine Fallstudie aus dem westlichen Zentral-Brasilien. .Fachberichte Wasserversorgung. Fachberichte Wasserversorgung, VulcanVerlag, Essen, Germany, gwf-Wasser Abwasser
Marques FM (2009) Valoracao dos Servicos Ambientais da Floresta de MataAtlantica associados a Qualidade e Quantidade da Agua na APA do Sana.Curso de Pos-Graduacao em Agronomia Ciencia do Solo, Thesis. Seropedica,Universidade Federal Rural do Rio de Janeiro (UFRRJ), Rio de Janeiro, Brazil
Martinez de Anguita P, Rivera S, Beneitez JM, Cruz F, Espinal FM (2011) A GIScost-benefit analysis-based methodology to establish a payment forenvironmental services system in watersheds: application to the Calan Riverin Honduras. J Sustain For 30(1–2):79–110
Martin-Ortega J, Ojea E, Roux C (2012) Payments for Water Ecosystem Services inLatin America: Evidence from Reported Experience. In: TEEB Conference2012. Mainstreaming the Economics of Nature: Challenges for Science andImplementation, Leipzig, Germany., p ID143
MDA (2010) Programa Nacional de Crédito Fundiário (PNCF). Linha deFinanciamento combate à pobreza rural, Manual de operações. Ministry ofAgrarian Development (MDA). Secretaria de Reordenamento Agrario, Brasilia,Brazil
MEA (2005) The Millenium Ecosystem Assessment. Island Press, Washington D.CMedeiros R, Young CEF, Pavese HB, Araujo FFS (2011) Contribuição das unidades
de conservação para a economia nacional: Sumário Executivo. UNEP-WCMC,Brasilia, Brazil
Ministry of Environment (2005) Rio Floresta. Assistencia Tecnica e extensaoflorestal aos agricultores familiares da Mata Atlantica do Estado do Rio deJaneiro. Bases Legais e tecnicas para implantacao de projetos florestais.Ministry of Environment Niteroi, Rio de Janeiro, Brazil
Montes C (2007) Del desarrollo sostenible al servicio de los ecosistemas.Asociacion Espanola de Ecologia Terrestre. Ecosistemas Revista Cientifica yTecnica de Ecologia y Medio Ambiente 16(3). Available via RUA.http://rua.ua.es/dspace/handle/10045/7641?locale=en. Accessed 04 Jul 2014
Moore W, McCarl B (1987) Off-site costs of soil erosion: A case study in theWillamette Valley. West J Agric Econ 12(1):42–49
Muñoz-Piña C, Guevara A, Torres JM, Braña J (2008) Paying for the hydrologicalservices of Mexico’s forests: Analysis, negotiations and results. Ecol Econ 65(4):725–736
Naegeli F (2010) Evaluation of Forest Fragmentation and Land Use ChangePatterns using Remote Sensing Techniques and Field Methods, MasterThesis. Cologne University of Applied Sciences, Abstract available viaDINARIhttp://dinario.fh-koeln.de/2011/F.%20Naegeli-%20Evaluation%20of%20forest%20fragmentation%20and%20land%20use.pdf. Accessed 04 Jul 2014
Nehren U, Kirchner A, Sattler D, Turetta AP, Heinrich J (2013) Impact of naturalclimate change and historical land use on landscape development in theAtlantic Forest of Rio de Janeiro, Brazil. An Acad Bras Cienc 85(2):497–518
Nehren U, Sudmeier-Rieux K, Sandholz S, Estrella M, Lomarda M, Guillén T (eds)(2014) The Ecosystem-based Disaster Risk Reduction Case Study and ExerciseSource Book. UNEP/CNRD, http://postconflict.unep.ch/publications/DRR_CASE_STUDIES_&_EXERCISES.pdf. Accessed 04 Jul 2014
Pabon-Zamora L, Fauzi A, Halim A, Bezaury-Creel J, Vega-Lopez E, Leon F, Gil L,Cartaya V (2008) Protected Areas and Human Well-Being: Experiences fromIndonesia, Mexico, Peru and Venezuela, vol CBD Technical Series No. 36.Secretariat of Convention on Biological Diversity, Montreal
Pagiola S, von Ritter K, Bishop J (2004) Assessing the Economic Value ofEcosystem Conservation, Environment Department Paper No. 101. The WorldBank Environment Department, Washington, United States of America,Available via CBD. https://www.cbd.int/doc/case-studies/inc/cs-inc-iucn-nc-wb-en.pdf. Accessed 04 Jul 2014
Pagiola S, Zhang W, Colom A (2010) Can payments for watershed services helpfinance biodiversity conservation? A spatial analysis of Highland Guatemala.J Nat Resour Pol Res 2(1):7–24
Paiva M, Penedo S, Kuenne A, Prado RB, Schuler AE (2011) Qualidade daAgua e Exportacao de Sedimentos em Sub-bacias dos rios Guapi-Macacu- Bioma Mata Atlantica- RJ. In: XXXIII Congresso Brasileiro deCiencia do Solo. Solos nos Biomas Brasileiros: Sustentabilidade eMudancas Climaticas. Embrapa, Uberlandia /Minas Gerais, Brazil, Availablevia Embrapa. http://ainfo.cnptia.embrapa.br/digital/bitstream/item/51926/1/2315-1.pdf. Accessed 04 Jul 2014
Pattanayak SK, Wunder S, Ferraro PJ (2010) Show me the money: Do paymentssupply environmental services in developing countries? Rev Environ EconPolicy 4(2):254–274
Pedreira B, Fidalgo ECC, Abreu MB, Epiphanio JCN, Galvao LS (2009)Mapeamento do uso e cobertura da terra da bacia hidrografica do rioGuapi-Macacu, RJ. Anais XIV Simposio Brasileiro de Sensoriamento Remoto.Natal, INPE. pp 2111–2118
Perman R, Ma Y, McGilvray J, Common M (2003) Natural Resource andEnvironmental Economics, Third Editionth edn. Pearson Education Limited,Available via WordPress. http://dutraeconomicus.files.wordpress.com/2014/01/roger-perman-yue-ma-michael-common-david-maddison-james-mcgilvray-natural-resource-and-environmental-economics-3rd-edition-2003.pdf. Accessed 04 Jul 2014
Porras I, Grieg-Gran M, Neves N (2008) All that Glitters: A Review of Payments forWatershed Services in Developing Countries, vol Natural Resource Issues 11.International Institute for Environment and Development, Available via IIED.http://pubs.iied.org/13542IIED.html. Accessed 04 Jul 2014
Postel B, Barton H, Jr T (2005) Watershed protection: Capturing the benefits ofnature’s water supply services. Nat Res Forum 29:98–108
Pria DA, Diederichsen A, Klemz C (2013) Pagamento por Servicos Ambientais.Uma estrategia para a conservacao ambiental nas regioes produtivas doBrasil? Sustentabilidade em. Debate 4(1):317.340
Quintana B (2012) Native Tree Species in Silvopastoral Systems: A BioeconomicAssessment in Cachoeiras de Macacu, RJ-Brazil, Master Thesis. Master ofScience awarded by Universidad Autónoma de San Luis Potosí and CologneUniversity of Applied Sciences. Cologne University of Applied Sciences.Available. http://www.google.de/url?url=http://comunidadpmpca.uaslp.mx/documento.aspx%3FidT%3D258&rct=j&frm=1&q=&esrc=s&sa=U&ei=z9q2U8K-DLOTmywPbw4CgCA&ved=0CCQQFjAD&usg=AFQjCNFldcTMmPE0Err5jbaX-kOJOA3FeJA. Accessed 04 Jul 2014
Quintero M, Wunder S, Estrada R (2009) For services rendered? Modelinghydrology and livelihoods in Andean payments for environmental servicesschemes. For Ecol Manag 258(9):1871–1880
Reis LVS (2004) Cobertura Florestal e Custo do Tratamento de Águas em BaciasHidrográficas de Abastecimento Público: Caso do Manancial do Município dePiracicaba, Doctoral Thesis. University of São Paulo (USP), Piracicaba,Accessed via USP. http://www.google.de/url?url=http://www.teses.usp.br/teses/disponiveis/11/11150/tde-14122004-113308/publico/lucia.pdf&rct=j&frm=1&q=&esrc=s&sa=U&ei=29u2U8e9FKviywPXg4H4CA&ved=0CBQQFjAA&usg=AFQjCNEomEW_8Ve3hF6ct4kADwlw013bCA.Accessed 04 Jul 2014
Ribeiro MC, Metzger JP, Martensen AC, Ponzoni FJ, Hirota MM (2009) TheBrazilian Atlantic Forest: How much is left, and how is the remaining forestdistributed? Implications for conservation. Biol Conserv 142(6):1141–1153
RioRural (2013) Rio Rural. Programa de Desenvolvimento Rural Sustentavel emMicrobacias Hidrograficas. Governo do Rio de Janeiro. Secretaria deAgricultura e Pecuaria, Rio de Janeiro, Brazil, Available via http://www.microbacias.rj.gov.br/. Accessed 15 Jul 2012
Rodriguez Osuna V (2013) Smallholder Production and Climate Risk: The LowerAmazon Region, Brazil. LAP Lambert Academic Publishing, Germany
Russi D, ten Brink P, Farmer A, Badura T, Coates D, Forster J, Kumar R, DavidsonN (2013) The Economics of Ecosystems and Biodiversity for Water and Wetlands.Institute for European Environmental Policy (IEEP) & Ramsar Secretariat. Availablevia TEEB. http://www.teebweb.org/publication/the-economics-of-ecosystems-and-biodiversity-teeb-for-water-and-wetlands/. Accessed 04 Jul 2014
Santos DG, Domingues AF, Gisler CVT (2010) Gestão de recursos hídricos naagricultura: O Programa Produtor de Água. In: Prado RB, Turetta AP, AndradeAG (eds) Manejo e Conservação do Solo e da Água no Contexto dasMudanças Ambientais. Brazil, Rio de Janeiro, pp 353–376
Secretary of Agriculture, Cattle Farming, Fisheries and Supply (2011) Governmentof Rio de Janeiro. Campanha de Vacinalção contra a febre aftosa. Cachoeirasde Macacu Region. Núcleo de Defesa Sanitária- Escritorio Cachoeiras Macacu,Rio de Janeiro, Brazil
Stanton T, Echavarria M, Hamilton K, Ott C (2010) State of Watershed Payments.An Emerging Marketplace. Executive Summary. Ecosystem Marketplace: AForest Trends Initiative., http://www.forest-trends.org/publication_details.php?publicationID=2440. Accessed 04 Jul 2014
Strobel JS, De Sousa JR WC, da Motta RS, Amend MR, Goncalves DA (2007)Critérios Econômicos para a Aplicação do Princípio do Protetor – Recebedor:Estudo de Caso do Parque Estadual dos Três Picos Serie Tecnica, vol Edicao11. Conservation Strategy Fund, Brazil
Rodríguez Osuna et al. Ecological Processes 2014, 3:16 Page 21 of 21http://www.ecologicalprocesses.com/content/3/1/16
TEEB (2009) The Economics of Ecosystems and Biodiversity for National andInternational Policy Maker. Summary: Responding to the Value of Nature.The Economics of Ecosystems and Biodiversity (TEEB), Wesseling, Germany
TEEB (2010a) The Economics of Ecosystems and Biodiversity (TEEB). Ecologicaland Economic Foundations, Earthscan, London and Washington
TEEB (2010b) Mainstreaming the Economics of Nature: A Synthesis of theApproach, Conclusions and Recommendations of TEEB. The Economics ofEcosystems and Biodiversity (TEEB), Malta
TEEB (2010c) TEEB for Business Report, Executive Summary. The Economics ofEcosystems and Biodiversity (TEEB), Malta
Thomas JM, Callan SJ (2010) Economia Ambiental: Aplicacoes, Politicas e Teoria.Cencage Learning, São Paulo
van Noordwijk M (2005) RUPES typology of environmental service worthy ofreward, RUPES Working Paper. ICRAF-Southeast Asia, Bogor
Veiga FC (2008) A Construcao dos Mercados de Servicos Ambientais e suasImplicacoes para o Desenvolvimento Sustentavel no Brasil, Doctoral Thesis.UFRRJ, Rio de Janeiro, Brazil
Veiga FC, Galvadao M (2011) Iniciativas de PSA de conservacao dos recursoshidricos na Mata Atlantica. In: Guedes BF, Seehusen ES (eds) Pagamentos porServicos Ambientais na Mata Atlanica: licoes aprendidas e desafios, vol SerieBiodiversidade 42, Secondth edn. Ministerio do Meio Ambiente, Secretaria deBiodiversidade e Florestas, Departamento de Conservacao da Biodiversidade,Brasilia, Brazil
WBI (2011) Estimating the opportunity costs of REDD+, vol Version 1.3, A trainingmanual. The World Bank Institute, Washington DC
WRI (2011) Mainstreaming Ecosystem Services Initiative (MESI). World ResourcesInstitute, Washington, United States of America, Available via WRI. http://www.wri.org/project/mainstreaming-ecosystem-services
Wunder S, Alban M (2008) Decentralized payments for environmental services:The cases of Pimampiro and PROFAFOR in Ecuador. Ecol Econ 65(4):685–698
Zimmer Y, Deblitz C, Seifert K (2009) Die globale Landwirtschaft besser verstehen: Agrarokonomen betreiben internationales Netzwerk agri benchmark,Forschung Report. Agribenchmark, Braunschweig, Germany
doi:10.1186/s13717-014-0016-7Cite this article as: Rodríguez Osuna et al.: Priority areas for watershedservice conservation in the Guapi-Macacu region of Rio de Janeiro,Atlantic Forest, Brazil. Ecological Processes 2014 3:16.
Submit your manuscript to a journal and benefi t from:
7 Convenient online submission
7 Rigorous peer review
7 Immediate publication on acceptance
7 Open access: articles freely available online
7 High visibility within the fi eld
7 Retaining the copyright to your article
Submit your next manuscript at 7 springeropen.com