Quantitative Transcriptomics using Designed Primer-based Amplification
Research ArticlePrimary Stability Recognition of the Newly Designed CementlessFemoral Stem Using Digital Signal Processing
Mohd Yusof Baharuddin12 Sh-Hussain Salleh2 Mahyar Hamedi2
Ahmad Hafiz Zulkifly3 Muhammad Hisyam Lee24 Alias Mohd Noor2
Arief Ruhullah A Harris2 and Norazman Abdul Majid2
1 Department of Biomedical Engineering Faculty of Engineering University ofMalaya 50603 LembahPantai Kuala LumpurMalaysia2 Centre for Biomedical Engineering Transportation Research Alliance Universiti Teknologi Malaysia 81310 Skudai Johor Malaysia3 Department of Orthopaedic Traumatology amp Rehabilitation Kuliyyah of Medicine International Islamic University Malaysia25200 Kuantan Pahang Malaysia
4Department of Mathematical Sciences Faculty of Science Universiti Teknologi Malaysia 81310 Skudai Johor Malaysia
Correspondence should be addressed to Sh-Hussain Salleh hussainfkeutmmy
Received 15 November 2013 Revised 20 February 2014 Accepted 6 March 2014 Published 1 April 2014
Academic Editor Yoshinobu Sato
Copyright copy 2014 Mohd Yusof Baharuddin et alThis is an open access article distributed under theCreativeCommonsAttributionLicense which permits unrestricted use distribution and reproduction in anymedium provided the originalwork is properly cited
Stress shielding and micromotion are two major issues which determine the success of newly designed cementless femoral stemsThe correlation of experimental validation with finite element analysis (FEA) is commonly used to evaluate the stress distributionand fixation stability of the stem within the femoral canal This paper focused on the applications of feature extraction and patternrecognition using support vector machine (SVM) to determine the primary stability of the implant We measured strain withtriaxial rosette at the metaphyseal region and micromotion with linear variable direct transducer proximally and distally usingcomposite femora The root mean squares technique is used to feed the classifier which provides maximum likelihood estimationof amplitude and radial basis function is used as the kernel parameter which mapped the datasets into separable hyperplanes Theresults showed 100 pattern recognition accuracy using SVM for both strain and micromotion This indicates that DSP could beapplied in determining the femoral stem primary stability with high pattern recognition accuracy in biomechanical testing
1 Introduction
Total hip arthroplasty (THA) has been the most successfulsurgery in the orthopaedic field in the 20th century Commonissues which arise concerning the femoral stem include stressshielding in the proximal calcar and micromotion withinthe femoral canal [1ndash4] Stiffer femoral stems induce stressshielding and bone resorption due to lack of mechanicalresponse in surrounding bone [2 3] This phenomenonwhich commonly occurs in proximal calcar will complicatethe revision surgery either while removing the old stem orwhile providing primary stability for a new stem because ofthe severe bone resorption at that region [5] In additionthe interface micromotion between the femoral stem andthe medullary canal should be around 40 120583m to promoteprimary bone ingrowth and less than 150120583m to prevent
fibrous tissue formation [6 7]This is essential for cementlessfemoral stems which depend solely on the implantmdashboneinterface for osseointegration and primary fixation stabilityStress distribution and micromotion are generally validatedin vitro using human cadaveric bones Still the availabilityof cadaveric bone is restricted and its preparation is cum-bersome The use of composite femur is a solution whichmimics the mechanical properties of actual human femora[8] In addition this eradicates geometrical and mechanicaldifferences between cadaveric femoras [2]
Finite element analysis (FEA) has become an importanttool for researchers to predict the results of the newlydesigned implant [9] Pettersen et al [1 2] affirmed thecorrelation between subject specific human cadaveric femurandfinite element analysiswhich looks upon the stress shield-ing and micromotion around cementless femoral stems
Hindawi Publishing CorporationBioMed Research InternationalVolume 2014 Article ID 478248 9 pageshttpdxdoiorg1011552014478248
2 BioMed Research International
In addition Dopico-Gonzalez et al [10] investigated aprobabilistic finite element analysis of cementless femoralstems which emphasized femora anatomical features andgeometrical stem design which demonstrated good agree-ment with the in vitro study In this present study we wouldlike to utilize our knowledge of digital signal processingon strain and micromotion for pattern recognition As faras the authors are aware there is no documented studyregarding feature extraction and pattern recognition involv-ing either micromotion or strain distribution for primarystability of the cementless femoral stem involving a supportvector machine as a classifier Only few studies appliedDSP while studying femoral stem loosening [11ndash13] andstress impact [14] The conventional diagnostic investigationfor loosening after THA generally uses imaging modalitiessuch as plain radiograph arthrography scintigraphy andfluorodeoxyglucose-positron emission tomography (FDG-PET) [11] As more than one million THA are performedeach year better methods using sensors were introducedto reduce costs and improve diagnostic performances forTHA looseningThe characterization of the femoral stem andbone is completed using electrical (conductivity) mechan-ical (strain micromotion and stiffness) acoustic (audiblesound and ultrasound) and biological (pH and temper-ature) properties [11] Li et al [12] found that vibrationanalysis using frequency (fast Fourier transform) could beimplemented to diagnose late loosening but it performedpoorly when used to diagnose early loosening Pastrav etal [13] assessed the in vivo vibration analysis based endpoint during femoral stem implantation using a frequencyresponse function that offered reliable information stabilityand lessen intraoperative fractures Gueiral and Nogueira[14] studied the impact of peak stress on THA by employingacoustic emissions normally used for detection location andclassification of cracks in the femoral canal The objectivesof this study were (1) to validate the newly designed femoralstem from experimental and finite element analysis and (2)to propose a new method using support vector machine infeature extraction andpattern recognition of the femoral stemprimary stability
2 Materials and Methods
21 Experimental Protocol Theexperimentwas performed tovalidate the finite element analysis towards stress distributionand micromotion as shown in Figure 1 We used smallleft fourth generation composite femur (Sawbones PacificResearch Laboratories Inc Vashon Island WA USA) whichmimicked actual human femora in accordance with Asianhip morphologyThe composite femur had a 95mm isthmusdiameter with a collodiaphyseal angle of 130∘ The femurneck was resected by an experienced orthopaedic surgeonbefore being implanted with our newly designed femoralstem within the medullary canal This metaphyseal loadingmediolaterally flared femoral stem was designed tailored toAsian femur anatomy [15 16] The femur was loaded at thecenter of the femoral stem ball using an advanced materialtesting system machine (Instron 5565 Norwood MA USA)
at the rate of 1 kNmin and constrained distally using acustom designed jig positioned at the base of the machineThe cyclic axial loading was set from 0 to 2000N using 5 kNload cell for 50 cycles The jig aid aligned the vertical loadingwith the femur mechanical axis and was tilted 12∘ in valgusmimicking the actual femur orientation The pretest wasdone using a similar set-up before experimental validation tostabilize the implant within the femoral canal
211 Micromotion Measurement Micromotion was mea-sured using two linear variable displacement transduc-ers (LVDT Model DP2S Orbit3 Digital Probe SolartronMetrology West Sussex UK) proximally and distally asshown in Figure 1(b) These sensors processed data up to3906 readings per second with an accuracy of 01120583mresolution of 1 120583m and a measurement range of 2mm Thecalibration showed peak-to-peak error of 013ndash016 120583mwhileunder 1014 mbars pressure Four mm diameter holes weredrilled 10mm below the osteotomy level for the proximalregion and 10mm above the femoral stem tip for the distalregion The steel pins were glued into the femoral stem holeswhich were drilled prior to implantation to prevent a stemmdashmedullary canal mismatch The sensors were fixed firmly atthe extra cortical femora with the spring tip touching thesteel pin Micromotion was measured by the LVDT oncethe axial cyclic loading from Instron machine was exertedupon the femoral stem through a digital network (Orbit3DigitalNetworkV30 SolartronMetrologyWest SussexUK)connected to the sensors Elastic micromotion was computedfrom the difference between the peak and trough for eachcycle
212 Strain Measurement Strain distribution was measuredusing four triaxial rosettes (UFRA-5-350-17 Tokyo SokkiKenkyujo Co Ltd Tokyo Japan) medially and laterally atthe metaphyseal region as shown in Figure 1(c)This stainlesssteel (SUS 304) gauge had resistance of 350plusmn10Ω and factorof 213 plusmn 10 In addition this 5mm length gauge had threegrid orientations 0∘ (120598
1) 45∘ (120598
2) and 90∘ (120598
3) as illustrated
in Figure 1(d) Several steps were taken to bind the triaxialrosette optimally to the composite femur
(1) The position of the strain gauge to the femur surfacewas first determined proximally medial and lateralcalcar
(2) The femur surface was prepared by removing anygrease or dirt with a solvent (Freon TF) A regionlarger than the bonding area was wet abraded usingsilicon carbide paper (220ndash320 grit size) with a condi-tioner (M-Prep Conditioner A) and dried using gauzesponge
(3) The femur surface was then finely cleansed with asmall amount of acetone (M-PrepNeutralizer 5) usinga cotton tipped applicator to prevent contamination
(4) The strain gauge was carefully removed from theacetate envelope and tape mastic (M-M NumberPCT-2 cellophane tape)was placed over the gauge andits lead to ease the realignment process The adhesive
BioMed Research International 3
(a) (b) (c)
1
2
3
(d)
Point loadFixed displacement
2000N
(e)
T + 20
T minus 10
T minus 40
(f)
Figure 1 Experimental validation using composite femur (a) loading condition (b) micromotion (c) strain distribution (d) triaxial rosetteorientations (e) finite element analysis and (e) newly designed femoral stem
(M-Bond 200) was then swabbed uniformly at theback of the strain gauge base
(5) The strain gauge was realigned and promptly appliedto the femur surface and pressed down using thumbwith tape mastic (M-M Number PCT-2 cellophanetape) over it for approximately one minute to com-plete the curing process
(6) The tape was gently removed and the gauge leadswere raised using a pair of tweezers A terminal foilshape connector (TF-2S) was placed near the gauge(3ndash5mm) to alleviate the wiring process The gaugeleads were soldered slightly taut to the connectingterminal to avoid excessive tension during strainmea-surementThe extension lead wire was soldered to theterminal wire at the opposite side of the connectingterminal The strain gauge was then protected withpolyurethane protective layer (PU120) The terminalwires which connected to the strain gauge were finallyconnected to a multichannel data logger (TDS-630
Tokyo Sokki Kenkyujo Co Ltd Tokyo Japan) Theequivalent von Misses stress was computed using thestrain data acquired
22 Finite Element Analysis The femoral stem was designedusing computer aided design (CAD) software (SolidWorks2009 SP21 Dassault System Massachusetts USA) in accor-dance with local anatomical femoral features [17ndash19] Theosteotomy level was set to 20mm above the center of thelesser trochanter The stem was subsequently aligned withinthe medullary canal to simulate hip arthroplasty and thestem neck was positioned to mimic the experimental stemorientationThe stem and ldquovirtual surgery femorardquo were thenimported to finite element software (MarcMentat MSC Soft-ware Santa Ana CA) in stereo lithographic format and thenconverted into solid linear first order tetrahedral elementsA mesh convergence study was performed on the femoralstem to ensure that the results were independent of the meshdensity An average of 13 200 elements with 4 200 nodes wasfound to be optimal for the cementless femoral stem and
4 BioMed Research International
the ldquovirtual surgery femorardquo consisted of 7 900 nodes and41 900 elements The material properties of the cementlessfemoral stem were described as 316 L stainless steel withYoungrsquos Modulus of 200GPa with a Poissonrsquos ratio of 03 [20]In addition the femur was assumed to be isotropic and linearelastic with bone properties determined according to the CTdatasets grey level values using the correlation proposed byCarte and Hayes [21] The cancellous and cortical bones wereassumed to be at different ends of a continuum spectrumThefinite element model was completely restrained distally andloaded at the center of the femoral stem head with 2 kN asshowed in Figure 1 A deformable to deformable contact wascreated between stem and femur with a friction coefficient of04Themicromotion algorithm subroutine used in this studywas written using Compaq Visual Fortran software (CompaqComputer Corporation) to compute micromotion in finiteelement software The result focused on the equivalent vonMises stress and micromotion
23 Digital Signal Processing Root mean square (RMS)technique was used to feed the classifiers because the RMSprovided the maximum likelihood estimation of amplitudein a constant force when a signal was modeled as a Gaussianrandom process The micromotion signals for each channel(proximal and distal) were divided into three classes highpeak transition and stabilized On the other hand strainsignal for each channel (120576
1 1205762 and 120576
3) was divided into four
classes (A B C and D) The RMS was excerpted after every500 seconds of raw signal and subsequently fed into classifieras shown in (1) where 119909
119899are the signals from all datasets and
119873 is the length of 119909119899 Consider
RMS = 1
119873
119873
sum
119899=1
1199092
119899
(1)
In this present study multiclass support vector machine(SVM) is used to classify the 3 classes of LVDT and 4classes of triaxial rosette under consideration which requireda classifier as shown in (2) where 119896 is the number of classeswhich approximate the most suitable class from the datasetsConsider
119891 119877119873
997888rarr 1 119896
(1199091 1199101199091) (119909
119899 1199101198991) isin 119877119873
times 1 119896
(2)
SVM is commonly used as a binary classifier to classify twogroups of data However an increment to the datasets andclasses required an optimal nonlinear classificationwith SVMwhich could solve the classification problems by mappingthe original data into a ldquofeature spacerdquo The kernel function120593(sdot) was applied to the map training vector 119909
119894into a higher
dimensional space which belonged to the dot product spaceas shown in
119896 (119909119894 119909119895) = (120593 (119909
119894) sdot 120593 (119909
119895)) (3)
We applied the radial basis function (RBF) as the kerneltypes in accordance with our datasets structure where 120574 gt 0
is the kernel parameter as shown in
119896 (119909119894 119909119895) = 119890
minus120574|1199091minus119909119895|
2
(4)
Subsequently these datasets were mapped into the lin-early separable space and hyperplanes divided them intotwo labeled classes The hyper plane was the best optionto separate the data as it yields the maximum margin ofseparation between the classes One-against-all and one-against-one were two techniques used in multiclass SVMclassification In this study one-against-all method was usedto classify the data because this technique was easy to applyrequired less computational time and produced accurateresults Training one-against-all is an essential requisite ofthe 119896 binary SVMs training In addition estimation for theprobability of the output of a pairwise classifier betweenclasses 119894 and 119895 is defined by 119903
119894119895as shown in
119903119894119895asymp 119901 (119910 = 119894 | 119910 = 119894 119895 119909) 119903
119894119895+ 119903119895119894= 1 (5)
and 119901119894is the probability of the 119894th class The class probability
119901 = (1199011 119901
119896) can be derived by (6)
min119896
sum
119894=1
sum
119895119895 = 1
(119903119894119895119901119895minus 119903119895119894119901119894)2
119896
sum
119894=1
119901119894= 1119875119894ge 0 (6)
The SVM parameters were adjusted and three- (micro-motion) or four- (strain) fold random cross validation wasemployed for assessment purposes Asmentioned above RBFwas our kernel type (120574 = 1119896) where 119896 was the number ofattributes in the input data and 119862 = 1 was the cost of SVMThe active features were randomly permutated precedingtraining to facilitate classifier training Subsequently 70 ofthe data were fed to classifiers for training and 30 for testingin SVM
24 Statistical Analysis The time domain features for bothinterface micromotion and strain distribution were statis-tically analyzed with SAS 43 software (SAS Institute IncCary NC USA) For micromotion two cases were studiedwhich involved the comparison between channels (proximaland distal) and the comparison between classes (high peaktransition and stabilized) in each channel On the otherhand three cases were studied in strain distribution whichconsisted of the comparison between channels (120576
1 1205762 and
1205763) in each class (A B C and D) comparison between
classes and comparison between middle (AB) and lateral(CD) classes Normality assumption for each group of datawas verified using Kolmogorov-Smirnov method Folded 119865method will be used to examine the equality of data varianceif the data was normally distributedThe probability was thenchecked using 119905-test either by Pooledmethod or Satterthwaitemethod according to the equality of the variance If thedata was not normally distributed nonparametric one-wayvariance (ANOVA) was adopted using Wilcoxon scores Thevalue for probability (Pr gt 119865) must be less than 005 to verify
BioMed Research International 5
0
minus001
minus002
minus003
minus004
minus005
minus006
minus007
minus0080 1 2 3 4 5 6 7 8 9
times104Data
High peak Transition Stable
ProximalDistal
(mm
)
(a)
3000
2500
2000
1500
1000
500
0
minus500
minus1000
minus1500
minus2000
minus2500
Stra
in ( 120583
120576 )
Tri-axial rosette
MeanMaximum
Minimum
A1 A2 A3 B1 B2 B3 C1 C2 C3 D1 D2 D3
(b)
Figure 2 Raw data for (a) micromotion and (b) strain gauge
that the datawere statistically significant for variance analysisSubsequently multiple comparisons were performed usingTukeyrsquos studentized range test using the least square meanfor effect feature (Pr gt |119905|) which must be less than 005 todemonstrate that the comparison was statistically significant
3 Results
The raw data for both micromotion and strain distributionare illustrated in Figure 2 For the micromotion we dividedthe signal into three regions high peak (initial phase) tran-sition (middle phase) and stable (final phase) The signalsdecreased exponentially for both proximal and distal regionThe raw signal for proximal region started with 4 120583m beforestabilizing atasymp40120583mwhile at distal region startedwith 18120583mbefore stabilizing at asymp70 120583m The elastic micromotion wascomputed which showed proximal region stabilized at 15ndash20 120583m and distal region stabilized at 10ndash12 120583m The strainsignal ismeasured from four different locations aroundmeta-physeal region proximal medical calcar (A) distal medicalcalcar (B) proximal lateral (C) and distal lateral (D) Themean values for equivalent vonMisses stress for experimental
Table 1 Analysis of micromotion variance for comparison betweenchannels and classes
119873 119865 value Pr gt 119865 119877-squareBetween channels 342 66979 lt00001 0663297Between classes
Proximal 171 33892 lt00001 0801379Distal 171 15117 lt00001 0642819
Table 2 Analysis of strain variance for comparison betweenchannels and classes
119873 119865 value Pr gt 119865 119877-squareBetween channels
A 72 340622 lt00001 0999899B 72 180487 lt00001 0999809C 72 377443 lt00001 0999087D 72 227867 lt00001 0985085
Between classesA versus Bversus C versus D 288 6636 lt00001 0412109
AB versus CD 288 198 01603 0006881
testing were 1426 plusmn 1200MPa (A) 1168 plusmn 974MPa (B)614 plusmn 495MPa (C) and 1222 plusmn 981MPa (D) From themicromotion contour plots in Figure 3 we found that themaximum value for micromotion was 476 120583m proximallyand 1303 120583m distally This ensured bone ingrowth occurringin the bonemdashstem interface and fibrous tissue formationwas prevented which reflected the implantrsquos fixation stabilityThe stress was normally distributed at metaphyseal regionwhich was essential for primary stability fixation preventingstress shielding at the proximal calcar as shown in Figure 4The stresses demonstrated in FEA were 15ndash20MPa (A) 20ndash35MPa (B) 5ndash10MPa (C) and 15ndash20MPa (D) The safetyfactor for this new stem design was computed as 245
We extracted active features using vector supportmachine classifier as shown in Figure 5 From this studywe managed to acquire 100 pattern recognition for bothsignals using SVM Three micromotion classes (high peaktransitions and stable) for proximal and distal LVDTand four strain classes (A B C and D) were clearlydiscriminated in Figure 5 In Table 1 the RMS showedsignificant differences (119875 lt 005) for comparisons againstclasses (high peak transition and stabilized) and betweenchannels (proximal and distal) The RMS demonstrated119865 value of 66979 (with 119877
2
= 066) between channelsIn addition the 119865 values between channels for proximalregion were shown as 33992 (with 119877
2
= 080) and 15117for distal region (with 119877
2
= 064) Further analysis formultiple comparisons test between classes for RMS alsodenoted significant differences (119875 lt 005) In Table 2the RMS showed significant differences (119875 lt 005) forboth comparisons against classes (A B C and D) andbetween channels (120576
1 1205762 and 120576
3) However comparison
between classes medial (AB) and lateral (CD) was notstatistically significant (119875 gt 005) Advance analysis for
6 BioMed Research International
(a) (b)
(mm
)
1000e + 000
9000e minus 001
8000e minus 001
7000e minus 001
6000e minus 001
5000e minus 001
4000e minus 001
3000e minus 001
2000e minus 001
1000e minus 001
0000e + 000
(c)
Figure 3 Finite element analysis for micromotion (a) high peak (b) transition and (c) stable phase
5000e + 001
4500e + 001
4000e + 001
3500e + 001
3000e + 001
2500e + 001
2000e + 001
1500e + 001
1000e + 001
5000e + 000
0000e + 000
(MPa
)
Figure 4 Finite element analysis for equivalent von Mises stress after stable phase
multiple comparisons test between channels denoteda significant difference (119875 lt 005) Furthermore theRMS was statistically significant (119875 lt 005) for multiplecomparisons between classes except between class A and Cand class B and D which demonstrated almost similar meanvalue for these respective classes On the other hand thedistribution between medial and lateral classes comparisondemonstrated no difference between AB and CD
4 Discussion
In general the validation of the experimental testing cor-related normally with the finite element analysis (FEA)Several studies have described the FEA as a fundamentalpreclinical testing tool with promising results [1ndash4] The
primary stability of the femoral stem during physiologicalloading and osseointegration are essential in determiningthe lifespan of the stem Deficiency in fixation stabilitywill cause thigh pain and loosening of the stem due tocontinuous disturbance during bone ingrowth [6] Severalstudies proved thatmicromotion exceeding 150 120583mwill causefibrous tissue formation while less than 40 120583mwill stimulateosseointegration [6 7] Micromotion was found to be higherduring the first load cycle compared to later cycles Theexperimental and FEA results demonstrated abrupt changesbetween the first cycle and subsequent cycles This occurreddue to femoral stem fixation in the femoral canal that createdprestress to the bone Elasticmicromotion from experimentaltesting showed that the femoral stemwas stabilized around 10to 115 120583m distally and 15 to 18 120583m proximally On the other
BioMed Research International 7
High peakStabilizedTransition
Prox
imal
Distal008007006005004003002
45
4
35
3
25
2
15
1
05
0
times10minus2
(a)
DC
BA
Vert
ical
Horizontal
600500400300200100
600 500 400 300 200 100 0 400 600 800 1000 1200 14001600
45 ∘
(b)
Figure 5 Pattern recognition from the vector support machine (a)micromotion and (b) strain
hand micromotion from the FEA was 30 to 40 120583m distallyand 20 to 30 120583m proximally Although the experimentaltesting was well correlated with FEA the result from FEAwasslightly higher due to several limitations such as the frictioncoefficient (120583 = 04) used in FEA for the implantmdashboneinterface simplified boundary conditions loading configura-tions and materials properties (inhomogeneous) Our studyshowed that the micromotion is within the adequate rangewhich primarily promoted bone ingrowth at the implantmdashbone interface particularly at the metaphyseal region as illus-trated in Figure 3 The optimal cross-section stem with thecurvature radius tailored to the femora anatomical featuresconduced to primary stability and lower micromotion value
On the other hand another issue is the stress shieldingdue to bone atrophy at proximal calcar Several factorsinfluenced the load distribution in femoral stem whichare implant geometry implant medullary canal interfaceorientation and osseointegration [20] Also proximal boneingrowth influenced stress distribution at the implantmdashboneinterface maintaining bone stock in this region [22] Thispresent study showed that the maximum femoral stem stressdid not exceed the yield strength of the bone which was160MPa as shown in Figure 4 [23 24] A safety factor of245 ascertained that the stem would not fracture the bone
The equivalent von Misses stress was computed to showthe strain distribution at the triaxial rosettes The strainresults from experimental testing had patterns similar to theequivalent von Mises stress contour plot The medial calcar(A and B) which generally experiences stress shielding dueto adaptive remodeling exhibited normal stress distributionin the FEAThis phenomenon can be described usingWolff rsquoslaw which states that loads are transferred directly throughfemoral stem to the distal region bypassing the proximalregion while performing hip replacement which later causedbone atrophy to the medial calcar Furthermore the use ofisoelastic femoral stems will cause stress shielding to thebone due to the stress to be reduced by half However thefemoral stem in this study obtained excellent results bothmedially and laterally which would prevent stress shieldingfrom occurring and prolong the lifespan of the implant
We reported several limitations in our finite elementanalysisThe femoral stemandmedullary canalwere assumedto be fully bondedwithout penetration In addition Pettersenet al [1 2] pointed out that the degree of contact pressureinterference penetration during stem fixation is difficult todetermine due to several factors such as stem size femorasize and quality and force applied while performing surgeryIn this study our newly designed stem efficiently distributedstress proximally and presented micromotion under thethreshold for osseointegration
Pattern recognition of the primary stability of the cement-less femoral stem is a new field of study which coulddetermine the stable phase during the biomechanical testingAlthough the FEA could predict the result of the implantthere are several limitations which influence this in silicomethod such as boundary and loading conditions mate-rial properties contact bodies and mesh convergence Anychanges to these parameters will lead to different resultswhich are not in compliance with the experimental resultsIn this study we applied digital signal processing (DSP) tothe raw signals for feature extraction and pattern recognitionof the primary stability We used root mean squares as thefeature to feed the multiclass support vector machine (SVM)classifier for feature extraction and pattern recognition Theexcellent result (100 pattern recognition) for the primarystability of the newly designed femoral stem proved that stemstability could be determined using this techniqueThe activefeatures are clearly differentiated which are also similarlyapplied to the strain as shown in Figure 5ThisDSPmethod iseasily applied and it also saved computation time and showedpresentable results In addition the result from DSP is incompliance with the FEA This suggests that DSP could beused to determine the primary stability and could become anefficient preclinical tool for newly designed implants
In micromotion study three classes (high peak transi-tion and stabilized) had been discriminated very well Thisinformation was essential in determining the primary fixa-tion stability of the femoral stem within the medullary canalThe deficiency in fixation stability will cause thigh pain andloosening of the stem due to continuous disturbance duringbone ingrowthThis proposed method not only classified theclasses with high accuracy but also provided the average valuewith its distribution around that region For example let us
8 BioMed Research International
look upon the proximal region The interface micromotionwas distributed normally at the proximal channel witha mean value of 0040 plusmn 0002 for stabilized 0019 plusmn 0007
for high peak and 0034 plusmn 0002 for transition class Thechannels (proximal and distal) were separated excellently(119875 lt 0001) with 119865 value of 66979 (1198772 = 066) andmean value of 11821 plusmn 139041 for proximal region andminus3373 plusmn 12020 for distal region Besides the classes (highpeak transition and stabilized) were distinguished very wellwith 119875 lt 0001 with 119865 value of 33892 (1198772 = 080)The classification accuracy using SVM showed 100 whichmeans that all classes for both channels were perfectlydistinguished This demonstrated that within the adequaterange as discussed above the micromotion of the femoralstem promoted the osseointegration at the bonemdashimplantinterface for the proximal region which is in accordance withthe experimental testing and FEA as shown in Figure 5(a)
On the other hand the strain study focused on fourclasses (A B C and D) which are located at medial andlateral region of the femur Information regarding straindistribution is vital in ensuring that the force was transferredfrom proximal to distal region A common problem afterhip arthroplasty is stress shielding due to the differences instiffness between the implant and femur This phenomenonoccurred at proximal calcar region which caused boneatrophy in the surrounding area and influenced the loadtransfer pattern to the femur To comprehend more aboutthis method for instance let us take class A The strainwas normally distributed at the medial calcar at proximalregion with each channel (120576
1 1205762 and 120576
3) and was statistically
significant (119875 lt 0001) with 119865 value of 340 622 (1198772 =
099) The mean values denoted for each channel based onthe three orientations of the triaxial rosettes are as follows1205761was 455310 plusmn 2457 120576
2was 40135 plusmn 0509 and 120576
3was
172878 plusmn 1791 1205761represented the horizontal axes (0∘) 120576
2
represented the 45∘ and 1205763represented vertical axes (90∘)
as shown in Figure 1(d) This information demonstrated thestrain transferred with its distribution according to thesethree orientations at region A Furthermore all classes (AB C and D) were statistically significant (119875 lt 0001)with 119865 value of 6636 (1198772 = 041) However the medial(AB) and lateral (CD) located rosettes were not statisticallysignificant (119875 lt 016) with 119865 value of 198 (1198772 = 0007) Thiswas illustrated in Figure 5(b) which showed that the medialrosettes (A and C) were located at similar axes in horizontal(1205761) and 45∘ (120576
2) axes with the mean value stated above
However features A and C were confirmed as not statisticallysignificant (119875 = 06304) from the multiple comparisonstest The classification accuracy using SVM showed 100which means that all classes for both channels were perfectlydiscriminated This demonstrated that within the sufficientrange as discussed above the micromotion of the femoralstem distributed the strain at these locations similar to theexperimental testing and FEA
There are several limitations in our study Firstly themea-surements taken in the experimental testingwere restricted tofour triaxial rosettes for strain distribution at themetaphysealregion and two LVDT for micromotion at the proximal
and distal region The load transferred through femoralstem normally caused the stress shielding at the medialcalcar which resulted in bone atrophy and loosening In thisstudy the strain was normally distributed at the metaphysealregion due to optimal contact area of this newly designedfemoral stem The micromotion also demonstrated less than40 120583m which promoted osseointegration between stemsmdashbone interface for both proximal and distal regions Secondlyonly one stem type was used for experimental testing whichsuited theAsian femur anatomical featuresMore commercialoff-the-shelf femoral stem types were required for experi-mental testing in the future which contributed more samplesdata to acquire more reliable DSP method for primarystability recognition Finally only RMS was used as thetime domain feature with the SVM as the classifier Furtherstudy using different time domain features such as maximumabsolute value (MAV) kurtosis (KUR) mean value (MV)waveform length (WL) and simple square integral (SSI)could be tested so that the requirement for training canachieve the reliable system Furthermore the experimentalresults provided evidence of the possibility of selecting thebest feature values in order to improve the robustness of theDSP model
5 Conclusion
We would like to stress the application of digital signalprocessing (DSP) method in determining the femoral stemprimary stability with high pattern recognition accuracyin biomechanical testing Despite the practical constraintsinvolved significant results have been obtained throughthe DSP system which validated the experimental resultswith good correlation which could be applied as preclinicaltools Nevertheless further study regarding different femoraltypes and time domain features and classifiers were requiredto develop a reliable DSP method However this methoddemonstrated excellent result in discriminating each class instrain and micromotion with lower computational cost andless preset parameters
Conflict of Interests
The author reports no conflict of interests in this work
Acknowledgments
The authors would like to thank the Centre forBiomedical Engineering Transportation Research AllianceUniversiti Teknologi Malaysia (UTM) for providingthe research facilities This research work has beensupported by UTM Research Grant (RJ13000077134J058QJ130000243600G31 amp QJ130000243600G33) Ministryof Science and Technology Malaysia (06-01-15-SF0119) andthe Ministry of Higher Education Malaysia (9003-00200)
BioMed Research International 9
References
[1] S H Pettersen T S Wik and B Skallerud ldquoSubject specificfinite element analysis of implant stability for a cementlessfemoral stemrdquoClinical Biomechanics vol 24 no 6 pp 480ndash4872009
[2] S H Pettersen T S Wik and B Skallerud ldquoSubject specificfinite element analysis of stress shielding around a cementlessfemoral stemrdquoClinical Biomechanics vol 24 no 2 pp 196ndash2022009
[3] Z Yosibash A Katza and C Milgrom ldquoToward verified andvalidated FE simulations of a femur with a cemented hipprosthesisrdquoMedical Engineering amp Physics vol 35 pp 978ndash9872013
[4] R Bieger A Ignatius R Decking L Claes H Reicheland L Durselen ldquoPrimary stability and strain distribution ofcementless hip stems as a function of implant designrdquo ClinicalBiomechanics vol 27 no 2 pp 158ndash164 2012
[5] A H Glassman J D Bobyn and M Tanzer ldquoNew femoraldesigns do they influence stress shieldingrdquo ClinicalOrthopaedics and Related Research no 453 pp 64ndash742006
[6] M R Abdul-Kadir U Hansen R Klabunde D Lucas and AAmis ldquoFinite element modelling of primary hip stem stabilitythe effect of interference fitrdquo Journal of Biomechanics vol 41 no3 pp 587ndash594 2008
[7] C A Engh D OrsquoConnor M Jasty T F McGovern J DBobyn and W H Harris ldquoQuantification of implant micro-motion strain shielding and bone resorption with porous-coated anatomic medullary locking femoral prosthesesrdquo Clin-ical Orthopaedics and Related Research no 285 pp 13ndash29 1992
[8] L Cristofolini M Viceconti A Cappello and A TonildquoMechanical validation of whole bone composite femur mod-elsrdquo Journal of Biomechanics vol 29 no 4 pp 525ndash535 1996
[9] R V OrsquoToole III B Jaramaz A M DiGioia III C D Visnicand R H Reid ldquoBiomechanics for preoperative planning andsurgical simulations in orthopaedicsrdquoComputers in Biology andMedicine vol 25 no 2 pp 183ndash191 1995
[10] C Dopico-Gonzalez AM New andM Browne ldquoProbabilisticfinite element analysis of the uncemented hip replacement-effect of femur characteristics and implant design geometryrdquoJournal of Biomechanics vol 43 no 3 pp 512ndash520 2010
[11] C Ruther U Timm H Ewald et al Current Possibilities forDetection of Loosening of Total Hip Replacements and HowIntelligent Implants Could Improve Diagnostic Accuracy InTechRijeka Croatia 2012
[12] P L S Li N B Jones and P J Gregg ldquoLoosening of total hiparthroplasty Diagnosis by vibration analysisrdquo Journal of Boneand Joint Surgery British vol 77 no 4 pp 640ndash644 1995
[13] L C Pastrav S V Jaecques I Jonkers G V D Perre and MMulier ldquoIn vivo evaluation of a vibration analysis technique forthe per-operative monitoring of the fixation of hip prosthesesrdquoJournal of Orthopaedic Surgery and Research vol 4 no 1 article10 2009
[14] N Gueiral and E Nogueira Acoustic Emission Studies in HipArthroplastymdashPeak Stress Impact in Vitro Cemented ProsthesisInTech Rijeka Croatia 2012
[15] M Y Baharuddin S H Salleh A A Suhasril et al ldquoFabricationof low-cost cementless femoral stem 316L stainless steel usinginvestment casting techniquerdquo Artificial Organs 2014
[16] M Y Baharuddin S H Salleh A H Zulkifly et al ldquoDesignprocess of cementless femoral stem using a nonlinear three
dimensional finite element analysisrdquo BMCMusculoskeletal Dis-orders vol 15 no 1 article 30 2014
[17] M Y Baharuddin A H Zulkifly M H Lee M R A Kadir ASaat and A A Aziz ldquoThree dimensional morphometry of thefemur to design the total hip arthroplasty forMalay populationrdquoAdvanced Science Letters vol 19 no 10 pp 2982ndash2987 2013
[18] M Y Baharuddin A H Zulkifly M H Lee M R A KadirA Saat and A A Aziz ldquoThree dimensional morphometry ofproximal femoral medullary canal inMalaysrdquoAdvanced ScienceLetters vol 19 no 12 pp 3582ndash3587 2013
[19] M Y Baharuddin M R A Kadir A H Zulkifly A Saat A AAziz and M H Lee ldquoMorphology study of the proximal femurin malay populationrdquo International Journal of Morphology vol29 no 4 pp 1321ndash1325 2011
[20] M Ando S Imura H Omori Y Okumura A Bo and H BabaldquoNonlinear three-dimensional finite element analysis of newlydesigned cementless total hip stemsrdquo Artificial Organs vol 23no 4 pp 339ndash346 1999
[21] D R Carte and W C Hayes ldquoThe compressive behavior ofbone as a two-phase porous structurerdquo Journal of Bone and JointSurgery American vol 59 no 7 pp 954ndash962 1977
[22] C A Engh and J D Bobyn ldquoThe influence of stem size andextent of porous coating on femoral bone resorption afterprimary cementless hip arthroplastyrdquoClinical Orthopaedics andRelated Research no 231 pp 7ndash28 1988
[23] H H Bayraktar E F Morgan G L Niebur G E Morris EK Wong and T M Keaveny ldquoComparison of the elastic andyield properties of human femoral trabecular and cortical bonetissuerdquo Journal of Biomechanics vol 37 no 1 pp 27ndash35 2004
[24] B R Rawal R Ribeiro R Malhotra and N Bhatnagar ldquoDesignandmanufacturing of femoral stems for the Indian populationrdquoJournal of Manufacturing Processes vol 14 no 3 pp 216ndash2232012
Submit your manuscripts athttpwwwhindawicom
Stem CellsInternational
Hindawi Publishing Corporationhttpwwwhindawicom Volume 2014
Hindawi Publishing Corporationhttpwwwhindawicom Volume 2014
MEDIATORSINFLAMMATION
of
Hindawi Publishing Corporationhttpwwwhindawicom Volume 2014
Behavioural Neurology
EndocrinologyInternational Journal of
Hindawi Publishing Corporationhttpwwwhindawicom Volume 2014
Hindawi Publishing Corporationhttpwwwhindawicom Volume 2014
Disease Markers
Hindawi Publishing Corporationhttpwwwhindawicom Volume 2014
BioMed Research International
OncologyJournal of
Hindawi Publishing Corporationhttpwwwhindawicom Volume 2014
Hindawi Publishing Corporationhttpwwwhindawicom Volume 2014
Oxidative Medicine and Cellular Longevity
Hindawi Publishing Corporationhttpwwwhindawicom Volume 2014
PPAR Research
The Scientific World JournalHindawi Publishing Corporation httpwwwhindawicom Volume 2014
Immunology ResearchHindawi Publishing Corporationhttpwwwhindawicom Volume 2014
Journal of
ObesityJournal of
Hindawi Publishing Corporationhttpwwwhindawicom Volume 2014
Hindawi Publishing Corporationhttpwwwhindawicom Volume 2014
Computational and Mathematical Methods in Medicine
OphthalmologyJournal of
Hindawi Publishing Corporationhttpwwwhindawicom Volume 2014
Diabetes ResearchJournal of
Hindawi Publishing Corporationhttpwwwhindawicom Volume 2014
Hindawi Publishing Corporationhttpwwwhindawicom Volume 2014
Research and TreatmentAIDS
Hindawi Publishing Corporationhttpwwwhindawicom Volume 2014
Gastroenterology Research and Practice
Hindawi Publishing Corporationhttpwwwhindawicom Volume 2014
Parkinsonrsquos Disease
Evidence-Based Complementary and Alternative Medicine
Volume 2014Hindawi Publishing Corporationhttpwwwhindawicom
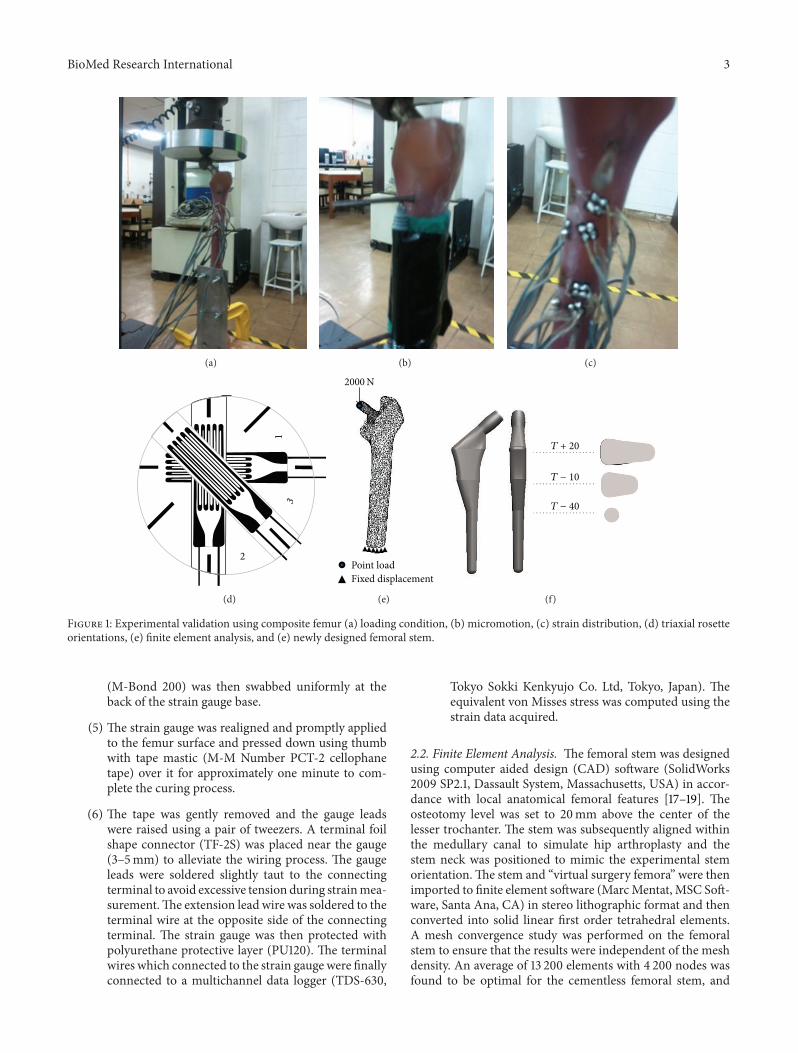
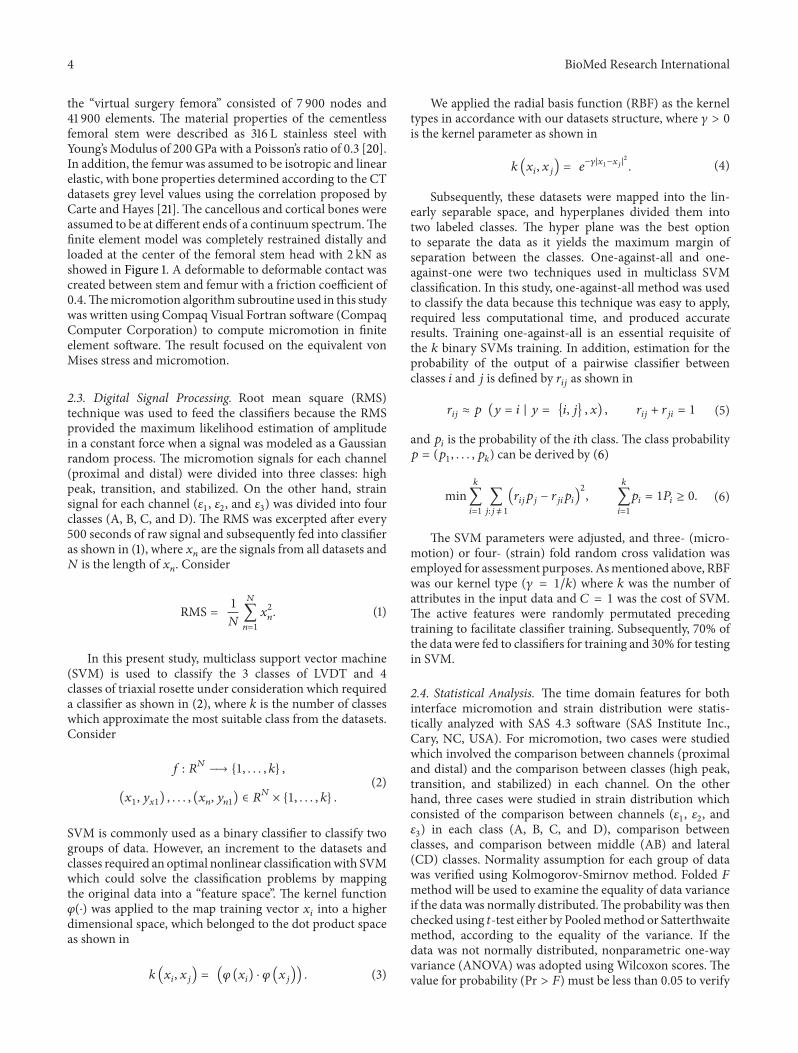
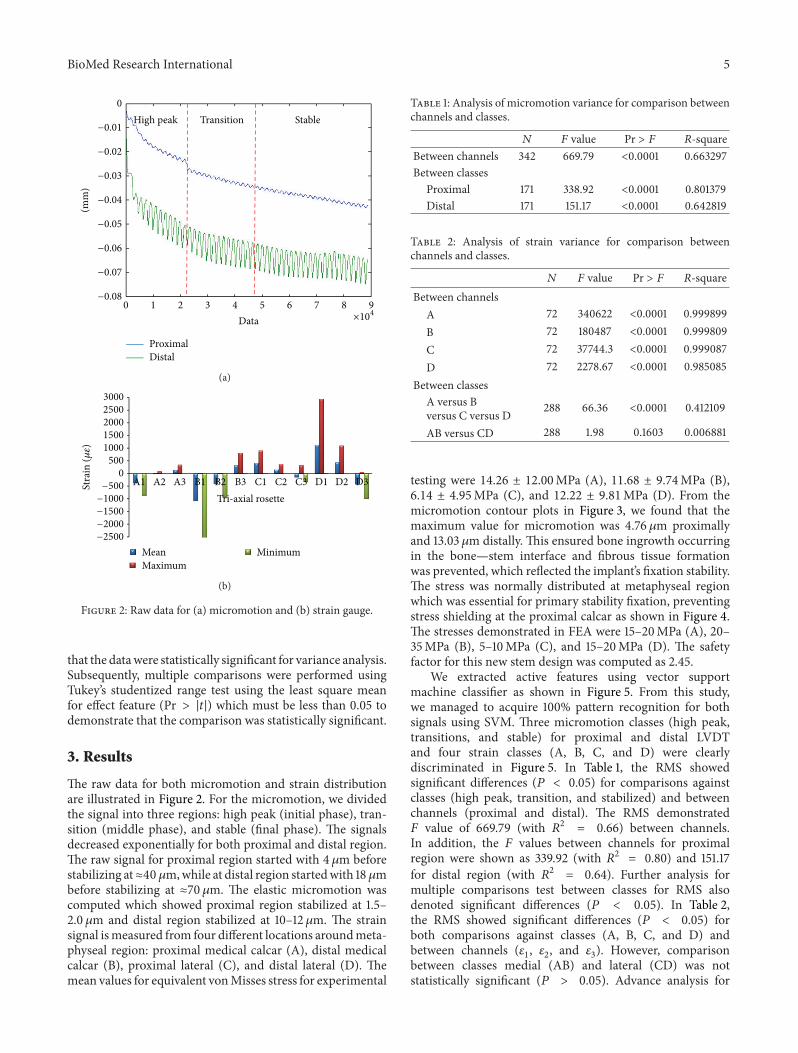
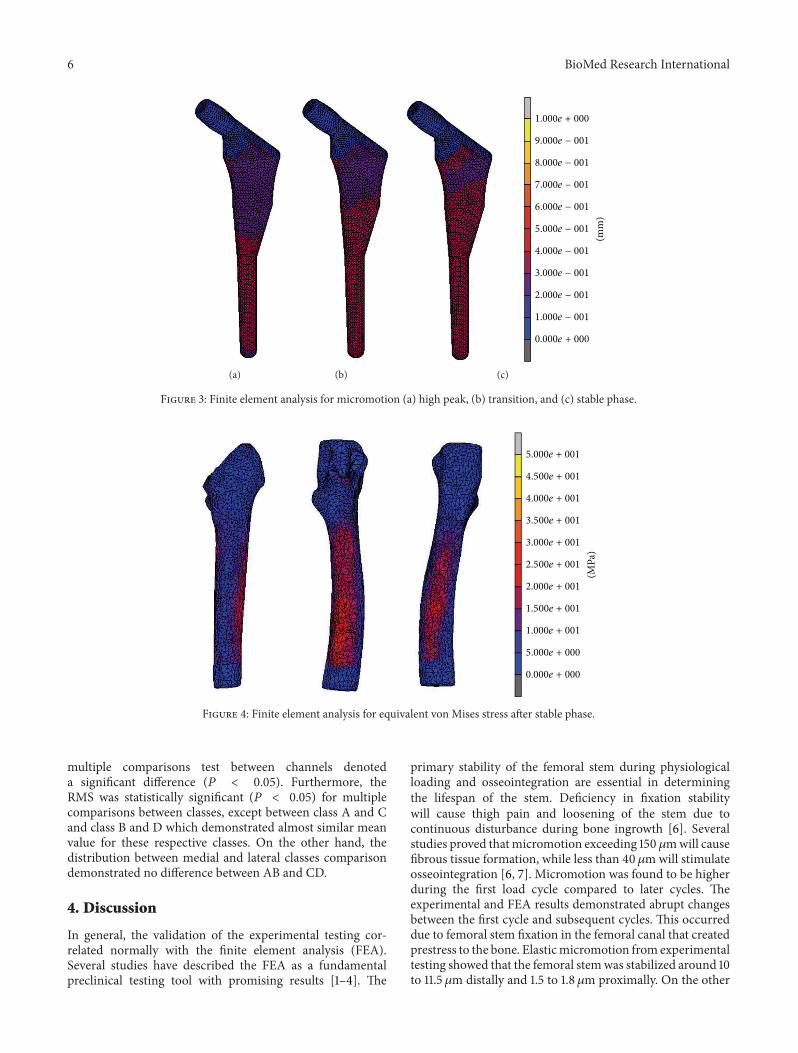
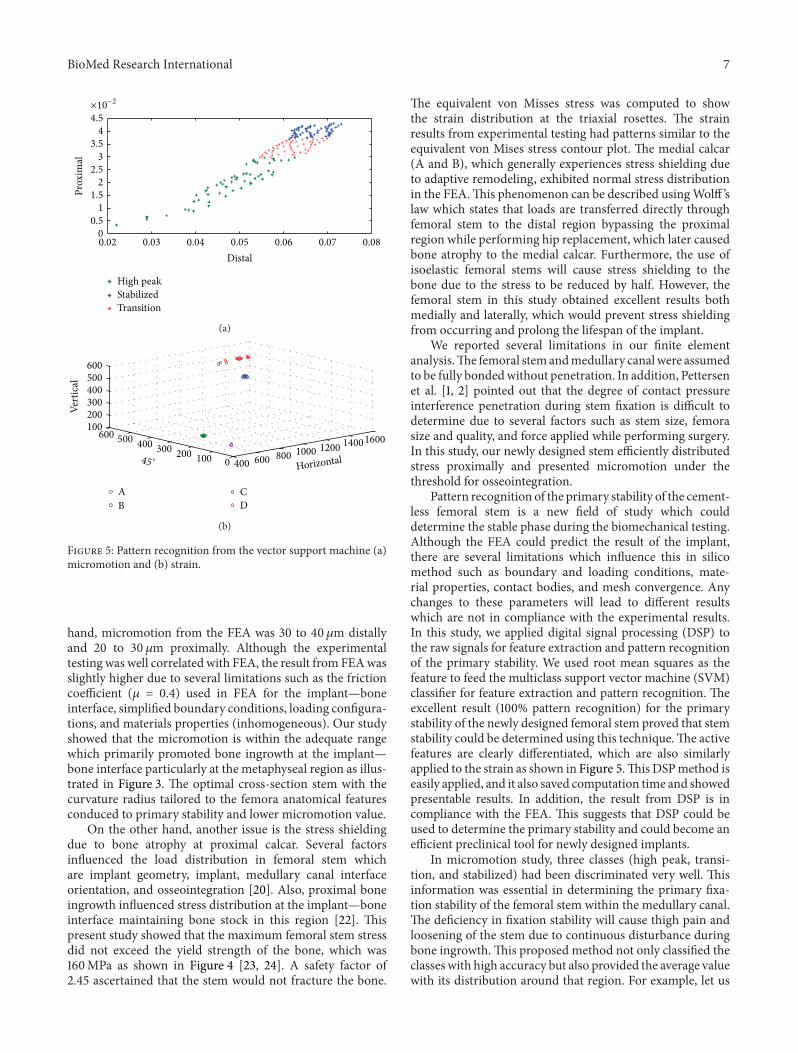
Copyright © 2022 FDOKUMEN