Prima Industrial Holdings - Atmospheric Impact Report - zitholele
105
March 2017 ZITHOLELE CONSULTING (PTY) LTD Prima Industrial Holdings - Atmospheric Impact Report REPORT Report Number: 1665711-313101-1 Distribution: 1 x electronic copy Zitholele Consulting (Pty) Ltd 1 x electronic copy inMagic 1 x electronic copy Golder Project Folder Submitted to: Zitholele Consulting (Pty) Ltd Building 1, Maxwell Office Park Magwa Crescent West c/o Allendale Road and Maxwell Drive Waterfall City, Midrand Attention: Virginia Ramakuwela
-
Upload
khangminh22 -
Category
Documents
-
view
0 -
download
0
Transcript of Prima Industrial Holdings - Atmospheric Impact Report - zitholele
March 2017
ZITHOLELE CONSULTING (PTY) LTD
Prima Industrial Holdings - Atmospheric Impact Report
RE
PO
RT
Report Number: 1665711-313101-1
Distribution:
1 x electronic copy Zitholele Consulting (Pty) Ltd
1 x electronic copy inMagic
1 x electronic copy Golder Project Folder
Submitted to:
Zitholele Consulting (Pty) Ltd Building 1, Maxwell Office Park Magwa Crescent West c/o Allendale Road and Maxwell Drive Waterfall City, Midrand Attention: Virginia Ramakuwela

PRIMA AIR
March 2017 Report No. 1665711-313101-1
Executive Summary
Prima Industrial holdings (Pty) Ltd (Prima) requested Golder Associates Africa (Pty) Ltd. (Golder) and
Zitholele Consulting (Pty) Ltd (Zitholele) to assist with the Environmental Authorisation process required in
order to obtain an Atmospheric Emissions Licence (AEL). This Air Quality Impact Report presents the
findings of the Air Quality Impact Assessment (AQIA) undertaken in support of the AEL application.
Contributors to this report include:
Virginia Ramakuwela (BSc. Hons. Cand.Sci.Nat.): Baseline assessment;
Candice Allan (MSc. Pr.Sci.Nat): Inventory, impact assessment and dispersion modelling; and
Lance Coetzee (NHD. Eng. Chem): Senior Review.
The activities undertaken at Prima are listed in terms of National Environmental Management: Air Quality
Act, 2004 (Act No. 39 of 2004) (NEM: AQA) Category 4, Sub-category 4.10: Foundries. Prima is therefore
undertaking AEL and Environmental Authorisation (Basic Assessment) application processes to comply with
the NEM: AQA and National Environmental Management Act, 1998 (Act No. 107 of 1998) as amended
(NEMA) respectively. The Basic Assessment process is undertaken for the proposed upgrade at Prima and
the AEL application process for both existing and new (upgrade/replacement) operations.
Land uses within 10 km of Prima include the following (Figure 3):
Light industry and manufacturing;
Heavy industry;
Commercial and retail;
Airfield;
Formal and informal residential areas;
Agricultural;
Sports and Recreational Areas;
Open undeveloped land;
Old Mine Areas;
Arterial roads infrastructure; (N12, R21, R29, etc.); and
Rail infrastructure.
According to the 2016 emissions survey, Prima are currently compliant in terms of the PM, SO2 and NOx
maximum emissions standards listed in NEM: AQA Subcategory 4.10.
SO2 and NOx emissions concentrations measured at the furnace stacks (Prima Silica, F-A1, F-A2 and F-10)
were negligible, suggesting that the impact of the Prima emissions on ambient SO2 and NO2 concentrations
is also negligible at present.
PM concentrations at the F-A1 and F-A2 stacks were low at 8% and 16% of the maximum emissions
standard (30 mg/Nm3) respectively. PM concentrations at the Prima Silica and Short Extraction (F-10) stacks
were comparatively higher although remained compliant at 56% and 95% of the maximum emissions
standard respectively. Simulations run based on these results showed maximum daily average

PRIMA AIR
March 2017 Report No. 1665711-313101-1
concentrations are compliant and reach a maximum of 41 µg/m3 (55% of the NAAQS) within 50 m of the
Prima boundary.
Similarly maximum annual average concentrations are compliant and reach a maximum of 23 µg/m3 (58% of
the NAAQS) within 50 m of the Prima boundary. The current impact of the facility on the receiving
environment is therefore predicted to be moderate.
Worst case scenario dispersion simulations were run for the Prima facility including the proposed additions to
the Silica Plant and assuming all PM, SO2 and NO2 emissions from each stack meet the maximum emissions
standards, i.e.:
PM (modelled and benchmarked here as PM10) at 30 mg/Nm3;
SO2 at 400 mg/Nm3; and
NOx (modelled and benchmarked as NO2).
This is a highly conservative approach considering the SO2 and NOx 2016 emissions survey, however it does
present the ‘worst case scenario’ i.e. if Prima’s emissions were to increase significantly due to process
changes, yet remain compliant in terms of NEM: AQA Subcategory 4.10 emissions standards.
The results of the dispersion simulations show that while Prima may remain compliant in terms of the
legislated emissions standards, the impact of the emissions on ambient air quality may be significant
although localised. The simulation results can be summarised as:
Particulate matter: Maximum daily and annual average ambient PM10 concentrations exceed the
NAAQS by up to two and a half within 50 m of the Prima boundary. Compliance is reached at 500 m
from the Prima boundary. The intensity of the impact is therefore considered to be very high.
Impacts are localised with concentrations decreasing with distance from the site. Both the daily and
annual average PM10 concentrations remain well below the NAAQS1 at the closest sensitive receptor
(Ephes Mamkeli Secondary). The intensity of the impact on this receptor is therefore considered to be
low;
Sulphur dioxide: Maximum hourly average ambient SO2 concentrations exceed the NAAQS by up to 4
times within 50 m of the Prima boundary although compliance is reached at 500 m from the boundary.
Similarly, maximum daily average and annual average SO2 concentrations exceed the NAAQS by up to
7 times within 50 m of the Prima boundary with compliance reached at 400 m from the boundary.
Impacts are localised with concentrations decreasing with distance from the site. The maximum hourly,
daily and annual average ambient SO2 concentrations remain below the NAAQS2 at the closest
sensitive receptor (Ephes Mamkeli Secondary). The intensity of the impact on this receptor is therefore
considered to be low – moderate; and
Nitrogen dioxide: Maximum hourly average ambient NO2 concentrations exceed the NAAQS by up to
7 times within 50 m of the Prima boundary although compliance is reached at 500 m from the Prima
boundary. Maximum annual average ambient NO2 concentrations exceed the NAAQS by up to 9 times
within 50 m of Prima. Compliance is reached at 300 m from the Prima boundary.
Impacts are localised with concentrations decreasing with distance from the site. Hourly and annual average
ambient NO2 concentrations at the closest identified receptor (Ephes Mamkeli Secondary) remain below the
NAAQS at 68%, 38% of the NAAQS respectively. The intensity of the impact on this receptor is therefore
considered to be moderate to high.
The following recommendations for monitoring are made:
1 23% and 15% of the NAAQS respectively
2 39%, 36% and 30% of the NAAQS respectively

PRIMA AIR
March 2017 Report No. 1665711-313101-1
Stack emissions sampling should be undertaken annually to monitor compliance in terms of the
NEM: AQA Subcategory 4.10;
A once-off particulate matter monitoring campaign should be undertaken at a nearby sensitive receptor
such as Ephes Mamkeli Secondary to validate the predicted plumes; and
Should stack emissions sampling reveal increases in SO2 and NO2 emissions at the facility, a once-off
SO2 and NO2 monitoring campaign should be undertaken at a nearby sensitive receptor such as Ephes
Mamkeli Secondary to validate the predicted plumes.
PRIMA AIR
March 2017 Report No. 1665711-313101-1
Acronyms list
AEL Atmospheric Emissions License
AIR Air Quality Impact Report
AQIA Air Quality Impact Assessment
AQMP Air Quality Management Plan
CH4 Methane
CO Carbon monoxide
DEAT Department of Environment, Agriculture and Tourism
EMM Ekurhuleni Metro Municipality
HAPs Hazardous air pollutants
HPA Highveld Priority Area
mamsl metres above mean sea level
MM5 Mesoscale modelled meteorological data
NAAQS National Ambient Air Quality Standards
NEM: AQA National Environmental Management: Air Quality Act, 2004 (Act No. 39 of 2004)
NEMA National Environmental Management Act, 1998 (Act No. 107 of 1998) as amended
NO2 Nitrogen dioxide
NOx Oxides of nitrogen
Npi National Pollutant Inventory
O3 Ozone
OLM Ozone Limiting Method
PM Particulate matter
PVMRM Plume Volume Molar Ratio Method
SAAQIS South African Air Quality Information System
SAWS South African Weather Service
SO2 Sulphur dioxide
SR Sensitive receptors
TSP Total suspended particulates
USEPA United States Environmental Protection Agency
VOC Volatile organic compounds

PRIMA AIR
March 2017 Report No. 1665711-313101-1 i
Table of Contents
1.0 INTRODUCTION ........................................................................................................................................................ 1
1.1 Enterprise details .......................................................................................................................................... 1
1.2 Location and extent of plant .......................................................................................................................... 2
1.3 Description of surrounding land use and pollution sources ........................................................................... 5
1.4 Sensitive receptors ....................................................................................................................................... 8
1.5 Local topography ........................................................................................................................................ 11
1.6 Atmospheric emission licence and other authorisations ............................................................................. 13
2.0 NATURE OF PROCESS .......................................................................................................................................... 13
2.1 Listed activity or activities ........................................................................................................................... 13
2.2 Process description .................................................................................................................................... 13
2.3 Unit processes ............................................................................................................................................ 17
2.4 Raw materials used .................................................................................................................................... 18
2.5 Appliances and abatement equipment control technologies ....................................................................... 18
3.0 ATMOSPHERIC EMISSIONS .................................................................................................................................. 21
3.1 Point source parameters ............................................................................................................................. 21
3.2 Point source maximum emission rates (normal working conditions) ........................................................... 22
3.3 Point source maximum emission rates (start-up, maintenance and shut-down conditions) ........................ 24
3.4 Fugitive emissions (area and line sources) ................................................................................................. 28
3.5 Emergency incidents .................................................................................................................................. 29
4.0 IMPACT OF THE ENTERPRISE ON THE RECEIVING ENVIRONMENT ............................................................... 30
4.1 Study approach and methodology .............................................................................................................. 30
4.1.1 Baseline assessment ............................................................................................................................ 30
4.1.2 Emissions inventory and air dispersion modelling ................................................................................. 30
4.1.3 Impact Assessment ............................................................................................................................... 32
4.1.4 Mitigation and Monitoring ...................................................................................................................... 34
4.2 Applicable Legislation, Guidelines and Standards ...................................................................................... 34
4.2.1 National Environmental Management: Air Quality Act (Act No. 39 of 2004) .......................................... 34
4.2.2 Emission Limits for Listed Activities and Controlled Emitters ................................................................ 35
4.2.3 National Ambient Air Quality Standards (NAAQS) ................................................................................ 35
4.2.4 National Dust Control Regulations ........................................................................................................ 36
4.2.5 Highveld Priority Area and Air Quality Management Plan ..................................................................... 36

PRIMA AIR
March 2017 Report No. 1665711-313101-1 ii
4.3 General Overview of Key Pollutants and Associated Health Effects ........................................................... 37
4.3.1 Particulates ........................................................................................................................................... 37
4.3.2 Sulphur Dioxide ..................................................................................................................................... 38
4.3.3 Volatile Organic Compounds ................................................................................................................ 39
4.3.4 Nitrogen Oxides .................................................................................................................................... 39
4.3.5 Carbon Monoxide .................................................................................................................................. 40
4.4 Climate and meteorology ............................................................................................................................ 40
4.4.1 Regional climate.................................................................................................................................... 40
4.4.2 Precipitation .......................................................................................................................................... 41
4.4.3 Temperature ......................................................................................................................................... 42
4.4.4 Boundary layer properties and atmospheric stability ............................................................................. 43
4.4.5 Meteorology .......................................................................................................................................... 43
4.4.6 Regional ambient air quality overview ................................................................................................... 48
4.4.7 Ambient Air Quality Monitoring in Ekurhuleni ........................................................................................ 49
4.4.8 Emissions monitoring ............................................................................................................................ 51
4.4.9 Local sources of emissions ................................................................................................................... 52
4.5 Emissions inventory .................................................................................................................................... 55
4.6 Dispersion simulations ................................................................................................................................ 57
4.6.1 Model settings ....................................................................................................................................... 57
4.6.2 Receptors .............................................................................................................................................. 57
4.6.3 Dispersion plots .................................................................................................................................... 57
4.6.4 Supporting documentation .................................................................................................................... 74
4.7 Air quality impact assessment .................................................................................................................... 74
4.7.1 Construction phase ............................................................................................................................... 74
4.7.2 Operational phase ................................................................................................................................. 74
4.7.3 Decommissioning phase ....................................................................................................................... 77
4.7.4 Environmental impact rating .................................................................................................................. 78
5.0 RECOMMENDATIONS FOR MONITORING ........................................................................................................... 86
6.0 REFERENCES ......................................................................................................................................................... 86
TABLES
Table 1: Enterprise details .......................................................................................................................................................... 1
Table 2: Location and extent of plant ......................................................................................................................................... 2

PRIMA AIR
March 2017 Report No. 1665711-313101-1 iii
Table 3: Summary of pollutants, contributing sources and key impacts surrounding Prima (EMM AQMP, 2005) ...................... 6
Table 4: Listed activities underway at Prima (DEA, 2013)........................................................................................................ 13
Table 5: Unit processes............................................................................................................................................................ 17
Table 6: Raw materials used .................................................................................................................................................... 18
Table 7: Appliances and abatement equipment control technologies ...................................................................................... 18
Table 8: Abatement equipment control technology .................................................................................................................. 20
Table 9: Point source parameters ............................................................................................................................................ 21
Table 10: Point source maximum emission rates (normal working conditions) ........................................................................ 22
Table 11: Point source emission rates – start-up, maintenance and shut-down conditions ..................................................... 24
Table 12: Fugitive emission sources (area and line) location ................................................................................................... 28
Table 13: Fugitive emission sources (area and line) mitigation measures ............................................................................... 29
Table 14: Criteria for the assessment of the extent of the impact (Zitholele, 2015) .................................................................. 32
Table 15: Criteria for the rating of the duration of an impact (Zitholele, 2015) .......................................................................... 32
Table 16: Criteria for impact rating of potential intensity of a negative impact (Golder, 2016).................................................. 33
Table 17: Criteria for the impact rating of potential intensity of a positive impact (Zitholele, 2015) .......................................... 33
Table 18: Criteria for the rating of the likelihood of the impact occurring (Zitholele, 2015) ....................................................... 33
Table 19: Significance rating formulas (Zitholele, 2015) .......................................................................................................... 34
Table 20: NEM: AQA, Category 4 - Metallurgical Industry listed activities ............................................................................... 35
Table 21: South African Ambient Air Quality Standards for Criteria Pollutants ......................................................................... 35
Table 22: Acceptable dust fall rates ......................................................................................................................................... 36
Table 23: Atmospheric stability classes.................................................................................................................................... 43
Table 24: Surface meteorological data details ......................................................................................................................... 44
Table 25: Summary of results for Prima’s Stack Emission Survey (Golder, 2016) ................................................................... 52
Table 26: Sources and priority pollutants within the EMM (EMM AQMP, 2005) ....................................................................... 52
Table 27: Comparison between the legislated maximum emissions rate and the actual rates measured during Prima’s Stack Emission Survey (Golder, 2016) ....................................................................................................... 55
Table 28: Emissions inventory for the Prima facility ................................................................................................................. 56
Table 29: Summary of model settings ...................................................................................................................................... 57
Table 30: Grid receptor locations ............................................................................................................................................. 57
Table 31: Simulated PM10 maximums ...................................................................................................................................... 58
Table 32: Simulated PM10 maximums at an identified discrete receptor .................................................................................. 58
Table 33: Simulated SO2 maximums ........................................................................................................................................ 64
Table 34: Simulated SO2 maximums at an identified discrete receptor .................................................................................... 64
Table 35: Simulated NO2 maximums ....................................................................................................................................... 70
Table 36: Simulated NO2 maximums at an identified discrete receptor .................................................................................... 70
Table 37: Environmental Impact Assessment Matrix for the construction phase ..................................................................... 78

PRIMA AIR
March 2017 Report No. 1665711-313101-1 iv
Table 38: Environmental Impact Assessment Matrix for operational phase (based on maximum permissible emissions) ............................................................................................................................................................... 79
Table 39: Environmental Impact Assessment Matrix for the decommissioning phase ............................................................. 85
FIGURES
Figure 1: Location and extent of Prima....................................................................................................................................... 3
Figure 2: Layout of the Prima site .............................................................................................................................................. 4
Figure 3: Land use within 10 km of Prima .................................................................................................................................. 7
Figure 4: Sensitive receptors within 10 km of Prima ................................................................................................................ 10
Figure 5: Topography of the region and approximate Prima location (Zitholele, 2016) ............................................................ 11
Figure 6: Topography of the region within 50 km of Prima location (Zitholele, 2017) ............................................................... 12
Figure 7: Process flow for the Prima’s AD foundry process (Prima, 2017) ............................................................................... 15
Figure 8: Process flow for the Prima’s Silica sand foundry process (Prima, 2017) .................................................................. 16
Figure 9: Process flow for the Prima’s resin sand foundry process (Prima, 2017) ................................................................... 16
Figure 10: Process flow for the Prima’s fettling process (Prima, 2017) .................................................................................... 17
Figure 11: Process followed in the determination of the air quality impacts associated with the proposed activities ............... 30
Figure 12: Location of Prima within the Highveld Priority Area part of Gauteng ....................................................................... 37
Figure 13: Precipitation graph for Benoni for the period 2000 to 2012. (World Weather Online, 2016) .................................... 42
Figure 14: Average Monthly Temperature and Humidity for OR Tambo International Airport for period Jan 2005- Dec 2010 (SAWS) ................................................................................................................................................... 42
Figure 15: Modelled Prima wind rose for 2013-2015. ............................................................................................................... 45
Figure 16: Modelled diurnal wind roses for the Prima with predominant wind directions for 2013-2015 .................................. 46
Figure 17: Modelled seasonal wind roses for the Prima with predominant wind directions for 2013 - 2015 ............................. 47
Figure 18: Period Wind rose for the OR Tambo International Airport meteorological monitoring station (GDACE Gauteng Province AQMP, 2009) ............................................................................................................................. 48
Figure 19: MM5 modelled annual Prima wind rose for 2013-2015 ........................................................................................... 48
Figure 20: The main transport pathways out of the Highveld, (Scholes, 2002) ........................................................................ 49
Figure 21: Ambient SO2 daily average concentrations from the Wattville station for 1 January 2014 to 1 January 2016 (SAAQIS, November 2016) ............................................................................................................................ 50
Figure 22: Ambient PM10 daily averages concentrations from the Wattville station for 1 January 2014 to 1 January 2016 (SAAQIS, April 2016) ..................................................................................................................................... 50
Figure 23: Ambient NO2 hourly averages concentrations from the Wattville station for 1 January 2014 to 1 January 2016 (SAAQIS, April 2016) ........................................................................................................................ 51
Figure 24: Simulated daily average ambient PM10 concentrations ........................................................................................... 59
Figure 25: Simulated frequency of PM10 exceedances of the NAAQS per annum ................................................................... 60
Figure 26: Simulated annual average ambient PM10 concentrations........................................................................................ 61
Figure 27: Simulated daily average ambient PM10 concentrations based on 2016 emissions survey results .......................... 62
Figure 28: Simulated annual average ambient PM10 concentrations based on 2016 emissions survey results ....................... 63
Figure 29: Simulated hourly average ambient SO2 concentrations .......................................................................................... 65

PRIMA AIR
March 2017 Report No. 1665711-313101-1 v
Figure 30: Simulated frequency of hourly SO2 exceedances of the NAAQS per annum .......................................................... 66
Figure 31: Simulated daily average ambient SO2 concentrations ............................................................................................ 67
Figure 32: Simulated frequency of daily SO2 exceedances of the NAAQS per annum ............................................................ 68
Figure 33: Simulated annual average ambient SO2 concentrations ......................................................................................... 69
Figure 34: Simulated hourly average ambient NO2 concentrations .......................................................................................... 71
Figure 35: Simulated frequency of hourly NO2 exceedances of the NAAQS per annum ......................................................... 72
Figure 36: Simulated annual average ambient NO2 concentrations ......................................................................................... 73
APPENDICES
APPENDIX A Document Limitations
APPENDIX B Sensitive Receptors
PRIMA AIR
March 2017 Report No. 1665711-313101-1 1
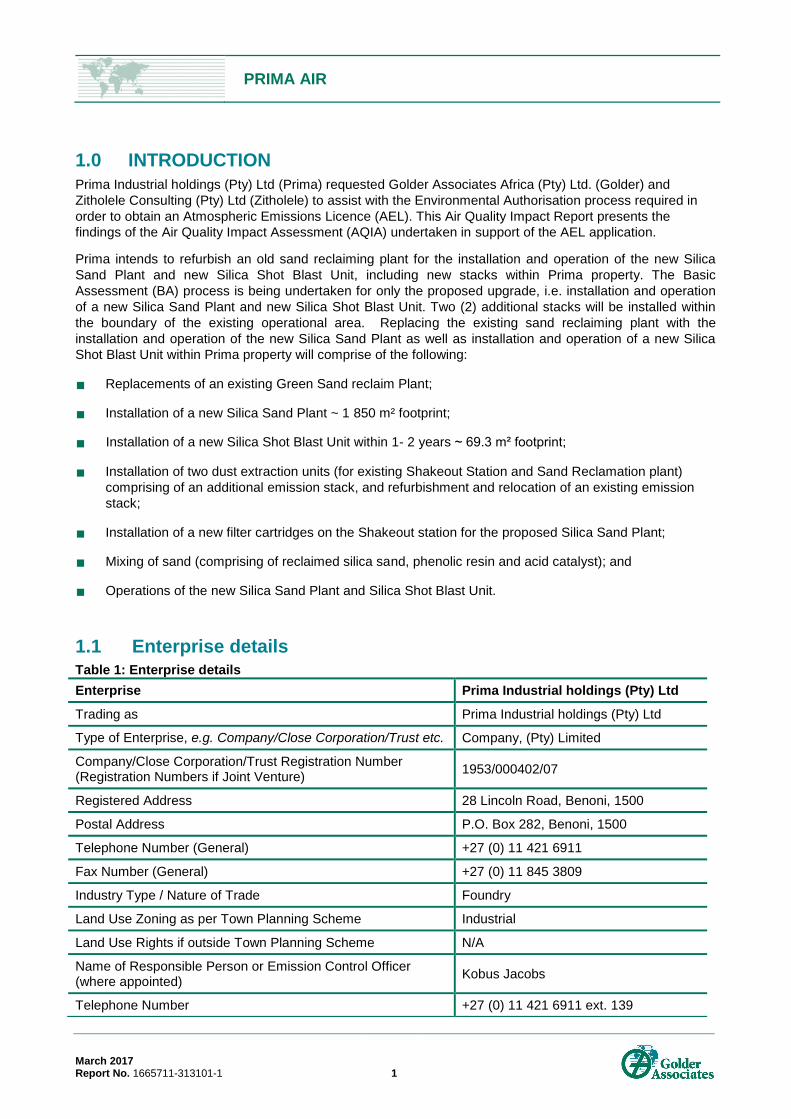
1.0 INTRODUCTION
Prima Industrial holdings (Pty) Ltd (Prima) requested Golder Associates Africa (Pty) Ltd. (Golder) and
Zitholele Consulting (Pty) Ltd (Zitholele) to assist with the Environmental Authorisation process required in
order to obtain an Atmospheric Emissions Licence (AEL). This Air Quality Impact Report presents the
findings of the Air Quality Impact Assessment (AQIA) undertaken in support of the AEL application.
Prima intends to refurbish an old sand reclaiming plant for the installation and operation of the new Silica
Sand Plant and new Silica Shot Blast Unit, including new stacks within Prima property. The Basic
Assessment (BA) process is being undertaken for only the proposed upgrade, i.e. installation and operation
of a new Silica Sand Plant and new Silica Shot Blast Unit. Two (2) additional stacks will be installed within
the boundary of the existing operational area. Replacing the existing sand reclaiming plant with the
installation and operation of the new Silica Sand Plant as well as installation and operation of a new Silica
Shot Blast Unit within Prima property will comprise of the following:
Replacements of an existing Green Sand reclaim Plant;
Installation of a new Silica Sand Plant ~ 1 850 m² footprint;
Installation of two dust extraction units (for existing Shakeout Station and Sand Reclamation plant)
comprising of an additional emission stack, and refurbishment and relocation of an existing emission
stack;
Installation of a new filter cartridges on the Shakeout station for the proposed Silica Sand Plant;
Mixing of sand (comprising of reclaimed silica sand, phenolic resin and acid catalyst); and
Operations of the new Silica Sand Plant and Silica Shot Blast Unit.
1.1 Enterprise details Table 1: Enterprise details
Enterprise Prima Industrial holdings (Pty) Ltd
Trading as Prima Industrial holdings (Pty) Ltd
Type of Enterprise, e.g. Company/Close Corporation/Trust etc. Company, (Pty) Limited
Company/Close Corporation/Trust Registration Number (Registration Numbers if Joint Venture)
1953/000402/07
Registered Address 28 Lincoln Road, Benoni, 1500
Postal Address P.O. Box 282, Benoni, 1500
Telephone Number (General) +27 (0) 11 421 6911
Fax Number (General) +27 (0) 11 845 3809
Industry Type / Nature of Trade Foundry
Land Use Zoning as per Town Planning Scheme Industrial
Land Use Rights if outside Town Planning Scheme N/A
Name of Responsible Person or Emission Control Officer (where appointed)
Kobus Jacobs
Telephone Number +27 (0) 11 421 6911 ext. 139
Installation of a new Silica Shot Blast Unit within 1- 2 years ~ 69.3 m² footprint;

PRIMA AIR
March 2017 Report No. 1665711-313101-1 2
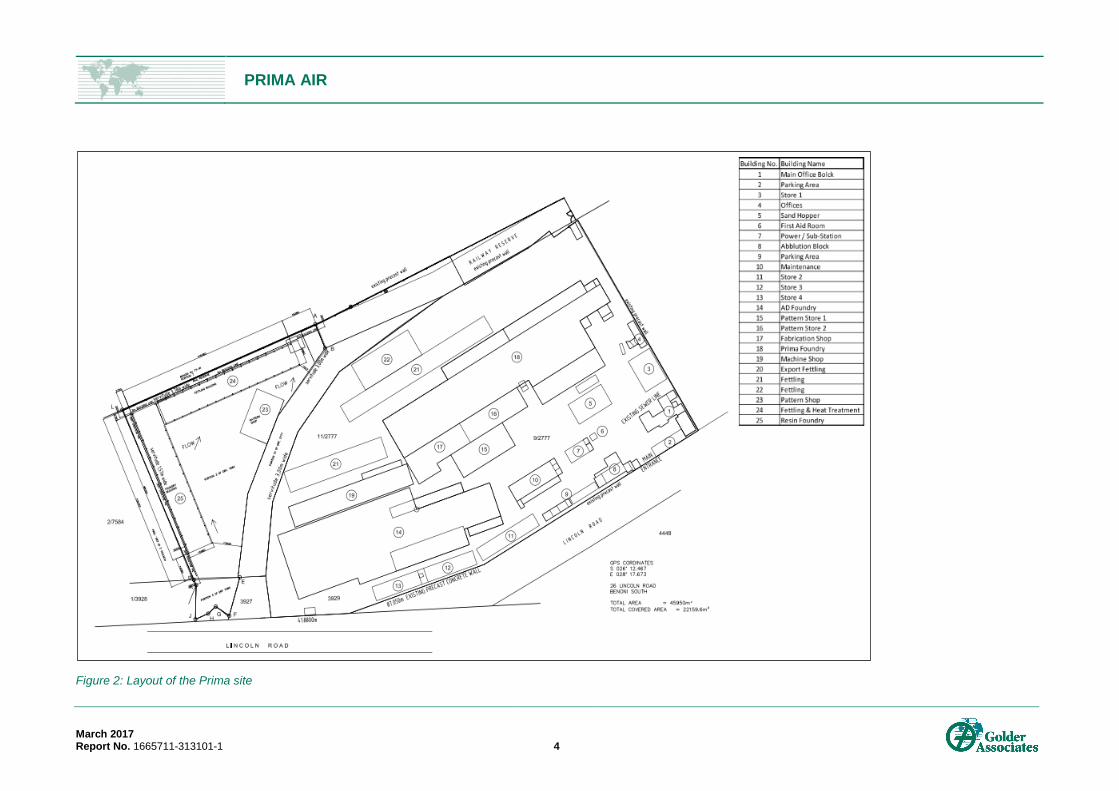
1.2 Location and extent of plant
The location and extent of the facility is described in Table 2 and illustrated in Figure 1 and Figure 2.
Table 2: Location and extent of plant
Cell Phone Number +27 (0) 83 237 7609
Fax Number +27 (0) 11 845 3809
Email Address [email protected]
After Hours Contact Details +27 (0) 83 237 7609
Physical Address of the Premises 28 Lincoln Road, Benoni, 1500
Description of Site (Erf) Stands 9/2777, 11/2777, 3929 and 8403, Nestadt Industrial Sites, Benoni South, Gauteng Province.
Coordinates of Approximate Centre of Operations Latitude: 26°12'28.30"S
Longitude: 28° 17'33.32"E
Extent (km²) 0.04595 km2
Elevation Above Mean Sea Level (m) 1 653 m
Province Gauteng
Metropolitan/District Municipality Ekurhuleni Metropolitan Municipality
Designated Priority Area Highveld Priority Area

PRIMA AIR
March 2017 Report No. 1665711-313101-1 3
Figure 1: Location and extent of Prima
PRIMA AIR
March 2017 Report No. 1665711-313101-1 4
Figure 2: Layout of the Prima site

PRIMA AIR
March 2017 Report No. 1665711-313101-1 5
1.3 Description of surrounding land use and pollution sources
Land uses within 10 km of Prima include the following (Figure 3):
Light and heavy industry and manufacturing;
Commercial and retail;
Airfield;
Formal and informal residential areas;
Agricultural;
Sports and Recreational Areas;
Open undeveloped land;
Old Mine Areas;
Arterial roads infrastructure; (N12, R21, R29, etc.); and
Rail infrastructure.
Table 3 below presents the key pollution sources surrounding Prima, pollutants emitted, and their typical
impacts as reported in the Ekurhuleni Metro Municipality (EMM) Air Quality Management Plan (AQMP)
(2005).
PRIMA AIR
March 2017 Report No. 1665711-313101-1 6
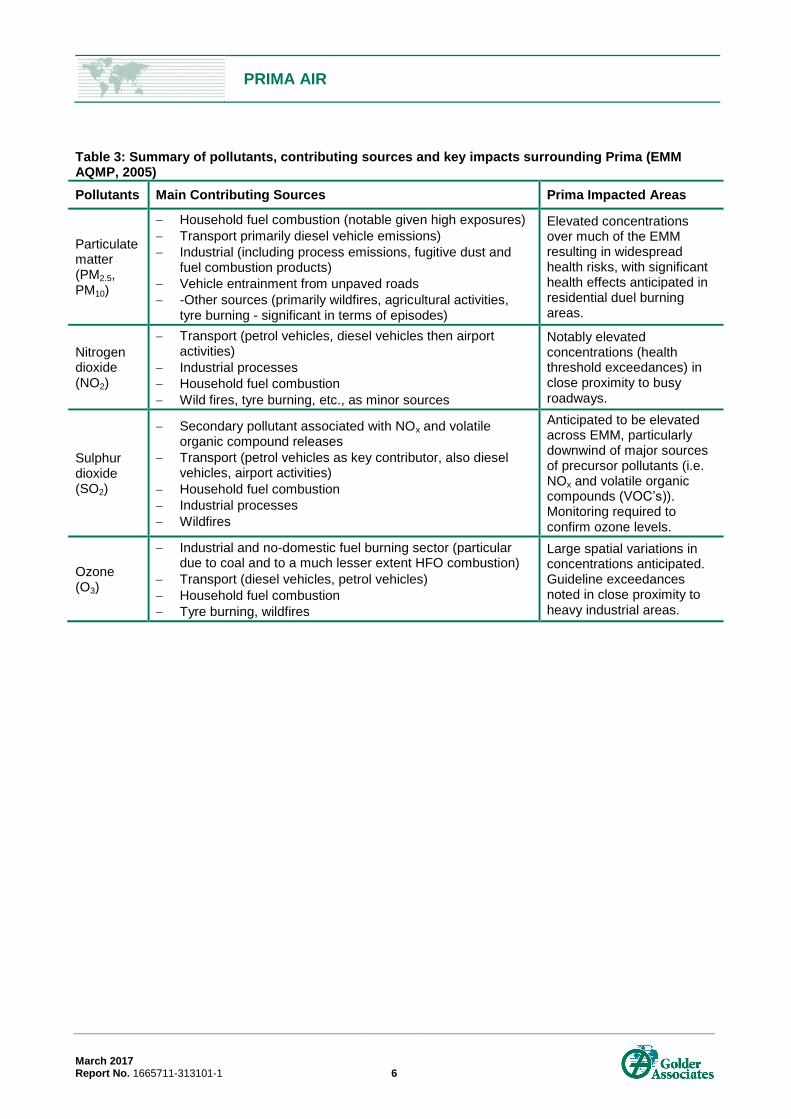
Table 3: Summary of pollutants, contributing sources and key impacts surrounding Prima (EMM AQMP, 2005)
Pollutants Main Contributing Sources Prima Impacted Areas
Particulate matter (PM2.5, PM10)
Household fuel combustion (notable given high exposures)
Transport primarily diesel vehicle emissions)
Industrial (including process emissions, fugitive dust and fuel combustion products)
Vehicle entrainment from unpaved roads
Other sources (primarily wildfires, agricultural activities, tyre burning significant in terms of episodes)
Elevated concentrations over much of the EMM resulting in widespread health risks, with significant health effects anticipated in residential duel burning areas.
Nitrogen dioxide (NO2)
Transport (petrol vehicles, diesel vehicles then airport activities)
Industrial processes
Household fuel combustion
Wild fires, tyre burning, etc., as minor sources
Notably elevated concentrations (health threshold exceedances) in close proximity to busy roadways.
Sulphur dioxide (SO2)
Secondary pollutant associated with NOx and volatile organic compound releases
Transport (petrol vehicles as key contributor, also diesel vehicles, airport activities)
Household fuel combustion
Industrial processes
Wildfires
Anticipated to be elevated across EMM, particularly downwind of major sources of precursor pollutants (i.e. NOx and volatile organic compounds (VOC’s)). Monitoring required to confirm ozone levels.
Ozone (O3)
Industrial and no-domestic fuel burning sector (particular due to coal and to a much lesser extent HFO combustion)
Transport (diesel vehicles, petrol vehicles)
Household fuel combustion
Tyre burning, wildfires
Large spatial variations in concentrations anticipated. Guideline exceedances noted in close proximity to heavy industrial areas.

PRIMA AIR
March 2017 Report No. 1665711-313101-1 7
Figure 3: Land use within 10 km of Prima

PRIMA AIR
March 2017 Report No. 1665711-313101-1 8
1.4 Sensitive receptors
Sensitive receptors (SR) were identified within 10 km of Prima (Figure 4). These sensitive receptors and their
respective coordinates are provided in Appendix B. The following are identified as SR within 5 km of the site
(Figure 4):
The Stewards Residential area located approximately 770 m north of the Prima –SR1;
Ephes Mamkeli Secondary School located approximately 480 m south of the Prima – SR2;
Sunshine and Actonville Hospitalitals located approximately 865 m and 820 m south-east of the Prima
respectively – SR3 and SR4;
Solomon Motlana Primary School located approximately 830 m south of the Prima – SR5;
Magalelagase Primary School located approximately 1 710 m south of the Prima – SR6;
Benoni Primary and Liverpool Secondary Schools located approximately 1 400 m and 1 100 m
respectively south-east of the Prima respectively– SR7 and SR8;
Letmabang Clinic ( Wattville) and William Hills Secondary School located approximately 1 450 m and
1 660 m east of the Prima respectively – SR9 and SR10;
Glynwood Hospitalital located approximately 1 900 m north-east of the Prima –SR11;
Actonville and Pioneer Primary Schools located approximately 1 150 m and 1 250 m south-east of the
Prima respectively–SR12 and SR13;
New Kleinfontein Residential area and Isaac Makau Primary School located approximately 760 m and
1 240 m south of the Prima respectively –SR14 and SR15;
Etwatwa Secondary School, Kgothalong Primary School and Wattville Residential area located
approximately 1 680 m, 1 625 m and 1 685 m south of the Prima respecpectivey –SR16, SR17 and
SR18;
Actonville Residential area located approximately 1 440 m south-east of the Prima –SR19;
Lakesfield residential area located approximately 2 550 m north of the Prima –SR20;
Benoni West Primary and Benoni Junior Schools located approximately 2 120 m and 2 315 m north-
east of the Prima respectively –SR21 and SR22;
Optiklin Eye Hospitalital located approximately 3 200 m north of the Prima –SR23;
Laerskool Westwood located approximately 2 950 m north-west of the Prima –SR24;
Kempston Clinic, Willowmoore High School and Laerskool Verkenner located approximately 2850 m,
2 450 m and 3 400 m north-east of the Prima respectively –SR25, SR26 and SR27;
Mackenzie Park/Dewald Hattingh Park residential areas located approximately 3 730 m east of the
Prima –SR28;
Wordsworth High School, Laerskool Northmead, Hoërskool Brandwag, Tom Newby School, Benoni
residential area, Khangezile Primary School and Farrarmere/Airfield/Northmead residential areas
located approximately 3 700 m, 4 215 m, 4 190 m, 4 540 m, 2 640 m, 4 910 m and 4 110 m north-east
of the Prima respectively – SR29, SR30, SR30, SR31, SR32, SR33, SR34 and SR35;
Beyers Park residential area located approximately 4 230 m north-west of the Prima –SR36;

PRIMA AIR
March 2017 Report No. 1665711-313101-1 9
Boksburg residential area, Martin Primary School, Laerskool J M Louw and Laerskool Hennie Basson
located approximately 3 510 m, 4 440 m, 3 550 m and 4 230 m west of the Prima respectively – SR37,
SR38, SR39 and SR40;
Harry Gwala Informal residential area and Actonville Clinic located approximately 2 120 m and 2 430 m
south-east of the Prima respectively –SR41 and SR42;
Lesabe Primary School located approximately 2 280 m south of the Prima –SR43;
Ekukhanyeni Primary School, Tamboville / Wattville residential areas, Wattville Clinic - old, Leachville
and Brakpan residential areas located approximately 2 500 m, 2 850 m, 2 970 m, 3 620 m and 3 970 m
south-east of the Prima respectively – SR44, SR45, SR46, SR47 and SR48;
Parkrand, Van Dyk Park residential areas and Parkrand Primary School located approximately 3 710 m,
4 650 m and 4 650 m south of the Prima respectively – SR49, SR50 and SR51;
Summerfields Primary School located approximately 4 970 m north-west of the Prima respectively –
SR52;
Boksburg High School, Parkdene Primary School, Boksburg and Cinderella/Libradene residential areas
located approximately 4 100 m, 4 500 m, 3 700 m and 4 750 m south-west of the Prima respectively –
SR53, SR54, SR55 and SR56; and
Tambo Memorial Hospital located approximately 4 900 m west of the Prima –SR57.
Note: A sensitive receptor is defined as a location/s of human receptors or environment which is sensitive to,
and may be negatively affected by, then negative effects brought about by the degeneration of the ambient
air quality created by the process contribution of the proposed activity.

PRIMA AIR
March 2017 Report No. 1665711-313101-1 10
Figure 4: Sensitive receptors within 10 km of Prima
PRIMA AIR
March 2017 Report No. 1665711-313101-1 11
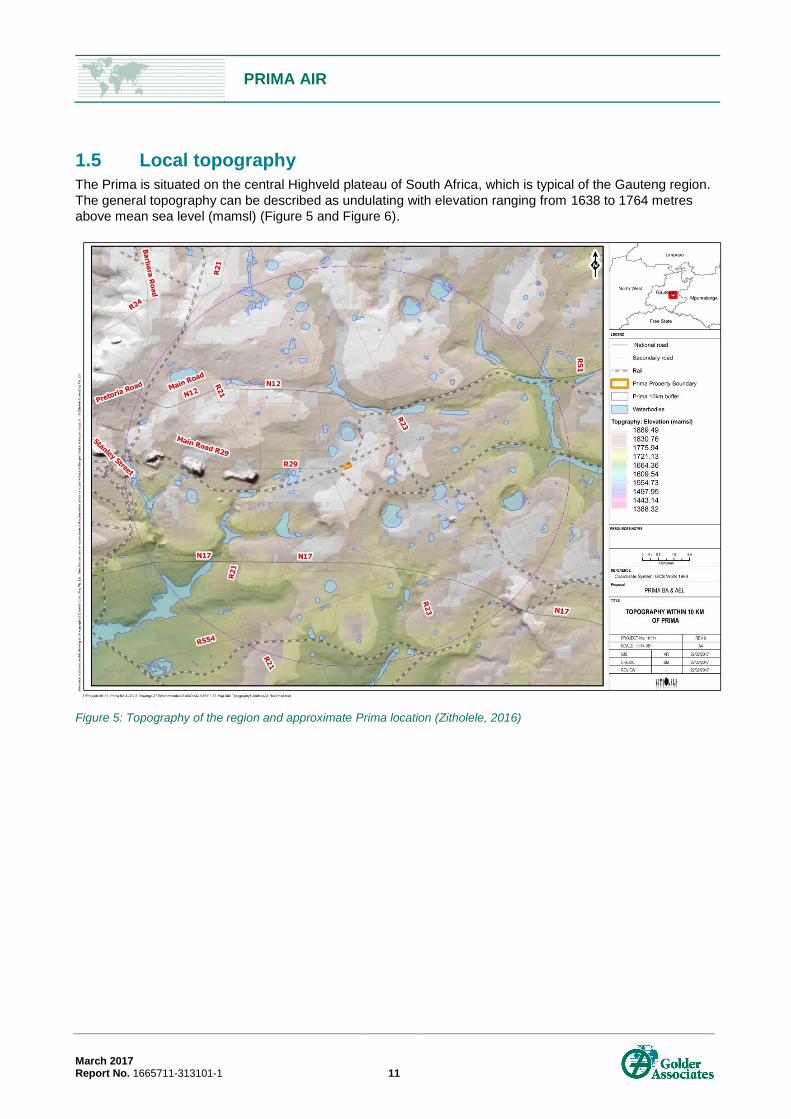
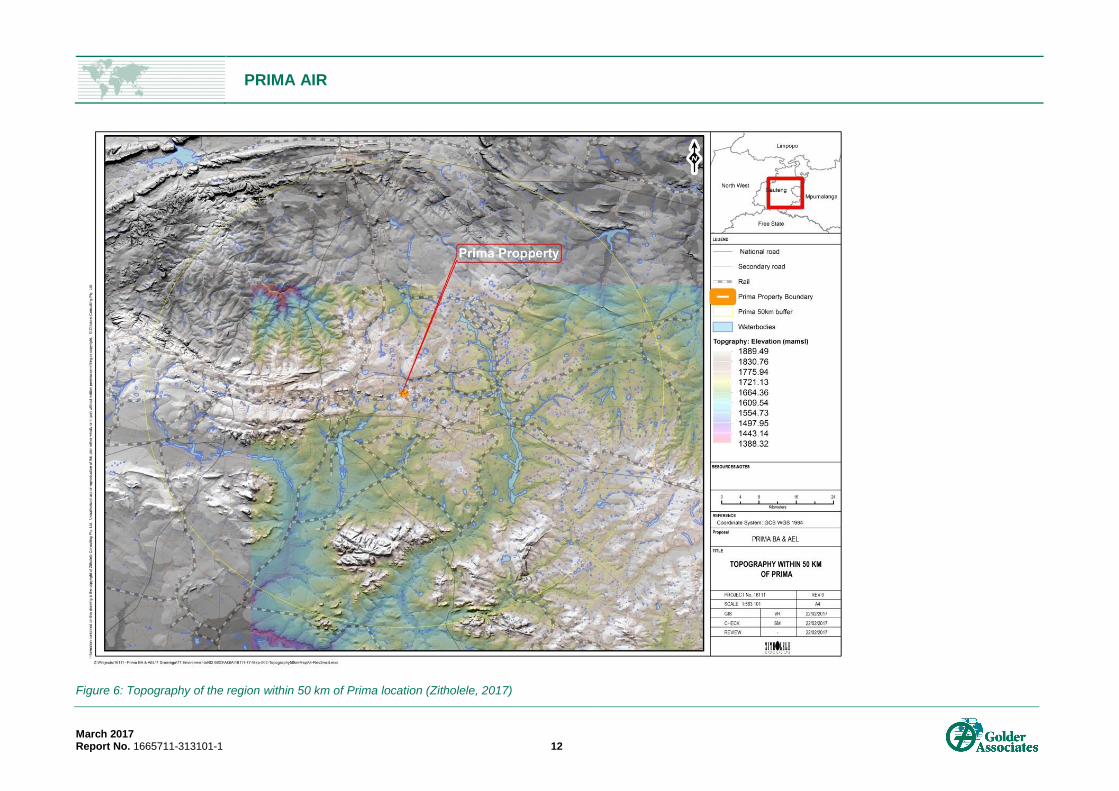
1.5 Local topography
The Prima is situated on the central Highveld plateau of South Africa, which is typical of the Gauteng region.
The general topography can be described as undulating with elevation ranging from 1638 to 1764 metres
above mean sea level (mamsl) (Figure 5 and Figure 6).
Figure 5: Topography of the region and approximate Prima location (Zitholele, 2016)
PRIMA AIR
March 2017 Report No. 1665711-313101-1 12
Figure 6: Topography of the region within 50 km of Prima location (Zitholele, 2017)
PRIMA AIR
March 2017 Report No. 1665711-313101-1 13
1.6 Atmospheric emission licence and other authorisations
Prima is currently undertaking AEL and Environmental Authorisation (Basic Assessment) application
processes to comply with the National Environmental Management: Air Quality Act, 2004 (Act No. 39 of
2004) (NEM: AQA) and National Environmental Management Act, 1998 (Act No. 107 of 1998) as amended
(NEMA) respectively. The Basic Assessment process is undertaken for the proposed upgrade at Prima and
the AEL application process for both existing and new (upgrade/replacement) operations.
2.0 NATURE OF PROCESS
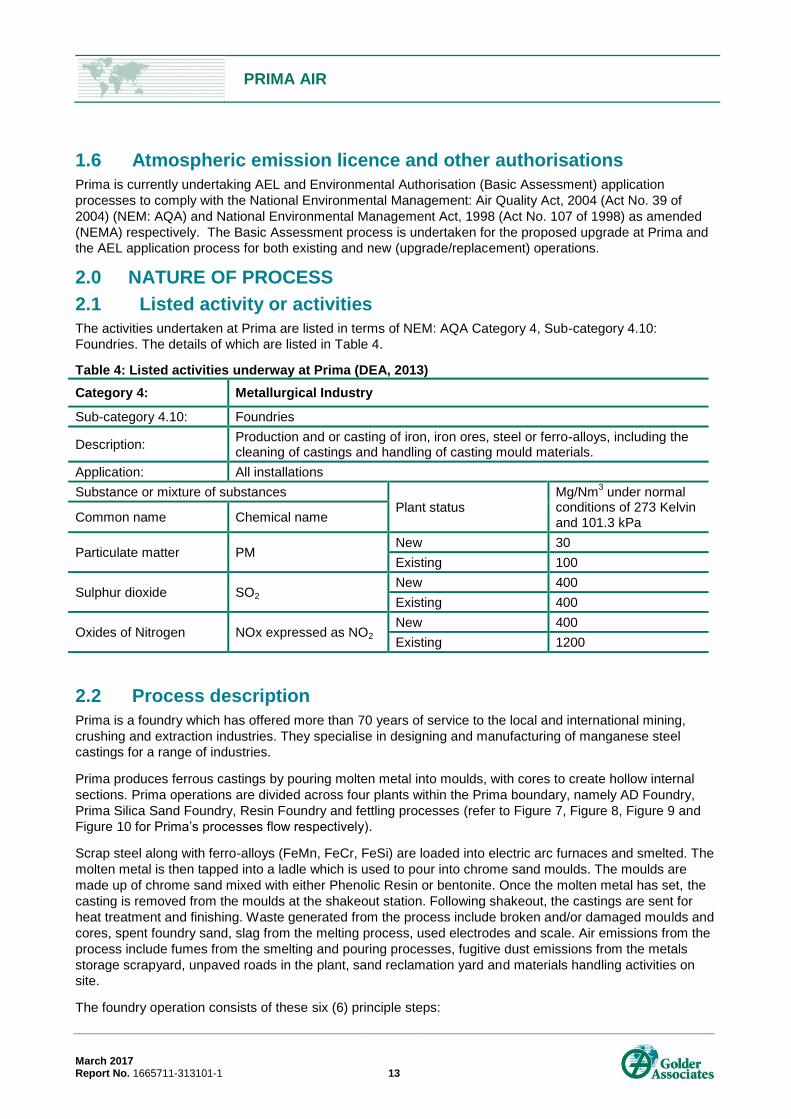
2.1 Listed activity or activities
The activities undertaken at Prima are listed in terms of NEM: AQA Category 4, Sub-category 4.10:
Foundries. The details of which are listed in Table 4.
Table 4: Listed activities underway at Prima (DEA, 2013)
Category 4: Metallurgical Industry
Sub-category 4.10: Foundries
Description: Production and or casting of iron, iron ores, steel or ferro-alloys, including the cleaning of castings and handling of casting mould materials.
Application: All installations
Substance or mixture of substances Plant status
Mg/Nm3 under normal
conditions of 273 Kelvin and 101.3 kPa Common name Chemical name
Particulate matter PM New 30
Existing 100
Sulphur dioxide SO2 New 400
Existing 400
Oxides of Nitrogen NOx expressed as NO2 New 400
Existing 1200
2.2 Process description
Prima is a foundry which has offered more than 70 years of service to the local and international mining,
crushing and extraction industries. They specialise in designing and manufacturing of manganese steel
castings for a range of industries.
Prima produces ferrous castings by pouring molten metal into moulds, with cores to create hollow internal
sections. Prima operations are divided across four plants within the Prima boundary, namely AD Foundry,
Prima Silica Sand Foundry, Resin Foundry and fettling processes (refer to Figure 7, Figure 8, Figure 9 and
Figure 10 for Prima’s processes flow respectively).
Scrap steel along with ferro-alloys (FeMn, FeCr, FeSi) are loaded into electric arc furnaces and smelted. The
molten metal is then tapped into a ladle which is used to pour into chrome sand moulds. The moulds are
made up of chrome sand mixed with either Phenolic Resin or bentonite. Once the molten metal has set, the
casting is removed from the moulds at the shakeout station. Following shakeout, the castings are sent for
heat treatment and finishing. Waste generated from the process include broken and/or damaged moulds and
cores, spent foundry sand, slag from the melting process, used electrodes and scale. Air emissions from the
process include fumes from the smelting and pouring processes, fugitive dust emissions from the metals
storage scrapyard, unpaved roads in the plant, sand reclamation yard and materials handling activities on
site.
The foundry operation consists of these six (6) principle steps:

PRIMA AIR
March 2017 Report No. 1665711-313101-1 14
Obtaining the casting geometry - The casting geometry is obtained by sending blueprint drawings to
the foundry, or computer aided designs are utilized;
Pattern making - The pattern is a physical model of the casting that will be used to make the mold. The
mold is made by packing sand material around the pattern. When the pattern is withdrawn, the imprint
provides the mold cavity, which is filled with metal to become the casting. If the casting needs to be
hollow, then cores are patterned and used to form these hollow cavities;
Core-making - Cores are forms, usually made of sand, which are placed into a mold cavity to form the
interior surfaces of castings. The void space between the core and mold-cavity surface is what
eventually becomes the casting;
Molding - The molding consists of all the operations necessary to prepare a mold for receiving the
molten metal. Molding involved placing a molding aggregate (compacted sand) around a pattern held
with a support frame. The pattern is then removed to leave the mold cavity, setting the cores in the mold
cavity and finishing and closing the mold;
Melting and Pouring - The preparation of molten metal for casting is referred to as melting. Melting is
done in several specifically designated areas of the foundry, where the furnaces are located. Prima
foundry melts scrap metal and ferrous alloys. The molten metal is transferred to the pouring area where
the molds are filled; and
Shake-out/Cleaning - Cleaning refer to all activities that remove the sand, scale and excess metal from
a casting. The casting is separated from the mold and transported to the cleaning department. Burned-
on sand and scale are removed to improve the surface appearance of the casting. Excess metal is also
removed by blasting or grinding.

PRIMA AIR
March 2017 Report No. 1665711-313101-1 15
Figure 7: Process flow for the Prima’s AD foundry process (Prima, 2017)

PRIMA AIR
March 2017 Report No. 1665711-313101-1 16
Figure 8: Process flow for the Prima’s Silica sand foundry process (Prima, 2017)
Figure 9: Process flow for the Prima’s resin sand foundry process (Prima, 2017)

PRIMA AIR
March 2017 Report No. 1665711-313101-1 17
Figure 10: Process flow for the Prima’s fettling process (Prima, 2017)
2.3 Unit processes
Table 5 lists the unit processes operating at the Prima facility. All unit processes above are undertaken
24 hours per day, 365 days per year.
Table 5: Unit processes
Unit Process Unit Process Function Batch or Continuous Process
Sand Conditioning Reclamation and preparation Batch
Core Making Formation of sand forms which are placed into mould cavity Batch
Moulding Preparation of sand to receive molten metal Batch
Melting and Pouring from Furnaces
Preparation of metal for casting Batch
Shake-out & Cleaning Removal of sand from casting Batch
Heat Treatment Castings are heated to 1000oC and subsequently cooled Batch
Fettling Welding and gouging of castings. And Grinding of castings to achieve specification dimensions
Batch
Finishing Painting of casts Batch
Sand Disposal Spent sand is removed from site at a rate of 300T/m (90% is reclaimed)
Batch
Storage of Source Metal Source material is received Batch
Silica Plant (New) Reclamation and preparation Batch
Shot Blasting Cleaning, strengthening or polishing the metal Batch
PRIMA AIR
March 2017 Report No. 1665711-313101-1 18
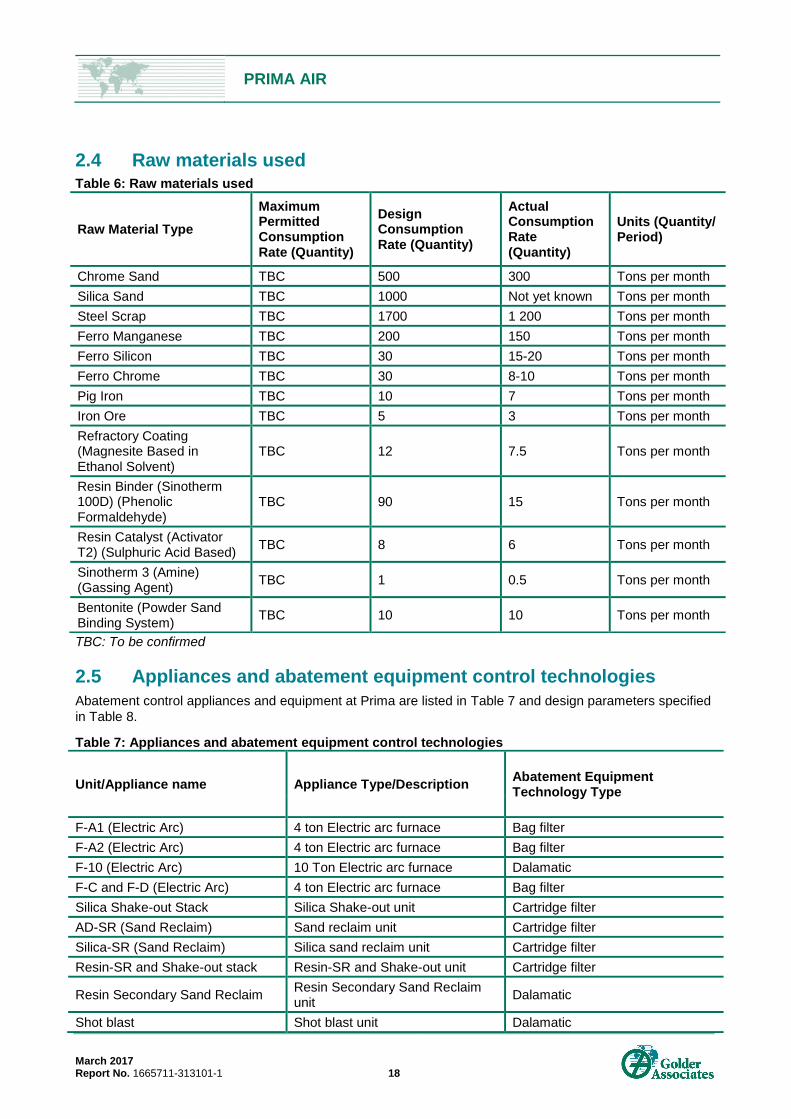
2.4 Raw materials used Table 6: Raw materials used
TBC: To be confirmed
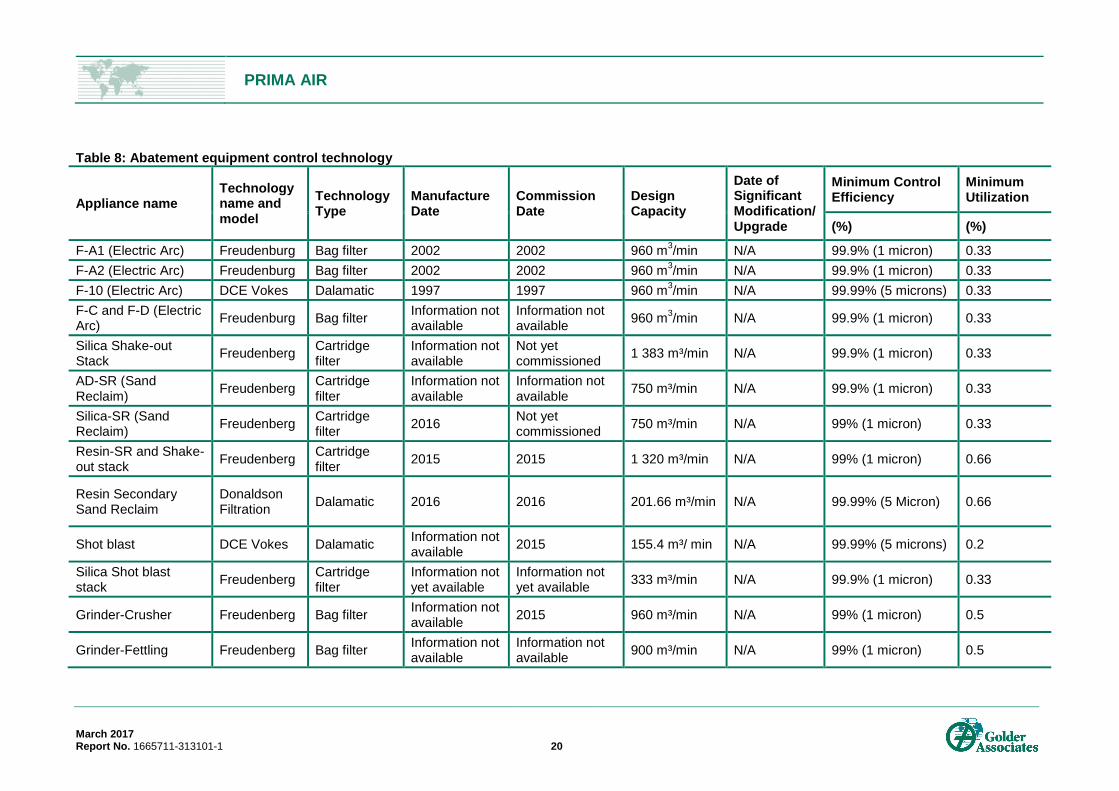
2.5 Appliances and abatement equipment control technologies
Abatement control appliances and equipment at Prima are listed in Table 7 and design parameters specified
in Table 8.
Table 7: Appliances and abatement equipment control technologies
Unit/Appliance name Appliance Type/Description Abatement Equipment Technology Type
F-A1 (Electric Arc) 4 ton Electric arc furnace Bag filter
F-A2 (Electric Arc) 4 ton Electric arc furnace Bag filter
F-10 (Electric Arc) 10 Ton Electric arc furnace Dalamatic
F-C and F-D (Electric Arc) 4 ton Electric arc furnace Bag filter
Silica Shake-out Stack Silica Shake-out unit Cartridge filter
AD-SR (Sand Reclaim) Sand reclaim unit Cartridge filter
Silica-SR (Sand Reclaim) Silica sand reclaim unit Cartridge filter
Resin-SR and Shake-out stack Resin-SR and Shake-out unit Cartridge filter
Resin Secondary Sand Reclaim Resin Secondary Sand Reclaim unit
Dalamatic
Shot blast Shot blast unit Dalamatic
Raw Material Type
Maximum Permitted Consumption Rate (Quantity)
Design Consumption Rate (Quantity)
Actual Consumption Rate (Quantity)
Units (Quantity/ Period)
Chrome Sand TBC 500 300 Tons per month
Silica Sand TBC 1000 Not yet known Tons per month
Steel Scrap TBC 1700 1 200 Tons per month
Ferro Manganese TBC 200 150 Tons per month
Ferro Silicon TBC 30 15-20 Tons per month
Ferro Chrome TBC 30 8-10 Tons per month
Pig Iron TBC 10 7 Tons per month
Iron Ore TBC 5 3 Tons per month
Refractory Coating (Magnesite Based in Ethanol Solvent)
TBC 12 7.5 Tons per month
Resin Binder (Sinotherm 100D) (Phenolic Formaldehyde)
TBC 90 15 Tons per month
Resin Catalyst (Activator T2) (Sulphuric Acid Based)
TBC 8 6 Tons per month
Sinotherm 3 (Amine) (Gassing Agent)
TBC 1 0.5 Tons per month
Bentonite (Powder Sand Binding System)
TBC 10 10 Tons per month

PRIMA AIR
March 2017 Report No. 1665711-313101-1 19
Unit/Appliance name Appliance Type/Description Abatement Equipment Technology Type
Silica Shotblast stack Freudenberg Cartridge filter
Grinder-Crusher Crusher unit Bag filter
Grinder-Fettling Fettling unit Bag filter
PRIMA AIR
March 2017 Report No. 1665711-313101-1 20
Table 8: Abatement equipment control technology
Appliance name Technology name and model
Technology Type
Manufacture Date
Commission Date
Design Capacity
Date of Significant Modification/ Upgrade
Minimum Control Efficiency
Minimum Utilization
(%) (%)
F-A1 (Electric Arc) Freudenburg Bag filter 2002 2002 960 m3/min N/A 99.9% (1 micron) 0.33
F-A2 (Electric Arc) Freudenburg Bag filter 2002 2002 960 m3/min N/A 99.9% (1 micron) 0.33
F-10 (Electric Arc) DCE Vokes Dalamatic 1997 1997 960 m3/min N/A 99.99% (5 microns) 0.33
F-C and F-D (Electric Arc)
Freudenburg Bag filter Information not available
Information not available
960 m3/min N/A 99.9% (1 micron) 0.33
Silica Shake-out Stack
Freudenberg Cartridge filter
Information not available
Not yet commissioned
1 383 m³/min N/A 99.9% (1 micron) 0.33
AD-SR (Sand Reclaim)
Freudenberg Cartridge filter
Information not available
Information not available
750 m³/min N/A 99.9% (1 micron) 0.33
Silica-SR (Sand Reclaim)
Freudenberg Cartridge filter
2016 Not yet commissioned
750 m³/min N/A 99% (1 micron) 0.33
Resin-SR and Shake-out stack
Freudenberg Cartridge filter
2015 2015 1 320 m³/min N/A 99% (1 micron) 0.66
Resin Secondary Sand Reclaim
Donaldson Filtration
Dalamatic 2016 2016 201.66 m³/min N/A 99.99% (5 Micron) 0.66
Shot blast DCE Vokes Dalamatic Information not available
2015 155.4 m³/ min N/A 99.99% (5 microns) 0.2
Silica Shot blast stack
Freudenberg Cartridge filter
Information not yet available
Information not yet available
333 m³/min N/A 99.9% (1 micron) 0.33
Grinder-Crusher Freudenberg Bag filter Information not available
2015 960 m³/min N/A 99% (1 micron) 0.5
Grinder-Fettling Freudenberg Bag filter Information not available
Information not available
900 m³/min N/A 99% (1 micron) 0.5

PRIMA AIR
March 2017 Report No. 1665711-313101-1 21
3.0 ATMOSPHERIC EMISSIONS
3.1 Point source parameters Table 9: Point source parameters
Point source name
Latitude (decimal degrees)
Longitude (decimal degrees)
Height of release above ground (m)
Height above nearby building (m)
Diameter at stack tip/ vent exit (m)
Actual gas exit temperature (°C)
Actual Gas Volumetric Flow (m³/hr)
Actual Gas Exit Velocity (m/s)
Type of emission
Continuous/ Batch
F-A1 Stack -26.20859 o
28.29292 o 12.2 6 0.57 35.89 13 644 6.7 Continuous
F-A2 Stack -26.20715 o
28.29457 o 12.2 6 0.95 25 49 428 14.5 Continuous
AD-SR stack -26.20813 o
28.29366 o 2 -6 0.75 x 0.65
Process dependant
5 040 9.87 Continuous
Prima Silica Stack (F-C and F-D emissions)
-26.20699 o
28.29461 o 12.4 1 1.06 40 13 644 9.6 Continuous
Silica Shake-out Stack
-26.20755 o
28.29324 o 4.4 -4 1.4 x 1.55
Process dependant
83 000 12 Continuous
Silica-SR Stack -26.20778 o
28.29373 o 2.955 -8 1.2 x 0.92
Process dependant
45 000 Not known
Continuous
Short stack (F-10 stack)
-26.20817 o
28.29229 o 2.6 Below 0.59 29 22 248 10.5 Continuous
Resin-SR and Shake-out stack
-26.20751 o
28.29233 o 4 -9 1.3 x 1.1
Process dependant
79 200 21.82 Continuous
Resin Secondary SR stack
-26.20755 o
28.29224 o 2 -11 0.7 x 0.59
Process dependant
12 100 16.8 Continuous
Shot blast stack -26.21219 o
28.29897 o 2.1 Below 1.4 Ambient 9 324 8 Continuous
Silica shot blast stack
-26.00001 28.283334 6 -7 750 50 20 000 Not known
Continuous
Grinder-Crusher -26.20771 o
28.29299 o 7 0 0.85 Ambient 57 600 20 Continuous

PRIMA AIR
March 2017 Report No. 1665711-313101-1 22
Point source name
Latitude (decimal degrees)
Longitude (decimal degrees)
Height of release above ground (m)
Height above nearby building (m)
Diameter at stack tip/ vent exit (m)
Actual gas exit temperature (°C)
Actual Gas Volumetric Flow (m³/hr)
Actual Gas Exit Velocity (m/s)
Type of emission
Continuous/ Batch
stack
Grinder-Fettling stack
-26.20705 o
28.29369 o 3.4 -2.6 1 x 1.3 Ambient 54 000 18.75 Continuous
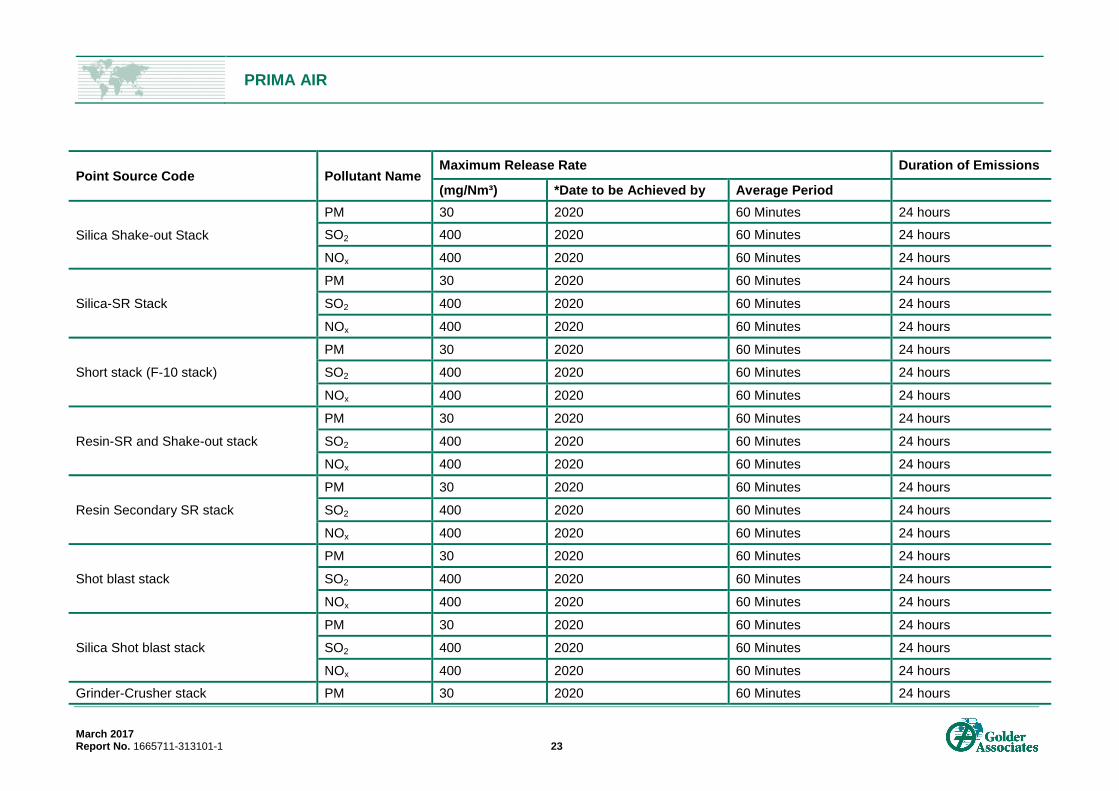
3.2 Point source maximum emission rates (normal working conditions) Table 10: Point source maximum emission rates (normal working conditions)
Point Source Code Pollutant Name Maximum Release Rate Duration of Emissions
(mg/Nm³) *Date to be Achieved by Average Period
F-A1 Stack
PM 30 2020 60 Minutes 24 hours
SO2 400 2020 60 Minutes 24 hours
NOx 400 2020 60 Minutes 24 hours
F-A2 Stack
PM 30 2020 60 Minutes 24 hours
SO2 400 2020 60 Minutes 24 hours
NOx 400 2020 60 Minutes 24 hours
AD-SR stack
PM 30 2020 60 Minutes 24 hours
SO2 400 2020 60 Minutes 24 hours
NOx 400 2020 60 Minutes 24 hours
Prima Silica Stack (F-C and F-D emissions)
PM 30 2020 60 Minutes 24 hours
SO2 400 2020 60 Minutes 24 hours
NOx 400 2020 60 Minutes 24 hours
PRIMA AIR
March 2017 Report No. 1665711-313101-1 23
Point Source Code Pollutant Name Maximum Release Rate Duration of Emissions
(mg/Nm³) *Date to be Achieved by Average Period
Silica Shake-out Stack
PM 30 2020 60 Minutes 24 hours
SO2 400 2020 60 Minutes 24 hours
NOx 400 2020 60 Minutes 24 hours
Silica-SR Stack
PM 30 2020 60 Minutes 24 hours
SO2 400 2020 60 Minutes 24 hours
NOx 400 2020 60 Minutes 24 hours
Short stack (F-10 stack)
PM 30 2020 60 Minutes 24 hours
SO2 400 2020 60 Minutes 24 hours
NOx 400 2020 60 Minutes 24 hours
Resin-SR and Shake-out stack
PM 30 2020 60 Minutes 24 hours
SO2 400 2020 60 Minutes 24 hours
NOx 400 2020 60 Minutes 24 hours
Resin Secondary SR stack
PM 30 2020 60 Minutes 24 hours
SO2 400 2020 60 Minutes 24 hours
NOx 400 2020 60 Minutes 24 hours
Shot blast stack
PM 30 2020 60 Minutes 24 hours
SO2 400 2020 60 Minutes 24 hours
NOx 400 2020 60 Minutes 24 hours
Silica Shot blast stack
PM 30 2020 60 Minutes 24 hours
SO2 400 2020 60 Minutes 24 hours
NOx 400 2020 60 Minutes 24 hours
Grinder-Crusher stack PM 30 2020 60 Minutes 24 hours

PRIMA AIR
March 2017 Report No. 1665711-313101-1 24
Point Source Code Pollutant Name Maximum Release Rate Duration of Emissions
(mg/Nm³) *Date to be Achieved by Average Period
SO2 400 2020 60 Minutes 24 hours
NOx 400 2020 60 Minutes 24 hours
Grinder-Fettling stack
PM 30 2020 60 Minutes 24 hours
SO2 400 2020 60 Minutes 24 hours
NOx 400 2020 60 Minutes 24 hours
*The Maximum Release Rates contain emission limits to be achieved by the Year 2015 and 2020 respectively in terms of the Minimum Emission Standards (issued in terms of Section 21 of the National
Environmental Management: Air Quality Act – Standards and Regulations, Notice Number 248 of 2010) or requirements set in Registration Certificate 164 issued on 12 March 2010 in terms of the
Atmospheric Pollution Prevention Act 45/1965, whichever is stricter
3.3 Point source maximum emission rates (start-up, maintenance and shut-down conditions)
Start-up, maintenance and shut down conditions emissions monitoring data is not currently available as the emissions monitoring under these operation conditions
has not been undertaken to date. Table 11 is included to highlight the point sources only for record purposes.
Table 11: Point source emission rates – start-up, maintenance and shut-down conditions
Point Source Code
Pollutant Name
Maximum Release Rate Maximum gas volumetric flow (m
3/hr)
Maximum gas exit velocity (m/s)
Emission Hours
Permitted duration of emissions
Historical frequency of occurrence over the last 2 years
**(mg/Nm³) *Date to be Achieved by
Average Period
F-A1 Stack
PM 30 2020 Hourly Not available Not available 00:00 24:00 <48 hours as per AEL
Not available
SO2 400 2020 Hourly Not available Not available 00:00 24:00 <48 hours as per AEL
Not available
NOx 400 2020 Hourly Not available Not available 00:00 24:00 <48 hours as per AEL
Not available
F-A2 Stack PM 30 2020 24 Hours Not available Not available 00:00 24:00 <48 hours as per AEL
Not available

PRIMA AIR
March 2017 Report No. 1665711-313101-1 25
Point Source Code
Pollutant Name
Maximum Release Rate Maximum gas volumetric flow (m
3/hr)
Maximum gas exit velocity (m/s)
Emission Hours
Permitted duration of emissions
Historical frequency of occurrence over the last 2 years
**(mg/Nm³) *Date to be Achieved by
Average Period
SO2 400 2020 24 Hours Not available Not available 00:00 24:00 <48 hours as per AEL
Not available
NOx 400 2020 24 Hours Not available Not available 00:00 24:00 <48 hours as per AEL
Not available
AD-SR stack
PM 30 2020 24 Hours Not available Not available 00:00 24:00 <48 hours as per AEL
Not available
SO2 400 2020 24 Hours Not available Not available 00:00 24:00 <48 hours as per AEL
Not available
NOx 400 2020 24 Hours Not available Not available 00:00 24:00 <48 hours as per AEL
Not available
Prima Silica Stack (F-C and F-D emissions)
PM 30 2020 24 Hours Not available Not available 00:00 24:00 <48 hours as per AEL
Not available
SO2 400 2020 24 Hours Not available Not available 00:00 24:00 <48 hours as per AEL
Not available
NOx 400 2020 24 Hours Not available Not available 00:00 24:00 <48 hours as per AEL
Not available
Silica Shake-out Stack
PM 30 2020 24 Hours Not available Not available 00:00 24:00 <48 hours as per AEL
Not available
SO2 400 2020 24 Hours Not available Not available 00:00 24:00 <48 hours as per AEL
Not available
NOx 400 2020 24 Hours Not available Not available 00:00 24:00 <48 hours as per AEL
Not available
Silica-SR Stack
PM 30 2020 24 Hours Not available Not available 00:00 24:00 <48 hours as per AEL
Not available
SO2 400 2020 24 Hours Not available Not available 00:00 24:00 <48 hours as per AEL
Not available

PRIMA AIR
March 2017 Report No. 1665711-313101-1 26
Point Source Code
Pollutant Name
Maximum Release Rate Maximum gas volumetric flow (m
3/hr)
Maximum gas exit velocity (m/s)
Emission Hours
Permitted duration of emissions
Historical frequency of occurrence over the last 2 years
**(mg/Nm³) *Date to be Achieved by
Average Period
NOx 400 2020 24 Hours Not available Not available 00:00 24:00 <48 hours as per AEL
Not available
Short stack (F-10 stack)
PM 30 2020 24 Hours Not available Not available 00:00 24:00 <48 hours as per AEL
Not available
SO2 400 2020 24 Hours Not available Not available 00:00 24:00 <48 hours as per AEL
Not available
NOx 400 2020 24 Hours Not available Not available 00:00 24:00 <48 hours as per AEL
Not available
Resin-SR and Shake-out stack
PM 30 2020 24 Hours Not available Not available 00:00 24:00 <48 hours as per AEL
Not available
SO2 400 2020 24 Hours Not available Not available 00:00 24:00 <48 hours as per AEL
Not available
NOx 400 2020 24 Hours Not available Not available 00:00 24:00 <48 hours as per AEL
Not available
Resin Secondary SR stack
PM 30 2020 24 Hours Not available Not available 00:00 24:00 <48 hours as per AEL
Not available
SO2 400 2020 24 Hours Not available Not available 00:00 24:00 <48 hours as per AEL
Not available
NOx 400 2020 24 Hours Not available Not available 00:00 24:00 <48 hours as per AEL
Not available
Shot blast stack
PM 30 2020 24 Hours Not available Not available 00:00 24:00 <48 hours as per AEL
Not available
SO2 400 2020 24 Hours Not available Not available 00:00 24:00 <48 hours as per AEL
Not available
NOx 400 2020 24 Hours Not available Not available 00:00 24:00 <48 hours as per AEL
Not available

PRIMA AIR
March 2017 Report No. 1665711-313101-1 27
Point Source Code
Pollutant Name
Maximum Release Rate Maximum gas volumetric flow (m
3/hr)
Maximum gas exit velocity (m/s)
Emission Hours
Permitted duration of emissions
Historical frequency of occurrence over the last 2 years
**(mg/Nm³) *Date to be Achieved by
Average Period
Silica Shot blast stack
PM 30 2020 24 Hours Not available Not available 00:00 24:00 <48 hours as per AEL
Not available
SO2 400 2020 24 Hours Not available Not available 00:00 24:00 <48 hours as per AEL
Not available
NOx 400 2020 24 Hours Not available Not available 00:00 24:00 <48 hours as per AEL
Not available
Grinder-Crusher stack
PM 30 2020 24 Hours Not available Not available 00:00 24:00 <48 hours as per AEL
Not available
SO2 400 2020 24 Hours Not available Not available 00:00 24:00 <48 hours as per AEL
Not available
NOx 400 2020 24 Hours Not available Not available 00:00 24:00 <48 hours as per AEL
Not available
Grinder-Fettling stack
PM 30 2020 24 Hours Not available Not available 00:00 24:00 <48 hours as per AEL
Not available
SO2 400 2020 24 Hours Not available Not available 00:00 24:00 <48 hours as per AEL
Not available
NOx 400 2020 24 Hours Not available Not available 00:00 24:00 <48 hours as per AEL
Not available
*The Maximum Release Rates contain emission limits to be achieved by the Year 2015 and 2020 respectively in terms of the Minimum Emission Standards (issued in terms of Section 21 of the National
Environmental Management: Air Quality Act – Standards and Regulations, Notice Number 248 of 2010) or requirements set in Registration Certificate 164 issued on 12 March 2010 in terms of the
Atmospheric Pollution Prevention Act 45/1965, whichever is stricter
** The Maximum Release Rates are currently unknown as Prima has not undertaken any emissions monitoring during these conditions.

PRIMA AIR
March 2017 Report No. 1665711-313101-1 28
3.4 Fugitive emissions (area and line sources)
Table 12 and Table 13 list the fugitive emission sources and mitigation measures respectively.
Table 12: Fugitive emission sources (area and line) location
Unique Area Source ID Source Name Source Description
Latitude (decimal degrees) of SW corner
Longitude (decimal degrees) of SW corner
Height of Release Above Ground (m)
Length of Area (m)
Width of Area (m)
Unpaved road 1 on site (Line source) – Close to the main road
Unpaved road on site Fugitive emissions of PM
-26.20845° 28.29317° 0 185 4.2
Unpaved road 2 on site (Line source) – back of the site
Unpaved road on site Fugitive emissions of PM
-26.20783° 28.29255° 0 265 6
Scrap storage area (Area source) – 1 NE
Scrap storage area Fugitive emissions of PM
-26.20678° 28.29413° 4.5 41 16.2
Scrap storage area (Area source) – 2 SW
Scrap storage area Fugitive emissions of PM
-26.20854° 28.29268° 4.5 33.5 10.6
Scrap storage area (Area source) – 3 N
Manganese Scrap storage area
Fugitive emissions of PM
-26.20703° 28.29298° 4.5 31.7 9.8
Sand piling area (Area source) - 1 NE
Sand piling area Fugitive emissions of PM
-26.20691° 28.29380° 1.6 9 5

PRIMA AIR
March 2017 Report No. 1665711-313101-1 29
Table 13: Fugitive emission sources (area and line) mitigation measures
Area and/or Line Source Code
Area and/or Line Source Description
Description of Specific Measures
Timeframe for Achieving Required Control Efficiency
Method of Monitoring Measures Effectiveness
Contingency Measures
Unpaved road on site (Line source)
Unpaved road on site None but to be paved in the near future
Dependant on financial situation
None Information not available
Scrap storage area (Area source) – 1 NE
Scrap storage area No atmospheric emissions Information not available Information not available Information not available
Scrap storage area (Area source) – 2 SW
Scrap storage area No atmospheric emissions Information not available Information not available Information not available
Scrap storage area (Area source) – 3 N
Manganese Scrap storage area
No atmospheric emissions Information not available Information not available Information not available
Sand piling area (Area source) -1 NE
Sand piling area No atmospheric emissions Information not available Information not available Information not available
Sand piling area (Area source) – 2 NW
Sand piling area No atmospheric emissions Information not available Information not available Information not available
3.5 Emergency incidents
No specific air quality emergency incidents were declared by Prima from 2014 - 2016.

PRIMA AIR
March 2017 Report No. 1665711-313101-1 30
4.0 IMPACT OF THE ENTERPRISE ON THE RECEIVING ENVIRONMENT
4.1 Study approach and methodology
The methodology used in this assessment is illustrated in Figure 11 and further discussed in the sections
that follow.
Figure 11: Process followed in the determination of the air quality impacts associated with the proposed activities
4.1.1 Baseline assessment
4.1.1.1 Background literature review
A background literature review was conducted of various documents to gain an overview of the Prima
operations, the typical regional climate and expected meteorological conditions. Documentation reviewed
included the following:
Air Quality Management Plan (AQM) for the Ekurhuleni Metropolitan Municipality (EMM), (Report No.
APP/04/EMM-02c), Compiled by Airshed Planning Professionals and Environmental Sciences
Associates, January 2005;
Gauteng Province Air Quality Management Plan compiled by Airshed Planning Professionals (Pty) Ltd
and Ecoserv (Pty) Ltd for the Gauteng Department of Agriculture, Conservation and Environment
(GDACE), 2009;
Highveld Priority Area Air Quality Management Plan (HPA AQMP);
South African Air Quality Information System (SAAQIS);
Modelled MM5 meteorological data was purchased and used for the meteorological analysis and
interpretation; and
The U. S. Environmental Protection Agency Emission Factor Documentation for AP-42, final report,
2004.
4.1.1.2 Ambient air quality baseline monitoring data
Prima has not undertaken any ambient air quality monitoring however ambient air quality data was accessed
from SAAQIS for the region to provide an indication of background pollutant levels.
4.1.2 Emissions inventory and air dispersion modelling
4.1.2.1 Emissions Inventory
An emissions inventory comprises the identification of sources of emission, and the quantification of each
source’s contribution to ambient air pollution concentrations. The establishment of a comprehensive
emissions inventory forms the basis for the assessment of the impacts of activities on the receiving
environment.
Baseline assessment
Emissions inventory
Impact assessment
Management Plan

PRIMA AIR
March 2017 Report No. 1665711-313101-1 31
Prima’s emission inventory was based on information provided by the Client and the maximum legislated
emissions in terms of the NEM: AQA Category 4, Sub-category 4.10: Foundries. Emission factors3 obtained
from the National Pollutant Inventory (NPI) Emission Estimation Technique Manuals were used to quantify
fugitive emissions from stockpiles and unpaved roads at the facility.
4.1.2.2 Dispersion Modelling
Dispersion modelling is used as a tool to predict the ambient atmospheric concentration of pollutants emitted
to the atmosphere from a variety of processes, as well as the distribution of concentrations from existing
sources.
This assessment is considered to be a Level 2 assessment in terms of GN R.533, as a steady state
Gaussian Plume model is required in order to gain an understanding of the distribution of the odour
concentrations in time and space. Furthermore, the greatest impacts are anticipated < 50 km downwind of
the source
The AERMOD View modelling software code was used to determine likely ambient air pollutant
concentrations from the Prima operations. AERMOD View is an air dispersion modelling package which
incorporates the following United States Environmental Protection Agency (US EPA) air dispersion models
into one integrated interface:
AERMOD;
ISCST3; and
ISC-PRIME.
The AERMET pre-processor was used to process MM5 modelled regional meteorological data for input into
ISC-AERMOD. Input to a dispersion model includes prepared meteorological data, source data, information
on the nature of the receptor grid and emissions input data.
Dispersion models are limited in their inability to account for highly complex rapidly varying spatial and
temporal meteorological systems such as calms; coastal fumigation, sea/land breeze recirculation, and
mountain and valley winds, especially where complex terrain is involved. The US EPA considers the range of
uncertainty to be -50% to 200% for models applied to gently rolling terrain. The accuracy improves with fairly
strong wind speeds and during neutral atmospheric conditions. Dispersion modelling results can be
compared with monitored values in order to improve the accuracy of, or “calibrate” models.
Dispersion simulations were undertaken for normal operating conditions, with the use of 3 years of MM5 data
and the regulatory approved AERMOD.
NO2 was modelled as NOx. The U.S. EPA has defined a 3-tier approach to NO2 concentrations:
Tier I - total conversion, or all NOX = NO2;
Tier II – use a default NO2/NOX ratio of 0.75; and
Tier III – case by case detailed screening methods, such as Ozone Limiting Method (OLM) and Plume
Volume Molar Ratio Method (PVMRM).
This study adopts conservative methodology whereby the Tier I approach or 100% conversion is assumed. It
must be noted that the dispersion simulations only consider the emissions from the Prima operations and do
not include existing background air quality or emissions sources located off site.
3 Note: An emission factor is a representative value that attempts to relate the quantity of a pollutant released to the atmosphere with an activity associated with the release of that
pollutant. Emission factors and emission inventories are fundamental tools for air quality management and planning. The emission factors are frequently the best or only method available for estimating emissions produced by varying sources.
PRIMA AIR
March 2017 Report No. 1665711-313101-1 32
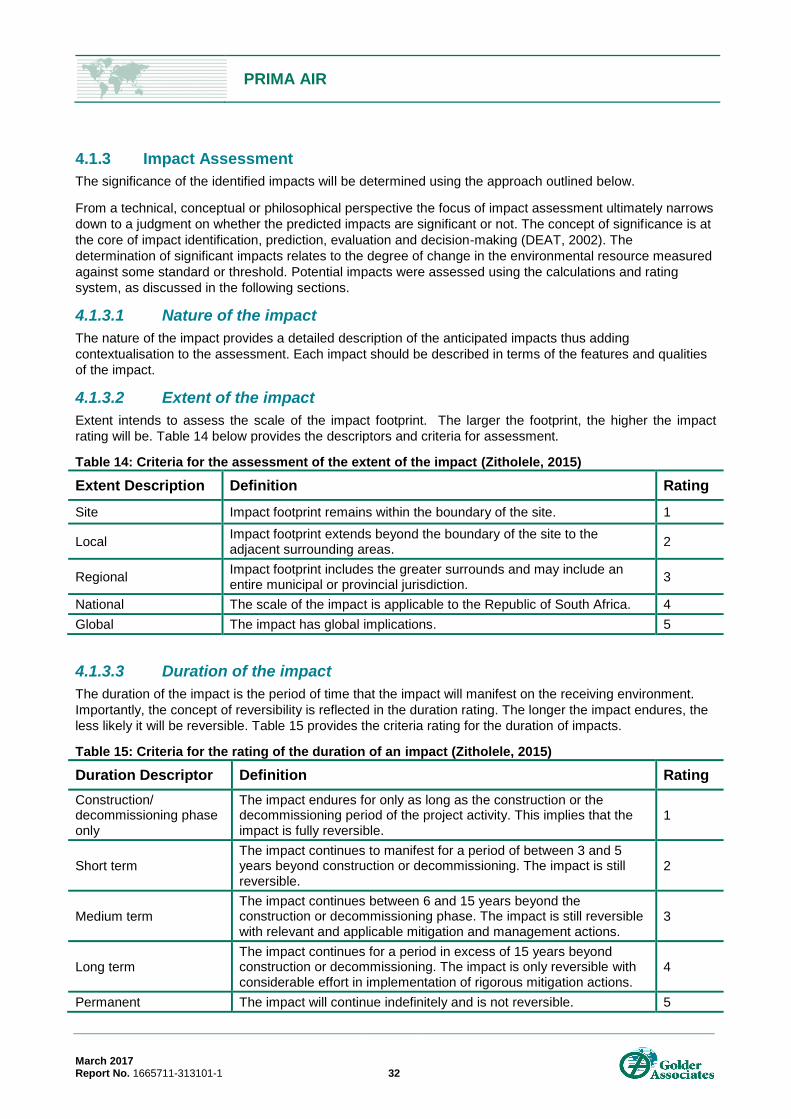
4.1.3 Impact Assessment
The significance of the identified impacts will be determined using the approach outlined below.
From a technical, conceptual or philosophical perspective the focus of impact assessment ultimately narrows
down to a judgment on whether the predicted impacts are significant or not. The concept of significance is at
the core of impact identification, prediction, evaluation and decision-making (DEAT, 2002). The
determination of significant impacts relates to the degree of change in the environmental resource measured
against some standard or threshold. Potential impacts were assessed using the calculations and rating
system, as discussed in the following sections.
4.1.3.1 Nature of the impact
The nature of the impact provides a detailed description of the anticipated impacts thus adding
contextualisation to the assessment. Each impact should be described in terms of the features and qualities
of the impact.
4.1.3.2 Extent of the impact
Extent intends to assess the scale of the impact footprint. The larger the footprint, the higher the impact
rating will be. Table 14 below provides the descriptors and criteria for assessment.
Table 14: Criteria for the assessment of the extent of the impact (Zitholele, 2015)
Extent Description Definition Rating
Site Impact footprint remains within the boundary of the site. 1
Local Impact footprint extends beyond the boundary of the site to the adjacent surrounding areas.
2
Regional Impact footprint includes the greater surrounds and may include an entire municipal or provincial jurisdiction.
3
National The scale of the impact is applicable to the Republic of South Africa. 4
Global The impact has global implications. 5
4.1.3.3 Duration of the impact
The duration of the impact is the period of time that the impact will manifest on the receiving environment.
Importantly, the concept of reversibility is reflected in the duration rating. The longer the impact endures, the
less likely it will be reversible. Table 15 provides the criteria rating for the duration of impacts.
Table 15: Criteria for the rating of the duration of an impact (Zitholele, 2015)
Duration Descriptor Definition Rating
Construction/ decommissioning phase only
The impact endures for only as long as the construction or the decommissioning period of the project activity. This implies that the impact is fully reversible.
1
Short term The impact continues to manifest for a period of between 3 and 5 years beyond construction or decommissioning. The impact is still reversible.
2
Medium term The impact continues between 6 and 15 years beyond the construction or decommissioning phase. The impact is still reversible with relevant and applicable mitigation and management actions.
3
Long term The impact continues for a period in excess of 15 years beyond construction or decommissioning. The impact is only reversible with considerable effort in implementation of rigorous mitigation actions.
4
Permanent The impact will continue indefinitely and is not reversible. 5

PRIMA AIR
March 2017 Report No. 1665711-313101-1 33
4.1.3.4 Potential intensity of the impact
The concept of the potential intensity of an impact is the acknowledgement at the outset of the project of the
potential significance of the impact on the receiving environment. For example, SO2 emissions have the
potential to result in significant adverse human health effects, and this potential intensity must be
accommodated within the significance rating. The importance of the potential intensity must be emphasised
within the rating methodology to indicate that, for an adverse impact to human health, even a limited extent
and duration will still yield a significant impact.
Within potential intensity, the concept of irreplaceable loss is taken into account. Irreplaceable loss may
relate to losses of entire faunal or floral species (for example) at an extent greater than regional, or the
permanent loss of significant environmental resources. Potential intensity provides a measure for comparing
significance across different specialist assessments. This is possible by aligning specialist ratings with the
potential intensity ratings (Table 16 and Table 17). This approach allows for better integration of specialist
studies into the environmental impact assessment process.
Table 16: Criteria for impact rating of potential intensity of a negative impact (Golder, 2016)
Potential Intensity Descriptor
Definition of negative impact benchmarked against the National Ambient Air Quality Standards (NAAQS)
Rating
High > 100% of the NAAQS 16
Moderate-High 75% - 100% of the NAAQS 8
Moderate 50% - 75% of the NAAQS 4
Moderate-Low 25% - 50% of the NAAQS 2
Low 0% - 25% of the NAAQS 1
Table 17: Criteria for the impact rating of potential intensity of a positive impact (Zitholele, 2015)
Potential Intensity Descriptor
Definition of positive impact Rating
Moderate-High Net improvement in human welfare. 8
Moderate Improved environmental quality/improved individual livelihoods. 4
Moderate-Low Economic development. 2
Low Positive change with no other consequences. 1
It must be noted that there is no high rating for positive impacts under potential intensity, as it must be
understood that no positive spinoff of an activity can possibly raise a similar significance rating to a negative
impact that affects human health or causes the irreplaceable loss of a species.
4.1.3.5 Likelihood of the impact
This is the likelihood of the impact potential intensity manifesting. If an impact is unlikely to manifest then the
likelihood rating will reduce the overall significance. Table 18 provides the rating methodology for likelihood.
The rating for likelihood is provided in fractions in order to provide an indication of percentage probability,
although it is noted that mathematical connotation cannot be implied to numbers utilised for ratings.
Table 18: Criteria for the rating of the likelihood of the impact occurring (Zitholele, 2015)
Likelihood Descriptor Definition Rating
Improbable The possibility of the impact occurring is negligible and only under exceptional circumstances.
0.1
Unlikely The possibility of the impact occurring is low with a less than 10% chance of occurring. The impact has not occurred before.
0.2
Probable The impact has a 10% to 40% chance of occurring. Only likely to 0.5
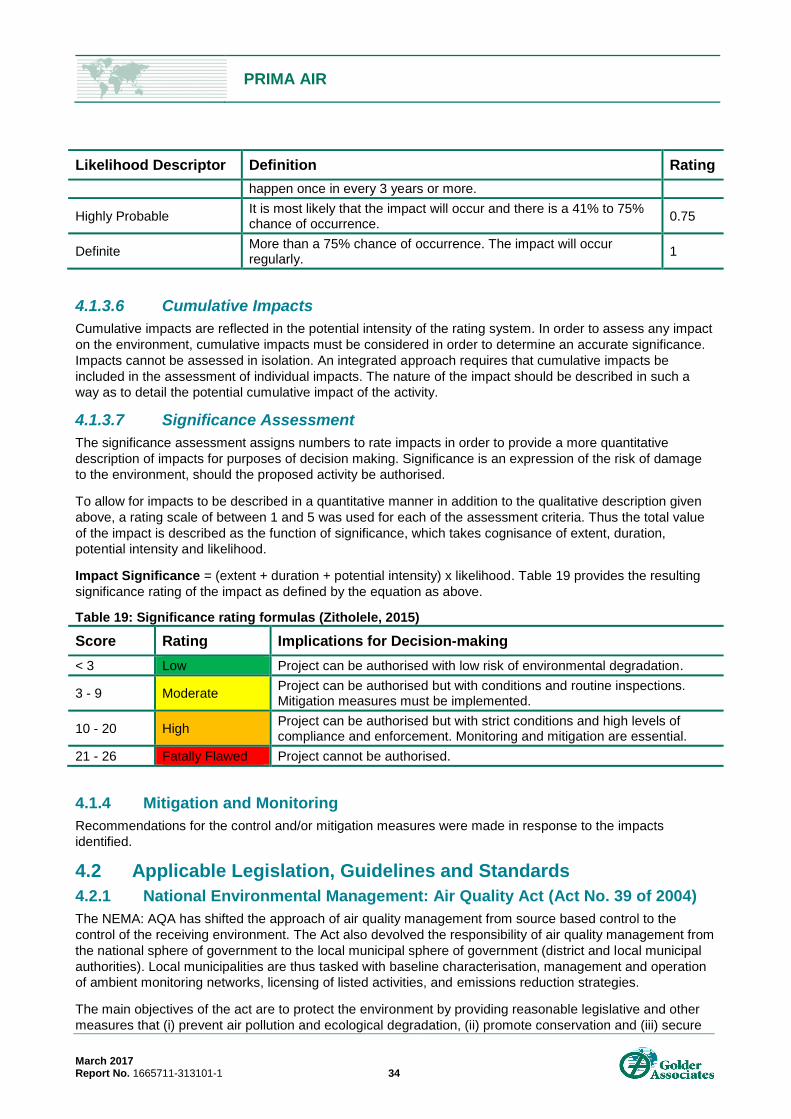
PRIMA AIR
March 2017 Report No. 1665711-313101-1 34
Likelihood Descriptor Definition Rating
happen once in every 3 years or more.
Highly Probable It is most likely that the impact will occur and there is a 41% to 75% chance of occurrence.
0.75
Definite More than a 75% chance of occurrence. The impact will occur regularly.
1
4.1.3.6 Cumulative Impacts
Cumulative impacts are reflected in the potential intensity of the rating system. In order to assess any impact
on the environment, cumulative impacts must be considered in order to determine an accurate significance.
Impacts cannot be assessed in isolation. An integrated approach requires that cumulative impacts be
included in the assessment of individual impacts. The nature of the impact should be described in such a
way as to detail the potential cumulative impact of the activity.
4.1.3.7 Significance Assessment
The significance assessment assigns numbers to rate impacts in order to provide a more quantitative
description of impacts for purposes of decision making. Significance is an expression of the risk of damage
to the environment, should the proposed activity be authorised.
To allow for impacts to be described in a quantitative manner in addition to the qualitative description given
above, a rating scale of between 1 and 5 was used for each of the assessment criteria. Thus the total value
of the impact is described as the function of significance, which takes cognisance of extent, duration,
potential intensity and likelihood.
Impact Significance = (extent + duration + potential intensity) x likelihood. Table 19 provides the resulting
significance rating of the impact as defined by the equation as above.
Table 19: Significance rating formulas (Zitholele, 2015)
Score Rating Implications for Decision-making
< 3 Low Project can be authorised with low risk of environmental degradation.
3 - 9 Moderate Project can be authorised but with conditions and routine inspections. Mitigation measures must be implemented.
10 - 20 High Project can be authorised but with strict conditions and high levels of compliance and enforcement. Monitoring and mitigation are essential.
21 - 26 Fatally Flawed Project cannot be authorised.
4.1.4 Mitigation and Monitoring
Recommendations for the control and/or mitigation measures were made in response to the impacts
identified.
4.2 Applicable Legislation, Guidelines and Standards
4.2.1 National Environmental Management: Air Quality Act (Act No. 39 of 2004)
The NEMA: AQA has shifted the approach of air quality management from source based control to the
control of the receiving environment. The Act also devolved the responsibility of air quality management from
the national sphere of government to the local municipal sphere of government (district and local municipal
authorities). Local municipalities are thus tasked with baseline characterisation, management and operation
of ambient monitoring networks, licensing of listed activities, and emissions reduction strategies.
The main objectives of the act are to protect the environment by providing reasonable legislative and other
measures that (i) prevent air pollution and ecological degradation, (ii) promote conservation and (iii) secure
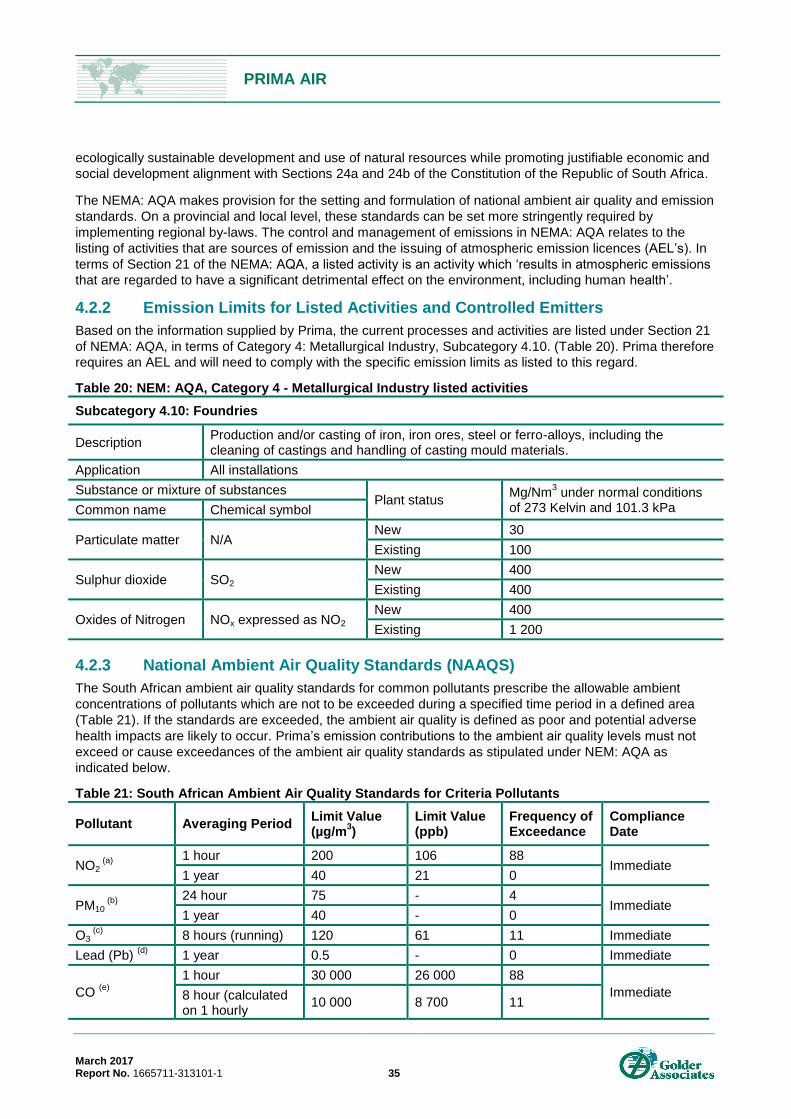
PRIMA AIR
March 2017 Report No. 1665711-313101-1 35
ecologically sustainable development and use of natural resources while promoting justifiable economic and
social development alignment with Sections 24a and 24b of the Constitution of the Republic of South Africa.
The NEMA: AQA makes provision for the setting and formulation of national ambient air quality and emission
standards. On a provincial and local level, these standards can be set more stringently required by
implementing regional by-laws. The control and management of emissions in NEMA: AQA relates to the
listing of activities that are sources of emission and the issuing of atmospheric emission licences (AEL’s). In
terms of Section 21 of the NEMA: AQA, a listed activity is an activity which ‘results in atmospheric emissions
that are regarded to have a significant detrimental effect on the environment, including human health’.
4.2.2 Emission Limits for Listed Activities and Controlled Emitters
Based on the information supplied by Prima, the current processes and activities are listed under Section 21
of NEMA: AQA, in terms of Category 4: Metallurgical Industry, Subcategory 4.10. (Table 20). Prima therefore
requires an AEL and will need to comply with the specific emission limits as listed to this regard.
Table 20: NEM: AQA, Category 4 - Metallurgical Industry listed activities
Subcategory 4.10: Foundries
Description Production and/or casting of iron, iron ores, steel or ferro-alloys, including the cleaning of castings and handling of casting mould materials.
Application All installations
Substance or mixture of substances Plant status
Mg/Nm3 under normal conditions
of 273 Kelvin and 101.3 kPa Common name Chemical symbol
Particulate matter N/A New 30
Existing 100
Sulphur dioxide SO2 New 400
Existing 400
Oxides of Nitrogen NOx expressed as NO2 New 400
Existing 1 200
4.2.3 National Ambient Air Quality Standards (NAAQS)
The South African ambient air quality standards for common pollutants prescribe the allowable ambient
concentrations of pollutants which are not to be exceeded during a specified time period in a defined area
(Table 21). If the standards are exceeded, the ambient air quality is defined as poor and potential adverse
health impacts are likely to occur. Prima’s emission contributions to the ambient air quality levels must not
exceed or cause exceedances of the ambient air quality standards as stipulated under NEM: AQA as
indicated below.
Table 21: South African Ambient Air Quality Standards for Criteria Pollutants
Pollutant Averaging Period Limit Value (µg/m
3)
Limit Value (ppb)
Frequency of Exceedance
Compliance Date
NO2 (a)
1 hour 200 106 88 Immediate
1 year 40 21 0
PM10 (b)
24 hour 75 - 4
Immediate 1 year 40 - 0
O3 (c)
8 hours (running) 120 61 11 Immediate
Lead (Pb) (d)
1 year 0.5 - 0 Immediate
CO (e)
1 hour 30 000 26 000 88
Immediate 8 hour (calculated on 1 hourly
10 000 8 700 11

PRIMA AIR
March 2017 Report No. 1665711-313101-1 36
Pollutant Averaging Period Limit Value (µg/m
3)
Limit Value (ppb)
Frequency of Exceedance
Compliance Date
averages)
Benzene (C6H6)
(f)
1 year 5 1.6 0 Immediate
SO2 (g)
10 minute 500 191 526
Immediate 1 hour 350 134 88
24 hours 125 48 4
1 year 50 19 0
PM2.5 (h)
24 hours 40 4 Immediate
24 hours 25 4 1 January 2030
1 year 20 0 Immediate
1 year 15 0 1 January 2030
Notes:
a. The reference method for the analysis of NO2 shall be ISO 7996
b. The reference method for the determination of the particulate matter fraction of suspended particulate matter shall be EN 12341
c. The reference method for the analysis of ozone shall be the UV photometric method as described in ISO 13964
d. The reference method for the analysis of lead shall be ISO 9855
e. The reference method for analysis of CO shall be ISO 4224
f. The reference methods for benzene sampling and analysis shall be either EPA compendium method TO-14 A or method TO-17
g. The reference method for the analysis of SO2 shall be ISO 6767
h. The reference method for the analysis of PM2.5 shall be EN14907
4.2.4 National Dust Control Regulations
On 1 November, 2013, the National Dust Control Regulations were promulgated under the National
Environmental Management: Air Quality Act (NEMA: AQA), 2004 and published in the Government Gazette
No. 36974. The dust fall standard defines acceptable dust fall rates in terms of the presence of residential
areas (Table 22).
Table 22: Acceptable dust fall rates
Restriction areas Dust fall rate (mg/m
2/day over a
30 day average) Permitted frequency of exceedance
Residential areas Dust fall < 600 Two per annum (not in sequential months)
Non-residential areas 600 < Dust fall < 1 200 Two per annum (not in sequential months)
4.2.5 Highveld Priority Area and Air Quality Management Plan
Prima is located within the Highveld Priority Area (Figure 12). The Highveld area is associated with poor air
quality and elevated concentrations of trace gas pollutants due to the region having a high concentration of
industry, mining, power generation and other non-industrial sources (Held et al. 1996 and DEAT, 2006). For
this reason, the Minister of Environmental Affairs declared the region a priority area, namely the Highveld
Priority Area (HPA) in November 2007.
The primary motive of the HPA declaration and the HPA Air Quality Management Plan (HPA AQMP) is to
achieve and maintain compliance with the national ambient air quality standards across the HPA, using the
constitutional principal of progressive realisation of air quality improvements (DEAT, 2007).
The HPA AQMP thus allows for the alignment of air quality practices with legal and regulatory requirements
to ensure air quality management planning is implemented effectively (DEAT, 2007). Prima is located within
the HPA and is thus required to operate within the air quality requirements of the HPA AQMP.
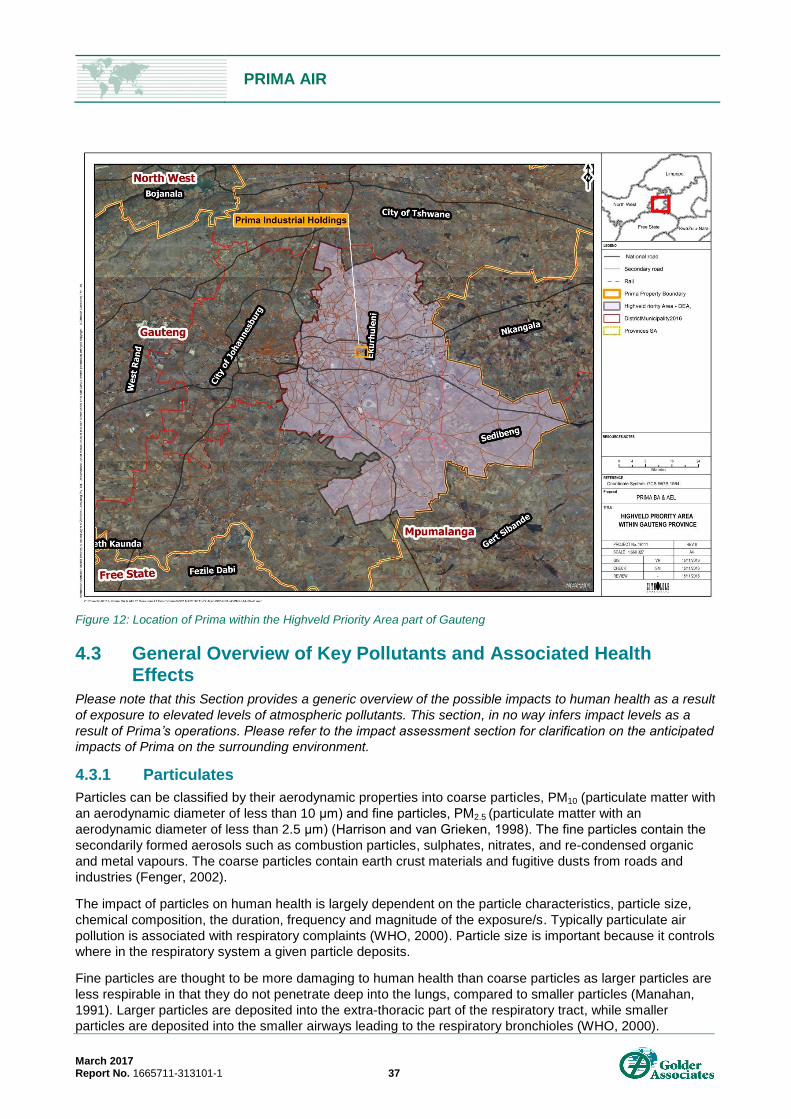
PRIMA AIR
March 2017 Report No. 1665711-313101-1 37
Figure 12: Location of Prima within the Highveld Priority Area part of Gauteng
4.3 General Overview of Key Pollutants and Associated Health Effects
Please note that this Section provides a generic overview of the possible impacts to human health as a result
of exposure to elevated levels of atmospheric pollutants. This section, in no way infers impact levels as a
result of Prima’s operations. Please refer to the impact assessment section for clarification on the anticipated
impacts of Prima on the surrounding environment.
4.3.1 Particulates
Particles can be classified by their aerodynamic properties into coarse particles, PM10 (particulate matter with
an aerodynamic diameter of less than 10 μm) and fine particles, PM2.5 (particulate matter with an
aerodynamic diameter of less than 2.5 μm) (Harrison and van Grieken, 1998). The fine particles contain the
secondarily formed aerosols such as combustion particles, sulphates, nitrates, and re-condensed organic
and metal vapours. The coarse particles contain earth crust materials and fugitive dusts from roads and
industries (Fenger, 2002).
The impact of particles on human health is largely dependent on the particle characteristics, particle size,
chemical composition, the duration, frequency and magnitude of the exposure/s. Typically particulate air
pollution is associated with respiratory complaints (WHO, 2000). Particle size is important because it controls
where in the respiratory system a given particle deposits.
Fine particles are thought to be more damaging to human health than coarse particles as larger particles are
less respirable in that they do not penetrate deep into the lungs, compared to smaller particles (Manahan,
1991). Larger particles are deposited into the extra-thoracic part of the respiratory tract, while smaller
particles are deposited into the smaller airways leading to the respiratory bronchioles (WHO, 2000).

PRIMA AIR
March 2017 Report No. 1665711-313101-1 38
Acute exposure
Studies have proven that acute exposure to particulate matter at both high and low concentrations is
associated with health effects. Various studies undertaken during the 1980s to 1990s have investigated the
relationship between daily fluctuations in particulate matter and mortality at low levels of acute exposure.
Pope et al. (1992) studied daily mortality in relation to PM10 concentrations in the Utah Valley during 1985 to
1989. A maximum daily average concentration of 365 µg/m3 was recorded with effects on mortality observed
at concentrations below 100 µg/m3. The increase in total daily mortality was 13% per 100 µg/m
3 increase in
the 24 hour average. Schwartz’s 1993 studies in Birmingham, recorded daily concentrations of 163 µg/m3
and noted that an increase in daily mortality was experienced with increasing PM10 concentration levels.
Relative risks for chronic lung disease and cardiovascular deaths were higher than deaths from other
causes.
Overall, exposure-response can be described as curvilinear, with small absolute changes in exposure at the
low end of the curve having similar effects on mortality to large absolute changes at the high end
(WHO, 2000). Morbidity effects associated with acute exposures to particulates include increases in lower
respiratory symptoms, medication use and small reductions in lung functioning. Pope and Dockery (1992)
studied groups of children in Utah Valley in winter during the period 1990 to 1991. Daily PM10 concentrations
ranged between 7 and 251 µg/m3. Peak Expiratory Flow was decreased and respiratory symptoms increased
when PM10 concentrations increased. Pope and Kanner (1993) utilised lung function data obtained from
smokers with mild to moderate chronic obstructive pulmonary disease in Salt Lake City. The estimated effect
was a 2% decline in the forced expiratory volume over one second for each 100 µg/m3 increase in the daily
PM10 average.
Chronic exposure
Chronic exposure to low concentrations of particulates is associated with mortality and other chronic effects
such as increased rates of bronchitis and reduced lung functioning (WHO, 2000). An association between
lung function and chronic respiratory disease and airborne particles has been indicated through several
studies. Chestnut et al (1991) found that forced vital capacity decreases with increasing annual average
particulate levels with an apparent threshold of 60 µg/m3. Using chronic respiratory disease data, Schwartz
(1993) determined that the risk of chronic bronchitis increased with increasing particulate concentrations,
with no apparent threshold.
Few studies have been undertaken documenting the morbidity effects of chronic exposure to particulates.
Recently, the Harvard Six Cities Study showed increased respiratory illness rates among children exposed to
increasing particulate, sulphate and hydrogen ion concentrations. Relative risk estimates suggest an 11%
increase in cough and bronchitis rates for each 10 µg/m3 increase in annual average particulate
concentrations.
4.3.2 Sulphur Dioxide
Sulphur dioxide (SO2) is one of a group of highly reactive gasses known as “oxides of sulphur.”
Anthropogenic sources include; fossil fuel combustion (particularly coal burning power plants) industrial
processes such as wood pulping, paper manufacture, petroleum and metal refining, metal smelting
(particularly from sulfide containing ores, e.g. lead, silver and zinc ores) and vehicle tailpipe emissions.
Natural sources of SO2 emissions include; geothermal activity (including hot springs and volcanic activity),
and the natural decay of vegetation on land, in wetlands and in oceans.
SO2 is linked with a number of adverse effects on the respiratory system as it is highly soluble and thus
readily absorbed by the mucous membranes of the nose and upper respiratory tract (Maroni et al., 1995).
Acute exposure
Most information on the acute effects of SO2 is derived from short-term exposures in controlled chamber
experiments. These experiments have demonstrated a wide range of sensitivity amongst individuals, as SO2
concentrations can lead to severe bronchio constriction in some individuals, while others remain completely
unaffected. Response to SO2 inhalation is rapid, with the maximum effect experienced within a few minutes.

PRIMA AIR
March 2017 Report No. 1665711-313101-1 39
Continued exposure does not increase the response. Effects of SO2 exposure were short-lived, with lung
function returning to normal within a few minutes to hours (WHO, 2000).
Exposure over 24 hours
Epidemiological studies have been used to determine the effects of exposure/s, averaged over 24 hour
periods. Studies of the health impact of emissions from the inefficient burning of coal in domestic appliances
have shown that when SO2 concentrations exceed 250 µg/m3 in the presence of particulate matter, an
exacerbation of symptoms is observed in sensitive patients. Recent studies of health impacts in ambient air
polluted by industrial and vehicular activities have demonstrated low level effects on mortality and increases
in Hospitalise admissions. In these studies, no obvious SO2 threshold level was identified (WHO, 2000).
Chronic exposure
Chronic exposure to SO2 has been found to be associated with an increase in respiratory symptoms and a
small (or no) reduction in lung function in children. In adults, respiratory symptoms such as wheeze and
cough are increased. Assessments during the coal burning period in Europe determined the lowest observed
adverse effects to be at an annual average of 100 µg/m3, together with particulate matter. Recent studies
have shown adverse effects below this level in the presence of industrial air pollution. A closer relationship
between mortality and particulate matter, rather than SO2 concentrations has been found (WHO, 2000).
4.3.3 Volatile Organic Compounds
Volatile Organic Compounds (VOCs) are organic compounds that easily vaporise at room temperature and
are colourless. VOCs are released from vehicle exhaust gases either as unburned fuels or as combustion
products, and are also emitted by the evaporation of solvents and motor fuels. Acute exposure to VOCs can
cause eye and respiratory tract irritation and damage, headaches, dizziness, visual disorders, fatigue, loss of
coordination, allergic skin reactions, nausea, and memory impairment, damage the bone marrow and even
cause death. Chronic exposure to high levels of VOCs has been linked to an increase in occurrence of
leukaemia, damage to the liver, kidneys and the central nervous system.
Acute and chronic exposures
Information on health effects from acute exposure to benzene is fairly limited. The most significant adverse
effects from chronic exposure to benzene are haematotoxicity, genotoxicity and carcinogenicity. Chronic
benzene exposure can result in bone marrow depression expressed as leucopoenia, anaemia and/or
thrombocytopenia, leading to pancytopenia and aplastic anaemia. Based on this evidence, benzene is
recognized to be a human and animal carcinogen. An increased mortality from leukaemia has been
demonstrated in workers occupationally exposed (WHO, 2000).
4.3.4 Nitrogen Oxides
Nitrogen Oxides (NOx) emissions are mostly associated with the combustion of fuels (e.g. coal in smelting
and natural gas in pyro-refining). Oxides of nitrogen are basically a mixture of gases that are composed of
nitrogen and oxygen. Two of the most toxicologically significant compounds are nitric oxide (NO) and
nitrogen dioxide (NO2). Other gases belonging to this group are nitrogen monoxide (or nitrous oxide, N2O),
and nitrogen pentoxide (NO5).
NO2 formed though the oxidation of nitric oxide in the atmosphere is a primary pollutant emitted from the
combustion of stationary point sources and from motor vehicles. It is toxic by inhalation. However, as the
compound is acrid and easily detectable by smell at low concentrations, inhalation exposure can generally
be avoided.
Acute exposure
Acute exposures at concentration level of 1 880 µg/m3 and above, lead to observable changes in the
pulmonary function of adults. Normal healthy people exposed at rest or with light exercise for less than 2
hours to concentrations above 4 700 µg/m3, experience pronounced decreases in pulmonary function.
Asthmatics are the most sensitive subjects although various studies of the health effects on asthmatics have
been inconclusive. The lowest concentration causing effects on pulmonary function was reported from two

PRIMA AIR
March 2017 Report No. 1665711-313101-1 40
laboratories that exposed mild asthmatics for 30 to 110 minutes to 565 µg/m3 during intermittent exercise
(WHO, 2000).
Chronic exposure
Animal studies have shown that exposure to 1 880 µg/m3 over a period of several weeks to months, causes
effects in the lung, spleen and liver. The effects may be reversible or irreversible. NOx exposure can lead to
structural changes include a change in cell type in the tracheo-bronchial (levels above 640 µg/m3) and
pulmonary regions to emphysema like effects. Nitrogen dioxide concentrations, as low as 940 µg/m3, can
increase the lungs susceptibility to bacterial and viral infections (WHO, 2000).
Epidemiological studies have been undertaken on the indoor use of gas cooking appliances and health
effects. Studies on adults and children under two years found no association between the use of gas cooking
appliances and respiratory effects. Children aged five to 12 years have a 20% increased risk for respiratory
symptoms and disease for each increase of 28 µg/m3 NO2 concentration, where the weekly average
concentrations are in the range of 15 to 128 µg/m3 (WHO, 2000).
Outdoor studies consistently indicate that children with chronic ambient NO2 exposures exhibit increased
respiratory symptoms that are of a longer duration. However, no evidence is provided for the association of
long-term exposures with health effects in adults (WHO, 2000).
4.3.5 Carbon Monoxide
Carbon monoxide (CO) is one of the most common and widely distributed air pollutants (WHO, 2000). CO is
an odourless, colourless and tasteless gas which has a low solubility in water. The amount of CO varies
largely depending on the metal and the production process. In the human body, CO reaching the lungs
diffuses rapidly across the alveolar and capillary membranes and binds reversibly with the haem proteins.
Approximately 80 to 90% of CO binds to haemoglobin to form carboxyhaemoglobin. This causes a reduction
in the oxygen carrying capacity of the blood, which leads to hypoxia as the body is starved of oxygen.
Acute and chronic exposures
CO exposure can cause severe hypoxia, resulting in the rapid onset of nausea, headaches, vomiting,
muscular weakness, loss of consciousness, shortness of breath and even death. The symptoms
experienced will depend on the exposure concentration and duration. The hypoxia may cause both
reversible, short-lasting neurological deficits and severe, often delayed, neurological damage.
Neurobehavioral effects include impaired co-ordination, tracking, driving ability, vigilance and cognitive ability
(WHO, 2000). High risk individuals to CO exposure include persons with cardiovascular disease (especially
ischemic heart disease), pregnant mothers and the foetus and new-born infants.
4.4 Climate and meteorology
4.4.1 Regional climate
Prima is situated in the subtropical high-pressure belt. The mean circulation of the atmosphere over the
subcontinent is anticyclonic throughout the year (except for near the surface) (Preston-Whyte and Tyson,
1997). The synoptic patterns affecting the typical weather experienced in the region owe their origins to the
subtropical, tropical and temperate features of the general atmospheric circulation over Southern Africa.
The subtropical control is brought via the semi-permanent presence of the South Indian Anticyclone
(HP cell), Continental High (HP cell) and the South Atlantic Anticyclone (LP cell) in the high pressure belt
located approximately 30°S of the equator (Preston-Whyte and Tyson, 1997).
The tropical controls are brought via tropical easterly flows (LP cells) (from the equator to the southern mid-
latitudes) and the occurrence of the easterly wave and lows (Preston-Whyte and Tyson, 1997). The
temperature control is brought about by perturbations in the westerly wave, leading the development of
westerly waves and lows (LP cells) (i.e. cold front from the polar region, moving into the mid-latitudes)
(Preston-Whyte and Tyson, 1997).

PRIMA AIR
March 2017 Report No. 1665711-313101-1 41
Seasonal variations in the positioning and intensity of the HP cells determine the extent to which the westerly
waves and lows impact the atmosphere over the region. In winter, the high pressure belt intensifies and
moves northward while the westerly waves in the form of a succession of cyclones or ridging anticyclones
moves eastwards around the South African coast or across the country. The positioning and intensity of
these systems are thus able to significantly impact the region. In summer, the anticyclonic HP belt weakens
and shifts southwards and the influence of the westerly waves and lows weakens.
Anticyclones (HP cells) are associated with convergence in the upper levels of the troposphere, strong
subsidence throughout the troposphere, and divergence in near the surface of the earth. Air parcel
subsidence, inversions, fine conditions and little to no rainfall occur as a result of such airflow circulation
patterns (i.e. relatively stable atmospheric conditions). These conditions are not favourable for air pollutant
dispersion, especially with regard to those emissions emitted close to the ground.
Westerly waves and lows (LP cells) are characterised by surface convergence and upper-level divergence
that produce sustained uplift, cloud formation and the potential for precipitation. Cold fronts, which are
associated with the westerly waves, occur predominantly during winter. The passage of a cold front is
characterised by pronounced variations in wind direction and speed, temperature, humidity, pressure and
distinctive cloud bands (i.e. unstable atmospheric conditions). These unstable atmospheric conditions bring
about atmospheric turbulence which creates favourable conditions for air pollutant dispersion.
The tropical easterlies and the occurrence of easterly waves and lows affect Southern Africa mainly during
the summer months. These systems are largely responsible for the summer rainfall pattern and the north
easterly wind component that occurs over the region (Preston-Whyte and Tyson, 1988).
In summary, the convective activity associated with the easterly and westerly waves disturbs and hinders the
persistent inversion which sits over Southern Africa. This allows for the upward movement of air pollutants
through the atmosphere leading to improved dispersion and dilution of accumulated atmospheric pollution.
4.4.2 Precipitation
Prima is located in the summer rainfall region of South Africa and thus receives most of its rainfall during the
period of October through to April, with peak precipitation being experienced in December and February
(Figure 13). Average Rainfall of approximately 710mm is experienced annually in the region with significant
inter-annual variations in total rainfall experienced. Rainfall experienced frequently falls in the late-afternoon
in the form of electrical storms (EMM AQMP, 2005).
Precipitation is important in air pollution studies as it represents an effective removal mechanism of
atmospheric pollutants and reduces the erosion potential by increasing the moisture content of erodible
materials.

PRIMA AIR
March 2017 Report No. 1665711-313101-1 42
Figure 13: Precipitation graph for Benoni for the period 2000 to 2012. (World Weather Online, 2016)
4.4.3 Temperature
Ambient air temperature is a key factor affecting both plume buoyancy and the development of mixing and
inversion layers. The greater the difference in temperature between the plume and the ambient air, the
higher the plume is able to rise.
Figure 14 below illustrate the average monthly temperature and humidity at OR Tambo International Airport
for the period January 2005 – December 2010, Based on the observed data from OR Tambo, daily average
summer temperatures range between approximately 190C and 20
0C, while winter temperatures range
between approximately 110C and 13
0C. The relative humidity as depicted in Figure 14 is highest in summer
and spring; and lowest in autumn and winter.
Figure 14: Average Monthly Temperature and Humidity for OR Tambo International Airport for period Jan 2005- Dec 2010 (SAWS)

PRIMA AIR
March 2017 Report No. 1665711-313101-1 43
4.4.4 Boundary layer properties and atmospheric stability
The atmospheric boundary layer constitutes the first few hundred metres of the atmosphere and is directly
affected by the earth’s surface. The earth’s surface affects the boundary layer through the retardation of air
flow created by frictional drag, created by the topography, or as a result of the heat and moisture exchanges
that take place at the surface.
During the day, the atmospheric boundary layer is characterised by thermal heating of the earth’s surface,
converging heated air parcels and the generation of thermal turbulence, leading to the extension of the
mixing layer to the lowest elevated inversion. These conditions are normally associated with elevated wind
speeds, hence a greater dilution potential for the atmospheric pollutants.
During the night, radiative flux divergence is dominant due to the loss of heat from the earth’s surface. This
usually results in the establishment of ground based temperature inversions and the erosion of the mixing
layer. As a result, night-times are characterised by weak vertical mixing and the predominance of a stable
layer. These conditions are normally associated with low wind speeds, hence less dilution potential.
The mixed layer ranges in depth from a few metres during night-times to the base of the lowest elevated
inversion during unstable, daytime conditions. Elevated inversions occur for a variety of reasons, however
typically the lowest elevated inversion on the Highveld is located at a mean height above ground of 1550 m
during winter months with a 78% frequency of occurrence. During summer, the mean subsidence inversion
occurs at about 2 600 m with a 40% frequency. Atmospheric stability is frequently categorised into one of six
stability classes. These are briefly described in Table 23.
The atmospheric boundary layer is normally unstable during the day as a result of the turbulence due to the
sun's heating effect on the earth's surface. The thickness of this mixing layer depends predominantly on the
extent of solar radiation, growing gradually from sunrise to reach a maximum at about 5 - 6 hours after
sunrise. This situation is more pronounced during the winter months due to strong night-time inversions and
a slower developing mixing layer. During the night a stable layer, with limited vertical mixing, exists. During
windy and/or cloudy conditions, the atmosphere is normally neutral.
Table 23: Atmospheric stability classes
Designation Stability Class Atmospheric Condition
A Very unstable Calm wind, clear skies, hot daytime conditions
B Moderately unstable Clear skies, daytime conditions
C Unstable Moderate wind, slightly overcast daytime conditions
D Neutral High winds or cloudy days and nights
E Stable Moderate wind, slightly overcast night-time conditions
F Very stable Low winds, clear skies, cold night-time conditions
For elevated releases, the highest ground level concentrations would occur during unstable, daytime
conditions. The wind speed resulting in the highest ground level concentration depends on the plume
buoyancy. If the plume is considerably buoyant (high exit gas velocity and temperature) together with a low
wind, the plume will reach the ground relatively far downwind. With stronger wind speeds, on the other hand,
the plume may reach the ground closer, but due to the increased ventilation, it would be more diluted. A wind
speed between these extremes would therefore be responsible for the highest ground level concentrations.
In contrast, the highest concentrations for ground level, or near-ground level releases would occur during
weak wind speeds and stable (night-time) atmospheric conditions.
4.4.5 Meteorology
The meteorological overview for Prima was based on the analysis of the MM5 modelled meteorological for
2013 - 2015. The analysis of the data is assumed and expected to be representative of the actual
experienced meteorological conditions on site.

PRIMA AIR
March 2017 Report No. 1665711-313101-1 44
The details of the MM5 data are provided in Table 24.
Table 24: Surface meteorological data details
Station Information
Station/data description
MM5 mesoscale modelled meteorological data;
Format: SAMSON (surface met data for pre-processing by AERMET);
Anemometer height: 14 m;
Base elevation above MSL = 1517 m; and
Output interval: hourly.
Period of record 2013 – 2015.
Data recovery 100%.
Demonstration of spatial and temporal representativeness
Data grid cell centre: - 25.860764, 2 9.160989; and
The use of MM5 data is accepted in terms of the Regulations Regarding Air Dispersion Modelling (GN R.533).
Program and version used to process the data AERMET View 9.1.0.
Method used to replace the missing hours N/A.
Method used to handle calm N/A.
4.4.5.1 Wind rose for the modelled period
Wind roses summarise the occurrence of winds at a specified location via representing their strength,
direction and frequency. Calm conditions are defined as wind speeds of less than 1 m/s which are
represented as a percentage of the total winds in the centre circle. Each directional branch on a wind rose
represents wind originating from that specific cardinal direction (16 cardinal directions). Each cardinal branch
is divided into segments of different colours which represent different wind speed classes. For the current
wind roses, wind speed is represented in classes, 1 to 2 m/s in blue, 2 to 4 m/s in green, 4 to 6 m/s in yellow
6 to 10 m/s in orange and > 10 m/s in red. Each dotted circle represents a percentage frequency of
occurrence.
North-north-westerly to north-north-easterly winds are expected to be dominant at Prima. Wind speeds are
generally low to moderate with 10 % calms conditions (<1 m/s) (Figure 15).

PRIMA AIR
March 2017 Report No. 1665711-313101-1 45
Figure 15: Modelled Prima wind rose for 2013-2015.

PRIMA AIR
March 2017 Report No. 1665711-313101-1 46
4.4.5.1.1 Diurnal wind roses
A minor diurnal variation in winds is observed (Figure 16). During the early morning, winds from the north to
north-north-easterly sectors are anticipated to be dominant. During the day winds from the north-north-west
to north-north-easterly sectors are anticipated to be dominant. During the afternoon winds from the north-
west to northerly sectors are anticipated to be dominant while in the evening, winds from the north-north-
west to the north-north-easterly sectors are anticipated to be dominant.
Early Morning (00:00 - 05:59)
Winds dominate from the N to NNE sector
Morning (06:00 - 11:59)
Winds dominate from the NNW to NNE sector
Afternoon (12:00 - 17:59)
Winds dominate from the NW to N sector
Evening (18:00 - 23:59)
Winds dominate from the NNW to NNE sector
Figure 16: Modelled diurnal wind roses for the Prima with predominant wind directions for 2013-2015
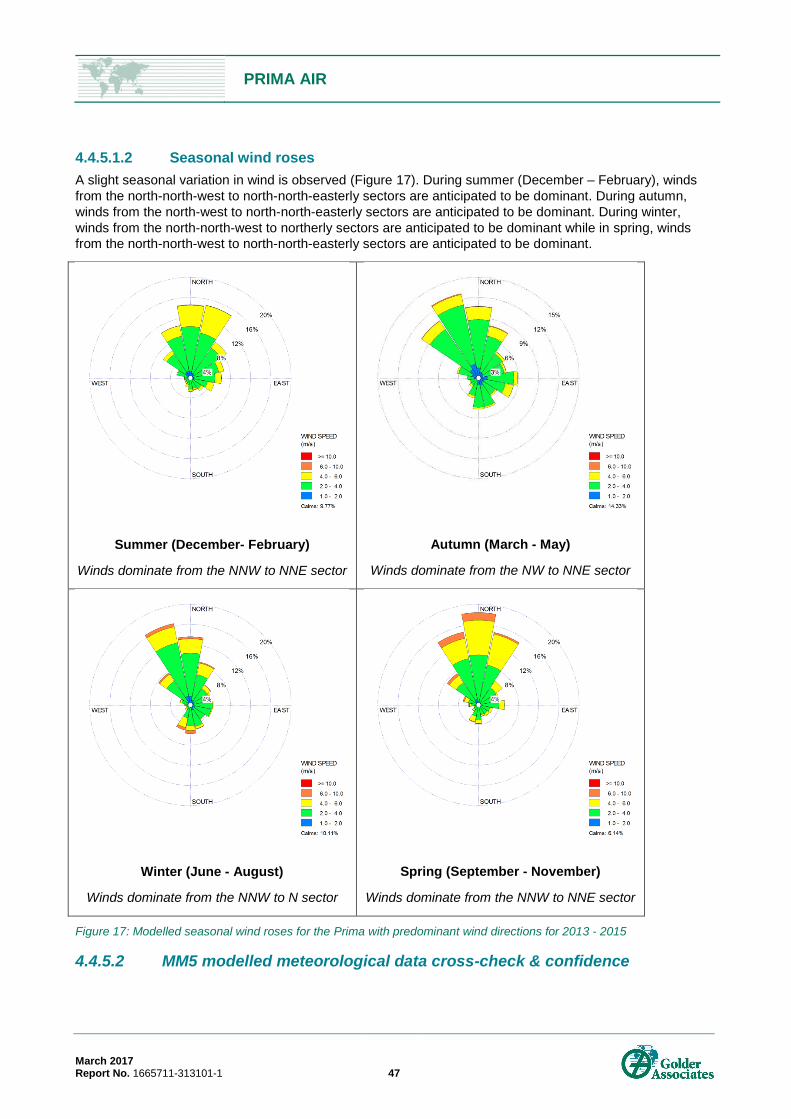
PRIMA AIR
March 2017 Report No. 1665711-313101-1 47
4.4.5.1.2 Seasonal wind roses
A slight seasonal variation in wind is observed (Figure 17). During summer (December – February), winds
from the north-north-west to north-north-easterly sectors are anticipated to be dominant. During autumn,
winds from the north-west to north-north-easterly sectors are anticipated to be dominant. During winter,
winds from the north-north-west to northerly sectors are anticipated to be dominant while in spring, winds
from the north-north-west to north-north-easterly sectors are anticipated to be dominant.
Summer (December- February)
Winds dominate from the NNW to NNE sector
Autumn (March - May)
Winds dominate from the NW to NNE sector
Winter (June - August)
Winds dominate from the NNW to N sector
Spring (September - November)
Winds dominate from the NNW to NNE sector
Figure 17: Modelled seasonal wind roses for the Prima with predominant wind directions for 2013 - 2015
4.4.5.2 MM5 modelled meteorological data cross-check & confidence
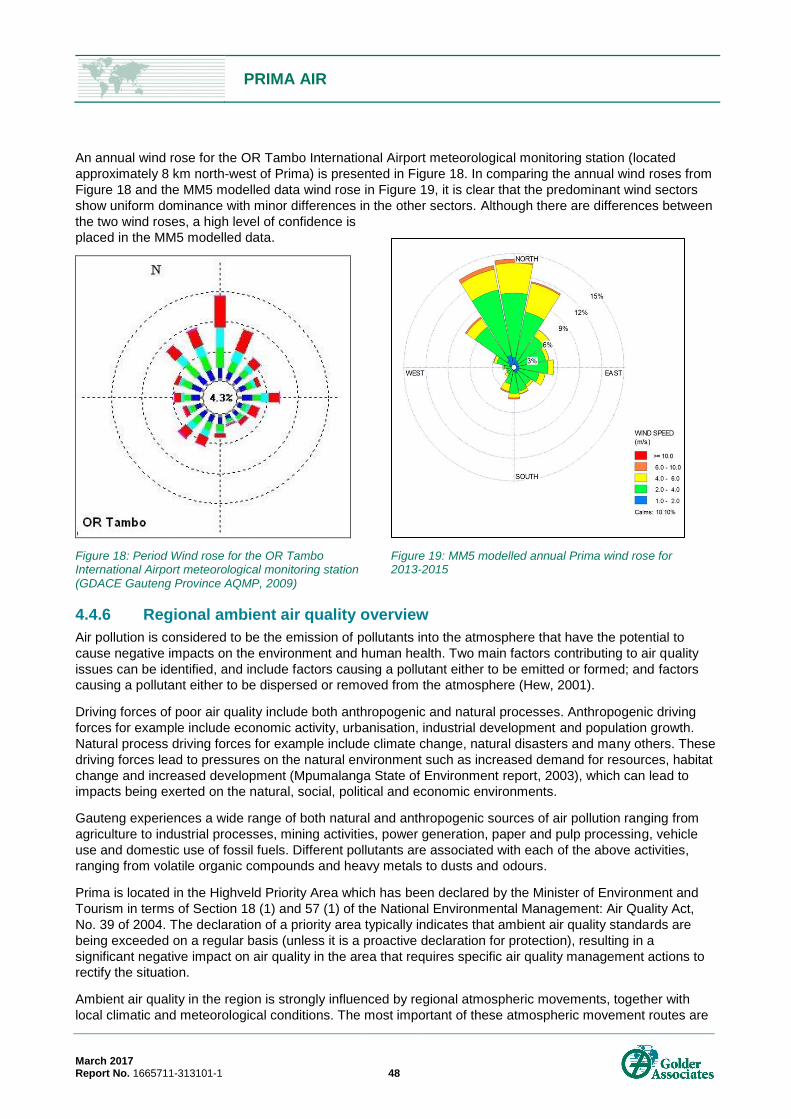
PRIMA AIR
March 2017 Report No. 1665711-313101-1 48
An annual wind rose for the OR Tambo International Airport meteorological monitoring station (located
approximately 8 km north-west of Prima) is presented in Figure 18. In comparing the annual wind roses from
Figure 18 and the MM5 modelled data wind rose in Figure 19, it is clear that the predominant wind sectors
show uniform dominance with minor differences in the other sectors. Although there are differences between
the two wind roses, a high level of confidence is
placed in the MM5 modelled data.
Figure 18: Period Wind rose for the OR Tambo International Airport meteorological monitoring station (GDACE Gauteng Province AQMP, 2009)
4.4.6 Regional ambient air quality overview
Air pollution is considered to be the emission of pollutants into the atmosphere that have the potential to
cause negative impacts on the environment and human health. Two main factors contributing to air quality
issues can be identified, and include factors causing a pollutant either to be emitted or formed; and factors
causing a pollutant either to be dispersed or removed from the atmosphere (Hew, 2001).
Driving forces of poor air quality include both anthropogenic and natural processes. Anthropogenic driving
forces for example include economic activity, urbanisation, industrial development and population growth.
Natural process driving forces for example include climate change, natural disasters and many others. These
driving forces lead to pressures on the natural environment such as increased demand for resources, habitat
change and increased development (Mpumalanga State of Environment report, 2003), which can lead to
impacts being exerted on the natural, social, political and economic environments.
Gauteng experiences a wide range of both natural and anthropogenic sources of air pollution ranging from
agriculture to industrial processes, mining activities, power generation, paper and pulp processing, vehicle
use and domestic use of fossil fuels. Different pollutants are associated with each of the above activities,
ranging from volatile organic compounds and heavy metals to dusts and odours.
Prima is located in the Highveld Priority Area which has been declared by the Minister of Environment and
Tourism in terms of Section 18 (1) and 57 (1) of the National Environmental Management: Air Quality Act,
No. 39 of 2004. The declaration of a priority area typically indicates that ambient air quality standards are
being exceeded on a regular basis (unless it is a proactive declaration for protection), resulting in a
significant negative impact on air quality in the area that requires specific air quality management actions to
rectify the situation.
Ambient air quality in the region is strongly influenced by regional atmospheric movements, together with
local climatic and meteorological conditions. The most important of these atmospheric movement routes are
Figure 19: MM5 modelled annual Prima wind rose for 2013-2015

PRIMA AIR
March 2017 Report No. 1665711-313101-1 49
the direct transport towards the Indian Ocean and the recirculation over the sub-continents (Scholes, 2002)
(Figure 20). It is these climatic conditions and circulation movements that are responsible for the distribution
and dispersion of air pollutants within Gauteng and between neighbouring provinces and countries bordering
South Africa.
Gauteng experiences distinct weather patterns in summer and winter that affect the dispersal of pollutants in
the atmosphere. In summer, unstable atmospheric conditions result in mixing of the atmosphere and rapid
dispersion of pollutants. Summer rainfall also aids in removing pollutants through wet deposition. In contrast,
winter is characterised by atmospheric stability caused by a persistent high pressure system over South
Africa. This dominant high pressure system results in subsidence, causing clear skies and a pronounced
temperature inversion over the Highveld. This inversion layer traps the pollutants in the lower atmosphere,
which results in reduced dispersion and a poorer ambient air quality. Preston-Whyte and Tyson (1988)
describe the atmospheric conditions in the winter months as highly unfavourable for the dispersion of
atmospheric pollutants.
Plumes emitted at night from stacks during stable
conditions can be transported up to thousands of
kilometres downwind of the source before reaching
ground level in a well diluted state. During day-time
however, strong convection currents transport
plumes upward and downward whilst drifting
downwind (Mpumalanga State of Environment
report, 2003). Pollutants thus reach ground level
close to the point source of emission and are well
diluted due to convective mixing (Turner, 2001).
Emissions at low levels (such as from mine residue
deposits, households or vehicles) do not disperse
much at night because of the atmospheric stability,
resulting in high concentrations of pollutants at
ground level despite the relatively low emissions
quantities.
During the day, these low level emissions are readily mixed into the convective layer close to the earth’s
surface (Turner, 2001), which results in lower concentrations of pollutants at ground level and better air
quality.
4.4.7 Ambient Air Quality Monitoring in Ekurhuleni
Ambient air quality monitoring in the Ekurhuleni Metropolitan Municipality (EMM) comprises multiple
standalone monitoring networks owned and operated by EMM, Airkem, SAWS (meteorological stations) and
several industries (Scaw Metals, Ergo, Consolidated Modderfontein Mines).The Ekurhuleni monitoring
station Wattville has been identified as the closest station to Prima. The Wattville data presented in the
sections below was obtained from SAAQIS for the period January 2014 to January 2016. The data recovery
levels from this station appear to be low (< 80%) as several gaps in the data have been observed across all
pollutants. Interpretations based on this data must thus be viewed with caution. In Figure 21, Figure 22 and
Figure 23, the blue lines represent the atmospheric parameters while the red line indicates the national
standard limit.
4.4.7.1 Regional ambient SO2 concentrations
Ambient daily average SO2 concentrations in the region were found to exceed the national SO2 daily average
standard (48 ppb) on one occasion during the monitoring period (Figure 21).
Figure 20: The main transport pathways out of the Highveld, (Scholes, 2002)

PRIMA AIR
March 2017 Report No. 1665711-313101-1 50
Figure 21: Ambient SO2 daily average concentrations from the Wattville station for 1 January 2014 to 1 January 2016 (SAAQIS, November 2016)
4.4.7.2 Regional ambient fine particulate concentrations (PM10)
Ambient daily average PM10 concentrations in the region were found exceed the national PM10 daily average
standard (75µg/m3) on multiple occasions throughout the monitoring period (Figure 22). (Note: this data
should be viewed with caution as it does not meet the 80% data recovery required by SANAS for data
interpretation and manipulation).
Figure 22: Ambient PM10 daily averages concentrations from the Wattville station for 1 January 2014 to 1 January 2016 (SAAQIS, April 2016)

PRIMA AIR
March 2017 Report No. 1665711-313101-1 51
4.4.7.3 Regional ambient NO2 concentrations
Ambient hourly average NO2 concentrations in the region were found to exceed the national NO2 hourly
average standard (106 ppb) on one occasion during 2014 (Figure 23). (Note: The data presented in
Figure 23 was only continuous for approximately ten months and therefore should be viewed with caution).
Figure 23: Ambient NO2 hourly averages concentrations from the Wattville station for 1 January 2014 to 1 January 2016 (SAAQIS, April 2016)
4.4.8 Emissions monitoring
The objective of the measurement program undertaken by Rayten for Prima on behalf of Golder was to
quantify the following parameters and emissions4:
Particulate Matter (PM);
Sulphur Dioxide (SO2);
Nitrogen Dioxide (NOx expressed as NO2);
Gas velocity;
Gas volumetric flow rate;
Gas temperature;
Gas static and absolute pressure; and
Moisture Content.
The following stacks were monitored:
Prima Silica Stack;
F-A1 Stack;
4 Golder (2016) Stack Emissions Survey Report (1662740-308952-1)

PRIMA AIR
March 2017 Report No. 1665711-313101-1 52
F-A2 Stack; and
Short extraction stack (F-10).
The summary of the results obtained from the survey are tabulated in Table 25 below.
Table 25: Summary of results for Prima’s Stack Emission Survey (Golder, 2016)
Pollutants AEL emissions limits (mg/Nm
3)
Average sampled (mg/Nm3)
Prima Silica Stack F-A1 Stack F-A2 Stack Short Extraction Stack (F-10)
PM 30 16.80 2.50 4.80 28.60
SO2 400 0.00 0.00 0.00 0.00
NOx 400 2.43 0.00 0.00 0.00
4.4.9 Local sources of emissions
Potential sources of air pollution within vicinity of the Prima have been identified to include:
Domestic fuel burning;
Industrial and commercial fuel burning;
Vehicle exhaust emissions and petrol stations (fuel storage);
Brakpan Airfield;
Agricultural activities;
Mining and related activities (Old mines); and
Industrial emissions associated with various stack, vent and fugitive emissions.
Summary of the identified pollutants and their associated sources within the EMM are provided in Table 26.
Additional detail in regards to the emissions contribution from these identified sources is further discussed in
the sections that follow.
Table 26: Sources and priority pollutants within the EMM (EMM AQMP, 2005)
Source
Part
icu
late
matt
er
Su
lph
ur
dio
xid
e
Oxid
es o
f
Nit
rog
en
Carb
on
mo
no
xid
e
Carb
on
dio
xid
e
Meth
an
e
Hazard
ou
s a
ir
po
llu
tan
ts
PM SO2 NOx CO CO2 CH4 HAP
Vehicle-tailpipe emissions x x x x x x x
Industrial operations, energy generation and commercial fuel burning appliances
x x x x x x x
Domestic fuel burning x x x x x x x
Aviation emissions x x x x x x x
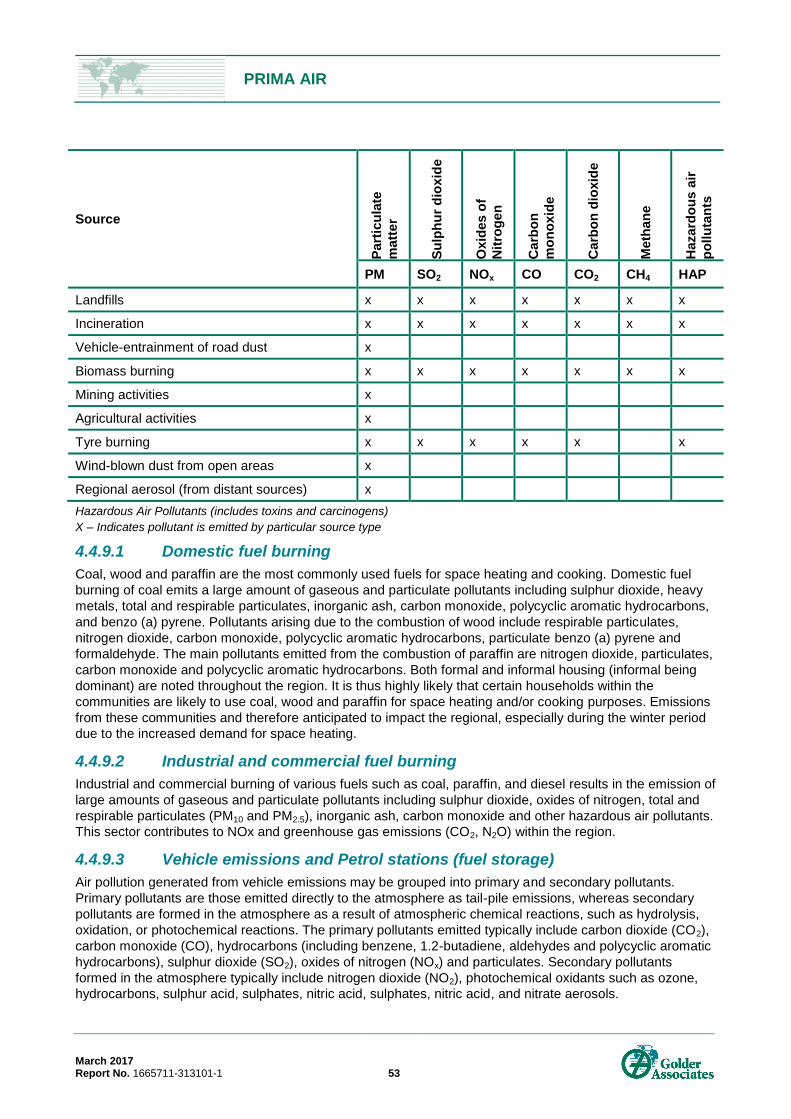
PRIMA AIR
March 2017 Report No. 1665711-313101-1 53
Source
Part
icu
late
matt
er
Su
lph
ur
dio
xid
e
Oxid
es o
f
Nit
rog
en
Carb
on
mo
no
xid
e
Carb
on
dio
xid
e
Meth
an
e
Hazard
ou
s a
ir
po
llu
tan
ts
PM SO2 NOx CO CO2 CH4 HAP
Landfills x x x x x x x
Incineration x x x x x x x
Vehicle-entrainment of road dust x
Biomass burning x x x x x x x
Mining activities x
Agricultural activities x
Tyre burning x x x x x
x
Wind-blown dust from open areas x
Regional aerosol (from distant sources) x
Hazardous Air Pollutants (includes toxins and carcinogens)
X – Indicates pollutant is emitted by particular source type
4.4.9.1 Domestic fuel burning
Coal, wood and paraffin are the most commonly used fuels for space heating and cooking. Domestic fuel
burning of coal emits a large amount of gaseous and particulate pollutants including sulphur dioxide, heavy
metals, total and respirable particulates, inorganic ash, carbon monoxide, polycyclic aromatic hydrocarbons,
and benzo (a) pyrene. Pollutants arising due to the combustion of wood include respirable particulates,
nitrogen dioxide, carbon monoxide, polycyclic aromatic hydrocarbons, particulate benzo (a) pyrene and
formaldehyde. The main pollutants emitted from the combustion of paraffin are nitrogen dioxide, particulates,
carbon monoxide and polycyclic aromatic hydrocarbons. Both formal and informal housing (informal being
dominant) are noted throughout the region. It is thus highly likely that certain households within the
communities are likely to use coal, wood and paraffin for space heating and/or cooking purposes. Emissions
from these communities and therefore anticipated to impact the regional, especially during the winter period
due to the increased demand for space heating.
4.4.9.2 Industrial and commercial fuel burning
Industrial and commercial burning of various fuels such as coal, paraffin, and diesel results in the emission of
large amounts of gaseous and particulate pollutants including sulphur dioxide, oxides of nitrogen, total and
respirable particulates (PM10 and PM2.5), inorganic ash, carbon monoxide and other hazardous air pollutants.
This sector contributes to NOx and greenhouse gas emissions (CO2, N2O) within the region.
4.4.9.3 Vehicle emissions and Petrol stations (fuel storage)
Air pollution generated from vehicle emissions may be grouped into primary and secondary pollutants.
Primary pollutants are those emitted directly to the atmosphere as tail-pile emissions, whereas secondary
pollutants are formed in the atmosphere as a result of atmospheric chemical reactions, such as hydrolysis,
oxidation, or photochemical reactions. The primary pollutants emitted typically include carbon dioxide (CO2),
carbon monoxide (CO), hydrocarbons (including benzene, 1.2-butadiene, aldehydes and polycyclic aromatic
hydrocarbons), sulphur dioxide (SO2), oxides of nitrogen (NOx) and particulates. Secondary pollutants
formed in the atmosphere typically include nitrogen dioxide (NO2), photochemical oxidants such as ozone,
hydrocarbons, sulphur acid, sulphates, nitric acid, sulphates, nitric acid, and nitrate aerosols.

PRIMA AIR
March 2017 Report No. 1665711-313101-1 54
The quantity of pollutants emitted by a vehicle depends on specific vehicle related factors such as vehicle
weight, speed and age; fuel-related factors such as fuel type (petroleum or diesel), fuel formulation (oxygen,
sulphur, benzene and lead replacement agents) and environmental factors such as altitude, humidity and
temperature (Samaras and Sorensen, 1999).
Taking into consideration that the study area is an industrial hub and a gateway for travel from Africa to the
rest of the world, the study area has very high traffic as confirmed by the present Arterial roads. Vehicle
emissions both light passenger and industrial vehicles and machinery engines have a significant contribution
to the regional ambient air quality. In addition, the airport is also a major contributor to vehicle emissions in
the area.
Petrol stations release VOC’s on a constant basis however the release is elevated during filling of the petrol
storage tanks and vehicle tanks. VOC compounds contribute to the creation of ozone in the lower layers of
the atmosphere. The work carried out by Karakitsios et al. (2007) concluded that petrol stations make a
significant contribution to ambient benzene concentration in their vicinity. When the petrol station is
surrounded by roads with intense traffic, the emissions from the petrol station are not as important as those
coming from vehicle combustion. If the petrol station emissions are mixing with relatively clean air the typical
n-hexane/benzene ratio from these stations changes more slowly (Terres et al., 2010).
4.4.9.4 Brakpan Airfield
Brakpan Airfield emissions are expected to contribute to NO2 health threshold exceedances in its vicinity.
The airport is also anticipated to release significant amount of CO2 and CO. Although in smaller quantities,
emissions of VOC’s, SO2, non-methane VOCs, CH4, and particulate matter are also associated with the
airport activities.
Given the presence of the Brakpan Airfield and population densities in the region surrounding Prima, it is
anticipated that emissions of trace gas pollutants may be of a concern to the regional ambient air quality.
4.4.9.5 Industrial emissions associated with various stack, vent and fugitive emissions
Heavy industry in this region is also recognised as a key source of emissions. Industrial emissions include
pollutants such as particulates (TSP, PM10 & PM2.5), CO2, CO, hydrocarbons (including benzene, 1.2-
butadiene, aldehydes and polycyclic aromatic hydrocarbons), SO2, NO2, NOx and SOx, VOCs (list not
exhaustive). These industrial emissions are widely recognised as having a significant adverse effect on both
the local and regional ambient air quality.
4.4.9.6 Mining and related activities
Dust emissions may be generated by wind erosion from waste rock dumps, tailings facilities (slimes dams,
ash dumps etc.), open mining pits, unpaved mine access roads and other exposed areas. In addition, dust
fallout and inhalable particulate emissions within the mining sector are generated due to aeolian action on
exposed storage piles, material transfer activities, vehicle entrainment, drilling and blasting operations and
various other process related emissions.
Dust emissions occur when the threshold wind speed is exceeded (Cowherd et al., 1988). Factors which
influence the rate of wind erosion include surface compaction, moisture content, vegetation, shape of
storage pile, particle size distribution, wind speed and rain. Dust generated by these sources is termed
‘fugitive dust’ as it is not emitted to the atmosphere in a confined flow stream (USEPA, 1995). These
emissions are often difficult to quantify as they are very diffuse, variable and intermittent (Ministry of the
Environment, 2001). Fugitive dusts generated from mining activities in the region are anticipated to be one of
the dominant emission sources in the region. Emissions from these mining activities are anticipated to impact
the regional ambient air quality.
4.4.9.7 Agricultural activities
Emissions from agricultural activities are difficult to control due to the seasonality of emissions and the large
surface area producing emissions (USEPA, 1995).

PRIMA AIR
March 2017 Report No. 1665711-313101-1 55
NH3 and H2S emissions are also generated due to agricultural activities related to animal husbandry,
particularly malodours from feeding and cleaning of animals (USEPA, 1996).
Agricultural emissions are not anticipated to significantly influence the air quality in the area although
particulate emissions may increase during the winter period due to seasonal wild fires on fallow farmlands
and during periods when large scale field ploughing is undertaken.
4.5 Emissions inventory
The theoretical emissions rates for the Prima foundry are listed in Table 28. The following assumptions were
made in the development of the Prima emissions inventory:
Under the ‘worst case scenario’ all emissions are emitted at the maximum legislated concentration for
foundries in terms of NEM: AQA Subcategory 4.10;
All particulate matter emitted from the stacks is PM10;
SO2 and NO2 emissions are only generated by the furnaces (i.e. not from sand recovery, shake-out or
finishing);
Where gas exit temperatures were not known or process dependent, an assumed temperature of 35°C
was used; and
Fugitive PM10 emissions from the unpaved road and storage areas (as detailed in section 3.4) were
calculated using the NPi Emissions Factor: 0.2 kg/ha/hr.
It must be noted that, based on the results from the stack emissions monitoring undertaken in 2016, the use
of the maximum legislated concentrations to predict ground level concentrations is considered to be a highly
conservative approach, particularly for SO2 and NO2 (Table 27).
Table 27: Comparison between the legislated maximum emissions rate and the actual rates measured during Prima’s Stack Emission Survey (Golder, 2016)
Pollutants Maximum emissions used in the calculation of Pima’s emissions rates (mg/Nm
3)
Actual average sampled emissions (mg/Nm3)
Prima Silica Stack
F-A1 Stack F-A2 Stack Short Extraction Stack (F-10)
PM 30 16.80 2.50 4.80 28.60
SO2 400 0.00 0.00 0.00 0.00
NOx 400 2.43 0.00 0.00 0.00

PRIMA AIR
March 2017 Report No. 1665711-313101-1 56
Table 28: Emissions inventory for the Prima facility
Emissions Points
Height of release above ground (m)
Diameter at stack tip/vent exit (m)
Actual gas exit temperature (°C)
Actual Gas Volumetric Flow (m³/hr)
PM (assuming all is PM10)
SO2 NOx (assuming all is NO2)
mg/Nm3 g/s mg/Nm
3 g/s mg/Nm
3 g/s
AD Foundry
F-A1 Stack 12.2 0.57 36 13644 30 0.104 400 1.389 400 1.389
F-A2 Stack 12.2 0.95 25 49428 30 0.377 400 5.031 400 5.031
AD-SR stack 2.0 0.75 35 5040 30 0.038 N/A N/A N/A N/A
Silica Sand Foundry
Prima Silica Stack (F-C and F-D emissions)
12.4 1.06 40 13644 30 0.104 400 1.389 400 1.389
Silica Shake-out Stack 4.4 1.50 35 83000 30 0.634 N/A N/A N/A N/A
Silica-SR Stack 3.0 1.20 35 45000 30 0.344 N/A N/A N/A N/A
Resin Sand Foundry
Short stack (F-10 stack) 2.6 0.59 29 22248 30 0.170 400 2.265 400 2.265
Resin-SR and Shake-out stack 4.0 1.30 35 79200 30 0.605 N/A N/A N/A N/A
Resin Secondary SR stack 2.0 0.70 35 12100 30 0.092 N/A N/A N/A N/A
Fettling
Silica shot blast stack 6 0.75 50 20000 30 0.15269 N/A N/A N/A N/A
Shot blast stack 2.1 1.40 Ambient 9324 30 0.071 N/A N/A N/A N/A
Grinder-Crusher stack 7.0 0.85 Ambient 57600 30 0.440 N/A N/A N/A N/A
Grinder-Fettling stack 3.4 1.30 Ambient 54000 30 0.412 N/A N/A N/A N/A

PRIMA AIR
March 2017 Report No. 1665711-313101-1 57
4.6 Dispersion simulations
4.6.1 Model settings
A summary of the model settings used in this assessment is provided in Table 29.
Table 29: Summary of model settings
Parameter Setting
Terrain settings (simple, flat, elevated) Elevated
Urban sector
Bowen ratio 1.625
Surface albedo 0.2075
Surface roughness 1
Flag pole height 1.5 m
Building downwash N/A
Chemical transformations N/A
4.6.2 Receptors
The location of the grid receptors is provided in Table 30. Discrete receptors used in the simulations are
listed in APPENDIX B.
Table 30: Grid receptor locations
Distance from source Receptor grid
2 km 50 m
5 km 100 m
10 km 250 m
20 km 1 000 m
40 km 2 000 m
4.6.3 Dispersion plots
4.6.3.1 Particulate matter
Simulated PM10 concentration maximums are provided in Table 31 and Table 32. The dispersion plots for
each of the modelled pollutants are provided in the Figures that follow.
‘Worst case scenario’ daily (Figure 24) and annual (Figure 26) average ambient PM10 concentrations exceed
the NAAQS by up two and a half times within 50 m of the Prima boundary. Figure 25 indicates the
acceptable frequency of exceedance (i.e. 4 times per annum) is exceeded only up to approximately 500 m
from the Prima fence line.
The predicted maximum daily and annual average ambient PM10 concentrations at an identified receptor
remain well below the NAAQS at 29% and 15% of the NAAQS respectively.
It must be noted that these simulations are theoretical and are based on the assumption that the Prima
foundries are emitting the maximum allowable PM concentrations as stipulated in NEM: AQA Subcategory
4.10. Additional simulations were therefore run based on the actual measured emissions survey results for
the furnace stacks only5. The results of these simulations are presented in Figure 27 and Figure 28.
The simulations show daily average concentrations are compliant and reach a maximum of 41 µg/m3 (55% of
the NAAQS) within 50 m of the Prima boundary. Similarly annual average concentrations are compliant and
reach a maximum of 23 µg/m3 (58% of the NAAQS) within 50 m of the Prima boundary.
5 Note: Emissions from the shake-out stations, sand recovery points, fettling and fugitive sources were not included in this simulation.

PRIMA AIR
March 2017 Report No. 1665711-313101-1 58
Table 31: Simulated PM10 maximums
Pollutant Averaging period
Concentration µg/m
3
% of the NAAQS
X Y Elevation Grid resolution
PM10
24 hour (daily)
194 259% 629204.5 7100824.5 1 650 50 m
Annual 52 130%
Table 32: Simulated PM10 maximums at an identified discrete receptor
Pollutant Averaging period
Concen-tration µg/m
3
% of the NAAQS
X Y Receptor Elevation Grid resolution
PM10
24 hour (daily)
22 29% 629804 7100007 (# 14) New Kleinfontein Residential
1 660 50 m
Annual 6 15% 628982 7100063 (# 2) Ephes Mamkeli Secondary
1 652 50 m

PRIMA AIR
March 2017 Report No. 1665711-313101-1 59
Figure 24: Simulated daily average ambient PM10 concentrations
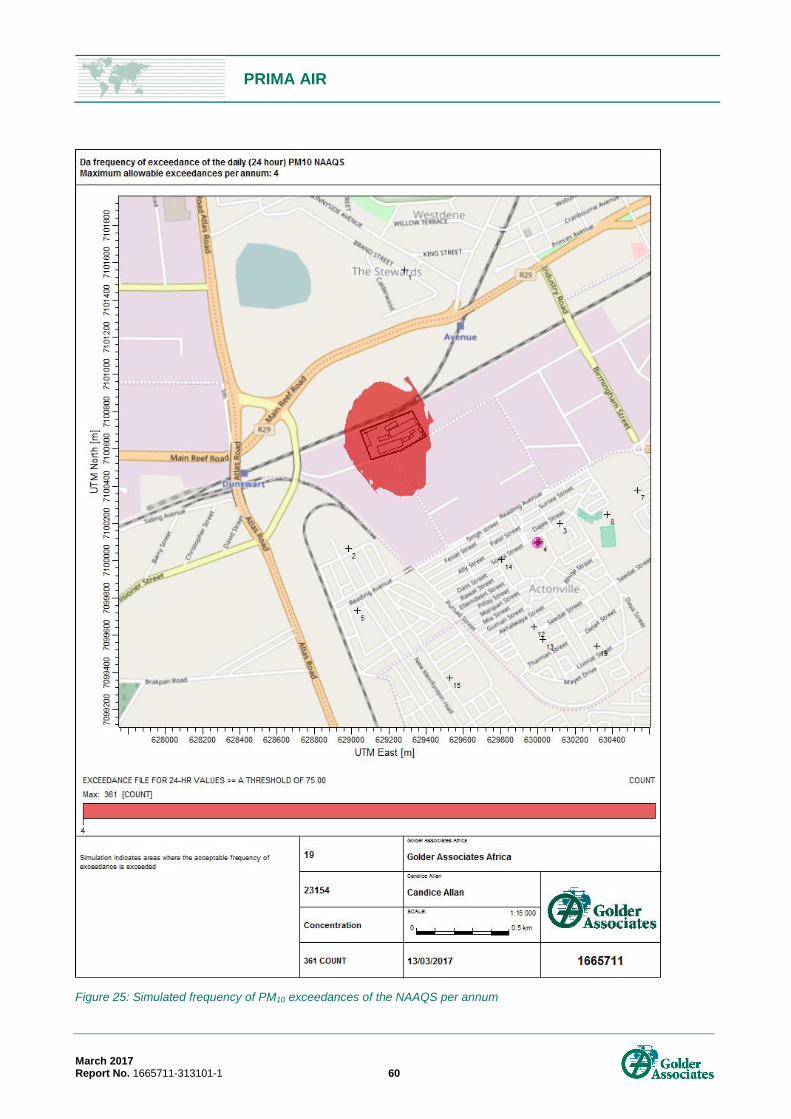
PRIMA AIR
March 2017 Report No. 1665711-313101-1 60
Figure 25: Simulated frequency of PM10 exceedances of the NAAQS per annum
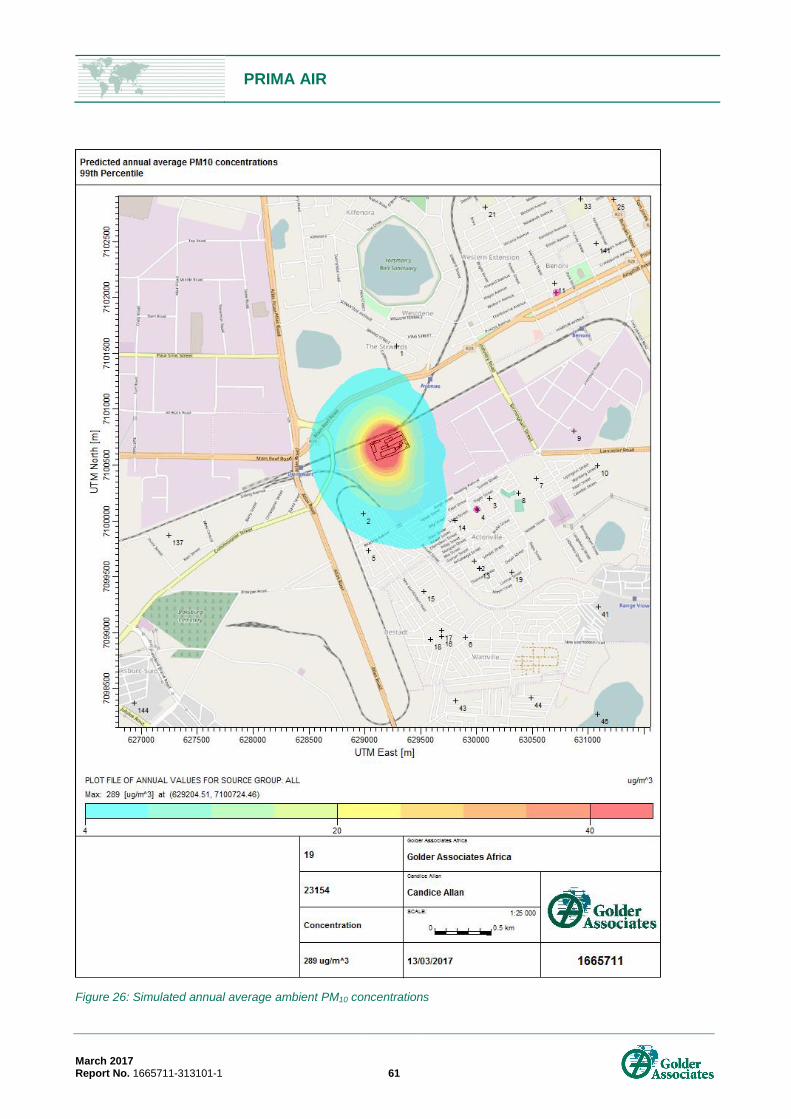
PRIMA AIR
March 2017 Report No. 1665711-313101-1 61
Figure 26: Simulated annual average ambient PM10 concentrations
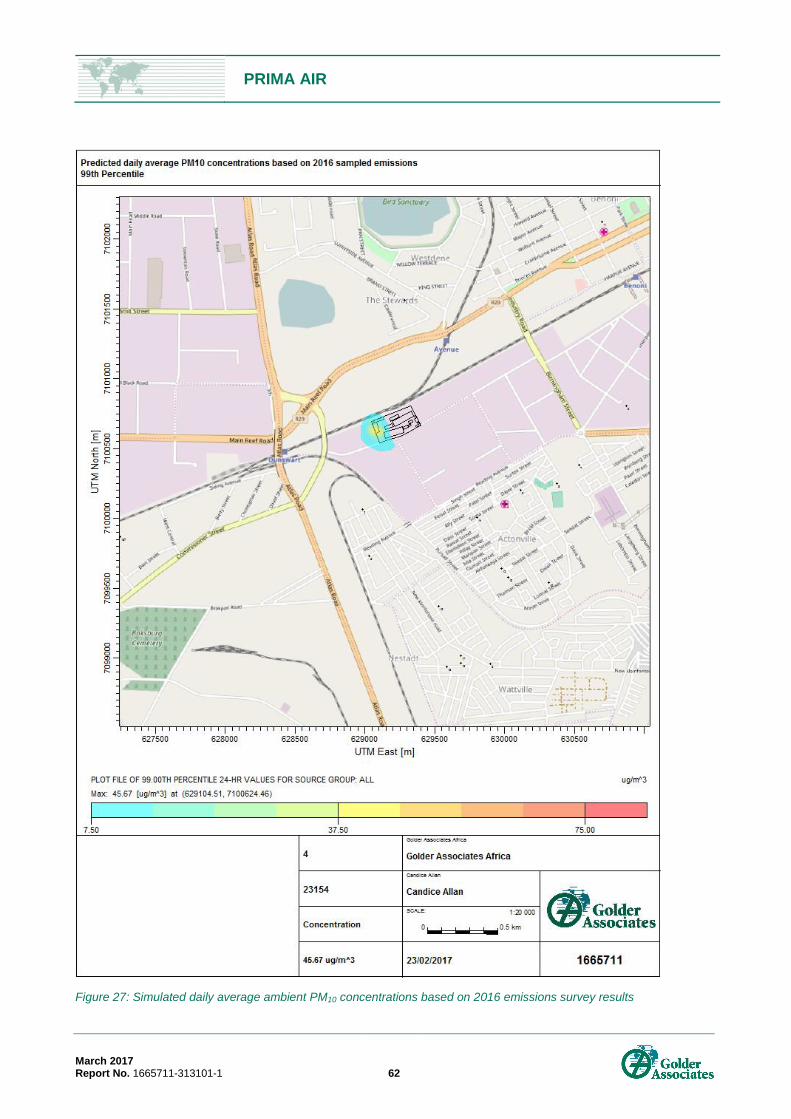
PRIMA AIR
March 2017 Report No. 1665711-313101-1 62
Figure 27: Simulated daily average ambient PM10 concentrations based on 2016 emissions survey results

PRIMA AIR
March 2017 Report No. 1665711-313101-1 63
Figure 28: Simulated annual average ambient PM10 concentrations based on 2016 emissions survey results

PRIMA AIR
March 2017 Report No. 1665711-313101-1 64
4.6.3.2 Sulphur dioxide
Simulated SO2 concentration maximums are provided in Table 33 and Table 34. The dispersion plots for
each of the modelled pollutants are provided in the Figures that follow.
Hourly average ambient SO2 concentrations (Figure 29) exceed the NAAQS by up to 4 times within 50 m of
the Prima boundary. Figure 30 indicates the concentrations reach compliance at 500 m from the boundary.
Daily average ambient SO2 concentrations (Figure 31) exceed the NAAQS by up to 6 times within 50 m of
the Prima boundary. Figure 32 indicates the concentrations reach compliance at 400 m from the boundary.
Annual average ambient SO2 concentrations exceed the NAAQS by up to 7 times within 50 m of Prima
(Figure 33). The SO2 concentrations reach compliance at 400 m from the boundary.
The maximum hourly, daily and annual average ambient SO2 concentrations at an identified receptor remain
below the NAAQS at 39%, 36% and 30% of the NAAQS respectively.
It must be noted that these simulations are theoretical and are based on the assumption that the Prima
foundries are emitting the maximum allowable SO2 concentrations as stipulated in NEM: AQA Subcategory
4.10. Based on the 2016 emissions survey, however, current Prima SO2 emission concentrations are
negligible and are therefore anticipated to have little to no impact on the ambient air quality
(See section 4.4.8).
Table 33: Simulated SO2 maximums
Pollutant Averaging period
Concentration µg/m
3
% of the NAAQS
X Y Elevation Grid resolution
SO2
1 hour 1 543 441%
629054 7100624 1 651 50 m 24 hour (daily)
762 610%
Annual 379 758%
Table 34: Simulated SO2 maximums at an identified discrete receptor
Pollutant Averaging period
Concentration µg/m
3
% of the NAAQS
X Y Receptor Elevation Grid resolution
PM10
1 hour 136 39%
628982 7100063 (#2) Ephes Mamkeli Secondary
1 652 50 m 24 hour (daily)
45 36%
Annual 15 30%
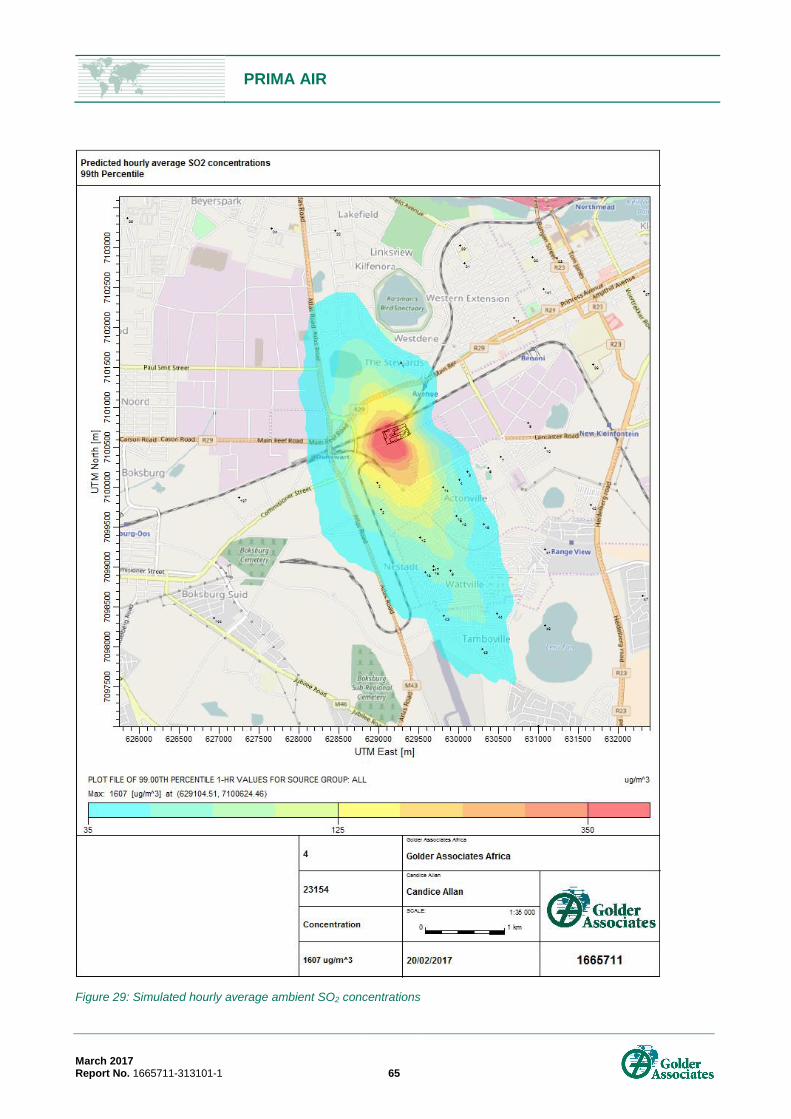
PRIMA AIR
March 2017 Report No. 1665711-313101-1 65
Figure 29: Simulated hourly average ambient SO2 concentrations

PRIMA AIR
March 2017 Report No. 1665711-313101-1 66
Figure 30: Simulated frequency of hourly SO2 exceedances of the NAAQS per annum
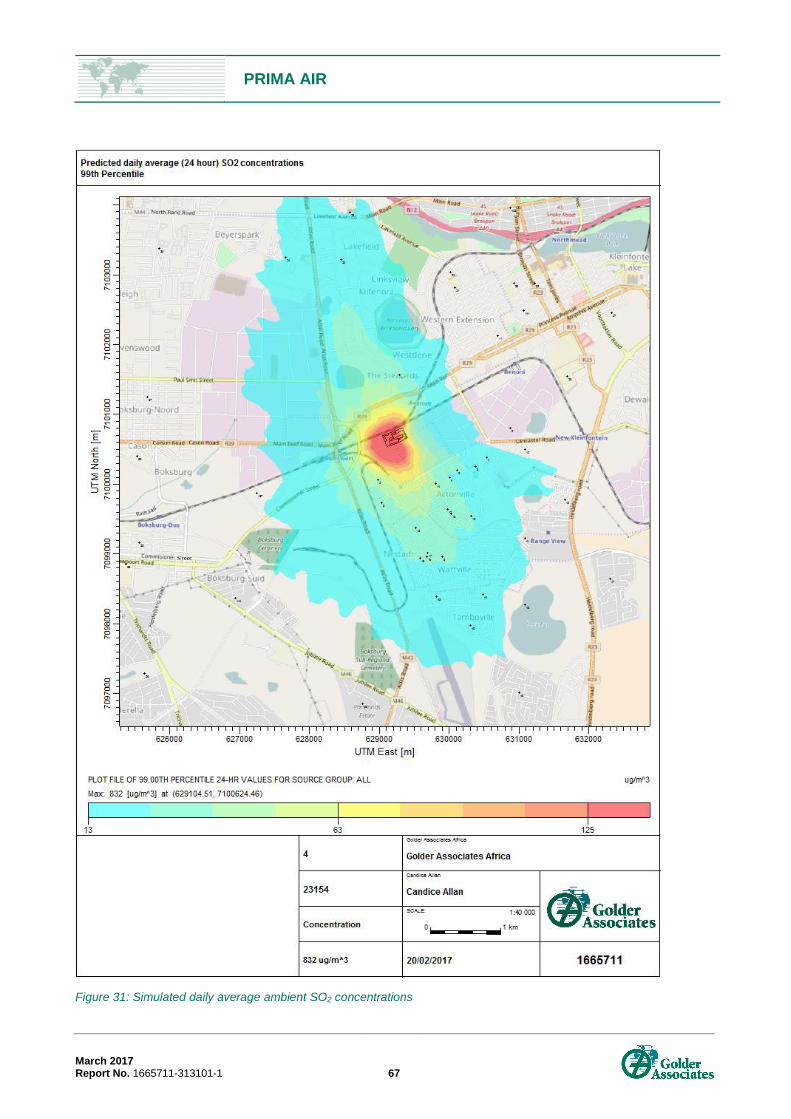
PRIMA AIR
March 2017 Report No. 1665711-313101-1 67
Figure 31: Simulated daily average ambient SO2 concentrations

PRIMA AIR
March 2017 Report No. 1665711-313101-1 68
Figure 32: Simulated frequency of daily SO2 exceedances of the NAAQS per annum
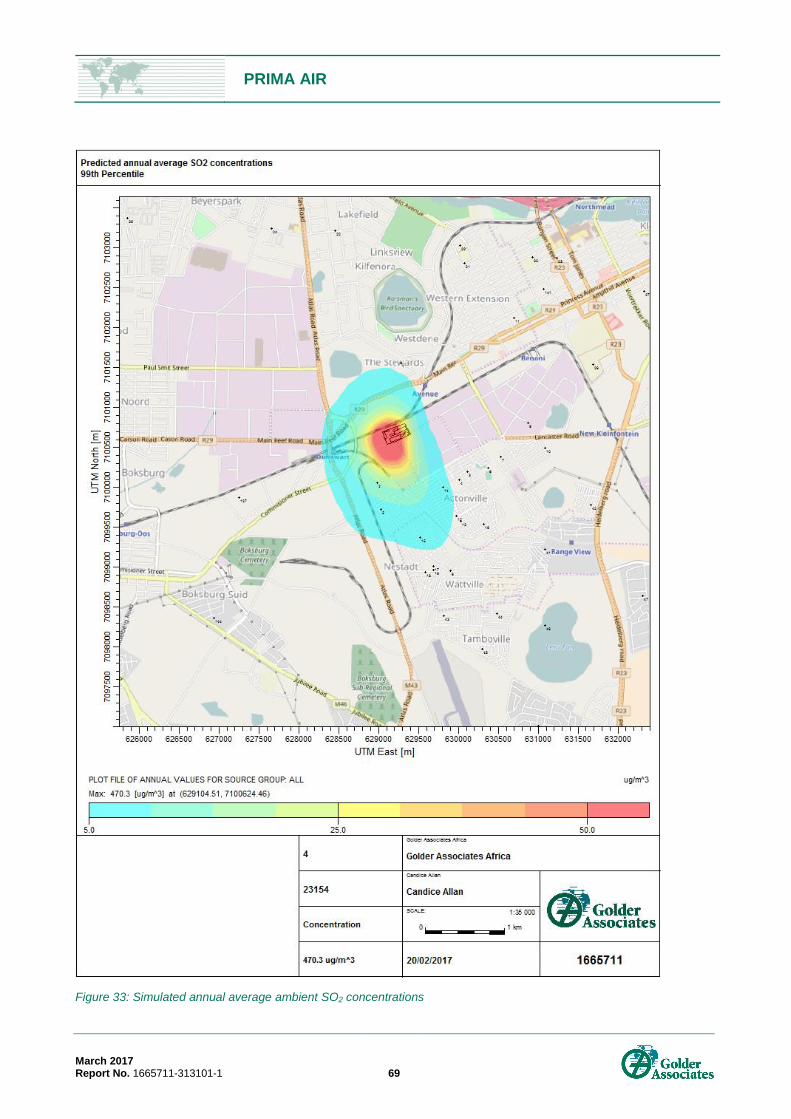
PRIMA AIR
March 2017 Report No. 1665711-313101-1 69
Figure 33: Simulated annual average ambient SO2 concentrations

PRIMA AIR
March 2017 Report No. 1665711-313101-1 70
4.6.3.3 Nitrogen dioxide
Simulated NO2 concentration maximums are provided in Table 35 and Table 36. The dispersion plots for
each of the modelled pollutants are provided in the Figures that follow.
Hourly average ambient NO2 concentrations (Figure 34) exceed the NAAQS by up to 7 times within 50 m of
the Prima boundary. Figure 35 indicates compliance is reached at 500 m from the Prima boundary.
Annual average ambient NO2 concentrations (Figure 36) exceed the NAAQS by up to 9 times within 50 m of
Prima. Compliance is reached at 300 m from the Prima boundary.
The maximum hourly and annual average ambient NO2 concentrations at an identified receptor remain below
the NAAQS at 68%, 38% of the NAAQS respectively.
It must be noted that these simulations are theoretical and are based on the assumption that the Prima
foundries are emitting the maximum allowable NO2 concentrations as stipulated in NEM: AQA Subcategory
4.10. Based on the 2016 emissions survey, however, current Prima NO2 emission concentrations are
negligible and are therefore anticipated to have little to no impact on the ambient air quality at present (See
section 4.4.8).
Table 35: Simulated NO2 maximums
Pollutant Averaging period
Concentration µg/m
3
% of the NAAQS
X Y Elevation Grid resolution
NO2 1 hour 1543 772%
629054 7100624 1651 50 m Annual 379 948%
Table 36: Simulated NO2 maximums at an identified discrete receptor
Pollutant Averaging period
Concentration µg/m
3
% of the NAAQS
X Y Receptor Elevation Grid resolution
NO2 1 hour 136 68%
628982 7100063 (#2) Ephes Mamkeli Secondary
1652 50 m Annual 15 38%
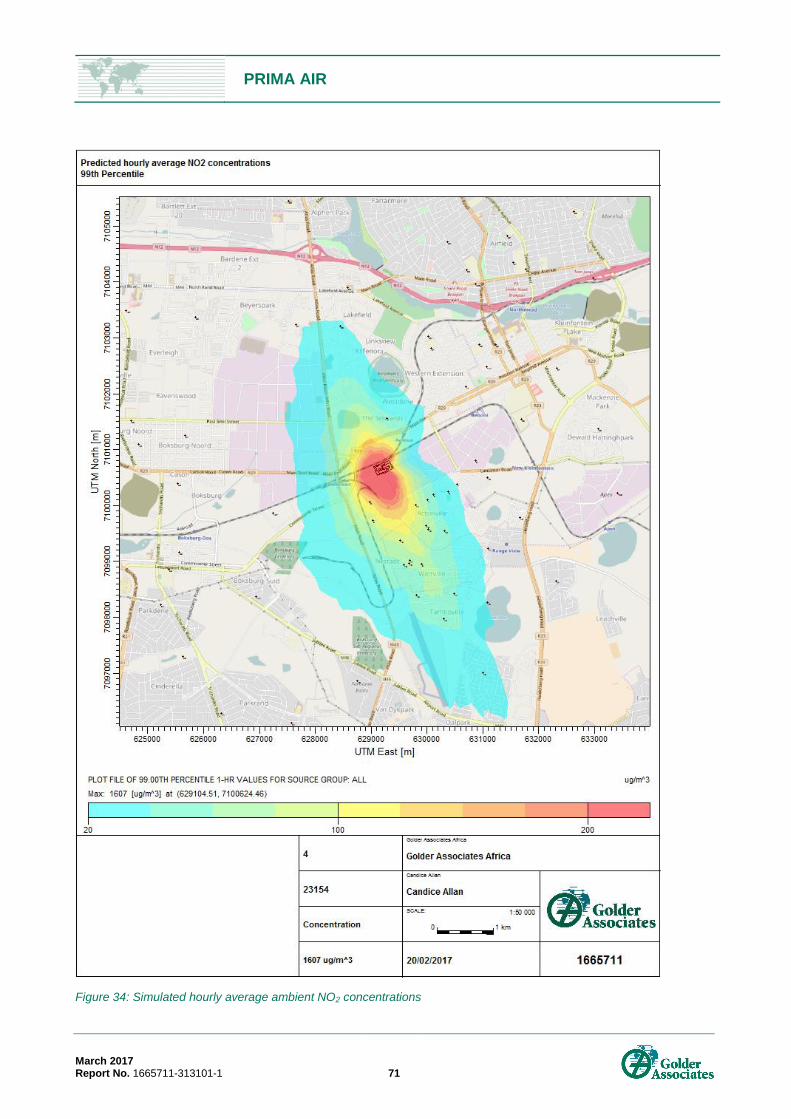
PRIMA AIR
March 2017 Report No. 1665711-313101-1 71
Figure 34: Simulated hourly average ambient NO2 concentrations
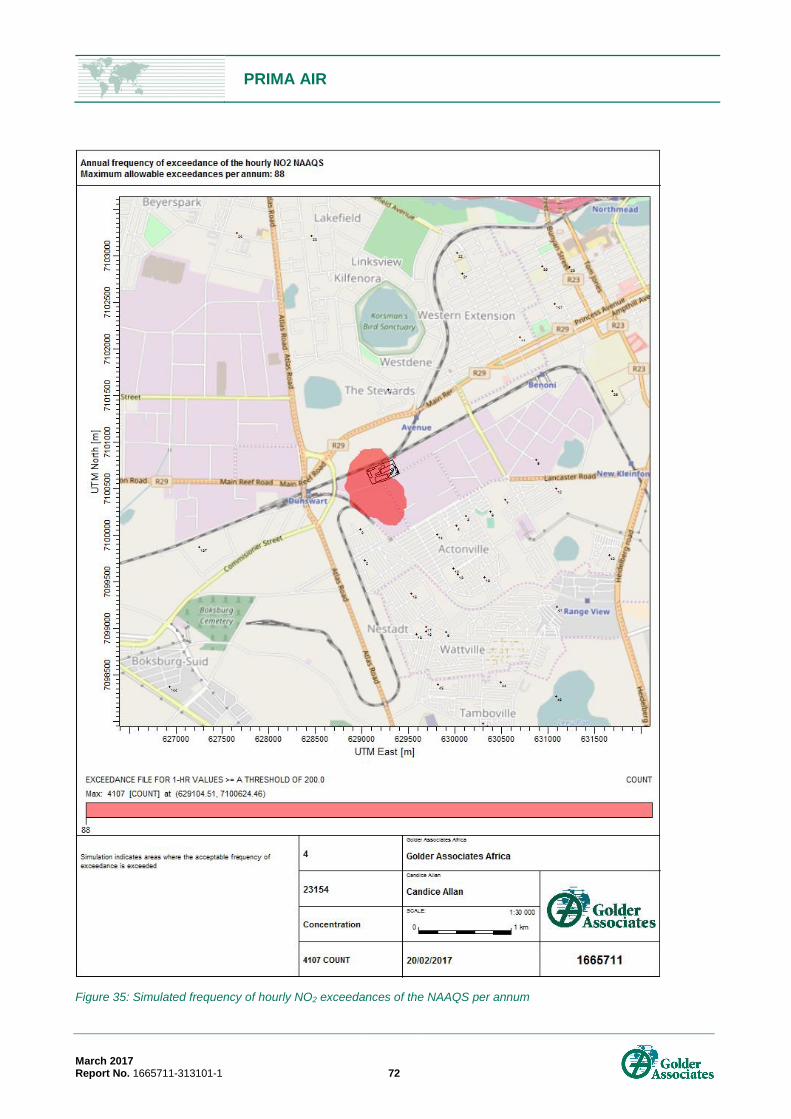
PRIMA AIR
March 2017 Report No. 1665711-313101-1 72
Figure 35: Simulated frequency of hourly NO2 exceedances of the NAAQS per annum

PRIMA AIR
March 2017 Report No. 1665711-313101-1 73
Figure 36: Simulated annual average ambient NO2 concentrations

PRIMA AIR
March 2017 Report No. 1665711-313101-1 74
4.6.4 Supporting documentation
The following digital information is available on request:
MM5 data;
Terrain data;
Model output files;
Plot files; and
Final report.
4.7 Air quality impact assessment
4.7.1 Construction phase
Construction and land clearing activities are key sources of fugitive dust emissions that may have substantial
temporary impact on the local air quality in the vicinity of the activity. The primary chemical constituents of
fugitive dust are oxides of silicon, aluminium, iron and other calcium compounds. Daily dust emissions will
vary according to the level of activity, the type of operation and the meteorological conditions, however these
emissions will have a definable beginning and end (USEPA, 1995).
The following possible sources of fugitive dust and particulate emissions were identified as activities which
could potentially generate air pollution during construction operations:
Vehicular traffic (exhaust and dust emissions);
Bulldozing, excavating and/or scraping;
Loading and unloading material;
Dumping of fill material, road base, or other materials; and
Compacting and grading.
The impact on air quality by fugitive dust is dependent on the quantity and drift potential of the dust particles.
Large particles settle out near the source causing a local nuisance problem. Fine particles can be dispersed
over much greater distances. Impacts are however expected to be more of a nuisance value than a potential
health risk.
Potential mitigation measures that can be implemented to reduce the air quality impact of the installation:
Minimising dust emissions with the use of water sprays or a dust binder (when necessary);
Ensuring all equipment is well maintained and in good working order;
Ensuring equipment and vehicles are switched off when not in use;
Minimising the area disturbed at any one time; and
Avoiding the use of unpaved roads (where possible).
4.7.2 Operational phase
According to the 2016 emissions survey, Prima are currently compliant in terms of the PM, SO2 and NOx
maximum emissions standards listed in NEM: AQA Subcategory 4.10.

PRIMA AIR
March 2017 Report No. 1665711-313101-1 75
SO2 and NOx emissions concentrations measured at the furnace stacks (Prima Silica, F-A1, F-A2 and F-10)
were negligible, suggesting that the impact of the Prima emissions on ambient SO2 and NO2 concentrations
is also negligible at present.
PM concentrations at the F-A1 and F-A2 stacks were low at 8% and 16% of the maximum emissions
standard (30 mg/Nm3) respectively. PM concentrations at the Prima Silica and Short Extraction (F-10) stacks
were comparatively higher although remained compliant at 56% and 95% of the maximum emissions
standard respectively. Simulations run based on these results showed maximum daily average
concentrations are compliant and reach a maximum of 41 µg/m3 (55% of the NAAQS) within 50 m of the
Prima boundary. Similarly maximum annual average concentrations are compliant and reach a maximum of
23 µg/m3 (58% of the NAAQS) within 50 m of the Prima boundary. The current impact of the facility on the
receiving environment is therefore predicted to be moderate.
Worst case scenario dispersion simulations were run for the Prima facility including the proposed additions to
the Silica Plant and assuming all PM, SO2 and NO2 emissions from each stack meet the maximum emissions
standards, i.e.:
PM (modelled and benchmarked here as PM10) at 30 mg/Nm3;
SO2 at 400 mg/Nm3; and
NOx (modelled and benchmarked as NO2).
This is a highly conservative approach considering the SO2 and NOx 2016 emissions survey, however it does
present the ‘worst case scenario’ i.e. if Prima’s emissions were to increase significantly due to process
changes, yet remain compliant in terms of NEM: AQA Subcategory 4.10 emissions standards.
The results of the dispersion simulations show that while Prima may remain compliant in terms of the
legislated emissions standards, the impact of the emissions on ambient air quality may be significant
although localised. The simulation results can be summarised as:
Particulate matter: Maximum daily and annual average ambient PM10 concentrations exceed the
NAAQS by up to two and a half within 50 m of the Prima boundary. Compliance is reached at 500 m
from the Prima boundary. The intensity of the impact is therefore considered to be very high.
Impacts are localised with concentrations decreasing with distance from the site. Both the daily and
annual average PM10 concentrations remain well below the NAAQS6 at the closest sensitive receptor
(Ephes Mamkeli Secondary). The intensity of the impact on this receptor is therefore considered to be
low;
Sulphur dioxide: Maximum hourly average ambient SO2 concentrations exceed the NAAQS by up to 4
times within 50 m of the Prima boundary although compliance is reached at 500 m from the boundary.
Similarly, maximum daily average and annual average SO2 concentrations exceed the NAAQS by up to
7 times within 50 m of the Prima boundary with compliance reached at 400 m from the boundary.
Impacts are localised with concentrations decreasing with distance from the site. The maximum hourly,
daily and annual average ambient SO2 concentrations remain below the NAAQS7 at the closest
sensitive receptor (Ephes Mamkeli Secondary). The intensity of the impact on this receptor is therefore
considered to be low – moderate; and
Nitrogen dioxide: Maximum hourly average ambient NO2 concentrations exceed the NAAQS by up to
7 times within 50 m of the Prima boundary although compliance is reached at 500 m from the Prima
boundary. Maximum annual average ambient NO2 concentrations exceed the NAAQS by up to 9 times
within 50 m of Prima. Compliance is reached at 300 m from the Prima boundary.
6 23% and 15% of the NAAQS respectively
7 39%, 36% and 30% of the NAAQS respectively

PRIMA AIR
March 2017 Report No. 1665711-313101-1 76
Impacts are localised with concentrations decreasing with distance from the site. Hourly and annual
average ambient NO2 concentrations at the closest identified receptor (Ephes Mamkeli Secondary)
remain below the NAAQS at 68%, 38% of the NAAQS respectively. The intensity of the impact on this
receptor is therefore considered to be moderate to high.
In this ‘worst case scenario’, Prima’s emissions will have a cumulative impact on the already degraded
airshed. Prima is located within the Highveld Priority Area, synonymous with poor air quality as a result of the
high concentration of industry, mining, power generation and other non-industrial sources (Held et al. 1996
and DEAT, 2006). It is expected that air quality will be poorer during the winter months as a result of
temperature inversions common over the region and the cumulative effects of pollution caused by the
burning of coal and wood in households, and from veld fires common in winter.
Mitigation and management measures which may aid in reducing the Prima’s emissions to atmosphere
include:
Handling and transfer of dusty materials should be controlled to minimise fugitive emissions by covering
skips and vessels, spraying water on unpaved roads/areas onsite and minimising spills. Fugitive dust
from outdoor or uncovered stockpiles must be minimised through stockpile placement and stockpile
minimisation where practicable;
Develop and implement a maintenance and housekeeping plan for the plant. This includes:
Dry sweeping should not be permitted where it will result in further generation of fugitive dust. In
such instances, vacuum cleaning and wet methods (where appropriate) should be employed;
External surfaces of the process buildings, roofs, guttering, ancillary plant, roadways and open
yards and storage areas should be inspected at least annually; and
Cleaning operations should be carried out if necessary to prevent the accumulation of dusty
material, using methods which minimise the emission of particulate matter into the air.
Vehicles and equipment should undergo regular inspection in order to ensure that they are in good
working order;
Ensure adequate and appropriate abatement technology used to ensure compliance. Emission control
systems commonly used to control particulate and gas emissions from foundries are bag filters, cyclone
separators and venturi scrubbers;
The correct operation and regular maintenance of abatement technologies. This includes:
Implementing a routine maintenance programme to ensure that vents and ductwork are cleaned to
prevent the accumulation of materials; and
Regular inspections for leaks, blockages and other failures in the abatement control systems.
Maintain a register for equipment and abatement technology maintenance;
Develop a procedure to demonstrate to the regulator that all reasonably practicable steps are taken
during start-up and shut down, and during changes of fuel or combustion load or in emergency
incidents in order to minimise emissions. This may include:
Investigating the undertaking of remedial action immediately;
Promptly record the events and actions taken; and
Ensuring the regulator is made aware, without delay, as per Environmental Authorisation conditions.
Cease plant operations for specific sections of the facility in the event that emission control measures
for that section are out of order;

PRIMA AIR
March 2017 Report No. 1665711-313101-1 77
Ensure that stack heights are as per manufacturer specifications in order to ensure adequate dispersion
under normal conditions;
Consider fuel types with the lowest practical sulphur levels in an attempt to lower emissions from the
process;
A complaints register should be developed for interested and affected parties to register complaints and
receive feedback. The register must be maintained throughout the operation of the foundry and should
include:
Development of emissions incident reporting procedure;
Providing a dedicated telephone number for the lodging of complaints;
Ensuring all complaints are recorded and investigated;
Documentation of the investigations associated with the complaints;
Documentation of any mitigation measures that are implemented; and
Documentation of the close out and feedback of the resolution of the complaint.
4.7.3 Decommissioning phase
The impacts associated with the decommissioning of the Prima facility will be similar to those associated with
the construction phase. These impacts are anticipated to be low and limited to the immediate vicinity of the
site. Nevertheless, in order to reduce the nuisance factor of the fugitive dust emissions, mitigation measures
should be implemented during decommissioning.
Potential mitigation measures that can be implemented to reduce the air quality impact of the
decommissioning:
Minimising dust emissions with the use of water sprays or a dust binder (when necessary);
Ensuring all equipment is well maintained and in good working order;
Ensuring equipment and vehicles are switched off when not in use;
Minimising the area disturbed at any one time; and
Avoiding the use of unpaved roads (where possible).

PRIMA AIR
March 2017 Report No. 1665711-313101-1 78
4.7.4 Environmental impact rating
Table 37, Table 38 and Table 39 below summarise the assessed impacts related to the various phases of the proposed project.
Table 37: Environmental Impact Assessment Matrix for the construction phase
CONSTRUCTION PHASE
Activity Nature of Impact Impact type
Exte
nt
Du
rati
on
Po
ten
tial
Inte
nsit
y
Lik
elih
oo
d
Rating Mitigation Interpretation
Fugitive dust emissions
Direct Impact: Project impact 1 1 4 0.5 3 - MOD
With mitigation the air quality impact intensity will reduce
Fugitive dust emissions will be short-lived and cease once construction ceases. Impacts are anticipated to be limited to the site and are unlikely to be anything more than a nuisance.
Fugitive dust concentrations resulting in the degradation of the ambient air quality and creating a nuisance
Cumulative impact 1 1 4 0.2 1 - LOW
Construction dust will be largely limited to the site and is therefore not likely to have a cumulative impact on ambient air quality beyond the Prima fence line.
Residual impact 1 1 1 0.1 0 - LOW Fugitive dust emissions associated with construction will cease once construction ceases.

PRIMA AIR
March 2017 Report No. 1665711-313101-1 79
Table 38: Environmental Impact Assessment Matrix for operational phase (based on maximum permissible emissions)
OPERATIONAL PHASE
Activity Nature of Impact
Impact type
Exte
nt
Du
rati
on
Po
ten
tial
Inte
nsit
y
Lik
elih
oo
d
Rating Mitigation Interpretation
Particulate matter emissions
Direct Impact: Project impact based on maximum permissible emissions
2 4 8 0.75 11 - HIGH
With mitigation the air quality impact intensity will reduce
Elevated PMs are only likely to impact the local environment however impacts will continue for the duration of Prima's operation. The intensity of the impact within 500 m of the site under the 'worst case scenario' is likely to be moderate-high.
Particulate matter emissions concentrations resulting in the degradation of the ambient air quality
Cumulative impact based on maximum permissible emissions
2 4 8 0.75 11 - HIGH
Ambient air quality in the region is considered to be poor. The intensity of the cumulative impact within 500 m of the site under the 'worst case scenario' is predicted to be moderate-high.
Anticipated actual project impact based on 2016 survey results
2 4 8 0.5 7 - MOD
According to the 2016 stack emissions sampling Prima’s PM contributions from the F-A1 and F-A2 stacks are low at 8% and 16% of the maximum emissions standard. The Prima Silica and Short Extraction (F-10) stack contributions were higher at 56% and 95% of the maximum emissions standard. Prima’s PM emissions are therefore anticipated to have a moderate impact on the local ambient air quality.
Anticipated actual cumulative project impact based on 2016 survey results
2 4 8 0.5 7 - MOD Ambient air quality in the region is considered to be poor. The cumulative impact of the project within 500 m of the site is anticipated to be moderate.
Residual impact
2 1 1 0.1 0 - LOW Particulate emissions will cease once the operation of the facility ceases.

PRIMA AIR
March 2017 Report No. 1665711-313101-1 80
OPERATIONAL PHASE
Activity Nature of Impact
Impact type
Exte
nt
Du
rati
on
Po
ten
tial
Inte
nsit
y
Lik
elih
oo
d
Rating Mitigation Interpretation
Particulate matter emissions
Direct Impact:
Project impact based on maximum permissible emissions
2 4 1 0.75 5 - MOD
With mitigation the air quality impact intensity will reduce
Elevated PM impacts will continue for the duration of Prima's operation. The intensity of the impact at the closest identified sensitive receptor (SR2) under the 'worst case scenario is predicted to be moderate.
Ambient PM concentrations resulting from Prima's emissions with the potential to affect human health at an identified receptor location
Cumulative impact based on maximum permissible emissions
2 4 2 0.75 6 - MOD
Ambient air quality in the region is considered to be poor. The intensity of the cumulative impact on the closest receptor under the 'worst case scenario' is predicted to be moderate.
Anticipated actual project impact based on 2016 survey results
2 4 1 0.5 4 - MOD
According to the 2016 stack emissions sampling Prima’s PM contributions from the F-A1 and F-A2 stacks are low at 8% and 16% of the maximum emissions standard respectively. The Prima Silica and Short Extraction (F-10) stack contributions were comparatively higher at 56% and 95% of the maximum emissions standard respectively. Prima’s PM emissions are therefore anticipated to have a low impact intensity at the closest sensitive receptor.
Anticipated actual cumulative project impact based on 2016 survey results
2 4 1 0.5 4 - MOD Ambient air quality in the region is considered to be poor. The cumulative impact of the site at the closest sensitive receptor anticipated to be moderate.
Residual impact
2 1 1 0.1 0 - LOW Particulate emissions will cease once the operation of the facility ceases.

PRIMA AIR
March 2017 Report No. 1665711-313101-1 81
OPERATIONAL PHASE
Activity Nature of Impact
Impact type
Exte
nt
Du
rati
on
Po
ten
tial
Inte
nsit
y
Lik
elih
oo
d
Rating Mitigation Interpretation
Sulphur dioxide emissions
Direct Impact:
Project impact based on maximum permissible emissions
2 4 16 0.75 17 - HIGH
With mitigation the air quality impact intensity will reduce
Under the 'worst case scenario' elevated SO2 concentrations are only likely to impact the local environment however impacts will continue for the duration of Prima's operation. The intensity of the impact at the fence line is predicted to be very high.
SO2 emissions concentrations resulting in the degradation of the ambient air quality
Cumulative impact based on maximum permissible emissions
2 4 16 0.75 17 - HIGH Ambient air quality in the region is considered to be poor. The intensity of the cumulative impact within 500 m of the site under the 'worst case scenario' is predicted to be high.
Anticipated actual project impact based on 2016 survey results
2 4 1 0.1 1 - LOW
According to the 2016 stack emissions sampling Prima’s SO2 contributions are negligible. It is therefore anticipated that the project’s SO2 emissions will have a low impact within 500 m of the site.
Anticipated actual cumulative project impact based on 2016 survey results
2 4 1 0.1 1 - LOW
Ambient air quality in the region is considered to be poor however; according to the 2016 stack emissions sampling Prima’s SO2 contributions are negligible. It is therefore anticipated that the project’s SO2 emissions will have a low cumulative impact within 500 m of the site.
Residual impact
2 1 1 0.1 0 - LOW SO2 emissions will cease once the operation of the facility ceases.
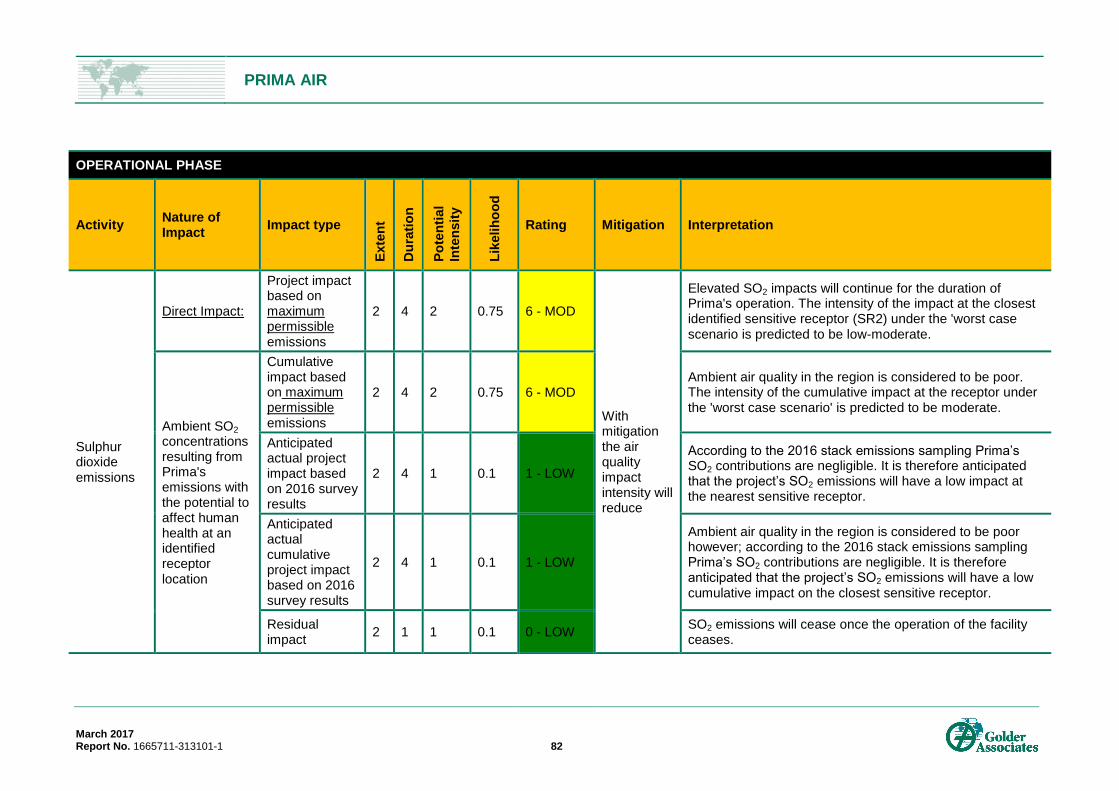
PRIMA AIR
March 2017 Report No. 1665711-313101-1 82
OPERATIONAL PHASE
Activity Nature of Impact
Impact type
Exte
nt
Du
rati
on
Po
ten
tial
Inte
nsit
y
Lik
elih
oo
d
Rating Mitigation Interpretation
Sulphur dioxide emissions
Direct Impact:
Project impact based on maximum permissible emissions
2 4 2 0.75 6 - MOD
With mitigation the air quality impact intensity will reduce
Elevated SO2 impacts will continue for the duration of Prima's operation. The intensity of the impact at the closest identified sensitive receptor (SR2) under the 'worst case scenario is predicted to be low-moderate.
Ambient SO2 concentrations resulting from Prima's emissions with the potential to affect human health at an identified receptor location
Cumulative impact based on maximum permissible emissions
2 4 2 0.75 6 - MOD Ambient air quality in the region is considered to be poor. The intensity of the cumulative impact at the receptor under the 'worst case scenario' is predicted to be moderate.
Anticipated actual project impact based on 2016 survey results
2 4 1 0.1 1 - LOW
According to the 2016 stack emissions sampling Prima’s SO2 contributions are negligible. It is therefore anticipated that the project’s SO2 emissions will have a low impact at the nearest sensitive receptor.
Anticipated actual cumulative project impact based on 2016 survey results
2 4 1 0.1 1 - LOW
Ambient air quality in the region is considered to be poor however; according to the 2016 stack emissions sampling Prima’s SO2 contributions are negligible. It is therefore anticipated that the project’s SO2 emissions will have a low cumulative impact on the closest sensitive receptor.
Residual impact
2 1 1 0.1 0 - LOW SO2 emissions will cease once the operation of the facility ceases.

PRIMA AIR
March 2017 Report No. 1665711-313101-1 83
OPERATIONAL PHASE
Activity Nature of Impact
Impact type
Exte
nt
Du
rati
on
Po
ten
tial
Inte
nsit
y
Lik
elih
oo
d
Rating Mitigation Interpretation
Oxides of nitrogen emissions
Direct Impact:
Project impact based on maximum permissible emissions
2 4 16 0.75 17 - HIGH
With mitigation the air quality impact intensity will reduce
Under the 'worst case scenario' elevated NO2 concentrations are only likely to impact the local environment however impacts will continue for the duration of Prima's operation. The intensity of the impact at the fence line is predicted to be very high.
NO2 emissions concentrations resulting in the degradation of the ambient air quality
Cumulative impact based on maximum permissible emissions
2 4 16 0.75 17 - HIGH Ambient air quality in the region is considered to be poor. The intensity of the cumulative impact at the fence line under the 'worst case scenario' is predicted to be high.
Anticipated actual project impact based on 2016 survey results
2 4 1 0.1 1 - LOW
According to the 2016 stack emissions sampling Prima’s NOx contributions are negligible. It is therefore anticipated that the project’s NO2 emissions will have a low impact within 500 m of the site.
Anticipated actual cumulative project impact based on 2016 survey results
2 4 1 0.1 1 - LOW
Ambient air quality in the region is considered to be poor however; according to the 2016 stack emissions sampling Prima’s NO2 contributions are negligible. It is therefore anticipated that the project’s NO2 emissions will have a low cumulative impact within 500 m of the site.
Residual impact
2 1 1 0.1 0 - LOW NO2 emissions will cease once the operation of the facility ceases.
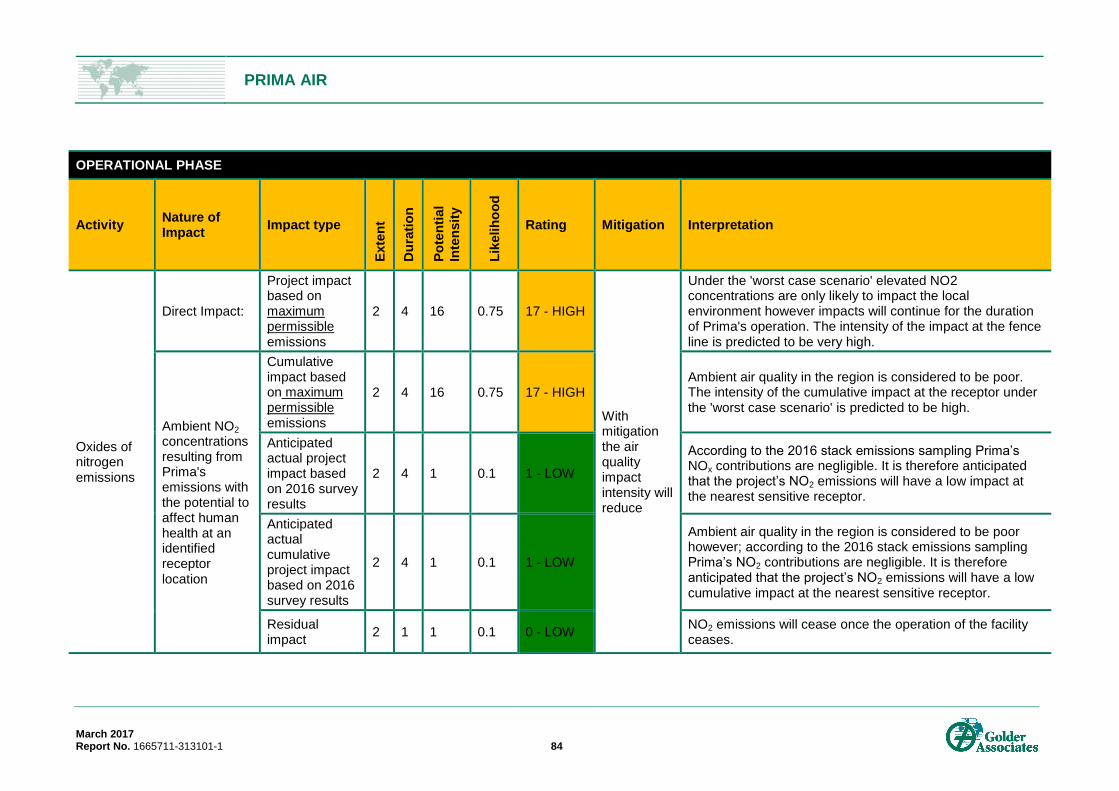
PRIMA AIR
March 2017 Report No. 1665711-313101-1 84
OPERATIONAL PHASE
Activity Nature of Impact
Impact type
Exte
nt
Du
rati
on
Po
ten
tial
Inte
nsit
y
Lik
elih
oo
d
Rating Mitigation Interpretation
Oxides of nitrogen emissions
Direct Impact:
Project impact based on maximum permissible emissions
2 4 16 0.75 17 - HIGH
With mitigation the air quality impact intensity will reduce
Under the 'worst case scenario' elevated NO2 concentrations are only likely to impact the local environment however impacts will continue for the duration of Prima's operation. The intensity of the impact at the fence line is predicted to be very high.
Ambient NO2 concentrations resulting from Prima's emissions with the potential to affect human health at an identified receptor location
Cumulative impact based on maximum permissible emissions
2 4 16 0.75 17 - HIGH Ambient air quality in the region is considered to be poor. The intensity of the cumulative impact at the receptor under the 'worst case scenario' is predicted to be high.
Anticipated actual project impact based on 2016 survey results
2 4 1 0.1 1 - LOW
According to the 2016 stack emissions sampling Prima’s NOx contributions are negligible. It is therefore anticipated that the project’s NO2 emissions will have a low impact at the nearest sensitive receptor.
Anticipated actual cumulative project impact based on 2016 survey results
2 4 1 0.1 1 - LOW
Ambient air quality in the region is considered to be poor however; according to the 2016 stack emissions sampling Prima’s NO2 contributions are negligible. It is therefore anticipated that the project’s NO2 emissions will have a low cumulative impact at the nearest sensitive receptor.
Residual impact
2 1 1 0.1 0 - LOW NO2 emissions will cease once the operation of the facility ceases.

PRIMA AIR
March 2017 Report No. 1665711-313101-1 85
Table 39: Environmental Impact Assessment Matrix for the decommissioning phase
DECCOMMISSIONING PHASE
Activity Nature of Impact
Impact type
Exte
nt
Du
rati
on
Po
ten
tial
Inte
nsit
y
Lik
elih
oo
d
Rating Mitigation Interpretation
Fugitive dust emissions
Direct Impact: Project impact 2 1 8 0.5 6 - MOD
With mitigation the air quality impact intensity will reduce
Fugitive dust emissions will be short-lived and cease once decommissioning ceases. Impacts are anticipated to be limited to the local scale and are unlikely to be anything more than a nuisance.
Fugitive dust concentrations resulting in the degradation of the ambient air quality and creating a nuisance
Cumulative impact
2 1 8 0.5 6 - MOD Fugitive dust will be largely limited to the local environment and is therefore not likely to have a cumulative impact on regional air quality.
Residual impact 2 1 1 0.1 0 - LOW Fugitive dust emissions associated with decommissioning will cease once decommissioning ceases.

PRIMA AIR
March 2017 Report No. 1665711-313101-1 86
5.0 RECOMMENDATIONS FOR MONITORING
The following recommendations for monitoring are made:
Stack emissions sampling should be undertaken annually to monitor compliance in terms of the
NEM: AQA Subcategory 4.10;
A once-off particulate matter monitoring campaign should be undertaken at a nearby sensitive receptor
such as Ephes Mamkeli Secondary to validate the predicted plumes; and
Should stack emissions sampling reveal increases in SO2 and NO2 emissions at the facility, a once-off
SO2 and NO2 monitoring campaign should be undertaken at a nearby sensitive receptor such as Ephes
Mamkeli Secondary to validate the predicted plumes.
6.0 REFERENCES
1) Airshed Planning Professionals (2015) Basic Assessment and Atmospheric Emissions Licence (AEL)
Amendment for the Decommissioning of the Intermediate Carbon Converter (IC3) Plant at Ferrometals.
Prepared for Golder Associates. Report No: 15GAA01 v. 1.
2) Chestnut, L.G .et al., 1991: Pulmonary Function and Ambient Particulate Matter: Epidemiological
Evidence from NHANES I, Archives of Environmental Health, 46, 135 – 144.
3) Clayton, G. and Clayton, F. (eds.), 1981: Patty’s industrial hygiene and toxicology manual, 3rd
. ed., John
Wiley & Sons, New York.
4) Cowherd C, Muleski GE and Kinsey JS, 1988: Control of Open Fugitive Dust Sources, EPA-450/3-88-
008, US Environmental Protection Agency, Research Triangle Park, North Carolina.
5) Department of Environmental Affairs, 2012: National Environmental Management: Air Quality Act
(39/2004): List of activities which result in atmospheric emissions which may have a significant
detrimental effect on the environment, including health, social conditions, economic conditions,
ecological conditions or cultural heritage, GN 35894, 23 November 2012.
6) Department of Water and Environmental Affairs (DWEA), 2011: National Dust Control Regulations,
Government Gazette no 36974, 1 November 2013.
7) Department of Environmental Affairs and Tourism (DEAT), 2007: The Highveld Air Quality Management
Plan (HPA AQMP).
8) Department of Environmental Affairs and Tourism (DEAT), 2006: The National Air Quality Management
Programme (NAQMP), Output C.4., Initial State of Air Report.
9) Department of Environmental Affairs and Tourism (DEAT), 2002: Specialist Studies. Information Series
4.
10) EPA, 1996: Compilation of Air Pollution Emission Factors (AP-42), 5th Edition US Environmental
Protection Agency, Research Triangle Park, North Carolina.
11) Fenger, J., 2002: Urban air quality, In J. Austin, P. Brimblecombe and W. Sturges (eds.), Air pollution
science for the 21st century, Elsevier, Oxford.
12) Harrison, R.M. and R.E. van Grieken, 1998: Atmospheric Aerosols. John Wiley: Great Britain.
13) Held, G., Gore, B.J., Surridge, A.D., Tosen, G.R., and W Amsley, R.D, 1996: Air Pollution and its
impacts on the South African Highveld, Environmental Scientific Association, Cleveland, 144p.
14) Hew, 2001: Health, Environment and Work: Learning about air quality. Available at
http://www.agius.com.
15) Manahan, S.E., 1991: Environmental Chemistry, Lewis Publishers Inc, United States of America.
PRIMA AIR
March 2017 Report No. 1665711-313101-1 87
16) Maroni, M., Seifert, B., Lindvall, T., 1995: Indoor air quality – a comprehensive reference book, Elsevier,
Amsterdam.
17) Ministry for the Environment, (NZ) 2001. Good Practice for assessing and managing the environmental
effects of dust emissions. Wellington, New Zealand, <http://www.mfe.govt.nz>.
18) Mpumalanga State of Environment report, 2003.
19) National Environmental Management Act: Air Quality Act, Act 39 of 2004.
20) Pope, C. A III and Dockery, D.W., 1992: Acute Health Effects of PM10 Pollution on Symptomatic and
Non- Symptomatic Children, American Review of Respiratory Disease, 145, 1123–1128.
21) Pope, C.A. III and Kanner, R.E., 1993: Acute Effects of PM10 Pollution on Pulmonary Function of
Smokers with Mild to Moderate Chronic Obstructive Pulmonary Disease, American Review of
Respiratory Disease, 147, 36–40.
22) Preston-Whyte, R.A., and Tyson, P.D., 1997: The Atmosphere and Weather of Southern Africa. Oxford
University Press, Cape Town.
23) Preston-Whyte, R.A., and Tyson, P.D., 1998: The Weather and Climate of Southern Africa, 2nd
Edition.
24) Samaras, Z., and Sorensen, S.C., 1999: Mobile sources, In J. Fenger, O. Hertel and F. Palmgren
(eds.), urban air pollution – European aspects, Kluwer Academic Publishers, Denmark.
25) Sasol, 2002: Sasol Synfuels Air Quality Monitoring Network Data Report, 2002.
26) Scholes, R., 2002: SAFARI 2000 – Nitrogen and Sulphur Deposition in Southern Africa. Final report to
DACST. CSIR Report No. ENV-P-C 2002-020.
27) The South African ambient air quality standards for common pollutants were published in the
Government Gazette, No. 32816 on 24 December 2009.
28) Turner, C., 2001: Ambient air quality in South Africa – Do we know what we want to achieve and are we
monitoring the right things in the right places?, African Centre for Energy and the Environment (ACEE)
Air Quality Workshop, 7-9 March 2001, Warmbaths. Available at http://www.acee.co.za.
29) USEPA., 1995: Compilation of air pollutant emission factors, AP-42, Fifth Edition Volume 1: Chapter 13:
Miscellaneous Sources - Introduction to Fugitive Dust Sources, U.S Environmental Protection Agency,
Research Triangle Park, N.C.
30) USEPA., 1995: Compilation of air pollutant emission factors, AP-42, Fifth Edition Volume 1: Chapter 12:
Section 13: Steel Foundries, U.S Environmental Protection Agency, Research Triangle Park, N.C.
31) USEPA., 1995: Compilation of air pollutant emission factors, AP-42, CH 13.2.3: Heavy Construction.
PRIMA AIR
March 2017 Report No. 1665711-313101-1 88
33) USEPA Air Pollution Control Technology Fact Sheet (EPA-452/F-03-025). Available at:
https://www3.epa.gov/ttn/chief/mkb/documents/ff-pulse.pdf. Accessed 18 October 2016.
GOLDER ASSOCIATES AFRICA (PTY) LTD.
Candice Allan Lance Coetzee
Air Quality Specialist Senior Air Quality
Specialist
CA/LC/jep
Reg. No. 2002/007104/07
Directors: RGM Heath, MQ Mokulubete, SC Naidoo, GYW Ngoma
Golder, Golder Associates and the GA globe design are trademarks of Golder Associates Corporation.
g:\projects\1665711 - zitholele aqia\6.1 deliverables\1665711-313101-1_rep_prima_aqia_final_14mar17.docx

PRIMA AIR
March 2017 Report No. 1665711-313101-1
APPENDIX A Document Limitations
PRIMA AIR
March 2017 Report No. 1665711-313101-1
APPENDIX B Sensitive Receptors

PRIMA AIR
March 2017 Report No. 1665711-313101-1
ID X Y Receptor name
1 629284 7101562 The Stewards Residential
2 628983 7100063 EPHES MAMKELI SECONDARY
3 630117 7100201 Sunshine Hospital
4 630011 7100100 Actonville Hospital
5 629030 7099730 SOLOMON MOTLANA PRIMARY
6 629899 7098959 MAGALELAGASE PRIMARY SCHOOL
7 630535 7100380 BENONI PRIMARY SCHOOL
8 630374 7100249 LIVERPOOL SECONDARY SCHOOL
9 630871 7100805 LETMABANG CLINIC ( WATTVILLE)
10 631086 7100496 WILLIAM HILLS SECONDARY
11 630698 7102124 Glynwood Hospital
12 629978 7099643 ACTONVILLE PRIMARY SCHOOL
13 630027 7099576 PIONEER PRIMARY SCHOOL
14 629804 7100007 New Kleinfontein Residential
15 629526 7099371 ISAAC MAKAU PRIMARY SCHOOL
16 629685 7098965 ETWATWA SECONDARY SCHOOL
17 629689 7099017 KGOTHALONG PRIMARY SCHOOL
18 629586 7098938 Wattville Residential
19 630317 7099543 Actonville Residential
20 628455 7103215 Lakesfield
21 630080 7102811 BENONI WEST PRIMARY SCHOOL
22 630022 7103033 BENONI JUNIOR SCHOOL
23 628578 7103899 Optiklin Eye Hospital
24 627655 7103245 LAERSKOOL WESTWOOD
25 631230 7102877 KEMPSTON CLINIC
26 631686 7101545 WILLOWMOORE HIGH SCHOOL
27 632325 7102456 LAERSKOOL VERKENNER
28 633062 7101371 Mackenzie Park/ Dewald Hattingh Park
29 630713 7104222 WORDSWORTH HIGH SCHOOL
30 631763 7104234 LAERSKOOL NORTHMEAD
31 631544 7104347 HOëRSKOOL BRANDWAG
32 631439 7104824 TOM NEWBY SCHOOL
33 630932 7102884 Benoni
34 632977 7104074 KHANGEZILE PRIMARY SCHOOL
35 630369 7104727 Farrarmere / Airfield / Northmead
36 625850 7103375 Beyers Park
37 625674 7101253 Boksburg
38 624710 7101523 MARTIN PRIMARY SCHOOL
39 625533 7100398 LAERSKOOL J M LOUW
40 624836 7101090 LAERSKOOL HENNIE BASSON
41 631090 7099229 Harry Gwala Informal
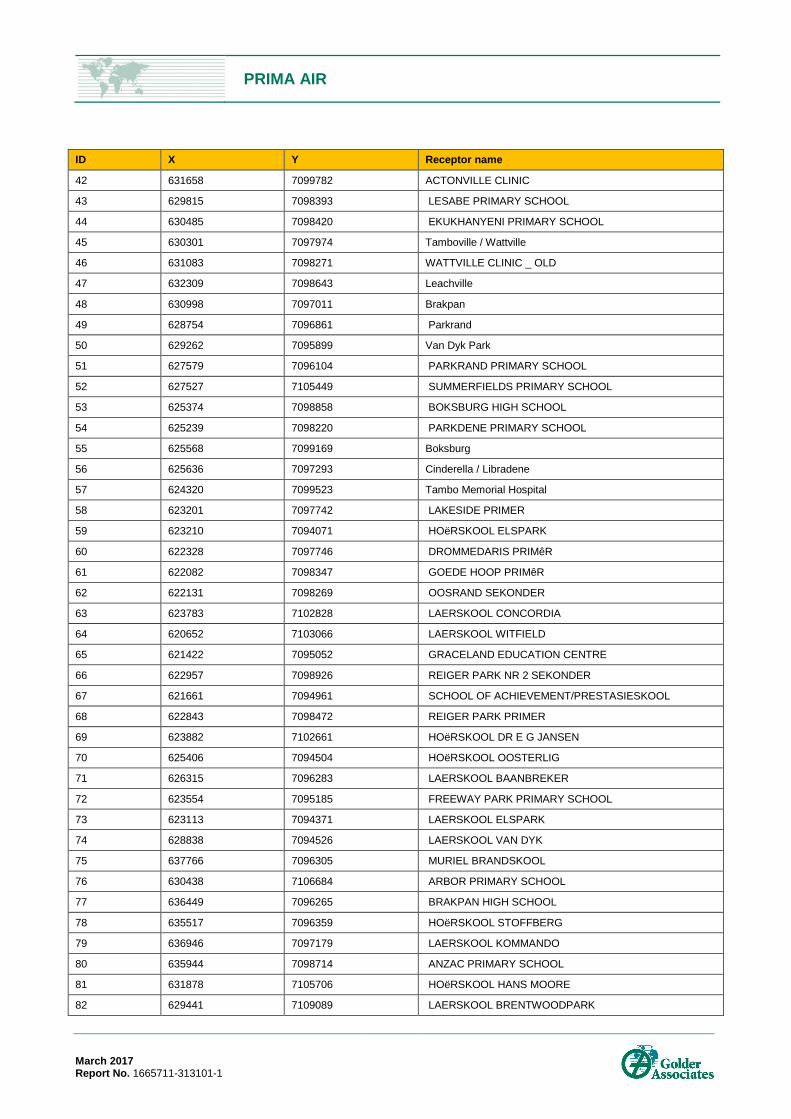
PRIMA AIR
March 2017 Report No. 1665711-313101-1
ID X Y Receptor name
42 631658 7099782 ACTONVILLE CLINIC
43 629815 7098393 LESABE PRIMARY SCHOOL
44 630485 7098420 EKUKHANYENI PRIMARY SCHOOL
45 630301 7097974 Tamboville / Wattville
46 631083 7098271 WATTVILLE CLINIC _ OLD
47 632309 7098643 Leachville
48 630998 7097011 Brakpan
49 628754 7096861 Parkrand
50 629262 7095899 Van Dyk Park
51 627579 7096104 PARKRAND PRIMARY SCHOOL
52 627527 7105449 SUMMERFIELDS PRIMARY SCHOOL
53 625374 7098858 BOKSBURG HIGH SCHOOL
54 625239 7098220 PARKDENE PRIMARY SCHOOL
55 625568 7099169 Boksburg
56 625636 7097293 Cinderella / Libradene
57 624320 7099523 Tambo Memorial Hospital
58 623201 7097742 LAKESIDE PRIMER
59 623210 7094071 HOëRSKOOL ELSPARK
60 622328 7097746 DROMMEDARIS PRIMêR
61 622082 7098347 GOEDE HOOP PRIMêR
62 622131 7098269 OOSRAND SEKONDER
63 623783 7102828 LAERSKOOL CONCORDIA
64 620652 7103066 LAERSKOOL WITFIELD
65 621422 7095052 GRACELAND EDUCATION CENTRE
66 622957 7098926 REIGER PARK NR 2 SEKONDER
67 621661 7094961 SCHOOL OF ACHIEVEMENT/PRESTASIESKOOL
68 622843 7098472 REIGER PARK PRIMER
69 623882 7102661 HOëRSKOOL DR E G JANSEN
70 625406 7094504 HOëRSKOOL OOSTERLIG
71 626315 7096283 LAERSKOOL BAANBREKER
72 623554 7095185 FREEWAY PARK PRIMARY SCHOOL
73 623113 7094371 LAERSKOOL ELSPARK
74 628838 7094526 LAERSKOOL VAN DYK
75 637766 7096305 MURIEL BRANDSKOOL
76 630438 7106684 ARBOR PRIMARY SCHOOL
77 636449 7096265 BRAKPAN HIGH SCHOOL
78 635517 7096359 HOëRSKOOL STOFFBERG
79 636946 7097179 LAERSKOOL KOMMANDO
80 635944 7098714 ANZAC PRIMARY SCHOOL
81 631878 7105706 HOëRSKOOL HANS MOORE
82 629441 7109089 LAERSKOOL BRENTWOODPARK
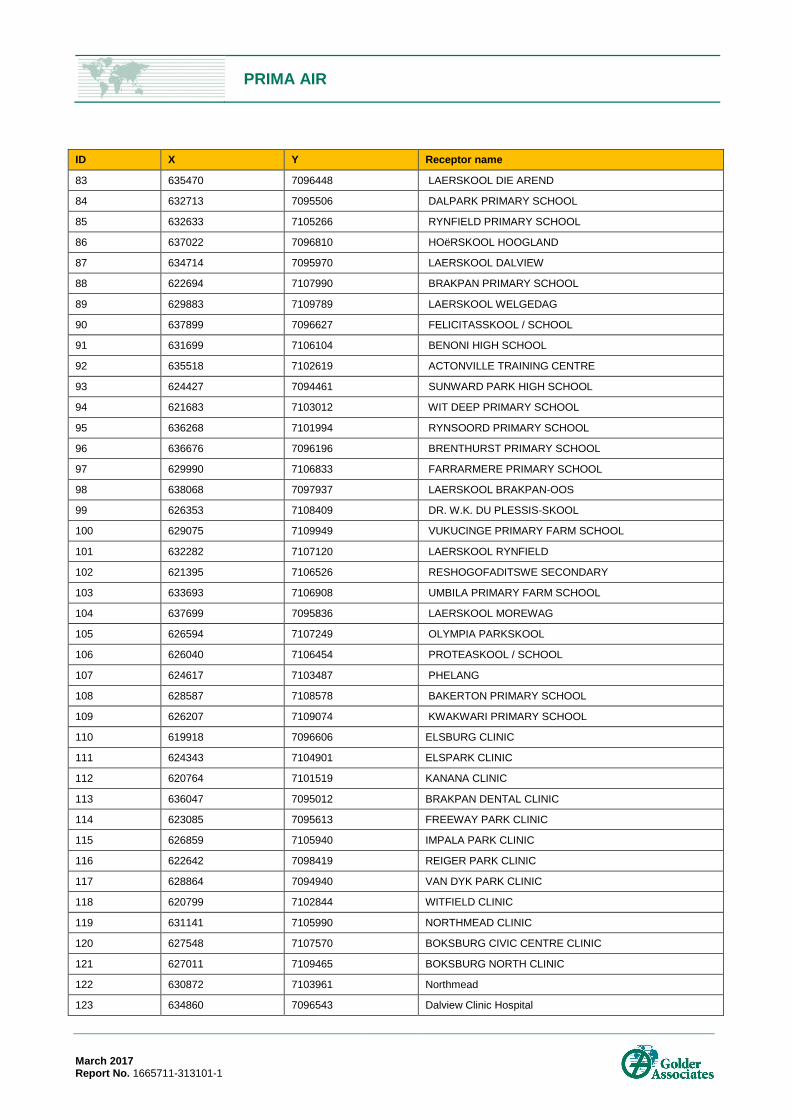
PRIMA AIR
March 2017 Report No. 1665711-313101-1
ID X Y Receptor name
83 635470 7096448 LAERSKOOL DIE AREND
84 632713 7095506 DALPARK PRIMARY SCHOOL
85 632633 7105266 RYNFIELD PRIMARY SCHOOL
86 637022 7096810 HOëRSKOOL HOOGLAND
87 634714 7095970 LAERSKOOL DALVIEW
88 622694 7107990 BRAKPAN PRIMARY SCHOOL
89 629883 7109789 LAERSKOOL WELGEDAG
90 637899 7096627 FELICITASSKOOL / SCHOOL
91 631699 7106104 BENONI HIGH SCHOOL
92 635518 7102619 ACTONVILLE TRAINING CENTRE
93 624427 7094461 SUNWARD PARK HIGH SCHOOL
94 621683 7103012 WIT DEEP PRIMARY SCHOOL
95 636268 7101994 RYNSOORD PRIMARY SCHOOL
96 636676 7096196 BRENTHURST PRIMARY SCHOOL
97 629990 7106833 FARRARMERE PRIMARY SCHOOL
98 638068 7097937 LAERSKOOL BRAKPAN-OOS
99 626353 7108409 DR. W.K. DU PLESSIS-SKOOL
100 629075 7109949 VUKUCINGE PRIMARY FARM SCHOOL
101 632282 7107120 LAERSKOOL RYNFIELD
102 621395 7106526 RESHOGOFADITSWE SECONDARY
103 633693 7106908 UMBILA PRIMARY FARM SCHOOL
104 637699 7095836 LAERSKOOL MOREWAG
105 626594 7107249 OLYMPIA PARKSKOOL
106 626040 7106454 PROTEASKOOL / SCHOOL
107 624617 7103487 PHELANG
108 628587 7108578 BAKERTON PRIMARY SCHOOL
109 626207 7109074 KWAKWARI PRIMARY SCHOOL
110 619918 7096606 ELSBURG CLINIC
111 624343 7104901 ELSPARK CLINIC
112 620764 7101519 KANANA CLINIC
113 636047 7095012 BRAKPAN DENTAL CLINIC
114 623085 7095613 FREEWAY PARK CLINIC
115 626859 7105940 IMPALA PARK CLINIC
116 622642 7098419 REIGER PARK CLINIC
117 628864 7094940 VAN DYK PARK CLINIC
118 620799 7102844 WITFIELD CLINIC
119 631141 7105990 NORTHMEAD CLINIC
120 627548 7107570 BOKSBURG CIVIC CENTRE CLINIC
121 627011 7109465 BOKSBURG NORTH CLINIC
122 630872 7103961 Northmead
123 634860 7096543 Dalview Clinic Hospital

PRIMA AIR
March 2017 Report No. 1665711-313101-1
ID X Y Receptor name
124 632947 7107609 Linmed Hospital
125 625520 7094975 Sunward Park Hospital
126 619418 7102287 Waverly Hospital
127 625763 7092146 Windmill Park
128 623231 7092511 Elspark
129 634396 7093448 Sunair Park
130 636836 7093759 Salies Village
131 634962 7094984 Denneoord
132 637097 7095021 Schapenrust
133 625189 7095488 Sunward Park
134 633197 7095698 Dalpark
135 634582 7095704 Dalview
136 619929 7096861 Elsburg
137 627249 7099870 Dunswarts
138 633407 7100219 Apex
139 620040 7100753 Delmore
140 620682 7100844 Angelo
141 631071 7102485 Old People's Home
142 634651 7108051 Rynpark Old Age
143 622588 7094111 Kowa Pienaar Retirement Home
144 626935 7098368 Alan Woodrow Park Retirement Village
145 634510 7093162 Gold Reef Village Retirement Home

Golder Associates Africa (Pty) Ltd.
P.O. Box 29391
Maytime, 3624
Block C, Bellevue Campus
5 Bellevue Road
Kloof
Durban, 3610
South Africa
T: [+27] (31) 717 2790
Caption Text