Pricing and Reimbursement in U.S. Pharmaceutical Markets
77
Pricing and Reimbursement in U.S. Pharmaceutical Markets Faculty Research Working Paper Series Ernst R. Berndt MIT Sloan School of Management and NBER Joseph P. Newhouse Harvard School of Public Health, Harvard Kennedy School, and NBER September 2010 RWP10-039 The views expressed in the HKS Faculty Research Working Paper Series are those of the author(s) and do not necessarily reflect those of the John F. Kennedy School of Government or of Harvard University. Faculty Research Working Papers have not undergone formal review and approval. Such papers are included in this series to elicit feedback and to encourage debate on important public policy challenges. Copyright belongs to the author(s). Papers may be downloaded for personal use only. www.hks.harvard.edu
-
Upload
khangminh22 -
Category
Documents
-
view
1 -
download
0
Transcript of Pricing and Reimbursement in U.S. Pharmaceutical Markets

Pricing and Reimbursement in U.S. Pharmaceutical Markets Faculty Research Working Paper Series
Ernst R. Berndt MIT Sloan School of Management and NBER
Joseph P. Newhouse Harvard School of Public Health, Harvard Kennedy School, and NBER
September 2010 RWP10-039
The views expressed in the HKS Faculty Research Working Paper Series are those of the author(s) and do not necessarily reflect those of the John F. Kennedy School of Government or of Harvard University. Faculty Research Working Papers have not undergone formal review and approval. Such papers are included in this series to elicit feedback and to encourage debate on important public policy challenges. Copyright belongs to the author(s). Papers may be downloaded for personal use only.
www.hks.harvard.edu

NBER WORKING PAPER SERIES
PRICING AND REIMBURSEMENT IN U.S. PHARMACEUTICAL MARKETS
Ernst R. BerndtJoseph P. Newhouse
Working Paper 16297http://www.nber.org/papers/w16297
NATIONAL BUREAU OF ECONOMIC RESEARCH1050 Massachusetts Avenue
Cambridge, MA 02138August 2010
Revised version to appear in Patricia M. Danzon and Sean Nicholson, eds., The Economics of theBiopharmaceutical Industry. The authors have benefited from discussions with Richard G. Frank andE. Mick Kolassa, but are solely responsible for the views expressed herein. This research was notsponsored. The views expressed herein are those of the authors and do not necessarily reflect the viewsof the National Bureau of Economic Research.
© 2010 by Ernst R. Berndt and Joseph P. Newhouse. All rights reserved. Short sections of text, notto exceed two paragraphs, may be quoted without explicit permission provided that full credit, including© notice, is given to the source.

Pricing and Reimbursement in U.S. Pharmaceutical MarketsErnst R. Berndt and Joseph P. NewhouseNBER Working Paper No. 16297August 2010JEL No. D4,I11,I18,L11,L65
ABSTRACT
In this survey chapter on pricing and reimbursement in U.S. pharmaceutical markets, we first providebackground information on important federal legislation, institutional details regarding distributionchannel logistics, definitions of alternative price measures, related historical developments, and reasonswhy price discrimination is highly prevalent among branded pharmaceuticals. We then present a theoreticalframework for the pricing of branded pharmaceuticals, without and then in the presence of prescriptiondrug insurance, noting factors affecting the relative impacts of drug insurance on prices and on utilization.With this as background, we summarize major long-term trends in copayments and coinsurance ratesfor retail and mail order purchases, average percentage discounts off Average Whole Price paid bythird party payers to pharmacy benefit managers as well as average dispensing fees, and generic penetrationrates. We conclude with a summary of the evidence regarding the impact of the 2006 implementationof the Medicare Part D benefits on pharmaceutical prices and utilization, and comment on very recentdevelopments concerning the entry of large retailers such as Wal-Mart into domains traditionally dominatedby large retail chains and the "commoditization" of generic drugs.
Ernst R. BerndtMIT Sloan School of Management100 Main Street, E62-518Cambridge, MA 02142and [email protected]
Joseph P. NewhouseDivision of Health Policy Research and EducationHarvard University180 Longwood AvenueBoston, MA 02115-5899and [email protected]

I. Introduction
The pricing and reimbursement of prescription drugs in the United States is
important for at least two reasons. First, from the perspective of US consumers,
prescription drugs constitute 12 percent of total U.S. health care spending (2008) or
roughly two percent of GDP.1 Thirty-seven percent of this amount was tax financed, with
the associated deadweight loss to finance that spending. 2
An additional 42 percent was
financed through insurance, the bulk of which flowed through employer provided and
subsidized insurance. The employer subsidies for this insurance cause distortions in the
labor market with associated inefficiencies.3 Thus, the financing of pharmaceuticals in
the U.S. is associated with various types of deadweight losses. Second, from the
perspective of all consumers, the U.S. constitutes about 40 percent of the world
pharmaceutical market. As a result, its pricing and regulatory policies materially
influence world demand and hence the incentives of pharmaceutical firms to innovate.4
In this survey chapter on pricing and reimbursement in U.S. pharmaceutical
markets, we first provide background information on important federal legislation,
institutional details regarding distribution channel logistics, definitions of alternative
price measures, related historical developments, and reasons why price discrimination is
highly prevalent among branded pharmaceuticals. We then present a theoretical
framework for pricing of branded pharmaceuticals without and then in the presence of
prescription drug insurance, noting factors affecting the relative impacts of insurance on
prices and on utilization. With this as background, we summarize major long-term trends
in copayments and coinsurance for retail and mail order purchases, average percentage
discounts off Average Wholesale Price paid by third party payers to pharmacy benefit
managers as well as average dispensing fees, and generic penetration rates, We conclude
with a summary of the evidence regarding the impact of the 2006 implementation of the
Medicare Part D benefits on pharmaceutical prices and utilization, and comment on very
recent developments concerning the entry of large retailers such as Wal-Mart into
domains traditionally dominated by large retail chains and the “commoditization” of
generic drugs.

Berndt and Newhouse “Draft Handbook Pricing Chapter”
Page 2
II. Background: Legislation, Institutions and Historical Developments
We begin with a brief background section that focuses on important U.S.
legislative developments. This lays the groundwork for our later discussion of the
marketing and pricing of generic and brand prescription drugs in the U.S. For the most
part the U.S. generic drug industry approximates competitive conditions with price
approaching marginal costs. As a result, we employ traditional microeconomic tools to
describe the structure and pricing of that industry. We defer discussion of brand pricing
in the presence of market power to later in this chapter. Next we outline the structure and
distribution logistics of U.S. markets for pharmaceuticals, distinguishing roles and prices
faced by providers from those of payers. Then, since any researcher focusing on the
pricing of branded and generic drugs in the U.S. cannot avoid encountering the critical
functions played by the misnamed Average Wholesale Price (“AWP”, aka “Ain‟t What‟s
Paid”), we digress to provide background on the origins, history and evolution of the very
important and sometimes misunderstood central role played by AWP in various segments
of the U.S. pharmaceutical industry. We conclude this section with a discussion
highlighting the demand and cost conditions facing biopharmaceutical manufacturers that
make third degree price discrimination an attractive and widespread practice.
A. Important Legislative Developments Affecting Drug Pricing
The pricing of branded and generic drugs has long been a focus of controversy.
Although Congressional attention to pharmaceutical pricing dates back further, a good
place to begin is with the Congressional hearings conducted by Senator Estes Kefauver‟s
Anti-Trust and Monopoly subcommittee between 1959 and 1962. These hearings dealt
not only with the thalidomide tragedy in which many children were born with birth
defects as a result of their mothers taking thalidomide for morning sickness during
pregnancy, but also with allegations of pharmaceutical companies engaging in various
questionable practices to realize excess profits. One writer describes the hearings as
follows:
“Witnesses told of conflicts of interest for the AMA (whose Journal, for example,
received millions of dollars in drug advertising and was, therefore, reluctant to
challenge claims made by drug company ads)…The drug companies themselves
were shown to be engaged in frenzied advertising campaigns designed to sell
trade name versions of drugs that could otherwise be prescribed under generic
names at a fraction of the cost; this competition, in turn, had led to the marketing

Berndt and Newhouse “Draft Handbook Pricing Chapter”
Page 3
of new drugs that were no improvements on drugs already on the market but,
nevertheless, heralded as dramatic breakthroughs without proper concern for
either effectiveness or safety.”5
Kefauver‟s hearings led to enactment of the Kefauver-Harris Drug Act in 1962,
also known as the Kefauver-Harris Amendments to the 1938 Food, Drug and Cosmetic
Act. Among its numerous important provisions were that sponsors of New Drug
Applications needed to document evidence of both safety and efficacy (not just safety),
that informed consent was required of patients participating in clinical trials, that the
sponsor file an Investigational New Drug application with the Food and Drug
Administration before initiating human testing, that drug advertising be required to
disclose accurate information about side effects, and provisions that stopped inexpensive
to manufacture generic drugs from being marketed as expensive drugs under new trade
names as new breakthrough medications, and that prevented the use of generic names that
were obscure and difficult to remember, a practice that manufacturers allegedly employed
to diminish generic substitution. It also mandated that a Drug Efficacy Study
Implementation be undertaken to classify all pre-1962 drugs that already were on the
market as either effective, ineffective, or needing further study.6 For our purposes here,
the Kefauver-Harris Drug Act Amendments of 1962 are notable for clarifying
distinctions between brand and generic drugs and regulating their marketing.
Another important development of the 1960s was the 1965 passage of
Congressional legislation adding Titles XVIII (Medicare) and XIX (Medicaid) as
Amendments to the Social Security Act, which took effect in July 1966. At that time,
however, Medicare covered only prescription drugs taken by hospital inpatients under
Part A and physician administered drugs (typically injections) under Part B. Part D of
Medicare which covered outpatient drugs taken orally -- small molecule drugs -- would
not take effect until 40 years later in 2006.
Also in the mid 1960s drug wholesalers envisaged a potential growth in demand
for generic drugs, and a number of them, such as McKesson vertically integrated into
manufacturing operations and began marketing their own generics. Part of the
wholesalers‟ incentive to integrate into generic manufacturing and marketing arose
because wholesaler margins were traditionally keyed to the price at which the

Berndt and Newhouse “Draft Handbook Pricing Chapter”
Page 4
manufacturer suggested the wholesaler should sell, and to the extent generics were lower
priced than brands, the prospect of manufacturers shifting their prescription drug mix
toward generics implied a reduced gross profit margin for wholesalers. Contemporary
industry analysts opined that the generic manufacturing and marketing window for
wholesalers would, however, likely be a temporary one, as new specialized generic
manufacturers entered the prescription drug market and marketed directly to the retail and
hospital sectors.7 We discuss changing dynamics in drug distribution channels,
particularly the impacts of information and communication technologies, later on in this
chapter.
A subsequent important legislative development was the Hatch-Waxman Drug
Price Competition and Patent Term Restoration Act of 1984. It established the
Abbreviated New Drug Application (“ANDA”) pathway that required only establishing
bioequivalence with the reference drug (eliminating the need to establish safety and
efficacy anew) and compliance with Good Manufacturing Practices.8 It specified that
when a generic manufacturer submitted an ANDA and successfully established
bioequivalence with the originator drug and complied with Good Manufacturing
Procedures, the Food and Drug Administration (“FDA”) was authorized to approve the
ANDA. For oral solid small molecules, along with ANDA approval the FDA assigns the
generic an A (therapeutically equivalent) or B (drug not considered therapeutically
equivalent) rating with the pioneer, thereby enabling pharmacists to substitute a generic
for the brand prescription.9 It is worth noting that the FDA‟s A rating essentially grants
complete interchangeabilty between brand and generic, or what economists would call
almost “perfect substitutability” of the brand and generic.10
A weaker form of
substitutability between different molecules occurs when, for example, payers (not
necessarily the FDA) term two different molecules as being “therapeutically
substitutable.”
B. Pricing of Generic Drugs
As noted above, the traditional microeconomic theory toolkit is mostly sufficient
for analyzing generic drug pricing. For the most part one can view generic drug
manufacturers as operating in competitive markets, taking the price of generic drugs as
given, and facing no buyer with monopsony power.

Berndt and Newhouse “Draft Handbook Pricing Chapter”
Page 5
For most small molecule pharmaceuticals (i.e., most tablets or capsules), the
process of undertaking clinical trials to establish bioequivalence and meet ANDA
requirements is inexpensive relative to establishing efficacy; estimates range from $2-5
million.11
With entry being relatively inexpensive and the regulatory pathway open and
clear, one would expect extensive generic entry following patent expiration, with price
eventually falling to marginal cost. Indeed, that is what numerous researchers have
found. Frank and Salkever [1997], Reiffen and Ward [2005], Atanu, Grabowski,
Birnbaum, Greenberg and Bizan [2006], and Berndt, Mortimer, Bhattacharjya, Parece
and Tuttle [2007] all find that price and the extent of generic entry are jointly determined.
Reiffen and Ward also report that generic price continues to fall as the number of generic
entrants increases up to five or so, but thereafter levels off. A common finding from the
literature is that the number of generic entrants increases with the size of the branded
molecule market (measured in dollars) prior to the loss of patent protection; generic entry
of oral solids tends to be more extensive than that of injectables. Scott Morton [1997,
1999] considers various aspects of generic entry decisions in detail, and finds that generic
firms tend to specialize in the therapeutic classes in which they have previous experience.
Three notable exceptions to envisaging the generic drug industry as being
competitive with price approximating marginal cost are worth noting, each involving
some aspect of market power. First, under the terms of the Hatch-Waxman Act, before or
after submitting its ANDA, a generic manufacturer who successfully prevails in
challenging the brand innovator‟s patent claims can be granted 180 days of exclusivity
during which time no other ANDA holder for that molecule/strength can market its
product. This is typically called a Paragraph IV entry.
With no further ANDA entry permitted for a period of 180 days, the market for
that particular molecule/strength becomes a duopoly, with the branded and single generic
as competitors. In such a duopoly environment, the price of generics is generally only
10-20% below that of the brand.12
A variant of this occurs when the branded
manufacturer enters into an agreement with a generic manufacturer (other than the
successful Paragraph IV entrant) to market the molecule/strength under the branded
product‟s original New Drug Application (not an ANDA). This has been dubbed
“authorized generic entry”, and it enables the branded company to continue pricing its
Berndt and Newhouse “Draft Handbook Pricing Chapter”
Page 6
branded product high after loss of patent protection, and rather than ceding all generic
sales to the single successful Paragraph IV entrant, it can share generic revenues with its
collaborating “authorized generic” entrant in a triopoly environment for up to 180 days.13
Following the 180 day Paragraph IV exclusivity period, generic entry tends to be
substantial, with generic prices falling sharply. The presence of authorized generic entry
does not appear to adversely impact the extent of subsequent generic entry post-180 day
exclusivity, although it might do so in cases where the size of the potential generic
market is small.14
A second exception involves what is called “branded generics”. For example, a
common feature observed in antidepressant markets in the 1980s following loss of patent
protection was primarily branded manufacturers other than the original patent holder
entering with similar strength (or with the off-patent molecule in combination with other
molecules) therapeutic formulations but branded with other than the generic name. 15
Branded generics attempt to differentiate themselves from both the original branded
patent holder and other generic entrants, and charge prices in between the generic and the
original brand. While not particularly successful in the last few decades, branded
generics may be rejuvenated in the context of biosimilars, as we discuss next.
A third potential exception to generic or patent expiration follow-on markets
being approximated as competitive with price close to marginal cost involves biologics,
as distinct from small molecules. Prior to 2010 there was no procedure for generic entry
of biologics, now dubbed “biosimilars.” Section 7002 of the 2010 health care reform
legislation (the Patient Protection and Affordable Care Act), however, established the
authority for the licensure of biosimilars, which are intended to provide price competition
for the original biologic; it granted the original biologic 12 years of market exclusivity.
The term biosimilar rather than generic drug is used not only because biologics
are considerably larger and more complex molecules than are synthesized small
molecules, and tend to be more challenging and costly to manufacture,16
but also because
their larger size and complexity implies possibilities of their surfaces folding in different
ways, thereby not blocking receptor sites as uniformly as synthesized small molecules.
Hence, characterizing them analytically and establishing bioequivalence between the
original biologic and an attempted follow-on biologic entrant raises difficult scientific

Berndt and Newhouse “Draft Handbook Pricing Chapter”
Page 7
issues and challenges with important economic implications. In particular, because of
greater manufacturing costs and complexity, difficulties in establishing bioequivalence
and meeting other regulatory requirements, it is widely anticipated that the extent of
follow-on biologic entry subsequent to loss of patent protection will be considerably less
than has historically been observed with chemically synthesized small molecules.17
A
consequence of this is that biosimilars are unlikely to experience the same degree of price
competition following loss of patent protection as brands that A or B-rated bioequivalent
small molecules have encountered in the US.18
Instead, as the 2010 health care reform
legislation is implemented, one will likely see competition from something akin to
“branded generics,” products that are less than perfectly substitutable with the branded
biologic pioneers, but nonetheless positioned to act as possible therapeutic equivalents.
Hence, price declines of biologics following loss of patent protection are likely to be
notably smaller than have occurred historically with generic small molecules.
C. Distribution Channel Logistics and Pricing
Before initiating our discussion of the supply prices of branded drugs, we believe
it useful to outline several logistical and transactional aspects of biopharmaceuticals, both
generic and brand, including use of a variety of distribution channels. Observed prices of
even the same biopharmaceutical will differ in various transactions simply because the
drug pathway involves distinct distribution channel transactions.
It is important to distinguish consumers, providers and payers. We designate
providers of pharmaceutical products as those entities that actually purchase and take
both title and physical possession of biopharmaceutical products, either directly or
indirectly providing them to consumers. Providers include retail and mail order
pharmacies, various wholesalers, hospitals, and physician offices that administer
medicines (typically by intravenous, infusion or injection). In comparison, payers such
as health care plans, pharmaceutical benefit managers, most group purchasing
organizations and employers, typically do not take title to and physical possession of drug
products, but instead reimburse providers for the purchases they or their beneficiaries
have made. Despite their name payers do not actually purchase drugs, and the prices
involved in the transactions in which payers engage are not the purchase prices of drugs
from manufacturers or wholesalers.

Berndt and Newhouse “Draft Handbook Pricing Chapter”
Page 8
Brand manufacturers of small molecules sell their drugs primarily to certain
providers, particularly wholesalers and chain warehouses, and have relatively limited
direct sales to hospitals, retail and mail order pharmacies, and physician offices.19
The
price at which brand manufacturers sell to wholesalers and chain warehouses is generally
the Wholesale Acquisition Cost (WAC), a published list price, minus a few percent
discount for prompt payment and other incentives. In turn, wholesalers sell branded small
molecules to retail and mail order pharmacies, usually at the present time at a few percent
above their WAC, and at a 15-20% or larger discount off of what is known as the
misleadingly named Average Wholesale Price (“AWP”).20
Wholesalers face different markets for branded and generic drugs. They can
purchase branded drugs only from a single manufacturer, whereas they can purchase
most generic drugs from many manufacturers. As a result, they can create price
competition among the various generic manufacturers of a particular small molecule.
Large retail chains also buy directly from generic manufacturers, pitting one generic
manufacturer against others to obtain the lowest generic price. As a result, gross profit
margins for both wholesalers and large retail chains are larger for generic than branded
small molecules.21
In contrast, many biologics are administered via injection or infusion by health
care providers (i.e., physicians and nurses), rather than being patient self-administered
oral tablets or capsules purchased from retail or mail order pharmacies. As a result,
manufacturers of branded biologics sometimes sell directly to hospitals and physician
offices rather than to the wholesalers to which the branded small molecule manufacturers
usually sell. Firms known as “specialty pharmaceuticals,” however, often provide
wholesaler-type intermediary services between biologic manufacturers and providers.
Although the practice is not as firmly ingrained as it is with branded small molecules,
biologic manufacturers generally sell products to the specialty pharmaceutical firms at a
slightly discounted WAC, and often at slightly higher prices to the providers who are
buying directly.
Over the years a variety of intermediary services for all drugs have increasingly
been provided by pharmaceutical benefit managers (“PBMs”). Services provided by
PBMs include benefit design and contracting with manufacturers for third party payers

Berndt and Newhouse “Draft Handbook Pricing Chapter”
Page 9
(insurers, employers, governments); pharmacy network formation; real time prescription
benefit eligibility certification and claims processing; formulary management and rebate
negotiations with manufacturers, payers and pharmacies; drug utilization screening and
review; operation of mail order pharmacies, and other functions. Although PBMs are a
critical component of the third party drug benefit system, in general they do not directly
purchase prescription drugs from manufacturers, take title or physical possession of the
product, or provide the drug product to the patient. Rather, they are best viewed as
intermediary payers. If, however, the PBM owns a mail order pharmacy, as large PBMs
do, then the PBM‟s mail order pharmacy may perform provider services directly to
patients.
Because of the multitude of agents involved in pharmaceutical transactions, a
variety of ex post reconciliations and “true ups” occur. One of these is the chargeback.
It arises because, as noted above, few brand manufacturers sell directly to providers,
instead distributing their products primarily via wholesalers. Suppose that a
manufacturer negotiates with a third party payer (“TPP”) or group purchasing
organization (“GPO”), which does not take title to the product, a discounted price that is
below the price the manufacturer charged the wholesaler. Pharmacies contracting with
the TPP or members of the GPO purchase from the wholesaler at the contractually agreed
on TPP/GPO price. The chargeback is the difference between the manufacturer‟s price
charged the wholesaler and the manufacturer‟s contract price with the TPP/GPO and
makes the wholesaler whole. Typically the wholesaler submits chargeback requests to
the manufacturer on a regular basis, and the manufacturer transfers the invoiced
chargeback to the wholesaler via electronic data interchange.
In addition to chargebacks, various forms of rebates are common in
pharmaceutical transactions. Manufacturers contracting with TPPs/GPOs and PBMs
often have market share or absolute number/dollar provisions that provide financial
incentives for the TPPs/GPOs/PBMs to meet certain targets. e.g., a 10% of WAC rebate
if brand x attains 40% of all dispensed prescriptions in a given, well-defined therapeutic
class, and 15% if it attains 50%. Depending on the extent to which targets are attained or
exceeded, manufacturers pay these organizations rebates. Since whether such target
thresholds have been reached can typically only be determined retrospectively, these

Berndt and Newhouse “Draft Handbook Pricing Chapter”
Page 10
rebates (or at least a portion of them) are paid ex post at regular intervals. PBM contracts
with network pharmacies often contain similar rebate provisions, as do PBM contracts
with TPPs.22
To this point we have not dealt with prices paid by consumers, be they completely
cash paying uninsured or the much larger number of consumers whose insurance covers
drugs. Regarding the latter, TPPs have attempted to constrain rising pharmaceutical
expenditures by exerting financial pressures on the patient, altering cost-sharing
provisions between the insurer and the insured consumer. Initially drug insurance
involved the insured‟s paying a copayment (a fixed dollar amount, usually for a month‟s
supply) or a coinsurance rate (a fixed percentage of the total cost) irrespective of the
specific drug bought. Drug insurance also involved the insurer‟s establishing a
formulary, which was simply a list of drugs covered by the insurer. Formularies could be
open or closed. Open formularies essentially cover all drugs approved by the FDA,
whereas closed formularies cover only a subset of FDA approved drugs; for those drugs
not covered, the insured must pay the full pharmacy price.
Drug benefit cost-sharing provisions have evolved over the last two decades, with
the key innovation being to charge the customer different amounts for different drugs.
When drug insurance was first introduced, the consumer typically paid the same
coinsurance rate for any drug, but now the price paid by the customer depends on which
“tier” the drug is placed. The first tiered plans typically had two tiers, but as we come to
in Section IV, now there are usually three or even four. In such an arrangement, generic
drugs will typically be on the lowest or cheapest (to the consumer) tier. When a customer
brings a prescription for a generic drug on the first tier to the pharmacy, the customer
pays the pharmacy a relatively small amount, say $10 for a 30-day prescription. The TPP
or its PBM pays the pharmacy the remaining cost of the drug and a dispensing fee.
Relatively few benefit plans have many branded drugs on their first tiers, although
occasionally a formulary will have an off-patent brand on the first tier.
Depending on the result of negotiations among the manufacturer and the PBM or
TPP, for a given therapeutic class of drugs (e.g., anti-depressants) the insurer has one or
more preferred brands on the second tier. A customer presenting a prescription to a

Berndt and Newhouse “Draft Handbook Pricing Chapter”
Page 11
pharmacy for a branded drug on the second tier faces a larger copayment, say $25 for a
30-day prescription, with the TPP or its PBM picking up the balance.
Brands for which the TPP or PBM was unable to negotiate a favorable price (from
its perspective) are placed on the third tier. To incentivize customers and their
physicians to substitute away from these non-preferred brands, copayments for third tier
brands are considerably higher than for the second tier, say, $50 for a 30-day
prescription. Finally, certain very costly drugs, such as the oncology and rheumatoid
arthritis biologics that can cost thousands of dollars per month, may be placed on a fourth
tier. Even if the lower three tiers have increasingly higher copayments, the fourth tier, if
the plan has four tiers, almost always has a coinsurance rate, perhaps 20-30%.
A relatively recent innovation involves prescriptions for maintenance drugs
(drugs used to treat chronic rather than acute or episodic conditions). TPPs and PBMs
now incentivize customers to obtain such drugs via mail order in 90 day prescriptions by
making the copayments for 90 day prescriptions less than three times the 30 day
copayment, often twice the 30 day copayment.23
Another, even more recent innovation is
to reduce cost sharing amounts for specific drugs (or specific classes of drugs) to
encourage compliance and potentially reduce hospital and physician costs. We discuss
this development below.
D. The Long-Lived, Ubiquitous but Misnamed Average Wholesale Price
In almost all brand drug transactions, reference is made to a “price” called the
Average Wholesale Price (“AWP”). Although the role of AWP as a reference or
benchmark price from which various discounts are taken is critical for contracting in
these markets, the AWP is sometimes misunderstood, in part because it is neither an
average nor a wholesale price.24
D.1 The Creation and Evolution of Average Wholesale Price
We now digress, initially to discuss the creation and evolution of the Average
Wholesale Price “AWP”) as a reference or benchmark for the pricing of numerous
pharmaceutical transactions. Following Congressional passage of the federal Medicaid
enabling legislation in 1965, the various states were required to develop beneficiary and
reimbursement practices, subject to approval from the Health Care Financing
Administration (“HCFA”, now the Centers for Medicare and Medicaid Services,

Berndt and Newhouse “Draft Handbook Pricing Chapter”
Page 12
“CMS”). At that time, numerous small wholesalers existed, and while prices of
prescription drugs were very low by current standards, they varied enormously. Large
third party payers were coping with how to reimburse pharmacies for prescription
pharmaceuticals they acquired and dispensed. Around the same time, in 1967 the United
Auto Workers reached a precedent-setting agreement with Ford Motor Company
enshrining drug insurance benefits as part of Ford employees‟ benefit package. In both
the private and public sectors, therefore, insurance covering prescription pharmaceuticals
was becoming an increasingly important benefit. How would such drug insurance
benefits be administered and claims processed efficiently among private and public
payers, pharmacies and beneficiaries?
According to George Pennebaker [1998], early on California Medicaid program
designers, who were conceiving a formula to facilitate reimbursement to pharmacies for
costs incurred in dispensing prescription drugs to beneficiaries, focused on a total or
aggregate reimbursement that consisted of a dispensing fee plus a reimbursement of
acquisition costs. Regarding dispensing fees, under the leadership of Bill Apple, the
American Pharmaceutical Association advocated a flat professional fee per dispensed
prescription, independent of the pharmacy‟s acquisition cost (thereby covering overhead
costs and mitigating moral hazard issues to dispense ever costlier drugs, but not
reimbursing pharmacies for inventory holding costs). Third party payers were
sympathetic to this notion, as were pharmacy associations, but each struggled with how
to determine pharmacy acquisition costs. For large payers, the number of invoice
transactions was in the millions. Computers and information communication systems had
not yet diffused widely. Third party public and private payers believed it was infeasible
to check each pharmacy‟s invoices, but allowing pharmacies simply to declare their costs
to be whatever they decided would create perverse incentives. A standard or reference
price was needed to facilitate pharmaceutical claims processing and reimbursement.
Officials at MediCal, California‟s Medicaid prescription drug program, had
helped in writing the federal Title XIX legislation.25
Pennebaker, the first pharmacist
hired by MediCal in November 1966, had to deal with reimbursing about 5,000
pharmacies who dispensed drugs to three million MediCal beneficiaries, at that time the
largest third party drug benefit program in the nation. The major private sector program

Berndt and Newhouse “Draft Handbook Pricing Chapter”
Page 13
with prescription drug benefits at the time was Blue Shield. Its reimbursement method
required the pharmacy laboriously to fill out a four part carbon paper form, with the
physician and pharmacy each keeping one copy, with two copies sent to Blue Shield.
According to Pennebaker, after checking with several large wholesalers (Amerisource,
Bergen Brunswick and McKesson), several independent wholesalers, and Blue Shield
pharmacy analyst Bill Thompson, Pennebaker and his fellow MediCal pharmacist Vic
Boisseree estimated informally, without any extensive mathematical calculations or
precision, that pharmacies were “roughly on average with considerable variability” being
reimbursed at the pharmacy‟s acquisition cost plus a 35% markup and a $1.00 - $1.25
dispensing fee.26
To facilitate California pharmacy buy in, Pennebaker and Boisseree
decided to maintain or very slightly increase the total pharmacy reimbursement, but
change the methodology so that the dispensing fee would be $3.25. The $2.00 - $2.25
increase from $1.00 - $1.25 in the dispensing fee component corresponded with 35% of
an actual pharmacy acquisition cost per prescription ranging between $5.71 and $6.43,
which he thought was in the reasonable range of average pharmacy acquisition costs.
Though he and Boisseree never explicitly defined AWP, Pennebaker named this “rough
average” of actual pharmacy acquisition costs Average Wholesale Price, writing those
words, in their first known usage, on his yellow paper pad.
As they traveled across California visiting pharmacies to explain the MediCal
reimbursement policy of AWP plus $3.25 dispensing fee, they were met with mixed
reactions, although particularly sympathetic support emerged because of its conceptual
and administrative simplicity. The major problem with implementing it was that at the
time there was no list of AWPs for commonly dispensed prescription drugs, as AWP was
not a term that was then being used in pharmaceutical transactions.
During the 1960s and 1970s and to some extent still today, pharmaceutical
manufacturers differed in the extent to which they sold directly to pharmacies and other
providers vs. indirectly via wholesalers and chain warehouses. When selling directly to
providers, manufacturers also varied in the extent to which they provided information
publicly on what prices manufacturers suggested retail pharmacies charge consumers.
Drug Topics Red Book was one of several directory or catalog publications summarizing
various drug prices; these catalogs served as a resource for pharmacists. Annual Red

Berndt and Newhouse “Draft Handbook Pricing Chapter”
Page 14
Book catalog prices (supplemented twice yearly in January and May) provided
information on “suggested selling price to consumer” and “cost price to the retail
druggist”27
at various drug strengths and package sizes. Prices paid by the retail druggist
to acquire drugs were named “Trade List Prices”, and were separately identified as to
whether the price referred to prices paid by the retailer on direct orders from the
manufacturer, or by the retailer to the wholesaler.
Pennebaker‟s wish for someone authoritatively to publish figures corresponding
to his notion of AWPs was soon fulfilled with the September 1969 publication of the
1970 annual edition of Drug Topics Red Book. The cover page of this Red Book
highlighted a new product feature: “The only price directory in the drug field that shows
Average Wholesale Prices and keeps up-to-date with supplements.”28
Inside on the
Product Information page, the 1970 Red Book explained (with some imprecision):
The price paid by the retailer to the wholesaler is either that suggested by the
manufacturer or an independently determined Average Wholesale Price which is
preceded by the symbol “(AWP)”. For the first time in the drug field the 1970
Drug Topics Red Book has procured and reports these Average Wholesale Prices
for those drug products where the manufacturer has not suggested a price to be
charged by wholesalers to indirect purchasing retailers. It has been independently
obtained and calculated by the Red Book’s editorial staff from a representative
group of wholesalers located in different areas throughout the country…There has
been a long felt need for this type of price information and Drug Topics Red Book
has gone to considerable effort to compile a meaningful price for its subscribers.
It is hoped that the Average Wholesale Price may be used as a guide by
wholesalers and retailers and the government agencies. Although this price is
designed to show the average price retailers throughout the country are paying to
the wholesaler for a particular item, it is not intended to be a standard or
established price.29
The 1970 Red Book continued to distinguish a manufacturer‟s price charged to direct
customers from prices retailers paid to wholesalers, but beginning in 1970 added AWP
figures, calling all of them “trade list prices”. Subsequent annual issues of the Red Book
continued publication of the AWP, clearly designating it as a list price.30
Within months, a competitive price catalog publication, the American Druggist
Blue Book 1970, also began publishing AWP, referring to it as a “trade list price” through
1975. In 1976, however, the Blue Book did away with the “trade list price” column
heading and instead simply separately listed a new “Average Wholesale Price” and

Berndt and Newhouse “Draft Handbook Pricing Chapter”
Page 15
“Direct Net Price”, stating in a footnote that the former was “Based on latest Blue Book
surveys.” The Blue Book also added a new “Suggested Wholesale Price.”31
The 1977
April update replaced the previous years‟ footnote to Average Wholesale Price with an
elongated dagger symbol referring to “Manufacturer‟s Estimated AWP” prices.32
A 1994
publication stated “BLUE BOOK AWP is either the published suggested wholesale price
obtained from the manufacturer/labeler or the price commonly charged by wholesalers as
determined by survey.”33
Notably, George Pennebaker apparently never asked Red Book
or Blue Book how they in fact obtained their estimates of AWP, stating simply that he
thought the published AWP figures “looked reasonable”.34
D.2 Relationships Between Branded AWP and Branded WAC
Having discussed the creation and early evolution of the AWP notional price, we
now turn to why it was that for most branded drugs in the 1970s and 1980s (and in many
cases continuing on to this day), AWP tends to be 20% or 25% greater than WAC,
implying that WAC is usually 16.7% or 20% smaller than AWP. The source of this
relatively stable relationship for brands has been identified by Kolassa [1994]:
The AWP, the most common figure used for drug price comparisons, is a vestige
of a drug distribution system that disappeared in the early 1980s. Prior to that
time, there were several hundred small, independent drug wholesalers, each
operating regionally. Due to the inefficiencies of such a fragmented system, the
operating costs were quite high. The average markup above cost by these
wholesalers to their retail customers, primarily pharmacies, was 20% to 25%,
depending on manufacturer. The manufacturer differences were due to the fact
that, while most pharmaceutical manufacturers used a wholesaler-only method of
distribution to the retail class of trade, a significant number of large firms had
invested in their own distribution networks and preferred „direct‟ sales over the
use of wholesalers. By convention, wholesalers added 20% to the price of
products from companies following a wholesaler-only policy while adding 25% to
the prices of products from those companies who chose to „compete‟ with the
wholesalers. At that time, virtually all pharmaceutical companies sold products
directly to hospitals that did not use wholesalers. As a result, less than one-half of
the pharmaceutical products sold in the United States were handled by drug
wholesalers in the early 1970s.35
While Kolassa‟s observations help explain sources of the 20% or 25% wholesaler
markups to retailers, there is ample evidence that since the 1980s these wholesaler
markups have declined substantially, with pharmacies acquiring branded drugs at
discounts that approach 20% off of AWP, consistent with WAC plus a few percentage

Berndt and Newhouse “Draft Handbook Pricing Chapter”
Page 16
points. This raises at least two issues: Why did the decline in wholesaler markups to
retailers occur, and in the face of this trend, why has the ratio of AWP to WAC remained
relatively stable for branded drugs? We first examine published trends in pharmacies‟
ability to purchase branded prescription drugs at increasing discounts off AWP over time.
D.3 The Declining Markups of Drug Wholesaler Sales to Retailers
Already in the late 1960s, evidence was accumulating that drug wholesaler
margins were declining. Based on published data from the National Wholesale
Druggists‟ Association, Keller [1969] reports that wholesalers‟ gross margins had fallen
from 18% in 1950 to 15.3% of net sales in 1966, even as net profit before taxes fell from
4.1% to 2.9% of net sales; most of that margin decline occurred in the 1960s. The
decline in drug wholesaler gross margins continued, however, falling to 14.4% in 1970
and then accelerated in the 1970s to 11.9% in 1977, the last year for which data are
reported.36
The sustained decline in wholesaler gross margins reflects several offsetting
trends. Fay [1980] documents the gradual increase over time in operating expenses until
about the early 1960s, peaking at 14.0% of sales in 1961, then gradually declining to
12.3% in 1970, and falling more sharply in the 1970s, to 10.2% in 1977, the last year for
which he reports data .37
Part of the reason was the increasing cost during the 1950s of
servicing geographically diffused pharmacies with an ever wider array of over-the-
counter and prescription-only products. Beginning in the 1960s, however, the diffusion
of information and communications technologies and the rationalization of product
distribution logistics reduced operating costs. Throughout the 1957-77 time period,
however, wholesaler discounts granted to pharmacy clients steadily increased – from
2.4% of net sales in 1957, 3.0% in 1963, 4.6% in 1967, 5.3% in 1970 and 6.5% in 1977.38
Fay [1980, p. 37] quotes from the 1976 National Wholesale Druggists Association annual
report, which stated “Almost every dollar gained in the operations area has been in turn
dissipated through increased discounts.”
The increasing cost phenomenon during the 1950s actually favored large
wholesalers over brand manufacturers, for branded drug manufacturers had much less
scale and scope than did the large wholesalers, and as a result likely experienced even
greater increasing costs in maintaining direct distribution to retailers. The increasing

Berndt and Newhouse “Draft Handbook Pricing Chapter”
Page 17
costs of maintaining distribution networks with pharmacies not only created incentives
for brand manufacturers to shed direct distribution with multiple regional warehouses and
change to indirect sales networks via wholesalers with increasingly rationalized
warehousing, but it also created incentives for consolidation among the wholesalers.39
Consolidation during the 1960s and 1970s was likely driven in large part by
computerization and the associated exploitation by wholesalers of economies of scale and
scope. F.D.C. Reports [1966], publisher of a general pharmaceutical industry trade
publication called The Pink Sheet, observed that a likely very powerful force changing
the dynamics of wholesaling was the advent of electronic processing equipment that
enabled wholesalers to improve the efficiency of their operations, exploit prospects for
tying customers to a single wholesaler by offering to maintain continuing inventory
records, provide pharmacies with software, and assist them in the installation of data
phones tied to electronic equipment. Fay [1980, p. 42], cites in particular the role of
automation of order entry processing:
“…the automation of the order entry process between retailer and wholesaler is
clearly most important since it leads to all of the efficiencies and cost reduction
inherent in the single source concept – a retailer concentrating nearly all of his
orders with one supplier.”40
A related phenomenon affecting wholesale druggists was the emerging invasion
of the retail trade more generally – not just the retail drug trade – by mass merchandisers
and food chains. Recall that during the 1970s, following the pioneering practices of Sam
Walton‟s WalMart and other “superbox” retailers, widespread implementation of
information and communications technological developments significantly impacted the
rationalization of wholesaler-retailer or distribution center-retailer logistics, giving rise to
new networks of automated distribution centers and “just in time” inventory
management. Along with the increasing ability to monitor transactions in real time,
thereby more efficiently managing inventory and product shipping, these developments
exploited economies of both scale and scope, and in the process led to the demise of
many small retail and wholesale firms. Kolassa [1994, pp. 236-7] describes how
consolidating pharmaceutical wholesalers adopted more sophisticated inventory control
systems and expanded software and communications hardware services to their client
retail pharmacies and hospitals. Fay [1983] provides additional details on how computer

Berndt and Newhouse “Draft Handbook Pricing Chapter”
Page 18
and information technology developments affected wholesaler-retail interactions in the
pharmaceutical industry.41
With increasing consolidation among wholesalers, competition from mass
merchandisers and food chains, and inexorable technological developments that
facilitated exploitation of economies of scale and scope, thereby reducing product
distribution and transaction monitoring costs, one would expect that prices charged
retailers by wholesalers would have reflected increasing discounts off AWP. Note that if
there is a relatively stable relationship of brand AWP list prices being 20% or 25%
greater than brand WAC list prices, the actual discounts off AWP granted by wholesalers
to retailers have an upper limit of about 20%; to the extent generic products have larger
discrepancies between AWP and WAC, the average discount could be even greater. In
fact, increasingly large discounts off AWP have been documented in a number of studies,
both for brand and generic purchases by retailers from wholesalers.
Over the years, the Office of Inspector General (“OIG”) at the U.S. Department of
Health and Human Services has conducted and publicly disclosed results of a number of
investigations comparing Medicare and Medicaid reimbursement rates with commercial
pharmacies‟ and providers‟ acquisition costs. For example, using 1994 invoice data
sampled from Medicaid pharmacy providers in 11 states, the OIG found that pharmacies
on average acquired branded drugs from wholesalers at an 18.3% discount off AWP.42
Using 1995 data, a year when Medicare Part B physicians and suppliers were being
reimbursed for branded and generic drugs at AWP - 5%, another OIG study concluded
that for 22 drug codes representing Medicare‟s largest Part B dollar outlays, the average
discount over both brand and generic drugs was 29%.43
A 2001 OIG study using 1997
Medicaid data from pharmacy invoices in eight states found that for these states, the
average pharmacy acquisition cost for brands involved a 21.8% discount off AWP, an
increase from the 19.3% observed in these states using 1994 data. OIG also compared
WAC to actual acquisition prices for pharmacies, and determined that invoice prices
were, on an average national basis, 1.8% below WAC.44
Discounts off AWP list prices
for generics were much larger, increasing on average from 55% off list using 1994 data to
65.9% based on 1997 invoice transactions.45
Moreover, discounts off AWP were not
confined to major government programs such as Medicare Part B and Medicaid, but also

Berndt and Newhouse “Draft Handbook Pricing Chapter”
Page 19
occurred in the private sector. For example, referring to a 1993 report issued by the
General Accounting Office, the Congressional Budget Office (“CBO”) in 1996 noted that
private payers also received large discounts off AWP, stating “A recent General
Accounting Office (GAO) survey found that four HMOs received an average discount off
the published list price of 32 percent in 1990 and 34 percent in 1991 on their top 100
outpatient drugs.”46
Given that Medicare and Medicaid drug reimbursement rates to pharmacies used
discounts off AWP that were much less than pharmacies were actually receiving, the
declines in markups attained by wholesalers translated into increasing ingredient cost
margins for pharmacies, particularly for generic drugs. In a 2004 CBO study that defined
pharmacy markups as “the dollar difference between the total amount that Medicaid pays
the pharmacy for each prescription and the amount that the pharmacy or wholesaler pays
the manufacturer for the drug”47
, the authors concluded that “Between 1997 and 2002, by
CBO‟s estimates, the average markup increased by nearly 60 percent – rising from $8.70
to $13.80 per prescription, or by about 9.7% per year.” CBO went on further, noting that:
Much of the increase in the average markup was attributable to the use of
relatively new generic drugs. For generic drugs that came on the market between
1997 and 2002, Medicaid reimbursed pharmacies an average of about $46 per
prescription in 2002, of which only about $14 went for the purchase of the drug
itself. Pharmacies and wholesalers retained the remainder, or markup, of about
$32 per prescription.”48
In summary, the combination of wholesaler consolidation and their exploitation of
economies of scale and scope, facilitated by technological progress embodied in ever
lower cost computers and information technology software and equipment, resulted in
wholesaler markups and margins diminishing considerably over time, as actual pharmacy
acquisition costs were increasingly discounted off the AWP list price.
The final issue we address in this lengthy digression on AWP pricing is why is it
that branded manufacturers did not bring actual pharmacy acquisition costs closer to
published AWPs. In other words, why have AWPs adhered to the 20% or 25% formulaic
markup over WAC?

Berndt and Newhouse “Draft Handbook Pricing Chapter”
Page 20
D.4 Factors Locking in Branded Drugs’ AWP to WAC Relationships
As the Drug Topics Red Book data description quoted above made clear, not all
brand manufacturers provided data on the AWP of their drugs; others instead provided
some form of alternative “suggested price.” In addition to surveying wholesalers and
thereby generating their own estimates of AWP for data non-supplying manufacturers,
price catalogs such as the Red Book and the Blue Book were able to generate AWPs for
manufacturers who previously had but no longer provided such data by examining
whether historically the manufacturer had a 20% or 25% markup over WAC for its AWP
or other “suggested price”, and continued to use that markup factor in generating their
AWP.
Given the virtual universal presence of an AWP for drug products, whether
supplied by the manufacturer or estimated by the price catalogs, transaction prices
involving wholesalers, PBMs, pharmacies and other providers could all be specified with
reference to AWP minus some x% discount. For example, a pharmacy could acquire all
its brand drugs from the wholesaler at AWP – 18%, could be reimbursed by PBMs for
dispensing any of its brand drugs at AWP – 13%, even as PBMs contracted with third
party payers for all their brand drug costs at AWP – 10%. In this example, pharmacies‟
gross margin would be 5% of AWP for all its brand drug sales, while the common margin
for PBMs would be 3% of AWP.
The important point is that even though few if any transactions actually took place
at the AWP price, the notional AWP served a valuable role as a common focal or
reference point from which various discounts could be negotiated. While in theory
pharmacies, PBMs and payers could negotiate separate AWP discounts that varied by
manufacturer or drug, this would make electronic transactions more complicated and
vulnerable to error. Rather, it was much simpler and more efficient for various contracts
among PBMs, pharmacies and payers to specify the same percent off AWP for all
branded drugs, regardless of manufacturer. Given AWP data entry into the networked
computer system, very large numbers of various transactions among manufacturers,
wholesalers, chain warehouses, retail and mail order pharmacies, other providers, PBMs
and private and governmental payers could be processed and finalized expeditiously,
efficiently and monitored very accurately. Hence, even though some observers

Berndt and Newhouse “Draft Handbook Pricing Chapter”
Page 21
accurately called AWP “Ain‟t What‟s Paid,” AWP played a critical role in facilitating
efficiently millions if not billions of transactions among the various manufacturers,
providers, and payers49
.
As wholesalers over time increasingly discounted off AWP in their sales to
pharmacies and other providers, the “spread” between AWP and providers‟ actual
acquisition costs increased. For some providers, such as physicians providing Medicare
Part B drug benefits (e.g., chemotherapy, other injected and infused therapies), the spread
between AWP and the provider‟s actual acquisition costs became an increasingly
significant source of practice revenues. In the 1980s, for example, Medicare reimbursed
these providers at full AWP, and in the early 1990s, at AWP – 5%. Any single
manufacturer attempting to bring its AWP more in line with medical practice actual
acquisition costs by unilaterally reducing its AWP and then discounting it less
aggressively than its competitors would have been competitively disadvantaged, for as
discussed above both Medicare and private contracts uniformly specified a common
discount off AWP for all manufacturers.
To see this, consider the following. In the above Medicare Part B example, if in
the 1990s a manufacturer decided unilaterally not to discount off AWP, all providers
being reimbursed by Medicare Part B at AWP – 5% would lose 5% of AWP with every
purchase; as AWP increased over time, the absolute amount of dollar losses incurred by
the provider would increase. Each manufacturer unilaterally considering reducing AWP
discounts to bring AWP closer to actual acquisition costs faced the same disincentive. In
the language of economics and game theory, staying with the notional and in some sense
“unrealistic” AWP system was a Nash equilibrium; it was competitively optimal for each
manufacturer to adhere to the traditional WAC-to-AWP markup, given what other
manufacturers (and the system of contracts) were doing. In short, individual
manufacturers were locked into the AWP system, even if they wanted to change it.
An alternative possibility among brand manufacturers would involve their
agreeing in a coordinated manner simultaneously to reduce their AWP so that it would be
much closer to actual provider acquisition costs. In order to ensure that relative new
AWPs would be preserved across manufacturers from relative old AWPs, thereby
mitigating problems of gaming, the brand manufacturers would need also to agree to

Berndt and Newhouse “Draft Handbook Pricing Chapter”
Page 22
reduce their new AWPs by a common percentage from their old AWPs. Moving AWPs
to more closely approximate providers‟ actual acquisition costs would have required
coordination.
One problem with such a coordinated mutual reduction in manufacturers‟ AWPs
is that such actions would likely invite antitrust scrutiny and challenge from the U.S.
Department of Justice. Notably, such antitrust concerns apparently occurred in the early
1990s when pharmaceutical manufacturers considered and then rejected the idea of
mutually pledging to keep brand name drug prices from rising more rapidly than the
Consumer Price Index, a proposal that the then Assistant U.S. Attorney General Anne
Bingaman indicated
“…would violate the antitrust laws. An agreement among independent
competitors that interferes with free and open price competition by restraining
individual pricing decisions is a per se violation of the Sherman Act. The per se
rule has been applied to agreements among competitors that fix or set the prices at
which goods or services are sold as well as agreements that set price-related terms
but not the specific price at which transactions occur.”50
Hence, such coordination among manufacturers attempting mutually to bring their AWPs
more in line with providers‟ actual acquisition costs was infeasible since it was illegal.
Yet another possibility would be that major public sector purchasers, such as the
Health Care Financing Administration (later renamed the Centers for Medicare and
Medicaid Services, “CMS”) and the Veterans‟ Administration could require that
information on actual acquisition and/or manufacturers‟ net revenues be made public, or
at least be disclosed on a confidential basis to major public (and possibly private) sector
payers. In fact, several variants of that possibility have emerged from legislation.
Specifically, when Congress passed the Omnibus Budget Reconciliation Act of
1990 (“OBRA 90”), it specified that the Medicaid programs receive a rebate that was the
lower of a “best price” to a private purchaser, or 15.1% off the Average Manufacturer‟s
Price (“AMP”) for each drug, plus an allowance for inflation over and above that of the
CPI. AMP was defined in federal law as the average price (including cash discounts and
other price reductions) paid to drug manufacturers by U.S. wholesalers for drugs
distributed to the retail class of trade. Retail here included mail order operations
dispensing to patients. In turn, “best price” was defined in federal law as the lowest price

Berndt and Newhouse “Draft Handbook Pricing Chapter”
Page 23
(including cash discounts and other price reductions) available from the manufacturer to
any U.S. wholesaler, retailer, provider, health maintenance organization, nonprofit entity,
or government entity, with some exceptions. In order to participate in Medicaid,
manufacturers must report both AMPs and best prices. While CMS could audit
manufacturers to ensure the accuracy of the manufacturer‟s AMP and best price
computations, the law required that CMS maintain the confidentiality of this AMP
information, which therefore was not publicly available.51
In part because the various states‟ Medicaid agencies were continuing to
reimburse pharmacies at considerably smaller discounts off AWP than private payers
were paying pharmacies, enabling pharmacies to retain the spread between their
discounted AWP reimbursement and actual acquisition costs, in 2005 the Bipartisan
Commission on Medicaid Reform recommended a change from AWP list prices to AMP
actual prices, stating:
“There is widespread acceptance that AWP is inflated and does not reflect a valid
benchmark for pricing. A different reference price should be established and
made available to the states that more accurately reflects the actual price for
drugs. The Average Manufacturer Price (AMP) should be used for this
purpose.”52
For multiple source (generic) drugs dispensed to Medicaid recipients, the
maximum amount a state Medicaid agency can reimburse a pharmacy is called the
Federal Upper Limit (“FUL”).53
Over the years the FUL has been computed based on a
somewhat complex procedure involving AWPs of generic drugs. States can choose to
establish reimbursement limits below the FUL at a state maximum allowable cost
(“MAC”). State-specific programs also establish dispensing fee and patient copayment
policies, which have varied considerably among the states. As a general rule, the state-
specific lists typically include more drugs, list newly available generic drugs more
quickly, and establish more aggressive (i.e., lower) reimbursements than does the FUL
list. Private payers also create their own MACs, whose construction details are typically
proprietary.54
The Deficit Reduction Act of 2005 (“DRA”) mandated that CMS change the way
in which FUL was determined for multiple source drugs using the formula AMP times
250%. AMP data was also to be published on the Internet. Final Rules for implementing

Berndt and Newhouse “Draft Handbook Pricing Chapter”
Page 24
the AMP provisions were issued by CMS in July 2007. However, the National
Association of Chain Drug Stores (“NACDS”) and the National Community Pharmacy
Association (“NCPA”) successfully filed suit against CMS and in December 2007 won
an injunction from U.S. District Court Judge Royce Lamberth that prevented CMS from
adopting the AMP-based FUL determination and publishing AMP data on the Internet.55
The March 2010 health care reform legislation redefined AMP. Effective October
1, 2010, AMP is limited to sales to retail community pharmacies and wholesalers selling
to these pharmacies (including independent, chain and supermarket pharmacies), but
explicitly excluding mail order pharmacies, hospital pharmacies, and not-for-profit
pharmacies. Since the excluded pharmacies have in the past been able to obtain
substantially larger discounts than community pharmacies, the resulting AMP is larger
than would be the case were these pharmacy transactions not excluded.56
Rather than
publishing prices at the individual manufacturer level for each drug, CMS is now
required to post only the weighted average of the AMPs over multiple-source drugs,
implying that pricing data for individual products will continue to remain confidential.
The FUL applicable to each group of multiple source drugs is set at 175% of their
weighted AMP. Ostensibly to mitigate significant quarter to quarter fluctuations, CMS is
to apply a smoothing process. Notably the 2010 health care reform legislation also
increased the Medicaid rebate for branded drugs from 15.1% to 23.1%.57
Turning from Medicaid to Medicare, under provisions of the Medicare
Prescription Drug, Improvement and Modernization Act of 2003 (“MMA”), beginning
January 1, 2005 Medicare Part B reimbursement for single-source (primarily on-patent
originator brand drugs) became 106% of their two-quarter lagged average sales price
(“ASP”) or their WAC, whichever is lower. The ASP is intended to represent the
volume-weighted average manufacturer sales price net of rebates and discounts to all
U.S. purchasers, excluding sales that are exempt from the Medicaid best price
calculations and those to other federal purchasers. Rebates and discounts incorporated
into the ASP calculation include volume discounts, prompt payment discounts, cash
discounts, free goods that are contingent on any purchase requirement, chargebacks, and
rebates to providers (not payers) other than those paid under the Medicaid rebate
program. For new drugs and biologicals approved by the FDA, for the first two quarters

Berndt and Newhouse “Draft Handbook Pricing Chapter”
Page 25
for which it is sold, the ASP is computed as 106% of WAC, or invoice pricing if the
WAC is not published. Beginning in the third calendar quarter of its first year of U.S.
sales, however, the ASP represents the average sales price lagged two quarters. Unlike
AMP, however, ASP is posted by CMS on its website, and thus is publicly available.58
Yet another federal government purchase price is that on the Federal Supply
Schedule (“FSS”) for pharmaceuticals, administered by the Veteran‟s Administration
(“VA”). It is a list of products and their prices available to federal entities that purchase
prescription drugs. In order to have their products covered and paid for by Medicaid
programs, under terms of OBRA 1990 and Veterans Health Care Act of 1992,
manufacturers must agree to supply drugs at these prices. The FSS price is intended to
equal or better the price that the manufacturer offers its most-favored nonfederal
customer under comparable terms and conditions. Similar to the best price, to determine
the Federal Ceiling Price (more on this below), manufacturers must provide the VA
information on price discounts and rebates offered to domestic customers and the terms
and conditions involved. The FSS price is publicly available.59
The VA‟s Office of
Inspector General reviews the information used to determine the FSS price. Agencies
using the FSS generally provide drugs directly to beneficiaries through their own
pharmacies and facilities.60
A related price is the Federal Ceiling Price (“FCP”) which is
the maximum price manufacturers can charge for FSS-listed brand name drugs to the VA,
Department of Defense, Public Health Service and the Coast Guard – even if the FSS
price is higher. FCP must be at least 24% below the non-Federal AMP. Data on FCP
prices are not publicly available.61
In summary, while the misnamed Average Wholesale Price remains and continues
to play a critical role in providing a reference point for pharmaceutical transactions, for
brands the discount off AWP has increased over time and likely will reach a peak as
wholesaler markups over WAC decline to competitive levels. While manufacturers are
locked in to the AWP system of pricing, the federal government has taken various steps
to gain access to information that enables it to acquire or reimburse for branded
pharmaceuticals at levels equal to or lower than paid by private purchasers. For generics,
whether the federal government (and state Medicaid agencies) reimburse at levels equal
to or lower than those paid by private purchasers is unclear, although historically that has

Berndt and Newhouse “Draft Handbook Pricing Chapter”
Page 26
not been the case. Later on in this chapter we discuss other recent related developments
involving payers‟ attempts to make public pharmacy acquisition costs.
D.5 The First DataBank - McKesson Settlement: Is AWP About To Die?
To this point our discussion of AWP has emphasized that even though AWP is a
reference price that increasingly diverged from actual pharmacy acquisition costs,
remarkably it has endured and continued to play a critical role as a benchmark price for
the multitude of transactions involving various private and public sector participants.
However, developments of the last decade have led some industry observers to declare
that the death of AWP, while not imminent, is inevitable.
On October 6, 2006, the Wall Street Journal published a front page article by
Barbara Martinez reporting that First DataBank (“FDB”), the unit of Hearst Corporation
publishing the Blue Book, in late 2001 had decided to increase the AWP to WAC markup
from 1.20 to 1.25 for over 400 hundred drugs, in a secret agreement with drug wholesaler
McKesson.62
Third party payers and groups representing the uninsured sued FDB and
McKesson. The Federal District Court Judge presiding over the ensuing litigation, Judge
Patti B. Saris, described the FDB – McKesson conspiracy as follows:
“Typically, a drug‟s wholesale acquisition cost or „WAC‟ was understood as the
price wholesalers paid to purchase a drug from the manufacturer; the WAC was
then marked up by a fixed percent to derive the AWP. FDB represented that it
surveyed wholesalers to ascertain the AWP, but this was untrue. Beginning in
2001, FDB and McKesson reached a secret agreement to raise the markup
between WAC and AWP from its standard 20% to 25% for over four hundred
drugs. McKesson communicated these new 25% WAC to AWP markups to FDB,
which then published AWPs with the new markup. To camouflage the scheme,
McKesson and FDB agreed to effectuate price changes only when some other
WAC-based price announcement was made by a drug manufacturer. McKesson
has estimated that by 2002, 95% of all prescription drug manufacturers used the
inflated 25% markup, and by 2004, 99% of all prescription drug manufacturers
did so. The scheme ended on March 15, 2005, when FDB told its customers that
it would „no longer survey drug wholesalers for information relating to AWP‟.
The scheme resulted in higher profits for retail pharmacies that purchase drugs on
the basis of WAC but are reimbursed on the basis of AWP, a differential called
the „spread‟. McKesson implemented the scheme in order to provide a greater
„spread‟ to important retail pharmacy clients like Rite Aid as well as to its only
pharmacy related businesses.”63
Any other stakeholder whose revenues (costs) depended on the spread, also profited (was
adversely affected). Apparently both insurers (such as United Health) and manufacturers

Berndt and Newhouse “Draft Handbook Pricing Chapter”
Page 27
contacted FDB asking for explanations of the AWP increase, but were unable to obtain a
satisfactory explanation.64
In a January 2005 deposition, Kay Morgan, who had been in charge of AWPs at
FDB, testified that rather than FDB relying on surveys from various wholesalers, since
late 2003 the only wholesaler providing FDB with markup information was McKesson.65
Without admitting to any wrongdoing, eventually both FDB and McKesson
settled, although FDB‟s initial 2006 and 2008 proposed settlements with plaintiffs were
opposed by pharmacies and some PBMs;66
McKesson agreed to a settlement in
November 2008 just before the scheduled beginning of a trial. A final FDB settlement
was not approved by the Court until March 2009. This final settlement was challenged
by several organizations representing pharmacies, and an organization representing
PBMs, but was upheld by the United States Court of Appeals for the First Circuit on
September 3, 2009. Under terms of the settlements, McKesson agreed to pay $350
million, and set aside a $143 million reserve for certain future claims.67
FDB issued a
statement saying not only had it agreed to roll back the prices of approximately 1400
drugs identified in the plaintiffs‟ previously filed complaint to a Blue Book AWP of 1.20
times the WAC or Direct Price effective September 26, 2009, but that independent of the
settlement, by the same date, FDB would apply the identical 1.20 markup factor to all
other drugs
“…whose Blue Book AWP is set based upon a markup to WAC or Direct Price in
excess of 1.20. First DataBank will also independently discontinue publishing the
Blue Book AWP data field for all drugs no later than two years following the date
that the Blue Book AWP adjustments noted above are implemented.”68
FDB stated that it would, however, continue to publish other drug pricing information
such as WAC, Direct Price, Suggested Wholesale Price, and Federal Upper Limits.
Interestingly, a year earlier, on January 23, 2008, Judge Saris issued an order
denying approval of a previously proposed settlement which would have required that
First DataBank cease publishing AWP within two years after the Court‟s approval of the
settlement, as long as no competitor continued publishing similar AWP data. Since AWP
is so widely used by the various stakeholders involved in pharmaceutical transactions, the
Court was concerned that the original settlement had the potential to affect many
providers that were not parties in the lawsuit.69
What would be the consequences of this

Berndt and Newhouse “Draft Handbook Pricing Chapter”
Page 28
settlement for pharmacies and PBMs (not parties in the law suit), and would this create
havoc in the entire pharmaceutical reimbursement system, undermining AWP? Who
would be the winners and losers from this rollback, and would AWP itself survive as a
benchmark price from which various discounts were negotiated?
In an affidavit an expert economist hired by plaintiffs estimated that the
settlement would represent a reduction in costs of $4.2 billion annually, of which $3.8
billion was the impact on third party payers and pharmacies, and $400 million on the
uninsured. Plaintiffs worried that pharmacies would be seriously harmed by the rollback,
unless public and private contract provisions were adjusted to offset the lower
reimbursement.70
A spokesman for the National Community Pharmacists Association
stated that the settlement “will force many mom-and-pops out of business or make drastic
service reductions, which would hurt consumers, especially in under-served low income
or rural areas where chains are few”.71
Benefits consulting firms were less alarmed,
arguing that the pharmacy supply chain had already absorbed the AWP increases through
a steady increase in the AWP discounts offered to payers and distributors, and expected
that PBMs would approach their clients either to request or mandate that currently
contracted discount guarantees be adjusted downward to make up for the rollback. Over
the longer term, however, they voiced concerns that “FDB‟s agreement to cease
publication of the AWP created the very real possibility that AWP would be phased out
completely as a pricing index.”72
As the September 26, 2009 AWP-to-WAC markup rollback date approached,
observers predicted it would have little effect, since PBMs and others “adjusted their
contracts so that PBMs, their clients and pharmacies will feel little or no financial pain.”
PBMs described the rollback as “little more than an administrative headache”, saying that
they and their clients had devised revenue neutral arrangements. Adam Fein, President of
Pembroke Consulting, was quoted as saying “My view is that there‟s not going to be
much of a difference after Sept. 26…As I see it, the net impact on total U.S. drug
spending will be relatively small and certainly far below the initial multibillion-dollar
predictions from a few years ago.” However, one set of “winners” from the rollback
were state Medicaid agencies, which for the most part had not renegotiated contracts with

Berndt and Newhouse “Draft Handbook Pricing Chapter”
Page 29
pharmacies, and thus ended up paying pharmacies less, which by one estimated totaled
$550 million in just one year.73
While some observers suggested that WAC should eventually replace AWP as the
benchmark price, others have noted that for brands the relationship between WAC and
AWP is very stable, and since WAC is a list rather than transactions price, “Judge Saris‟
critique of AWP could potentially be leveled against WAC, too.”74
A 2010 collaboration
among state Medicaid Directors resulted in the publication of a list of desired
characteristics of a replacement for AWP, but was unable to reach a consensus regarding
details.75
On June 21, 2010, Wolters Kluwer Health, publisher of MediSpan which had
previously acquired the Red Book pricing compendium, announced that it was
temporarily reversing its May 2007 decision to discontinue publication of AWP by late
2011, since “no comprehensive alternative benchmark price is yet available.” In their
pricing policy update press release, they stated:
“As a result, Wolters Kluwer Health intends to publish AWP (or a similarly
determined benchmark price) until relevant industry or governmental
organizations develop a viable, generally accepted alternative price benchmark to
replace AWP. Wolters Kluwer Health expects to continue to support industry
efforts to identify a widely accepted, alternative benchmark and, once such a
viable AWP alternative exists, to work with customers to migrate the publication
of that new price benchmark in place of AWP, under an appropriate
implementation and transition schedule.”76
We return to the issue of how reimbursement models based on actual pricing data
might ultimately become the dominant benchmark for pharmacy reimbursement later in
this chapter, but now move on to a different aspect of pricing, namely, price
discrimination.
E. Price Discrimination in Prescription Pharmaceuticals
In the previous pages we have spent considerable time discussing the various
prices at which a multitude of transactions occur at differing points in the pharmaceutical
distribution chain, and the roles of discounts, chargebacks and rebates. But even at the
same point in the distribution chain, it is not uncommon for differing buyers to pay
distinct prices for the identical drug; the practice of charging different prices for the
identical product to distinct buyers is called price discrimination.77
Economic theory
suggests that for a firm to find the practice of price discrimination to be profitable and

Berndt and Newhouse “Draft Handbook Pricing Chapter”
Page 30
sustainable, three factors must generally be present: (i) buyers must have heterogeneous
marginal evaluations; (ii) firms must have market power; and (iii) arbitrage must be
minimal, because it is costly and/or illegal.
Regarding buyers‟ heterogeneous evaluations, a great deal of variability exists in
the valuations patients place on drugs. Patients vary in their medical and functional
responsiveness to a medication, and in the values they attach to different characteristics
and effects of a drug (e.g., its side effect profile, dosing convenience, ability to keep
functioning while at work or carry out activities of daily living when retired, or about a
particular drug interaction). In considering a drug relative to other drug and non-drug
therapies, the costs of physician office visits (including time and convenience aspects)
and hospitalizations are also relevant.78
There is likely also substantial diversity in
patients‟ willingness to pay for and/or exert efforts to attain or maintain certain health
states. On the demand side, therefore, it is reasonable to expect that there is enormous
heterogeneity in the marginal valuations of medications. This patient heterogeneity is a
necessary condition for manufacturers to be able to practice price discrimination.
Second, firms must have market power. If a firm attempted to practice price
discrimination in a perfectly competitive environment, it would either capture the entire
market by pricing below marginal cost or find itself with excess inventory because buyers
were purchasing from other sellers offering the product at lower cost. In the case of
pharmaceuticals, firms can possess market power by virtue of their having a valid patent
on the product, by the FDA granting the firm market exclusivity on that product for some
other reasons (e.g., data exclusivity, pediatric extension, Orphan Drug status), or because
of some other barriers to entry (e.g., manufacturing know-how, access to rare or limited
raw materials). Possession of market power is yet another necessary condition for
manufacturers to be able to practice price discrimination on a sustained basis.
Third, arbitrage must minimal, because it is costly and/or illegal. If arbitrage
were perfectly legal and costless, purchasers could buy at low cost from the manufacturer
and resell to others willing to pay a higher price, thereby undoing and subverting the
manufacturer‟s attempted non-uniform pricing. For example, if a hospital were able to
purchase a drug at a highly discounted price for inpatient use, it might wish to operate a
retail pharmacy open to the public at which it could charge a much higher price.

Berndt and Newhouse “Draft Handbook Pricing Chapter”
Page 31
In the U.S., the potential for arbitraging transactions is very limited, because of
legislation making many such transactions illegal. The Prescription Drug Marketing Act
of 1987, which became effective on July 21, 1988, was intended to reduce public health
risks from adulterated, misbranded and counterfeit drug products that enter the
marketplace through drug diversion.79
The law provides that prescription drugs
manufactured in the U.S. and exported can no longer be reimported, except by the
product‟s manufacturer. It also places restrictions on sales of prescription drugs and
samples. Hospitals cannot sell prescription drugs to the general public.80
Wholesale
distributors must be licensed by the state and meet uniform standards. The practice of
wholesalers reselling to each other, particularly drugs whose shelf life is about to expire,
continues to be a focus of FDA regulatory attention.
Over the years since 1987, there has also been considerable Congressional
attention and legislation regarding the reimportation of drugs for personal use,
particularly from Canada. Currently implementation of such reimportation is under the
discretionary authority of the FDA.81
For our purposes, it is sufficient to note that along with heterogeneity of
consumers‟ evaluations and the presence of manufacturer market power, arbitrage of
prescription drugs in the U.S. is costly and in many cases illegal, and is insufficient to
discourage the practice of price discrimination. Together these three conditions make
sustained price discrimination of prescription drugs feasible.82
One other factor, this on the cost rather than demand side, makes price
discrimination of prescription pharmaceuticals very attractive, and that is the high
fixed/sunk cost, low marginal cost structure. A number of studies have estimated the
costs of bringing a prescription pharmaceutical to market;83
also see the chapters in this
volume by DiMasi, “Costs and Returns to R&D”, and by Metrick and Nicholson,
“Financing R&D”. The costs include opportunity costs of funds and failed projects. The
most recent of these (DiMasi, Hansen and Grabowski [2003]) estimates that around the
turn of the century, it took on average about $802 million of 2000 dollars and 12 years to
bring a new drug to market, including prepatent application R&D. The $802 million is
more than twice the $350 million estimated a decade earlier, and in large part reflects
increased costs of clinical development rather than basic R&D. Estimates in the same

Berndt and Newhouse “Draft Handbook Pricing Chapter”
Page 32
general range have been reported by Adams and Van Brantner [2006]. However, while
there appears to be substantial heterogeneity in development costs across therapeutic
areas,84
it appears that on average the costs of bring traditional chemically synthesized
small molecule pharmaceuticals are about the same as that for large molecule biologics.85
In contrast to the fixed or sunk R&D costs, the variable and marginal costs of
manufacturing and marketing a prescription pharmaceutical once it has been approved by
the FDA are often very small, nickels and dimes, not dollars, for many small molecule
pharmaceuticals; evidence on this is provided by the fact that following loss of patent
protection and extensive generic entry, prices of generic drugs fall to as low as 10% of
the brand price.86
For some drugs, however, particularly large molecule proteins and
biologics, manufacturing marginal costs can be substantial. Whether small molecule or
biologic, therefore, relative to the fixed or sunk R&D costs, marginal production costs are
much smaller, implying that returns to scale are substantial, and that as long as price
compensates for marginal production and marketing costs, it will be profitable for the
manufacturer to price discriminate.87
Combined with the fact that three necessary
conditions for price discrimination to be feasible and sustainable are met for
pharmaceuticals – patient marginal evaluation heterogeneity, manufacturer market power
and minimal possibilities to arbitrage – the presence of very substantial production scale
economies implies that branded manufacturers face strong incentives to practice price
discrimination.
Within the U.S., considerable price variability occurs across distribution channels,
with the VA and Medicaid able to obtain very low brand prices, staff model health
maintenance organizations slightly higher but still relatively low prices, third party payers
higher prices depending in large part on their ability to implement tiered formularies, and
retail pharmacies frequently paying the highest brand prices.88
These practices gave rise
to considerable litigation within the U.S. in the 1990s, with some economists arguing that
since a necessary condition for third degree price discrimination to increase welfare (total
quantity sold in all markets being greater than if a uniform price occurred across all
markets89
) likely was satisfied in the case of pharmaceuticals, such price discrimination
was welfare enhancing within the U.S.90
Others, however, argued that the practice of
price discrimination unfairly affected pharmacies, particularly independent pharmacies.91

Berndt and Newhouse “Draft Handbook Pricing Chapter”
Page 33
What is clear and relatively uncontested, however, is that third degree price
discrimination is a common occurrence in the U.S. branded prescription drug industry.
A more enduring and perhaps even more passionate debate involves price
discrimination across countries. Although for many years global brand pharmaceutical
companies charged lower prices to southern European countries than to those in northern
Europe and Great Britain, in the 1980s arbitrage (known as parallel importing) became
more prevalent. The European Union has explicitly permitted parallel importing, and this
has affected global branded pharmaceutical companies‟ pricing strategies; for discussion,
see Kyle [2007, 2009, 2010]. Danzon and Towse [2003] argue that the case for third
degree price discrimination improving global economic welfare is much more
complicated in the context of fixed and sunk R&D costs than it is for constant cost
industries, and that instead the Ramsey pricing analysis of second-best pricing provides a
more appropriate theoretical framework. Moreover, if (absolute values of ) countries‟
price elasticities of demand are positively related to countries‟ income (per capita) levels,
then not only might there be a strong case for third degree price discrimination on
economic efficiency criteria, but it could also be consistent with standard norms of
equity. Access pricing for pharmaceuticals via third degree price discrimination remains
a controversial global policy issue. For further discussion, see the chapters in this volume
by Patricia Danzon, “Pricing and Reimbursement: Other Countries”, and by Hannah
Kettler, David Ridley and Adrian Towse, “Drugs for Developing Countries”.
Our goal in this introductory section on the economics of pharmaceutical pricing
has been to provide an institutional background and introduction of various pricing
concepts for the U.S. Having reviewed important U.S. legislation, characterized the
generic industry as approximating a competitive market with price equal to marginal cost,
outlined various distribution channel transactions along with their prices, discounts,
chargebacks and rebates, digressed to summarize the creation and evolution of the
misnamed but ubiquitous average wholesale price, and then discussed why the demand
and cost conditions facing biopharmaceutical firms provide strong incentives for firms to
practice intra- and inter-country third degree price discrimination, we now turn to a
discussion of the economic theory foundations of supply prices for branded drugs.
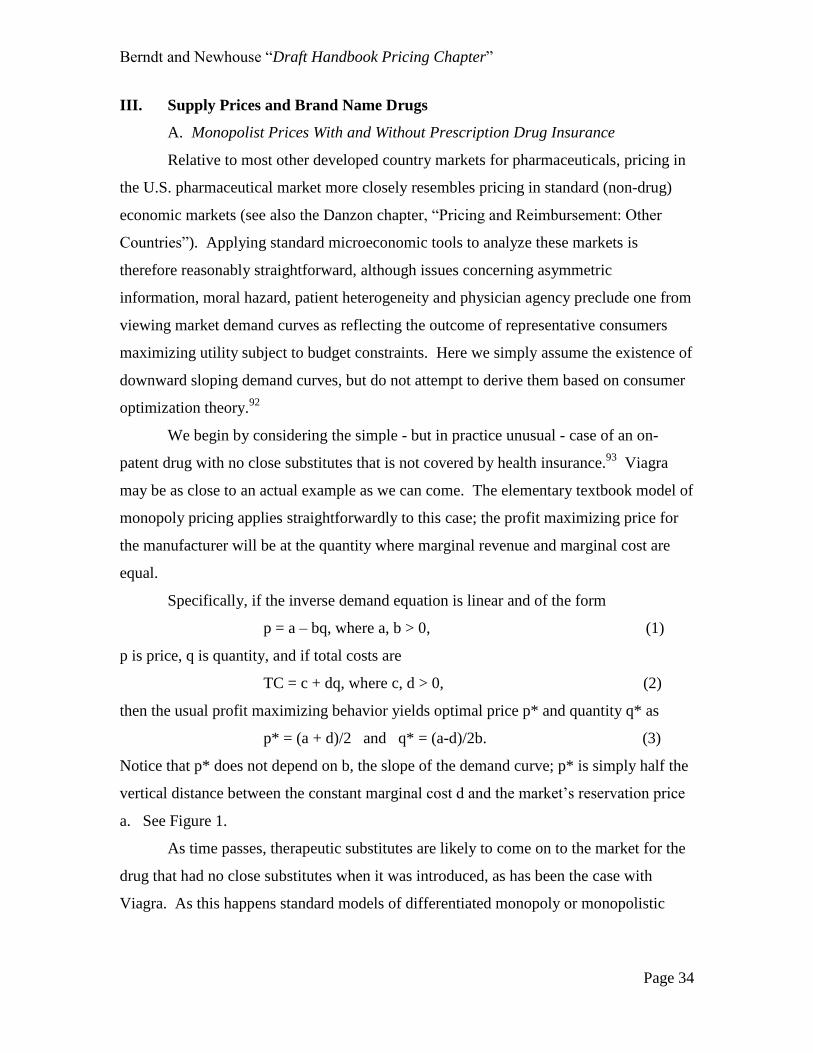
Berndt and Newhouse “Draft Handbook Pricing Chapter”
Page 34
III. Supply Prices and Brand Name Drugs
A. Monopolist Prices With and Without Prescription Drug Insurance
Relative to most other developed country markets for pharmaceuticals, pricing in
the U.S. pharmaceutical market more closely resembles pricing in standard (non-drug)
economic markets (see also the Danzon chapter, “Pricing and Reimbursement: Other
Countries”). Applying standard microeconomic tools to analyze these markets is
therefore reasonably straightforward, although issues concerning asymmetric
information, moral hazard, patient heterogeneity and physician agency preclude one from
viewing market demand curves as reflecting the outcome of representative consumers
maximizing utility subject to budget constraints. Here we simply assume the existence of
downward sloping demand curves, but do not attempt to derive them based on consumer
optimization theory.92
We begin by considering the simple - but in practice unusual - case of an on-
patent drug with no close substitutes that is not covered by health insurance.93
Viagra
may be as close to an actual example as we can come. The elementary textbook model of
monopoly pricing applies straightforwardly to this case; the profit maximizing price for
the manufacturer will be at the quantity where marginal revenue and marginal cost are
equal.
Specifically, if the inverse demand equation is linear and of the form
p = a – bq, where a, b > 0, (1)
p is price, q is quantity, and if total costs are
TC = c + dq, where c, d > 0, (2)
then the usual profit maximizing behavior yields optimal price p* and quantity q* as
p* = (a + d)/2 and q* = (a-d)/2b. (3)
Notice that p* does not depend on b, the slope of the demand curve; p* is simply half the
vertical distance between the constant marginal cost d and the market‟s reservation price
a. See Figure 1.
As time passes, therapeutic substitutes are likely to come on to the market for the
drug that had no close substitutes when it was introduced, as has been the case with
Viagra. As this happens standard models of differentiated monopoly or monopolistic

Berndt and Newhouse “Draft Handbook Pricing Chapter”
Page 35
B
A
C
C
A
Marginal cost
P(i=1)
P(i=0.2)
Price
Quantity
Figure 1
The inverse demand curve BC, corresponding to no insurance, has slope
-b. The demand curve AC, corresponding to a coinsurance rate of 0.2,
has slope = -5. Marginal revenue curves are the dotted lines
corresponding to the two demand curves. Price at a coinsurance rate of
0.2 is not quite five times as great as with no insurance (i=1).

Berndt and Newhouse “Draft Handbook Pricing Chapter”
Page 36
competition apply. Prices will fall toward competitive levels, with each product retaining
some market power to maintain price above competitive marginal cost levels.
Whether or not therapeutic substitutes have appeared, at some point the original
drug will go off patent and generic competitors will enter. As more generic firms enter,
the generic price falls to competitive levels. The original manufacturer may, however,
produce a branded generic (e.g., Advil vs. the generic ibuprofen), which will command a
price premium above generic or private labels.
This no insurance case, however, is exceptional, since approximately 85 percent
of Americans have insurance coverage, and most of those policies cover drugs. Medicare
beneficiaries use about three times as many drugs as the under 65, and around 90 percent
of them have coverage for drugs.94
Thus, we next consider how the standard model
needs to be modified for the case of an insured consumer.
The simplest case to analyze is an insurance policy with a constant coinsurance
rate i (0 < i ≤ 1), meaning the patient pays 100i percent of the cost; for mathematical
convenience, we rule out the completely free case (i = 0). Policies with non-zero
coinsurance rates were relatively common when health insurance began to cover
prescription drugs in the 1970s and 1980s.95
They are much less common today, but still
are found, e.g., Medicare coverage of drugs taken orally for persons who spend above a
certain (large) amount out-of-pocket face a 5 percent coinsurance rate.96
A 20 percent
coinsurance rate applies currently in Medicare for drugs injected during an office visit.
Although many beneficiaries have a supplementary insurance policy that covers the 20
percent coinsurance amount, not all do.
We again begin with a drug with no close substitutes that is covered by such an
insurance policy. Examples would be Mevacor (lovastatin), which in 1987 became the
first statin on the U.S. market, and Gleevec (imatinib), which was launched in 2001 and
still (in 2010) has no close substitutes for the treatment of chronic myelogenous
leukemia. How one specifies the resulting with insurance inverse demand curve is
somewhat speculative, since modeling precisely how both insurers and insureds would
respond to the sudden possibility of insurance raises challenging issues. Let I-1
= 1/i
(note we have excluded the i=0 possibility). One possibility is to specify the new market
demand equation with capital (rather than lower case) letters as

Berndt and Newhouse “Draft Handbook Pricing Chapter”
Page 37
P = I-1
(a – bQ) = A – BQ, where A = I-1
a and B = I-1
b. (4)
Relative to the no insurance case, this with-insurance demand curve simply rotates
clockwise and upward at the quantity demanded when the price equals zero (Figure 1);
the actual rotation occurs where the demand curve intersects the q and Q axes as p and P*
become zero, which from Eqns. (3) and (4) is where q = a/b and Q = A/B = I-1
a/ I-1
b = q.
The slope of the new market demand curve becomes B = I-1
b. Let us assume cost
functions are unchanged. At the new with-insurance equilibrium (denoted with capital
letters), from Eqn. (3) we see that P* becomes
P* = (A + d)/2 = (I-1
a + d)/2 (5)
so that
P*/p* = (I-1
a + d)/(a + d). (6)
As long as marginal cost d > 0 and the coinsurance rate follows 0 < i ≤ 1 , then
1 < P*/p* < I-1
. (7)
Only if marginal cost d = 0 will P*/p* = I-1
. In terms of quantity at the new with
insurance equilibrium, from (3) we have that
Q* = (A – d)/2B = (I-1
a - d)/2 I-1
b. (8)
A bit of algebra reveals that
Q*/q* = (I-1
ab – bd)/ (I-1
ab – I-1
bd) (9)
which implies that under insurance, as long as b, d > 0 and i < 1 which implies I-1
> 1, the
denominator of (9) will be smaller than the numerator, implying that the ratio Q*/q* > 1.
Intuitively, the lower is the coinsurance rate i, the greater is Q* relative to q* --
equilibrium quantity with insurance relative to no insurance. Graphically, as seen in
Figure 1, the effect of coinsurance on price is greater than that on quantity.
There are other possibilities, however. Suppose that the “hardnosed” insurer
announced that it would not pay any greater than the pre-insurance reservation price, but
that it would provide very generous benefits at lower prices; consumers might also balk at
paying the very large upfront insurance policy costs they realized would occur were the
insurer be willing to pay prices much greater than the pre-insurance reservation price.
Alternatively, as has been argued by some97
, suppose it was not just the presence of
insurance, but the form that it takes that makes demand for drugs under insurance more
elastic, as insurers use managed care and formulary bargaining techniques to force

Berndt and Newhouse “Draft Handbook Pricing Chapter”
Page 38
manufacturers to make price concessions. In such an admittedly hypothetical situation,
one could simply rotate the demand curve at the reservation price, and make its slope a
much flatter i times the no insurance slope, i.e. specify a new market demand curve as
P = a – b‟Q = a – ibQ, where now b‟ = ib. (10)
Substituting in to Eqn. (3), at the new with “hardnosed” insurance equilibrium (denoted
with capital letters and a prime, i.e. P‟ and Q‟), and assuming again no change in cost
functions, we see that the equilibrium quantity is I-1
times the no insurance quantity,
Q‟ = (a – d)/2b‟ = (a-d)/2 ib = I-1
q*. (11)
However, since P‟ = (a + d)/2 is not a function of b‟, under this admittedly hypothetical
scenario the impact of insurance is only a very large quantity and no price effect. Recall
that in contrast, the insurance scenario with the much larger reservation price involves a
large price effect and a considerably smaller quantity impact.
Both of these insurance scenarios implicitly contain a number of unrealistic
assumptions. While the insurer‟s passive acceptance of a reservation price I-1
times that
occurring in a pre-insurance market is unlikely, a priori it seems even more unlikely that
the insurer would not at least in some cases be willing to pay a higher reservation price
than in the no insurance case. The two insurance scenarios likely provide some upper
and lower bounds on what is the impact of insurance on price and quantity demanded,
with the insurer accepting higher reservation price scenario providing us the most useful
intuition and guidance. In such a scenario, if the manufacturer‟s profit-maximizing price
was p* in an uninsured market, the profit maximizing price if everyone has an insurance
policy with a coinsurance rate i is larger than p* but less than p*/i. How large is the
quantity effect relative to the price effect is at this point speculative.
In the case of a drug with therapeutic substitutes, a similar analysis applies; the
demand (willingness to pay) for all drugs rises by the factor I-1
, so the profit-maximizing
prices of all drugs will rise by somewhat less than I-1
times prices in an uninsured market.
Moreover, equilibrium quantities will always be greater with than without insurance.
Policies with a non-zero coinsurance rate, however, have now mostly been
replaced with copayments for drugs taken orally (i.e., tablets and capsules). A common
arrangement is a three or four tier formulary. As of 2008, according to IMS data98
, a
common three tier formulary at a retail pharmacy charged a $6 copay for generic

Berndt and Newhouse “Draft Handbook Pricing Chapter”
Page 39
medications, $29 for preferred branded drugs, and $40 or more for non-preferred branded
drugs, all for 30-day prescriptions.99
The difference between the copayment and the
manufacturer‟s price is paid through the premium for the policy. The different levels of
copayments control relative out-of-pocket prices for various drugs. This shifts demand
toward generic drugs and drugs on the formulary; for branded drugs the device of the
formulary effectively increases the elasticity of demand faced by the manufacturer (see
the chapters by Goldman-Joyce, “Consumer Demand and Health Effects of Cost
Sharing”, and by Pauly, “Insurance Design”).
As described above, if there is a fourth tier, instead of a fixed copayment it will
have a coinsurance rate i. As discussed earlier, drugs in this tier are often biologics with
high unit prices, e.g., many thousands of dollars for a yearly supply.100
For such drugs
the coinsurance model described above applies.101
Some therapeutic classes may have a large number of drugs, but any given patient
may only do well on one or a few of them. Analytically, of course, this simply means
that the drugs in the class are not close substitutes, and that therefore the manufacturer of
each branded drug in the relevant class has substantial market power. Medicare has
designated six protected therapeutic drug classes, in which drugs are thought not to be
close substitutes. Insurers that participate in Medicare Part D must offer all but one of
the drugs in those six classes.102
In the remaining drug classes insurers must only offer
two drugs. Nonetheless, within those classes drugs may have similar effects on the
condition being treated but be differentiated by some having fewer side effects (the
occurrence of side effects may well vary from person to person) or the frequency with
which a patient must take the medication. These differentiating features also give rise to
price differences among drugs treating the same condition.
B. The Prescription Drug Insurance Market
In the U.S. prescription drug insurance benefit services are typically purchased
from a pharmacy benefits manager (PBM), usually by the underlying health insurer or as
a “carve-out” policy by a large employer. In the latter case the employer may offer
medical insurance plans from multiple health insurers but require all of them to use one
PBM to prevent selection on the basis of drug formularies or pharmacies. Even if the
employer contracts solely with one health insurer so that selection is not relevant, the

Berndt and Newhouse “Draft Handbook Pricing Chapter”
Page 40
employer may carve out the drug benefit to a PBM not affiliated with that insurer because
it is more economical.
The American PBM industry has become increasingly concentrated; at the
beginning of 2010 it was dominated by three large firms (Caremark/CVS;
ExpressScripts; Medco) who had a combined market share of just under 50 percent.103
Since each of the three large PBMs has substantial bargaining power with manufacturers,
this increased concentration has served to increase the price elasticity of demand facing
manufacturers with drugs that are highly substitutable within a therapeutic class.
Somewhat over 10 percent of the overall 2008 U.S. pharmaceutical market is
accounted for by Medicaid and certain other federal programs such as the Veteran‟s
Administration, Community Health Centers, and the military medical care system.104
(This share was larger prior to the implementation of Medicare Part D in 2006; see
below.) These government programs purchase prescription drugs under legislation that
sets prices to manufacturers as a discount off prices charged to commercial customers.
The size of the discount varies by type of drug. As noted above, the 2010 health care
reform bill increased the discount off single source drugs (generally those on patent) from
15 to 23.1 percent and off multiple source drugs from 11 to 13 percent.
Scott Morton and Duggan and Scott Morton have demonstrated that these
statutorily prescribed discounts have raised prices to other customers.105
The reason is
simple: if a manufacturer lowers price to a commercial customer, the manufacturer also
must lower price to the government programs. There will be little or no quantity
response in the government market, since quantities are determined by prescribing
decisions made by individual physicians who do not face a budget constraint when
prescribing. Hence, the optimal price in the commercial market must be greater than it
would be without this tie between the commercial and government markets.
C. Welfare Implications of Market Power and Insurance
Deriving welfare implications about drug prices and insurance is difficult for
many reasons. A first-best outcome would achieve both static efficiency -- the efficient
allocation of drugs on the market at a point in time -- and dynamic efficiency -- the
efficient allocation of R&D resources devoted to drugs.

Berndt and Newhouse “Draft Handbook Pricing Chapter”
Page 41
It is best to begin with the simplest, albeit unrealistic case. Assume that the
patient is well informed and ignore agency issues with respect to the prescribing
physician. Static efficiency requires that price equal the marginal cost of production,
which for most drugs will be negligible. Dynamic efficiency, however, requires a price
at which the R&D costs can be recouped. (Marketing costs must also be recouped; see
below.) Achieving both static and dynamic efficiency simultaneously thus requires some
sort of two-part pricing scheme, in which consumers pay little or nothing at the time of
purchase, but prices received by manufacturers are sufficiently above marginal
production cost to enable them to recoup R&D costs (including R&D on failed drug
development efforts).
In principle, of course, drug insurance can achieve just such an efficient outcome.
The consumer, or the employer or government on her behalf, pays a premium for the
insurance and in turn the consumer receives a heavily discounted price at the time of
purchase with the insurer using the proceeds from the premiums to pay the manufacturer
a price above the marginal cost of production so that the manufacturer can recover R&D
costs. How close or far actual premiums and copayments come to inducing something
approximating an economically efficient outcome is not known.106
But the conflict between static and dynamically efficient prices is not the only
difficulty in attaining an efficient outcome. Consumer ignorance and resulting agency
problems are omnipresent in this domain. Because of their relative lack of knowledge
and training, by law in the U.S. consumers must obtain a prescription from a physician to
purchase most drugs. But the physician also faces costs in acquiring information about
drugs, and thus it pays a manufacturer to devote resources to marketing. Although there
has been much attention in the general press about direct-to-consumer advertising of
prescription pharmaceuticals, the great bulk of pharmaceutical manufacturers‟ marketing
efforts are directed toward physicians;107
also see the Kenkel and Mathios chapter in this
volume, “Promotion to Physicians and Consumers”. Detailers (pharmaceutical sales
representatives) visit physician offices, dispense free samples, pay opinion-leader
physicians speaking fees, and offer physicians free “continuing education” - featuring
that manufacturer‟s products of course – often at resorts or other desirable locations.
Such marketing efforts are profitable given typically low marginal production costs,

Berndt and Newhouse “Draft Handbook Pricing Chapter”
Page 42
which implies that any additional quantities of drug sold as a result of marketing efforts
can contribute handsomely to profits.108
Public controversy and lawsuits have occurred
alleging that certain marketing practices may be considered unethical, and occasionally
illegal. In recent years, manufacturers have entered into a number of settlements
involving their marketing efforts.109
Marketing efforts directed toward the physician create an agency problem; for
example, the physician may rely on the manufacturer‟s representatives for information
rather than spending the time and effort to seek information from a less biased source,
potentially leading to prescribing a less than optimal drug for a patient – or perhaps
prescribing when not prescribing at all would be the best treatment. Physician
investments in learning about the efficacy, tolerability and safety characteristics of
various treatments involves costly investments which the physician must trade off with
being able to see more patients and enjoy greater leisure time.
Even if the physician were perfectly informed about the effects of all treatments,
however, consumers‟ lack of knowledge can be a barrier to efficiency. Suppose the
condition being treated has no immediate symptoms – hypertension is an example – but
the drug being used to treat the condition has adverse side effects. One possibility in this
case is that the side effects are so bad or the consequences of the condition so mild or so
far in the future that it is efficient not to take the drug. In this case it can be efficient for
the consumer not to take the drug.
But even if it is efficient for the patient to take the drug, there are several barriers.
Although the physician can in principle know the clinical consequences on average of
taking or not taking the drug, he or she cannot know the patient‟s utility function
including the patient‟s risk aversion. Yet another possibility is simply that the patient is a
poor decision maker with respect to probabilistic outcomes, especially in cases in which
there is a certain small loss now (e.g., from side effects or simply from the copayments)
in return for a larger gain later so the patient simply does not fill the prescription; Frank
[2006] considers this and several related situations in the context of behavioral
economics. Physicians would characterize this scenario as an adherence or compliance
problem. This suggests setting copayments lower than they would be set if all consumers

Berndt and Newhouse “Draft Handbook Pricing Chapter”
Page 43
were excellent decision makers, in effect, providing a greater inducement to comply;
some call this “value-based pricing”.110
Such a possibility is reinforced if lack of compliance generates greater use of non-
drug medical services than would otherwise be the case. If, for example, a person with
high blood pressure does not take the appropriate medication, s/he is at higher risk of
cardiovascular disease and stroke. In the event of, say, a stroke, there will be additional
hospital, physician, and other medical care costs involved when treating the stroke.
These costs, which will be mainly borne by others if the patient is insured, can potentially
be avoided if the copayment is lowered to induce compliance. This is analogous to
raising taxes on cigarettes to deter consumption.111
. An extreme example is directly
observed therapy, in which those with an infectious disease (the usual example is
tuberculosis) are paid to come in to an office or hospital to be observed taking drugs to
treat the disease. In effect, this is a negative copayment.112
Value-based pricing has been implemented by a number of benefit plans.
Evidence documents that in 2009, although 51.5% of employers surveyed had not
adopted any value-based design tool, 28.6% reduced copayments for specific drug
classes, 22.7% provided incentives to motivate behavior change, 7.9% reduced
copayments for members with specific health conditions, and 6.1% reduced copayments
tied to participation in care management programs.113
IV. Recent Developments, Issues and Emerging Trends
We now move on to a discussion of recent developments, controversies and
emerging trends. As noted earlier, many drug benefit plans offer tiered formularies; in
one recent survey, 86.9% of employers using a formulary have it structured with multiple
tiers, with the dominant being three or more tiers, although there is an increasing trend to
use four or more tiers (4.7% in 2007, 12.7% in 2009). Coinsurance is giving way to fixed
dollar copayments (except for a fourth tier, if it exists); in 2009 (2007), 18.3% (20.9%) of
responding employers with multiple tiers utilized a multitier coinsurance design, while
81.7% (79.1%) had multitier fixed dollar copayment provisions.114
In terms of mail
order, the same survey indicated that 96.7% of employers offered access to mail service
pharmacy to dispense maintenance medications used to treat chronic conditions, while

Berndt and Newhouse “Draft Handbook Pricing Chapter”
Page 44
17.4% required maintenance medications be dispensed by mail order (“mandatory
mail”).115
A. Major Long-Term Trends
There are very clear trends over time in dollar copayments by tier, less so for
coinsurance. As seen in Table 1, between 1998 and 2009, average retail copayment
levels increased from $6.13 to $9.96, an increase of 62%. Tier 2 average copayments
increased even more, from $11.10 in 1998 to $25.19 in 2009, an increase of 127%. But
Tier 3 average copayments rose the most, from $17.53 in 1998 to $42.95 in 2009, an
increase of 145%. As expected, the 2009 average retail Tier 4 copayment is even greater
at $62.11, a tier that covers specialty drugs; the PBMI report notes that average
copayment levels for “lifestyle” drugs in 2009 was $36.00.116
______________________________________________________________________
Table 1
Average Retail Copayment Levels and Coinsurance Rates, by Tier, 1998-2009
Average Copayment Levels Average Coinsurance Rates
Year Tier 1 Tier 2 Tier 3 Tier 4* Tier 1 Tier 2 Tier 3 Tier 4*
1998 $ 6.13 $11.10 $17.53 na na na na na
1999 7.05 12.82 23.40 na na na na na
2000 7.17 14.14 27.35 na 19% 21% 42% na
2001 7.68 16.06 30.51 na na na na na
2002 8.33 17.57 33.23 na 19% 23% 37% na
2003 8.66 19.26 35.15 na 20% 26% 40% na
2004 9.14 20.71 37.45 na na na na na
2005/6 9.53 21.61 39.06 na na na na na
2007 8.99 23.08 39.63 na 18% 26% 38% 27%
2008 9.53 24.62 41.13 na 20% 26% 42% 29%
2009 9.96 25.19 42.95 62.11 20% 27% 40% 28%
*Tier 4 are specialty drugs. na is data not available. Source: 1998-2000 data, Takeda-
Lilly [2001]; 2001-3 data, Takeda [2004]; 2004-9 data, Pharmacy Benefit Management
Institute [2009].
______________________________________________________________________
While retail coinsurance rates generally increase from Tier 1 to Tier 3 (roughly,
doubling from 20% to 40%), there is no discernable trend over time in Tiers 1 and 3,
although there is some evidence suggesting an upward trend in Tier 2 over time.
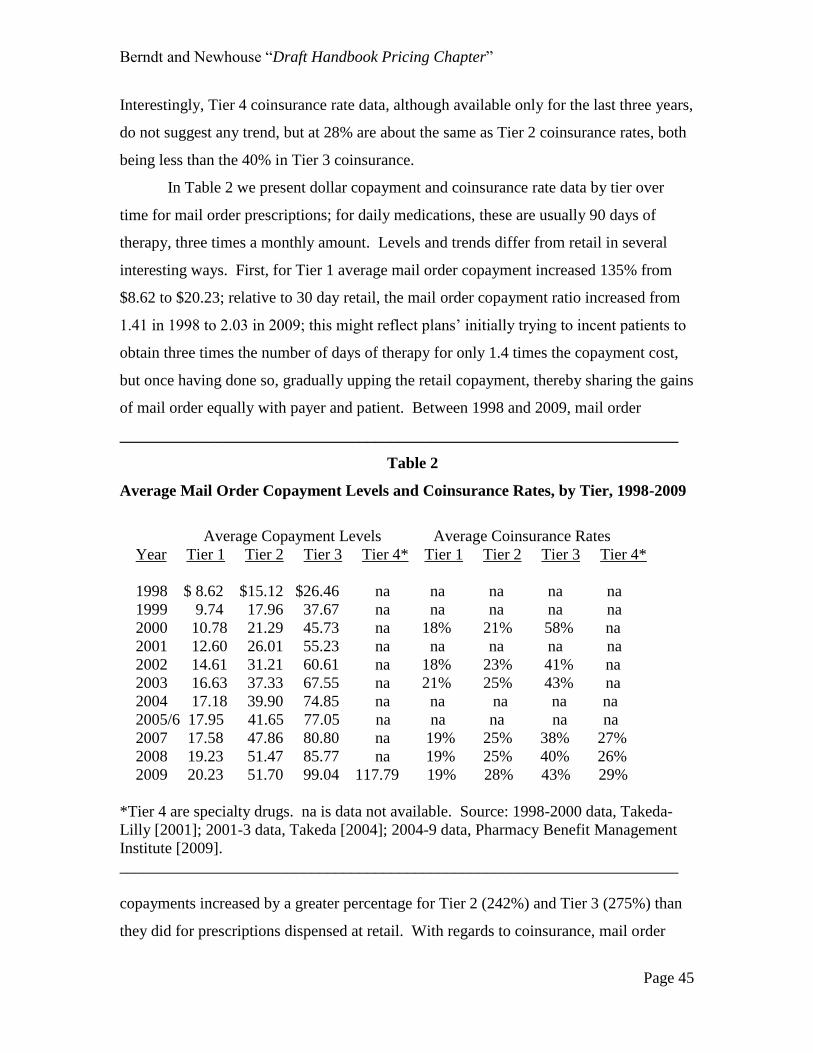
Berndt and Newhouse “Draft Handbook Pricing Chapter”
Page 45
Interestingly, Tier 4 coinsurance rate data, although available only for the last three years,
do not suggest any trend, but at 28% are about the same as Tier 2 coinsurance rates, both
being less than the 40% in Tier 3 coinsurance.
In Table 2 we present dollar copayment and coinsurance rate data by tier over
time for mail order prescriptions; for daily medications, these are usually 90 days of
therapy, three times a monthly amount. Levels and trends differ from retail in several
interesting ways. First, for Tier 1 average mail order copayment increased 135% from
$8.62 to $20.23; relative to 30 day retail, the mail order copayment ratio increased from
1.41 in 1998 to 2.03 in 2009; this might reflect plans‟ initially trying to incent patients to
obtain three times the number of days of therapy for only 1.4 times the copayment cost,
but once having done so, gradually upping the retail copayment, thereby sharing the gains
of mail order equally with payer and patient. Between 1998 and 2009, mail order
______________________________________________________________________
Table 2
Average Mail Order Copayment Levels and Coinsurance Rates, by Tier, 1998-2009
Average Copayment Levels Average Coinsurance Rates
Year Tier 1 Tier 2 Tier 3 Tier 4* Tier 1 Tier 2 Tier 3 Tier 4*
1998 $ 8.62 $15.12 $26.46 na na na na na
1999 9.74 17.96 37.67 na na na na na
2000 10.78 21.29 45.73 na 18% 21% 58% na
2001 12.60 26.01 55.23 na na na na na
2002 14.61 31.21 60.61 na 18% 23% 41% na
2003 16.63 37.33 67.55 na 21% 25% 43% na
2004 17.18 39.90 74.85 na na na na na
2005/6 17.95 41.65 77.05 na na na na na
2007 17.58 47.86 80.80 na 19% 25% 38% 27%
2008 19.23 51.47 85.77 na 19% 25% 40% 26%
2009 20.23 51.70 99.04 117.79 19% 28% 43% 29%
*Tier 4 are specialty drugs. na is data not available. Source: 1998-2000 data, Takeda-
Lilly [2001]; 2001-3 data, Takeda [2004]; 2004-9 data, Pharmacy Benefit Management
Institute [2009].
______________________________________________________________________
copayments increased by a greater percentage for Tier 2 (242%) and Tier 3 (275%) than
they did for prescriptions dispensed at retail. With regards to coinsurance, mail order

Berndt and Newhouse “Draft Handbook Pricing Chapter”
Page 46
levels and trends are generally very similar to those at retail. Note that even though there
may not be trends over time within each tier in coinsurance rates, to the extent
prescription drug prices are increasing, the dollar amounts associated with fixed
coinsurance rates increase over time as well.
In Table 3 we report average percent discounts off AWP and average dispensing
fees for brands, as reported by employers who are either self-insured or fully insured,
separately for retail and mail order. Between 1995 and 2009, both the retail and mail
________________________________________________________________________
Table 3
Trends in Retail and Mail Order Reimbursement, 1995 - 2009
Average Percentage Discounts Off Brand AWP and Average Dispensing Fee
Retail Mail Order
Discount Dispensing Discount Dispensing
Year Off AWP Fee Off AWP Fee
1995 11.8% $2.50 15.0% $1.82
1996 12.1 2.47 15.6 1.71
1997 12.6 2.32 16.6 1.61
1998 13.2 2.35 17.1 1.51
1999 13.1 2.30 17.4 1.38
2000 13.5 2.31 18.5 1.15
2001 13.9 2.21 18.9 1.09
2002 14.1 2.13 19.7 0.86
2003 14.5 2.05 20.4 0.52
2004 14.8 1.95 21.0 0.41
2005/6 15.3 1.88 21.9 0.24
2007 16.1 1.88 22.7 *
2008 16,1 1.73 20,2 *
2009 16.4 1.57 23.7 *
Notes: *In 2008 (2009), only 20.3% (13%) of employers paid dispensing fee on mail
prescriptions. For those who did pay a mail dispensing fee, 2007-9 average dispensing
fees were $1.62, $2.17 and $3.19, respectively. Data Sources: 1995-2002 data, Takeda
[2004}; 2003-9 data, Pharmacy Benefit Management Institute [2009].

Berndt and Newhouse “Draft Handbook Pricing Chapter”
Page 47
order discount off AWP paid by employers to PBMs and pharmacies increased about
50%, not quite five percentage points for retail (from 11.8% to 16.4%), and not quite nine
percentage points for mail order (from 15.0% to 23.8%). This increase in discounts over
time is consistent both with PBMs gaining bargaining power, and with declining
wholesaler margins.
An equally noteworthy trend is the decline in dispensing fees, both for retail and
mail order. For retail, the average dispensing fee declined 37% between 1995 and 2009,
from $2.50 to $1.57. The decline in the average mail order dispensing fee is even more
pronounced, falling 87% from $1.82 in 1995 to $0.24 in 2005/6. As the notes to Table 4
indicate, by 2008 and 2009, only 20.3% and 13% of employers, respectively, paid a mail
order dispensing fee, with 79.7% and 87% providing a zero dispensing fee to mail order
service providers.
These trends in retail and mail order dispensing fees, as well as in discounts off
AWP, reflect the changing relative bargaining power of PBMs, manufacturers and
pharmacies, as well as continuing cost-saving technological advances in information and
communication technologies that facilitate electronic communications among them. Two
observations are worth noting. First, with discounts off AWP increasing and dispensing
fees decreasing, pharmacy gross margins are likely decreasing, at least for transactions
involving private sector payers; we discuss this further below. Second, as was noted
earlier and documented by numerous CBO and Office of Inspector General Studies, as
well as others, reimbursement by public sector payers, particularly Medicaid, have been
considerably more generous to pharmacies than have private sector payers, with state
Medicaid agencies paying higher dispensing fees and discounting AWP less, both for
brand and generic drugs than their private sector counterparts.117
In Table 4 we report trends over time in generic dispensing rates – the proportion
of all brand plus generic prescriptions dispensed as generics – separately for retail and
mail order. Recall that the extent to which generics can be dispensed depends critically
on the proportion of patent and off-patent drugs. As the number of new drugs approved
by the FDA has generally fallen since their peak numbers in 1995-96, an echo resounds
12-15 years later as they go off patent and encounter generic competition, implying that

Berndt and Newhouse “Draft Handbook Pricing Chapter”
Page 48
the proportion of all distinct molecules that are still patent protected falls over time as
well, thereby facilitating increases in generic dispensing rates.118
Table 4
Average Retail and Mail Order Generic Dispensing Rates
Percent of Prescriptions Dispensed Through Mail Service, 2000-2009
Percent Generic Percent Percent Generic Percent
Year Retail Mail Order Mail Order Year Retail Mail Order Mail Order
2000 39.0% 28.0% 14.2% 2006/6 51.0% 39.0%
2001 40.4 2007 54.5 41.7 18.2*
2002 41.5 31.8 13.0 2008 60.4 49.3 17.8*
2003 44.1 34.0 16.0 2009 63.5 53.6
2004 47.0 38.0
Data Sources: 2000 data, Takeda-Lilly [2001]; 2001-2 data, Takeda [2003]; 2003 data,
Takeda [2004]; 2004-9 data, Pharmacy Benefit Management Institute [2009]; *Fein
[2009].
________________________________________________________________________
As seen in Table 4, between 2000 and 2009, retail generic dispensing rates have
increased more than 20 percentage points, from 39% to 63.5%, a 63% proportional
increase.119
Although at lower percentage levels in each year than retail, mail order
generic dispensing rates have increased proportionately even more, from 28% to 53.6%, a
91% proportional increase. Note that from the vantage point of employers paying drug
insurance benefits, since mail order discounts off AWP for on patent brands are greater
than those at retail, it is less costly on a per day of therapy basis to have branded
maintenance medications for chronic conditions dispensed by mail order than at retail.
Thus it is not surprising that the proportion of prescriptions dispensed by brand is greater
for mail order (46.4% in 2009) than for retail (36.5%).120
Another trend worth noting,
though at this point based on relatively sparse data, involves the proportion of all
prescriptions dispensed via mail order. As seen in Table 4, this proportion appears to be
increasing over time, from about 14% at the turn of the century to around 18% by 2009.
Note that since mail order dispenses a greater proportion of more costly brands than does

Berndt and Newhouse “Draft Handbook Pricing Chapter”
Page 49
retail, the proportion of revenues flowing through the mail order channel is greater than
the proportion of prescriptions.
One final long term trend worth highlighting here is the growth in specialty drugs,
primarily (but not exclusively) physician-administered biologics. According to one
integrated retailer-PBM, spending on specialty drugs accounted for 12% of all drug
spending in 2008, up from 8% three years earlier.121
To gain bargaining power, retailer-
PBM firms are attempting to have their clients exclusively use their network for single-
source specialty management for all drugs to treat cancer except those used in hospital
settings.122
Many of the specialty drugs, however, are used for treating cancer. Fifteen years
ago, according to one observer, the only cancer drug on the market that cost more than
$2,500 per month was paclitaxel (Taxol, Bristol-Myers Squibb).123
As seen in Figure 2
below, the number of cancer drugs charging many times that amount has increased
sharply in the last several decades.124
For example, in 2007 Genentech‟s Avastin
Figure 2: Monthly and Median Costs of Cancer Drugs at the Time of
Approval by the Food and Drug Administration (FDA), from 1965 through
2008. Source: Bach [2009].
(colorectal cancer) cost on average $42,960, its Herceptin (breast cancer) cost $27,900,
and GlaxoSmith Kline‟s Tykerb (breast cancer) cost $16,575 per course of treatment.125

Berndt and Newhouse “Draft Handbook Pricing Chapter”
Page 50
Partly in response to these high unit prices, many Medicare Part D insurers have placed
these drugs on a special tier that typically requires 25 percent coinsurance. This induces
some demand responsiveness, but the high prices are consistent with a relatively low
price elasticity of demand by cancer patients. Medicare, however, covers physician-
administered drugs – and many of the cancer drugs are physician administered – under
Part B rather than Part D, and Part B has 20% coinsurance. The Part B coinsurance,
however, is frequently covered by some kind of supplemental insurance, most often
retiree health insurance from a prior employer or Medicaid, in which case the insured
may have little or no copayment. The existence of such supplemental insurance likely
increases both the profit-maximizing price and quantity of the drugs covered under Part B
(see Figure 1).
B. Emerging Issues and Trends Affecting Pharmaceutical Pricing
We now move on to a discussion of several prominent emerging issues and trends
involving pharmaceutical pricing.
B.1 Part D, Pharmaceutical Prices and Pharmacy Gross Margins
As we noted in our theoretical discussion earlier, it is plausible to expect that
prices of covered drugs would generally be expected to be greater under insurance than
without insurance; the extent of price increase can to some extent be offset depending on
how concentrated is the buying and negotiating power of insurers and PBMs acting on
behalf of the previously under- and uninsured. Issues regarding the effects of expanded
drug coverage on drug prices and pharmacy margins recently emerged again with the
implementation of Medicare Part D benefits on January 1, 2006.
Overall, Part D appeared to reduce optimal prices for drugs, which seems
contrary to the logic of Figure 1 above.126
The reason, however, is straightforward: Part D
subsidized Medicare beneficiaries to purchase a private insurance plan, and around 90
percent of the individuals enrolled in those plans chose plans with formularies. Before
Part D a quarter of Medicare beneficiaries were cash paying customers (i.e., they had no
insurance for drugs), whereas after they enrolled in a Part D plan, they in effect had a
purchasing agent, the PBM or in Medicare terms the Prescription Drug Plan (PDP), that
bargained on their behalf with pharmaceutical manufacturers on the basis of price, using
the threat to place any given drug on a higher tier of the formulary in order to obtain a

Berndt and Newhouse “Draft Handbook Pricing Chapter”
Page 51
better price. In short, the demand from the formerly cash-paying segment of the
Medicare population became more, not less elastic with the acquisition of insurance, and
this drove prices down.
Not surprisingly, utilization of drugs increased post Part D because of the lower
out-of-pocket prices paid by consumers. (Although around 75 percent of Medicare
beneficiaries had at least some drug insurance before Part D, Part D improved the
generosity of the insurance for the majority of them; that is, it lowered the out-of-pocket
prices they paid. For example, many Medicare beneficiaries prior to Part D had limits of
$500-1,250 on the amount of drug spending covered in a year.) Duggan and Scott
Morton [2010] estimate a large utilization effect from Part D, but it is imprecisely
estimated. Zhang et al. [2009] estimate that for a subset of beneficiaries enrolled in an
HMO who had no prior drug coverage, utilization increased 74 percent. Moreover, they
estimate that for this group the increased cost of drugs was more than offset by decreased
costs for hospital and physician spending, most likely because beneficiaries better
adhered to the medication regimens prescribed for their chronic diseases. By contrast,
another group with reasonably generous drug insurance prior to Part D increased
utilization only 11 percent; moreover, hospital and physician spending in this group
actually increased, perhaps because the increase in drugs meant too many drugs were
now being used with concomitant adverse effects.
As noted by Frank and Newhouse, an additional feature of Part D partially offset
the overall downward effect on prices of shifting cash paying customers to PDPs that
used a formulary. 127
Specifically, Part D also shifted the drug coverage of those
Medicare beneficiaries eligible for both Medicaid and Medicare from Medicaid to PDPs.
This meant manufacturers were able to obtain higher prices for this dually eligible group,
because they had previously been paid under the discount rules off the best commercial
price that we described earlier in this chapter. (The law did not allow the PDPs to buy at
the rules governing Medicaid prices for this dually eligible group.) The expectation was
that any price rise relative to the best-price Medicaid system would be modest. For
unique drugs, however, particularly those used primarily by senior citizens, price
increases could have been substantial.
Berndt and Newhouse “Draft Handbook Pricing Chapter”
Page 52
Unfortunately this prediction is impossible to verify directly because AMP and
PDP prices are confidential and protected by statute. Hence, one cannot compare
Medicaid and PDP prices for drugs heavily used by dual eligibles. Examining Form 10-
Q filings with the Securities and Exchange Commission by pharmaceutical firms,
however, Frank and Newhouse report that all the manufacturers of branded antipsychotic
drugs, 70% of which were purchased by Medicaid prior to 2006, reported “favorable
changes in prices that resulted from the shift of large numbers of users of antipsychotic
medications from Medicaid to Part D”, leading Frank and Newhouse to conclude “The
implication is that prices have increased.”128
Frank and Newhouse carried out one other test of this prediction. They compared
2004-6 brand price changes with high shares (55% or more) of elderly purchasers and
those with relatively low shares (35% or less) of elderly purchasers. They report that
prices for drugs used more heavily by the elderly grew 24.2% over the three years
compared with 18.8% for those less heavily used.129
Moreover, prices of drugs sold to
the elderly grew at a more rapid rate after August 2004 (several months after the
December 2003 signing of the Part D legislation, but before the January 2006
implementation) than before.130
These greater price increases for drugs used relatively
intensively by the elderly had not been observed in earlier studies, which showed no
differences in price inflation for elderly vs. non-elderly intensive drugs, probably because
there was no insurance shock analogous to the implementation of Part D.131
One other study worth noting in this context is that by Lakdawalla and Yin
[2009], who examine whether greater concentration among PDP purchasers offering Part
D plans allows them to obtain lower prices for their members. Unlike monopoly power
for producers, monopsony power for purchasers can result in consumers‟ experiencing
price decreases as market power increases – the more enrollees a PDP has, the more
bargaining power it has with pharmacies and drug manufacturers – so long as the PDP
market does not get so concentrated that PDPs are able to charge consumers a large
markup over their costs. Lakdawalla and Yin examine claims data from a large national
retail pharmacy. These data contain the drug prices negotiated between the pharmacy
and every insurer with which it contracted and cover prescriptions dispensed between
September 2004 and April 2007, before and after implementation of Part D on January 1,

Berndt and Newhouse “Draft Handbook Pricing Chapter”
Page 53
2006. They find that insurers that experienced larger enrollment increases due to Part D
implementation negotiated lower drug prices with the pharmacy. (Note that the insurer
may have been negotiating with the pharmacy on the basis of both its commercial or
under 65 business as well as its Medicare business.) More specifically, they find that
enrolling an additional 100,000 members is associated with a 2.5% decrease in drug
prices and a 5% decrease in pharmacy profits earned on prescriptions filled by enrollees
of that insurer. Further, PDPs appear to have used their increased bargaining power to
reduce margins at pharmacies for multiple source generic drugs, but were much less
successful in leveraging additional enrollments into lower prices for on patent branded
drugs.
A closely related issue is the impact of Part D on pharmacy margins. While
greater insurance coverage increased overall prescription utilization, benefiting brick and
mortar pharmacies, pharmacies‟ gross margins could have nonetheless declined following
implementation of Part D because they had previously been able to earn very high
margins on underinsured and insured cash customers who now had Part D coverage.
According to the CVS Caremark 2007 10-K Securities and Exchange Commission filing,
in fact pharmacy margins did decline after Part D:
“The Medicare Drug Benefit became effective on January 1, 2006. Since its
inception the program has resulted in increased utilization and decreased
pharmacy gross margin rates as higher margin business (such as cash and state
Medicaid customers) migrated to the new Medicare Part D coverage.”132
Similar to their bargaining with drug manufacturers over drug prices, the insurers that sell
Part D plans also bargain with pharmacies over dispensing fees. Their bargaining power,
however, is constrained by access rules that require 90 percent of urban and suburban
Medicare beneficiaries to live within two and five miles, respectively, of a pharmacy.133
Nonetheless, for the same reason as it did for drug manufacturers, demand facing retail
pharmacies likely became more price elastic following the implementation of Part D.
B.2 Disintermediating PBMs and Preferred Pharmacy Networks
Another interesting emerging trend involves the substantial profits earned on
generic drugs by both the retail and mail order pharmacy sectors. In September 2006
mass merchandiser giant retailer Wal-Mart announced it was offering a number of 30-day

Berndt and Newhouse “Draft Handbook Pricing Chapter”
Page 54
generic drugs for a price of $4 per prescription. About a year later Wal-Mart expanded
the list of available generic drugs and simultaneously added a new 90-day prescription
for a price of $9 per prescription, implying a dime per day cost of that prescription.134
A
Wal-Mart spokesperson called this the “commoditization” of generic drugs, made
possible in part by its buying directly from generic manufacturers and bypassing
wholesalers.135
Recall that customers with third party insurance usually pay the same copayment
regardless of the retail or mail order pharmacy from which they purchase (as long as the
pharmacy is in the insurer‟s network, which is usually the case). Moreover, as seen in
Tables 1 and 2 above, on average in 2007 the Tier 1 copayment for 30 day prescriptions
at retail was $8.99, and for 90-day via mail order was $17.58, which in both cases is more
than twice the cash price offered by Wal-Mart.136
What Wal-Mart was doing was its
classic tactic -- utilizing its enormous purchasing power to underprice its retail
competitors, in this case, even underpricing the copayments charged by traditional retail
and mail order pharmacies.
For underinsured and uninsured cash paying customers, however, the savings
from having their prescriptions dispensed at Wal-Mart could be much larger. According
to one observer, a Wal-Mart official stated that while it always files a claim on behalf of
its insured customers, it often does not seek reimbursement from payers, even at times
waiving dispensing fees offered by Medicaid.137
Since federal law mandates that
pharmacies cannot be reimbursed by Medicaid for more than its Usual & Customary
(“U&C”) charges and since these $4 and $9 were now clearly Wal-Mart‟s U&C charges,
when it was seeking reimbursement for dispensing to Medicaid beneficiaries, Wal-Mart
typically filed a claim involving smaller reimbursement than that sought by chain and
independent retail and mail order pharmacies; state Medicaid agencies thus benefited
whenever a beneficiary filled out a prescription at Wal-Mart rather than at other
pharmacies.138
Apparently even at only $4, at least for the specific generic drugs Wal-
Mart had available, the $4 revenue more than covered Wal-Mart‟s acquisition and
dispensing costs, generating a positive gross margin.139
Note that like other pharmacies,
Wal-Mart pharmacies have high fixed costs (pharmacy license, pharmacists, insurance,
rented space, etc.) relative to the marginal costs of dispensing, implying that as pharmacy

Berndt and Newhouse “Draft Handbook Pricing Chapter”
Page 55
volume increases, even with constant marginal cost, Wal-Mart‟s average dispensing cost
will fall. Moreover, to the extent the $4 and $9 offers incentivized more customers to
come to Wal-Mart, the increase in its foot traffic likely had a further positive impact on
its non-drug sales and profits.
Within months, a number of other mass merchandisers and food stores, such as
Target, Kroger, Safeway and Giant Food, followed Wal-Mart and began offering very
low priced generics, aimed particularly at cash customers. The first retail pharmacy
chain to respond was Walgreens, which in June 2008 introduced the Walgreens
Prescription Savings Club, offering a 3-month supply of over 400 generics for $12.99
(plus an annual membership fee).140
Then in September 2008 Wal-Mart announced an agreement with Peoria, Illinois
based Caterpillar by which Wal-Mart would charge a zero copay for Caterpillar‟s 70,000
beneficiaries on 2,500 generic drugs, but if Caterpillar‟s beneficiaries chose to fill their
prescriptions at other retail pharmacies, they would pay the normal $5 generic copay.
Notably, Wal-Mart had 12 stores near Peoria, where most of Caterpillar‟s employees
lived. Also as part of the agreement, Caterpillar‟s PBM (RESTAT) agreed to reimburse
Wal-Mart based on Wal-Mart‟s actual invoice prices on drugs. The Wal-Mart –
Caterpillar agreement not only took away profits from sales of generic drugs at retail and
mail order pharmacies, but it also conveyed its potential to disintermediate other
PBMs.141
With this agreement, Wal-Mart and Caterpillar reintroduced the heavily restricted
network differential copayment concept into pharmacy benefits, a concept implemented
for hospitals and physicians in the early 1990s with managed care, but later largely
discarded because of consumers‟ wanting freedom of choice without paying differentially
for it. (Insurers continued to have networks, but the great majority of hospitals and
physicians were in-network.) Recent news events, however, suggest that employers are
returning to a more restrictive or preferred network concept, particularly for physicians
and hospitals.142
Interestingly, in November 2009 Caterpillar announced extension of its
preferred pharmacy network effective January 2010, adding Walgreens to Wal-Mart as
the only sites at which generic copayments for generic drugs would be zero; at other

Berndt and Newhouse “Draft Handbook Pricing Chapter”
Page 56
pharmacies generic copayments would be higher, and customers would need to initially
pay cash, and then fill out various forms to claim reimbursement.143
In November 2008, the combined PBM-retail chain CVS-Caremark announced a
new Health Savings Plan that let customers buy 90 day supplies of over 400 generics for
$9.99 (plus a $10 annual enrollment fee) either through its mail order or at its retail sites,
calling this “channel neutrality”, and noting that it hoped by shifting its 90-day mail order
prescriptions to its retail stores, it would increase foot traffic there.144
Notably, these developments involved generic drugs, drugs that have numerous
manufacturers competing with each other for sales, and that are still the source of
considerable profits for PBMs, mail order and retail pharmacies. As we have noted
earlier, the market for on-patent brands is very different, with exclusive manufacturers
not having to compete as aggressively on price as do generic manufacturers. Whether
discount retailers will team up with other geographically concentrated employers in
offering differential copayments and preferred pharmacy networks for on-patent branded
products remains to be seen.
B.3 Pricing Transparency and Cost-Plus Pricing
As we have noted many times in this chapter, numerous pharmaceutical-related
transactions occur at prices that are not publicly observed. Within health care this is not
unique to pharmaceuticals – it also occurs with hospitals and other providers – but for
pharmaceuticals it has been a prominent and controversial issue.
In terms of actual acquisition costs, while the Average Sales Price (ASP) is now
publicly posted, for new products (including new generics) during the first two quarters
on the market, the manufacturer can report WAC as its ASP, and in those two quarters
pharmacies and other providers will be reimbursed by Medicare at 1.06*WAC. As actual
prices of generics typically fall very rapidly following extensive generic entry, for the
two quarters following initial extensive generic entry pharmacies‟ actual acquisition costs
are likely to be considerably less than WAC, particularly since WAC is a list rather than a
transaction price, implying that for these two quarters retail and mail order profits from
generics will continue to be substantial.
As we noted earlier, regarding AMP and Medicaid reimbursement, while under
the 2010 health care reform legislation the AMP will now be publicly available, the set of

Berndt and Newhouse “Draft Handbook Pricing Chapter”
Page 57
transactions it covers is smaller than before, and as we write this chapter (August 2010)
details of how AMP will be determined for new brand and generic products remain to be
worked out.
More generally, it should not be surprising that the initial set of pharmaceuticals
for which greater transparency in pricing is occurring, particularly in the private sector, is
generic drugs. As noted earlier, Wal-Mart and others view generic drugs as being
commodities, and in commodity markets with relatively homogenous products,
incentives to keep price proprietary are relatively weak; indeed, price competition tends
to be particularly strong in commodity markets -- markets that approach the
microeconomic ideal of perfect competition. Might certain physician procedures and
hospitalizations become “commoditized” in the near future? Walk-in clinics at large
retailers may be an embryonic form of such commoditization.145
The obstacles are
considerable, but so too are pressures for cost reductions. We shall see.
One interesting aspect of moving to cost-plus pricing with audited or public actual
acquisition costs is a reduction in incentives for pharmacies and PBMs to minimize their
costs, and indeed the creation of perverse incentives to increase the cost base on which
the “plus factor” is calculated. In the electric utility industry, cost-plus pricing was seen
to create incentives for utilities to become too capital intensive, and not aggressively
attempt to minimize generation and distribution costs.146
Will the movement to
reimburse pharmacies on cost-plus for generic drugs reduce their incentives to purchase
at lowest prices from generic manufacturers?
For branded and other differentiated product markets, particularly for the many
pharmaceuticals for which marginal costs are much smaller than average costs and for
which consumers‟ preferences and valuations are heterogeneous, we can expect that
individual manufacturers will find it profitable to employ price discrimination tools,
negotiating distinct prices with groups representing beneficiaries with varying demand
elasticities, and wanting to keep these transactions price out of the public eye. Indeed,
particularly for those organizations such as staff model HMOs (e.g., Kaiser) that have
strong bargaining positions due to their restrictive formularies and networks, resulting in
ability to move market share, transparent pricing is an undesirable outcome. Rather, for
them “the best deal is a secret deal”.147

Berndt and Newhouse “Draft Handbook Pricing Chapter”
Page 58
In summary, while the share of prescriptions dispensed as generics has generally
been increasing in the U.S. over the last decade, generating substantial margins for retail
pharmacies, the introduction of Medicare Part D shifted formerly cash paying customers
to insured customers benefiting from the bargaining power of PDPs, thereby reducing
manufacturer and retail pharmacy gross margins. Medicare Part D also shifted dual
Medicare and Medicaid eligibles from Medicaid to PDPs, increasing revenues for
manufacturers but likely decreasing margins for retail pharmacies, as Medicaid
reimbursement to pharmacies has traditionally been more generous than that by the
private sector insurers. It is likely that demand facing retail pharmacies became more
price elastic following the implementation of Part D. A notable recent development is
the entry of retail mass merchandiser giants such as Wal-Mart into the low price generic
market segment, offering low 30- and 90-day prescription prices, and disintermediating
both traditional pharmacy retail chains and PBMs. By offering differentially lower
copays at preferred pharmacy networks, the mass merchandise retailers are creating
additional price competition for generic pharmaceuticals. Whether the
“commoditization” of generic drugs will expand to other types of medical services
remains to be seen.

Berndt and Newhouse “Draft Handbook Pricing Chapter”
Page 59
REFERENCES
Abelson, Reed [2010], “Insurers Push Plans That Limit Health Choices: A Test for the
Future”, New York Times, July 18, p. A1.
Abramson, Richard G., Catherine A. Harrington, Raad Missmar, Susan P. Li and Daniel
N. Mendelson [2004], “Generic Drug Cost Containment in Medicaid: Lessons
from Five State MAC Programs”, Health Care Financing Review 25(3):25-34,
Spring.
Abrantes-Metz, Rosa M., Christopher P. Adams and Albert D. Metz [2005],
“Pharmaceutical Development Phases: A Duration Analysis”, Journal of
Pharmaceutical Finance, Economics and Policy 14(4):19-42.
Adams, Christopher P. and Van V. Brantner [2006], “Estimating the Cost of New Drug
Development: Is It Really $802 Million? Health Affairs 25(2):420-8,
March/April.
Agwunobi, John and Paul A. London [2009], “Removing Costs from the Health Care
Supply Chain: Lessons from Mass Retail”, Health Affairs 28(5):1336-42,
September/October.
Aitken, Murray L., Ernst R. Berndt and David M. Cutler [2008], “Prescription Drug
Spending: Looking Beyond the Turning Point”, Health Affairs – Web Exclusive
28(1):W151-60, published online December 16, 2008;
10.1377.hlthaff.28.1.W138.
Alpert, Bill [1996], “Hooked on Drugs: Why Do Insurers Pay Such Outrageous Prices
for Pharmaceuticals?”, Barrons, June 10, pp. 15-19.
American Druggist Blue Book [1969, 1976, 1977], Various annual and semi-annual
updates, New York: The Hearst Corporation.
AmerisourceBergen Corporation [2004], “AmerisourceBergen Corporation –
Introduction, Company Histories”, available online at
http://www.enotes.com/company-histories/amerisourcebergen-corporation, last
accessed September 7, 2009.
Averch, Harvey and Leland L. Johnson [1962], “Behavior of the Firm Under Regulatory
Constraint”, American Economic Review 52(5):1052-89, December.
Bach, Peter B. [2009], “Limits on Medicare‟s Ability to Control Rising Spending on
Cancer Drugs”, New England Journal of Medicine 360(6):626-33, February 5.
Berndt, Ernst R. [2001], “The U.S. Pharmaceutical Industry: Why Major Growth In
Times Of Cost Containment?”, Health Affairs 20(2):100-14, March/April.
Berndt, Ernst R. [2002], “Pharmaceuticals in U.S. Health Care: Determinants of Quantity
and Price”, Journal of Economic Perspectives 16(4):45-66, Fall.
Berndt, Ernst R. [2005], Report of Independent Expert Professor Ernst R. Berndt to Judge
Patti B. Saris, February 9. United States District Court, District of Massachusetts,
In Re Pharmaceutical Industry Average Wholesale Price Litigation, M.D.L. No.
1456, Civil Action No. 01-12257-PBS, Judge Patti B. Saris.
Berndt, Ernst R. [2007], “A Primer on the Economics of the Re-Importation of
Prescription Drugs”, Managerial and Decision Economics 28:415-35.
Berndt, Ernst R., Iain M. Cockburn, Douglas L. Cocks, Arnold M. Epstein and Zvi
Griliches [1998], “Prescription Drug Prices for the Elderly”, Monthly Labor
Review 121(9):23-34.
Berndt, Ernst R., Iain M. Cockburn and Zvi Griliches [1996], “Pharmaceutical
Berndt and Newhouse “Draft Handbook Pricing Chapter”
Page 60
Innovations and Market Dynamics: Tracking Effects on Price Indexes for
Antidepressant Drugs”, Brookings Papers on Economic Activity:
Microeconomics 1996(2):1133-88.
Berndt, Ernst R., Rena N. Denoncourt and Anjli C. Warner [2009], U.S. Markets for
Vaccines: Characteristics, Case Studies and Controversies”, Washington DC:
AEI Press for the American Enterprise Institute.
Berndt, Ernst R. and Richard G. Frank [2007], “Medicare Part D and Prescription Drug
Prices”, Survey of Current Business 87(6):59-71, June.
Berndt, Ernst R., Richard Mortimer, Ashoke Bhattacharjya, Andrew Parece and Edward
Tuttle [2007], ”Authorized Generic Drugs, Price Competition and Consumers‟
Welfare”, Health Affairs 26(3):790-9, May/June.
Brin, Dinah Wisenberg [2009], “Drug-Benefit Cos Said They‟ve Adjusted for Price
Rollback”, Wall Street Journal, September 17. Available at
http://online.wsj.com/article/BT-CO-20090917-713653.html, accessed September
18, 2009.
Calfee, John E. and Elizabeth DuPre [2006], “The Emerging Market Dynamics of
Targeted Therapeutics”, Health Affairs 25(5):1302-8, September/October.
Chernew, Michael E., Allison B. Rosen, and A. Mark Fendrick [2007], "Value-Based
Insurance Design," Health Affairs 26(2):w195-w203.
Congressional Budget Office [1996], "How the Medicaid Rebate on Prescription Drugs
Affects Pricing in the Pharmaceutical Industry", Washington DC: CBO Papers,
January.
Congressional Budget Office [2004], "Medicaid's Reimbursement to Pharmacies for
Prescription Drugs", Washington DC: CBO Papers, December. Available at
www.cbo.gov.
Congressional Budget Office [2007], "Prescription Drug Pricing in the Private Sector",
Washington DC: CBO Papers, January. Available at www.cbo.gov.
Congressional Budget Office [2008], "Increasing Transparency in the Price of Health
Care Services and Pharmaceuticals", Washington DC: CBO Papers, June 5.
Available at www.cbo.gov.
Currie, Janet and Brigitte C. Madrian [1999], "Health, Health Insurance and the Labor
Market", in Orley C. Ashenfelter and David Card, eds., Handbook of Labor
Economics, Amsterdam: North Holland.
CVS Caremark [2009], TrendsRx Report 2009. Caremark. Available at
www.caremark.com.
Danzon, Patricia M. [1997], "Price Discrimination for Pharmaceuticals: Welfare Effects
in the US and the EU", International Journal of the Economics of Business
4(3):301-21, November.
Danzon, Patricia M. and Li-Wei Chao [2000], "Cross-National Price Differences for
Pharmaceuticals: How Large and Why?", Journal of Health Economics
19(2):159-95.
Danzon, Patricia M. and Mark V. Pauly [2001], "Insurance and New Technology: From
Hospital to Drugstore", Health Affairs 20(5):86-100, September/October.
Danzon, Patricia M. and Mark V. Pauly [2002], "Health Insurance and the Growth in
Pharmaceutical Expenditures", Journal of Law and Economics 45(2):587-613,
October.

Berndt and Newhouse “Draft Handbook Pricing Chapter”
Page 61
Danzon, Patricia M. and Adrian Towse [2003], "Differential Pricing for Pharmaceuticals:
Reconciling Access, R&D and Patents", International Journal of Health Care
Finance and Economics 3(3):183-205, September.
Danzon, Patricia M., Gail R. Wilensky and Kathleen E. Means [2005], "Alternative
Strategies for Medicare Payment of Outpatient Prescription Drugs -- Part B and
Beyond", American Journal of Managed Care 11(3):173-80, March.
DiMasi, Joseph A. and Henry G. Grabowski [2007], "The Cost of Biopharmaceutical
R&D: Is Biotech Different?", Managerial Decision and Economics 28:469-79.
DiMasi, Joseph A., Ronald W. Hansen and Henry G. Grabowski [2003], "The Price of
Innovation: New Estimates of Drug Development Costs", Journal of Health
Economics 22(2):151-86, March.
DiMasi, Joseph A., Ronald W. Hansen, Henry G. Grabowski and Louis Lasagna [1995],
"Research and Development Costs for New Drugs by Therapeutic Category: A
Study of the US Pharmaceutical Industry", PharmacoEconomics 7:152-60.
DiMasi, Joseph A., Ronald W. Hansen, Henry G. Grabowski and Louis Lasagna [1991],
"Cost of Innovation in the Pharmaceutical Industry", Journal of Health Economics
10:107-42.
Drug Channels [2007a], "Wal-Mart adds some $4 generics (yawn)", Drug Channels,
September 27. Available at http://www.drugchanels.net/2007/09/wal-mart-adds-
some4-generics-yawn.html.
Drug Channels [2007b], "Wal-Mart's Gain is not Walgreen's Pain", Drug Channels,
October 2. Available at http://www.drugchannels.net/2007/10/wal-marts-gain-is-
not-walgrens-pain.html.
Drug Channels [2008a], "The AMP Saga Goes On and On and On", Drug Channels,
April 25. Available at http://www.drugchannels.net/2008/04/amp-saga-goes-on-
and-on.html.
Drug Channels [2008b], "Wal-Mart Redux", Drug Channels, May 7. Available at
http://www.drugchannels.net/2008/05/wal-mart-redux.html.
Drug Channels [2008c], "Walgreens' $4.33 Surrender to Wal-Mart", Drug Channels, June
25. Available at http://www.drugchannels.net/2008/06/walgreens-433-surrender-
to-wal-mart.html.
Drug Channels [2008d], "WMT + CAT: Pharmacy's Future?", Drug Channels, September
25. Available at http://www.drugchannels.net/2008/09/wmt-cat-pharmacys-
future.html.
Drug Channels [2008e], "New Details on WMT-CAT Pharmacy Deal", Drug Channels,
November 6. Available at http://www.drugchannels.net/2008/11/new-details-on-
wmt-cat-pharmacy-deal.html.
Drug Channels [2008f], "CVS Escalates the Generic Price War", Drug Channels,
November 12. Available at http://www.drugchannels.net/2008/11/cvs-escalates-
generic-price-war.html.
Drug Channels [2008g], "The Future of AWP: Ask Again Later", Drug Channels,
November 24. Available at http://www.drugchannels.net/2008/04/amp-saga-goes-
on-and-on.html.
Drug Channels [2009a], "Healthcare Reform: Bullish for PBMs, but not Pharmacies",
Drug Channels, October 20. Available at

Berndt and Newhouse “Draft Handbook Pricing Chapter”
Page 62
http://www.drugchannels.net/2009/10/healthcare-reform-bullish-for-pbms-
but.html.
Drug Channels [2009b], "CAT Rolls Out Preferred WAG-WMT Pharmacy Network",
Drug Channels. Available at http://www.drugchannels.net/2009/12/cat-rolls-out-
preferred-wag-wmt.html.
Drug Topics Red Book [1970, 1971, 1985, 1992], New York: Topics Publishing Co., Inc.
Duggan, Mark and Fiona Scott Morton [2006], "The Distortionary Effects of Government
Procurement: Evidence from Medicaid Prescription Drug Purchasing", Quarterly
Journal of Economics 121(1):1-30.
Duggan, Mark and Fiona Scott Morton [2010], "The Effect of Medicare Part D on
Pharmaceutical Prices and Utilization", American Economic Review 100(1):590-
607, March.
Ellis, Randall P. and Willard G. Manning [2007], "Optimal Health Insurance for
Prevention and Treatment," Journal of Health Economics 26(6):1128-50.
Emissary International LLC [2008], "The Historical Rise of Pharmaceutical Regulation".
Available online at http://www.emissary.com/Focus-on-Clinical-Research-
Professionals/history.html, last accessed 3 July 2010.
Fay, John T., Jr. [1980], "Wholesale Drug Pricing and Perfect Knowledge", unpublished
Ph.D. thesis, Boston MA: Massachusetts College of Pharmacy and Allied Health
Sciences, 1980.
Fay, John T., Jr. [1983], "The Wholesaler", ch. 12 in Mickey C. Smith, Principles of
Pharmaceutical Marketing, Third Edition, Philadelphia: Lea & Febiger, pp. 248-
71.
F.D.C. Reports [1966], Two Dominant Trends in Wholesale Drug Business -- Vertical
Integration by Adding Manufacturing and Horizontal Merging -- Could
Restructure Entire Drug Field", The Pink Sheet, November 14, pp. 3.ff. Adapted
and reprinted in part as ch. 15, "Two Dominant Trends in Wholesale Drug
Business" in Bernard G. Keller and Mickey C. Smith, eds., [1969] Pharmaceutical
Marketing: An Anthology and Bibliography, Baltimore: Williams and Wilkins,
pp. 90-93.
Federal Trade Commission [2009], Authorized Generics: An Interim Report of the
Federal Trade Commission, June. Available at
http://www.ftc.gov/opa/2009/06/generics.shtm, last accessed 14 July 2010.
Fein, Adam J. [2009], U.S. Pharmacy Industry: 2009 Economic Report and Outlook,
Philadelphia, PA: Pembroke Consulting, Inc., September. Available at
http://www.PembrokeConsulting.com/pharmacyEULA.pdf.
First DataBank [2009], "AWP Communications re: Update Regarding AWP Litigation --
Final Order and Judgment Entered", March 31. Available at
http://www.firstdatabank.com/Support/awp-communications.aspx, last accessed
July 15, 2010.
Frank, Richard G. [2001], "Prescription Drug Prices: Why Some Pay More Than Others
Do", Health Affairs 20(2):115-28, March/April.
Frank, Richard G. [2003], "New Estimates of Drug Development Costs", Journal of
Health Economics 22(2):325-30.

Berndt and Newhouse “Draft Handbook Pricing Chapter”
Page 63
Frank, Richard G. [2006], "Behavioral Economics and Health Economics", Economic
Institutions and Behavioral Economics, in Peter Diamond and Hannu Vartiainen,
eds., Princeton: Princeton University Press.
Frank, Richard G. and Joseph P. Newhouse [2007], "Mending the Medicare Prescription
Drug Benefit: Improving Consumer Choices and Restructuring Purchasing",
Washington DC: The Brookings Institution, Hamilton Project Discussion Paper
2007-03, April.
Frank, Richard G. and Joseph P. Newhouse [2008], "Should Drug Prices Be Negotiated
Under Part D of Medicare? And If So, How?", Health Affairs 27(1):33-43,
January/February.
Frank, Richard G. and David S. Salkever [1997], "Generic Entry and the Pricing of
Pharmaceuticals", Journal of Economics and Management Strategy 6(1):75-90.
Fuchs, Victor R. [1974], Who Shall Live?, New York: Basic Books.
Garber, Alan M., Charles I. Jones and Paul M. Romer [2006], "Insurance and Incentives
for Medical Innovation", Cambridge, MA: National Bureau of Economic
Research, Working Paper No. W12080, March. Published in Forum for Health
Economics & Policy, 2006, Forum: Biomedical Research and the Economy,
Article 4.
Gencarelli, Dawn M. [2002], "Average Wholesale Price for Prescription Drugs: Is There
A More Appropriate Pricing Mechanism?", National Health Policy Forum, Issue
Brief No. 775, June 7. Washington DC: George Washington University.
Golden, Joshua [2008], "Assessing the First DataBank Settlement: Dramatic Shake-Up or
Status Quo?", Benefits Quarterly, Fourth Quarter 2008:12-15. Available at
www.hewittassociates.com, last accessed 12 July 2010.
Goldman, Dana P., Geoffrey F. Joyce, Grant Lawless et al. [2006], "Benefit Design and
Specialty Drug Use", Health Affairs 25(5):1319-31, September/October.
Goldman, Dana P. and Tomas J. Philipson [2007], "Integrated Insurance Design in the
Presence of Multiple Medical Technologies," American Economic Review
97(2):427-32.
Gorman, Joseph B. [1971], Kefauver: A Political Biography, New York: Oxford
University Press.
Grabowski, Henry G. [2008], "Follow-on Biologics: Data Exclusivity and the Balance
Between Innovation and Competition", Nature Reviews: Drug Discovery 7:479-
88, June, doi:10.1038/nrd2532.
Grabowski, Henry G., Iain M. Cockburn and Genia Long [2006], "The Market for
Follow-On Biologics: How Will It Evolve?", Health Affairs 25(5):1
Greenberg, R.B. [1988], "The Prescription Drug Marketing Act of 1987", American
Journal of Hospital Pharmacy 45(10):2118-26, November.
Green Sheet [1971], "Actual Acquisition Cost Should Replace 'Average Whsle. Price'",
Weekly Pharmacy Reports, Pharmacy Reports, Inc., March 22.
Gruber, Jonathan [2000], "Health Insurance and the Labor Market", ch. 12 in Anthony J.
Culyer and Joseph P. Newhouse, eds., Handbook of Health Economics,
Amsterdam: North-Holland, 645-706.
Gruber, Jonathan and Botond Koszegi [2001], "Is Addiction Rational? Theory and
Evidence," Quarterly Journal of Economics 116(4):1261-1305.

Berndt and Newhouse “Draft Handbook Pricing Chapter”
Page 64
Harris, Gardiner [2009], "Pfizer Pays $2.3 Billion to Settle Marketing Case", New York
Times, September 2. Available online at
http://www.nytimes.com/2009/09/03/business/03health.html?_r=1&pagewanted=
print, last accessed July 10, 2010.
Hyman, Phelps & McNamara [2008]. "First DataBank Announces New Settlement in
AWP Litigation", FDA Law Blog, June 24. Available at
http://www.fdalawblog.net/fda_law_blog_hyman_phelps/2008/06/first-
databank.html, last accessed July 12, 2010.
Keeler, Emmett B., Joseph P. Newhouse, and Charles E. Phelps [1977], "Deductibles and
Demand: A Theory of the Consumer Facing a Variable Price Schedule under
Uncertainty," Econometrica 45(3): 641-655.
Keller, Bernard G., Jr. [1969], "The Modern Drug Wholesaler", ch. 14 in Bernard G.
Keller, Jr., and Mickey C. Smith, eds., Pharmaceutical Marketing: An Anthology
and Bibliography, Baltimore: The Williams and Wilkins Co., pp. 85-93.
Kolassa, E. M. (Mick) [1997], Elements of Pharmaceutical Pricing, Binghamton NY: The
Pharmaceutical Products Press.
Kolassa, E. M. (Mick) [2009], The Strategic Pricing of Pharmaceuticals, The
PondHouse Press.
Kolassa, Mick [1994], "Guidance for Clinicians in Discerning and Comparing the Price
of Pharmaceutical Agents", Journal of Pain and Symptom Management 9(4):235-
43, May.
Kyle, Margaret K. [2007], "Pharmaceutical Price Controls and Entry Strategies", Review
of Economics and Statistics 89(1):88-99.
Kyle, Margaret K. [2009], "Parallel Trade in Pharmaceuticals: Firm Responses and
Competition Policy", ch. 13 in Barry Hawk, ed., International Antitrust Law &
Policy, New York: Juris Publishing for the Fordham Competition Law. Available
from http://margaretkyle.net/IntlAntitrust.pdf, last accessed July 10, 2010.
Kyle, Margaret K. [2010], "Strategic Responses to Parallel Trade", unpublished working
paper, Toulose School of Economics, May (revision of National Bureau of
Economic Research Working Paper No. 12968). Available from
http://margaretkyle.net/Strategic_Responses.pdf, last accessed July 10, 2010.
Lakdawalla, Darius and Wesley Yin [2009], "How Insurers' Bargaining Power Affects
Drug Prices in Medicare Part D", Cambridge MA: National Bureau of Economic
Research, Working Paper No. 15330, April.
Martinez, Barbara [2006], "How Quiet Moves by a Publisher Sway Billions in Drug
Spending", Wall Street Journal, October 6, p. A1.
"Medicaid Commission". Report to the Honorable Secretary Michael O. Leavitt,
Department of Health and Human Services and the United States Congress,
September 1, 2005. Available at http://aspe.hhs.gov/medcaid/090105rpt.pdf.
Morgan Lewis [2010], "Price Reporting and Governmental Rebate Issues Arising from
the Healthcare Reform Law -- An Early Assessment", Morgan Stanley LawFlash,
July 6. Available at http://www.morganlewis.com/healthcarereform.
Mossinghoff, Gerald J. [1999], "Overview of the Hatch-Waxman Act and Its Impact on
the Drug Development Process", Food and Drug Law Journal 54(2):187-94.

Berndt and Newhouse “Draft Handbook Pricing Chapter”
Page 65
National Association of Chain Drug Stores [2010], "Industry Stats". Available at
http://www.nacds.org/wmsprint.cfm?print_url=http%3A//www.nacds.org/wmspa
ge.cfm%3..., last accessed August 4, 2010.
National Association of State Medicaid Directors [2010], "Post AWP Pharmacy Pricing
and Reimbursement", June/
National Community Pharmacy Association [2006], "First DataBank (FDB) Lawsuit and
Proposed AWP Settlement -- FAQ", available at
www.ncpanet.org/pdf/legal/legal_1stdbpal-faw.pdf.
National Pharmaceutical Council [2003], Pharmaceutical Benefits 2003.
Needles, Zack [2008], "McKesson Settles Class Action Suit for $350 Million",
Law.Com, November 24. Available at
http://www.law.com/jsp/laww/LawArticleFriendly.jsp?id=1202426232278.
Newhouse, Joseph P. and Anna D. Sinaiko [2008], "What We Know and Don‟t Know
About the Effects of Cost Sharing on Demand for Medical Care - and So What?"
in Frank A. Sloan and Hirschel Kasper, eds., Incentives and Choice in Health
Care, Frank A. Sloan and Hirschel Kasper, Cambridge, MA: MIT Press, pp. 156-
84.
Peltzman, Sam [1973], "An Evaluation of Consumer Protection Legislation: The 1962
Drug Amendments", Journal of Political Economy 81(5), September-October.
Pennebaker, George [1998], "The Rest of the AWP Story", ComputerTalk 18(1):6-7,
January/February.
Pharmacy Benefit Management Institute [2009], 2009-2010 Prescription Drug Benefit
Cost and Plan Design Report, Scottsdale AZ. Available from www.pbmi.com.
Phelps, Charles E. and Joseph P. Newhouse [1974], "Coinsurance, The Price of Time,
and the Demand for Medical Services", Review of Economics and Statistics
56(3):334-42, August.
Reiffen, David E. and Michael E. Ward [2005], "Generic Drug Industry Dynamics",
Review of Economics and Statistics 87(1):37-49.
Reiffen, David E. and Michael E. Ward [2007], "'Branded Generics' As A Strategy to
Limit Cannibalization of Pharmaceutical Markets", Managerial and Decision
Economics 28:251-65.
Rosenthal, Meredith B., Ernst R. Berndt, Julie M. Donohue, Richard G. Frank and
Arnold M. Epstein [2002], "Promotion of Prescription Drugs to Consumers", New
England Journal of Medicine 346(7):498-505, February 14.
Saha, Atanu, Henry G. Grabowski, Howard M. Birnbaum, Paul E. Greenberg and Oded
Bizan [2006], "Generic Competition in the U.S. Pharmaceutical Industry",
International Journal of the Economics of Business 13(1):15-38, February.
Saris, Judge Patti B. [2009], "Memorandum and Order", in re: New England Carpenters
Health Benefit Fund, et al., Plaintiffs, v. First Databank, Inc. and McKesson
Corporation, Defendants, Civil Action No. 05-11148-PBS, and District Council
37 Health and Security Plan, on behalf of itself and all others similarly situated,
Plaintiff, v. Medi-Span, a division of Wolters Kluwer Health, Inc., Defendant,
Civil Action No. 07-10988-PBS, March 17, pp. 5-6. Available at
http://www.firstdatabank.com/download/pdf/OrderGrantingFinalApprovalofSettle
ment031709.pdf.
Scherer, F. Michael [1997], "How US Antitrust Can Go Astray: The Brand Name

Berndt and Newhouse “Draft Handbook Pricing Chapter”
Page 66
Prescription Drug Litigation", International Journal of the Economics of Business
4(3):239-56, November.
Schondelmeyer, Stephen W. and Marian V. Wrobel [2004], Medicaid and Medicare Drug
Pricing: Strategy to Determine Marke Prices, Cambridge, MA: Abt Associates,
Inc., August 30. Available online at
wwww.abtassociates.com/reports/20040830_500_00_0049.pdf.
Scott, Mary Kate [2006], "Health Care in the Express Lane: The Emergence of Retail
Clinics". Available online at
http:P//www.chcf.org/~/media/Files/PDF/H/HealthCareInTheExpressLaneRetailC
linics.pdf.
Scott Morton, Fiona [1997], "The Strategic Response by Pharmaceutical Firms to the
Medicaid Most-Favored-Customer Rules", RAND Journal of Economics
28(2):269-90, Summer.
Scott Morton, Fiona [1999], "Entry Decisions in the Generic Pharmaceutical Industry",
RAND Journal of Economics 30:421-40.
Scott Morton, Fiona [2000], "Barriers to Entry, Brand Advertising, and Generic Entry in
the U.S. Pharmaceutical Industry", International Journal of Industrial
Organization 18:1085-1104.
Schwartz, Victor E., Cary Silverman, Michael J. Hulka and Christopher E. Appel [2009],
"Marketing Pharmaceutical Products in the Twenty-First Century: An Analysis of
the Continued Viability of Traditional Principles of Law in the Age of Direct-to-
Consumer Advertising", Harvard Journal of Law & Public Policy 32(1):333-88.
Showalter, Mark H. [1999], "Firm Behavior in a Market with Addiction: The Case of
Cigarettes", Journal of Health Economics 18:409-27.
Shrank, William H., Niteesh K. Choudhry, Jessica Agnew-Blas et al. [2010], "State
Generic Substitution Laws Can Lower Drug Outlays Under Medicaid", Health
Affairs 29(7):1383-90, July.
Siecker, Bruce [19??], "Place Applications in the U.S. Drug Market", ch.12 in Mickey C.
Smith, E. M. "Mick" Kolassa, Greg Perkins and Bruce Siecker, eds.,
Pharmaceutical Marketing: Principles, Environment, and Practice, publisher?
Silverman, Ed [2008], "Pharmacies Fight First DataBank Settlement", Pharmalot.com,
January 7. Available at http://www.pharmalot.com/2008/01/pharmacies-fight-
first-databank-settlement/, last accessed July 12, 2010.
Smith, Mickey C. [1975], "The Wholesaler", ch. 12 in Principles of Pharmaceutical
Marketing, Second Edition, Philadelphia: Lea & Febiger, pp. 221-71.
Takeda [2003], The Prescription Drug Benefit Cost and Plan Design Survey Report
Provided by Takeda, 2003 Edition, Temple AZ: Pharmacy Benefit Management
Institute, Inc. Available from [email protected].
Takeda [2004], The Prescription Drug Benefit Cost and Plan Design Survey Report, 2004
Edition, Temple AZ: Pharmacy Benefit Management Institute, Inc. Available
from [email protected].
Takeda-Lilly [2001], The Takeda and Lilly Prescription Drug Benefit Cost and Plan
Design Survey Report, 2001 Edition, Temple AZ: Pharmacy Benefit
Management Institute, Inc. Available from [email protected].
Trusheim, Mark R., Murray L. Aitken and Ernst R. Berndt [2010], “Characterizing

Berndt and Newhouse “Draft Handbook Pricing Chapter”
Page 67
Markets for Biopharmaceutical Innovations: Do Biologics Differ From Small
Molecules?”, Cambridge, MA: National Bureau of Economic Research, Working
Paper No. 16014, May. Forthcoming, Forum for Health Economics & Policy.
Trusheim, Mark. R., Ernst R. Berndt and Frank L. Douglas [2007], “Stratified Medicine:
Strategic and Economic Implications of Combining Drugs and Clinical
Biomarkers”, Nature Reviews Drug Discovery 6(4):287-93.
United States Department of Health and Human Services [2010], “Glossary of Pharmacy-
Related Terms”, Health Resources and Services Administration. Available online
at http://www.hrsa.gov/opa/glossary.htm, last accessed July 7, 2010.
United States Department of Health and Human Services [1997a], “Medicaid Pharmacy –
Actual Acquisition Costs of Prescription Drug Products for Brand Name Drugs”,
Office of Inspector General, Report A-06-96-00030, April. Available online
through www.oig.hhs.gov/reports.htm.
United States Department of Health and Human Services [1997b], “Excessive Medicare
Payments for Prescription Drugs”, Office of Inspector General, Report OEI-0e-
97-00290, Decemberl. Available online through www.oig.hhs.gov/reports.htm.
United States Department of Health and Human Services [2001], “Medicaid Pharmacy –
Actual Costs of Brand Name Prescription Drug Products”, Office of Inspector
General, Report A-06-00-00023, August. Available online through
www.oig.hhs.gov/reports.htm.
United States Department of Health and Human Services [2002], “Medicaid Pharmacy –
Actual Acquisition Costs of Generic Prescription Drug Products”, Office of
Inspector General, Report A-06-01-00053, March. Available online through
www.oig.hhs.gov/reports.htm.
United States Department of Health and Human Services [2004a], “Omission of Drugs
from the Federal Upper Limit List in 2001”, Office of Inspector General, Report
OEI-03-02-00670, February. Available online through
www.oig.hhs.gov/reports.htm.
United States Department of Health and Human Services [2004b], “Variation in State
Medicaid Drug Prices”, Office of Inspector General, Report OEI-05-02-00681,
September. Available online through www.oig.hhs.gov/reports.htm.
United States Federal Trade Commission [2009], Emerging Health Care Issues: Follow-
on Biologic Drug Competition, June. Available online at
www.ftc.gov/opa/2009/06/biologics.shtru.
United States Food and Drug Administration [nd], “Therapeutic Equivalence Evaluations
Codes”, in Orange Book Preface, Center for Drug Evaluation and Research,
Approved Drug Products with Therapeutic Equivalence Evaluations, 30th
Edition.
United States General Accounting Office [1993], “Medicaid: Changes in Drug Prices
Paid by HMOs and Hospitals Since Enactment of Rebate Provisions”,
GAO/HRD-93-43, January.
United States General Accounting Office [2001], “Medicare: Payments for Covered
Outpatient Drugs Exceed Providers‟ Cost”, Report to Congressional Committees,
GAO-01-1118, September.
Varian, Hal R. [1989], “Price Discrimination”, ch.10 in Richard L. Schmalensee and
Robert D. Willig, eds., Handbook of Industrial Organization, Vol. 1:597-654.

Berndt and Newhouse “Draft Handbook Pricing Chapter”
Page 68
Wal-Mart [2010], “$4 Prescriptions Program”, available online at
http://www.walmart.com/cp/4-Prescriptions-Program/546834, last accessed
March 21, 2010.
Weinstein, Roy and John Culbertson [1997], “How US Antitrust Can Be On Target: The
Brand Name Prescription Drug Litigation”, International Journal of the
Economics of Business 4(3):257-64, November.
Wolters Kluwer Health [2010], “Pricing Policy Update: Important Notice for Wolters
Kluwer Health‟s MediSpan Customers”. Available online at
http://www.medispan.com/Pricing-Policy-Update.aspx, last accessed July 27,
2010.
Zhang, Yuting, Julie M. Donohue, Judith R. Lave et al. [2009], “The Impact of Medicare
Part D Drug Benefit on Pharmacy and Medical Care Spending”, New England
Journal of Medicine 361(1):52-61.

Berndt and Newhouse “Draft Handbook Pricing Chapter”
Page 69
ENDNOTES
1 http://www.cms.gov/NationalHealthExpendData/downloads/tables.pdf.
2 See Gruber [2000] and Currie and Madrian [1999].
3 The 37 percent is a conservative estimate because the National Health Accounts define the subsidies that
the federal government pays private employers who maintain credible drug coverage for their retirees a
subsidy. These subsidies are defined as Private Health Insurance costs in the Accounts and not public
sector pharmaceutical spending, though they arguably should be classified with prescription drug spending;
if there were no Medicare Part D drug benefit, these subsidies would not exist. 4 Although it is commonly believed that US unit prices are well above those in the rest of the world, this is
not the case; a market basket of US prices (including brands and generics) is slightly lower than Canadian
and 24 percent lower than German prices, although higher than prices in a number of other countries. See
Danzon and Chao [2000]. 5 As described in Gorman [1971].
6 For further details, see, for example, Gorman [1971], Peltzman [1973], Emissary International [2008], and
Schwartz, Silverman, Hulka and Appel [2009]. 7 See, for example, F.D.C. Reports [1966].
8 Mossinghoff [1999].
9 The FDA assigns an AA, AN, AO, AP or AT rating, depending on the dosage form, when there are no
known or suspected bioequivalence problems, and an AB rating when actual or potential bioequivalence
problems have been resolved with adequate in vivo and/or in vitro evidence supporting bioequivalence.
Various B ratings, e.g., BC, BD, BE, BN, etc. are drug products for which actual or potential
bioequivalence problems have not been resolved by adequate evidence of bioequivalence. See U.S. Food
and Drug Administration, Orange Book Preface, p. 4 for more details. 10
For the small number of patients who have allergies to certain colors, lactose intolerance or other
reactions with the inactive ingredient of a small molecule, a brand and an AB-rated bioequivalent generic
drug may in fact generate clinically significant different patient responses. 11
Reiffen and Ward [2005], Saha, Grabowski, Birnbaum, Greenberg and Bizan [2006]. 12
If there are several formulations of the molecule having different strengths, it is possible that there will
be different successful Paragraph IV entrants for each strength. Further details and references regarding
Paragraph IV certifications are given in Berndt, Mortimer, Bhattacharjya, Parece and Tuttle [2007], 13
For discussion, see Federal Trade Commission [2009]. 14
Berndt, Mortimer, Bhattacharjya, Parece and Tuttle [2007]. 15
See Berndt, Cockburn and Griliches [1996] for examples. 16
For a comparison of small molecules and biologics, see Trusheim, Aitken and Berndt [2010]. 17
For discussion and references, see, for example, Grabowski, Cockburn and Long [2006], Grabowski
[2008] and United States Federal Trade Commission [2009]. 18
It is notable that for vaccines – among the largest biologic molecules – in the U.S. there has not been any
generic vaccine marketed. For discussion of vaccine markets and comparisons with small molecules and
other biologics, see Berndt, Denoncourt and Warner [2009]. 19
Schondelmeyer and Wrobel [2004]. 20
The use and marketing of AWP, WAC, and other prices has been the subject of considerable litigation, in
which one of the current authors (ERB) has been involved. See Berndt [2005] for definitions and histories
of the various list prices. The National Association of Chain Drug Stores [2010] reports that in 2009 an
average retail prescription was priced at $76.94, of which the manufacturer receives $61.27 (79.6% of
price), the wholesaler receives $2.33 (3.0% of price), and the retailer receives $13.33 (17.3% of price). The
average brand prescription price was $155.45, while that for a generic was $39.73. 21
Berndt [2001,2002]; Frank [2001]. 22
For further discussion, see Frank [2001] and Berndt [2002]. 23
Variants of formularies, and examples of historical copayment trends, are given in Frank [2001] and
Berndt [2002]. 24
Much of the material presented here regarding AWP and other prices is discussed in greater detail in
Berndt [2005]. For a detailed discussion of various pharmaceutical prices, see Kolassa [2009], especially
ch. 3.

Berndt and Newhouse “Draft Handbook Pricing Chapter”
Page 70
25
The paragraphs that follow regarding the creation and evolution of AWP are based in large part on
Pennebaker [1998] and a half-day meeting between one of the authors (ERB) and Pennebaker on August
28, 2009. George Pennebaker, PharmD, is now a retired consultant, and can be reached at 916-501-6541,
or at [email protected]. Reference to the role California Medicaid played in creating AWP
is also made in Martinez [2006], citing E. M. “Mick” Kolassa; also see Kolassa [2009], especially ch. 3. 26
ERB discussion with Pennebaker, August 28, 2009, in Boston, MA. 27
In cases where the manufacturer did not suggest a retail selling price nor established a fair trade
minimum, the Red Book column entry was left blank. See, for example, Drug Topics Red Book [1970]. 28
Drug Topics Red Book [1970]. 29
Drug Topics Red Book [1970]. 30
See, for example, Drug Topics Red Book [1971, 1985, 1992]. 31
American Druggist Blue Book [1975, p. 1, 340; 1976, p. 67, 446]. 32
American Druggist Blue Book [1997, p. 436]. 33
American Druggist Blue Book [1995, p. 5]. 34
ERB discussion with Pennebaker, August 28, 2009, in Boston, MA. There is evidence that already in
1971, the California legislature‟s fiscal consultant recognized that AWP overstated pharmacy‟s actual
acquisition costs. The Green Sheet [1971, p. 3] reports that the consultant‟s report stated that “Most
discounts are in the 10% range.” 35
Kolassa [1994, pp. 236-7]; much of this material is reproduced in Kollassa‟s 1997 textbook, Kolassa
[1997, pp. 33, 35-6]. Independent verification of Kolassa‟s observation is provided in Fay [1980, p. 51]. 36
Fay [1980], pp. 29, 32, 34. 37
Fay [1980], pp. 26, 29, 32, 34. 38
Ibid. 39
Fay [1980, pp. 125-6] reports, “For the period 1977-1979, an examination of NWDA records and other
sources indicates that some 25 warehouses were closed to consolidate service in larger trading ares, 11
were either merged or acquired and 13 ceaased operations for one business reason or another, usually a
financial problem. There is general agreement in the industry that the number of locations will continue to
decline and that the trend to mergers and acquisitions will accelerate [footnote reference omitted]…Active
members of NWDA operated from 367 locations in 1970. The comparable number for these same firms
was 265 in 1979.” 40
Fay reports that in 1979 a typical wholesaler was receiving orders for 42% of its sales volume
electronically, “with 60 percent a reasonable estimate for 1980.” (p. 45). Additional details on the
electronic transformation of wholesaling are given in ch. 5 of Fay‟s 1980 Ph.D. dissertation. 41
See especially “Computers as Agents of Change” (pp. 61-5) and “Retailing Reorganized” (pp. 65-7) in
Fay [1983]. For one wholesaler company‟s historical description of its experience in exploiting
opportunities brought about by the ever lower cost information and communications technologies, see
Ameriscource Bergen Corporation[2004]. 42
United States Department of Health and Human Services [1997a]. 43
United States Department of Health and Human Services [1997b]. 44
United States Department of Health and Human Services [2001]. 45
United States Department of Health and Human Services [2002]. 46
Congressional Budget Office [1996], p. 19, referring to United States General Accounting Office [1993]. 47
Congressional Budget Office [2004], p. 1. 48
Congressional Budget Office [2004], p. 1. 49
Kolassa [1994], p. 237; Alpert [1996]. 50
Online at http://www.usdoj.gov/atr/public/busreview/0772.htm, pp. 1,2. This was a portion of
Bingaman‟s October 1, 1993 response indicating that “the Department currently intends to bring suit to
challenge the program if PMA and its members go forward with this proposal.” Earlier, following Merck‟s
1990 announcement of a voluntary commitment to limit annual price increases to no more than the growth
in the overall Consumer Price Index (“CPI”), several other pharmaceutical companies followed suit. In
1993 the Pharmaceutical Manufacturers Association (“PMA”) requested a business review by the U.S.
Department of Justice of a program it proposed to implement, whereby member companies would commit
to limiting annual price increases at rates not to exceed growth in the CPI, subject to audit. 51
United States General Accounting Office [2001], pp. 23-24. 52
Medicaid Commission [2005].
Berndt and Newhouse “Draft Handbook Pricing Chapter”
Page 71
53
See Gencarelli [2002] and the references cited therein for further details. 54
Gencaarelli [2002], National Pharmaceutical Council [2003], Abramson, Harrington, Missmar et al.
[2004] and U.S. Department of Health and Human Services [2004a,b]. 55
Drug Channels [2008a]. 56
Morgan Lewis [2010]. 57
Morgan Lewis [2010]. Bona fide service fees are excluded from the AMP calculations. 58
Danzon, Wilensky and Means [2005]. 59
United States Department of Health and Human Services, Health Resources and Service Administration
[2010]. 60
United States General Accounting Office [2001], p. 23. 61
United States Department of Health and Human Services, Health Resources and Services Administration
[2010]. 62
Martinez [2006]. 63
Saris [2009]. References and paragraph breaks from Judge Saris‟ order have been omitted. 64
Martinez [2006]. 65
Martinez [2006]. This article also states that Morgan‟s testimony contradicted accounts of the two other
largest wholesalers, AmerisourceBergen and Cardinal Health, who stated they hadn‟t provided pricing
information in earlier years either. 66
Silverman [2008]. 67
Needles[2008]; Drug Channels [2008g]. 68
First DataBank [2009]. Additional terms of the settlement required FDB to establish a centralized data
repository to facilitate reasonable access to other pending FDB litigation, make a $1 million contribution
for benefit of settlement class members, and pay $1.1 million in attorneys‟ fees and other expenses. A
separate settlement was also reached with publisher Medi-Span, a division of Wolters Kluwer Health, Inc.,
to apply the same rollback to all other drugs whose AWP was in excess of 120% of WAC. 69
Hyman, Phelps & McNamara [2008]. 70
National Community Pharmacy Association [2006]. Also see National Association of State Medicaid
Directors [2010]. 71
Silverman [2008]. 72
Golden [2008], p. 13. 73
Brin [2009]. 74
Fein [2009], p. 35. 75
See National Association of State Medicaid Directors [2010]. 76
Wolters Kluwer Health [2010]. 77
See Frank [2001] for an overview discussion and application. 78
Phelps and Newhouse [1974]. 79
The discussion that follows is based largely on Greenberg [1988]. 80
Hospitals can return drug products, provided the return is made to the manufacturer or wholesaler and
provided written notice is secured that the goods were received (for manufacturers) or the goods were
destroyed or returned to the manufacturer (for wholesalers). See Greenberg [1988] for further details. 81
For further discussion of the economics of reimportation, see Berndt [2007]. 82
Fuchs [1974] describes price discrimination by pharmaceutical manufacturers, stating “maximum profits
are realized by cutting prices where sales are likely to be responsive to such cuts and by maintaining them
in all other markets” (p. 109). He goes on to state, “More than half of all the drugs sold by retailers come
to them through drug wholesalers, whose markup is usually small (about 10 percent of the retail price) and
covers the cost of such essential functions as storage, credit and delivery. Unlike drug manufacturing and
drug retailing, the wholesaling sector of the drug business has never seemed to pose any special problems
for public policy.” (p. 112). 83
DiMasi, Hansen, Grabowski and Lasagna [1991], DiMasi, Hansen , Grabowski [2003]; also see Adams
and Van Brantner [2006]. 84
See, for example, Abrantes-Metz, Rosa M., Christopher P. Adams and Albert D. Metz [2005], and DiMasi, Hansen, Grabowski and Lasagna [1995]. 85
DiMasi and Grabowski [2007]. 86
Aitken, Berndt and Cutler [2008]; Berndt, Cockburn and Griliches [1996].

Berndt and Newhouse “Draft Handbook Pricing Chapter”
Page 72
87
For a discussion of various components of variable costs for biopharmaceuticals, see Berndt [2002].
These conditions also create strong incentives for pharmaceutical manufacturers to engage in vigorous
marketing efforts, including traditional detailing to physicians and direct-to-consumer advertising (Berndt
[2001]). 88
Frank [2001]; Schondelmeyer and Wrobel [2004]. 89
For a survey of the welfare economics of price discrimination, see Varian [1989]. 90
See, for example, F. Michael Scherer [1997] and Patricia M. Danzon [1997]. 91
See, for example, Weinstein and Culbertson [1997], The International Journal of the Economics of
Business devoted an entire special issue, November 1997 (Vol. 4, No. 3) to a Symposium on the US Brand
Name Prescription Drug Antitrust Litigation, with Harold E. Frech III as guest editor. One of the current
authors (ERB) was involved in that litigation on behalf of the defendant brand drug manufacturers. 92
With fixed health ministry budgets, demand price elasticities would equal -1. It is generally believed that
demand for health care is price inelastic; note that with a standard monopoly pricing framework with linear
demand curves and constant marginal cost, the monopolist prices in the elastic portion of the market
demand curve, with markup (P – MC)/P = -1/Ed, where P, MC and Ed, are price, marginal cost and
elasticity of demand, respectively. One plausible way in which to incorporate inelastic demand and
negative markups is to permit time dependence in demand, such as long term maintenance treatment of
medicines, or in the extreme addiction. As pointed out by Showalter [1999], recognizing that future
demand for a product can be much larger than current period demand, the profit maximizing monopolist
may price in the inelastic portion of the current period demand curve, with negative markup, since doing so
will entice the consumer to begin consuming a life-long maintenance medicine in the current time period. 93
We do not consider a perfectly competitive market for branded drugs, because perfect competition is in
general inconsistent with differentiated products. While perfect competition might be a useful
approximation to generic drug markets (see our earlier discussion), for brands this is clearly not the relevant
microeconomic framework. 94
http://www.medpac.gov/chapters/Jun09DataBookSec11.pdf 95
The policies often had an initial deductible such as $50 or $100. If the consumer expects to exceed such
a deductible with certainty, it creates only a modest income effect. If not, demand depends on the expected
marginal price at the end of the accounting period. See Keeler, Newhouse and Phelps [1977]. 96
The dollar expenditure at which 5 percent coinsurance takes effect changes each year, but in 2009 was
$6,356. 97
See, for example, Danzon and Pauly [2001, 2002]. 98
Aitken, Berndt and Cutler [2008]. 99
Many chronic drugs can also be purchased from the insurer (pharmacy benefit manager) by mail order.
In this case a common arrangement is to price a three month supply for a copayment less than three times
the 30-day copay. This has the effect of passing on to the consumer some of the savings of the
pharmacists‟ dispensing fee. 100
Not surprisingly, estimated price elasticities of demand for these specialty drugs are very small; for one
set of estimates, see Goldman, Joyce, Lawless et al. [2006]. 101
Sometimes the coinsurance applies only after the consumer has spent a certain amount out-of-pocket. In
this case the above coinsurance analysis does not apply unless the benefit is valued sufficiently highly by
the insured so that s/he is willing to spend the amount needed to arrive in to the coinsurance region. There
is also an income effect on demand from spending this amount, which may mitigate the manufacturer‟s
ability to increase the pre-insurance price. 102
The six classes are antidepressants, antipsychotics, anticonvulsants, immunosupressants, antiretroviral
and antineoplastic. 103
http://www.nu-retail.com/The_Express_Scripts_Wellpoint_PBM_Deal.pdf. The Wellpoint – Express
Scripts merger referred to in this document was permitted by U.S. antitrust authorities and has been
consummated. 104
http://www.cms.gov/NationalHealthExpendData/downloads/tables.pdf, Table 11. 105
See Scott Morton [1997] and Duggan and Scott Morton [2006]. 106
While patent protection and monopoly power result in deadweight loss relative to perfect competition,
Garber, Jones and Romer [2006] report simulations that when moral hazard from insurance is taken into
account, quantity demanded approaches the efficient perfectly competitive outcome, but the resulting prices
are much higher.

Berndt and Newhouse “Draft Handbook Pricing Chapter”
Page 73
107
See, for example, Rosenthal, Berndt, Donohue et al. [2002]. 108
Berndt [2001,2002] considers marketing issues in greater detail. 109
For a recent example involving Pfizer‟s $2.3 billion settlement with the U.S. Department of Justice, see
Harris [2009]. 110
Chernew, Rosen and Fendrick [2007]. 111
For further discussion, see Gruber and Koszegi [2001]. 112
For further work along these lines, see Chernew, Rosen and Fendrick [2007], Ellis and Manning [2007],
Goldman and Philipson [2007] and Newhouse and Sinaiko [2008]. 113
Pharmacy Benefit Management Institute [2009], p. 8. A given employer might have multiple responses. 114
Pharmacy Benefit Management Institute [2009], p. 8, 14. 115
Pharmacy Benefit Management Institute [2009], p. 8. 116
Pharmacy Benefit Management Institute [2009], p. 18. 117
In addition to references cited earlier, see Congressional Budget Office [2004, 2007]. Pharmacy Benefit
Management Institute [2009], p. 23, reports that for retail and mail order generics, the average discount off
AWP in 2009 was 45.8% and 57.3%; MAC pricing is used by 70.6% of employers for retail generic
prescriptions, and by 45.5% of employers for mail order prescriptions. 118
See Aitken, Berndt and Cutler [2008] for further discussion. 119
Evidence suggests that variation among states in the extent to which patients must consent to substitute
generic for brand has a substantial impact on Medicaid generic prescribing rates; see Shrank, Choudhry,
Agnew-Blais et al. [2010]. 120
Berndt [2005] discusses this phenomenon in greater detail, noting the important role of therapeutic class
effects. 121
CVS Caremark [2009], p. 14. 122
See, for example, CVS Caremark [2009], p. 15. Incidentally, for branded specialty drugs, the Pharmacy
Benefit Management Institute [2009, p. 23] reports that the mean discount off AWP for specialty drugs in
2009 was 17.9%, slightly greater than the 16.4% for retail brand. 123
Bach [2009]. 124
Taken from Bach [2009], p. 626. 125
Aitken, Berndt and Cutler [2008], based on data from IMS Health. 126
For further discussion, see Duggan and Scott Morton [2010]. 127
Frank and Newhouse [2007, 2008]. 128
Frank and Newhouse [2008}, p. 37. 129
Frank and Newhouse [2008], p. 38. 130
Berndt and Frank [2007] report more rapid price increases for elderly intensively used drugs in
anticipation of the January 2006 implementation of Part D than after based on Producer Price Index data by
therapeutic class, although at the aggregate class level the results were less evident. 131
Berndt, Cockburn, Cocks et al. [1998]. 132
As quoted in Drug Channels [2009a], p. 2. 133
The law requires that 70% of rural beneficiaries must live within fifteen miles of a pharmacy. 134
Drug Channels [2007a], p. 1. Also see Wal-Mart [2010]. 135
Agwunobi and London [2009]. 136
In instances in which the price of a generic drug is less than the copayment, the consumer typically pays
the lower price. 137
Drug Channels [2007a], p. 1. 138
Drug Channels [2008b], p. 1. 139
Using data published in June 2007 by the Office of the Inspector General (“OIG”) at the Department of
Health and Human Services on pharmacy‟s actual average acquisition costs, for the six generic drugs on
both the OIG report and available at WalMart, one observer computed a weighted average gross margin for
WalMart of 24%, using the $4 per prescription price. To the extent WalMart is able to purchase at less
than the actual average national price, this gross margin is understated. See Drug Channels [2007b]. 140
Drug Channels [2008c]. 141
Durg Channels [2008d, 2008e]. 142
See, for example, Abelson [2010]. 143
Drug Channels [2009b]. 144
Drug Channels [2008f].

Berndt and Newhouse “Draft Handbook Pricing Chapter”
Page 74
145
See, for example, Scott [2006]. 146
This is known as the Averch-Johnson effect after Averch-Johnson [1962], and more colloquially as “rate
base padding.” 147
For a discussion of issues underlying “optimal transparency”, and the pros and cons of transparent
pricing in the context of pharmaceuticals, see Congressional Budget Office [2008] and Berndt [2005],
particularly Section IV.