
Price Formation and Liquidity Provision in Short-Term Fixed Income Markets
36
Working Paper/Document de travail 2007-27 Price Formation and Liquidity Provision in Short-Term Fixed Income Markets by Chris D’Souza, Ingrid Lo, and Stephen Sapp www.bankofcanada.ca
-
Upload
independent -
Category
Documents
-
view
5 -
download
0
Transcript of Price Formation and Liquidity Provision in Short-Term Fixed Income Markets
Working Paper/Document de travail2007-27
Price Formation and Liquidity Provision in Short-Term Fixed Income Markets
by Chris D’Souza, Ingrid Lo, and Stephen Sapp
www.bankofcanada.ca
Bank of Canada Working Paper 2007-27
April 2007
Price Formation and Liquidity Provisionin Short-Term Fixed Income Market
by
Chris D’Souza,1 Ingrid Lo,1 and Stephen Sapp2
1Financial Markets DepartmentBank of Canada
Ottawa, Ontario, Canada K1A [email protected]
2Ivey School of BusinessUniversity of Western Ontario
Bank of Canada working papers are theoretical or empirical works-in-progress on subjects ineconomics and finance. The views expressed in this paper are those of the authors.
No responsibility for them should be attributed to the Bank of Canada.
ISSN 1701-9397 © 2007 Bank of Canada

ii
Acknowledgements
We acknowledge the excellent research assistance of Jessica Liang. All remaining errors are our
own.
iii
Abstract
Differences in market structures may affect the manner in which fundamental information is
incorporated into prices. High levels of quote and trade transparency plus substantial quoting
obligations in European government securities markets ensure that prices are informationally
efficient. The relationship between price changes, order flow, relative depth and spreads across
European and Canadian short-term government bond markets is examined via a reduced-form
vector autoregression model. In European markets, dealers are able to quickly absorb private
information elsewhere in the market. Consequently, spreads and the relative depth on the bid and
offer sides of the market are found to be only slightly informative. Similarly, order flow, which
reflects inventory management practices in addition to private information, explains a smaller
proportion of the variation in asset returns in European markets than in Canadian interdealer
brokered markets where no quoting obligations exist.
JEL classification: G12, G14, G15Bank classification: Market structure and pricing; Financial markets; Interest rates
Résumé
Les différences de structure de marché peuvent influer sur la manière dont l’information
fondamentale est intégrée aux prix. Le degré élevé de transparence en amont et en aval des
transactions et les rigoureuses obligations de cotation sur les marchés européens de titres d’État
assurent l’efficience informationnelle des prix. À l’aide d’un modèle vectoriel autorégressif de
forme réduite, les auteurs analysent la relation entre les variations de prix, le flux d’ordres, les
écarts acheteur-vendeur et la différence de profondeur entre les deux côtés du carnet sur les
marchés européens et canadiens des obligations d’État à court terme. Sur les marchés européens,
les opérateurs peuvent assimiler rapidement l’information privée détenue par d’autres
participants. Par conséquent, les écarts acheteur-vendeur et la différence de profondeur entre les
deux côtés du carnet se révèlent peu informatifs. De même, le flux d’ordres, qui traduit aussi bien
les pratiques de gestion des stocks que l’information privée, explique une proportion plus faible
de la variation des rendements sur les marchés européens que sur le marché canadien du courtage
intermédiaire, où il n’y a aucune obligation de cotation.
Classification JEL : G12, G14, G15Classification de la Banque : Structure du marché et fixation des prix; Marchés financiers;Taux d’intérêt
1
1. Introduction
The behaviour of market participants, and their trading and quoting decisions, will be affected by
how a financial market is organized. The results of this paper confirm previous findings, and
provide some new insight into how price and liquidity dynamics are affected by the structure of
government bond markets in Europe and, by comparison, in Canada. In Europe, interdealer
trading in the most liquid government bonds occurs on the Mercato Telematico dei Titoli de Stato
(MTS) platform. This segment of the market functions as an electronic limit order book. With the
introduction of a “liquidity pact” in 1999, MTS market makers are required to post buy and sell
limit orders above a minimum size, within a maximum bid-offer spread, for a minimum number
of hours each day. In contrast, Canadian bond dealers have no quoting obligations.1
European and Canadian bond market structures also differ with respect to quote and trade
transparency. The MTS platform makes pre- and post-trade information available to interested
participants in real time via Bloomberg and Reuters. In Canada, only the best quotes available at
each individual interdealer broker are observable to the market. This paper addresses whether
differences in these market structures has an impact on the dynamics of prices, and more
importantly, the process in which fundamental information is incorporated into prices.
Bloomfield and O’Hara (1999) provide evidence from experimental settings that suggest that
transparency significantly improves a market’s informational efficiency but that spreads will
widen and depth will fall as the risks borne by dealers increase. In this paper, we attempt to
determine if markets remain efficient once quoting obligations are imposed on dealers in a
transparent market.
Asymmetric information may exist in government securities markets even though these securities
have fixed and known cash flows and a finite life. For example, market participants have
heterogeneous models of interest rates relating macroeconomic fundamentals, including news
announcements, to prices and yields. Since markets do not clear instantaneously, prices at any
point in time may not reflect all fundamental information available in the market. To characterize
all aspects of the price discovery process, we investigate the joint relationship between price
changes, order flow, the relative depth on the bid and offer sides of the market, and spreads,
across several short-term European and Canadian government securities markets. When
1 Unless otherwise indicated, any mention of “markets”, “dealers” or “participants” relate to government bond markets.
2
information is incomplete and heterogeneous, market participants’ subjective valuations of a
security may be captured by the latter three variables.
Order flow is defined as the number of buyer- less seller-initiated trades. Green (2004), Brandt
and Kavajecz (2004) and Pasquariello and Vega (2006) demonstrate that order flow has a
permanent impact on the price of government securities. We extend their analysis by examining
the role of relative depth and spreads in the price discovery process. Relative depth is calculated
as the difference between the quantity of a security available for purchase at the best bid quote in
the market and the quantity available for sale as the best offer quote in the market. As usual,
spreads are the difference between those best offer and bid quotes. Recent microstructure
literature demonstrates that market participants may learn new information from the supply of
liquidity in the market. Bloomfield, O’Hara and Saar (2005) illustrate how informed traders will
use both market orders and limit orders strategically in an electronic limit order market. Goettler,
Parlour and Rajan (2005) illustrate that limit orders placed by informed traders reveal new
information about the underlying value of an asset. Thus relative depth and spreads, like order
flow, may also convey information and have an impact on the price discovery process.
Depth and spreads are also associated with measures of liquidity in the market. Earlier
microstructure studies demonstrated that the supply of liquidity and informed trading are related.
Admati and Pfleiderer (1988) show that uninformed discretionary liquidity traders will trade
around the same time, increasing liquidity in the market, and reducing the losses they suffer to
informed traders. Kim and Verrecchia (1994), on the other hand, illustrate that if informed traders
possess an informational advantage after an event, liquidity will remain low as long as those
informed traders maintain that advantage. Therefore, the supply of liquidity in markets affects,
and is affected by, the speed with which information is incorporated into prices. In addition,
recent literature on the pricing of securities, most notably, Acharya and Pedersen (2005),
Garleanu and Pedersen (2004), and Vayanos (2004) point out that illiquidity is priced in financial
markets, and that investors will demand compensation in terms of an illiquidity premia on their
required rate of return.
Motivated by questions associated with the relationship between price changes, order flow,
relative depth and spreads, we utilize the framework of Hasbrouck (1991a, b), Chordia, Roll and
Subrahmanyam (2000, 2001), Chordia, Sarkar and Subrahmanyam (2005) and examine the
dynamic interactions between these variables via a reduced-form vector autoregression (VAR)
model. We find relative depth in the market explains some of the variability in prices in Europe

3
although the magnitude is relatively small. In addition, the absence of quoting restrictions
contributes to informative market-wide spreads in the Canadian market. Generally, a liquidity
premia will be demanded by investors when spreads widen to reflect a fall in liquidity. Finally,
when there is a risk that private information in the market will not be resolved immediately,
investors that are contemplating holding the security in their portfolio will demand a required rate
of return that includes an information risk premium.
Order flow is more informative in the Canadian market. Restrictions on quotes in European
markets allow dealers to share their inventory risk cheaply through the immediate execution of
market orders. Consequently, order flow reflects both inventory management and private
information considerations, and for this reason it explains a smaller proportion of the variation in
returns then in Canadian interdealer brokered markets where no quoting obligations exist. While
the results of this study suggest that market structure is important, within a couple of hours
private information in either marketplace is found to have dissipated---revealed either through the
relative depth in the market, spreads, or order flow.
Microstructure studies of government securities markets have predominantly focused on U.S.
Treasury markets. For example, Green (2004) examines the impact of macroeconomic news
announcements and their associated uncertainty on the U.S. benchmark five-year bond while
Pasquariello and Vega (2006) examine the effect of unanticipated order flow on yield changes in
the 2-year, 5-year and 10-year U.S. Treasury bond (or note) markets. In addition, little is known
about the price discovery process in government fixed-income markets for securities with shorter
maturities. In particular, the trading and quoting strategies of dealers may be different from those
at the longer end of the yield curve. In the short-term sector, financial market participants build
positions based on their views of the expected future path of overnight interest rates. There is one
important exception. Brandt and Kavajecz (2004) examine the role that order flow and liquidity
in price discovery across the entire U.S. yield curve. The authors utilize traditional yield curve
modeling techniques to isolate the major latent factors driving order flow and liquidity. Findings
suggest that the effect of order flow is strongest when liquidity is low. We address a similar
question but instead uncover the direct relationships between order flow, depth, spreads and
prices. We also analyse individual government securities markets outside the extremely liquid
U.S. Treasury market.
4
2. Institutional Structure and Data
There are some important differences between the organization of European and Canadian
Treasury markets. In Europe, the dominant interdealer electronic trading platform for fixed-
income securities is MTS.2 Given the large and unpredictable inventory shocks typically faced by
dealers in their trades with customers, interdealer debt markets have developed to facilitate
inventory management and risk sharing. Interdealer trading accounts for more than half of all
trades.3 A number of dealers active on MTS are designated as primary dealers. They are assigned
to individual securities and must fulfill a number of requirements. In particular, primary dealers
must provide two-sided quotes continuously for a minimum amount of time each day during
regular trading hours. In addition, minimum quote amounts and a maximum bid-offer spread are
imposed. Compliance with these quoting obligations is strictly monitored by MTS. In return for
meeting these commitments, primary dealers are allowed to bid in Treasury auctions and enjoy
privileged relations with the issuing authorities.
In Government of Canada bond markets, government securities dealers may also be designated as
primary dealers. If dealers provide evidence of sufficient resources and a desire to participate
actively in the market-making activity of Government of Canada securities they will enjoy
preferential access to securities auctions. While there are incentives to actively make markets,
unlike European markets, there are no specific quoting obligations in Canada. Dealer behaviour is
not governed by rules that directly limit bid-offer spreads or enhance depth. Furthermore, dealers
can freely enter and exit the market at any time.
In the Canadian government securities market, dealers can trade directly or execute anonymous
buy and sell orders at one of four interdealer brokers (IDB). Based on dealer statistics reported to
the Canadian Investment Dealer Association and the Bank of Canada, the Canadian interdealer
debt market represented approximately 46 per cent of the total secondary Government of Canada
bond market trading volume during 2002, of which IDB trading accounted for 86 per cent (up
from 50 per cent in 1991 and 75 per cent in 1997). The introduction of IDBs significantly
reduced the role of direct interdealer trading in recent years. The current IDBs disseminate quote
information electronically though actual brokered trades are still executed over the phone.
2 MTS was created in 1988 by the Italian Treasury and the Bank of Italy with the objective of increasing competition and efficiency in the market for government debt. MTS became a private company in 1997. 3 The Bond Market Association (TBMA, 2005).

5
Participants communicate with brokers over the telephone but each participant can observe best
bid and offer quotes, and trade outcomes, on a computer screen once they are posted.4
Transparency in the Canadian interdealer government securities market is provided by brokers
who publish interdealer quotes.5 At any one broker, only the best quotes and their respective
quote amounts are visible. Participants observing quotes across the multiple IDBs may be able to
determine a noisy measure of the overall depth of the market. The MTS limit order book market
is more transparent. Dealing quotes are centralized and market participants observe the top 5
quotes on either side of the market and the associated quote amounts. In addition, the last traded
price is observable.
European government bonds can be listed on a domestic MTS platform (such as MTS France)
and/or the EuroMTS electronic trading system.6 Those fixed income securities that satisfy a
number of listing requirements, such as exceeding a required principal amount outstanding and
certification that a number of dealers that will act as market markers in that security, can be listed
on EuroMTS. All government marketable securities, in addition to benchmarks, are listed on their
respective domestic MTS platform (subject to a given outstanding principal amount). Cheung, de
Jong and Rindi (2005) find that trading costs are similar on both platforms. In our study, we
examine trade and quote information for Treasury bills and short-term Treasury bonds listed on
the domestic market platform since almost all trading in these securities occurs on the domestic
MTS platforms.
The MTS dataset includes all updates of the best quotes and the associated quote amounts for
each security in addition to transaction prices and traded quantities. The dataset also includes
information about the time and the direction of each trade, i.e., whether the trade was executed
against the bid or the offer side of the market. Our analysis focuses on European Treasury bills
listed on the four largest domestic MTS platforms: MTS Italy, MTS Germany, MTS France and
MTS Belgium. We analyse short-term government bill data for securities with a maturity from 6
months to 2 years. The MTS data set spans the period from 1 April, 2003 to 31 December 2004.
The MTS market is open for trading from 8:15 to 17:30 (Central European Time, CET)7.
4 The four Canadian IDBs are Freedom International Brokerage Company, Prebon Canada Ltd., Shorcan Brokers Limited, and Tullett Liberty (Canada) Ltd. 5 More recently, electronic platforms have been introduced in Canada that offer simultaneous multipledealer quote inquiries and trading in one case, and peer-to-peer, order-driven trading in another. 6 EuroMTS was introduced in 1999. 7 There is a pre-trade session in the MTS market from 7:45 to 8:15 (CET). During this time, dealers can post limit orders but they are not allowed to trade on these orders.
6
Accounting for trade and quote activity, we divide the trading day into 30-minute intervals from
8:30 till 17:30. The bonds analysed in our study include: the 6-month Italian Treasury Certificate
(BOT), the 6-month French Treasury Bill (FTB), the 6-month German Treasury Certificate
(GTC), the 12-month Belgian Treasury Certificate, the 12-month Italian Treasury Certificate
(BOT), the 12-month French Treasury Bill (FTB), and the 2-year German Treasury Bond
(Schätze).
The Canadian dataset was obtained from CanPx---a data service that consolidates and
disseminates to interested subscribers anonymous trade and quote data submitted by Canada’s
fixed-income interdealer brokers (IDBs). The CanPx data set is relatively complete, receiving
quote and trade information from all IDBs. Dealers leave firm quotes with a broker, along with a
minimum size that they are willing to trade. The best quotes across all the participating dealers
are collected by CanPx. We focus the analysis on the 2-year Canadian bond since quote and
transaction frequency is relatively small for Government of Canada 6- and 12-month bills in the
IDB sphere.
The CanPx dataset spans the period from 1 October 2003 to 31 October 2004. We divide the
trading day into 30-minute intervals from 8:30 (Eastern Daylight Time, EDT) to 17:30 (EDT).
The following trade and quote information relating to a particular security is used: all updates of
the best bid and offer prices across all IDBs, the total amount offered and bid at these best prices,
the time at which the best bid and offer were last updated, and the time and direction of each
trade. The raw data is filtered for outliers associated with data entry errors. The methodology
employed is described in D’Souza, Gaa and Yang (2004). In addition, we discard days with less
than 5 hours of trading. This alleviates problems associated with stale quotes.8
The datasets exclude days with major macroeconomic news announcements. Many authors,
including Fleming and Remolona (1999), Balduzzi, Elton, and Green (2001) and Green (2004),
find overwhelming evidence of a public information price discovery process that is distinct from
that observed during normal trading periods. For the Canadian market, we exclude days in which
an important U.S. or Canadian macroeconomic news announcement occurred. These news
announcements are based on Gravelle and Moessner (2001) and the finding that Canadian interest
rates react significantly to U.S. macroeconomic news. For each European security, days where
there are either European-wide or individual country macroeconomic news announcements
8 We also discarded data for MTS on 2 August 2004. A liquidity shock occurred when Citibank sold 11.3 billion euros worth of government bonds on the MTS platform.

7
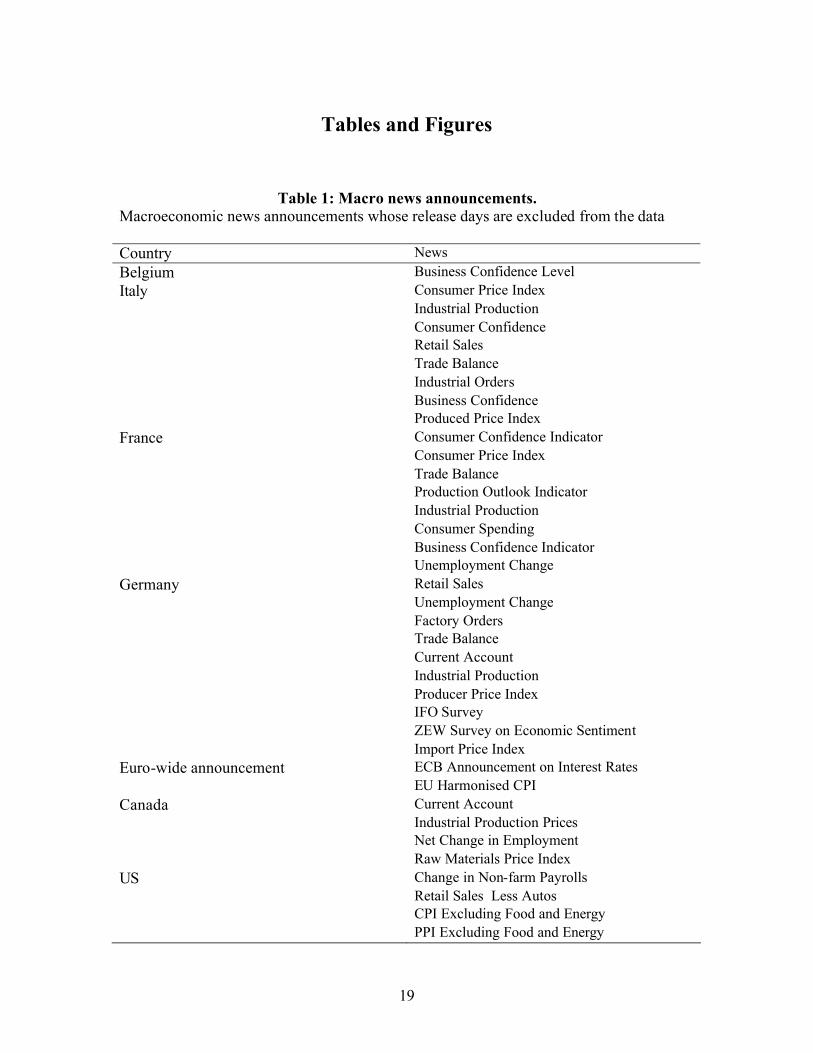
similar to those chosen for Canada and the U.S. are excluded. All important macroeconomics new
announcements are listed in Table 1.
3. Variable Definitions and Descriptive Statistics
Dealers with private information regarding the mispricing of a security have a number of options
that they may employ in order to maximize profits. If the information is likely to be discovered in
a short amount of time, dealers may execute market orders against the prevailing best bid and
offer quotes. If some degree of post-trade transparency exists in the market, executed trades will
provide a signal to the rest of the market that current prices are not efficient. Kyle (1985) and
Glosten and Milgrom (1985) illustrate how dealers revise their expectation when they observe
trading in the market. If market orders provide a signal to the market about the existence of
private information, then order flow, defined as the signed number of trades over a given time
period, will also be informative. Green (2004), Brandt and Kavajecz (2004) and Pasquariello and
Vega (2006), have all shown that in fixed-income markets order flow captures the arrival of
information and has a permanent impact on prices.
If traders are patient and believe that in the short-run their private information will not be
revealed to the market, they have other options. In particular, they can post limit orders with
either better bid or offer prices, or they may adjust their existing orders in terms of the relative
quantities they are willing to buy and sell at the current best market quotes. For example, if
private information suggests that a security is overpriced, i.e., the midpoint between the best offer
and best bid quotes is too high, traders may improve upon the best offer price in the market, or
they may increase the relative amount that they are willing to sell versus buy at slightly better
prices. Bloomfield, O’Hara and Saar (2005) illustrate in an experimental setting how informed
traders will use limit orders strategically in an electronic limit order market. Goettler, Parlour and
Rajan (2005) show that less informed agents can learn about new information from quotes in the
order book. In general, relative depth and market spreads, like order flow can be informative.
Since significant levels of quote transparency are present in European and Canadian markets,
over time private information will trickle out into the market.
Quoting obligations and higher levels of transparency in Europe may prevent market participants
from manipulating limit and market orders excessively. In particular, market participants are able
to quickly absorb private information elsewhere in the market by observing changes in the limit
8
order book and order flow. Restrictions on quotes allow dealers to share their inventory risk
cheaply through the immediate execution of market orders. Consequently, order flow will reflect
both inventory management and private information considerations, and for this reason explains a
smaller proportion of the variation in returns than in Canadian interdealer brokered markets
where no quoting obligations exist. In general, while it is easier for dealers in MTS to manage
their inventories it may also be harder to exploit information strategically. Quoting restrictions
may also contribute to uninformative spreads. When there is a risk that private information in the
market will not be resolved immediately, spreads will widen, and investors contemplating holding
the security in their portfolio may demand a return that includes an information risk premium.
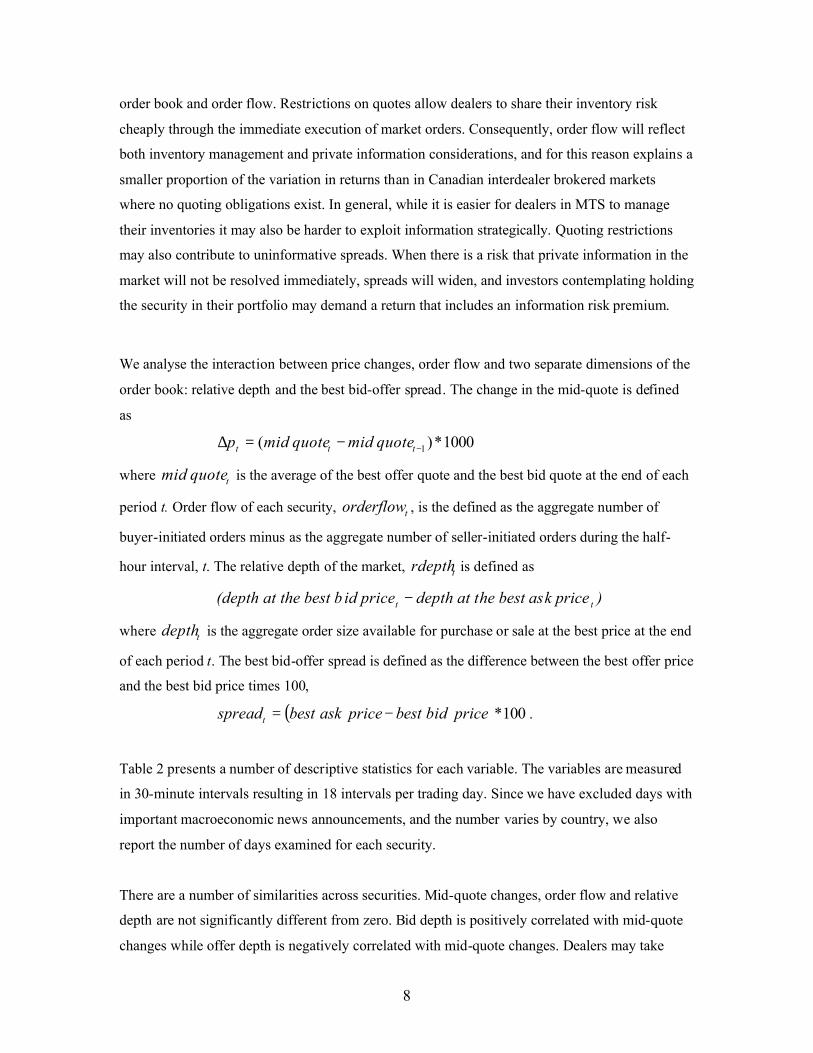
We analyse the interaction between price changes, order flow and two separate dimensions of the
order book: relative depth and the best bid-offer spread. The change in the mid-quote is defined
as
1000*)( 1−−=∆ ttt quote midquote midp
where tquote mid is the average of the best offer quote and the best bid quote at the end of each
period t. Order flow of each security, torderflow , is the defined as the aggregate number of
buyer-initiated orders minus as the aggregate number of seller-initiated orders during the half-
hour interval, t. The relative depth of the market, trdepth is defined as
)k pricehe best asdepth at tid pricethe best b(depth at tt −
where tdepth is the aggregate order size available for purchase or sale at the best price at the end
of each period t. The best bid-offer spread is defined as the difference between the best offer price
and the best bid price times 100,
( ) 100*pricebidbestpriceaskbestspreadt −= .
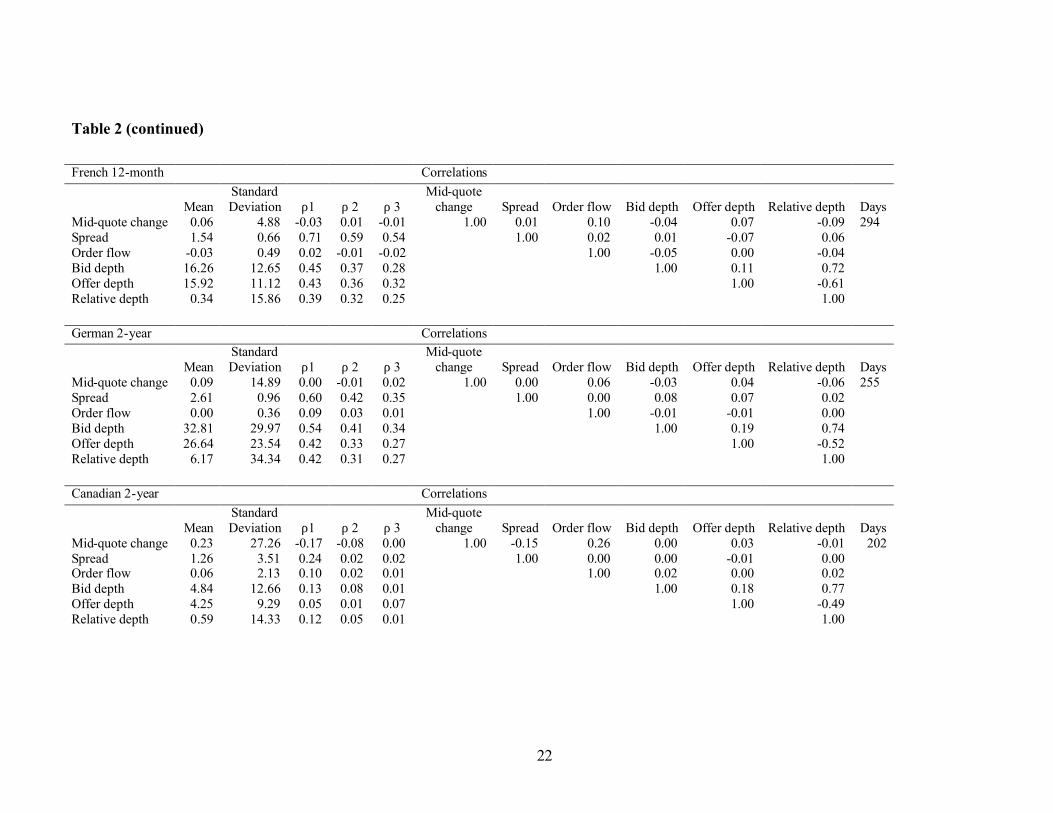
Table 2 presents a number of descriptive statistics for each variable. The variables are measured
in 30-minute intervals resulting in 18 intervals per trading day. Since we have excluded days with
important macroeconomic news announcements, and the number varies by country, we also
report the number of days examined for each security.
There are a number of similarities across securities. Mid-quote changes, order flow and relative
depth are not significantly different from zero. Bid depth is positively correlated with mid-quote
changes while offer depth is negatively correlated with mid-quote changes. Dealers may take

9
timely advantage of any improved liquidity on one side of the market by executing limit orders
against it, which may then lead to an increase in the mid-quote.
There are other interesting patterns. Spreads increase with the maturity of a security. French,
Italian and German 6-month bill spreads are narrower than their one- or two-year national
counterparts. The autocorrelation in order flow is small. This is consistent with the random walk
nature regarding the arrival of information. Order flow is positively correlated with changes in the
mid-quote across all securities. The correlation ranges from 0.06 in the German 2-year bond to
0.2 in the Italian 12-month bill. There is mixed evidence associated with the correlation between
order flow and spreads, and between relative depth and spreads.
Compared to European fixed income markets, the Canadian 2-year bond market has a lower
average level of depth on either side of the market. This could be due to the fact that the quantity
quoted in Canadian markets is only the lower bound that dealers are willing to trade. There are no
obligations in Canada for dealers to post minimum levels of depth in the market. The Canadian
market also exhibits a stronger correlation between order flow and the change in mid-quotes, and
between spreads and the change in mid-quotes. As expected, depth and spreads are more
persistent across European securities. The autocorrelation in spreads is greater than 0.5 in all
European markets. Quoting obligations constrain the maximum spread dealers are allowed to post
in the limit order book. The autocorrelation in bid and offer depth may also be larger for this
reason.
4. Methodology: Econometric Specification
In the paper, we use a vector autoregression model to capture the intertemporal associations
between changes in quotes, order flow, relative depth, and spreads. The motivation for using this
general setup is that all four variables are interrelated. Causality among these variables could
potentially run in both directions. For example, the execution of a market order will directly
affect the market depth on one side of the market. The execution of market orders will also affect
the future placement and cancellation of limit-orders. Conversely, market orders will only be
executed if a certain amount of depth is available in the market. Complicating things further, even
after allowing for causality between order flow and relative depth in both directions, the
relationship between depth and order flow will depend on the size of the existing bid-offer spread
10
in the market. In order to determine the implied impact of order flow, relative depth, spreads and
quotes, it is necessary to capture the dynamic relationship between all variables simultaneously.
We follow Hasbrouck (1991a, 1991b) and calculate two statistics derived from the estimates of a
VAR. Impulse response functions and variance decompositions of mid-quote returns provide a
measure of the informativeness of order flow, spreads, and relative depth in each market. In
general, impulse response functions represent the expected future values of each variable in a
system of equations conditional on an initial shock. In the current environment, they summarize
the permanent impact of an innovation in each variable on prices. Any permanent impact must
reflect available private information contained in that variable. The second measure we use is a
variance decomposition of mid-quote returns. Observed mid-quotes can be thought of as the sum
of an efficient price and a term reflecting short-term microstructure imperfections. We
decompose the variance of these efficient prices into components that are attributable to order
flow, spreads, and relative depth.
We estimate the following VAR system,
tPtPttt vDDDyAyAyAy ++++++++= −−− 9212211 ...... ,
where ty is defined as
]',,,[ ttttt quotemidspreadrdepthorderflowy ∆=
and the pA ’s are (p × p) coefficient matrices of the endogenous variables, ty . The
disturbance, tv is a column vector with mean zero, 0)( =tvE , serially uncorrelated disturbances,
and covariance matrix Ω=]'[ tt vvE . Hourly dummies, iD , control for the intra-day seasonality.
The parameters pA andΩ are unknown and have to be estimated before the necessary impulse
response and variance decomposition statistics can be calculated. Estimates of these parameters
can be obtained from least squares. See Hamilton (1994) and Judge et al. (1982) for a discussion
of these methods.
There is little theoretical guidance regarding the appropriate ordering of mid-quote changes, order
flow, relative depth and spreads in the VAR. Since identification in crucial, all orderings of order
flow, relative depth and spreads were examined to ensure robustness of our results. It is standard
to place the change in the mid-quote last. The order of the VAR was chosen using the Akaike
Information Criterion (AIC) and the Schwarz Information Criterion (SIC).
11
5. Empirical Results
Vector autoregressions are estimated for each of the eight securities in our sample, and consist of
four equations that model the interaction between the change in the mid-quote, order flow,
relative depth, and spreads. Three lags were chosen for most of the 6- and 12-month securities.
For the 2-year bonds, two lags minimized the AIC or SIC criteria. The last row in Table 3 reports
the chosen lag order for each estimated VAR.
To conserve space, the coefficient estimates are not presented in tables. There are a number of
interesting findings that are summarized now. Across all securities, there is evidence of positive
and significant own-lag effects in the order flow, relative depth, and spread equations. The
coefficient on the first lag is generally positive and statistically significant at the 10% level. With
respect to the order flow equation, results suggests that there is a certain degree of momentum
buying and selling, which may be an indication of order fragmentation. In transparent markets,
dealers will attempt to hide their orders, and any private information that they reflect, by
breaking-up their trades. Autocorrelation in spreads and relative depth may reflect market
conventions or the constraints on spread and quote amounts imposed on MTS dealers. Changes in
mid-quotes are negatively autocorrelated and statistically significant at the 10% level in the case
of the French 6-month bill, the Italian 6-month bill, the German 6-month bill, the Italian 12-
month note, and the Canadian 2-year bond. These results suggest the existence of inventory
control and lagged adjustment effects. In particular, quotes may over-react to trades as dealers
attempt to manage their inventories. Over time, these effects will dissipate. Amihud and
Mendelson (1980) and Ho and Stoll (1981) illustrate how undesired inventories impose costs on
dealers, and that these costs are reflected in bid and offer prices.
There are a number of interesting results associated with cross-effects. Lag order flow has a
significant impact on mid-quotes in Italian and German 6-month bill markets, German and French
12-month bill markets, and German and Canadian 2-year bond markets. Relative depth has a
positive and statistically significant impact on mid-quotes in all markets except for the German 6-
month bill and the Canada 2-year bond markets. Spreads have a statistically significant positive
or negative impact in the following securities markets: Italian 6-month, Belgian 12-month, Italian
12-month, French 12-month and Canadian 2-year. These results suggest that order flow, relative
depth, and spreads may indeed convey information about the mis-pricing of government

12
securities in fixed income markets. Nevertheless, an essential question addressed below is
whether innovations in these variables have effects that are permanent.
One of the key questions that can be addressed with a VAR is how useful some variables are in
forecasting others. Table 3 presents the results of pair-wise Granger-causality tests. One variable
is said to Granger-cause another if past information about the latter variable helps to improve the
forecasts of the former. We test the null hypothesis that variable x does not Granger-cause
variable z by testing whether the lag coefficients of x are jointly zero in the equation with z as a
dependent variable.
For the Canadian 2-year bond, Wald test statistics indicate that there is two-way causality
between relative depth and mid-quote changes. In the Italian 6-month bill market, order flow,
relative depth and spreads each Granger-cause mid-quote changes. There is no evidence of
causality in the opposite direction. In the German 6-month market, spreads, relative depth, and
order flow do not Granger-cause mid-quote changes. Instead, relative depth, spreads and mid-
quote changes Granger-cause order flow. The results associated with the Belgian 12-month bill
indicate that order flow, relative depth and spread variables do not Granger-cause changes in mid-
quotes, but that order flow Granger-causes changes in the relative depth of the market. For the
Italian 12-month security, relative depth Granger-causes changes in the mid-quote, though there
is no evidence in the other direction. In the 12-month French bill market, relative depth Granger-
causes changes in mid-quotes, spreads and order flow. For the German 2-year bond, relative
depth is found to Granger-cause change in mid-quotes. Lastly, for the Canadian 2-year bond,
there is evidence of two-way causality between mid-quotes and spreads. Order flow is also shown
to Granger-causes mid-quote changes.
Overall, there is significant evidence across securities that order flow and relative depth forecast
changes in the mid-quote. There is some evidence that spreads Granger-cause changes in quotes
and that quote changes Granger-cause changes in spreads. But overall there is a lack of
uniformity across securities. Looking at the results across securities it is impossible to conclude
that any one variable is exogenous. In addition, two variables may affect one another through a
third. More work is needed to properly identify the relationship between these variables. For now,
we take an agnostic approach and include all four variables in the VAR in each market.
We now examine the dynamics associated with innovations in quotes, order flow, relative depth
and spreads. For each security market, impulse response functions are calculated to trace out the
13
effect of a one-time shock to order flow, relative depth, and spreads. Because the innovations are
correlated, we use the inverse of the Cholesky decomposition of the residual covariance matrix to
orthogonalize the impulses. While we present impulse response functions with the following
ordering: order flow, relative depth, spreads and the change in the mid-quote, results are very
similar across orderings.
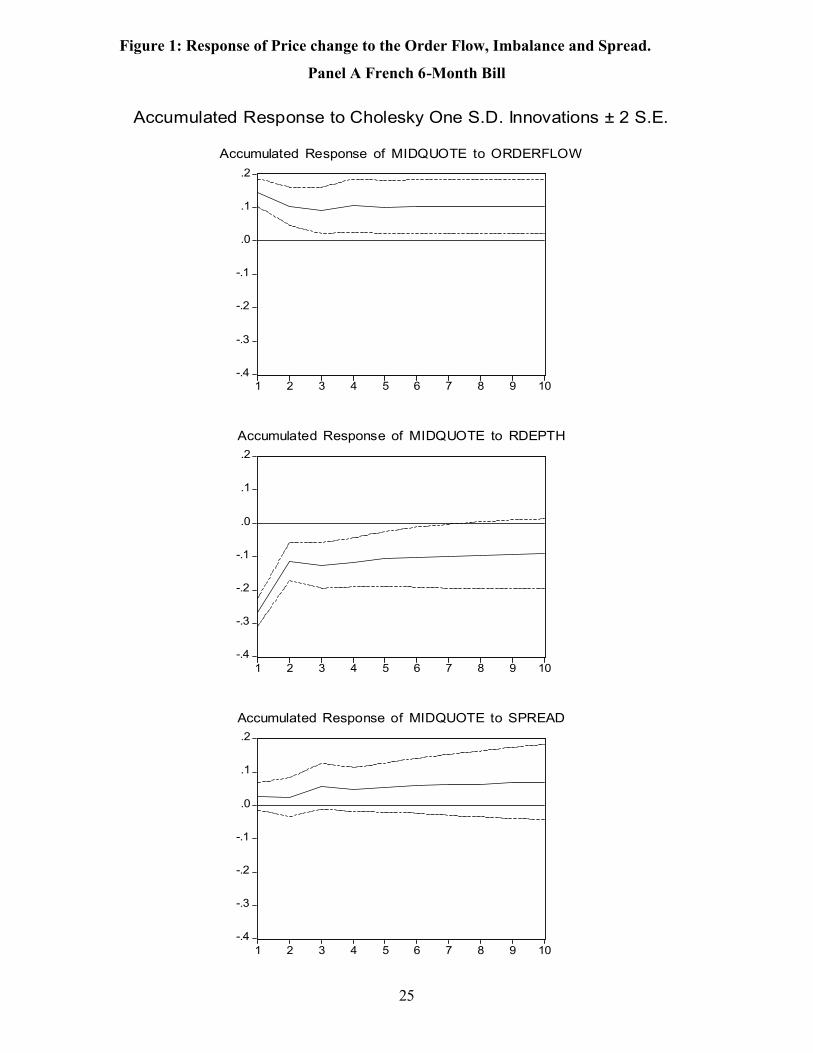
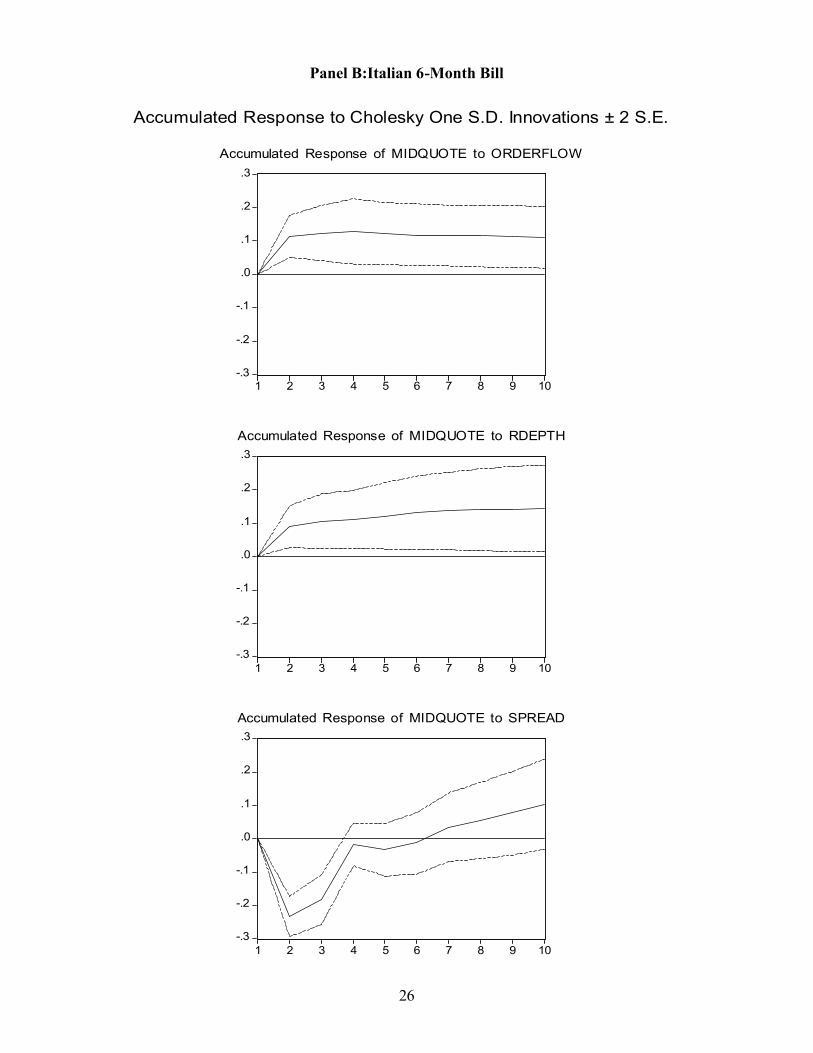
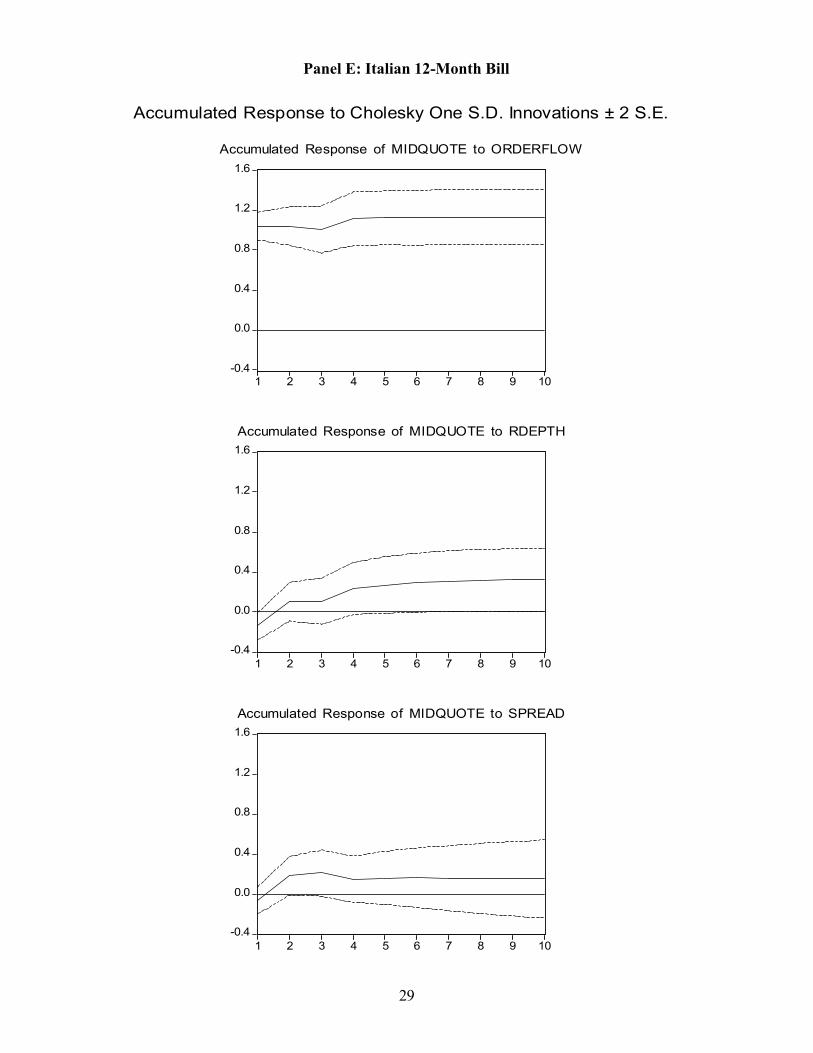
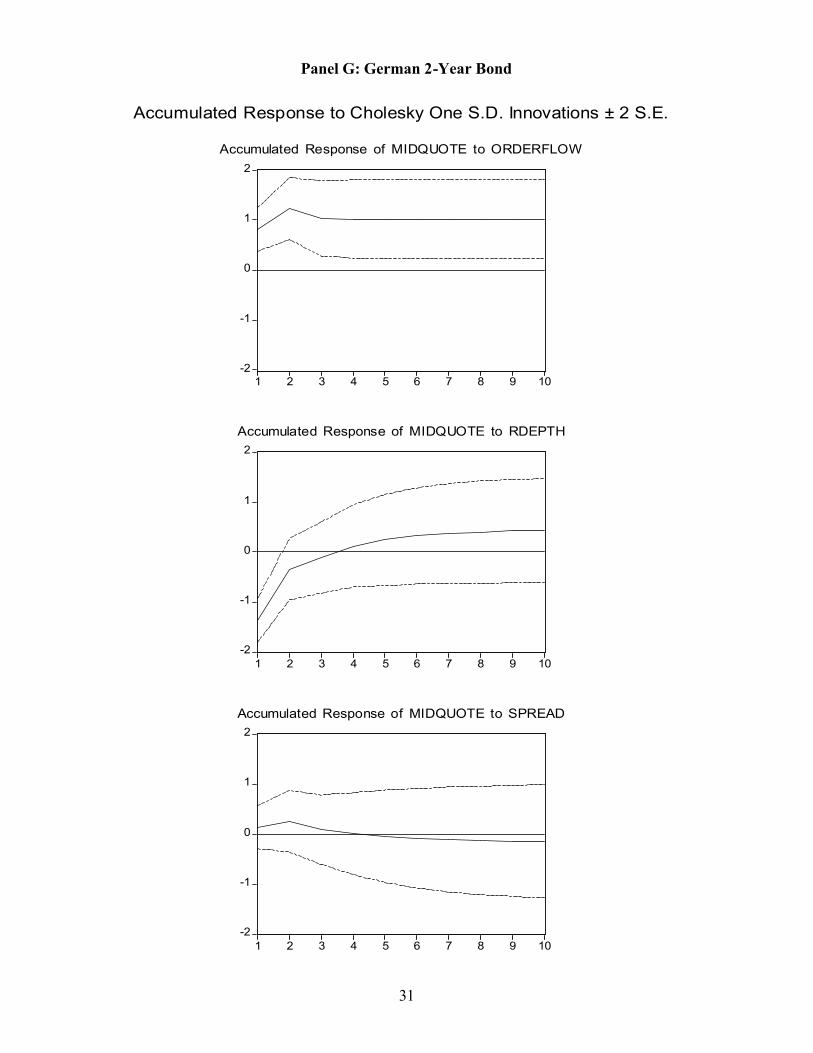
Figure 1 illustrates the cumulative effect on the change in the mid-quote from three types of
shocks: a one-standard deviation shock to order flow, to relative depth, and to spreads. Two
standard error bounds are also shown in each graph. The long-term cumulative implied mid-quote
change that occurs subsequent to an innovation in each variable may be interpreted as the
informational content of that variable. An order flow shock has a permanent and positive impact
on the prices of all European securities and the Canadian 2-year bond. This finding is consistent
with previous research in the fixed-income microstructure literature suggesting that order flow is
informative since it has a permanent impact on prices. Specifically, it implies that dealers with
private information execute market orders against the prevailing best bid and offer quotes.
Across all securities, relative depth has an initial negative impact on prices. There is one possible
explanation for the initial and temporary drop in the mid-quote. A rise in depth on the buy side of
the order book reduces the marginal cost of selling a security. Dealers attempting to manage their
excess inventories use this opportunity to immediately execute market sell orders rather than use
limit orders. Coefficient estimates suggest that in a number of markets relative depth has a
negative effect on order flow. The execution of sell orders may inadvertently signal negative
information to other dealers about the value of the security. Once dealers figure out their mistake,
quotes will revert to their initial long-run equilibrium level.
While innovations in spreads generally have no impact on prices in European securities markets,
they do have a significant impact on price dynamics in the Canadian 2-year bond sector. An
increase in spreads results in a permanent reduction in prices. From an informational perspective,
large spreads in the market may convince dealers that informed traders may exist in the market. If
liquidity decreases as a result, price may fall temporarily. If the information risk persists,
investors will demand a required rate of return that includes a risk premia. Spreads, much like
order flow, seems to be informative to dealers in the Canadian market. They have a permanent
impact on the mid-quote. While there are some important differences across securities markets,
within four to five time periods, or a few hours, private information in either marketplace has
dissipated.

14
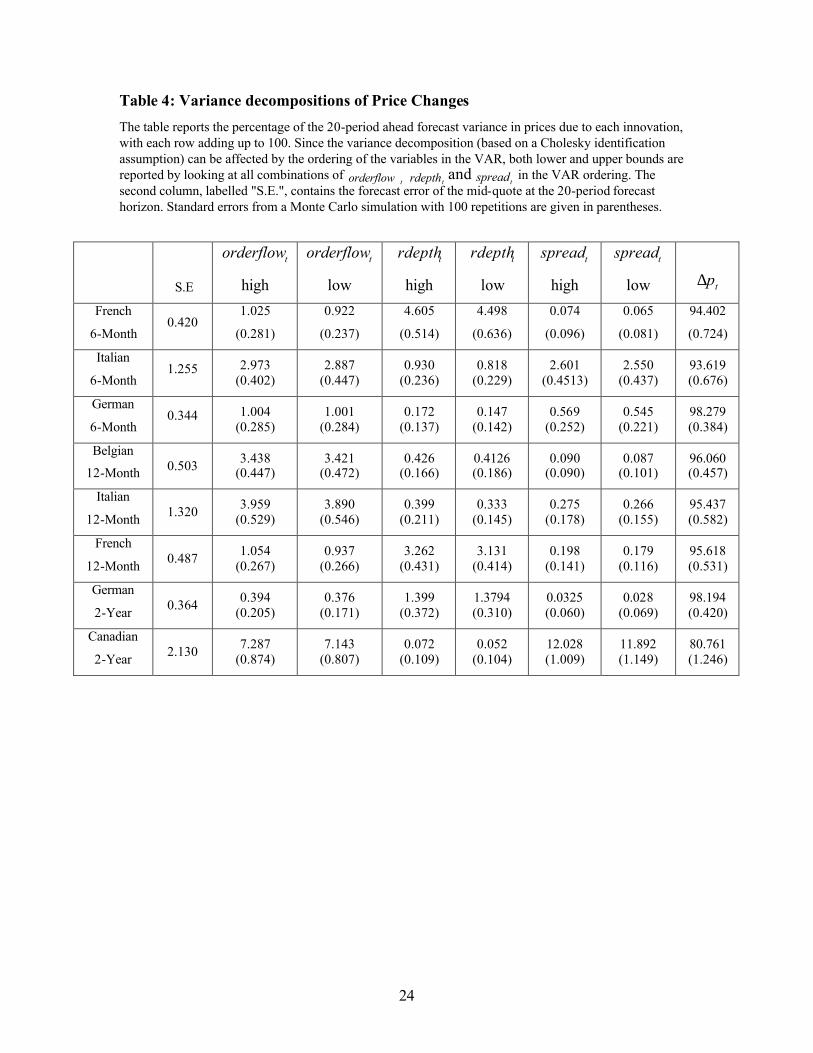
As an alternative approach to determine which variables are informative in the price discovery
process, Table 4 presents a decomposition of mid-quotes in terms of each component in the VAR
system. Results at the 20-period-ahead forecast horizon are shown. We examine this relatively
long forecast horizon so as to focus only on the long-run, or permanent, explanatory power of
each variable. Since the variance decomposition is based on a Cholesky identification
assumption, the ordering of the variables will be important. The table displays the upper- and
lower-bound estimates of the variance decomposition for each endogenous variable across all
possible orderings of order flow, relative depth, and spreads. Each column gives the percentage of
the overall forecast variance explained by innovations in each variable.9
Order flow has some explanatory power for certain European securities. For example, order flow
explains around 3 or 4 % of the variation in quotes in the Italian and Belgian 12-month bill
markets. The number is significantly larger for the Government of Canada 2-year bond (7%). In
Europe, restrictions on quotes allow dealers to share their inventory risk cheaply through the
immediate execution of market orders. Consequently, order flow will reflect both inventory
management and private information considerations, and for this reason explain a smaller
proportion of the variation in returns than in Canadian interdealer brokered markets where no
quoting obligations exist. Order flow has little (<1%) explanatory power in the German 6-month
and 2-year bond markets. Cheung, de Jong and Rindi (2005) find that trading of German fixed-
income securities is concentrated in the liquid EUREX futures market. As a result, price
discovery most likely occurs in the futures market.
Relative depth has some explanatory power only in the French 6-month bill (above 4%) and the
French 12-month bill (around 3%) markets. In the Canadian market, relative depth is not
informative at all. There is a possible explanation. Quoting restrictions in European markets
diminish the quality of the signal associated with relative depth, while in Canada, the absence of
transparency and quoting restrictions may result in concealed levels of depth.
There is a very small role for spreads in the long-run price-discovery process across European
securities. Since minimum spreads are restricted in Europe, and pre-trade quote transparency is
significant, the information content of spreads on the mid-quote is lower in these markets. Any
variation in spreads must be related to the management of inventories, which will adjust in the
short-run. In the Canadian 2-year bond market, the results are significantly different. Spreads 9 Each row will not add up to 100 since we have reported maximums and minimums across all orderings.
15
explain around 12% of the long-term variability in prices. Dealers with private information in the
Canadian market adjust their quotes strategically, and market spreads reflect these adjustments.
Since quotes are not fully transparent this information may not be reflected in the mid-quote
immediately.
6. Summary and Conclusion
In this paper, we examine the dynamics of prices, order flow, relative depth, and spreads in short-
term European and Canadian government securities markets. Overall, the impulse response
functions and the variance decompositions illustrate that in European markets, order flow, relative
depth and spreads are only slightly informative. These results also suggest that European markets
are usually efficient. Market participants are able to quickly absorb private information elsewhere
in the market by observing changes in the limit order book and order flow. In Canadian markets,
where order flow has a permanent and positive impact on quotes, while spreads have a permanent
and negative impact on quotes, market prices are not always at their efficient levels.
The order flow result is a common finding in studies examining longer-term U.S. Treasuries.
Since quotes are to some extent transparent in Canadian markets, the combination of both quoting
obligations and transparency may be required to generate greater levels of price discovery. While
there are some differences in trade and quote dynamics, both Canadian and European short-term
fixed-income markets reflect fundamental information in a short amount of time. The results of
this paper confirm some previous findings. For example, Albanesi and Rindi (2000) also find
little evidence of asymmetric information in Italian bond trading. The comparison of European
and Canadian markets illustrates which market structures may be a contributing factor to greater
market efficiency.
There is still one possible drawback concerning the European system. The MTS liquidity pact is
often characterized as “forced liquidity.” It is not clear how these markets will behave in stressful
or disorderly periods. Liquid and efficient government securities markets are important to a
country’s overall economic well-being. They are necessary to ensure that savings and investment
decisions are made optimally. They also perform a number of key roles. For example, given their
virtually default-free nature, government securities are used as benchmarks for the pricing and
hedging of other fixed-income securities. Monetary policy makers, concerned about disorderly

16
markets, can determine if future interest rate-setting decisions are going to surprise financial
markets.10
In future research, we will build on the results of this paper and explore how trading and quoting
decisions are jointly determined across on-the-run and off-the-run securities markets. Since
dealers in fixed-income markets usually manage a portfolio of securities within a given maturity
sector, if securities are substitutable, a dealer can have a long position in one security and an
offsetting short position in another and bear little inventory risk. Primary dealers of both on- and
off-the-run securities can manage risk in their portfolio by adjusting prices and liquidity supplies
of the two securities jointly. We will also seek to determine if private information learned about
one security is used in the pricing decisions of other similar securities. Inventory control effects
may link on- and off-the-run securities.
10 Johnson (2003) describes how simple expectations-based models can be utilized to extract expectations. Usually, securities with maturities of two years and less are employed in this exercise.

17
References Acharya, V., Pedersen, L., 2005. Asset pricing with liquidity risk. Journal of Financial Economics 77, 375-410 Admati, A., Pfleiderer, P. 1988. A theory of intraday patterns: volume and price. Review of Financial Studies 1, 3-40. Amihud, T., Mendelson, H. 1980. Dealership market: market making with inventory. Journal of Financial Economics 8, 31-53. Albanesi, S., Rindi, B., 2000. The quality of the Italian Treasury bond market, asymmetric information and transaction costs. Annales d’Economie et de Statistique 60, 1-19. Angel, J., 1994. Limit versus market orders. Georgetown University Working Paper. Balduzzi, P., Elton, E., Green, C., 2001. Economic news and bond prices: evidence from the U.S. Treasury market. Journal of Financial and Quantitative Analysis 36, 523-543. Bloomfield, R., O’Hara, M., 1999, Market transparency: who wins and who loses? The Review of Financial Studies 12, 5-35. Bloomfield, R., O’Hara, M. and Saar, G., 2005, The “make or take” decision in an electronic market: Evidence on the evolution of liquidity. Journal of Financial Economics 75, 165-199. Brandt, M., Kavajecz, K., 2004. Price discovery in the U.S. Treasury market: The impact of order flow and liquidity on the yield curve. Journal of Finance 59, 2623-2654. Cheung, Y., de Jong, F., Rindi, B., 2005. Trading European sovereign bonds. The microstructure of the MTS trading platform. ECB working paper. Chordia, T., Roll, R., Subrahmanyam, A., 2000. Commonality in liquidity. Journal of Financial Economics 56, 3-28. Chordia, T., Roll, R., Subrahmanyam, A., 2001. Trading activity and expected stock returns. Journal of Financial Economics 59, 501-530. Chordia, T., Sarkar, A., Subrahmanyam, A., 2005. An empirical analysis of stock and bond market liquidity. Review of Financial Studies 18, 85-129. D’Souza, C., Gaa, C., Yang, J., 2003. An empirical analysis of liquidity and order flow in the brokered interdealer market for Government of Canada bonds. Bank of Canada working paper No. 2003-28. Evans, M., Lyons, R., 2004. Do currency markets absorb news quickly? NBER Working Paper No. 11041. Fleming, M., Remolona, E., 1999. Price formation and liquidity in the U.S. Treasury market: The response to public information. Journal of Finance 54, 1901-1915.
18
Foster, F., Viswanathan, S., 1990. A theory of interday variations in volumes, variances and trading costs in securities markets. Review of Financial Studies 4, 595-624. Gallant, A. Rossi, P., Tauchen, G., 1992. Stock prices and volume. Review of Financial Studies 199-242. Garleanu, N., Pedersen, L., 2006. Liquidity and risk management. The American Economic Review forthcoming. Goettler, R., Parlour, C., Rajan, U., 2005. Equilibrium in dynamic limit order markets. The Journal of Finance 60, 2149-2192. Green, C., 2004. Economic news and the impact of trading on bond prices. Journal of Finance 59 1201-1233. Greene, W., 1994. Econometric Analysis, 5th Edition. Prentice-Hall, Upper Saddle River, NJ. Hamilton, J., 1994. Time series analysis. Princeton University Press, Princeton, New Jersey. Hasbrouck, J., 1991a. Measuring the informational content of stock trades. Journal of Finance 46, 179-207. Hasbrouck, J., 1991b, The summary informativeness of stock trades: An econometric analysis, Review of Financial Studies 4, 571-95. Ho, T., Stoll, H., 1981. Optimal dealer pricing under transactions and return uncertainty, Journal of Financial Economics 9, 47-73. Johnson, G., 2003. Measuring interest rate expectations in Canada. Bank of Canada working paper No. 2003-26. Judge, G., Hill, R., Griffiths, W., Lutkepohl, H., Lee, T., 1982. Introduction to the theory and practice of econometrics, Wiley, New York. Kim, O., Verrecchia, R., 1994. Market liquidity and volume around earnings announcements. Journal of Accounting and Economics 17, 41-67. Pasquariello, P., Vega, C., 2006. Informed and strategic order flow in the bond markets. Forthcoming in the Review of Financial Studies. The Bond Market Association (TBMA) and the European Primary Dealers Association, 2005. European bond pricing sources and services: Implications for price transparency in the European bond market. Vayanos, D., 2004. Flight to quality, flight to liquidity, and the pricing of risk. NBER Working Papers No. 10327
19
Tables and Figures
Table 1: Macro news announcements. Macroeconomic news announcements whose release days are excluded from the data Country News Belgium Business Confidence Level Italy Consumer Price Index Industrial Production Consumer Confidence Retail Sales Trade Balance Industrial Orders Business Confidence Produced Price Index France Consumer Confidence Indicator Consumer Price Index Trade Balance Production Outlook Indicator Industrial Production Consumer Spending Business Confidence Indicator Unemployment Change Germany Retail Sales Unemployment Change Factory Orders Trade Balance Current Account Industrial Production Producer Price Index IFO Survey ZEW Survey on Economic Sentiment Import Price Index Euro-wide announcement ECB Announcement on Interest Rates EU Harmonised CPI Canada Current Account Industrial Production Prices Net Change in Employment Raw Materials Price Index US Change in Non-farm Payrolls Retail Sales Less Autos CPI Excluding Food and Energy PPI Excluding Food and Energy

20
Table 2: Summary statistics
The mid-quote change is the 30-minute change in mid-quote times 1000. Relative depth is defined as )k pricehe best asdepth at tricebest bid p(depth at tt − in which depth is measured in million of dollars or euros. Order flow of the bond,
torderflow , is defined as the aggregate number of buyer-initiated orders minus seller-initiated order during each half-hour interval. The best bid-offer spread is defined as (best offer price - the best bid price)*100.
French 6-month Correlations
Mean Standard Deviation ρ1 ρ 2 ρ 3
Mid-quote change Spread Order flow Bid depth Offer depth Relative depth Days
Mid-quote change 0.02 1.48 -0.07 0.00 -0.02 1.00 0.01 0.10 -0.08 0.09 -0.13 292 Spread 0.73 0.34 0.74 0.64 0.58 1.00 -0.03 -0.01 -0.02 0.01 Order flow 0.00 0.42 0.03 0.02 0.05 1.00 -0.02 0.00 -0.01 Bid depth 15.48 12.65 0.43 0.30 0.27 1.00 0.17 0.70 Offer depth 15.75 11.11 0.58 0.47 0.37 1.00 -0.58 Relative depth -0.27 15.38 0.45 0.32 0.26 1.00
Italian 6-month
Correlations
Mean Standard Deviation ρ1 ρ 2 ρ 3
Mid-quote change Spread Order flow Bid depth Offer depth Relative depth Days
Mid-quote change 0.01 2.19 -0.13 -0.02 -0.04 1.00 0.07 0.17 -0.04 0.02 -0.05 295 Spread 0.59 0.70 0.71 0.65 0.65 1.00 -0.03 -0.16 -0.17 0.05 Order flow 0.02 1.25 0.03 0.03 0.01 1.00 -0.01 0.01 -0.02 Bid depth 6.75 6.65 0.56 0.44 0.39 1.00 0.27 0.39 Offer depth 7.53 9.73 0.62 0.51 0.47 1.00 -0.78 Relative depth -0.78 10.16 0.48 0.36 0.31 1.00

21
Table 2 (continued)
German 6-month Correlations
Mean Standard Deviation ρ1 ρ 2 ρ 3
Mid-quote change Spread Order flow Bid depth Offer depth Relative depth Days
Mid-quote change 0.05 1.43 -0.10 0.02 0.00 1.00 -0.03 0.10 -0.05 0.00 -0.03 269 Spread 0.80 0.31 0.75 0.65 0.57 1.00 -0.02 -0.01 -0.07 0.05 Order flow 0.01 0.34 0.16 0.03 0.04 1.00 0.00 0.03 -0.03 Bid depth 12.71 8.97 0.56 0.42 0.42 1.00 0.10 0.53 Offer depth 13.89 12.49 0.65 0.46 0.38 1.00 -0.79 Relative depth -1.18 14.64 0.61 0.42 0.36 1.00 Belgian 12-month Correlations
Mean Standard Deviation ρ1 ρ 2 ρ 3
Mid-quote change Spread Order flow Bid depth Offer depth Relative depth Days
Mid-quote change 0.03 4.70 -0.02 0.02 0.00 1.00 -0.01 0.18 -0.02 0.05 -0.05 379 Spread 1.49 0.66 0.73 0.61 0.54 1.00 0.00 0.03 0.05 -0.01 Order flow 0.00 0.50 0.11 0.06 0.00 1.00 -0.01 0.00 -0.01 Bid depth 13.54 13.15 0.49 0.35 0.24 1.00 0.12 0.78 Offer depth 12.80 9.55 0.46 0.35 0.29 1.00 -0.52 Relative depth 0.74 15.29 0.41 0.30 0.20 1.00 Italian 12-month Correlations
Mean Standard Deviation ρ1 ρ 2 ρ 3
Mid-quote change Spread Order flow Bid depth Offer depth Relative depth Days
Mid-quote change 0.04 4.92 -0.03 -0.03 0.01 1.00 0.01 0.20 0.00 0.03 -0.02 295 Spread 0.84 0.63 0.66 0.51 0.45 1.00 -0.01 -0.20 -0.18 -0.01 Order flow 0.08 1.32 0.08 0.04 0.02 1.00 -0.01 0.04 -0.04 Bid depth 6.91 6.63 0.46 0.36 0.32 1.00 0.31 0.59 Offer depth 6.46 6.67 0.42 0.34 0.28 1.00 -0.59 Relative depth 0.45 7.82 0.27 0.16 0.09 1.00
22
Table 2 (continued)
French 12-month Correlations
Mean Standard Deviation ρ1 ρ 2 ρ 3
Mid-quote change Spread Order flow Bid depth Offer depth Relative depth Days
Mid-quote change 0.06 4.88 -0.03 0.01 -0.01 1.00 0.01 0.10 -0.04 0.07 -0.09 294 Spread 1.54 0.66 0.71 0.59 0.54 1.00 0.02 0.01 -0.07 0.06 Order flow -0.03 0.49 0.02 -0.01 -0.02 1.00 -0.05 0.00 -0.04 Bid depth 16.26 12.65 0.45 0.37 0.28 1.00 0.11 0.72 Offer depth 15.92 11.12 0.43 0.36 0.32 1.00 -0.61 Relative depth 0.34 15.86 0.39 0.32 0.25 1.00 German 2-year Correlations
Mean Standard Deviation ρ1 ρ 2 ρ 3
Mid-quote change Spread Order flow Bid depth Offer depth Relative depth Days
Mid-quote change 0.09 14.89 0.00 -0.01 0.02 1.00 0.00 0.06 -0.03 0.04 -0.06 255 Spread 2.61 0.96 0.60 0.42 0.35 1.00 0.00 0.08 0.07 0.02 Order flow 0.00 0.36 0.09 0.03 0.01 1.00 -0.01 -0.01 0.00 Bid depth 32.81 29.97 0.54 0.41 0.34 1.00 0.19 0.74 Offer depth 26.64 23.54 0.42 0.33 0.27 1.00 -0.52 Relative depth 6.17 34.34 0.42 0.31 0.27 1.00 Canadian 2-year Correlations
Mean Standard Deviation ρ1 ρ 2 ρ 3
Mid-quote change Spread Order flow Bid depth Offer depth Relative depth Days
Mid-quote change 0.23 27.26 -0.17 -0.08 0.00 1.00 -0.15 0.26 0.00 0.03 -0.01 202 Spread 1.26 3.51 0.24 0.02 0.02 1.00 0.00 0.00 -0.01 0.00 Order flow 0.06 2.13 0.10 0.02 0.01 1.00 0.02 0.00 0.02 Bid depth 4.84 12.66 0.13 0.08 0.01 1.00 0.18 0.77 Offer depth 4.25 9.29 0.05 0.01 0.07 1.00 -0.49 Relative depth 0.59 14.33 0.12 0.05 0.01 1.00
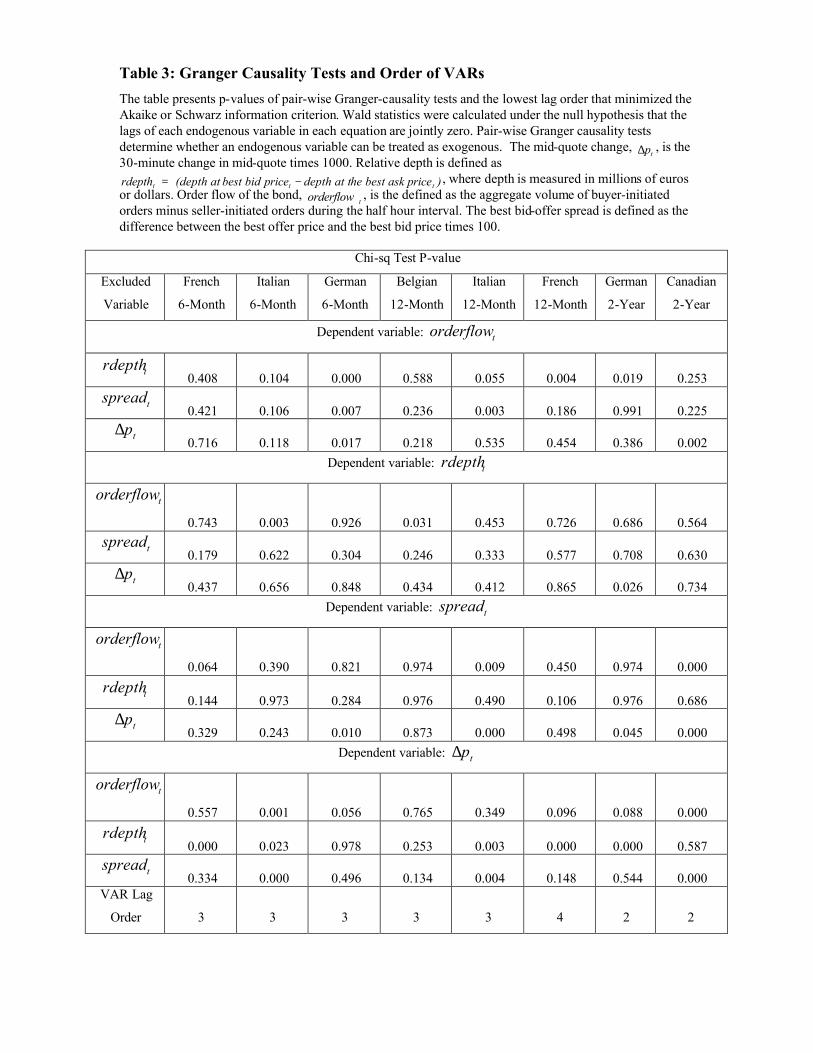
Table 3: Granger Causality Tests and Order of VARs
The table presents p-values of pair-wise Granger-causality tests and the lowest lag order that minimized the Akaike or Schwarz information criterion. Wald statistics were calculated under the null hypothesis that the lags of each endogenous variable in each equation are jointly zero. Pair-wise Granger causality tests determine whether an endogenous variable can be treated as exogenous. The mid-quote change,
tp∆ , is the 30-minute change in mid-quote times 1000. Relative depth is defined as
)k pricehe best asdepth at tprice best bid (depth atrdepth ttt −= , where depth is measured in millions of euros or dollars. Order flow of the bond,
torderflow , is the defined as the aggregate volume of buyer-initiated orders minus seller-initiated orders during the half hour interval. The best bid-offer spread is defined as the difference between the best offer price and the best bid price times 100.
Chi-sq Test P-value
Excluded
Variable
French
6-Month
Italian
6-Month
German
6-Month
Belgian
12-Month
Italian
12-Month
French
12-Month
German
2-Year
Canadian
2-Year
Dependent variable: torderflow
trdepth 0.408 0.104 0.000 0.588 0.055 0.004 0.019 0.253
tspread 0.421 0.106 0.007 0.236 0.003 0.186 0.991 0.225
tp∆ 0.716 0.118 0.017 0.218 0.535 0.454 0.386 0.002
Dependent variable: trdepth
torderflow 0.743 0.003 0.926 0.031 0.453 0.726 0.686 0.564
tspread 0.179 0.622 0.304 0.246 0.333 0.577 0.708 0.630
tp∆ 0.437 0.656 0.848 0.434 0.412 0.865 0.026 0.734
Dependent variable: tspread
torderflow 0.064 0.390 0.821 0.974 0.009 0.450 0.974 0.000
trdepth 0.144 0.973 0.284 0.976 0.490 0.106 0.976 0.686
tp∆ 0.329 0.243 0.010 0.873 0.000 0.498 0.045 0.000
Dependent variable: tp∆
torderflow 0.557 0.001 0.056 0.765 0.349 0.096 0.088 0.000
trdepth 0.000 0.023 0.978 0.253 0.003 0.000 0.000 0.587
tspread 0.334 0.000 0.496 0.134 0.004 0.148 0.544 0.000
VAR Lag
Order
3
3
3
3
3
4
2
2
24
Table 4: Variance decompositions of Price Changes
The table reports the percentage of the 20-period ahead forecast variance in prices due to each innovation, with each row adding up to 100. Since the variance decomposition (based on a Cholesky identification assumption) can be affected by the ordering of the variables in the VAR, both lower and upper bounds are reported by looking at all combinations of
torderflow trdepth and
tspread in the VAR ordering. The second column, labelled "S.E.", contains the forecast error of the mid-quote at the 20-period forecast horizon. Standard errors from a Monte Carlo simulation with 100 repetitions are given in parentheses.
S.E
torderflow
high
torderflow
low
trdepth
high
trdepth
low
tspread
high
tspread
low
tp∆
French
6-Month 0.420
1.025
(0.281)
0.922
(0.237)
4.605
(0.514)
4.498
(0.636)
0.074
(0.096)
0.065
(0.081)
94.402
(0.724)
Italian
6-Month 1.255 2.973
(0.402) 2.887
(0.447) 0.930
(0.236) 0.818
(0.229) 2.601
(0.4513) 2.550
(0.437) 93.619 (0.676)
German
6-Month 0.344 1.004
(0.285) 1.001
(0.284) 0.172
(0.137) 0.147
(0.142) 0.569
(0.252) 0.545
(0.221) 98.279 (0.384)
Belgian
12-Month 0.503 3.438 (0.447)
3.421 (0.472)
0.426 (0.166)
0.4126 (0.186)
0.090 (0.090)
0.087 (0.101)
96.060 (0.457)
Italian
12-Month 1.320 3.959 (0.529)
3.890 (0.546)
0.399 (0.211)
0.333 (0.145)
0.275 (0.178)
0.266 (0.155)
95.437 (0.582)
French
12-Month 0.487 1.054 (0.267)
0.937 (0.266)
3.262 (0.431)
3.131 (0.414)
0.198 (0.141)
0.179 (0.116)
95.618 (0.531)
German
2-Year 0.364 0.394 (0.205)
0.376 (0.171)
1.399 (0.372)
1.3794 (0.310)
0.0325 (0.060)
0.028 (0.069)
98.194 (0.420)
Canadian
2-Year 2.130 7.287 (0.874)
7.143 (0.807)
0.072 (0.109)
0.052 (0.104)
12.028 (1.009)
11.892 (1.149)
80.761 (1.246)
25
Figure 1: Response of Price change to the Order Flow, Imbalance and Spread.
Panel A French 6-Month Bill
-.4
-.3
-.2
-.1
.0
.1
.2
1 2 3 4 5 6 7 8 9 10
Accumulated Response of MIDQUOTE to ORDERFLOW
-.4
-.3
-.2
-.1
.0
.1
.2
1 2 3 4 5 6 7 8 9 10
Accumulated Response of MIDQUOTE to RDEPTH
-.4
-.3
-.2
-.1
.0
.1
.2
1 2 3 4 5 6 7 8 9 10
Accumulated Response of MIDQUOTE to SPREAD
Accumulated Response to Cholesky One S.D. Innovations ± 2 S.E.
26
Panel B:Italian 6-Month Bill
-.3
-.2
-.1
.0
.1
.2
.3
1 2 3 4 5 6 7 8 9 10
Accumulated Response of MIDQUOTE to ORDERFLOW
-.3
-.2
-.1
.0
.1
.2
.3
1 2 3 4 5 6 7 8 9 10
Accumulated Response of MIDQUOTE to RDEPTH
-.3
-.2
-.1
.0
.1
.2
.3
1 2 3 4 5 6 7 8 9 10
Accumulated Response of MIDQUOTE to SPREAD
Accumulated Response to Cholesky One S.D. Innovations ± 2 S.E.

27
Panel C: German 6-Month Bill
-.2
-.1
.0
.1
.2
.3
.4
1 2 3 4 5 6 7 8 9 10
Accumulated Response of MIDQUOTE to ORDERFLOW
-.2
-.1
.0
.1
.2
.3
.4
1 2 3 4 5 6 7 8 9 10
Accumulated Response of MIDQUOTE to RDEPTH
-.2
-.1
.0
.1
.2
.3
.4
1 2 3 4 5 6 7 8 9 10
Accumulated Response of MIDQUOTE to SPREAD
Accumulated Response to Cholesky One S.D. Innovations ± 2 S.E.

28
Panel D: Belgian 12-Month Bill
-0.8
-0.4
0.0
0.4
0.8
1.2
1.6
1 2 3 4 5 6 7 8 9 10
Accumulated Response of MIDQUOTE to ORDERFLOW
-0.8
-0.4
0.0
0.4
0.8
1.2
1.6
1 2 3 4 5 6 7 8 9 10
Accumulated Response of MIDQUOTE to RDEPTH
-0.8
-0.4
0.0
0.4
0.8
1.2
1.6
1 2 3 4 5 6 7 8 9 10
Accumulated Response of MIDQUOTE to SPREAD
Accumulated Response to Cholesky One S.D. Innovations ± 2 S.E.
29
Panel E: Italian 12-Month Bill
-0.4
0.0
0.4
0.8
1.2
1.6
1 2 3 4 5 6 7 8 9 10
Accumulated Response of MIDQUOTE to ORDERFLOW
-0.4
0.0
0.4
0.8
1.2
1.6
1 2 3 4 5 6 7 8 9 10
Accumulated Response of MIDQUOTE to RDEPTH
-0.4
0.0
0.4
0.8
1.2
1.6
1 2 3 4 5 6 7 8 9 10
Accumulated Response of MIDQUOTE to SPREAD
Accumulated Response to Cholesky One S.D. Innovations ± 2 S.E.

30
Panel F:French 12-Month Bill
-.8
-.4
.0
.4
.8
1 2 3 4 5 6 7 8 9 10
Accumulated Response of MIDQUOTE to ORDERFLOW
-.8
-.4
.0
.4
.8
1 2 3 4 5 6 7 8 9 10
Accumulated Response of MIDQUOTE to RDEPTH
-.8
-.4
.0
.4
.8
1 2 3 4 5 6 7 8 9 10
Accumulated Response of MIDQUOTE to SPREAD
Accumulated Response to Cholesky One S.D. Innovations ± 2 S.E.
31
Panel G: German 2-Year Bond
-2
-1
0
1
2
1 2 3 4 5 6 7 8 9 10
Accumulated Response of MIDQUOTE to ORDERFLOW
-2
-1
0
1
2
1 2 3 4 5 6 7 8 9 10
Accumulated Response of MIDQUOTE to RDEPTH
-2
-1
0
1
2
1 2 3 4 5 6 7 8 9 10
Accumulated Response of MIDQUOTE to SPREAD
Accumulated Response to Cholesky One S.D. Innovations ± 2 S.E.

32
Panel H: Canadian 2-Year Bond
-8
-4
0
4
8
12
1 2 3 4 5 6 7 8 9 10
Accumulated Response of MIDQUOTE to ORDERFLOW
-8
-4
0
4
8
12
1 2 3 4 5 6 7 8 9 10
Accumulated Response of MIDQUOTE to RDEPTH
-8
-4
0
4
8
12
1 2 3 4 5 6 7 8 9 10
Accumulated Response of MIDQUOTE to SPREAD
Accumulated Response to Cholesky One S.D. Innovations ± 2 S.E.