PREVALENCE OF HYPERACTIVITY IN ELEMENTARY SCHOOL CHILDREN AS A FUNCTION OF SOCIAL SYSTEM DEFINERS
18
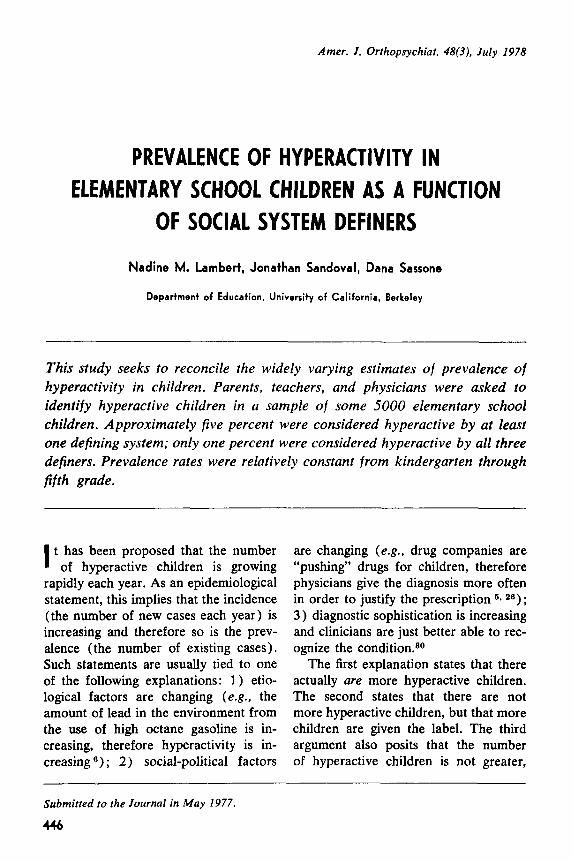
Amer. J. Orthopsychiat. 48(3), July I978 PREVALENCE OF HYPERACTIVITY IN ELEMENTARY SCHOOL CHILDREN AS A FUNCTION OF SOCIAL SYSTEM DEFINERS Nadine M. Lambed, Jonathan Sandoval, Dana Sassone Department of Education, University of California, Berkeley This study seeks to reconcile the widely varying estimates of prevalence of hyperactivity in children. Parents, teachers, and physicians were asked to identify hyperactive children in a sample of some 5000 elementary school children. Approximately five percent were considered hyperactive by at least one defining system; only one percent were considered hyperactive by all three definers. Prevalence rates were relatively constant from kindergarten through fifth grade. t has been proposed that the number I of hyperactive children is growing rapidly each year. As an epidemiological statement, this implies that the incidence (the number of new cases each year) is increasing and therefore so is the prev- alence (the number of existing cases). Such statements are usually tied to one of the following explanations: 1) etio- logical factors are changing (e.g., the amount of lead in the environment from the use of high octane gasoline is in- creasing, therefore hyperactivity is in- creasing ”) ; 2) social-political factors are changing (e.g., drug companies are “pushing” drugs for children, therefore physicians give the diagnosis more often in order to justify the prescription 2e) ; 3 ) diagnostic sophistication is increasing and clinicians are just better able to rec- ognize the condition.80 The first explanation states that there actually are more hyperactive children. The second states that there are not more hyperactive children, but that more children are given the label. The third argument also posits that the number of hyperactive children is not greater, Submitted to the Journal in May 1977. 446
-
Upload
uaemmorelos -
Category
Documents
-
view
1 -
download
0
Transcript of PREVALENCE OF HYPERACTIVITY IN ELEMENTARY SCHOOL CHILDREN AS A FUNCTION OF SOCIAL SYSTEM DEFINERS
Amer. J . Orthopsychiat. 48(3), July I978
PREVALENCE OF HYPERACTIVITY IN ELEMENTARY SCHOOL CHILDREN AS A FUNCTION
OF SOCIAL SYSTEM DEFINERS
Nadine M. Lambed, Jonathan Sandoval, Dana Sassone
Department of Education, University of California, Berkeley
This study seeks to reconcile the widely varying estimates of prevalence of hyperactivity in children. Parents, teachers, and physicians were asked to identify hyperactive children in a sample of some 5000 elementary school children. Approximately five percent were considered hyperactive by at least one defining system; only one percent were considered hyperactive by all three definers. Prevalence rates were relatively constant from kindergarten through fifth grade.
t has been proposed that the number I of hyperactive children is growing rapidly each year. As an epidemiological statement, this implies that the incidence (the number of new cases each year) is increasing and therefore so is the prev- alence (the number of existing cases). Such statements are usually tied to one of the following explanations: 1) etio- logical factors are changing (e.g., the amount of lead in the environment from the use of high octane gasoline is in- creasing, therefore hyperactivity is in- creasing ”) ; 2) social-political factors
are changing (e.g., drug companies are “pushing” drugs for children, therefore physicians give the diagnosis more often in order to justify the prescription 2e) ; 3 ) diagnostic sophistication is increasing and clinicians are just better able to rec- ognize the condition.80
The first explanation states that there actually are more hyperactive children. The second states that there are not more hyperactive children, but that more children are given the label. The third argument also posits that the number of hyperactive children is not greater,
Submitted to the Journal in May 1977.
446
LAMBERT, SANDOVAL AND SASSONE 447
but suggests that there were many more such children in the past who went un- recognized. Although all three points of view differ in basic assumptions about the meaning of hyperactivity, they all rely on the same type of prevalence study to provide evidence that “hyper- activity” is increasing.
It has been reported that the preva- lence in school children of “hyperactiv- ity,” “hyperkinesis,” or “MBD-hyper- activity” (minimal brain dysfunction-hy- peractivity) ranges from 5 % to lO%.‘O What does this mean? From an epidemi- ological point of view, these figures are taken to mean that from five to ten out of any 100 school children have “hyper- activity.’’ The assumption has been made that hyperactivity is a medical condition or a disease, such as measles. The as- sumption also has been made that more than simple behaviors have been as- sessed, that an underlying condition, a syndrome, has been identified. Are these assumptions reasonable? Leaving aside the question of etiology, does the meth- odology used in prevalence studies meet the standards necessary for a medical epidemiological statement?
Defining for the purposes of esti- mating prevalence requires the presump- tion of a unitary entity that may be operationally defined. If one is investi- gating the prevalence of a specific di- sease entity, the task of definition is relatively simple. However, when one is investigating the prevalence of a prob- lem that is defined by the absence of observable pathology and defined by behavioral characteristics that are re- ported s~bjec t ive ly ,~~ the task of defi- nition is complex indeed. A first prob- lem arises from the lack of observable pathology. When the lack of something (e.g., assessable brain damage) becomes
a criterion, there is a difficulty in de- ciding who does not meet the criterion. Are all children who are overactive but who do not have brain damage “hyper- active”? Obviously not, but the lack of brain damage is used as one criterion for the technical diagnosis of “hyper- kinetic reaction of childhood.”
A second problem is that the report of the child’s behavior is made by those who contribute to the child’s environ- ment, namely the parents and teachers. Because they are a part of the child’s environment, their attitudes and be- haviors affect both the child’s behavior and their perception of the child’s be- havior. Such subjective reports hardly can be comparable to laboratory meth- ods used in medical diagnosis. Is a prevalence investigation of “hyperac- tivity” studying the prevalence of “a syndrome,” of “behavior,” or of a “re- port of behavior”? As will be seen, tra- ditional studies have lumped all three together and presume to measure a syn- drome, which we believe to be an un- justifiable practice. This does not mean that one cannot study the occurrence of: 1 ) a defined behavior, 2) the reports of behavior from various sources or 3) the diagnosis or labeling of hyperactivity. It does, however, mean that one must be careful to differentiate reports of be- havior that are subjective from diag- noses given by professionals. In all cases, the report or diagnosis may be as much a reflection of the reporter or diagnos- tician as of the child. It therefore be- comes incumbent on the prevalence investigator to specify the environment in which the behavior occurs and the source of the label or diagnosis along with the estimates.
We believe that a prevalence study of reported behaviors should look both at
448 PREVALENCE OF HYPERACTIVITY
the intra-child variables independent of the social system and at the social (ell- vironmental and attitudinal) factors that might affect the behavior and its labeling or diagnosis. The following sec- tion is a brief description of how the assumptions of each model (after Mer- cer 1 8 ) could be applied to the preva- lence study of “hyperactivity.”
Models of Hyperactivity
A prevalence study from an organic, neurological, or metabolic deficit model (i .e. , a disease model) assumes that hy- peractivity is inherent in the individual and that it can be diagnosed reliably. One model holds that a child’s behavior results from a dysfunction in the central nervous system which prevents normal self-control. Authors such as Wender 3o
maintain that medications, usually cen- tral nervous system stimulants, work to overcome the deficit and cause the child to function normally, just as insulin al- lows a diabetic to process sugar in the usual manner. People subscribing to this model often use the term hyperkinesis or minimal brain dysfunction when talking about hyperactive children. A variant of this model is Feingold’s hypothesis that hyperactive children react unfavor- ably to food chemicals and are, presum- ably, deficient in this regard. Another, by Morrison and Stewart,20 suggests the possibility of a genetic etiology. The neurological or metabolic models stress the biological condition of the child and pay less attention to the environment in which the child grows and develops.
Diagnosis of the deficit can occur either through medical tests or evidence of symptoms, or through a statistical procedure (e.g., deviations from the norm). Regardless of the methods of
diagnosis, the condition is considered solely an attribute of the individual. In other words, a report of behavior is considered evidence of a symptom equal to the finding on a medical laboratory test. Prevalence is determined by esti- mating the number of persons with a sig- nificant number of symptoms. Symptoms are not looked at in terms of environ- mental contingencies, but are assumed to be a by-product of the child’s internal state. They are a reflection of an in- ternal condition and are not looked at as behaviors per se. Nearly all available prevalence studies look at “hyperactiv- ity” from such a model. Some use a physician’s diagnosis; most use reports of behavior, taking into account neither the source of the report nor the context of the behavior. Others use a statistical definition assuming that a certain cut- off percentile point on a teacher rating procedure is evidence of “hyperactivity.”
A second model, one that incorpo- rates a sociological and anthropological perspective, is the social system model. Here, in contrast to the organic model, authors such as Conrad or Robin and Bosco 22 stress that hyperactive be- havior is defined by the child’s social environment, including the child’s role in an institution (e.g., the family or the school). When a hyperactive child’s be- havior is socially deviant and trans- gresses social system norms, the family or the school “create” the hyperactive child by labeling this behavior as such. In this model, very little emphasis is placed on the constitutional makeup of the child or on individual differences in children. “Hyperactivity” is regarded as an achieved status; it is a role played by those assigned the status. This status exists within, and is specific to, the so- cial system in which it occurs. Preva-
LAMBERT, SANDOVAL AND SASSONE 449
lence rates, therefore, are specific to the type of social system: traditional preva- lence rates, which ignore the environ- mental or sociocultural factors, are con- sidered meaningless. One can achieve the status, that is, be labeled “hyperac- tive,” in one social system, such as the school, but not in others, such as the home or larger community. The status of hyperactivity is thought of, therefore, as a product of the social system and not a condition inherent in the child.
A third model, one on which our re- search program has been based, incor- porates both the social and the child- centered perspectives in a single inter- active system model. This model asserts that both individual differences in the organic and psychological makeup of the child and individual differences in the family and school environment of the child may contribute to whether or not a child is identified as “hyperactive.” Rather than viewing the social structure as the sole arbiter of hyperactive be- havior, the multidimensional or interac- tive model posits a complex interaction between the child’s environment and his physical and psychological status. Chil- dren function on a continuum of physi- cal-neurological capacity and develop on a continuum of supportive social en- vironments.
It follows, then, that hyperactivity in children cannot be defined by a single behavioral dimension or a single de- fining system. A definitive diagnosis based on the etiology of the symptoms is not realistic at this time, and multiple rather than single treatment recommen- dations are desirable. We accept the as- sumption that the severity of the hyper- active behaviors may be related to fac- tors in the child’s home and school environments, and that the flexibility of
these two critical environments affects the child’s prognosis.
Our prevalence study will offer a number of different definitions of hy- peractivity based on information from several sources: home, school, and physician. We shall not produce one prevalence rate for hyperactivity, but several based on different defining sys- tems. As much as possible, we shall provide environmental information along with figures attached to a particu- lar definition. Before proceeding, how- ever, it is informative to summarize what others have reported about the preva- lence of hyperactivity.
Prevalence in the General School Population
Studies of the prevalence in the United States. The work of Huessy and his col- leagues 9* lo* l1. l2 is often cited in the literature as indicating that between ten and twenty percent of school children are “hyperkinetic.” The researchers had teachers of 500 second-grade school children in rural Vermont complete their own 21-item, five-point scale rating on the children. Anyone with a total score above the 80th percentile was considered a “problem” and “hyperkinetic.” l2
Thus, twenty percent is the prevalence rate often cited from this study, but the estimate cannot be accepted without question. By arbitrarily choosing the 80th percentile, the investigators picked the prevalence rate. Using a percentile cut-off on an unvalidated checklist is hardly an adequate method of diagnosis or identification. The authors claimed that the instrument was validated by the fact that some of the children in the top twenty percent included the children about whom teachers complained. That teachers complain about the same chil-

450 PREVALENCE OF HYPERACTIVITY
dren to whom they give high ratings should come as no surprise; however, behavior resulting in teacher complaint is hardly synonomous with “hyperki- netic syndrome.”
Huessy et a1 l2 further argued that the “hyperkinetic syndrome” is not as stable as many have assumed. They based their assertion on the fact that, when a sim- ilar rating was made on the same chil- dren two years later, only half of the top ten percent were still above the 80th percentile. But since there was no ex- ternal validation of the original “diag- nosis,” it is hard to see how they jus- tify such a conclusion. It would seem more reasonable to conclude that re- ports of children’s behavior change over time, without identifying a reason.
Wender 30 used a procedure in which the teacher rated whether or not speci- fied behaviors were a “problem.” He found that fifteen percent of a stratified sample of Montgomery County, Mary- land, children in first through sixth grades had teacher-reported problems of restlessness, and 22 % had problems of attention span. Wender concluded that . . . one-fifth to one-tenth of grade school children had problems considered to be mani- festations of MBD (minimal brain dysfunc- tion) to some (perhaps minor) degree. (p. 60 1
Werner et a1 31 used behavior check- lists and reports from parents and teach- ers to indicate the presence of hy- perkinetic symptoms (hyperactive, dis- tractible, and irritable) in 750 Kauai children followed from before birth. They found that 8.79% of the boys and 3.2% of the girls (5.9% total) evi- denced symptoms at ten years of age.
Stewart et a lZs found that four per- cent of 47 first-grade children in St.
Louis grade schools who had been sta- tistically selected to be controls had been “diagnosed hyperactive.” No definition of the method used to conclude that the children were “diagnosed hyperactive” was provided, however. Furthermore, the four percent figure was a statistical extrapolation based on a hypothesized boy-girl ratio. Despite these methodolo- gical difficulties, Wender so reported that . . . Stewart et a1 . . . reported the prevalence of the “hyperactivity syndrome” to be approx- imately 4% in a population of St. Louis grade school children between the ages of five and eleven.
In a later study, Miller, Palkes and Stewartlo found that, in a population of 849 suburban St. Louis grade school children in grades third through sixth, 1.46% of the girls, 9.32% of the boys, and 5.53% overall were “diagnosed hy- peractive.” The criteria for diagnosis were teacher report (yes or no format), the presence of overactive and distracti- ble behavior, and the presence of at least three out of 28 other “symptoms” such as “does not do homework,” “has changeable moods,” “seems to think he/ she is worthless.” No confirmation of the “diagnosis” was made, other than the “face” validity of the reported symp- toms.
Studies of prevalence in Western Eu- rope. Prechtl and Stemmer,21 using a neurological sign (choreiform move- ments) and “behavioral problems” found the syndrome to be present in twenty percent of the boys and ten per- cent of the girls in Netherland schools. The symptoms were “severe” in five percent of the boys and one percent of the girls.
Bax3 and Rutter and Graham,24 us- ing the criteria of 1) short attention
LAMBERT, SANDOVAL AND SASSONE 45 1
span and excess motor activity 2) which are observed by all familiar adults and 3) are not affected by presence of fa- miliar adults, found a very low preva- lence rate in the entire rural population of the Isle of Wight. Bax found no cases among 1200 five-year-olds, while Rut- ter found two out of 2199 ten-to- eleven year-olds who met the criteria.
Research designed to estimate the prevalence of “hyperactivity” provides evidence that from fewer than one per- cent to as many as twenty percent of school-aged children are considered hy- peractive using a variety of different kinds of behavior reporting systems. The wide variety of criteria and lack of rig- orous cross validation undoubtedly con- tribute to the wide range of estimates.
Prevalence in Clinic Populations Another approach to examining the
prevalence of hyperactivity is to look at the proportion of children seen in child guidance clinics who are “diagnosed” hyperactive.
Kenny et a1 l3 found that, of 100 chil- dren referred to a clinic with complaints of hyperactivity, only thirteen were rated hyperactive by all (usually three) clinic observers. Using a similar meth- odology, Rosen, Bahn and Kramer,23 in surveying the demographic characteris- tics of psychiatric clinic outpatients in 1961, concluded that the most common diagnosis for school age children was “transient situational personality disor- der.” Wender 30 subsequently reported that the most common pediatric diagno- sis during latency is hyperactivity.
Symptom Prevalence in the Normal Population
A variety of large-scale epidemiologi- cal studies have looked at the preva-
lence of certain behaviors in normal children. These studies provide informa- tion on the presence of behavior con- sidered symptomatic of hyperactivity in general childhood populations. A vari- ety of methods were used, including mothers’ reports; l7 teacher check- lists; 32 Q-sorts by mothers; 2Q and ques- tionnaires by mothers and schools.*’ Although these studies have not looked specifically at the diagnosis of “hyper- activity,” they are quite similar to those of H u e s ~ y , ~ Wender,30 and Miller, Palkes and Stewart,lB all of whom used com- parable methodology and inferred diag- noses from their data.
Generally, these studies indicated a rather high prevalence of behaviors as- sumed by others to be “symptoms of hyperactivity.” For example, Lapouse and Monk16 found that the mothers of 482 six-to-twelve-year-olds reported thalt 57% of the boys and 42% of the girls were overactive. Similarly, Werry and Quay32 noted that the teachers of almost 2000 kindergarten ,through sec- ond-grade children report that 50% of the boys and 28% of the girls cannot sit still, while 44% of the boys and 26% of the girls have a short attention span. These investigators concluded that the prevalence of such behaviors, which are assumed a priori to be symptomatic of hyperactivity, is so high in normal chil- dren that they are of poor diagnostic value. Prevalence studies focused on “hyperactivity,” which use similar in- struments and criteria, should be evalu- ated in this light.
OBJECTIVES
The investigation reported here set out to identify a large representative sample of children in public and private elementary schools and to estimate the
452 ’ PREVALENCE OF HYPERACTIVITY
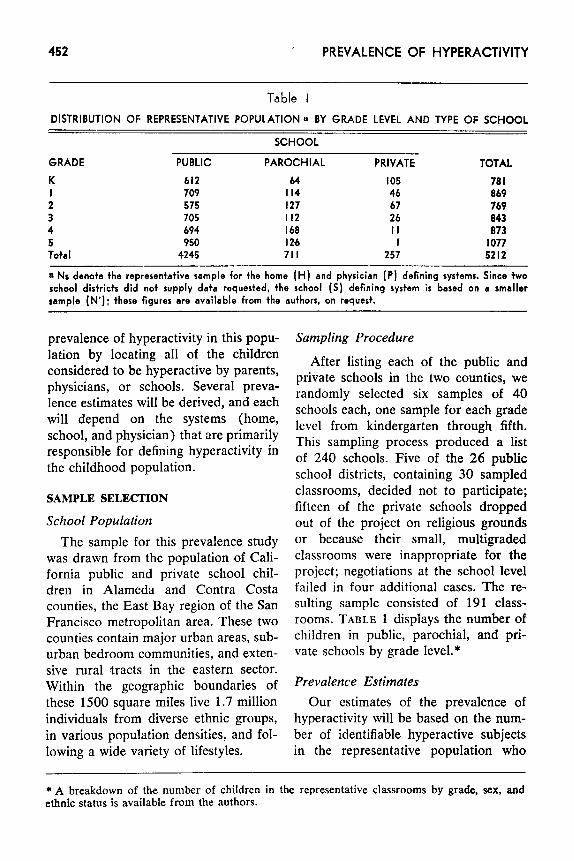
Table I DISTRIBUTION OF REPRESENTATIVE POPULATION a BY GRADE LEVEL AND TYPE OF SCHOOL
SCHOOL
GRADE PUBLIC PAROCHIAL PRIVATE TOTAL K I 2 3 4 5 Total
612 709 575 705 694 950 4245
64 I05 I14 46 I27 67 I I2 26 160 I I I26 I 71 I 257
70 I 069 769 043 073
I077 5212
~~~ ~
a Ns denote the representative sample for the home (H) and physician ( P ) defining systems. Since two school dishicts did not supply data requested, the school ( S ) defining system is based on a smaller sample (N’): these figures are available from the suthors, on request.
prevalence of hyperactivity in this popu- lation by locating all of the children considered to be hyperactive by parents, physicians, or schools. Several preva- lence estimates will be derived, and each will depend on the systems (home, school, and physician) that are primarily responsible for defining hyperactivity in the childhood population.
SAMPLE SELECTION
School Population The sample for this prevalence study
was drawn from the population of Cali- fornia public and private school chil- dren in Alameda and Contra Costa counties, the East Bay region of the San Francisco metropolitan area. These two counties contain major urban areas, sub- urban bedroom communities, and exten- sive rural tracts in the eastern sector. Within the geographic boundaries of these 1500 square miles live 1.7 million individuals from diverse ethnic groups, in various population densities, and fol- lowing a wide variety of lifestyles.
Sampling Procedure
After listing each of the public and private schools in the two counties, we randomly selected six samples of 40 schools each, one sample for each grade level from kindergarten through fifth. This sampling process produced a list of 240 schools. Five of the 26 public school districts, containing 30 sampled classrooms, decided not to participate; fifteen of the private schools dropped out of the project on religious grounds or because their small, multigraded classrooms were inappropriate for the project; negotiations at the school level failed in four additional cases. The re- sulting sample consisted of 191 class- rooms. TABLE 1 displays the number of children in public, parochial, and pri- vate schools by grade level.*
Prevalence Estimates Our estimates of the prevalence of
hyperactivity will be based on the num- ber of identifiable hyperactive subjects in the representative population who
* A breakdown of the number of children in the representative classrooms by grade, sex, and ethnic status is available from the authors.
LAMBERT, SANDOVAL AND SASSONE 453
meet operationally defined and replica- ble definitions of hyperactivity. We em- ployed information from parents, physi- cians, and school personnel to locate these children, while protecting the rights of the children and their parents.
To obtain information from parents, we contacted by mail all of the parents in the randomly sampled public and private classrooms and asked them to notify us, by returning a form or by a phone call, if their child was considered to be hyperactive and if they would be willing to participate in the project. We sent a Spanish-language form when ap- propriate.
These methods provided a large sam- ple of hyperactive subjects, but not nec- essarily all of the identified hyperactive children in the representative sample. In order to identify other cases known to the school, we asked teachers, psycholo- gists, principals, nurses, and special edu- cators to compare the names in the rep- resentative sample with children known to be considered hyperactive in their school district. The additional cases that they noted were children known to be under treatment for hyperactivity and under the care of the physician, but who had not yet been referred to us by par- ents or physicians. We asked the school to contact the parents and request per- mission for us to interview them.
Simultaneously with the parent and school identification phase, we asked all of the physicians in the two-county area to refer to us any children they had identified as hyperactive after they ob- tained parent consent to notify us. To assist the physicians in this process, we listed all of the schools in which the representative sample was located and offered to send them the lists of repre- sentative sample pupils in their area. We
were in contact with and received re- ferrals from the major pediatric clinics and hospitals, as well as private physi- cians. In all cases where parents, physi- cians, and clinics referred children to us, we followed with a home interview and secured written, informed consent to ob- tain the child’s school history and medi- cal records.
We recognized that the accuracy of the prevalence estimates would be de- pendent on canvassing parents, physi- cians, and teachers regarding their per- ceptions of children’s hyperactivity. We asked school personnel to identify by sex and age, but not name, those chil- dren they considered to be hyperactive, but whose parents had not responded #to our request to participate. These cases were added to those others identified by the school whose parents were willing to be interviewed, but who did not con- sider their children to be hyperactive.
The procedures described above pro- vided us with a pool of children con- sidered to be hyperactive by parents, physicians, or educators; it included all of the children to be considered in prev- alence estimates. Before determining prevalence estimates, we assigned each child a classification based on the social systems that considered that child hyper- active.
Systems for Defining Hyperactivity Children may be considered hyper-
active or labeled hyperactive by at least three defining systems: the home (H), the school (S), and the physician (P). We have pointed out that many investi- gators do not consider a child to be hy- peractive unless he or she has been judged to be hyperactive by a physician. Other investigators, centering on the school behavior of children, accept the
454 PREVALENCE OF HYPERACTIVITY
judgments of the classroom teacher, often formalized by rating procedures, in identifying a child as hyperactive. Recognizing that the behavior of the child may not be the same at home as at school, still other investigators con- sider that the manifestations of the child’s hyperactive behaviors both at home and at school must be present before hyperactivity is an appropriate label.
The home. A child was considered home-identified if, in response to an in- terview question, the parents indicated that they considered the child to be hyperactive.
The school. All teachers of the repre- sentative classrooms and ather school personnel, such as principals and psy- chologists, were asked to nominate: 1) children who were considered hyperac- tive, 2) children who, in their opinion, would be considered hyperactive by a physician if their parents would consent to take them for an evaluation, and 3) children who had been referred to a physician for hyperactive behavior for the first time during the current school year. If the replies were in the affirma- tive from these school personnel, we identified the child as one considered to be hyperactive in the school system, and therefore one whose behavior was de- fined as hyperactive by the social system of the school.
The physician. When we were able to determine that the child had seen a physician for behavior problems associ- ated with hyperactivity, and we had obtained consent for information re- lease, we asked the physician to com- plete a medical evaluation form. This form was developed in consultation with a group of neurologists, pedia- tricians, and child psychiatrists. The
outcome of this pooling of expertise was an instrument that contained items un- der the following headings: child’s med- ical history; physical examination re- sults; laboratory findings; family history; general behavior; school performance; diagnostic summary; and treatment rec- ommendations.
If there were no competing medical explanation of the symptoms (e.g., epi- lepsy) and the physician’s diagnosis was hyperactivity, hyperkinesis, MBD with hyperactivity, or if we could determine that the physician prescribed a cerebral stimulant commonly used with hyper- active children, such as Ritalin or Dexe- drine, we reasoned that the physician considered the child to be hyperactive.
Operational Criteria By applying the definitions of hyper-
activity from these three defining sys- tems, home (H) , school ( S ) , and physi- cian (P), it was possible to define operationally the types of hyperactive subjects on the basis of system definers. These operational definitions are as follows: HSP-children considered hy- peractive by all three definers; HP- children considered hyperactive by par- ents and physicians, but not by educa- tors; SP-children considered hyperac- tive by physicians and educators, but not by parents.
Many children are considered hyper- active by parents, school, or both, but have not been identified as hyperactive by a physician. Some may not have seen a physician for the presenting problem of hyperactive behavior; parents of others may not have requested such an evaluation; or attending physicians may not have suggested hyperactivity as an explanation of the children’s problems. These children are usually excluded
LAMBERT, SANDOVAL AND SASSONE 455
from studies of hyperactive children, especially drug studies, even though they are included in prevalence esti- mates of some investigators. They form, nevertheless, important groups of hy- peractive children from the perspective of the home and school defining sys- tems.
These subjects make up three addi- tional groups of hyperactive children for prevalence estimates : H C h i l d r e n considered hyperactive by parents and educators; H-children considered hy- peractive only by parents; S-children considered hyperactive only by the school.
Behavior Equivalents We have still another method for de-
fining hyperactivity, one that has been used in a number of prevalence studies. In this method, children are defined as hyperactive if their behavior is rated as being in a critical region on a be- havior checklist. We used the Behavior and Temperament Survey, which con- sists of a list of 31 behaviors; it is simi- lar to but more comprehensive than Con- ners’s Abbreviated Symptom Question- naire,4 and correlates with the Conners instrument to a high degree ( r= .89) . Other investigators who have used rat- ings as a source of data to estimate hy- peractivity have applied arbitrary cutoff measures based on presumptions of the prevalence of hyperactivity in a child- hood population.12 We established the critical region for behavioral equivalents by comparing ratings of identified hyper- active children (i.e., those classified as HSP) with the representative population of peers of their age and sex.
After making a frequency distribu- tion of the total scores on the rating as- signed by teachers to the children in the
HSP group, we can locate a cutoff region that will include all the children who have been consensually identified, as well as those with equivalently severe be- havior who have not been considered hyperactive. Children not considered hyperactive may be well liked by teach- ers in spite of their behavior, may be succeeding in school in spite of it, or may have clearly established reasons for their behavior in the teacher’s view.
For our higher bound prevalence es- timates we will call any child a be- havioral equivalent (BE), regardless of whether the home, school, or physician considered the child hyperactive, whose ratings equaled those earned by the HSP group. Using this method for defining BE children, one obtains another esti- mate of the prevalence of children evi- dencing hyperactive behaviors based on the number of children whose school behavior can be considered to be simi- lar to that of the HSP hyperactive chil- dren, a group of children that has not been labeled otherwise by a critical de- fining system.
Types of Prevalence Estimates
The above methods of assigning sub- jects to groups for prevalence estimates determined by defining systems yields nine different estimates of hyperactivity -HSP, HP, SP, HS, H, and S, plus all those identified by H, S, or P regardless of other concurring data. A tenth esti- mate of hyperactivity, one based solely on teacher ratings of children’s school behavior, provides some indication of the proportion of children in an ele- mentary school whose school behavior can be considered hyperactive but who are not otherwise considered hyperactive by defining systems.

456 PREVALENCE OF HYPERACTIVITY
Table 2 PREVALENCE RATES OF CHILDREN IDENTIFIED AS HYPERACTIVE BY IDENTIFYING AGENT
GRADE ~~~
DEFINING SYSTEM K
Home-School-Physician Home-Physician School-Physician Home-School Home only School only
Total by School Total by Home Total by Physician
Total by one or more definers Behavioral Equivalent not
otherwise defined Maximum prevalence
I .28% .26
.38
. I3 2.98 4.64 2.05 I .54 5.03
-
6.65 I 1.68
I 2
1.38% 1.17%
.I2 - - . I 3 - .I3
I .86 3.12 3.36 4.42 I .38 I .43 I .50 1.17 3.36 4.55
- -
8.3 I 8.17 11.67 12.72
3 4
.59% 1.49%
.I2 . I I
.36 -
.47 .23
4.90 3.56 6.32 5.28 1.18 I .83 I .07 I .60 6.44 5.39
- -
8.43 8.3 I 14.87 13.70
5 TOTAL
I.217'0 1.19% .09 .I0 - .08 .09 .2 I - .04
3.44 3.30 4.74 4.78 I .39 I .54 I .30 I .37 4.83 4.92
6.49 7.75 11.32 12.67
DATA COLLECTION AND ANALYSIS
Prevalence Estimates
Essentially the procedure for estimat- ing the prevalence of hyperactivity was to determine the proportion of children in each of the system-defined groups in the representative population of the same grade level. The denominator for thc prevalence estimate was the number of pupils in the grade levels kindergarten through fifth. Two school districts de- clined our request for data from teachers regarding the numbers of children per- ceived to be hyperactive because we had not made this additional task an ex- plicit requirement in our initial contact. The outcome of their decision was that we produced two different denominators for our prevalence estimates. When es- timates of the prevalence of hyperactiv- ity are based on the school as a defining system, the denominator for the esti- mates included only those classrooms on which we had all of the data. The estimates for hyperactivity defined by the school ( S ) as the definer, therefore,
used a smaller number of representative subjects than the estimates of hyperac- tive children otherwise defined.
RESULTS AND DISCUSSION We will begin the presentation of the
prevalence estimates with an examina- tion of defining systems, with rates broken down by grade level. Next we will set forth prevalence rates as a func- tion of socioeconomic status, sex, and ethnic status. Our strategy will be to pose hypotheses about variations in rates that occur in different sex, age, and social status groups, as well as by various defining systems.
Prevalence Rates as a Function of Definition
Many will be surprised by our finding that the overall prevalence rate of chil- dren identified as hyperactive by the home, the school, and the physician (HSP subjects) is only 1.19% of an elementary school population. TABLE 2 displays all the rates derived from our assignment of subjects on the basis of
LAMBERT, SANDOVAL AND SASSONE 457
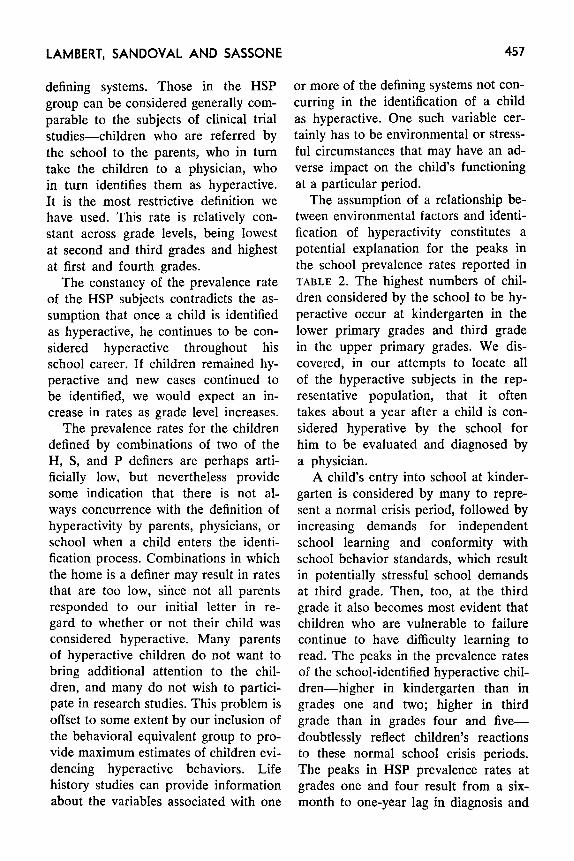
defining systems. Those in the HSP group can be considered generally com- parable to the subjects of clinical trial studies-children who are referred by the school to the parents, who in turn take the children to a physician, who in turn identifies them as hyperactive. I t is the most restrictive definition we have used. This rate is relatively con- stant across grade levels, being lowest at second and third grades and highest at first and fourth grades.
The constancy of the prevalence rate of the HSP subjects contradicts the as- sumption that once a child is identified as hyperactive, he continues to be con- sidered hyperactive throughout his school career. If children remained hy- peractive and new cases continued to be identified, we would expect an in- crease in rates as grade level increases.
The prevalence rates for the children defined by combinations of two of the H, S, and P definers are perhaps arti- ficially low, but nevertheless provide some indication that there is not al- ways concurrence with the definition of hyperactivity by parents, physicians, or school when a child enters the identi- fication process. Combinations in which the home is a definer may result in rates that are too low, since not all parents responded to our initial letter in re- gard to whether or not their child was considered hyperactive. Many parents of hyperactive children do not want to bring additional attention to the chil- dren, and many do not wish to partici- pate in research studies. This problem is offset to some extent by our inclusion of the behavioral equivalent group to pro- vide maximum estimates of children evi- dencing hyperactive behaviors. Life history studies can provide information about the variables associated with one
or more of the defining systems not con- curring in the identification of a child as hyperactive. One such variable cer- tainly has to be environmental or stress- ful circumstances that may have an ad- verse impact on the child’s functioning at a particular period.
The assumption of a relationship be- tween environmental factors and identi- fication of hyperactivity constitutes a potential explanation for the peaks in the school prevalence rates reported in TABLE 2. The highest numbers of chil- dren considered by the school to be hy- peractive occur at kindergarten in the lower primary grades and third grade in the upper primary grades. We dis- covered, in our attempts to locate all of the hyperactive subjects in the rep- resentative population, that it often takes about a year after a child is con- sidered hyperative by the school for him to be evaluated and diagnosed by a physician.
A child’s entry into school at kinder- garten is considered by many to repre- sent a normal crisis period, followed by increasing demands for independent school learning and conformity with school behavior standards, which result in potentially stressful school demands at third grade. Then, too, at the third grade it also becomes most evident that children who are vulnerable to failure continue to have difficulty learning to read. The peaks in the prevalence rates of the school-identified hyperactive chil- dren-higher in kindergarten than in grades one and two; higher in third grade than in grades four and five- doubtlessly reflect children’s reactions to these normal school crisis periods. The peaks in HSP prevalence rates at grades one and four result from a six- month to one-year lag in diagnosis and
458 PREVALENCE OF HYPERACTIVITY
treatment from the time of school iden- tification.
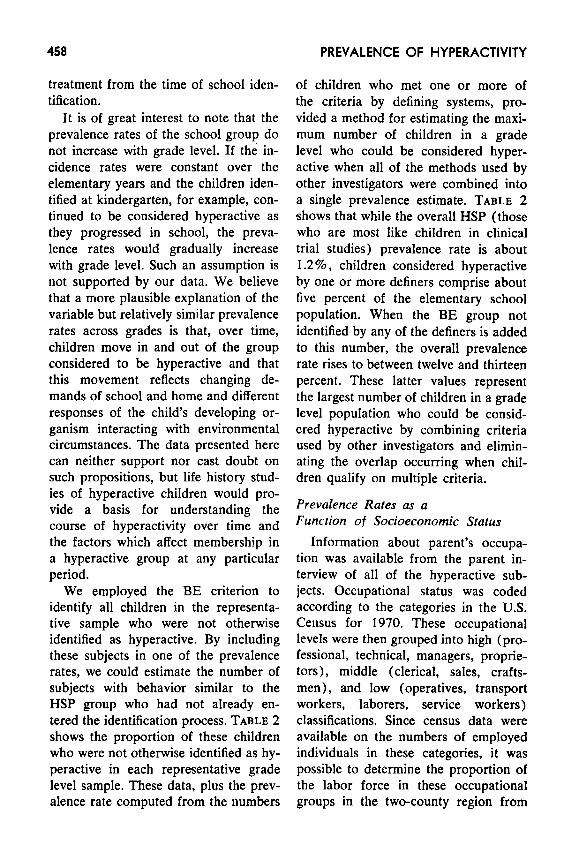
I t is of great interest to note that the prevalence rates of the school group do not increase with grade level. If the in- cidence rates were constant over the elementary years and the children iden- tified at kindergarten, for example, con- tinued to be considered hyperactive as they progressed in school, the preva- lence rates would gradually increase with grade level. Such an assumption is not supported by our data. We believe that a more plausible explanation of the variable but relatively similar prevalence rates across grades is that, over time, children move in and out of the group considered to be hyperactive and that this movement reflects changing de- mands of school and home and different responses of the child’s developing or- ganism interacting with environmental circumstances. The data presented here can neither support nor cast doubt on such propositions, but life history stud- ies of hyperactive children would pro- vide a basis for understanding the course of hyperactivity over time and the factors which affect membership in a hyperactive group at any particular period.
We employed the BE criterion to identify all children in the representa- tive sample who were not otherwise identified as hyperactive. By including these subjects in one of the prevalence rates, we could estimate the number of subjects with behavior similar to the HSP group who had not already en- tered the identification process. TABLE 2 shows the proportion of these children who were not otherwise identified as hy- peractive in each representative grade level sample. These data, plus the prev- alence rate computed from the numbers
of children who met one or more of the criteria by defining systems, pro- vided a method for estimating the maxi- mum number of children in a grade level who could be considered hyper- active when all of the methods used by other investigators were combined into a single prevalence estimate. TABLE 2 shows that while the overall HSP (those who are most like children in clinical trial studies) prevalence rate is about 1.2%, children considered hyperactive by one or more definers comprise about five percent of the elementary school population. When the BE group not identified by any of the definers is added to this number, the overall prevalence rate rises to between twelve and thirteen percent. These latter values represent the largest number of children in a grade level population who could be consid- wed hyperactive by combining criteria used by other investigators and elimin- ating the overlap occurring when chil- dren qualify on multiple criteria.
Prevalence Rates as a Function of Socioeconomic Status
Information about parent’s occupa- tion was available from the parent in- terview of all of the hyperactive sub- jects. Occupational status was coded according to the categories in the U.S. Census for 1970. These occupational levels were then grouped into high (pro- fessional, technical, managers, proprie- tors), middle (clerical, sales, crafts- men), and low (operatives, transport workers, laborers, service workers) classifications. Since census data were available on the numbers of employed individuals in these categories, it was possible to determine the proportion of the labor force in these occupational groups in the two-county region from

LAMBERT, SANDOVAL AND SASSONE 459
Table 3 PERCENT O F SUBJECTS IDENTIFIED AS HYPERACTIVE BY DEFIN ING SYSTEMS FROM
DIFFERENT S O C I O E C O N 0 M : C GROUPS
PREVALENCE RATES FOR OCCUPATIONAL LEVEL
DEFIN ING SYSTEMS
Home-School-Physician Home-Physician School-Physician Home-School Home Only School Only
Total by Home Total by School Total by Physician
tracts a t there occupational levels Proportion of adult population in census
HIGH
32.2570 20.00
18.18 IOO.00
17.64 3 I .25 26.60 29.58
30.83
-
MIDDLE
30.65% 40.00 75.00 36.36
41.18 31.25 35.10 33.80
45.67
-
L O W
37.10Y0 40.00 25.00 45.46
41.18 37.50 38.30 36.62
23.49
-
which the representative sample was drawn.
The distribution of occupations of parents of the identified hyperactive subjects is presented in TABLE 3. These data show that socioeconomic status of families of hyperactive chil- dren, as inferred from parents’ occupa- tional status, is similar to the distribu- tion in the counties. Some discrepancy will be noted in the proportions of mid- dle-class and lower-class occupational levels. There is a somewhat smaller pro- portion of middle-class families and a somewhat larger proportion of lower- class families than in the distribution of these occupations in the counties as a whole.
We can conclude from the data dis- played in TABLE 3 that the prevalence of hyperactive children by socioeco- nomic status is relative proportional to the distribution of socioeconomic status in the general population. Where there
are differences, the rates are somewhat higher than expected for lower socio- economic groups and lower than ex- pected for the children of middle-class families. These findings suggest, at the least, that medical services are available for children referred for school-related problems of all socioeconomic levels, and that hyperactive children are iden- tified at all socioeconomic levels of the population.
Prevalence Rates as a Function of Sex and Ethnic Status
In general, the prevalence rates for male and female hyperactive children show that boys are from six to eight times more frequently identified as hy- peractive than are girls. The prevalence estimates * parallel one another, with the exception that peak rates for girls occur at kindergarten. This may reflect an early appearance of hyperactive be- havior in girls which may not be as
-
* A breakdown of the prevalence rates by sex and by ethnic status is available from the authors.
460 PREVALENCE OF HYPERACTIVITY
much a function of school attendance as is the occurrence of such behaviors in boys. Such inferences need careful con- firmation in longitudinal studies; they are offered here to encourage other in- vestigators to learn more about the char- acteristics of girls who are defined as hyperactive and to study factors asso- ciated with the life period in which hy- peractivity in girls and boys is first recognized and treated. Battle and Lacey * also have presented provoca- tive data concerning the interrelations among age, sex, and behavior of over- active children.
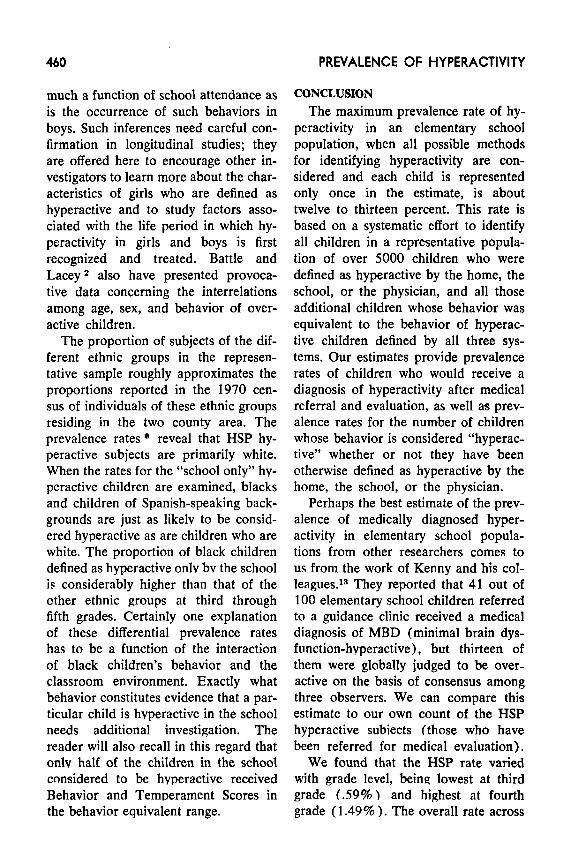
The proportion of subjects of the dif- ferent ethnic groups in the represen- tative sample roughly approximates the proportions reported in the 1970 cen- sus of individuals of these ethnic groups residing in the two county area. The prevalence rates * reveal that HSP hy- peractive subjects are primarily white. When the rates for the “school only” hy- peractive children are examined, blacks and children of Spanish-speaking back- grounds are just as likely to be consid- ered hyperactive as are children who are white. The proportion of black children defined as hyperactive only bv the school is considerably higher than that of the other ethnic groups at third through fifth grades. Certainly one explanation of these differential prevalence rates has to be a function of the interaction of black children’s behavior and the classroom environment. Exactly what behavior constitutes evidence that a par- ticular child is hyperactive in the school needs additional investigation. The reader will also recall in this regard that only half of the children in the school considered to be hyperactive received Behavior and Temperament Scores in the behavior equivalent range.
CONCLUSION The maximum prevalence rate of hy-
peractivity in an elementary school population, when all possible methods for identifying hyperactivity are con- sidered and each child is represented only once in the estimate, is about twelve to thirteen percent. This rate is based on a systematic effort to identify all children in a representative popula- tion of over 5000 children who were defined as hyperactive by the home, the school, or the physician, and all those additional children whose behavior was equivalent to the behavior of hyperac- tive children defined by all three sys- tems. Our estimates provide prevalence rates of children who would receive a diagnosis of hyperactivity after medical referral and evaluation, as well as prev- alence rates for the number of children whose behavior is considered “hyperac- tive” whether or not they have been otherwise defined as hyperactive by the home, the school, or the physician.
Perhaps the best estimate of the prev- alence of medically diagnosed hyper- activity in elementary school popula- tions from other researchers comes to us from the work of Kenny and his col- league~.’~ They reported that 41 out of 100 elementary school children referred to a guidance clinic received a medical diagnosis of MBD (minimal brain dys- function-hyperactive) , but thirteen of them were globally judged to be over- active on the basis of consensus among three observers. We can compare this estimate to our own count of the HSP hyperactive subiects (those who have been referred for medical evaluation).
We found that the HSP rate varied with grade level, beine lowest at third grade ( 5 9 % ) and highest at fourth grade ( 1.49% ). The overall rate across
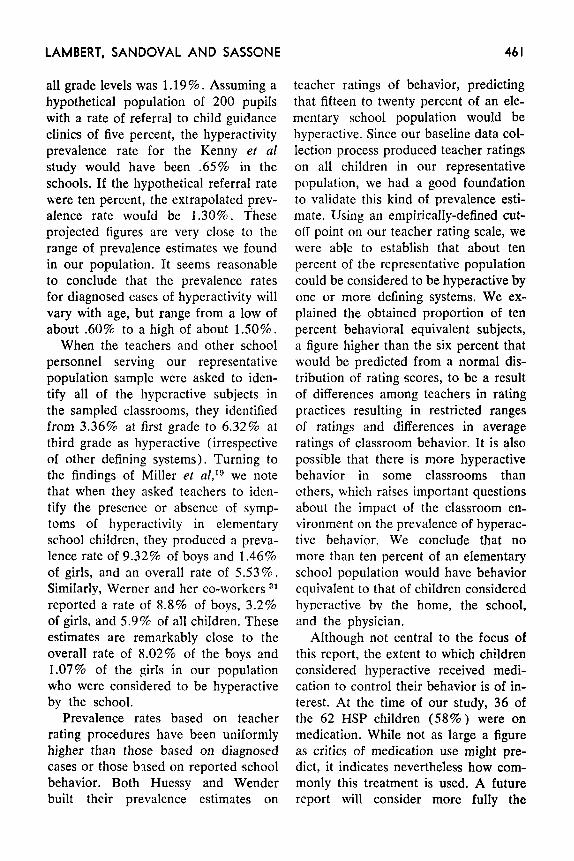
LAMBERT, SANDOVAL AND SASSONE 46 I
all grade levels was 1.19%. Assuming a hypothetical population of 200 pupils with a rate of referral to child guidance clinics of five percent, the hyperactivity prevalence rate for the Kenny et a1 study would have been .65% in the schools. If the hypothetical referral rate were ten percent, the extrapolated prev- alence rate would be 1.30%. These projected figures are very close to the range of prevalence estimates we found in our population. It seems reasonable to conclude that the prevalence rates for diagnosed cases of hyperactivity will vary with age, but range from a low of about .60% to a high of about 1.50%.
When the teachers and other school personnel serving our representative population sample were asked to iden- tify all of the hyperactive subjects in the sampled classrooms, they identified from 3.36% at first grade to 6.32% at third grade as hyperactive (irrespective of other defining systems). Turning to the findings of Miller et U Z , ' ~ we note that when they asked teachers to iden- tify the presence or absence of symp- toms of hyperactivity in elementary school children, they produced a preva- lence rate of 9.32% of boys and 1.46% of girls, and an overall rate of 5.53%. Similarly, Werner and her co-workers 31 reported a rate of 8.8% of boys, 3.2% of girls, and 5.9% of all children. These estimates are remarkably close to the overall rate of 8.02% of the boys and 1.07% of the girls in our population who were considered to be hyperactive by the school.
Prevalence rates based on teacher rating procedures have been uniformly higher than those based on diagnosed cases or those bnsed on reported school behavior. Both Huessy and Wender built their prevalence estimates on
teacher ratings of behavior, predicting that fifteen to twenty percent of an ele- mentary school population would be hyperactive. Since our baseline data col- lection process produced teacher ratings on all children in our representative population, we had a good foundation to validate this kind of prevalence esti- mate. Using an empirically-defined cut- off point on our teacher rating scale, we were able to establish that about ten percent of the representative population could be considered to be hyperactive by one or more defining systems. We ex- plained the obtained proportion of ten percent behavioral equivalent subjects, a figure higher than the six percent that would be predicted from a normal dis- tribution of rating scores, to be a result of differences among teachers in rating practices resulting in restricted ranges of ratings and differences in average ratings of classroom behavior. It is also possible that there is more hyperactive behavior in some classrooms than cthers, which raises important questions about the impact of the classroom en- vironment on the prevalence of hyperac- tive behavior. We conclude that no more than ten percent of an elementary school population would have behavior equivalent to that of children considered hyperactive bv the home, the school, and the physician.
Although not central to the focus of this report, the extent to which children considered hyperactive received medi- cation to control their behavior is of in- terest. At the time of our study, 36 of the 62 HSP children (58%) were on medication. While not as large a figure as critics of medication use might pre- dict, it indicates nevertheless how com- monly this treatment is used. A future report will consider more fully the
462 PREVALENCE OF HYPERACTIVITY
types of treatments recommended and used.
Our maximum prevalence rate of twelve to thirteen percent is somewhat higher than a rate based solely on be- havioral equivalent status. Some of the children who were in our prevalence rates and who were not behavior equiv- alents had low scores, possibly because they were taking medication at the time of the ratings. Other children who the school considered hyperactive did not receive scores high enough on the Be- havior and Temperament Survey to qualify as BE subjects. Only additional study of the psychometric properties of the ratings by classroom and of the be- haviors that are crucial to considering children hyperactive at school will pro- vide the needed answers.
The data we have presented do not support the belief that there are cur- rently more hyperactive children than there were in the past. Moreover, our data do not show that the prevalence rates increase with age; if there were an increasing rate we could conclude that there are more children identified each year and that the condition is on the rise. The prevalence rates for hyper- activity, regardless of the method of de- fining subjects as hyperactive, are rela- tively similar across the grade levels in an elementary school. We believe that differences in rates are to be explained as a function of the child's constitutional makeup interacting with changing home and school environmental demands.
Children, once they are identified as hyperactive, do not continue to be de- tined as hyperactive throughout the ele- mentary school years. The validity of the assumption of a dynamic interac- tion of the child with his environmental systems, and the possibility of specify-
ing the factors that influence favorable and unfavorable outcomes, can be eval- uated in longitudinal studies. Results could then be compared with the cross- sectional findings that have been pre- sented here, which summarize the preva- lence of hyperactivity as a function of social system definers.
REFERENCES 1. APA COMMITTEE ON NOMENCLATURE AND
STATISTICS. 1968. Diagnostic and Statisti- cal Manual of Mental Disorders (2nd ed). American Psychiatric Association, Wash- ington.
2. BATTLE, E. AND LACEY, B. 1972. A context for hyperactivity in children over time. Child Develpm. 43:757-773.
3 . s ~ ~ . M. 1972. The active and the over- active school child. Develpm. Med. Child Neurol. 14:83-86.
4. CONNERS, c. 1969. A teacher rating scale for use in drug studies with children. Amer. J. Psychiat. 126:884-888.
5 . CONRAD, P. 197.5. The discovery of hyper- kinesis: notes on the medicalization of de- viant behavior. SOC. Problems 23: 12-21.
6 . ~ ~ ~ 1 0 . 0. ET AL. 1976. Lead and hyper- activity-behavioral response to chelation: a pilot study. Arner. J. Psychiat. 133:
7. FEINGOLD, B. 1974. Why Your Child is Hyperactive. Random House, New York.
8. GLIDEWELL, J . 1968. Studies of mothers' reports of behavior symptoms in their children. I n The Definition and Measure- ment of Mental Health, s. Sells. ed. U. S. Public Health Srvice, National Center for Health Statistics, Government Printing Office, Washington, D.C.
9. HUESSY, H. 1967. Study of the prevalence and therapy of the coreatiform syndrome of hyperkinesis in rural Vermont. Acta Paedopsychiatrica 34 : 130-1 35.
10. HUESSY, H. 1974. Hyperkinetic problems continue to teens. Clin. Psychiat. News 2: 5.
11. HUESSY, H. AND GENDRON, R. Prevalence of the so-called hyperkinetic syndrome in public school children of Vermont. Acta Paedopsychiatrica 37:243-248.
12. HUESSY, H., MARSHALL, c . AND OENDRON, R. 1973. Five hundred children followed from 2nd-5th grade for the prevalence of behavior disorder. Acta Paedopsychiatrica
11.55-1158.
3 9 : 3 01-309.
LAMBERT, SANDOVAL AND SASSONE 463
13. KENNY, T. ET AL. 1971. Characteristics Of children referred because of hyperactivity. J. Pediat. 79:618-622.
I ~ . L A M B E R T , N. AND HARTSOUGH, c. 1973. Scaling behavioral attributes of children using multiple teacher judgments of pupil characteristics. Ed. Psychol. Meas. 33(4) : 859-873.
sted with the treatment of children with hyperactive-learning-behavior d i sorders . Report of the Pilot Investigation. (NIMH Grant # R01 MH 20765-01)
16. LAPOUSE, R. AND MONK, M. 1958. An epi- demiological study of behavior character- istics in children. Amer. J . Pub. Hlth 48: 1134-1 144.
17. MACFARLANE, J., ALLEN, L. AND HONZIK, M. 1954. A Developmental Study of the Be- havior Problems of Normal Children Be- tween Twenty-one Months and Fourteen Years. University of California Publica- tions in Child Development, vol. 2. Uni- versity of California Press, Berkeley.
18. MERCER, J. 1973. Labeling the Mentally Retarded: Clinical and Social System Per- spectives on Mental Retardation. Univer- sity of California Press, Berkeley.
1973. Hyperactive children in suburban elementary school. Child Psychiat. Hum. Develpm. 4 : 121-127.
psychiatric status of the legal families of adopted hyperactive children. Arch. Gen. Psychiat. 28 : 88 1-89 1 .
~ ~ . P R E C H T L , H. AND STEMMER, c. 1962. The coreiform syndrome in children. Dzvelpm. Med. Child Neurol. 4: 119-127.
22.ROBIN, S. AND BOSCO, J . 1976. The social context of stimulant drug treatment for
15. LAMBERT, N. ET AL. 1973. Factors aSSOCi-
19. MILLER, R., PALKES, H. AND STEWART, M.
20. MORRISON, J . AND STEWART, M. 1973. The
hyperkinetic children. School Rev. 85:
23. ROSEN, B., BAHN, A. AND KRAMER, M. 1964. D.emographic and diagnostic characteris- tics of psychiatric clinic outpatients in the U. S. A. Amer. J. Orthopsychiat. 34:455- 467.
atric disorder in 10 and 1 1 year old chil- dren. Proceedings Royal SOC. Med. 59:
141-1 55.
2 4 . R U m E R , M. AND GRAHAM, P. 1965. Psychi-
3 82-387. 25. SANDOVAL, J., LAMBERT, N. AND YANDELL,
G. 1976. Current medical practice and hy- peractive children. Amer. J. Orthopsy- chiat. 46: 323-334.
26. SCHRAG, P. AND DIVOKY, D. 1975. The Myth of the Hyperactive Child and Other Means of Child Control. Pantheon, New York.
s. 1966. Childhood behavior disorders and the child guidance clinic: an epidemiologi- cal study. J. Psychol. Psychiat. 7:39-52.
28. STEWART, M. ET AL. 1966. The hyperactive child syndrome. Amer. J. Orthopsychiat.
27. SHEPARD, M., OPPENHEIM, A. AND MITCHELL,
36: 861-867. 29. TUDDENHAM, R., BROOKS, J. AND MILKOVICH,
L. 1974. Mothers’ reports of behavior of ten year olds: relationships with sex, eth- nicity, and mothers’ education. Develop .
30. WENDER, P. 1971. Minimal Brain Dys- function in Children. John Wiley, New York.
environmental casualties: a report on the ten year follow-up of the children of the Kauai Pregnancy Study. Pediatrics 42:
Psychol. 10:959-995.
31. WERNER, E. ET AL. 1968. Reproductive and
112-127. 32. WERRY, J . AND QUAY, H. 1971. The preva-
lence of bzhavior symptoms in younger elementary school children. Amer. J. Orthopsychiat. 41: 136-143.
For reprints: Dr. Nadine M. Lambert, School of Education, University of California, Berkeley, Calif. 94720