Prevalence of Diabetes among Men and Women in China
12
original article The new england journal of medicine n engl j med 362;12 nejm.org march 25, 2010 1090 Prevalence of Diabetes among Men and Women in China Wenying Yang, M.D., Juming Lu, M.D., Jianping Weng, M.D., Weiping Jia, M.D., Linong Ji, M.D., Jianzhong Xiao, M.D., Ph.D., Zhongyan Shan, M.D., Jie Liu, M.D., Haoming Tian, M.D., Qiuhe Ji, M.D., Dalong Zhu, M.D., Jiapu Ge, M.D., Lixiang Lin, M.D., Li Chen, M.D., Xiaohui Guo, M.D., Zhigang Zhao, M.D., Qiang Li, M.D., Zhiguang Zhou, M.D., Guangliang Shan, M.D., Ph.D., and Jiang He, M.D., Ph.D., for the China National Diabetes and Metabolic Disorders Study Group* From China–Japan Friendship Hospital, Beijing (W.Y., J.X.); Chinese People’s Lib- eration Army General Hospital, Beijing (J. Lu); Sun Yat-sen University Third Hos- pital, Guangzhou (J.W.); Shanghai Jiao- tong University Affiliated Sixth People’s Hospital, Shanghai (W.J.); Peking Univer- sity People’s Hospital, Beijing (L.J.); First Affiliated Hospital, Chinese Medical Uni- versity, Liaoling (Z.S.); Shanxi Province People’s Hospital, Taiyuan, Shaanxi (J. Liu); West China Hospital, Sichuan University, Chengdu, Sichuan (H.T.); Xijing Hospital, Fourth Military Medical University, Xi’an, Shaanxi (Q.J.); Affiliated Drum Tower Hospital of Nanjing University Medical School, Nanjing, Jiangsu (D.Z.); Xinjiang Uygur Autonomous Region’s Hospital, Urmqi, Xinjiang (J.G.); Fujian Provincial Hospital, Fuzhou, Fujiang (L.L.); Qilu Hos- pital, Qilu Hospital of Shandong Univer- sity, Jinan, Shandong (L.C.); Peking Uni- versity First Hospital, Beijing (X.G.); Henan Province People’s Hospital, Zhengzhou, Henan (Z. Zhao); Second Affiliated Hospi- tal of Harbin Medical University, Harbin, Heilongjiang (Q.L.); Xiangya Second Hos- pital, Changsha, Hunan (Z. Zhou); and Pe- king Union Medical College, Beijing (G.S.) — all in China; and Tulane University School of Public Health and Tropical Medi- cine, New Orleans (J.H.). Address reprint requests to Dr. Yang at the Department of Endocrinology, China–Japan Friendship Hospital, Beijing 100029, China, or at [email protected]. *The members of the China National Diabetes and Metabolic Disorders Study group are listed in the Supplementary Appendix, available with the full text of this article at NEJM.org. N Engl J Med 2010;362:1090-101. Copyright © 2010 Massachusetts Medical Society. ABSTRACT BACKGROUND Because of the rapid change in lifestyle in China, there is concern that diabetes may become epidemic. We conducted a national study from June 2007 through May 2008 to estimate the prevalence of diabetes among Chinese adults. METHODS A nationally representative sample of 46,239 adults, 20 years of age or older, from 14 provinces and municipalities participated in the study. After an overnight fast, participants underwent an oral glucose-tolerance test, and fasting and 2-hour glu- cose levels were measured to identify undiagnosed diabetes and prediabetes (i.e., impaired fasting glucose or impaired glucose tolerance). Previously diagnosed dia- betes was determined on the basis of self-report. RESULTS The age-standardized prevalences of total diabetes (which included both previously diagnosed diabetes and previously undiagnosed diabetes) and prediabetes were 9.7% (10.6% among men and 8.8% among women) and 15.5% (16.1% among men and 14.9% among women), respectively, accounting for 92.4 million adults with diabe- tes (50.2 million men and 42.2 million women) and 148.2 million adults with pre- diabetes (76.1 million men and 72.1 million women). The prevalence of diabetes in- creased with increasing age (3.2%, 11.5%, and 20.4% among persons who were 20 to 39, 40 to 59, and ≥60 years of age, respectively) and with increasing weight (4.5%, 7.6%, 12.8%, and 18.5% among persons with a body-mass index [the weight in ki- lograms divided by the square of the height in meters] of <18.5, 18.5 to 24.9, 25.0 to 29.9, and ≥30.0, respectively). The prevalence of diabetes was higher among urban residents than among rural residents (11.4% vs. 8.2%). The prevalence of isolated impaired glucose tolerance was higher than that of isolated impaired fasting glu- cose (11.0% vs. 3.2% among men and 10.9% vs. 2.2% among women). CONCLUSIONS These results indicate that diabetes has become a major public health problem in China and that strategies aimed at the prevention and treatment of diabetes are needed. The New England Journal of Medicine Downloaded from nejm.org at OKLAHOMA UNIVERSITY BIRD LIB on August 19, 2011. For personal use only. No other uses without permission. Copyright © 2010 Massachusetts Medical Society. All rights reserved.
Transcript of Prevalence of Diabetes among Men and Women in China
original article
T h e n e w e ngl a nd j o u r na l o f m e dic i n e
n engl j med 362;12 nejm.org march 25, 20101090
Prevalence of Diabetes among Men and Women in China
Wenying Yang, M.D., Juming Lu, M.D., Jianping Weng, M.D., Weiping Jia, M.D., Linong Ji, M.D., Jianzhong Xiao, M.D., Ph.D., Zhongyan Shan, M.D.,
Jie Liu, M.D., Haoming Tian, M.D., Qiuhe Ji, M.D., Dalong Zhu, M.D., Jiapu Ge, M.D., Lixiang Lin, M.D., Li Chen, M.D., Xiaohui Guo, M.D.,
Zhigang Zhao, M.D., Qiang Li, M.D., Zhiguang Zhou, M.D., Guangliang Shan, M.D., Ph.D., and Jiang He, M.D., Ph.D.,
for the China National Diabetes and Metabolic Disorders Study Group*
From China–Japan Friendship Hospital, Beijing (W.Y., J.X.); Chinese People’s Lib-eration Army General Hospital, Beijing (J. Lu); Sun Yat-sen University Third Hos-pital, Guangzhou (J.W.); Shanghai Jiao-tong University Affiliated Sixth People’s Hospital, Shanghai (W.J.); Peking Univer-sity People’s Hospital, Beijing (L.J.); First Affiliated Hospital, Chinese Medical Uni-versity, Liaoling (Z.S.); Shanxi Province People’s Hospital, Taiyuan, Shaanxi (J. Liu); West China Hospital, Sichuan University, Chengdu, Sichuan (H.T.); Xijing Hospital, Fourth Military Medical University, Xi’an, Shaanxi (Q.J.); Affiliated Drum Tower Hospital of Nanjing University Medical School, Nanjing, Jiangsu (D.Z.); Xinjiang Uygur Autonomous Region’s Hospital, Urmqi, Xinjiang (J.G.); Fujian Provincial Hospital, Fuzhou, Fujiang (L.L.); Qilu Hos-pital, Qilu Hospital of Shandong Univer-sity, Jinan, Shandong (L.C.); Peking Uni-versity First Hospital, Beijing (X.G.); Henan Province People’s Hospital, Zhengzhou, Henan (Z. Zhao); Second Affiliated Hospi-tal of Harbin Medical University, Harbin, Heilongjiang (Q.L.); Xiangya Second Hos-pital, Changsha, Hunan (Z. Zhou); and Pe-king Union Medical College, Beijing (G.S.) — all in China; and Tulane University School of Public Health and Tropical Medi-cine, New Orleans (J.H.). Address reprint requests to Dr. Yang at the Department of Endocrinology, China–Japan Friendship Hospital, Beijing 100029, China, or at [email protected].
*The members of the China National Diabetes and Metabolic Disorders Study group are listed in the Supplementary Appendix, available with the full text of this article at NEJM.org.
N Engl J Med 2010;362:1090-101.Copyright © 2010 Massachusetts Medical Society.
A BS TR AC T
BACKGROUND
Because of the rapid change in lifestyle in China, there is concern that diabetes may become epidemic. We conducted a national study from June 2007 through May 2008 to estimate the prevalence of diabetes among Chinese adults.
METHODS
A nationally representative sample of 46,239 adults, 20 years of age or older, from 14 provinces and municipalities participated in the study. After an overnight fast, participants underwent an oral glucose-tolerance test, and fasting and 2-hour glu-cose levels were measured to identify undiagnosed diabetes and prediabetes (i.e., impaired fasting glucose or impaired glucose tolerance). Previously diagnosed dia-betes was determined on the basis of self-report.
RESULTS
The age-standardized prevalences of total diabetes (which included both previously diagnosed diabetes and previously undiagnosed diabetes) and prediabetes were 9.7% (10.6% among men and 8.8% among women) and 15.5% (16.1% among men and 14.9% among women), respectively, accounting for 92.4 million adults with diabe-tes (50.2 million men and 42.2 million women) and 148.2 million adults with pre-diabetes (76.1 million men and 72.1 million women). The prevalence of diabetes in-creased with increasing age (3.2%, 11.5%, and 20.4% among persons who were 20 to 39, 40 to 59, and ≥60 years of age, respectively) and with increasing weight (4.5%, 7.6%, 12.8%, and 18.5% among persons with a body-mass index [the weight in ki-lograms divided by the square of the height in meters] of <18.5, 18.5 to 24.9, 25.0 to 29.9, and ≥30.0, respectively). The prevalence of diabetes was higher among urban residents than among rural residents (11.4% vs. 8.2%). The prevalence of isolated impaired glucose tolerance was higher than that of isolated impaired fasting glu-cose (11.0% vs. 3.2% among men and 10.9% vs. 2.2% among women).
CONCLUSIONS
These results indicate that diabetes has become a major public health problem in China and that strategies aimed at the prevention and treatment of diabetes are needed.
The New England Journal of Medicine Downloaded from nejm.org at OKLAHOMA UNIVERSITY BIRD LIB on August 19, 2011. For personal use only. No other uses without permission.
Copyright © 2010 Massachusetts Medical Society. All rights reserved.
Diabetes in China
n engl j med 362;12 nejm.org march 25, 2010 1091
Cardiovascular disease has become the leading cause of death in China, a de-velopment that has followed rapid eco-
nomic growth, an increase in life expectancy, and changes in lifestyle.1 Diabetes is a major risk fac-tor for cardiovascular disease, and the prevalence of diabetes is high and is increasing in China.2-4 A national survey conducted in 1994, involving 224,251 Chinese residents, 25 to 64 years of age, from 19 provinces, showed that the prevalences of diabetes and impaired glucose tolerance were 2.5% and 3.2%, respectively.2 These estimates were higher by a factor of approximately 3 than those reported in 1980.3 In a cross-sectional study in 2000–2001 involving a nationally representative sample of 15,540 adults, 35 to 74 years of age, the prevalences of diabetes and impaired fasting glu-cose were 5.5% and 7.3%, respectively.4 Although these studies have documented a marked increase in the prevalence of diabetes in China, they can-not be compared directly, owing to methodologic differences in sampling and to differences in the criteria used to define diabetes.2-4 Furthermore, the prevalences of diabetes and prediabetes were probably underestimated in these studies because 2-hour oral glucose-tolerance tests were not per-formed in all participants. It has been suggested that isolated hyperglycemia 2 hours after glucose loading is common among Asian patients with diabetes.5 For example, in the Shanghai Diabetes Study, 48.6% of patients with newly diagnosed diabetes had isolated hyperglycemia 2 hours af-ter glucose loading, and 75.0% of those with pre-diabetes had isolated impaired glucose tolerance.6
The China National Diabetes and Metabolic Disorders Study, conducted from June 2007 through May 2008, was a cross-sectional study designed to provide current and reliable data on the preva-lences of diabetes and associated metabolic risk factors in the adult population in China.
Me thods
Study Participants
We used a multistage, stratified sampling meth-od to select a nationally representative sample of persons 20 years of age or older in the general population. The sampling process was stratified according to geographic region (northeast, north, east, south central, northwest, and southwest China), degree of urbanization (large cities [Bei-jing, Shanghai, and provincial capitals], midsize cities, county seats, and rural townships), and eco-
nomic development status (as assessed on the basis of the gross domestic product [GDP] for each province). The first two stages of sampling, in which provinces were selected from geographic regions and cities and counties were selected from provinces, were not random. In the next two stag-es (the stage in which city districts were selected from cities and rural townships from counties and the stage in which street districts were selected from city districts and rural villages from town-ships), the sampling was random (see Fig. 1 in the Supplementary Appendix, available with the full text of this article at NEJM.org). This multi-stage, stratified sampling process resulted in an oversampling of urban residents. In total, 152 ur-ban street districts and 112 rural villages were selected. In the final stage of sampling, the sam-ple was stratified according to the sex and age dis-tribution in China, on the basis of Chinese popu-lation data from 2006.7 Only persons who had lived in their current residence for 5 years or lon-ger were eligible to participate.
A total of 54,240 people were selected and in-vited to participate in the study; 47,325 persons (18,976 men and 28,349 women) completed the study. The overall response rate was 87.3%: 81.0% for men and 92.0% for women; 88.1% of those who lived in urban areas and 82.7% of those who lived in rural areas responded. After the exclusion of 538 persons for whom demographic informa-tion was missing and 548 for whom data on fast-ing or 2-hour plasma glucose levels were missing, 46,239 adults were included in the final analysis.
The institutional review board or ethics com-mittee at each participating institution approved the study protocol. Written informed consent was obtained from each participant before data col-lection.
Data Collection
A standard questionnaire was administered by trained staff to obtain information on demograph-ic characteristics, personal and family medical history, and lifestyle risk factors.8 The interview included questions related to the diagnosis and treatment of diabetes, hypertension, dyslipidemia, and cardiovascular events. Cigarette smoking was defined as having smoked at least 100 cigarettes in one’s lifetime. Information was obtained on the amount and type of alcohol that was consumed during the previous year, and alcohol drinking was defined as the consumption of at least 30 g of alcohol per week for 1 year or more. Regular lei-
The New England Journal of Medicine Downloaded from nejm.org at OKLAHOMA UNIVERSITY BIRD LIB on August 19, 2011. For personal use only. No other uses without permission.
Copyright © 2010 Massachusetts Medical Society. All rights reserved.

T h e n e w e ngl a nd j o u r na l o f m e dic i n e
n engl j med 362;12 nejm.org march 25, 20101092
Tabl
e 1.
Cha
ract
eris
tics
of S
tudy
Par
ticip
ants
Acc
ordi
ng to
Pla
sma
Glu
cose
Cat
egor
ies
and
Sex.
*
Cha
ract
eris
ticN
orm
al G
luco
se
Tole
ranc
eIs
olat
ed I
mpa
ired
Fa
stin
g G
luco
seIs
olat
ed I
mpa
ired
G
luco
se T
oler
ance
Com
bine
d Im
pair
ed
Fast
ing
Glu
cose
and
Im
pair
ed G
luco
se
Tole
ranc
ePr
evio
usly
U
ndia
gnos
ed D
iabe
tes
Prev
ious
ly
Dia
gnos
ed D
iabe
tes
Men
(N
= 1
8,41
9)
Part
icip
ants
— n
o. (
%)
13,4
26 (
73.3
)68
6 (3
.2)
1691
(11
.0)
395
(1.9
)13
27 (
6.5)
894
(4.1
)
Mea
n fa
stin
g pl
asm
a gl
ucos
e (9
5% C
I) —
mg/
dl
87.3
(87
.0–8
7.7)
114.
9 (1
14.4
–115
.5)
93.1
(92
.3–9
3.9)
116.
2 (1
15.5
–117
.0)
135.
7 (1
32.0
–139
.4)
158.
6 (1
51.8
–165
.4)
Mea
n 2-
hr p
lasm
a gl
ucos
e in
ora
l glu
cose
-tol
eran
ce
test
(95
% C
I) —
mg/
dl†
99.1
(98
.4–9
9.7)
110.
6 (1
07.9
–113
.3)
160.
9 (1
59.7
–162
.1)
164.
6 (1
61.8
–167
.4)
243.
5 (2
36.4
–250
.7)
265.
9 (2
52.8
–278
.9)
Mea
n ag
e (9
5% C
I) —
yr
42.5
(42
.1–4
3.0)
48.5
(46
.4–5
0.6)
50.2
(49
.0–5
1.5)
50.2
(47
.8–5
2.6)
52.1
(50
.8–5
3.4)
55.8
(54
.2–5
7.4)
Fam
ily h
isto
ry o
f dia
bete
s (9
5% C
I) —
%
12.9
(11
.8–1
4.1)
12.8
(9.
3–17
.3)
14.6
(12
.0–1
7.6)
23.5
(17
.3–3
1.0)
23.3
(19
.1–2
8.1)
42.6
(36
.6–4
8.9)
Col
lege
or
high
er le
vel o
f edu
catio
n (9
5% C
I) —
%
25.3
(24
.1–2
6.5)
19.2
(14
.7–2
4.8)
18.7
(16
.1–2
1.6)
22.6
(17
.3–2
8.9)
16.8
(14
.2–1
9.7)
16.4
(13
.0–2
0.5)
Cig
aret
te s
mok
ing
(95%
CI)
— %
‡57
.5 (
56.2
–59.
1)56
.8 (
50.2
–63.
1)58
.6 (
54.6
–62.
5)60
.1 (
52.2
–67.
5)59
.4 (
54.9
–63.
8)50
.5 (
44.6
–56.
3)
Con
sum
ptio
n of
alc
ohol
(95
% C
I) —
%§
44.3
(42
.8–4
5.7)
41.7
(35
.6–4
8.2)
39.5
(35
.7–4
3.3)
51.6
(43
.6–5
9.4)
40.5
(36
.3–4
4.8)
35.2
(29
.9–4
0.8)
Reg
ular
leis
ure-
time
phys
ical
act
ivity
(95
% C
I) —
%¶
33.3
(32
.0–3
4.7)
31.6
(25
.5–3
8.4)
36.2
(32
.5–4
0.0)
39.2
(31
.6–4
7.4)
30.3
(26
.5–3
4.3)
49.7
(43
.9–5
5.5)
Mea
n bo
dy-m
ass
inde
x (9
5% C
I)‖
23.6
(23
.5–2
3.7)
24.5
(24
.1–2
5.0)
24.8
(24
.5–2
5.2)
26.6
(26
.0–2
7.2)
25.8
(25
.4–2
6.3)
25.2
(24
.9–2
5.6)
Mea
n w
aist
cir
cum
fere
nce
(95%
CI)
— c
m
82.1
(81
.8–8
2.4)
86.7
(85
.0–8
8.3)
85.5
(84
.5–8
6.5)
90.7
(89
.2–9
2.1)
89.1
(88
.1–9
0.0)
88.7
(87
.7–8
9.7)
Mea
n sy
stol
ic b
lood
pre
ssur
e (9
5% C
I) —
mm
Hg
121.
0 (1
20.5
–121
.5)
127.
4 (1
24.8
–130
.0)
129.
2 (1
27.2
–131
.1)
132.
1 (1
29.3
–135
.0)
133.
2 (1
31.4
–134
.9)
132.
0 (1
29.6
–134
.3)
Mea
n he
art r
ate
(95%
CI)
— b
eats
/min
72
.4 (
72.1
–72.
8)73
.4 (
72.1
–74.
6)74
.2 (
73.3
–75.
1)75
.1 (
73.2
–77.
1)76
.4 (
75.4
–77.
5)76
.6 (
75.2
–78.
0)
Mea
n H
DL
chol
este
rol (
95%
CI)
— m
g/dl
48
.5 (
48.1
–48.
9)47
.1 (
45.3
–49.
0)48
.9 (
47.9
–49.
9)45
.6 (
44.0
–47.
3)48
.1 (
46.9
–49.
3)44
.5 (
42.9
–46.
0)
Mea
n LD
L ch
oles
tero
l (95
% C
I) —
mg/
dl
101.
2 (1
00.2
–102
.3)
108.
5 (1
03.2
–113
.7)
108.
5 (1
05.2
–111
.9)
112.
5 (1
06.4
–118
.6)
112.
1 (1
08.3
–115
.8)
109.
7 (1
05.3
–114
.0)
Mea
n tr
igly
ceri
des
(95%
CI)
— m
g/dl
14
1.7
(138
.6–1
44.7
)17
6.5
(160
.9–1
92.2
)16
9.5
(160
.8–1
78.1
)20
4.3
(180
.9–2
27.7
)19
8.6
(186
.0–2
11.3
)17
2.4
(159
.0–1
85.7
)
Wom
en (
N =
27,
820)
Part
icip
ants
— n
o. (
%)
20,8
67 (
76.4
)78
3 (2
.2)
2880
(10
.9)
562
(1.7
)15
81 (
5.2)
1147
(3.
5)
Mea
n fa
stin
g pl
asm
a gl
ucos
e (9
5% C
I) —
mg/
dl
86.9
(86
.6–8
7.2)
114.
7 (1
14.2
–115
.2)
93.7
(93
.0–9
4.4)
115.
5 (1
14.7
–116
.4)
135.
3 (1
31.2
–139
.4)
165.
2 (1
47.1
–183
.3)
Mea
n 2-
hr p
lasm
a gl
ucos
e in
ora
l glu
cose
-tol
eran
ce
test
(95
% C
I) —
mg/
dl†
102.
1 (1
01.5
–102
.6)
111.
6 (1
09.4
–113
.7)
159.
6 (1
58.5
–160
.6)
165.
8 (1
63.7
–167
.9)
259.
2 (2
50.9
–267
.6)
285.
8 (2
63.5
–308
.1)
Mea
n ag
e (9
5% C
I) —
yr
42.1
(41
.6–4
2.5)
46.6
(44
.8–4
8.4)
51.9
(50
.5–5
3.4)
53.9
(51
.8–5
6.0)
54.8
(53
.4–5
6.2)
59.3
(57
.9–6
0.8)
Fam
ily h
isto
ry o
f dia
bete
s (9
5% C
I) —
%
13.9
(13
.0–1
4.8)
12.2
(9.
2–16
.1)
17.5
(13
.4–2
2.7)
15.3
(10
.5–2
1.8)
23.4
(19
.0–2
8.6)
44.3
(36
.3–5
2.6)
Col
lege
or
high
er le
vel o
f edu
catio
n (9
5% C
I) —
%
20.3
(19
.4–2
1.3)
11.1
(8.
4–14
.5)
9.6
(7.7
–12.
0)11
.0 (
8.0–
14.8
)6.
3 (5
.0–7
.9)
4.6
(3.4
–6.3
)
Cig
aret
te s
mok
ing
(95%
CI)
— %
‡3.
0 (2
.7–3
.5)
2.3
(1.3
–4.0
)4.
4 (3
.1–6
.2)
3.7
(1.6
–8.7
)4.
6 (2
.9–7
.2)
4.2
(2.4
–7.3
)
Con
sum
ptio
n of
alc
ohol
(95
% C
I) —
%§
4.1
(3.7
–4.6
)4.
3 (2
.4–7
.4)
3.8
(2.7
–5.4
)4.
0 (2
.2–6
.9)
4.7
(3.0
–7.2
)3.
4 (1
.9–6
.0)
Reg
ular
leis
ure-
time
phys
ical
act
ivity
(95
% C
I) —
%¶
30.9
(29
.8–3
2.0)
22.9
(18
.1–2
8.6)
34.6
(30
.0–3
9.6)
30.9
(24
.9–3
7.6)
35.5
(31
.2–4
0.1)
49.2
(42
.7–5
5.7)
Mea
n bo
dy-m
ass
inde
x (9
5% C
I)‖
22.9
(22
.8–2
3.0)
24.2
(23
.8–2
4.7)
25.8
(25
.2–2
6.4)
25.9
(25
.5–2
6.3)
24.8
(24
.5–2
5.1)
24.6
(24
.2–2
5.1)
Mea
n w
aist
cir
cum
fere
nce
(95%
CI)
— c
m
76.3
(76
.0–7
6.6)
80.8
(79
.5–8
2.1)
82.0
(81
.2–8
2.8)
86.3
(84
.5–8
8.0)
85.6
(84
.8–8
6.4)
84.4
(83
.3–8
5.4)
Mea
n sy
stol
ic b
lood
pre
ssur
e (9
5% C
I) —
mm
Hg
116.
4 (1
15.9
–117
.0)
123.
6 (1
20.7
–126
.4)
128.
6 (1
27.0
–130
.2)
134.
2 (1
31.6
–136
.9)
134.
9 (1
32.9
–137
.0)
136.
1 (1
33.5
–138
.8)
The New England Journal of Medicine Downloaded from nejm.org at OKLAHOMA UNIVERSITY BIRD LIB on August 19, 2011. For personal use only. No other uses without permission.
Copyright © 2010 Massachusetts Medical Society. All rights reserved.

Diabetes in China
n engl j med 362;12 nejm.org march 25, 2010 1093
sure-time physical activity was defined as par-ticipation in moderate or vigorous activity for 30 minutes or more per day at least 3 days a week. Socioeconomic status, educational level, occupa-tion, and income were also recorded. The econom-ic development of provinces or municipalities was defined on the basis of the GDP per capita in 2006. Blood pressure, body weight, height, and waist circumference were measured with the use of standard methods, as described previously.2
All study investigators and staff members suc-cessfully completed a training program that fa-miliarized them with both the aims of the study and the specific tools and methods used. At the training sessions, interviewers were given detailed instructions concerning the administration of the study questionnaire. Clinical staff members were trained to measure blood pressure and obtain anthropometric measurements and blood speci-mens according to a standard protocol.8
Oral Glucose-Tolerance Test
Participants were instructed to maintain their usual physical activity and diet for at least 3 days before the oral glucose-tolerance test. After at least 10 hours of overnight fasting, a venous blood speci-men was collected in a vacuum tube containing sodium fluoride, for the measurement of plasma glucose. Participants with no history of diabetes were given a standard 75-g glucose solution, where-as for safety reasons, participants with a self-reported history of diabetes were given a steamed bun that contained approximately 80 g of com-plex carbohydrates. Blood samples were drawn at 0, 30, and 120 minutes after the glucose or car-bohydrate load to measure glucose concentrations. Plasma glucose was measured with the use of a hexokinase enzymatic method, and serum cho-lesterol and triglyceride levels were assessed en-zymatically with the use of commercially avail-able reagents, at the clinical biochemical labora-tories in each province. All the study laboratories successfully completed a standardization and cer-tification program.
Study-outcome Definitions
The 1999 World Health Organization diagnostic criteria were used to diagnose diabetes.9 Results of plasma glucose testing were categorized as fol-lows: isolated impaired fasting glucose (fasting glucose level, ≥110 mg per deciliter [6.1 mmol per liter] and <126 mg per deciliter [7.0 mmol per liter), M
ean
hear
t rat
e (9
5% C
I) —
bea
ts/m
in74
.3 (
74.0
–74.
6)74
.7 (
73.6
–75.
8)76
.5 (
75.6
–77.
4)78
.5 (
76.6
–80.
4)78
.0 (
77.2
–78.
9)77
.2 (
76.2
–78.
3)
Mea
n H
DL
chol
este
rol (
95%
CI)
— m
g/dl
52
.4 (
52.0
–52.
7)51
.4 (
50.0
–52.
9)52
.0 (
51.2
–52.
8)50
.6 (
48.3
–52.
9)51
.4 (
50.4
–52.
3)51
.4 (
48.9
–53.
8)
Mea
n LD
L ch
oles
tero
l (95
% C
I) —
mg/
dl
99.8
(98
.7–1
00.8
)11
3.0
(108
.2–1
17.9
)11
2.0
(108
.6–1
15.4
)11
7.4
(111
.3–1
23.5
)11
3.8
(110
.5–1
17.1
)11
5.8
(110
.5–1
21.1
)
Mea
n tr
igly
ceri
des
(95%
CI)
— m
g/dl
11
3.6
(111
.9–1
15.4
)14
0.9
(130
.4–1
51.5
)15
4.6
(147
.6–1
61.6
)16
6.2
(155
.7–1
76.7
)17
2.9
(165
.1–1
80.6
)17
4.6
(158
.6–1
90.6
)
* A
ll da
ta, i
nclu
ding
per
cent
ages
and
mea
n va
lues
, wer
e w
eigh
ted
to r
epre
sent
the
tot
al p
opul
atio
n of
Chi
nese
adu
lts (
20 y
ears
of a
ge o
r ol
der)
on
the
basi
s of
Chi
nese
pop
ulat
ion
data
fr
om 2
006.
Pla
sma
gluc
ose
leve
l was
cat
egor
ized
as
follo
ws:
nor
mal
glu
cose
tol
eran
ce (
fast
ing
plas
ma
gluc
ose,
<11
0 m
g pe
r de
cilit
er, a
nd 2
-hou
r pl
asm
a gl
ucos
e in
a g
luco
se-t
oler
ance
te
st, <
140
mg
per
deci
liter
); is
olat
ed im
pair
ed fa
stin
g gl
ucos
e (f
astin
g gl
ucos
e, ≥
110
and
<126
mg
per
deci
liter
, and
2-h
our
plas
ma
gluc
ose
in a
glu
cose
-tol
eran
ce t
est,
<140
mg
per
deci
liter
); is
olat
ed im
pair
ed g
luco
se t
oler
ance
(fa
stin
g gl
ucos
e, <
110
mg
per
deci
liter
, and
2-h
our
plas
ma
gluc
ose
in a
glu
cose
-tol
eran
ce t
est,
≥140
mg
and
<200
mg
per
deci
liter
); c
om-
bine
d im
pair
ed fa
stin
g gl
ucos
e an
d im
pair
ed g
luco
se t
oler
ance
(fa
stin
g gl
ucos
e, ≥
110
and
<126
mg
per
deci
liter
, and
2-h
our
plas
ma
gluc
ose
in a
glu
cose
-tol
eran
ce t
est,
≥140
and
<20
0 m
g pe
r de
cilit
er);
and
und
iagn
osed
dia
bete
s (f
astin
g gl
ucos
e, ≥
126
mg
per
deci
liter
, 2-h
our
plas
ma
gluc
ose
in a
glu
cose
-tol
eran
ce t
est,
≥200
mg
per
deci
liter
, or
both
). T
o co
nver
t th
e va
lues
for
gluc
ose
to m
illim
oles
per
lite
r, m
ultip
ly b
y 0.
0555
1. T
o co
nver
t th
e va
lues
for
chol
este
rol t
o m
illim
oles
per
lite
r, m
ultip
ly b
y 0.
0258
6. T
o co
nver
t th
e va
lues
for
trig
lyce
ride
s to
m
illim
oles
per
lite
r, m
ultip
ly b
y 0.
0112
9. H
DL
deno
tes
high
-den
sity
lipo
prot
ein,
and
LD
L lo
w-d
ensi
ty li
popr
otei
n.†
For
saf
ety
reas
ons,
par
ticip
ants
with
a s
elf-r
epor
ted
hist
ory
of d
iabe
tes
wer
e gi
ven
a st
eam
ed b
un t
hat
cont
aine
d ap
prox
imat
ely
80 g
of c
ompl
ex c
arbo
hydr
ates
.‡
Cig
aret
te s
mok
ing
was
def
ined
as
havi
ng s
mok
ed a
t le
ast
100
ciga
rett
es in
one
’s li
fetim
e.§
Alc
ohol
dri
nkin
g w
as d
efin
ed a
s co
nsum
ptio
n of
at
leas
t 30
g o
f alc
ohol
per
wee
k fo
r 1
year
or
mor
e.¶
Reg
ular
leis
ure-
time
phys
ical
act
ivity
was
def
ined
as
part
icip
atio
n in
30
or m
ore
min
utes
of m
oder
ate
or v
igor
ous
activ
ity p
er d
ay a
t le
ast
3 da
ys p
er w
eek.
‖ Th
e bo
dy-m
ass
inde
x is
the
wei
ght
in k
ilogr
ams
divi
ded
by t
he s
quar
e of
the
hei
ght
in m
eter
s.
The New England Journal of Medicine Downloaded from nejm.org at OKLAHOMA UNIVERSITY BIRD LIB on August 19, 2011. For personal use only. No other uses without permission.
Copyright © 2010 Massachusetts Medical Society. All rights reserved.
T h e n e w e ngl a nd j o u r na l o f m e dic i n e
n engl j med 362;12 nejm.org march 25, 20101094
and 2-hour glucose level in the glucose-tolerance test, <140 mg per deciliter [7.8 mmol per liter]), isolated impaired glucose tolerance (fasting glu-cose level, <110 mg per deciliter, and 2-hour glu-cose level, ≥140 and <200 mg per deciliter [11.1 mmol per liter]), combined impaired fasting glu-cose and impaired glucose tolerance (fasting glu-cose level, ≥110 and <126 mg per deciliter, and 2-hour glucose level, ≥140 and <200 mg per deci-liter), and undiagnosed diabetes (fasting glucose level, ≥126 mg per deciliter, 2-hour glucose level, ≥200 mg per deciliter, or both). Previously diag-nosed diabetes was identified by a positive re-sponse from the participant to the question, “Has a doctor ever told you that you have diabetes?” Among participants with previously diagnosed dia-betes, 81.2% were using insulin or oral hypogly-cemic agents and 14.9% were using lifestyle in-
tervention alone (diet, regular exercise, or both). Total diabetes included both previously diag-nosed diabetes and previously undiagnosed dia-betes. Prediabetes was defined as either impaired fasting glucose or impaired glucose tolerance.
Statistical Analysis
Our study was designed to provide accurate esti-mates of the prevalence of diabetes according to age, sex, urban or rural residence, and level of economic development in the general Chinese pop-ulation of persons 20 years of age or older. Sam-ple sizes were estimated to meet generally recom-mended requirements for precision in a complex survey design.10 All calculations were weighted to represent the total population of Chinese adults (20 years of age or older) on the basis of Chinese population data from 2006 and the study sam-
6 col33p9
Prev
alen
ce (%
)
30.0
20.0
15.0
5.0
25.0
10.0
0.020 to <30
2.61.2
5.23.0
11.1
7.3
15.513.1
10.6
8.79.7
10.6
8.89.7
18.120.3
21.822.0
7.65.7
12.29.2
17.716.0
18.121.1
16.114.9 15.5
16.115.0 15.5
24.122.2
26.426.2
30 to <40 40 to <50 50 to <60 60 to <70 ≥70
20 to <30 30 to <40 40 to <50 50 to <60 60 to <70 ≥70
A Total Diabetes
Prev
alen
ce (%
)
12.0
8.0
6.0
2.0
10.0
4.0
0.0Crude
Age (yr)
Age (yr)
Standardized
B Total Diabetes
Prev
alen
ce (%
)
40.0
20.0
15.0
5.0
30.0
35.0
25.0
10.0
0.0
C Prediabetes
Prev
alen
ce (%
)
18.0
12.0
9.0
3.0
15.0
6.0
0.0Crude Standardized
D Prediabetes
Men Women Overall
AUTHOR:
FIGURE:
RETAKE:
SIZE
4-C H/TLine Combo
Revised
AUTHOR, PLEASE NOTE: Figure has been redrawn and type has been reset.
Please check carefully.
1st
2nd
3rd
Yang
1 of 2
ARTIST:
TYPE:
MRL
03-25-10JOB: 36212 ISSUE:
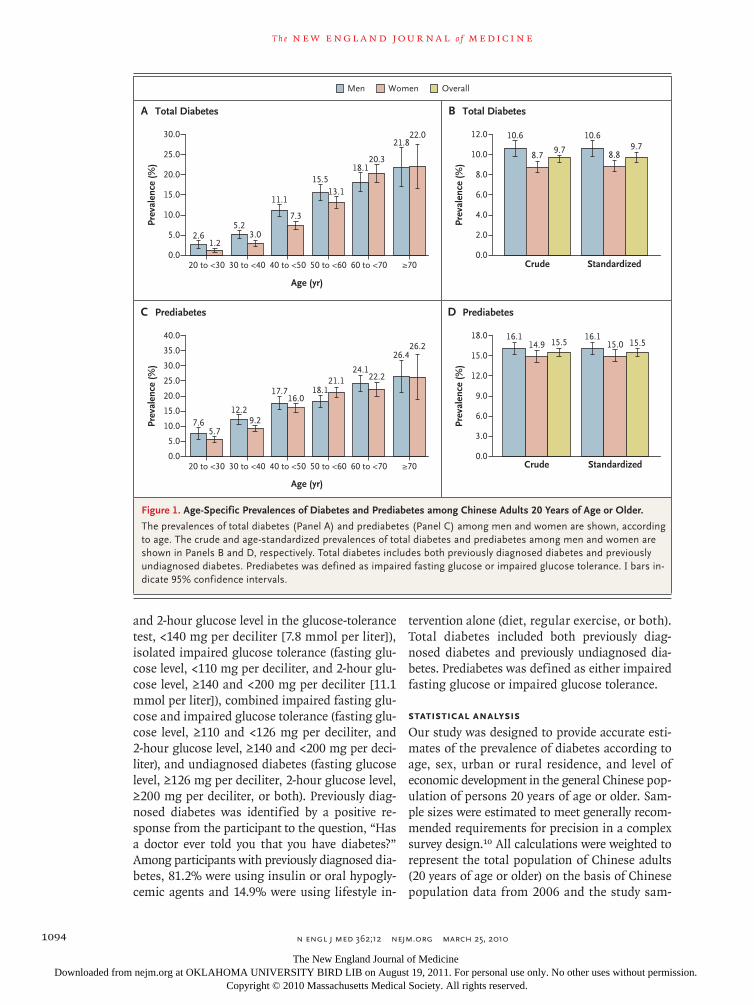
Figure 1. Age-Specific Prevalences of Diabetes and Prediabetes among Chinese Adults 20 Years of Age or Older.
The prevalences of total diabetes (Panel A) and prediabetes (Panel C) among men and women are shown, according to age. The crude and age-standardized prevalences of total diabetes and prediabetes among men and women are shown in Panels B and D, respectively. Total diabetes includes both previously diagnosed diabetes and previously undiagnosed diabetes. Prediabetes was defined as impaired fasting glucose or impaired glucose tolerance. I bars in-dicate 95% confidence intervals.
The New England Journal of Medicine Downloaded from nejm.org at OKLAHOMA UNIVERSITY BIRD LIB on August 19, 2011. For personal use only. No other uses without permission.
Copyright © 2010 Massachusetts Medical Society. All rights reserved.
Diabetes in China
n engl j med 362;12 nejm.org march 25, 2010 1095
pling scheme, and were corrected for several fea-tures of the survey, including oversampling for female and urban residents, nonresponse, highly developed economic regions, and other demo-graphic or geographic differences between the sample and the total population.
Mean values for lifestyle and metabolic factors were determined according to sex and plasma glucose categories. Prevalence estimates for dia-betes and prediabetes were calculated for the overall population and for subgroups according to age, sex, and other variables. Age- and sex-standardized prevalences were calculated by the direct method with the use of data on the popu-lation distribution in China in 2006.7 Estimated numbers of persons with diabetes and prediabe-tes were calculated from subgroup-specific prev-alences according to age, sex, geographic region, urban or rural residence, and level of economic development and from data on the size of the population in China in 2006. A multinomial logit analysis was used to examine the association of demographic, lifestyle, and metabolic factors with the odds of diabetes and prediabetes. With the use of backward elimination, only covariables that were significant (P<0.05) were retained in the fi-nal model. Standard errors were calculated with the use of a technique that was appropriate to the complex survey design. All P values are two-tailed and have not been adjusted for multiple testing. All statistical analyses were conducted with the use of SUDAAN software, version 10 (Research Triangle Institute).
R esult s
Prevalences of Diabetes and Prediabetes
The prevalences of isolated impaired fasting glu-cose, isolated impaired glucose tolerance, com-bined impaired fasting glucose and impaired glu-cose tolerance, previously undiagnosed diabetes, and previously diagnosed diabetes were 3.2%, 11.0%, 1.9%, 6.5%, and 4.1% among men and 2.2%, 10.9%, 1.7%, 5.2%, and 3.5% among wom-en, respectively (Table 1). The prevalence of undi-agnosed diabetes in which the 2-hour plasma glu-cose level in an oral glucose-tolerance test was 200 mg per deciliter or more but the fasting glu-cose level was less than 126 mg per deciliter was 2.9% among men and 2.6% among women. In other words, 46.6% of the participants with un-diagnosed diabetes (44.1% of the men and 50.2%
of the women) had isolated increased 2-hour plas-ma glucose levels after an oral glucose-tolerance test. In the case of approximately 61.3% of the men with diabetes and 59.8% of the women with diabetes, the diabetes had not previously been di-agnosed. In general, patients with previously di-agnosed diabetes had higher fasting plasma glu-cose levels and higher 2-hour plasma glucose levels in an oral glucose-tolerance test than did those with undiagnosed diabetes. In addition, pa-tients with previously diagnosed diabetes, as com-pared with those with undiagnosed diabetes, were older, more likely to have a family history of dia-betes, more likely to participate in leisure-time physical activity, less likely to smoke cigarettes, and less likely to be obese. A total of 70.7% of the participants with prediabetes (68.3% of the men and 73.6% of the women) had isolated impaired glucose tolerance, and participants with isolated
4 col22p3
33.431.3
40.842.7
15.5
12.8
10.18.9
7.7
27.322.0 22.9
20.3
14.315.6
16.6
A Total Diabetes
Urban RuralUrban Rural
Abs
olut
e N
o. (m
illio
ns)
Abs
olut
e N
o. (m
illio
ns)
50.0
30.0
20.0
40.0
10.0
0.0
0.0
30.0
20.0
30.0
10.0
Urban Rural
Prev
alen
ce (%
)Pr
eval
ence
(%)
21.0
15.0
12.0
3.0
18.0
6.0
9.0
0.0
0.0
16.0
12.0
10.0
8.0
6.0
4.0
2.0
Urban Rural
B Total Diabetes
C Prediabetes D Prediabetes
Men Women
AUTHOR:
FIGURE:
RETAKE:
SIZE
4-C H/TLine Combo
Revised
AUTHOR, PLEASE NOTE: Figure has been redrawn and type has been reset.
Please check carefully.
1st
2nd
3rd
Yang
2 of 2
ARTIST:
TYPE:
MRL
03-25-10JOB: 36212 ISSUE:
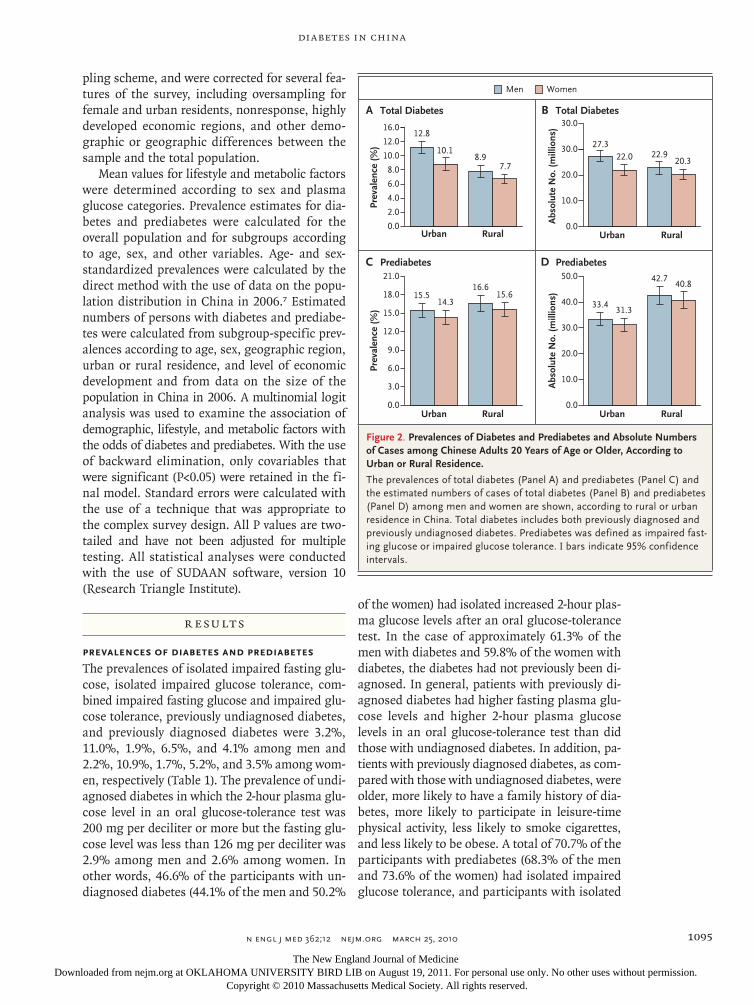
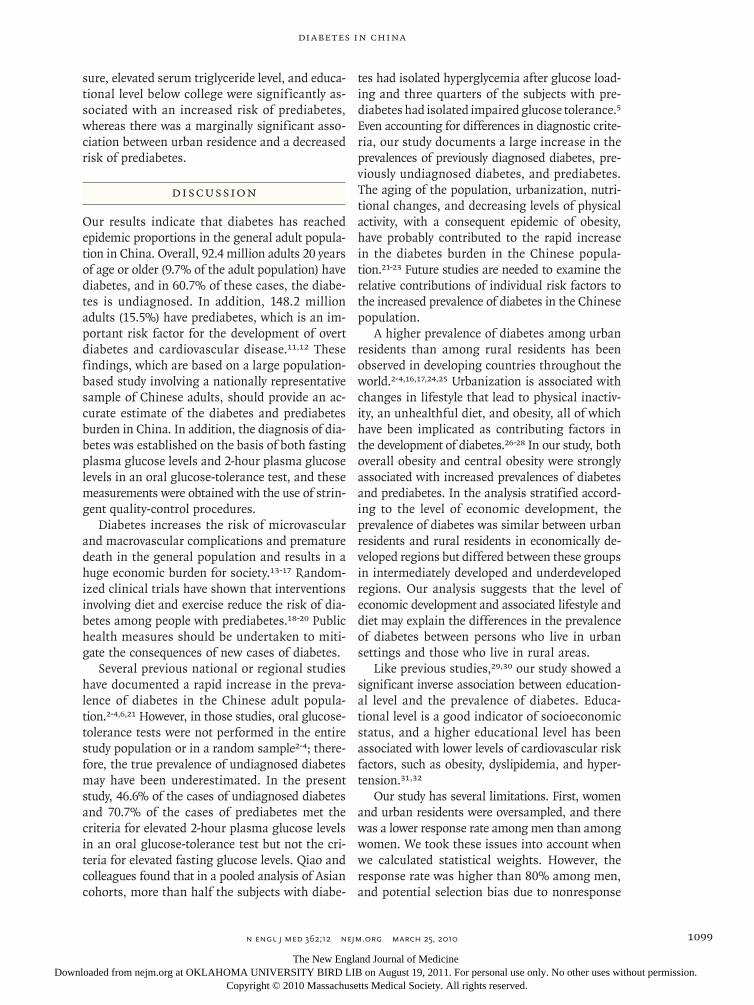
Figure 2. Prevalences of Diabetes and Prediabetes and Absolute Numbers of Cases among Chinese Adults 20 Years of Age or Older, According to Urban or Rural Residence.
The prevalences of total diabetes (Panel A) and prediabetes (Panel C) and the estimated numbers of cases of total diabetes (Panel B) and prediabetes (Panel D) among men and women are shown, according to rural or urban residence in China. Total diabetes includes both previously diagnosed and previously undiagnosed diabetes. Prediabetes was defined as impaired fast-ing glucose or impaired glucose tolerance. I bars indicate 95% confidence intervals.
The New England Journal of Medicine Downloaded from nejm.org at OKLAHOMA UNIVERSITY BIRD LIB on August 19, 2011. For personal use only. No other uses without permission.
Copyright © 2010 Massachusetts Medical Society. All rights reserved.
T h e n e w e ngl a nd j o u r na l o f m e dic i n e
n engl j med 362;12 nejm.org march 25, 20101096
impaired glucose tolerance were slightly older than those who had isolated impaired fasting glucose. In addition, women with isolated impaired glu-cose tolerance had a higher body-mass index, high-
er systolic blood pressure, and higher serum tri-glyceride levels than did women with isolated impaired fasting glucose.
The overall prevalences of total diabetes (pre-
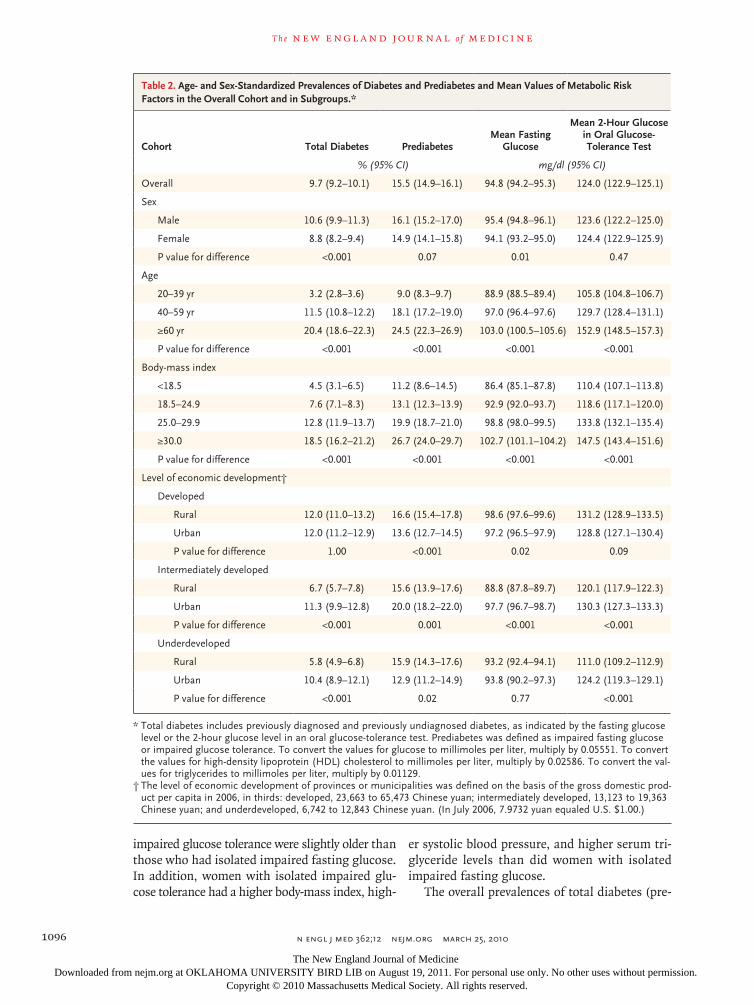
Table 2. Age- and Sex-Standardized Prevalences of Diabetes and Prediabetes and Mean Values of Metabolic Risk Factors in the Overall Cohort and in Subgroups.*
Cohort Total Diabetes PrediabetesMean Fasting
Glucose
Mean 2-Hour Glucose in Oral Glucose- Tolerance Test
% (95% CI) mg/dl (95% CI)
Overall 9.7 (9.2–10.1) 15.5 (14.9–16.1) 94.8 (94.2–95.3) 124.0 (122.9–125.1)
Sex
Male 10.6 (9.9–11.3) 16.1 (15.2–17.0) 95.4 (94.8–96.1) 123.6 (122.2–125.0)
Female 8.8 (8.2–9.4) 14.9 (14.1–15.8) 94.1 (93.2–95.0) 124.4 (122.9–125.9)
P value for difference <0.001 0.07 0.01 0.47
Age
20–39 yr 3.2 (2.8–3.6) 9.0 (8.3–9.7) 88.9 (88.5–89.4) 105.8 (104.8–106.7)
40–59 yr 11.5 (10.8–12.2) 18.1 (17.2–19.0) 97.0 (96.4–97.6) 129.7 (128.4–131.1)
≥60 yr 20.4 (18.6–22.3) 24.5 (22.3–26.9) 103.0 (100.5–105.6) 152.9 (148.5–157.3)
P value for difference <0.001 <0.001 <0.001 <0.001
Body-mass index
<18.5 4.5 (3.1–6.5) 11.2 (8.6–14.5) 86.4 (85.1–87.8) 110.4 (107.1–113.8)
18.5–24.9 7.6 (7.1–8.3) 13.1 (12.3–13.9) 92.9 (92.0–93.7) 118.6 (117.1–120.0)
25.0–29.9 12.8 (11.9–13.7) 19.9 (18.7–21.0) 98.8 (98.0–99.5) 133.8 (132.1–135.4)
≥30.0 18.5 (16.2–21.2) 26.7 (24.0–29.7) 102.7 (101.1–104.2) 147.5 (143.4–151.6)
P value for difference <0.001 <0.001 <0.001 <0.001
Level of economic development†
Developed
Rural 12.0 (11.0–13.2) 16.6 (15.4–17.8) 98.6 (97.6–99.6) 131.2 (128.9–133.5)
Urban 12.0 (11.2–12.9) 13.6 (12.7–14.5) 97.2 (96.5–97.9) 128.8 (127.1–130.4)
P value for difference 1.00 <0.001 0.02 0.09
Intermediately developed
Rural 6.7 (5.7–7.8) 15.6 (13.9–17.6) 88.8 (87.8–89.7) 120.1 (117.9–122.3)
Urban 11.3 (9.9–12.8) 20.0 (18.2–22.0) 97.7 (96.7–98.7) 130.3 (127.3–133.3)
P value for difference <0.001 0.001 <0.001 <0.001
Underdeveloped
Rural 5.8 (4.9–6.8) 15.9 (14.3–17.6) 93.2 (92.4–94.1) 111.0 (109.2–112.9)
Urban 10.4 (8.9–12.1) 12.9 (11.2–14.9) 93.8 (90.2–97.3) 124.2 (119.3–129.1)
P value for difference <0.001 0.02 0.77 <0.001
* Total diabetes includes previously diagnosed and previously undiagnosed diabetes, as indicated by the fasting glucose level or the 2-hour glucose level in an oral glucose-tolerance test. Prediabetes was defined as impaired fasting glucose or impaired glucose tolerance. To convert the values for glucose to millimoles per liter, multiply by 0.05551. To convert the values for high-density lipoprotein (HDL) cholesterol to millimoles per liter, multiply by 0.02586. To convert the val-ues for triglycerides to millimoles per liter, multiply by 0.01129.
† The level of economic development of provinces or municipalities was defined on the basis of the gross domestic prod-uct per capita in 2006, in thirds: developed, 23,663 to 65,473 Chinese yuan; intermediately developed, 13,123 to 19,363 Chinese yuan; and underdeveloped, 6,742 to 12,843 Chinese yuan. (In July 2006, 7.9732 yuan equaled U.S. $1.00.)
The New England Journal of Medicine Downloaded from nejm.org at OKLAHOMA UNIVERSITY BIRD LIB on August 19, 2011. For personal use only. No other uses without permission.
Copyright © 2010 Massachusetts Medical Society. All rights reserved.
Diabetes in China
n engl j med 362;12 nejm.org march 25, 2010 1097
viously diagnosed plus previously undiagnosed diabetes) and prediabetes were 9.7% and 15.5%, respectively. The age-specific prevalences of dia-betes and prediabetes increased significantly with increasing age (P<0.001 for both comparisons) (Fig. 1). The age-standardized prevalence of dia-betes was significantly higher among men than among women (P<0.001), but the age-standardized prevalence of prediabetes did not differ signifi-cantly according to sex (P = 0.08). The age-stan-dardized prevalence of diabetes was significantly
higher among urban residents than among rural residents (11.4% vs. 8.2%, P<0.001) (Fig. 2); how-ever, the age-standardized prevalence of predia-betes was slightly lower among urban residents than among rural residents (14.9% vs. 16.0%, P = 0.06).
Metabolic Risk Factors
The age-adjusted mean fasting glucose level, body-mass index, waist circumference, serum triglyc-eride level, and systolic blood pressure were sig-
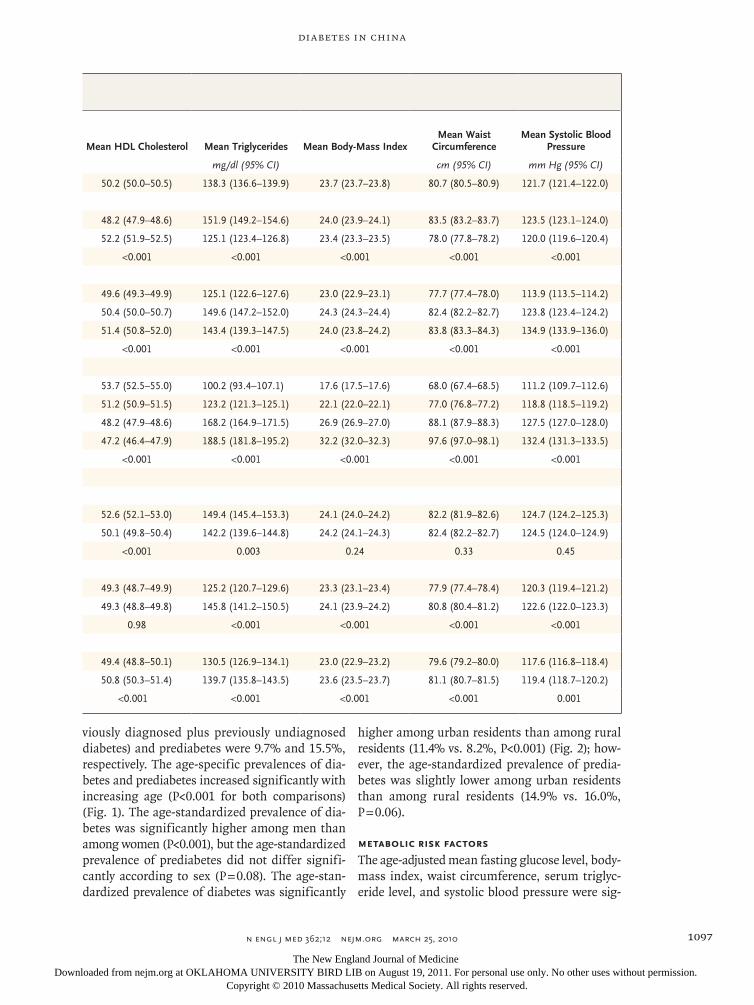
Mean HDL Cholesterol Mean Triglycerides Mean Body-Mass IndexMean Waist
CircumferenceMean Systolic Blood
Pressure
mg/dl (95% CI) cm (95% CI) mm Hg (95% CI)
50.2 (50.0–50.5) 138.3 (136.6–139.9) 23.7 (23.7–23.8) 80.7 (80.5–80.9) 121.7 (121.4–122.0)
48.2 (47.9–48.6) 151.9 (149.2–154.6) 24.0 (23.9–24.1) 83.5 (83.2–83.7) 123.5 (123.1–124.0)
52.2 (51.9–52.5) 125.1 (123.4–126.8) 23.4 (23.3–23.5) 78.0 (77.8–78.2) 120.0 (119.6–120.4)
<0.001 <0.001 <0.001 <0.001 <0.001
49.6 (49.3–49.9) 125.1 (122.6–127.6) 23.0 (22.9–23.1) 77.7 (77.4–78.0) 113.9 (113.5–114.2)
50.4 (50.0–50.7) 149.6 (147.2–152.0) 24.3 (24.3–24.4) 82.4 (82.2–82.7) 123.8 (123.4–124.2)
51.4 (50.8–52.0) 143.4 (139.3–147.5) 24.0 (23.8–24.2) 83.8 (83.3–84.3) 134.9 (133.9–136.0)
<0.001 <0.001 <0.001 <0.001 <0.001
53.7 (52.5–55.0) 100.2 (93.4–107.1) 17.6 (17.5–17.6) 68.0 (67.4–68.5) 111.2 (109.7–112.6)
51.2 (50.9–51.5) 123.2 (121.3–125.1) 22.1 (22.0–22.1) 77.0 (76.8–77.2) 118.8 (118.5–119.2)
48.2 (47.9–48.6) 168.2 (164.9–171.5) 26.9 (26.9–27.0) 88.1 (87.9–88.3) 127.5 (127.0–128.0)
47.2 (46.4–47.9) 188.5 (181.8–195.2) 32.2 (32.0–32.3) 97.6 (97.0–98.1) 132.4 (131.3–133.5)
<0.001 <0.001 <0.001 <0.001 <0.001
52.6 (52.1–53.0) 149.4 (145.4–153.3) 24.1 (24.0–24.2) 82.2 (81.9–82.6) 124.7 (124.2–125.3)
50.1 (49.8–50.4) 142.2 (139.6–144.8) 24.2 (24.1–24.3) 82.4 (82.2–82.7) 124.5 (124.0–124.9)
<0.001 0.003 0.24 0.33 0.45
49.3 (48.7–49.9) 125.2 (120.7–129.6) 23.3 (23.1–23.4) 77.9 (77.4–78.4) 120.3 (119.4–121.2)
49.3 (48.8–49.8) 145.8 (141.2–150.5) 24.1 (23.9–24.2) 80.8 (80.4–81.2) 122.6 (122.0–123.3)
0.98 <0.001 <0.001 <0.001 <0.001
49.4 (48.8–50.1) 130.5 (126.9–134.1) 23.0 (22.9–23.2) 79.6 (79.2–80.0) 117.6 (116.8–118.4)
50.8 (50.3–51.4) 139.7 (135.8–143.5) 23.6 (23.5–23.7) 81.1 (80.7–81.5) 119.4 (118.7–120.2)
<0.001 <0.001 <0.001 <0.001 0.001
The New England Journal of Medicine Downloaded from nejm.org at OKLAHOMA UNIVERSITY BIRD LIB on August 19, 2011. For personal use only. No other uses without permission.
Copyright © 2010 Massachusetts Medical Society. All rights reserved.
T h e n e w e ngl a nd j o u r na l o f m e dic i n e
n engl j med 362;12 nejm.org march 25, 20101098
nificantly higher in men than in women, whereas the high-density lipoprotein (HDL) cholesterol level was lower in men than in women (Table 2). The sex-adjusted fasting glucose level, 2-hour glucose level in an oral glucose-tolerance test, body-mass index, waist circumference, HDL cholesterol level, triglyceride level, and systolic blood pressure all increased significantly with increasing age. The age- and sex-adjusted prevalences of diabetes and prediabetes, as well as the mean fasting glucose level, 2-hour glucose level in the oral glucose-tolerance test, waist circumference, serum triglyc-eride level, and systolic blood pressure, increased significantly, whereas the HDL cholesterol level decreased, with increasing body-mass index.
Economic Development and Urbanization
In the economically developed regions, the age- and sex-adjusted prevalence of diabetes did not differ significantly between urban and rural resi-dents, whereas the prevalence of prediabetes was higher among rural residents. In the intermedi-ately developed and underdeveloped regions, the prevalence of diabetes and levels of metabolic risk
factors were higher among urban residents than among rural residents.
In 2007–2008, it was estimated that among adults 20 years of age or older in China, there were 92.4 million persons with diabetes (50.2 mil-lion men and 42.2 million women) and 148.2 million persons with prediabetes (76.1 million men and 72.1 million women). An estimated 49.3 million persons with diabetes lived in urban areas, and 43.1 million in rural areas (Fig. 2); an esti-mated 64.7 million persons with prediabetes lived in urban areas, and 83.5 million in rural areas.
Multivariable Risk Assessment
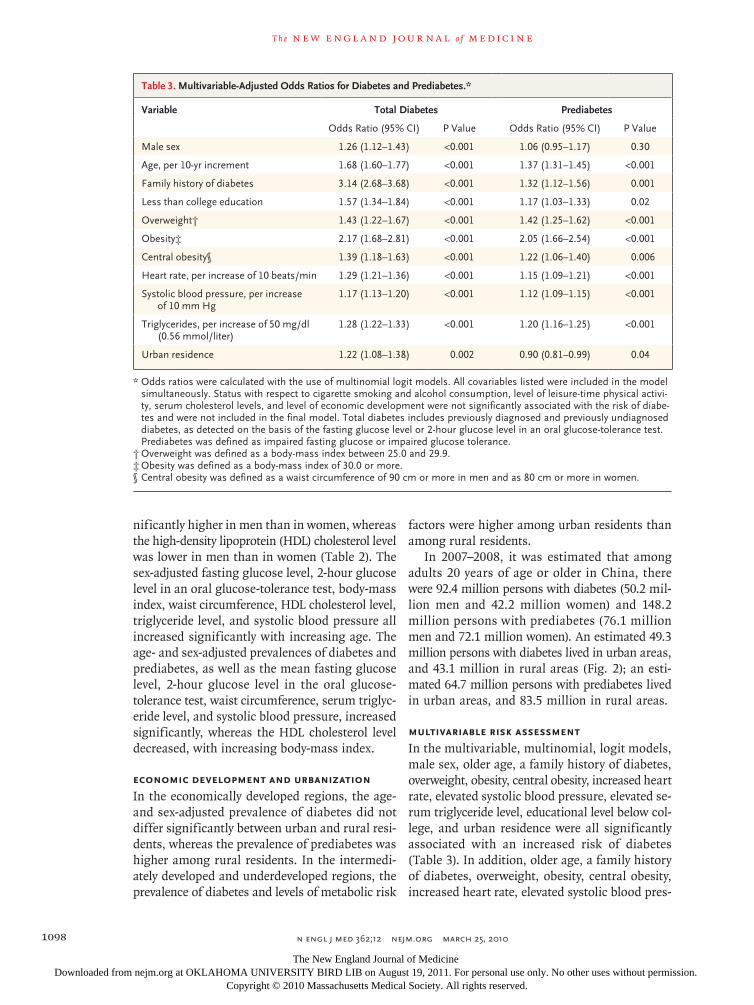
In the multivariable, multinomial, logit models, male sex, older age, a family history of diabetes, overweight, obesity, central obesity, increased heart rate, elevated systolic blood pressure, elevated se-rum triglyceride level, educational level below col-lege, and urban residence were all significantly associated with an increased risk of diabetes (Table 3). In addition, older age, a family history of diabetes, overweight, obesity, central obesity, increased heart rate, elevated systolic blood pres-
Table 3. Multivariable-Adjusted Odds Ratios for Diabetes and Prediabetes.*
Variable Total Diabetes Prediabetes
Odds Ratio (95% CI) P Value Odds Ratio (95% CI) P Value
Male sex 1.26 (1.12–1.43) <0.001 1.06 (0.95–1.17) 0.30
Age, per 10-yr increment 1.68 (1.60–1.77) <0.001 1.37 (1.31–1.45) <0.001
Family history of diabetes 3.14 (2.68–3.68) <0.001 1.32 (1.12–1.56) 0.001
Less than college education 1.57 (1.34–1.84) <0.001 1.17 (1.03–1.33) 0.02
Overweight† 1.43 (1.22–1.67) <0.001 1.42 (1.25–1.62) <0.001
Obesity‡ 2.17 (1.68–2.81) <0.001 2.05 (1.66–2.54) <0.001
Central obesity§ 1.39 (1.18–1.63) <0.001 1.22 (1.06–1.40) 0.006
Heart rate, per increase of 10 beats/min 1.29 (1.21–1.36) <0.001 1.15 (1.09–1.21) <0.001
Systolic blood pressure, per increase of 10 mm Hg
1.17 (1.13–1.20) <0.001 1.12 (1.09–1.15) <0.001
Triglycerides, per increase of 50 mg/dl (0.56 mmol/liter)
1.28 (1.22–1.33) <0.001 1.20 (1.16–1.25) <0.001
Urban residence 1.22 (1.08–1.38) 0.002 0.90 (0.81–0.99) 0.04
* Odds ratios were calculated with the use of multinomial logit models. All covariables listed were included in the model simultaneously. Status with respect to cigarette smoking and alcohol consumption, level of leisure-time physical activi-ty, serum cholesterol levels, and level of economic development were not significantly associated with the risk of diabe-tes and were not included in the final model. Total diabetes includes previously diagnosed and previously undiagnosed diabetes, as detected on the basis of the fasting glucose level or 2-hour glucose level in an oral glucose-tolerance test. Prediabetes was defined as impaired fasting glucose or impaired glucose tolerance.
† Overweight was defined as a body-mass index between 25.0 and 29.9.‡ Obesity was defined as a body-mass index of 30.0 or more.§ Central obesity was defined as a waist circumference of 90 cm or more in men and as 80 cm or more in women.
The New England Journal of Medicine Downloaded from nejm.org at OKLAHOMA UNIVERSITY BIRD LIB on August 19, 2011. For personal use only. No other uses without permission.
Copyright © 2010 Massachusetts Medical Society. All rights reserved.
Diabetes in China
n engl j med 362;12 nejm.org march 25, 2010 1099
sure, elevated serum triglyceride level, and educa-tional level below college were significantly as-sociated with an increased risk of prediabetes, whereas there was a marginally significant asso-ciation between urban residence and a decreased risk of prediabetes.
Discussion
Our results indicate that diabetes has reached epidemic proportions in the general adult popula-tion in China. Overall, 92.4 million adults 20 years of age or older (9.7% of the adult population) have diabetes, and in 60.7% of these cases, the diabe-tes is undiagnosed. In addition, 148.2 million adults (15.5%) have prediabetes, which is an im-portant risk factor for the development of overt diabetes and cardiovascular disease.11,12 These findings, which are based on a large population-based study involving a nationally representative sample of Chinese adults, should provide an ac-curate estimate of the diabetes and prediabetes burden in China. In addition, the diagnosis of dia-betes was established on the basis of both fasting plasma glucose levels and 2-hour plasma glucose levels in an oral glucose-tolerance test, and these measurements were obtained with the use of strin-gent quality-control procedures.
Diabetes increases the risk of microvascular and macrovascular complications and premature death in the general population and results in a huge economic burden for society.13-17 Random-ized clinical trials have shown that interventions involving diet and exercise reduce the risk of dia-betes among people with prediabetes.18-20 Public health measures should be undertaken to miti-gate the consequences of new cases of diabetes.
Several previous national or regional studies have documented a rapid increase in the preva-lence of diabetes in the Chinese adult popula-tion.2-4,6,21 However, in those studies, oral glucose-tolerance tests were not performed in the entire study population or in a random sample2-4; there-fore, the true prevalence of undiagnosed diabetes may have been underestimated. In the present study, 46.6% of the cases of undiagnosed diabetes and 70.7% of the cases of prediabetes met the criteria for elevated 2-hour plasma glucose levels in an oral glucose-tolerance test but not the cri-teria for elevated fasting glucose levels. Qiao and colleagues found that in a pooled analysis of Asian cohorts, more than half the subjects with diabe-
tes had isolated hyperglycemia after glucose load-ing and three quarters of the subjects with pre-diabetes had isolated impaired glucose tolerance.5 Even accounting for differences in diagnostic crite-ria, our study documents a large increase in the prevalences of previously diagnosed diabetes, pre-viously undiagnosed diabetes, and prediabetes. The aging of the population, urbanization, nutri-tional changes, and decreasing levels of physical activity, with a consequent epidemic of obesity, have probably contributed to the rapid increase in the diabetes burden in the Chinese popula-tion.21-23 Future studies are needed to examine the relative contributions of individual risk factors to the increased prevalence of diabetes in the Chinese population.
A higher prevalence of diabetes among urban residents than among rural residents has been observed in developing countries throughout the world.2-4,16,17,24,25 Urbanization is associated with changes in lifestyle that lead to physical inactiv-ity, an unhealthful diet, and obesity, all of which have been implicated as contributing factors in the development of diabetes.26-28 In our study, both overall obesity and central obesity were strongly associated with increased prevalences of diabetes and prediabetes. In the analysis stratified accord-ing to the level of economic development, the prevalence of diabetes was similar between urban residents and rural residents in economically de-veloped regions but differed between these groups in intermediately developed and underdeveloped regions. Our analysis suggests that the level of economic development and associated lifestyle and diet may explain the differences in the prevalence of diabetes between persons who live in urban settings and those who live in rural areas.
Like previous studies,29,30 our study showed a significant inverse association between education-al level and the prevalence of diabetes. Educa-tional level is a good indicator of socioeconomic status, and a higher educational level has been associated with lower levels of cardiovascular risk factors, such as obesity, dyslipidemia, and hyper-tension.31,32
Our study has several limitations. First, women and urban residents were oversampled, and there was a lower response rate among men than among women. We took these issues into account when we calculated statistical weights. However, the response rate was higher than 80% among men, and potential selection bias due to nonresponse
The New England Journal of Medicine Downloaded from nejm.org at OKLAHOMA UNIVERSITY BIRD LIB on August 19, 2011. For personal use only. No other uses without permission.
Copyright © 2010 Massachusetts Medical Society. All rights reserved.

T h e n e w e ngl a nd j o u r na l o f m e dic i n e
n engl j med 362;12 nejm.org march 25, 20101100
should be minimal. Second, dietary intake and work-related physical activity were not assessed in our study. Therefore, we were not able to de-termine the association between these factors and the prevalence of diabetes. Third, to ensure com-parability across studies, we used the World Health Organization criteria to define diabetes and pre-diabetes in our study. The relationship of glucose categories to the risk of microvascular and mac-rovascular diseases, however, has not been exten-sively examined in the Chinese population.20,33
In summary, our results show that diabetes and prediabetes are highly prevalent in the gen-
eral adult population in China. Given its large population, China may bear a higher diabetes-related burden than any other country.16,17 More troublesome is the finding that the majority of cases of diabetes are undiagnosed. These results indicate that diabetes has become a major public health challenge in China and underscore the need for national strategies aimed at the prevention, detection, and treatment of diabetes in the gen-eral Chinese population.
Supported by grants from the Chinese Medical Association Foundation and Chinese Diabetes Society.
No potential conflict of interest relevant to this article was reported.
References
He J, Gu D, Wu X, et al. Major causes 1. of death among men and women in China. N Engl J Med 2005;353:1124-34.
Pan XR, Yang WY, Li GW, Liu J. Preva-2. lence of diabetes and its risk factors in China, 1994. Diabetes Care 1997;20:1664-9.
National Diabetes Research Group. Di-3. abetes mellitus survey of 300,000 in four-teen provinces and cities of China. Chin Med J 1981;20:678-81.
Gu D, Reynolds K, Duan X, et al. Prev-4. alence of diabetes and impaired fasting glucose in the Chinese adult population: International Collaborative Study of Car-diovascular Disease in Asia (InterASIA). Diabetologia 2003;46:1190-8.
Qiao Q, Nakagami T, Tuomilehto J, et 5. al. Comparison of the fasting and the 2-h glucose criteria for diabetes in different Asian cohorts. Diabetologia 2000;43: 1470-5.
Jia WP, Pang C, Chen L, et al. Epide-6. miological characteristics of diabetes mel-litus and impaired glucose regulation in a Chinese adult population: the Shanghai Diabetes Studies, a cross-sectional 3-year follow-up study in Shanghai urban com-munities. Diabetologia 2007;50:286-92.
National Bureau of Statistics of Chi-7. na. China statistical yearbook — 2006. Beijing: China Statistics Press, 2006. (Ac-cessed February 26, 2010, at http://www .stats.gov.cn/tjsj/ndsj/2006/indexeh.htm.)
Luepker RV, Evans A, McKeigue P, 8. Reddy KS. Cardiovascular survey methods. 3rd ed. Geneva: World Health Organiza-tion, 2004.
Department of Noncommunicable Dis-9. ease Surveillance. Definition, diagnosis and classification of diabetes mellitus and its complications: report of a WHO con-sultation. Part 1. Diagnosis and classifi-cation of diabetes mellitus. Geneva: World Health Organization, 1999. (Accessed Feb-ruary 26, 2010, at http://www.staff.ncl .ac.uk/philip.home/who_dmg.pdf.)
Plan and operation of the Third Na-10.
tional Health and Nutrition Examination Survey, 1988-94. Series 1: programs and collection procedures. Vital Health Stat 1 1994;32:1-407.
Schmidt MI, Duncan BB, Bang H, et 11. al. Identifying individuals at high risk for diabetes: the Atherosclerosis Risk in Com-munities study. Diabetes Care 2005;28: 2013-8.
Levitzky YS, Pencina MJ, D’Agostino 12. RB, et al. Impact of impaired fasting glu-cose on cardiovascular disease: the Framingham Heart Study. J Am Coll Car-diol 2008;51:264-70.
Haffner SM, Lehto S, Ronnemaa T, 13. Pyorala K, Laakso M. Mortality from cor-onary heart disease in subjects with type 2 diabetes and in nondiabetic subjects with and without prior myocardial infarc-tion. N Engl J Med 1998;339:229-34.
Schramm TK, Gislason GH, Køber L, 14. et al. Diabetes patients requiring glucose-lowering therapy and nondiabetics with a prior myocardial infarction carry the same cardiovascular risk: a population study of 3.3 million people. Circulation 2008;117: 1945-54.
Brancati FL, Whelton PK, Randall BL, 15. Neaton JD, Stamler J, Klag MJ. Risk of end-stage renal disease in diabetes melli-tus: a prospective cohort study of men screened for MRFIT: Multiple Risk Factor Intervention Trial. JAMA 1997;278:2069-74.
Wild S, Roglic G, Green A, Sicree R, 16. King H. Global prevalence of diabetes: estimates for the year 2000 and projec-tions for 2030. Diabetes Care 2004;27: 1047-53.
Diabetes atlas. 3rd ed. Brussels: Inter-17. national Diabetes Federation, 2008. (Ac-cessed February 26, 2010, at http://www .eatlas.idf.org/index-2.html.)
Tuomilehto J, Lindström J, Eriksson 18. JG, et al. Prevention of type 2 diabetes mellitus by changes in lifestyle among subjects with impaired glucose tolerance. N Engl J Med 2001;344:1343-50.
Diabetes Prevention Program Re-19. search Group. Reduction in the incidence of type 2 diabetes with lifestyle interven-tion or metformin. N Engl J Med 2002; 346:393-403.
Li G, Zhang P, Wang J, et al. The long-20. term effect of lifestyle interventions to prevent diabetes in the China Da Qing Diabetes Prevention Study: a 20-year fol-low-up study. Lancet 2008;371:1783-9.
Li G, Hu Y, Pan X. Prevalence and in-21. cidence of NIDDM in Daqing City. Chin Med J (Engl) 1996;109:599-602.
Leeder S, Raymond S, Greenberg H, 22. Liu H, Esson K. A race against time: the challenge of cardiovascular disease in de-veloping economies. New York: Columbia University, 2004.
Yang G, Kong L, Zhao W, et al. Emer-23. gence of chronic non-communicable dis-eases in China. Lancet 2008;372:1697-705.
Wang Y, Mi J, Shan XY, Wang QJ, Ge 24. KY. Is China facing an obesity epidemic and the consequences? The trends in obe-sity and chronic disease in China. Int J Obes (Lond) 2007;31:177-88.
Singh RB, Bajaj S, Niaz MA, Rastogi 25. SS, Moshiri M. Prevalence of type 2 diabe-tes mellitus and risk of hypertension and coronary artery disease in rural and ur-ban population with low rates of obesity. Int J Cardiol 1998;66:65-72.
Reynolds K, Gu D, Whelton PK, et al. 26. Prevalence and risk factors of overweight and obesity in China. Obesity (Silver Spring) 2007;15:10-8.
Muntner P, Gu D, Wildman RP, et al. 27. Prevalence of physical activity among Chi-nese adults: results from the International Collaborative Study of Cardiovascular Dis-ease in Asia. Am J Public Health 2005;95: 1631-6.
Li LM, Rao KQ, Kong LZ, et al. A de-28. scription on the Chinese national nutri-tion and health survey in 2002. Zhonghua Liu Xing Bing Xue Za Zhi 2005;26:478-84. (In Chinese.)
Borrell LN, Dallo FJ, White K. Educa-29.
The New England Journal of Medicine Downloaded from nejm.org at OKLAHOMA UNIVERSITY BIRD LIB on August 19, 2011. For personal use only. No other uses without permission.
Copyright © 2010 Massachusetts Medical Society. All rights reserved.

Diabetes in China
n engl j med 362;12 nejm.org march 25, 2010 1101
tion and diabetes in a racially and ethni-cally diverse population. Am J Public Health 2006;96:1637-42.
Ko GTC, Chan JCN, Yeung VT, Chow 30. CC, Tsang LW, Cockram CS. A low socio-economic status is an additional risk fac-tor for glucose intolerance in high risk Hong Kong Chinese. Eur J Epidemiol 2001;17:289-95.
Seeman T, Merkin SS, Crimmins E, 31. Koretz B, Charette S, Karlamangla A. Ed-ucation, income and ethnic differences in cumulative biological risk profiles in a national sample of US adults: NHANES III (1988-1994). Soc Sci Med 2008;66:72-87.
Yan LL, Liu K, Daviglus ML, et al. Edu-32. cation, 15-year risk factor progression,
and coronary artery calcium in young adulthood and early middle age: the Coro-nary Artery Risk Development in Young Adults study. JAMA 2006;295:1793-800.
Chan JC, Malik V, Jia W, et al. Diabe-33. tes in Asia: epidemiology, risk factors, and pathophysiology. JAMA 2009;301: 2129-40.Copyright © 2010 Massachusetts Medical Society.
The New England Journal of Medicine Downloaded from nejm.org at OKLAHOMA UNIVERSITY BIRD LIB on August 19, 2011. For personal use only. No other uses without permission.
Copyright © 2010 Massachusetts Medical Society. All rights reserved.