Access to Care and Prevalence of Hypertension and Diabetes ...
RESEARCH ARTICLE
Association between Family History RiskCategories and Prevalence of Diabetes inChinese PopulationJinping Zhang1‡, Zhaojun Yang1*‡, Jianzhong Xiao1, Xiaoyan Xing1, Juming Lu2,JianpingWeng3, Weiping Jia4, Linong Ji5, Zhongyan Shan6, Jie Liu7, Haoming Tian8,Qiuhe Ji9, Dalong Zhu10, Jiapu Ge11, Li Chen12, Xiaohui Guo13, Zhigang Zhao14, Qiang Li15,Zhiguang Zhou16, Lixiang Lin17, NaWang1, Wenying Yang1*, for the China NationalDiabetes and Metabolic Disorders Study Group¶
1 Department of Endocrinology, China–Japan Friendship Hospital, Beijing, China, 2 Department ofEndocrinology, Chinese People's Liberation Army General Hospital, Beijing, China, 3 Department ofEndocrinology, Sun Yat-sen University Third Hospital, Guangzhou, China, 4 Department of Endocrinology,Shanghai Jiaotong University Affiliated Sixth People's Hospital, Shanghai, China, 5 Department ofEndocrinology, Peking University People's Hospital, Beijing, China, 6 Department of Endocrinology, FirstAffiliated Hospital, Chinese Medical University, Liaoling, China, 7 Department of Endocrinology, ShanxiProvince People's Hospital, Taiyuan, Shanxi, China, 8 Department of Endocrinology, West China Hospital,Sichuan University, Chengdu, Sichuan, China, 9 Department of Endocrinology, Xijing Hospital, FourthMilitary Medical University, Xi'an, Shanxi, China, 10 Department of Endocrinology, Affiliated Drum TowerHospital of Nanjing University Medical School, Nanjing, Jiangsu, China, 11 Department of Endocrinology,Xinjiang Uygur Autonomous Region's Hospital, Urmqi, Xinjiang, China, 12 Department of Endocrinology,Qilu Hospital, Qilu Hospital of Shandong University, Jinan, Shandong, China, 13 Department ofEndocrinology, Peking University First Hospital, Beijing, China, 14 Department of Endocrinology, HenanProvince People's Hospital, Zhengzhou, Henan, China, 15 Department of Endocrinology, Second AffiliatedHospital of Harbin Medical University, Harbin, Heilongjiang, China, 16 Department of Endocrinology,Xiangya Second Hospital, Changsha, Hunan, China, 17 Department of Endocrinology, Fujian ProvincialHospital, Fuzhou, Fujiang, China
‡ These authors contributed equally to this work.¶ Membership of the China National Diabetes and Metabolic Disorders Study Group are listed inS1 Appendix.* [email protected] (ZY); [email protected] (WY)
Abstract
Aim
To investigate the association between different family history risk categories and preva-
lence of diabetes in the Chinese population.
Methods
The family history of diabetes was obtained from each subject, and an oral glucose toler-
ance test was performed for measuring the fasting and postload glucose and insulin levels
based on a national representative cross-sectional survey of 46,239 individuals (age� 20
years) in the 2007–2008 China National Diabetes and Metabolism Disorders Study. The
family history risk categories of diabetes were high, moderate, and average (FH2 and FH1:
at least two generations and one generation of first-degree relatives with diabetes, respec-
tively; FH0: no first-degree relatives with diabetes).
PLOS ONE | DOI:10.1371/journal.pone.0117044 February 9, 2015 1 / 13
OPEN ACCESS
Citation: Zhang J, Yang Z, Xiao J, Xing X, Lu J,Weng J, et al. (2015) Association between FamilyHistory Risk Categories and Prevalence of Diabetesin Chinese Population. PLoS ONE 10(2): e0117044.doi:10.1371/journal.pone.0117044
Academic Editor: Harry Zhang, Old DominionUniversity, UNITED STATES
Received: September 6, 2014
Accepted: December 17, 2014
Published: February 9, 2015
Copyright: © 2015 Zhang et al. This is an openaccess article distributed under the terms of theCreative Commons Attribution License, which permitsunrestricted use, distribution, and reproduction in anymedium, provided the original author and source arecredited.
Data Availability Statement: All relevant data arewithin the paper and its Supporting Information files.
Funding: This study was supported by grants fromthe Chinese Medical Association Foundation and theChinese Diabetes Society (grant numbers:07020470055). The funders had no role in the studydesign, data collection and analysis, decision topublish, or preparation of the manuscript.
Competing Interests: The authors have declaredthat no competing interests exist.
Results
The age- and gender-adjusted prevalence rates of diabetes were 32.7% (95% confidence
interval (CI): 26.4–39.7%) in FH2, 20.1% (95% CI: 18.2–22.1%) in FH1, and 8.4% (95% CI:
7.9–8.9%) in FH0 (P< 0.0001). The calculated homeostatic model assessment-estimated
insulin resistance (HOMA-IR), Matsuda insulin sensitivity index (ISI), and insulinogenic
index (ΔI30/ΔG30) values showed significant trending changes among the three risk cate-
gories, with the most negative effects in FH2. Multivariate logistic regression analysis
showed that the odds ratios of having diabetes were 6.16 (95% CI: 4.46–8.50) and 2.86
(95% CI: 2.41–3.39) times higher in FH2 and FH1, respectively, than in FH0 after adjust-
ment for classical risk factors for diabetes.
Conclusions
Family history risk categories of diabetes have a significant, independent, and graded asso-
ciation with the prevalence of this disease in the Chinese population.
IntroductionDiabetes mellitus is a major noncontagious disease that has become a serious threat to humanhealth. According to the latest estimates of the International Diabetes Federation, the preva-lence of diabetes worldwide has reached 8.3%, and approximately 382 million adults have haddiabetes, and 80% of these adults are present in medium and low income countries with scarcehealth resources [1].
In China, the latest data have shown that prevalence of diabetes in adults aged 20 years orolder has increased to an alarming 9.7% [2]. If the American Diabetes Association standard(glycated hemoglobin� 6.5%) is included in the diagnostic criteria for diabetes, then the preva-lence of diabetes in the Chinese population reaches 11.6% [3]. The population size of Chinesepatients with diabetes is estimated to be 92.4–98.4 million [1,2]; of which, approximately 60%patients have not yet been diagnosed [2]. Due to the scarcity and uneven distribution of healthresources in China, effective and targeted screening of high-risk groups and early treatment ofdiabetes are significant factors for preventing the late complications of this disease.
The etiology of diabetes involves complex genetic and environmental factors[4,5]. A largenumber of epidemiological studies have indicated that the family history of diabetes, advancedage, obesity (especially abdominal obesity), physical inactivity, and abnormal lipid metabolismare independent risk factors for diabetes. Patients with a positive family history of diabetes ex-perience 3- to 4-fold higher risk of developing this disease than those with a negative familyhistory of diabetes[2,3,6–8], and the risk of diabetes increases with the number of affected rela-tives [6–9]. Other studies have shown that the level of risk of diabetes is related to the nature ofrelationship with the affected relatives. For instance, mothers with diabetes contribute morethan fathers with diabetes to the risk of type 2 diabetes in the offspring [8], and the first-degreerelatives with diabetes are associated with a higher family history risk category than that of sec-ond-degree relatives with diabetes [9].
The above findings on the association between the family history risk categories and theprevalence of diabetes were mainly obtained from the European and American populations[6–9]. However, a study on the South Korean population shows no evidence that the offspringof mothers with diabetes have a higher risk of diabetes than other groups [10]. The familial
Family History Risk Categories and Diabetes
PLOS ONE | DOI:10.1371/journal.pone.0117044 February 9, 2015 2 / 13

aggregation of diabetes is believed to be the result of combined action by genetic factors andsimilar environmental factors shared among family members (e.g., diet habits and sedentarylifestyle) [11]. Therefore, it is necessary to explore the association between the family historyrisk categories and the prevalence of diabetes among different types of ethnic groups to providea reference for the highly effective identification of high-risk groups of this disease.
In China, two epidemiological studies on diabetes nationwide have been conducted, whichshow that a positive family history of diabetes is an independent risk factor for this disease inthe Chinese population [2,12]. In the 2007–2008 China National Diabetes and Metabolic Dis-orders Study (DMS), all subjects underwent a standard 75-g oral glucose tolerance test(OGTT) with blood glucose and insulin measurements. Additionally, the prevalence of diabe-tes in the first-degree relatives of the subjects was surveyed. In the present study, an in-depthanalysis on the association among the family history risk categories of diabetes and insulin se-cretion, insulin resistance, and prevalence of diabetes was carried out using data from the2007–2008 DMS survey of Chinese adults aged 20 years or older.
Materials and Methods
Study subjectsFrom June 2007 to May 2008, the nationwide DMS was carried out using a complex multistagestratified sampling method. Representative regions (including 152 urban districts and 112rural villages) were selected across the country by considering the geographical distribution,economic development, and level of urbanization. Residents aged 20 years and older and livinglocally for 5 years or more were randomly selected from each region. A total of 46,239 subjects(18,419 men and 27,820 women) with mean age of 44.9 years completed the study. Detailedsampling methods can be found in a previous description in the literature [2].
Ethics StatementThe study program was reviewed and approved by the Clinical Research Ethics Committee ofChina-Japan Friendship Hospital (No. 2007–026). All the subjects had signed informed con-sent forms prior to the collection of data and other tests.
Physical examination and questionnaire surveyTrained and qualified physicians conducted the physical examination of all the subjects accord-ing to standard methods of the study program, including the measurement of body height,weight, waist and hip circumferences, blood pressure, and heart rate [2]. The body height andweight of the patients were measured with the patients wearing only underwear and shoes,with an accuracy of 0.1 cm and 0.1 kg, respectively. The body mass index (BMI) was calculatedby dividing the body weight (kg) by the square of body height (m). The waist circumferencewas defined as the minimal horizontal circumference along the connection between the sub-costal margin and the iliac crest, and the hip circumference was defined as the maximal hori-zontal circumference between the waist and the hips. Central obesity was defined as a waistcircumference of� 90 cm in males and� 85 cm in females [13,14]. After 10–15 min of rest atsitting position, the blood pressure was measured twice at a 30-s interval in the right upper armusing a mercury sphygmomanometer; the arithmetic mean of the two measurements wastaken as the blood pressure value.
Data were collected in health stations or community clinics near the residence of the sub-jects. During an on-site survey, a standard questionnaire was completed by trained, qualifiedphysicians and nurses by face-to-face method. Each subject was queried about his/her lifestyle,
Family History Risk Categories and Diabetes
PLOS ONE | DOI:10.1371/journal.pone.0117044 February 9, 2015 3 / 13
previous maximal weight, history of diabetes, time of diagnosis of diabetes, and history of med-ication, as well as family histories of coronary heart disease, stroke, and diabetes.
Family history of diabetesThe DMS questionnaire survey collected information about the presence or absence of diabetesin the first-degree relatives of the subjects (including father, mother, siblings, and children). Ifthe answer was “yes,” then the subject was considered to have a positive family history of diabe-tes and further had to specify the nature of relationship with those who have diabetes. If the an-swer was “no,” then the subject was considered to have a negative family history of diabetes. Inthe case of “unknown,” “refuse to answer,” or “forget to ask,” the subject was excluded from thefollowing analysis because of the uncertainty regarding the family history of diabetes. In accor-dance with the family history of diabetes, the risk categories of disease were defined as follows:(1) Average: no first-degree relatives with diabetes (FH0); (2) moderate: only one generation offirst-degree relatives with diabetes (FH1); and (3) high: at least two generations of first-degreerelatives with diabetes (FH2).
OGTT or standard meal testThe subjects were requested to avoid excessive exercise or diet control for at least 3 days priorto the test. After fasting overnight for 10–12 h, blood specimens were collected using a vacuumtube with sodium fluoride for determining fasting plasma glucose, lipid profile, and insulin.Then, the subjects with no history of diabetes received an oral dose (75 g) of glucose solution(25%), and those previously diagnosed with diabetes had a standard meal containing 80 g ofcarbohydrate. Blood specimens were collected at 30 and 120 min after the loading using a vacu-um tube with sodium fluoride for determining postload glucose and insulin.
Level of blood glucose was measured using the hexokinase enzymatic method, and lipid pro-file was measured enzymatically in local laboratories that are recognized by a national or pro-vincial quality control system. For analyzing the levels of insulin, blood specimens wereimmediately centrifuged at 4°C, and the serum specimens obtained were transported to theCentral Laboratory of Endocrinology at the China-Japan Friendship Hospital via the coldchain transportation system, and then stored at -80°C until used. Level of serum insulin wasmeasured using radioactive immunoassay (Beckman insulin kit, Prague, Czech Republic) in anauthorized laboratory by certified technicians from China National Nuclear Corporation (Bei-jing, China). The diagnostic criteria for diabetes, impaired fasting glucose (IFG), and impairedglucose tolerance (IGT) were based on the 1999 World Health Organization Criteria [15]. Pre-diabetes refers to IFG or IGT, and diabetes and prediabetes are collectively referred toas dysglycemia.
Calculation of β-cell function and insulin resistance indicesThe β-cell function is indicated by two indices: (1) The insulinogenic index (ΔI30/ΔG30) refersto the insulin increment at 30 min after glucose loading relative to fasting serum insulin divid-ed by the plasma glucose increment at 30 min, i.e., ΔI30/ΔG30 = (INS30- FINS)/(PG30 - FPG),where INS30 and PG30 are serum insulin and plasma glucose levels at 30 min after OGTT, re-spectively; and FINS and FPG are the fasting serum insulin and fasting plasma glucose levels,respectively [16] and (2) corrected insulin response (CIR), i.e., (100 × insulin [mU/L] at 30min)/(glucose [mmol/L] at 30 min) × (glucose [mmol/L] at 30 min—3.89 mmol/L) [17].
The insulin resistance was indicated by homeostatic model assessment-estimated insulin re-sistance (HOMA-IR, FINS × FPG/22.5) [18] and the Matsuda insulin sensitivity index, ISI =
Family History Risk Categories and Diabetes
PLOS ONE | DOI:10.1371/journal.pone.0117044 February 9, 2015 4 / 13

10,000/p(fasting plasma glucose [mmol/L] × fasting insulin [mU/L]) × (mean OGTT glucose
[mmol/L] × mean OGTT insulin [mU/L] [18,19].The disposition index (DI) was calculated as the product of insulin secretion index and
ISI: DI30 = ΔI30/ΔG30 × ISI [20] or DI = CIR × ISI [17], which indicates the insulin secretionfunction after the adjustment for insulin sensitivity.
Statistical analysisAll statistical analyses were performed using the SUDAAN (version 10; Research Triangle Insti-tute, NC, USA), as appropriate for the complex survey design. All calculations were weighted torepresent the total Chinese adult population aged 20 years or older. Weights were calculatedbased on the data from the Chinese population of the year 2006 and the study sampling scheme,and took several features of the survey into account, including oversampling for female andurban residents, nonresponse, economic development, and other demographic or geographic dif-ferences between the sample and the total population [2]. The data are expressed as means with95% confidence interval (95% CI) or median with the interquartile range. The difference betweenthe group means and the between-group frequencies was tested using the PAIRWISE procedurein SUDAAN 10. The test for trend was performed with a polynomial contrast procedure. Vari-ables that were not normally distributed were transformed logarithmically before the analysis.A multiple logistic regression analysis was used to examine the association between the familyhistory of diabetes and the prevalence of diabetes, and the adjusted odd ratios were obtained. AllP values were two-tailed, and a P value of< 0.05 was considered statistically significant.
Results
Subject dispositionThe survey database collected information on a total of 46,239 subjects, including 18,419 menand 27,820 women (mean age 44.9 ± 13.7 years). Of these, 9958 subjects were excluded for in-complete or inaccurate report on the family history of diabetes. The present study focused on36,281 subjects with a complete dataset including 14,263 men and 22,018 women. Out of the36,281 subjects, 5443 subjects were classified into the risk category of FH1, accounting for aweighted percentage of 13.9% (95% CI: 13.2–14.5%); 643 subjects in the risk category of FH2,accounting for a weighted percentage of 1.6% (95% CI: 1.3–2.0%); and the remaining in therisk category of FH0. There were no significant differences in the mean age among the threefamily history risk categories of diabetes, i.e., 44.9 years for FH0 and FH1 and 45.1 years forFH2. The age of onset of diabetes was 1–2 years earlier in the groups with a positive family his-tory of diabetes (FH1 and FH2) than in those of FH0.
Family history risk categories of the subjectsWith increasing family history risk category of diabetes, the levels of previous maximal weight,prevalence of central obesity, present BMI, systolic and diastolic blood pressure, fasting glucose andinsulin, 2-h postloading glucose and insulin levels, total serum cholesterol levels, triglyceride levels,and low-density lipoprotein cholesterol levels all showed a significantly increasing trends (Table 1).
Association between family history risk categories and prevalence ofdiabetesThe age- and gender-adjusted prevalence rates of diabetes were 8.4% (95% CI: 7.9–8.9%) in therisk category of FH0, 20.1% (95% CI: 18.2–22.1%) in the risk category of FH1, and 32.7% (95%CI: 26.4–39.7%) in the risk category of FH2, showing a statistically significant increasing trend
Family History Risk Categories and Diabetes
PLOS ONE | DOI:10.1371/journal.pone.0117044 February 9, 2015 5 / 13

Table 1. General clinical characteristics of the Chinese population with positive or negative history of diabetes (adjusted for age and gender).
FH0 FH1 FH2 P-value
FH1 vs FH0 FH2 vs FH0 FH1 vs FH2
Number 30,195 5443 643
Gender (M/F) 11,951/18,244 2072/3371 240/403
Prevalence of DM (%) 8.4 20.1 32.7 <0.0001 <0.0001 0.0003
7.9, 8.9 18.2, 22.1 26.4, 39.7
Age (years) 44.9 44.9 45.1 0.2834 0.1876 0.3892
44.8, 44.9 44.8, 45.1 44.7, 45.5
Age of diagnosis of DM (years) 45.3 43.9 44.6 0.0002 0.0409 0.2035
45.1, 45.4 43.2, 44.6 43.9, 45.2
Maximal weight (kg) 65.3 69.2 71.0 <0.0001 <0.0001 0.0075
65.1, 65.6 68.6, 69.8 69.9, 72.2
Smoking (%) 24.8 25.6 29.1 0.4312 0.1609 0.2841
23.9, 25.6 23.7, 27.7 23.5, 35.5
Drinking (%) 21.3 26.2 28.6 <0.0001 0.0171 0.4480
20.5, 22.1 24.3, 28.1 23.0, 34.9
Central obesity (%) 27.40 34.00 41.7000 <0.0001 <0.0001 0.0148
26.6, 28.3 31.8, 36.4 36.1, 47.5
Body mass index (kg/m2) 23.85 24.54 25.11 <0.0001 <0.0001 0.0204
23.78, 23.92 24.34, 24.74 24.67, 25.56
Systolic blood pressure (mmHg) 122.7 123.9 123.8 0.0158 0.2598 0.9289
122.4, 123.1 123.0, 124.7 122.0, 125.6
Diastolic blood pressure (mmHg) 77.8 78.6 80.6 0.0100 <0.0001 0.0039
77.6, 78.1 78.1, 79.2 79.4, 81.8
FPG (mmol/L) 5.2 5.8 6.5 <0.0001 <0.0001 0.0005
5.2, 5.2 5.6, 6.0 6.2, 6.8
PG2h (mmol/L) 6.8 8.1 9.6 <0.0001 <0.0001 0.0001
6.8, 6.9 7.8, 8.4 8.9, 10.2
FINS (mU/L)* 6.9 7.7 7.3 0.0006 0.0238 0.6814
5.0, 9.6 5.5, 10.7 5.1, 10.7
INS2h (mU/L)* 25.4 31.2 34.6 <0.0001 0.0006 0.8351
15.2, 43.3 18.6, 54.9 19.0, 56.9
TCHO (mmol/L)* 4.66 4.74 5.00 0.0024 <0.0001 0.0015
4.03, 5.34 4.18, 5.37 4.42, 5.52
TG (mmol/L)* 1.21 1.39 1.64 <0.0001 0.0004 0.2556
0.85, 1.82 0.94, 2.07 0.98, 2.24
LDLC (mmol/L)* 2.54 2.75 3.11 <0.0001 <0.0001 0.1305
2.04, 3.09 2.28, 3.29 2.52, 3.37
HDLC (mmol/L)* 1.25 1.25 1.25 0.4728 0.9045 0.8669
1.07, 1.48 1.06, 1.48 1.05, 1.53
ΔI30/ΔG30a,* 8.28 7.75 5.97 0.0132 0.8311 0.2763
4.39, 15.50 3.91, 14.92 4.03, 12.53
CIR* 750.8 688.2 461.9 0.0001 <0.0001 0.0039
427.3, 1324.3 375.3, 1261.9 266.1, 954.5
ISI* 136.3 116.9 115.5 <0.0001 <0.0001 0.0107
92.7, 193.9 76.8, 165.6 73.2, 153.2
(Continued)
Family History Risk Categories and Diabetes
PLOS ONE | DOI:10.1371/journal.pone.0117044 February 9, 2015 6 / 13
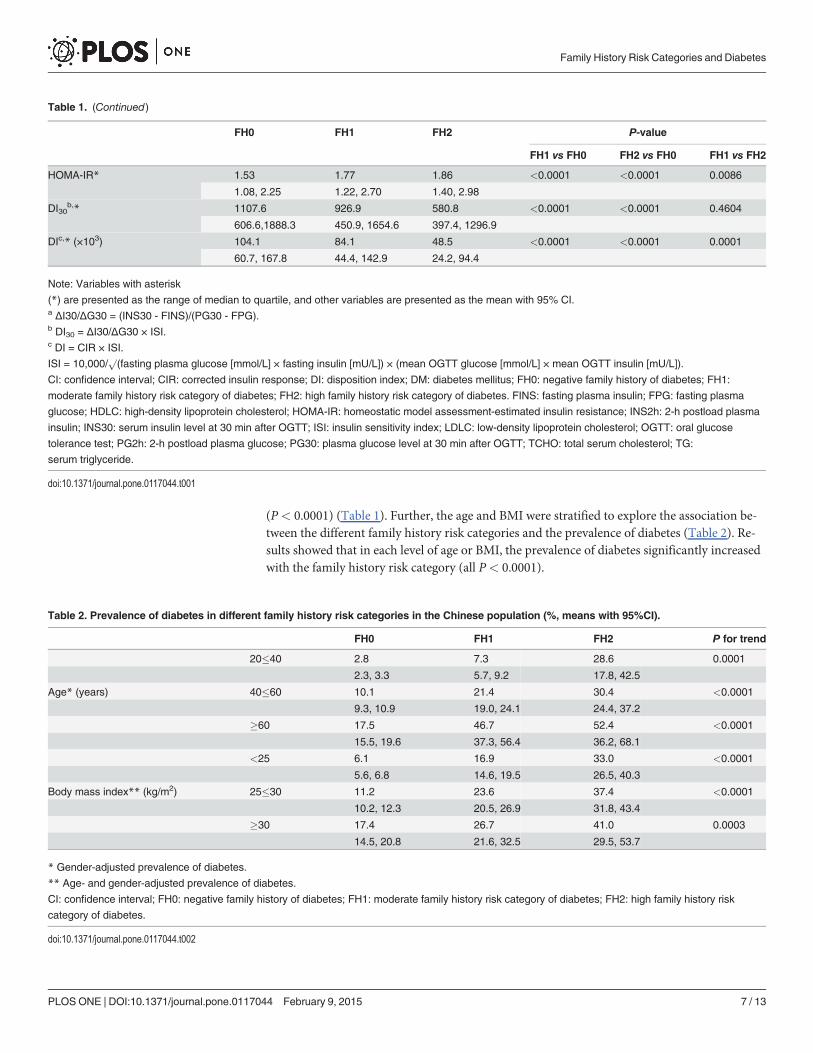
(P< 0.0001) (Table 1). Further, the age and BMI were stratified to explore the association be-tween the different family history risk categories and the prevalence of diabetes (Table 2). Re-sults showed that in each level of age or BMI, the prevalence of diabetes significantly increasedwith the family history risk category (all P< 0.0001).
Table 1. (Continued)
FH0 FH1 FH2 P-value
FH1 vs FH0 FH2 vs FH0 FH1 vs FH2
HOMA-IR* 1.53 1.77 1.86 <0.0001 <0.0001 0.0086
1.08, 2.25 1.22, 2.70 1.40, 2.98
DI30b,* 1107.6 926.9 580.8 <0.0001 <0.0001 0.4604
606.6,1888.3 450.9, 1654.6 397.4, 1296.9
DIc,* (×103) 104.1 84.1 48.5 <0.0001 <0.0001 0.0001
60.7, 167.8 44.4, 142.9 24.2, 94.4
Note: Variables with asterisk
(*) are presented as the range of median to quartile, and other variables are presented as the mean with 95% CI.a ΔI30/ΔG30 = (INS30 - FINS)/(PG30 - FPG).b DI30 = ΔI30/ΔG30 × ISI.c DI = CIR × ISI.
ISI = 10,000/p(fasting plasma glucose [mmol/L] × fasting insulin [mU/L]) × (mean OGTT glucose [mmol/L] × mean OGTT insulin [mU/L]).
CI: confidence interval; CIR: corrected insulin response; DI: disposition index; DM: diabetes mellitus; FH0: negative family history of diabetes; FH1:
moderate family history risk category of diabetes; FH2: high family history risk category of diabetes. FINS: fasting plasma insulin; FPG: fasting plasma
glucose; HDLC: high-density lipoprotein cholesterol; HOMA-IR: homeostatic model assessment-estimated insulin resistance; INS2h: 2-h postload plasma
insulin; INS30: serum insulin level at 30 min after OGTT; ISI: insulin sensitivity index; LDLC: low-density lipoprotein cholesterol; OGTT: oral glucose
tolerance test; PG2h: 2-h postload plasma glucose; PG30: plasma glucose level at 30 min after OGTT; TCHO: total serum cholesterol; TG:
serum triglyceride.
doi:10.1371/journal.pone.0117044.t001
Table 2. Prevalence of diabetes in different family history risk categories in the Chinese population (%, means with 95%CI).
FH0 FH1 FH2 P for trend
20�40 2.8 7.3 28.6 0.0001
2.3, 3.3 5.7, 9.2 17.8, 42.5
Age* (years) 40�60 10.1 21.4 30.4 <0.0001
9.3, 10.9 19.0, 24.1 24.4, 37.2
�60 17.5 46.7 52.4 <0.0001
15.5, 19.6 37.3, 56.4 36.2, 68.1
<25 6.1 16.9 33.0 <0.0001
5.6, 6.8 14.6, 19.5 26.5, 40.3
Body mass index** (kg/m2) 25�30 11.2 23.6 37.4 <0.0001
10.2, 12.3 20.5, 26.9 31.8, 43.4
�30 17.4 26.7 41.0 0.0003
14.5, 20.8 21.6, 32.5 29.5, 53.7
* Gender-adjusted prevalence of diabetes.
** Age- and gender-adjusted prevalence of diabetes.
CI: confidence interval; FH0: negative family history of diabetes; FH1: moderate family history risk category of diabetes; FH2: high family history risk
category of diabetes.
doi:10.1371/journal.pone.0117044.t002
Family History Risk Categories and Diabetes
PLOS ONE | DOI:10.1371/journal.pone.0117044 February 9, 2015 7 / 13

Tab
le3.
Ass
ociationbetwee
nfamily
history
risk
categories
andinsu
linse
cretionan
dresistan
ce.
NGT
Prediabetes
DM
FH0
FH1
FH2
Pfortren
dFH0
FH1
FH2
Pfortren
dFH0
FH1
FH2
Pfortren
d
ΔI30/ΔG30
9.29
9.57
9.60
0.00
016.31
6.25
4.26
0.17
373.15
3.35
3.22
0.20
13
5.04
,16.97
5.03
,17.27
5.37
,21.63
3.42
,11.51
3.54
,12.11
4.19
,6.29
1.64
,7.2
11.69
,5.64
1.51
,7.50
CIR
860.8
890.0
917.8
0.23
3655
4.7
603.9
406.8
0.27
4125
8.7
252.5
195.5
0.00
91
521.8,
1487
.39
517.4,
1499
.450
4.8,
1515
.632
6.6,
958.2
373.5,
1025
.939
6.7,
558.4
142.0,
505.0
133.0,
507.7
88.6,4
62.6
HOMA-IR
1.42
1.55
1.70
<0.00
011.77
2.01
1.40
0.12
512.79
3.55
3.29
0.18
60
1.03
,2.01
1.13
,2.16
0.94
,2.37
1.19
,2.64
1.32
,3.02
1.39
,2.25
1.67
,4.42
2.23
,5.91
2.00
,5.81
ISI
148.9
134.7
122.9
<0.00
0110
7.8
89.8
117.4
0.08
4480
.571
.973
.50.71
44
105.7,
208.2
97.2,1
81.1
84.0,1
93.3
72.2,1
57.1
60.9,1
38.2
92.7,1
17.9
52.9,1
22.1
44.1,1
01.9
43.4,1
32.1
DI 30
1320
.411
86.9
1256
.20.42
2566
3.4
588.4
501.1
<0.00
0127
0.3
221.8
199.9
0.00
10
812.2,
2138
.872
2.1,
1981
.575
4.6,
2063
.540
7.2,
994.9
361.9,
902.3
435.3,
555.8
144.0,
513.0
124.7,
395.4
125.9,
460.0
DI(×10
3)
125.3
113.2
101.4
0.00
0159
.452
.248
.20.00
0422
.218
.516
.50.00
01
83.5,1
29.6
74.9,1
72.9
71.9,1
77.5
40.9,8
5.3
40.5,7
8.2
40.9,5
0.3
12.6,3
7.9
9.3,
29.5
8.4,
25.1
Note:
Variables
arepres
entedas
therang
eof
med
ianto
quartile.
ΔI30/ΔG30
=(INS30
-FINS)/(PG30
-FPG);ISI=
10,000
/p(fas
tingplas
magluc
ose[m
mol/L]×
fastinginsu
lin[m
U/L])×(m
eanOGTTgluc
ose[m
mol/L]×
mea
nOGTTinsu
lin[m
U/
L]);DI=
CIR
×ISI;DI 30=ΔI30/ΔG30
×ISI
CIR:c
orrected
insu
linresp
onse
;DI:disp
osition
inde
x;DM:d
iabe
tesmellitus
;FH0:
nega
tivefamily
historyof
diab
etes
;FH1:
mod
eratefamily
historyris
kca
tego
ryof
diab
etes
;FH2:
high
family
historyris
kca
tego
ryof
diab
etes
;FINS:fas
tingplas
mainsu
lin;F
PG:fas
tingplas
magluc
ose;
HOMA-IR:h
omeo
staticmod
elas
sessmen
t-es
timated
insu
linresistan
ce;
INS30
:serum
insu
linleve
lat3
0min
afterOGTT;ISI:insu
linse
nsitivity
inde
x;NGT:n
ormal
gluc
osetoleranc
e;OGTT:o
ralg
luco
setoleranc
etest;P
G30
:plasm
agluc
oseleve
lat3
0
min
afterOGTT.
doi:10.1371/journal.pone.0117044.t003
Family History Risk Categories and Diabetes
PLOS ONE | DOI:10.1371/journal.pone.0117044 February 9, 2015 8 / 13
Association between family history risk categories and insulin secretionand resistanceIn comparison to those in the risk category of FH0, both ΔI30/ΔG30 and CIR continuously de-creased in the risk categories of FH1 and FH2. The indicator for insulin sensitivity, ISI, alsosuccessively decreased in FH1 and FH2, while HOMA-IR, indicative of insulin resistance,showed an increase. After the adjustment for insulin sensitivity, the declining tendency in theinsulin secretory function (described by DI and DI30) became more significant with the in-creasing family history risk category of diabetes (Table 1). Even if the glucose tolerance statuswas further divided into three levels (normal glucose tolerance, NGT; prediabetes; and diabe-tes), there remained significant declining trends in DI and DI30 of different glucose tolerancestatuses (Table 3).
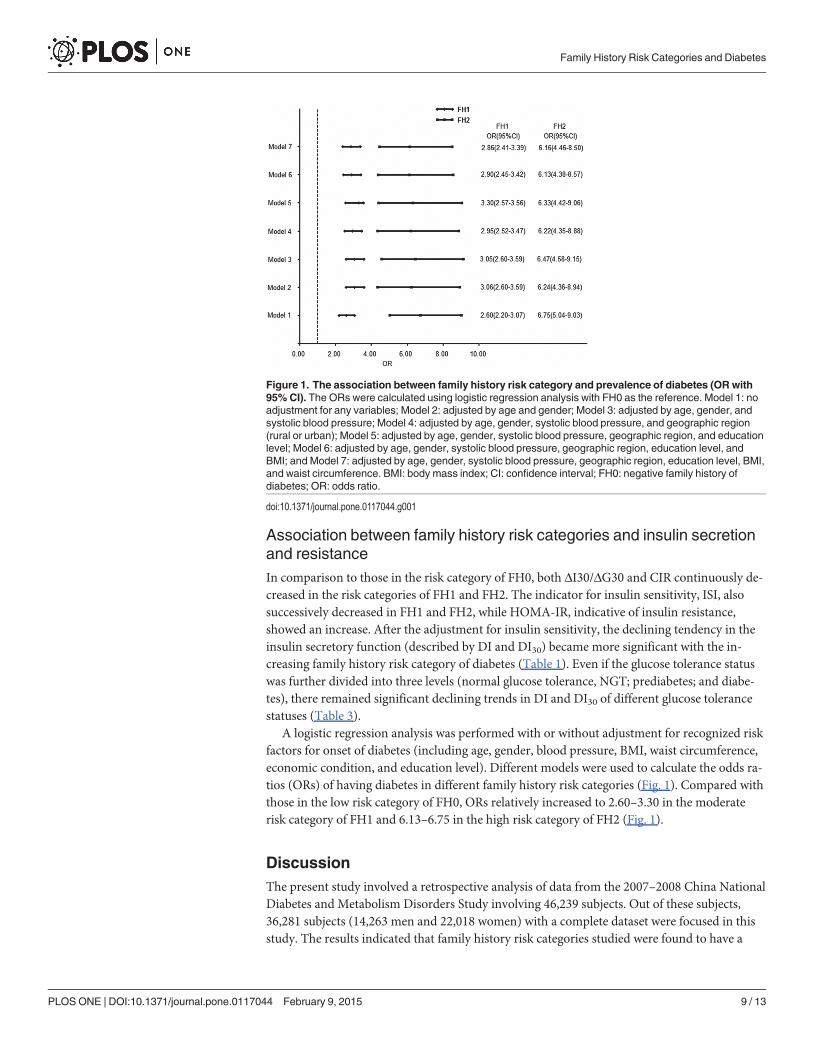
A logistic regression analysis was performed with or without adjustment for recognized riskfactors for onset of diabetes (including age, gender, blood pressure, BMI, waist circumference,economic condition, and education level). Different models were used to calculate the odds ra-tios (ORs) of having diabetes in different family history risk categories (Fig. 1). Compared withthose in the low risk category of FH0, ORs relatively increased to 2.60–3.30 in the moderaterisk category of FH1 and 6.13–6.75 in the high risk category of FH2 (Fig. 1).
DiscussionThe present study involved a retrospective analysis of data from the 2007–2008 China NationalDiabetes and Metabolism Disorders Study involving 46,239 subjects. Out of these subjects,36,281 subjects (14,263 men and 22,018 women) with a complete dataset were focused in thisstudy. The results indicated that family history risk categories studied were found to have a
Figure 1. The association between family history risk category and prevalence of diabetes (OR with95% CI). The ORs were calculated using logistic regression analysis with FH0 as the reference. Model 1: noadjustment for any variables; Model 2: adjusted by age and gender; Model 3: adjusted by age, gender, andsystolic blood pressure; Model 4: adjusted by age, gender, systolic blood pressure, and geographic region(rural or urban); Model 5: adjusted by age, gender, systolic blood pressure, geographic region, and educationlevel; Model 6: adjusted by age, gender, systolic blood pressure, geographic region, education level, andBMI; and Model 7: adjusted by age, gender, systolic blood pressure, geographic region, education level, BMI,and waist circumference. BMI: body mass index; CI: confidence interval; FH0: negative family history ofdiabetes; OR: odds ratio.
doi:10.1371/journal.pone.0117044.g001
Family History Risk Categories and Diabetes
PLOS ONE | DOI:10.1371/journal.pone.0117044 February 9, 2015 9 / 13
significant association with prevalence of diabetes in the country. Hence, the results carry sig-nificant relevance in understanding the etiology and prevalence of diabetes among the Chinesepopulation. The etiology of diabetes involves genetic and environmental factors as well as theircomplex interactions[4,5]. Substantial epidemiological research has confirmed that family his-tory of diabetes, advanced age, obesity (especially abdominal obesity), physical inactivity, andabnormal lipid metabolism are independent risk factors for diabetes[2,3,6,7]. Individuals witha positive family history of diabetes experience 3- to 4-fold higher risks for this disease thanthose with a negative family history of diabetes [2,3,6–8], and the risk of developing diabetes isrelated to the type [8] and number of affected relatives [6–9].
In the nationwide cross-sectional study, results showed that the proportion of first-degreerelatives with a positive family history of diabetes was up to 15.5% in the Chinese population.Of these, the proportion of at least two generations of the first-degree relatives with a positivefamily history of diabetes was 1.6%. The age of diagnosis of diabetes in those with a positivefamily history of diabetes was earlier than those with a negative family history of this disease.This study took the lead to classify the family history of diabetes into different risk categories inthe Chinese population according to the generation number of the affected first-degree rela-tives. Additionally, this study demonstrated that with the increasing family history risk catego-ry of diabetes, a gradual increase was observed in the levels of diabetes-associated metabolicabnormalities including central obesity, BMI, blood pressure, and lipid levels. Moreover, thegroup with a positive family history of diabetes had higher ratios of smoking and drinking, tosome extent reflecting a more negative lifestyle. Thus, it is not surprising that the prevalence ofdiabetes increased with the family history risk category of this disease.
As the age and BMI are strong risk factors for diabetes, this study also referred to the Na-tional Health and Nutrition Examination Survey of the United States (NHANES) [9] and ana-lyzed the association between family history risk category and prevalence of diabetes afterstratification of age and BMI into multiple levels. At each level of the age or BMI, the preva-lence rate of diabetes continued to increase significantly with the family history risk category ofthis disease. The results of a further multivariate analysis showed that the hierarchical associa-tion between the family history risk category and the prevalence rate of diabetes was indepen-dent of some major risk factors for diabetes such as age, gender, BMI, and economicdevelopment. This conclusion is consistent with that of NHANES, despite certain differencebetween the definitions of family history risk category in both the studies.
Insulin resistance and abnormal insulin secretion are the most important prerequisites forthe occurrence of type 2 diabetes. Some studies show that the first-degree relatives of type 2 di-abetes have experienced insulin resistance even in the normal status of glucose tolerance [21–23], whereas other studies have presented different results and proposed that the first-degreerelatives of diabetes mainly had abnormal insulin secretion [17,24,25]. The main reasons forthe above contradiction are as follows: (1) The interrelation between insulin secretion andinsulin sensitivity is not considered. The maintenance of glucose homeostasis depends on thebalance of insulin secretion and insulin sensitivity. There is a hyperbolic equation betweenboth the above-mentioned parameters, i.e., the product of insulin sensitivity and acute insulinresponse is a constant, commonly known as the glucose DI [26]. The DI is equivalent to theβ-cell secretion function after the adjustment for insulin sensitivity. (2) Insulin secretionand insulin sensitivity are not estimated after the stratification of different glucose tolerancestatuses because the levels of impaired insulin secretion and insulin resistance vary with dif-ferent glucose tolerance types [27–29]. (3) The accuracy of estimating insulin secretion andinsulin sensitivity using simple indices based on fasting and postloading blood glucose and in-sulin levels may vary in different glucose tolerance statuses [30], as confirmed by the results ofthis study.
Family History Risk Categories and Diabetes
PLOS ONE | DOI:10.1371/journal.pone.0117044 February 9, 2015 10 / 13
In this study, through the overall analysis on the Chinese population, it was found that withthe increasing family history risk category of diabetes, the insulin secretion indices both ΔI30/ΔG30 and CIR exhibited significant decreasing tendencies, while HOMA-IR showed progres-sive increases and ISI showed gradual declines. After the adjustment for insulin resistance, theinsulin secretion indices DI30 and DI exhibited even more significant declining tendencies. Fur-ther, the population was divided into three groups according to the glucose tolerance status, i.e., NGT, prediabetes, and diabetes. Results showed that ΔI30/ΔG30 had a compensatory in-crease with the family history risk category in the NGT group, with no significant changes inthe other two groups (prediabetes and diabetes). In contrast, CIR significantly declined with in-creasing family history risk category in the diabetes group. Both DI30 and DI had linear de-creases with increasing family history risk category in all the three groups (NGT, prediabetes,and diabetes). The above-mentioned results indicate that the first-degree relatives of diabetesmainly had β-cell dysfunction, and that the higher the family history risk category, the more se-vere the β-cell dysfunction.
The present study also has its own limitations. First, in the 2007–2008 DMS database, infor-mation regarding the prevalence of diabetes in the first-degree relatives is incomplete, un-known, or missing for one-fifth of the subjects. During the in-depth analysis, these subjectswere excluded, which might raise questions regarding the representativeness of the study datafor the overall situation of the Chinese population. This is despite the fact that the general in-formation was compared between the groups included and excluded, and found no significantdifferences in the major parameters related to diabetes (age, gender, BMI, waist circumference,blood pressure, and education level). Second, the 2007–2008 DMS database provides informa-tion on the prevalence of diabetes in the first-degree relatives but not in the second-degree rela-tives. Thus, in this study, the definition of family history risk category of diabetes may berestrictive. Finally, the family history of diabetes was self-reported by the subjects through aquestionnaire survey, perhaps with reporting bias. The information obtained was not verifiedlater, and the accuracy of reports was not validated through random sampling. However, a uni-fied training of inquiry methods and techniques was provided for physicians or nurses involvedin collecting information on the family history of diabetes; and only the first-degree relatives(parents, siblings, and children) who are closely associated with the subjects in their daily lifewere surveyed. Thus, it is reasonable to believe that the accuracy of reports on disease history isrelatively high.
In conclusion, this study represents a large-sample representative study of the Chinese pop-ulation. Results show that family history risk category of the first-degree relatives of diabetesnot only significantly relates to the level of β-cell defects but also has a significant and indepen-dent rank correlation with the prevalence of diabetes in individuals. Risk assessment, screening,and prevention of diabetes should therefore consider the positive or negative as well as the riskcategory of family history of this disease.
Supporting InformationS1 Appendix. Members of the China National Diabetes and Metabolic Disorders StudyGroup.(DOC)
AcknowledgmentsWe thank all the members of the China National Diabetes and Metabolic Disorders StudyGroup for their contribution to the study, as listed in S1 Appendix.
Family History Risk Categories and Diabetes
PLOS ONE | DOI:10.1371/journal.pone.0117044 February 9, 2015 11 / 13
Author ContributionsConceived and designed the experiments: ZY JZ JXWY. Performed the experiments: XX JLJWWJ LJ ZS JL HT QJ DZ JG LC XG Z. Zhao QL Z. Zhou LL NW. Analyzed the data: ZY JXWY. Contributed reagents/materials/analysis tools: JL JWWJ LJ ZS JL HT QJ DZ JG LC XGZ. Zhao QL Z. Zhou LL. Wrote the paper: ZY JZWY JX. Interpretation of data, reviewed andcritically revised the manuscript: XX JL JWWJ ZS HT QJ NW.
References1. International Diabetes Federation (2013) IDF Diabetes Atlas, 6th edn. Brussels, Belgium: Internation-
al Diabetes Federation. doi: 10.3390/jpm3040288 PMID: 25566432
2. YangW, Lu J, Weng J, Jia W, Ji L, et al. (2010) Prevalence of diabetes among men and women inChina. N Engl J Med 362: 1090–1101. doi: 10.1056/NEJMoa0908292 PMID: 20335585
3. Xu Y, Wang L, He J, Bi Y, Li M, et al. (2013) Prevalence and control of diabetes in Chinese adults.JAMA 310: 948–959. doi: 10.1001/jama.2013.168118 PMID: 24002281
4. Moonesinghe R, Ioannidis JP, FlandersWD, Yang Q, Truman BI, et al. (2012) Estimating the contribu-tion of genetic variants to difference in incidence of disease between population groups. Eur J HumGenet 20:831–836. doi: 10.1038/ejhg.2012.15 PMID: 22333905
5. Temelkova-Kurktschiev T, Stefanov T (2012) Lifestyle and genetics in obesity and type 2 diabetes. ExpClin Endocrinol Diabetes 120:1–6. doi: 10.1055/s-0031-1285832 PMID: 21915815
6. Grill V, Persson G, Carlsson S, Norman A, Alvarsson M, et al. (1999) Family history of diabetes in mid-dle-aged Swedish men is a gender unrelated factor which associates with insulinopenia in newly diag-nosed diabetic subjects. Diabetologia 42: 15–23. PMID: 10096799
7. Hariri S, Yoon PW, Qureshi N, Valdez R, Scheuner MT, et al. (2006) Family history of type 2 diabetes: apopulation-based screening tool for prevention? Genet Med 8: 102–108. PMID: 16481893
8. Meigs JB, Cupples LA, Wilson PW (2000) Parental transmission of type 2 diabetes: the FraminghamOffspring Study. Diabetes 49: 2201–2207. PMID: 11118026
9. Valdez R, Yoon PW, Liu T, Khoury MJ (2007) Family history and prevalence of diabetes in the U.S. pop-ulation: the 6-year results from the National Health and Nutrition Examination Survey (1999–2004). Dia-betes Care 30: 2517–2522. PMID: 17634276
10. Kim DJ, Cho NH, Noh JH, Lee MS, Lee MK, et al. (2004) Lack of excess maternal transmission of type2 diabetes in a Korean population. Diabetes Res Clin Pract 65: 117–124. PMID: 15223223
11. Franks PW (2010) Diabetes family history: a metabolic storm you should not sit out. Diabetes 59:2732–2734. doi: 10.2337/db10-0768 PMID: 20980473
12. Pan XR, YangWY, Li GW, Liu J (1997) Prevalence of diabetes and its risk factors in China, 1994 Na-tional Diabetes Prevention and Control Cooperative Group. Diabetes Care 20: 1664–1669. PMID:9353605
13. Joint Committee for Developing Chinese guidelines on Prevention and Treatment of Dyslipidemia inAdults (2007) Chinese guidelines on prevention and treatment of dyslipidemia in adults. Zhonghua XinXue Guan Bing Za Zhi 35: 390–419.(in Chinese) PMID: 17711682
14. Bao Y, Lu J, Wang C, Yang M, Li H, et al. (2008) Optimal waist circumference cutoffs for abdominalobesity in Chinese. Atherosclerosis 201: 378–384. doi: 10.1016/j.atherosclerosis.2008.03.001 PMID:18417137
15. Department of Noncommunicable Disease Surveillance (1999) Definition, diagnosis and classificationof diabetes mellitus and its complications: report of a WHO consultation. Part 1. Diagnosis and classifi-cation of diabetes mellitus. Geneva: World Health Organization. PMID: 25506965
16. Haffner SM, Miettinen H, Gaskill SP, Stern MP (1996) Decreased insulin action and insulin secretionpredict the development of impaired glucose tolerance. Diabetologia 39: 1201–1207. PMID: 8897008
17. Isomaa B, Forsen B, Lahti K, Holmstrom N, Waden J, et al. (2010) A family history of diabetes is associ-ated with reduced physical fitness in the Prevalence, Prediction and Prevention of Diabetes (PPP)-Bot-nia study. Diabetologia 53: 1709–1713. doi: 10.1007/s00125-010-1776-y PMID: 20454776
18. Matthews DR, Hosker JP, Rudenski AS, Naylor BA, Treacher DF, et al. (1985) Homeostasis model as-sessment: insulin resistance and beta-cell function from fasting plasma glucose and insulin concentra-tions in man. Diabetologia 28: 412–419. PMID: 3899825
19. Matsuda M, DeFronzo RA (1999) Insulin sensitivity indices obtained from oral glucose tolerance test-ing: comparison with the euglycemic insulin clamp. Diabetes Care 22: 1462–1470. PMID: 10480510
Family History Risk Categories and Diabetes
PLOS ONE | DOI:10.1371/journal.pone.0117044 February 9, 2015 12 / 13

20. Muniyappa R, Lee S, Chen H, Quon MJ (2008) Current approaches for assessing insulin sensitivityand resistance in vivo: advantages, limitations, and appropriate usage. Am J Physiol Endocrinol Metab294: E15–26. PMID: 17957034
21. Ishikawa M, Pruneda ML, Adams-Huet B, Raskin P (1998) Obesity-independent hyperinsulinemia innondiabetic first-degree relatives of individuals with type 2 diabetes. Diabetes 47: 788–792. PMID:9588451
22. Warram JH, Martin BC, Krolewski AS, Soeldner JS, Kahn CR (1990) Slow glucose removal rate andhyperinsulinemia precede the development of type II diabetes in the offspring of diabetic parents. AnnIntern Med 113: 909–915. PMID: 2240915
23. Gulli G, Ferrannini E, Stern M, Haffner S, DeFronzo RA (1992) The metabolic profile of NIDDM is fullyestablished in glucose-tolerant offspring of two Mexican-American NIDDM parents. Diabetes 41:1575–1586. PMID: 1446799
24. Goran MI, Coronges K, Bergman RN, Cruz ML, Gower BA (2003) Influence of family history of type 2 di-abetes on insulin sensitivity in prepubertal children. J Clin Endocrinol Metab 88: 192–195. PMID:12519851
25. van Haeften TW, Dubbeldam S, Zonderland ML, Erkelens DW (1998) Insulin secretion in normal glu-cose-tolerant relatives of type 2 diabetic subjects. Assessments using hyperglycemic glucose clampsand oral glucose tolerance tests. Diabetes Care 21: 278–282. PMID: 9539996
26. Utzschneider KM, Prigeon RL, Carr DB, Hull RL, Tong J, et al. (2006) Impact of differences in fastingglucose and glucose tolerance on the hyperbolic relationship between insulin sensitivity and insulin re-sponses. Diabetes Care 29:356–362. PMID: 16443887
27. Hanefeld M, Koehler C, Fuecker K, Henkel E, Schaper F, et al. (2003) Insulin secretion and insulin sen-sitivity pattern is different in isolated impaired glucose tolerance and impaired fasting glucose: the riskfactor in Impaired Glucose Tolerance for Atherosclerosis and Diabetes study. Diabetes Care 26: 868–874. PMID: 12610051
28. Weyer C, Bogardus C, Pratley RE (1999) Metabolic characteristics of individuals with impaired fastingglucose and/or impaired glucose tolerance. Diabetes 48: 2197–2203. PMID: 10535454
29. Davies MJ, Raymond NT, Day JL, Hales CN, Burden AC (2000) Impaired glucose tolerance and fastinghyperglycaemia have different characteristics. Diabet Med 17: 433–440. PMID: 10975211
30. Hanson RL, Pratley RE, Bogardus C, Narayan KM, Roumain JM, et al. (2000) Evaluation of simple indi-ces of insulin sensitivity and insulin secretion for use in epidemiologic studies. Am J Epidemiol 151:190–198. PMID: 10645822
Family History Risk Categories and Diabetes
PLOS ONE | DOI:10.1371/journal.pone.0117044 February 9, 2015 13 / 13
Copyright © 2022 FDOKUMEN