Prevalence, Knowledge, Attitude and Practice on Refractive ...
110
Prevalence, Knowledge, Attitude and Practice on Refractive error among Students attending Public High Schools in Nairobi County Research dissertation in part fulfilment for the degree of Master of Medicine, Ophthalmology: Principal Researcher :Dr. Lily A. Nyamai, University of Nairobi n
-
Upload
khangminh22 -
Category
Documents
-
view
2 -
download
0
Transcript of Prevalence, Knowledge, Attitude and Practice on Refractive ...

Prevalence, Knowledge,
Attitude and Practice on
Refractive error among
Students attending Public
High Schools in Nairobi
County Research dissertation in part fulfilment for the
degree of Master of Medicine, Ophthalmology:
Principal Researcher :Dr. Lily A. Nyamai, University of Nairobi n

1
DECLARATION
This proposal is my original work and has not been presented for a degree in any other
University.
Signed ………………………………………….... Date………………………………
Dr. Lily Adhiambo Nyamai
2
APPROVAL
This dissertation has been submitted with our approval as University supervisors:
Dr. Margaret W Njuguna,
MBChB, M. Med. Ophthalmology (Nairobi), Paediatric Ophthalmologist (LVPEI –
India), FEACO, Lecturer, department of ophthalmology, University of Nairobi
Signed ……………………………………………… Date ………………………………..
Dr. Lucy Njambi Ombaba
MBchB, M. Med. Ophthalmology. (Nairobi), ICO, FEACO, Paediatric Ophthalmologist
Lecturer, Department of Ophthalmology, University of Nairobi
Signed ……………………………………………… Date ………………………………….
3
DEDICATION
To my dedicated husband, and to my loving and supportive family.

4
ACKNOWLEDGEMENTS
I would like to express my gratitude to the department of ophthalmology, most especially to
Dr. M Njuguna and Dr. Njambi Ombaba. I am thankful for their aspiring guidance,
invaluably constructive criticism, friendly advice during the project work and providing the
instruments used during the study.
LHBS for providing the financial support needed to carry out this project.
Dr. Ngandu and Dr. Ng’anga were also very instrumental to the smooth running of the
project by contributing their time for data collection and for this I am very grateful.
I would like to appreciate the Ministry of education especially the assistant county director of
education, Mr. Samuel Boto who was very instrumental in facilitating my data collection.
Lastly I would like to extend my hearty gratitude to all the students, principals and teachers
who participated in the study for their support.

5
TABLE OF CONTENTS
DECLARATION ....................................................................................................................... 1
APPROVAL .............................................................................................................................. 2
DEDICATION ........................................................................................................................... 3
ACKNOWLEDGEMENTS ....................................................................................................... 4
LIST OF FIGURES ................................................................................................................... 7
LIST OF TABLES ..................................................................................................................... 8
ACRONYMS AND ABBREVIATIONS .................................................................................. 9
STUDY DEFINITIONS .......................................................................................................... 10
ABSTRACT ............................................................................................................................. 11
1.0 INTRODUCTION ............................................................................................................. 13
1.1.0 TYPES OF AMMETROPIA/ REFRACTIVE ERROR.............................................. 13
1.1.1 MYOPIA (SHORT-SIGHTED) .............................................................................. 14
1.1.2 HYPERMETROPIA (LONG-SIGHTED) .............................................................. 15
1.1.3 ASTIGMATISM ..................................................................................................... 16
2.0 LITERATURE REVIEW .................................................................................................. 18
2.1.0 PREVALENCE OF REFRACTIVE ERRORS........................................................... 18
2.2.0 DISTRIBUTION OF REFRACTIVE ERRORS IN SCHOOL AGE CHILDREN
AND ADOLESCENTS ........................................................................................................ 21
2.2.1 MYOPIA ................................................................................................................. 21
2.2.2 HYPEROPIA ........................................................................................................... 22
2.2.3 ASTIGMATISM ..................................................................................................... 23
2.3.0 KNOWLEDGE, ATTITUDE AND PRACTICE IN REFRACTIVE ERROR .......... 25
3.0 STUDY JUSTIFICATION ................................................................................................ 28
4.0 STUDY OBJECTIVES. ..................................................................................................... 30
5.0 METHODS ........................................................................................................................ 31
5.1.0 STUDY DESIGN ........................................................................................................ 31
5.2.0 STUDY POPULATION ............................................................................................. 31
5.3.0 STUDY INCLUSION AND EXCLUSION CRITERIA ............................................ 31
5.4.0 STUDY AREA ............................................................................................................ 31
5.5.0 STUDY PERIOD ........................................................................................................ 33
5.6.0 SAMPLE SIZE CALCULATION AND SAMPLING METHOD ............................. 33
5.7.0 SAMPLING PROCEDURE ........................................................................................ 34

6
5.8.0 STUDY TEAM ........................................................................................................... 36
5.9.0 MATERIALS REQUIRED ......................................................................................... 36
5.10.0 DATA COLLECTION PROCEDURE ..................................................................... 37
5.11.0 TRAINING PROCEDURES FOR KEY RESEARCH PERSONEL ....................... 40
5.12.0 QUALITY ASSUARANCE MEASURES ............................................................... 40
5.13.0 ETHICAL CONSIDERATIONS .............................................................................. 41
5.15.0 DATA MANAGEMENT .......................................................................................... 41
6.0 RESULTS .......................................................................................................................... 44
7.0 DISCUSSION .................................................................................................................... 65
8.0 LIMITATIONS AND STRENGTHS ................................................................................ 77
9.0 CONCLUSION .................................................................................................................. 78
10.0 RECOMMENDATIONS ................................................................................................. 79
REFRENCE ............................................................................................................................. 80
APPENDIX 1: ETHICAL APPROVAL ................................................................................. 85
APPENDIX 2: APPROVAL, COUNTY DIRECTOR OF EDUCATION ............................. 87
APPENDIX 3: KAP QUESTIONNAIRE AND VISUAL ASSESSMENT............................ 88
APPENDIX 4 - VISUAL ASSESSMENT OF STUDENT WITH R.E AND ALL THOSE
CURRENTLY USING SPECTACLES. .................................................................................. 93
APPENDIX 5: FOCUSED GROUP DISCUSSION AND IN DEPTH INTERVIEW GUIDE ;
.................................................................................................................................................. 95
APPENDIX 6: BUDGET AND BUDGET JUSTIFICATION ............................................... 96
APPENDIX 7: RANDOMIZATION OF SCHOOLS ............................................................. 97
APPENDIX 8: LETTER TO THE SCHOOLS FOR SEEKING PERMISSION .................... 98
APPENDIX 9: ASSENT FORM FOR CHILDREN/DEPENDENTS (English) .................. 100
APPENDIX 10: ASSENT FORM FOR CHILDREN/DEPENDENTS (Kiswahili) ............. 101
APPENDIX 11: PATIENT REFERRAL FORM .................................................................. 103
APPENDIX 12: WHO CATEGORIES OF VISUAL IMPAIRMENT AND BLINDNESS 104
APPENDIX 13-EYE EXAMINATION AND FOCUS GROUP DISCUSSION.................. 105
APPENDIX 14: PUBLIC SECONDARY SCHOOLS IN NAIROBI COUNTY ................. 106

7
LIST OF FIGURES
Figure 1: Map of Nairobi County ............................................................................................ 32
Figure 2: Data collection process (all form III students) ......................................................... 39
Figure 3: Data analysis............................................................................................................. 43
Figure 4: Total number of students in respective schools........................................................ 44
Figure 5: Flow diagram of students ......................................................................................... 45
Figure 6: Age distribution of the students................................................................................ 47
Figure 7: Prevalence of Refractive Error, N=1376 .................................................................. 48
Figure 8: Proportion of students with R.E who had corrected, uncorrected and under
corrected refractive error, n=237 ............................................................................................. 50
Figure 9: Proportion of students with refractive error with anisometropia ............................. 51
Figure 10: Attitude of students towards spectacle use ............................................................. 54

8
LIST OF TABLES
Table 1: Sampling frame of high school students in Nairobi County ...................................... 35
Table 2: Demographic characteristics of the study students enrolled...................................... 46
Table 3: Prevalence of the types of refractive errors and comparison between males and
females ..................................................................................................................................... 49
Table 4: Students knowledge regarding refractive error.......................................................... 52
Table 5: Students general attitude towards spectacle use ........................................................ 55
Table 6: Students practice in refractive error ........................................................................... 56
Table 7: Students Practice on Spectacle Use .......................................................................... 57
Table 8: Comparison of Pattern of refractive error across regions .......................................... 68

9
ACRONYMS AND ABBREVIATIONS
BCVA Best corrected visual acuity
D Diopter
DC Diopter cylinder
DS Diopter sphere
LE Left eye
RE Right eye
VA Visual Acuity
CC With correction
SC Without correction
SR Subjective refraction
OR Objective refraction
cm Centimetre
Mm Millimetre
RE refractive error
WHO World Health Organization
SPSS Statistical Package of Social Science
KAP Knowledge Attitude and Practice
FGD Focused Group Discussion

10
STUDY DEFINITIONS
The following definitions will be considered for the study.
Amblyopia Unilateral or bilateral decreased best corrected visual acuity caused by any form
of visual deprivation and /or abnormal binocular interaction for which there is no pathology
of the eye or the visual pathway.
Blindness: vision less than 3/60 in the best corrected eye.
Low vision: vision worse than 6/18 and up to 3/60 in the better eye.
Disabling / significant refractive error: Presenting visual acuity of ≤6/12 in the better eye
due solely to uncorrected refractive error. Also referred to as significant refractive errors35
(Anon., 2014)
Significant astigmatism: of more than +/- 0.5 dioptre
Significant hyperopia: of more than +1.00 dioptre
Significant myopia: of more than -0.5 dioptre
Vision 2020: WHO global initiative by NGOs and Governments to reduce the burden of
avoidable blindness (preventable and treatable) by the year 2020.
Under corrected refractive error: Presenting V.A with correction of less than 6/12 in the
better eye.
Corrected refractive error: Presenting V.A cc of better than 6/12 in the better eye
Spherical Equivalent: Algebraic sum of the sphere and half the cylindrical value i.e sphere +
cylinder/2
Anisometropia: S.E of at least 1D difference.

11
ABSTRACT
BACKGROUND: Uncorrected refractive error is a major public health concern and is the
biggest cause of visual impairment in the world. Refractive errors can be easily corrected
with spectacles. Lack of knowledge, erroneous attitude and practices, contribute significantly
to the magnitude of uncorrected refractive errors.
PURPOSE: The objective this study was to assess the prevalence and type of refractive error
in urban public high school students as well as their knowledge, practice and attitude towards
refractive errors.
METHODS:
Study Design and Study Population: Cross sectional school based study with a qualitative
component in at least 1297 public high school students of Nairobi County, Kenya.
Data collection Procedure: The schools were selected by multistage random sampling and
the students included in each school category were based on proportion of students in each
stratification. All Form 3 students in the selected schools participated in the study. First, a
semi structured KAP questionnaire was administered to the students followed by an eye
examination that consisted of visual acuity using a Log MAR chart. The cut off for defining
significant refractive error was VA less than 6/12 in the better eye. For those whose vision
was less than 6/12 in the better eye a dry objective refraction was performed followed by
subjective refraction. Students with spectacles were tested for uncorrected and corrected VA.
The power of spectacles was read using the lensometer. For those wearing spectacles and VA
worse than 6/12 in the better eye with correction, objective then subjection refraction was
done. If VA did not improve by at least two lines in all students anterior and posterior
examination was performed to determine the cause. The students then participated in Focus

12
Group Discussion of 8-12 students and in-depth interviews with key informants (class or
head teacher). The information gathered was recorded in a questionnaire or a tape recorder.
Data Analysis: The data was analysed using SPSS 20.0.Graphs, tables and charts were used
to analyse means and proportions. Chi-square test was used compare means and proportions.
Results: The prevalence of significant R.E was found to be 17.2%. The prevalence of
myopia, hyperopia and astigmatism was 15.6%, 0.9% and 7.6% respectively. The proportion
of students with uncorrected refractive error was 64.1%. Only 39% of students had an eye
exam prior to this study. Cost (38%) and fear of being teased (38.1%) were the most
common reasons for not wearing spectacles amongst students. Mixed attitudes as regards
spectacles preventing normalization of eyes and spectacles leading to dependence and
worsening of vision were elicited. Most students (72.3%) of students with spectacles
preferred another way of correcting their poor vision and 69.1% of these preferred contact
lenses.
13
1.0 INTRODUCTION
Globally, uncorrected refractive errors are the main cause of moderate and severe visual
impairment and account for 43% of the world’s causes of visual impairment. Although
refractive errors are easy to correct and diagnose, 77.3% of children in Kenya who actually
need spectacles due to disabling refractive error do not have or wear spectacles (1)
. Therefore
uncorrected refractive error could have a substantial socioeconomic and psychological
impact, as it may hinder school performance and lead to development of amblyopia.
The prevalence of refractive error among the teenage age and high school students varies
depending on the region, race and ethnicity, with myopia being the most prevalent refractive
error ranging from 9.6% in South Africa (2)
to 73.9% in Singapore (3)
. Data are limited on the
prevalence of refractive error among high school students and teenagers in Kenya. Several
studies reported that a lack of knowledge regarding refractive error and incorrect attitudes
about spectacles are major contributors in uptake of refractive services. A study in conducted
among adults in Singapore with corrected and undercorrected refractive error reported those
with corrected refractive error had better knowledge and improved beliefs regarding spectacle
use (4)
. However, data are limited regarding the knowledge and attitudes of refractive error
among high school students. The objective of our study was to describe the prevalence and
pattern of refractive error as well as the knowledge, attitude and practice of refractive error
among in high school students in Nairobi, Kenya.
1.1.0 TYPES OF AMMETROPIA/ REFRACTIVE ERROR
Refractive error or ametropia refers to the absence of emmetropia, (the refractive state in
which parallel rays of light from a distant object are brought to focus on the retina in the non-
accommodating eye). Ametropia arises when light rays converge in front or behind the retina,
as a consequence of this, images seen are blurred, which is sometimes so severe that it creates
14
functional blindness for affected individuals. Refractive errors include myopia,
hypermetropia and astigmatism.
Refractive error is a continuum and changes in refracting status may occur throughout life.
Refractive changes result from a complex interplay of developmental, genetic, internal and
external factors that influence eye growth, size and shape which also change throughout life
and remain largely unknown. In general, infants are hyperopic at birth, become slightly more
hyperopic until seven years, and then experience a myopic shift toward emmetropia until the
eye reaches its adult dimensions, usually by about sixteen years (5)
.
1.1.1 MYOPIA (SHORT-SIGHTED)
This is a condition of the eye where the light that comes in does not directly focus on the
retina but in front of it, causing the image that one sees when looking at a distant object to be
out of focus, but in focus when looking at a close object.
For purposes of this study myopia can be classified by cause, degree and age of onset. In
classification by cause, myopia is divided into axial and refractive myopia (further
subdivided into curvature myopia and index myopia). Axial myopia is attributed to an
increase in the eye's axial length. Refractive myopia is attributed to the condition of the
refractive elements of the eye. Curvature myopia is attributed to excessive, or increased,
curvature of one or more of the refractive surfaces of the eye, especially the cornea. Index
myopia is attributed to variation in the index of refraction of one or more of the ocular media.
Degenerative myopia, also known as malignant, pathological, or progressive myopia, is
characterized by marked retinal changes, such as posterior staphyloma, and associated with a
high refractive error and subnormal visual acuity after correction. This form of myopia gets
progressively worse over time. Degenerative myopia has been reported as one of the main
causes of visual impairment. (6)

15
In classification by degree or severity; Low myopia usually describes myopia of −3.00
dioptres or less (i.e. closer to 0.00). Medium myopia usually describes myopia between −3.00
and −6.00 dioptres. High myopia usually describes myopia of −6.00 or more (6)
.
Myopia is sometimes classified by the age at onset. Congenital myopia, also known as
infantile myopia, is present at birth and persists through infancy. Youth onset myopia occurs
in the early childhood or teenage, and the ocular power can keep varying until 21 years of
age, before which any form of corrective surgery is usually not recommended by ophthalmic
specialists around the world. This is because the eye reaches adult dimentions by around 16
years of age (7)
. School myopia appears during childhood, particularly the school-age years.
This form of myopia is attributed to the use of the eyes for close work during the school years
(6).Adult onset myopia is further classified into early adult onset myopia occurs between ages
20 and 40 and late adult onset myopia occurs after age 40 (7)
.
1.1.2 HYPERMETROPIA (LONG-SIGHTED)
This is the refractive state of the eye where parallel rays of light coming from infinity are
focused behind the retina in non-accommodating eye, resulting in a blurred image. People
with hypermetropia are at a risk of developing asthenopia, accommodative dysfunction,
binocular dysfunction, amblyopia and strabismus.
Hypermetropia can be classified etiologically, clinically and on severity in relation to
accommodation and outcome of cycloplegic refraction. Etiologically hyperopia is classified
as follows. Axial hyperopia, which is the commonest form, a one millimeter shortening of the
eyeball results in 3Dioptre of hypermetropia. Curvature hyperopia result by flattening of
curvature of the cornea or lens or both, therefore diminish the refractive power of the eye. In
Curvature hyperopia a one millimeter increase in radius of curvature results in 6 Diopter of
hyperopia. Index hyperopia is due to change in refractive index of the lens in old age.

16
Positional hyperopia results from posteriorly placed crystalline lens while aphakia results in
high hyperopia (6)
.
Clinically hyperopia may be divided in three categories: Simple hyperopia, due to normal
biological variation, can be axial or refractive. Pathological hyperopia is caused by abnormal
ocular anatomy due to maldevelopment, ocular disease, or trauma. Functional hyperopia
results from paralysis of accommodation (6)
.
Hyperopia may also be categorized by degree of refractive error: Low hyperopia consists of
an error of +2.00 Diopter or less. Moderate hyperopia includes a range of error from +2.25 to
+5.00 Diopter while high Hyperopia consists of an error over +5.00 Diopter. (8)
Regarding hyperopia in relation to accommodation of the eye, facultative hyperopia is that
which can be overcome by accommodation. Absolute hyperopia is that which cannot be
compensated with accommodation (8)
.
Hyperopia can also be based upon the outcome of non cycloplegic and cycloplegic
refractions: Manifest hyperopia, is that which is determined by non cycloplegic refraction, it
may be either facultative or absolute. Latent hyperopia is detected only through cycloplegia
and can be overcome by accommodation (8)
.
1.1.3 ASTIGMATISM
Astigmatism is a refractive status that causes blurred vision due either to the irregular shape
of the cornea, or sometimes the curvature of the lens. An irregularly shaped cornea or lens
prevents light from focusing properly on the retina.
Regular astigmatism occurs when the cornea, retina or lens has two regular radii, one smaller
than the other, that are located 90 degrees apart. The most common presentation is the
corneal astigmatism. Regular astigmatism can be with the rule or against the rule according to

17
the axis and angle between the two principal meridians. With the Rule astigmatism, the
vertical meridian is steepest and its correction requires the concave cylinder lens at 180 +/- 20
degrees or convex cylindrical lens at 90 +/- 20 degrees. In against the rule astigmatism, the
horizontal meridian is steepest; its corrections require convex cylindrical lens at 180+/- 20
degrees or concave cylindrical lens at 90 +/- 20 degrees. Oblique astigmatism has the
principal meridians at or near 45 and 135 degrees. (8)
Regular astigmatism also can be classified according position of two focal lines in relation to
the retina. In simple astigmatism, one ray is focused on the retina and the other is focused in
front of retina (simple myopic astigmatism) or behind the retina (simple hyperopic
astigmatism).In compound astigmatism, both meridians are either focused in front of retina
(compound myopic astigmatism) or behind the retina (compound hyperopic astigmatism). In
mixed astigmatism, one meridian is focused in front of retina and the other behind the retina
(8).
Irregular astigmatism is often caused by a corneal scaring or scattering in the crystalline lens.
The principal meridians are not at 900 to each other. It cannot be corrected by standard
spectacle lenses, but can be corrected by contact lenses (8)
.

18
2.0 LITERATURE REVIEW
2.1.0 PREVALENCE OF REFRACTIVE ERRORS
The global prevalence of refractive errors has been estimated from 800 million to 2.3 billion
(9). In Kenya, prevalence of refractive errors among primary school children (12-15years) in
urban and rural areas has been found to be 11% (1)
and 5.2% (10)
respectively. In urban Kenya,
myopia was found to be the most prevalent refractive error, with a prevalence of 10.2%,
followed by hypermetropia at 0.3% and lastly astigmatism at 0.5% (1)
. On the contrary
hypermetropia was the most prevalent refractive error at 3.2% then myopia at 1.7% and
astigmatism at 0.3% (10)
. A survey of the prevalence of refractive errors among children aged
6-9 years in Kampala, Uganda by Kawuma et al found the prevalence of refractive error to be
11.6 percent (11)
. These studies give as the prevalence of refractive error in two different age
groups that is 6-9years and 12-15 years. The studies were done over ten years ago and
literature is lacking in our set up on recent studies. In east Africa, data are also lacking in
children who are seventeen years and above, in which case emmetropisation has occurred (5)
and this study was able to address these some of these discrepancies in data.
In Ghana, in a study on prevalence of refractive error in school going children aged between
five and nineteen years was 25.6 percent. Hyperopia was estimated to be 3.0%, myopia was
found in 8.9% and 16.7% were astigmatic among 15 year olds. Of the children examined,
only 0.6% had previous eye examination (12)
. The study in Ghana showed a high prevalence
in refractive error and poor eye health seeking behavior. In South Africa a study done among
African children of ages five to fifteen, the largest cause of reduced vision in this age group
was refractive error at 68 percent. With retinoscopy, the prevalence of myopia did not exceed
3% until age 13, after which a definite upward trend began, reaching 9.0% in 15-year-olds.
With autorefraction, myopia was generally approximately 3% or 4%, before rising to 6.3% in
19
14-year-olds and 9.6% in 15-year-olds. The prevalence of hyperopia generally ranged
between 1% and 2% when measured with retinoscopy and between 2% and 3% with
autorefraction . Astigmatism of 0.75 D or more was found in 6.7% of right eyes and 6.8% of
left eyes, measured with retinoscopy; and in 9.3% and 9.6%, respectively, measured with
autorefraction. The study demonstrated myopia, hypermetropia and astigmatism with both
retinoscopy and autorefraction was associated with older children. (2)
The studies carried out
in Ghana (12)
and South Africa (2)
were able to compare refractive errors occuring in different
age groups and a summation of the prevalence of the different types of refractive errors.
These studies demonstrated an increase in the prevalence of refractive error among the older
age groups. The study on the prevalence, knowledge, attitude and practice in refractive error
among High school students in Nairobi was the beginning of an evaluation of the prevalence
of refractive error in a different age group, averaging 17 years, that is comparable with
different regions.
In Ohio, USA a study by Kleinstein et al of children aged 5-17 years, found 9.2% of the
children were myopic, 12.8% were hyperopic, and 28.4% were astigmatic. There was a
definite upward trend in the prevalence of refractive error with increasing age (13)
. This study
has a different distribution of refractive error compared to studies done in Africa and Asia
where myopia is the most prevalent refractive error followed by asatigmatism and lastly
hyperopia (1) (2) (3)
.
Codova et al studied the prevalence of refractive error among high school students in Cusco
province Peru and found the prevalence to be 18.2% and astigmatism to be the commonest
form of refractive error at14.6%, followed by myopia,3.4% and lastly hypermetropia at0.1
percent (14)
.

20
Studies done in children ranging in age from 3 to 15 years, the proportion of visual
impairment due to uncorrected refractive error varies from 72.6% in Sydney Australia (15)
to
75% in Beijing, China (16)
, 76.8% in Sao Paulo, Brazil (17)
, and as high as 94.9% Guangzhou,
China (18)
. The prevalence of uncorrected refractive error has been reported to be high
especially in developing countries. In Kenya the proportion of students with significant
refractive error who are uncorrected was found to be 77.3% in urban Kenya (1)
and 95.6% in
rural Kenya (10)
. In Kenya the proportion of students with significant refractive error who are
uncorrected is high.
21
2.2.0 DISTRIBUTION OF REFRACTIVE ERRORS IN SCHOOL AGE
CHILDREN AND ADOLESCENTS
2.2.1 MYOPIA
A number of studies have reported the distribution of refractive errors among school age
children /adolescents. Myopia increases steadily with increasing age. Myopia prevalence in
children increases substantially from 7 – 17 years in East Asian populations. In a study by
Fan DS et al myopia was the most common refractive error and was found in 36.7% of
children. Prevalence of myopia correlated positively with older age. Children aged 11 years
were almost 15 times more likely to have myopia than those aged less than seven years.
Incidence of myopia was 144 per 1000 primary school children per annum. Increasing age
correlated with increased incidence of myopia, with highest prevalence in children older than
eleven years (19)
.
In the United States, the mean rate of childhood myopia progression is reported at about 0.5
D per year. In approximately 75% of teenagers, refractive errors stabilize at about age 15 or
16. In those whose errors do not stabilize, progression often continues into the 20s or 30s.
The prevalence of myopia in the United States, has been estimated at 3% among children
aged 5 to 7 years, 8% among those aged 8 to 10 years, 14% among those aged 11 to 12 years,
and 25% among adolescents aged 12 to 17 years. In particular ethnic groups, a similar trend
has been demonstrated, although the percentages in each age group may differ. Ethnic
Chinese children have much higher rates of myopia at all ages (20)
.
In China a study by Lian-Hong et al among sub-urban children aged 6-15 years found that as
children's ages increased, the prevalence rate of hyperopia decreased and that of myopia
increased significantly .The prevalence of hyperopia , myopia and astigmatism were 3.26%,
13.75%, and 3.75%, respectively (21)
.

22
In Germany, a study by Jobke et al among children, adolescents and adults found prevalence
rates of myopia to increase with age. Prevalence was 0% in children aged 2–6 years, 5.5% in
children aged 7–11 years, 21.0% in adolescents (aged 12–17 years) and 41.3% in adults aged
18–35 years (22)
.
A study done in Ghana among children of 7-17 years, the frequency of the distribution of
myopia was found to show a linear progression with age. In addition, myopia and
astigmatism was found to be higher in the urban group with percentage differences of two
percent (12)
. The prevalence of myopia in the age group of 12-15 years has also been found to
be higher among the urban group in Kenya at 10.2% (1)
compared to the rural group whose
prevalence was at 1.7 percent (10)
.
Myopia prevalence varies with age, race and sex, increasing at least through adolescence, and
is present in one percent of children at age five, increasing to 8% at ten years and about 15%
at fifteen years (5)
. The above studies have shown that the rate of myopia in most populations
increases with age. In our population the studies done by Muma in 2007 and Nzuki in 2004
among the age group of 12-15 years in rural and urban settings differered in their findings.
The prevalence of myopia among children in urban kenya of ages 12- 15 years was 10.2%
and was the commestest refractive error in this age group (1)
. However, this was not the case
for the same age agroup in rural Kenya, myopia was found to be the second commenest
refractive error at 1.7% after hypermetropia at 3.2 percent (10)
. Data on the patterns of
refractive error among ages 16-19 years in Kenya was found to be lacking.
2.2.2 HYPEROPIA
The prevalence of hyperopia in children appears to decrease during younger school age years
and then stabilize during adolescence. In a study done in Australia, hyperopia prevalence

23
decreased between the ages six to seven years and 9-12 years. Prevalence of moderate
hyperopia among children ages 6 and 12 was 13.2% and 5.0%, respectively (15)
.
A study done in Nigeria among children aged between 7-17 years, the observed frequency for
hyperopia followed a reverse pattern to that of myopia. The prevalence of hyperopia in the 7
year old subjects was at 26% and continued to decrease with age to 5% among the 17year old
subjects (5)
. Both studies in Australia and Nigeria are consistent with what is observed in
other populations across the world.
In Kenya, the are no studies that have been done across wider paediatric age groups that have
been published. However, in a study done by Muma et al, revealed that the prevalence of
hypermetropia among ages 12-16 years in rural Kenya showed the converse, hypermetropia
was found to be the commonest refractive error at 3.2% followed by myopia at1.7 percent
(10). This is unlike what is found in most populations as discussed above.
2.2.3 ASTIGMATISM
The have been no consistent age patterns observed for astigmatism. In a study done in
southern Indian state of Andhra Pradesh, rural India, the prevalence of astigmatism of more
than 0.75D was 10% higher than what is seen in most populations (23)
.
In South African a study on refractive error and visual impairment in African children found
astigmatism was associated with older age (2)
.
A study done to determine the distributions of refractive, corneal , and internal astigmatism
(IA) in 12-year-old Australian children concluded that the girls had significantly greater
corneal astigmatism and internal astigmatism prevalence, with greater against the rule
astigmatism and lower oblique internal astigmatism than did the boys. The European white-
Australian children had lower corneal astigmatism prevalence than did the East Asian-

24
Australian children and higher internal astigmatism prevalence than did the South Asian-
Australian children (24)
.
In general, data regarding the patterns of astigmatism in Africa are scarce and would be an
area to be studied in the future. In Kenya the studies by Muma et al and Nzuki et al have
demonstrated a low prevalence of 0.3% (10)
and 0.7% (1)
respectively.
25
2.3.0 KNOWLEDGE, ATTITUDE AND PRACTICE IN REFRACTIVE
ERROR
Regarding knowledge, attitude, beliefs and practice of refractive errors, lack of knowledge
and stigma plays a major role in uptake of refractive services in different continents. A study
conducted in Singapore, Malay on the Knowledge and beliefs associated with refractive
errors and undercorrection showed that in the urban Singapore population, the lack of
knowledge and awareness of refractive errors played a big role in uncorrected and
undercorrection of refractive error. The subjects found to have R.E, of the myopes, 79.5%
had heard of myopia, 79.2% of hyperopes had heard of hyperopia, and only 7.7% of those
with astigmatism had heard of astigmatism. Adults who had never previously visited an eye-
care specialist were less likely to know that they had a refractive error (p<0.01). Adults with
undercorrected refractive error were more likely to be female at 61.1% compared to the
males, 49.3 percent. The females in the study were also less likely to wear spectacles,
compared to the men (41.7% vs 22.3%). The study also compared the undercorrected group
and the corrected group and found that the knowledge on astigmatism (1.4% vs 5.6%) and
refractive errors (62.6% vs 77.5%) was significantly lower in the undercorrected group (4)
.
A study conducted in University of Benin, Nigeria on attitude and beliefs of Nigerian
undergraduates to spectacle wear showed significant lack of knowledge as well as erroneous
beliefs towards refractive errors. Sixty eight percent of the total population studied had not
heard of refractive error. Only Thirty eight percent believed wearing eyeglasses was one of
the methods used to correct refractive error. Fifty percent believed they could wear spectacles
if prescribed for one by their doctor. Sixty four percent believed eyeglasses are harmful to the
eyes; and 65% did not know eyeglasses could be used to relieve other forms of ocular
discomfort such as headache and tearing. Fifty seven percent of respondents regarded people
who wore eyeglasses as visually handicapped, while 60% believed that eyeglasses were

26
meant for old people. Majority of the correspondents (56%) believed they would be teased if
they wore glasses (25)
.
A KAP study of refractive errors in students of rural central India showed that stigma
regarding refractive errors and modalities to correct it is prevalent amongst high school
students of rural central India. Most of the students were aware about spectacles (92%) as a
modality to correct low vision. Very few knew about surgery (14%) and half of them knew
about contact lenses (54%). The respondents refused to use spectacles at all if needed because
of likely teasing from colleagues 82% as well as problem with handling of glass (71%). Many
refused to use spectacles because of fear of rejection from opposite sex (65%) and for fear of
being labelled as blind (48%), since it could lead to low self-esteem (58%). Sixty four percent
respondents believed that long term use of spectacles can harm the eyes and even lead to
blindness. Another finding was the belief that continued use of spectacle can increase the
power of glasses (62%) and it prevents normalization of eyes (68%). Traditional methods like
yoga, ayurveda and homeopathy were more useful for correction of low vision in comparison
to allopath according to 57% of students (26)
.
A study of the prevalence and determinants of spectacle non- wear among rural Chinese
secondary school children, 62% of the children were not wearing correction despite the fact
that they would benefit from doing so (27)
.
Several studies have also explored the barriers to spectacle use in children. A study in rural
china revealed significant knowledge gaps in families and schools about glasses use as a
barrier to glasses use among children in rural China. Older students, students with greater
visual impairment and higher parental education were found to be factors that contributed to
greater awareness of visual difficulties. The purchase of spectacles was associated with
greater visual impairment. Undercorrection by two lines or more in the better eye was found

27
in 30% of those already with spectacles, and it was associated with greater visual impairment
and less frequent refraction check-ups. The study concluded half of the children in need of
first-time or updated spectacles did not have them. This was an unacceptably high proportion.
Younger children with moderate visual impairment were at particular risk for uncorrected
refractive error. The study recommended that parental education and enhanced school-based
screening programs would be necessary to address the unfilled need for refractive correction
among school-aged children (27)
.
These studies showed that the students’ knowledge gaps on refractive error were quite
significant and that their attitude and errors in beliefs affected their health seeking habits.
Whether the same or converse was true in our set up was unknown and this is what the study
set out to unveil.

28
3.0 STUDY JUSTIFICATION
Uncorrected refractive error continues to be a major public health concern. It is a leading
cause of visual impairment and blindness. Worldwide uncorrected refractive error has been
estimated to account for more than half of the cause of visual impairment and 18.2% of
blindness (28)
. A study in Kenya on significant refractive error among primary school children
by Nzuki et al among primary school children aged 12-15 years found the prevalence of
refractive error to be 10% of which 77% had uncorrected refractive error (1)
. Why the students
remained uncorrected is the unknown fact the study was trying to answer. No study come to
light in this matter.
No study in East Africa has clearly tried to determine the factors affecting health seeking
behaviour and barriers to health care in students with refractive error.
In addition there are no studies in our region that have attempted to compare the socio-
demographic characteristics, eye health seeking behaviour and knowledge of refractive errors
among students with and without refractive errors. There are also no studies that have
compared the socio-demographic characteristics, eye health seeking behaviour and
knowledge of refractive errors among students with corrected refractive errors and
uncorrected refractive errors.
Lack of knowledge, stigma and erroneous beliefs towards refractive errors plays a major role
in uptake of refractive services in different continents (4) (26) (25)
. In Kenya and East Africa,
there are hardly any studies that address the knowledge, attitude and practices of its people in
refractive error. This study is aimed at gaining insight and assessing the gaps in the
knowledge, attitude and practice in refractive error so as to justify appropriate intervention
programmes.

29
The study was be done among high school students as this group of people are in their
formative years and intervention programmes can therefore be appropriately targeted to the
knowledge, attitude and practice gaps found. The study is in public schools because these
schools are less privileged as compared to the private schools. The high school age group in
Kenya is between 14- 20 years and the study will be narrowed down to form 3 students
whose average age is 17 years. In approximately 75% of teenagers, refractive errors stabilize
at about age 15 or 16 (5)
. Refractive error patterns in this age group in Nairobi County have
also not been studied.

30
4.0 STUDY OBJECTIVES.
Broad objectives
To determine the prevalence and pattern of refractive error among high school students in
Nairobi County as well as the factors affecting their eye health seeking behaviour as regards
refractive error.
Specific objectives
1. To determine the prevalence of refractive errors (R.E) among high school students in
Nairobi County.
2. To describe knowledge, attitude and practice regarding R.E. among students attending
public high schools in Nairobi County.

31
5.0 METHODS
5.1.0 STUDY DESIGN
Cross sectional school based study with a mixed method approach (quantitative/qualitative).
5.2.0 STUDY POPULATION
The study students were selected from public high schools in Nairobi County. All form 3
students (average age 17 years) in selected public high schools in Nairobi county, were
invited to participate. By this age any manifest refractive errors of up to 75% would have
developed (5)
. The total number of students in Nairobi County, attending public schools is
37850 of which approximately 9400 are form 3 students (29)
.
5.3.0 STUDY INCLUSION AND EXCLUSION CRITERIA
All the form three students in the schools that were selected were included in the study.
5.4.0 STUDY AREA
The study was carried out in Nairobi County (Figure 1) where Kenya’s capital city is located.
Nairobi County has a total of 80 public high schools distributed across 10 divisions Central,
(Dagoretti, Embakasi, Kasarani, Langata, Makadara, Pumwani, Starehe, Njiru and
Westlands) (29)
. Eleven schools from Kamkunji, Embakasi, Kasarani, Dagoretti, Langata,
Westlands, and Makadara districts were randomly selected to participate in the study.

32
Figure 1: Map of Nairobi County

33
5.5.0 STUDY PERIOD
The study was conducted from September 2013 to February 2015.
5.6.0 SAMPLE SIZE CALCULATION AND SAMPLING METHOD
To calculate the required sample size, the following parameters were used:
1. Estimate of the expected proportion (p)
2. Desired level of absolute precision (d)
3. Estimated design effect (DEFF)
4. Confidence limit (usually 95% and Z score = 1.96)
The sample size formula is:
2
2 ))(1(96.1
d
DEFFppn
n = 1.962 x 0.1 x 0.9 (1.5)
0.022
n = 1297
To estimate the assumed prevalence of refractive error 10% (1)
with 95% CI (8% - 12%)
among high school students, adjusting for the design effect of 1.5 and confidence limit
(usually 95% and Z score = 1.96), the final minimal sample size was 1297.
A factor of 10% was added to the minimal sample size to give 1427, so as to account for
absentees and those who decline to participate.

34
5.7.0 SAMPLING PROCEDURE
The total number of public high schools in Nairobi County is 80 spread out across 10
divisions. The mode of sampling was a multistage random sampling, to select the schools.
The schools were stratified into whether they were National, County and District schools then
further sub stratified into girl, boy and mixed schools. There were a total of 7, 29, 44
National, County and District schools respectively. The total number of students in National,
County and District are 6276, 16425 and 14888 respectively giving a total of 37850 students.
The total number of form 3 students in Nairobi County is approximately nine thousand four
hundred. The population of form 3 students per school ranges from 250 in National schools,
125-250 in County schools and 50-210 in the District schools. Schools from each category
were randomly selected for the study using a random generated number. If a school was not
able to participate for any reason the next school of the same category on the list was
selected. The number of students to be included in each school category was based on
proportion of students in each stratification using the enrolment statistics (Table 1).

35
Table 1: Sampling frame of high school students in Nairobi County (29)
Type of
school
(Stratific
ation)
Total
schools
Category Total
Students
in each
stratum
% per
stratum
Required
students
per
stratum
Number of
form 3
students
who
participated
Schools
Planned to
visit
National
school
7 Girls= 3
Boys= 4
6276 17 275 275 Girl=1
Boy=1
County
schools
and
extra-
county
29 Girls= 17
Boys=
11
Mixed=1
16425 44 633 633 Girl=1
Boy=1
Mixed=2
District
schools
44 Girls=5
Boys=7
Mixed=3
2
14888 39 585 482 Mixed=4
Total 80 33 37580 100 1500 1390 11
633(45%) were selected from county schools, (482, 35%) from district schools and (275,
20%) from national schools.

36
5.8.0 STUDY TEAM
The study team was composed of the principal investigator, the first and second supervisors,
two qualified ophthalmologists and research assistant.
5.9.0 MATERIALS REQUIRED
1. Two Retinoscopes- for refraction.
2. Two Ophthalmoscopes (direct and indirect) - For anterior and posterior segment
examination.
3. Two 20 Diopter loupe- For anterior and posterior segment examination.
4. Torches with batteries and spare bulbs- for anterior segment examination
5. 3 LogMAR charts - for visual acuity assessment
6. Refraction set and trial frames – for refraction
7. Lensometer – measuring power of spectacles
8. Blinders( curtains)
9. Data collection forms - Questionnaires
10. Stationary- referral papers, data collection forms, pencils, pens, staplers etc.
11. Vehicle for hire and fuel
12. Tape recorder
13. Photographs

37
5.10.0 DATA COLLECTION PROCEDURE
Ethical approval was obtained from University of Nairobi - Kenyatta National Hospital
Research and ethics committee. Approval was also attained from the Ministry of Education
and permission to carry out the study from individual school head teachers. Assent from the
individual form 3 students in the selected schools was sought. The individual students were
each allocated a study number. The students were then issued with a self-administered
questionnaire to obtain basic demographic data and determine their knowledge, attitude and
practice towards refractive error (APPENDIX 3: KAP QUESTIONNAIRE AND VISUAL
ASSESSMENT). The questionnaire also included whether they have had any refraction done,
any ocular disease or abnormalities and challenges in accessing eye care services. Once this
was done, visual acuity of each eye without correction (sc) and with correction (cc) was taken
using a Log MAR chart at 3 metres. The students with VA of better than 6/12 in the better
eye had their information recorded in a visual assessment section (APPENDIX 3: KAP
QUESTIONNAIRE AND VISUAL ASSESSMENT). Those with visual acuity of less than
6/12 in either eye underwent further ocular examination which included a dry objective
refraction in a darkened room while fixating at a distant target placed at 6 meters. This was
followed by a subjective refraction. Those whose VA improved by two lines or more were
classified into myopia, hyperopia and astigmatism depending on the type of lens used. If
vision did not improve by at least two lines, anterior segment examination was performed
using a torch and a magnifying loupe followed by an undilated fundus examination. The
information obtained was recorded in a questionnaire. (APPENDIX 4 - VISUAL
ASSESSMENT OF STUDENT WITH R.E AND ALL THOSE CURRENTLY USING
SPECTACLES.)
For the students who had spectacles, visual acuity of both eyes with and without correction
was taken using Log MAR chart. If the VA with correction <6/12 in the better eye, the power

38
of the spectacles was read using the lensometer to give the power of spectacles used to
correct the refractive error. If the vision with correction was worse than 6/12 in the better eye
then the participant was refracted objectively then subjectively. If visual acuity did not
improve by at least two lines, anterior and undilated posterior segment examination was done
to determine the cause of reduced vision. The information obtained was recorded in a
questionnaire (APPENDIX 4 - VISUAL ASSESSMENT OF STUDENT WITH R.E AND
ALL THOSE CURRENTLY USING SPECTACLES.)
A spectacle prescription was issued where applicable and referral to a facility for conditions
that could not be handled in the field. Phone numbers of students were recorded for follow-
up.
The students were organised into groups of 6-12 students who participated in focus group
discussions. In depth interviews were conducted with key informants, these included class
teachers, house masters or the principal.

39
Figure 2: Data collection process (all form III students)

40
5.11.0 TRAINING PROCEDURES FOR KEY RESEARCH PERSONEL
Three medical students were given a training session on how to take visual acuity so as to
assist the Principal investigator and the ophthalmologists with taking visual acuity. The
training session included key lecture on refractive errors and significant refractive error,
video on how to take visual acuity, practical sessions on how to take visual acuity and an
evaluation on taking visual acuity.
5.12.0 QUALITY ASSUARANCE MEASURES
Visual Acuity was taken using a Log Mar chart held 3 meters away from the participant. The
Log Mar chart is one of the standard and accurate charts used to take visual acuity.
The standard measure of refractive error is objective retinoscopy (O.R). Objective
Retinoscopy was carried out using a streak retinoscope and lenses in increments of 0.50
diopter sphere until neutralization was achieved in the two principal meridians. The test is
objective and not examiner dependent. The patient may however accommodate and a target
of 6 meters was provided so as to relax accommodation and avoid errors associated with
accommodation. The objective refraction was repeated twice and average was taken to be the
true R.E. Measurements that were 0.50 dioptre difference were repeated and the average of
the two closest measurements was taken as true refractive error.
Subjective refraction- The subjective refraction further refines the results of the objective
refraction to suit the needs of the patient.
Anterior segment examination was done using a touch and magnifying loupe. With this
method the examiner is able to pick up most anterior segment abnormalities, however the slit
lamp is the gold standard. Patients found or suspected to have any anterior segment
abnormalities were referred to an eye hospital for further management.

41
The direct ophthalmoscope was used to pick up posterior segment abnormalities. The
students found to have any abnormalities were referred to an eye hospital for further
management.
A calibrated lensometer was used to measure the power of the lenses of the students wearing
spectacles.
5.13.0 ETHICAL CONSIDERATIONS
1. Approval was sought from Ethical Committee of University of Nairobi – Kenyatta
National Hospital in Nairobi Kenya.
2. Permission was sought from the Permanent Secretary, Ministry of Education.
3. Permission from head teachers of schools was obtained
4. Assent from the students was sort and obtained.
5. Confidentially of students records was observed.
6. Spectacle correction and follow up was recommended for all the students found to
have refractive error.
7. Students with other ocular diseases were referred to local eye hospitals.
8. A phone follow-up will be made to confirm that students having refractive errors have
been able to access the recommended health facilities.
5.15.0 DATA MANAGEMENT
After collection of data, it underwent double entry to ensure accuracy. The qualitative data
was analysed using SPSS 20.0. Proportions were used to estimate the prevalence and pattern
of refractive errors as well as knowledge, attitude and practice (KAP) in refractive error.

42
Descriptive statistics and chi-square tests were used to compare knowledge, attitude and
practice among students with normal vision, uncorrected refractive error and corrected
refractive error. The notes and tape recorded information obtained during the FGD and IDI
was analysed using observer impression and regression analysis. Results were presented
using ratio, proportion, rates, tables and diagrams wherever appropriate.

43
Figure 3: Data analysis
Data Analysis
Quantitative Qualitative
Prevalence
of R.E
Myopia Astigmatism Hypermetropia
Knowledge Attitude Practice Emmetropia
(without R.E)

44
6.0 RESULTS
The total number of students in Nairobi County, attending public schools is 37,850 of which
approximately 9,400 are form III students (29)
. The students were recruited from 11 public
secondary schools, 5 county schools, 4 district schools and two national schools. Of the
students who were selected from form III, 633(45%) were from county schools, (482, 35%)
from district schools and (275, 20%) from national schools.
Figure 4: Total number of students in respective schools
0 50 100 150 200 250 300
Aquinas High School
Dagorreti mixed secondary school
Hospital hail secondary school
Karen C Secondary School
Kayole South secondary school
Lenana High School
Our Lady of Fatima Secondary…
Our Lady of Mercy Shauri Moyo
precious Blood Riruta
Ruaraka High school
Starehe Girls centre
Number of students
Nam
e o
f sc
ho
ol
Total number of Students (n=1390)
45
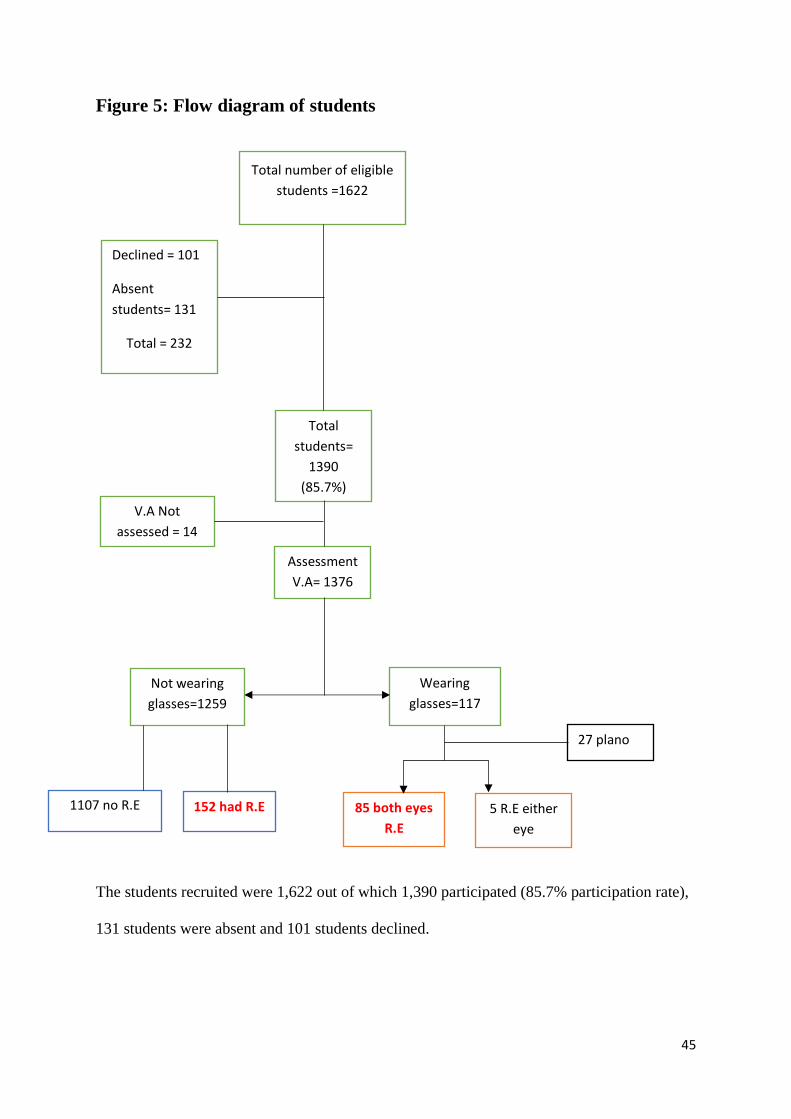
Figure 5: Flow diagram of students
The students recruited were 1,622 out of which 1,390 participated (85.7% participation rate),
131 students were absent and 101 students declined.
Total
students=
1390
(85.7%)
V.A Not
assessed = 14
Wearing
glasses=117
Assessment
V.A= 1376
Not wearing
glasses=1259
1107 no R.E 152 had R.E 85 both eyes
R.E
5 R.E either
eye
27 plano
Total number of eligible
students =1622
Declined = 101
Absent
students= 131
Total = 232

46
Table 2: Demographic characteristics of the students enrolled
Characteristics of the Study Population Total N= 1390
Sex
Male 751 (54.0%)
Female 639 (46.0%)
Schools
County 633 (45.5%)
District 482 (34.7%)
National 275 (19.8%)
Spectacle use (students response)
No 1210 (87.1%)
Yes 148 (10.6 %)
No response 32 (2.3%)
Mother’s education
None 40 (2.9%)
Primary 129 (9.3%)
Secondary 176 (12.7%)
College/University 820 (58.9%)
No response 225 (16.2%)
Father’s education
None 41 (2.9%)
Primary 65 (4.7%)
Secondary 143 (10.3%)
College/University 854 (61.4%)
No response 287 (20.6%)
Of the students, 639 (46%) were females and most of them, 633(45.5%) were from County
schools. Most students’ parents, constituting 70% (820) of the students’ mothers and 77%
(854) of the students’ fathers had a college/university education.

47
Figure 6: Age distribution of the students
The mean age was 16.98 years (range 14-23 years, Standard deviation= ± 1.04)
2(0) 28(2.0)
329(23.7)
689(49.6)
246(17.7)
53(3.8) 5(0.4) 2(0) 0.0 1.(0
0
200
400
600
800
14 15 16 17 18 19 20 21 22 23
Freq
uen
cy(N
um
ber
)
Age of students
Age distribution Of Students n=1390(%) [Mean=16.98, STD= ± 1.04]

48
Figure 7: Prevalence of Refractive Error, N=1376
The total number of students who were assessed and found to have significant refractive error
was 237(17.2%).
82.78% (1139)
17.22%(237)
Prevalenve Refractive Error, N=1376
Refractive error No refractive error

49
Table 3: Prevalence of the types of refractive errors and comparison
between males and females
Description Myopia % [
95% C.I]
P
value*
Astigmatism
% [95% C.I]
P value Hyperopia
% [95%
C.I]
P value*
N=1376 Total
(%) 1
215
(15.63%)
104 (7.55%) 12 (0.87%)
Sex
Male 103 (7.49%) 0.52
54 (3.92%) 0.69 4 (0.29%) 0.25
Female 112 (8.14%) 50 (3.63%) 8 (0.5
8%)
*All proportions accurate to ±0.02
Myopia, at 15.6% was found to be the most prevalent form of refractive error.

50
Figure 8: Proportion of students with refractive error; corrected,
uncorrected and under corrected refractive error, n=237
A large proportion of students with refractive error, 152/237 (64.1%) were uncorrected. The
prevalence of uncorrected refractive error was 11.04 percent (152/1376).
0
20
40
60
80
100
120
140
160
under corrected refractiveerror
corrected refractive error uncorrected refractive error
Proportion of students with R.E; corrected, uncorrected and under corrected R.E, n=237
20, 8.4%
65, 27.4%
152, 64.1%

51
Figure 9: Proportion of students with refractive error with anisometropia
Of the students with refractive error, 31 (13.1%) students were found to have anisometropia.
The prevalence of anisometropia was 2.25% in the general population.
0
20
40
60
80
100
none At least 1 Diopter
% o
f p
arti
cip
ants
spherical equivalent difference
Proportion of students with refractive error with anisometropia(n=237)
206 (86.91%)
31, (13.08%)

52
Table 4: Students knowledge regarding refractive error
Knowledge regarding refractive error and poor
vision
Total population
n=1390 Do you feel you have normal vision
I don’t know 385 (27.6%)
I don’t have normal vision 416 (29.9%)
Yes I have normal vision 439 (31.6%)
No response 23 (1.7%)
Knowledge on causes of poor vision among students
Short sightedness 429 (30.9%)
Long sightedness 178 (12.8%)
Poor nutrition 526 (37.8%)
Astigmatism 111 (7.9%)
Don’t know 257 (18.4%)
No Response 128 (9.2%)
Knowledge on methods of correcting poor vision
Spectacles 851 (61.2%)
Medicine 400 (28.8%)
Contact lenses 365 (26.2%)
Surgery 296 (21.3%)
Don’t know 28 (2.0%)
No response 30 (2.2%)
What are the reasons for wearing spectacles
Improve vision 992 (71.4%)
Protect eyes from excessive light and injury 472 (33.9%)
Look intelligent 105 (7.6%)
No response 5 (0.3%)
Reasons students with poor vision do not wear spectacles
Don’t know 51 (3.7%)
Spectacle prevent normalization of eye sight 334 (24.0%)
Cosmetically unacceptable and embarrassing in public 149 (10.7%)
Cost 488 (35.1%)
Fear of being teased 529 (38.1%)
No response 161 (11.6%)
Do you know where to seek help if you have poor eye sight?
Yes 880
Sources of eye care Optic
shop
155 (11.1%)
General hospital 236 (16.9%)
Eye specialist/ Hospital 515 (37.0%)
I don’t Know 316 (22.7%)
No response 194 (13.8%)
Only 491 (35.3%) students knew their vision was normal.
Most of the students gave poor nutrition 578 (42%) as a cause of poor vision. However,
majority of the students 1096 (78.8%) knew that spectacles were used to improve vision. The

53
fear of being teased 529 (38.1%) and cost 488 (35.1%) were the major reasons for not
wearing spectacles when needed to correct poor vision.
Most students (63%, 880) knew where to seek help if they had poor eyesight; majority
(37.0%, 515) would go to an eye specialist/ eye hospital.

54
Figure 10: Attitude of students towards spectacle use
0% 10% 20% 30% 40% 50% 60% 70% 80% 90% 100%
Associated with intelligence
Cosmetically unacceptable/embarrasing in Public
Improves appearance
Leads to low self esteem
Makes you less attractive to the opposite sex
Leads to dependence and worsening of vision
Damage your eyes
Young people do not need correction
Attitude of Students towards spectacle use (n=1390)
Strongly disagree Disagree Neutral Agree Strongly Agree
55
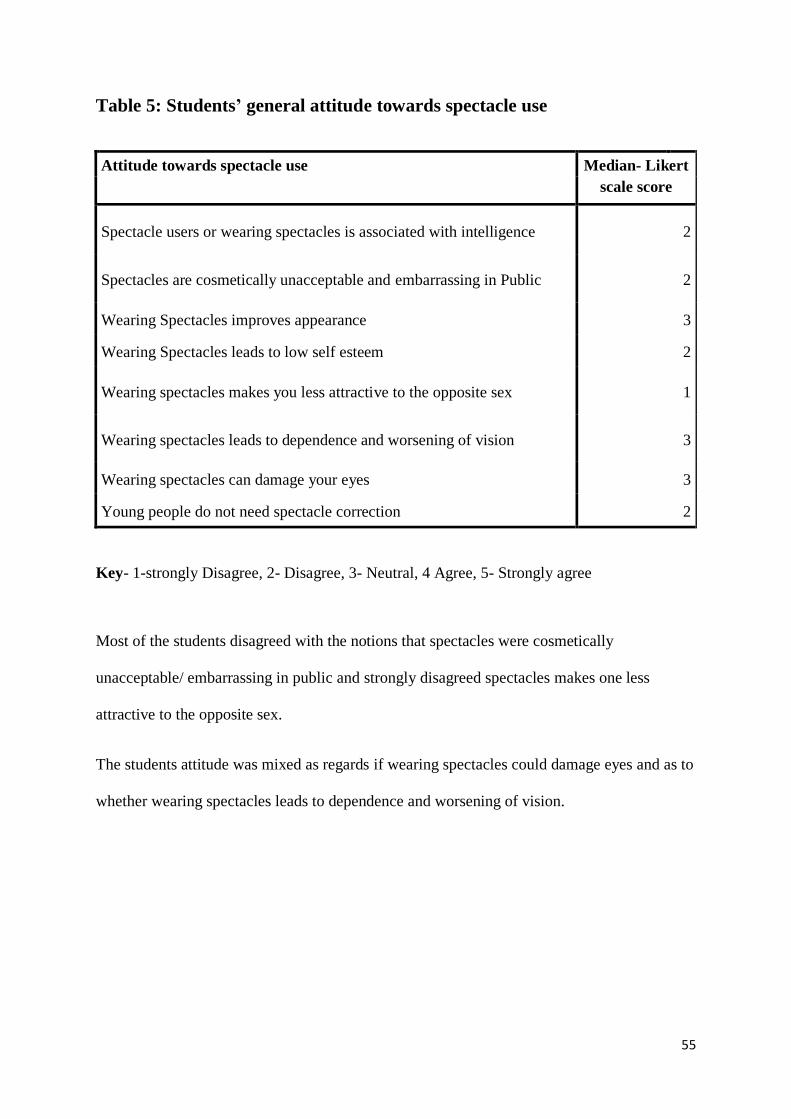
Table 5: Students’ general attitude towards spectacle use
Attitude towards spectacle use Median- Likert
scale score
Spectacle users or wearing spectacles is associated with intelligence 2
Spectacles are cosmetically unacceptable and embarrassing in Public 2
Wearing Spectacles improves appearance 3
Wearing Spectacles leads to low self esteem 2
Wearing spectacles makes you less attractive to the opposite sex 1
Wearing spectacles leads to dependence and worsening of vision 3
Wearing spectacles can damage your eyes 3
Young people do not need spectacle correction 2
Key- 1-strongly Disagree, 2- Disagree, 3- Neutral, 4 Agree, 5- Strongly agree
Most of the students disagreed with the notions that spectacles were cosmetically
unacceptable/ embarrassing in public and strongly disagreed spectacles makes one less
attractive to the opposite sex.
The students attitude was mixed as regards if wearing spectacles could damage eyes and as to
whether wearing spectacles leads to dependence and worsening of vision.

56
Table 6: Students practice regarding refractive error
Practice on Refractive error- Eye Check-up N= 1390
Have you ever had an eye-check-up
1. Students who have had eye check-up n=539/1390(39%)
Where students had an eye check-up (>1 responses allowed) n= 463/539 (85.9%)
Optical shop 87 (16.1%)
General hospital 110 (20.4%)
Eye specialist/ hospital 345 (64.0%)
No response 76 (14.1%)
2. Students who have not had an eye check up 829/1390 (59.6%)
Reasons why not had eye check-up(>1 responses allowed) n= 829 (83.0%)
No money 390 (47.0%)
No hospital/ clinic 43 (5.2%)
No time 140 (16.9%)
No need 603 (72.7%)
No Response 141(17.0%)
3. No Response 22/1390(1.5%)
Regarding practice on refractive error, only 539 (39%) of the students had an eye checkup
prior to this study. Majority of them 345 (54.7%) visited an eye specialist/ hospital and most
of them, 305 (56.6%) did so when they had an eye problem. Of the students without a prior
eye check-up, 829 (60%), 603 (72.7%) didn’t see the need and 390 (47.1%) stated cost as
reason for not having an eye checkup before.

57
Table 7: Students Practice on Spectacle Use
Practice on Refractive error- Spectacle use
1.Have you been advised to wear spectacles n=1390 Yes (been advised to wear spectacles) 427(30.7%)
No (not been advised to wear spectacles) 867(62.4%)
No Response 96(6.9%)
2.If yes do you have your spectacles n=427
(Yes) Been advised wear spectacles and have them 170 (39.8%)
(No) Been advised wear spectacles and don’t have them 245 (57.4%)
Why students been advised to wear spectacles don’t have/don’t wear
spectacles/don’t wear
n=245
Expensive 124 (50.6)
Not much difference in vision 118 (48.2)
Makes vision worse 35 (14.3)
Fear of being teased 25 (10.2)
Broken/ lost 4 (1.6)
(No response) Been advised wear spectacles and didn’t respond
No
12 (2.8%)
3.How often students with spectacles wear them n=170 All the time 76 (45%)
Sometimes 90 (55%)
No response 4 (2.4%)
4.Would you Prefer another way to correct vision ( students
with spectacles)
n=170
(Prefer another way to correct vision) Yes 123 (72.3%)
(Do not prefer another way to correct vision) No 37 (21.8%)
No response 10 (5.9%)
5.What method would you prefer (for only those who said yes,
prefer another way to correct vision)
N=123
Contact lenses 83 (69.1%)
Surgery 37 (31.7%)
No response 3 (2.4%)
Of the students who had been advised to wear spectacles and did not have them/ wear them
(427, 31%), gave cost (126, 50.6%) and not much difference in vision (118, 48.2%) as the
major reasons they did not wear/ have their spectacles.
Most of the students who wore/ had their spectacles (123/170, 72.3%), preferred another
modality of correcting their vision and most gave contact lenses (83/123, 69.1%) as the
preferred modality.

58
Focus Group Discussions
The focus group discussions were carried out among the study students in groups of 12
students after the KAP questionnaire was filled and the eye examination was carried out. The
selection of students was random from the class register.
Students’ knowledge regarding their vision and barriers to spectacle use
‘ ..I have never seen the need… I thought my eyes were perfectly alright’
Most of the students felt their vision was normal and had never had an eye check-up prior to
the study. However, some who thought their vision was normal or had never seen the need to
go to hospital, discovered they had refractive error or were found to have refractive error
during the clinical exam.
‘.. I know my vision is poor, I have told my parents and they advised me it will get better.’
‘ .. I know my vision is poor, so I am waiting for it to get better’
‘… I know my eyesight is poor but I just cannot ask my parents to take me to hospital, I
cannot ask for more, my parents have no money, they are struggling to take me and my
siblings through school.’
‘.. I have noticed for the past two years I have poor vision and even went to an optical shop to
seek for help, I even know the cheapest pair or spectacles cost Ksh. 2000 but I simply cannot
afford it..’
‘.. I know my vision is poor, so I simply sit at the front of the class and beg the teacher not to
move me.’
‘... my vision is poor, I know because when I use my desk mate‘s glasses, I see better, I
cannot explain why I have not had my eyes checked..’

59
‘.. I thought there was something wrong with my vision, but I did not think it was that
serious....’
Most of the students who had poor vision had realised their vision was sub optimal. However,
in spite of having poor vision, most of them had not previously had an eye check-up. The
reasons for not had having a previous eye check-up were cost, poor eye health seeking habits
among the parents as well as students and some students had developed coping mechanisms
to deal with their poor vision like sitting in front in class.
‘.. I do not see the difference with my vision if I am wearing my glasses or not....’
‘.. I have poor vision but I cannot stand how my spectacles look, if I could get a better frame I
would definitely wear my glasses.’
‘.. I used to have spectacles but, I broke them and I am too scared to let my parents know
because they will be annoyed with me....’
‘..I know my vision is poor, I had spectacles but I stopped wearing them so that my eyes could
normalize.’
‘.. My spectacles were stolen last term and my parents don’t have money to replace them...
they cost me Ksh. 15000... .’
‘.. Some of us live in the country side. I wear my spectacles mostly at school, when I am at
home for the holidays, it is cumbersome to wear spectacles in the field when harvesting. In
the country side people will also view you to be peculiar if you wear spectacles.’
‘.. if you have the right spectacle frames and tint, you look swag.’
Of the students who had poor vision and did not have their spectacles, the reasons for not
wearing spectacles were broken spectacles, stolen spectacles, high cost of glasses, no

60
difference in vision or vision made worse, difficulty handling spectacles, fear of being teased
and poor communication between parents and children. One of the students was not willing
to replace his spectacles with less trendy glasses after they were stolen. A fascinating
response for not wearing spectacles was that spectacles left marks on the side of the face and
made the eyes appear smaller.
‘.. I simply didn’t know my vision was poor, I thought this is how I am meant to see....’
‘..until today I didn’t realise how poor my vision was, now I know with spectacles I can see
much better.’
Some students were found to have significant refractive error during the screening process
but they were unaware of their poor vision.
‘.. when I started to notice I couldn’t see well I told my parents, my parents are lecturers and
they took me to see an eye specialist and was given a spectacle prescription.’
The students found to be wearing spectacles due to poor vision had a much better realization
of their poor vision and the need to do something about it. They also seemed to have a better
knowledge of poor vision as regards refractive error and eye care. The students with
spectacles also seemed to come from a better socioeconomic background, as we observed
most of them were from County schools and very few from district schools. The students who
had spectacles also had more educated parents.
Attitude towards spectacles
The general attitude towards spectacles and spectacle use in certain aspects were positive
among high school students in Nairobi County. There were certain attitudes the students
embraced that stood in the way in better uptake of refractive services.

61
‘.. I wear spectacles but my vision keeps getting worse, my eyes are dependent on the
spectacles because I cannot see without them....’
‘..you see, for the students who wear glasses, their vision gets worse and you see them buying
spectacles with more power....’
‘.. most students who wear spectacles don’t stop; they are dependent on them....’
Many of the students were of the opinion that spectacles led to dependence of spectacles and
that spectacles made the vision worse. The students attributed the change of refractive status
of the eye to the wearing of spectacles as they realized some students kept getting stronger
spectacles to see clearly. Some students account that they even discontinued spectacle use to
allow their eyes to normalize as their eyes were getting worse on spectacles.
‘.. as a matter of fact if you want to be attractive to boys get a pair of spectacles, especially
the ones that tint.’
Interestingly most of the students were of the opinion that spectacles made one attractive to
the opposite sex, particularly if the frames were trendy and the lens were tinted.
‘ ... spectacles make you look ‘swag’, if they are fashionable and can tint’
Spectacles were also found to be a fashion statement among high school students in Nairobi
County.
‘… I am in basketball and not having good eyesight is sometimes looked at like a
disability....’
Though few, some students considered wearing spectacles due to poor vision a form of
disability especially if you were in a sport and were concerned not being selected for the main
team.

62
In depth interviews with key informants
The in-depth interviews were carried out one on one by either the principals of the respective
schools we went to, the class teachers of the form three class or the house mistress/ master.
This depended on who was free. The interviews were held after the data collection from the
students was complete.
Barriers to uptake of eye health care among high school students
‘.. some of the students are struggling to put food on the table, even if they had problems with
their vision it would not be considered a priority.’
The class teachers or principals were able to recognize that some of the students did have
problems with their vision. They realised that some of them however were not able to afford
appropriate eye care due to financial and social constraints at home. In the district schools
particularly, this was the major problem. The teachers reported that the students had such
difficult social problems like prostitution among girls, being involved in gangs especially
among boys, not having homes, not being able to pay school fees, illicit drug abuse, teenage
pregnancies, absenteeism and having serious health problems like H.I.V infections and
having to take anti-retroviral therapy. The head teachers in these schools pointed out they
spend much effort looking for funds to mainly keep the students in school. Having to face
these problems, for both teachers and students, eye health is very low in the priority list. In
the County and National schools the picture was different. In one National school the director
pointed out they had a yearly eye check-up for the students.
‘.. I have noticed some students do not see well, when you ask them they say they have been
on medication without improvement.’

63
‘.. it is a high school requirement to have your eyes checked but from my observation many
do not because if you look at some of the medical records, you can tell the person
commenting on the eyes did not even examine.’
Some of the teachers were observant and noticed some of the students had poor vision they
had also made an effort to enquire about whether the students had sought help. Some of the
students had sought in-appropriate help. Many of the students sought eye care in a pharmacy
where they were given eye drops without referral to an eye specialist or hospital. Some
teachers made the observation that some of the clinicians the students sought help from had
no training/ knowledge in eye health and they could judge this by the inappropriate comments
in the students’ medical records.
‘.. some students have told me they cannot see well and would like to be moved in front.’
The teachers made an observation many students who could not see well, noticed and
requested to be moved to sit at the front.
‘.. I have noted some once brilliant students, dropping in performance in class. I usually
enquire and many times they will tell you they have noticed something wrong with their
vision.’
It was also observed by the teachers that poor vision had a bearing on school performance.
Poor vision seemed to lead to poor performance among students.
‘.. these children are having so many changes going on in their bodies and are sometimes shy
or scared to reveal this to anyone unless you ask them in a friendly way.’
It was also noted by the teachers that in the teenage years students are undergoing so many
changes in their bodies, they may be overwhelmed. The teachers also noted the children do

64
not have proper mentorship and guidance and therefore are not open or able to speak out their
problems.
‘.. some students particularly the girls are concerned about their image and may therefore
be more reluctant to wearing spectacles.’
All the district schools visited in the study were mixed and almost all the district schools in
the county are mixed. The teachers in the district schools pointed out that school was
particularly difficult for the girls because they generally had more social problems to deal
with coming from low socio-economic background. Being in a mixed school the girls were
very concerned about their image and would be reluctant to wearing spectacles particularly if
it made them less attractive. The teachers reported that the girls faced a lot of teasing from the
boys and this was one of the reasons they had to separate the girls and boys into different
classes.
‘.. some of these students like to pretend so that they go home on sick off. I do not think
anything is wrong with their eyes. I can see perfectly well.’
‘.. we have never been keen to look at eye health as a major concern. I have never thought
these young students could have problems with their vision.’
Unfortunately a few teachers had no insight on eye healthcare. They thought the students’
health problems as regards to the eye were unfounded and a way of absconding class. Some
of them thought that if they could see well, there was no reason why a teenager should not.

65
7.0 DISCUSSION
Prevalence and Pattern of Refractive Error
Nairobi County has approximately 40000 students attending public high schools (29)
. Our
study population was form III students numbering 9500 students with 16.98±1.04 years
(Figure 6) as the mean age. This study population was selected because they have an average
age of above 16 years and most refractive errors have manifested by this age (5)
. The form IV
class ahead was not selected to participate because they were sitting a national examination.
Our sample size for the study was 1622, with a response rate of 85.6% making the survey
study valid. Most of the students who did not participate were absent or declined (Figure 5).
In one school, an inter-house football tournament was underway with a bull as the first price
and thus some students declined to participate even after revisiting the school. Access to
schools is more for boys and this is shown by the higher response rates among male students
54% versus 46% for girls. More than 50% of the students’ parents of both sexes had college/
university education, reflecting the urban setting of the study (Table 2).
Prevalence of Refractive Error
The prevalence of significant refractive error (R.E) amongst high school students was 17.2%
in Nairobi County, Kenya (Figure 7). There are no comparable published studies in this age
group done in Kenya. Studies that are comparable in other parts of the world the prevalence
of refractive error was found to be at least 16.2% in Ghana (12)
, 18.2% in Peru (14)
, 9.6% in
South Africa (African children) (2)
, 73.9% in Singapore (3)
, 29.3% in Western Iran (31)
, 21% in
German adolescents and approximately 30% in Polish students (32)
. The prevalence of
refractive error in Kenya is comparable to that of Ghana, but much lower than Singapore,
Poland and Iran. As evidenced by these studies, there is difference in the prevalence of

66
refractive error with the highest prevalence in Asians, followed by Europeans and lastly in
Africans. The heterogeneity of the prevalence can be attributed to the difference in methods
of the study design, as our study had a cut off of visual acuity of 6/12 or less in the better eye.
Other contributory factors to the difference in prevalence are racial differences, geographical
distribution, near work, outdoor exposure, genetics (33)
and has been further illustrated in a
study by Kleinstein et al that showed significant differences in the prevalence and types on
R.E in different ethnic groups (13)
.
In Kenya, studies with similar methods have been conducted among younger age groups.
Nzuki et al. studied prevalence of refractive error amongst an urban population with a mean
age of 14±0.9 years. The prevalence of refractive error was 10.2 % in this age group. (1)
Lower prevalence of refractive error in younger age groups has been corroborated in several
studies (2) (12)
(13) (22)
and literature (5)
showing that the prevalence of refractive error increases
with age.
Muma et al. in a follow up study amongst a predominantly rural population with a similar age
group(14 years) found the prevalence of refractive error to be 5.2 percent (10)
. This was a
much lower figure when compared to their urban counterparts. (1) (10)
. Kenya has a
heterogeneous population with many tribes and the genetic differences could play a role in
this difference. However near work, which is more common in urban populations, and
outdoor pursuits, amongst the rural counterparts, have been shown to influence the
prevalence of refractive error in this populations (33)
.
Msiska et al in a similar study in urban and rural malawi mean age 12.96±0.02 years, found a
the prevalence of refractive error in Lilongwe (urban) to be 2.3% and 2.4% in Ntcheu (rural).
The refractive error rate was much lower than in the studies previously mentioned. This is

67
one of the lowest prevalence of refractive error reported and could be attributed to genetics
and the enviroment (33)
.
Pattern of Refractive Error
In our study we found the commonest type of refractive error in this age group (16.98±1.04)
to be myopia at 15.63%, followed by Astigmatism at 7.55% and hyperopia at 0.87% (Table
3).
This trend is similar to Nzuki et al, in Kenyan urban population (mean 14 years), who found
myopia to be the most prevalent refractive error at 9.4 %, followed by Astigatism at 0.5 %
and Hypermetropia at 0.3 percent. This shows that the general trends of refractive error
shown in our study are already established at this younger age group (1)
.
In a similar study conducted by Msiska et al. who considered both urban and rural
populations in Malawi, refractive error trends in Lilongwe(urban) were similar to our study.
However the prevalence was much lower with myopia, hyperopia and astigmatism found to
be 1.5%, 0.4% and 0.3% respectively. The prevalence rates in the Ntcheu(rural) were
hyperopia at 1.4%, Myopia at 0.8% and Astigmatism at 0.2 percent (34)
.
The only comparable study done in the rural areas done in Kenya was by Muma et al. which
confirmed hyperopia being more prevalent in the rural areas. The general trend of refractive
error in rural Kenya was hypermetropia at 3.2 percent. This was followed by myopia at 1.7%
and astigmatism 0.3 percent (10)
.
A possible mechanism for the difference in the pattern of refractive error between urban and
rural populations, could be that children in the urban settings are engaged in more near work

68
compared to their counterparts in the rural setting leading to higher rates of myopia in urban
children. Other mechanisms involved could be enviromental and geographical (33)
.
Internationally studies done in 15-18 years age group showed great differences across regions
as summarised in Table 8.
Table 8: Comparison of Pattern of refractive error across regions
Author/region Myopia Astigmatism Hypermetropia
Quek T.et al. (Singapore) (3)
73.9% 58.7% 1.5%
Teofilo et al. (Cusco,Peru) (14)
3.4% 14.6% 0.1%
Hassan et al. (Western Iran) (31)
29.3% 20.7% 21.7%
Ovenseri et al. (Ghana) (12)
8.9% 16.7% 3.0%
Naidoo et al. (South Africa) (2)
9.6% 6.7% 2.0%
Kleinstein et al.(Ohio, USA) (13)
9.2% 28.4% 12.8%
Czepita et al (Poland) (32)
23.4% 22.2% 4.5%
Nyamai et al(Nairobi,Kenya) 15.6% 7.6% 0.9%
These studies demonstrate variable patterns of refractive error in different continents among
people of different ethinicities. If comparable then populations of Asian origin have the
highest prevalence of Myopia and Astigmatism amongst the quoted studies. Iranians, who
are part of the asian continent have the highest rates of Hypermetropia. Of note the study
definitions for the different types of errors were the same in the different studies.
South Americans have the lowest prevalence of myopia, Africans the lowest prevalence of
astigmatism while South Americans have the lowest prevalence of hypermetropia. This
comparison however is not accurate as continents have diverse populations within them and
more population studies are required to find out whether these trends are true.
The prevalence of anisometropia in our study was found to be 2.3% (Figure 9) which was
lower than their counterparts in Western Iran at 4.6% and Singapore at 11.2 percent (3) (31)
.
Our study had a cut-off visual acuity of less than 6/12 in the better eye and this could have
resulted in under estimation of the prevalence of anisometropia.

69
Uncorrected refractive error in the study population
Uncorrected refractive error is a significant cause of blindness and the major cause of
impaired vision(35) (36)
. In the world, 153 million people are either blind or visually impaired
due to uncorrected distance refractive error(28)
. As a result, the World Health Organization
(WHO) and the International Agency for the Prevention of Blindness (IAPB), both separately
and in their joint initiative, VISION 2020: The Right to Sight, have put uncorrected refractive
error on the blindness prevention agenda. The goal is to develop strategies for the
elimination of, this most simple, avoidable cause of vision loss (37)
.
In our study we found the proportion of students with uncorrected significant refractive error
out of the total number of students with refractive error to be 64.1 percent (Figure 8). This
ranged from 96.8% in district schools to 54.3% in county schools. This wide range could be
an indicator of inequality of access to eye care services and corrective devices. A
majority(50.6%) of students who had uncorrected refractive error stated that lack of money
was a major factor that prevented them from having spectacles. A small proportion(10%)
feared being teased(Table 7). This however was at variance with attitudes towards spectacle
use as the median responses all encouraged spectacle use(Table 5).
The proportion of students with significant refractive error who were uncorrected in previous
studies was 77.3% according to Nzuki et al in Nairobi (urban) (1)
, 98.7% by Muma et al
(rural Kenya) (10)
, 68.5% by Teofilo et al Cusco, Peru (14)
and 95.3% by Msiska et al in
Malawi (34)
. The proportion of students with uncorrected refractive error in these studies is
very high signifying that it is a major cause of visual impairment in schools. However, in our
study we had a lower proportion as compared to various studies that have been carried out in
Africa. This shows that most school going children with significant refractive error are

70
uncorrected, and is a major concern as it may hamper productivity and school performance in
this age group.
The proportion of students with significant refractive error who were under-corrected
(Improved by two lines when refracted) was 8.4 percent. This was 23.5% (20/85) of students
who had correction. Almost 1 in 4 students who were refracted were undercorrected. Students
who had been advised to wear spectacles and did not have them, 48.2 % said that there was
not much difference in their vision when they wore the spectacles. A further 14.3 % stated
that wearing spectacles made their vision worse(Table 7).This shows that less than perfect
refraction services are a major cause of reduced spectacle use amongst students in Nairobi
county.

71
Knowledge, attitude and practice regarding Refractive Error among students
We found a high proportion of uncorrected refractive error among the students who had
significant refractive error. This was similar to studies done in different regions (1)
(10) (14) (34)
.
To explore why this is the case, we enquired the knowledge, attitude and practices (KAP) as
regards refractive error of all the students who participated in the study. This included
students with no significant refractive error, uncorrected refractive error, under corrected
refractive error and corrected refractive error. One of the strengths of the study is that we
carried out the KAP study on refractive error before examining the students and therefore the
responses were not affected by the clinical examination. This method was unique among the
other published studies.
Students’ knowledge as regards R.E
Interestingly, only 491 (35.3%) of the students felt their vision was normal, 458 (32.9%) felt
their vision was abnormal and 433(32%) did not know whether they had normal vision or not
(Table 4). The reason for this, could be that a great number of the students had never had
their eyes examined (829, 60%) prior to this study (Table 6). During the in depth interviews,
the teachers attributed the students’ lack of realization of their poor vision to the many
changes occurring in adolescence that may be overwhelming to them. To cope with their poor
vision some of the students had developed mechanisms like sitting in front in class and
sharing spectacles with their desk mates.
Most of the students gave poor nutrition 578 (42%) as a cause of poor vision, followed by
short sightedness 465 (33.5%) and lastly 121 (8.7%) astigmatism (Table 4). Compared to
Agarwal et al study in India (26)
, on the KAP of refractive error, with an emphasis on spectacle
usages in students, they found that most common reason for low vision was nutritional

72
deficiency at 68 percent. This proportion was much higher than in our study but in both
studies it was cited by high school students as the most common cause of poor vision.
As regards refractive error, most students responded to spectacles 938 (67.5%) as a mode of
correcting poor vision. Argawal et al, found most of the students were aware about spectacles
(92%) as a modality for correcting low vision (26)
. In our study 365 (26.2%) of students
identified contact lenses and 296 (21.3%) surgery, as methods of correcting poor vision
(Table 4). In India, 54% knew of contact lenses and only 14% of surgery (26)
. While in
Nigeria, Ebeigbe et al found only 38% knew about spectacles, 22.8% contact lenses and 14%
surgery as a means of correcting refractive error (25)
. Generally the Argawal study showed that
students in India had more knowledge on correcting poor vision than students in our study
and Nigeria.
The fear of being teased 529 (38.1%) followed by cost 488 (35.1%) were the major reasons
the students gave for not wearing spectacles (Table 4). In rural India (26)
students stated that
the fear of being teased (82%) and problems with handling of spectacle (71%), were the
major reasons for refusal to use spectacles if need arose. In Nigeria (25)
, 56.0% of the students
would not wear spectacles for fear of being teased or mocked. This shows students in Kenya
were generally less averse to negative peer pressure. However, it remains a major cause of
uncorrected refractive error.
Other causes for not wearing spectacles were poor eye health seeking behaviours among
students and their parents. There was also lack of awareness as regards eye healthcare,
evidenced by some students and their parents suggesting that they wait for their eye problems
to subside instead of seeking medical advice (Focus Group Discussions and In depth
interviews with key informants).

73
Most students, 880 (63%) knew where to seek help if they had poor eyesight and majority
515 (37.0%) would go to an eye specialist or eye hospital (Table 4). However access to
healthcare was hindered as most had not been evaluated due lack of awareness and cost.
(Table 6)
Students’ attitude on spectacle use
The Likert scale was used to grade attitude of students towards spectacle use. Generally, we
found the students disagreed with the notions that spectacles are associated with intelligence,
spectacles are cosmetically unacceptable and embarrassing in public, wearing spectacles
leads to low self-esteem and that young people do not need spectacles. The attitude was
neutral and generally mixed as regards the notions that wearing spectacles improves
appearance, wearing spectacles leads to dependence and worsening of vision and wearing
spectacles can damage the eyes (Figure 10, Table 5). During the FDG, the opinion that
spectacles lead to dependence and worsening of vision came out even more strongly. The
students attributed changes in the refractive status of the eye to the wearing of spectacles as
they realised some of their counterparts with spectacles kept getting stronger lenses with
time. On this account, some students had discontinued spectacle use to allow their eyes to
normalize. However, most students strongly disagreed wearing spectacles makes one less
attractive to the opposite sex. In fact, amongst the students, spectacles are considered a
fashion statement, if the frames are trendy, and the lenses are photochromatic. At the time of
this study, there was a popular musician called ‘Pharrell Williams’ who wore spectacles and
many students referred to a particular fashionable frame by his name. Few students in sports
did not find spectacles very popular because it was viewed as a flaw and it reduced their
chances of being in the main team. These students feared their abilities would be down
played and their peers would view them as less of a superstar in the particular sport. In a

74
similar study in India (26)
, 68% responded spectacles prevent normalisation of eyes, 64%
spectacles can harm the eyes, 62% felt spectacles were cosmetically unacceptable, 54%
thought spectacles were unattractive to the opposite sex and 48% responded spectacles could
lead to low self-esteem. Among undergraduates in Nigeria (25)
, 64% thought glasses were
harmful to the eyes and 60% thought glasses were meant for old people. The attitude towards
spectacle use in the rural India and Nigeria setting seemed similar but so much different to
that of students in Nairobi. The attitude of high school students towards spectacles in many
aspects tends to be generally positive. However, mixed reaction was elicited as regards
spectacles damaging eyes and preventing normalization of eyes. In Nigeria and India students
leaned towards the idea spectacles damage eyes and prevent normalization of eyes and this
notion is similar across these study populations. The differences in attitude as regards
spectacle use could be attributed to difference in culture, ethnic background as well as urban
verses rural backgrounds.
Practice of students in regard to refractive error and eye healthcare
Only 539/1390 (39%) of the students had an eye checkup prior to this study of whom
345/539 (64.0%) had visited an eye specialist/ eye hospital and majority, 305/539 (56.6%)
only did so when they had an eye problem. Of those who had not had an eye checkup,
829/1390 (60%), majority lacked awareness (72.7%) while 390/1390 (47.1%) stated cost as
reason for not having an eye checkup (Table 6).
We found the prevalence of significant refractive error to be 17.2 percent. However, we
found 31% (427/1390) of the students had been advised to wear spectacles before. Of these
students, 57.4% (245/427) stated they did not wear spectacles mainly because, they could not
afford (50.6%) and 48.2% saw no improvement in vision. On further enquiry, 170/427 (39.8

75
%) students stated they had spectacles, but during the study, we found only 117 students had
their spectacles in school. Out of these117 students, 85 had significant refractive error with
65/85 having the right correction and 20/85 under corrected. This suggests the quality of
refractive services in the County may be wanting because 152 students who were visually
impaired and 20 students who were undercorrected had improved vision after refraction.
Another aspect pointing to the quality of refractive services is that 427 students had
previously been advised that they needed spectacles but when we examined them we found
that only 237 actually needed them. Of the students who stated they wore spectacles,
123/170 (74.1%) preferred another way of correcting their vision, with majority 83/123
(69.1%) preferring contact lenses (Table 6, Figure 5, Figure 7, Figure 8). This cascade of
events in provision of refractive services shows a deficiency in screening and correction for
refractive errors.
A captivating aspect brought about by teachers in the key informant interviews that leads to
the reduced uptake of refractive services is the socioeconomic status of the individual
students. Generally in all categories of schools, the teachers realised that some of the students
were not able to access or prioritize eye healthcare because of financial and social constraints
at home. This was particularly so for students in district schools, some of which happen to be
situated in slums. They are also ranked lowest in terms of cut-off marks for intake from the
national primary examinations compared to the National and County schools. Their overall
performance in the National examinations is collectively poorer than the other school
categories with the exception of some schools (30)
. The teachers especially in the district
schools pointed out that the students had such difficult social problems like poverty,
absenteeism, prostitution, alcohol, drug abuse, teenage pregnancies and serious health
problems like H.I.V infections. The teachers reported much of their efforts would be geared
to solving these issues rather than addressing eye health issues. We observed that majority of

76
the students with uncorrected refractive errors out of the total number of students with
refractive error ranged from 96.8% in district schools to 54.3% in county schools. This points
to the inequality in the distribution of refractive services with the social constraints as a major
impediment.

77
8.0 LIMITATIONS AND STRENGTHS
Limitations
Absenteeism and Missing questionnaires: Some of the students were issued with
questionnaires which they did not return even on subsequent follow up because
certain school activities coincided with the data collection.
Anisometropia may not have been fully described because we had a cut of visual
acuity of <6/12 in the better eye yet there were disparity in some of the students visual
acuity probably due to different refractive status in both eyes.
Small number of studies to make comparisons with on the same research topic.
The limitation was only carried out in Nairobi County, Kenya and therefore the results
cannot be generalised to all high school students in the country.
Strengths
The strength in this study is that we performed an objective refraction followed by
subjective refraction which was not carried in previous studies in the region.
Sampling was representative of the entire Nairobi County.
This study had a large sample size.
The knowledge, attitude and practice questionnaire was issued before the clinical
examination and therefore bias was reduced answering the questions.
This study was the only study in the region that did lensometry reading.
This study was the only study in the region on refractive error that performed a KAP
study, in addition to a clinical exam.

78
9.0 CONCLUSION
There is a high prevalence of significant refractive error among high school students
in Nairobi County (17.2%) with a high preponderance of myopia at 15.6%.
There is a high prevalence of uncorrected refractive error at 11 percent.
There is a high burden of uncorrected refractive error at 64.1% out of all the students
with significant refractive error.
The refractive services in the county are wanting as students who required spectacles;
majority could not afford neither did they see any improvement in vision.
The uptake of refractive services was poor due to lack of awareness 72.7%, cost
(38%) and flawed attitudes.

79
10.0 RECOMMENDATIONS
A well designed screening protocol of refractive error in high school students, as well
as regular screening programs, would help in reducing the prevalence of uncorrected
refractive error and improving uptake of refractive services.
The provision of visual acuity charts in schools with instructions on how to use them
would greatly improve the knowledge of students on the status of their vision.
Raise awareness of refractive error among students.
Provision of low cost trendy spectacles.
Alternative refractive services like contact lenses where feasible and affordable
should be explored by weighing the benefits verses the risks.
Regular continuous professional developments training programs for ophthalmic
health professionals on refraction to provide quality refractive services.
A similar study to our study should be conducted in rural Kenya so as to compare the
differences in prevalence and characteristics of R.E among teenagers/ high school
students in urban verses rural Kenya

80
REFRENCES
1. Nzuki H. Significant Refractive Errors as Seen in Standard Eight Pupils Attending
Public Schools in Langata Division, Nairobi, Kenya 2004. MMed Thesis. Nairobi:
University of Nairobi, Opthalmology; 2004.
2. Naidoo K, Raghunandan A, Govender P, Mashige K. Refractive error and visual
impairment in African children in South Africa. Invest Ophthalmol Vis Sci. 2003
september;: p. 3764-70.
3. Quek T, Chua C, Chong J, Hey H, Lee J,Lim YF,Saw SM. Prevalence of refractive
errors in teenage high school students in Singapore. Ophthalmic Physiological Optics.
2004 January; 24(1).
4. Rosman M, Wong T, Wong W, Wong M, Saw S. Knowledge and beliefs associated with
refractive errors and undercorrection: the Singapore Malay Eye Study. Br J Ophthalmol.
2009 Jan; 93(1).
5. Skuta G, Cantour L, Weiss J. Refractive State. In Pediatric Ophthalmology and
Strabismus. San Francisco: American College of Opthamologist; 2012-2013. p. 169.
6. Cline D Hofsetter H, Griffin J. Dictionary of Visual Science. 4th ed. Boston:
Butterworth-Heinemann; 1997.
7. Theodore P, Goss DA. Optometric Clinical Practice Guideline. Care of the patient with
myopia. 1997.
8. Skuta G, Cantor L, Weiss J. In Clinical Optics. San Francisco: American Academy of
Opthamology; 2012-2013. p. 113-119.

81
9. Berger I, Dunaway D. www.infocusonline.org. [Online].; 2004 [cited 2014 March 14th.
Available from:
http://www.infocusonline.org/WORLDWIDE%20DISTRIBUTION%20OF%20VISUA
L%20REFRACTIVE%20ERROR1.doc.
10. Muma M, Kimani K, Kariuki M. prevalence of refractive errors among primary school
children in Makueni District, Kenya 2007. East Afr. j. ophthalmol. 2007; 14(2): p. 48-
51.
11. Kawuma M, Mayeku R. A survey of the prevalence of refractive errors among children
in lower primary schools in Kampala district. African Health Sciences. 2002 August;
2(2): p. 69-72.
12. Ovenseri-Ogbomo G, Omuemu V. Prevalence of refractive error among school children
in the Cape Coast Municipality, Ghana. Dovepress. 2010 July; 2010(2): p. Volume
2010:2 Pages 59 - 66.
13. Kleinstein RN, Jones LA, Hullet S, Kwon S. Refractive Error and Ethnicity in Children.
Arch Ophthalmol. 2003 August; 121: p. 121:1141-1147.
14. Teofilo c. Prevalence of Ametropia Among Public High School Students in Cusco
Province, Peru. Thesis. Nairobi: University of Nairobi, Ophthalmology ; 2013.
15. Robaei D, Huynh SC, Kifey A. Correctable and non-correctable visual impairment in a
population based sample of 12year old Australian Children. Am J Ophthalmol. 2007
January; 48(1).
16. Lu Q, Zheng Y, Sun B. A population based study of visual impairment among pre-

82
school children in Beijing. Am J Ophthalmol. 2009; 147(1075-1081).
17. Salomao S, Cinoto R, Berezovsky A. Prevalence and causes of low visual impairment in
low middle income school children in Sao Paulo. Brazil. Invest Ophthalmol Vis Sci.
2008; 49(4308-4313).
18. He M, Zeng J, Liu Y. Refractive error and visual impairment in urban children in south
China. Invest Ophthalmol Vis Sci. 2004; 45(793-799).
19. Fan D, Lam D, Lam R, Lau J, Chong K, Cheung E, et al. Prevalence, incidence, and
progression of myopia of school children in Hong Kong. Invest Ophthalmol Vis Sci.
2004 April; 45(4): p. 1071-5.
20. Giordano L, Friedman D, Repka M, Ibironke J, Hawes P, Tielsch J. Prevalence of
refractive error among preschool children in an urban population: the Baltimore
Pediatric Eye Disease Study. American Journal of Ophthalmology. 2009 April; 116(4).
21. Liang-Hong P, Chen L, Qin L, Ning K, Fan J. Prevalence of Eye Diseases and Causes of
Visual Impairment in School-Aged Children in Western China. J Epidemiol. 2012
November; 22(1): p. 7(6):342-353.
22. Jobke S, Kasten E, Vorwerk C. The prevalence rates of refractive errors among children,
adolescents, and adults in Germany. Clinical ophthalmology. 2008 september;: p. 600-
607.
23. Dandona R, Srinivas M, Sahare P, Narsaiah S, Munoz S, Pokharel G. Refractive error in
children in a rural population in India. Invest Ophthalmol Vis Sci. 2010 March; 23(72):
p. 615-22.

83
24. Huynh S, Kifley A, Rose K, Morgan I. Astigmatism in 12-Year-Old Australian
Children: Comparisons with a 6-Year-Old Population. investigative opthalmology and
visual science. January 2007;: p. vol. 48 no. 1 73-82.
25. Ebeigbe J. attitude and beliefs of Nigerian undergraduates to spectacle wear. Ghana
Medical Journal. 2013 June; 47(2).
26. Agarwal R, Dhoble P, Bhopal R. Study of the knowledge, attitude and practices of
refractive error. Journal of Biomedical and Pharmaceutical Research. 2013 June; 2(3).
27. He M, Xu J, Yin Q, Ellwein L. Need and challenges of refractive correction in urban
Chinese school children. Optom Vis Sci. 2005 Apr;82(4):229-3. 2005 April; 82(4).
28. World Health Organisation MC. WHO Media centre. [Online].; 2013 [cited 2014 March
18. Available from: http://www.who.int/mediacentre/factsheets/fs282/en/.
29. Ministry Of Education. Nairobi County Education Awards 2012. Thursday 1st August
2013. Newsletter. Nairobi Kenya: Ministry of Educaton, Kenya National Examinations
Council; 2013.
30. Education Mo. Nairobi County Education Awards 2012. Thursday 1st August 2013.
Newsletter. Nairobi: Ministry of Education Kenya, Examination council of Nairobi;
2012.
31. Hashemi H, Rezvan F, Beiranvand A. Papi O-A, Yazdi H, Ostadimoghaddam A et al.
Prevalence of Refractive Errors among High School Students in Western Iran. J
Ophthalmic Vis Res. 2014 April; 9(2)(232-239).
32. Czepita D, Mojsa A, Ustianowska M, Czepita M, Lachowez E. Prevalence of refractive

84
errors in school children ranging from 6 to 18 years of age. Annales academiae Medicae
Stinensis. 2007; 53(1).
33. Johnson G, Minassian D, Weale R, West S. The Epidemilology of Eye Disease. 3rd ed.
Johnson G, editor. London: Imperial College Press; 2012.
34. Msiska V, Njuguna M, Karuiki M. Magnitude and pattern of significant refractive errors
in primary school children of Ntcheu, a rural district in Malawi. East Afr. j. ophthalmol.
2009 Jul; 15(1).
35. Dandona L, Naduvilath T, McCarty C, Srinivas M, Mandal P, Nanda A, Rao G. Burden
of moderate visual impairment in an urban population in Southern India.
Ophthalmology. 1999 Mar; 106(3).
36. Taylor H, Livingston P, Stanislavsky Y, McCarty C. Visual impairment in Australia:
distance visual acuity, near vision, and visual field findings of the Melbourne Visual
Impairment Project. Am J Ophthalmol. 1997 March; 123(3).
37. Holden BA. Uncorrected refractive error: the major and most easily avoidable cause of
vision loss. Community Eye Health. 2007 September: p. 37-39.

85
APPENDIX 1: ETHICAL APPROVAL
86

87
APPENDIX 2: APPROVAL, COUNTY DIRECTOR OF EDUCATION

88
APPENDIX 3: KAP QUESTIONNAIRE AND VISUAL ASSESSMENT
Date: Study number:
Name of the school: ___________________________________________
Age: ____________ Years Gender: Male Female
Form: _____________ Using spectacles: Yes No
Mother’s education level None Primary Secondary College
University other:
______________________________________________________________________
Father’s education level None Primary Secondary College
University other:
______________________________________________________________________
Knowledge
1) Do you feel you have normal vision?
I do not know Yes No
2) What do you think are the causes of poor vision amongst students (give as many examples)
I don’t know Short sightedness
Long Sightedness Poor nutrition
Other: ______________________________________________
3) What methods of correcting low vision do you know of?
I don’t know Spectacles Medicine Contact lens Surgery
Other: ___________________________________
4) What do you think are some of the reasons for people wearing spectacles?
I don’t know Protect eyes from excessive light and injury
Improve vision Look intelligent
Other: __________________________________________________

89
5) It’s been shown that many students with poor vision do not want to wear spectacles. Why
do you think so?
I don’t know
Spectacles prevent normalisation of eyes
Cosmetically unacceptable and embarrassing in public
Cost
Fear of being teased
Other: _______________________________________________________
5) In your area do you know where you can seek help if you found out you had poor eye
sight?
I don’t know
Yes (go to 5 a)
a) If yes where?
Optical Shop Hospital Clinic eye clinic
Other: __________________________________________________

90
Attitude
For each of the following statements, indicate whether you……
Strongly agree, strongly disagree, neutral, moderately agree, disagree
1) What are some of your beliefs towards spectacle wearing?
Strongly
agree
Strongly
disagree
Neutral Moderately
agree
Disagree
Spectacle users or wearing
spectacles is associated with
intelligence
Spectacles are cosmetically
unacceptable and
embarrassing in public
Wearing spectacles
improves appearance
Wearing spectacles leads to
low self esteem
Wearing spectacles makes
you less attractive to the
opposite sex
Wearing spectacles leads to
dependence and worsening
of vision
Wearing Spectacles can
damage your eye
Young people do not need
spectacle correction
Other: ____________________________________________________________

91
Practice
1) Have you ever had an eye checkup?
Yes (go to 1b &c) No (go to 1a) I don’t know (go to 1a)
a) Why have you not had your eyes checked?
b) Where have you had your eyes checked?
Optical Shop Hospital Clinic eye clinic
c) How often do you have your eyes checked?
2) Have you ever been advised to wear spectacles?
I don’t know Yes (go to 2 b) No
a) If yes, do you have your spectacles?
Yes (go to ii then iii) No (got to 2b)
i) If no why?
ii) If yes, when do you wear your spectacles?
Yes No (go to 2b)
iii) Would you prefer another way of correcting your poor
vision?
Yes No
b) What are some the reasons you don’t wear your spectacles or don’t
have spectacles?
Fear of being teased
Not much difference in vision
Broken/ lost
Makes vision worse
Expensive (cost)
Others: __________________________________

92
VISUAL ASSESSMENT
Wearing Spectacles Yes No
Visual Acuity:
Right Eye Left Eye
Without correction With correction Without correction With correction
/ / / /
Power of spectacle:
Right eye Left eye
Sphere Cylinder Axis Sphere Cylinder Axis
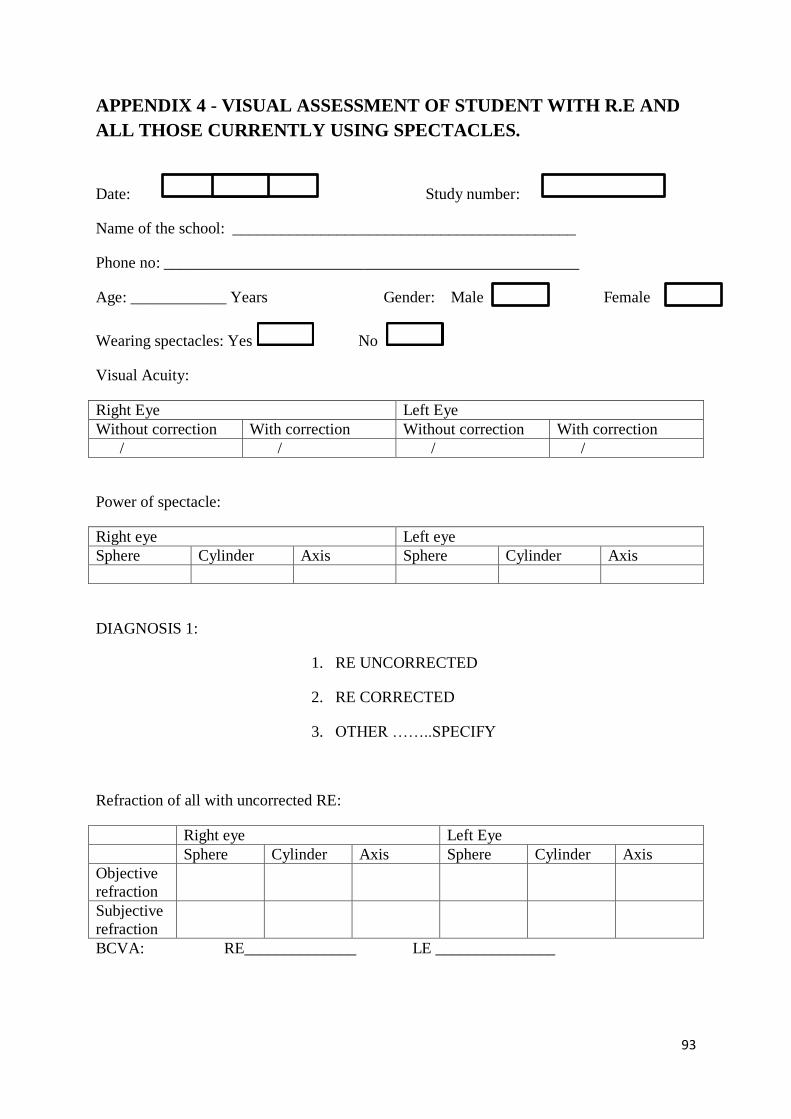
93
APPENDIX 4 - VISUAL ASSESSMENT OF STUDENT WITH R.E AND
ALL THOSE CURRENTLY USING SPECTACLES.
Date: Study number:
Name of the school: ___________________________________________
Phone no: ____________________________________________________
Age: ____________ Years Gender: Male Female
Wearing spectacles: Yes No
Visual Acuity:
Right Eye Left Eye
Without correction With correction Without correction With correction
/ / / /
Power of spectacle:
Right eye Left eye
Sphere Cylinder Axis Sphere Cylinder Axis
DIAGNOSIS 1:
1. RE UNCORRECTED
2. RE CORRECTED
3. OTHER ……..SPECIFY
Refraction of all with uncorrected RE:
Right eye Left Eye
Sphere Cylinder Axis Sphere Cylinder Axis
Objective
refraction
Subjective
refraction
BCVA: RE______________ LE _______________

94
STUDENTS WHO’S VISUAL ACUITY (VA) DOES NOT IMPROVE WITH 2 LINES
Anterior Segment findings:
_____________________________________________________
Posterior segment findings:
_____________________________________________________
Diagnosis:
Right eye Left Eye
Myopia Hyperopia Astigmatism Other Myopia Hyperopia Astigmatism Other
Action taken: Glasses precribed Referral to eye centre for further examinations and
management

95
APPENDIX 5: FOCUSED GROUP DISCUSSION AND IN DEPTH
INTERVIEW GUIDE ;
Study title: Prevalence, Kknowledge, Attitude and Practices on refractive errors among
high school students, in Nairobi County, Kenya.
Introduction
Welcome and a quick round of introductions, overview of topic and ground rules.
Knowledge
1) What conditions do you think people wearing spectacles have?
2) What modes of correction can these people (refer to Q.1) use to improve their vision?
3) What do you think are the causes of poor vision amongst students?
4) It has been shown that many students with poor vision do not take steps to correct their
vision. Why do you think so?
5) In your area do you know where you can seek help if you have poor vision?
Practice
1) Have you ever had an eye checkup?
a) Where have you had your eyes checked?
b) How often do you have your eyes checked?
c) Why have you not had your eyes checked?
3) What are some of the reasons that make wearing of spectacles popular among students?
Attitude
1) What are some of your beliefs towards spectacle wearing?

96
APPENDIX 6: BUDGET AND BUDGET JUSTIFICATION
Unit Number Material Unit Price(Ksh) Total(Ksh)
2 Torches with
batteries
@ 900 1800
3 Blinders( curtains) @500 1500
1400 Data collection
forms
@50 70000
Stationary 2000
1 Vehicle for hire
and fuel
30000
1 Statistician 50000
1 Social scientist 50000
1 Refractionist 50000
1 Research Assistant 50000
1 Lens meter-rent 10000
1 Recorder 5000
Total 320300

97
APPENDIX 7: RANDOMIZATION OF SCHOOLS

98
APPENDIX 8: LETTER TO THE SCHOOLS FOR SEEKING
PERMISSION
Name of school and Address
Date
Dr. Lily A. Nyamai
University of Nairobi
P.O Box 30197, G.P.O, Nairobi, Kenya
Telephone: (+254 - 20) 318262. Fax: (+254 - 20) 245566...
To:
Head teacher /principal
___________________________________________________________________________
RE: REQUEST FOR THE ASSESSMENT OF REFRACTIVE ERRORS
My name is Dr. Lily Nyamai a post graduate student in Ophthalmology at the University of
Nairobi. I am doing a study to find out the Prevalence, knowledge, attitude and practice in
refractive error in high school students in Nairobi County. Your school has been selected to
participate in this study. This study is not invasive and poses no risk for the student. It will
also benefit students in way of picking those with refractive errors for possible correction and
give us information on barriers to correction of refractive errors.
Therefore, I am earnestly requesting you to allow me to do the study, looking forward to a
favorable response

99
Yours Sincerely.
Dr. Lily Nyamai
University of Nairobi-Kenya
Tel: +254721710027
Email: [email protected]
The University of Nairobi (UON) in conjunction with the Kenyatta National
Hospital (KNH) ethics committee for protection of human subjects has
reviewed and approved this project. Any questions regarding your rights as a
research subject may be addressed to the chairperson of the ethics committee for
the protection of human subjects Prof A. Guantai Tel 0733220580,
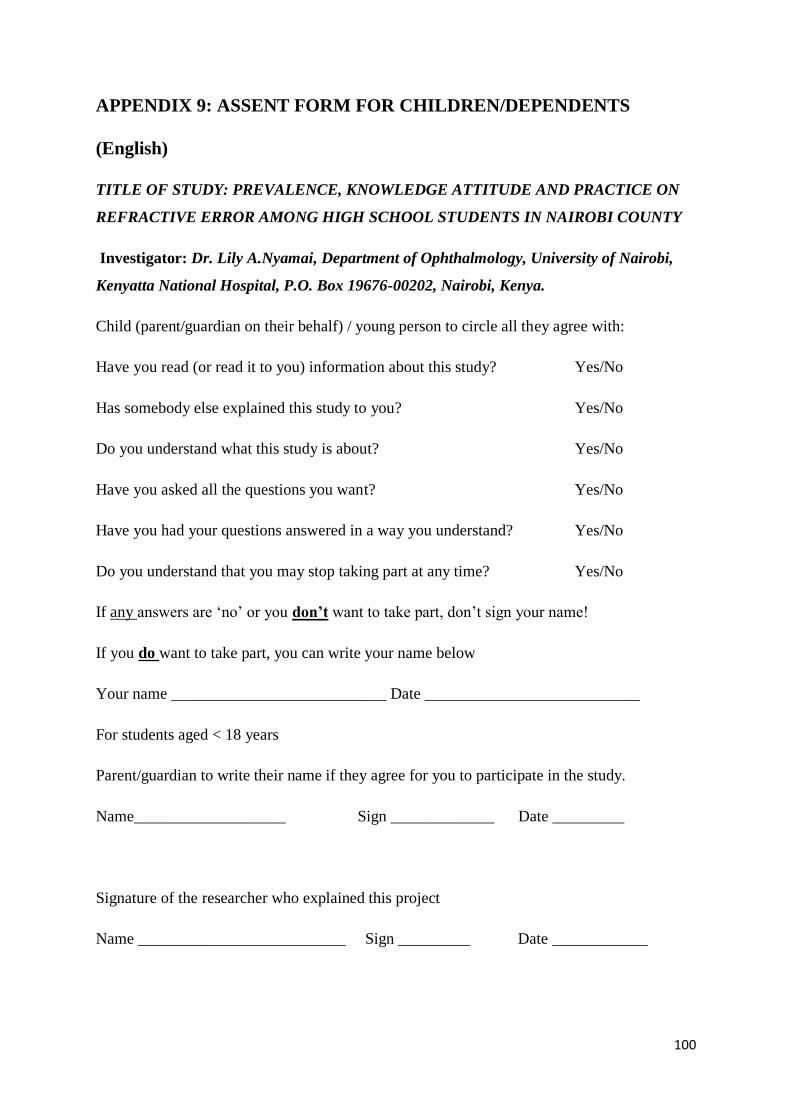
100
APPENDIX 9: ASSENT FORM FOR CHILDREN/DEPENDENTS
(English)
TITLE OF STUDY: PREVALENCE, KNOWLEDGE ATTITUDE AND PRACTICE ON
REFRACTIVE ERROR AMONG HIGH SCHOOL STUDENTS IN NAIROBI COUNTY
Investigator: Dr. Lily A.Nyamai, Department of Ophthalmology, University of Nairobi,
Kenyatta National Hospital, P.O. Box 19676-00202, Nairobi, Kenya.
Child (parent/guardian on their behalf) / young person to circle all they agree with:
Have you read (or read it to you) information about this study? Yes/No
Has somebody else explained this study to you? Yes/No
Do you understand what this study is about? Yes/No
Have you asked all the questions you want? Yes/No
Have you had your questions answered in a way you understand? Yes/No
Do you understand that you may stop taking part at any time? Yes/No
If any answers are ‘no’ or you don’t want to take part, don’t sign your name!
If you do want to take part, you can write your name below
Your name ___________________________ Date ___________________________
For students aged < 18 years
Parent/guardian to write their name if they agree for you to participate in the study.
Name___________________ Sign _____________ Date _________
Signature of the researcher who explained this project
Name __________________________ Sign _________ Date ____________

101
APPENDIX 10: ASSENT FORM FOR CHILDREN/DEPENDENTS
(Kiswahili)
TITLE OF STUDY: KIWANGO CHA MAAMBUKIZI, MAARIFA, TABIA NA MAZOEZI
KATIKA ‘REFRACTIVE ERROR’KATI YA WANAFUZI WA SHULE YA UPILI
KATIKA KATA YA NAIROBI.
Mchunguzi: Dr. Lily A. Nyamai, Idara ya Utafiti ya Macho, Chuo kikuu cha Nairobi,
S.L.P. 19676-00202, Nairobi, Kenya.
Mtoto (mzazi/mlezi kwa niaba ya) / mtoto aweke alama pahali anakubaliana na:
Je, umesoma/ kusomewa habari kuhusu utafiti hili? Ndio/La
Je, umeelezewa kuhusu utafiti hili? Ndio/La
Je, unaelewa utafili hili linahusu nini? Ndio/La
Je, umeuliza maswali kuhusu utafiti hili unge penda kujua? Ndio/La
Je, umepata majibu ya maswali zote umeuliza kwa njia unaelewa? Ndio/La
Je, unaelewa unweza kuondoka kwa utafiti hili wakati wowte? Ndio/la
Kama jibu lolote ni la, basi hutaki kuunga utafiti hili. Tafadhali usipige sahihi.
Ukitaka kujiunga na utafiti hili, tafadhali andika jina lako kwa nafasi umepewa.
Jina lako ___________________________ Date ___________________________
Mzazi/ Mlezi tafadhali andika jina lako na sahihi ukikubali mtoto wako ajiunge na utafiti.
Jina ___________________ Sahihi _____________ Tarehe _________
Mtafiti ambaye amekuelezea juu ya utafi hili anafaa pia kupiga sahihi.
Jina __________________________ Sahihi _________ Tarehe ____________
The University of Nairobi (UON) in conjunction with the Kenyatta National
Hospital (KNH) ethics committee for protection of human subjects has
102
reviewed and approved this project. Any questions regarding your rights as a
research subject may be addressed to the chairperson of the ethics committee for
the protection of human subjects Prof A. Guantai Tel 0733220580,

103
APPENDIX 11: PATIENT REFERRAL FORM
Patient referral form
Dear parent.
Please note that your child
………………………………………………………………………… Who had an eye
examination today was found to have …………………………………………… please
Kindly bring him/her to the
…………………………………………………………………………………………………
……..eye clinic for management.
Dr. Lily A Nyamai .
Date: …………………………………………..

104
APPENDIX 12: WHO CATEGORIES OF VISUAL IMPAIRMENT AND
BLINDNESS
WHO categories of visual impairment and blindness.
Presenting distance Visual Acuity with BCVA in the better eye
Category Worse than Equal to or
better than
0 Mild or no Visual impairment (Normal
Vision)
6/18
1 Moderate visual impairment 6/18 6/60
2 Severe visual impairment 6/60 3/60
3 Blindness 3/60 1/60
4 Blindness 1/60 Light perception
5 Blindness No light
perception
9 Undetermined or
unspecified

105
APPENDIX 13-EYE EXAMINATION AND FOCUS GROUP
DISCUSSION
106
APPENDIX 14: PUBLIC SECONDARY SCHOOLS IN NAIROBI
COUNTY
National Schools
20400001 LENANA SCHOOL- Boys boarding
20400002 NAIROBI SCHOOL- Boys boarding
20400003 THE KENYA HIGH SCHOOL- Girls Boarding
20400004 STAREHE BOYS’ CENTRE AND SCHOOL- Boys boarding
20400008 MOI FORCES ACADEMY- NAIROBI- Boys boarding
20400009 STAREHE GIRLS CENTRE- Girls boarding
County Schools
20401001 AQUINAS HIGH SCHOOL – Boys Boarding
20401005 OFAFA JERICHO HIGH SCHOOL – Boys Boarding
20401003 HURUMA GIRLS’ HIGH SCHOOL – Girls Day & Boarding
20401084 BURUBURU GIRLS SECONDARY SCHOOL – Girls Boarding
20402006 O.L.M SHAURI MOYO GIRLS SEC. SCHOOL – Girls Boarding
20403003 PUMWANI SECONDARY SCHOOL – Boys Boarding
20403004 NGARA GIRLS’ HIGH SCHOOL – Girls Boarding
20405001 DAGORETTI HIGH SCHOOL – Boys Boarding

107
20405002 UPPER HILL SCHOOL – Boys Boarding
20405003 MOI GIRLS’ SCHOOL NAIROBI – Girls Boarding
20405004 PRECIOUS BLOOD RIRUTA – Girls Boarding
20406001 PARKLANDS ARYA GIRLS HIGH SCHOOL – Girls Boarding
20406002 STATEHOUSE GIRLS H. SCH – Girls Boarding
20406007 KANGEMI HIGH SCHOOL – Boys Boarding
20406009 HOSPITAL HILL HIGH SCHOOL – Mixed Boarding
20406011 ST. GEORGE’S GIRLS’ SECONDARY SCHOOL – Girls Boarding
20405007 NEMBU GIRLS HIGH SCHOOL – Girls Boarding
20406018 LAVINGTON MIXED SECONDARY SCHOOL – Mixed Boarding
20406019 HIGHRIDGE MIXED SECONDARY SCHOOL – Mixed Boarding
20408007 EMBAKASI GIRLS SECONDARY SCHOOL – Girls Boarding
20409002 MUHURI MUCHIRI BOYS HIGH SCHOOL – Boys Boarding
20409005 JEHOVA JIRE SECONDARY SCHOOL – Mixed Boarding
20409006 DRUMVALE SECONDARY SCHOOL – Mixed Boarding
20409007 ST. GEORGE ATHI SECONDARY SCHOOL – Mixed Boarding
District Schools
20401002 HIGHWAY SECONDARY SCHOOL – Boys Day
20401004 OUR LADY OF MERCY SECONDARY SCHOOL SOUTH B – Girls Day

108
20401006 NILEROAD SECONDARY – Girls Day
20401008 ST. TERESA’S BOYS SECONDARY SCHOOL – Boys Day
20401008 MAKONGENI SECONDARY SCHOOL – Mixed Day
20401081 RUARAKA HIGH SCHOOL – Mixed Day
20401088 OUR LADY OF FATIMA SECONDARY SCHOOL – Mixed Day
20401233 BABA DOGO SECONDARY SCHOOL – Mixed Day
20401258 C.G.H.U SECONDARY SCHOOL – Mixed Day
20402001 EASTLEIGH HIGH SCHOOL – Boys Day
20402003 MAINA WANJIGI SECONDARY SCHOOL – Mixed Day
20402004 UHURU SECONDARY SCHOOL – Boys Day
20402005 KAMUKUNJI SECONDARY SCHOOL – Mixed Day
20403001 JAMHURI HIGH SCHOOL – Boys Day
20403002 PARKLANDS SECONDARY SCHOOL – Boys Day
20403005 ST TERESA’S GIRLS SECONDARY SCHOOL – Girls Day
20403019 NDURURUNO SECONDARY SCHOOL – Mixed Day
20403024 MURANG’A ROAD MIXED DAY SECONDARY SCHOOL – Mixed Day
20403026 PUMWANI GIRLS SECONDARY SCHOOL – Girls Day
20404001 LANG’ATA HIGH SCHOOL – Mixed Day
20404022 KAREN ‘ C ‘ SECONDARY SCHOOL. – Mixed Day

109
20404024 OLYMPIC HIGH SCHOOL – Mixed Day
20404025 RAILA EDUCATIONAL CENTRE – Mixed Day
20405005 MUTUINI HIGH SCHOOL – Boys Day
20405006 RUTHIMITU SECONDARY SCHOOL – Mixed Day
20405008 RUTHIMITU GIRLS SEC SCHOOL – Girls Day
20405009 DAGORETTI MIXED SEC SCHOOL – Mixed Day
20406012 NAIROBI MILIMANI SECONDARY SCHOOL – Boys Day
20407002 KAHAWA GARRISON SECONDARY SCHOOL – Mixed Day
20407004 KAMITI SECONDARY SCHOOL – Mixed Day
20408001 KAYOLE SECONDERY SCHOOL – Mixed Day
20408014 PETER KIBUKOSYA SECONDARY SCHOOL – Mixed Day
20408015 KAYOLE SOUTH SECONDARY SCHOOL – Mixed Day
20409001 DANDORA SECONDARY SCHOOL – Mixed Day
20409003 HON. DR. MWENJE SECONDARY SCHOOL – Mixed Day
20409004 USHIRIKA SECONDARY SCHOOL – Mixed Day