Aircraft Handling Qualities Data - Robert Heffley Engineering
Upload
khangminh22Category
view
0download
0
Author: Rahul Rajpal
Student number: 10854304
Thesis Supervisor: dhr. drs. Roger Pruppers
Date of submission: 29 June 2015
Presenting the core qualities of your brand
personality, and avoiding the pitfalls
Master’s Thesis - MSc. Business Administration
(Marketing Track)
Faculty of Economics and Business (FEB)

Statement of Originality
This document is written by Student Rahul Rajpal who declares to take full responsibility for
the contents of this document.
I declare that the text and the work presented in this document is original and that no sources
other than those mentioned in the text and its references have been used in creating it.
The Faculty of Economics and Business is responsible solely for the supervision of
completion of the work, not for the contents.

Table of Contents
1 Introduction ........................................................................................................................ 1
1.1 Brands are alive, brands add meaning to our lives ...................................................... 1
1.1.1 Research topic - Brand personality ...................................................................... 2
1.1.2 Research gap in brand personality literature ........................................................ 3
1.2 Problem definition ....................................................................................................... 4
1.2.1 Problem statement ................................................................................................ 4
1.2.2 Sub-questions ....................................................................................................... 4
1.2.3 Delimitations of the study .................................................................................... 5
1.3 Contribution ................................................................................................................ 5
1.3.1 Theoretical contributions ..................................................................................... 5
1.3.2 Managerial contributions ..................................................................................... 6
1.4 Structure of the thesis .................................................................................................. 6
2 Brand personality ................................................................................................................ 8
2.1 Conception of, and early research on brand personality ............................................. 8
2.2 The first brand personality scale ................................................................................. 9
2.3 Replication of Aaker’s scale across cultures and product markets ............................. 9
2.4 Criticism of Aaker’s brand personality scale ............................................................ 10
2.5 Development of new brand personality scale ........................................................... 11
2.6 Brand personality research - as it currently stands .................................................... 12
2.7 Antecedents or drivers of brand personality ............................................................. 12
2.8 Consequences and impact of brand personality ........................................................ 13
2.9 Congruence of consumer and brand personality ....................................................... 13
2.10 Gap in brand personality literature ............................................................................ 14
2.11 Place of this research in brand personality literature ................................................ 15
3 Brand positioning ............................................................................................................. 16
3.1 What is ‘positioning’? ............................................................................................... 16
3.2 Importance and consequences of brand positioning ................................................. 16
3.3 The role of associations in Brand Positioning ........................................................... 17
3.4 The importance of differentiation in brand positioning ............................................ 18
3.5 Is differentiation enough?.......................................................................................... 20
4 Personal and organizational development ........................................................................ 23

4.1 Personal development ............................................................................................... 23
4.2 Organizational development ..................................................................................... 23
4.3 Models of personal and organizational development ................................................ 24
4.3.1 Trait-based approach to human personality ....................................................... 24
4.3.2 Maslow’s theory of human motivation .............................................................. 24
4.3.3 Enneagram ......................................................................................................... 26
4.3.4 Core qualities ..................................................................................................... 27
4.4 Personal development may also imply self-presentation .......................................... 30
5 Study 1 .............................................................................................................................. 31
5.1 Self-presentation vs. brand positioning ..................................................................... 31
5.2 From presenting human personality to presenting brand personality ....................... 32
5.3 Testing Ofman’s model on brand personality ........................................................... 33
5.4 Conceptual framework and hypotheses..................................................................... 33
5.5 Methodology ............................................................................................................. 37
5.5.1 Stimuli generation – Qualitative pre-tests.......................................................... 37
5.5.2 Qualitative pre-test 1 .......................................................................................... 39
5.5.3 Qualitative pre-test 2 .......................................................................................... 41
5.5.4 Stimuli testing - Quantitative pre-test ................................................................ 43
5.5.5 Quantitative Pre-test questionnaire design ......................................................... 44
5.5.6 Results of quantitative pre-test........................................................................... 47
5.5.7 Final experiment design ..................................................................................... 52
5.5.8 Experiment procedure ........................................................................................ 53
5.6 Results ....................................................................................................................... 54
5.6.1 Test for sufficient brand familiarity ................................................................... 54
5.6.2 Factor analysis ................................................................................................... 55
5.6.3 Reliability analysis ............................................................................................. 58
5.6.4 Dimension reduction - Computing scale means ................................................ 58
5.6.5 Manipulation check ............................................................................................ 59
5.6.6 Hypotheses testing ............................................................................................. 60
5.6.7 Additional analyses ............................................................................................ 62
5.7 Discussion ................................................................................................................. 70
6 Study 2 - Ofman’s model as a brand personality positioning tool ................................... 74
6.1 Conceptual framework and hypotheses..................................................................... 75

6.2 Methodology ............................................................................................................. 79
6.2.1 Choice of brand personalities............................................................................. 79
6.2.2 Choice of product categories ............................................................................. 81
6.2.3 Choice of brand names and pictures .................................................................. 82
6.2.4 Final experiment design ..................................................................................... 82
6.2.5 Choice of communication texts and images ...................................................... 84
6.2.6 Experiment procedure ........................................................................................ 85
6.3 Results ....................................................................................................................... 86
6.3.1 Factor analysis ................................................................................................... 86
6.3.2 Reliability analysis ............................................................................................. 88
6.3.3 Dimension reduction - Computing scale means ................................................ 89
6.3.4 Manipulation check ............................................................................................ 90
6.3.5 Hypotheses testing ............................................................................................. 94
6.3.6 Additional analyses .......................................................................................... 106
6.4 Discussion ............................................................................................................... 120
6.4.1 Implications of results of Study 2 on results of Study 1 .................................. 120
6.4.2 Discussion of results of study 2 ....................................................................... 121
7 General discussion and implications .............................................................................. 125
7.1 Theoretical implications .......................................................................................... 127
7.1.1 Applicability of new insights to brand personality literature........................... 127
7.1.2 Mastering the Challenge is perhaps not all that important .............................. 127
7.1.3 Brand personality as a component of associative network .............................. 129
7.2 Managerial implications .......................................................................................... 131
8 Conclusions .................................................................................................................... 134
8.1 Summary ................................................................................................................. 134
8.2 Answer to the problem statement ............................................................................ 135
8.3 Limitations, recommendations, and directions for further research ........................ 136
References
Appendix 1- Qualitative pre-test 1 results
Appendix 2 - Qualitative pre-test 2 results
Appendix 3- Quantitative pre-test questionnaire versions 1 - 6
Appendix 4 - Study 1 Questionnaire
Appendix 5 - Correlation matrices (Study 1)

Appendix 6 - Study 2 experiment set-up
Appendix 7 - Study 2 Questionnaire
Appendix 8 - SPSS outputs of main analyses (Study 1)
Appendix 9 - SPSS outputs of main analyses (Study 2)

List of Tables
Table 1: Core Quadrant of the personality traits for pre-test 1 ................................................ 39
Table 2: Core Quadrant of "Sympathetic" personality ............................................................ 42
Table 3: Core Quadrants for the personalities in Quantitative pre-test ................................... 44
Table 4: Input for Quantitative pre-test phase ......................................................................... 45
Table 5: Multi-items for Core Quality traits - Quantitative pre-test ........................................ 46
Table 6: Multi-items for Pitfall traits - Quantitative pre-test ................................................... 46
Table 7: Means and std. deviations for stimuli brands - Quantitative pre-test ........................ 48
Table 8: Final stimuli Study 1 .................................................................................................. 51
Table 9: One sample T-test against 4 on mean familiarity ratings .......................................... 55
Table 10: Rotated component table and factor loadings - Exciting ......................................... 56
Table 11: Rotated component table and factor loadings - Rugged .......................................... 57
Table 12: Rotated component table and factor loadings - Competent ..................................... 57
Table 13: Reliability analysis of all Core Quality, Pitfall, and Challenge items ..................... 58
Table 14: One sample t-test against 4 on Core Quality ........................................................... 60
Table 15: One sample t-test against 4 on Pitfall ...................................................................... 60
Table 16: One sample t-test against 4 on Challenge ................................................................ 60
Table 17: Regression table for 'exciting' brand personality ..................................................... 61
Table 18: Regression table for 'rugged' brand personality ....................................................... 61
Table 19: Regression table for 'competent' brand personality ................................................. 62
Table 20: Mean Core Quality, Pitfall, and Challenge scores of the 'exciting' brands ............. 65
Table 21: Mean Core Quality, Pitfall, and Challenge scores of the 'rugged' brands ............... 65
Table 22: Mean Core Quality, Pitfall, and Challenge scores of the 'competent' brands .......... 66
Table 23: Mean brand attitude scores of all brands shown by personality type ...................... 69
Table 24: Final experiment design - Study 2 ........................................................................... 83
Table 25: Rotated component table and factor loadings - ‘Confidence’ brand personality .... 87
Table 26: Rotated component table and factor loadings - ‘Excitement’ brand personality ..... 87
Table 27: Rotated component table and factor loadings - ‘Excitement’ brand personality ..... 88
Table 28: Reliability analyses - Brand attitude ........................................................................ 89
Table 29: Reliability analyses - Core Quality, Pitfall, and Challenge items (Confidence brand
personality) .............................................................................................................................. 89
Table 30: Reliability analyses - Core Quality, Pitfall, and Challenge items (Excitement brand
personality) .............................................................................................................................. 89
Table 31: Mean scores of Core Quality, Pitfall, and Challenge - Confident brand personality
.................................................................................................................................................. 90
Table 32: Mean scores of Core Quality, Pitfall, and Challenge - Excitement brand personality
.................................................................................................................................................. 90
Table 33: One sample t-test against 4 on Core Quality ........................................................... 91
Table 34: One sample t-test against 4 on Pitfall ...................................................................... 91
Table 35: One sample t-test against 4 on Challenge ................................................................ 91
Table 36: Mean scores of Core Quality, Pitfall, and Challenge scenarios on Core Quality,
Pitfall, and Challenge - Confidence brand personality ............................................................ 93

Table 37: Mean scores of Core Quality, Pitfall, and Challenge scenarios on Core Quality,
Pitfall, and Challenge - Excitement brand personality ............................................................ 94
Table 38: All within- and between-subjects variables, and their various interactions ............ 95
Table 39: Mean Scores on Brand attitude - Confidence brand personality ............................. 95
Table 40: Mean Scores on Brand attitude - Exciting brand personality .................................. 96
Table 41: Mean Scores on Core Quality - Confidence brand personality ............................. 112
Table 42: Mean Scores on Core Quality - Excitement brand personality ............................. 112
Table 43: Mean Scores on Pitfall - Confidence brand personality ........................................ 115
Table 44: Mean Scores on Pitfall - Excitement brand personality ........................................ 115
Table 45: Mean Scores on Brand attitude - Confidence brand personality ........................... 118
Table 46: Mean Scores on Brand attitude - Excitement brand personality ........................... 118
Table 47: Means, Standard deviations, and Correlations (Brand personality Exciting) .......... 53
Table 48: Means, Standard deviations, and Correlations (Brand personality Rugged) ........... 53
Table 49: Means, Standard deviations, and Correlations (Brand personality Competent) ...... 53

List of Figures
Figure 1: Ads of different brands communicating distinctive personalities; Image source:
(images.google.com, 2015) ........................................................................................................ 1
Figure 2: Example of Anthropomorphism - According to her owner, this car has beautiful
eyes ............................................................................................................................................ 1
Figure 3: Maslow's hierarchy of needs model; Source: (Maslow, 1943) ................................ 25
Figure 4: The Enneagram model; Image source: (Kale & Shrivastava, 2003) ........................ 26
Figure 5: Ofman's Core Quadrant; Source: (Ofman, 2001) ..................................................... 27
Figure 6: Core Quadrant of the personality "Confidence"; Source: (Ofman, 2001) ................ 29
Figure 7: Study 1: Conceptual framework ............................................................................... 37
Figure 8: Mean Core Quality, Pitfall, and Challenge scores of the 'exciting' brands .............. 65
Figure 9: Mean Core Quality, Pitfall, and Challenge scores of the 'rugged' brands ................ 66
Figure 10: Mean Core Quality, Pitfall, and Challenge scores of the 'competent' brands ........ 66
Figure 11: Mean brand attitude scores of all brands shown by personality type ..................... 69
Figure 12: Study 2: Conceptual framework ............................................................................. 78
Figure 13: Mean scores of Core Quality, Pitfall, and Challenge scenarios on Core Quality,
Pitfall, and Challenge - Confidence brand personality ............................................................ 93
Figure 14: Mean scores of Core Quality, Pitfall, and Challenge scenarios on Core Quality,
Pitfall, and Challenge - Confidence brand personality ............................................................ 94
Figure 15: ANOVA plots confident brand personality ............................................................ 97
Figure 16: ANOVA plots exciting brand personality .............................................................. 97
Figure 17: ANOVA plots confident brand personality ............................................................ 99
Figure 18: ANOVA plots excitement brand personality ......................................................... 99
Figure 19: ANOVA plots confident brand personality .......................................................... 101
Figure 20: ANOVA plots excitement brand personality ....................................................... 101
Figure 21: ANOVA plots confident brand personality .......................................................... 103
Figure 22: ANOVA plots excitement brand personality ....................................................... 103
Figure 23: ANOVA plots confident brand personality .......................................................... 105
Figure 24: ANOVA plots excitement brand personality ....................................................... 105
Figure 25: ANOVA plots confident brand personality .......................................................... 107
Figure 26: ANOVA plots excitement brand personality ....................................................... 107
Figure 27: ANOVA plots confident brand personality .......................................................... 109
Figure 28: ANOVA plots excitement brand personality ....................................................... 109
Figure 29: ANOVA plots confident brand personality .......................................................... 111
Figure 30: ANOVA plots excitement brand personality ....................................................... 111
Figure 31: ANOVA plots confident brand personality .......................................................... 114
Figure 32: ANOVA plots excitement brand personality ....................................................... 114
Figure 33: ANOVA plots confident brand personality .......................................................... 117
Figure 34: ANOVA plots excitement brand personality ....................................................... 117
Figure 35: Plot of mean brand attitude scores vs. scenario type for both brand personalities
................................................................................................................................................ 119
Figure 36: Harley Davidson's communication messages showing perhaps too much
"Ruggedness"; image source: (images.google.com, 2015) .................................................... 130

Figure 37: Harley Davidson has been able to foster tremendous brand loyalty and community
engagement over several years; image source: (images.google.com, 2015) ......................... 130
Figure 38: A comparison of the communication messages of Dayton and Timberland; image
source: (images.google.com, 2015) ....................................................................................... 132

Page 1 of 137
1 Introduction
1.1 Brands are alive, brands add meaning to our lives
Consider Apple’s “I’m a MAC and I’m a PC” series of advertisements, or advertisements for
Pillsbury dough, Mr. Muscle power cleaner, and M&M’s candy. What is common in these
advertisements, and why have they been so hugely appealing to consumers?
By either incorporating real people
(Apple’s “Get a Mac” ads), or animated
characters (Pillsbury, Mr. Muscle,
M&M’s) to represent the brands, these
advertisements have endowed their
respective brands with distinctive
personalities, making them come alive.
For e.g. in Apple’s “Get a Mac” ads, PC
has been demonstrated as possessing a
traditional, formal, boring, and rather
awkward personality, while Mac has
been represented as possessing a casual,
fun, informal, hip, and cool personality.
Such personification techniques have been extremely effective in appealing to
consumers, and therefore a key advertising strategy for many firms. It has been suggested that
people seek to form close relationships with brands, and brands can
serve as a relationship partner if they are able to behave as an active
member in the consumer-brand relationship, i.e. if they are able to
reciprocate and respond to consumers (Fournier, 1998). This
tendency of people to form relationships with brands stems from a
phenomenon termed anthropomorphism - people’s tendency to see
inanimate objects as possessing human-like characteristics
(Aggarwal & McGill, 2007). Some other examples of
anthropomorphism include naming objects of personal possession
like cars, bikes, houses, etc. Figure 2: Example of Anthropomorphism -
According to her owner, this car has beautiful
eyes
Figure 1: Ads of different brands
communicating distinctive personalities; Image
source: (images.google.com, 2015)
Page 2 of 137
It therefore appears as though brands are not considered as merely inanimate constructs
that lack vitality and are meant to differentiate companies and their products, but rather as
living beings with distinct human-like personality traits. Consumers widely seek to form
relationships with brands, and feel that brands can add meaning to their lives (Fournier,
1998).
1.1.1 Research topic - Brand personality
As mentioned above, the notion that brands seem to possess distinct human-like personality
traits and characteristics has long existed in marketing and branding literature. “If the brand
were to come alive as a person, what would it be like? What would it do? Where would it
live? What would it wear? Who would it talk to if it went to a party (and what would it talk
about)?” (Keller & Richey, 2006, p. 74). These are some of the most commonly asked set of
questions when determining the personality traits associated with a brand.
While brand personality as a construct had existed in marketing, branding, and
advertising literature, it’s importance was highlighted when Jennifer Aaker formally defined
the term as “the set of human characteristics associated with a brand” (J. L. Aaker, 1997, p.
347), developed the five dimensions of brand personality, namely - Sincerely, Excitement,
Competence, Sophistication, and Ruggedness (Aaker, 1997). Currently, much of the existing
body of brand personality research stands at the crossroads of four main sub-categories.
Azoulay (2005) identified three of these sub-domains as - development of scales and
dimensions to measure a brand’s personality, studying the consequences and impact of a
brand’s personality on consumers’ behavior towards the brand, and understanding the extent
to which congruence between a brand’s and consumers’ personality influences their brand
choice (Azoulay, 2005). However, besides the three sub-domains identified by Azoulay
(2005), another sub-stream of literature in brand personality research involves studying the
antecedents and sources of a brand’s personality (J. L. Aaker, 1997; Eisend & Stokburger-
Sauer, 2013; Grohmann, 2009; Maehle & Supphellen, 2011).
While all these existing sub-streams of research in brand personality literature have
added tremendous value and greatly advanced this construct until now, they have also
somewhat limited the scope of brand personality research, since most of the work done on
this construct has not been able to venture outside the boundaries created by these sub-
streams.

Page 3 of 137
1.1.2 Research gap in brand personality literature
Existing literature has paid significant attention to how consumers perceive a firm’s brand
personality; however, how a firm actually intends its brand personality to be perceived by the
consumers (i.e. a strategic perspective) has largely been neglected (Malär, Nyffenegger,
Krohmer, & Hoyer, 2012). In their research, Malär et al. (2012) have underscored the
relevance of a strategic perspective on brand personality research by pointing out that a
successfully implemented brand personality can positively affect consumers’ loyalty towards
the brand, and hence the firm’s market share. However, one of the limitations of Malär et al’s
research is that it does not point out how consumers process, and react to the different ways
in which a firm communicates its brand and intended personality (Malär et al., 2012).
Moreover, no clear principles exist yet in brand personality research for strategically
positioning a firm’s intended brand personality such that it occupies a desired or favorable
position in consumers’ minds. While several ideas and principles exist for positioning an
organization’s brands, in general (Keller, 2013; Keller, Sternthal, & Tybout, 2002), such
ideas have not been carried over to brand personality research to explore whether a firm can
position its brand personality similar to how it can position its brand. This research therefore
intends to fill these two gaps by developing a framework which studies differences in
consumers’ perception of a firm’s brand personality, depending on how it is communicated
by the firm, thereby allowing brands to frame their personality messages effectively. For this
purpose, this research simultaneously considers both a consumer behavior, as well as a
strategic perspective on brand personality.
Besides the above mentioned two gaps in the literature, another surprising trend to be
noted in brand personality research is that barring Aaker’s research on the development of
brand personality scale that incorporated insights from (human) personality psychology
research (J. L. Aaker, 1997), subsequent literature on brand personality has not incorporated
any new insights from other domains. This comes as a surprise, since brands have since been
widely acknowledged as being anthropomorphized and possessing human-like
characteristics. If this is really the case, then a wide body of literature exists in the field of
personal and organizational development that might possibly endow brand personality
research with relevant insights, and further solidify the parallel drawn between brands and
humans.

Page 4 of 137
One such tool that has been developed in personal and organizational development
literature is the Core Quadrant (Ofman, 2001), which highlights the importance of
understanding one’s Core qualities, Pitfalls, Challenges, and Allergies. The essence of this
model is to enable people to discover their own, as well as others’ strengths and challenges,
and learn from the people they dislike the most (Ofman, 2001). With a slightly different
interpretation however, this tool could also be used as a self-presentation tool, making people
aware of how they could present their unique and positive personality trait (core quality) to
others by having the right ‘balance’ of certain personality traits. Consider for example a
person with a Core Quality of ‘confidence’. This person might very easily be perceived by
others as being ‘arrogant’ (his/her Pitfall) if he/she doesn’t seem to balance the quality of
confidence with ‘modesty’ (his/her Challenge). Could such an idea be extended to brands?
Do brands, like humans, need to strike the right balance between certain personality traits to
be perceived positively by consumers? Such ideas will be explored in this research in detail.
1.2 Problem definition
The objective of this research is two-fold. The first objective is to fill the existing two gaps in
brand personality literature - regarding the lack of knowledge on how consumers process, and
react to the different ways in which a firm communicates its brand and intended personality,
and regarding the absence of ideas and principles for strategically positioning an intended
brand personality. A second objective of this research is to advance, and broaden the scope of
the existing brand personality research beyond its existing boundaries by interweaving and
applying principles from domains that have previously not been considered in brand
personality literature, namely - personal & organizational development, and strategic brand
positioning. For this purpose, the following problem statement has been developed.
1.2.1 Problem statement
How can principles from personal & organizational development, and brand
positioning literature guide effective positioning of a firm’s intended brand
personality in its consumers’ minds?
1.2.2 Sub-questions
The problem statement can be split into the following sub-questions:
How can a parallel be drawn between the literature on personal & organizational
development and brand positioning?

Page 5 of 137
How can these insights from the two above mentioned domains be collectively
applied to brand personality literature in order to guide a strategic positioning of brand
personality?
How do consumers process, and react to the different ways in which a firm
communicates its brand and intended personality?
How can consumers’ attitudes towards the brands be influenced depending on the
manner in which brands communicate their personality traits?
1.2.3 Delimitations of the study
The purpose of this research is not to suggest incremental improvements in the existing body
of brand personality research, but to try to add substantial value to it by incorporating new
insights from literature domains such as personal and organizational development, and brand
positioning. Personal and organizational development is a domain which explains how both
human beings and organizations can develop and improve themselves, so that they can realize
their true potential. Being previously unconsidered in brand personality research, such
literature might provide a fresh perspective to this domain, and further solidify the parallel
drawn between brands and humans.
Moreover, while a key aim of this research is to enable strategic positioning of firms’
intended brand personality, it does not intend to develop new principles for this purpose. It
merely intends to interweave and apply existing insights from brand positioning literature,
which has previously not been incorporated in brand personality research. Another point
worth noting is that this research does not try to explain how firms can create a (strong) brand
personality in the first place, since the focus is on positioning an existing brand personality.
Also, no new brand personality scales or dimensions will be developed for the purpose of
conducting this research, but existing scales or dimensions from prior brand personality
research will be used and applied.
1.3 Contribution
1.3.1 Theoretical contributions
The intended theoretical contribution of this research is two-fold - Firstly, this research
intends to fill the existing gaps in brand personality literature regarding the lack of knowledge
on how consumers process, and react to the different ways in which a firm communicates its
brand and intended personality, and regarding the absence of principles for strategically
positioning a firm’s intended brand personality. Secondly, this research intends to advance,

Page 6 of 137
and broaden the scope of the existing brand personality literature beyond its existing
boundaries by interweaving and applying principles from domains that have previously not
been incorporated in brand personality literature, namely - organizational and personal
development, and strategic brand positioning. Personal and organizational development
domain explains how both human beings and organizations can develop and improve
themselves, and strategic brand positioning domain explains how firms can position their
brands. Therefore, such literature might further solidify the parallel drawn between brands
and humans, and endow the existing brand personality research with relevant insights.
1.3.2 Managerial contributions
The primary managerial contribution of this research is to enable firms to effectively position
their brand personality, such that it occupies an intended or favorable position in the minds of
their consumers which ultimately leads to positive attitude towards the brand. Prior brand
personality research has pointed out numerous advantages of brand personality for firms,
such as direct and indirect consequences on various dimensions such as trust, attachment,
commitment, attitude, and affect towards the brand (Eisend & Stokburger-Sauer, 2013; Louis
& Lombart, 2010; Sung & Kim, 2010). Also, being uniquely associated with a brand, its
personality can be an effective means of differentiation from competitors, and therefore a
source of competitive advantage for the firm (Siguaw, Mattila, & Austin, 1999).
Furthermore, research on congruence of brand’s and consumers’ personalities has
demonstrated that consumers often choose brands with similar personalities to theirs across
various products (Lin & Huang, 2012). Therefore, a successfully implemented brand
personality - such that the firm’s consumers perceive the brand personality similar to what is
intended by the firm can positively affect consumers’ loyalty towards the brand, and hence
the firm’s market share (Malär et al., 2012). Ultimately, a well-communicated brand
personality to the consumers by the firm can foster personal relevance to the consumers,
enabling formation of close relationships with the brand, and hence stimulating Brand
Resonance (Keller, 2001).
1.4 Structure of the thesis
The research will begin with reviewing the existing body of literature on Brand personality
(Chapter 2), since this construct is the central theme around which this research is organized.
Since the existing brand personality research lacks clear principles of strategic positioning of
a firm’s brand personality as pointed out above, literature on the topic of Brand positioning

Page 7 of 137
will be reviewed in the subsequent chapter (Chapter 3). Furthermore, in order to help further
strengthen the parallel drawn between brands and humans, Chapter 4 will review the
literature on Personal and organizational development, exploring ideas and insights from this
domain that might endow brand personality literature with useful insights. Following the
literature review, the research will continue with the first study (Chapter 5), which aims to
test the applicability of the insights from the domains of personal and organizational
development and brand positioning to the broader domain of brand personality. Following
this initial study, a second study (Chapter 6) will then aim to explain how the combination of
the above mentioned insights can guide effective positioning of a firm’s intended brand
personality in consumers’ minds. Collectively, Chapter 5 and 6 will aim to answer the
research question and sub-questions that have been presented in the paragraphs above.
Finally, the research will be concluded with General discussion and implications (Chapter 7)
and Conclusions (Chapter 8).
Page 8 of 137
2 Brand personality
Chances are that when the word “personality” is mentioned in any conversation, one would
quickly assume that the subject of the conversation is a human being. Although, it is well
known that all human beings possess individual personality traits, such traits are not
exclusive to us humans. Inanimate objects can also be associated with distinct personality
traits; in fact, it is well acknowledged that people have a tendency to see inanimate objects as
possessing human-like characteristics - a phenomenon termed anthropomorphism (Aggarwal
& McGill, 2007). Anthropomorphism can explain why some people tend to name objects of
personal possession such as cars, bikes, houses, etc.
From a marketing perspective, one such an inanimate construct that has been widely
anthropomorphized over the last several decades has been brands. Whether it be
advertisements demonstrating brands as real people (e.g. Apple’s “I’m a Mac, and I’m a PC”
ads), or as animated characters (e.g. Pillsbury, Mr. Muscle or M&M’s ads), or whether it be
marketing, branding and advertising literature, brands have long been acknowledged to
possess distinctive personality traits, as if they were alive.
2.1 Conception of, and early research on brand personality
The concept of brand personality was conceived as early as 1955, when Gardner and Levy
acknowledged the importance of the image, character, and personality that get associated
with brands resulting from the firm’s advertising communication activities, and advocated
that a brand be conceived as more than simply a means to differentiate among the producers
of products (Gardner & Levy, 1955). Research on brand personality has also been done in
advertising. Plummer (1984), for example, pointed out that a firm can benefit by
communicating its brand’s personality to its consumers, enabling them to “see the brand in
themselves”, or “see themselves in the brand” (Plummer, 1984, p. 81). Plummer also noted
that a brand personality consists of two “faces”, called “Brand personality statement” - how
the firm wants its consumers to perceive its brand, and “Brand personality profiles” - how the
consumers actually perceive the brand (Plummer, 1984, p. 80). Furthermore, Keller (1993)
described brand personality as an attribute originating from user and usage imagery
attributes, and highlighted its role in consumers’ self-expression. It is also addressed how
brand personality attributes “reflect emotions or feelings evoked by the brand” by means of
the associations that get attributed with the brand (Keller, 1993, p. 4). This self-expressive
function of brand personality was also brought to attention earlier by (Belk, 1988), who

Page 9 of 137
described that the personality or image of a brand can enable consumers to express
themselves.
2.2 The first brand personality scale
While the early research on brand personality in marketing, branding, and advertising
literature brought about attention to the construct and underscored its importance, much of
this literature either used the construct interchangeably with, or embedded it within the wider
concept of brand image or user/usage image (Gardner & Levy, 1955; Keller, 1993; Plummer,
1984). Moreover, this early stream of literature also lacked a consensus on a clear definition
of the construct, and its actual contribution to theory and practice.
The one research that brought about such clear definition of brand personality, along
with its defining dimensions was Aaker’s (J. L. Aaker, 1997). In Aaker’s research, she not
only formally defined the term brand personality as “the set of human characteristics
associated with a brand” (J. L. Aaker, 1997, p. 347), but also developed a framework which
drew a parallel with the so-called “Big five” dimensions of human personality in personality
psychology research (J. L. Aaker, 1997). According to Aaker, consumers perceive that brands
have five distinct personality dimensions, namely - Sincerity, Excitement, Competence,
Sophistication, and Ruggedness. The most important implications of this research were that it
highlighted the necessity of looking at brand personality at the level of its multiple
dimensions, and not at the aggregate level of the construct as a whole.
Aaker’s brand personality scale had been the first of its kind and added great value to
brand personality literature, as many studies have made use of this scale to examine the
antecedents and consequences of brand personality, underscoring both the drivers, and the
direct and indirect impact of brand personality on various dimensions such as trust,
attachment, commitment, attitude, and affect towards the brand (Eisend & Stokburger-Sauer,
2013; Louis & Lombart, 2010; Maehle & Supphellen, 2011; Sung & Kim, 2010). These ideas
will also be explained in the subsequent paragraphs in detail.
2.3 Replication of Aaker’s scale across cultures and product markets
Aaker’s brand personality scale has also served as the basic foundation for replication in
various cultural contexts. For example, Jennifer Aaker, Benet-Martinez, and Garolera (2001)
studied the extent to which the basic dimensions of brand personality, as developed by J. L.
Aaker (1997) for the United States can be generalized across Spanish and Japanese contexts,
and concluded that a set of brand personality dimensions (Sincerety, Excitement, and
Page 10 of 137
Sophistication) are common to all three countries, while a few other dimensions are culture-
specific (Ruggedness - American, Peacefulness - Japanese, Peacefulness, Passion - Spanish)
(Jennifer Aaker et al., 2001). In the Netherlands, the culture-specific brand personality
dimensions were found to be Gentle, annoying, and distinguishing (Smit, Van den Berge, &
Franzen, 2003), while in Korea, they were found to be Passive likeableness and Ascendancy
(Sung & Tinkham, 2005).
Besides being tested for its applicability across various countries, Aaker’s scale has
also been replicated across product markets and categories. For instance, Sung, Choi, Ahn,
and Song (2015) attempted to test the applicability of this scale to luxury brands in the
fashion, automobile and retail sectors, and found that in addition to the Sincerity, Excitement,
and Sophistication dimensions, three other dimensions, namely - Professionalism,
Attractiveness, and Materialism are uniquely applicable to luxury brands. Moreover, Aaker’s
five brand personality dimensions also proved to be robust in the economy hotel sector (Li,
Yen, & Uysal, 2014).
2.4 Criticism of Aaker’s brand personality scale
Despite its significant contribution to the brand personality literature and widespread
replication in numerous empirical studies across different cultures and product-market
contexts, Aaker’s scale has not remained free from criticism. The major criticism came from
Azoulay and Kapferer (2003), who first of all questioned Aaker’s “loose” and “broad”
definition of the construct of brand personality. According to them, including the term
‘human characteristics’ in the definition of brand personality may mean that brands can be
attributed with any and all human attributes, including non-physical ones such as inner
values, intellectual abilities, physical traits, social class, gender, etc. - attributes which have
even been excluded from the human personality definition and scales in psychology
literature, from which Aaker derived the idea of brand personality dimensions in the first
place (Azoulay & Kapferer, 2003, p. 150). Consequently, they proposed a new, stricter
definition of brand personality as “the set of human personality traits that are both applicable
to and relevant for brands” (Azoulay & Kapferer, 2003, p. 151).
Secondly, Azoulay and Kapferer questioned the validity of Aaker’s scale, arguing that
the scale does not actually measure brand personality, but in fact measures attributes of brand
identity and even product performance, since asking people to describe the personality traits
they would normally associate with a particular brand would result in people naming the

Page 11 of 137
brands best associated with their product categories (E.g. considering Energy drink brands as
possessing Energetic personality, and Electronic equipment as possessing Up-to-date
personality traits) (Azoulay & Kapferer, 2003, p. 153). Moreover, Azoulay and Kapferer
(2003) argue that such a method can enforce people in naming brands for which they possess
typical user or usage imagery associations - which are characteristics of brand identity - and
not brand personality.
With their criticisms of Aaker’s existing brand personality scale, Azoulay and Kapferer
(2003) brought up some very important points for brand personality researchers to consider
when replicating this scale in their empirical studies. Moreover, their newly proposed, more
apt definition of brand personality led to further clarification of the construct. However, these
criticisms and conceptual clarifications of Azoulay and Kapferer (2003) did not suggest ways
for, or lead to any immediate improvements in the methodology or measurement techniques
of brand personality dimensions. It was only until recently that a new brand personality scale
was developed by Geuens, Weijters, and De Wulf (2009) based on the definition of brand
personality which Azoulay and Kapferer (2003) proposed.
2.5 Development of new brand personality scale
Acknowledging the rising criticism of Aaker’s scale in brand personality literature, Geuens et
al. (2009) developed a new brand personality scale consisting strictly of personality items
based on Azoulay and Kapferer’s definition of brand personality. According to their study,
the new dimensions of brand personality are - Activity, Responsibility, Aggressiveness,
Simplicity, and Emotionality (Geuens et al., 2009).
While only three of Aaker’s five brand personality dimensions related to the “Big
five” dimensions of human personality - for Sincerity (similar to
Agreeableness/Conscientiousness), Excitement (similar to Extraversion), and Competence
(similar to Conscientiousness/Extraversion) dimensions, the brand personality scale
developed by Geuens et al. (2009) had a five-factor structure similar to the “Big five” human
personality dimensions (Geuens et al., 2009). Moreover, this scale also tested its reliability
and validity rigorously, such that it can be used for studies across multiple brands of different
product categories, or within a specific product category, on the level of an individual brand,
or for studies across different cultural contexts - something which Aaker’s scale had only
partly been able to do (Geuens et al., 2009).

Page 12 of 137
2.6 Brand personality research - as it currently stands
Besides development of brand personality scales, there exist three other major sub-streams of
research in the field of brand personality research, as mentioned below. The first two of these
have been previously recognized by Azoulay (2005), however, the last has recently regained
the attention of brand personality researchers.
Understanding the extent to which congruence between a brand’s personality and that
of consumers’ influences their brand choice
Studying the consequences and impact of brand personality on consumers’ behavior
towards the brand
Studying the antecedents and drivers of brand personality.
Subsequent paragraphs will briefly describe the developments in each of these sub-streams.
2.7 Antecedents or drivers of brand personality
Of the four sub-streams of literature on brand personality mentioned above, the one that has
received relatively little attention has been studying the antecedents or sources of brand
personality - i.e. what gives rise to a brand’s personality or its certain dimensions.
While proposing the dimensions of brand personality, Aaker herself pointed out a few
sources or drivers of brand personality in the form of consumers’ user imagery associations,
companies’ CEOs, endorsers, or spokespeople, typical users of a brand, or even product-
related attributes, brand logos, advertising styles, etc. (J. L. Aaker, 1997). However, research
on examining the antecedents of brand personality had been quite limited in the literature,
especially since much attention has been to three sub-streams of brand personality.
Nevertheless, a few studies have made importance contributions in this field by examining
whether or not introduction of brand extensions has any effect on brand personality
(Diamantopoulos, Smith, & Grime, 2005), and studying the effect of gender of a brand
spokesperson on the gender dimensions of brand personality (Grohmann, 2009), effects of
user imagery and price on certain dimensions of brand personality (Lee & Back, 2010), and
effects of advertising with hedonic benefit claims, branding, country of origin, and self-brand
congruent consumer personality (Eisend & Stokburger-Sauer, 2013).
Moreover, Maehle and Supphellen (2011) provided an important contribution towards
this end by studying the impact of various sources on different dimensions of brand
personality. They concluded that various sources affect the different dimensions of brand
personality separately, thereby reiterating Aaker’s conclusion that brand managers should

Page 13 of 137
focus on specific dimensions of brand personality, rather than the aggregate construct (J. L.
Aaker, 1997; Maehle & Supphellen, 2011).
2.8 Consequences and impact of brand personality
This sub-stream of research in brand personality literature, which deals with studying the
importance of brand personality, has received significant attention in the brand personality
literature. In fact, it has existed since even before Aaker’s seminal work in the field. The
early contribution in this field came from Belk, who underscored the self-expressive benefit
of the personality or image of a brand for consumers (Belk, 1988). Moreover, D. A. Aaker
(1996) brought to attention the role of brand personality in evaluating brand equity over
products and markets, and in serving as a basis for customer/brand relationships and
differentiation (D. A. Aaker, 1996).
However, more concrete research on studying the consequences of brand personality on
consumers’ behavior towards the brand was carried out after the work of J. L. Aaker (1997).
The first of such studies was the one by Kim, Han, and Park (2001), in which they concluded
that attractiveness of the brand personality directly affects positive word-of-mouth reports
and indirectly affects loyalty towards the brand (Kim et al., 2001).
More recently, there have been several other studies which have shown both direct and
indirect consequences of brand personality on various dimensions. For example, brand
personality has been concluded to have an impact on attitude towards the brand, enhancing
commitment to the brand, stimulating positive brand image, and facilitating purchase
intentions (Eisend & Stokburger-Sauer, 2013). Similarly, brand personality has also been
found to have an impact on facilitating trust, attachment, and commitment towards the brand
(Louis & Lombart, 2010). Moreover, brand personality can also increase trust in the brand,
evoke brand affect, thereby stimulating loyalty for the brand (Sung & Kim, 2010).
2.9 Congruence of consumer and brand personality
This sub-stream of research in brand personality literature deals with exploring the effects of
congruence between a brand’s and consumers’ personality on consumers’ brand choice
(Azoulay, 2005). The early research in this field came from Jennifer Aaker (1999), who
concluded that congruence between consumers’ and brands’ personality can have an impact
on consumers’ brand preferences, however, such an impact is situation-specific. In situations
where consumers are able to express themselves and their self-concept through the use of
brands better, brand personality can positively influence consumers’ attitude towards the

Page 14 of 137
brand (Jennifer Aaker, 1999). The research by Phau and Lau (2001), although having a
slightly different line of reasoning to Aaker’s research, drew very similar conclusions. They
concluded that consumers’ preference levels for a given brand actually play a significant role
in determining how they perceive the brand’s personality. If consumers strongly prefer a
particular brand, then their actual, ideal, or desired personality traits influence the perception
of the brand’s personality, again bringing to attention how brand personality is often used as a
means by consumers to express their own individual personality, either actual, or desire
(Phau & Lau, 2001).
Moreover, Mulyanegara, Tsarenko, and Anderson (2009) found that consumers with
specific personality traits prefer brands with certain brand personality dimensions. For
instance, consumers with Conscientious personality trait prefer brands with personality traits
associated with trust to reflect their reliable personality traits; similarly, Extroverts prefer
sociable brands to reflect their outgoing nature (Mulyanegara et al., 2009). Furthermore, they
concluded that preference of brands to reflect self-expressive personality traits is stronger for
male consumers than female consumers (Mulyanegara et al., 2009).
2.10 Gap in brand personality literature
Existing literature has paid significant attention to how consumers perceive a firm’s brand
personality; however, how a firm actually intends its brand personality to be perceived by the
consumers (i.e. a strategic perspective) has largely been neglected (Malär et al., 2012). In
their research, Malär et al. (2012) have underscored the relevance of a strategic perspective
on brand personality research by pointing out that a successfully implemented brand
personality can positively affect consumers’ loyalty towards the brand, and hence the firm’s
market share. They conclude that a brand personality is successfully implemented if the
firm’s consumers perceive the brand personality similar to what is intended by the firm - i.e. a
strong fit exists between a firm’s intended and realized brand personality. To this end, they
highlight five antecedents that can create such a fit - singularity of the brand’s personality
profile, competitive differentiation of the brand, credibility of brand-related communication
activities, product involvement, and prior brand attitude (Malär et al., 2012).
However, one of the limitations of Malär et al’s research is that it does not point out
how consumers process, and react to the different ways in which a firm communicates its
brand and intended personality (Malär et al., 2012). Moreover, no clear principles exist yet in
brand personality research for strategically positioning a firm’s intended brand personality

Page 15 of 137
such that it occupies a desired or favorable position in consumers’ minds. While several ideas
and principles exist for positioning an organization’s brands in general (Keller, 2013; Keller
et al., 2002), such ideas have not been carried over to brand personality research to explore
whether a firm can position its brand personality similar to how it can position its brand.
2.11 Place of this research in brand personality literature
Since the development of Aaker’s brand personality scale, most follow-up research on the
construct of brand personality in its various sub-streams has tried to fill existing gaps in the
literature. There is no doubt about the fact that the contributions of all these studies have been
extremely valuable to brand personality literature, and have advanced the construct to a great
degree until now. However, most of these studies can be considered as incremental
improvements in the existing body of research, that have been unable to venture outside the
boundaries created by the existing sub-streams of research. This has inevitably made brand
personality research repetitive and ever so slightly monotonous. Somewhere along the line
since Aaker’s research, the construct of brand personality seems to have lost its core idea -
i.e. the parallel drawn between brands and humans. Too often, studies have analyzed the
construct and its definition with strict, skeptical eyes. Borrowing insights from the domain of
(human) personality psychology research, a major contribution of Aaker’s research in
developing the brand personality scale was to establish a parallel between brands and humans
(J. L. Aaker, 1997). It is hence quite surprising that most follow-up studies have not made
efforts to take this parallel a step further, or to solidify this parallel.
If brands have been widely acknowledged as being anthropomorphized and
possessing human-like characteristics, then a wide body of literature existing in the field of
personal and organizational development might possibly endow brand personality research
with fresh and relevant insights. This might enable brand personality researchers to venture
outside the restrictive boundaries in the current literature. Therefore, besides the intention of
filling the existing two gaps in brand personality literature - firstly regarding the lack of
knowledge on how consumers process, and react to the different ways in which a firm
communicates its brand and intended personality, and secondly regarding the absence of
ideas and principles for strategically positioning an intended brand personality, this research
seeks to advance, and broaden the scope of the existing brand personality research by
interweaving and applying principles from domains that have not been incorporated so far in
brand personality literature, namely - personal & organizational development, and strategic

Page 16 of 137
brand positioning. Subsequent chapters will provide a detailed literature review on these two
domains.
3 Brand positioning
3.1 What is ‘positioning’?
In the context of branding, the term ‘positioning’ has had slightly different connotations in
different streams of literature. D. A. Aaker and Shansby (1982) consider positioning as an
‘impression’ which results from the combination of many different associations that the firm
brings together, and argue that positioning very often requires the use of competitors as a
‘frame of reference’. Keller describes positioning as a brand’s unique selling proposition that
gives the customers a compelling reason to choose a particular brand, thereby providing the
brand with a sustainable competitive advantage (Keller, 1993). Keller and Lehman describe
brand positioning as a means to establish key brand associations in the consumers’ minds in
order to differentiate the brand from competitors and attain competitive superiority or
advantage (Keller & Lehmann, 2006). A more recent and perhaps more complete definition
of positioning has been given by Kotler, Keller, Ancarani, and Costabile (2014), who define
‘Positioning’ as “the act of designing a company’s offering and image to occupy a distinctive
place in the minds of the target market, with the goal of locating the brand in the minds of
consumers to maximize the potential benefit to the firm” (Kotler et al., 2014, p. 276).
With all these different connotations of brand positioning, it becomes quite apparent
that there is no single universal definition available for the construct of brand positioning.
However, from all the above mentioned connotations, positioning can be considered as a
strategic move for a brand in order to achieve a unique and intended place in its consumers’
minds so as to be able to differentiate itself from its competitors. The brand positioning
strategy can be considered effective if consumers hold strong, favorable, and unique
associations about the brand in their minds after the positioning strategy has been deployed
by the brand (Keller, 1993, 1999). Subsequent sections will explain such associations and
their role in brand positioning in detail.
3.2 Importance and consequences of brand positioning
Aaker and Shansby underscore the positioning decision as a crucial strategic decision for a
company or brand since the position can be central to customers' perception and choice about
the brand and the firm (D. A. Aaker & Shansby, 1982). Positioning is also considered quite
Page 17 of 137
important for a firm, as it sets the tone for what the firm or the brand should and should not
do with its marketing activities (Keller & Lehmann, 2006). Moreover, an effective
positioning of a brand is considered a part of the firm’s overall marketing strategy, and helps
communicate the brand’s essence to the consumers, enabling them to achieve their goals in a
unique way (Kotler et al., 2014).
Various studies have pointed out important consequences (both direct and indirect) of
brand positioning on several important variables. A firm’s brand positioning indirectly (via
advertising and communication activities) affects the brand’s desirability and price sensitivity
among consumers (Boulding, Lee, & Staelin, 1994). Moreover, the study by Jewell and
Barone (2007) demonstrated that competitive differentiation achieved by a brand through
within-category or out-of-category comparisons with its competitors as part of a brand
positioning strategy can impact consumers’ attitudes towards the brand. Kalra and Goodstein
(1998) concluded that a positioning strategy can impact the relationship between a firm’s
advertising communications and consumers’ price sensitivity. It can also be noted that a
brand’s positioning strategy affects the favorability, strength, and uniqueness of associations
that customers hold in their minds about the brands, which can impact the brand’s image, and
ultimately the customer-based brand equity of the firm (Keller, 1993). Moreover, Keller
(2000) includes a properly positioned brand as one of the “top ten traits” of the world’s
strongest brands.
3.3 The role of associations in Brand Positioning
Keller defines Brand positioning as being about “creating the optimal location in the minds of
existing and potential customers so that they think of the brand in the right way” (Keller,
1999, p. 44). Such a position can be created in consumers’ minds by establishing certain
associations about the brand.
Brand associations are described by Keller as the associations that are either created
or reinforced in consumers’ minds by the firms' brand positioning activities (Keller, 1999). A
firm’s marketing or positioning strategy can be translated externally (in the form of brand
associations) for its consumers to convey what the brand stands for, and represents (Keller,
1999). Moreover, a firm can achieve customer-based brand equity when the consumers are
familiar with the brand and hold favorable, strong, and unique associations about it in their
memory; the role of such associations is explained in the following paragraph.

Page 18 of 137
3.4 The importance of differentiation in brand positioning
While in theory it can all sound quite simple for a firm to achieve a unique and intended place
in its consumers’ minds by communicating its brand’s unique points, it is often quite hard to
do so in practice, especially since a firm can (and will) encounter numerous competitors who
are also trying to do so. Therefore, the need to differentiate from competitors plays an
important role in a firm’s ability to position its brand as it intends.
D. A. Aaker and Shansby (1982) highlight that comparison with competitors can
prove to be a good positioning strategy for a firm, since not only can the image of a well-
established competitor provide the firm with a frame of reference, but it can also make the
firm’s customers believe that the firm is better than (or at least as good as) its competitor(s).
Therefore, competitors play a major role in the development of a positioning strategy, which
consists of six steps, namely: identifying both direct and indirect competitors, determining
how the competitors are perceived and evaluated, determining the competitors' positions,
analyzing the customers, selecting the position, and monitor the position (D. A. Aaker &
Shansby, 1982).
However, a firm does not always need to make direct comparisons with competitors
in order to differentiate its brand. It can also communicate its unique points or differences
implicitly without a competitive point of reference (Keller, 1993). Points of Difference (PoD)
are associations that are unique to a brand; these associations are therefore quite important
and should not be ignored by a firm while positioning its brand (Keller, 2013).
As previously highlighted by (Keller, 1993, 1999) , a brand positioning strategy can
be considered effective if consumers hold strong, favorable, and unique associations about
the brand in their minds after the positioning strategy has been deployed by the brand.
Establishing distinguishable points of difference from competitors can enable a brand to
create such associations (Keller et al., 2002).
Strong brand associations are those associations which are triggered easily in
consumers’ minds and come up relatively quickly when compared to other associations in
their associative networks about the brands (Keller, 2013). Of course, not all strong brand
associations are bound to be favorable. There can be several instances where people may
immediately associate a brand with something unfavorable or negative at its very mention.
For instance, even several years after the mishap, many consumers still strongly, yet
unfavorably associate BP with the oil spill disaster. Favorable associations are associations
Page 19 of 137
that consumers evaluate positively about the brand, and can be established by convincing
customers that the brand is personally relevant to them, able to solve their needs (Keller,
2013). Lastly, unique associations are associations that, as the name suggests, are uniquely
attributable to a brand and not with any other competing brands (Keller, 2013). They are a
brand’s unique points which the brand’s competitors do not, or cannot possess - what Porter
would describe as a brand’s “competitive advantage” (Porter, 1991, p. 101).
Therefore, a brand can successfully be able to differentiate itself from other
competing brands if it is able to achieve strength, favorability, and uniqueness of the
associations that consumers hold regarding the brand in their minds. However, the question
that then arises is how a brand can manage to achieve such favorable, strong, and unique
associations. There are two important criteria in order to ensure that a brand’s point of
difference can result in unique, favorable, and strong associations - “Desirability”, and
“Deliverability” (Keller et al., 2002, pp. 84, 85).
Desirability criteria is met when a firm can ensure that the associations which it wants
its consumers to perceive as PoDs are considered “personally relevant” and “believable” by
consumers - meaning that these PoDs are fundamental in satisfying consumers’ needs, and
consumers can accept that the firm would actually be able to deliver on its claimed benefits
(Keller et al., 2002, p. 84). On the other hand, Deliverability criteria is met when a firm can
ensure that the associations which it wants its consumers to perceive as PoDs are “feasible”,
“profitable”, and “preemptive/defensible” for the firm - meaning that the firm actually
possesses resources to be able to deliver on its promised claims, and that too in a manner
which can generate sufficient profits for the firm, while ensuring that competitors are unable
to imitate such claims (Keller et al., 2002, p. 85).
When a firm is able to ensure that the associations which it wants its consumers to
perceive as PoDs are desirable and deliverable, these associations can become strong,
relevant, and unique to a firm, resulting in a unique and differentiated position for the firm’s
brand (Keller, 2013; Keller et al., 2002). Ultimately, associations that are strong, favorable,
and unique can enable a brand to achieve favorable customer attitudes, thereby establishing
strong relationships with its customers, ultimately leading to the creation of brand resonance
between the brand and customers (Keller, 2001).

Page 20 of 137
3.5 Is differentiation enough?
While brand positioning has traditionally been concerned with being unique and
differentiating in order to set brands apart from competitors, such PoDs alone are not
sufficient to establish a strong brand position (Keller et al., 2002). Contrary to conventional
approach to brand positioning, it has been argued that there exist two other aspects of
competitive positioning which a firm must consider, namely: Frame of reference - identifying
the target consumers and existing competitors, and Points of Parity (PoP) - The attributes on
which the brand is similar to competitors (Keller, 2013; Keller et al., 2002). These three
elements - PoP, PoD, and frame of reference, are therefore considered as essential tools to
effectively position a brand in consumers’ minds (Keller, 2013). While PoDs have been
described in detail in the previous section, subsequent paragraphs elaborate each of the other
two elements.
A frame of reference is one of the brand positioning tools which when communicated
to the consumers helps create associations in their minds regarding the benefits they can
expect by using the brand, and establish the competitors against which the firm competes to
offer them the products associated with the firm’s brand (Keller, 2013; Keller et al., 2002).
However, before a firm can communicate the frame of reference to the consumers, it must
first be clearly defined. Establishing a frame of reference can be accomplished in two steps:
by identifying and defining the target market (classic segmentation and targeting processes),
and by identifying the competitors which the firm will compete with for its defined target
market (Keller, 2013).
A frame of reference essentially defines the brand’s boundaries of operation (by
defining the relevant customers and competitors), and hence enables the firm to establish the
types of associations which can be considered as its points of parities and points of
differences relative to other brands (Keller, 2013). Moreover, since in many cases, a frame
can be defined by the category of product which the brand offers, establishing a frame of
reference allows a firm to broadly consider its scope of operation and hence consider both
direct as well as indirect competitors as ‘competition’ (Keller, 2013; Keller et al., 2002).
Points of Parity (PoP) are associations that are not necessarily unique to a brand and
might in fact be shared with other brands (Keller, 2013). One of the main purposes of
establishing PoP with other brands is to enable the brand’s target customers to consider the
brand a “legitimate and credible player” within the established frame of reference (Keller et

Page 21 of 137
al., 2002, p. 82). Such PoP are called “Category points of parity” (Keller, 2013, p. 84). They
can simply be considered as the minimum set of requirements a brand must fulfil to pass
consumers’ test of a brand’s belongingness to a certain product category.
Besides the category PoP, there are two other types of PoP that can be established by
a brand. The first of this type are the “Competitive” PoP, which are designed to negate
competitors PoD (Keller, 2013, p. 84). These can essentially be used by a brand to achieve
parity with competing brands where they are trying to achieve an advantage over it, in order
to stay relevant within the consumers’ frame of reference. The second type of PoP are called
“Correlational” PoP, which are the potentially negative associations about the brand that may
originate as a result of the presence of other more positive PoD associations (Keller, 2013, p.
84). For instance, consumers might easily be convinced that a car brand that is strongly
positioned on “safety” PoD association will probably be “less powerful”, or meals that a
brand offers which are “healthy” will probably be “less tasty” (Keller, 2013, p. 84).
In order to overcome this problem or conflict between the perception of points of
parity and points of difference to the consumers, Keller (2013) suggests that a brand might
not necessarily need to convey points of parity which are exactly the same as competitors,
there is however a “range of tolerance or acceptance” within which the firm’s demonstration
of points of parity are considered acceptable by the consumers (Keller, 2013, p. 84).
Therefore, in order to effectively position a brand in consumers’ minds, a strike of right
balance is required among all three elements (frame of reference, PoP, and PoD) of the brand,
along with a sound consideration of when and what attributes of the brands consumers might
perceive as mutually exclusive (Keller et al., 2002).
Furthermore, Keller et al. (2002) suggest three ways in order for brands to ensure that
the associations that want consumers to have in their minds do not contradict each other - or
become Correlational PoP. The first way they suggest this problem can be rectified is by
“Sequencing” the two seemingly contradictory associations separately in all of the firm’s
communication activities, as consumers are much less likely in this situation to devote time
and psychological resources to connect multiple brand associations (Keller et al., 2002). The
second way to rectify this problem is by providing credibility to the claims from external
sources such as celebrity brand endorsers (Keller et al., 2002). Finally, if possible, Keller et
al. (2002) suggest brands to be able to stand their ground by claiming that the contradictions
are actually complements.
Page 22 of 137
In today’s world, where each and every brand is seemingly trying hard to
communicate to its consumers how it is different from its competitors, giving considerable
attention to a brand’s frame of reference and points of parity, as suggested by Keller et al.
(2002) might sound counter-intuitive in a firm’s efforts to position its brand effectively
among consumers’ minds. However, the experimental study conducted by Romaniuk and
Gaillard (2007) across 94 brands in eight markets confirms that the presence of unique
associations about a brand is not positively related to stronger brand preference by
consumers. The main implication that emerged from this study was that brands need not
entirely focus on having unique associations, but rather also on satisfying the criteria of
performing well on the general category needs which are deemed as necessary by the
consumers; this builds up a favorable network of associations in consumers’ memory
regarding the brand, and in turn creates unique associations about the brand in consumers’
memory (Romaniuk & Gaillard, 2007). This implication supports the view of Keller et al.
(2002), and Keller (2013) regarding the effective positioning of brands.
Similar conclusions were also made by Romaniuk, Sharp, and Ehrenberg
(2007),whose studies across seventeen markets concluded that consumers do not perceive a
specific brand as being ‘differentiated’ from other brands that they buy unless there is a great
deal of functional difference in the benefits that the brand offers, especially on price and/or
location characteristics. Moreover, despite this lack of perceived consumer ‘differentiation’,
these brands continue to be bought, with many being successful and profitable (Romaniuk et
al., 2007).
Therefore, from Keller’s work on brand positioning and experimental studies
demonstrating the ineffectiveness of differentiation by itself, it can be concluded that besides
the well-known points of difference (PoD), an effective brand positioning requires careful
consideration of a brand’s frame of reference and competitive Points of Parity (PoP)
associations; the need for a brand to be able to generate certain PoP associations in its
consumers’ minds is so compelling that a brand’s PoD may even be rendered irrelevant by
consumers if it has not demonstrated a certain level of PoP to its consumers (Keller, 2013;
Keller et al., 2002; Romaniuk & Gaillard, 2007; Romaniuk et al., 2007).

Page 23 of 137
4 Personal and organizational development
4.1 Personal development
In its broadest sense, Personal development can be seen as a tool that enables human beings
to develop themselves and improve their personalities so that they can realize their true
potential in life (Rich, 2010). Personal development can therefore simply be described as the
act of learning about self, usually through the process of self-reflection which usually leads to
self-improvement and self-development.
This process of self-improvement usually begins with the identification of one’s
personality and its various dominant traits, usually leading to the identification of one’s
unique strengths and weaknesses. Once identified, the person’s ultimate goal should be to
improve their strengths and minimize their weaknesses, thereby enabling them to lead a
happy and fulfilling life (Rich, 2010).
4.2 Organizational development
The principle of organizational development involves a set of theories, strategies, and
techniques targeted at bringing organizational change through change in the behavior and
practices of individual members of the organization (Porras & Silvers, 1991).
Ultimately, organizational development aims to bring about a better fit between the
organization's capabilities and its environmental demands by creating organizational change
(Porras & Silvers, 1991).
In this aspect, Organizational development can be considered as a similar tool to
personal development, the difference being that the former is applied to benefit the
organization as a whole rather than an individual. Furthermore, both organizational and
personal development involve the process of learning that is undertaken by humans - on a
collective level in case of the former while on a personal level in case of the latter.
While the ultimate aim of Organizational development is to bring about change, it is
worth pointing out, however, that the principle is not the same as ‘Change Management’.
Woren, Ruddle, and Moore (1999) make a clear distinction between Organizational
development and change management in that while the former focuses primarily on changing
human processes in order to bring about organizational change, the latter focuses on both
human processes as well as structure and systems of the organization. Change management is
therefore driven by, and linked to strategy of the organization, while organizational

Page 24 of 137
development not directly so (Woren et al., 1999). Subsequent paragraphs will discuss some
models of personal and organizational development in detail.
4.3 Models of personal and organizational development
4.3.1 Trait-based approach to human personality
It has been long argued by various personality theorists that there exists a multi-level,
hierarchical structure of human personality (Cattell & Mead, 2008) . This idea led to the
observation and grouping of several thousands of human personality traits in the early years
of human personality research (Goldberg, 1990). Later, these personality traits were narrowed
down by Raymond Cattell into sixteen major personality traits by a factor analysis (Cattell &
Mead, 2008), and ultimately as they are widely accepted today, into the 5 major “big five”
human personality traits (Neuroticism, Extraversion, Openness to experience, Agreeableness,
and Conscientiousness), each with their individual sub-traits (Costa & McCrae, 1992;
Goldberg, 1990).
The core essence of these trait theories of human personality is that the human
personality can simply not be considered as a one-dimensional construct. It is in fact
comprised of a combination of several traits and sub-traits, where some are more dominant
than others. This is also highlighted by another trait-based approach theory - the Myers-
Briggs personality type approach. The Myers-Briggs type indicators consist of sixteen major
personality types that are formed by the interaction of four dichotomies (Extraversion-
Introversion, Sensation-Intuition, Thinking-Feeling, and Judgment-Perception) (Murray,
1990).
The trait based theories such as Myers-Briggs type indicator find their application in
several areas such as business organizations as well as in schools and other communities
(Murray, 1990). Moreover, since different individuals possess a slightly different
combination of personality traits and sub-traits, it could possibly result in the formation of the
individual’s unique personal strengths and weaknesses. In such cases, these trait theories
might also be applied by the individuals themselves for their own personal growth and
development.
4.3.2 Maslow’s theory of human motivation
Maslow’s theory of human motivation is one of the earliest theories of personal development.
It describes the hierarchical nature of human needs, and the resulting intrinsic motivation of

Page 25 of 137
human beings for achieving those needs in order to achieve ultimate satisfaction and self-
growth.
According to this theory, human beings have 5 sets of goals (needs) in life -
Physiological, safety, love, esteem, and self-actualization (Maslow, 1943). This theory
highlights that the ultimate goal of a human being in life is to achieve self-actualization
(represented by the top level of the pyramid), i.e. to achieve his/her true potential in life and
become what he/she is intended to, and capable of becoming through his/her inherent
personality traits (Maslow, 1943). This ultimately leads to happiness, satisfaction, and self-
fulfillment in life.
The need or intrinsic motivation of an individual for this self-actualization depends upon
whether he/she has achieved the previous lower levels of the pyramid
Figure 3: Maslow's hierarchy of needs model; Source: (Maslow, 1943)
Self-actualization
Esteem
Love
Safety
Physiological
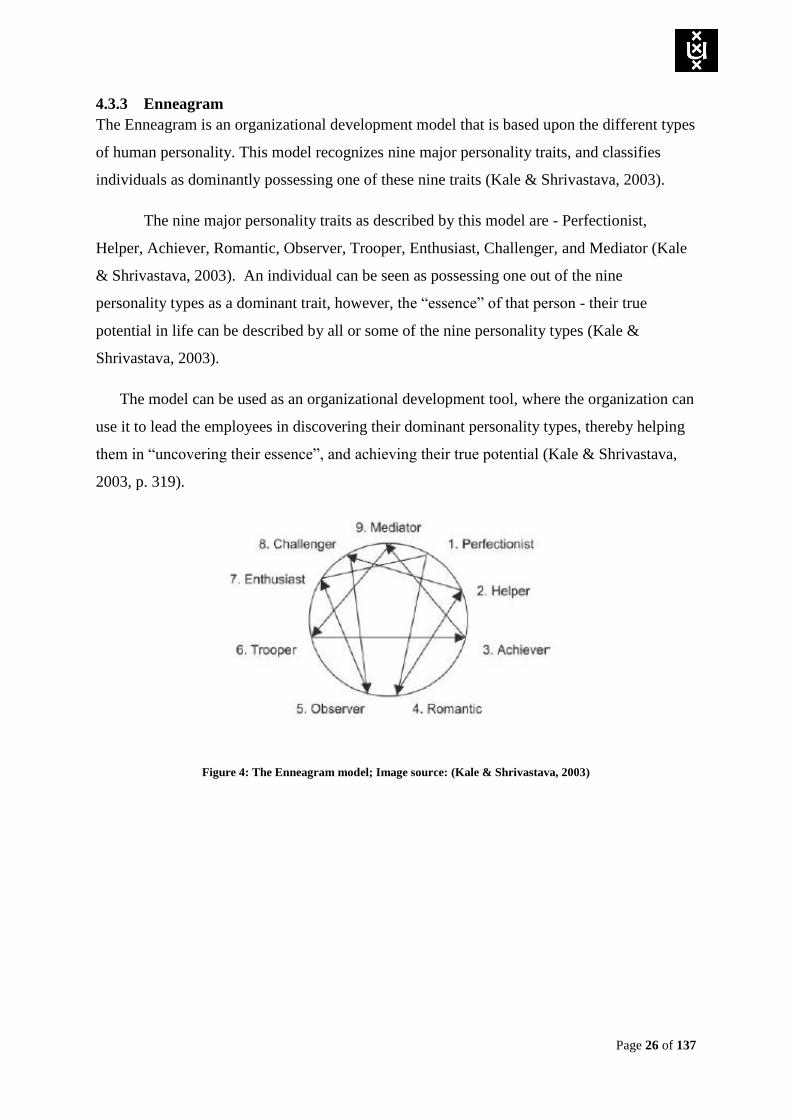
Page 26 of 137
4.3.3 Enneagram
The Enneagram is an organizational development model that is based upon the different types
of human personality. This model recognizes nine major personality traits, and classifies
individuals as dominantly possessing one of these nine traits (Kale & Shrivastava, 2003).
The nine major personality traits as described by this model are - Perfectionist,
Helper, Achiever, Romantic, Observer, Trooper, Enthusiast, Challenger, and Mediator (Kale
& Shrivastava, 2003). An individual can be seen as possessing one out of the nine
personality types as a dominant trait, however, the “essence” of that person - their true
potential in life can be described by all or some of the nine personality types (Kale &
Shrivastava, 2003).
The model can be used as an organizational development tool, where the organization can
use it to lead the employees in discovering their dominant personality types, thereby helping
them in “uncovering their essence”, and achieving their true potential (Kale & Shrivastava,
2003, p. 319).
Figure 4: The Enneagram model; Image source: (Kale & Shrivastava, 2003)

Page 27 of 137
4.3.4 Core qualities
Like the Enneagram theory discussed above, another theory that emphasizes recognizing the
essence of one’s own personality is Daniel Ofman’s “Core qualities”. The Core Qualities
theory is primarily a managerial tool from the Human Resource Management (HRM) domain
that is intended to demonstrate managers how they can discover their own, as well as others’
strengths and challenges, and learn from the people they dislike the most (Ofman, 2001).
The essence of this theory lies in a simple quadrant shown below. This quadrant
highlights four elements - Core quality, pitfall, challenge, and allergy. Each of these
elements is discussed briefly in the following paragraphs.
Figure 5: Ofman's Core Quadrant; Source: (Ofman, 2001)
Core Quality
The first element of the quadrant - called the “Core Quality” discusses the idea that every
person possesses some unique qualities that form a part of that person’s essence or core; such
qualities are called “Core qualities” (Ofman, 2001). According to Ofman (2001), core
qualities are those positive qualities or personality traits that being unique to every person
immediately characterize and differentiate them from others. An example of a Core quality
could be the positive trait of “Confidence”.
Ofman’s model therefore calls for managers to recognize their own, as well as others’
core qualities in order to practice effective leadership and management.

Page 28 of 137
Pitfall
“Pitfall” is defined as “the dark side of the core quality” or “an overly-developed core
quality” (Ofman, 2001, p.30). It is described as the negative opposite of a person’s positive
core quality, and usually the “label” that is given to the person by others because they are
often unable to see the underlying core quality in the person’s personality (Ofman, 2001). An
example of Pitfall of the positive quality of “Confidence” could therefore be the negative too
much of confidence - “Arrogance”.
Ofman therefore encourages managers to recognize other people’s core qualities that
often lie hidden underneath their “Pitfalls”, and to begin seeing the positive traits in others’
seemingly negative traits.
Challenge
“Challenge” is defined as “the positive quality diametrically opposite to the pitfall” (Ofman,
2001, p.32). It is therefore a quality which a person must master in order to prevent his/her
core quality from overly developing and becoming a pitfall. Mastering this quality might
especially be difficult, since it does not come naturally to a person and often conflicts with
their Core Quality - hence the name “Challenge”. An example of the “Challenge” for a
person with the Core Quality of “Confident” can be “Modesty”.
While mastering the Challenge might appear difficult in the first glance, according to
Ofman, it is necessary for a person to strike the right balance between their Core quality and
Challenge, and strive towards possessing at least a certain degree of Challenge along with the
Core Quality in order to prevent the Pitfall (Ofman, 2001).
Allergy
Just like overly-developed Core Quality can turn into one’s Pitfall, in the same way
“Challenge” can result in an overly developed Quality called “Allergy”. “Allergy” is defined
as “an excess of one’s Challenge personified in someone else” (Ofman, 2001, p.33), resulting
in the person disliking the other in which one sees their overly-developed challenge. It is
therefore the negative opposite of one’s Core Quality. For instance, “Timidity” could be an
Allergy for a confident person.
The “Allergy”, being the opposite of one’s Core Quality might force the person to
want to distance themselves from the person in whom they spot their “Allergy”; hence, they

Page 29 of 137
might overemphasize their “Core Quality”, ultimately resulting in their “Pitfall” (Ofman,
2001). Spotting one’s “Allergy” in another person should therefore be considered as a
reminder for one to adorn their “Challenge” even more in order to avoid their “Pitfall”
(Ofman, 2001).
The following is an example of a completed Core Quadrant for the “Core Quality” of
“Confidence”. Ideally, one should strive to have a balance of “Confidence” and “Modesty” in
order to truly be perceived as “Confident”.
Figure 6: Core Quadrant of the personality "Confidence"; Source: (Ofman, 2001)
From all the various models of personal and organizational development that are highlighted
in the previous section, two key takeaways emerge.
The first key takeaway is the necessity for self-awareness. From a personal development
standpoint, in order to truly develop oneself, one must be aware of their personality traits -
both strengths and weaknesses, and try to minimize the weaknesses while capitalizing on the
strengths as much as possible. From an organizational development standpoint, one must start
to uncover the positive traits that underlie the often negative-seeming traits of others.
The second key takeaway is the need to balance certain qualities. Particularly from
Ofman’s model, it becomes apparent that a person’s true Core Quality will only become
visible to others if this person also possess a certain element of his/her Challenge - or in other
Confidence
+
Arrogance
-
Timidity
-
Modesty
+
Too much of a good thing
Too much of a good thing
Positive Opposite
Positive Opposite

Page 30 of 137
words when the person manages to balance the Core Quality with the Challenge. Without the
Challenge, there is no Core Quality, since it merely appears as a Pitfall.
Another theory in organizational development literature that highlights the importance of
having a right balance, just as balancing the core qualities and challenge is Herzberg’s
Motivation-Hygiene theory, which explains that employees’ job satisfaction and job
dissatisfaction in a company are produced by different factors, are hence not dependent on
each other (Herzberg, 1974). According to this theory, Motivators are factors whose presence
ensures that employees are satisfied with their jobs (such as achievement, or recognition of
achievement at work), whereas Hygiene factors are those critical factors which, when absent,
almost always guarantee job dissatisfaction, but when present do not necessarily guarantee
job satisfaction; these factors merely guarantee no more job dissatisfaction (such as good
working conditions, salary, security, etc.) (Herzberg, 1974; Sachau, 2007).
Therefore, hygiene factors (analogous to Challenge) can be understood as those
critical and basic factors, whose presence is absolutely essential for even considering an
employee’s satisfaction (analogous to Core Quality) at work, and when absent, deem job
satisfaction irrelevant. The implication for firms of this theory is that employers must first
ensure that employees are not dissatisfied at work by ensuring the presence of basic
conditions (hygiene factors), and then ensure that employees are satisfied by ensuring the
presence of motivation factors. Otherwise, satisfaction would even be out of question.
4.4 Personal development may also imply self-presentation
In addition to being a personal and organizational development tool, a personal development
model such as Ofman’s Core Qualities can also be seen as a self-presentation tool, which can
be deployed by a person to highlight his/her positive qualities in a desired manner to others.
For instance, without being “humble” (Challenge), one will merely be perceived as
“arrogant” (Pitfall), no matter how “confident” (Core Quality) that person is; or without
being “organized” (Challenge), one will merely be perceived as “chaotic” (Pitfall), no matter
how “creative” (Core Quality) that person is. The crucial message here is that in order to
present oneself in a positive light to others, in addition to possessing and demonstrating the
actual positive or the Core Quality, mastering one’s Challenge is the key - or in Daniel
Ofman’s words “striking the right balance” between core quality and challenge (Ofman,
2001, p. 32). The absence of challenge when projecting one’s positive personality traits to
Page 31 of 137
others will almost always guarantee the core quality to not only not be considered, but in fact
be deemed irrelevant by other people.
5 Study 1
The purpose of this study is to establish the links between the three broad streams of literature
that have been previously discussed, namely - brand personality, brand positioning, and
personal and organizational development. Subsequent paragraphs aim to establish these links,
and will be followed by hypotheses and conceptual model.
5.1 Self-presentation vs. brand positioning
The review of the literature on brand positioning (section 3.5) highlighted two important
aspects of effective positioning of brands, namely - Points of Parity (PoP) and Points of
Difference (PoD) associations. Points of Difference (PoD) were described as those
associations that are uniquely attributable to a brand, and help the brand in differentiating
itself from its competitors in consumers’ minds (Keller et al., 2002). However, as suggested
previously, PoDs by themselves are not sufficient to establish an effective brand positioning
strategy, since a firm must also consider its Points of Parity (PoP) associations - the attributes
on which the brand is not different from its competitors, but is in fact similar to them (Keller
et al., 2002). One of the main purposes of establishing these PoP associations is to avoid the
origination of potentially negative associations about the brand - called “Correlational” PoP
associations, as a result of the lone presence a brand’s PoD associations; for instance,
consumers might be convinced that a car brand that is strongly positioned on “safety” PoD
association will probably be “less powerful”, or meals that a restaurant offers which are
“healthy” will probably be “less tasty” (Keller, 2013).
Therefore, demonstrating at least a par level of such PoP associations, in fact doing so even
before demonstrating the brand’s actual PoD associations can help the brand in avoiding
potentially negative correlational PoP associations (Keller et al., 2002) . This can enable the
brand’s target customers to consider the brand capable of performing on a par level with its
competitors, in addition to it being different and unique from them on the basis of its PoDs.
This not only gives the brand an advantage by providing it with favorable associations, but
avoids the potential disadvantage of unfavorable associations, thereby establishing a strong,
favorable, and unique position in consumers’ minds (Keller, 2013).

Page 32 of 137
Having discussed Ofman’s theory from a self-presentation perspective, it can be observed
that this model is strikingly similar to the aforementioned ideas about brand positioning. In
terms of Ofman’s Core Qualities model, a person who is strongly focused on demonstrating
only their Core Quality to others will end up being labelled by others as their Pitfall, unless
they can demonstrate a certain element of their Challenge (Ofman, 2001).
Core Qualities, in brand positioning terms can therefore be regarded as a person’s PoD. They
are a person’s uniquely attributable positive personality traits. However, only demonstrating
Core Qualities may lead people to label the person as the negative too much of their Core
Quality - Pitfall, which can be regarded as the potentially “unfavorable” associations - just
like the Correlational PoPs in brand positioning terms. Therefore, in order to avoid such
unfavorable associations, a person must demonstrate a certain element of their Challenge -
which can be regarded as the PoP in brand positioning terms (Keller et al., 2002; Ofman,
2001).
It is therefore important to understand that both Ofman (2001) and Keller et al. (2002) state
the importance of striking the right amount of balance between that key quality which is
unique (Core Quality and PoD respectively) and the quality that is not unique but is
extremely necessary in order for the key unique quality to even be considered relevant
(Challenge and PoP respectively). The negative consequences of not doing so, according to
both Ofman (2001) and Keller et al. (2002) is the origination of other negative associations
(Pitfall and Correlational PoP respectively) which are unfavorable.
5.2 From presenting human personality to presenting brand personality
The above analogy between personal development literature and brand positioning literature
only deepens the parallel drawn between brands and humans. The question that now arises is
whether these insights can be applied to brand personality literature. If a personal and
organizational development tool like Ofman’s model (that can guide human beings in
presenting their personality effectively to others) has similar underlying principles to a brand
positioning model such as Keller’s (that can guide firms in positioning their brands
effectively to consumers), can Ofman’s model be applied to brand personality literature in
order to guide effective presentation of brand personalities to a brand’s consumers?
This research will aim to answer the aforementioned question in two main steps: the first
study of this research will aim to determine whether Ofman’s model that is mainly applicable
for human personality presentation, but has similar underlying principles to brand positioning

Page 33 of 137
literature can in fact be applied to brand personality literature. The second study of this
research will then aim to explore whether and how these insights can guide brands to control
the attitudes of their consumers towards the brand’s personality, thereby allowing effective
positioning of the brand’s personality in consumers’ minds.
5.3 Testing Ofman’s model on brand personality
The first study of this research will aim to discover whether Ofman’s model of human
personality is also applicable to brand personality. In order to explore this, the following
assumptions have been made for this study with respect to application of Ofman’s Core
Quadrant model on brands and their personalities (Ofman, 2001):
Core Quality is assumed to be the personality trait of a brand that most strongly
differentiates its personality from other brands, and forms the essence of who the
brand is.
Pitfall is assumed to be the negative opposite of the brand’s positive Core quality. It
can be seen as an overly-developed Core Quality which is negatively perceived by
consumers.
Challenge is assumed to be the positive personality trait diametrically opposite to the
Pitfall. It is the personality trait of a brand that it not only finds the most difficult to
possess due to the nature of its Core Quality, but also that which consumers do not
easily imagine the brand as possessing.
Allergy is assumed to be the excess of a brand’s Challenge. It is therefore the negative
opposite trait of the brand’s Core Quality.
5.4 Conceptual framework and hypotheses
In impression management theory of human personality, the implied complementarity of one
personality trait from another has been a topic that has received widespread attention. It has
been widely claimed that people form impression of others on the basis of “expectancies of
certain traits going together” (Kaplan, 1971, p. 280). This phenomenon is known as the
“Halo effect”, and is explained as “the influence of a global evaluation on evaluations of
individual attributes of a person” (Nisbett & Wilson, 1977, p. 250). It has been claimed that
Halo effect often leads to judgmental bias (Wetzel, Wilson, & Kort, 1981). This is because
people are often observed as having a false psychological belief that "nice people tend to
have nice attributes and less nice people have less nice attributes" (Nisbett & Wilson, 1977,
p. 250). For instance, Halo effect might lead to the perception of a person who is physically
attractive as being more intelligent than someone who is less physically attractive.
At the same time, another effect seemingly contradictory to the “Halo effect” that has
received some attention is the “Innuendo effect”, which has been defined as “the tendency for

Page 34 of 137
individuals to draw negative inferences from positive descriptions” (Kervyn, Bergsieker, &
Fiske, 2012, p. 77). For instance, a person describing himself as fun-loving and adrenaline
junkie - a supposedly positive personality trait in one context might be easily perceived as a
negative trait in another context - such as when applying for a serious desk job (Kervyn et al.,
2012). The Halo effect and Innuendo effect demonstrate that certain human personality traits
can be implied from certain other personality traits, even without their explicit mention.
This implied perception of personality traits is also similar to what Ofman (2001)
describes as a person’s Pitfall originating from the person’s Core Quality. According to
Ofman, a person’s positive attribute - Core Quality will often be labelled by others as a
seemingly negative attribute - Pitfall. The Core Quality and Pitfall are described as being
“inextricably bound” and “going together like light and darkness” (Ofman, 2001, p. 31). For
instance, a “helpful” (Core Quality), might easily be labeled as “interfering” (Pitfall), or a
“decisive” (Core Quality) person, might easily be labeled as “pushy” (Pitfall) (Ofman, 2001).
It therefore becomes clear that in the context of human personality management, certain
positive attributes of human personality can easily be labelled, and perceived by others as
negative attributes. However, as described previously, not only does this effect take place for
people, but it also works for brands in a similar manner. It was discussed that the presence a
brand’s PoD associations (which are the brand’s uniquely positive attributes) lead to
origination of potentially negative associations about the brand - called “Correlational” PoP
associations; for instance, consumers might be convinced that a car that is “safe” (PoD) will
probably be “less powerful” (Correlational PoP), or healthy meals (PoD) offered by a
restaurant will probably be “less tasty” (Correlational PoP) (Keller, 2013).
After establishing that such negative perceptions originate from seemingly positive
perceptions of human personality and brand positioning, it is therefore interesting to know
whether the same happens for the personality of brands as well. Therefore, applying these
insights from human personality and brand positioning literature to brand personality
literature, it is hypothesized in Ofman’s terminology that if a brand is perceived as possessing
positive attributes - or Core Quality, it will invariably also be perceived as possessing some
element of negative attributes - or Pitfall that go along with those positive attributes.
H1 - There is a positive relationship between a brand’s perceived level of Core
Quality and Pitfall
Page 35 of 137
Furthermore, Ofman describes Challenge as “the positive quality diametrically opposed to
the Pitfall” (Ofman, 2001, p. 32). For instance, the positive opposite of an “interfering”
(Pitfall) person is a person who is “autonomous” (Challenge), or the positive opposite of a
“pushy” (Pitfall) person is a person who is “patient” (Challenge) (Ofman, 2001). Again,
drawing the parallel with brand positioning literature, a brand’s PoP associations which is
shares with other brands, can help the brand in avoiding potentially negative correlational
PoP associations. This can enable the brand’s target customers to consider the brand capable
of performing on a par level with its competitors. For instance, if a car brand can successfully
demonstrate to consumers that its car is powerful (PoP), it will avoid the possible perceptions
of the opposite attribute originations of the car not being safe enough (Correlational PoP).
Similarly, if a restaurant can successfully demonstrate to consumers that its meals are tasty
(PoP), it will avoid the perceptions of the opposite attribute origination of the food not being
tasty enough (Correlational PoP) (Keller, 2013).
The presence of such antagonistic traits in both human personality as well as brand
positioning literature again leads to the interesting question of whether the same happens for
the personality of brands as well. Therefore, applying these insights from human personality
and brand positioning literature to brand personality literature, it is hypothesized in Ofman’s
terminology that a brand that is perceived as possessing certain positive attributes - or
Challenge, cannot be simultaneously seen as possessing the negative opposite attributes - or
Pitfall.
H2 - There is a negative relationship between a brand’s perceived level of Challenge
and Pitfall
Ofman further explains the importance of having the right balance between the Challenge
and Core Quality to prevent the Pitfall; in order “to prevent the pitfall it is advisable to
develop the challenge” (Ofman, 2001, p. 33). For instance, a person who is “helpful” (Core
Quality) has to be able to demonstrate a certain element of “autonomy” (Challenge) in order
to avoid being labelled as “interfering” (Pitfall), or a person who is “decisive” (Core Quality)
has to be able to demonstrate a certain element of “patience” (Challenge) in order to avoid
being labelled as “pushy” (Pitfall) (Ofman, 2001).
This is similar to what human personality literature on “Innuendo effect” also suggests.
When listeners hear other people’s personality descriptions containing only positive traits,
with no mention of the contextually salient dimension, they will make negative inferences on

Page 36 of 137
the omitted dimension about the person described (Kervyn et al., 2012). For instance, a
person describing himself as fun-loving and adrenaline junkie - a supposedly positive
personality trait in one context might be easily perceived as a negative trait in another context
- such as when applying for a serious desk job, unless the person can also demonstrate the
important positive trait of being a serious and responsible person, which is necessary in the
context of the desk job. Therefore, being able to demonstrate at least a certain element of the
contextually relevant trait is necessary to avoid the “Innuendo effect” (Kervyn et al., 2012).
Amazingly, this is also what brand positioning literature would suggest. Demonstrating at
least a par level of PoP associations, in fact doing so even before demonstrating the brand’s
actual PoD associations can help a brand in avoiding the origination of potentially negative
correlational PoP associations. This can enable the brand’s target customers to consider the
brand capable of performing on a par level with its competitors, in addition to it being
different and unique from them on the basis of its PoDs. This avoids the potential
disadvantage of unfavorable associations, thereby establishing a strong, favorable, and unique
position in consumers’ minds (Keller, 2013). For instance, in order to avoid being perceived
as “less powerful” (Correlational PoP) by consumers, a car brand that is positioned on
“safety” (PoD) will need to demonstrate that it also “powerful” (PoP); or in order to avoid
being perceived as “less tasty” (Correlational PoP) by consumers, a restaurant chain that is
positioned on “healthiness” (PoD) will need to demonstrate that its meals are “delicious”
(PoP) (Keller, 2013).
The above insights highlight the importance of striking the right amount of balance between
that key quality which is unique and positive and the quality that is not unique but is
extremely necessary in order for the key unique quality to even be considered relevant. The
negative consequence of not being able to do so is the origination of another negative
association which are unfavorable. Applying these interesting insights from human
personality and brand positioning literature to brand personality literature, it is hypothesized
in Ofman’s terminology that perception of Challenge will weaken the relationship between
the Core Quality and Pitfall, such that when a brand is perceived as possessing sufficient
levels of Challenge, its Core Quality will no longer (or at least less likely to) be perceived as
Pitfall.
H3 - The relationship between a brand’s perceived level of Core Quality and Pitfall is
weakened by its perceived level of Challenge.

Page 37 of 137
In order to explain the above hypotheses, the following conceptual model has been
developed:
In this model, the Core Quality and Challenge are the two independent variables, while the
Pitfall is the main dependent variable.
5.5 Methodology
The first step to testing the conceptual model was finding human personality traits that can
best represent brands, and vice-versa. This was the main aim of the phase of Stimuli
generation. This phase proved to be especially important since it was decided that in order to
derive rigorous and conclusive results out of this study, not just one but three distinct human
personality traits will be employed and their applicability to brands will be tested.
However, the final choice of these personality traits as well as selection of brands took quite a
substantial amount of time. Subsequent paragraphs describe all the phases one by one - from
the initial stimuli generation phase up until the final experiment.
5.5.1 Stimuli generation – Qualitative pre-tests
Once it was decided that the study will be based upon testing the conceptual model on three
distinct human personality traits in order to provide more rigorous results, the first major
hurdle was selecting those three traits, along with finding the brands that would be the perfect
archetypes of being seen as possessing those specific personality traits as their primary
personality (Core Quality).
H1
H2
H3
Core Quality Pitfall
Challenge
Figure 7: Study 1: Conceptual framework
Page 38 of 137
In order to select the three human personality traits, the famous sixteen factor personality
scale was used, which has a description of the primary scales for sixteen major human
personality traits, as well as the personality descriptors of their low to high ranges (Cattell &
Mead, 2008). The choice of selection of three personality scales was based on the criterion
that their respective personality traits should be applicable enough to brands, since some
scales out of these sixteen would make it extremely hard to find suitable brands as archetype
stimuli. For instance, a few of the human personality scales that were initially considered
from Cattell’s 16 personality factor scales were Privateness (N) and Apprehension (O)
(Cattell & Mead, 2008). However, finding suitable brands as stimuli to represent the
descriptors of the low and high ranges of these three scales, personality traits such as Genuine
& non-disclosing (in case of Privateness) and Complacent & apprehensive personality traits
(in case of Apprehension) proved to be extremely difficult, as these traits are generally more
suitable for representing human personality rather than brand personality.
This difficulty led to the selection of three personality scales - Abstractedness (M), Liveliness
(F), and Social boldness (H), as these scales seemed to be more suitable to be able to generate
brands as stimuli (Cattell & Mead, 2008). Then, based on the descriptors of the low and high
ranges of these three scales, three personality traits - Creative - representing Abstractedness
(M), Enthusiastic representing Liveliness (F), and Confident representing Social boldness (H)
were initially chosen as the three human personality traits that could potentially generate
suitable brands as archetype stimuli.
Application of Ofman’s theory to these personality traits resulted in the development of 3
distinct Core Quadrants - one for each these brand personalities. Each Core Quadrant has its
own distinct Core Quality (which is the brand personality itself), Pitfall, Challenge, and
Allergy. It is worthwhile mentioning here that since Allergy is not directly a part of the
conceptual model, it was decided to not include Allergy as part of the stimuli development
phase just for the sake of simplicity and saving valuable time. The three Core Quadrants
along with their corresponding Core Quality, Pitfall, and Challenge that were therefore
developed are shown in Table 1:

Page 39 of 137
Table 1: Core Quadrant of the personality traits for pre-test 1
Core Quality Pitfall Challenge
Creative Chaotic Analytical
Enthusiastic Unserious Inexpressive
Confident Arrogant Modest
After the selection of the three personality traits and development of their respective
Challenge and Pitfall traits, the next step was to find 9 archetype brands (one each for 3 Core
Quality, Pitfall and Challenge traits) which would be seen as possessing each of these traits
as their primary personality traits. It was initially decided to assign a suitable distinct product
category to each of the core quadrants developed above, so that all brands within one Core
Quadrant could belong to the same product category.
Therefore, a product category was assigned to each of the 3 Core Quadrants - Consumer
electronics (Creative), Beers (Enthusiastic), Cars (Confident). The choice of assignment of
product categories to these 3 core quadrants was based purely on the intuitive suitability of
the personality traits within each of the core quadrants to the category.
The next step was to discover which brands within a specific product category are seen as the
typical representatives of each of the personality traits in a quadrant. For this purpose, a
qualitative pre-test was employed.
5.5.2 Qualitative pre-test 1
The main purpose of this pre-test was to generate stimuli of brands that are seen as typical
representatives of each of the personality traits in the three quadrants described above. The
sample used for this qualitative pre-test were students of the “Branding” course of the MSc.
Programme of Business Administration, since the construct of Brand personality is also a part
of this course. It was therefore assumed that having some prior knowledge of the construct of
brand personality would enable this sample to be able to conceive of brands as human beings
relatively easily, and therefore contribute effectively to the stimuli generation.
The participation in these semi-structured interviews was voluntary. Questions were asked in
face-to-face interviews or telephonic conversations, and were fairly standardized open-ended
questions, with room to probe using the laddering technique.
Examples of the questions asked are:

Page 40 of 137
“Which brand within the product category of consumer electronics, if it were to come
alive as a human being, would you describe as a creative/chaotic/analytical brand,
and why?”
“Which brand within the product category of beers, if it were to come alive as a
human being, would you describe as an enthusiastic/unserious/inexpressive brand,
and why?”
“Which brand within the product category of cars, if it were to come alive as a human
being, would you describe as a confident/arrogant/modest brand, and why?”
This semi-structured first qualitative pre-test led to identification of several brands within the
chosen product categories that were apparently seen as typically possessing the distinct
human personality trait in question. Based on these interviews, word-cloud of brands were
formed within these three product categories as shown in Appendix 1.
However, the results obtained from this pre-test were highly unreliable and unrealistic for a
few reasons:
Firstly, it was realized that the three personality traits (Creative - Enthusiastic- Confident)
were not sufficiently mutually exclusive of each other. For instance, the brands that could be
seen as creative can also be seen as enthusiastic. This was a problem since it was important
that the stimuli that were generated would represent the typical brands of a particular
personality trait, with that and only that trait as their primary identifying trait. Using
quadrants that were not sufficiently exclusive of each other might inhibit that.
Secondly, and perhaps more importantly, it was observed from the results that the brands that
were seen as ideal archetype brands of a certain personality trait by many were in fact more
so because of the associations that people have with those brands rather than these traits
being their actual (brand) personality traits. It seemed that the respondents failed to imagine
the brands as human beings. For instance, Philips was seen as a creative brand probably not
due to its personality, but due to its perceived “innovativeness”. Stimuli like this clearly
implied that people were unable to think of brands in terms of brand personality, but were
still thinking in terms of other associations such as products, slogans, etc. even after
repeatedly being prompted to think of the brand as a person.
Thirdly the fact that respondents had to stay confined within a particular product category
limited their scope of thinking about representative brands. Moreover, for a core quadrant
such as “Enthusiastic - Unserious - Inexpressive”, the stimuli were the hardest to obtain, since
the product category assigned to this quadrant (beer) is in itself an expressive one. This

Page 41 of 137
implied that even if a beer brand represented an inexpressive personality trait, there could
still, outside the product category of beer, be other brands that are perhaps more inexpressive,
implying that perhaps the most suitable brand for that personality trait could have been
outside the product category of beers.
Furthermore, the stimuli were also quite scattered, with no single brand clearly emerging as a
clear representative of a particular personality. Brands within one quadrant appeared in
multiple places in that quadrant (please refer to Appendix 1 for the complete results of the
qualitative pre-test). For instance, the brand Philips appeared as being a representative of
both a Creative as well as Analytical brand, and Apple was perceived as being both Creative
as well as Chaotic. Such scattered results imply that these brands were not perceived as the
typical representatives of a particular personality trait.
5.5.3 Qualitative pre-test 2
The less-than-appropriate results obtained from the first qualitative pre-test meant that the
stimuli had to be re-developed. For this purpose, it was decided to conduct a second
qualitative pre-test with a few changes.
Firstly, it was decided to not restrict each Core quadrant to a product category, since it
strictly limits the scope of thinking about the brands, and more importantly, this ultimately
leads to less-than-optimal results in terms of the stimuli that is obtained since all brands
within a specific product category may not necessarily be the perfect representatives of a
particular personality trait.
Secondly, it was also decided to re-consider the personality traits that were chosen for the
first pre-test, since some of the traits ended up being not sufficiently mutually exclusive of
each other. For instance, a brand’s primary personality could be both Creativity and
Enthusiasm. Again, this would deem the brand as not being a perfect representative of a
particular personality trait.
Therefore, in addition to the two personality traits of confident and creative that were selected
for the first pre-test, a third one (sympathetic) was added representing Warmth (A)
personality scale in Cattell’s sixteen personality factors (Cattell & Mead, 2008). The criterion
of selection of this personality scale was again based on its applicability to brands and their
personalities.
The core quadrant that was developed for this personality was as follows:

Page 42 of 137
Table 2: Core Quadrant of "Sympathetic" personality
Core Quality Pitfall Challenge
Sympathetic Sentimental Pragmatic
The same sample was used again for this qualitative pre-test as the previous one. However,
this time, the questions were framed in a slightly different way in order to get the respondents
thinking in terms of the brand personality, rather than products or free associations, as
observed from the results previously. Examples of the questions asked are:
“Mention a typically confident/creative/sympathetic person or a celebrity. Now which
brand would this person typically use that would complement his/her personality?
“If you were to think of a brand as a living person, which brand would you typically
describe as being confident/creative/sympathetic, and why?”
This qualitative pre-test again led to identification of several brands within the three core
quadrants (Appendix 2). However, just like the first qualitative pre-test, the results obtained
from this pre-test were quite unreliable and unrealistic, and a few problems clearly emerged.
Firstly, the stimuli were very scattered again, with no clear brand appearing as being an ideal
representative of a personality trait. Secondly, and perhaps more importantly was the problem
that the brands were again failed to be seen by many respondents as human beings, even after
more rigorous prompting and cueing of the construct of brand personality while conducting
the interviews. The stimuli clearly indicated this, with brands appearing mostly based on their
associations and type of products, rather than their actual personality traits. For instance,
brands such as Ray Ban, Rolex, and Hugo Boss were perceived as Confident brands, possibly
due to the impact that using the products of these brands might have on making the user feel
more Confident. However, this doesn’t necessarily imply that the personality of these brands
themselves is Confident.
The repeated failure of these qualitative interviews not only led to a lot of lost time in the
initial set-up of the study, but also brought to attention a few important points. It firstly
implied that despite the fact that the respondents were well capable of grasping the concept of
brand personality and its overall idea, they repeatedly failed to actively associate brands with
a particular personality trait. It was therefore inferred that perhaps if the respondents are
given the brands instead of the personality traits, and asked whether they associated a
particular personality trait with that brand, that might solve this problem.

Page 43 of 137
Another important takeaway from the first two qualitative pre-tests were that looking at the
results, it seemed that there might also have been a conceptual problem with the personality
traits that were used for these two tests. Looking back at the selection criteria of these traits,
they were not part of a brand personality scale, but rather of human personality scales. The
fact that the respondents were not able to conceive of brands that specifically possessed these
very traits could have implied that perhaps these personality traits might have been very
specific to human personality, so much so that their application to brands might be very
difficult. It might have instead been possible to assign brands to relatively general personality
trait descriptions (such as that described in Aaker’s framework). Therefore, it was ultimately
decided to not rely on qualitative pre-tests anymore to generate stimuli. Instead, it was
decided to pre-test quantitatively whether enough respondents perceive a given brand as
possessing a specific personality trait.
5.5.4 Stimuli testing - Quantitative pre-test
At this point, it was decided to consider broader and more generic brand personality scales
instead of more specific human personality scales. For this purpose, it was decided to consult
the brand personality literature - specifically the two frameworks that were mainly considered
were that of J. L. Aaker (1997) and Geuens et al. (2009). The main criteria for finalizing a
particular brand personality trait were twofold: Firstly, it should be relatively easy to derive
the Pitfall and the Challenge traits once the Core Quality (brand personality trait itself) was
identified. Secondly, it should be relatively easy to think of brands as the perfect archetypes
of these personality traits, since that would imply that the personality traits are applicable
enough to brands.
Furthermore, it was decided to pre-test six brand personality traits this time instead of three,
so that as much stimuli can be pre-tested as possible, leaving more possibility to test and then
retain the suitable stimuli. A few personality traits emerged from the frameworks of J. L.
Aaker (1997) and Geuens et al. (2009) as possible candidates for the quantitative pre-tests,
namely: Responsibility and Activity from Geuens et al. (2009), while Excitement, Sincerity,
Sophistication, Ruggedness, and Competence from J. L. Aaker (1997). Since both Activity
and Exciting measure similar traits, it was decided to choose Exciting as one of the five brand
personality traits. Responsibility seemed similar to the Challenge of Excitement
(Responsible), and was therefore not included as a separate Core Quality trait. The remaining
three traits of Sincerity, Sophistication and Competence were also selected as part of the five
Core Quality traits to pre-test. Finally, one of the human personality traits of Creativity was

Page 44 of 137
also included as part of the six brand personality pre-test stimuli (to confirm the previous
assumption that more specific human personality traits seemed less capable of representing
brands than the actual brand personality traits).
The core quadrants that were developed for these traits are shown in Table 3:
Table 3: Core Quadrants for the personalities in Quantitative pre-test
Core Quality Pitfall Challenge
Exciting Impulsive Responsible
Sincere Sentimental Pragmatic
Sophisticated Condescending Humble
Rugged Rude Kind
Competent Boring Enthusiastic
Creative Chaotic Analytical
Looking at the Core Quadrants at this stage revealed that some Core Quality and Challenge
traits appeared to not be sufficiently exclusive of each other. For e.g. brands that could be
seen as Competent could also be seen as Responsible, and brands that could be seen as
Exciting could also be seen as Enthusiastic. For this reason, it was decided to pre-test only the
Core Quality and Pitfall brands quantitatively. Challenge brands were not pre-tested
quantitatively and Core Quadrants were accepted even if they were not necessarily
completely mutually exclusive of each other as was intended previously. This is because
previously this had led to loss of valuable stimuli development and testing time, and also
limited the scope of the stimuli and put an additional constraint on the chances of finding the
stimuli that practically work. At this stage, finding the right Core Quality and Pitfall brands
was considered the biggest priority.
5.5.5 Quantitative Pre-test questionnaire design
Having excluded the Challenge brands from the pre-test for the sake of simplicity, and to
avoid the constraint of limiting the scope of the stimuli, four brands were chosen in each
Core Quadrant from this stage on for the pre-test - two for Core Quality and two for Pitfall
traits (in order to test multiple stimuli for each personality trait and leave room for
elimination and refinement at later stages). These four brands were assumed as being the
ideal candidates to represent their respective traits. However, for the sake of comparison of
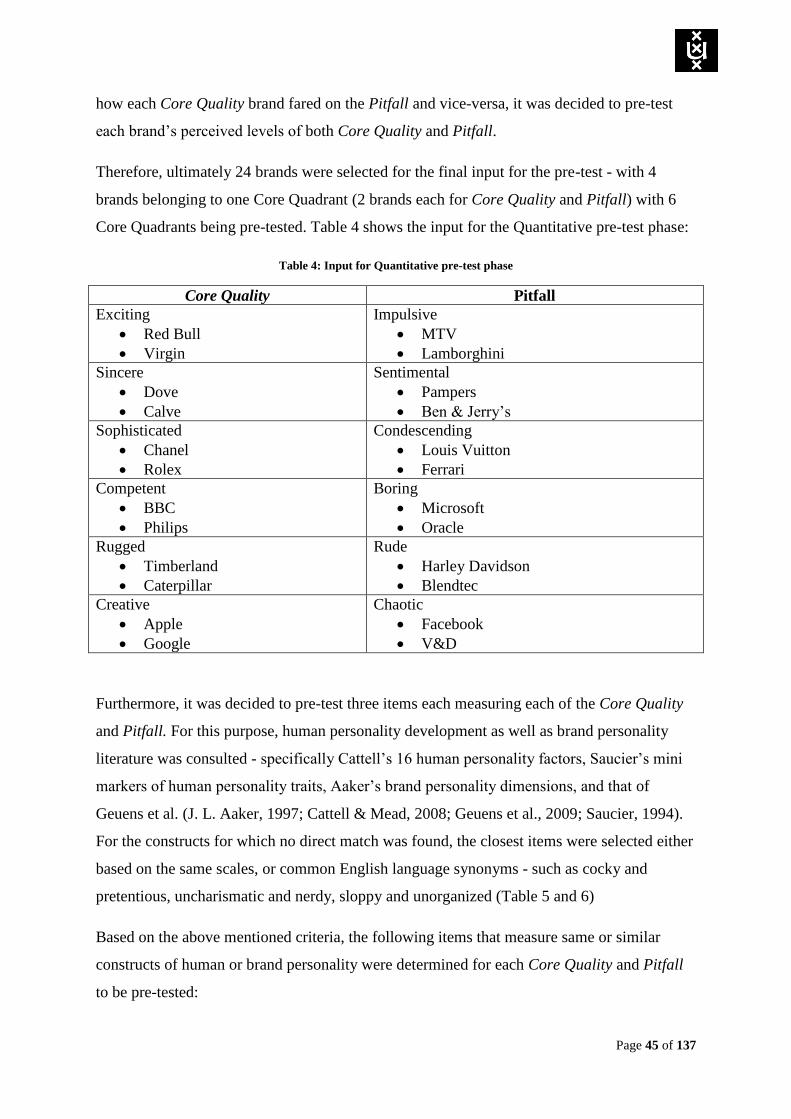
Page 45 of 137
how each Core Quality brand fared on the Pitfall and vice-versa, it was decided to pre-test
each brand’s perceived levels of both Core Quality and Pitfall.
Therefore, ultimately 24 brands were selected for the final input for the pre-test - with 4
brands belonging to one Core Quadrant (2 brands each for Core Quality and Pitfall) with 6
Core Quadrants being pre-tested. Table 4 shows the input for the Quantitative pre-test phase:
Table 4: Input for Quantitative pre-test phase
Core Quality Pitfall
Exciting
Red Bull
Virgin
Impulsive
MTV
Lamborghini
Sincere
Dove
Calve
Sentimental
Pampers
Ben & Jerry’s
Sophisticated
Chanel
Rolex
Condescending
Louis Vuitton
Ferrari
Competent
BBC
Philips
Boring
Microsoft
Oracle
Rugged
Timberland
Caterpillar
Rude
Harley Davidson
Blendtec
Creative
Apple
Chaotic
V&D
Furthermore, it was decided to pre-test three items each measuring each of the Core Quality
and Pitfall. For this purpose, human personality development as well as brand personality
literature was consulted - specifically Cattell’s 16 human personality factors, Saucier’s mini
markers of human personality traits, Aaker’s brand personality dimensions, and that of
Geuens et al. (J. L. Aaker, 1997; Cattell & Mead, 2008; Geuens et al., 2009; Saucier, 1994).
For the constructs for which no direct match was found, the closest items were selected either
based on the same scales, or common English language synonyms - such as cocky and
pretentious, uncharismatic and nerdy, sloppy and unorganized (Table 5 and 6)
Based on the above mentioned criteria, the following items that measure same or similar
constructs of human or brand personality were determined for each Core Quality and Pitfall
to be pre-tested:

Page 46 of 137
Table 5: Multi-items for Core Quality traits - Quantitative pre-test
Core Quality Multi-items for Core Quality
Exciting Active, Daring
Sincere Warm, Sympathetic
Sophisticated Classy, Elegant
Competent Intelligent, Reliable
Rugged Tough, Outdoorsy
Creative Imaginative, Idea-oriented
Table 6: Multi-items for Pitfall traits - Quantitative pre-test
Pitfall Multi-items for Pitfall
Impulsive Undependable, Careless
Sentimental Emotional, Over-protective
Condescending Pretentious, Cocky
Boring Nerdy, Uncharismatic
Rude Unkind, Uncharitable
Chaotic Sloppy, Unorganized
Based on the above Core Quadrants, the 24 brands were pre-tested in the form of a printed
Quantitative pre-test questionnaire, consisting of 6 different questionnaire versions - each
testing 4 brands (Appendix 3). These questionnaires were distributed randomly in the
Branding course of the MSc. programme of Business Administration. In these questions,
each brand’s familiarity was measured, alongside each brand’s rating on its Core Quality (and
its corresponding 2 multi-items) as well as Pitfall (and its corresponding 2 multi-items). This
was done to determine whether a brand that is assumed to be a Core Quality brand is also
seen by the respondents that way. In addition, an open question about brand personality was
included to observe people’s inferences about the brands’ primary personality traits. All other
questions were measured on a 7-point Likert scale ranging from Strongly Disagree to
Strongly Agree.
Page 47 of 137
5.5.6 Results of quantitative pre-test
There were a total of 71 respondents, with an average of 12 respondents for each
questionnaire version and therefore for each brand. The results revealed that out of the 24
brands tested, 21 were sufficiently familiar, since their mean familiarity scores were
significantly higher than 4 - which is the mid-point of the Likert scale. A sufficient score
above this scale would ensure that overall, the average brand familiarity is high, ensuring
reliable results for the personality scores of the brands. A mean familiarity rating lower than 4
would imply low and even possibly poor brand familiarity. Therefore, the remaining three
brands - Caterpillar (M =3.08; SD = 1.881), Blendtec (M = 1.33; SD = 0.492), and Oracle (M
= 2.73; SD = 2.054) were excluded from further analyses, since respondents had to be
sufficiently familiar with the brands in order to be able to rate their respective personalities
correctly.
Furthermore, since there were very few respondents (approximately 11 to 13) per
questionnaire version (and therefore per brand), it resulted in poor results of the reliability
analysis, with very low Cronbach’s alpha ratings (< 0.3) for almost all constructs, barring a
few with very high Cronbach’s alphas (> 0.8) - Sincere, warm, and sympathetic (Sincerity),
and Sophisticated, classy, and elegant (Sophistication). Seeing the inconsistency in these
patterns, it was realized that they were due to the small sample size. Therefore, the
Cronbach’s alpha ratings were ignored in the pre-test for further analyses and two summated
variables were formed for each brand based on its score on the three items for Core Quality
and three items for Pitfall, resulting in 2 variables per brand - one for Core Quality and one
for Pitfall.
A one-sample t-test against the score of 4 was then conducted to compare each set of four
brands (2 for Core quality and 2 for Pitfall) for within each Core Quadrant to compare their
mean ratings on both Core quality and Pitfall. This was done so that it can be determined
which brand was seen as the Core quality brand, and which as the Pitfall brand within each
quadrant. A score higher than 4, just like the familiarity score criterion of 4 explained above
would establish whether a brand is on average seen as possessing the Core quality and Pitfall.
For instance, a score lower than 4 for an expected Core Quality brand on its perceived levels
of Core Quality would imply that the brand does not seem to possess enough levels of Core
Quality to be perceived that way by the respondents. The same applies to testing Pitfall levels
as well.
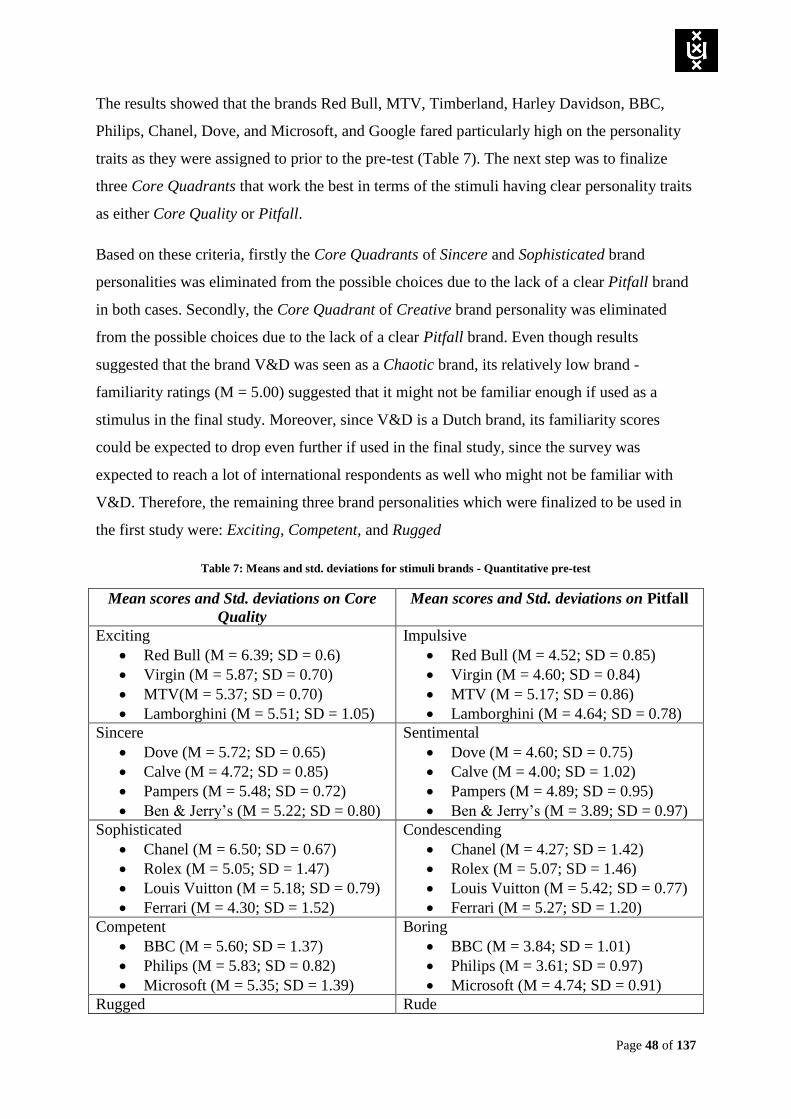
Page 48 of 137
The results showed that the brands Red Bull, MTV, Timberland, Harley Davidson, BBC,
Philips, Chanel, Dove, and Microsoft, and Google fared particularly high on the personality
traits as they were assigned to prior to the pre-test (Table 7). The next step was to finalize
three Core Quadrants that work the best in terms of the stimuli having clear personality traits
as either Core Quality or Pitfall.
Based on these criteria, firstly the Core Quadrants of Sincere and Sophisticated brand
personalities was eliminated from the possible choices due to the lack of a clear Pitfall brand
in both cases. Secondly, the Core Quadrant of Creative brand personality was eliminated
from the possible choices due to the lack of a clear Pitfall brand. Even though results
suggested that the brand V&D was seen as a Chaotic brand, its relatively low brand -
familiarity ratings (M = 5.00) suggested that it might not be familiar enough if used as a
stimulus in the final study. Moreover, since V&D is a Dutch brand, its familiarity scores
could be expected to drop even further if used in the final study, since the survey was
expected to reach a lot of international respondents as well who might not be familiar with
V&D. Therefore, the remaining three brand personalities which were finalized to be used in
the first study were: Exciting, Competent, and Rugged
Table 7: Means and std. deviations for stimuli brands - Quantitative pre-test
Mean scores and Std. deviations on Core
Quality
Mean scores and Std. deviations on Pitfall
Exciting
Red Bull (M = 6.39; SD = 0.6)
Virgin (M = 5.87; SD = 0.70)
MTV(M = 5.37; SD = 0.70)
Lamborghini (M = 5.51; SD = 1.05)
Impulsive
Red Bull (M = 4.52; SD = 0.85)
Virgin (M = 4.60; SD = 0.84)
MTV (M = 5.17; SD = 0.86)
Lamborghini (M = 4.64; SD = 0.78)
Sincere
Dove (M = 5.72; SD = 0.65)
Calve (M = 4.72; SD = 0.85)
Pampers (M = 5.48; SD = 0.72)
Ben & Jerry’s (M = 5.22; SD = 0.80)
Sentimental
Dove (M = 4.60; SD = 0.75)
Calve (M = 4.00; SD = 1.02)
Pampers (M = 4.89; SD = 0.95)
Ben & Jerry’s (M = 3.89; SD = 0.97)
Sophisticated
Chanel (M = 6.50; SD = 0.67)
Rolex (M = 5.05; SD = 1.47)
Louis Vuitton (M = 5.18; SD = 0.79)
Ferrari (M = 4.30; SD = 1.52)
Condescending
Chanel (M = 4.27; SD = 1.42)
Rolex (M = 5.07; SD = 1.46)
Louis Vuitton (M = 5.42; SD = 0.77)
Ferrari (M = 5.27; SD = 1.20)
Competent
BBC (M = 5.60; SD = 1.37)
Philips (M = 5.83; SD = 0.82)
Microsoft (M = 5.35; SD = 1.39)
Boring
BBC (M = 3.84; SD = 1.01)
Philips (M = 3.61; SD = 0.97)
Microsoft (M = 4.74; SD = 0.91)
Rugged Rude

Page 49 of 137
Timberland (M = 5.53; SD = 0.77)
Harley Davidson (M = 6.09; SD =
0.53)
Timberland (M = 2.84; SD = 1.10)
Harley Davidson (M = 4.27; SD =
1.31)
Creative
Apple (M = 5.61; SD = 0.69)
Google (M = 5.78; SD = 0.80)
Facebook (M = 4.92; SD = 1.27)
V&D (M = 2.12; SD = 0.93)
Chaotic
Apple (M = 1.97; SD = 0.99)
Google (M = 3.18; SD = 0.50)
Facebook (M = 3.76; SD = 1.25)
V&D (M = 4.96; SD = 1.11) * Note: Caterpillar & Blendtec (Ruggedness) and Oracle (Competence) were deleted due to low familiarity
ratings
After having finalized upon the three brand personalities to be used for the first study, each
quadrant’s Core Quality and Pitfall brands were re-considered, since the pre-tests results
could not be completely relied on because of the small sample size obtained per brand.
It was determined that Red Bull and MTV were clear candidates of the Exciting brand
personality to represent Core Quality and Pitfall brands respectively having scored high on
these traits respectively. Similarly, it was also determined that Timberland and Harley
Davidson were clear candidates of the Rugged brand personality to represent Core Quality
and Pitfall brands respectively.
Finally, after considering that both Philips and BBC had similar mean ratings as representing
the Core Quality of the Competent brand personality from the pre-test, it was determined that
BBC might be a better candidate of this brand personality due to the more informational and
reliable nature of the category that BBC is in (broadcasting news and media).
At this stage, a slight adaptation in the conceptual model was made, and the original idea of
only considering the Core Quality and Pitfall brands was reconsidered. It was concluded that
it might be better to have a wider spread of brands across all levels of Core Quality, Pitfall,
and Challenge in the actual experiment. Therefore, it was decided to include two more types
of brands - namely a Challenge brand (representing high levels of Challenge and low levels
of Core Quality) and a Neutral brand (representing both low levels of Challenge and Core
Quality). In this way, each Core Quadrant would have 4 brands, two representing high levels
of Core Quality - the Core Quality and Pitfall brands, low levels of Core Quality - the
Challenge and Neutral brands, and low levels of Challenge - the Pitfall brand and Neutral
brand.
Page 50 of 137
After careful consideration, it was decided that Philips could represent the Challenge of
Exciting personality, since it also scored high on the trait of Reliability in the pre-test. Dove
was considered to be the Challenge brand of the Rugged personality, since it scored high on
the trait of sympathy in the pre-test. Axe, which was not tested in the pre-test was considered
as the Challenge brand of the Competent personality due to its enthusiastic personality
perception. This was also confirmed by brief qualitative pre-test in which a few respondents
were asked whether they perceived Axe as having an enthusiastic personality.
Finally, three more brands were included as the neutral brands based on the criteria that no
primary (brand) personality trait should come to mind when thinking of them. Based on this
criterion - Zara, Sprite, and Lays were concluded as the Neutral brands. This was again
confirmed by brief qualitative pre-tests, asking a few respondents about these brands and
their perceived dominant personality traits. Most respondents could not assign any particular
dominant personality trait to any of the three brands.
This led to the completion of the stimuli development phase. The final stimuli which was to
be used in the actual experiment is shown in Table 8.

Page 51 of 137
Table 8: Final stimuli Study 1
CQ = Exciting/Active/Daring
High CQ, High CH
Pitfall = Impulsive/Undependable/Careless
High CQ, Low CH
Allergy = Unadventurous
Challenge = Responsible/level-
headed/sensible
Low CQ, High CH
Neutral brand (low CQ, low CH) =
CQ =Rugged/Tough/Outdoorsy
High CQ, High CH
Pitfall = Rude/disrespectful/Harsh
High CQ, Low CH
Allergy = Sentimental
Challenge = kind/considerate/soft-hearted
Low CQ, High CH
Neutral brand (low CQ, low CH) =
CQ = Competent/Intelligent/Reliable
High CQ, High CH
Pitfall = Boring/Nerdy/Uncharismatic
High CQ, Low CH
Allergy = Unintellectual Challenge =Enthusiastic/lively/fun
Low CQ, High CH
Neutral brand (low CQ, low CH) =

Page 52 of 137
5.5.7 Final experiment design
Finally, the experiment was a 3 X 4 experimental set-up, with 3 distinct brand personalities -
Excitement, Ruggedness, and Competence; and 3 distinct positions in the quadrant - Core
Quality brand (High Core Quality + possibly High Challenge), Pitfall brand (High Core
Quality + possibly Low Challenge), Challenge brand (Possibly Low Core Quality + High
Challenge), along with an additional brand that is Neutral in nature (Possibly both Low Core
Quality and Challenge).
It was decided to make four different versions of the final questionnaire, each with three
brands to be evaluated on all three dimensions - their levels of Core Quality, Pitfall, and
Challenge - each measured with three items, along with one additional item for measuring
each brand’s level of Allergy, even though Allergy is not directly a part of the conceptual
model.
The variable that was manipulated within each questionnaire was the actual brand personality
(Core Quality) - Excitement, Ruggedness, and Competence, and was therefore the Within-
Subjects variable. Each version of the questionnaire received the brands to be evaluated from
the same position on the quadrant (i.e. one version with all Core Quality brands from the 3
quadrants, second with all Pitfall brands from the 3 quadrants, third with all Challenge brands
from the 3 quadrants, and fourth with all Neutral brands from the 3 quadrants). Therefore the
variable that was manipulated between each different version of the questionnaire was the
position where each of the brand was located in the Core Quadrant - Core Quality, Pitfall,
Challenge, or Neutral; and was therefore the Between-Subjects variable. The reason for this
particular choice and combination of within- and between-subjects variable was to avoid the
possibility of potential hypotheses guessing, which would be quite high if for instance, the
same set of respondents were asked to rate all three brands within a Core Quadrant on their
perceived levels of Core Quality, Pitfall, and Challenge. For instance, the chances of
hypotheses guessing would be much higher if the same set of respondents were asked to rate
Red Bull, MTV, and Philips on their perceived levels of Core Quality, Pitfall, and Challenge,
rather than if asked to rate only Red Bull, and two other brands representing only the Core
Quality positions of two different Core Quadrants - Timberland and BBC.
It is also worthwhile mentioning that in the actual study, some of the multi-items that
measured the Core Quality, Pitfall, and Challenge were slightly adjusted according to both
the results of the pre-test, as well as keeping in mind the fact that majority of the sample was

Page 53 of 137
going to be Dutch, and due to the fact that their native language is not English, the words that
expressed the constructs had to be relatively easy to understand. For instance, unkind and
uncharitable were replaced with harsh and disrespectful as being the pitfalls traits (Rudeness)
of the Rugged personality.
Also, the Allergy was measured with just one item so as to avoid making the questionnaires
too long, especially considering that Allergy was not a direct part of the conceptual model. It
was still measured in order to have the possibility of explanation of any unexpected results
later that might be otherwise hard to explain, or simply for conducting additional analyses if
needed at later stages.
5.5.8 Experiment procedure
The experiment was created and distributed in the form of an online questionnaire via the
Qualtrics survey platform. The four different versions or conditions (Core Quality, Pitfall,
Challenge and Neutral) of the questionnaire (Appendix 4), each with three separate brands
from three different Core Quadrants were created in the form of blocks in the same
questionnaire link, and assigned to be distributed randomly to the participants. It was decided
that there needed to be a minimum number of responses of 30 for each condition in order to
draw conclusive results.
The survey and the randomized blocks were conditioned so as to generate approximately
even number of respondents randomly per condition. The experiment was designed to last
approximately 5 minutes, and consisted of an open question on the brand personality that the
respondents associated with the brand prior being asked questions to rate the selected
personality traits. This was done so as to gauge the primary personality trait that the
respondents associate with a particular brand, which could be useful in case the results
showed at later stages that the chosen personality traits were not perceived as the brands’
primary ones. Besides this item, all other items were measured on a 7-point Likert scale of
Strongly Disagree - Strongly Agree.
Furthermore, some control variables were also measured such as Respondent personality,
Product category involvement, and brand attitude, alongside the usual demographics
measuring age, gender, and nationality of the respondents.
Section 2.9 in the literature review of brand personality revealed that the congruence between
consumers’ personality and brand personality can have an impact on their brand preferences,
Page 54 of 137
as well as their attitude towards the brand. For this purpose, the respondents’ personality and
their attitude towards the brand were measured. Furthermore, another factor that could
potentially influence the respondents’ perceived levels of Core Quality, Pitfall, and Challenge
of a particular brand might be their involvement with the product category of that brand. For
this purpose, the product category involvement of the respondents was also measured as a
control variable.
Finally, demographic variables could reveal whether the respondents of being of a certain age
(group) or nationality, or male or female could influence their perceptions of personality of a
particular brand.
5.6 Results
The results of the experiment were analyzed in IBM SPSS V.20. The data collection was
ended after reaching 147 total respondents and more than 30 for each condition.
In order to prepare the raw data for analyses, the dataset was sorted so that the responses
appear neatly as separate blocks of data. Out of the 147 respondents, 135 completed the
questionnaires. A frequency check was then conducted to check for any errors or missing
values in the data. Based on this check, 2 missing values were found. Hence, these 2 data
were removed from the analyses, reducing the final sample size (N) to be 133.
After this initial data cleaning process, the sample (N) was 32 each for Core Quality, Pitfall,
and Challenge conditions, and 37 for Neutral condition.
a new variable called “Quadrant_Position” was created, and labelled with dummy values
from 1 to 4, which symbolizes the position of a brand on each Core Quadrant (i.e. whether a
brand is a Core Quality, Pitfall, or Challenge brand, or a Neutral one). The variables were
also renamed to match the items being measured.
5.6.1 Test for sufficient brand familiarity
The first step before performing any actual tests towards the conceptual model was to
ascertain whether all brands selected in the experiment were sufficiently familiar. Just like the
quantitative pre-test, a one sample t-test was conducted against a value of 4 (mid-point in the
Likert scale) for this purpose. Again, a sufficient score above this scale would ensure that
overall, the average brand familiarity is high, which would ensure reliable results for the
personality scores of the brands.

Page 55 of 137
All brands were sufficiently familiar (Table 9), with brand familiarity scores significantly
greater than 4 (p < 0.05).
Table 9: One sample T-test against 4 on mean familiarity ratings
Brand Mean familiarity score SD t df Sig. (1-tailed)
Red Bull 6.34 0.90 14.70 31 0.000
MTV 6.25 1.21 10.45 31 0.000
Philips 6.06 1.36 8.53 31 0.000
Zara 6.54 1.14 13.49 36 0.000
Timberland 5.31 1.73 4.28 31 0.000
Harley Davidson 5.66 1.57 5.93 31 0.000
Dove 6.06 1.36 8.53 31 0.000
Sprite 6.16 1.16 11.27 36 0.000
BBC 5.19 1.78 3.76 31 0.001
Microsoft 6.41 0.79 17.06 31 0.000
Axe 5.75 1.60 6.16 31 0.000
Lay’s 6.27 1.14 12.04 36 0.000
5.6.2 Factor analysis
The next step in the data analysis process was to determine the belongingness of the 10 items
(3 items each for Core Quality, Pitfall, and Challenge, and 1 item for Allergy) for each brand
personality with each other, to determine which items load together and seem to measure the
same construct. The factor analysis was conducted three times for three different brand
personalities - (Excitement, Ruggedness, and Competence). Principal components analysis
with Varimax rotation of the 10 items for the brand personalities Exciting, Rugged, and
Competent resulted in quite different results.
Brand personality ‘Exciting’ - Three separate components with eigen values greater than 1
were observed. The first component consisted of five items that loaded together - 3 items
measuring Core Quality, one of the Pitfall items (Impulsive), as well as the Allergy item
(albeit with a negative sign). The second component consisted of three items measuring
Challenge, while the third consisted of the remaining two Pitfall items (Undependable and
careless).
The fact that the item impulsive loaded well with the Core Quality factors can possibly imply
that impulsive might not necessarily be perceived as having the same (possibly negative)

Page 56 of 137
connotation as the other two Pitfall items. Furthermore, the fact that the Allergy item loaded
well with the Core Quality factors with a negative sign can possibly imply that they are seen
by the respondents as the polar opposites, which also supports Ofman’s theory of Core
Quality and Allergy being opposites.
Table 10: Rotated component table and factor loadings - Exciting
Item Component 1 Component 2 Component 3
Active .828
Exciting .827
Unadventurous -.698 .352
Daring .694
Impulsive .683 .468
Level-headed .841
Sensible .768 -.309
Responsible -.342 .756
Careless .760
Undependable .736 Extraction method: Principal component analysis
Rotation method: Varimax with Kaiser normalization
Brand personality ‘Rugged’ - Two separate components with eigen values greater than 1
were observed. The first component consisted of 3 items measuring Core Quality, 3 items
measuring Challenge (albeit with a negative sign possibly implying theoretically same, but
polar opposite items), and again, one Allergy item negatively loading. The second component
consisted of the three items measuring Pitfall and 3 items measuring Challenge (albeit with a
negative sign possibly implying theoretically same, but polar opposite items). Since
theoretically it was known that there must be at least 3 components each to represent Core
Quality, Pitfall, and Challenge, the factor analysis was run by forced extraction of the items
into three components. Following this, it was observed that the three items of Core Quality
loaded together, the three items of Challenge and one item of Allergy loaded together, and the
three items of Pitfall loaded together.

Page 57 of 137
Table 11: Rotated component table and factor loadings - Rugged
Item Component 1 Component 2 Component 3
Considerate .787
Sentimental .786 -.338
Soft-hearted .743 -.431 -.318
Kind .735 .735 -.379
Tough -.303 .863
Outdoorsy -.392 .791
Rugged .790
Harsh -.462 .539 .450
Disrespectful .896
Rude -.446 .676 Extraction method: Principal component analysis
Rotation method: Varimax with Kaiser normalization
Brand personality ‘Competent’ - Two separate components with eigen values greater than 1
were observed. The first component consisted of 3 items measuring three items measuring
Pitfall (albeit with a negative sign possibly implying theoretically same, but polar opposite
items) and 3 items measuring Challenge. The second component consisted of the three items
measuring Core Quality and one Allergy item negatively loading with it. After forced
extraction into three components, the three items of Core Quality and one for Allergy loaded
together, the three items of Challenge loaded together, and the three items of Pitfall loaded
together.
Table 12: Rotated component table and factor loadings - Competent
Item Component 1 Component 2 Component 3
Enthusiastic .917
Fun .843
Lively .830
Boring -.756 .374
Intelligent .873
Reliable .838
Unintelligent -.835
Competent .815
Uncharismatic -.354 .850
Nerdy -.429 .381 .507 Extraction method: Principal component analysis
Rotation method: Varimax with Kaiser normalization

Page 58 of 137
5.6.3 Reliability analysis
In order to check the internal consistency of items in one scale, a reliability analysis was
conducted three times - once for the three Core Quality items, once for the three Pitfall items,
and once for the three Challenge items for each of the three brand personalities.
Table 13: Reliability analysis of all Core Quality, Pitfall, and Challenge items
Brand personality - Variable (items) Cronbach's alpha
Excitement - Core Quality (Exciting, Active, Daring) .756
Excitement - Pitfall (Impulsive, Undependable, Careless) .673
Excitement - Challenge (Responsible, Level-headed, Sensible) .757
Rugged - Core Quality (Rugged, Tough, Outdoorsy) .879
Rugged - Pitfall (Disrespectful, Harsh, Rude) .764
Rugged - Challenge (Kind, Soft-hearted, Considerate) .888
Competent - Core Quality (Competent, Intelligent, Reliable) .858
Competent - Pitfall (Nerdy, Uncharismatic, Boring) .748
Competent - Challenge (Enthusiastic, Lively, Fun) .865
Brand personality ‘Exciting’
The Cronbach’s alpha for the Core Quality and Challenge items scales was > .7, indicating a
high level of internal consistency. Meanwhile, the Cronbach’s alpha for the Pitfall items
scales was < .7 indicating a low level of internal consistency. However, if the item
‘Undependable’ was deleted, then the Cronbach’s alpha increased to 0.697. Based on this
reasoning, the item ‘Undependable’ was excluded while forming the summated variables for
later analyses.
Brand personality ‘Rugged’
The Cronbach’s alpha for all three Core Quality, Pitfall, and Challenge item scales was > .7,
indicating a high level of internal consistency the three items.
Brand personality ‘Competent’
The Cronbach’s alpha for all three Core Quality, Pitfall, and Challenge item scales was > .7,
indicating a high level of internal consistency between the three items.
5.6.4 Dimension reduction - Computing scale means
Following the reliability analysis, scale means were created for the 3 constructs (Core
Quality, Pitfall, and Challenge) for all three brand personalities. At this stage it was
important to make a choice between the results of factor analysis or reliability analysis while
considering the brand personality Exciting. Factor analysis showed the Pitfall item of the
Exciting brand personality ‘Impulsive’ loading together, implying that perhaps in the eyes of
Page 59 of 137
the respondents, being impulsive is not a negative thing per se. Despite this case, the Pitfall
item of the Exciting brand personality ‘Undependable’ was ultimately deleted while
computing the scale means since deleting the item increased the Cronbach’s alpha 0.697.
Therefore, the mean of remaining two Pitfall items of the Exciting brand personality
(Impulsive and Careless) were used to represent one scale and hence new variables called
“Summated” were formed.
For all the other constructs which showed high level of internal consistency between their
individual items, the mean consisted of all items that were used to represent that scale. The
means and standard deviations of the variables can be seen in the correlation matrix in
Appendix 5.
5.6.5 Manipulation check
The main purpose at this stage of the data analysis of a manipulation check was to ensure that
the predicted levels of Core Quality, Pitfall, and Challenge at the experimental set-up phase
for each brand personality has been achieved after the experiment. For instance, the
experimental set-up suggested the need for a Core Quality brand (High Core Quality +
possibly High Challenge), Pitfall brand (High Core Quality + possibly Low Challenge),
Challenge brand (Possibly Low Core Quality + High Challenge).
Therefore, the purpose of manipulation check at this stage was to confirm whether this
aforementioned spread of Core Quality, Pitfall, and Challenge has been obtained after the
experiment. This was done by conducting a one sample t-test against a value of 4 (mid-point
in the Likert scale) for all Core Quality, Pitfall, and Challenge brands for each brand
personality. This was done in order to ensure that a brand which has been pitted to represent
the archetype of a particular position in a Core Quadrant (whether Core Quality, Pitfall, or
Challenge) scores at least sufficiently high on that position. An overall average score
significantly higher than 4 on the brand’s predicted position would suggest that the brand can
be considered a suitable candidate to represent that particular position in the Core Quadrant.
Therefore, a variable “Position” was created which indicates each brand’s expected position
on the Core Quadrant (Core Quality, Pitfall, or Challenge). Tables 14, 15, and 16 show the t-
value and significance of the brands for their own expected position on the quadrant. All
brands scored significantly higher than 4 on their expected position in the quadrant (p <
0.05). The results have been described in the tables 14, 15, and 16.

Page 60 of 137
Table 14: One sample t-test against 4 on Core Quality
Core Quality
brands
Core Quality
Scores t-value against 4 on Core Quality df Sig. (1-tailed)
Red Bull 5.91 14.39 31 0.000
Timberland 5.25 6.77 31 0.000
BBC 5.54 10.16 31 0.000
Table 15: One sample t-test against 4 on Pitfall
Pitfall brands Pitfall Scores t-value against 4 on Pitfall df Sig. (1-tailed)
MTV 5.02 5.27 31 0.000
Harley Davidson 4.33 2.00 31 0.027
Microsoft 4.72 4.24 31 0.000
Table 16: One sample t-test against 4 on Challenge
Challenge brands Challenge Scores t-value against 4 on Challenge df Sig. (1-tailed)
Philips 4.72 3.37 31 0.001
Dove 6.17 22.60 31 0.000
Axe 5.69 12.93 31 0.000
5.6.6 Hypotheses testing
In order to test the hypotheses, a regression analysis was conducted using the Process macro
by Andrew Hayes for SPSS (Hayes, 2012) for each of the three brand personalities. The
process model 1 in the Process manual matches the conceptual model explained above, with
variables X (independent variable) being the Core Quality, Y (dependent variable) being the
Pitfall, and M (moderator) being the Challenge.
Hierarchical multiple regression was performed to investigate the ability of perceived person-
organization fit and psychological contract breach to predict levels of job satisfaction, after
controlling for gender and age.
Brand personality ‘Exciting’ - In the first step of the regression, the predictor variable of the
Exciting brand personality (Pitfall score) was entered. Overall, the model was statistically
significant, F (3, 129) = 47.20; p < .01 and explained 52.3 % of variance in the Pitfall score.
Further observation of the results for each variable revealed the Core Quality to be a

Page 61 of 137
significant predictor of the Pitfall scores, = .72, t(3.53) = 6.53, p < .001, demonstrating a
positive relationship between the Core Quality and Pitfall. However, the Challenge failed to
significantly predict the Pitfall scores, = -.40, t(0.27) = -1.46, p = .1448. The interaction
effect of Core Quality and Challenge was also statistically insignificant p = .7578, indicating
no moderation effect of Challenge on the Core Quality and Pitfall relationship.
Table 17: Regression table for 'exciting' brand personality
R R2 SE F df1 df2 p
.72 .52 1.11 47.21 3.00 129.00 .000
Dependent variable = Pitfall
Independent variables B SE t p
Core Quality .72 .20 3.53 .000
Challenge -.40 .27 -1.46 .144
Core Quality*Challenge -.015 .05 -.30 .757
Brand personality ‘Rugged’ - In the next step of the regression, the predictor variable of the
Rugged brand personality (Pitfall score) was entered. Overall, the model was statistically
significant, F (3, 129) = 55.31; p < .01 and explained 56.26 % of variance in the Pitfall score.
Further observation of the results for each variable for each variable revealed that for this
brand personality, Core Quality does not significantly predict the Pitfall, = .164, t(0.18) =
0.90, p = .368. However, for this brand personality, the Challenge does significantly predict
the Pitfall scores, = -.51, t(0.17) = -2.89, p < 0.05. The interaction effect of Core Quality
and Challenge was again statistically insignificant p = .9519, indicating no moderation effect
of Challenge on the Core Quality and Pitfall relationship.
Table 18: Regression table for 'rugged' brand personality
R R2 SE F df1 df2 p
.75 .56 .82 55.31 3.00 129.00 .000
Dependent variable = Pitfall
Independent variables B SE t p
Core Quality .16 .18 .90 .368
Challenge -.51 .17 -2.89 .004
Core Quality*Challenge .00 .03 .06 .951

Page 62 of 137
Brand personality ‘Competent’ - In the final step of the regression, the predictor variable of
the Competent brand personality (Pitfall score) was entered. Overall, the model was again
statistically significant, F (3, 129) = 64.07; p < .01 and explained 59.84 % of variance in the
Pitfall score. Further observation of the results for each variable for each variable revealed
that for this brand personality, Core Quality is a significant predictor of the Pitfall, = .455,
t(0.18) = 2.40, p < .05. Challenge also significantly predicts the Pitfall scores, = -.51,
t(0.20) = -2.47, p < 0.05. However, the interaction effect of Core Quality and Challenge was
again statistically insignificant p = .3682, indicating no moderation effect of Challenge on the
Core Quality and Pitfall relationship.
Table 19: Regression table for 'competent' brand personality
R R2 SE F df1 df2 p
.77 .59 .73 64.07 3.00 129.00 .000
Dependent variable = Pitfall
Independent variables B SE t p
Core Quality .45 .18 3.53 .000
Challenge -.51 .20 -2.47 .014
Core Quality*Challenge -.03 .03 -.90 .368
The results therefore revealed inconclusive and mixed evidence for all the three brand
personalities. For the Exciting brand personality, only the Core Quality seems to have a direct
effect on the Pitfall, while the Challenge does not. For the Rugged brand personality, the
results are quite the opposite - Challenge seems to have a direct effect on the Pitfall, while
the Core Quality does not. For Competent brand personality, both Core Quality and
Challenge seem to have a direct effect on the Pitfall. While for all the three brand
personalities, the Challenge does not seem to moderate the relationship between the Core
Quality and Pitfall.
Therefore, it can be concluded that none of the hypotheses have been sufficiently supported.
5.6.7 Additional analyses
In order to explore the reason behind the mixed and inconclusive results of the regression
model for the three hypotheses, additional analyses were conducted. The first logical step to
troubleshooting the apparent failure of the hypotheses was taking a step backwards and
analyzing the stimuli that had been picked for the experiment again. This was done in order
to rule out the possibility of having chosen inappropriate stimuli for the experiment.

Page 63 of 137
A manipulation check had previously been conducted to test whether a brand actually
represents its expected position on the Core Quadrant. While this initial t-test confirmed that
all brands scored sufficiently high on their expected positions in the Core Quadrant, it does
not necessarily imply that the selection of the right stimuli has been made. In order to really
establish whether a brand is a perfect representative of a particular position on the Core
Quadrant, it should satisfy two main criteria: firstly, its score on that particular position
should be the highest compared to its scores on the other positions in the quadrant; secondly,
its score on that particular position should be higher than the scores of other brands on the
same position that are in the quadrant. For instance, in order to really establish whether Red
Bull is the Core Quality brand of the Core Quadrant of the Exciting brand personality, Red
Bull’s scores on Excitement should be higher than its scores on its Pitfall (Impulsive) and
Challenge (Responsible), as well as higher than the scores of any other brand within the same
Core Quadrant (MTV, Philips, Zara). Therefore, for this purpose, there was a need to
perform a mixed-measures ANOVA.
A three-way mixed measures ANOVA with two within-subjects independent factors (Type of
brand personality - Exciting, Rugged, Competent; Mean scores on Core Quality, Pitfall, and
Challenge) and one between-subjects independent factor (Expected position of brand on the
Core Quadrant - Core Quality, Pitfall, or Challenge) was conducted to see whether there are
were any major differences between the Core Quality, Pitfall, and Challenge scores of each
of the three (Core Quality, Pitfall, or Challenge) brands in a Core Quadrant compared to the
other brands in its own Quadrant.
There was a significant main effect of type of brand personality on perceived levels of Core
Quality, Pitfall, and Challenge, F(2, 186) = 33.42, p < .01, η² = .264, indicating that the
perceived levels of Core Quality, Pitfall, and Challenge can vary depending on the type of
brand personality. Ideally across the three Core Quadrants, the brand Red Bull’s level of Core
Quality (Excitement) should not be significantly different from the brand Timberland’s level
of Core Quality (Ruggedness) and the brand BBC’s level of Core Quality (Competence) if
they all truly represent the Core Quality brands of their respective Core Quadrants. The same
would also apply for all Pitfall as well as Challenge brands. However, the significant results
for the main effect of type of brand personality on perceived levels of Core Quality, Pitfall,
and Challenge shows that this is not the case, and the type of brand personality determines
the perceived levels of Core Quality, Pitfall, and Challenge.
Page 64 of 137
There was also a significant main effect of the expected position of brand on the Core
Quadrant on perceived levels of Core Quality, Pitfall, and Challenge, F(2, 93) = 60.72, p <
.01, η² = .566, indicating that the perceived levels of Core Quality, Pitfall, and Challenge can
vary depending on whether a brand is a Core Quality, Pitfall, or Challenge brand.
However, surprisingly, it was observed that there both a significant main effect [F(2, 113.5) =
78.41, p < .01, η² = .457] of the perceived scores of Core Quality, Pitfall, and Challenge as
well as their interaction effect [F(4, 208.8) = 144.30, p < .01, η² = .756] with position of
brand on the Core Quadrant on the perceived levels of Core Quality, Pitfall, and Challenge.
This implies that overall, some scores out of the Core Quality, Pitfall, and Challenge scores
are higher than some others. Ideally, the perceived levels of Core Quality, Pitfall, and
Challenge should not have any major differences, since the Core Quality brands should score
equally as high on their Core Quality as the Pitfall brands on their Pitfall and the Challenge
brands on their Challenge. For instance, Red Bull should score equally as high on Excitement
as MTV on Impulsivity and Philips on Responsibility. Therefore, overall, the levels of
perceived scores of Core Quality, Pitfall, and Challenge should remain about the same.
However, the fact that these tests are significant implies that it is not the case.
The ANOVA plots revealed an interesting finding. The first plot for the Exciting brand
personality shows that the Core Quality brand (Red Bull) and the Challenge brand (Philips)
scored highest on their Core Quality and Challenge respectively out of all their three scores
(Core Quality, Pitfall, and Challenge). However, the line plot for the supposedly Pitfall brand
(MTV) reveals that not only does MTV not score higher on its Pitfall than its other two scores
(Core Quality and Challenge), it in fact scores highest on its Core Quality. Moreover, the fact
that MTV scores even lower on its Pitfall than the Core Quality brand (Red Bull) indicates
wrong stimuli selection to represent the Pitfall brand of the Exciting brand personality.

Page 65 of 137
Table 20: Mean Core Quality, Pitfall, and Challenge scores of the 'exciting' brands
Brands - Exciting brand
personality
Mean Core
Quality scores
Mean Pitfall
scores
Mean Challenge
scores
Core Quality brand - Red Bull 5.85 5.56 3.09
Pitfall brand - MTV 5.50 5.25 2.90
Challenge brand - Philips 3.80 2.93 4.71
Figure 8: Mean Core Quality, Pitfall, and Challenge scores of the 'exciting' brands
The second and the third plot for the Rugged and Competent brand personality also show a
similar pattern. While the Core Quality and the Challenge brands scored highest on their
Core Quality and Challenge respectively out of all their three scores (Core Quality, Pitfall,
and Challenge), the supposedly Pitfall brands (Harley Davidson and Microsoft) do not score
highest on their Pitfall but it in fact on their respective Core Qualities. Therefore, what were
supposed to represent the Pitfall brands for all the three Core Quadrants actually turned out
to be the Core Quality brands by scoring highest on their Core Qualities.
Table 21: Mean Core Quality, Pitfall, and Challenge scores of the 'rugged' brands
Brands - Rugged brand
personality
Mean Core
Quality scores
Mean Pitfall
scores
Mean Challenge
scores
Core Quality brand - Timberland 5.21 3.15 4.12
Pitfall brand - Harley Davidson 5.87 4.37 2.68
Challenge brand - Dove 2.09 1.71 6.15

Page 66 of 137
Figure 9: Mean Core Quality, Pitfall, and Challenge scores of the 'rugged' brands
Table 22: Mean Core Quality, Pitfall, and Challenge scores of the 'competent' brands
Brands - Competent brand
personality
Mean Core
Quality scores
Mean Pitfall
scores
Mean Challenge
scores
Core Quality brand - BBC 5.53 3.68 4.40
Pitfall brand - Microsoft 5.93 4.68 3.78
Challenge brand - Axe 4.03 2.03 5.68
Figure 10: Mean Core Quality, Pitfall, and Challenge scores of the 'competent' brands
Page 67 of 137
There were however some interesting differences between Exciting and the other two the
brand personalities. Independent t-tests revealed that for the Exciting the brand personality,
the Core Quality brand’s (Red Bull) score on the Core Quality (M = 5.91, SD = 0.749) was
significantly higher than the supposedly Pitfall brand - MTV (M = 5.52, SD = 0.743) t(62) =
2.067, p = 0.043. However, for the Rugged brand personality, the opposite was the case. The
Pitfall brand - Harley Davidson scored higher on the Core Quality (M = 5.82, SD = 0.838)
than even the actual Core Quality brand - Timberland (M = 5.25, SD = 1.044). This
difference was significant with t(62) = 2.421, p = 0.018. For the Competent brand personality,
the general pattern was quite the same as Rugged brand personality. The Pitfall brand
(Microsoft) scored higher on the Core Quality (M = 5.94, SD = 0.745) than even the actual
Core Quality brand - BBC (M = 5.54, SD = 0.858). However, this difference was statistically
insignificant with t(62) = 1.970, p = 0.053.
Furthermore, for the Exciting brand personality, the Pitfall brand (MTV) scored lower on its
Challenge (M = 2.94, SD = 0.849) than the Core Quality brand - Red Bull (M = 3.08, SD =
0.935). This difference was however, statistically insignificant with t(62) = 1.043, p = 0.301.
However, for the other two brand personalities (Rugged and Competent), the results were
slightly less surprising. The Pitfall brands (Harley Davidson and Microsoft respectively)
scored higher on the Pitfall than the Core Quality brands (Timberland and BBC respectively).
These differences were also statistically significant with t(62) = 4.625, p < 0.01 and t(62) =
4.472, p < 0.01 respectively for Rugged and Competent brand personalities.
Also, for the Exciting brand personality, the Pitfall brand (MTV) actually scored lower on its
Pitfall (M = 5.02, SD = 1.089) than the Core Quality brand - Red Bull (M = 5.30, SD =
1.069). This difference was however, statistically insignificant with t(62) = 0.653, p = 0.516.
However, for the other two brand personalities (Rugged and Competent), the results were
slightly less surprising. The Pitfall brands (Harley Davidson and Microsoft respectively)
scored lower on the Challenge than the Core Quality brands (Timberland and BBC
respectively). These differences were also statistically significant with t(62) = 5.623, p < 0.01
and t(62) = 2.047, p < 0.05 respectively for Rugged and Competent brand personalities.
In conclusion, all the above mentioned additional analyses and the various plots revealed that
the all the three Pitfall brands of all three brand personalities actually scored higher on their
Core Quality than on their Pitfall. This means that the manipulation checks failed for the
Pitfall brands for all three brand personalities, and the supposedly Pitfall brands were not

Page 68 of 137
perceived that way by the respondents, since brands that are supposed to represent the Pitfall
brands should score highest on their Pitfall levels. However, this is not the case. The
manipulation checks, however, succeeded for all the Core Quality and Challenge brands that
were part of the experiment, since these brands scored highest on their Core Quality and
Challenge levels respectively. The apparent failure to select the perfect representatives of the
Pitfall brands could therefore possibly explain the failure of the hypotheses of this
experiment.
Besides these analyses conducted on the actual scores of Core Quality, Pitfall, and
Challenge, it was decided to also analyze the same ANOVA patterns but this time with the
Brand Attitude scores of the respondents for each brand, to look for any other possible
explanations of the failed hypotheses. However, the results revealed an inconsistent and
chaotic pattern, since the attitude scores seemed to be quite unrelated to the position in the
Core Quadrant the brands belonged to, and rather related to the individual associations of the
various brands. For instance, Microsoft (the Pitfall brand of the Competent brand personality)
had the highest rating out of the three brands tested in its Core Quadrant, while Dove and
Philips (the Challenge brands of the Rugged and Exciting brand personalities respectively)
had the highest rating out of the three brands tested in their respective Core Quadrants.
However, perhaps one key takeaway that emerges from this analysis is that none of the
brands that were selected for this study have really low attitude scores towards the brand, not
even the Pitfall brands as would be suggested by Ofman’s model, Pitfall being the negative
too much of the Core Quality (Ofman, 2001).

Page 69 of 137
Table 23: Mean brand attitude scores of all brands shown by personality type
Brands
Mean attitude
scores - Core
Quality brands
Mean attitude
scores - Pitfall
brands
Mean attitude
scores - Challenge
brands
Exciting brand personality
brands (Red Bull, MTV,
Philips)
4.15 4.15 5.06
Rugged brand personality
brands (Timberland, Harley
Davidson, Dove)
4.43 3.84 5.31
Competent brand personality
brands (BBC, Microsoft, Axe) 4.37 5.09 4.18
Figure 11: Mean brand attitude scores of all brands shown by personality type
Page 70 of 137
5.7 Discussion
The research began with the main research question of how principles from personal and
organizational development can guide effective positioning of a brand’s personality. The
main purpose of the first study was to answer the first half of this research question by
seeking to test whether Ofman’s model of human personality could be applied to brands (and
their personalities).
Mixed results were obtained by the regression model and all the hypotheses that were
laid out were not simultaneously supported for any of the three brand personalities. For the
exciting brand personality, only a significant positive relationship between the Core Quality
and Pitfall was observed indicating support for H1, while the Challenge failed to significantly
predict the Pitfall scores as well as failed to moderate the relationship between the Core
Quality and Pitfall.
For the Rugged brand personality, only a significant negative relationship between the
Challenge and Pitfall was observed indicating support for H2, while the Core Quality failed
to significantly predict the Pitfall scores. No moderation effect of the Challenge on the
relationship between the Core Quality and Pitfall was observed.
Finally, for the Competent brand personality, both a significant positive relationship
between the Core Quality and Pitfall was observed and a significant negative relationship
between the Challenge and Pitfall was observed indicating support for both H1 and H2.
However, also for this personality trait, no moderation effect was observed for the Challenge
on the relationship between the Core Quality and Pitfall, indicating failure of H3.
In order to dig deeper into the reasons behind this apparent lack of practical support
for Ofman’s model, additional analysis using ANOVAs were conducted, These additional
analyses revealed that even though the brands scored significantly high on the levels of their
predicted positions in the Core Quadrant, they might not have been the ideal stimuli for
testing Ofman’s model on brands and their personalities for a few reasons - firstly, all three
Pitfall brands (MTV, Harley Davidson, and Microsoft) in all the Core Quadrants scored
higher on their respective Core Qualities than their Pitfalls. Secondly, the Pitfall brands
(Harley Davidson and Microsoft) of the Rugged and Competent brand personalities
respectively even scored higher on Core Quality levels than the actual Core Quality brands in
their respective Core Quadrants (Timberland and BBC). Thirdly, in the Core Quadrant of

Page 71 of 137
the Exciting brand personality, The Pitfall brand MTV even scored lower on the Pitfall than
the Core Quality brand (Red Bull).
Furthermore, an analysis of respondents’ attitude towards the brands was also done in order
to look for any possible explanations. However, this also gave scattered results. The
Challenge brands of the Exciting and Rugged brand personalities (Philips and Dove) had the
highest brand attitude scores in their respective Core Quadrants, while the Pitfall brand
(Microsoft) had the highest brand attitude scores in its Core Quadrant, demonstrating that
whether a brand which the study expected to be a Core Quality, Pitfall, or a Challenge brand
did not influence the respondents’ attitudes towards the brand. This probably implies that
perhaps their attitudes were influenced by other associations which these brands have built up
with the respondents irrespective of their perceived brand personality.
In conclusion, the results of this study therefore indicated that the respondents perceive all the
Core Quality and Challenge brands by their respective Core Quality and Challenge traits,
indicating successful identification and manipulation of the stimuli. However, this was not
the case for the Pitfall brands (MTV, Harley Davidson, and Microsoft) of all three brand
personalities (Exciting, Rugged, and Competent) respectively. These brands were not rated
with the highest scores on their Pitfall characteristics, indicating that perhaps the respective
Pitfall traits (Impulsive, Rude, and Boring respectively) of these three brands are not
perceived to be their primary personality traits by the respondents. The fact that these brands
scored higher on the Core Quality than the Pitfall indicates that perhaps the Core Quality
traits (Exciting, Rugged, and Competent) are their primary personality traits. Results were
especially surprising for the Exciting brand personality, since not only does the Pitfall brand
(MTV) not score the highest on its Pitfall, but the Core Quality brand (Red Bull) scores
higher on the Pitfall than MTV which was supposed to represent the Pitfall brand of this
quadrant. This indicates wrong stimuli selection to represent the Pitfall brand of this brand
personality. It can also perhaps be concluded that both Red Bull and MTV are likely
perceived as very similar brands in terms of their personalities, since they are both perceived
to possess high levels of excitement (Core Quality) and impulsivity (Pitfall), and a low levels
of responsibility (Challenge).
However, barring the fact that the Pitfall brands were not perceived that way by the
respondents also for the Rugged and Competent brand personalities, the results for these two
brand personalities were otherwise in line with Ofman’s model according to the ANOVA

Page 72 of 137
analysis. The Pitfall brands (Harley Davidson and Microsoft) scored higher on their Pitfall
than the Core Quality brands in their respective Core Quadrants (Timberland and BBC). This
can perhaps be explained by the fact that both these Pitfall brands scored low on their levels
of Challenge, while the Core Quality brands were perceived to possess a high element of
Challenge. This seems to support Ofman’s claim of the Challenge being “the positive quality
diametrically opposed to the Pitfall” (Ofman, 2001, p. 32), implying that the Pitfall and
Challenge cannot co-exist. Furthermore, it was observed that Harley Davidson and Microsoft
scored higher on the Core Quality than even the actual Core Quality brands in their
respective quadrants (Timberland and BBC). Even though these results seem slightly
surprising in the first glance, they can also be explained by Ofman’s theory, according to
which the Core Quality and Pitfall are “inextricably bound” and “go together like light and
darkness” (Ofman, 2001, p. 31), implying that the Core Quality does not diminish with the
possession of Pitfall.
These results are also in line with what brand positioning literature would suggest. A strike of
the right balance is needed between the key differentiating quality (PoD) - which is analogous
to the Core Quality here, and the quality without which the differentiating quality (PoD) is
irrelevant (PoP) - which is analogous to the Challenge here in order to avoid the perception of
negative associations about the brand (Correlational PoP) - which is analogous to the Pitfall
(Keller, 2013; Keller et al., 2002).
This partial support for Ofman’s and Keller’s model provided by the ANOVA results may be
capable of deepening the parallel drawn between brands and humans, with possible new
insights for brand personality literature. For instance, this might imply that a brand can avoid
being labelled as its Pitfall personality trait which originates a consequence of possessing a
high level of its Core Quality personality trait if it can communicate a sufficient level of its
Challenge personality trait. In human personality terms, the results also provide a support to
the suggestion provided by Kervyn et al. (2012) that in order to avoid an “Innuendo effect”, a
person who is communicating their personality traits to others must pay attention to the
contextually salient dimension, since when listeners hear other people’s personality
descriptions containing only positive traits, with no mention of the contextually salient
dimension, they will make negative inferences on the omitted dimension about the person
described. The “Innuendo effect” can be compared to the brand’s Pitfall perception,
originating from the communication of only its positive personality trait - its Core Quality
without the contextually salient dimension - the brand’s Challenge.

Page 73 of 137
From all the above insights, a few important findings can be highlighted. First of all, proper
stimuli for the Exciting brand personality could not be found, even after multiple elaborate
pre-tests. Secondly, and perhaps more importantly, the supposedly Pitfall brands were
actually not perceived that way by the respondents for all three brand personalities. This can
imply that there might have been an improper selection of the Pitfall brands for all three
brand personalities even after rigorous pre-tests.
However, there might be another plausible explanation for this finding. Could the fact that
none of the brands proved to be really the ‘Pitfall’ brands possibly imply that brands that can
truly be described as ‘Pitfall’ brands according to Ofman’s theory might not actually exist in
reality? Pondering over the methodology and stimuli selection of the study revealed that all
the Pitfall brands that were chosen for this study had to be well-known and successful brands
in order for respondents to be able to rate them on their personality traits. If they were to be
truly the ‘Pitfall’ brands, then they perhaps might not be as well-known and successful as
they are, since a Pitfall trait is identified by a negative connotation.
Therefore, in order to find the real reason behind the apparent failure of the quest for what
would be the true definition of Pitfall brands, this first study was followed by a second study
conducted on fictitious brands, which should remove this limitation.
Page 74 of 137
6 Study 2 - Ofman’s model as a brand personality positioning tool
Aside from the fact that the typical archetypes of the Pitfall brands were hard to find in the
first study, the other results seemed to be in line with the insights from Ofman’s model and
the Innuendo effect, as well as brand positioning literature, suggesting that there is a
possibility of brand personality literature to benefit from these principles and insights. The
purpose of this follow-up study is two-fold. Firstly, after having failed to identify what can be
considered as the typical archetypes of the Pitfall brands in the first study, this study would
establish whether Pitfall brands really exist in reality, or whether their Pitfall puts an end to
their very existence even before the brand gets famous and successful. The second purpose of
this study, and perhaps a more important one, is to provide an answer to the second half of
the problem statement of how combined principles from personal and organizational
development, as well as brand positioning literature can be used to guide effective positioning
of a firm’s intended brand personality in consumers’ minds.
The additional analyses of the first study revealed inconclusive and scattered results
for respondents’ attitudes towards the brands. This variable was, however mainly a control
variable in the previous study, since the primary goal of that study was to test and establish
the relationships between the Core Quality, Pitfall, and Challenge in order to determine
whether principles from human personality literature such as that of Ofman (2001) as well as
Kervyn et al. (2012), and brand positioning literature such as Keller et al. (2002) could be
applicable to brand personality domain. However, this follow-up study, being mainly
conducted from a brand personality positioning perspective will hold attitude towards the
brand as its central theme. The primary focus of this study is to explore what kinds of brands
(and personalities) do consumers like, and have a favorable attitude towards. Based on these
insights, it can benefit brands to strategically communicate their personalities to consumers
so that it occupies a favorable position in their minds. If a brand does indeed need to strike
the right balance between its Challenge personality trait and its Core Quality personality trait
in order to avoid being labelled as its Pitfall trait, is it possible for brands to manipulate the
communication of their personality traits in such a way in order to observe favorable
consumer attitudes towards the brand? This study will aim to explore the answer to this
question in detail.

Page 75 of 137
6.1 Conceptual framework and hypotheses
It was previously discussed in section 2.8 that brand personality has several consequences on
various dimensions, such as influencing attitude towards the brand, enhancing commitment to
the brand, stimulating positive brand image, and facilitating purchase intentions (Eisend &
Stokburger-Sauer, 2013).
One of the above mentioned consequences that this research is particularly interested in is the
consumers’ attitude towards the brand, specifically how it can be influenced by
communicating the brand’s personality. This is because awareness of this can help brands to
effectively communicate their brand personalities so as to position them in consumers’ minds
in an intended way. Consumers’ attitude towards the brand is an important construct,
especially from a managerial perspective since it often forms the basis for consumers’ choice
of the brands (Keller, 1993). Ultimately, a well-communicated brand personality to the
consumers by the firm can foster personal relevance to the consumers, enabling formation of
close relationships with the brand, and hence stimulating Brand Resonance (Keller, 2001).
Section 3.4 of the literature review on brand positioning highlighted that a brand’s
positioning strategy can be considered effective if consumers hold strong, favorable, and
unique associations about the brand in their minds (Keller, 1993, 1999). Establishing
distinguishable points of difference (PoD) from competitors can enable a brand to create such
associations (Keller et al., 2002). These insights about strength, favorability, and uniqueness
of associations from the domain of brand positioning have also been incorporated in the
domain of brand personality. One of the studies that has previously researched the impact of
brand personality in influencing consumers’ attitude towards the brand is that of Freling and
Forbes (2005), which concluded that a strong and positive brand personality leads to more
favorable, unique, strong, and congruent brand associations. This effect - which they refer to
as the “Brand Personality effect” was found to take place irrespective of the type of brand
personality, suggesting that any brand personality that is perceived as strong and favorable by
the consumers is likely to be associated with positive attitude towards the brand (Freling &
Forbes, 2005). Turning the wheel back to insights from Ofman (2001), it can be realized that
a person’s Core Quality is a strong and positive personality trait that is unique to that person.
Combining this insight with the above mentioned findings from brand positioning and brand
personality literature, the following is hypothesized:

Page 76 of 137
H1: Communication of a brand’s Core Quality trait has a positive effect on attitude towards
the brand
Like the Core Quality, Ofman (2001) describes the Challenge as a positive personality trait
of a person, and defines it as a person’s “Challenge” trait as “the positive quality
diametrically opposite to the pitfall” (Ofman, 2001, p.32). Even though this is a personality
trait that is not unique to the person, it can still be considered another positive or favorable
personality trait. Applying this insight to the findings of Freling and Forbes (2005) that have
been explained above, the following is hypothesized:
H2: Communication of a brand’s Challenge trait has a positive effect on attitude towards the
brand
Ofman (2001) describes Pitfall as the negative opposite of a person’s positive Core quality.
Although, specific literature does not exist in brand personality research about the possible
impact of a brand’s negatively perceived personality traits on consumers’ attitude towards the
brand, insights from more general branding literature highlight the potential impact of
negative information about a celebrity endorser on the brand that the celebrity endorses. Till
and Shimp (1998) found that negative information about a celebrity resulted in a decline in
attitude toward the endorsed brand. From the literature review on antecedents of brand
personality in section 2.7, it was explained that a few sources or drivers of brand personality
exist, such as user imagery associations, companies’ CEOs, endorsers, or spokespeople, or
even product-related attributes, brand logos, advertising styles, etc. (J. L. Aaker, 1997).
Therefore, celebrity endorsers can also be considered as a source of formation of a brand’s
personality.
Combining the above mentioned insights from the three domains of personal development,
branding literature, as well as brand personality literature, the following is hypothesized:
H3: Communication of a brand’s Pitfall trait has a negative effect on attitude towards the
brand

Page 77 of 137
A corporate brand personality is a form of brand personality that is explained as “the human
characteristics or traits of the employees of the corporation as a whole” (Keller & Richey,
2006, p. 74). According to Keller and Richey (2006), a corporate brand personality consists
of three key personality dimensions, each with two traits or sub-dimensions, namely the
‘heart’ (passionate and compassionate), the ‘mind’(creative and disciplined) and the ‘body’
(agile and collaborative), each of which has a multiplicative or interactive effect on each
other, thereby creating valuable synergistic effects. Ofman (2001) describes both Core
Quality and Challenge as positive human personality traits, while Freling and Forbes (2005)
described the “Brand Personality effect”, suggesting that any brand personality that is
perceived as strong and favorable by the consumers is likely to be associated with positive
attitude towards the brand. If these three insights are combined, it appears as though the Core
Quality and Challenge traits could perhaps synergistically increase the influence of the so-
called “Brand Personality effect”. Therefore, the following can be hypothesized:
H4: The positive effect of Core Quality on attitude towards the brand is strengthened by the
presence of Challenge
As discussed above, the Pitfall is hypothesized to have a negative influence on the attitude
towards the brand, while the Challenge is hypothesized to have a positive influence on the
attitude towards the brand. Therefore, collectively, if the Challenge is communicated along
with the Pitfall, its influence due to the “Brand Personality effect” could add certain strong
and favorable associations for the consumers, thereby increasing the likelihood of a positive
attitude towards the brand (Freling & Forbes, 2005). Therefore, the following is
hypothesized:
H5: The negative effect of Pitfall on attitude towards the brand is weakened by the presence
of Challenge

Page 78 of 137
In order to explain the above hypotheses, the following conceptual model has been
developed:
In this model, the Core Quality, Pitfall, and Challenge are the three independent variables,
while the Attitude towards the brand is the main dependent variable.
H1 Core Quality PF
CH
Challenge
Pitfall
Brand Attitude
H2
H3
H4
H5
Figure 12: Study 2: Conceptual framework

Page 79 of 137
6.2 Methodology
The results of study 1 led to the possible explanation that perhaps the respondents’ prior
associations with the brands might have inhibited their perception of the brands’ personality
traits, especially their Pitfalls. Therefore, it was decided to use fictitious brands for this study,
which would provide a strict control for all prior associations that the respondents might have
had with the real and well-known brands that were used as stimuli in the first study, leading
to more rigorous and credible results. For carrying out this study, it was decided to use two
fictitious brands, where each was demonstrated as possessing a brand personality, and all
three aspects (Core Quality, Pitfall, and Challenge) and their various combinations were
communicated in the form of communication messages for each brand to measure
respondents’ attitude towards the brand for each scenario. This was done in order to evaluate
under which scenario the respondents would demonstrate the most favorable as well as the
least favorable attitudes towards the brand. The detailed set-up of this study is explained in
the following paragraphs.
6.2.1 Choice of brand personalities
The first step in setting up this experiment was to decide which two brand personalities
would be the most suitable to represent the personalities of the two fictitious brands. The
most obvious choice at this point was to select the brand personalities that had been
employed in the preceding study. Previously, relatively consistent results were observed for
Rugged and Competent brand personalities, while Exciting brand personality had resulted in
somewhat scattered results (although that could have been because of the wrong stimuli
selection for the Pitfall brand MTV, which demonstrated less Pitfall elements than even the
Core Quality brand Red Bull). Moreover, the patterns for the Rugged and Competent brand
personalities were very similar with respect to the perception of their respective levels of
Core Quality, Pitfall, and Challenge.
With this in mind, it was initially decided to choose Rugged and Competent brand
personalities as part of the second study to represent the two fictitious brands. The next step
was to then assign a suitable product category to each of these personalities. Since the
personality of a fictitious brand had to be communicated in this study, assigning a product
category to each of the two brands would facilitate the communication of the message with
the brand’s personality traits. Due to lack of time to carry out an elaborate quantitative pre-
test at this stage of the study, this was done based on brief qualitative interviews, asking a
few respondents the category which they would typically see as representing each of these

Page 80 of 137
personalities. The results revealed product categories of ‘tires’ and ‘outdoor apparel and
footwear’ for the personality Rugged, and the product category of ‘news channels’ and
‘broadcasting stations’ for the personality Competent.
However, since building and communicating the personality of a brand should transcend
the (type of) products, and instead should be about who the brand really is, tires could not be
a very suitable choice since not only are they a very functional product, but could also
possibly be less interesting, and their personality more difficult for the survey respondents to
grasp. Moreover, since all three aspects (Core Quality, Pitfall, and Challenge) and their
various combinations had to be communicated, it would be hard to demonstrate the
Challenge - ‘Kindness’ with such a personality, particularly since Kindness and Ruggedness
are usually perceived as highly mutually exclusive and conflicting personality traits, even
more so than some other Core Quality - Challenge combinations such as Exciting -
Responsible, or Competent - Enthusiastic, etc.
Furthermore, it was decided that the communication of messages about the brands’
personality to the respondents in the online survey would be done in the form of a few lines
of text, since reading the texts would take the least time for the respondents to answer the
survey questions. Moreover, using a few lines of text, only the key personality traits of the
brand can be highlighted without any additional distractions and possibility for respondents to
relate any associations other than the apparent personality traits of the brands. Therefore,
such communication of the personality of the fictitious brands in the form of short lines of
text would make it even more difficult to properly convey personality traits such as
Ruggedness and Kindness for which more explanations are needed to paint a true picture in
respondents’ minds. The same logic also applies to the Competent brand personality, which
using a product category of ‘News channels’ and ‘broadcasting stations’ would make it hard
to demonstrate the Pitfall of being ‘boring’ due to lack of elaborate means to properly
communicate the brand personality in an online survey form.
Therefore, due to these limitations, it was decided to choose two different brand
personalities to represent the dominant traits of the fictitious brands to be used in this study
that would satisfy mainly two criteria. Firstly, all the three personality characteristics
belonging to that specific personality (Core Quality, Pitfall, and Challenge) and the
combinations thereof should be both easy to communicate in the form of brief pieces of text
in the online survey as well as easy for the audience to grasp the brand personality from these

Page 81 of 137
texts. Secondly, staying true to the idea of brand personality, the personality traits should be
such that communicating them should not be dependent on the product that the brand would
be described as delivering, but rather the personality characteristics that the brand would be
seen as possessing.
Based on the above-mentioned two criteria, a few brand personalities were given
consideration, namely Exciting, Sophisticated, Sincere, and Confident. However, it was
realized that not only the personalities Confident and Exciting seemed relatively easier to
form a Core Quadrant, with all three traits - Core Quality, Pitfall, and Challenge coming to
mind easily, but both these personalities could also be easier for the respondents to relate to
in their personal lives, thus making the experiment more interesting and relatable. Even
though the personality Exciting had led to less than ideal and expected results in the first
study, this was most likely due to the selection of the improper stimuli for the Core Quality
(Red Bull) and Pitfall (MTV) brands rather than any limitation due to the personality trait
itself. Hence, these personality traits (Confident and Exciting) were finalized and selected to
be used for the actual experiment.
6.2.2 Choice of product categories
Once again, brief qualitative pre-tests like the first one revealed that some respondents
consider product categories like ‘deodorants’ or ‘toothpaste’ as suitable for Confident brand
personality, while ‘cars’ and ‘beer’ were considered more relevant for Exciting brand
personality. Considering the broad reach and usage of both toothpaste and beer products and
their respective categories, these two were selected for the final experiment to represent
Confident and Exciting brand personalities respectively and the product categories of
deodorants and cars were discarded.
It was decided to slightly modify the product category of the toothpaste brand to
“whitening” toothpaste and the product category of the beer brand to “lager” beer. The
choice of these specific product categories was made in order to facilitate the communication
messages of the brand personalities Confidence and Excitement, since the consequence of
having white teeth could demonstrate a brand’s typical user as more confident while the
consequence of drinking a lager beer could demonstrate a brand’s typical user as more
exciting. The inclusion of the consequences on the brand’s typical user was important, since
prior brand personality research suggests that a brand’s personality can also be formed by the
brand’s typical users (J. L. Aaker, 1997).

Page 82 of 137
6.2.3 Choice of brand names and pictures
It was decided to name the fictitious toothpaste brand as “Crystal White” and the beer brand
as “Carlisle”, after considering various options such as “Magic White” and “White shine” for
the toothpaste brand, and “Carlington”, “Sterling”, and “Milner” for the beer brand. The
names that were finally chosen for the toothpaste and beer brands (“Crystal White” and
“Carlisle” respectively) were due to their likely ability to trigger their respective product
categories easily, as well as the fact that some of the other brand names that were being
considered turned out to already be names of other real brands.
Furthermore, in addition to simply creating descriptive texts to communicate Core
Quality, Pitfall, and Challenge of the brand’s personality, it was decided to incorporate
pictures to represent these personality traits. The pictures would demonstrate the typical users
of the brands, since it has been proposed that typical users and people around the brand can
strengthen the brand’s personality and act as key drivers or antecedents of its personality (J.
L. Aaker, 1997). Moreover, images of the products (toothpaste and beer) were also used
along with the image of typical users. A search on the internet for images resulted in some
images which were rejected due to their lack of appropriateness, while some which were
retained due to their seemingly effortless ability to communicate the personality trait which
was to be communicated by the texts. For the various combinations of texts and images of
typical users and products see appendix 6 and appendix 7.
6.2.4 Final experiment design
Finally, the experiment was a 2 X 2 X 2 X 2 experimental set-up, with 2 distinct brand
personalities - Confidence and Excitement; and the other eight combinations representing the
presence or absence of Core Quality, Pitfall, and Challenge. This would ensure that all
possible combinations could be made with these three variables and the attitudes of the
respondents could be measured for each scenario, in order to ultimately determine the best
and the worst possible scenario for a brand to position its personality.
Based on the length of the questionnaire - which was decided to be kept around 5 minutes in
order to keep the respondents from getting fatigued and thereby sacrificing the quality of the
results, it was decided that each respondent can rate up to a maximum of four scenarios.
Within each questionnaire, the variables that were decided to be manipulated were the actual
brand personality - Excitement and Confidence, and the presence or absence of Core Quality.
The between -subjects variables were the presence or absence of Pitfall and the Challenge.
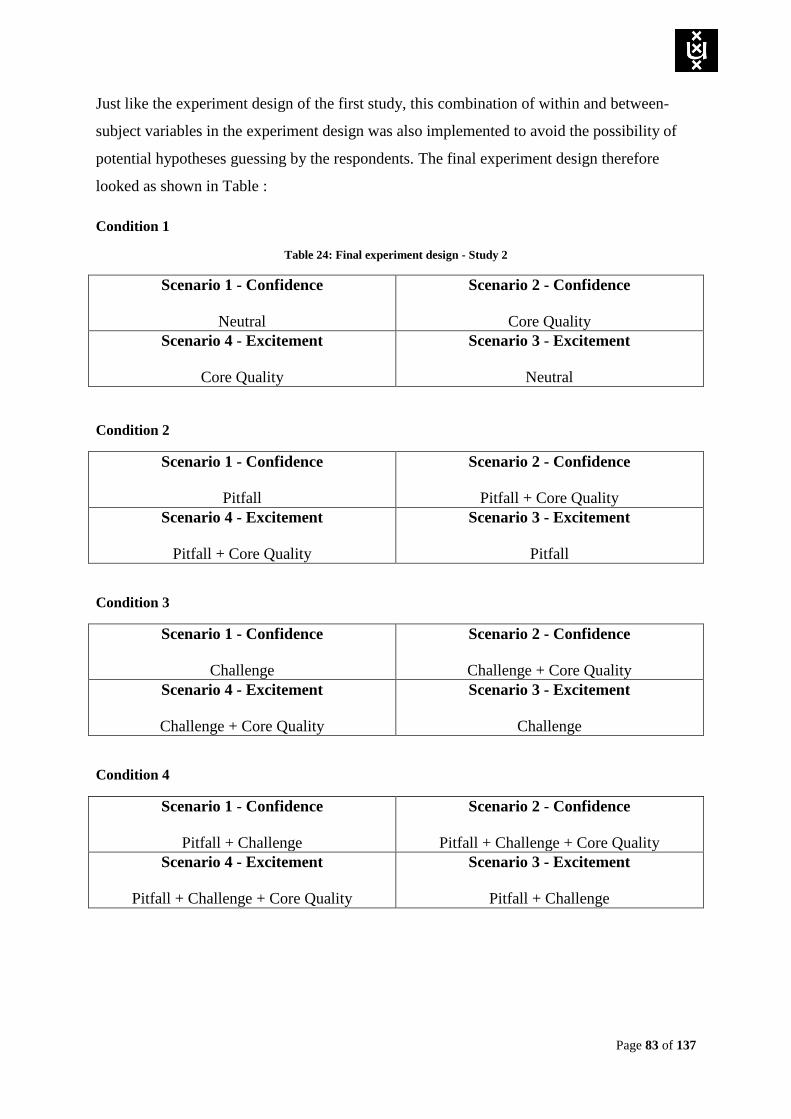
Page 83 of 137
Just like the experiment design of the first study, this combination of within and between-
subject variables in the experiment design was also implemented to avoid the possibility of
potential hypotheses guessing by the respondents. The final experiment design therefore
looked as shown in Table :
Condition 1
Table 24: Final experiment design - Study 2
Scenario 1 - Confidence
Neutral
Scenario 2 - Confidence
Core Quality
Scenario 4 - Excitement
Core Quality
Scenario 3 - Excitement
Neutral
Condition 2
Scenario 1 - Confidence
Pitfall
Scenario 2 - Confidence
Pitfall + Core Quality
Scenario 4 - Excitement
Pitfall + Core Quality
Scenario 3 - Excitement
Pitfall
Condition 3
Scenario 1 - Confidence
Challenge
Scenario 2 - Confidence
Challenge + Core Quality
Scenario 4 - Excitement
Challenge + Core Quality
Scenario 3 - Excitement
Challenge
Condition 4
Scenario 1 - Confidence
Pitfall + Challenge
Scenario 2 - Confidence
Pitfall + Challenge + Core Quality
Scenario 4 - Excitement
Pitfall + Challenge + Core Quality
Scenario 3 - Excitement
Pitfall + Challenge

Page 84 of 137
Each of these four conditions and each of their representative scenarios would independently
measure the attitude towards the brand (which is the main dependent variable in the
conceptual model) based on the manner in which the brand presents its personality in the
form of a communication message.
It was also decided that within each condition, a respondent would be alternatively presented
with the scenarios about the same brand personality so as to reset the respondents’ memories
briefly by keeping them involved with different scenarios involving two different personality
traits. Therefore, it was decided to implement the order of the scenarios to 1, 3, 2, and 4
instead of presenting the scenarios order-wise one after the other from 1 to 4.
6.2.5 Choice of communication texts and images
Following this set-up, communication texts and their respective chosen images were first
created that would convey typical Core Quality, Pitfall, and Challenge traits of each
personality. These were then pre-tested qualitatively by asking a few respondents whether a
particular piece of text and its associated image conveys the personality trait that it was
intended to convey. Questions were asked such as:
“Do you think this combination of text and image communicates
Confidence/Arrogance/Modesty?”
“Do you think this combination of text and image communicates
Exciting/careless/responsible behavior?”
Then, in order to make various possible combinations of Core Quality, Pitfall, and
Challenge, the texts and images were simply followed by the previous text so as to avoid the
potential risk of not knowing which scenario actually drives the attitude change of the
respondents. For instance, if a Pitfall + Challenge scenario had to be created, then the Pitfall
text and image was simply followed by the Challenge text and image of the brand. However,
only in case of the scenarios with the presence of Core Quality, the Core Quality text and
image dominated and preceded any other text and image. This was done based on the
reasoning from Ofman’s theory that the Core Quality is the primary, and hence the dominant
personality trait that differentiates a person (Ofman, 2001). For the various combinations of
texts and images see appendix 7.
Furthermore, the two brands were evaluated on all three dimensions - their levels of Core
Quality, Pitfall, and Challenge - each measured with three items. For the brand personality
Excitement, all the items except the ones measuring Pitfall were retained from the previous

Page 85 of 137
study. The Pitfall items were changed since reliability analysis in Study 1 showed low
Cronbach alpha ratings for the term Undependable. Therefore the item ‘Reckless’ replaced
this item, and the three new items measuring the Pitfall of Excitement were - Careless,
Reckless, and Impulsive.
The personality scale of Confidence was selected based on Cattell and Mead (2008) 16
personality factor of Social boldness (H) while its traits were based on more general synonym
descriptors of the English language - e.g. Confident - Self-assured - Self-reliant; Arrogant -
Pretentious - Cocky; Modest - Humble - Down-to-earth
6.2.6 Experiment procedure
The experiment was created and distributed in the form of an online questionnaire via the
Qualtrics survey platform. The four different versions (conditions) of the questionnaire
(Appendix 7), each with two separate brands and four scenarios were created in the form of
blocks in the same questionnaire link, and assigned to be distributed randomly to the
participants. As explained above, in order to prevent the same brand being presented one after
the other, the order of the scenarios was changed to represent the two brands alternatively,
once without, and once with the Core Quality. It was decided that there needed to be a
minimum number of responses of 25 for each condition in order to draw conclusive results.
The survey and the randomized blocks were conditioned so as to generate approximately
even number of respondents randomly per condition. The experiment was designed to last
approximately 5 minutes. The questions consisted of asking the respondents to rate three
items for attitude towards the brand - liking, favorable attitude, and appeal. Furthermore,
some control variables were also measured such as attitude towards the brand’s
communication message and purchase intention based on the communication message. The
primary motive of these control variables was to be able to carry out some additional analyses
if needed at later stages to evaluate other behavior related actions towards the brands by the
respondents. These control variables were each measured with one item. All variables were
measured on a 7-point Likert scale of Strongly Disagree - Strongly Agree. Finally, some
other control variables were measured such as product-category involvement of the
respondents with the brands’ presented category, perceived message realism, and brand name
appropriateness. These were again measured in case at later stages some additional analyses
would be required to explain findings which would otherwise be inexplicable. The
Page 86 of 137
questionnaire also incorporated the usual demographic questions, measuring age, gender, and
nationality of the respondents.
Finally, in order to be able to do manipulation checks to evaluate whether people perceive the
personality of the brand the way it was intended to be, the respondents were also asked to
evaluate the given brand on three items each for its personality components (Core Quality,
Pitfall, and Challenge). All these items were also measured on a 7-point Likert scale of
Strongly Disagree - Strongly Agree.
6.3 Results
The results of the experiment were analyzed in IBM SPSS V.20. The data collection was
ended after reaching 103 total respondents and approximately 25 for each condition.
In order to prepare the raw data for analyses, the dataset was sorted so that the responses
appear neatly as separate blocks of data. A frequency check was then conducted to check for
any errors or missing values in the data. Based on this check, no missing values were found.
Hence, the final sample size (N) was 103. After this initial data cleaning process, the sample
(N) was 26 each for Version 3 and 4 (Challenge, and Pitfall+Challenge), and 24 and 27 for
Neutral and Pitfall condition respectively.
A new variable called “Questionnaire_version” was created, and labelled with values from 1
to 4, which symbolizes the between subjects variable - the version of questionnaire the
respondents answered (i.e. whether a brand was evaluated on its Core Quality, Pitfall,
Challenge, and Pitfall+Challenge personality traits. The variables were also renamed to
match the items being measured.
For the data analysis, three dummy variables - representing the presence or absence of Core
Quality, Pitfall, and Challenge were created for each condition and were labelled as 0 or 1
depending on whether the respective elements were absent or present in the scenario that was
responded to.
6.3.1 Factor analysis
The first step in the data analysis process was to determine the belongingness of the 9 items
(3 items each for Core Quality, Pitfall, and Challenge) for each brand personality with each
other, to determine which items load together and seem to measure the same construct. The
factor analysis was conducted twice for the two different brand personalities - (Confidence

Page 87 of 137
and Excitement). Principal components analysis with Varimax rotation of the 9 items for the
brand personalities Confidence led to the following result:
Table 25: Rotated component table and factor loadings - ‘Confidence’ brand personality
Item Component 1 Component 2 Component 3
Pretentious .901
Arrogant .899
Cocky .897 -.305
Modest .922
Humble .893
Down-to-earth -.332 .851
Self-assured .922
Confident .897
Self-reliant .889 Extraction method: Principal component analysis
Rotation method: Varimax with Kaiser normalization
Three separate components with eigen values greater than 1 were observed. The first
component consisted of three items for Pitfall that loaded together, the second component
consisted of three items measuring Challenge, while the third consisted of the three Core
Quality items. The fact that one of the Challenge and Pitfall items loaded with the Pitfall and
Challenge components respectively with a negative sign can possibly imply that they are seen
by the respondents as the polar opposites.
Principal components analysis with Varimax rotation of the 9 items for the brand
personalities Excitement led to the following result:
Table 26: Rotated component table and factor loadings - ‘Excitement’ brand personality
Item Component 1 Component 2
Daring .885
Exciting .858
Active .836
Reckless .826 -.358
Impulsive .810 -.353
Careless .778 -.356
Sensible .933
Level-Headed .884
Responsible .877 Extraction method: Principal component analysis
Rotation method: Varimax with Kaiser normalization

Page 88 of 137
Two separate components with eigen values greater than 1 were observed. The first
component consisted of all three items for Pitfall that loaded together with the three items for
Core Quality; the second component consisted of three items measuring Challenge.
After being forced to extract three components, the following output was observed:
Table 27: Rotated component table and factor loadings - ‘Excitement’ brand personality
Item Component 1 Component 2 Component 3
Careless .907
Reckless .888 .326
Impulsive .836 .350
Active .928
Exciting .894
Daring .420 .810
Sensible .936
Level-Headed .902
Responsible .885 Extraction method: Principal component analysis
Rotation method: Varimax with Kaiser normalization
The first component consisted of the three Pitfall items that loaded together with one Core
Quality item, albeit with a low correlation score. The second component consisted of the
three Core Quality items that loaded together with two Pitfall items, albeit with a low
correlation score. The third component consisted of the three Challenge items that loaded
together.
6.3.2 Reliability analysis
The next step in performing the tests towards the conceptual model was to ascertain whether
all three items that were intended to measure attitude towards the brand in the experiment
were sufficiently correlated. For this purpose, two separate reliability analyses were carried
out for the two brands. In each case, the three items measuring attitude towards the brand -
Brand Liking, Favorable brand attitude, and Brand appeal were tested for reliability.
All items were sufficiently correlated for both brands, with Cronbach alpha scores > .70
(Table 28).

Page 89 of 137
Table 28: Reliability analyses - Brand attitude
Brand (items) Cronbach's alpha
Crystal White (Brand liking, favorable attitude, appeal) 0.983
Carlisle (Brand liking, favorable attitude, appeal) 0.980
The next step was to ascertain whether all three items that were intended to measure all three
constructs - Core Quality, Pitfall, and Challenge were sufficiently correlated. For this
purpose, three reliability analyses were carried out for the two brands. In each case, the three
items measuring Core Quality, Pitfall, and Challenge were tested for reliability.
All items were sufficiently correlated for both brands and all three constructs - Core Quality,
Pitfall, and Challenge, with Cronbach alpha scores > .70 (Table 29 and 30).
Table 29: Reliability analyses - Core Quality, Pitfall, and Challenge items (Confidence brand personality)
Brand personality - Confidence
Variable
(items)
Cronbach's alpha
Core Quality (Confident, Self-assured, Self-reliant) .888
Pitfall (Arrogant, pretentious, cocky) .940
Challenge (Modest, humble, down-to-earth) .928
Table 30: Reliability analyses - Core Quality, Pitfall, and Challenge items (Excitement brand personality)
Brand personality - Excitement
Variable
(items)
Cronbach's alpha
Core Quality (Exciting, active, daring) .921
Pitfall (Impulsive, careless, reckless) .944
Challenge (Responsible, sensible, level-headed) .910
6.3.3 Dimension reduction - Computing scale means
Following the reliability analysis, scale means were created for the 3 constructs (Core
Quality, Pitfall, and Challenge) as well as for the brand attitude scores for both the brand
personalities. These scale means were created twice for each construct, once for scenario
without the presence of the Core Quality, and once with the presence of the Core Quality.

Page 90 of 137
Tables 31 and 32 demonstrate the mean scores of Core Quality, Pitfall, and Challenge traits
of each personality (Confidence and Excitement respectively), both prior to, and after the
addition of the Core Quality to the brand’s communication messages.
Table 31: Mean scores of Core Quality, Pitfall, and Challenge - Confident brand personality
Brand
attitude
Core
Quality Pitfall Challenge
Mean scores prior to Core Quality 4.21 4.30 4.02 3.69
Mean scores after the addition of Core
Quality 4.46 5.27 4.31 3.58
Table 32: Mean scores of Core Quality, Pitfall, and Challenge - Excitement brand personality
Brand
attitude
Core
Quality Pitfall Challenge
Mean scores prior to Core Quality 4.20 4.31 4.25 3.74
Mean scores after the addition of Core
Quality 4.83 5.56 4.76 3.66
-
6.3.4 Manipulation check
The main purpose at this stage of the data analysis of a manipulation check was to confirm
whether each of the three scenarios - Core Quality, Pitfall, and Challenge have been
individually perceived by the respondents as they were intended. This was done by
conducting a one sample t-test against a value of 4 (mid-point in the Likert scale) for the
Core Quality, Pitfall, and Challenge scenarios for each brand personality. This was done in
order to ensure that a scenario that was chosen to represent either a Core Quality, Pitfall, or
Challenge manages to score at least sufficiently high on that construct. An overall average
score significantly higher than 4 would suggest that the scenario can be considered a suitable
representative of that particular scenario type in the questionnaire.
Tables 33, 34, and 35 show the t-value and significance of the brands for their own expected
scenario type. All three scenarios (Core Quality, Pitfall, and Challenge) for both brand
personalities scored significantly higher than 4 on their expected value (p < 0.05). The results
have been described in tables 33, 34, and 35.

Page 91 of 137
Table 33: One sample t-test against 4 on Core Quality
Scenario type = Core
Quality
Mean rating on
Core Quality SD
t-value against 4 on
Core Quality df
Sig. (1-
tailed)
Brand personality -
Confidence 5.51 1.51 4.89 24 0.000
Brand personality -
Excitement 5.58 1.54 5.00 24 0.000
Table 34: One sample t-test against 4 on Pitfall
Scenario type = Pitfall Mean rating on
Pitfall SD
t-value against 4 on
Pitfall df
Sig. (1-
tailed)
Brand personality -
Confidence 5.12 1.43 4.05 27 0.000
Brand personality -
Excitement 5.62 1.09 7.73 27 0.000
Table 35: One sample t-test against 4 on Challenge
Scenario type =
Challenge
Mean rating on
Challenge SD
t-value against 4 on
Challenge df
Sig. (1-
tailed)
Brand personality -
Confidence 5.25 1.43 4.47 26 0.000
Brand personality -
Excitement 4.89 1.53 2.98 26 0.000
The results above demonstrate that the scenarios that were intended to represent the Core
Quality, Pitfall, and Challenge scenarios were indeed perceived that way by the respondents
for both brand personalities.
While this initial t-test confirmed that all scenarios scored sufficiently high on their expected
values, it does not yet necessarily imply that these scenarios can be selected to represent these
conditions (Core Quality, Pitfall, and Challenge) for further analyses. The results of the first
study demonstrated that even though the Pitfall brands scored significantly higher than 4 on

Page 92 of 137
their respective positions in the quadrant, additional analyses in ANOVA plots revealed that
these brands were not perceived that way by the respondents.
Therefore, in order to really establish whether a scenario is a perfect representative of a
particular construct, it should satisfy two main criteria: firstly, its score on that particular
condition should be the highest compared to its own scores on the other two conditions;
secondly, its score on that particular condition should be higher than the scores of other
scenarios on the same condition. For instance, in order to really establish whether the Core
Quality scenario is indeed a Core Quality scenario, first of all, it should score the highest on
its Core Quality scores out of all three of its scores for Core Quality, Pitfall, and Challenge.
Secondly, the other two conditions’ (Pitfall, and Challenge) scores on Core Quality should be
less than the scores of the Core Quality scenario on the Core Quality condition.
A three-way mixed measures ANOVA with two within-subjects independent factors (Type of
brand personality - Confident or Exciting; Mean scores on Core Quality, Pitfall, and
Challenge and one between-subjects independent factor (Questionnaire version answered by
the respondent) was conducted to see whether there are were any major differences between
the Core Quality, Pitfall, and Challenge scores of each of the three conditions (Core Quality,
Pitfall, or Challenge) compared to the other conditions.
There was a significant main effect of the Scenario type on perceived levels of Core Quality,
Pitfall, and Challenge, F(2, 74) = 3.46, p < .05, η² = .086, indicating that the perceived levels
of Core Quality, Pitfall, and Challenge can vary depending on whether a Core Quality,
Pitfall, or Challenge scenario is being presented to the respondent.
There was both a significant main effect [F(2, 148) = 17.37, p < .01, η² = .190] of the
perceived scores of Core Quality, Pitfall, and Challenge as well as their interaction effect
[F(4, 148) = 35.11, p < .01, η² = .487] with the type of scenario on the perceived levels of
Core Quality, Pitfall, and Challenge. This implies that overall, some scores out of the Core
Quality, Pitfall, and Challenge scores are higher than some others. Ideally, the perceived
levels of Core Quality, Pitfall, and Challenge should not have any major differences, since
the Core Quality scenario should score equally as high on the Core Quality as the Pitfall
scenario on its Pitfall and the Challenge scenario on its Challenge. Therefore, overall, the
levels of perceived scores of Core Quality, Pitfall, and Challenge should remain about the
same. However, the fact that these tests are significant implies that it is not the case.

Page 93 of 137
The following tables indicate the mean scores of the Core Quality, Pitfall, and Challenge
scenarios on their perceived levels of Core Quality, Pitfall, and Challenge. It can be observed
that the manipulations were carried out successfully for both brand personalities, since the
Core Quality scenarios scored the highest on its Core Quality than its other scores, as well as
neither the Pitfall nor the Challenge scenario scored higher on their perceived levels of Core
Quality than the Core Quality scenario for both brand personalities. The same was true for
the Pitfall and Challenge scenarios as well. This can also be seen in the graphs shown below.
Table 36: Mean scores of Core Quality, Pitfall, and Challenge scenarios on Core Quality, Pitfall, and Challenge -
Confidence brand personality
Scenario Mean Core Quality
Scores Mean Pitfall scores Mean Challenge scores
Core Quality 5.51 3.40 3.30
Pitfall 4.53 5.12 2.50
Challenge 4.32 2.56 5.25
Figure 13: Mean scores of Core Quality, Pitfall, and Challenge scenarios on Core Quality, Pitfall, and Challenge -
Confidence brand personality

Page 94 of 137
Table 37: Mean scores of Core Quality, Pitfall, and Challenge scenarios on Core Quality, Pitfall, and Challenge -
Excitement brand personality
Scenario Mean Core Quality
Scores Mean Pitfall scores Mean Challenge scores
Core Quality 5.58 4.11 3.25
Pitfall 5.23 5.63 2.65
Challenge 3.48 2.48 4.89
Figure 14: Mean scores of Core Quality, Pitfall, and Challenge scenarios on Core Quality, Pitfall, and Challenge -
Confidence brand personality
6.3.5 Hypotheses testing
In order to test the hypotheses, a four-way mixed measures ANOVA with two within-subject
independent factors (Type of brand personality: Confidence or Excitement; Absence or
presence of Core Quality) and two between-subjects independent factors (Absence or
presence of Pitfall; absence or presence of Challenge) was conducted. The main dependent
variable in this analysis was the respondents’ scores on their attitude towards the brand; this
is also the main dependent variable in the conceptual model. The main purpose of this
analysis was to see whether there are were any major differences between Brand attitude
scores each of the three conditions (Core Quality, Pitfall, or Challenge) and their various
combinations.
Table 38 displays all within- and between-subjects variables, and their various interactions.

Page 95 of 137
Table 38: All within- and between-subjects variables, and their various interactions
Variable df SE F p η²
Core Quality 1 99 17.05 .000 .147
Pitfall 1 99 5.39 .022 .052
Challenge 1 99 2.59 .111 .026
Brand Personality 1 99 1.32 .252 .013
Core Quality*Challenge 1 99 2.44 .121 .024
Core Quality*Pitfall 1 99 2.005 .160 .020
Core Quality*Pitfall*Challenge 1 99 2.00 .160 .020
Challenge*Pitfall 1 99 2.91 .091 .029
Brand Personality*Core Quality 1 99 7.68 .007 .072
Brand Personality*Pitfall 1 99 8.23 .005 .077
Brand Personality*Challenge 1 99 .66 .417 .007
Brand Personality*Core Quality* Pitfall 1 99 4.86 .030 .047
Brand Personality*Core Quality*Challenge 1 99 .77 .381 .008
Brand Personality*Pitfall*Challenge 1 99 .33 .562 .003
Brand Personality*Core Quality* Pitfall*Challenge 1 99 .24 .624 .002
Dependent variable: Brand attitude
Table 38 shows that there is a significant main effect of Core Quality and Pitfall on the
attitude towards the brand, as well as a significant interaction effect of Brand personality with
the Core Quality, significant interaction effect of Brand personality with the Pitfall, and a
significant interaction effect of Brand personality with both Core Quality and Pitfall. These
results are explained in the subsequent paragraphs in more detail.
Tables 39 and 40 indicate the mean scores on brand attitude for each scenario for both the
brand personalities:
Table 39: Mean Scores on Brand attitude - Confidence brand personality
No Challenge Challenge
No Core Quality No Pitfall 4.09 5.29
No Core Quality Pitfall 3.72 3.73
Core Quality No Pitfall 4.58 5.32
Core Quality Pitfall 3.97 4.00

Page 96 of 137
Table 40: Mean Scores on Brand attitude - Exciting brand personality
No Challenge Challenge
No Core Quality No Pitfall 3.59 4.56
No Core Quality Pitfall 4.30 4.29
Core Quality No Pitfall 4.98 5.10
Core Quality Pitfall 4.69 4.59
Hypothesis 1 - main effect of Core Quality on Brand attitude
Table 38 shows that there is an overall significant main effect of Core Quality on attitude
towards the brand F(1, 99) = 17.05, p < .005, η² = .147, indicating that the difference in
perceived levels of Core Quality leads to a significant change in attitude towards the brand.
Looking at the plots in the ANOVA for both brand personalities, a direct positive effect of
the addition of Core Quality can be observed in all scenarios, since all the lines slope
upwards when the Core Quality is present than when it is absent. This indicates an increase in
attitude towards the brand when the Core Quality is communicated than when it is not
communicated. Therefore, since overall, Core Quality appears to have a significant positive
effect on the brand attitude scores, hypothesis 1 is accepted.
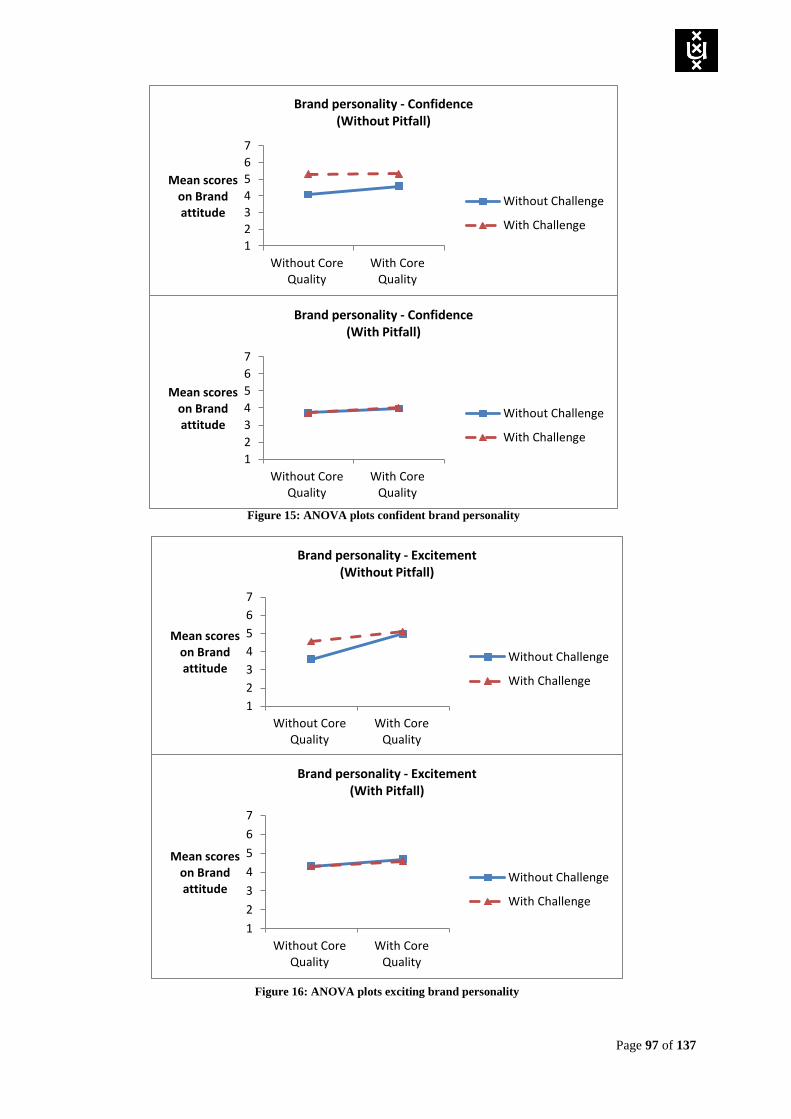
Page 97 of 137
1
2
3
4
5
6
7
Without CoreQuality
With CoreQuality
Mean scores on Brand attitude
Brand personality - Confidence (Without Pitfall)
Without Challenge
With Challenge
1
2
3
4
5
6
7
Without CoreQuality
With CoreQuality
Mean scores on Brand attitude
Brand personality - Confidence (With Pitfall)
Without Challenge
With Challenge
1
2
3
4
5
6
7
Without CoreQuality
With CoreQuality
Mean scores on Brand attitude
Brand personality - Excitement (Without Pitfall)
Without Challenge
With Challenge
1
2
3
4
5
6
7
Without CoreQuality
With CoreQuality
Mean scores on Brand attitude
Brand personality - Excitement (With Pitfall)
Without Challenge
With Challenge
Figure 15: ANOVA plots confident brand personality
Figure 16: ANOVA plots exciting brand personality

Page 98 of 137
Hypothesis 2 - main effect of Challenge on Brand attitude
Table 38 shows that there is no significant main effect of Challenge on attitude towards the
brand F(1, 99) = 2.59, p = .111, η² = .026, indicating that overall, the difference in perceived
levels of Challenge does not lead to a significant change in attitude towards the brand.
However, looking at the plots in the ANOVA for both brand personalities, a direct positive
effect of the addition of Challenge is observed, but only in plots without the Pitfall for both
brand personalities, since the dashed line (scenario when Challenge is communicated) is
higher than the solid line (scenario when Challenge is not communicated), indicating an
increase in attitude towards the brand when the Challenge is present than when it is absent.
This effect is however extremely small and almost negligible in the scenarios when the Pitfall
has previously been communicated to the respondents for both brand personalities. Perhaps
due to this reason, the overall main effect of the Challenge on the brand attitude scores is not
significant, and therefore, hypothesis 2 has to be rejected.

Page 99 of 137
1
2
3
4
5
6
7
Without CoreQuality
With CoreQuality
Mean scores on Brand attitude
Brand personality - Confidence (Without Pitfall)
Without Challenge
With Challenge
1
2
3
4
5
6
7
Without CoreQuality
With CoreQuality
Mean scores on Brand attitude
Brand personality - Confidence (With Pitfall)
Without Challenge
With Challenge
1
2
3
4
5
6
7
Without CoreQuality
With CoreQuality
Mean scores on Brand attitude
Brand personality - Excitement (Without Pitfall)
Without Challenge
With Challenge
1
2
3
4
5
6
7
Without CoreQuality
With CoreQuality
Mean scores on Brand attitude
Brand personality - Excitement (With Pitfall)
Without Challenge
With Challenge
Figure 17: ANOVA plots confident brand personality
Figure 18: ANOVA plots excitement brand personality

Page 100 of 137
Hypothesis 3 - main effect of Pitfall on Brand attitude
Table 38 shows that there is a significant main effect of Pitfall on attitude towards the brand
F(1, 99) = 5.39, p < .05, η² = .052, indicating that the difference in perceived levels of Pitfall
leads to a significant change in attitude towards the brand.
Looking at the plots in the ANOVA for both the brand personalities, a direct negative effect
of the addition of Pitfall can be observed in almost all scenarios, since the dashed line
(scenario when Pitfall is communicated) is almost always lower than the solid line (scenario
when Pitfall is not communicated), indicating a general decrease in attitude towards the brand
when the Pitfall is present than when it is absent. Only in case of Exciting brand personality,
when no Core Quality and no Challenge is communicated, addition of Pitfall actually
increases attitude towards the brand compared to when nothing is communicated. However,
since overall, Pitfall appears to have a significant negative effect on the brand attitude scores,
hypothesis 3 is accepted.

Page 101 of 137
1
3
5
7
Without CoreQuality
With Core Quality
Mean scores on Brand attitude
Brand personality - Confidence (Without Challenge)
Without Pitfall
With Pitfall
1
3
5
7
Without CoreQuality
With Core Quality
Mean scores on Brand attitude
Brand personality - Confidence (With Challenge)
Without Pitfall
With Pitfall
1
2
3
4
5
6
7
Without CoreQuality
With Core Quality
Mean scores on Brand attitude
Brand personality - Excitement (Without Challenge)
Without Pitfall
With Pitfall
1
2
3
4
5
6
7
Without CoreQuality
With Core Quality
Mean scores on Brand attitude
Brand personality - Excitement (With Challenge)
Without Pitfall
With Pitfall
Figure 19: ANOVA plots confident brand personality
Figure 20: ANOVA plots excitement brand personality

Page 102 of 137
Hypothesis 4 - interaction effect of Core Quality and Challenge on Brand attitude
Table 38 shows that there is no significant interaction effect of Core Quality and Challenge
on attitude towards the brand F(1, 99) = 2.44, p = .121, η² = .024, indicating that
communicating additional information about the Challenge when information about the Core
Quality has been communicated does not lead to significant change in attitude towards the
brand.
However, looking at the ANOVA plots for both Confident and Exciting brand personalities, a
negative interaction effect of the Core Quality and Challenge is observed, since the slope of
the lines in case of presence of Core Quality decrease from the first plot (when the Challenge
is absent) to the second plot (when the Challenge is present) for both brand personalities.
This indicates that in case when the Core Quality is present, the presence of Challenge
actually weakens the positive effect of Core Quality on attitude towards the brand than when
the Challenge was absent. Therefore, contrary to expectations, the addition of Challenge
seems to marginally dampen the positive effect of Core Quality instead of strengthening it, as
predicted by the hypothesis 4. This effect is observed for both brand personalities; however, it
is not significant.
Therefore, due to insignificant interaction results and contrary expectations, hypothesis 4 is
rejected.
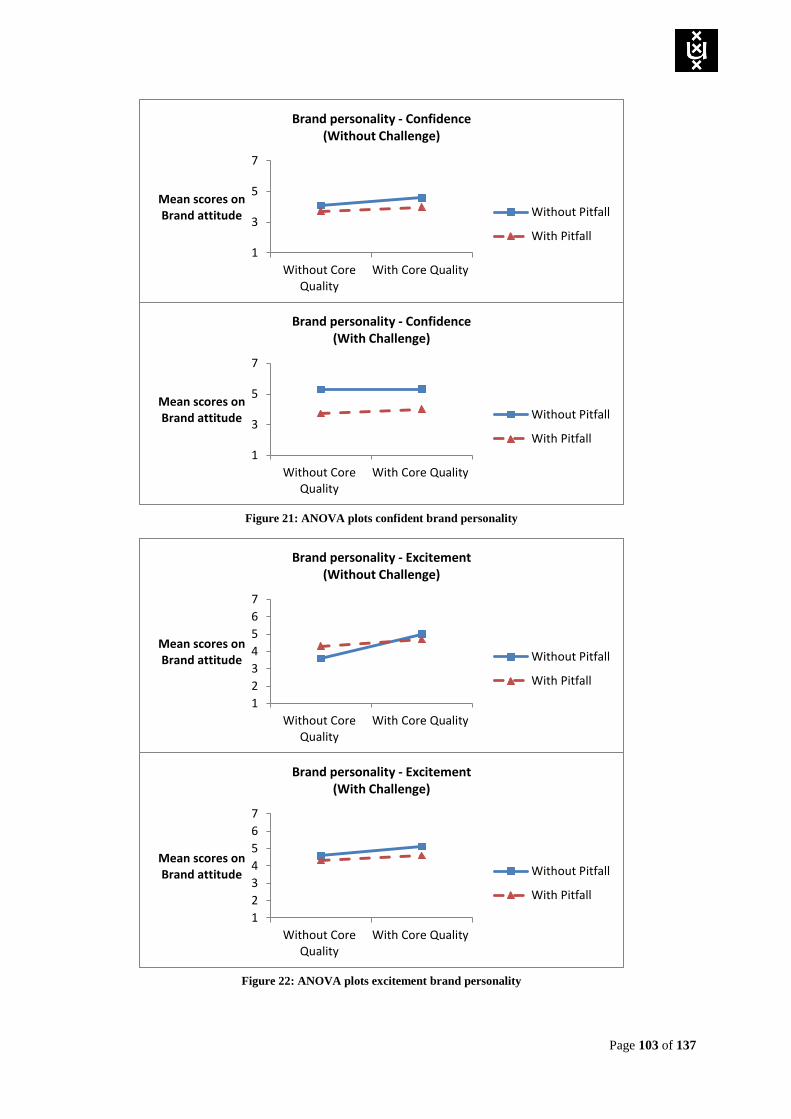
Page 103 of 137
1
3
5
7
Without CoreQuality
With Core Quality
Mean scores on Brand attitude
Brand personality - Confidence (Without Challenge)
Without Pitfall
With Pitfall
1
3
5
7
Without CoreQuality
With Core Quality
Mean scores on Brand attitude
Brand personality - Confidence (With Challenge)
Without Pitfall
With Pitfall
1
2
3
4
5
6
7
Without CoreQuality
With Core Quality
Mean scores on Brand attitude
Brand personality - Excitement (Without Challenge)
Without Pitfall
With Pitfall
1
2
3
4
5
6
7
Without CoreQuality
With Core Quality
Mean scores on Brand attitude
Brand personality - Excitement (With Challenge)
Without Pitfall
With Pitfall
Figure 21: ANOVA plots confident brand personality
Figure 22: ANOVA plots excitement brand personality

Page 104 of 137
Hypothesis 5 - interaction effect of Challenge and Pitfall on Brand attitude
Table 38 shows that there is no significant interaction effect of Challenge and Pitfall on
attitude towards the brand F(1, 99) = 2.91, p = .091, η² = .029, indicating that communicating
additional information about the Challenge when information about the Pitfall has been
communicated does not lead to a significant change in attitude towards the brand.
However, looking at the ANOVA plots for both Confident and Exciting brand personalities, a
negative interaction effect of the Pitfall and Challenge is observed in almost all scenarios,
since the slope of the lines in case of presence of Pitfall decrease from the first plot (when the
Challenge is absent) to the second plot (when the Challenge is present) for both brand
personalities. This indicates that in case when the Pitfall is present, the presence of Challenge
actually strengthens the negative effect of Pitfall on attitude towards the brand (makes the
attitude towards the brand more negative) than when the Challenge was absent. Therefore,
contrary to expectations, the addition of Challenge seems to marginally strengthen the
negative effect of Pitfall instead of dampening it, as predicted by the hypothesis 5. This effect
is observed for both brand personalities; however, perhaps this effect is not significant overall
since it is not observed only in case of Exciting brand personality without the presence of
Core Quality (denoted by the solid line).
Therefore, due to insignificant interaction results and contrary expectations, hypothesis 5 is
rejected.

Page 105 of 137
1
3
5
7
Without Pitfall With Pitfall
Mean scores on Brand attitude
Brand personality - Confidence (Without Challenge)
Without Core Quality
With Core Quality
1
2
3
4
5
6
7
Without Pitfall With Pitfall
Mean scores on Brand attitude
Brand personality - Confidence (With Challenge)
Without Core Quality
With Core Quality
1
2
3
4
5
6
7
Without Pitfall With Pitfall
Mean scores on Core Quality
Brand personality - Excitement (Without Challenge)
Without Core Quality
With Core Quality
1
2
3
4
5
6
7
Without Pitfall With Pitfall
Mean scores on Core Quality
Brand personality - Excitement (With Challenge)
Without Core Quality
With Core Quality
Figure 23: ANOVA plots confident brand personality
Figure 24: ANOVA plots excitement brand personality

Page 106 of 137
6.3.6 Additional analyses
In order to explain the surprising significant results which were observed for interactions of
brand personality both with Core Quality and Pitfall separately as well as collectively,
additional analyses were conducted to observe these specific interactions. Furthermore, in
order to explore the reason behind the insignificant as well as contrary results to expectations
for hypotheses 2, 4 and 5, additional analyses were conducted using a 4-way ANOVA, this
time with mean scores on Core Quality and Pitfall as the dependent variable instead of brand
attitude scores as was done previously.
Interaction effect of Brand personality and Core Quality
From the following ANOVA plots, it can be observed that communication of Core Quality
leads to an increase in attitude towards the brand for both brand personalities. However, for
the Excitement brand personality this increase is larger than for Confidence, since the lines
sloping upwards are steeper for Excitement brand personality than for Confidence. This
explains the significant interaction effect of Core Quality and Brand personality. This
perhaps indicates that communication of the Core Quality of Excitement has a larger positive
effect on attitude towards the brand than communication of the Core Quality of Confidence,
perhaps indicating that in general, the (brand) personality trait of Excitement has a more
positive connotation than Confidence.

Page 107 of 137
1
2
3
4
5
6
7
Without CoreQuality
With CoreQuality
Mean scores on Brand attitude
Brand personality - Confidence (Without Pitfall)
Without Challenge
With Challenge
1
2
3
4
5
6
7
Without CoreQuality
With CoreQuality
Mean scores on Brand attitude
Brand personality - Confidence (With Pitfall)
Without Challenge
With Challenge
1
2
3
4
5
6
7
Without CoreQuality
With CoreQuality
Mean scores on Brand attitude
Brand personality - Excitement (Without Pitfall)
Without Challenge
With Challenge
1
2
3
4
5
6
7
Without CoreQuality
With CoreQuality
Mean scores on Brand attitude
Brand personality - Excitement (With Pitfall)
Without Challenge
With Challenge
Figure 25: ANOVA plots confident brand personality
Figure 26: ANOVA plots excitement brand personality

Page 108 of 137
Interaction effect of Brand personality and Pitfall
From the following ANOVA plots, it can be observed that communication of Pitfall leads to
a decrease in attitude towards the brand for both brand personalities (denoted by a drop in
levels of the dashed line which communicates Pitfall). However, for the Confidence brand
personality, this decrease in attitude is much larger than for the Excitement brand personality.
This explains the significant interaction effect of Pitfall and Brand personality. This perhaps
indicates that communication of the Pitfall of arrogance has a larger negative effect on
attitude towards the brand than communication of the Pitfall of carelessness, perhaps
indicating that in general, the (brand) personality trait of arrogance has a more negative
connotation than carelessness.
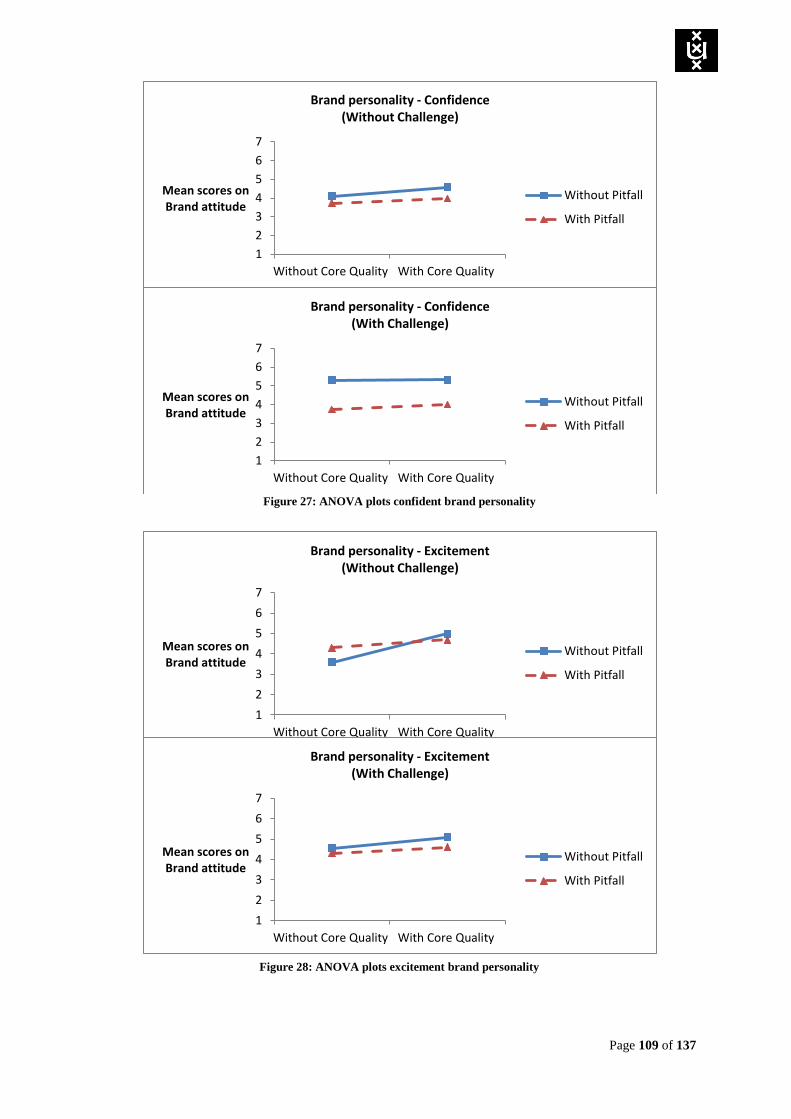
Page 109 of 137
1
2
3
4
5
6
7
Without Core Quality With Core Quality
Mean scores on Brand attitude
Brand personality - Confidence (Without Challenge)
Without Pitfall
With Pitfall
1
2
3
4
5
6
7
Without Core Quality With Core Quality
Mean scores on Brand attitude
Brand personality - Confidence (With Challenge)
Without Pitfall
With Pitfall
1
2
3
4
5
6
7
Without Core Quality With Core Quality
Mean scores on Brand attitude
Brand personality - Excitement (Without Challenge)
Without Pitfall
With Pitfall
1
2
3
4
5
6
7
Without Core Quality With Core Quality
Mean scores on Brand attitude
Brand personality - Excitement (With Challenge)
Without Pitfall
With Pitfall
Figure 27: ANOVA plots confident brand personality
Figure 28: ANOVA plots excitement brand personality

Page 110 of 137
Interaction effect of Brand personality, Core Quality, and Pitfall
Looking at the ANOVA plots for both Confident and Exciting brand personalities, no
interaction effect of the Core Quality and Pitfall is observed in almost all scenarios, since the
slope of the lines in case of presence of Core Quality does not change much from the first
plot (when the Pitfall is absent) to the second plot (when the Pitfall is present). However,
only in case of the Confident brand personality, a decrease of slope of lines in case of
presence of Core Quality is observed from the first plot (when the Pitfall is absent) to the
second plot (when the Pitfall is present), indicating that in case when the Core Quality is
present, the presence of Pitfall weakens the positive effect of Core Quality on attitude
towards the brand than when the Pitfall was absent for the Confident brand personality.
Perhaps this offers an explanation as to why the interaction effect of only the Core Quality
and Pitfall is not significant, but the interaction of this effect with brand personality is
significant.
This again reinforces the relative negative strength of arrogance as a Pitfall personality trait
than carelessness.
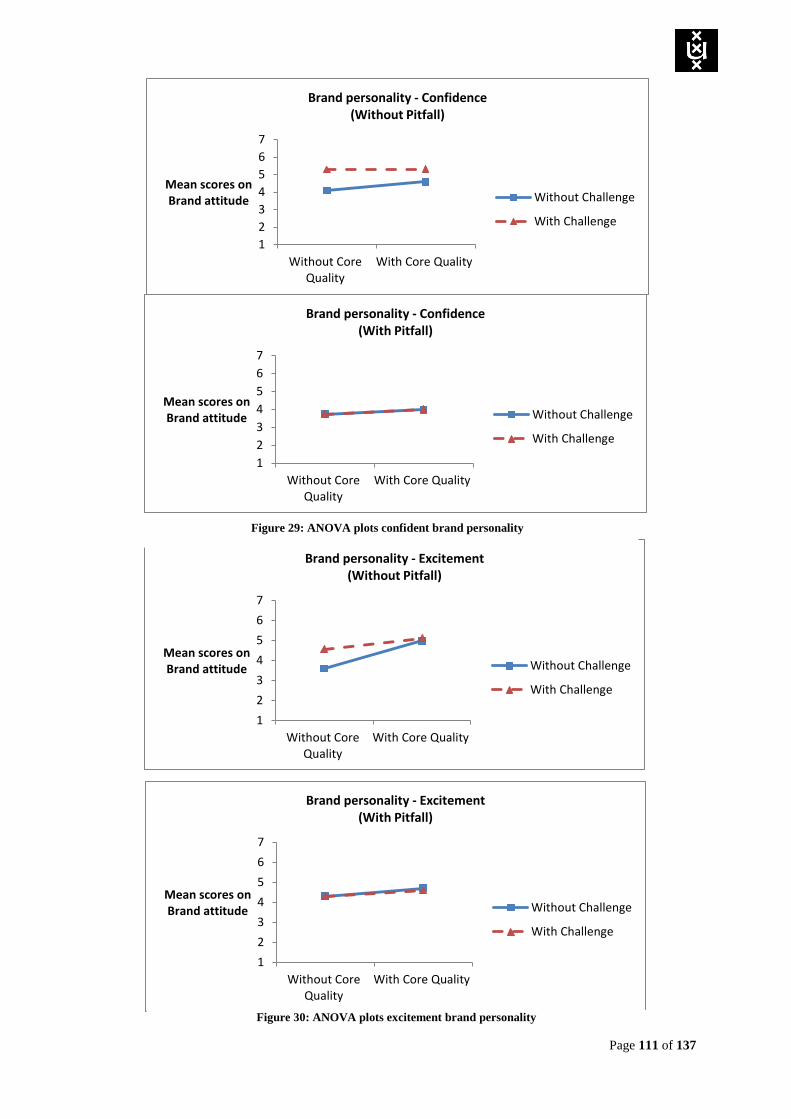
Page 111 of 137
1
2
3
4
5
6
7
Without CoreQuality
With Core Quality
Mean scores on Brand attitude
Brand personality - Confidence (Without Pitfall)
Without Challenge
With Challenge
1
2
3
4
5
6
7
Without CoreQuality
With Core Quality
Mean scores on Brand attitude
Brand personality - Confidence (With Pitfall)
Without Challenge
With Challenge
1
2
3
4
5
6
7
Without CoreQuality
With Core Quality
Mean scores on Brand attitude
Brand personality - Excitement (Without Pitfall)
Without Challenge
With Challenge
1
2
3
4
5
6
7
Without CoreQuality
With Core Quality
Mean scores on Brand attitude
Brand personality - Excitement (With Pitfall)
Without Challenge
With Challenge
Figure 29: ANOVA plots confident brand personality
Figure 30: ANOVA plots excitement brand personality
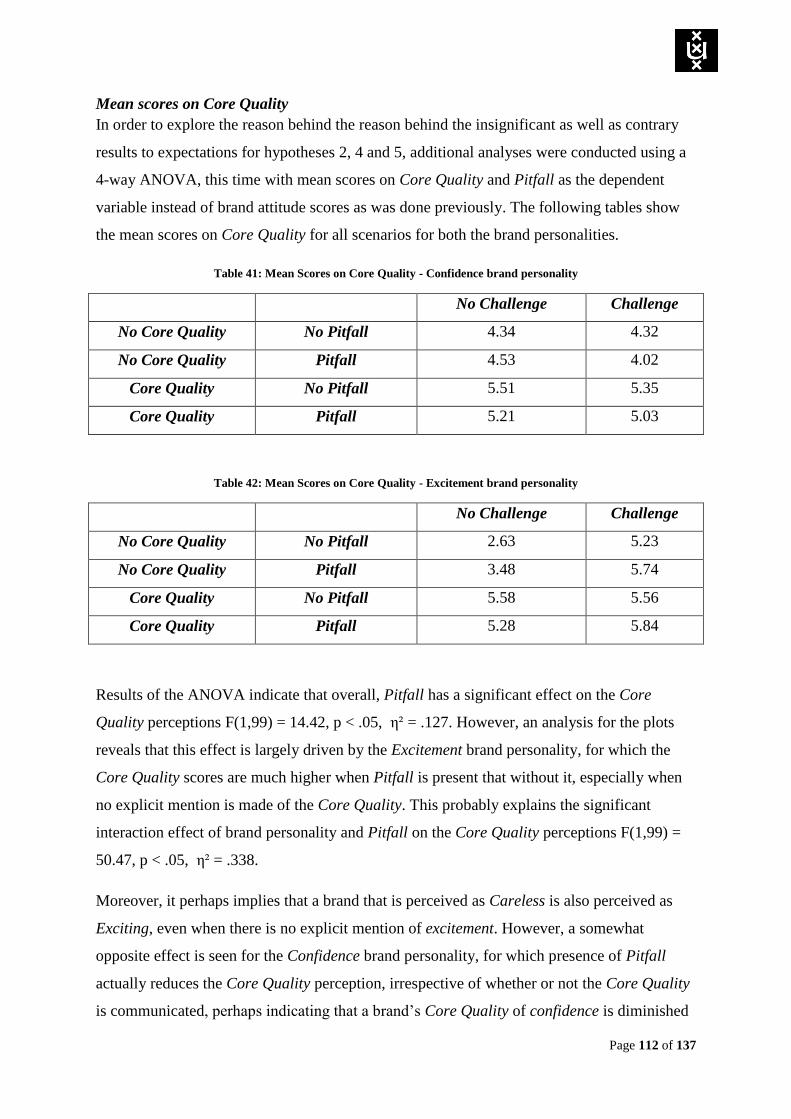
Page 112 of 137
Mean scores on Core Quality
In order to explore the reason behind the reason behind the insignificant as well as contrary
results to expectations for hypotheses 2, 4 and 5, additional analyses were conducted using a
4-way ANOVA, this time with mean scores on Core Quality and Pitfall as the dependent
variable instead of brand attitude scores as was done previously. The following tables show
the mean scores on Core Quality for all scenarios for both the brand personalities.
Table 41: Mean Scores on Core Quality - Confidence brand personality
No Challenge Challenge
No Core Quality No Pitfall 4.34 4.32
No Core Quality Pitfall 4.53 4.02
Core Quality No Pitfall 5.51 5.35
Core Quality Pitfall 5.21 5.03
Table 42: Mean Scores on Core Quality - Excitement brand personality
No Challenge Challenge
No Core Quality No Pitfall 2.63 5.23
No Core Quality Pitfall 3.48 5.74
Core Quality No Pitfall 5.58 5.56
Core Quality Pitfall 5.28 5.84
Results of the ANOVA indicate that overall, Pitfall has a significant effect on the Core
Quality perceptions F(1,99) = 14.42, p < .05, η² = .127. However, an analysis for the plots
reveals that this effect is largely driven by the Excitement brand personality, for which the
Core Quality scores are much higher when Pitfall is present that without it, especially when
no explicit mention is made of the Core Quality. This probably explains the significant
interaction effect of brand personality and Pitfall on the Core Quality perceptions F(1,99) =
50.47, p < .05, η² = .338.
Moreover, it perhaps implies that a brand that is perceived as Careless is also perceived as
Exciting, even when there is no explicit mention of excitement. However, a somewhat
opposite effect is seen for the Confidence brand personality, for which presence of Pitfall
actually reduces the Core Quality perception, irrespective of whether or not the Core Quality
is communicated, perhaps indicating that a brand’s Core Quality of confidence is diminished

Page 113 of 137
as soon as it is perceived as arrogant, either with, or even without the explicit mention of
confidence.
Furthermore, Challenge does not have a significant effect on the Core Quality perceptions
F(1,99) = 0.15, p = .699, η² = .002. The plots also reveal that for the Confidence brand
personality, communication of Challenge with the Core Quality even marginally decreases
the perception of Core Quality, especially when the Pitfall is communicated. This perhaps
indicates that a brand’s Core Quality of confidence is diminished when it is perceived as
humble, either with, or even without the explicit mention of confidence. This can mean that
for the confident brand personality, confidence and humility are seen as somewhat mutually
exclusive personality traits. For the Excitement brand personality, as opposed to the
confidence brand personality, communication of Challenge generally leads to increased
perception of Core Quality.
Perhaps due to these opposing effects of Challenge on the respective Core Quality
perceptions of the two brand personalities, no overall significant interaction effect was
observed for the Core Quality and Challenge on attitude towards the brand. This offers an
explanation as to why hypothesis 4 could not be accepted.

Page 114 of 137
1
3
5
7
Without Challenge With Challenge
Mean scores on Core Quality
Brand personality - Confidence (Without Core Quality)
Without Pitfall
With Pitfall
1
3
5
7
Without Challenge With Challenge
Mean scores on Core Quality
Brand personality - Confidence (With Core Quality)
Without Pitfall
With Pitfall
1
2
3
4
5
6
7
Without Challenge With Challenge
Mean scores on Core Quality
Brand personality - Excitement (Without Core Quality)
Without Pitfall
With Pitfall
1
2
3
4
5
6
7
Without Challenge With Challenge
Mean scores on Core Quality
Brand personality - Excitement (With Core Quality)
Without Pitfall
With Pitfall
Figure 31: ANOVA plots confident brand personality
Figure 32: ANOVA plots excitement brand personality
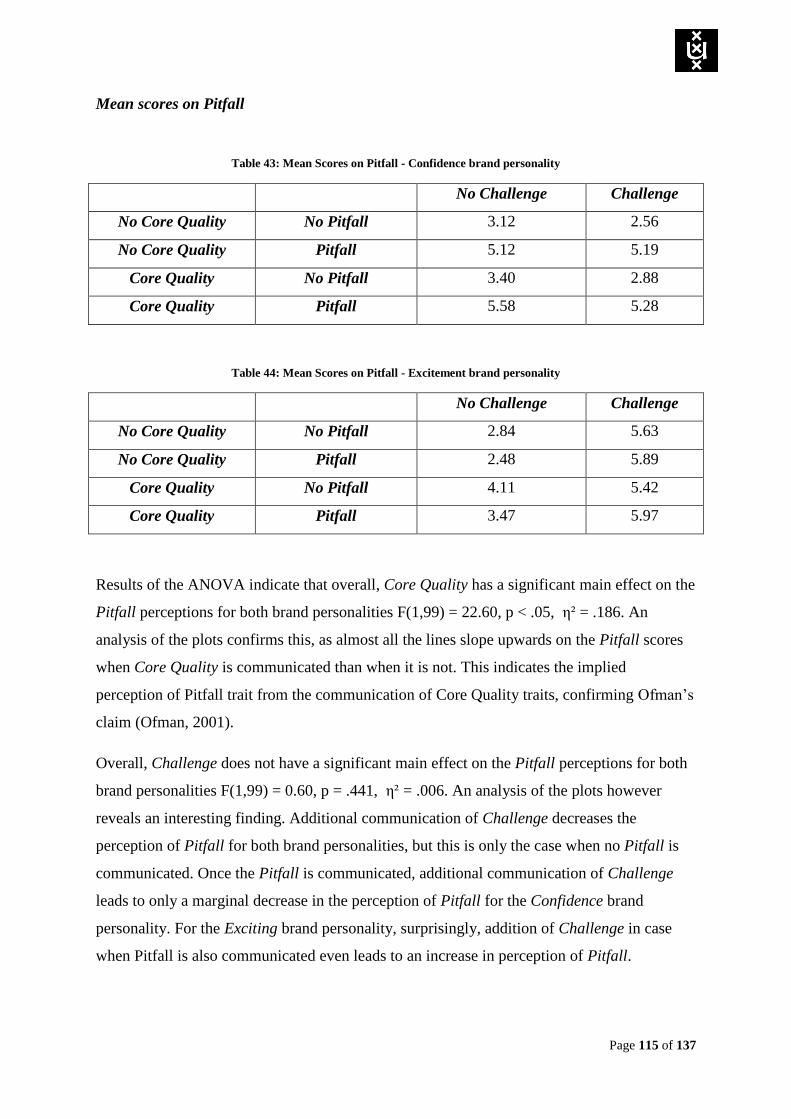
Page 115 of 137
Mean scores on Pitfall
Table 43: Mean Scores on Pitfall - Confidence brand personality
No Challenge Challenge
No Core Quality No Pitfall 3.12 2.56
No Core Quality Pitfall 5.12 5.19
Core Quality No Pitfall 3.40 2.88
Core Quality Pitfall 5.58 5.28
Table 44: Mean Scores on Pitfall - Excitement brand personality
No Challenge Challenge
No Core Quality No Pitfall 2.84 5.63
No Core Quality Pitfall 2.48 5.89
Core Quality No Pitfall 4.11 5.42
Core Quality Pitfall 3.47 5.97
Results of the ANOVA indicate that overall, Core Quality has a significant main effect on the
Pitfall perceptions for both brand personalities F(1,99) = 22.60, p < .05, η² = .186. An
analysis of the plots confirms this, as almost all the lines slope upwards on the Pitfall scores
when Core Quality is communicated than when it is not. This indicates the implied
perception of Pitfall trait from the communication of Core Quality traits, confirming Ofman’s
claim (Ofman, 2001).
Overall, Challenge does not have a significant main effect on the Pitfall perceptions for both
brand personalities F(1,99) = 0.60, p = .441, η² = .006. An analysis of the plots however
reveals an interesting finding. Additional communication of Challenge decreases the
perception of Pitfall for both brand personalities, but this is only the case when no Pitfall is
communicated. Once the Pitfall is communicated, additional communication of Challenge
leads to only a marginal decrease in the perception of Pitfall for the Confidence brand
personality. For the Exciting brand personality, surprisingly, addition of Challenge in case
when Pitfall is also communicated even leads to an increase in perception of Pitfall.

Page 116 of 137
Therefore, it appears that addition of Challenge leads to a decrease in the perception of Pitfall
for both the brand personalities, but only as long as no explicit mention is made of the Pitfall.
As soon as the Pitfall is mentioned, this damping effect of Challenge is lost. Perhaps due to
this reason, the overall interaction effect of Challenge with Pitfall on attitude towards the
brand was not observed in hypothesis 5.
Overall, the interaction effect of Core Quality and Challenge does not have a significant
effect on the Pitfall perceptions for both brand personalities F(1,99) = 0.21, p = .648, η² =
.006. An analysis of the plots confirms this, as communicating Challenge with the Core
Quality only seems to slightly decrease perceptions of Pitfall for the confident brand
personality. Only in this case does the slope of the dashed line (representing Challenge)
decreases compared to the slope of the solid line (representing no Challenge) in the presence
of Core Quality, indicating an interaction effect of Core Quality and Challenge on the Pitfall.
In all other cases, addition of Challenge to the Core Quality does not seem to influence the
perception of Pitfall. In fact, the addition of Challenge to the Core Quality even slightly
increases the perception of Pitfall in case of exciting brand personality in case when Pitfall is
communicated.
These results perhaps indicate the inability of Challenge to reduce the perceptions of Pitfall,
especially when the Pitfall is explicitly communicated. It thereby offers an explanation as to
why Challenge does not seem to have a direct positive effect on attitude towards the brand in
the presence of the Pitfall, which was the main reason why hypothesis 2 had to be rejected.
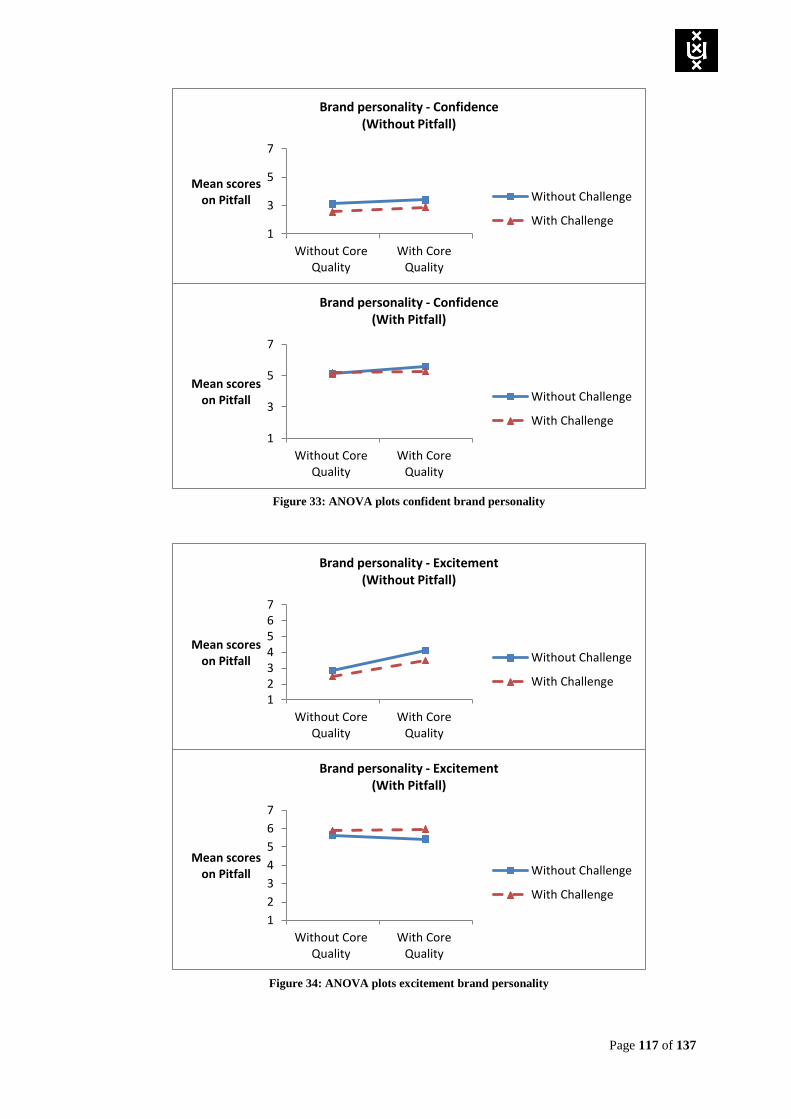
Page 117 of 137
1
3
5
7
Without CoreQuality
With CoreQuality
Mean scores on Pitfall
Brand personality - Confidence (Without Pitfall)
Without Challenge
With Challenge
1
3
5
7
Without CoreQuality
With CoreQuality
Mean scores on Pitfall
Brand personality - Confidence (With Pitfall)
Without Challenge
With Challenge
1234567
Without CoreQuality
With CoreQuality
Mean scores on Pitfall
Brand personality - Excitement (Without Pitfall)
Without Challenge
With Challenge
1
2
3
4
5
6
7
Without CoreQuality
With CoreQuality
Mean scores on Pitfall
Brand personality - Excitement (With Pitfall)
Without Challenge
With Challenge
Figure 33: ANOVA plots confident brand personality
Figure 34: ANOVA plots excitement brand personality

Page 118 of 137
Plot of mean brand attitude scores
The third and final additional analysis that was conducted was to compare the mean brand
attitude scores for each scenario for the two brand personalities in one plot.
The following tables, which were also presented above display the means of the brand
attitude scores for both brand personalities.
Table 45: Mean Scores on Brand attitude - Confidence brand personality
No Challenge Challenge
No Core Quality No Pitfall 4.09 5.29
No Core Quality Pitfall 3.72 3.73
Core Quality No Pitfall 4.58 5.32
Core Quality Pitfall 3.97 4.00
Table 46: Mean Scores on Brand attitude - Excitement brand personality
No Challenge Challenge
No Core Quality No Pitfall 3.59 4.56
No Core Quality Pitfall 4.30 4.29
Core Quality No Pitfall 4.98 5.10
Core Quality Pitfall 4.69 4.59
Based on the plot, a few interesting points emerge:
Communication of only the Challenge has a higher brand attitude score than communication
of only the Core Quality for Confident brand personality, implying that perhaps being humble
is perceived to be better than being confident. This, however, is not the case for the Exciting
brand personality, for which the communication of only the Core Quality has a higher brand
attitude score than communication of only the Challenge, perhaps implying that being
exciting is perceived to be better than being responsible for Exciting brand personality.
When Challenge is communicated both separately and together with the Core Quality, the
brand attitude is higher for Confident brand personality than for Exciting brand personality.
This perhaps shows that humility is perceived better than responsibility, even though both are
Challenge traits, implying perceived differences in brand personalities.

Page 119 of 137
1
2
3
4
5
6
7
Mean scores on Brand attitude
Brand attitude scores -Confidence
Brand attitude scores -Excitement
Whenever Pitfall is communicated (both separately and together with the Core Quality or
Challenge) the brand attitude for Confident brand personality decreases. This decrease is
more than that of the Exciting brand personality in the same scenarios. This perhaps implies
that arrogance in general is considered as a more negative personality trait than carelessness,
even though both are Pitfall traits, again implying perceived differences in brand
personalities.
For Confident brand personality, the most negative brand attitudes occur when Pitfall is
communicated alone while for Exciting brand personality, the most negative brand attitudes
occur in the Neutral scenario when nothing is communicated. This effect is perhaps driven by
the product category, and implies that being Careless is better than being nothing at all for
beer, while being arrogant is worse than being nothing at all for toothpaste.
Interestingly, adding Challenge certainly doesn’t seem to help the cause much for both brand
personalities, especially compared to when Pitfall has previously been communicated, as the
brand attitude scores are almost the same in both scenarios for both brand personalities (only
a difference of 0.01). This perhaps implies that communicating Pitfall and Challenge together
is equally as bad in terms of brand attitude as communicating only the Pitfall, further
highlighting the failure of hypothesis 5.
Figure 35: Plot of mean brand attitude scores vs. scenario type for both brand personalities

Page 120 of 137
6.4 Discussion
6.4.1 Implications of results of study 2 on results of study 1
Prior to this study, the results of the first study demonstrated mixed evidence of the
applicability of Ofman’s principles on brands, as all the hypotheses that were laid out were
not simultaneously supported for any of the three brand personalities. Furthermore, the first
study also concluded that the respondents failed to perceive the Pitfall traits in the brands, as
all of the Pitfall brands scored higher on their Core Quality than their Pitfall, thereby
contradicting the true conceptual meaning of what a Pitfall brand should be.
This follow-up second study therefore had two main purposes: firstly, after having failed to
identify what can be considered as the typical archetypes of the Pitfall brands in the first
study, the use of fictitious brands would confirm whether Ofman’s principles are
conceptually incompatible with brands and their personality traits, or whether there is an
alternative explanation to the results of the first study. The second and perhaps a larger
motive of the second study was to provide an answer to the second half of the problem
statement by holding the attitude towards the brand as its central theme in order to be able to
explore what kinds of brands (and personalities) do consumers like, and have a favorable
attitude towards. This would help brands manipulate the communication of their personality
traits in such a way in order to observe favorable consumer attitudes towards the brand and its
personality.
Contrary to the results of the first study, the results of this study revealed that the respondents
were clearly able to perceive the three personality traits (Core Quality, Pitfall, and
Challenge) in a brand’s personality in the brand’s communication messages. Furthermore, the
effects on respondents of the communication of these personality traits were also largely in
line with Ofman’s model, as reflected in the change in the respondents’ attitudes towards the
brand depending on the combination of personality traits that were being communicated. This
indicates that conceptually, a framework like that of Ofman (2001) can be applicable to
brands and their personalities. This also offers perhaps an alternative explanation to the
reason why results of the first study were the way they were.
The brands that were picked to represent the archetypes of the Pitfall brands in the first study
were all real and successful brands that the respondents were widely familiar with, and had a
moderately high to highly positive attitude towards (as observed in the additional analysis of
the first study). Choosing real and well-known brands was important in that study, otherwise
Page 121 of 137
the respondents would not have been able to rate the brands on their personalities if they were
not sufficiently aware of them. As indicated by the results of the second study, and in line
with Ofman’s model, the perception of Pitfall trait in a brand’s personality leads to a
significant decrease in attitude towards the brand. Based on these findings, if respondents in
the first study were to have perceived the brands as Pitfall brands, then these brands would
have fared poorly in terms of their attitude ratings. However, that was not the case. This was
reflected both from the additional analyses conducted on the attitude scores, as well as the
fact that the brands were well-known with very high familiarity ratings. Therefore, it can be
concluded that the results of the first study were not due the conceptual incompatibility of
Ofman’s model with brands and their personalities, but primarily due to the selection of
successful brands as stimuli.
6.4.2 Discussion of results of study 2
As for the second purpose of this study, the results clearly demonstrate that it is possible to
influence consumers’ perceptions of the brand as well as their attitudes depending on the
manner in which the brands present and communicate their personalities. Significant positive
and negative results were observed for both Core Quality and Pitfall respectively on the
attitude towards the brand offering support for hypotheses 1 and 3. These results imply that
communication of Core Quality leads to increased positive perceptions of the brand, while
communication of Pitfall leads to increased negative perceptions of the brand. These results
are in line with Ofman’s framework (Ofman, 2001).
Overall, there was no significant effect of Challenge on attitude towards the brand. However,
looking at the plots in the ANOVA for both brand personalities revealed a direct positive
effect of the addition of Challenge on attitude towards the brand, for both Confident and
Exciting brand personalities. However, this effect was only to be seen in the scenarios when
the Pitfall was not communicated to the respondents. In scenarios when the Pitfall was
communicated to the respondents for both brand personalities, the direct positive effect of the
addition of Challenge on attitude towards the brand was lost. Perhaps due to this reason, the
overall main effect of the Challenge on the brand attitude scores was not significant, and
hypothesis 2 had to be rejected. Moreover, the finding of the additional analysis of the
ANOVA plots with Pitfall as the main dependent variable indicated that communication of
the Challenge also does not seem to diminish the perceptions of Pitfall. Therefore, it seems
that the positive influence of the Challenge diminishes in the presence of Pitfall, perhaps

Page 122 of 137
indicating that the relative strength of the negativity of Pitfall supersedes the relative strength
of the positivity of Challenge.
There was also no significant effect found for the interaction of Core Quality and Challenge
on attitude towards the brand. Surprisingly, observing the plots from the ANOVA for both
Confident and Exciting brand personalities revealed that contrary to expectations, a negative
interaction effect of the Core Quality and Challenge was observed, perhaps implying that not
only is the combined effect of Core Quality and Challenge not as synergistic as expected, but
there is a greater positive effect of Core Quality on attitude towards the brand when the
Challenge is absent that when it is present. Additional analysis with Core Quality scores as
the main dependent variable confirmed these unexpected results. For the Confidence brand
personality, communication of Challenge with the Core Quality seems to dampen the
positive effect of Core Quality instead of strengthening it, especially when the Pitfall is
communicated. This perhaps indicates that a brand’s Core Quality of confidence is
diminished when it is perceived as humble, either with, or even without the explicit mention
of confidence. This can mean that for the confident brand personality, confidence and
humility are seen as somewhat mutually exclusive personality traits. For the Excitement brand
personality, as opposed to the confidence brand personality, communication of Challenge
generally leads to increased perception of Core Quality. Perhaps due to these opposing
effects of Challenge on the respective Core Quality perceptions of the two brand
personalities, no overall significant interaction effect was observed for the Core Quality and
Challenge on attitude towards the brand. This offers an explanation as to why hypothesis 4
could not be accepted.
There was also no significant effect found for the interaction of Challenge and Pitfall on
attitude towards the brand, indicating that communicating additional information about the
Challenge when information about the Pitfall has already been communicated does not lead
to a significant change in attitude towards the brand. An analysis of the ANOVA plots for
both the brand personalities revealed that contrary to expectations, a negative interaction
effect of the Pitfall and Challenge is observed in almost all scenarios. Although this effect
was not significant, it indicates that in case when the Pitfall is present, the presence of
Challenge might actually strengthen the negative effect of Pitfall on attitude towards the
brand (makes the attitude towards the brand more negative) than when the Challenge was
absent. Therefore, due to the contrary results to expectations and insignificance of the
interaction, hypothesis 5 had to be rejected.

Page 123 of 137
However, Additional analysis with Pitfall scores as the main dependent variable revealed that
for both Confident and Exciting brand personalities, addition of Challenge leads to a decrease
in the perception of Pitfall, but only as long as no explicit mention is made of the Pitfall. As
soon as the Pitfall is mentioned, this damping effect of Challenge is lost. Perhaps due to this
reason, the overall interaction effect of Challenge with Pitfall on attitude towards the brand
was not observed in hypothesis 5.
Furthermore, additional analyses revealed that that communication of Core Quality leads to
an increase in attitude towards the brand for both brand personalities. However, for the
Excitement brand personality this increase was larger than for Confidence, thereby
confirming the significant interaction effect of Core Quality and brand personality. Similarly,
communication of Pitfall led to a decrease in attitude towards the brand for both brand
personalities. However, for the Confidence brand personality, this decrease in attitude was
much larger than for the Excitement brand personality, thereby confirming the significant
interaction effect of Pitfall and Brand personality.
Finally, and perhaps most importantly, communicating Challenge with the Core Quality only
seems to slightly decrease perceptions of Pitfall for the confident brand personality,
indicating a slight interaction effect of Core Quality and Challenge on the Pitfall. However,
this slight interaction effect was only seen for the confident brand personality when the Pitfall
was explicitly communicated. In all other cases, addition of Challenge to the Core Quality
does not seem to influence the perception of Pitfall. In fact, the addition of Challenge to the
Core Quality even slightly increases the perception of Pitfall in case of exciting brand
personality in case when Pitfall is communicated.
In conclusion, a few key takeaways emerge from the second study:
1. Core Quality has a strong positive effect on attitude towards the brand for both brand
personalities, however, this effect is larger for the exciting brand personality, perhaps
indicating that exciting (brand) personality trait is perceived as more positive than
confident.
2. Pitfall has a strong negative effect on attitude towards the brand however, this effect
is larger for the confident brand personality, perhaps indicating that arrogance (brand)
personality trait is perceived as more negative than careless.
Page 124 of 137
3. Due to the strong negative effect of Pitfall on attitude towards the brand, a well-
known and successful brand cannot be a Pitfall brand, because if it were, Pitfall’s
relative negative strength would put an end to its very existence and fame.
4. In general, Challenge seems to have a positive effect on attitude towards the brand.
However, it seems that this positive effect of the Challenge diminishes in the presence
of Pitfall.
5. Communication of Core Quality and Challenge together does not lead to any
significant increase in attitude towards the brand; in fact, contrary to expectations, it
may even marginally decrease attitude towards the brand since these two traits are
apparently seen as somewhat mutually exclusive personality traits, as the mention of
Challenge seems to diminish the perceptions of Core Quality.
6. In general, the addition of Challenge independently leads to a decrease in the
perception of Pitfall, but only as long as no explicit mention is made of the Pitfall. As
soon as the Pitfall is mentioned, not only is this damping effect of Challenge lost, it
may even marginally decrease attitude towards the brand, contrary to expectations.
7. Communicating Challenge together with the Core Quality only seems to slightly
decrease perceptions of Pitfall - only for the confident brand personality, and that too
only in case when the Pitfall is mentioned explicitly. In all other cases,
communication of Challenge together with the Core Quality does not seem to have
any beneficial effect to reduce the perception of Pitfall.

Page 125 of 137
7 General discussion and implications
The research was organized in the form of two studies. Study 1 aimed to answer the first half
of the research question by seeking to test whether a personal and organizational
development model such as that of Ofman (2001) along with insights from brand positioning
literature (Keller, 2013; Keller et al., 2002) could collectively be applicable to brand
personality literature. Results of the first study indicated that what Ofman would describe as a
“true” Pitfall trait was not perceived in the real brands’ personalities by the respondents. This
led to the conclusion that either there might have been a conceptual limitation, possibly
implying that principles such as that of Ofman might be incompatible with brand personality
literature, or a methodological limitation due to the stimuli selection that was done for the
Pitfall brands in the first study.
Study 2 aimed to provide an answer to these two apparent explanations for the less-than-ideal
results obtained from the first study. This was done by selecting fictitious brands in order to
control for all prior associations that the respondents might have had with the brands and
therefore their personalities. Unlike results of the first study, results of the second study
indicated that the respondents were clearly able to perceive Pitfall traits in brands, implying
no conceptual limitation of Ofman’s framework with its applicability on brands and their
personalities. Furthermore, Pitfall traits were found to be perceived as negative, as suggested
by decrease in attitude towards the brand. This finding also implies no methodological
limitation in selection of stimuli for the first study, since the brands that were picked to
represent the archetypes of the Pitfall brands in the first study were all real and successful
brands that the respondents were widely familiar with, and had a moderately high to highly
positive attitude towards (as observed in the additional analysis of the first study). Therefore,
based on the findings of the second study, if respondents in the first study were to have
perceived the brands as Pitfall brands, then these brands would have fared poorly in terms of
their attitude ratings. This was however, not the case.
Study 2 also aimed to answer the second half of the research question by seeking to
demonstrate how consumers’ attitudes towards the brands could be influenced depending on
the manner in which the brands communicate their personality traits. Expected results were
found for Core Quality traits which led to positive attitudes towards the brand, providing
further support for the “Brand personality effect” (Freling & Forbes, 2005). However, the
results also demonstrated that the Core Quality traits led to implied perceptions about the
brands’ respective Pitfall traits as well. This apparently is problematic for brands, since

Page 126 of 137
perceptions of Pitfall traits were found to be perceived as negative, as suggested by decrease
in attitude towards the brand.
Insights from personal and organizational development literature as well as brand positioning
literature would suggest that in order to prevent the so-called “innuendo effect” of Core
Quality (or a brand’s PoD) from turning into a Pitfall (or Correlational PoP), a brand would
need to master its Challenge (or PoP) (Keller, 2013; Keller et al., 2002; Kervyn et al., 2012;
Ofman, 2001). However, even though the Challenge did independently seem to increase the
respondents’ attitude towards the brand, a few interesting observations and contrary results
were obtained. Firstly, Challenge also seemed to marginally decrease the perception of a
brand’s Core Quality. Perhaps due to this reason, combined communication of the Challenge
and Core Quality did not lead to any synergistic effects, as was expected. Secondly, even
though it appeared that addition of Challenge independently led to a decrease in the
perception of Pitfall, this happened only as long as no explicit mention was made of the
Pitfall. As soon as the Pitfall was mentioned, this damping effect of Challenge was lost.
Third, and perhaps most important was therefore to observe the impact of communicating
Challenge together with the Core Quality on Pitfall perceptions. This combination only
seems to slightly decrease perceptions of Pitfall - only for the confident brand personality,
and that too only in case when the Pitfall is mentioned explicitly. In all other cases,
communication of Challenge together with the Core Quality does not seem to have any
beneficial effects to reduce the perception of Pitfall.
Therefore, based on these results, it can be concluded that mastering the Challenge is perhaps
not as big of a necessity, nor a big priority for brands as theory would suggest. In fact what
would appear to be a necessity and a key takeaway from the second study would be the need
for brands to control the communication of Core Quality by ensuring its communication in a
slightly subtle way, in order to avoid the possibility of it being exaggerated and perceived as
a Pitfall trait.

Page 127 of 137
7.1 Theoretical implications
7.1.1 Applicability of new insights to brand personality literature
One of the key objectives of the present research was to advance and broaden the scope of the
existing brand personality research by interweaving and applying principles from domains
that have previously not been considered in brand personality literature, thereby providing
fresh insights to this stream. For this purpose, theories from other domains, namely personal
and organizational development, human personality psychology, impression management, as
well as brand positioning was consulted in order to look for insights which could be
applicable to brand personality literature. From all these insights, and from the results of the
research, a few key implications emerge. First of all, the results of both the studies indicated
the applicability of ideas and principles from the above mentioned domains to the stream of
brand personality. The study found evidence of the “Innuendo effect”, which has been
defined as “the tendency for individuals to draw negative inferences from positive
descriptions” (Kervyn et al., 2012, p. 77) on brand personality. Just like human personality
traits, Pitfall is implicitly conveyed by the Core Quality traits of a brand. Moreover, ideas
from Ofman’s model that are applicable to human personality also seemed to be applicable to
the personality of brands, as results of the second study indicated that the respondents were
clearly able to perceive Pitfall traits in brands, and they were found to be perceived as
negative, as suggested by decrease in attitude towards the brand. Expected results were found
for Core Quality traits which led to positive attitudes towards the brand, providing further
support for the “Brand personality effect” (Freling & Forbes, 2005).
These insights suggest that there appears to be a huge potential for brand personality research
to greatly benefit and broaden its horizons by considering insights and principles from other
interesting literature streams such as those considered in this research, especially those
involving human personality as well as general branding literature.
7.1.2 Mastering the Challenge is perhaps not all that important
Insights from personal and organizational development literature as well as brand positioning
literature suggested that in order to prevent the so-called “innuendo effect” of Core Quality
(or a brand’s PoD) from turning into a Pitfall (or Correlational PoP), a brand would need to
master its Challenge (or PoP) (Keller, 2013; Keller et al., 2002; Kervyn et al., 2012; Ofman,
2001) this did not appear to be fully supported for, and applicable to brand personality
literature.
Page 128 of 137
Even though the Challenge did independently seem to increase the respondents’ attitude
towards the brand, a few interesting observations and contrary results were obtained
Firstly, Challenge also seemed to marginally decrease the perception of a brand’s Core
Quality. Perhaps due to this reason, combined communication of the Challenge and Core
Quality did not lead to any synergistic effects on brand attitude, as was expected. In fact,
combined communication of the Challenge and Core Quality even showed evidence of
marginally negatively affecting respondents’ attitude towards the brand. Even though no
direct alternative explanation exists in human personality literature of this effect, perhaps this
can be explained by the law of diminishing returns in economics, which states that after a
predictable equilibrium of prices and market shares is reached, companies get decreasing
returns for further increases in their investments (Arthur, 1996). Similarly, perhaps after one
positive personality trait (Core Quality) is communicated to the consumers, the additional
communication of another positive trait (Challenge) leads to diminishing returns in terms of
attitude towards the brand.
Secondly, even though it appeared that addition of Challenge independently led to a decrease
in the perception of Pitfall, this happened only as long as no explicit mention was made of the
Pitfall. As soon as the Pitfall was mentioned, this damping effect of Challenge was lost.
Perhaps due to this reason, also no significant effect of Challenge was found on respondents’
attitude towards the brand. According to Baumeister, Bratslavsky, Finkenauer, and Vohs
(2001), in everyday life, the relative influence of negative psychological events is greater
than positive ones. Bad impressions and bad stereotypes form quicker and are more resistant
than good ones; similarly, negative information has more relative influence on likeability
than positive information, and this occurrence has been shown to be valid across a broad
range of psychological phenomena (Baumeister et al., 2001). Perhaps this could offer a
possible explanation as to why it seems that the strength of the negativity of Pitfall
supersedes the relative strength of the positivity of Challenge.
A key insight that came out regarding the supposed need to balance the Core Quality on
Challenge was that this particular combination only seems to slightly decrease perceptions of
Pitfall - only for the confident brand personality, and that too only in case when the Pitfall is
mentioned explicitly. In all other cases, communication of Challenge together with the Core
Quality does not seem to have any beneficial effects to reduce the perception of Pitfall.

Page 129 of 137
Therefore, it can be concluded that mastering the Challenge is perhaps not as big of a
necessity, nor a big priority for brands as theory would suggest. Perhaps this could be due to
the idea of Challenge or PoP is somewhat less “contextually relevant” in the domain of brand
personality as Kervyn et al. (2012) would suggest, or perhaps this idea is a bit too
complicated for people to process in the context of forming impressions about a brand’s
personality, since according to the research by Nidorf and Crockett (1965) on human
personality impression formation, individual differences exist in the way in which a person
forms impressions of another person who is described by conflicting information.
An individual with high degree of cognitive complexity will try to rationalize the conflict and
reduce the cognitive dissonance arising from the situation while retaining the initially
conflicting information contained in the personality description, while someone with a low
degree of cognitive complexity is less likely to be able to do so, and will consequently reduce
the dissonance by removing one set of the conflicting informational trait and retaining the
other, holding a one-sided picture of the person being described (Nidorf & Crockett, 1965).
Perhaps the latter is what happens in the context of forming impressions about a brand’s
personality. Perhaps people perceive the Core Quality and Challenge not as complementary,
but as conflicting information, thereby removing either one of those associations, while
retaining the other when forming associations about the brand’s personality.
Therefore, it can be concluded that the need to “master the Challenge” or “strike the right
balance between the PoD and PoP” is not entirely necessary for brands in order for brands to
avoid being perceived by the Pitfall personality trait. Instead, what appears more important is
the need to limit the communication of Core Quality to a somewhat subtle manner and avoid
its exaggeration.
7.1.3 Brand personality as a component of associative network
Keller (1993) described brand personality as an attribute originating from user and usage
imagery attributes, and highlighted its role in consumers’ self-expression. It is also addressed
how brand personality attributes “reflect emotions or feelings evoked by the brand” by means
of the associations that get attributed with the brand (Keller, 1993, p. 4). Therefore, brand
personality is seen as an important component of the associative network of consumers.
Moreover, according to Keller (2001), brand personality is one of the key essential
components of a brand’s customer-based brand equity model, since ultimately, a well-
communicated brand personality to the consumers by the firm can foster personal relevance
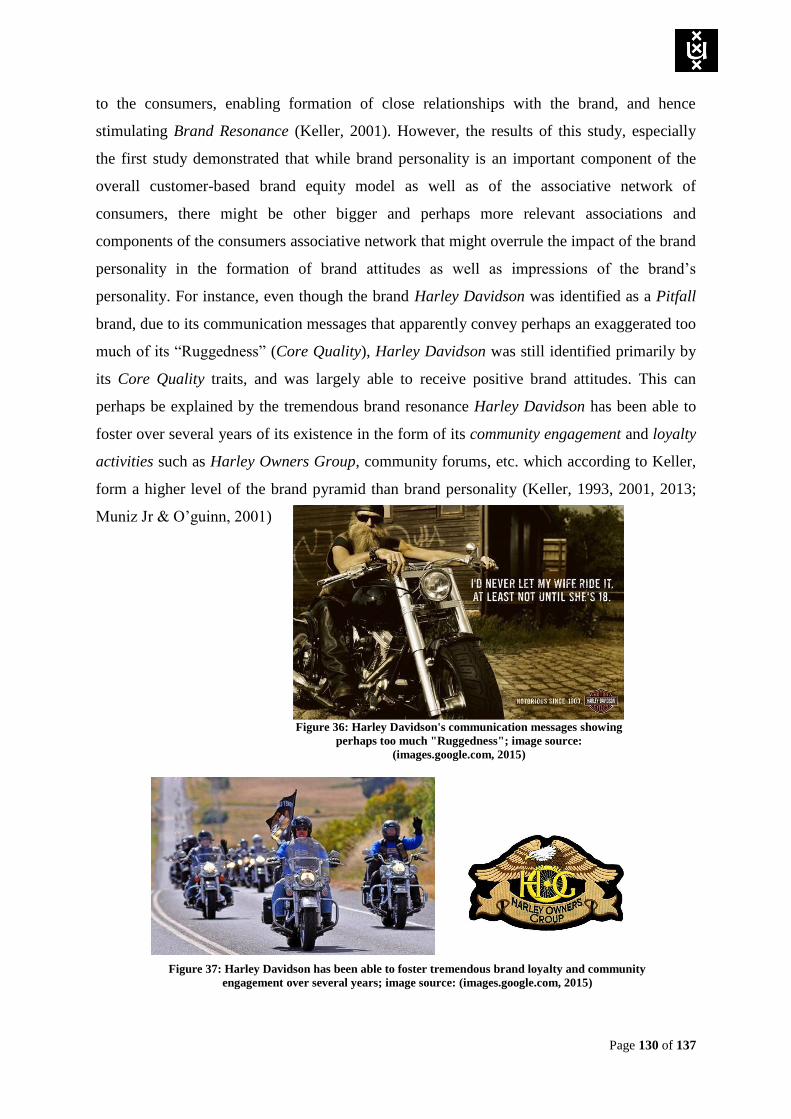
Page 130 of 137
to the consumers, enabling formation of close relationships with the brand, and hence
stimulating Brand Resonance (Keller, 2001). However, the results of this study, especially
the first study demonstrated that while brand personality is an important component of the
overall customer-based brand equity model as well as of the associative network of
consumers, there might be other bigger and perhaps more relevant associations and
components of the consumers associative network that might overrule the impact of the brand
personality in the formation of brand attitudes as well as impressions of the brand’s
personality. For instance, even though the brand Harley Davidson was identified as a Pitfall
brand, due to its communication messages that apparently convey perhaps an exaggerated too
much of its “Ruggedness” (Core Quality), Harley Davidson was still identified primarily by
its Core Quality traits, and was largely able to receive positive brand attitudes. This can
perhaps be explained by the tremendous brand resonance Harley Davidson has been able to
foster over several years of its existence in the form of its community engagement and loyalty
activities such as Harley Owners Group, community forums, etc. which according to Keller,
form a higher level of the brand pyramid than brand personality (Keller, 1993, 2001, 2013;
Muniz Jr & O’guinn, 2001)
Figure 36: Harley Davidson's communication messages showing
perhaps too much "Ruggedness"; image source:
(images.google.com, 2015)
Figure 37: Harley Davidson has been able to foster tremendous brand loyalty and community
engagement over several years; image source: (images.google.com, 2015)
Page 131 of 137
The findings of the first study can perhaps imply that successful brands that are well known
and generally perform well are far less likely to be perceived as what could be described as
true Pitfall brands largely owing to the huge sets of other associative networks that they have
built up over in consumers’ minds over several years of their existence as well as their
success. Having said that, however, if all those associations are to be controlled for (as was
done in the second study), and if consumers were to judge a brand only by their apparent
personality traits, then brand personality could prove to be crucial factor, perhaps even a
deciding one in the successful positioning of the brand as well as the attitudes the brand will
foster amongst its consumers. The same is likely to hold true if a brand is a relatively new
one, with small association sets, or is trying to build a new associative network in consumers’
minds, as suggested by the results.
7.2 Managerial implications
The findings of the present research could be of key relevance to brand managers and firms
seeking to occupy a favorable position in consumers’ minds through the communication of
their brand personalities. A key objective of this research was to demonstrate how consumers
process, and react to the different ways in which a firm communicates its brand and intended
personality, and the key ways in which firms could use these insights to strategically position
an intended brand personality such that it occupies a favorable position in the consumers’
minds.
The results of the research demonstrate that the Core Quality, which is the personality trait of
a brand that most strongly differentiates its personality from other brands, as well as forms
the essence of who the brand is, can lead to strong and favorable associations about the brand
in consumers’ minds, thereby improving their attitudes towards the brands. Therefore, it is
strongly advisable for firms to communicate their brand’s Core Quality to consumers, as it
can lead to improved attitudes towards the brand.
However, managers must be careful while conveying their Core Quality, since the Core
Quality invariably and implicitly also seems to convey certain other personality traits (Pitfall)
which hold negative connotations and lead to decreased attitudes towards the brand. For
instance, consumers implicitly perceive the traits of “arrogance” in a brand that
communicates itself and its personality as “confident”, or the traits of “carelessness”
implicitly go together with the Core Quality of “excitement”. Therefore, managers are
advised to not exaggerate their Core Quality while communicating their brand personalities.

Page 132 of 137
For instance, consider the following print ads by two boot brands that produce “Rugged”
boots for outdoor wear. The Core Quality
of both these brands is ruggedness.
However, the brand Dayton seems to
communicate exaggerated claims of
ruggedness in its advertisements, while
the brand Timberland seems to convey
claims of the same personality trait, but in
a more subtle and controlled manner.
As a consequence, both the brand
Dayton’s advertisements as well as its
personality primarily come across as rude
and harsh, instead of rugged, while both
the brand Timberland’s advertisements
and its personality primarily come across
what it is supposed to - Rugged and
Tough.
As mentioned above, the trait
ruggedness by itself may invariably
communicate rudeness to many consumers. However, exaggeration of this trait will almost
certainly be perceived as rudeness by the consumers. Therefore, a key message is that an
intended communication of the brand’s key positive personality traits should be subtle, in a
way that it does not seem as the negative too much of the trait.
Another key implication of this research is that certain Core Quality traits seem to differ in
the relative ease of which they are perceived as Pitfall traits by the consumers. For instance,
the Core Quality trait of confidence seems to be perceived as its Pitfall trait of arrogance
more quickly and easily than other exciting trait’s Pitfall of carelessness. Moreover, it
appears as though consumers’ attitudes towards the brand can be higher or lower depending
on the type of personality trait conveyed by the brand. For instance, confidence fosters lower
brand attitude than exciting, and arrogance fosters more negative attitude than careless.
While in general, managers need to be careful while conveying their Core Quality traits, extra
care needs to be taken with certain Core Quality traits as they seem to be more susceptible to
Figure 38: A comparison of the communication messages of Dayton
and Timberland; image source: (images.google.com, 2015)

Page 133 of 137
being perceived as their Pitfall traits. Therefore, managers are advised to know their brands
and their brand personalities well before communicating it to the consumers.
Furthermore, it might seem logical to think that if one positive brand personality trait such as
Core Quality can lead to positive attitude towards the brand, then adding a couple more
should incrementally increase this effect, and might even decrease consumers’ (possible)
negative perceptions. However, the research suggests that this is not the case. Additional
communication of other positive brand personality traits such as the Challenge does not seem
to incrementally enhance the positive effect of the Core Quality, nor does it seem to reduce
the effect of the perception of Pitfall. In fact, it seems to slightly diminish the positive impact
of Core Quality on attitude towards the brand, as well as slightly increase the negative
perceptions of Pitfall, especially when implications of Pitfall are already present.
Therefore, in case of crisis when a brand is plagued with perceptions of negative personality
traits, it is not advisable to try to negate the negative perceptions of Pitfall with addition of
other positive traits, as this might further worsen the attitude towards the brand. Nor is it
advisable to try to improve the consumers’ attitude by further stressing the Core Quality. The
key focus of managers in such situations should instead be to stick to the knitting, and
slightly release the throttle of communicating their Core Quality traits to the consumers.
Ensuring to communicate the Core Quality in a subtle and controlled manner is the key to
fostering positive attitude towards the brand, and ensuring that the Core Quality does not turn
into the Pitfall.

Page 134 of 137
8 Conclusions
8.1 Summary
The results of the first study demonstrated mixed evidence of the applicability of personal
and organizational development tools on brands and their personalities, such as Ofman’s
which states that in order for a human being to avoid negative perceptions (Pitfalls) of their
positive personality traits (Core Quality), they need to possess and demonstrate certain other
positive personality traits (Challenge) (Ofman, 2001). The respondents in the first study
failed to perceive the Pitfall traits in the brands, as all of the supposed Pitfall brands scored
higher on their Core Quality than their Pitfall, thereby contradicting the true conceptual
meaning of what a Pitfall brand should be. This questioned the compatibility of personal
development tools such as Ofman’s with brand personality literature.
The follow-up second study, which employed fictitious brands instead of real brands unlike
the first study however revealed that Ofman’s principles are not conceptually incompatible
with brands and their personality traits, and in fact revealed an alternative explanation to the
results of the first study. It was found that the respondents were clearly able to perceive the
three personality traits (Core Quality, Pitfall, and Challenge) in a brand’s personality when it
was presented in the brand’s communication message. Furthermore, the effects on
respondents of the communication of these personality traits were also largely in line with
Ofman’s model, as reflected in the change in the respondents’ attitudes towards the brand
depending on the combination of personality traits that were being communicated.
In line with Ofman’s model, results of the second study revealed that the perception of Pitfall
trait in a brand’s personality leads to a significant decrease in attitude towards the brand.
Based on these findings, if respondents in the first study were to have perceived the chosen
brands as Pitfall brands, then they would have fared poorly in terms of their attitude ratings.
However, that was not the case. The alternative explanation to the results of the first study
was therefore that successful brands in reality that are well-known and generally well-
perceived by the consumers cannot be what can be considered as Pitfall brands, as they have
been able to build strong, favorable, and unique associations in consumers’ minds over
several years of their success. Conceptually, being perceived as a Pitfall brand should
therefore put an end to a brand’s existence, due to the flurry of negative attitude that it would
receive due to its perception of Pitfall. Therefore, a true Pitfall brand cannot be successful,
while a successful brand cannot be a Pitfall brand.

Page 135 of 137
Another motive of the second study was to explore how firms can effectively position their
intended brand personality in consumers’ minds. This would reveal what kinds of brands (and
personalities) do consumers like, and have a favorable attitude towards, and which ones they
don’t, potentially enabling brands manipulate the communication of their personality traits in
such a way in order to observe favorable consumer attitudes towards the brand and its
personality.
Apart from the significant results obtained for Pitfall and its negative effect on attitude
towards the brand as explained above, significant results were also obtained for Core Quality
and its positive effect on attitude towards the brand, implying that communication of Core
Quality leads to increased positive perceptions of the brand, while communication of Pitfall
leads to increased negative perceptions of the brand; these findings were in line with Ofman’s
framework (Ofman, 2001).
A slight positive effect of the additional communication of Challenge was observed, but only
for the scenarios when the Pitfall was not previously communicated to the respondents. In
scenarios when the Pitfall was previously communicated to the respondents, the direct
positive effect of the addition of Challenge was extremely small and almost negligible,
indicating that Challenge loses its positive influence in scenarios when the Pitfall has been
communicated.
The results led to the conclusion that perhaps the need to “master the Challenge” and “strike
the right balance between the Core Quality and Challenge” is perhaps not as relevant for
personalities of brands as it is for human beings (Ofman, 2001, pp. 32, 33). The most
important message for brands in order to avoid being perceived by their Pitfall traits is
instead to ensure the communication of their Core Quality in a slightly subtle manner, such
that it doesn’t appear as an exaggerated claim, as the Core Quality almost always leads to the
perception of Pitfall, but this is especially the case when it is exaggerated.
8.2 Answer to the problem statement
The objective of this research was two-fold. The firstly objective was to fill the existing two
gaps in brand personality literature - regarding the lack of knowledge on how consumers
process, and react to the different ways in which a firm communicates its brand and intended
personality, and regarding the absence of ideas and principles for strategically positioning an
intended brand personality. The second objective was to advance and broaden the scope of
the existing brand personality research by interweaving and applying principles from

Page 136 of 137
domains that have previously not been considered in brand personality literature, thereby
providing fresh insights to this stream. For this purpose, the following problem statement was
developed:
How can principles from personal & organizational development, and brand
positioning literature guide effective positioning of a firm’s intended brand
personality in its consumers’ minds?
Combined insights from both studies of this research have led to the conclusion that firstly,
principles from other domains - such as personal and organizational development, human
personality psychology, impression management, as well as brand positioning are not only
applicable to the domain of brand personality, but can further broaden the boundaries of the
brand personality literature by providing fresh new insights that have previously not been
considered in this stream.
Secondly, and perhaps most importantly, a key implication that emerged from this research,
and perhaps the key takeaway was that in order to avoid perceptions of Pitfall, brands must
be careful when presenting their Core Quality to consumers. Even without the explicit
mention of the Pitfall, the Core Quality has the tendency to implicitly communicate Pitfall.
Therefore, exaggerating the Core Quality further will only add fuel to this fire, and possibly
trap the brand in its Pitfall. This is how firms can effectively position their intended brand
personality in their consumers’ minds.
8.3 Limitations, recommendations, and directions for further research
The present research has several limitations. Firstly, due to limitations of time and resources,
the research could not pre-test the formation of Core Quadrants. For instance, the Challenge
and the Pitfall traits were derived from the Core Quality traits based on intuitive reasoning.
Future research could perhaps pre-test for these traits, to see which personality trait is
perceived as a negative opposite (Pitfall) of the Core Quality, and which trait is perceived as
the positive opposite (Challenge) of the Pitfall, in order to ensure more rigorous results.
Secondly, the present research could only employ and test two brand personalities in the
second study and found somewhat different and even slightly conflicting results for those
brand personalities. Future research could perhaps test multiple brand personalities
simultaneously and compare their Core Quality, Pitfall, Challenge, and brand attitude
perceptions to categorize the effect of the type of brand personality on these variables.

Page 137 of 137
Thirdly, study 2 of this research used communication texts to convey the traits of Core
Quality, Pitfall, and Challenge, along with their various combinations. However, exactly
what levels of Core Quality, Pitfall, and Challenge were added to the base-line personality
traits were not accounted for. Nor was it possible to establish the exact levels at which
addition of each of these variables to the preceding variable led to the change in brand
attitude. It is recommended that future research rectifies this limitation by also controlling the
various levels of the variables that are added to the preceding variable and account for the
effect of this on brand attitude.

Page 1 of 106
References
Aaker, D. A. (1996). Measuring brand equity across products and markets. California
management review, 38(3), 103.
Aaker, D. A., & Shansby, J. G. (1982). Positioning your product. Business horizons, 25(3),
56-62.
Aaker, J. (1999). The malleable self: The role of self-expression in persuasion. Available at
SSRN 945453.
Aaker, J., Benet-Martinez, V., & Garolera, J. (2001). Consumption symbols as carriers of
culture: A study of Japanese and Spanish brand personality constucts. Journal of
personality and social psychology, 81(3), 492.
Aaker, J. L. (1997). Dimensions of brand personality. Journal of Marketing Research, 347-
356.
Aggarwal, P., & McGill, A. L. (2007). Is that car smiling at me? Schema congruity as a basis
for evaluating anthropomorphized products. Journal of consumer research, 34(4),
468-479.
Arthur, W. B. (1996). Increasing Returns and. Harvard Business Review, 74(4), 100-109.
Azoulay, A. (2005). The malleable personality of brands: the winning facets. Paper presented
at the Proceedings of.
Azoulay, A., & Kapferer, J.-N. (2003). Do brand personality scales really measure brand
personality? The Journal of Brand Management, 11(2), 143-155.
Baumeister, R. F., Bratslavsky, E., Finkenauer, C., & Vohs, K. D. (2001). Bad is stronger
than good. Review of general psychology, 5(4), 323.
Belk, R. (1988). Possessions and self: Wiley Online Library.
Boulding, W., Lee, E., & Staelin, R. (1994). Mastering the mix: Do advertising, promotion,
and sales force activities lead to differentiation? Journal of Marketing Research, 159-
172.
Cattell, H. E., & Mead, A. D. (2008). The sixteen personality factor questionnaire (16PF).
The SAGE handbook of personality theory and assessment, 2, 135-178.
Costa, P. T., & McCrae, R. R. (1992). Normal personality assessment in clinical practice: The
NEO Personality Inventory. Psychological assessment, 4(1), 5.
Diamantopoulos, A., Smith, G., & Grime, I. (2005). The impact of brand extensions on brand
personality: experimental evidence. European Journal of Marketing, 39(1/2), 129-
149.
Eisend, M., & Stokburger-Sauer, N. E. (2013). Brand personality: A meta-analytic review of
antecedents and consequences. Marketing Letters, 24(3), 205-216.
Fournier, S. (1998). Consumers and their brands: Developing relationship theory in consumer
research. Journal of consumer research, 24(4), 343-353.
Freling, T. H., & Forbes, L. P. (2005). An empirical analysis of the brand personality effect.
Journal of Product & Brand Management, 14(7), 404-413.
Gardner, B. B., & Levy, S. J. (1955). The product and the brand. Harvard Business Review,
33(2), 33-39.
Geuens, M., Weijters, B., & De Wulf, K. (2009). A new measure of brand personality.
International Journal of Research in Marketing, 26(2), 97-107.
Goldberg, L. R. (1990). An alternative" description of personality": the big-five factor
structure. Journal of personality and social psychology, 59(6), 1216.
Grohmann, B. (2009). Gender dimensions of brand personality. Journal of Marketing
Research, 46(1), 105-119.

Page 2 of 106
Hayes, A. F. (2012). PROCESS: A versatile computational tool for observed variable
mediation, moderation, and conditional process modeling.
Herzberg, F. (1974). Motivation-hygiene profiles: Pinpointing what ails the organization.
Organizational Dynamics, 3(2), 18-29.
images.google.com. (2015). Retrieved 29 June 2015, 2015, from https://images.google.com/
Jewell, R. D., & Barone, M. J. (2007). Norm violations and the role of marketplace
comparisons in positioning brands. Journal of the Academy of Marketing Science,
35(4), 550-559.
Kale, S. H., & Shrivastava, S. (2003). The enneagram system for enhancing workplace
spirituality. Journal of Management Development, 22(4), 308-328.
Kalra, A., & Goodstein, R. C. (1998). The impact of advertising positioning strategies on
consumer price sensitivity. Journal of Marketing Research, 210-224.
Kaplan, M. F. (1971). The determination of trait redundancy in personality impression
formation. Psychonomic Science, 23(4), 280-282.
Keller, K. L. (1993). Conceptualizing, measuring, and managing customer-based brand
equity. The Journal of Marketing, 1-22.
Keller, K. L. (1999). Brand mantras: Rationale, criteria and examples. Journal of Marketing
Management, 15(1-3), 43-51.
Keller, K. L. (2000). The brand report card. Harvard Business Review, 78(1), 147-158.
Keller, K. L. (2001). Building customer-based brand equity: a blueprint for creating strong
brands: Marketing Science Institute Cambridge, MA.
Keller, K. L. (2013). Strategic Brand Management: Building, Measuring, and Managing
Brand Equity (4th Edition - Global Edition ed.): Pearson Education, Inc.
Keller, K. L., & Lehmann, D. R. (2006). Brands and branding: Research findings and future
priorities. Marketing Science, 25(6), 740-759.
Keller, K. L., & Richey, K. (2006). The importance of corporate brand personality traits to a
successful 21st century business. Journal of Brand Management, 14(1), 74-81.
Keller, K. L., Sternthal, B., & Tybout, A. (2002). Three questions you need to ask about your
brand. Harvard Business Review, 80(9), 80-89.
Kervyn, N., Bergsieker, H. B., & Fiske, S. T. (2012). The innuendo effect: Hearing the
positive but inferring the negative. Journal of Experimental Social Psychology, 48(1),
77-85.
Kim, C. K., Han, D., & Park, S. B. (2001). The effect of brand personality and brand
identification on brand loyalty: Applying the theory of social identification. Japanese
Psychological Research, 43(4), 195-206.
Kotler, P., Keller, K. L., Ancarani, F., & Costabile, M. (2014). Marketing management 14/e
(14th Edition - Global Edition ed.): Pearson.
Lee, J.-S., & Back, K.-J. (2010). Examining antecedents and consequences of brand
personality in the upper-upscale business hotel segment. Journal of Travel & Tourism
Marketing, 27(2), 132-145.
Li, X., Yen, C.-L. A., & Uysal, M. (2014). Differentiating with brand personality in economy
hotel segment. Journal of Vacation Marketing, 20(4), 323-333.
Lin, Y.-C., & Huang, P.-W. (2012). Effects of the big five brand personality dimensions on
repurchase intentions: Using branded coffee chains as examples. Journal of
Foodservice Business Research, 15(1), 1-18.
Louis, D., & Lombart, C. (2010). Impact of brand personality on three major relational
consequences (trust, attachment, and commitment to the brand). Journal of Product &
Brand Management, 19(2), 114-130.
Maehle, N., & Supphellen, M. (2011). In search of the sources of brand personality.
International Journal of Market Research, 53(1), 95-114.
Page 3 of 106
Malär, L., Nyffenegger, B., Krohmer, H., & Hoyer, W. D. (2012). Implementing an intended
brand personality: a dyadic perspective. Journal of the Academy of Marketing
Science, 40(5), 728-744.
Maslow, A. H. (1943). A theory of human motivation. Psychological review, 50(4), 370.
Mulyanegara, R. C., Tsarenko, Y., & Anderson, A. (2009). The Big Five and brand
personality: Investigating the impact of consumer personality on preferences towards
particular brand personality. Journal of Brand Management, 16(4), 234-247.
Muniz Jr, A. M., & O’guinn, T. C. (2001). Brand community. Journal of consumer research,
27(4), 412-432.
Murray, J. B. (1990). Review of research on the Myers-Briggs type indicator. Perceptual and
Motor skills, 70(3c), 1187-1202.
Nidorf, L. J., & Crockett, W. H. (1965). Cognitive complexity and the integration of
conflicting information in written impressions. The Journal of social psychology,
66(1), 165-169.
Nisbett, R. E., & Wilson, T. D. (1977). The halo effect: Evidence for unconscious alteration
of judgments. Journal of personality and social psychology, 35(4), 250.
Ofman, D. (2001). Core qualities: A gateway to human resources: Scriptum Management.
Phau, I., & Lau, K. C. (2001). Brand personality and consumer self-expression: single or dual
carriageway? The Journal of Brand Management, 8(6), 428-444.
Plummer, J. T. (1984). How personality makes a difference. Journal of advertising research,
24(6), 27-31.
Porras, J. I., & Silvers, R. C. (1991). Organization development and transformation. Annual
review of Psychology, 42(1), 51-78.
Porter, M. E. (1991). Towards a dynamic theory of strategy. Strategic management journal,
12(S2), 95-117.
Rich, S. (2010). What is Personal Development? Retrieved April 9, 2015, 2015, from
http://simonarich.com/what-is-personal-development
Romaniuk, J., & Gaillard, E. (2007). The relationship between unique brand associations,
brand usage and brand performance: analysis across eight categories. Journal of
Marketing Management, 23(3-4), 267-284.
Romaniuk, J., Sharp, B., & Ehrenberg, A. (2007). Evidence concerning the importance of
perceived brand differentiation. Australasian Marketing Journal (AMJ), 15(2), 42-54.
Sachau, D. A. (2007). Resurrecting the motivation-hygiene theory: Herzberg and the positive
psychology movement. Human resource development review, 6(4), 377-393.
Saucier, G. (1994). Mini-markers: A brief version of Goldberg's unipolar Big-Five markers.
Journal of personality assessment, 63(3), 506-516.
Siguaw, J. A., Mattila, A., & Austin, J. R. (1999). The brand-personality scale. The Cornell
Hotel and Restaurant Administration Quarterly, 40(3), 48-45.
Smit, E. G., Van den Berge, E., & Franzen, G. (2003). Brands are just like real people.
Branding and Advertising. Copenhagen Business School Press, Copenhagen, 22-43.
Sung, Y., Choi, S. M., Ahn, H., & Song, Y. A. (2015). Dimensions of Luxury Brand
Personality: Scale Development and Validation. Psychology & Marketing, 32(1), 121-
132.
Sung, Y., & Kim, J. (2010). Effects of brand personality on brand trust and brand affect.
Psychology & Marketing, 27(7), 639-661.
Sung, Y., & Tinkham, S. F. (2005). Brand personality structures in the United States and
Korea: Common and culture-specific factors. Journal of consumer psychology, 15(4),
334-350.
Till, B. D., & Shimp, T. A. (1998). Endorsers in advertising: The case of negative celebrity
information. Journal of advertising, 67-82.

Page 4 of 106
Wetzel, C. G., Wilson, T. D., & Kort, J. (1981). The halo effect revisited: Forewarned is not
forearmed. Journal of Experimental Social Psychology, 17(4), 427-439.
Woren, N., Ruddle, K., & Moore, K. (1999). From organizational development to change
management. Journal of Applied Behavioral Science, 35(3), 273-287.

Page 5 of 106
Appendix 1 - Qualitative pre-test 1 results
Category 1 - Consumer Electronics/Technology
CQ 1 = Creative
Pitfall (CQ 1) = Chaotic

Page 6 of 106
Challenge (CQ 1) = Analytical
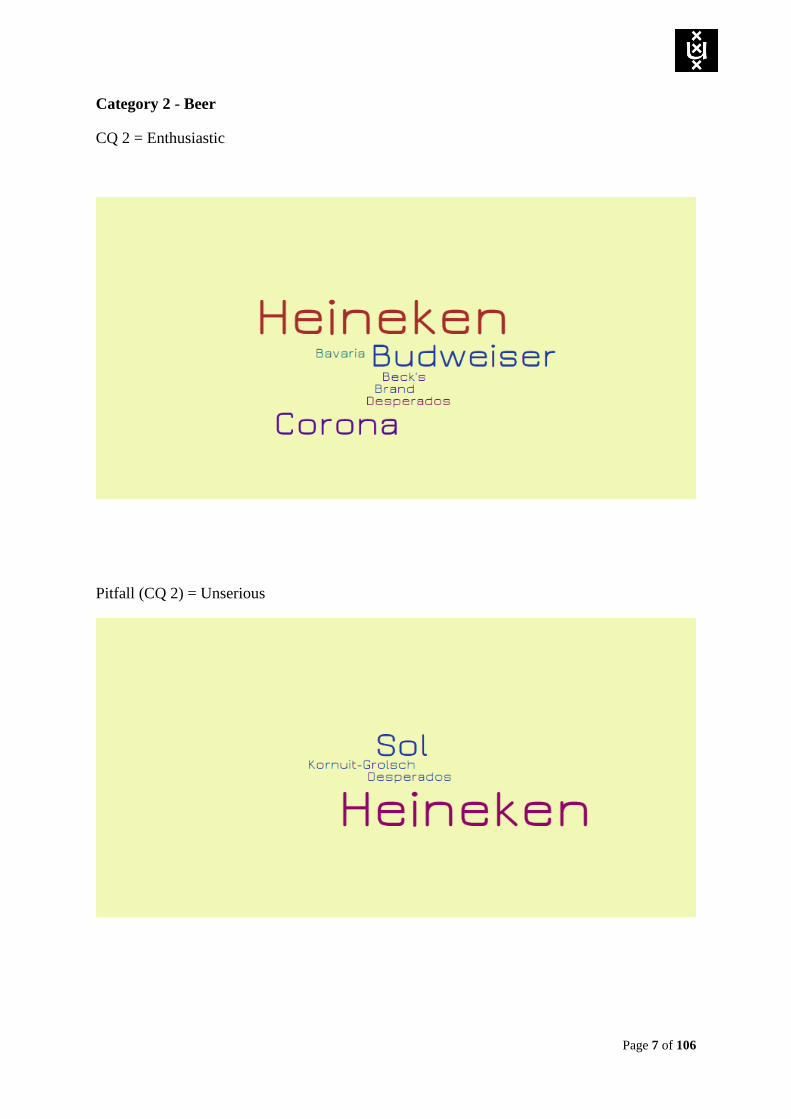
Page 7 of 106
Category 2 - Beer
CQ 2 = Enthusiastic
Pitfall (CQ 2) = Unserious

Page 8 of 106
Challenge (CQ 2) = Inexpressive

Page 9 of 106
Category 3 - Cars
CQ 3 = Confident
Pitfall (CQ 3) = Arrogant

Page 10 of 106
Challenge (CQ 3) = Modest

Page 11 of 106
Appendix 2 - Qualitative pre-test 2 results
CQ 1 = Creative
Pitfall (CQ 1) = Chaotic

Page 12 of 106
Challenge (CQ 1) = Analytical

Page 13 of 106
CQ 2 = Confident
Pitfall (CQ 2) = Arrogant

Page 14 of 106
Challenge (CQ 2) = Modest

Page 15 of 106
CQ 3 = Sympathetic
Pitfall (CQ 3) = Sentimental

Page 16 of 106
Challenge (CQ 3) = Pragmatic
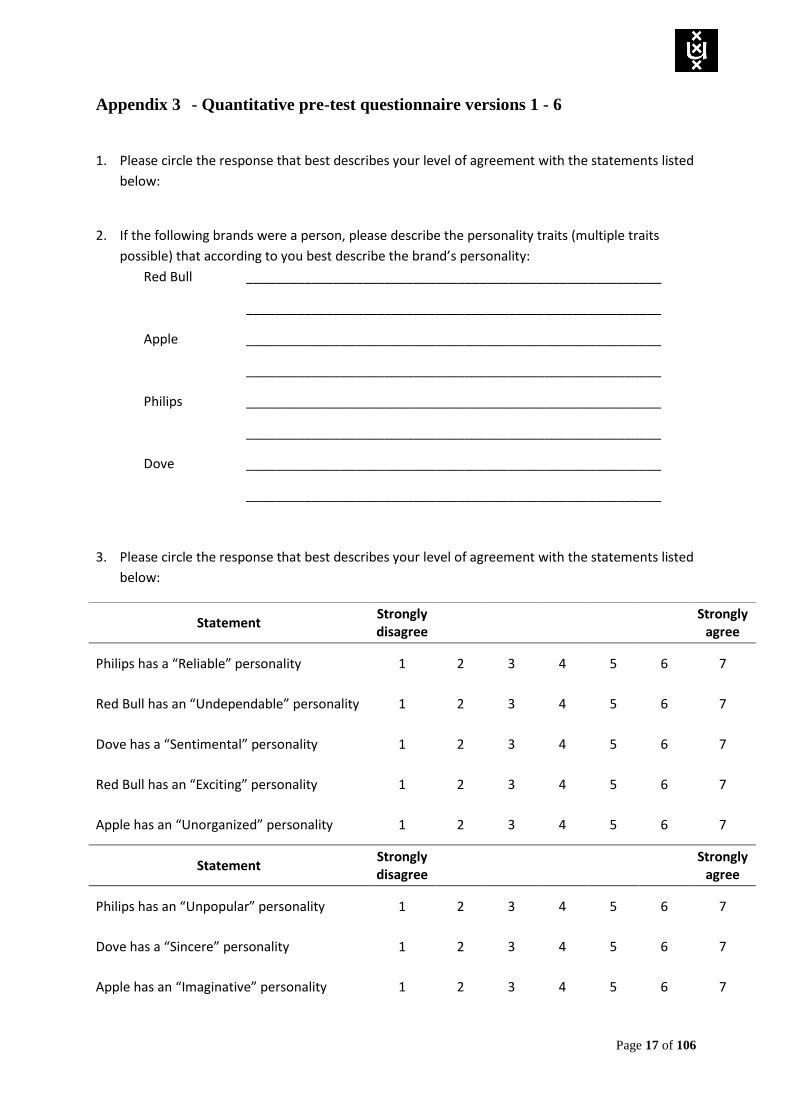
Page 17 of 106
Appendix 3 - Quantitative pre-test questionnaire versions 1 - 6
1. Please circle the response that best describes your level of agreement with the statements listed
below:
2. If the following brands were a person, please describe the personality traits (multiple traits
possible) that according to you best describe the brand’s personality:
Red Bull _________________________________________________________
_________________________________________________________
Apple _________________________________________________________
_________________________________________________________
Philips _________________________________________________________
_________________________________________________________
Dove _________________________________________________________
_________________________________________________________
3. Please circle the response that best describes your level of agreement with the statements listed
below:
Statement Strongly disagree
Strongly
agree
Philips has a “Reliable” personality 1 2 3 4 5 6 7
Red Bull has an “Undependable” personality 1 2 3 4 5 6 7
Dove has a “Sentimental” personality 1 2 3 4 5 6 7
Red Bull has an “Exciting” personality 1 2 3 4 5 6 7
Apple has an “Unorganized” personality 1 2 3 4 5 6 7
Statement Strongly disagree
Strongly
agree
Philips has an “Unpopular” personality 1 2 3 4 5 6 7
Dove has a “Sincere” personality 1 2 3 4 5 6 7
Apple has an “Imaginative” personality 1 2 3 4 5 6 7

Page 18 of 106
Red Bull has an “Active” personality 1 2 3 4 5 6 7
Dove has a “Warm” personality 1 2 3 4 5 6 7
Red Bull has a “Careless” personality 1 2 3 4 5 6 7
Apple has a “Creative” personality 1 2 3 4 5 6 7
Dove has a “Sympathetic” personality 1 2 3 4 5 6 7
Apple has a “Chaotic” personality 1 2 3 4 5 6 7
Philips has an “Intelligent” personality 1 2 3 4 5 6 7
Red Bull has an “Impulsive” personality 1 2 3 4 5 6 7
Philips has a “Nerdy” personality 1 2 3 4 5 6 7
Dove has an “Overprotective” personality 1 2 3 4 5 6 7
Philips has a “Competent” personality 1 2 3 4 5 6 7
Apple has a “Sloppy” personality 1 2 3 4 5 6 7
Philips has an “Uncharismatic” personality 1 2 3 4 5 6 7
Dove has an “Emotional” personality 1 2 3 4 5 6 7
Apple has an “Idea-oriented” personality 1 2 3 4 5 6 7
Red Bull has a “Daring” personality 1 2 3 4 5 6 7

Page 19 of 106
4. Please circle the response that best describes your level of agreement with the statements listed
below:
5. If the following brands were a person, please describe the personality traits (multiple traits
possible) that according to you best describe the brand’s personality:
Virgin _________________________________________________________
_________________________________________________________
Google _________________________________________________________
_________________________________________________________
BBC _________________________________________________________
_________________________________________________________
Calvé _________________________________________________________
_________________________________________________________
6. Please circle the response that best describes your level of agreement with the statements listed
below:
Statement Strongly disagree
Strongly
agree
I am familiar with the brand “Virgin” 1 2 3 4 5 6 7
I am familiar with the brand “Google” 1 2 3 4 5 6 7
I am familiar with the brand “BBC” 1 2 3 4 5 6 7
I am familiar with the brand “Calvé” 1 2 3 4 5 6 7
Statement Strongly disagree
Strongly
agree
BBC has a “Reliable” personality 1 2 3 4 5 6 7
Virgin has an “Undependable” personality 1 2 3 4 5 6 7
Calvé has a “Sentimental” personality 1 2 3 4 5 6 7
Virgin has an “Exciting” personality 1 2 3 4 5 6 7
Google has an “Unorganized” personality 1 2 3 4 5 6 7

Page 20 of 106
Statement Strongly disagree
Strongly
agree
BBC has an “Unpopular” personality 1 2 3 4 5 6 7
Calvé has a “Sincere” personality 1 2 3 4 5 6 7
Google has an “Imaginative” personality 1 2 3 4 5 6 7
Virgin has an “Active” personality 1 2 3 4 5 6 7
Calvé has a “Warm” personality 1 2 3 4 5 6 7
Virgin has a “Careless” personality 1 2 3 4 5 6 7
Google has a “Creative” personality 1 2 3 4 5 6 7
Calvé has a “Sympathetic” personality 1 2 3 4 5 6 7
Google has a “Chaotic” personality 1 2 3 4 5 6 7
BBC has an “Intelligent” personality 1 2 3 4 5 6 7
Virgin has an “Impulsive” personality 1 2 3 4 5 6 7
BBC has a “Nerdy” personality 1 2 3 4 5 6 7
Calvé has an “Overprotective” personality 1 2 3 4 5 6 7
BBC has a “Competent” personality 1 2 3 4 5 6 7
Google has a “Sloppy” personality 1 2 3 4 5 6 7
BBC has an “Uncharismatic” personality 1 2 3 4 5 6 7
Calvé has an “Emotional” personality 1 2 3 4 5 6 7
Google has an “Idea-oriented” personality 1 2 3 4 5 6 7
Virgin has a “Daring” personality 1 2 3 4 5 6 7
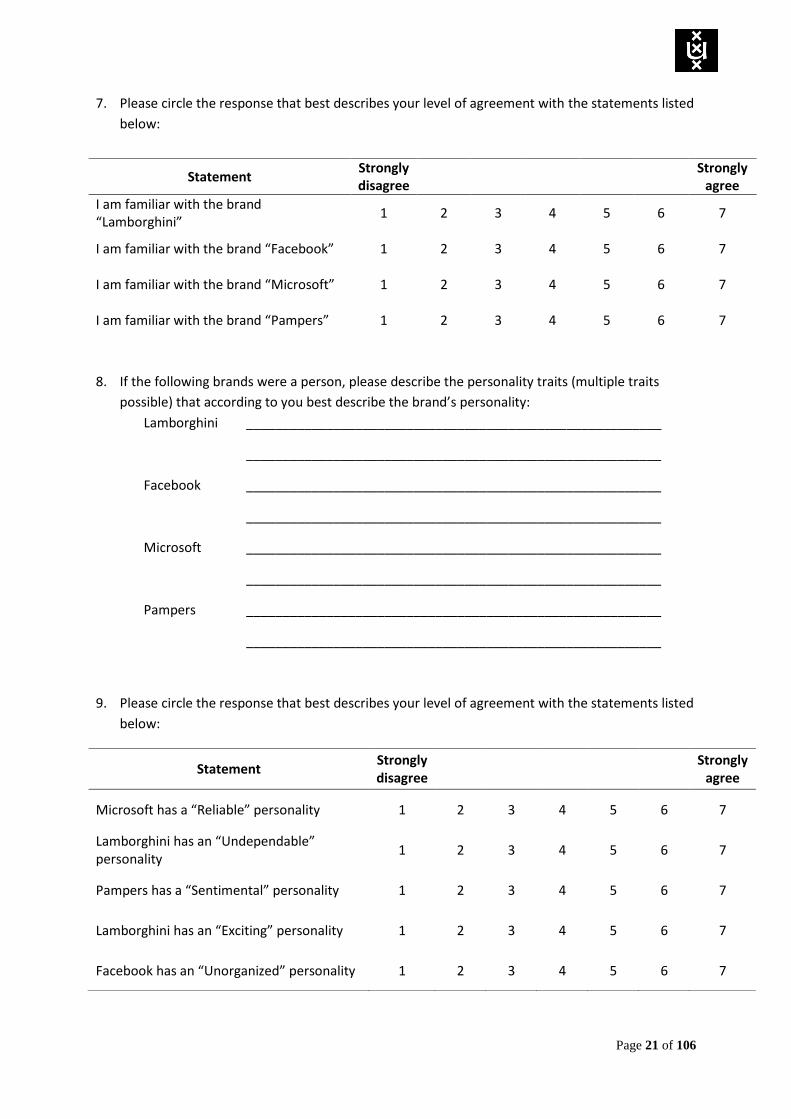
Page 21 of 106
7. Please circle the response that best describes your level of agreement with the statements listed
below:
8. If the following brands were a person, please describe the personality traits (multiple traits
possible) that according to you best describe the brand’s personality:
Lamborghini _________________________________________________________
_________________________________________________________
Facebook _________________________________________________________
_________________________________________________________
Microsoft _________________________________________________________
_________________________________________________________
Pampers _________________________________________________________
_________________________________________________________
9. Please circle the response that best describes your level of agreement with the statements listed
below:
Statement Strongly disagree
Strongly
agree
I am familiar with the brand “Lamborghini”
1 2 3 4 5 6 7
I am familiar with the brand “Facebook” 1 2 3 4 5 6 7
I am familiar with the brand “Microsoft” 1 2 3 4 5 6 7
I am familiar with the brand “Pampers” 1 2 3 4 5 6 7
Statement Strongly disagree
Strongly
agree
Microsoft has a “Reliable” personality 1 2 3 4 5 6 7
Lamborghini has an “Undependable” personality
1 2 3 4 5 6 7
Pampers has a “Sentimental” personality 1 2 3 4 5 6 7
Lamborghini has an “Exciting” personality 1 2 3 4 5 6 7
Facebook has an “Unorganized” personality 1 2 3 4 5 6 7

Page 22 of 106
Statement Strongly disagree
Strongly
agree
Microsoft has an “Unpopular” personality 1 2 3 4 5 6 7
Pampers has a “Sincere” personality 1 2 3 4 5 6 7
Facebook has an “Imaginative” personality 1 2 3 4 5 6 7
Lamborghini has an “Active” personality 1 2 3 4 5 6 7
Pampers has a “Warm” personality 1 2 3 4 5 6 7
Lamborghini has a “Careless” personality 1 2 3 4 5 6 7
Facebook has a “Creative” personality 1 2 3 4 5 6 7
Pampers has a “Sympathetic” personality 1 2 3 4 5 6 7
Facebook has a “Chaotic” personality 1 2 3 4 5 6 7
Microsoft has an “Intelligent” personality 1 2 3 4 5 6 7
Lamborghini has an “Impulsive” personality 1 2 3 4 5 6 7
Microsoft has a “Nerdy” personality 1 2 3 4 5 6 7
Pampers has an “Overprotective” personality
1 2 3 4 5 6 7
Microsoft has a “Competent” personality 1 2 3 4 5 6 7
Facebook has a “Sloppy” personality 1 2 3 4 5 6 7
Microsoft has an “Uncharismatic” personality
1 2 3 4 5 6 7
Pampers has an “Emotional” personality 1 2 3 4 5 6 7
Facebook has an “Idea-oriented” personality 1 2 3 4 5 6 7
Lamborghini has a “Daring” personality 1 2 3 4 5 6 7

Page 23 of 106
10. Please circle the response that best describes your level of agreement with the statements listed
below:
11. If the following brands were a person, please describe the personality traits (multiple traits
possible) that according to you best describe the brand’s personality:
MTV _________________________________________________________
_________________________________________________________
V&D _________________________________________________________
_________________________________________________________
Oracle _________________________________________________________
_________________________________________________________
Ben & Jerry’s _________________________________________________________
_________________________________________________________
12. Please circle the response that best describes your level of agreement with the statements listed
below:
Statement Strongly disagree
Strongly
agree
I am familiar with the brand “MTV” 1 2 3 4 5 6 7
I am familiar with the brand “V&D” 1 2 3 4 5 6 7
I am familiar with the brand “Oracle” 1 2 3 4 5 6 7
I am familiar with the brand “Ben & Jerry’s”
1 2 3 4 5 6 7
Statement Strongly disagree
Strongly
agree
Oracle has a “Reliable” personality 1 2 3 4 5 6 7
MTV has an “Undependable” personality 1 2 3 4 5 6 7
Ben & Jerry’s has a “Sentimental” personality
1 2 3 4 5 6 7
MTV has an “Exciting” personality 1 2 3 4 5 6 7
V&D has an “Unorganized” personality 1 2 3 4 5 6 7

Page 24 of 106
Statement Strongly disagree
Strongly
agree
Oracle has an “Unpopular” personality 1 2 3 4 5 6 7
Ben & Jerry’s has a “Sincere” personality 1 2 3 4 5 6 7
V&D has an “Imaginative” personality 1 2 3 4 5 6 7
MTV has an “Active” personality 1 2 3 4 5 6 7
Ben & Jerry’s has a “Warm” personality 1 2 3 4 5 6 7
MTV has a “Careless” personality 1 2 3 4 5 6 7
V&D has a “Creative” personality 1 2 3 4 5 6 7
Ben & Jerry’s has a “Sympathetic” personality
1 2 3 4 5 6 7
V&D has a “Chaotic” personality 1 2 3 4 5 6 7
Oracle has an “Intelligent” personality 1 2 3 4 5 6 7
MTV has an “Impulsive” personality 1 2 3 4 5 6 7
Oracle has a “Nerdy” personality 1 2 3 4 5 6 7
Ben & Jerry’s has an “Overprotective” personality
1 2 3 4 5 6 7
Oracle has a “Competent” personality 1 2 3 4 5 6 7
V&D has a “Sloppy” personality 1 2 3 4 5 6 7
Oracle has an “Uncharismatic” personality 1 2 3 4 5 6 7
Ben & Jerry’s has an “Emotional” personality 1 2 3 4 5 6 7
V&D has an “Idea-oriented” personality 1 2 3 4 5 6 7
MTV has a “Daring” personality 1 2 3 4 5 6 7
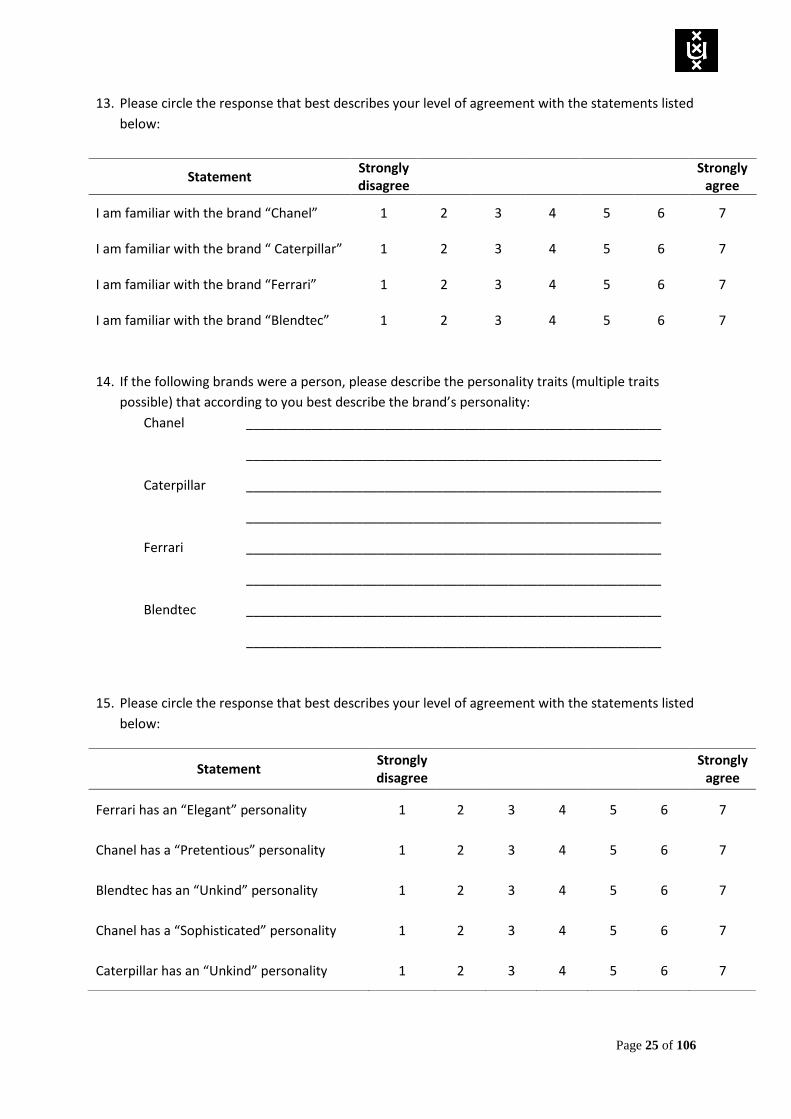
Page 25 of 106
13. Please circle the response that best describes your level of agreement with the statements listed
below:
14. If the following brands were a person, please describe the personality traits (multiple traits
possible) that according to you best describe the brand’s personality:
Chanel _________________________________________________________
_________________________________________________________
Caterpillar _________________________________________________________
_________________________________________________________
Ferrari _________________________________________________________
_________________________________________________________
Blendtec _________________________________________________________
_________________________________________________________
15. Please circle the response that best describes your level of agreement with the statements listed
below:
Statement Strongly disagree
Strongly
agree
I am familiar with the brand “Chanel” 1 2 3 4 5 6 7
I am familiar with the brand “ Caterpillar” 1 2 3 4 5 6 7
I am familiar with the brand “Ferrari” 1 2 3 4 5 6 7
I am familiar with the brand “Blendtec” 1 2 3 4 5 6 7
Statement Strongly disagree
Strongly
agree
Ferrari has an “Elegant” personality 1 2 3 4 5 6 7
Chanel has a “Pretentious” personality 1 2 3 4 5 6 7
Blendtec has an “Unkind” personality 1 2 3 4 5 6 7
Chanel has a “Sophisticated” personality 1 2 3 4 5 6 7
Caterpillar has an “Unkind” personality 1 2 3 4 5 6 7

Page 26 of 106
Statement Strongly disagree
Strongly
agree
Ferrari has a “Cocky” personality 1 2 3 4 5 6 7
Blendtec has a “Rugged” personality 1 2 3 4 5 6 7
Caterpillar has a “Rugged” personality 1 2 3 4 5 6 7
Chanel has a “Classy” personality 1 2 3 4 5 6 7
Blendtec has a “Tough” personality 1 2 3 4 5 6 7
Chanel has a “Stuck-up” personality 1 2 3 4 5 6 7
Caterpillar has a “Tough” personality 1 2 3 4 5 6 7
Blendtec has an “Outdoorsy” personality 1 2 3 4 5 6 7
Caterpillar has an “Unsympathetic” personality
1 2 3 4 5 6 7
Ferrari has a “Classy” personality 1 2 3 4 5 6 7
Chanel has a “Cocky” personality 1 2 3 4 5 6 7
Ferrari has a “Pretentious” personality 1 2 3 4 5 6 7
Blendtec has an “Unsympathetic” personality
1 2 3 4 5 6 7
Ferrari has a “Sophisticated” personality 1 2 3 4 5 6 7
Caterpillar has an “Uncharitable” personality 1 2 3 4 5 6 7
Ferrari has a “Stuck-up” personality 1 2 3 4 5 6 7
Blendtec has an “Uncharitable” personality 1 2 3 4 5 6 7
Caterpillar has an “Outdoorsy” personality 1 2 3 4 5 6 7
Chanel has an “Elegant” personality 1 2 3 4 5 6 7

Page 27 of 106
16. Please circle the response that best describes your level of agreement with the statements listed
below:
17. If the following brands were a person, please describe the personality traits (multiple traits
possible) that according to you best describe the brand’s personality:
Rolex _________________________________________________________
_________________________________________________________
Timberland _________________________________________________________
_________________________________________________________
Louis Vuitton _________________________________________________________
_________________________________________________________
Harley Davidson _________________________________________________________
_________________________________________________________
18. Please circle the response that best describes your level of agreement with the statements listed
below:
Statement Strongly disagree
Strongly
agree
I am familiar with the brand “Rolex” 1 2 3 4 5 6 7
I am familiar with the brand “Timberland” 1 2 3 4 5 6 7
I am familiar with the brand “Louis Vuitton”
1 2 3 4 5 6 7
I am familiar with the brand “Harley Davidson”
1 2 3 4 5 6 7
Statement Strongly disagree
Strongly
agree
Louis Vuitton has an “Elegant” personality 1 2 3 4 5 6 7
Rolex has a “Pretentious” personality 1 2 3 4 5 6 7
Harley Davidson has an “Unkind” personality 1 2 3 4 5 6 7
Rolex has a “Sophisticated” personality 1 2 3 4 5 6 7
Timberland has an “Unkind” personality 1 2 3 4 5 6 7

Page 28 of 106
Statement Strongly disagree
Strongly
agree
Louis Vuitton has a “Cocky” personality 1 2 3 4 5 6 7
Harley Davidson has a “Rugged” personality 1 2 3 4 5 6 7
Timberland has a “Rugged” personality 1 2 3 4 5 6 7
Rolex has a “Classy” personality 1 2 3 4 5 6 7
Harley Davidson has a “Tough” personality 1 2 3 4 5 6 7
Rolex has a “Stuck-up” personality 1 2 3 4 5 6 7
Timberland has a “Tough” personality 1 2 3 4 5 6 7
Harley Davidson has an “Outdoorsy” personality
1 2 3 4 5 6 7
Timberland has an “Unsympathetic” personality
1 2 3 4 5 6 7
Louis Vuitton has a “Classy” personality 1 2 3 4 5 6 7
Rolex has a “Cocky” personality 1 2 3 4 5 6 7
Louis Vuitton has a “Pretentious” personality
1 2 3 4 5 6 7
Harley Davidson has an “Unsympathetic” personality
1 2 3 4 5 6 7
Louis Vuitton has a “Sophisticated” personality
1 2 3 4 5 6 7
Timberland has an “Uncharitable” personality
1 2 3 4 5 6 7
Louis Vuitton has a “Stuck-up” personality 1 2 3 4 5 6 7
Harley Davidson has an “Uncharitable” personality
1 2 3 4 5 6 7
Timberland has an “Outdoorsy” personality 1 2 3 4 5 6 7
Rolex has an “Elegant” personality 1 2 3 4 5 6 7
Page 29 of 106
Appendix 4 - Study 1 Questionnaire
Version 1 - Core Quality brands
Page 30 of 106
Page 31 of 106

Page 32 of 106

Page 33 of 106
Page 34 of 106

Page 35 of 106
Version 2 - Pitfall brands
Page 36 of 106

Page 37 of 106
Page 38 of 106

Page 39 of 106

Page 40 of 106

Page 41 of 106
Version 3 - Challenge brands

Page 42 of 106
Page 43 of 106
Page 44 of 106

Page 45 of 106

Page 46 of 106
Page 47 of 106
Version 4 - Neutral brands
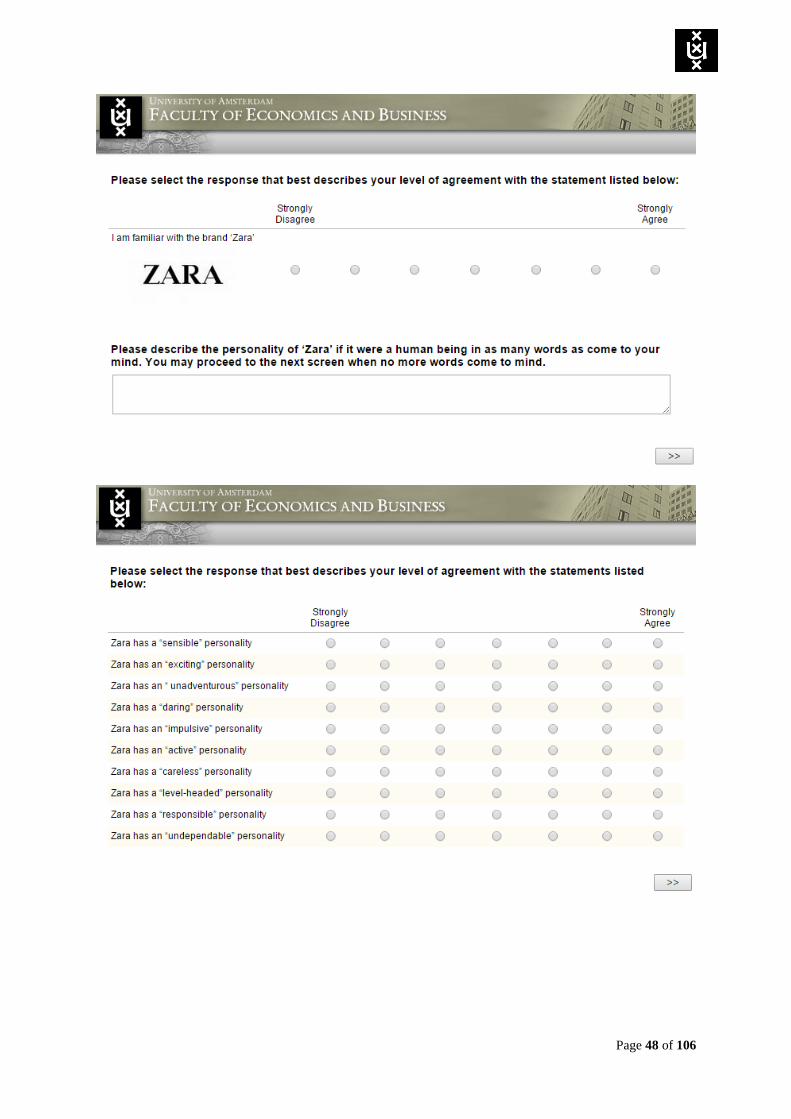
Page 48 of 106
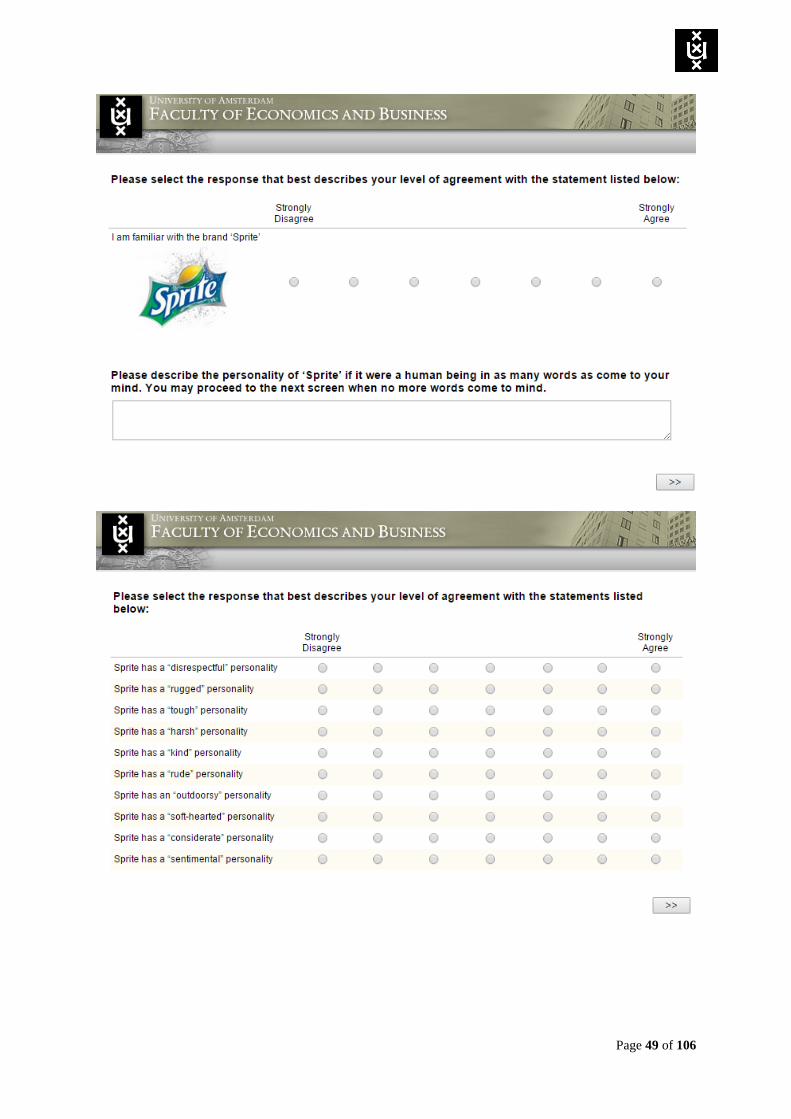
Page 49 of 106

Page 50 of 106

Page 51 of 106

Page 52 of 106

Page 53 of 106
Appendix 5 - Correlation matrices (Study 1)
Table 47: Means, Standard deviations, and Correlations (Brand personality Exciting)
Variables M SD 1 2 3
1 Exciting_CQ_Summated 5.04 1.17 (.756)
2 Exciting _PF_Summated 4.20 1.51 .596** (.697)
3 Exciting _CH_Summated 3.91 1.30 -.197* -.518** (.757)
**. Correlation is significant at the 0.01 level (2-tailed).
*. Correlation is significant at the 0.05 level (2-tailed).
Table 48: Means, Standard deviations, and Correlations (Brand personality Rugged)
Variables M SD 1 2 3
1 Rugged_CQ_Summated 4.38 1.71 (.879)
2 Rugged _PF_Summated 2.99 1.35 .628** (.764)
3 Rugged _CH_Summated 4.34 1.54 -.705** -.734** (.888)
**. Correlation is significant at the 0.01 level (2-tailed).
Table 49: Means, Standard deviations, and Correlations (Brand personality Competent)
Variables M SD 1 2 3
1 Competent_CQ_Summated 4.87 1.36 (.858)
2 Competent _PF_Summated 3.27 1.33 .393** (.748)
3 Competent _CH_Summated 4.77 1.29 -.144 -.714** (.865)
**. Correlation is significant at the 0.01 level (2-tailed).

Page 54 of 106
Appendix 6 - Study 2 experiment set-up
Confident (Core Quality)
Arrogant (Pitfall)
Humble (Challenge)

Page 55 of 106
Toothpaste images

Page 56 of 106
Exciting (Core Quality)
Careless (Pitfall)

Page 57 of 106
Responsible (Challenge)
Beer images
Page 58 of 106
Appendix 7 - Study 2 Questionnaire
Version 1 - Neutral, Core Quality scenarios

Page 59 of 106

Page 60 of 106

Page 61 of 106

Page 62 of 106
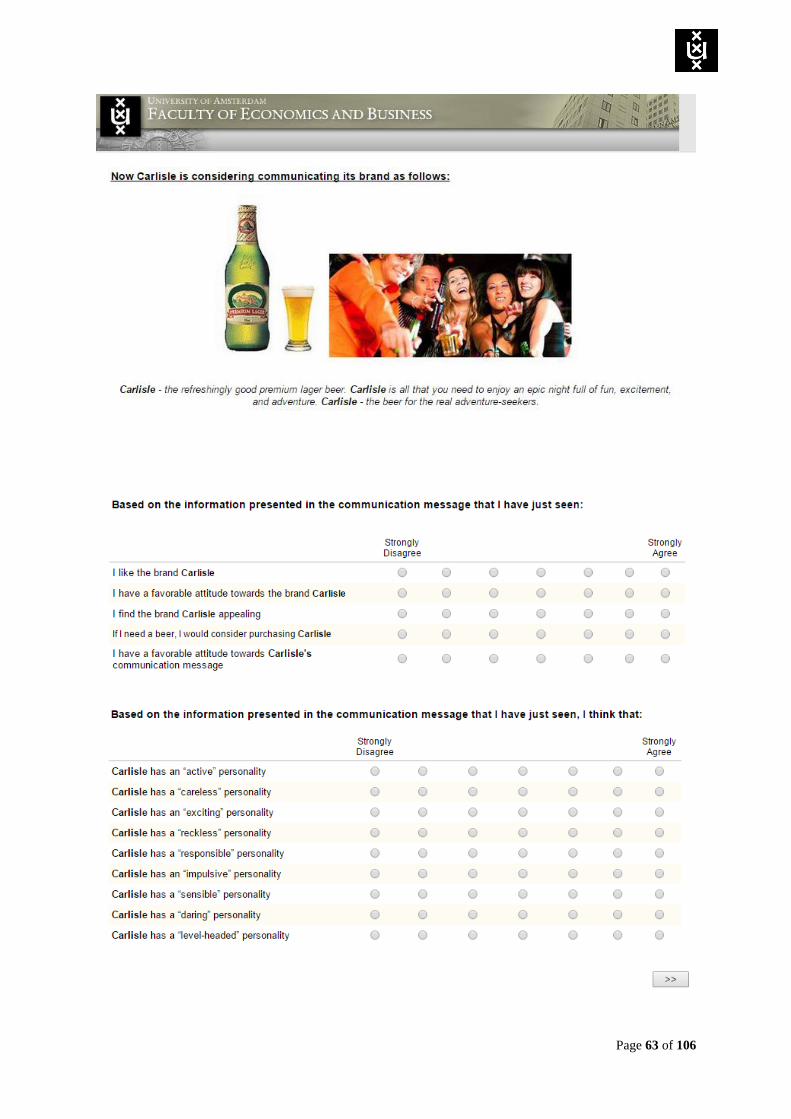
Page 63 of 106

Page 64 of 106

Page 65 of 106
Version 2 - Pitfall, Pitfall + Core Quality scenarios

Page 66 of 106

Page 67 of 106
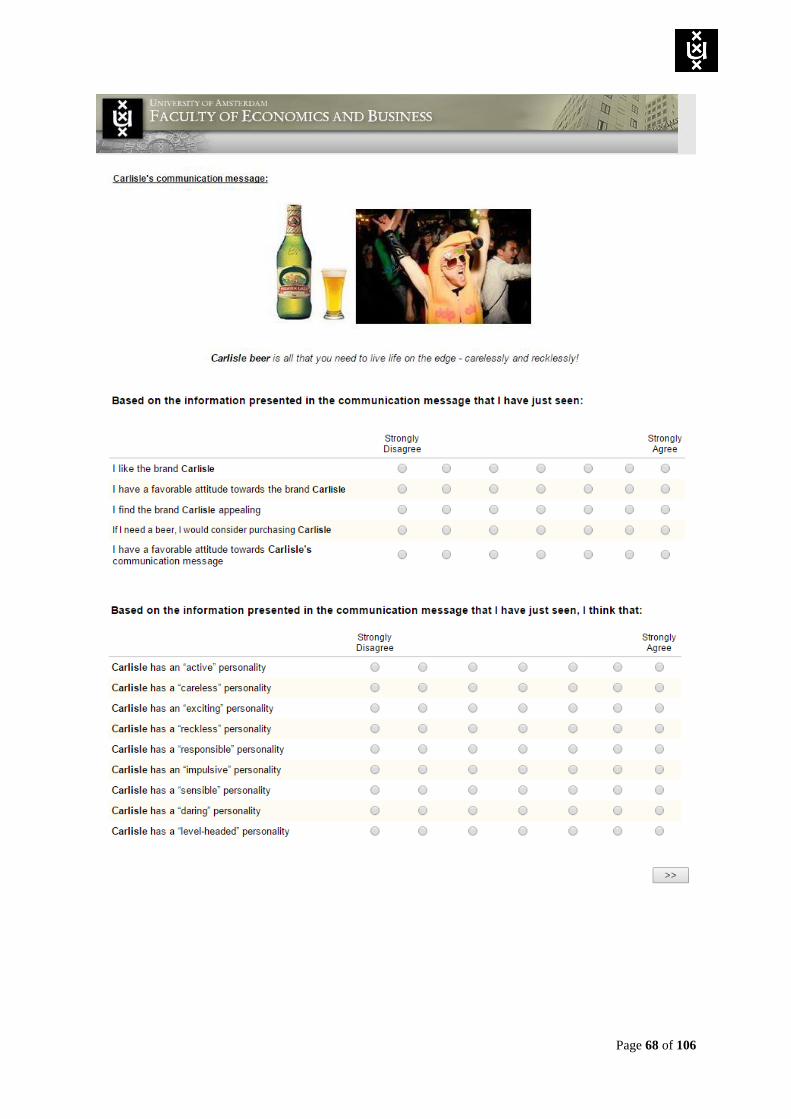
Page 68 of 106
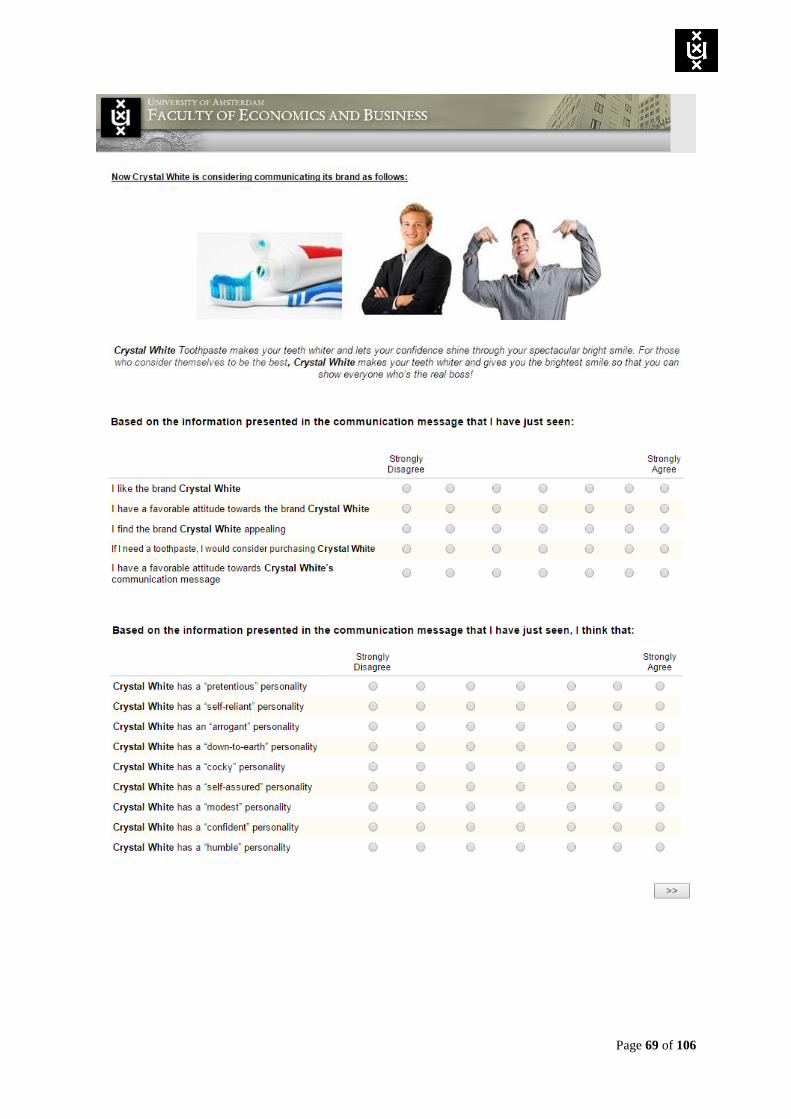
Page 69 of 106

Page 70 of 106

Page 71 of 106

Page 72 of 106
Version 3 - Challenge, Challenge + Core Quality scenarios
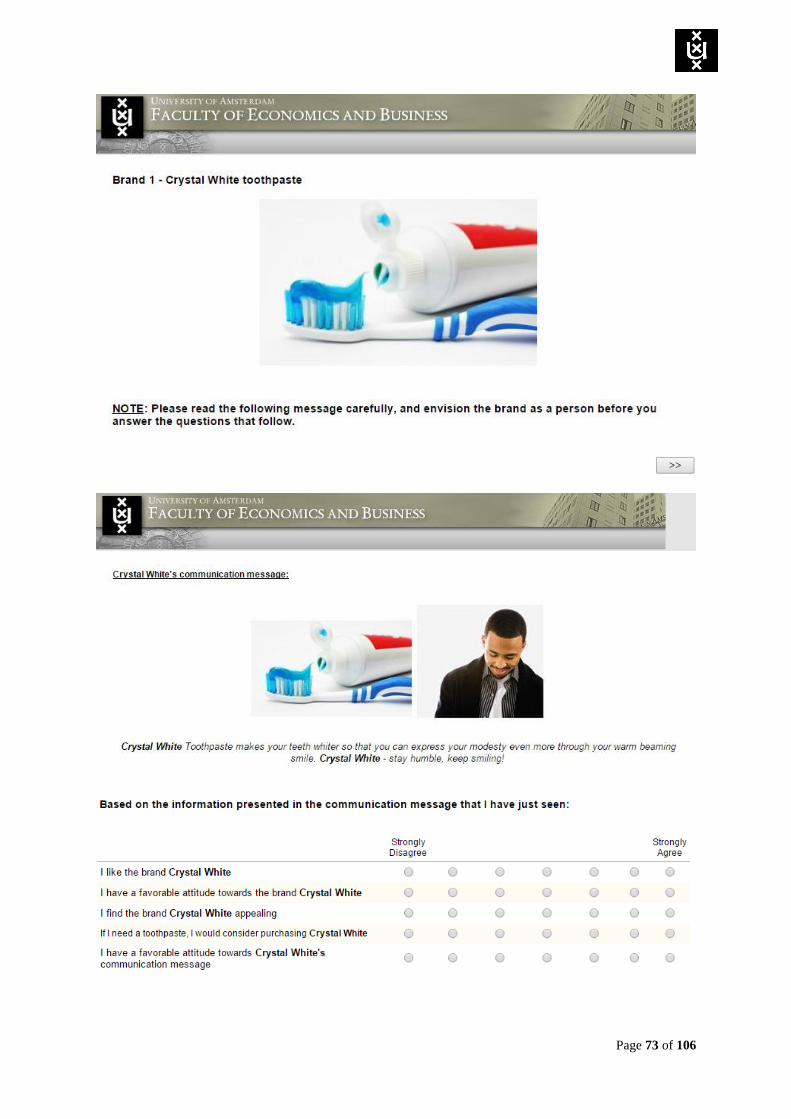
Page 73 of 106

Page 74 of 106
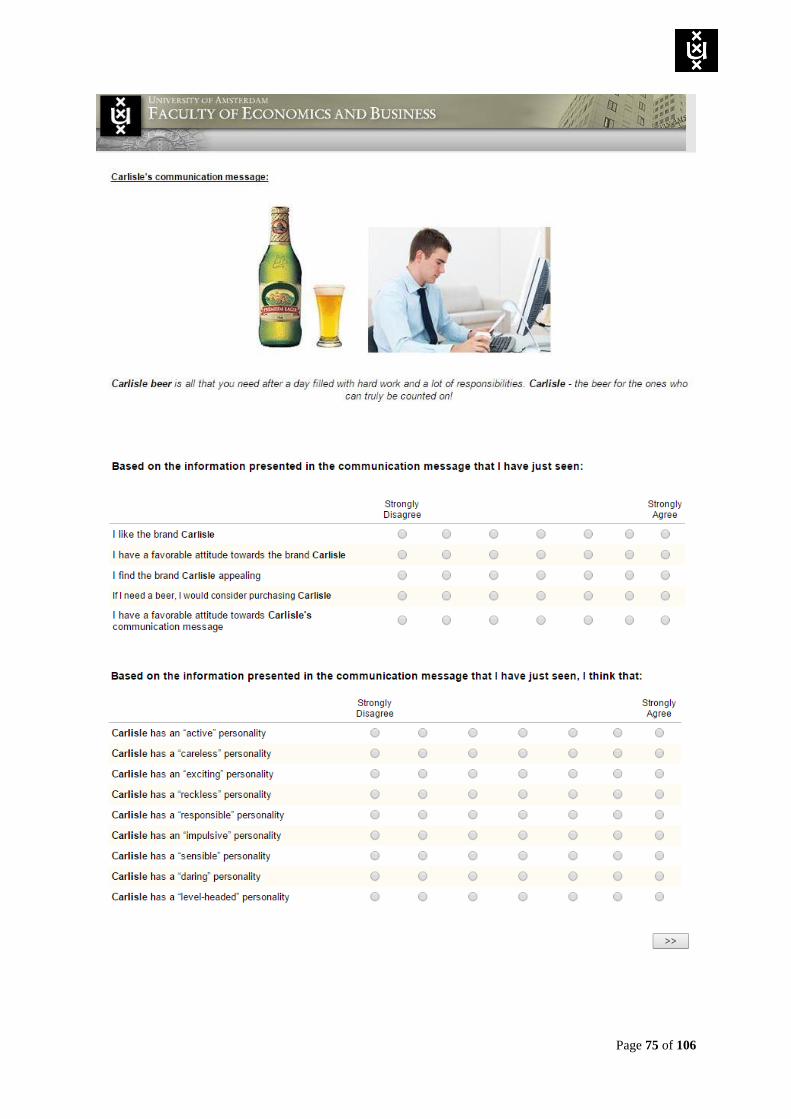
Page 75 of 106

Page 76 of 106

Page 77 of 106
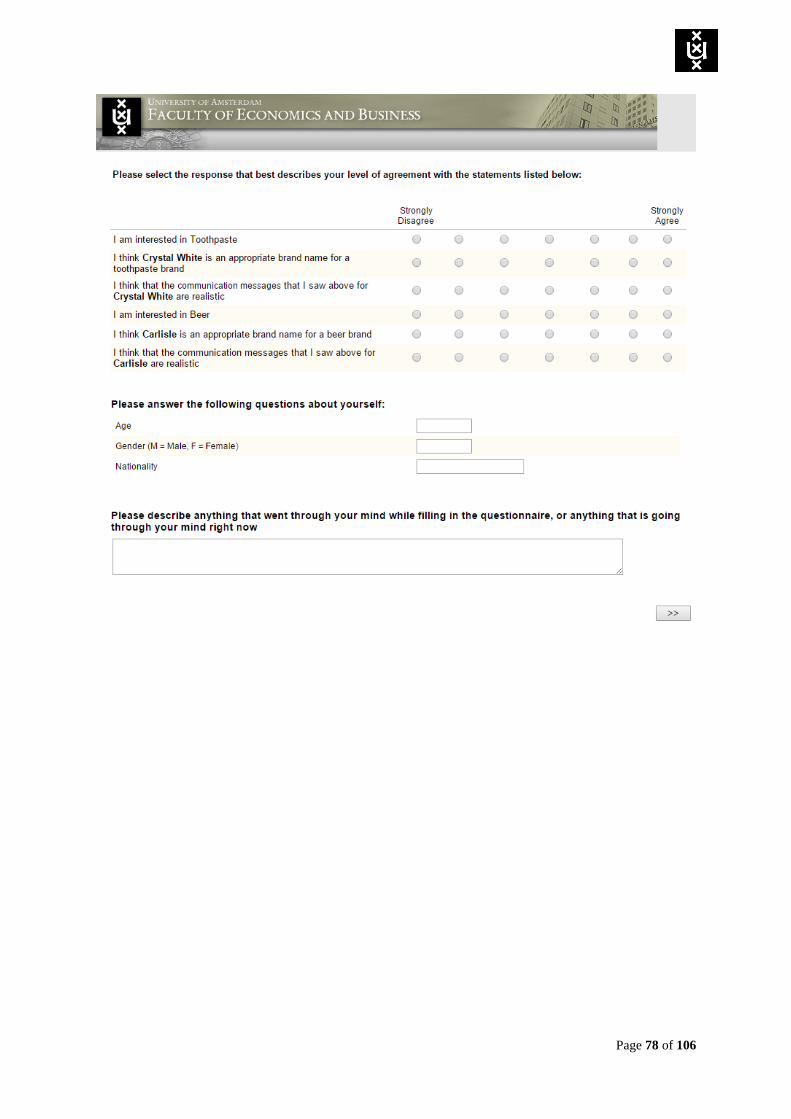
Page 78 of 106
Page 79 of 106
Version 4 - Pitfall + Challenge, Pitfall + Challenge + Core Quality scenarios

Page 80 of 106

Page 81 of 106

Page 82 of 106

Page 83 of 106

Page 84 of 106

Page 85 of 106
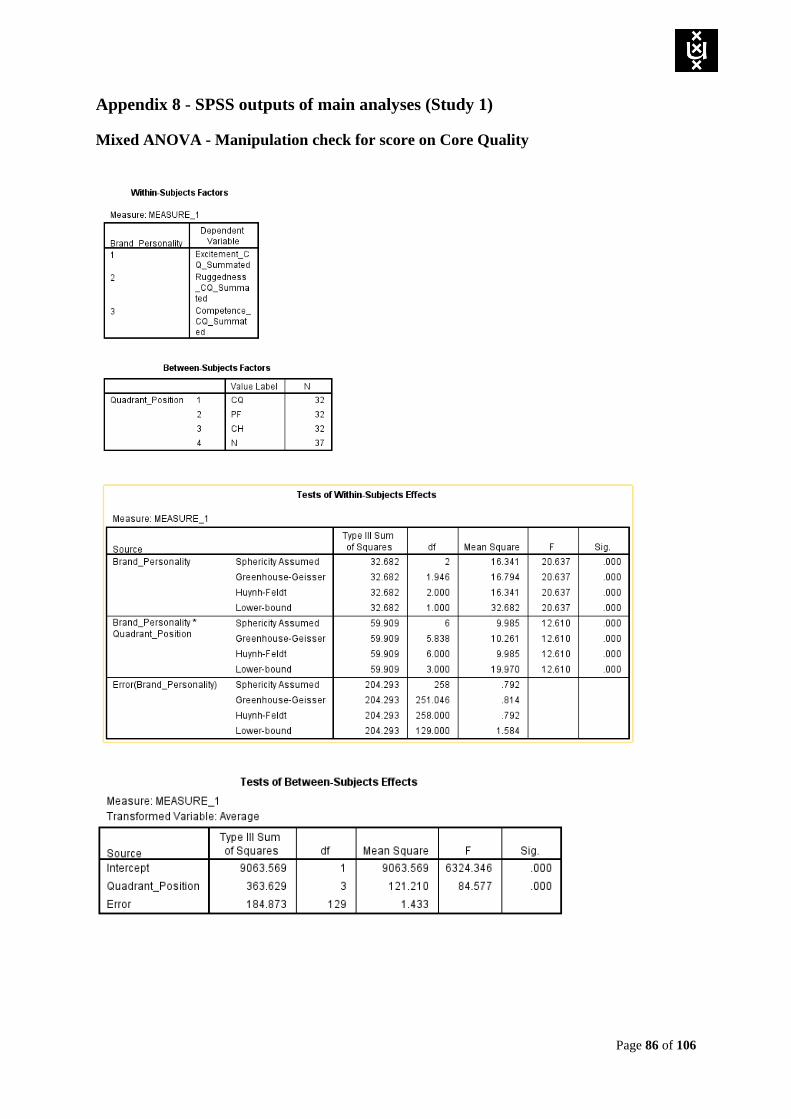
Page 86 of 106
Appendix 8 - SPSS outputs of main analyses (Study 1)
Mixed ANOVA - Manipulation check for score on Core Quality

Page 87 of 106

Page 88 of 106
Mixed ANOVA - Manipulation check for score on Pitfall

Page 89 of 106

Page 90 of 106
Mixed ANOVA - Manipulation check for score on Challenge

Page 91 of 106

Page 92 of 106
Hypothesis testing - Process by A. F. Hayes
Exciting brand personality

Page 93 of 106
Rugged brand personality

Page 94 of 106
Competent brand personality

Page 95 of 106
Manipulation check using 3-way ANOVA (DV = Scores on Core Quality, Pitfall,
Challenge)

Page 96 of 106
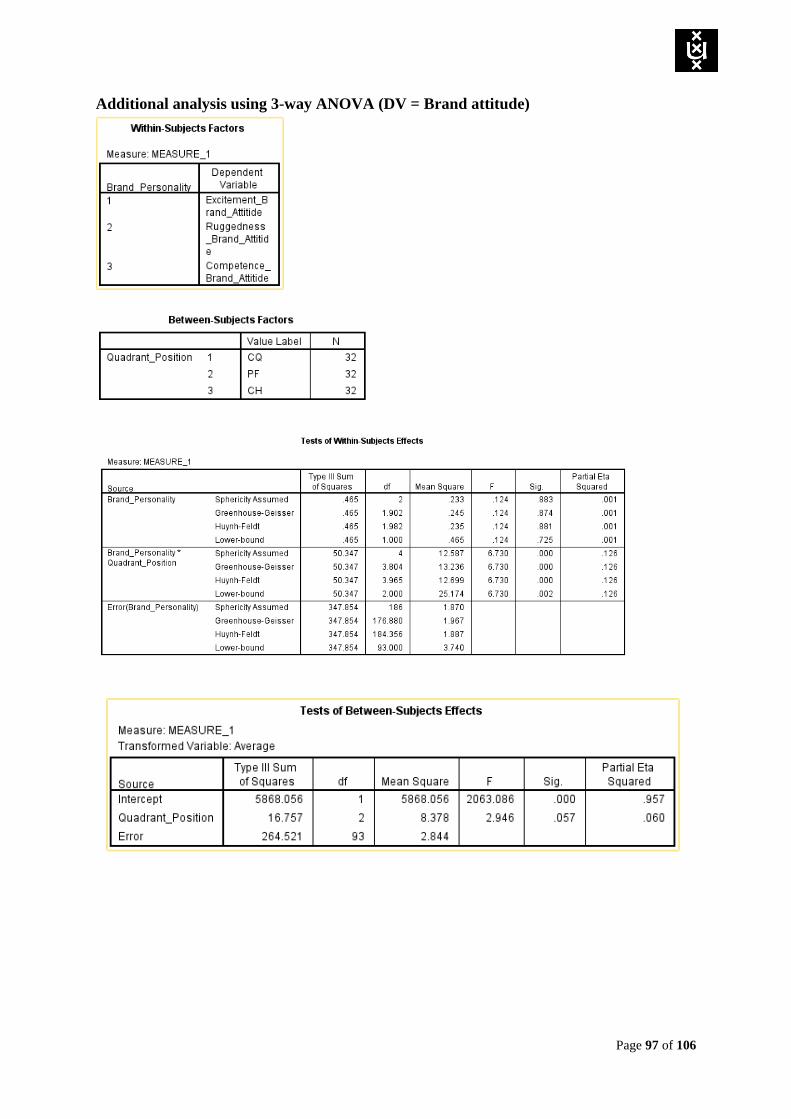
Page 97 of 106
Additional analysis using 3-way ANOVA (DV = Brand attitude)

Page 98 of 106
Appendix 9 - SPSS outputs of main analyses (Study 2)
Manipulation check using 3-way ANOVA for CQ, PF, and CH scenarios

Page 99 of 106

Page 100 of 106

Page 101 of 106
Hypotheses Testing using 4-way ANOVA (DV = Brand Attitude)

Page 102 of 106

Page 103 of 106
Additional using 4-way ANOVA (DV = Core Quality scores)

Page 104 of 106

Page 105 of 106
Additional using 4-way ANOVA (DV = PF scores)

Page 106 of 106
Copyright © 2022 FDOKUMEN