Prescribed burning effects on soil enzyme activity in a southern Ohio hardwood forest: a...
10
Prescribed burning eects on soil enzyme activity in a southern Ohio hardwood forest: a landscape-scale analysis Ralph E.J. Boerner a, b, *, Kelly L.M. Decker a , Elaine Kennedy Sutherland b a Department of Evolution, Ecology & Organismal Biology, Ohio State University, Columbus, OH 43210, USA b USDA Forest Service, Rocky Mountain Research Station, Missoula, MT 59801, USA Accepted 29 October 1999 Abstract We assessed the eect of a single, dormant season prescribed fire on soil enzyme activity in oak-hickory (Quercus-Carya ) forests in southern Ohio, USA. Four enzymes specific for dierent C sources were chosen for monitoring: acid phosphatase, b- glucosidase, chitinase and phenol oxidase. Postfire acid phosphatase activity was generally reduced by burning and decreased with increasing longterm soil water potential. Postfire b-glucosidase diered little between control and burned plots. Chitinase activity increased after fire in proportion to fire intensity. Phenol oxidase activity was highly variable and did not correlate well with either fire or soil water potential. Enzyme activities tended to vary more between samples taken upslope vs. downslope of a given tree than as the result of fire or landscape position. Overall enzymes whose activities are controlled by microclimatic or edaphic factors were aected more than those controlled primarily by substrate availability. Single, dormant season fires may consume a large proportion of the forest floor and change the apparent character of the surface organic matter complex without having major eects on soil enzyme activity. 7 2000 Elsevier Science Ltd. All rights reserved. Keywords: Fire; Landscape; Acid phosphatase; b-Glucosidase; Chitinase; Phenol oxidase 1. Introduction There exists a history of almost half a century of modern use of prescribed fire for tree plantation man- agement and wildfire fuel reduction (Riebold, 1971). More recently, prescribed fire has become a tool for restoration and conservation ecologists, first in grass- lands and more recently in forested ecosystems. In intensively managed ecosystems, such as pine planta- tions in the southern USA, the ecacy of prescribed fire as a management technique can be assessed in a straightforward manner through assessment of tree mortality, growth, radial increment, yield and rotation time. In contrast, in unmanaged (or less intensively managed) ecosystems, determining the degree to which the less clear-cut goals of longer term conservation projects have been achieved is more dicult. There- fore, the development of metrics with which to assess ecacy of management activities in quasi-natural eco- systems, such as the use of prescribing burning for eco- system restoration, becomes a higher priority. To this end, we have instituted a monitoring program to deter- mine the eects of prescribed fires on the activity of a suite of soil enzymes as part of a larger, long term assessment of the use of prescribed fire at various fre- quencies for the restoration of oak-hickory ecosystems in southern Ohio (see Sutherland, 1999). For some years, agricultural scientists have con- sidered soil biological and biochemical parameters to have great potential as early and sensitive indicators of stress on agroecosystems and on the ecacy of attempts to restore degraded agroecosystems (Dick, 1994; Dick and Tabatabai, 1992). In unmanaged eco- systems, there is a strong correlation between soil Soil Biology & Biochemistry 32 (2000) 899–908 0038-0717/00/$ - see front matter 7 2000 Elsevier Science Ltd. All rights reserved. PII: S0038-0717(99)00208-4 www.elsevier.com/locate/soilbio * Corresponding author. Tel.: +1-614-292-8280; fax: +1-614-292- 2030. E-mail address: [email protected] (R.E.J. Boerner).
-
Upload
independent -
Category
Documents
-
view
4 -
download
0
Transcript of Prescribed burning effects on soil enzyme activity in a southern Ohio hardwood forest: a...
Prescribed burning e�ects on soil enzyme activity in a southernOhio hardwood forest: a landscape-scale analysis
Ralph E.J. Boernera, b,*, Kelly L.M. Deckera, Elaine Kennedy Sutherlandb
aDepartment of Evolution, Ecology & Organismal Biology, Ohio State University, Columbus, OH 43210, USAbUSDA Forest Service, Rocky Mountain Research Station, Missoula, MT 59801, USA
Accepted 29 October 1999
Abstract
We assessed the e�ect of a single, dormant season prescribed ®re on soil enzyme activity in oak-hickory (Quercus-Carya )forests in southern Ohio, USA. Four enzymes speci®c for di�erent C sources were chosen for monitoring: acid phosphatase, b-glucosidase, chitinase and phenol oxidase. Post®re acid phosphatase activity was generally reduced by burning and decreasedwith increasing longterm soil water potential. Post®re b-glucosidase di�ered little between control and burned plots. Chitinaseactivity increased after ®re in proportion to ®re intensity. Phenol oxidase activity was highly variable and did not correlate wellwith either ®re or soil water potential. Enzyme activities tended to vary more between samples taken upslope vs. downslope of a
given tree than as the result of ®re or landscape position. Overall enzymes whose activities are controlled by microclimatic oredaphic factors were a�ected more than those controlled primarily by substrate availability. Single, dormant season ®res mayconsume a large proportion of the forest ¯oor and change the apparent character of the surface organic matter complex without
having major e�ects on soil enzyme activity. 7 2000 Elsevier Science Ltd. All rights reserved.
Keywords: Fire; Landscape; Acid phosphatase; b-Glucosidase; Chitinase; Phenol oxidase
1. Introduction
There exists a history of almost half a century ofmodern use of prescribed ®re for tree plantation man-agement and wild®re fuel reduction (Riebold, 1971).More recently, prescribed ®re has become a tool forrestoration and conservation ecologists, ®rst in grass-lands and more recently in forested ecosystems. Inintensively managed ecosystems, such as pine planta-tions in the southern USA, the e�cacy of prescribed®re as a management technique can be assessed in astraightforward manner through assessment of treemortality, growth, radial increment, yield and rotationtime. In contrast, in unmanaged (or less intensivelymanaged) ecosystems, determining the degree to which
the less clear-cut goals of longer term conservation
projects have been achieved is more di�cult. There-
fore, the development of metrics with which to assess
e�cacy of management activities in quasi-natural eco-
systems, such as the use of prescribing burning for eco-
system restoration, becomes a higher priority. To this
end, we have instituted a monitoring program to deter-
mine the e�ects of prescribed ®res on the activity of a
suite of soil enzymes as part of a larger, long term
assessment of the use of prescribed ®re at various fre-
quencies for the restoration of oak-hickory ecosystems
in southern Ohio (see Sutherland, 1999).
For some years, agricultural scientists have con-
sidered soil biological and biochemical parameters to
have great potential as early and sensitive indicators of
stress on agroecosystems and on the e�cacy of
attempts to restore degraded agroecosystems (Dick,
1994; Dick and Tabatabai, 1992). In unmanaged eco-
systems, there is a strong correlation between soil
Soil Biology & Biochemistry 32 (2000) 899±908
0038-0717/00/$ - see front matter 7 2000 Elsevier Science Ltd. All rights reserved.
PII: S0038-0717(99 )00208 -4
www.elsevier.com/locate/soilbio
* Corresponding author. Tel.: +1-614-292-8280; fax: +1-614-292-
2030.
E-mail address: [email protected] (R.E.J. Boerner).
enzyme activity and plant biomass production(Skujins, 1978) and an equally strong correlationbetween enzyme activity and microbial biomass (Eivaziand Bayan, 1996). However, in intensively managed ordisturbed ecosystems, the relationship can be altered(Bolton et al., 1993; Dick, 1994).
Because forests of eastern North America have beenhistorically N-limited and dependent on detrital path-ways for mineralization of N and P (Aber et al., 1989),we chose four enzymes which are speci®c for a widerange of substrates. These included enzymes involvedin the release of N and P and enzymes involved in thedegradation of both labile and recalcitrant C forms:
1. Phosphomonoesterase (hereafter acid phosphatase),an enzyme whose activity is strongly correlated withthe rate of release of both inorganic N and P to thesoil solution;
2. b-glucosidase, the third enzyme in a chain of threewhich break down labile cellulose and other carbo-hydrate polymers;
3. Chitobiase=N-acetylglucosaminidase (hereafterchitinase), the second enzyme in the chain of threewhich degrade chitin and release low molecularweight C- and N-rich compounds; and
4. Phenol oxidase, one of a suite of enzymes involvedin degradation of lignin, along with laccases andperoxidases.
Thus, this suite of four enzymes should represent theresponses of a diverse microbial assemblage to a widerange of substrate types, and more importantly forecosystem analysis, a range of soils from high to loworganic matter quality and nutrient availability.
2. Materials and methods
2.1. Study sites and sampling design
The two forest sites chosen for study were located inVinton and Lawrence Counties on the unglaciatedAllegheny Plateau of southern Ohio. The sites werecontiguous blocks of 90±120 ha occupied by oak-dominated forests which had developed followingclearcutting for charcoal production 100±150 y ago.The Vinton County study site, Arch Rock (lat.39811 'N, long. 82822 'W), and the Lawrence Countystudy site, Young's Branch (lat. 38843 'N, long.82841 'N) were separated by approximately 55 km. Thestudy areas were chosen on the basis of the followingcriteria:
1. they met the age and land use history criteria listedabove
2. the three watersheds within each study area were asuniform as possible in topography and geology and
3. there were no indications of signi®cant anthropo-genic disturbance since the clearcutting in the mid-to-late 1800s.
The parent materials underlying the study sites weresandstones and shales of Pennsylvanian age. The soilswere dominated by silt loams formed from colluviumand residuum, and were predominantly Al®sols (Boer-ner and Sutherland, 1999). The climate of the region iscool, temperate and continental, with mean annualtemperature and precipitation of 11.38C and 1024 mmfor the Vinton County sites and 12.98C and 1059 mmfor the Lawrence County sites (Sutherland andYaussy, 1999). Microclimatic gradients generated bythe steep, dissected topography of the region includedthe tendency for south, southwest and west facingslopes to be drier and warmer than northwest, northand east facing slopes due to the strong relief in thisregion (Wolfe et al., 1949).
Each study site was composed of three contiguouswatersheds (or treatment units) of 30±80 ha. One ofthe watersheds within each study area was randomlyassigned to be an unburned control. Each watershedwas strati®ed using a GIS-based integrated moistureindex (IMI) developed by Iverson et al. (1997) for thisregion. The IMI strati®cation was achieved through in-tegration of elevation, aspect, hill shade pro®le, solarradiation potential, accumulation of water downslope,total water holding capacity of the soil and curvaturepro®le of the landscape (Iverson et al., 1997). Eachcomponent was weighted and standardized on a 0±100scale. Three IMI classes were delimited as: xeric, inter-mediate, and mesic.
Within each of the watersheds, three sample plots of0.125 ha were established in each of the three IMIclasses, for a total of nine sample plots per watershedand 27 sample plots per study site. In each sampleplot, a single canopy northern red oak (Quercus rubraL.) tree with diameter at breast height (dbh) of 40±60cm was chosen for sampling at the individual treescale, and soil samples were taken 1.0 m upslope anddownslope of that tree.
The positions of the sample plots were determinedfrom a digital elevation model overlain with an IMIclass map in an ARC/INFO environment, and theoverall experiment was designed to be a balanced, ran-domized block design with study areas as blocks(Sutherland, 1999). However, subsequent GPS analysisof the sample plot locations determined that approxi-mately 15% of the sample plots were not actuallylocated at points within the IMI classes they weredesigned to represent. This resulted in an unbalanceddesign.
Previous analysis of the soils of these study areasindicated that soil chemical properties varied signi®-cantly among sites and among IMI classes, but not
R.E.J. Boerner et al. / Soil Biology & Biochemistry 32 (2000) 899±908900
among watersheds within sites (Boerner et al., 1999).The soils at Young's Branch had greater inorganic Ncontent, Ca, Mg and molar Ca-to-Al ratio and higherpH than the soils at Arch/Rock. Similarly, soils fromplots located in the xeric IMI class had lower inor-ganic N, lower extractable PO4, Ca and Ca-to-Al ratiothan soils in the mesic IMI class plots (Boerner et al.,1999).
In addition to di�erences in soil chemistry, our pre-vious studies of these sites have also demonstrated thatN mineralization and net nitri®cation increase signi®-cantly from xeric to mesic IMI classes, whereas chiti-nase and acid phosphatase activities are greatest inxeric IMI class soils (Decker et al., 1999; Boerner etal., 2000). In addition, organic matter content and acidphosphatase activity are greater in samples taken 1 mupslope from a given tree than in those taken 1 mdownslope, whereas b-glucosidase activity was greaterdownslope (Decker et al., 1999).
The two treatment watersheds in each of the studysites were burned on 18±19 April 1996. The ®res atYoung's Branch were of low intensity, with mean tem-perature at 10 cm above the forest ¯oor of 1578C(2128C) (Boerner et al., 2000). An average of 35%(24%) of the unconsolidated leaf litter was consumedby the ®re, and there was no signi®cant variation ineither ®re temperature or litter consumption with IMIclass (Boerner et al., 2000). Only six of 36 sample plotsat Young's Branch experienced ®re temperatures>2008C, the critical minimum for signi®cant loss of Nto volatilization (Boerner, 1982).
The ®res at Arch Rock were both hotter and moreheterogeneous (Boerner et al., 2000). Mean tempera-ture at 10 cm above the forest ¯oor was 2108C(2118C), and approximately 40% (25%) of the uncon-solidated litter was consumed. More importantly, ®retemperature and litter consumption decreased withincreasing long term moisture potential (measured asIMI), and 28 of the 36 sample plots at Arch Rock ex-perienced temperatures >2008C.
2.2. Soil sampling and laboratory analysis
In late August and early September 1995 (pre®re)and 1996 (post®re), samples of approximately 150 g ofA-horizon soil were taken to a 15 cm depth with asterile soil corer. The corer was sterilized betweensamples with 95% EtOH. Three samples were takeneach at a point 1.0 m upslope of and a point 1.0 mdownslope of one red oak (Q. rubra ) tree identi®edadjacent to each sample plot. This yielded a total ofsix samples per IMI plot, for a total of 18 samples perwatershed and 54 samples per study site. All sampleswere brought to the laboratory under refrigeration andanalyzed within 24 h of removal from the ®eld.
Approximately 5 g of fresh soil from each sample
was diluted with 120 ml of 50 mM NaOAc bu�er (pH5.0) and homogenized by rapid stirring for 90 s. Tominimize sand sedimentation, stirring was continuedwhile aliquots were withdrawn for analysis. For eachof the enzymes, we analyzed four analytical replicatesof each sample using 2.0 ml of soil slurry and 2.0 mlof enzyme substrate for each analytical replicate. Inaddition, soil-free blanks consisting of 2.0 ml of bu�erand 2.0 ml of enzyme substrate were analyzed to cor-rect for non-enzymatic hydrolysis of substrates. Allenzyme nomenclature follows IUB (1978).
Acid phosphatase (EC 3.1.3.1), b-glucosidase (EC3.2.1.21), and chitinase (EC 3.2.1.14) activities wereassayed using p-nitrophenol ( pNP) linked substrates:pNP-phosphate for phosphatase, pNP-glucopyranosidefor b-glucosidase, and pNP-glucosaminide for chiti-nase. Acid phosphatase and b-glucosidase sampleswere incubated for 1 h and chitinase samples wereincubated for 2 h, both at 208C with constant mixingon a platelet mixer. Following incubation, sampleswere centrifuged to remove soil particles, and 0.1 ml of1.0 M NaOH was added to the soil-free supernatant tohalt enzymatic activity and facilitate color develop-ment. Prior to spectrophotometric analysis, the samplewas diluted with 8.0 ml of distilled, deionized water.Phenol oxidase (EC 1.14.18.1 and 1.10.3.2) activitywas measured by oxidation of l-DOPA (l-3,4-dihy-droxyphenylalanine) following 1 h incubation at 208C.Parallel oxidations utilizing standard Horseradish Per-oxidase (Sigma Chemical) were used to calculate the l-DOPA extinction coe�cient. Absorbances were deter-mined spectrophotometrically at 410 nm for the pNPassays and 460 nm for phenol oxidase. To minimizeerrors due to hydrolysis of the pNP-linked substratesby the NaOH, all absorbances were determined within30 min after the addition of NaOH. All enzyme ana-lyses followed methods described by Sinsabaugh et al.(1993) and Sinsabaugh and Findlay (1995).
The initial soil moisture and fresh-to-dry weightratio of each soil sample was determined by drying 8±10 g of fresh soil at 658C to constant weight. Organicmatter content was determined by dry ashing 2 gsamples at 6008C for 4 h. We chose to express enzymeactivity both in relation to soil mass and in relation tosoil organic matter content. Expressing enzyme activityon a mass basis gives an estimate of the rate at whichthe product of the enzymatic activity is being madeavailable to microbes and plants; as such it is a quan-tity measure. In contrast, expressing activity on an or-ganic matter basis gives an estimate of how suitablethe organic matter complex is to degradation by thosespeci®c enzymes; thus this is an organic matter qualitymeasure.
We also calculated the change in enzyme activitybetween the pre®re and post®re sampling dates in twoways. First, we substracted directly the activity from
R.E.J. Boerner et al. / Soil Biology & Biochemistry 32 (2000) 899±908 901
the pre®re sample (data given by Decker et al., 1999)from the activity of the corresponding post®re sampleto generate an absolute rate of change. To furtherexplore the potential for direct ®re e�ects, we sub-tracted the absolute change in activity for each site �treatment watershed � IMI class � position sample inthe control watershed from that of the comparable site� treatment watershed � IMI class � position samplefrom each of the burned watersheds to estimate thechange from pre®re to post®re sampling that could beattributed to the e�ects of ®re alone.
2.3. Data analysis
All response variables except the proportional activi-ties were found to be normally distributed (PROC uni-variate of SAS, 1995); the proportional activities werearcsine transformed prior to analysis. As the ®re beha-vior and site characteristics di�ered somewhat betweenthe two study areas, we analyzed post®re and temporalchanges in enzyme activity by mixed model analysis ofvariance using a nested, unbalanced design (PROCmixed; SAS, 1995) using ®re temperature as a covari-ate. Where main e�ects were signi®cant, least squaresmeans were used to test di�erences among sites, water-sheds within sites, and IMI classes.
3. Results
3.1. Post®re enzyme activity
At Arch Rock there was a signi®cant interactivee�ect of IMI class and ®re on acid phosphatase ac-tivity after the ®re (Table 1). On a soil mass basis, acidphosphatase activity was greater in intermediate (butnot xeric or mesic) IMI class soils from the unburnedcontrol watershed than in soils from the two burnedwatersheds (Fig. 1). On an organic matter basis, acidphosphatase activity was greater in the control soilsthan the burned soils in both the xeric and intermedi-ate IMI class plots (Fig. 1).
There was also a signi®cant interactive e�ect of ®reand IMI class on acid phosphatase activity on a soilmass basis at Young's Branch (Table 1). Activity wassigni®cantly greater in soils from the control than insoils from the burned watersheds in both xeric and in-termediate IMI class plots, while the opposite was thecase in soils from mesic IMI class plots (Fig. 1). Therewere no signi®cant e�ects of either ®re or IMI class onacid phosphatase on an organic matter basis atYoung's Branch (Table 1, Fig. 1).
There were no signi®cant e�ects of ®re or IMI classin post®re b-glucosidase activity at either study site orin post®re chitinase activity at Arch Rock (Table 1).At Young's Branch, there was a signi®cant interactive
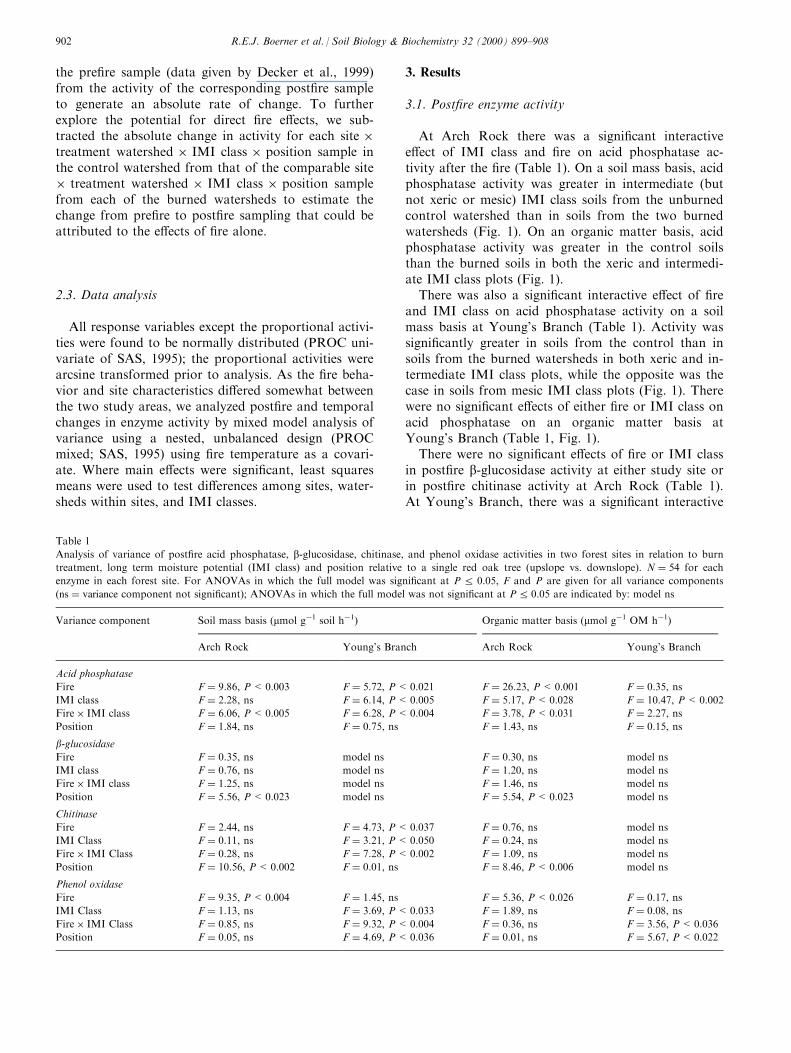
Table 1
Analysis of variance of post®re acid phosphatase, b-glucosidase, chitinase, and phenol oxidase activities in two forest sites in relation to burn
treatment, long term moisture potential (IMI class) and position relative to a single red oak tree (upslope vs. downslope). N � 54 for each
enzyme in each forest site. For ANOVAs in which the full model was signi®cant at P R 0.05, F and P are given for all variance components
�ns � variance component not signi®cant); ANOVAs in which the full model was not signi®cant at PR 0.05 are indicated by: model ns
Variance component Soil mass basis (mmol gÿ1 soil hÿ1) Organic matter basis (mmol gÿ1 OM hÿ1)
Arch Rock Young's Branch Arch Rock Young's Branch
Acid phosphatase
Fire F � 9:86, P<0.003 F � 5:72, P<0.021 F � 26:23, P<0.001 F � 0:35, nsIMI class F � 2:28, ns F � 6:14, P<0.005 F � 5:17, P<0.028 F � 10:47, P<0.002
Fire� IMI class F � 6:06, P<0.005 F � 6:28, P<0.004 F � 3:78, P<0.031 F � 2:27, nsPosition F � 1:84, ns F � 0:75, ns F � 1:43, ns F � 0:15, ns
b-glucosidaseFire F � 0:35, ns model ns F � 0:30, ns model ns
IMI class F � 0:76, ns model ns F � 1:20, ns model ns
Fire� IMI class F � 1:25, ns model ns F � 1:46, ns model ns
Position F � 5:56, P<0.023 model ns F � 5:54, P<0.023 model ns
Chitinase
Fire F � 2:44, ns F � 4:73, P<0.037 F � 0:76, ns model ns
IMI Class F � 0:11, ns F � 3:21, P<0.050 F � 0:24, ns model ns
Fire� IMI Class F � 0:28, ns F � 7:28, P<0.002 F � 1:09, ns model ns
Position F � 10:56, P<0.002 F � 0:01, ns F � 8:46, P<0.006 model ns
Phenol oxidase
Fire F � 9:35, P<0.004 F � 1:45, ns F � 5:36, P<0.026 F � 0:17, nsIMI Class F � 1:13, ns F � 3:69, P<0.033 F � 1:89, ns F � 0:08, nsFire� IMI Class F � 0:85, ns F � 9:32, P<0.004 F � 0:36, ns F � 3:56, P<0.036
Position F � 0:05, ns F � 4:69, P<0.036 F � 0:01, ns F � 5:67, P<0.022
R.E.J. Boerner et al. / Soil Biology & Biochemistry 32 (2000) 899±908902

e�ect of ®re and IMI class on post®re chitinase activityon a soil mass basis (Table 1). Chitinase activity wasgreater in control than burned plots in soils from xericIMI class plots, while the opposite was the case insoils from mesic IMI class plots (Fig. 2)
There was a signi®cant e�ect of ®re on phenol oxi-dase activity in soils from Arch Rock on both organicmatter and soil mass bases (Table 1) with activity con-sistently greater in soils from burned watersheds thanin soils from the unburned control (Fig. 3). AtYoung's Branch, phenol oxidase activity was greater inburned watersheds only in soils from mesic IMI classplots (Table 1, Fig. 3).
3.2. Relative carbon source utilization
To gain insight into the relative importance of chitinand the labile vs. recalcitrant lignocellulose fractions as
carbon sources in these soils, we calculated the relativeproportion of phenol oxidase, b-glucosidase and chiti-nase activity contributed by each of the three enzymesto the sum of the three. At Arch Rock the soils fromunburned control had signi®cantly greater pro-portional b-glucosidase activity �F � 5:53, P < 0.008)and signi®cantly lower phenol oxidase activity�F � 5:23, P < 0.010) than did soils from the twoburned plots (Fig. 4). There were no signi®cant di�er-
Fig. 1. Acid phosphatase activity expressed per unit soil mass (mmol
gÿ1 soil hÿ1) and per unit organic matter (mmol gÿ1 OM hÿ1) in two
southern Ohio forest sites in relation to integrated moisture index
classes and ®re treatment. Histogram bars represent means with stan-
dard deviations of the means of N � 18 for controls and N � 36 for
burned sites; signi®cant di�erences between means are indicated by �.
Fig. 2. Chitinase activity in soils from Young's Branch, an oak-hick-
ory forest site in southern Ohio, in relation to integrated moisture
index classes and ®re treatment. Histogram bars represent means of
N � 18 for controls and N � 36 for burned plots, with standard de-
viations of the means indicated; signi®cant di�erences between
means are indicated by �.
Fig. 3. Phenol oxidase activity expressed per unit soil mass (mmol
gÿ1 soil hÿ1) and per unit organic matter (mmol gÿ1 OM hÿ1) in two
southern Ohio forest sites in relation to integrated moisture index
classes and ®re treatment. Histogram bars represent means of
N � 18 for controls and N � 36 for burned plots, with standard de-
viations of the means indicated; signi®cant di�erences between
means are indicated by �.
Fig. 4. Proportional activity of b-glucosidase, chitinase and phenol
oxidase as a percentage of their summed activity in relation to pre-
scribed ®re in two southern Ohio forest sites. Histogram bars rep-
resent means of N � 18 for controls and N � 36 for burned plots,
with standard deviations of the means indicated; signi®cant di�er-
ences between means are indicated by �.
R.E.J. Boerner et al. / Soil Biology & Biochemistry 32 (2000) 899±908 903
ences in proportional activity among watersheds atYoung's Branch, nor among IMI classes at either site.
3.3. Fine-scale spatial variations
To determine what e�ect tree bases would have onpost®re heterogeneity on these steep slopes, we ana-lyzed di�erences in samples taken 1 m above andbelow individual trees (Table 1). Although there wereno signi®cant di�erences in absolute acid phosphataseactivity between soils taken upslope and downslope,the rate of change in phosphatase activity between pre-®re and post®re samples was signi®cantly greater insoils taken upslope than downslope in both study sites(Table 2). Post®re b-glucosidase activity was signi®-cantly greater in soils collected upslope from the treebase than in those taken downslope (Table 2) as wasthe magnitude of the change in activity between pre®reand post®re (Table 2).
Variations in chitinase activity at this spatial scalewere present at Arch Rock both on soil mass and or-ganic matter bases (Table 2). Post®re chitinase activityon soil mass and organic matter bases were 90 and101% greater, respectively, in upslope than downslopesoils (Table 2). Similarly, phenol oxidase activity on asoil mass basis was 28% greater in upslope than down-slope soils after the ®re and activity in upslope soilschanged more between pre®re and post®re samplingsthan did that in downslope soils, at least at Young'sBranch (Table 2).
3.4. Net ®re e�ects
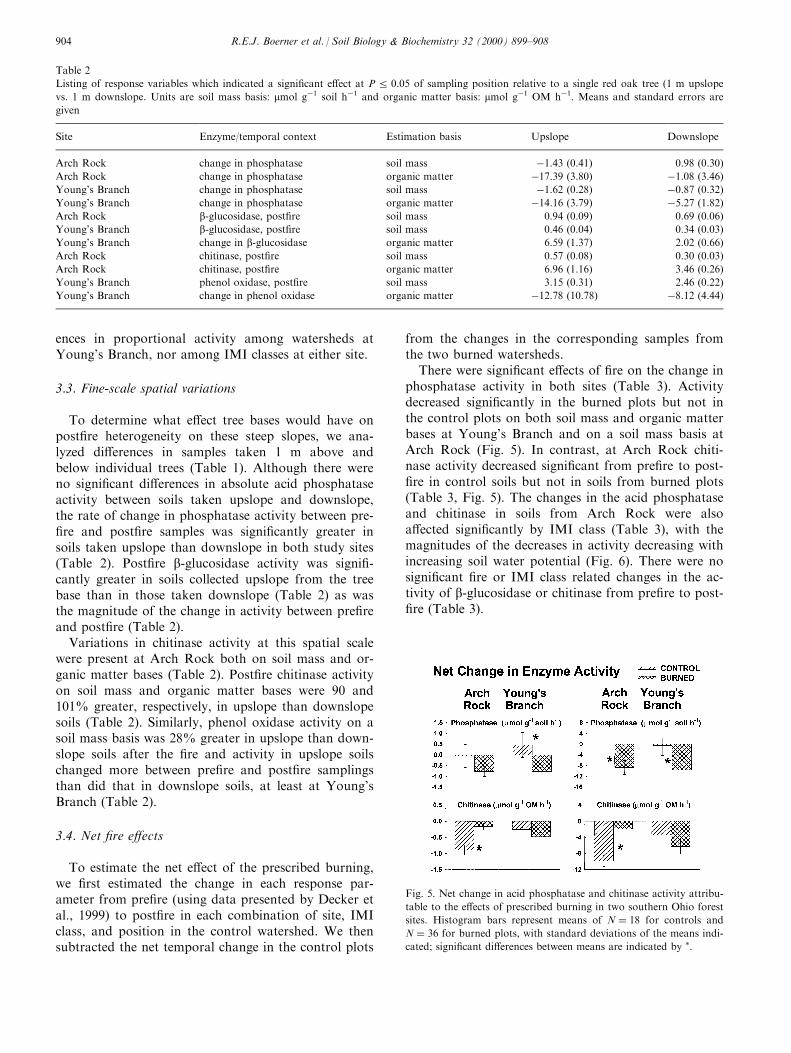
To estimate the net e�ect of the prescribed burning,we ®rst estimated the change in each response par-ameter from pre®re (using data presented by Decker etal., 1999) to post®re in each combination of site, IMIclass, and position in the control watershed. We thensubtracted the net temporal change in the control plots
from the changes in the corresponding samples fromthe two burned watersheds.
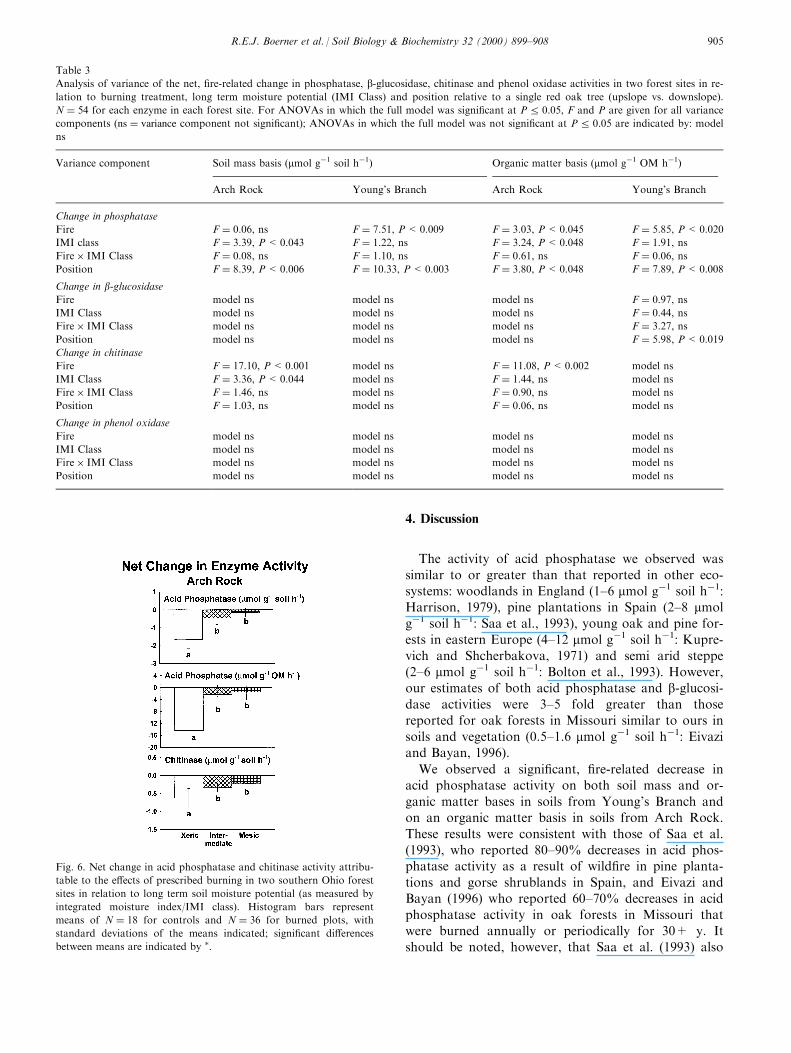
There were signi®cant e�ects of ®re on the change inphosphatase activity in both sites (Table 3). Activitydecreased signi®cantly in the burned plots but not inthe control plots on both soil mass and organic matterbases at Young's Branch and on a soil mass basis atArch Rock (Fig. 5). In contrast, at Arch Rock chiti-nase activity decreased signi®cant from pre®re to post-®re in control soils but not in soils from burned plots(Table 3, Fig. 5). The changes in the acid phosphataseand chitinase in soils from Arch Rock were alsoa�ected signi®cantly by IMI class (Table 3), with themagnitudes of the decreases in activity decreasing withincreasing soil water potential (Fig. 6). There were nosigni®cant ®re or IMI class related changes in the ac-tivity of b-glucosidase or chitinase from pre®re to post-®re (Table 3).
Table 2
Listing of response variables which indicated a signi®cant e�ect at P R 0.05 of sampling position relative to a single red oak tree (1 m upslope
vs. 1 m downslope. Units are soil mass basis: mmol gÿ1 soil hÿ1 and organic matter basis: mmol gÿ1 OM hÿ1. Means and standard errors are
given
Site Enzyme/temporal context Estimation basis Upslope Downslope
Arch Rock change in phosphatase soil mass ÿ1.43 (0.41) 0.98 (0.30)
Arch Rock change in phosphatase organic matter ÿ17.39 (3.80) ÿ1.08 (3.46)
Young's Branch change in phosphatase soil mass ÿ1.62 (0.28) ÿ0.87 (0.32)
Young's Branch change in phosphatase organic matter ÿ14.16 (3.79) ÿ5.27 (1.82)
Arch Rock b-glucosidase, post®re soil mass 0.94 (0.09) 0.69 (0.06)
Young's Branch b-glucosidase, post®re soil mass 0.46 (0.04) 0.34 (0.03)
Young's Branch change in b-glucosidase organic matter 6.59 (1.37) 2.02 (0.66)
Arch Rock chitinase, post®re soil mass 0.57 (0.08) 0.30 (0.03)
Arch Rock chitinase, post®re organic matter 6.96 (1.16) 3.46 (0.26)
Young's Branch phenol oxidase, post®re soil mass 3.15 (0.31) 2.46 (0.22)
Young's Branch change in phenol oxidase organic matter ÿ12.78 (10.78) ÿ8.12 (4.44)
Fig. 5. Net change in acid phosphatase and chitinase activity attribu-
table to the e�ects of prescribed burning in two southern Ohio forest
sites. Histogram bars represent means of N � 18 for controls and
N � 36 for burned plots, with standard deviations of the means indi-
cated; signi®cant di�erences between means are indicated by �.
R.E.J. Boerner et al. / Soil Biology & Biochemistry 32 (2000) 899±908904
4. Discussion
The activity of acid phosphatase we observed was
similar to or greater than that reported in other eco-systems: woodlands in England (1±6 mmol gÿ1 soil hÿ1:Harrison, 1979), pine plantations in Spain (2±8 mmol
gÿ1 soil hÿ1: Saa et al., 1993), young oak and pine for-ests in eastern Europe (4±12 mmol gÿ1 soil hÿ1: Kupre-
vich and Shcherbakova, 1971) and semi arid steppe(2±6 mmol gÿ1 soil hÿ1: Bolton et al., 1993). However,our estimates of both acid phosphatase and b-glucosi-dase activities were 3±5 fold greater than thosereported for oak forests in Missouri similar to ours in
soils and vegetation (0.5±1.6 mmol gÿ1 soil hÿ1: Eivaziand Bayan, 1996).
We observed a signi®cant, ®re-related decrease inacid phosphatase activity on both soil mass and or-
ganic matter bases in soils from Young's Branch andon an organic matter basis in soils from Arch Rock.
These results were consistent with those of Saa et al.(1993), who reported 80±90% decreases in acid phos-phatase activity as a result of wild®re in pine planta-
tions and gorse shrublands in Spain, and Eivazi andBayan (1996) who reported 60±70% decreases in acid
phosphatase activity in oak forests in Missouri thatwere burned annually or periodically for 30+ y. Itshould be noted, however, that Saa et al. (1993) also
Table 3
Analysis of variance of the net, ®re-related change in phosphatase, b-glucosidase, chitinase and phenol oxidase activities in two forest sites in re-
lation to burning treatment, long term moisture potential (IMI Class) and position relative to a single red oak tree (upslope vs. downslope).
N � 54 for each enzyme in each forest site. For ANOVAs in which the full model was signi®cant at P R 0.05, F and P are given for all variance
components �ns � variance component not signi®cant); ANOVAs in which the full model was not signi®cant at P R 0.05 are indicated by: model
ns
Variance component Soil mass basis (mmol gÿ1 soil hÿ1) Organic matter basis (mmol gÿ1 OM hÿ1)
Arch Rock Young's Branch Arch Rock Young's Branch
Change in phosphatase
Fire F � 0:06, ns F � 7:51, P<0.009 F � 3:03, P<0.045 F � 5:85, P<0.020
IMI class F � 3:39, P<0.043 F � 1:22, ns F � 3:24, P<0.048 F � 1:91, nsFire� IMI Class F � 0:08, ns F � 1:10, ns F � 0:61, ns F � 0:06, nsPosition F � 8:39, P<0.006 F � 10:33, P<0.003 F � 3:80, P<0.048 F � 7:89, P<0.008
Change in b-glucosidaseFire model ns model ns model ns F � 0:97, nsIMI Class model ns model ns model ns F � 0:44, nsFire� IMI Class model ns model ns model ns F � 3:27, nsPosition model ns model ns model ns F � 5:98, P<0.019
Change in chitinase
Fire F � 17:10, P<0.001 model ns F � 11:08, P<0.002 model ns
IMI Class F � 3:36, P<0.044 model ns F � 1:44, ns model ns
Fire� IMI Class F � 1:46, ns model ns F � 0:90, ns model ns
Position F � 1:03, ns model ns F � 0:06, ns model ns
Change in phenol oxidase
Fire model ns model ns model ns model ns
IMI Class model ns model ns model ns model ns
Fire� IMI Class model ns model ns model ns model ns
Position model ns model ns model ns model ns
Fig. 6. Net change in acid phosphatase and chitinase activity attribu-
table to the e�ects of prescribed burning in two southern Ohio forest
sites in relation to long term soil moisture potential (as measured by
integrated moisture index/IMI class). Histogram bars represent
means of N � 18 for controls and N � 36 for burned plots, with
standard deviations of the means indicated; signi®cant di�erences
between means are indicated by �.
R.E.J. Boerner et al. / Soil Biology & Biochemistry 32 (2000) 899±908 905
reported no signi®cant change in acid phosphatase ac-tivity following low intensity prescribed ®re in gorse(Ulex europaea ) shrublands.
The ®res also reduced spatial heterogeneity in acidphosphatase activity in the burned watersheds. Afterthe ®re, there was considerably less e�ect of topogra-phy (as measured by IMI class) on activity than waspresent either in pre®re sampling (Decker et al., 1999)or in the control watersheds during the post®resampling. This suggests that disturbance by ®re (if,indeed, ®re should be considered a disturbance in thisecosystem type) might serve to homogenize resources.Such a pattern has also been reported for semiaridshrublands and grasslands in the western US by Bol-ton et al. (1993). They found strongly heterogeneouspatterns of soil phosphatase activity, dehydrogenaseactivity, and microbial biomass in undisturbed shrub-lands and more homogeneous spatial distributions ingrasslands that had resulted from disturbance of thenative shrubland vegetation.
We observed little impact of ®re on b-glucosidaseactivity at the landscape scale. In contrast, Eivazi andBayan (1996) reported reductions of 50±65% in b-glu-cosidase activity after 30+ y of annual or periodic pre-scribed burning in oak woodlands. This, again, pointsout the potential for the e�ects of a single ®re to di�erdramatically from those of repeated ®res (see Vanceand Henderson, 1984).
We observed signi®cantly larger ®re-related changesin chitinase activity than in b-glucosidase activity. AtArch Rock, chitinase activity decreased signi®cantlyfrom the pre®re to post®re sampling in soils from theunburned control but not in those from the burnedwatersheds. Thus, soils from burned plots experiencedan increase in activity relative to what would havebeen expected in the absence of ®re. Several factorsmay have contributed to this ®re-induced increase inchitinase activity. First, there could have been a strongstimulation of fungal growth and turnover in theupper soil and forest ¯oor as a result of the ®re, thusincreasing the availability of chitin as a substrate.However, prior studies of the impact of low intensity®re on fungi have indicated either the lack of signi®-cant e�ect on fungal growth or modest reductions inbiomass (Wright and Tarrant, 1957; Jorgenson andHodges, 1971). Second, it may have re¯ected anincrease in chitinolytic bacteria or actinomycetes, theorganisms that dominate chitinase production in thesoil. Both Wright and Tarrant (1957) and Jorgensonand Hodges (1971) report that periodic prescribedburns a�ected bacteria and actinomycetes less thanthey did fungi; thus, a preferential e�ect of ®re onfungi could have increased the availability of chitin asa substrate for the relatively una�ected bacterial andactinomycete populations. In a grassland soil withhigh N availability (C-to-N of 9.9), additions of chitin
produce increases in both chitinase activity and theabundance of chitinolytic organisms (Hanzlikova andJandera, 1993); in contrast addition of chitin+glucoseresulted in a depression of chitinase activity, demon-strating that chitin is not a favored substrate for car-bon utilization at high N availability (Hanzlikova andJandera, 1993). Our observation of signi®cant andpositive changes in chitinase activity after ®re supportboth the notion that fungal abundance would bea�ected more than bacterial abundance and that thesesites remained N-enriched despite volatilization of Nduring the ®res.
There was considerable spatial variability in phenoloxidase activity, both prior to the ®re (Decker et al.,1999) and after the ®re, and we saw no clear indicationof a signi®cant e�ect of a single prescribed burn on theactivity of this enzyme. In a study of wood decompo-sition in a range of ecosystem types, Sinsabaugh et al.(1992, 1993) found lignocellulose degrading enzymes(such as phenol oxidase) to be controlled primarily bysubstrate availability, whereas chitinase and phospha-tases were controlled more by microclimate andedaphic factors. That we observed signi®cant e�ects of®re on both chitinase and acid phosphastase, but noton phenol oxidase, suggests that the ecological impactof this ®re was primarily a modifaction of the microcli-mate and structure of the forest ¯oor surface ratherthan on the composition of the organic matter com-plex within the soil.
In our earlier studies of a larger suite of hardwoodforest watersheds in southern Ohio (Morris and Boer-ner, 1998, 1999; Decker et al., 1999) we observed largeand signi®cant variations in organic matter and mi-crobial biomass between samples taken 1 m upslopeand 1 m downslope of an individual red oak in eachsample plot. The data we report here demonstratesthat acid phosphatase activity was signi®cantly greaterdownslope of a given tree than upslope, and the mag-nitude of this di�erence was increased by the e�ects of®re. Phenol oxidase activity was also greater down-slope than upslope, at least on a soil mass basis. b-glu-cosidase activity was greater in upslope thandownslope both before and after the ®re; however, ®rereduced the magnitude of this di�erence. Finally, chiti-nase activity was greater upslope than downslope afterthe ®re, primarily because of a greater change upslopethan downslope as a result of the ®re. The concept ofsingle tree in¯uence circles has been well established inthe literature for some time (e.g. Zinke, 1962; Crozierand Boerner, 1984; Boerner and Koslowski, 1988;Boettcher and Kalisz, 1990). However, this study andthe others we have done in these sites have demon-strated for the ®rst time a directional asymmetry tosingle tree in¯uence circles in steep lands (cf. Boettcherand Kalisz, 1990).
A single, dormant season prescribed ®re can con-
R.E.J. Boerner et al. / Soil Biology & Biochemistry 32 (2000) 899±908906
sume the majority of the unconsolidated leaf litter onthe forest ¯oor, and produce what appear to be majorchanges in the quantity, quality and character of theorganic matter complex of the forest ¯oor. Suchchanges often result in rapid and signi®cant changes inmicrobial activity and net N mineralization (Boerner etal., 2000). However, the data presented here indicatethat such changes do not lead to signi®cant and wide-spread changes in microbial community structure ormetabolic pro®les, at least to the degree that soilenzyme activity mirrors those attributes. Thus in thisecosystem type, at the least, application of single pre-scribed ®res for management or restoration purposesmay be conducted without the concern that majore�ects on the microbial community will result.
Acknowledgements
This study was supported by an Ecosystem Manage-ment grant (E.K.S., Principal Investigator) from theUSDA Forest Service. We thank Sherri Morris, Jenni-fer Brinkman, Susan Meyer, Michael Fisher, Eric Har-vey and Andy Morris for ®eld and laboratoryassistance and David Hosack for coordinating ®eldlogistics. We also thank David Coleman and an anon-ymous reviewer for helping to improve this work.
References
Aber, J.D., Nadelho�er, K.J., Steudler, P., Melillo, J., 1989.
Nitrogen saturation in northern forest ecosystems. BioScience 39,
378±386.
Boerner, R.E.J., 1982. Fire and nutrient cycling in temperate ecosys-
tems. BioScience 32, 187±192.
Boerner, R.E.J., Koslowski, S.D., 1988. Microsite variations in soil
chemistry and nitrogen mineralization in a beech-maple forest.
Soil Biology & Biochemistry 21, 795±801.
Boerner, R.E.J., Sutherland, E.K., 1999. Physiography, geology and
soil classi®cation. In: Sutherland, E.K. (Ed.), Restoring mixed
oak forests in southern Ohio. USDA Forest Service,
Northeastern Forest Experiment Station General Technical
Report NE-XX. USDA Forest Service, Radnor, PA (in press).
Boerner, R.E.J., Morris, S.J., Decker, K.L.M., 1999. Soil chemical
and physical characteristics. In: Sutherland, E.K. (Ed.), Restoring
mixed oak forests in southern Ohio. USDA Forest Service,
Northeastern Forest Experiment Station General Technical
Report NE-XX. USDA Forest Service, Radnor, PA (in press).
Boerner, R.E.J., Sutherland, E.K., Morris, S.J., Hutchinson, T.F.,
2000. Spatial variations in N mineralization and nitri®cation fol-
lowing prescribed burning. Landscape Ecology.
Boettcher, S.E., Kalisz, P.J., 1990. Single-tree in¯uence on soil prop-
erties in the mountains of eastern Kentucky. Ecology 71, 1365±
1372.
Bolton Jr, H., Smith, J.L., Link, S.O., 1993. Soil microbial biomass
and activity of a disturbed and undisturbed shrub-steppe system.
Soil Biology & Biochemistry 25, 545±552.
Crozier, C.R., Boerner, R.E.J., 1984. Correlations of understory
herb distribution patterns with microhabitats under di�erent tree
species in a mixed mesophytic forest. Oecologia 62, 337±343.
Decker, K.L.M., Boerner, R.E.J., Morris, S.J., 1999. Scale-dependent
patterns of soil enzyme activity in a forested landscape. Canadian
Journal of Forest Research 29, 232±241.
Dick, R.P., 1994. Soil enzyme activities as indicators of soil quality.
In: Doran, J.W., Coleman, D.C., Bezdicek, D.F., Stewart, B.A.
(Eds.), Soil Enzymes, Soil Science Society of America, Madison,
WI, pp. 107±124.
Dick, W.A., Tabatabai, W.A., 1992. Signi®cance and potential use
of soil enzymes. In: Metting, F.B. (Ed.), Soil Microbial Ecology.
Marcel Dekker, New York, pp. 95±130.
Eivazi, F., Bayan, M.R., 1996. E�ects of long-term prescribed burn-
ing on the activity of select soil enzymes in an oak-hickory forest.
Canadian Journal of Forest Research 26, 1799±1804.
Hanzlikova, A., Janders, A., 1993. Chitinase and changes of mi-
crobial communities in soil. Folia Microbiologika 38, 159±160.
Harrison, A.F., 1979. Variations in four phosphorus properties in
woodland soils. Soil Biology & Biochemistry 11, 393±403.
IUB, 1978. Enzyme Nomenclature. Academic Press, London.
Iverson, L.R., Dale, M.E., Scott, C.T., Prasad, A., 1997. A GIS-derived
integrated moisture index to predict forest composition and pro-
ductivity of Ohio forests (USA). Landscape Ecology 12, 331±348.
Jorgenson, J.R., Hodges Jr, C.S., 1971. E�ects of prescribed burning
on the microbial characteristics of. In: Proceedings, Prescribed
Burning Symposium. USDA Forest Service, Asheville, NC.
Kuprevich, V.F., Shcherbakova, T.A., 1971. In McLaren, A.D.,
Skujins, J. (Eds.), Comparative enzyme activities in diverse types
of soil, Soil Biochemistry, vol. 2. Marcel Dekker, New York, pp.
167±201.
Morris, S.J., Boerner, R.E.J., 1998. Landscape patterns of nitrogen
mineralization and nitri®cation in southern Ohio hardwood for-
ests. Landscape Ecology 13, 215±224.
Morris, S.J., Boerner, R.E.J., 1999. Spatial distribution of fungal
and bacterial biomass in hardwood forest soils in southern Ohio:
scale dependency and landscape patterns. Soil Biology &
Biochemistry 31, 887±902.
Riebold, R.J., 1971. The early history of wild®res and prescribed
burning. In: Proceedings, Prescribed Burning Symposium. USDA
Forest Service, Asheville, NC, pp. 11±19.
Saa, A., Trasar-Cepeda, M.C., Gil-Sotres, F., Carballas, T., 1993.
Changes in soil phosphorus and acid phosphatase activity im-
mediately following forest ®res. Soil Biology & Biochemistry 25,
1223±1230.
SAS, 1995. SAS User's Guide, Version 6.0 (on line documentation).
SAS Institute, Cary, NC.
Sinsabaugh, R.L., Antibus, R.K., Linkins, A.E., Rayburn, L.,
Repert, D., Weiland, T., 1992. Wood decomposition in a ®rst
order watershed: mass loss as a function of exoenzyme activity.
Soil Biology & Biochemistry 24, 743±749.
Sinsabaugh, R.L., Antibus, R.K., Linkens, A.E., McClaugherty,
C.A., Rayburn, L., Rayburn, L., Weiland, T., 1993. Wood de-
composition: nitrogen and phosphorus dynamics in relation to
extracellular enzyme activity. Ecology 74, 1586±1593.
Sinsabaugh, R.L., Findlay, S., 1995. Microbial production, enzyme
activity and carbon turnover in surface sediments of the Hudson
River estuary. Microbial Ecology 30, 127±141.
Skujins, J., 1978. Extracellular enzymes in soil. CRC Critical
Reviews in Microbiology 4, 383±421.
Sutherland, E.K., (Ed.). Restoring Mixed Oak Forests in Southern
Ohio. USDA Forest Service, Northeastern Forest Experiment
Station General Technical Report NE-XX. USDA Forest Service,
Radnor, PA (in press).
Sutherland, E.K., Yaussy, D.A., 1999. Climate and ®re weather in
mixed-oak forests of southern Ohio. In: Sutherland, E.K. (Ed.),
Restoring mixed oak forests in southern Ohio. USDA Forest
Service, Northeastern Forest Experiment Station General
Technical Report NE-XX. USDA Forest Service, Radnor, PA (in
press).
R.E.J. Boerner et al. / Soil Biology & Biochemistry 32 (2000) 899±908 907

Vance, E.D., Henderson, G.S., 1984. Soil nitrogen availability fol-
lowing long-term burning in an oak-hickory forest. Soil Science
Society of America Journal 48, 184±190.
Wolfe, J.T., Wareham, R.T., Sco®eld, H.T., 1949. Microclimates and
macroclimate of Neotoma, a small valley in central Ohio. Ohio
Biological Survey Bulletin 41, 1±267.
Wright, E., Tarrant, R.F., 1957. Microbial soil properties after log-
ging and slash burning. USDA Forest Service Paci®c Northwest
Forest Experiment Station, Research Note 157. USDA Forest
Service, Corvallis, OR, 5 pp.
Zinke, P.J., 1962. The pattern of in¯uence of individual forest trees
on soil properties. Ecology 43, 130±133.
R.E.J. Boerner et al. / Soil Biology & Biochemistry 32 (2000) 899±908908