Proceedings of the international scientific conference - vokitai.ru
Upload
khangminh22Category
view
0download
0
Natural resources and bioeconomy studies 80/2017
6th International Scientific Conference on Hardwood Processing PROCEEDINGS
Veikko Möttönen and Emilia Heinonen (eds.)

Natural resources and bioeconomy studies 80/2017
6th International Scientific Conference on
Hardwood Processing PROCEEDINGS
Veikko Möttönen and Emilia Heinonen (eds.)
Natural Resources Institute Finland, Helsinki 2017

ISBN: 978-952-326-509-7 (Online) ISSN 2342-7639 (Online) URN: http://urn.fi/URN:ISBN:978-952-326-509-7 Copyright: Natural Resources Institute Finland (Luke) Authors: Veikko Möttönen and Emilia Heinonen (eds.) Publisher: Natural Resources Institute Finland (Luke), Helsinki 2017 Year of publication: 2017 Cover photo: Paolo Batello Printing house and: publishing sales: Juvenes Print, http://luke.juvenesprint.fi

Natural resources and bioeconomy studies 80/2017
3
CONTENTS Preface 9 Acknowledgements 10 ISCHP 2017 committees 11
KEYNOTE SPEECHES
From Forest to Wood Production – A selection of challenges and opportunities for innovative hardwood utilization Prof. Alfred Teischinger, University of Natural Resources and Life Sciences, Vienna, Austria
13
The Broadleaf Citizen – Broadening the innovative use of European hardwoods Dr. Andreas Kleinschmit, Innovation Research Director, FCBA, France
14
State-of-the-art on education and development actions among wood panel industries in Finland Mr. Kasperi Sokka, R&D Director, Metsä Wood, Finland
Power of associations and networking between wood industry companies and with research organizations Mr. Timo Tetri, Business Manager, Jartek Invest Ltd., Finland
16
SESSION I: FOREST MANAGEMENT, WOOD PROCUREMENT, HARDWOOD PROPERTIES AND QUALITY, AND ANALYSIS OF RAW MATERIALS
Abundance and distribution of top five valuable hardwood timber species in Zambia and their implications on sustainable supply Phillimon Ng’andwe, Donald Chungu, Obote Shakacite, Lauri Vesa
18
The climate-growth relationship of Baikiaea plurijuga in Zambia Justine Ngoma, James H. Speer, Royd Vinya, Bart Kruijt, Eddy Moors, Rik Leemans 28
Density and selected mechanical properties of stemwood and branchwood of Brachystegia spiciformis and Julbernadia globiflora Inayat Khan, Narciso Bila, Alberto Manhiça, Ernesto Uetimane Jr , Andrade Egas, Veikko Möttönen
40
The reliability of visual and acoustics grading of beech wood from a standing tree to dry sawn wood Željko Gorišek, Katarina Čufar, Maks Merela, Aleš Straže, Jurij Marenče, Bogdan Šega, Dominika Gornik Bučar
48
Drying quality and properties of subfossil oak from Central Serbia Marko Veizović, Zdravko Popović, Nebojša Todorović, Goran Milić 55
Strength and stiffness perpendicular to the grain of ash (Fraxinus e.) and beech (Fagus s.) in comparison to spruce (Picea a.) Maximilian Westermayr, Frank Hunger, Jan-Willem van de Kuilen
62
3D FE-numerical modelling of growth defects in medium dense European hardwoods Ani Khaloian Sarnaghi, Wolfgang F. Gard, Jan-Willlem van de Kuilen 71

Natural resources and bioeconomy studies 80/2017
4
SESSION II: MARKETS, SUSTAINABILITY AND VALUE CHAINS OF HARDWOOD CLUSTER
Current and future products as the basis for value chains of birch in Finland Erkki Verkasalo, Henrik Heräjärvi, Veikko Möttönen, Antti Haapala, Hanna Brännström, Henri Vanhanen, Jari Miina
81
Hardwood processing in Germany – challenges and opportunities for the wood based panel industry Dirk Berthold, Peter Meinlschmidt, Nina Ritter
97
U.S. secondary wood manufacturers are becoming larger – are there Implications for hardwood sawmills? Matthew Bumgardner, Urs Buehlmann, Omar Espinoza
109
Hardwood research at the Georg-August University of Goettingen Susanne Bollmus, Antje Gellerich, Philipp Schlotzhauer, Georg Behr, Holger Militz 116
Cross laminated timber in the United States: Opportunity for hardwoods? Omar Espinoza, Urs Buehlmann 123
Curly birch (Betula pendula var. carelica), wooden marble from Finland − soon easily available Anneli Viherä-Aarnio, Risto Hagqvist 133
SESSION III: HARDWOOD PRODUCT DEVELOPMENT AND PERFORMANCE Glue-line performance and mechanical properties of multilaminar based products from planted Acacia and Eucalyptus forest resources for furniture manufacturing in Vietnam Nguyen Quang Trung, Henri Bailleres, Nguyen Thanh Tung, Adam Redman
143
Moisture buffering hardwood surfaces Katja Vahtikari, Mark Hughes 150
Case hardening and equilibrium moisture content of European aspen and silver birch after industrial scale thermo-mechanical timber modification Juhani Marttila, Barnes Owusu Sarpong, Veikko Möttönen, Henrik Heräjärvi
156
The green gluing of Eucalyptus grandis boards as a processing phase to reduce drying defects in the semi-finished product Michela Nocetti, Marius-Catalin Barbu, Michele Brunetti, Michael Dugmore, Marco Pröller, Brand Wessels
166
Assessment of internal defects of structural elements made from hardwood with the aid of micro-drilling resistance measurements Wolfgang F. Gard, S. Sleeuwaegen, Jan-Willem van de Kuilen
175
Steam and vacuum treatment of large timber in solid wood skids Zhangjing Chen, Marshall S. White, Ron Mack 176
Roughness profile by laser method on native milled and thermally modified milled oak wood Lukas Kaplan 187
SESSION IV: HARDWOOD PROCESSING, OPTIMIZATION AND TECHNOLOGY DEVELOPMENT FOR SOLID AND COMPOSITE PRODUCTS
Factors affecting dye uptake during the veneer dyeing process of Eucalyptus globulus Ngoc Nguyen, Barbara Ozarska, Peter Vinden, Macarthur Fergusson 195
Black oak wood for furniture application using a special heat pressure steaming process Tillmann Meints, Florian Burgstaller, Christian Hansmann 204

Natural resources and bioeconomy studies 80/2017
5
Cross laminated timber made by large-leaf beech: Production, characterization and testing Gatien Geraud Essoua Essoua, Pierre Blanchet 208
The impact of log heating on veneer quality and plywood performance Anti Rohumaa, Christopher G. Hunt, Charles R. Frihart, Jaan Kers, Louis Denaud, Mark Hughes 213
Glulam made by poplar: Delamination and shear strength tests Carlos Martins, A. M. P. G. Dias, Helena Cruz 222
Using low-grade hardwoods for CLT Production: A yield analysis R. Edward Thomas, Urs Buehlmann 232
Influence of surface activation on silver birch veneer properties Jussi Ruponen, Timo Lindroos, Anti Rohumaa, Kasperi Sokka, Lauri Rautkari 242
Use of phenolic resins for hardwood veneer modification for moulding applications Tom Franke, Anja Kampe, Claudia Lenz, Nadine Herold, Alexander Pfriem 252
Visual and machine strength grading of European ash and maple Andriy Kovryga, Peter Stapel, Jan-Willem van de Kuilen 260
SESSION V: HARDWOOD BIOREFINING AND VALUE-ADDED CHEMICAL PRODUCTS
Mathematical approach to build a numerical tool for mass loss prediction during wood torrefaction Edgar Silveira, Bo-Jhih Lin, Baptiste Colin, Mounir Chaouch, Anélie Pétrissans, Patrick Rousset, Mathieu Pétrissans
272
Odorants in oak wood – a review of aroma-analytical approaches used for uncovering the olfactorily relevant substances Rahil Ghadiriasli, Angela Lopez Pinar, Jan-Willem van de Kuilen, Andrea Buettner
280
Characterization of VOCs emission profile from different hardwood core samples during moisture cycles Martina Sassoli, Marco Fioravanti, Giacomo Goli, Cosimo Taiti, Stefano Mancuso
291
Clonal variation in hybrid aspen wood and bark basic density, heating value and nutrient concentrations Jyrki Hytönen, Egbert Beuker, Anneli Viherä-Aarnio
301
Tree provenance affects the growth and bioenergy potential of juvenile silver birch Antti Haapala, Sari Kontunen-Soppela, Elina Oksanen, Matti Rousi, Blas Mola-Yudego 310
Experimental and numerical analysis of poplar thermodegradation Bo-Jhih Lin, Edgar Silveira, Baptiste Colin , Mounir Chaouch, Anélie Pétrissans, Patrick Rousset, Mathieu Pétrissans
319
POSTER SESSION
Utilizing hardwoods for sustainable furniture products Eva Haviarova, Zuzana Toncikova 327
Web-based database for commercial and lesser-used hardwood timber species in Zambia Phillimon Ng’andwe, Elisha Ncube, Justine Ngoma, Fabian Malambo, Nchimunya Chaamwe 328
Properties of the wood of the Mediterranean Castanea sativa affected by the “roig” coloration: Preliminary results Eduard Correal-Mòdol, Brigitte Mies, Carmen Iglesias-Rodríguez
337

Natural resources and bioeconomy studies 80/2017
6
Drying of low quality birch timber – quality, time and energy consumption Fritz Wilhelms, Susanne Bollmus, Philipp Schlotzhauer, Holger Militz 345
Bark of European deciduous trees as a potential source for production of proanthocyanidins-rich extract Sarmite Janceva, Maris Lauberts, Liga Lauberte, Alexandr Arsanica, Tatiana Dizbite, Galina Telysheva
354
Comparison of physicochemical characterization of pretreated bamboo fibers Ma Li, Chu Jie, Zhangjing Chen 362
The properties of wax impregnated birch wood Juho Peura, Olli Paajanen, Hannu Turunen 371
INDUSTRY AND FIELD VISITS
Raute Corp. 377 Visaseura ry (Finnish Curly Birch Society) 378 Koskisen Ltd. 379 ISCHP 2019 380

Natural resources and bioeconomy studies 80/2017
7
Scientific collaboration

Natural resources and bioeconomy studies 80/2017
8
Financial Support

Natural resources and bioeconomy studies 80/2017
9
Preface ity of Lahti, Finland, has the opportunity to host the 6th International Conference of Hardwood Processing (ISCHP 2017) during September 25 to 28, 2017. The main events of the conference are arranged in the spectacular Sibelius Hall, an internationally acknowledged congress and concert
center with attractive wooden interiors and excellent acoustics. Lahti region constitutes also one of the main hardwood industry clusters in Finland with versatile manufacturing of hardwood products and processing machinery, high-quality birch resources, and long history of education in wood products sector.
The conference exhibits a continuum to the 10-year old history of ISCHP, the previous events being in Canada (2007 and 2015), France (2009), USA (2011), and Italy (2013). The scientific collaborators in the ISCHP family, listed before in page 2, take in turn the responsibility of the conference organization, and now it is the Finnish turn. Natural Resources Institute Finland (Luke) is the responsible organizer of this conference with a substantial support from University of Eastern Finland (UEF) and Aalto University. We are especially happy of this unique task in 2017, while Republic of Finland celebrates its centennial history as an independent country.
The main objective of this conference is to bring together the scientific and research communities working on hardwood, from the source to the customer, to share knowledge and ideas. Around 80 international experts, scientists, government employees, hardwood industry representatives, suppliers, and customers attend the conference to discuss recent progress and innovative work in this valuable area of wood-based economy.
Topics covered by ISCHP 2017 1) Forest management, wood procurement, wood properties and quality and analysis of hardwoods 2) Markets, sustainability, and value chains of hardwood cluster 3) Hardwood product development and performance 4) Hardwood processing, optimization and technology development for solid and composite
products 5) Hardwood biorefining and value-added chemical products
This conference book contains abstracts of all presentations in the conference, descriptions of industry and field visits and practical information for the attendees. A total of 42 scientific oral and poster presentations from 131 authors coming from 22 countries, and four keynote presentations from invited academic and industry experts provide the basis for the scientific success of ISCHP 2017. Papers written on the presentations have undergone a scientific peer-review process. They are available for readers in an electronic format in the Conference Proceedings.
On behalf of the organizing committee of the conference, I have the pleasure to wish the very best results and pleasure from the scientific and industry contents and networking with colleagues, not to talk about an enjoyable time in Lahti region.
Erkki Verkasalo Chair of ISCHP 2017
C

Natural resources and bioeconomy studies 80/2017
10
Acknowledgements he organization and contents of the 6th edition of ISCHP conference is a result from the support of several different organizations and individuals. I want to express my gratitude to each of them that make the conference possible.
Big thanks go to the members of Organizing Committee, Scientific Committee, and Editorial and Practical Management Committee, listed in page 6. Organizing committee was responsible for the planning, preparation, and accomplishment of the conference. Members of Scientific Committee and Organizing Committee were jointly responsible for accepting the abstracts and managing the peer-review process of the full papers. The anonymous reviewers deserve a big appreciation for their voluntary work to guarantee the quality of the papers. Editorial and Practical Management Committee took care of editing this book, as well as the Conference Proceedings and the actual accomplishment of the conference. In addition, the communications staff of Luke prepared media releases and social media means, and distributed conference announcements and info materials to academic and professional audience.
Secondly, I wish to thank Raute Corp., Koskisen Ltd. and Visaseura ry (Finnish Curly Birch Society) and their representatives for hosting the industry and field visits, as well as other collaboration during the conference. City of Lahti is gratefully thanked for contributing to the welcome reception and Mukkula Manor for being available for the conference dinner.
Thirdly, organizing a conference like ISCHP strongly benefits from support of public and private collaborators. Therefore, I wish to thank Puumiesten ammattikasvatussäätiö (Foundation of Finnish Wood Industry Technicians and Engineers) and Tieteellisten Seurain Valtuuskunta (Federation of Finnish Learned Societies) for financial support, as well as Raute Corp., Koskisen Ltd., Visaseura ry., and International Thermowood Association for sponsorships for the event.
Fourthly, I want to thank Natural Resources Institute Finland (Luke) for allowing partial financing and working hours of the staff to organize the conference, University of Eastern Finland (UEF) and Aalto University for similar contribution, as well as the home organizations of Scientific Committee members for the scientific support to the conference.
Finally, special thanks go to all speakers and other attendees of the conference.
Erkki Verkasalo Chair of ISCHP 2017
T

Natural resources and bioeconomy studies 80/2017
11
ISCHP 2017 Committees
Chair: Erkki Verkasalo Luke, Finland
Organizing committee: Erkki Verkasalo Luke, Finland Lauri Rautkari Aalto University, Finland Henrik Heräjärvi University of Eastern Finland, Finland Antti Haapala University of Eastern Finland, Finland Veikko Möttönen Luke, Finland Henri Vanhanen Luke, Finland Anneli Viherä-Aarnio Luke, Finland
Scientific committee: Erkki Verkasalo Luke, Finland Pierre Blanchet Université Laval, Canada Frédéric Rouger FCBA, France Stefano Berti Ivalsa, Italy Urs Buehlmann Virginia Tech, USA Jan-Willem van de Kuilen Technical University of Munich, Germany Wolfgang Gard Delft University of Technology, Netherlands Torsten Lihra Université Laval, Canada Uwe Schmitt IAWS, Germany
Editorial and practical arrangements committee: Erkki Verkasalo Luke, Finland Veikko Möttönen Luke, Finland Krista Kettunen Luke, Finland Merja Lindroos Luke, Finland Emilia Heinonen University of Eastern Finland
The presented papers reflect the opinion of the respective authors. Information contained in this document has been obtained by the authors from sources believed to be reliable. Authors of specific papers are responsible for the accuracy of the text and technical data. Neither the publisher nor the editors or authors shall be responsible for any errors, omissions or damages arising out of use of this information. The presented papers were all peer-reviewed.
Papers in this document should be quoted as follows: Verkasalo, E., Heräjärvi, H., Haapala, A., Möttönen, V., Brännström, H., Vanhanen, H., 2017. Current and Future Products as the Basis for Value Chains of Birch in Finland. ISCHP 2017: 6th International Scientific Conference on Hardwood Processing. Lahti, Finland, p. 82-97.

Natural resources and bioeconomy studies 80/2017
12
Keynote Speeches

Natural resources and bioeconomy studies 80/2017
13
Prof. Alfred Teischinger University of Natural Resources and Life Sciences Vienna, Austria
From Forest to Wood Production – a selection of challenges and opportunities for innovative hardwood utilization
ased on the European atlas of tree species, the paper provides a short survey of the European hardwood area. Further the allocation of the various hardwood species to the main wood process chains is provided and discussed. According to their wood properties, specific hardwood species
are featured for a specific process chain. Selected hardwood-specific raw material properties and their variation in comparison to the
softwoods are discussed as a major challenge for hardwood utilization. Besides features such as knot sizes and cracks, the trunk morphology, for example, is an important decision pattern for allocating roundwood to the sawmill process or other industrial processes such as pulping. Contrary to softwoods, hardwoods quite often grow in mixed species forests, where a specific species might grow in smaller plots or even in a scattered distribution. On the other hand, most of the wood process chains follow the law of economy of scale, which means that the hardwood allocation radius expands in comparison to softwood allocation. The allocation radius of wood raw materials is a decisive measure and decision criteria for primary processes.
The relationship between volume and value of mature trees is an important approach in the discussion about softwood or hardwood forestry. Based on these considerations a short survey of the grading rules is given in order to assess wood quality and to match the raw material properties with product properties. Currently, in many central European countries a significant amount of hardwood is allocated to the energy sector for reasons mentioned above and current economic framework conditions. On the other hand the potential of value-added and innovative hardwood utilization is underestimated within and outside the forest-based sector.
Biography
Alfred Teischinger studied Wood technology at BOKU University Vienna, Austria, and gained his Ph.D. from the Institute of Wood Science and Technology, also Vienna. After an Assistant Professor position there, he went to the University of Washington, Seattle, USA, with a Fulbright Scholarship. In 2000, Teischinger was appointed Full Professor for Wood Technology at BOKU Vienna. From 2001 to 2015, he was scientific director of the Competence Centre for Wood Composites and Wood Chemistry (Wood K plus), and since 2013, he is Head of the Department of Material Sciences and Process Engineering at BOKU.
Professor Teischinger is chairman of the Austrian Standard committee for wood and wood-based materials, Editor of the Series "LIGNOVISIONEN", a publication of the Institute of Wood Science and Technology at BOKU Wien, and member of the editorial board of Wood Research, the European Journal of Wood and Wood Products, and Holztechnologie. He is a member of various national and international organizations in the field of wood and wood industries and fellow of the International Academy of Wood Science (IAWS).
B

Natural resources and bioeconomy studies 80/2017
14
Dr. Andreas Kleinschmit Innovation Research Director, FCBA, France
The Broadleaf Citizen – Broadening the innovative use of European hardwoods
n initiative for the creation of a thematically focused, innovation, research and training alliance, has been launched, within the European umbrella organisation InnovaWood in close cooperation with the European Forest Institute (EFI). This initiative is called “European Hardwoods Innovation
Alliance – EHIA”. It has already been accepted by the European Commission Services as a commitment under the European Innovation Partnership for Raw Materials (ID 669). Key objectives of EHIA are the production of a detailed innovation and research program (IRP) (final draft May 2017 after wider consultation process) with an accompanying implementation action plan (IAP).
For the gathering of input from industry, the research community at large and other stakeholders, a first set of sixteen Innovation and Research themes have been pre-defined:
1Smart buildings and timber construction; 2facades and exterior applications; 3interior design; 4furniture and well-being; 5wood-based composites, new materials and fibers; 6green chemistry (food and non-food); 7life-style goods; 8mobility (humans, animals and products); 9clever keen injection (transfer of existing know-how into the forest-based sector); 10harvesting, transportation and logistics; 11forest ownership and resource availability; 12hardwoods resource location and potential; 13mobilization; 14forest management strategies; 15tree breeding; trade and markets; 16societal attitudes and expectations.
The E-HIA IRP will generate excellent knowledge and provide new products, processes and services. It will emphasize the value added use of HARDWOODS within Europe and contribute to tackle the grand societal challenges.
The Alliance will coordinate the know-how and the critical mass leading to breakthroughs in innovation, research and it will create new qualified employment in smart rural regions within Europe as well contribute in a positive way to urban communities.
The Timeframe is considered to facilitate collaboration with a long-term perspective (2025 and beyond). DISCLAIMER: It is important to underline that the E-HIA WILL NOT replace evolutions and innovations in existing forest-based value chains that are built upon softwood species. It is focussing on existing undervalued potentials and new applications by using hardwood species in an innovative way.
Background: Europe is covered by 41% with forest. Historically hardwoods were used in the construction sector, furniture, cladding, flooring etc. Today the forest-based industries within Europe are predominately based on softwood use. Coniferous tree species account for 57% of the European growing stock in forests, that corresponds to 20.0 billion m3. The growing stock of broadleaved tree species amounts to 15.0 billion m3. But, the stem volume of living trees in European forests is evenly distributed between broadleaved and coniferous tree species in almost all regions with the exception of the North Europe region where around 75% of growing stock is coniferous [Forest Europe, 2015]. The European Hardwoods Innovation Alliance runs under the umbrella of InnovaWood in a close collaboration with the European Forest Institute (EFI). The overall coordination is carried out by Dr. Andreas Kleinschmit von Lengefeld (FCBA, France) and Prof. Frédéric Pichelin (BFH, Switzerland) with a strong support team of key experts.
A

Natural resources and bioeconomy studies 80/2017
15
Biography
Dr. Andreas Kleinschmit von Lengefeld has been the Director of the French Institute of Technology for forest-based and furniture sectors (FCBA) since April 2011. Today around 340 people work at FCBA. The innovation and research activities at FCBA cover large parts of the French forest-based sector, namely forestry and genetic improvement of trees, lingo-cellulosic materials, building and living with wood and socio-economic aspects.
From March 2005 until March 2011 he was involved in the setting-up and operating of the European Forest-Based Sector Technology Platform – FTP, at which he held the position of Director. During that period he was also the RTDI Manager at CEI-Bois (Confederation of European Woodworking industries). He studied forestry sciences at Ludwig-Maximilians-University of Munich and holds a PhD from Technical University of Munich. Dr. Kleinschmit von Lengefeld is member of various expert and advisory groups:
Member of the InnovaWood Executive Board; Coordinator of the European Hardwoods Innovation Alliance (EHIA), Task Force Leader “Impact” within the InnovaWood network; Chairman of the Advisory Board of EFI regional office EFIATLANTIC; FTP NSG France; Member of the Stakeholder Advisory Board for the ERA-NET Foresterra; Member of the WoodWisdom-NET+ Management Team, Member of the ECOFOR Scientific Council; Member of the ESB Scientific Council; Member of the partners committee at IRSTEA.
Coordinating expert of the Focus Group 20 under the EIP AGRI on “sustainable mobilisation of forest biomass”

Natural resources and bioeconomy studies 80/2017
16
Mr. Timo Tetri Business manager, Jartek Invest Ltd., Finland
Power of Associations and Networking between Wood Industry Companies and with Research Organizations
e live in a world of global markets and availability of choices. A new product needs to have both economic and technical feasibility to be able to enter on the markets. Research and development pro-cesses are long and commonly require high financial resources. All new
products and processes do not succeed. We should not underestimate timing either. Product or process can be superior in many ways, but if timing is not right, success will not come.
On the other had we live also in the world of sharing, cooperation and networking. Finland is said to be the promised land of associations.
Roughly 20 years ago thermally modified wood with Thermowood method was introduced on the market. Not much later Thermowood Association, ITWA, was founded and Thermowood production was harmonized.
Today Thermowood has achieved a good market position and continuous growth. New members join to ITWA and new wood species are modified with Thermowood technology and introduced on the market.
During all these years ITWA has completed many research projects to be able to understand more and more the possibilities and limits of Thermowood in different applications and conditions. These re-search projects have required very close cooperation with research organizations internationally. Many of these projects would not have been feasible without sharing the costs and results. Keywords: thermally modified wood, networking, Thermowood, ITWA
Biography
My education is in business economics and marketing. First 10 years of my work life my occupation was in furniture industry and main activities were management of quality control, product development, distribution networks and sales. Also manufacturing of wooden furniture came very familiar during those years.
Since 1992 I have worked in technology companies, which provide machinery for wood working industry. I started this era first as a sales and project manager with applications of fast gluing lines for engineered flooring,
door and window and furniture industry. A short period of work history has taken place also in an engineering company, mainly to engineer their budgeting systems.
My present occupation at Jartek started in October 2000. By then wood modification was in very early phases and real industrial production was just initiated by first major plant investments in Finland. It has been a privilege to see so closely the TMT industry to grow from pilot plants to serious businesses. My years at Jartek have been fulltime only for Thermowood technology. I have shared this interesting development process of new industry with an international network of customers, colleagues, partner companies, scientists and research organizations.
I am also one of those, who were present at founding meeting of International Thermowood Association in December 2000. Since 2004 I have been a board member in ITWA and chairman of the board since 2007, not constantly, but, many, many years….When I get some spare time, I like to spend it in nature with my wife. We love all seasons of the year and adjust our activities according to those.
W

Natural resources and bioeconomy studies 80/2017
17
Session I Forest management, wood procurement, hardwood properties and quality, and analysis of raw materials

Natural resources and bioeconomy studies 80/2017
18
Abundance and distribution of top five most valuable hardwood timber species in Zambia and their
implications on sustainable supply Phillimon Ng’andwe1, Donald Chungu1, Obote Shakacite1,
Lauri Vesa2
Abstract
Zambia’s forests have been estimated to cover approximately 44 million ha. However, recent studies have shown that these forests are dwindling at a deforestation rate of 0.6% per annum. Increasing hardwood demand and unsustainable cutting practices are suggested as some of the factors contributing to the current rate of deforestation that affect the relative abundance of valuable species in the country. In addition, quantities and potential supply of remaining valuable hardwood timber species in Zambia are not well understood. The aim of this study was to quantify the abundance, distribution and stocking levels of selected valuable top five most valuable hardwoods on demand (i.e. Afzelia quanzensis, Baikiaea plurijuga, Guibourtia coleosperma, Pterocarpus angolensis and Pterocarpus chrysothrix). Data was collected from the 2015 national forest inventory database. Results obtained from the top five hardwoods on demand showed that the relative abundance (RA), diameter distribution, annual allowable cut (AAC) and stocking densities (SD) varied across species. P. angolensis recorded the highest RA of 63% and SD of 6.6 m
3/ha, the lowest RA of 3% and SD of 0.28 m
3/ha was observed in A. quanzensis. Results also
showed that P. angolensis was found in every province and mostly abundant in Luapula and Western provinces, RAs of 15% and 14% respectively. The most demanded P. chrysothrix hardwood was abundant in Luapula (4%) followed by Eastern (2%). B. plurijuga was found in Western (10%) and Southern (3%). Overall results showed that over 402 million m
3 of commercial
volume was available from the forests and the valuable species accounted for over 52 million m3
representing 13% of the commercial volume. The AAC was estimated at 4 million m3/year. These
results indicate the need to manage hardwood supply, promote lesser-known valuable hardwoods and diversify their utilization through forest certification to enhance their commercial importance.
Introduction 1.Zambia’s forest cover has declined from over 66% (49.9 million ha) in 2008 to 58.7% (44.1 million ha)
in 2016 and the current total growing stock has been estimated at 3.2 billion m3 of which 43% is considered of commercial importance (Shakacite et al. 2016). Despite this huge stock, forests in Zambia face increasing pressure due to household and industrial wood demand. It is speculated that extensive selective harvesting of trees has contributed to the sporadic distribution of commercial tree species thereby affecting their stocking densities, distribution and their relative abundance in the country. In addition, the increasing distances to wood harvesting areas, due to sporadic distribution of trees with merchantable size result in increasing production costs (Ratnasingam et al. 2014). Despite increasing distances to harvesting areas in the country, harvesting of wood and export of low grade hardwood cants (wood in the rough) have continued to increase (Ratnasingam et al. 2014, Azanzi et al. 2014, Phiri et al. 2015). Illegal logging of hardwood species on demand has Corresponding author: Tel.: +260977244672; E-mail: [email protected]
School of Natural Resources Copperbelt University, P.O. Box 21692,
Kitwe, 10101, Zambia
2ForestCalc Consulting Oy Koski-Jaakonkatu 15,
80230 Joensuu, Finland

Natural resources and bioeconomy studies 80/2017
19
become rampant due to high commercial value and availability of export markets particularly in China (Azanzi et al. 2014, Phiri et al. 2015).
According to the United Nations Comtrade data, exports of wood in the rough (cants) from valuable hardwoods has been increasing at an average annual change of 62% since 2010 (UN 2003). This increase suggests the availability of markets and price premiums for valuable prime industrial hardwoods. The increasing demand for valuable hardwoods such as Afzelia quanzensis Welw., Baikiaea plurijuga Harms, Guibourtia coleosperma (Benth.) J. Léonard. Pterocarpus angolensis DC,
Pterocarpus chrysothrix Taub. and other species belonging to Brachystergia species provide great opportunities for private sector participation through value addition processing and bioenergy production (Hagglom and partners 2016). However, raw material insecurity, unknown patterns of distribution and uncertainty of the potential supply are often considered as potential risks to attracting investment in the timber industry in Zambia (Ratnasingam and Ng'andwe 2012, Ng'andwe et al. 2015, Hagglom and partners 2016). Nevertheless, Zambia conducted an integrated land use assessment and collected data in 2005 and 2010 on various aspects of forests to provide useful information on the available growing stock for use by the forestry sector, investors, policy formulation and other stakeholders (MTENR 2008, Shakacite et al. 2016). However, the data requires further analysis targeting certain interests and user groups. The aim of this study was to describe patterns of distribution and abundance of top five hardwoods selected based on demand for sustainable industrial hardwood processing (i.e. A. quanzensis, B. plurijuga, G. coleosperma, P.
angolensis and P. chrysothrix). We also estimated diameter distribution, volumes and supply potential for these hardwoods.
Commercial importance of top five hardwood species 2.Tropical hardwood is unique among consumer products owing to the number of characteristics that sets it apart from other products. Some of the characteristics among species that influences customer preference and commercial importance include colour, density, pattern of growth rings (grain texture or pattern), and character marks (knots, stains, insect damage, etc.) (Thulasidas et al. 2006, Brinberg et al. 2007). For example, for furniture applications, both grain consistency and design are significant predictors of willingness to pay for a solid wood product by a consumer in the United States (Brinberg et al. 2007). Therefore, understanding consumer preferences of characteristics and species can aid in the global marketing of Zambia’s valuable hardwood species. In addition, the commercial importance and use of each of these species are influenced by economic factors such as availability, wood properties and market acceptance (Ratnasingam et al. 2014, UNECE/FAO 2015). The heartwood appearance of the top five hardwood sawn wood in Zambia (i.e. reddish to reddish brown and shades of these colors) and heartwood durability are considered among basic factors that influence preference and commercial importance of species at the end use point along the value chain. The appearance of the top five valuable hardwoods is shown in Figure 1.
Figure 1. Appearance of the kiln dry heartwood of the top five most valuable hardwoods on demand in Zambia: (a) Afzelia quanzensis - yellowish brown to pink color, (b) Baikiaea plurijuga - reddish brown with black

Natural resources and bioeconomy studies 80/2017
20
streaks, (c) Guibourtia coleosperma - rich mahogany-like red-brown colour, (d) Pterocarpus angolensis - brown streaked appearance and (e) Pterocarpus chrysothrix - deep reddish colour.
In general, the commercial importance of Zambia’s hardwoods has been attributed to the
attractive appearance of the well-established B. plurijuga (b) and P. angolensis (c) as benchmark hardwoods. Hardwoods with similar heartwood appearance such as A. quanzensis (a), G. coleosperma (d) and P. chrysothrix (e) are often used as substitutes in the market (Ng’andwe et al.
2015) even though the legality and quality assurance is questionable (Ratnasingam et al. 2014, Azanzi et al. 2014). Highlights of the ecology, technical properties that influence their commercial importance are described below:
Afzelia quanzensis: This species, also known as “pod mahogany” occurs in dry evergreen forest, woodlands and scrub forests at altitudes ranging from 1350 to 1800m altitude (Storrs 1979). It is distributed in Angola, Botswana, southern DR. Congo, Mozambique, South Africa, Tanzania, Zimbabwe and Zambia. It grows in association with Brachystegia and Pterocarpus spp. The susceptibility of A. quanzensis to fire hampers the natural regeneration (Storrs 1979). The heartwood is yellowish brown to pinkish brown (Figure 1a), becoming red-brown upon prolonged exposure, sometimes with darker streaks (Orwa et al. 2009). Heartwood is durable and distinctly demarcated from the whitish to pale yellow, up to 10 cm wide sapwood. The grain is straight to interlocked, yet it is dimensionally stable with a density of 800–870 kg/m³ at 12% moisture content. It is used in various wood products including doors and flooring. It is sometimes used in carving as an alternative for P.
angolensis. Baikiaea plurijuga: The commercial of importance of B. plurijuga is well documented (Piearce
1986, Ngoma et al. 2017). It is native to Angola, Botswana, Namibia, Zambia and Zimbabwe. It grows in pure stands in the low rainfall area of less than 700 mm. B. plurijuga is an important species in Zambia as it is a source of hardwood timber used for railway sleepers, furniture and flooring (Ng'andwe et al. 2015, Ngoma et al. 2017). The wood is heavy, with a density of 800-950 kg/m³ at 12% moisture content. The appearance of wood reddish brown with black streaks is typical of this diffuse porous hardwood (Figure 1b). Its commercial importance was recognised a long ago around 1911 as the main source of railway sleepers in the then Northern Rhodesia and today its value chain is well established (Fanshawe, 1962).
Pterocarpus angolensis: This species is native to Southern Africa (Angola, Mozambique, Namibia, South Africa, Swaziland, DR Congo, Zimbabwe and Zambia) and Eastern Africa (Tanzania), and typically found in the Miombo woodland growing in association with other deciduous trees such as Brachystegia species in areas with annual rainfall above 500 mm (Fanshawe, 1962, Storrs, 1979, Orwa et al. 2009). The technical properties that influence its end use are well documented (Chidumayo, 1996, Orwa et al. 2009). The wood is heavy, with a density of 650–700 kg/m³ at 12% moisture content. Wood is characterised by attractive streaked appearance, durable heartwood and light brownish-yellow colour (Figure 1c) suitable for various joinery, furniture and wood carvings. The Streaked appearance of P.
angolensis and superior carving properties, makes it easy for substitution by other LU and LK species such as A. quanzensis (Figure 1a), P. chrysothrix (Figure 1e) and other LU and LK (Orwa et al. 2009).
Guibourtia coleosperma. This species is known as “Rosewood” and occurs in forest
woodlands and often along rivers, at 750–1400 m altitude and mean annual rainfall of (450-1100 mm). It grows well on Kalahari sand soils, which are deep and infertile with a low water-holding capacity (Storrs 1979). It is found in Angola, Botswana, southern DR. Congo, Namibia, Zimbabwe and Zambia. It is often one of the dominant species in the upper storey together with B. plurijuga and P. angolensis (Chidumayo 1996). The heartwood is pinkish brown or pale red-brown with pinkish or reddish stripes (Figure 1d) and often darkening to a rich

Natural resources and bioeconomy studies 80/2017
21
mahogany-like red-brown colour (Figure 1a) (Orwa et al. 2009). The wood is heavy, with a density of 670–960 kg/m³ at 12% moisture content. The attractive appearance of this wood influences its commercial importance as it is widely used in construction, flooring and joinery among others. The grain is straight or interlocked and the texture moderately fine and even.
Pterocarpus chrysothrix: This is a deciduous tree that grows at high altitudes around hills of up to 1750 m (Storrs 1979) and is a synonym of Pterocarpus tinctorius (Lemmens 2008). It is native to Angola, DR Congo, Malawi, Mozambique, Tanzania and Zambia. The bark of this species is grey to dark brown and scaly similar to that of P. angolensis. It is a diffuse porous hardwood with indistinct growth rings, heavy wood with basic density of 450-900 kg/m3 at 12% moisture content. Until recently the commercial importance was not well documented and often reported as P. tinctorius (Lemmens 2008). The wood is reddish in colour (Figure 1e) and finds application in the furniture, wood cabinets and decorative floors, handy crafts and ethnobotany. The demand for P. chrysothrix has increased in recent years because the wood fetched attractive price on the exported market (Azanzi et al. 2014). The indiscriminate cutting of this species across the country, to meet growing export demand, threatens its existence and future supply. Therefore, P. chrysothrix ranks highly on the list of commercial species that the Government of Zambia plans to conserve while regulating exploitation to realise maximum contribution to the national economy.
Methods 3.To determine the abundance and distribution of the top most valuable hardwood tree species, data was obtained from the national database of the integrated land use assessment (ILUA) at the Forestry Department, Zambia (Forestry Department, 2010). Based on expert knowledge and secondary information sources of hardwood species on high demand (Azanzi et al. 2014), we filtered the top five species from this database. Data obtained include tree botanical names and GPS locations. The filtered raw data was cleaned in to remove errors. Using this data, we computed the stocking densities, dbh distribution, relative abundance and annual allowable cut for the top most valuable hardwood tree species. To re-evaluate sustainable supply and commercial importance between 2008 and 2016, the compound annual growth rate (GAGR) was computed. This was important to determine the average annual change in stocking densities of the top five species on demand. A proximate annual allowable cut (AAC) of industrial valuable species was determined as a product of the mean annual increment (MAI) and forest production area using a method from the literature (Ng’andwe et al. 2015). Diameter distribution and abundance density for each hardwood tree species was also assessed. Analysis of data was done in R version 3.3.2 (2016).
Results and discussions 4.
Abundance and distribution of top five hardwoods 4.1.The relative abundance of P. chrysothrix was the second lowest (RA of 8%) among the top five hardwoods on demand when compared to traditionally well-known and used species such as P.
angolensis (RA of 63%) and B. Plurijuga (RA of 12%) (Table 1). The RA of A. quanzensis and G.
coleosperma were 3% and 14%, respectively. At the provincial level, the distribution of the top five hardwoods on demand was highest in the
Western province (RA of 34.1%) followed by Luapula (RA of 19.7%) and Northern province (RA of 10.8%). The RA distribution of these hardwoods also varied greatly across other provinces (i.e. Central 3.4%, Copperbelt 1.8%, Eastern 3.9%, Lusaka 0.9%, Muchinga 3.8%, Southern 5.1%). Among the 200 hardwood species for timber and energy found in Zambia, P. angolensis is known to be in the

Natural resources and bioeconomy studies 80/2017
22
top ten (Shakacite et al. 2016). P. chrysothrix, previously a lesser known species, was one of the species on highest demand followed by B. Plurijuga among the industrial grade of valuable hardwoods.
Table 1. Relative abundance for the top five most valuable hardwood species on demand in Zambia.
Species Relative abundance (%) Afzelia quanzensis 3 Baikiaea plurijuga 12 Guibourtia coleosperma 14 Pterocarpus angolensis 63 Pterocarpus chrysothrix 8
The LU species such as Julbernardia paniculata, Brachystegia bohemii, Colophospermum mopane and several other Brachystegia species which were reported as the most abundant hardwoods in Zambia should be promoted for bioenergy, sustainable charcoal production and carbon trade (Hagglom and partners 2016, Shakacite et al. 2016). P. chrysothrix, previously considered as a lesser known species, was found in this study to be the most demanded species followed by B. Plurijuga as the most preferred industrial grade of valuable hardwoods.
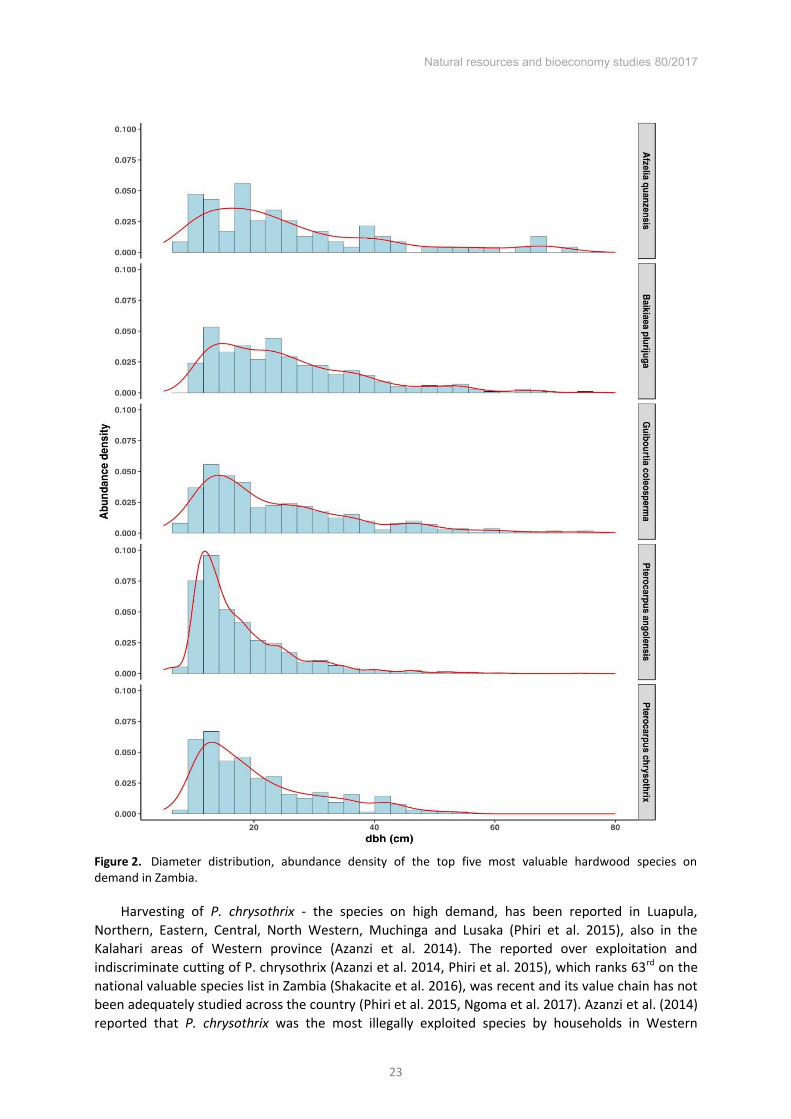
Diameter distribution of the top five most valuable hardwoods 4.2.The distribution of A. quanzensis (Figure 2a) was more wide spread in Northwestern and Luapula provinces while that of B. plurijuga (Figure 2b) and G. coleosperma (Figure 2c) were concentrated in Western and Southern provinces. P. chrysothrix (Figure 2d) was concentrated in Luapula province and a sporadic distribution was observed in Eastern, Muchinga, Northern and Northwestern provinces. The diameters for the top five most valuable hardwoods were skewed towards small sized trees with dbh below 20 cm (Figure 2). Higher abundance densities were observed for these trees. B. plurijuga (Figure 2b), concentrated in Western part of Zambia, had the highest abundance density for trees above 20cm followed by G. coleosperma (Figure 2c). There were few trees with over 40 cm dbh across Zambia. P. angolensis was the most abundant and widely distributed species in the country dominated by trees with dbh less than 20 cm.
The tree sizes that can be harvested for sawlogs are limited to >30 cm dbh and 5-30 cm is designated for poles according to the Forest Act of 2015 (GRZ 2015). Over 80% of P. chrysothrix trees met the dbh criteria for poles while 20% were suitable for sawlogs. This open ended dbh criteria is one of the loop holes in the regulation used by licensees to illegally extract P. chrysothrix for export in Zambia. In this study it was found that over 70% of A. quanzensis and B. plurijuga trees met the criteria as material for poles. Among the top five species on demand only P. angolensis seemed to have an even distribution across Zambia (Figure 2e) growing in association with a wide range of LK and LU hardwoods but according to the law (GRZ 2015) only 10% of P. angolensis trees could be harvested as sawlogs (GRZ 2015). The distributions of the top most valuable hardwood species by dbh skewed towards small diameters is indicative of the need to restrict extraction to quantities of these hardwoods.
Natural resources and bioeconomy studies 80/2017
23
Figure 2. Diameter distribution, abundance density of the top five most valuable hardwood species on demand in Zambia.
Harvesting of P. chrysothrix - the species on high demand, has been reported in Luapula, Northern, Eastern, Central, North Western, Muchinga and Lusaka (Phiri et al. 2015), also in the Kalahari areas of Western province (Azanzi et al. 2014). The reported over exploitation and indiscriminate cutting of P. chrysothrix (Azanzi et al. 2014, Phiri et al. 2015), which ranks 63rd on the national valuable species list in Zambia (Shakacite et al. 2016), was recent and its value chain has not been adequately studied across the country (Phiri et al. 2015, Ngoma et al. 2017). Azanzi et al. (2014) reported that P. chrysothrix was the most illegally exploited species by households in Western

Natural resources and bioeconomy studies 80/2017
24
province of Zambia for sell to the private Chinese companies and further identified the growing demand in the export markets and the need for household income to be among the main drivers for indiscriminate cutting in the area. According to Phiri et al. (2015), this species was harvested illegally by households from hills where it grows characterized by long distances and difficult terrains in some provinces. Similar illegal logging of P. chrysothrix has been reported in Luapula, Lusaka and Northern provinces in both print and electronic media, from forests and woodlands across the country, which suggest that this species has the highest technical and commercial value in Zambia (Azanzi et al. 2014, Phiri et al. 2015, Ng’andwe et al. 2015). However, on the export markets, other factors that relate to policy, legality and quality assurance strongly influence market access of tropical hardwoods and should be considered.
The abundant valuable LU and LK hardwood resources across the country provide great opportunities to SMEs and large industries to start investing in value addition processing of hardwoods. It is also the opportunity for Government to reduce pressure on P. angolensis, B.
plurijuga, G. coleosperma and A. quanzensis to contribute to efforts aimed at reducing deforestation (Vinya et al. 2011) through schemes such as forest certification and forest law enforcement, governance and trade (FLEGT) for actors who have plan to export hardwood sawn timber and vale added wood products to Europe and elsewhere. Forest certification tools will ensure that forests are well managed, economically, socially and environmentally. The forest act No.4 of 2015 can also be used by the Government to reduce illegal logging through development of an effective licensing system and regulations that link the demand and supply.
Luapula province with high relative abundance of P. angolensis and P. chrysothrix should be developed as one of the economic clusters - an industrial hardwood processing park in line with recommendations by Hagglom and partners (2016). Similarly, Western province could be developed for sustainable processing of B. plurijuga and G. coleosperma hardwoods while bioenergy and sustainable charcoal production could be clustered in Northwestern province.
Average annual change of stocking density of top five 4.3.hardwoods
The stocking density of P. angolensis declined from 1.33m3/ha in 2008 to 0.48 m3/ha in 2016, representing an average annual change of CAGR -12%. The average annual increase in the stocking densities were observed in G. coleosperma (CAGR of 5%), B. plurijuga (CAGR of 17%) - another traditionally over-exploited industrial round wood and P. chrysothrix (CAGR of 83%) - which was among the top LK hardwood on high demand in 2016 (MTENR2008, Shakacite et al. 2016). The reduction in the stocking density (sph) of P. angolensis, suggest that this hardwood is currently sporadically distributed in some areas, and characterized by long distances to forest production areas as reported by Shakacite et al. (2016). The increasing demand for furniture and builders’ joinery and carpentry for P. angolensis has resulted in the reduced stocks since 2008. The average annual increase in the stocking densities in B. plurijuga (CAGR of 17%), another species on demand suggest a reduction in harvesting intensities, increasing distances, sporadic species distribution as well possible substitution by P. chrysothrix (CAGR of 83%) and G. coleosperma (CAGR of 5%). In addition, the potential to certify the B. plurijuga forest, which failed several attempts to have it certified, is now high in Western province given the availability of current inventory data and mapping of this species.
Commercial hardwood volumes 4.4.Results on stocking density, tree volumes and AAC for valuable tree species are presented in Table 2. Results show that slightly over 402 million m3 is available for industrial utilization as commercial volume, representing 27% of the total volume of trees in the country. Over 4 million m3 was estimated as AAC which can be harvested on yearly sustainable basis for industrial processing (Table

Natural resources and bioeconomy studies 80/2017
25
2). Furthermore, the AAC by product type (i.e. sawlogs, peeler logs poles and fuelwood) should be determined by forest managers in line with the minimum dbh requirement and the need for multiple use of trees in forests earmarked for licensing. A regulation to extract hardwood poles from the most valuable species should not be encouraged to allow these trees get into sawlog dbh classes so sustainability could be achieved.
As a tool, forest certification will ensure that the top five hardwoods are sustainably harvested together with the LU and LK species in compliance with laws and regulations locally and globally. It is important to provide incentives for use of LU and LK hardwoods by SMEs while encouraging research and innovation for future development of the hardwood industry. Even though, the AAC for valuable hardwoods that meet industrial requirements are sufficient given the limited processing capacity (Hagglom and partners 2016) more needs to be done by the forestry Department to attract meaningful investment in the forestry sector.
The stocking density of industrial round wood was highest in Northwestern (48.9 m3/ha) and Copperbelt (41.9 m3/ha). The growing stocks in Southern (24 m3/ha) and in Lusaka (25.8 m3/ha) provinces were among the lowest. The AAC for industrial grade hardwoods was highest in the Northwestern province (1.17 million m3/yr), Muchinga (0.53 million m3/yr) and Western (0.50 million m3/ha). The highest stem count per hectare (sph) and volume per hectare of the top five most valuable species was observed in P. angolensis (1.4 sph and 6.6 m3/ha) and G. coleosperma (1.3 sph and1.5 m3/ha) (Table 3).
Table 2. The forest growing stock and annual allowable cut of commercial hardwoods in Zambia.
Province Area
(million ha) m3/ha
Commercial volume (million m3) AAC (million m3/yr.)
All species Valuable species All
species Valuable species
Central 5.64 34.8 196.42 52.05 0.68 0.41 Copperbelt 1.87 41.9 78.42 20.78 0.29 0.18 Eastern 2.64 28.7 75.60 20.03 0.35 0.21 Luapula 2.85 37.6 107.13 28.39 0.44 0.27 Lusaka 1.65 25.8 42.58 11.28 0.20 0.12 Muchinga 6.18 27.1 167.20 44.31 0.89 0.53 Northern 4.44 29.8 132.36 35.07 0.64 0.38 Northwestern 9.05 48.9 442.71 117.32 1.95 1 .17 Southern 2.86 24.0 68.80 18.23 0.38 0.23 Western 6.99 29.8 208.49 55.25 0.84 0.50 Zambia 44.17 34.4 15 19.71 402.72 6.66 4.00
Source: Shakacite et al. (2016) (unpublished). AAC= Annual Allowable Cut calculated in the current study
Table 3. Stocking density for the top five hardwood species in Zambia.
Species sph m3/ha Pterocarpus chrysothrix 0.274 0.760 Baikiaea plurijuga 0.651 1.259 Pterocarpus angolensis 1.429 6.635 Guibourtia coleosperma 1.344 1.480 Afzelia quanzensis 0.182 0.285
Source: Shakacite et al. (2016) (unpublished). Sph = stems per hectare

Natural resources and bioeconomy studies 80/2017
26
The stocking densities (sph) and volume for all the top five species show a sporadic distribution pattern. This has implications on the cost of logging due to long distances that are covered to fell and extract logs as well as the limitation on the dbh thresholds required by Law. Since most of the trees observed were below the 30cm required by law (Figure 2), it means that yield regulation and enforcement are paramount. It follows that a larger proportion of stocking densities of the top five were skewed to pole sizes (i.e. <30 cm dbh). Therefore, to achieve sustainability, it is recommended that grouping of hardwood species based on dbh distribution, similar technical properties should be pursued by Government along with forest certification as recommended earlier by Ratnasingam and Ng’andwe et al. (2012).
Conclusion 5.The relative abundance, stocking densities, and distribution varied across species. P. angolensis recorded the highest abundance among the top five hardwoods in Zambia. The most demanded P. chrysothrix hardwood was abundant in Luapula province while B. plurijuga in Western province. To sustainably manage hardwoods it is recommended that lesser-known valuable species be promoted along with commercially known species using forest certification tools to enhance their commercial importance and contribution to the national economy. The enforcement of regulations should also be strengthened.
References Azanzi, P., l. Putzel, D. Gumbo and M. Mupeta. 2014. Rural livelihoods and the Chinese timber trade in
Zambia's Western Province. International Forestry Review, 16, 447. Brinberg, D., M. Bumgardner, and K. Daniloski. 2007. Understanding perception of wood household
furniture:application of a policy capturing approach Fores products journal, 57. Chidumayo, E. N. 1996. Hand book of miombo ecology and management, . Stockholm, Sweden,
Stockholm Environmental Institute. Fanshawe, D. B. 1962. Fifty common trees of Northern Rhodesia, Lusaka, Zambia. 108 pp. Forestry Department 2010. Ministry of Tourism, Environment and Natural Resources, Project Plan.
Support to “Phase II of Integrated Land Use Assessment (ILUA) in the Republic of Zambia, Strengthening Forest Resources Management and Enhancing its Contribution to Sustainable Development, Land Use and Livelihoods", Lusaka, Zambia.
GRZ 2015. Government of the Republic of Zambia. Forest act No. 4 of 2015. Lusaka, Zambia: Government printers.
Hagglom and Partners 2016. Zambia forest opportunities for Finnish stakeholders, Ministry of Foreign Affairs. Finland. http://www.finland.org.zm/public/download.aspx?ID=164805&GUID={370E4536-0622-42F6-B67B-B08705325C7E} accessed February 2017.
Lemmens, R. H. M. J. 2008. Pterocarpus tinctorius Welw. In: Louppe, D., Oteng-Amoako, A. A. and Brink, M. (Editors). Prota 7(1): Timbers/Bois d’oeuvre 1. [CD-Rom]. PROTA, Wageningen, Netherlands.
MTENR 2008. Ministry of Tourism, Environment and Natural Resources Integrated Land Use Assessment Report 2005-2008, Forestry Department. Lusaka, Zambia.
Ng’andwe, P., J. Mwitwa and A. Muimba-Kankolongo. 2015. Forest policy, economics and markets in Zambia, United Kingdom, Elsevier, Academic Press.
Ngoma, J., J. Speer, R. Vinya, B. Kruijtd, E.Moorsd and R. Leemansb. 2017. The dendrochronological potential of Baikiaea plurijuga in Zambia. Dendrochronologia, 41 65–77.
Orwa, C., A. Mutua, R. Kindt, R. Jamnadas and A. Simons. 2009. Agroforestrey database: a tree reference and selection guide. Version 4.0. [Internet] World Agroforestry Centre (ICRAF), Nairobi, Kenya. http://www.worldagroforestry.org/ resources/databases/ agroforestree. February 2017.
Phiri, D., D. Zulu, C. Lwali and C. Imakando. 2015. Focusing on the Future of Pterocarpus chrysothrix (Mukula) in Zambia: A Brief Review of Its Ecology, Distribution and Current Threats. International Journal of Agriculture, Forestry and Fisheries, 3, 218-221.
Piearce, G. D. 1986. Properties and end-uses of Zambezi teak. In: Piearce, G.D.(Ed.), The Zambezi Teak Forests: Proceedings of the First InternationalConference on the Teak Forests of Southern Africa Livingstone Zambia.18–24th March 1984. Forest Department [etc.], Ndola, pp. 350–356.

Natural resources and bioeconomy studies 80/2017
27
R version 3.3.2 2016. The R Foundation for Statistical Computing Platform. Ratnasingam, J. and P. Ng'andwe. 2012. Forest industries opportunity study - synthesis report submitted
to the Forestry Department Integrated land use assessment II and the Food and Agriculture Organisation (FAO) of the United Nations (unpublished).
Ratnasingam, J., P. Ng'andwe, F. Ioras and I.V. Abrudan. 2014. Forestry and forest products industries in Zambia and the role of REDD+ initiatives. International Forestry Review, 16(4), 474.
Shakacite, O., D. Chungu, P. Ng’andwe, B. Chendauka, A. Siampale, R. Tavani, W. Roberts and L. Vesa. 2016. Integrated Land Use Assessment Phase II – Report for Zambia. The Food and Agriculture Organization of the United Nations and the Forestry Department, Ministry of Lands and Natural Resources, Lusaka, Zambia. Lusaka, Zambia (unpublished).
Storrs, A. E. G. 1979. Know your trees: some of the common trees found in Zambia. Forest Department, Ndola, Zambia.
Thulasidas, P.K., K. M. Bhat, K and T. Okuyama. 2006. Heartwood colour variation in home garden teak (tectona grandis) fromwet and dry localities of kerala, india. Journal of Tropical Forest Science, Vol. 18, No. 1 pp. 51-54
Vinya, R., Syampungani, S., Kasumu, E.C., Monde, C. and R. Kasubika. 2011. Preliminary Study on the Drivers of Deforestation and Potential for REDD+ in Zambia. A consultancy report prepared for Forestry Department and FAO under the national UN-REDD+ Programme Ministry of Lands & Natural Resources. Lusaka, Zambia.
UN. 2003. United Nations comtrade database. http://comtrade.un.org/. Accessed 7 February 2017

Natural resources and bioeconomy studies 80/2017
28
The climate-growth relationship of Baikiaea plurijuga in Zambia
Justine Ngoma1,2*, James H. Speer3, Royd Vinya1, Bart Kruijt4, Eddy Moors4,5 & Rik Leemans2,6
Abstract
The basic structure of a tree-ring is determined by genetic factors and the overall wood anatomical structure of tree species does not change. However, some variables of the wood structure can be modified by environmental factors. To understand the historical behaviour of individual tree species and have insight on the potential effects of climate change, tree-ring studies have been applied. In this study, we examined Baikiaea plurijuga (Spreng.) Harm, a hardwood species that dominates the Zambezi teak forests in Zambia with the objective of determining whether B. plurijuga forms annual rings and if so, whether these rings are cross-datable. We further determined the relationship between ring-width of B. plurijuga and climatic variables with the aim of understanding the potential climate change effects on the growth of these species in Zambia. We collected tree-ring samples from three Zambezi Teak forest reserves: Zambezi, Ila, and Masese, located in different climatic zones. Our examination of wood anatomical structures reviewed that the wood of B. plurijuga is diffuse porous and forms annual rings which were confirmed with samples of known age. The analysis resulted in three strong tree-ring chronologies of B. plurijuga. These chronologies were correlated with climate data from local weather stations which correlated negatively with evaporation and temperature and positively with rainfall. Our regression analysis indicated that evaporation has the highest influence on tree growth at all the study sites compared to temperature and rainfall alone. Evaporation in November and March, for example, explained almost a third of the radii’s variance at the Namwala and Sesheke sites. The likely future temperature increase and rainfall decrease that are projected by IPCC for Southern Africa are likely to adversely affect B. plurijuga in Zambia.
Introduction 1.Climate has been demonstrated to change at different scales for as far back as we have been able to reconstruct it, but anthropogenic factors have accelerated and are predicted to cause significant changes in temperature and precipitation around the globe. Temperature in Africa increased by 0.5°C during the last 50 to 100 years and minimum temperatures warmed more rapidly than maximum temperatures. Annual rainfall reduced over the past century over parts of the western, eastern Sahel region, eastern and southern Africa (Niang et al., 2014). In future, temperatures are projected to increase by 3 - 6°C by the end of the 21st century compared to 1986–2005 in Africa. However, rainfall
* Corresponding author: Tel.: +260 963 376306; E-mail: [email protected]
1School of Natural Resources
the Copperbelt University P.O. Box 21692, Kitwe,
Zambia
2 Water Systems and Global Change Group Wageningen University P.O. Box 47, 6700AA
Wageningen, The Netherlands
3Department of Earth and Environmental Systems, Indiana State University,
Terre Haute, Indiana, 47809 USA
4Wageningen Environmental Research,
P.O. Box 47, 6700AA Wageningen, The
Netherlands
5VU University Amsterdam, De Boelelaan 1085, 1081
HV Amsterdam, The Netherlands
6Environmental Systems Analysis Group,
Wageningen University, P.O Box 47, 6700AA
Wageningen, The Netherlands

Natural resources and bioeconomy studies 80/2017
29
has been projected to vary in different parts of the continent (Niang et al., 2014). Following these changes, ecosystems have also been affected differently in various parts of Africa. In Zambia, for example, climate change has different effects on ecosystems. Severe storms reduce flowering and fruiting potential, and irregular early season rainfall adversely affects germination and seedling survival of some trees in the Zambezi Teak Forests (Calvet, 1986). High temperatures plus low humidity contribute to a high fire hazard that results in severe damage in the late dry season (Calvet, 1986). The Baikiaea plurijuga (Spreng.) Harm, a dominant species in the Zambezi teak forests, has seedlings that are very sensitive to drought (Chisumpa, 1986). About 90% of seedlings that die during the first year after germination are due to drought stress because of competition for moisture with the understory shrubs (Chisumpa, 1986). B. plurijuga is a very important species in Zambia as it is a source of hardwood timber that supplies local, national, and international markets. It is also a very unique species as it is only found in southern Africa (Mubita, 1986). Thus, to understand the potential effects that climate change is likely to have on these species, it is important that a relationship is established between tree growth and climatic variables through tree-ring studies. Tree rings play a major role in determining the historical behaviour of individual tree species under natural micro-climatic conditions, and as such may provide insight into the potential impacts of climate change on B. plurijuga. This study therefore aimed at understanding whether B. plurijuga forms annual rings and if so, whether these rings are cross-datable. We further, analysed the possible relationship between ring-width of B. plurijuga and the main climatic variables: rainfall, temperature, and evaporation
Methodology 2.
Distribution, composition and description of B. Plurijuga 2.1.Baikiaea plurijuga is found in the Zambezi teak forests, and these forests are found on the Kalahari Sands of Angola, Botswana, Namibia, Zambia, and Zimbabwe (Chisumpa, 1986; Piearce, 1986a; Piearce, 1986b; Selander, 1986). In Zambia, the forests are mainly found in the western, southern, and north-western provinces (Chisumpa, 1986; Mbughi, 1986). The genus B. plurijuga is of the tribe Detarieae and falls in the sub-family caesalpinioideae of the family leguminosae; commonly known as the legume (Brummitt, 1986). This deciduous broad-leaved species grows up to 20 m high and 120 cm in diameter. To reach soil depths which are moist during the dry season, the taproot grows very deep and the rooting depth is estimated at 10 m (Högberg, 1984; Childes, 1988). The B. Plurijuga is the most dominant species in the Zambezi teak forests (Mbughi, 1986; Mulolwa, 1986; Piearce, 1986a; Ngoma et al., 2017) and Ngoma et al. (2017) found that about half of the surveyed trees in the Masese and Ila forest reserves were of B. Plurijuga species.
Study sites and climatic conditions 2.2.Zambia is divided into three agro-ecological zones defined by the amount of rainfall received annually (see I, II, and III in Figure 1). Zone I receives less than 800 mm of annual rainfall; Zone II between 800-1000 mm; and Zone III more than 1000 mm (Government of the Republic of Zambia and UNDP, 2009) (see Figure 1). Samples were taken from the Masese, Ila and Zambezi forest reserves. The Masese forest reserve is situated in the dry agro-ecological zone I, Ila is located at the border of agro-ecological zones I and II, and the reserve stretches in the two zones. However, the Zambezi forest reserve is located in the wet agro-ecological zone II (Figure 1A). While the drier Sesheke site receives about 643 mm of rainfall, Namwala receives 826 mm and the Kabompo site receives 1000 mm annually (Figure 1B). We averaged rainfall figures from various meteorological stations within 200 km radius, but within the same ecological zones as the respective study sites.

Natural resources and bioeconomy studies 80/2017
30
Sesheke rainfall figures came from Sesheke and Livingstone Meteorological stations, and we got Namwala values from Choma meteorological station. Kabompo rainfall figures came from Kabompo and Zambezi meteorological stations.
Sampling strategy 2.3.Samples were collected as described in Ngoma et al. (2017). We sampled young trees of 10 – 20 cm diameter because a preliminary analysis in all the three sites demonstrated that they had clearer ring boundaries compared to very old trees. Annual rings became less obvious in heartwood which increases as the tree ages. We also targeted trees of the same diameter range as those of known age for easy comparison. In addition to the diameter size, physical observations were made so as to get samples from trees that looked fresh and young. Thus, trees with fresh and smooth bark proved to be younger than those with rough bark. Working on the species for the first time and to avoid errors associated with omitting rings during analysis, we choose to work with samples that had clear ring boundaries, such as from relatively young trees caused by seasonal nature of rainfall pattern. We further worked with whole discs so as to increase dating accuracy. All samples were taken at stump height (30 cm above ground level), and in total, thirteen samples were analysed from Kabompo, twelve from Namwala, and eight from Sesheke. Two of these eight Sesheke samples had known planting dates.
Sample preparation and analysis 2.4.Samples for tree ring measurements were sanded with progressively finer sand paper as described in Ngoma et al. (2017). Samples were then examined under 6 – 60 times magnification using Leica (Leica Microsystems (Switzerland) Ltd, 2012) and Nikon microscope (Nikon Instruments Europe B.V, 2016) after skeleton plotting (Douglas, 1941; Speer, 2010). Crossing dating was done following the methods documented by Stahle (1999) to test for annual ring formation in B. plurijuga, and tested this with samples from known plantation sites and correlation to monthly and annual climate variables. The samples were then measured using a LinTab 6 measuring system (Rinn, 2013) with TSAP software (version 4.68e) from Rinntech (Rinn, 2013) to 0.01 mm precision. We checked the dating quality with the computer program COFECHA (Version 6.06P), (Holmes, 1983; Grissino-Mayer, 2001). The software ARSTAN (Version 44h3) (LDEO, 2016) was used to standardize the series with a 20-year cubic smoothing spline (about half the length of our average chronology) (Ngoma et al., 2017).
From the selected discs used for tree ring analysis, we cut wood blocks of 10 mm cubes with transverse, tangential and radial sides for anatomical examination. We further prepared samples following the method outlined by Jansen et al. (1998). We used both safranin and iodine indicators in sample preparation. Wood properties were examined following Wheeler et al. (1989).

Natural resources and bioeconomy studies 80/2017
31
Figure 1. (A) Ecological zones and distribution of study sites. (B) Total monthly rainfall received and the mean monthly temperature experienced at each site. The rainfall and temperature figures are for the period 1973-1989 (Kabompo), 1970-2011 (Namwala), and 1958-2011 (Sesheke). Source of agro-ecological zones map: Wamunyima, 2014 personal communication. Red dots show study sites.
Results 3.
Wood structure of Baikiaea plurijuga 3.1.Growth-ring boundaries were distinct though samples taken from wetter Kabompo site had more distinct and wide rings followed by samples from Namwala and then the drier Sesheke site. The wood is diffuse porous with a reduced number of large vessels in the late wood compared to the early wood.
Rainfall distribution (mm)
I - Less than 700
II - 800-1000
III - More than 1000
Rainfall distribution (mm)
I - Less than 700
II - 800-1000
III - More than 1000

Natural resources and bioeconomy studies 80/2017
32
Table 1. Wood anatomical features of B. plurijuga. We described wood anatomical features following the guide by Wheeler et al. (1989).The reader is strongly referred to this guide for detailed explanation of the features. A tick (√) denotes that a feature applies to B. plurijuga samples used in this study.
Wood anatomical
Feature
Feature numbers
(Wheeler et al., 1989)
Results Summary
Growth ring boundaries
1 and 2
Kabompo: Growth rings were very distinct 92 % of sampled trees had distinct growth ring boundaries
Namwala: Some trees had very distinct growth rings while other trees had indistinct growth rings.
83% of samples taken had distinct growth ring boundaries
Sesheke: Some trees showed very distinct growth rings while other trees had indistinct growth rings. Of the samples taken, 63% had distinct growth ring
boundaries
Figure 2. Distinct and indistinct growth ring boundaries. Figure 2A shows a disc with distinct growth ring boundaries while figure 2B depicts a disc with indistinct growth ring boundaries.
Growth rings are generally characterised by a distinct fibre zone with
no large (or very few) vessels in latewood, and
an abrupt boundary between early-wood and latewood. The number of
trees with indistinct growth rings was high in
Sesheke followed by Namwala and then
Kabompo.
Wood porosity and distribution of parenchyma cells in early-
wood and latewood
5
Figure 3. Wood diffuse porous. Figure 3A gives the direction of tree growth rings while figure 3B shows
anatomical features in early-
wood and latewood. Latewood is shown by a red arrow. The yellow box shows the position where the sample was taken for microscopic examination. Figure 3A was taken using lens 004
In all study sites, vessels (in white colour) had
more or less the same diameter in early-wood and latewood, but the
number of bigger vessels reduced (sometimes
none) in latewood (also called Autumn wood)
compared to early-wood (also called Spring wood).
The frequency of parenchyma bands (in black colour) within a growth ring decreased towards the latewood.
Vessel arrangement
7
Figure 4. Vessels in radial pattern. Lens: 004
Vessels (in white colour) were in radial pattern.This
applied to all study sites

Natural resources and bioeconomy studies 80/2017
33
Vessel groupings
Figure 5. Vessel groupings (in while colour). Figure 5A shows vessel grouping in early wood (lens 004) and figure 5B depicts vessel grouping in latewood (lens: 010)
Vessel grouping is mixed. Some vessels were partly solitary while others were partly in radial multiples.
In early-wood, vessels were often solitary
(approximately 60% or more), but with
approximately equal numbers of solitary
vessels and vessel groups of two to four in late-
wood Solitary vessel outline angular
(12) 12
Figure 6. Solitary vessel outline (white colour). Lens: x10
Vessels were mainly angular though circular
vessels were also present.
Paratracheal Axial
parenchyma
80, 81 and 82
Figure 7. Paratracheal Axial parenchyma ( in black colour)
Wood was characterised by axial parenchyma
aliform in all study sites. In Kabompo (A), the
parenchyma cells were winged aliform while in
Namwala (B) and Sesheke (C), they were lozeng
aliform.
Distribution of paratracheal
axial parenchyma
cells and vessels in heartwood and sapwood
Figure 8. Distribution of axial parenchyma cells and vessels in heartwood and sapwood. Heart wood is shown by orange colour while sapwood by yellow colour
The frequency of Paratracheal Axial parenchyma bands
reduced in the heartwood compared with the
sapwood. However, vessel distribution was similar in
both heartwood and sapwood
Non-anatomical information 178 Tropical mainland Africa and adjacent islands
(Brazier and Franklin region 78)
179 Tropical Africa 189 Tree 192 Wood of commercial importance 195 Basic specific gravity ≥0.75 196 Heart wood colour darker than sapwood colour 197 Heart wood basically brown or shades of brown 198 Heartwood basically red or shades of red
196,197, and 198
Figure 9. Colour of heartwood and sapwood. Figure 13A shows colour of heartwood while figure B depicts colour of sapwood. In very old trees, the heartwood is even darker than
what is depicted in the picture

Natural resources and bioeconomy studies 80/2017
34
Growth ring formation in Baikiaea plurijuga 3.2.We confirmed the annual nature of growth rings through cross-dating within the respective study sites (Figure 10), though cross-dating among sites was a challenge. We further tested the annual formation of rings with samples of known age taken from Sesheke site and found that the age successfully correlated with the number of rings. The chronologies developed at each site were further correlated with monthly and annual climate variables to provide further evidence of the annual nature of growth rings (Figure 11). We found that the chronologies at each site successfully correlated with temperature and rainfall, confirming that the rings formed in B. plurijuga are indeed annual. The more distinct and wider Kabompo samples were easier to date than samples taken from the drier Sesheke site. We were able to date 92% (12 samples) of the samples from Kabompo, 83% (10 samples) from Namwala, and 63% (5 samples) from Sesheke sites (Table 2)
Table 2. Descriptive statistics of the B. plurijuga chronologies at Kabompo, Namwala, and Sesheke sites
Descriptive statistics Kabompo Namwala Sesheke
Number of samples attempted to analyse 13 12 8*
Number of samples successfully dated 12 10 51
Number of samples included in the master chronology 9 8 51
Number of radii 11 10 8a
Time span of the chronology 1973 - 2013 1958 - 2013 1958 - 2013 Age of trees included in chronology (years) 32 - 44 17 - 56 28 - 56 Series inter-correlation (Correlation between trees) 0.603 0.604 0.449 Mean sensitivity (change in ring-width from one year to the next)
0.329 0.484 0.527
Average ring width (mm) (raw data before standardization)
2.473 2.473 1.605
*This included 2 samples from trees of known age

Natural resources and bioeconomy studies 80/2017
35
Figure 10. The tree-ring chronologies of B. Plurijuga at Kabompo, Namwala, and Sesheke sites. Y-axis gives ring width after standardization (indices). Black curves are for individual samples and a red curve is a mean curve for all the samples analysed at each site.
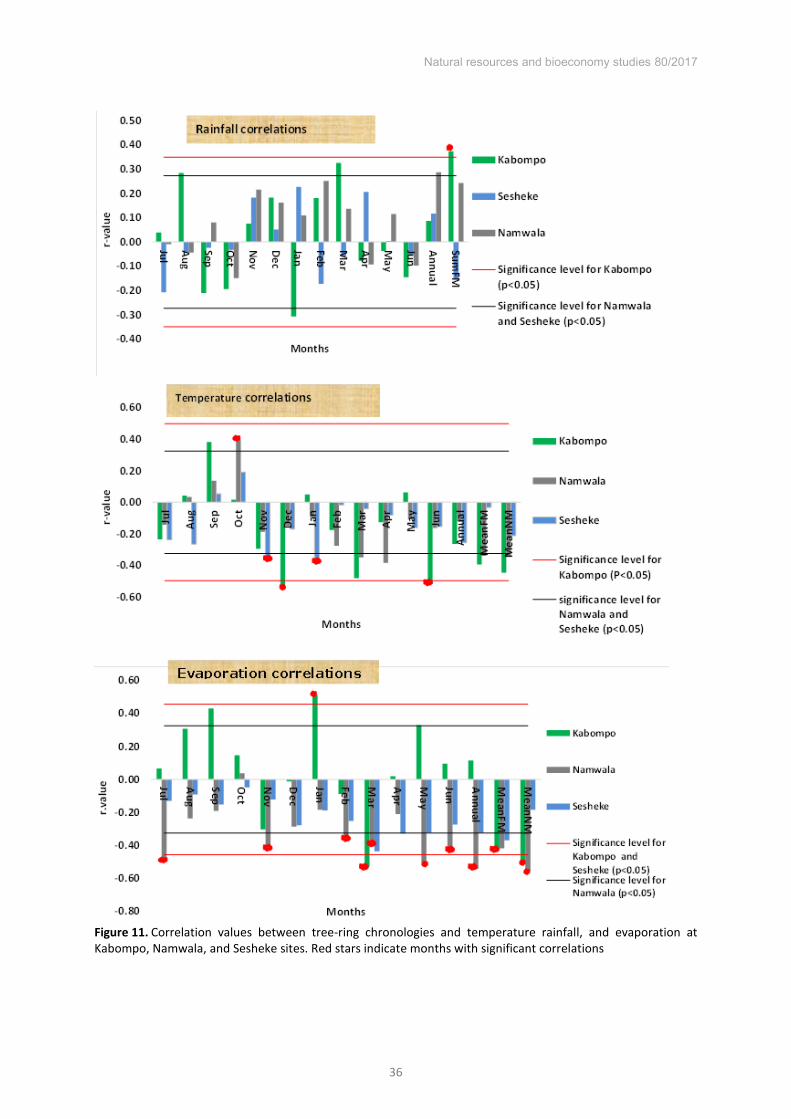
Natural resources and bioeconomy studies 80/2017
36
Figure 11. Correlation values between tree-ring chronologies and temperature rainfall, and evaporation at Kabompo, Namwala, and Sesheke sites. Red stars indicate months with significant correlations

Natural resources and bioeconomy studies 80/2017
37
Discussion 4.Tree phenology is one factor controlling wood formation (Kozlowski, 1971) and with high seasonality in rainfall, trees are likely to form clear growth boundaries (Jacoby, 1989). Zambia experiences one dry season. Rains start in late October and end in April and the phenology of B. plurijuga follows the same pattern. Leaf senescence and fall of B. plurijuga, coincides with decreasing moisture levels in the soil, and leaf flush starts in October (following the rains) (Childes, 1988). This seasonality induces cambial dormancy of trees.
In general, we found that the wood had clearer ring structure, and rings were wider in wetter Kabompo than in drier Sesheke sites. This is probably because Kabompo receive more rain that the rings were larger and easier to differentiate. Ring structure was clearer in the sapwood compared to heartwood. The unclear ring structure in the heartwood could be associated with the decreased frequency of parenchyma cells though vessel distribution is the same in both heartwood and sapwood.
Higher mean sensitivity values (change in ring-width from one year to the next) indicate the ease of dating the trees at a study site, but up-to a certain limit. Complacent trees (mean sensitivity around 0.1) are difficult to date because of the low degree of their annual variation. More sensitive trees (mean sensitivity of more than 0.4) are also hard to date due to frequent micro rings next to very wide rings (Speer, 2010) that result from high year-to-year variability of limiting growth factors (e.g. rainfall and temperature). This behaviour was observed during this research where the drier Sesheke site with higher mean sensitivity (0.527) was quiet difficult to date compared to the wet Kabompo site which has lower mean sensitivity value (0.329) ( see tables 2). Thus, the high mean sensitivity in Sesheke indicates high annual variations of environmental growth factors.
The negative correlation between tree ring chronologies as all site could be as a result of reduced photosynthesis (reduced carbon assimilation) due to increased temperature (Clark, 2004; Galbraith et al., 2010). The positive relationship recorded in October (i.e. the beginning of the rain season, see Figure 1B) could be as a result of rapid tree growth immediately after bud burst.
In general, the relationship between tree growth and rainfall was positive during the rainy season indicating that growth is limited by the amount of rainfall. The significant positive influence of the sum of February and March rainfall on tree growth at the Kabompo site indicate that the response is high when there is increased amount of water in the soil. The ring chronologies correlated negatively with evaporation at all sites. This is because in drier areas there is less rainfall available to satisfy the evapotranspiration demand.
Conclusions 5.Our analysis clearly shows that relatively young trees of B. plurijuga form annual rings and that these rings are cross-datable within a site. Tree growth is affected positively by rainfall, but temperature and evaporation have a negative influence. In the wetter areas studied, effects of rainfall, temperature, and evaporation are higher compared with the effects in the drier sites. Our analysis indicates that future temperature increase, which increases evaporation and reduced rainfall as projected by Niang et al. (2014) will adversely affect southern African young B. plurijuga.
Acknowledgements We would like to thank the HEART project of the NUFFIC-NICHE program, the Copperbelt University, International foundation for Science and the Schlumberger Foundation Faculty for the Future, for providing financial support. The guideline and template has been kindly provided for use by the International Scientific Conference on Hardwood Processing (ISCHP2017).

Natural resources and bioeconomy studies 80/2017
38
References Brummitt RK. 1986. A taxonomic perspective of the Genus Baikiaea. In: Piearce GD, editor. The
Zambezi teak forests: proceedings of the first international conference on the teak forests of Southern Africa, Livingstone, Zambia, 18 - 24th March 1984. Ndola: Forest Department [etc.]. p 61-73.
Calvet GM. 1986. The ecology and management of the Kalahari Sand Forest vegetation of South-Western Zimbabwe. In: Piearce GD, editor. The Zambezi teak forests: proceedings of the first international conference on the teak forests of Southern Africa, Livingstone, Zambia, 18 - 24th March 1984. Ndola: Forest Department [etc.],.
Childes SL. 1988. Phenology of Nine Common Woody Species in Semi-Arid, Deciduous Kalahari Sand Vegetation. Vegetatio 79(3):151-163.
Chisumpa SM. 1986. Mukusi Ecological Associations and Environmental Effects. In: Piearce GD, editor. The Zambezi teak forests: proceedings of the first international conference on the teak forests of Southern Africa, Livingstone, Zambia, 18 - 24th March 1984. Ndola: Forest Department [etc.]. p 102-109.
Clark DA. 2004. Sources or Sinks? The Responses of Tropical Forests to Current and Future Climate and Atmospheric Composition. Philosophical Transactions: Biological Sciences 359(1443):477-491.
Douglas AE. 1941. Crossdating in Dendrochronology. . Laboratory of Tree-Ring Research, University of Arizona.
Galbraith D, Levy PE, Sitch S, Huntingford C, Cox P, Williams M, Meir P. 2010. Multiple mechanisms of Amazonian forest biomass losses in three dynamic global vegetation models under climate change. New Phytologist 187(3):647-665.
Government of the Republic of Zambia, UNDP. 2009. Adaptation to the effects of drought and climate change in Agro-ecological Regions I and II in Zambia. Project document. Ministry of Agriculture and Cooperatives. Accepted by: Ministry of finance and National Planning, and UNDP.
Grissino-Mayer HD. 2001. Evaluating Crossdating Accuracy: A Manual and Tutorial for the Computer Program COFECHA. Tree-Ring Research 57(2):205-221.
Högberg P. 1984. Rooting habit and mycorrhizas of Baikiaea plurijuga. In: Piearce GD, editor. The Zambezi teak forests: proceedings of the first international conference on the teak forests of Southern Africa, Livingstone, Zambia, 18 - 24th March 1984. Ndola: Forest Department [etc.]. p 92-101.
Holmes RL. 1983. Computer-Assisted Quality Control in Tree-Ring Dating and Measurement. Tree-Ring Bulletin 1983(43):51-67.
Jacoby G. 1989. Over view of tree-ring analysis in tropical regions. In: In: Sass, Ute., Killmann, Wulf., and Eckstein, Dieter (1995). Wood formation in two species of dipterocarpaceae in peninsular Malaysia. . IAWA Journal, Vol 16 (4), 1995: 37 1-384.
Jansen S, Kitin P, De Pauw H, Idris M, Beeckman H, Smets E. 1998. Preparation of wood specimens for transmitted light microscopy and scanning electron microscopy. Belgian Journal of Botany 131(1):41-49.
Kozlowski TT. 1971. Growth and development of trees. Vol. II. Academic Press. New York, Lond on. In: Sass Ute., Killmann Wulf., and Eckstein Dieter. Wood formation in two species of dipterocarpaceae in peninsular Malaysia. IAWA Journal, Vol. 16 (4), 1995: 37 1-384.
LDEO. 2016. Lamont Doherty-Earth Observatory, Columbia University, Earth Institute, ARSTAN program. http://www.ldeo.columbia.edu/tree-ring-laboratory/resources/software. Downloaded 2/03/2016.
Leica Microsystems (Switzerland) Ltd. 2012. Leica M50. CH-9435 Heerbrugg. Mbughi RJ. 1986. The Habitat and Regeneration of Zambezi teak in Zambia. In: Piearce GD, editor. The
Zambezi teak forests: Proceedings of the first international conference on the teak forests of Southern Africa, Livingstone, Zambia, 18 - 24th March 1984. Ndola: Forest Department [etc.]. p 455-461.
Mubita AC. 1986. Prospects for genetic improvement of Zambian teak forests timber trees. In: Piearce GD, editor. The Zambezi teak forests: proceedings of the first international conference on the teak forests of Southern Africa, Livingstone, Zambia, 18 - 24th March 1984. Ndola: Forest Department [etc.]. p 210-226.
Mulolwa JM. 1986. Forestry in Zambia’s Western province. In: Piearce GD, editor. The Zambezi teak forests: Proceedings of the first international conference on the teak forests of Southern Africa, Livingstone, Zambia, 18 - 24th March 1984. Ndola: Forest Department [etc.]. p 431-435.
Ngoma J, Speer JH, Vinya R, Kruijt B, Moors E, Leemans R. 2017. The dendrochronological potential of Baikiaea plurijuga in Zambia. Dendrochronologia 41:65-77.

Natural resources and bioeconomy studies 80/2017
39
Niang I, O.C. Ruppel,, M.A. Abdrabo AE, C. Lennard, , J. Padgham aPU. 2014. Africa. In: Climate Change 2014: Impacts, Adaptation, and Vulnerability. Part B: Regional Aspects. Contribution of Working Group II to the Fifth Assessment Report of the Intergovernmental Panel on Climate Change [Barros, V.R., C.B. Field, D.J. Dokken, M.D. Mastrandrea, K.J. Mach, T.E. Bilir, M. Chatterjee, K.L. Ebi, Y.O. Estrada, R.C. Genova, B. Girma, E.S. Kissel, A.N. Levy, S. MacCracken, P.R. Mastrandrea, and L.L. White (eds.)]. Cambridge University Press, Cambridge, United Kingdom and New York, NY, USA, pp. 1199-1265.
Nikon Instruments Europe B.V. 2016. SMZ645 (discontinued). https://www.nikoninstruments.com/Products/Stereomicroscopes-and-Macroscopes/Stereomicroscopes/SMZ660.
Piearce GD. 1986a. How to save the Zambezi teak forests. In: FAO (1986). Unasylva - No. 152 - Genetics and the forests of the future. An international journal of the forestry and food industries. FAO - Food and Agriculture Organization of the United Nations. SPECIAL FAO's Forestry Action Plan An international journal of the forestry and food industries 38pp
Piearce GD. 1986b. Properties and end-uses of Zambezi teak. In: Piearce GD, editor. The Zambezi teak forests: proceedings of the first international conference on the teak forests of Southern Africa, Livingstone, Zambia, 18 - 24th March 1984. Ndola: Forest Department [etc.]. p 350-356.
Rinn F, Heidelberg. 2013. TSAP-Win User Reference. Time Series Analysis and Presentation for Dendrochronology and Related Applications. Version 4.6x for Microsoft windows. Heidelberg - Germany.
Selander J, and Malaya, F.M. 1986. Protection of Young Zambezi Teak plantations against weeds and Game Damage. In: Piearce GD, editor. The Zambezi teak forests: Proceedings of the first international conference on the teak forests of Southern Africa, Livingstone, Zambia, 18 - 24th March 1984. Ndola: Forest Department [etc.]. p 271-286.
Speer JH. 2010. Fundamentals of tree-ring research University of Arizona Press Stahle DW. 1999. Useful strategies for the development of tropical tree-ring chronologies. Journal of
International Association of Wood Anatomists (IAWA) 20(3):249-253. Wheeler EA, Baas Pa, Gasson PE. 1989. IAWA List of Microscopic Features for Hardwood Identification
with an appendix on non-anatomical information. IAWA Bulletin n.s. 10(3): 219-332.

Natural resources and bioeconomy studies 80/2017
40
Density and selected mechanical properties of stemwood and branchwood of Brachystegia spiciformis
and Julbernadia globiflora Inayat Khan1, Narciso Bila1, Alberto Manhiça2, Ernesto
Uetimane Jr1*, Andrade Egas1, Veikko Möttönen3
Abstract
The highly selective nature of the logging operations is rapidly decreasing the value of most forested areas in Mozambique due to lack of knowledge on properties of the overlooked species. In this study, a comparative assessment between branchwood and stemwood density along with some mechanical properties of two very abundant species (Brachystegia spiciformis and Julbernadia globiflora) was carried out in order to explore potential uses of branchwood. For each species, a total of five undated heavily branched trees were harvested in their natural habitats. Afterwards, samples from the main stem (bottom and top) and branches were separately prepared based on ISO standards for testing density and mechanical tests at 12% moisture content such as static bending (MOE and MOR) and compression (parallel and perpendicular to axial fibres) properties. The results show that in general branchwood is denser compared to the wood of main stem. However, the pairwise comparison across the wood sections did not produce significant differences, suggesting uniformity, especially in terms of density. The same trend was also observed for the mechanical properties, with the exception of branchwood MOE of Julbernadia globiflora to which significant difference was reported against either stemwood section. The global assessment of the results suggests a safe and interchangeable use of branchwood to supplement raw material for purposes commonly known for the stemwood. Therefore, the use of heavily branched trees is expected to increase sawing yield as well as halting deforestation rate.
Introduction 1.The demand of wood in Mozambique has increased considerably over the last two decades (Egas et al. 2013). The remaining standing volume of known species has decreased to such an extent that the interest on the overlooked species is rising in the context of sustainable harvesting quotas of native hardwoods. The evidence is supported by the growing number of studies on lesser known timbers (Uetimane Jr 2010, Ali 2011, Lhate 2011, Cristovão 2013, and Ah Shenga 2016). Better sawing strategies along with knowledge of technical properties are vital for the optimal and integral use of especially the lesser known native hardwood species.
Recently, logging companies have increasingly been interested in the use of branchwood, especially for heavily branched species such as Julbernadia globiflora and Brachystegia spiciformis. However, knowledge of branchwood properties is scarce since the stem wood remains the most used and studied wood section of the harvested trees. The common end use of branchwood includes firewood and particles for wood based panels (Gurau et al. 2008). In the recent past, due to the
* Corresponding author: Tel.: +258824153390; E-mail: [email protected]
1Faculty of Agronomy and Forest Engineering
Eduardo Mondlane University
Maputo, 257, Mozambique
2Agrarian National Research Institute
Ministry of Agriculture Maputo, 3658, Mozambique
3Bio-based Business and Industry
Natural Resources Institute Finland
Yliopistokatu 6 80100 Joensuu, Finland

Natural resources and bioeconomy studies 80/2017
41
abundance of premium class timbers, both species were neglected and therefore employed after chemical treatment almost alone as heavy beams of railway sleepers.
The most common forest type in southern Africa including Mozambique, miombo (derived from Swahili), is named after trees of both genera, namely Brachystegia and Julbernadia (Mwakalukwa et al. 2014). The use of branchwood is expected to supplement the poor yields of the country sawmills. Rather than firewood and charcoal production, the use of branchwood is expected to provide additional raw material from increasingly reduced number of trees. Similar efforts related to assessment and suitability of branchwoods for end uses traditionally assigned to stemwood is underway in other tropical African countries, especially in Ghana (Okai et al. 2003, Okai et al. 2004). Thus, the objective of this study was to comparatively examine the variation of density and selected mechanical properties of branchwood versus stemwood of two most abundant and heavily branched tree species, namely B. spiciformis and Julbernadia globiflora.
Materials and methods 2.The wood samples were obtained from three specific positions along the tree height, namely at breast height from bottom stemwood, top stemwood (upper stem before crown), and branchwood from primary branches (Figure 1). In total, 5 mature and undated trees of each studied species, namely Brachstegia spiciformis Benth and Julbernadia globiflora Benth were felled from natural habitat of wet miombo woodland, central inland region of Cheringoma district, and Sofala province in Mozambique. After felling, the sample preparation and handling were carried out according to methods and general requirements for physical and mechanical tests as recommended by International Organization for Standardization (ISO 3129: 1975).
Figure 1. Sampling scheme.
The stem wood samples (bottom and top) consisted of clear and straight grain heartwood while some branchwood samples were mostly composed of heartwood and occasionally strips of sapwood. In terms of tree size, the diameter of Brachystegia spiciformis ranged in stem sections between 49-63 cm and in branches between 34-41 cm. The diameter of Julbernadia globiflora in stem sections varied between 41-64 cm and in branchwood between 33-38 cm. Juvenile and mature wood were not distinguished during sampling. All samples regardless of wood section were conditioned to 12% moisture content (MC) prior to testing of physical and mechanical properties. The mechanical properties were tested using universal material testing machine (Testometric M-500-50AT).
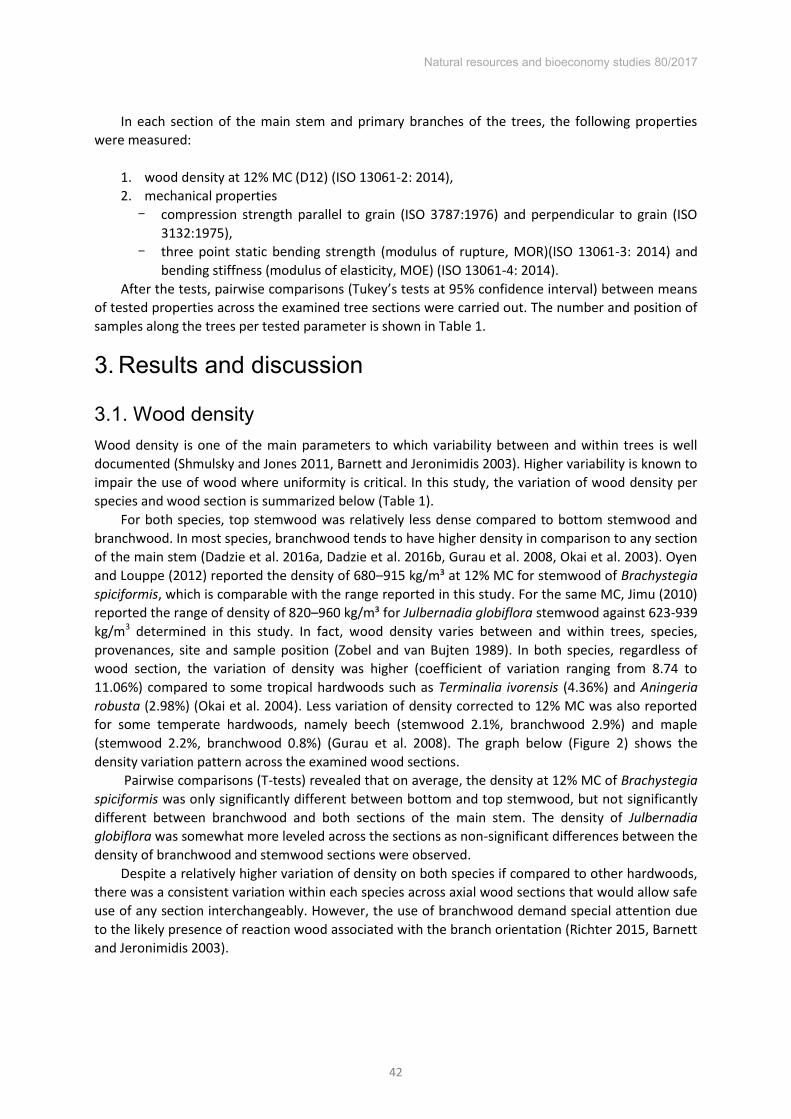
Natural resources and bioeconomy studies 80/2017
42
In each section of the main stem and primary branches of the trees, the following properties were measured:
1. wood density at 12% MC (D12) (ISO 13061-2: 2014), 2. mechanical properties - compression strength parallel to grain (ISO 3787:1976) and perpendicular to grain (ISO
3132:1975), - three point static bending strength (modulus of rupture, MOR)(ISO 13061-3: 2014) and
bending stiffness (modulus of elasticity, MOE) (ISO 13061-4: 2014). After the tests, pairwise comparisons (Tukey’s tests at 95% confidence interval) between means
of tested properties across the examined tree sections were carried out. The number and position of samples along the trees per tested parameter is shown in Table 1.
Results and discussion 3.
Wood density 3.1.Wood density is one of the main parameters to which variability between and within trees is well documented (Shmulsky and Jones 2011, Barnett and Jeronimidis 2003). Higher variability is known to impair the use of wood where uniformity is critical. In this study, the variation of wood density per species and wood section is summarized below (Table 1).
For both species, top stemwood was relatively less dense compared to bottom stemwood and branchwood. In most species, branchwood tends to have higher density in comparison to any section of the main stem (Dadzie et al. 2016a, Dadzie et al. 2016b, Gurau et al. 2008, Okai et al. 2003). Oyen and Louppe (2012) reported the density of 680–915 kg/m³ at 12% MC for stemwood of Brachystegia
spiciformis, which is comparable with the range reported in this study. For the same MC, Jimu (2010) reported the range of density of 820–960 kg/m³ for Julbernadia globiflora stemwood against 623-939 kg/m3 determined in this study. In fact, wood density varies between and within trees, species, provenances, site and sample position (Zobel and van Bujten 1989). In both species, regardless of wood section, the variation of density was higher (coefficient of variation ranging from 8.74 to 11.06%) compared to some tropical hardwoods such as Terminalia ivorensis (4.36%) and Aningeria
robusta (2.98%) (Okai et al. 2004). Less variation of density corrected to 12% MC was also reported for some temperate hardwoods, namely beech (stemwood 2.1%, branchwood 2.9%) and maple (stemwood 2.2%, branchwood 0.8%) (Gurau et al. 2008). The graph below (Figure 2) shows the density variation pattern across the examined wood sections.
Pairwise comparisons (T-tests) revealed that on average, the density at 12% MC of Brachystegia
spiciformis was only significantly different between bottom and top stemwood, but not significantly different between branchwood and both sections of the main stem. The density of Julbernadia
globiflora was somewhat more leveled across the sections as non-significant differences between the density of branchwood and stemwood sections were observed.
Despite a relatively higher variation of density on both species if compared to other hardwoods, there was a consistent variation within each species across axial wood sections that would allow safe use of any section interchangeably. However, the use of branchwood demand special attention due to the likely presence of reaction wood associated with the branch orientation (Richter 2015, Barnett and Jeronimidis 2003).

Natural resources and bioeconomy studies 80/2017
43
Table 1. Number and sample position of every tested property
Brachystegia spiciformis Julbernadia globiflora Wood section
Property Bottom
stemwood Top
stemwood Branchw
ood Bottom
stemwood Top
stemwood Branchw
ood Density at 12% MC 36 32 35 47 40 35
MOE 39 26 48 47 54 50 MOR 39 26 48 47 54 50
Compression parallel to grain 33 32 46 39 26 32
Compression perpendicular to grain 20 19 19 33 26 31
Table 2. Variation of wood density at 12% moisture content
Figure 2. Comparative axial variation of wood density at 12% MC of Brachystegia spiciformis and Julbernadia globiflora
Species Brachystegia spiciformis Julbernadia globiflora
Wood section Bottom stemwood
Top stemwood
Branchwood
Bottom stemwood
Top stemwood
Branchwood
Range (kg/m3) 596-915 580-885 583-946 623-933 648-939 550-927 Average (kg/m3) 768 710 737 818 790 809 CV (%) 10.24 10.89 11.06 8.74 9.95 9.20
CV = coefficient of variation

Natural resources and bioeconomy studies 80/2017
44
Static bending stiffness (MOE) and strength (MOR) 3.2.The Table 3 summarizes the bending stiffness and strength variation across sections per wood species. The MOE range of Brachystegia spiciformis obtained in this study is comparable with the range of 11100–14400 N/mm² reported by Oyen & Louppe (2012), especially for the bottom stemwood. In terms of MOR, the range reported by Oyen and Louppe (2012) (88–125 N/mm²) falls in the range of any stemwood section of Brachystegia spiciformis.
Table 3. Average bending stiffness (MOE) and strength (MOR) of Brachystegia spiciformis and Julbernadia globiflora.
Species Brachystegia spiciformis Wood section Bottom stemwood Top stemwood Branchwood
Property (N/mm2) MOE MOR MOE MOR MOE MOR
Min 11896 59 10581 43 9628 51 Average 20591.47 95.34 18369.77 84.69 19427.71 96.85
Max 29260 134 28409 129 27470 125 CV (%) 20.99 22.21 23.33 26.17 17.90 18.53
Species Julbernadia globiflora
Wood section Bottom stemwood Top stemwood Branchwood Property (N/mm2) MOE MOR MOE MOR MOE MOR
Min 10856 37 10467 41 15227 66 Average 20427.37 99.76 20572.15 99.59 22384.95 106.03
Max 27832 143 27736 147 29220 158 CV (%) 17.08 22.07 19.39 23.46 14.67 18.02
CV = coefficient of variation
The stiffness of Julbernadia globiflora stemwood (bottom and top) was characterized by a MOE range of 10467-27832 N/mm2. Oyen and Louppe (2012) reported a MOE range of 12400-15600 N/mm2 which also falls again inside the interval reported in this study. The same trend was observed in MOR values where the results of this study presents a stemwood MOR range of 37-147 N/mm2 against 97–147 N/mm2 presented by Oyen and Louppe (2012). In general, the bending stiffness and strength showed larger variation within and across the wood sections in comparison with density as expressed by the coefficient of variation which can be seen from the graphics bellow (Figure 3).
Figure 3. Comparative bending strength and modulus of elasticity across axial wood sections per species

Natural resources and bioeconomy studies 80/2017
45
The results from pairwise comparisons show that the average MOE of branchwood of Julbernadia globiflora was significantly different from that of either stemwood section. There was no significant difference between the average stemwood MOE sections (bottom and top). In terms of MOR, there was also no significant difference across wood sections of Julbernadia globiflora. The average MOE of all wood sections of Brachystegia spiciformis were not significantly different. With regard to MOR, the only significant difference between the means was the branchwood against the top stemwood.
Compression strength 3.3.The average variation of compressive strength (parallel and perpendicular to grain) across all examined wood sections per species is compiled in the Table 4.
Table 4. Variation of compression strength across wood sections of B. spiciformis and J. globiflora
Compression strength parallel to grain
Species Brachystegia spiciformis Julbernadia globiflora
Wood section
Bottom stemwood
Top stemwood Branchwood Bottom
stemwood Top
stemwood Branchwood
Range (N/mm2) 31-63 33-58 36-59 26-66 34-59 38-66
Average (N/mm2) 45.23 43.88 47.05 50.41 47.44 50.95
CV (%) 18.56 12.27 14.15 18.17 15.03 15.27
Compression strength perpendicular to grain
Species Brachystegia spiciformis Julbernadia globiflora
Wood section
Bottom stemwood
Top stemwood Branchwood Bottom
stemwood Top
stemwood Branchwood
Range (N/mm2) 5-17 6-11 6-11 7-12 6-17 6-11
Average (N/mm2) 8.53 8.45 8.49 9.03 8.92 8.6
CV (%) 29.57 17.86 15.62 12.02 24.18 13.94
CV = coefficient of variation
The results from the Table 4 show that on average the compressive strength parallel to grain was leveled, but slightly higher in branchwood of both wood species. The top stemwood sections recorded the lowest strength. In both studied species, the observed compression strength parallel to grain of stemwood sections (26-66 N/mm2) were relatively out of the interval of 60-69 N/mm2 reported by Oyen and Louppe (2012). Pairwise comparisons of average compression strength perpendicular to grain were not significant across all wood sections (bottom stemwood, top stemwood and branchwood) of the tested species.
Conclusions 4.This study was aimed at determining and assessing variation of density and selected mechanical properties of stemwood and branchwood of two abundant, but relatively lesser known and underused native hardwood species from Mozambique. Based on the results, it can be concluded that all measured physical and mechanical properties of branchwood are comparable with those of

Natural resources and bioeconomy studies 80/2017
46
any stemwood section. In general, the average density across wood sections is less variable than the mechanical properties. The wood density of upper part of the main stem is relatively lower compared to that of both branches and bottom stemwood in both studied species. Despite apparent uniformity of density, the mechanical properties appeared to be more variable across wood sections in both species showing the highest variability in compressive strength. An integral assessment of the results suggest that branchwood of both species can be used satisfactorily in similar applications often assigned to stemwood.
Acknowledgements The study was carried out in the framework of a project FORECAS (2012-2015) financed by the Ministry for Foreign Affairs of Finland to which financial support is gratefully acknowledged.
References Ali, A. C. 2011. Physical-mechanical properties and natural durability of lesser used wood species from
Mozambique. Doctoral thesis. Uppsala: Sveriges lantbruksuniversitet. Acta Universitatis agriculturae Sueciae, 1652-6880: 2011:32
Ah Shenga, P. 2016. Sawing strategies for tropical hardwood species: Simulation studies based on industrial conditions of Mozambique. Doctoral thesis. Lulea University of Technology in Skellefteå
Barnett, J.R and G. Jeronimidis (Eds). 2003. Wood Quality and its Biological Basis. Blackwell Publishing Ltd. Oxford. 226 p.
Cristovão, L. 2013. Machining Properties of Wood: Tool Wear, Cutting Force and Tensioning of Blades. Doctoral thesis. Lulea University of Technology in Skellefteå.44 pp.
Dadzie, P. K., M. Amoahb, K. Frimpong-Mensahc and P. B. Inkuma. 2016. Variation in bending strength properties in stem and branch woods as influenced by density and moisture levels in Entandrophragma cylindricum Australian Forestry 79 (4):233–240.
Dadzie, P.K., M Amoah., K. Frimpong-Mensah and F. Oheneba-Kwarteng. 2016. Some physical, mechanical and anatomical characteristics of stemwood and branchwood of two hardwood species used for structural applications. Materials and Structure 49 (12): 4947–4958.
Egas, A.F., E.J. Uetimane., J. Nhamire and E.C. Sitoe. 2013. Assessment of harvested volume and illegal logging in Mozambique natural forest. FAEF-UEM. Maputo. Mozambique
Gurau, L., H.M-Williams, G. Sawyer, O. Zelenuic. 2008. Comparison of the mechanical properties of branch and stem wood for three species. Wood and Fiber Science, 40 (4): 647–656
ISO 3129:1975. Wood Sampling Methods and General Requirements for Physical and Mechanical Tests. International Standards Organisation, Geneva.
ISO 3787:1976. Wood-Test methods -- Determination of ultimate stress in compression parallel to grain. International Standards Organisation, Geneva.
ISO 3132:1975.Wood-Testing in compression perpendicular to grain. International Standards Organisation, Geneva.
ISO 136061-2:2014. Physical and mechanical properties of wood -- Test methods for small clear wood specimens -- Part 2: Determination of density for physical and mechanical tests. International Standards Organisation, Geneva.
ISO 136061-3:2014. Physical and mechanical properties of wood -- Test methods for small clear wood specimens -- Part 3: Determination of ultimate strength in static bending. International Standards Organisation, Geneva.
ISO 136061-4:2014. Physical and mechanical properties of wood -- Test methods for small clear wood specimens -- Part 4: Determination of modulus of elasticity in static bending. International Standards Organisation, Geneva.
Jimu, L., 2010. Julbernardia globiflora (Benth.) Troupin. In: Brink, M. & Achigan-Dako, E.G. (Editors). Prota 16: Fibres/Plantes à fibres. [CD-Rom]. PROTA, Wageningen, Netherlands
Lhate, I.A. 2011. Chemical composition and machinability of selected species from Mozambique. Doctoral thesis. Uppsala: Sveriges lantbruksuniversitet. Acta Universitatis agriculturae Sueciae, 1652-6880; 2011:48
Mwakalukwa, E.E., H. Meilby and T. Treue1. 2014. Floristic Composition, Structure, and Species Associations of Dry Miombo Woodland in Tanzania. ISRN Biodiversity. 15pp

Natural resources and bioeconomy studies 80/2017
47
Okai, R., K. Frimpong-Mensah and D. Yeboah. 2003. Characterization of moisture content and specific gravity of branchwood and stemwood of Aningeria robusta and Terminalia ivorensis. Holz als Roh- und Werkstoff 61: 155–158.
Okai, R., K. Frimpong-Mensah and D. Yeboah. 2004. Characterization of strength properties of branchwood and stemwood of some tropical hardwood species. Wood Science and Technology (38): 163–171
Oyen, L.P.A. and D. Louppe. 2012. Brachystegia spiciformis Benth. [Internet] Record from PROTA4U. http://www.prota4u.org/search.asp. Lemmens, R.H.M.J., Louppe, D. & Oteng-Amoako, A.A. (Editors). PROTA (Plant Resources of Tropical Africa / Ressources végétales de l’Afrique tropicale), Wageningen, Netherlands. Accessed March 30, 2017.
Richter, C. 2015. Wood Characteristics Description, Causes, Prevention, Impact on Use and Technological Adaptation. Springer 222 pp. Shmulsky, J.R and P.D. Jones. 2011. Forest Products and Wood Science: an introduction 6th ed. – Blackwell Publishing Professional, Ames, Iowa. 478 p.
Uetimane Jr, E. 2010. Anatomy, Drying Behaviour and Mechanical Properties of Lesser Used Wood Species from Mozambique.Doctoral Thesis. Swedish University of Agricultural Sciences. Uppsala. Sweden
Zobel, B.J and J.P van Bujten. 1989. Wood variation: Its causes and control. Springer Verlag, New York 363 pp.

Natural resources and bioeconomy studies 80/2017
48
The reliability of visual and acoustics grading of beech wood from a standing tree to dry sawn wood
Željko Gorišek*, Katarina Čufar, Maks Merela, Aleš Straže, Jurij Marenče, Bogdan Šega, Dominika Gornik Bučar
Department of Wood Science and Technology Biotechnical Faculty, University or Ljubljana
Ljubljana, 1000, Slovenia
Abstract
Reliable wood quality assessment for achieving optimal economic outcomes is a big challenge for forestry as well as for wood industry, especially in case of hardwoods as some essential defects are often revealed during wood processing. Therefore, the still predominating visual grading of logs or sawn timber should be improved with other nondestructive methods. Thirty trees of European beech (Fagus sylvatica L) were selected from three forest plots from different regions in Slovenia. After cutting, the logs were assessed according to visual standard procedure and with nondestructive acoustics method. Both methods were also used for quality assessment on fresh and dry sawn wood. The quality assessment of standing trees was as a rule overestimated, as the evaluation was based on external tree appearance and the defects relevant for the classification revealed later after tree felling and log cutting. A large part of defects also occurred during manipulation. The visual assessment of the logs was as a rule more reliable. The dynamic E-modulus proved to be relatively well correlated with classification based on visual inspection of the logs. The exception was the logs from the lowest quality class, where we had to use the combination of non-destructive acoustic method and visual inspection. Sawing the wood assortments to smaller dimensions the acoustic method became more and more consistent with the visual assessment. The acoustic grading method applied for green and dry wood proved to be more reliable in case of a dry wood.
Introduction 1.Correctly grading of wood is exceptionally important for the possibility of its end use as well as for achieving the highest possible economic impact. The objectives of various research projects have in principle purpose of reducing the uncertainty of wood characteristics as influenced by its biological nature resulting in its high variability and heterogeneity with great number of diverse factors on wood quality.
Assessment of the quality of wood is for the forestry as well as for the wood industry a big challenge. The great variability and heterogeneity of wood exhibit at different levels more or less hidden structure which often determines its quality. Many wood defects are being disclosed during processing of wood to smaller and smaller assortments. The evaluation may be doubtful and assessment or classification is therefore risky and uncertain. Visual grading of logs or sawn timber is still dominant, but every day different nondestructive method was established (c.f. Grabianowski at al. 2006 Hansen, 2006 Ilic 2001).
Selection of trees in the forest is an important first step towards optimal exploitation and the most appropriate sorting, classification and grading of wood assortments in all forest wood processing chain. The participation of all stakeholders (foresters, wood processing industry as well as economists) is mandatory since we often meet a variety of assessment methods and grading criteria. For hardwoods, this problem is even more pronounced as we are faced with a more diverse and a wider variety of tree species, with more complex anatomic structure and a wider range of growth anomalies which are decisive in assigning assortments in quality classes (Gorišek et al. 2017).
* Corresponding author: Tel.: +386013203605; E-mail: [email protected]

Natural resources and bioeconomy studies 80/2017
49
The development of nondestructive techniques for the evaluation of different wood properties is particularly important to promote the efficient use of wood. Wood characteristics are usually determined from specimen cores (Evans and Ilic 2001), boards and beams (Divos et al., 1998, Divos & Tanaka, 2005, Gornik Bučar & Bučar 2011), structures in situ (Ross 2015) or sometimes from non-destructive measurements taken directly from trees and logs (Grabianowski et al., 2006). The methods are increasingly being applied by measuring of propagation time of elastic waves or from resonant vibrations (Ouis, 2002, Hansen 2006). The resonant vibrations have special advantages at uniform specimens, including industrial size material, simplicity, speed and convenience of use (Ilic 2001). There are some indications about the possibilities of applying these methods within the entire wood production chain (Divos et al., 1998; Boström, 1999; Evans in Ilic, 2001; Grabianowski in sod., 2006; Ross in Pellerin, 1991). Anyway, we should not forget quite a few factors that affect the reliability of measurements. (Sonderegger in sod., 2008; Yin in sod., 2010, Ilic, 2003; Hansen, 2006; Gorišek et al. 2014). The wave velocity and therefore dynamic longitudinal modulus of elasticity at
resonance vibrations in a wood fiber direction generally increase with material density (Sonderegger et al. 2007). The significant and strong correlation can be found between dynamic modulus of elasticity in longitudinal direction and modulus of elasticity in the transverse direction (Ilic 2001). Many studies have shown that the dynamic modulus, in longitudinal or transverse direction, can be used to indicate clearly the static Young’s modulus, whereas the prediction of modulus of rupture is
less significant (Ilic 2001; Sonderegger et al., 2007, Yin et al. 2010). Common beech (Fagus sylvatica L.) is one of the most important tree species in the forests of
temperate continental shelf to Europe (Čufar et al. 2012). Despite its marginalization in end use
beech wood can be used for a great variety of products. Practically it is almost used for any kinds of wood products with limitation due to its large shrinkage and poor natural durability that can be overcome with dimensional stabilization processes or any methods for increase sustainability (impregnation, thermal treatment). If we consider the possibility of extending the durability and dimensional stabilization beech wood becomes competitive or even exceeds the possibility of use in the construction purposes in comparison with other types of wood or building materials.
Growing demands of beech wood as a good energy source reduce the request for quality beech sawn wood and veneers despite its good features, a large available quantity and a favorable ratio between quality and price.
The aim of the research was to determine the reliability of visual and/or acoustic nondestructive method of evaluation of wood quality through the entire production line; that is from the standing tree to the final wood product.
Material and Methods 2.The material was selected on three samples forest plots from different region in Slovenia. For the needs of classification of trees on the basis of visual judgement features and observing the quality of standing trees, the current 5-class scale for quality evaluation of Slovenia Forest Service was used. Two trees from each quality range of 5 step scale (total 10 trees), with breast diameter greater than 30 cm, were chosen from each plot. The quality of standing trees was evaluated according to five-point scale from 1 to 5; where 1 represents the highest quality trees containing veneer logs and superior sawmill timber. Trees lowest quality is below average quality sawmilling logs and timber, suitable for chemical processing and heating.
To evaluate the wood assortments, the European standard (EN 1316-1: 2013) was applied. The length and the mean diameter of the logs were measured in accordance with EN 1309-2: 2006. Parallel with the visual assessment, the acoustic response was studied.
Logs were sawed on band sawing machine in an industrial environment, where we have pursued the goal of producing the best quality of sawn timber. The evaluation of sawn wood was performed as per the rules of the European Organization of the Sawmill Industry (EOS).

Natural resources and bioeconomy studies 80/2017
50
The dimensions of sawn timber were measured in accordance with the rules set out in EN 1309-1: 2000; the volume of sawn timber was calculated in accordance with the requirements of EN 1312: 2003.
With acoustics method we measured the speed of sound and frequency response from which we calculate the dynamic E-module. For the measurement of the speed of ultrasonic waves along the specimens measuring instrument PunditLab was used. The time of flight was measured by the transmitting and receiving ultrasonic probe at a frequency of 150 kHz. The modulus of elasticity of dry and green wood was calculated by equation 1.
(1)
Where, EUS = modulus of elasticity determined by the ultrasound speed [GPA]; v = wave speed [m/s] and ρMC = density of wood at current moisture content MC [kg/m3].
The dynamic modulus of elasticity of the specimens in a fresh and dry state was determined from the frequency response of free-lying specimen oscillation. With microphone (PCB-130d) and the measuring card (NI-9234) we determined the own frequency of specimen in the first oscillation mode. According to Bernoulli theory the elastic modulus of the frequency response was calculated (eq. 2).
(2)
where, Ef = modulus of elasticity determined by the frequency response [GPa], L = length of specimen [m], ρu = density of specimen [kg/m3], f = natural frequency of specimen in the first oscillation mode [s-1], A = area of cross section [m2], I = moment of inertia [m4] and k = Bernoulli constant (1. oscillation mode: k = 4,73).
Acoustic determination of E modulus enabled us the comparative evaluation of visual classification with results of acoustic measurements.
Results 3.The volume of fallen wood from all tree stands was estimated at 76.6 m3 of which 32.8 m3 of logs was made. On the basis of the analysis and by taking into account the information from literature indicating that the proportion of beech trees of the highest quality in Slovenian forest relatively high, but only approximately 8% of the logs of the highest quality can be expected (Fig. 1-left). The quality of standing trees is rather optimistic, since the assessment is based only on external appearance and many defects relevant for the classification appear after felling the tree. A large part of defect occurs also during manipulation. Perhaps the result indicates too good evaluation according to the recommendation and instructions generally apply for evaluation of standing trees in Slovenia.
The research shows that the quality logs, classified in B class according to the EN standards, may be acquired from the trees of quality classes 1, 2, 3 and even 4 (Fig. 1-right). This finding is somewhat surprising, as there is comparatively relatively small share of wood assortments of C quality in the tree quality classes 3 in 4. As expected, the critical defect for the classification of wood logs is the presence of covered knots that determine the quality class in high 63.4 % (Tab. 1).
MCUZ vE 2
4
2424Ik
AfLE u
f
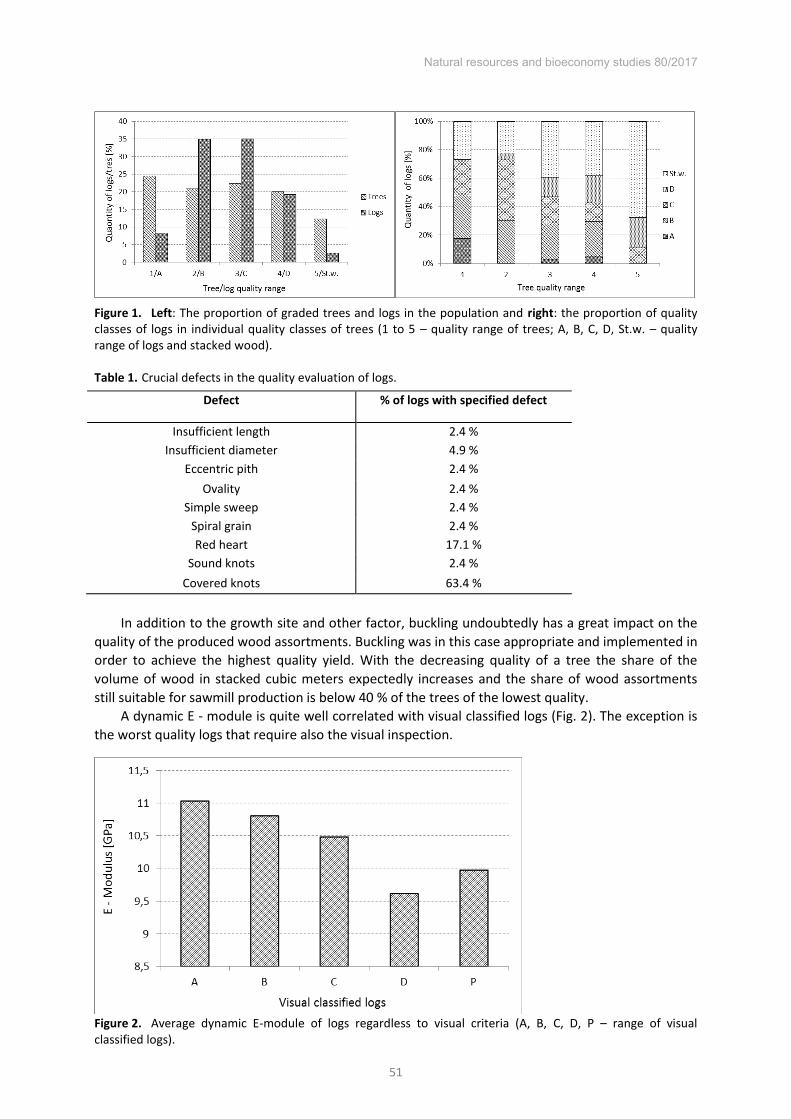
Natural resources and bioeconomy studies 80/2017
51
Figure 1. Left: The proportion of graded trees and logs in the population and right: the proportion of quality classes of logs in individual quality classes of trees (1 to 5 – quality range of trees; A, B, C, D, St.w. – quality range of logs and stacked wood).
Table 1. Crucial defects in the quality evaluation of logs.
Defect % of logs with specified defect
Insufficient length 2.4 % Insufficient diameter 4.9 %
Eccentric pith 2.4 % Ovality 2.4 %
Simple sweep 2.4 % Spiral grain 2.4 % Red heart 17.1 %
Sound knots 2.4 % Covered knots 63.4 %
In addition to the growth site and other factor, buckling undoubtedly has a great impact on the
quality of the produced wood assortments. Buckling was in this case appropriate and implemented in order to achieve the highest quality yield. With the decreasing quality of a tree the share of the volume of wood in stacked cubic meters expectedly increases and the share of wood assortments still suitable for sawmill production is below 40 % of the trees of the lowest quality.
A dynamic E - module is quite well correlated with visual classified logs (Fig. 2). The exception is the worst quality logs that require also the visual inspection.
Figure 2. Average dynamic E-module of logs regardless to visual criteria (A, B, C, D, P – range of visual classified logs).

Natural resources and bioeconomy studies 80/2017
52
Figure 3. The proportion of quality classes of sawn wood in individual quality classes of: left - trees and right – logs (A, B in C – quality classes of sawn boars, P – non-classified sawn wood).
Figure 4. The average E-modulus of green and dry wood according to visual classification of boards.
Table. 2: Crucial characteristics in deciding the quality class of sawn wood. Defect % of boards with specified defect
Length of boards 1.9 % Width of boards 0.8 %
Sound knots 1.3 % Unsound knots 52.8 % Slope of grain 10.0 %
Curly grain 1.1 % Inbark 3.0 %
Rot 6.5 % Discolouration 5.7 %
Red heart 31.1 % Curvature 8.4 %
Crack, fissures 2.4 %

Natural resources and bioeconomy studies 80/2017
53
Further processing of logs into sawn wood achieved only 25% of yield of the total gross tree volume, whereby the quantity yield of sawn wood in logs was between 65% and 71 %. The sawn wood of C quality prevailed (Fig. 3-left and 3-right). Crucial factors in classifying sawn wood are covered knots seen on the sawn wood as dead and unsound knots (Tab. 2).
Predicted quality of timber according to an assessed range of tree was in most cases not very reliable, while better correlation was observed between the quality of logs and the quality of sawn wood.
The logs of A quality provided 75.3 % of sawn wood of at least B quality, 53.2 % % of sawn wood of at least B quality were acquired from the logs of B quality, while for the logs of C quality this portion was 30.8 %. The lowest quality of sawn wood we get from the central part of logs and as expected from logs of the poorest quality. From all volume of obtained sawn wood, the C quality represented 52.7 %, obviously maximum from C and D log classes, respectively 61.9 % in 66.4 %.
The average values of dynamic E module of green sawn wood gradually declined was otherwise varied, but the differences were not significant (Fig. 4) otherwise, the quality grading of dry wood was more reliable.
Conclusions 4.The reliability of expected sawn wood quality of visual assessment of standing trees is a complex task as a lot of important characteristic become apparent during further production. The quality assessment of standing trees was as a rule overestimated, as the evaluation was based on external tree appearance and the defects relevant for the classification revealed later after tree felling and log cutting. A large part of defects also occurred during manipulation.
The visual assessment of the logs was as a rule more reliable. The dynamic E-modulus proved to be relatively well correlated with classification based on visual inspection of the logs. The exception was the logs from the lowest quality class, where we had to use the combination of non-destructive acoustic method and visual inspection.
When sawing the wood assortments to smaller dimensions the estimates of quality obtained with the acoustic method became more and more reliable and confident. When evaluating the boards, we recorded a weakness of the acoustic method, caused by very variable dynamic E-modulus. Therefore, the quality of the boards belonging to the lowest quality class was sometimes overestimated. The acoustic grading method applied for green and dry wood proved to be more reliable in case of a dry wood.
Acknowledgements This project was supported by the Slovenian Research Agency and Ministry of Agriculture, Forestry and Food through programmes P4-0015 and V4-1419.
References Boström, L. 1999. Determination of the modulus of elasticity in bending of structural timber – comparison
of two methods. Holz als Roh- und Werkstoff, 572):145-149. Čufar K., Ž. Gorišek, M. Merela, F. Pohleven 2012. Lastnosti bukovega lesa, predelava, problematika in
raba v arhitekturi. V: Bukovi gozdovi v Sloveniji : ekologija in gospodarjenje. Bončina A. (ur.). Ljubljana, Oddelek za gozdarstvo in obnovljive gozdne vire, Biotehniška fakulteta: 445-458.
Divos F., T. Tanaka, H. Nagao, H. Kato 1998. Determination of shear modulus on construction size timber. Wood Science and Technology, 32(6):393-402.
Divos F. and T. Tanaka 2005. Relation between static and dynamic modulus of elasticity of wood. Acta Silvatica et Lignaria Hungarica, 1:105-110.

Natural resources and bioeconomy studies 80/2017
54
Gorišek Ž., S. Pervan, M. Trop, A. Straže 2014. Interplay of density, moisture content and specimen size on static and dynamic determination of stiffness properties of beech wood. V: IAWS & Hardwood Conference. Sopron, pp. 30-31.
Gorišek, Ž., D. Plavčak, D. Gornik Bučar, M. Merela, K. Čufar, A. Straže 2017. Fizikalne in mehanske lastnosti svežega in osušenega lesa v bukovih deblih, izruvanih med želdolomom. Acta Silvae et Ligni, (in print).
Gornik Bučar D. and B. Bučar 2011. Strength grading of structural timber using the single mode transverse damped vibration method. Wood Research, 56(1):67-76.
Grabianowski M., B. Manley, J.C.F. Walker 2006. Acoustic measurements on standing trees, logs and green lumber. Wood Science and Technology, 40, pp 205-261.
Hansen H. 2006, Acoustic studies on wood. Canterbury, University of Canterbury, 146 pp. Ilic J. 2001, Relationship among the dynamic and static properties of air-dry Eucalyptus delegatensis R.
Baker. Holz als Roh- und Werkstoff, 59, pp 169-175. Ilic J. 2003. Dynamic MOE of 55 species using small wood beams. Holz als Roh- und Werkstoff,
61(3):167-172. Evans R. and J. Ilic 2001. Rapid prediction of wood stiffness from microfibril angle and density. Forest
Products Journal, 51:pp. 53-57. EN 1309-1: 2006. Round and sawn timber. Method of measurement of dimensions. Round timber.
Requirements for measurement and volume calculation rules. 5pp. EN 1316-1: 2013 Hardwood round timber - Qualitative classification – Part 1: Oak and beech. 9 pp. EOS European Organisation of the Sawmill Industry. http://www.eos-oes/en/index.php (13.8.2016). Ouis D, 2002. On the frequency dependence of the modulus of elasticity of wood. Wood Science and
Technology, 36(4): 335-346. Ross R.J. 2015. Nondestructive Evaluation of Wood. Second edition. Forest Products Laboratory.
Medison, 169 pp. Ross R.J. and R. F. Pellerin, 1991. Nondestructive Evaluation of Wood—Past, Present, and Future. V:
Nondestructive Characterization of Materials IV. Ruud C.O., Bussière J.F.Green R.E. (ur.). Boston, MA, Springer US pp. 59-64.
Sonderegger W., D. Mandallaz, P. Niemz 2008. An investigation of the influence of selected factors on the properties of spruce wood. Wood Science and Technology, 42, 4: 281-29.8
Yin Y., H. Nagao, X. Liu, T. Nakai 2010. Mechanical properties assessment of Cunninghamia lanceolata plantation wood with three acoustic-based nondestructive methods. Journal of Wood Science, 56,(1):33-40.

Natural resources and bioeconomy studies 80/2017
55
Drying quality and properties of subfossil oak from Central Serbia
Marko Veizović*, Zdravko Popović, Nebojša Todorović, Goran Milić
University of Belgrade Faculty of forestry
Kneza Višeslava 1, 11000 Belgrade, Serbia
Abstract
Subfossil wood which has been extracted from the river bed is interesting to wood marketers and wood industry because a huge market value that can be achieved, due to the age, specific color and texture. Subfossil oak logs that were used in this experiment originated from the Morava River in Central Serbia. The aim of this study was to determine the effects of prolonged exposure to water, mineral and organic matter on properties and drying quality of the wood. After sawing, timber was air-dried to about 20% MC followed by kiln drying. Drying quality was evaluated both after air drying and kiln drying. A large presence of cracks was observed after air drying, which suggests that in this type of wood kiln drying should be applied immediately after resawing logs. Although mild drying conditions during kiln drying were applied, the gap as a measure of case-hardening had a value greater than usual for oak same thickness. The basic properties, such as density, swelling, modulus of rupture – MOR, modulus of elasticity – MOE, compressive strength parallel to grain and Brinell hardness (parallel and perpendicular to the grain) were examined. The density of subfossil oak was about 0.64g/cm³, and values of swelling were: radial 8.15% and tangential 19.34%. Investigated mechanical properties were mostly lower by 10%-40% as compared to recent wood. The lower value of the modulus of elasticity can be one of the reasons for increased gap values after kiln drying. Compare to recent oak wood, there is no significant difference in hardness in the radial and tangential surface.
Introduction 1.Subfossil wood is unfossilized wood which has been deposited in rivers, swamps or moraine sediments for hundreds or thousands of years (Kaennel and Schweingruber 1995). This material is interesting to wood marketers and wood industry because a huge market value that can be achieved, due to the age, specific color and texture. Most of the subfossil wood trunks are excavated from river banks or gravel pits. Demand for this specific material and its exploitation has been on the rise in a past few years in Serbia. Therefore, it became necessary to start with the examinations of the properties of this material.
During the time subfossil wood is deposited in the specific conditions, a number of complicated physical and chemical processes occur. These finally result in its fossilization (Koláŕ and Rybníček
2010). The main factors which affect the speed of change in physical properties and chemical composition of wood are biotic (fungi, bacteria) and abiotic: pH, temperature, exposure to oxygen and water (Sandrström et al. 2004). In the wet environment, the oak wood is subject to continuous changes: gray degradation caused by bacteria, anaerobic hydrolytic degradation, leaching of unstructured substances, and mineralization. The first three lead to the reduction of wood density, and mineralization has the opposite effect (Dzabeński 1970, Kozakiewicz and Matejak 2013, as cited
in Mańkowski et al. 2016). The differences in chemical composition cause differences in behaviour of
the wood and its properties. The influence of the environment in which the wood was deposited on the changes in chemical composition prevails over the effect of time (Koláŕ et al. 2012). The change
in color is the most obvious difference between subfossil and recent oak wood. The color of wood
* Corresponding author: Tel.: +381113053828; E-mail: [email protected]
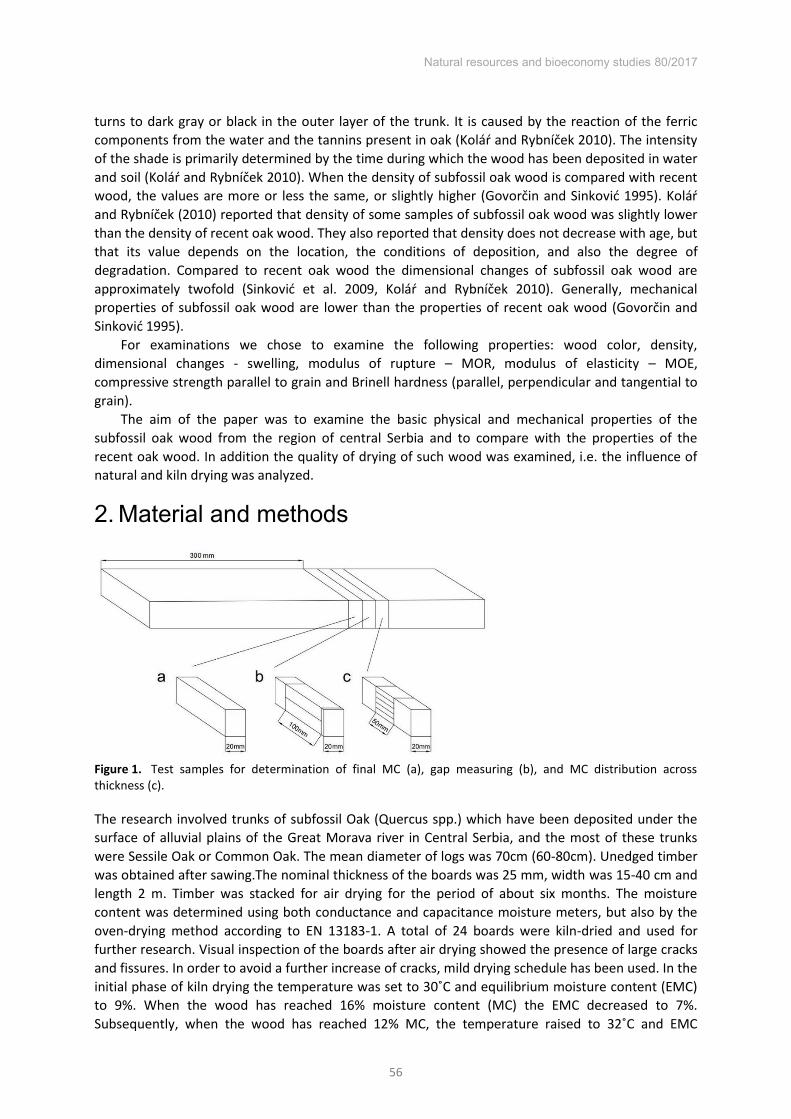
Natural resources and bioeconomy studies 80/2017
56
turns to dark gray or black in the outer layer of the trunk. It is caused by the reaction of the ferric components from the water and the tannins present in oak (Koláŕ and Rybníček 2010). The intensity
of the shade is primarily determined by the time during which the wood has been deposited in water and soil (Koláŕ and Rybníček 2010). When the density of subfossil oak wood is compared with recent
wood, the values are more or less the same, or slightly higher (Govorčin and Sinković 1995). Koláŕ
and Rybníček (2010) reported that density of some samples of subfossil oak wood was slightly lower than the density of recent oak wood. They also reported that density does not decrease with age, but that its value depends on the location, the conditions of deposition, and also the degree of degradation. Compared to recent oak wood the dimensional changes of subfossil oak wood are approximately twofold (Sinković et al. 2009, Koláŕ and Rybníček 2010). Generally, mechanical
properties of subfossil oak wood are lower than the properties of recent oak wood (Govorčin and
Sinković 1995). For examinations we chose to examine the following properties: wood color, density,
dimensional changes - swelling, modulus of rupture – MOR, modulus of elasticity – MOE, compressive strength parallel to grain and Brinell hardness (parallel, perpendicular and tangential to grain).
The aim of the paper was to examine the basic physical and mechanical properties of the subfossil oak wood from the region of central Serbia and to compare with the properties of the recent oak wood. In addition the quality of drying of such wood was examined, i.e. the influence of natural and kiln drying was analyzed.
Material and methods 2.
Figure 1. Test samples for determination of final MC (a), gap measuring (b), and MC distribution across thickness (c).
The research involved trunks of subfossil Oak (Quercus spp.) which have been deposited under the surface of alluvial plains of the Great Morava river in Central Serbia, and the most of these trunks were Sessile Oak or Common Oak. The mean diameter of logs was 70cm (60-80cm). Unedged timber was obtained after sawing.The nominal thickness of the boards was 25 mm, width was 15-40 cm and length 2 m. Timber was stacked for air drying for the period of about six months. The moisture content was determined using both conductance and capacitance moisture meters, but also by the oven-drying method according to EN 13183-1. A total of 24 boards were kiln-dried and used for further research. Visual inspection of the boards after air drying showed the presence of large cracks and fissures. In order to avoid a further increase of cracks, mild drying schedule has been used. In the initial phase of kiln drying the temperature was set to 30˚C and equilibrium moisture content (EMC)
to 9%. When the wood has reached 16% moisture content (MC) the EMC decreased to 7%. Subsequently, when the wood has reached 12% MC, the temperature raised to 32˚C and EMC
Natural resources and bioeconomy studies 80/2017
57
decreased to 6%. The final stage started when wood has reached 9% MC and the parameters were: T=40˚C and EMC=5%. Afterwards, conditioning and cooling phases were applied. The total drying time was 12 days. Drying quality was evaluated both after air drying and kiln drying. For this purpose three 20 mm thick specimens were sliced from each board and marked a to c (figure 1). Test specimen ,,a“ was taken for the final MC determination by the oven-drying method (EN 13183-1). The gap measurements were done on specimen ,,b“ after 48 h of acclimatization (EN 14464). Five
lamellae were sliced from specimen ,,c“, and their MC was determined gravimetrically to find out the MC distribution across the thickness. MC difference (ΔMC) was calculated as the difference between the MC in the core (MC of lamella 3) and the mean MC in the surface (MC of lamellae 1 and 5).
The color was measured using Easyco, manufactured by Erichsen. The diameter of the lenses was 10 mm, the device was set at the observing angle of 10˚, and illumination D65 for daylight. The
obtained results are displayed in the CIEL * a * b * color system. Measurements were made on marked places before and after the kiln drying process so it was possible to see if there is a difference. The difference in color of central and outer layers of the subfossil wood trunk was measured too. It was measured on central flat sawn boards from the pith to the bark with 2 cm step. Color difference (∆E ) was calculated according to folowing formula:
∆𝐸𝑎𝑏
∗ = √(𝐿2∗ − 𝐿1
∗ )2 + (𝑎2∗ − 𝑎1
∗)2 + (𝑏2∗ − 𝑏1
∗)2 (1)
The samples of 20 x 20 x 20 mm were used for investigation of physical properties of subfossil oak wood. Firstly, the samples were dried to 0% moisture content and wood density was investigated (SRPS D.A.044). The weight was measured with an accuracy of 0.01 g and dimensions with an accuracy of 0.1 mm and afterward samples were submerged in water with temperature at 20 ± 2˚C
until their dimensions were stable. Dimensional changes were investigated according to SRPS D.A.049. Samples of 20 x 20 mm in transversal dimensions and 40 mm in length were used for investigation of compressive strength (SRPS D.A1.045) and same samples were used for testing the hardness according to the Brinell method. Samples of 20 x 20 x 300 mm were used for investigation of modulus of elasticity – MOE (SRPS D.A1.035) and modulus of rupture – MOR (SRPS D.A1.046). For each test 30 samples were used.
Results and discussion 3.Visual inspection of subfossil oak boards has shown that there were too many cracks and fissures after air-drying (figure 2). Considering that subfossil oak timber was subjected to the air-drying procedures commonly applied to recent oak in industrial practice its poor condition afterward showed that the air-drying is not suitable for this material. It should be kiln-dried immediately after sawing with the use of a specific drying schedule. The recommendation is to put the wood in conditions of air humidity RH > 90%. Depending on the method for measuring the moisture content, different results were obtained. Producer of conductance electric moisture meter suggests group 3 setting for recent oak wood, but it was found that group 4 setting is more accurate when subfossil oak wood is measured. For this group ranging from 20% to 23% moisture content, the difference was less than 1% when measured with an electric moisture meter and the oven-dry method. At the end of the drying process, this difference was as small as in the beginning. This is the reason for the use of group 4 for MC measurements in the kiln-drying process. Due to the large differences in measurements as compared to the oven-dry method, it is not reliable to use the capacitance moisture meter when measuring subfossil oak wood MC.

Natural resources and bioeconomy studies 80/2017
58
As expected, moisture gradient was considerably low both at the beginning of drying and at the end of this process. In the beginning, the moisture gradient was 0.33 %/mm and at the end it was 0.24 %/mm. Both values meet the requirements for high drying quality. Moisture gradient normally obtained for recent wood is about 0.1 %/mm (i.e. Milić and Kolin 2008). Although mild drying
conditions during kiln-drying were applied, the gap as a measure of case-hardening had a value greater than usual for the oak of the same thickness. After 48 hours of conditioning, the gap was 2.2 mm. According to CEN/TS (2010) 14464 recommendations this is severe case-hardening.
Figure 2. Subfossil oak wood with many cracks and fissures (A) and recent oak wood (B)
Recent (A) and subfossil oak (B and C) wood are completely different in color (table 1) (ΔΕ A-B = 31.2 and ΔΕ A-C = 31.5). Kiln drying process did not affect the color change of subfossil oak wood ΔΕ
B-C = 0.3 – small difference (the highest temperature during the process was 40˚C). There is a big
difference in color between the central (Cc) and the outer (Co) part of the plank (ΔΕ Cc - Co = 9.2 – great difference) (figure 3).
Figure 3. Color difference from the central to the outer part of the plank
Table 1. Values of measured color parameters and color differences (results labeled “Cc” were obtained from pith, and “Co” near the board edge)
Wood Recent* Subfossil
Label A B C Cc Co
Kiln drying Yes No Yes Yes Yes
L 66.3 36.2 36.0 40.8 33.7
a 7.1 5.0 4.9 4.9 2.3
b 19.5 11.5 11.4 10.4 5.1 *internal data
The average values of subfossil wood swelling obtained in this experiment were: longitudinal 0.71%, radial 8.15% and tangential 19.34% (table 2). These values correspond to the values presented in the literature. Koláŕ and Rybníček (2010) reported longitudinal swelling 1.28%, radial 11.93 and tangential 17.08%. Swelling of recent oak wood is: longitudinal 0.46%, radial 4.7% and tangential 9.28% (Šoškić et al. 2005). It can be concluded that dimensional changes of the subfossil oak are approximately doubled in comparison to recent wood.
A
B

Natural resources and bioeconomy studies 80/2017
59
Table 2. Values of subfossil oak swelling (SD-standard deviation)
Source Subfossil/ recent
Oven-dry density
Radial swelling
SD Tangential
swelling SD
(g/cm³) (%) (%)
This experiment subfossil 0.637 8.15 0.96 19.34 2.38
Koláŕ, Rybníček, (2010) subfossil 0.575 11.93 1.75 17.08 2.37
Šoškić et al. (2005) recent 0.648 4.70 0.71 9.28 0.92
The obtained subfossil oak density was 0.637 g/cm³. The density of recent oak wood reported in
the literature is 0.648 g/cm³ (Šoškić et al. 2005). The variations of density of subfossil oak was 0.070 g/cm³, and it can not be ascertained whether there is significant difference when compared to density of recent oak. Koláŕ et al. (2014) presented that the density of subfossil oak ranges between
0.526 g/cm³ and 0.668 g/cm³. Koláŕ and Rybníček (2010) reported that density of some samples
significantly exceeds 0.700 g/cm³ but it can reach even 0.846 g/cm³ (Mańkovski et al. 2016). Modulus of elasticity of subfossil oak is about 40% lower than MOE of recent oak of the same
density (table 3). A similar reduction in the subfossil oak MOE had been discovered in previous studies (36% - Mańkovski et al. 2016, and 40% - Koláŕ et al. 2014). Modulus of rupture of subfossil
oak reaches 67%-76% of recent oak and compression strength parallel to the grain ranges between 72% and 85% of the strength of recent oak same density. Koláŕ et al. (2014) reported that degree of
degradation or the amount of minerals settled in the wood has a significant impact on density and mechanical properties of the subfossil oak. Over the years, depending on the conditions in which the tree was deposited, main wood components (lignin, cellulose and hemicellulose) are replaced by minerals – ash. Subfossil wood more or less retains its density, but due to the reduced content of lignin and cellulose, it is characterized by lower mechanical properties.
It was found that the values of subfossil oak hardness are 10% lower in the longitudinal direction, 7% higher in the radial direction and in the tangential direction, there is no difference as compared to recent oak (table 4).
Table 3. Comparison of selected properties of subfossil and recent oak wood
Source Subfossil/ recent
Oven-dry
density
Wood moisture MOE
SD MOR
SD Compressive
strength II SD
(g/cm³) (%) (MPa) (MPa) (MPa)
This experiment subfossil 0.637 11.5 6846 2162 81.7 22.0 52.0 11.6
Mańkovski et al. (2016) subfossil 0.846 12.0 9600 2300 125.0 31.0 80.0 11.
0 Koláŕ, Rybníček,
(2010) subfossil 0.575 12.0 4178 1415 - - 33.3 3.8
Šoškić et al. (2005) recent 0.648 11.2 11361 - 109.5 - 60.5 -
Mańkovski et al. (2016) recent 0.662 12.0 10050 750 121.0 10.0 72.0 6.0

Natural resources and bioeconomy studies 80/2017
60
Table 4. Comparison of static hardness of subfossil and recent oak wood
Source Subfossil/recent
Oven-dry
density (g/cm³)
Wood moisture
(%)
Hardness (MPa)
Longitudinal
SD Radial SD Tangential SD
This experiment subfossil 0.637 11.5 49.4 11.5 28.9 7.3 23.8 6.6
Šoškić et al. (2005) recent 0.648 13.5 55.6 - 27.0 - 23.8 -
Conclusions 4.Subfossil wood is a very specific material whose properties significantly depend on location and the conditions in which it has been deposited.
Subfossil wood requires a special drying schedule. Air drying should be avoided and this material should be kiln-dried immediately after sawing. Air humidity in the initial stage of drying process should be high.
It is recommended more frequent measuring of moisture content using oven-dry method during subfossil oak drying. In this research, it was found that group 4 should be used when the moisture content of subfossil oak is measured by electro meter.
The gap, as a measure of case-hardening had a value greater than usual for oak of same thickness. The lower value of the modulus of elasticity can be one of the reasons for increased gap values after kiln drying.
The color of subfossil oak wood differs considerably when compared to the recent oak wood. Gradual color change from the center to the outer layers of the trunk is specific for subfossil oak wood.
Dimensional changes of subfossil wood are approximately twofold compared to recent wood. The variation of investigated subfossil oak density is large, but its value corresponds to the
density range of subfossil oak reported in literature. It’s mean value is close to the density of recent oak wood reported in the literature.
Mechanical properties of subfossil oak are lower in comparison with recent oak. Modulus of elasticity, modulus of rupture and compression strength parallel to the grain ranges between 60%-85% of recent oak. Hardness in longitudinal direction reduced for about 10%, while in the radial and tangential direction it was almost the same or 7% higher.
Subfossile wood can be used to produce furniture, flors, wall coverings and it is especially appreciated for the production of musical instruments.
Acknowledgment This research was realized within projects TR 31041 and TR 37008, financed by Ministry of Education, Science and Technological Development of Republic of Serbia.
Natural resources and bioeconomy studies 80/2017
61
References CEN/TS (2010) 14464 Sawn timber – method for assessment of case-hardening Dzbeński, W., 1970: Criteria of estimating technical properties of fossil oak wood. (Kryteria oceny
technicznych własności dębowego drewna wykopaliskowego). Materiały V Sympozjum Ochrony Drewna, Zeszyty Naukowe SGGW – Leśnictwo, 14: 171-190 (in Polish).
EN 13183-1 (2002) Moisture content of a piece of sawn timber - Part 1: Determination by oven dry method
Govorčin, S. and Sinković, T. 1995. Some physical and mechanical properties of the Bednja abonos. Drvna-Industija 46(1): 9-14
Kaennel, M. and Schweingruber, F. H. 1995. Multilingual Glossary of Dendrochronology: Terms and definitions in English, German, French, Spanish, Italian, Portuguese and Russian. Swiss Federal Institute for Forest, Snow and Landscape Research, Birmensdorf / Paul Haupt Publishers, Berne. http://www.wsl.ch/dienstleistungen/produkte/glossare/dendro glossary/DetailsEN?id=299&language=English. Accessed March 25, 2017.
Koláŕ, T. and Rybníček, M. 2010. Physical and mechanical properties of subfossil oak (Quercus, sp.) wood. Acta univ. Agric et silvic. Mandel. Brun., LVIII, No. 4, pp. 123-134
Koláŕ, T., Gryc V., Rybníček, M., Vavrčík, H. 2012. Anatomical analysis and species identification of subfossil oak wood. Wood research 57 (2): 251-264
Koláŕ, T., Rybníček, M., Střelcová, M., Hedbávný, J. and Vít, J. 2014. The changes in chemical composition and properties of subfossil oak deposited in holocene sediments. Wood research 59 (1): 149-166
Kozakiewicz, P., Matejak, M., 2013: Climate and antique wood. Old-time and contemporary knowledge of wood. (Klimat a drewno zabytkowe. Dawna i współczesna wiedza o drewnie) Wydawnictwo SGGW, Warszawa (in Polish).
Mańkowski, P., Kozakiewicz, P. and Drożdżek, M. 2016. The selected properties of fossil oak wood from medieval burgh in płońsk. Wood research 61 (2): 287-298
Milić, G. and Kolin, B. 2008. Moisture content distribution across thickness of kiln dried oak and beech lumber during conditioning phase. Holz Roh Werkst 66: 83-87
Sandström, M., Fors, Y., Jalilehvand, F., Damian, E. and Gelius, U. 2014. Analyses of sulfur and iron in marine archaeological wood. Editors proceedings of the 9th ICOM group on wet organic archaeological materials conference, Copenhagen, pp. 181-202.
Sinković, T., Govorčin, S., Dubravac, T., Roth, V., Sedlar T. 2009. Comparison some physical and mechanical properties of abonos and recent oak (Quercus robur L.). Šumarski list, 11-12: 605-611
SRPS D.A1.035 Wood -- Determination of modulus of elasticity in static bending SRPS D. A1.045 Testing of wood - Longitudinal compression strength SRPS D.A1.046 Wood -- Determination of ultimate strength in static bending Šoškić, B., Popović, Z., Todorović, N. 2005. Svojstva i mogućnost upotrebe drveta hrasta kitnjaka
(Quercus sessiliflora S.). Šumarstvo 3: 85-96

Natural resources and bioeconomy studies 80/2017
62
Strength and stiffness perpendicular to the grain of ash (Fraxinus e.) and beech (Fagus s.) in comparison to
spruce (Picea a.) M. Westermayr1*, F. Hunger2, Jan-Willem van de Kuilen1,3
Abstract
In timber construction, the application of softwood is widely spread due to its high provision, easy processing and long-time research of its mechanical behavior. Nevertheless, hardwood can provide higher strength and stiffness compared to the mainly used softwood species spruce. Especially in structures like trusses and pitch cambered beams, high local stresses may occur in compression and tension perpendicular to the grain. In these cases, it can be advantageous to use medium dense hardwood, as they exhibit higher strength and stiffness values perpendicular to the grain. A test program has been set-up to determine values for strength and stiffness of ash and beech in tension and compression perpendicular to the grain according to EN 408. The same experiments were performed on spruce specimens to compare the mechanical behavior. The tests were performed with different angles between the applied load and the annual growth rings. Ash and spruce showed the smallest property values for angles of 45° with no difference between radial and tangential direction. Beech showed a minimum value for angles of approximately 70° and a maximum value for radial loading. This applies for both tension and compression perpendicular to the grain. In general, the characteristic tensile strength values perpendicular to the grain are approximately half of the compression strength values. The determined mechanical properties show that the tensile strength values currently given in EN 338 are low especially for hardwood and should be increased to take advantage of the favorable mechanical properties of medium dense hardwood species.
Introduction 1.The results of the German National Forest Inventories 2 and 3 show an increasing amount of the species beech (Fagus sylvatica) in German forests. At the same time, the forest areas covered by the economically important softwood species spruce (Picea abies) are decreasing (Federal Ministry of Food and Agriculture, 2015). The effects of climate change will probably intensify this development within the next decades. As a result, a growing proportion of hardwood can be expected in future.
A quantitatively interesting market for hardwood is timber construction. Some hardwood species show favorable strength and stiffness properties for the application in timber structures (Aicher and Ohnesorge, 2011). As stresses perpendicular to the grain cannot be avoided completely in timber construction, it is important to establish a high-quality database concerning strength and stiffness values perpendicular to the grain to ensure the safe design of structures. Tensile stresses perpendicular to grain arise for example in the middle of curved beams and also often close to openings or recesses within trusses, in finger-jointed frame corners and notches. Force transmission
* Corresponding author: Tel.: +498921806450; E-mail: [email protected]
1Wood Research Munich Technical University of
Munich Munich, D-80797, Germany
2Department of Civil, Geo and Environmental
Engineering Technical University of
Munich Munich, D-80333, Germany
3Faculty of Civil Engineering and Geosciences Delft University of
Technology Delft, 2628 CN,
The Netherlands

Natural resources and bioeconomy studies 80/2017
63
by transverse joints can also cause stresses perpendicular to the grain. Compression stresses perpendicular to the grain arise for example in trusses when compression beams transfer load to perpendicular beams or in general in support areas. In addition to the low mechanical performance of timber perpendicular to the grain, cracks show a major impact on the transverse tensile strength and stiffness. Especially timber produced at industrial scale is often dried fast due to economic reasons (Kollmann and Schneider, 1960). The resulting high moisture gradients increase the risk of drying cracks. Radial drying cracks may lead to low tensile strength and stiffness values perpendicular to the grain as well as low transverse compression stiffness (Niemz, 1993). As a result of low strength and stiffness in combination with the influence of cracks, there is often a need of reinforcing timber structures loaded perpendicular to the grain.
The resulting high moisture gradients increase the risk of drying cracks. Radial drying cracks may lead to low tensile strength and stiffness values perpendicular to the grain as well as low transverse compression stiffness (Niemz, 1993). As a result of low strength and stiffness in combination with the influence of cracks, there is often a need of reinforcing timber structures loaded perpendicular to the grain.
Common practices for the reinforcement of timber stressed in tension perpendicular to the grain are the application of self-tapping screws (Jönsson, 2005) and glued-in rods. For the reinforcement of timber stressed in compression perpendicular to the grain, Ehlbeck (1985) discussed glued-in rods and plates, hardwood dowels and screw nails. Bejtka and Blaß (2006) studied the use of self-tapping screws as a method for increasing the load carrying capacity of softwood. Finally, all reinforcement methods are cost- and time-intensive factors and may as well lead to further mechanical problems like induced stresses by inhibited swelling or shrinking. By the use of a species with higher strength and stiffness perpendicular to the grain, required reinforcements may be reduced or even get redundant.
A lot of literature is available concerning the mechanical behavior of beech and ash timber loaded in direction of the grain, for example by Glos and Lederer (2000), Frühwald and Schickhofer (2004) and Bittermann (2009). In contrast, a low number of studies can be found investigating the mechanical properties perpendicular to the grain. Early studies used small and clear specimens with necking. Kollmann (1956) and Goulet (1960) tested small dumbbell-shaped specimens in tension. But Kollmann (1951) also mentioned, that specimens with necking show an inhomogeneous stress distribution which leads to unrealistic mechanic properties. Furthermore, a strong dependency between specimen size and mechanical property is given. By testing douglas-fir and using data from literature, Barrett (1974) exemplified that the logarithm of maximum tensile strength decreases linearly with the logarithm of volume. Pedersen et al. (2003) also showed a significant dependency between specimen size and strength perpendicular to the grain. This explains the strongly varying mechanical properties in studies using either small and clear or more full-size specimens. It is also mentioned, that testing of very small specimens limits proper displacement measurements and thus the calculation of a reliable modulus of elasticity.
To provide reliable design values for the use of timber in heavy load carrying constructions, there is a need of testing representative specimen sizes. In consequence, this study applied specimen configuration and test setup according to EN 408:2010. There is a need of creating a reliable database on which basis the values given in literature and EN 338:2016 can be assessed. The different mechanical properties of the middle dense hardwood species beech and ash and the softwood species spruce are investigated as well as the influence of density and anatomical direction.
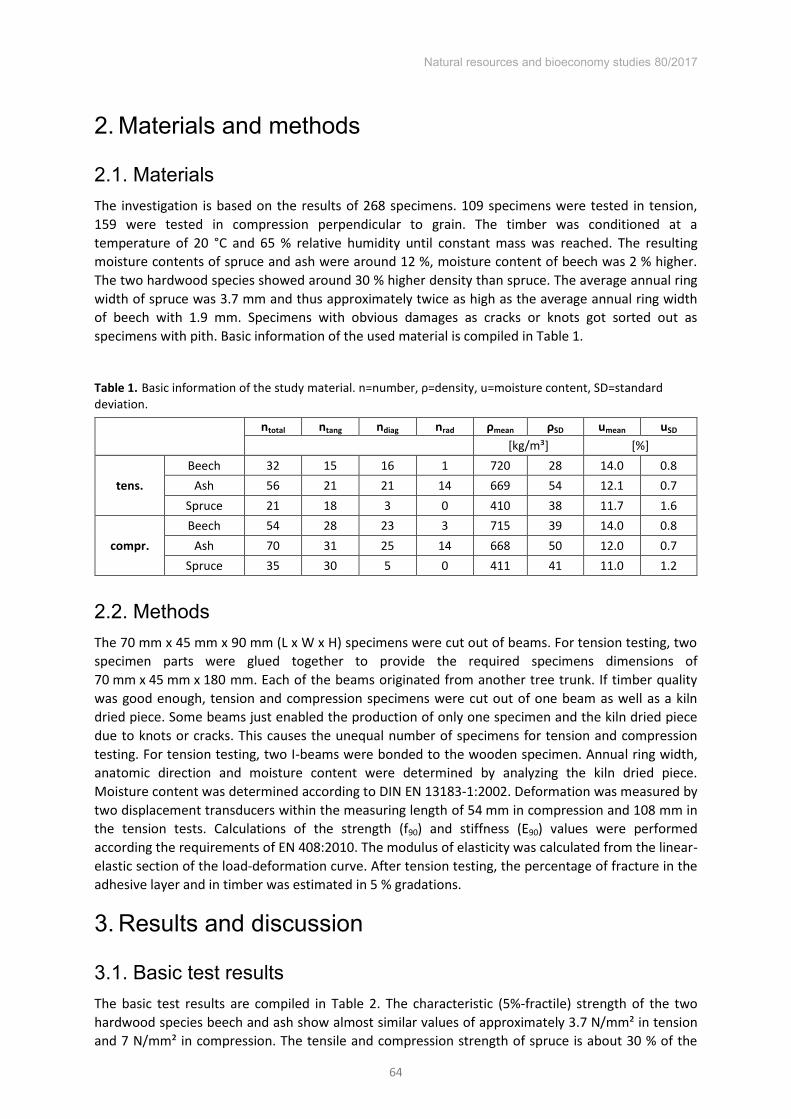
Natural resources and bioeconomy studies 80/2017
64
Materials and methods 2.
Materials 2.1.The investigation is based on the results of 268 specimens. 109 specimens were tested in tension, 159 were tested in compression perpendicular to grain. The timber was conditioned at a temperature of 20 °C and 65 % relative humidity until constant mass was reached. The resulting moisture contents of spruce and ash were around 12 %, moisture content of beech was 2 % higher. The two hardwood species showed around 30 % higher density than spruce. The average annual ring width of spruce was 3.7 mm and thus approximately twice as high as the average annual ring width of beech with 1.9 mm. Specimens with obvious damages as cracks or knots got sorted out as specimens with pith. Basic information of the used material is compiled in Table 1.
Table 1. Basic information of the study material. n=number, ρ=density, u=moisture content, SD=standard deviation.
ntotal ntang ndiag nrad ρmean ρSD umean uSD
[kg/m³] [%]
tens. Beech 32 15 16 1 720 28 14.0 0.8
Ash 56 21 21 14 669 54 12.1 0.7 Spruce 21 18 3 0 410 38 11.7 1.6
compr. Beech 54 28 23 3 715 39 14.0 0.8
Ash 70 31 25 14 668 50 12.0 0.7 Spruce 35 30 5 0 411 41 11.0 1.2
Methods 2.2.The 70 mm x 45 mm x 90 mm (L x W x H) specimens were cut out of beams. For tension testing, two specimen parts were glued together to provide the required specimens dimensions of 70 mm x 45 mm x 180 mm. Each of the beams originated from another tree trunk. If timber quality was good enough, tension and compression specimens were cut out of one beam as well as a kiln dried piece. Some beams just enabled the production of only one specimen and the kiln dried piece due to knots or cracks. This causes the unequal number of specimens for tension and compression testing. For tension testing, two I-beams were bonded to the wooden specimen. Annual ring width, anatomic direction and moisture content were determined by analyzing the kiln dried piece. Moisture content was determined according to DIN EN 13183-1:2002. Deformation was measured by two displacement transducers within the measuring length of 54 mm in compression and 108 mm in the tension tests. Calculations of the strength (f90) and stiffness (E90) values were performed according the requirements of EN 408:2010. The modulus of elasticity was calculated from the linear-elastic section of the load-deformation curve. After tension testing, the percentage of fracture in the adhesive layer and in timber was estimated in 5 % gradations.
Results and discussion 3.
Basic test results 3.1.The basic test results are compiled in Table 2. The characteristic (5%-fractile) strength of the two hardwood species beech and ash show almost similar values of approximately 3.7 N/mm² in tension and 7 N/mm² in compression. The tensile and compression strength of spruce is about 30 % of the

Natural resources and bioeconomy studies 80/2017
65
corresponding beech and ash values. A similar ratio can be found regarding the stiffness. The mean values of the modulus of elasticity are around 1000 N/mm² for both hardwood species in tensile loading and slightly higher in compression. The modulus of elasticity of spruce is approximately 20 % of the hardwood values.
Table 2. Statistical results of strength and stiffness perpendicular to the grain of beech, ash and spruce tested in tension and compression. n=number of specimens, mean=mean value, SD=standard deviation, 5%-fractile=characteristic value.
species n mean SD 5%-fractile
f90 [N/mm²]
tens. Beech 32 5.61 1.37 3.61
Ash 56 6.12 1.74 3.77 Spruce 21 1.60 0.31 1.27
compr. Beech 54 8.23 1.09 7.02
Ash 70 8.88 1.42 6.94 Spruce 35 2.95 0.52 2.35
E90 [N/mm²]
tens. Beech 32 946 255 675
Ash 56 1073 307 707 Spruce 21 210 75 137
compr. Beech 54 1063 385 746
Ash 70 1159 374 715 Spruce 35 227 86 126
Concerning tensile testing, Blaß and Schmid (2001) used spruce specimen with the same dimensions like this investigation and found a characteristic tensile strength value perpendicular to the grain of 1.24 N/mm². This fits well with the value of 1.27 N/mm² determined in this investigation. In contrast, the characteristic value of 0.4 N/mm² specified in EN 338:2016 for softwoods is substantially lower. The characteristic value given in EN 338:2016 for hardwood of 0.6 N/mm² is much lower than the characteristic transverse tensile strength of beech and ash of around 3.7 N/mm² found in this investigation. Concerning compression testing, Hoffmeyer et al. (2000) determined a characteristic value for spruce of approximately 2.4 N/mm2. The corresponding characteristic value in this investigation is 2.35 N/mm2 and confirms the findings of Hoffmeyer et al. (2000). For glulam made of beech and ash, Hübner (2013) determined characteristic values for compression perpendicular to the grain of 7.2 N/mm² for beech and 7.5 N/mm² for ash. These corresponding values determined in this investigation are almost congruent and show only slight deviation. The characteristic compression strength perpendicular to the grain for softwood given in EN 338:2016 range from 2.0 N/mm² to 3.0 N/mm² depending on the strength class. The characteristic value of 2.35 N/mm² determined in this investigation thus ranges in the middle of the strength values given in EN 338:2016. The same relation can be observed for hardwood compression strength values. The cumulative frequency distributions of tensile and compression strength and modulus of elasticity are shown in Figure 1.

Natural resources and bioeconomy studies 80/2017
66
Figure 1. Cumulative frequency distribution of strength and modulus of elasticity.
The strength and stiffness values for all three species in tension and compression are normally distributed. Regarding the modulus of elasticity, only minor differences between compression and tension were obtained. In consequence, the application of one modulus of elasticity for tension and compression is justifiable. Figure 2 shows the relation between strength and density.
Figure 2. Relation between tensile (left) compression (right) strength and density.
No correlation is found between the tensile or compression strength and the density for the three individual species, confirming the results of Ravenshorst et al. (2004) for hardwoods. In consequence, the density seems inappropriate to predict the strength perpendicular to the grain of a species in terms of strength grading.
Failure modes 3.2.The tensile strength perpendicular to the grain is governed by microcracks, wood rays and resin channels as well as fibre deviation. Moisture gradients are induced between the wood surface and the core during drying process. These moisture gradients can cause inner tensions, resulting in drying cracks. Niemz (1993) mentioned that these cracks run often along wood rays, initiating on the surfaces. Kollmann (1956) perceives the numerous wood rays of beech as weak links that cause the

Natural resources and bioeconomy studies 80/2017
67
failure under loads in tangential direction. For loading in radial direction, wood rays reinforce the structure of hardwood. However strength perpendicular to the grain is decreased by the porous annual ring structure of ash which acts like a predetermined failure point for radial loads.
Concerning failure through compression loads, Müller et al. (2003) mentions the plastic deformation of earlywood vessels by microscopic analysis for oak, whereas buckling of the cell walls is determined as failure mode for spruce, both under radial loading. The weakening of the cell structure causes the annual rings to slide off. Diagonal loading leads to rolling shear. Lateral yieldingness occurs as the most frequent failure mode. Common failure modes are compiled in Figure 3.
Figure 3. Typical failure modes in tension (above) and compression (below). From left to right: spruce (t), spruce (t), ash (t), spruce (c), beech (c), ash (c).
Relation between strength / stiffness and anatomical direction 3.3.In the following, the influence of the specimens’ anatomic direction on the strength and stiffness is
presented. A range of angles has been tested between 0 ° and 90 ° but in advance, the small number of specimen with radial direction is mentioned, especially for spruce and beech. As a result of the relatively large and more full-scale size of the specimen as well as often concentrically annual rings, there is always a combination of different anatomic directions within each specimen. Various overlapping influences lead to different combinations of failure modes. Figure 4 shows the influence of the anatomic direction on the tensile and compression strength of ash, beech and spruce.

Natural resources and bioeconomy studies 80/2017
68
Figure 4. Transverse tensile (above) and compression (below) strength depending on the anatomical direction.
Specimen with diagonal annual ring orientation show the lowest strengths, as radial and tangential effects cause the failure initiation and reduces the strength perpendicular to the grain. Based on a low number of compression specimen, Gaber (1940) came to similar conclusion for soft- and hardwood. Kollmann (1951) describes the phenomenon on softwood trough latewood zones sliding off at 45° angles under compression loading. For hardwood, this phenomenon is determined for ring porous species. The scattering of strength values is larger in tension, as drying cracks, wood rays or resin channels show bigger effect on tensile strength than compression strength. The high number of wood rays in beech leads to large scattering of tensile strength values.
Figure 5 shows the influence of the anatomic direction on the tensile and compression modulus of elasticity of ash, beech and spruce.
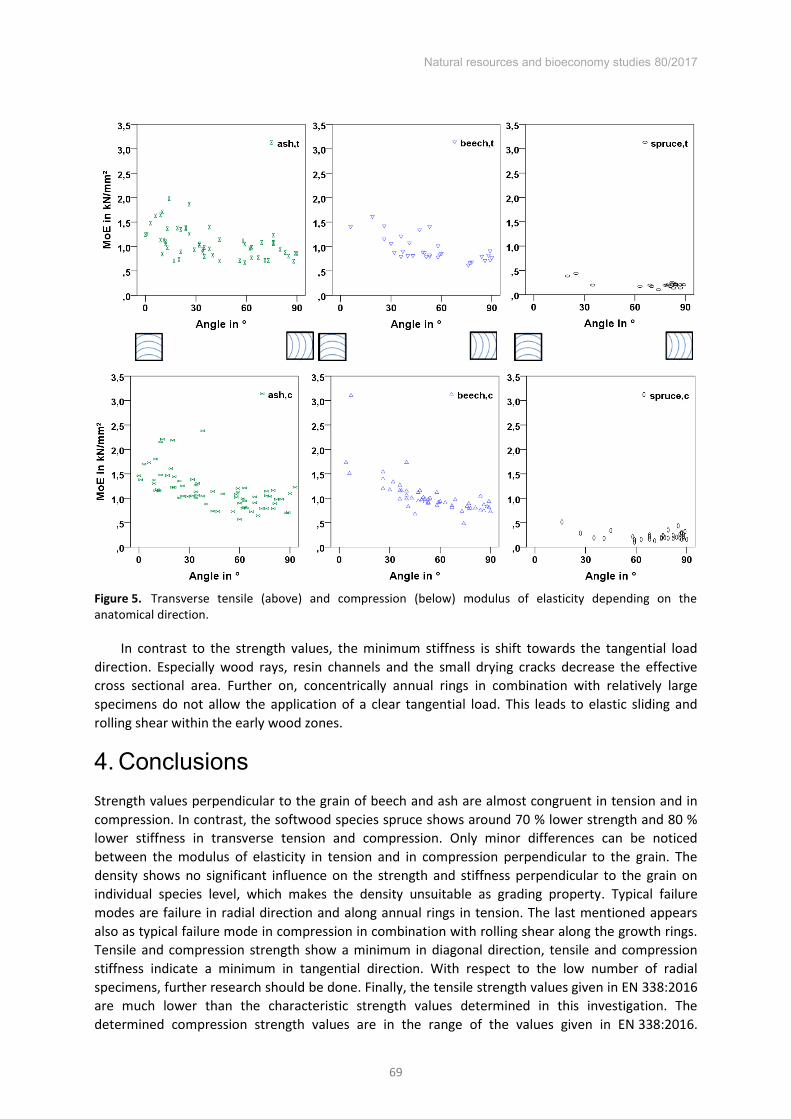
Natural resources and bioeconomy studies 80/2017
69
Figure 5. Transverse tensile (above) and compression (below) modulus of elasticity depending on the anatomical direction.
In contrast to the strength values, the minimum stiffness is shift towards the tangential load direction. Especially wood rays, resin channels and the small drying cracks decrease the effective cross sectional area. Further on, concentrically annual rings in combination with relatively large specimens do not allow the application of a clear tangential load. This leads to elastic sliding and rolling shear within the early wood zones.
Conclusions 4.Strength values perpendicular to the grain of beech and ash are almost congruent in tension and in compression. In contrast, the softwood species spruce shows around 70 % lower strength and 80 % lower stiffness in transverse tension and compression. Only minor differences can be noticed between the modulus of elasticity in tension and in compression perpendicular to the grain. The density shows no significant influence on the strength and stiffness perpendicular to the grain on individual species level, which makes the density unsuitable as grading property. Typical failure modes are failure in radial direction and along annual rings in tension. The last mentioned appears also as typical failure mode in compression in combination with rolling shear along the growth rings. Tensile and compression strength show a minimum in diagonal direction, tensile and compression stiffness indicate a minimum in tangential direction. With respect to the low number of radial specimens, further research should be done. Finally, the tensile strength values given in EN 338:2016 are much lower than the characteristic strength values determined in this investigation. The determined compression strength values are in the range of the values given in EN 338:2016.

Natural resources and bioeconomy studies 80/2017
70
Increasing transverse compression strength with increasing density as given in EN 338:2016 is indicated but cannot be confirmed for certain.
References Aicher, S.; Ohnesorge, D. (2011): Shear strength of glued laminated timber made from European beech
timber. European Journal of Wood and Wood Products 69: 143-154; DOI 10.1007/s00107-009-0399-9
Barrett, J.D. (1974): Effect of size on tension perpendicular -to-grain strength of douglas-fir. Wood and Fiber Science 6: 126-143.
Bejtka I., Blass H.J. (2006): Self-tapping screws as reinforcement in beam supports. Paper 39-7-2. In: Proceedings of 39th conference of CIB-W18, Florence, Italy.
Bittermann, P. (2009): Untersuchungen zur Zugfestigkeit von Eschenholz. Diploma. Technical University of Munich. (in German)
Blass, H.J.; Schmid, M. (2001): Querzugfestigkeit von Vollholz und Brettschichtholz. Holz als Roh- und Werkstoff 58: 456-466. (in German)
Ehlbeck, J. (1985): Möglichkeiten zur Erhöhung der Querdruck- und Querzugbelastbarkeit von Holz. Holz als Roh- und Werkstoff 43: 105-109. (in German)
Federal Ministry of Food and Agriculture (2015): The forests in Germany. Selected results of the third national forest inventory. Available online: https://www.bundeswaldinventur.de/index.php?id=421&L=3 (2017-06-19)
Frühwald, K.; Schickhofer, G. (2004): Strength grading of hardwoods. P. 675-679 in 8th World Conference on Timber Engineering, Lahti.
Gaber, E. (1940): Druckversuche quer zur Faser an Nadel- und Laubhölzern. Holz als Roh und Werkstoff 7/8: 222-226. (in German)
Glos P.; Lederer, B. (2000): Sortierung von Buchen- und Eichenschnittholz nach der Tragfähigkeit und Bestimmung der zugehörigen Festigkeits- und Steifigkeitskennwerte. Report. Wood Research Munich. (in German)
Goulet, M. (1960): Die Abhängigkeit der Querzugfestigkeit von Eichen-, Buchen- und Fichtenholz von Feuchtigkeit und Temperatur im Bereich von 0° bis 100°C. Holz als Roh und Werkstoff 18: 325-331. (in German)
Hoffmeyer, P.; Damkilde, L.; Pedersen, T.N. (2000): Structural timber and glulam in compression perpendicular to grain. Holz als Roh- und Werkstoff 58: 73-80.
Hübner, U. (2013): Mechanische Kenngrößen von Buchen-, Eschen- und Robinienholz für lastabtragende Bauteile. Dissertation Technische Universität Graz, Fakultät Bauingenieurwissenschaften, Institut für Holzbau und Holztechnologie, Graz, Austria. (in German)
Jönsson, J. (2005): Load carrying capacity of curved glulam beams reinforced with self-tapping screws. Holz als Roh- und Werkstoff 63: 342-346.
Kollmann, F. (1951): Technologie des Holzes und der Holzwerkstoffe. Erster Band. Springer Verlag, Berlin, Göttingen, Heidelberg.(in German)
Kollmann, F. (1956): Untersuchungen über die Querzugfestigkeit der Hölzer. Forstwissenschaftliches Centralblatt 75: 304-318. (in German)
Kollmann, F.; Schneider, A. (1960): The influence of the air velocity on the kiln drying of timber in mixtures of hot air and steam. Holz als Roh- und Werkstoff 18: 81-94.
Müller, U.; Grindl, W. Teischinger, A. (2003): Effects of cell anatomy on the plastic and elastic behaviour of different wood species loaded perpendicular to grain. IAWA journal, Vol. 24 (2): 117-128.
Niemz, P. (1993): Physik des Holzes und der Holzwerkstoffe. DRW-Verlag, Leinfelden-Echterdingen. Pedersen, M. U.; Clorius, C.O.; Damkilde, L.; Hoffmeyer, P. (2003): A simple size effect model for
tension perpendicular to the grain. Wood Science and Technology 37:125-140. Ravenshorst, G.; van der Linden, M.; Vrouwenvelder T.; van de Kuilen, J.W. (2004): An economic
method to determine the strength class of wood species. Heron Vol. 49 (4):297-326. http://heron.tudelft.nl
DIN EN 13183-1:2002: Moisture content of a piece of sawn timber. Determination by oven dry method. EN 338:2016: Structural timber. Strength classes. EN 408:2010: Timber structures. Structural timber and glued laminated timber. Determination of some
physical and mechanical properties.

Natural resources and bioeconomy studies 80/2017
71
3D FE-numerical modelling of growth defects in medium dense European hardwoods
A. Khaloian Sarnaghi1, Wolfgang F. Gard2, Jan-Willem van de Kuilen 1,2
Abstract
Structural wood-based materials such as glulam are widely used in larger spans for construction purposes. Generally made of spruce, there are other species in use such as beech, ash, oak as well as a number of more exotic hardwoods such as iroko. Anisotropy and inhomogeneity of each board can cause significant variations in the mechanical properties. In order to predict mechanical properties of lamellas for glulam, numerical models are developed. The models describe boards with local defects such as dead or live knots and fiber deviations around them. For simulations, ABAQUS and PYTHON programming language are used and two different sets of analysis are performed to predict the material behavior of the boards. Initially, effects of the knots and fiber deviations around these imperfections are simulated for ash and maple boards separately. The fiber deviations are applied in the form of local coordinates in to solid analysis, after performing a vector transformation. The boards are loaded in tension to predict the stress distributions around the imperfections. Fiber patterns, obtained from the simulations are validated comparing them to the ultrasonic and CT-scan images of the boards. Based on the results of the solid analysis, the strength of the boards is predicted. The results of the simulations are validated by comparing them to the strength values of the experimental results from tension tests. A promising correlation is found between both results, and regression equation is provided, through which the boards can be strength graded.
Introduction 1.In timber engineering, most research has been performed on softwoods as a basic component for glued laminated timber. Although mainly made of softwood species, hardwoods are also being used for these purposes. For the case of the softwood species there is large experimental databases available, covering mechanical (strength, stiffness, density) and geometrical properties (cross sections, knot sizes and locations) of the material. Different studies are performed starting from 1960’s for numerical investigations of softwoods. By development of the flow-grain analogy (Goodman and Bodig 1978, Phillips et al 1981) different 2D (Cramer and Goodman 1986, Cramer and Goodman 1982, Zandbergs and Smith 1987) and 3D models (Foley 2001, Hackspiel. 2010, Lukacevic and Füssl 2014, Guindos and Guaita 2013, Lang and Kaliske 2013, Baño et al 2010) have been created and the failure in the material has been predicted using different failure criteria, including Von Mises and Tsai Wu’s (Jenkel 2016, Jenkel and Kaliske 2013). Due to the lack of data for hardwoods
compared to softwoods, numerical studies are generally not performed for hardwoods. Recently, new studies are being performed for better prediction of the strength properties of these species including a classification system for tensile lamellas (Kovryga et al 2016). Corresponding author: Tel.: +498921806716; E-mail: [email protected]
1Wood Research Munich, Technical University of
Munich, 80797 Munich, Germany
2Faculty of Civil Engineering and Geosciences
Delft University of Technology Delft, The Netherlands
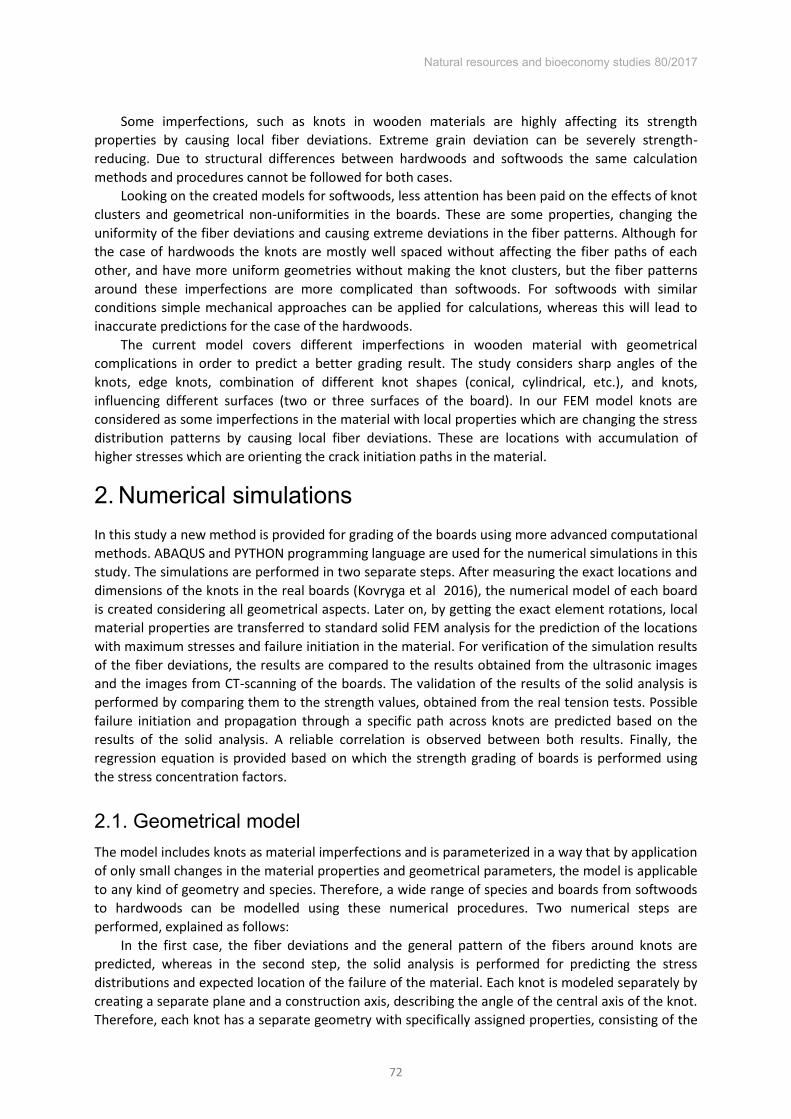
Natural resources and bioeconomy studies 80/2017
72
Some imperfections, such as knots in wooden materials are highly affecting its strength properties by causing local fiber deviations. Extreme grain deviation can be severely strength-reducing. Due to structural differences between hardwoods and softwoods the same calculation methods and procedures cannot be followed for both cases.
Looking on the created models for softwoods, less attention has been paid on the effects of knot clusters and geometrical non-uniformities in the boards. These are some properties, changing the uniformity of the fiber deviations and causing extreme deviations in the fiber patterns. Although for the case of hardwoods the knots are mostly well spaced without affecting the fiber paths of each other, and have more uniform geometries without making the knot clusters, but the fiber patterns around these imperfections are more complicated than softwoods. For softwoods with similar conditions simple mechanical approaches can be applied for calculations, whereas this will lead to inaccurate predictions for the case of the hardwoods.
The current model covers different imperfections in wooden material with geometrical complications in order to predict a better grading result. The study considers sharp angles of the knots, edge knots, combination of different knot shapes (conical, cylindrical, etc.), and knots, influencing different surfaces (two or three surfaces of the board). In our FEM model knots are considered as some imperfections in the material with local properties which are changing the stress distribution patterns by causing local fiber deviations. These are locations with accumulation of higher stresses which are orienting the crack initiation paths in the material.
Numerical simulations 2.In this study a new method is provided for grading of the boards using more advanced computational methods. ABAQUS and PYTHON programming language are used for the numerical simulations in this study. The simulations are performed in two separate steps. After measuring the exact locations and dimensions of the knots in the real boards (Kovryga et al 2016), the numerical model of each board is created considering all geometrical aspects. Later on, by getting the exact element rotations, local material properties are transferred to standard solid FEM analysis for the prediction of the locations with maximum stresses and failure initiation in the material. For verification of the simulation results of the fiber deviations, the results are compared to the results obtained from the ultrasonic images and the images from CT-scanning of the boards. The validation of the results of the solid analysis is performed by comparing them to the strength values, obtained from the real tension tests. Possible failure initiation and propagation through a specific path across knots are predicted based on the results of the solid analysis. A reliable correlation is observed between both results. Finally, the regression equation is provided based on which the strength grading of boards is performed using the stress concentration factors.
Geometrical model 2.1.The model includes knots as material imperfections and is parameterized in a way that by application of only small changes in the material properties and geometrical parameters, the model is applicable to any kind of geometry and species. Therefore, a wide range of species and boards from softwoods to hardwoods can be modelled using these numerical procedures. Two numerical steps are performed, explained as follows:
In the first case, the fiber deviations and the general pattern of the fibers around knots are predicted, whereas in the second step, the solid analysis is performed for predicting the stress distributions and expected location of the failure of the material. Each knot is modeled separately by creating a separate plane and a construction axis, describing the angle of the central axis of the knot. Therefore, each knot has a separate geometry with specifically assigned properties, consisting of the

Natural resources and bioeconomy studies 80/2017
73
rotation angle, density, kind of knot (live or dead), etc. Figure 1 shows a comparison between some hardwood and softwood species including different knot conditions and geometries.
As shown in figure 1, hardwoods are containing fewer knots compared to softwoods. Moreover, they are containing knots with more uniform geometries which are well distanced with respect to each other. Although less geometrical complications seem to ease the numerical calculations, more complicated fiber patterns are changing the conditions for these species making the simulations computationally more challenging. After the appropriate definition of wood as an orthotropic material, the geometrical model of wood is created for the analysis, described in parts 2.2 and 2.4 respectively.
Fluid analysis 2.2.Since the main fluid transport is occurring in the growing cells, an actual fluid flow exists around knots when the cells are growing (Goodman and Bodig 1980, Hu et al 2016). Using this theory for the first step of the simulations, the material model of wood is created including knots as material inhomogeneities. In this model and for further investigations these locations are considered as imperfections that are naturally included in wood and may vary among species from their geometrical and mechanical point of view. These are important parameters in wood, as they cause local fiber deviations and change the strength properties of the material.
Due to some differences in the number and combination of the knots among different samples, application of the same theories for different cases may lead to wrong predictions. Moreover, comparing softwoods to hardwood species, hardwoods have fewer knots with more non-uniform fiber patterns that are difficult to model using the simple numerical methods. Due to the geometrical complications and complexity of the fiber profiles around some imperfections, small deviations are visible from the uniform fiber paths in some locations. In contrast to softwoods where these locations are mainly the locations of the knot clusters or knots with geometrical complications, this condition is visible for most of the knots in hardwoods. Therefore, applying a more suitable numerical method can lead to better predictions of the mechanical behavior of the material under different loading conditions. Similar to the softwoods, the simulation results of the fiber profiles of hardwoods are also presented in a form, representing the general profile of the fibers through each board. These conditions are represented in figure 2.

Natural resources and bioeconomy studies 80/2017
74
Figure 1. Sample 2239, Spruce board with 29 knots a.1) Full board with location of knots, a.2) Combination of conical and cylindrical live knots with different axis, directions and properties, a.3) Side View of board with planes of knots. B) Sample 349 Ash with 3 knots, c) Sample 263 Maple with 4 knots
Figure 2. Sample 1225 Spruce, softwood fibre profiles from simulations. B) Sample 263 Ash, hardwood fibre profiles from simulations
As it can be seen in figure 2, in contrast to the uniform fiber profiles of the softwood species the fiber paths of the hardwoods are becoming more non-uniform around some knots.
a.1)
a.2)
a.3)
b)
c)
a)
b)

Natural resources and bioeconomy studies 80/2017
75
Comparison of the CFD results with ultrasound and CT-scan 2.3.data
In order to verify the simulation results of the fiber profiles, the results are compared to the ultrasonic and CT-scan images of the boards which represent the fiber profile in reality. An example of this comparison is shown in figure 3 and figure 4.
Figure 3. a.1) Softwood sample 2246 in reality, a.2) Ultrasound, a.3) fibre profiles. B) Hardwood sample 263, Ash and c) hardwood sample 345, Maple with ultrasonic images and simulation results
Figure 4. Comparison of the simulation results of Ash sample with the CT images in different planes
a.1)
a.2)
a.3)
b.1)
c.1)
b.2)
c.2)
Plane
Plane
Plane
Plane

Natural resources and bioeconomy studies 80/2017
76
In figure 3, a comparison is done between the simulation results regarding the fiber profiles and ultrasonic images for validation of the fiber profile. A reliable relation is visible between these both results.
As it can be seen in figure 4, CT-scan of the samples is performed for verification of the fiber paths in different depths and spatial directions. For this reason, different planes are created in different spatial directions and the results of the both cases of the simulations and the CT-scan images are compared to each other. Good relation is visible between the results of the fiber profiles in the simulations and the CT-scan images as well.
Solid analysis 2.4.In order to transfer the data to solid FEM analysis, a vector transformation is performed. The ratio of the velocities in each coordinate direction is calculated using equations 1, 2, and 3.
)arctan(y
zrot v
vx (1)
)arctan(x
zrot v
vy (2)
)arctan(x
yrot v
vz (3)
where represents the velocity vector in each spatial direction.
For these analyses, knots are divided into two groups of live and dead ones, and the properties of each case are applied separately. As dead knots do not have any connection with the surrounding bulk material, simulation of them as local holes in wooden geometry can simplify the conditions, and seem to represent the case well. Separate solid geometries with different material properties are defined for live knots. They are connected to the surrounding bulk material and influence the stress distribution and expected failure locations in the bulk material.
Figure 5. a) Sample 2248 softwood (Spruce) with pictures of the real board, ultrasound, fiber profile from the simulations, solid FEM results. b) Sample 210 hardwood (Ash) with pictures of the ultrasound, fiber profile from the simulations, solid FEM results. c) Sample 210 hardwood (Ash) with pictures of the ultrasound, fiber profile from the simulations, solid FEM results.
iv
a)
b) c)

Natural resources and bioeconomy studies 80/2017
77
Loading is applied as a uniform tension stress. Based on the results of the finite element analysis and the stress distribution profiles the results of different cases are compared to each other. Moreover, strength grading of the boards is also performed based on these results. Figure 5 represents the whole procedure of the simulations, from the initial images to the final solid analysis results. The locations of the knots are presented and are compared to the original boards.
Strength assessment and validation of the results 3.By getting the results of the simulations regarding the fiber profiles and by completing the solid analysis calculation, the stress distribution is obtained for the board. Simulations are performed by applying a uniform tension load to the boards. The stress distribution in the board is based on the dimensions and sizes of the knots, the angle of rotation, and the eccentricities. In order to be able to predict the strength properties of the material and compare and validate the results with the experiment, a single value is calculated from the simulations which cover these growth effects. For this reason, a straightforward parameter is defined for each single knot. This is a parameter, which can improve the strength grading of the boards, and can be used for the prediction of the weakest cross section of the board where failure is expected to be initiated.
For validation of the results, 14 hardwood boards are chosen randomly and the simulations are performed in three steps, as explained before. At the end, the simulation result of each board is compared to the experimental tension test results of the same boards.
Comparing the stress distribution patterns of the simulations with the strength values of the experiments, a regression analysis is performed to find the correlation, see figure 6. As expected, the simulation results and strength values of the experiments are inversely correlated to each other.
In addition, a high coefficient of determination is found between the simulation results and the board strength. Comparing this to the linear multiple-correlation analysis of the densities and modulus of elasticity, presented in table 1, higher R2-value for this analysis is showing a promising progress in strength prediction of the material, using the model, ackowledging that the quality of the prediction will decrease when more boards are being analysed.
Figure 6. Correlation between the strength results of the simulations and experiments

Natural resources and bioeconomy studies 80/2017
78
Table 1. Statistical results of the correlations for tensile strength grading of the boards (N= 14)
Model Summary: Strength and Simulation Result
Model R R-Square Adjusted R-Square
Std. Error of the
Estimation
1 ,916a ,905 ,816 9,21684
a. Predictors: (Constant), Simulation Result
Model Summary: Strength and Density
Model R R-Square Adjusted R-Square
Std. Error of the
Estimation
1 ,077a ,006 ,136 22,89393
a. Predictors: (Constant), Density
Model Summary: Strength and MOE
Model R R-Square Adjusted R-Square
Std. Error of the
Estimation
1 ,642a ,412 ,328 17,60207
Predictors: (Constant), MOE
Model Summary: Multiple Correlation
Model R R-Square Adjusted R-Square
Std. Error of the
Estimation
1 ,943a ,889 ,823 9,04139
a. Predictors: (Constant), MOE, Simulation Result, Density
Conclusion 4.The material model of wood, represented in this article is a model which is describing the hardwood properties in a more accurate way. This model is considering different aspects of the knots, affecting the fiber pattern and its deviation in different species. Moreover, consideration of different levels of geometrical and material complications is making this model applicable to different possible cases and species. Comparing the results of the fiber profiles in the simulations with the ultrasonic and CT-scan images, a reliable match can be observed. The results of the fiber distributions are transferred to solid FEM analysis after performing a vector transformation. The vector transformation is giving the opportunity to define a local coordinate system for each element in solid analysis. This is giving the possibility for applying local material properties in the simulations. The results of the solid analysis are summarized by the stress distribution of each board. Based on the results of the simulations, different boards are compared to each other and also they are compared to the strength values of the tests. Performed statistical analyses are validating the simulation results and are showing promising methods for grading of the boards. It is expected, however, that by extending the dataset, the correlation factor will decrease.
Natural resources and bioeconomy studies 80/2017
79
References Baño V, Arriaga F., Soilán A., Guaita M. 2010. F.E.M. analysis of the strength loss in timber due to the
presence of knots. World Conference on Timber Engineering, Riva del Garda, Italy, ISBN: 978-88-901660—3-7
Cramer S.M., Goodman JR. 1982. Model for stress analysis and strength prediction of lumber. Wood and Fiber Science. 15(4): 338-349
Cramer S.M., Goodman JR. 1986. Failure modeling: A basis for strength prediction of lumber. Wood and Fiber Science. 18: 446-459
Ferziger J.H., Peric M. 2002.Computational methods for fluid dynamics. 3rd Edition. Springer Verlag. 2-540-42074-6
Foley C. 2001. A three-dimensional paradigm of fibre orientation in timber. Wood Sci. and Tech., 35: 453–65
Goodman JR., Bodig J. 1978. Mathematical model of the tension behavior of wood with knots and cross grain. Proc. First Int. Conf. On Wood Fracture, Banff. Alberta
Goodman J.R. and Bodig J. 1980. Tension behavior of wood − an anisotropic, inhomogeneous material. Structural research report No. 32. Colorado State University, Fort Collins.
Guindos P, Guaita M. 2013.A three-dimensional wood material model to simulate the behavior of wood with any type of knot at the macro-scale. Wood Sci. and Tech., 47: 585–599
Hackspiel. 2010. A numerical simulation tool for wood grading. Dissertation, Vienna University of Technology
Hu M., Briggert A., Olsson A., Johansson M., Oscarsson J., Säll H. 2016. Three dimensional growth layer geometry and fiber orientation arount knots-A laboratory investigation. World Conference on Timber Engineering, Vienna, Austria
Jenkel C. 2016. Structural and material inhomogenities in timber, Modelling by means of the finite element method. Dissertation, Technische Universttät Dresden
Jenkel C., Kaliske M. 2013. Anlayse von Holzbauteilen unter Berücksichtigungstruktureller Inhomogenitäten. Bauingenieur 88, 494-507
Kovryga, A.; Stapel, P.; van de Kuilen, J.-W. 2016. Tensile strength classes for hardwoods. INTER-3rd Meeting, Graz, Austria.
Lang R. and Kaliske M. 2013. Description of inhomogeneities in wooden structures: modelling of branches. Wood Sci. and Tech., 47:1051−1070.
Lukacevic M. and Füssl J. 2014. Numerical simulation tool for wooden boards with a physically based approach to identify structural failure. Eur J Wood Prod, 72:497−508.
Phillips GE., Bodig J., Goodman JR. 1981. Flow-grain Analogy. Wood Science 14: 55-65 Zandbergs J.G., Smith F.W. 1987. Finite Elements fracture prediction for wood with knots and cross
grain. Wood and Fiber Science. 20: 97-106

Natural resources and bioeconomy studies 80/2017
80
Session II Markets, sustainability, and value chains of hardwood cluster

Natural resources and bioeconomy studies 80/2017
81
Current and future products as the basis for value chains of birch in Finland
Erkki Verkasalo1, Henrik Heräjärvi2, Veikko Möttönen1, Antti Haapala2, Hanna Brännström3, Henri Vanhanen1, Jari Miina1
Abstract
Birch-based value chains have stayed rather unchanged during the last two decades. In Finland, plywood, pulp, wood-free papers and paperboards together with sawn goods, flooring materials, furniture, facing veneers, firewood and forest residues as chips have formed the backbone for the birch uses. Valuable specialty handicraft products utilizing, for example, curly-grained or flame-grained birch have relatively small economic importance but considerable image value for birch. The most significant changes in business can be seen in the networks of primary and further manufacturing enterprises, distribution and sales companies and supplying practitioners, diversification of product segments within each sub-sector and in resources and sourcing of raw materials and primary products. Some new products such as thermally treated wood and sap products from birch have already been introduced to the market. Global competition has become stronger especially in plywood (Russian production) and fine papers (eucalypt pulps). Distribution and manufacturing chains have also changed much in the solid wood products and furniture. Current trends suggest that new innovative value chains based on side streams of primary industries and specialty products relying on the unique chemical or physical characteristics of birch are growing. Biorefinery processes provide new fibre-based products and advanced liquid and solid fuels as well as specialty chemicals for both large-volume techno-chemical industries and specialized industries in health and well-being sector, where the products are used as a variety of functional effective agents. Birch bark has shown a similar potential. Nature-based non-wood forest products, such as natural sap liquids and their derivatives, or high-value specialty mushrooms growing on stems, for example Pakuri based products, provide new value chains for human well-being as well. Traditional wood products have found new pathways in further-processed products, such as veneer in safety and credit cards, plywood in design-shaped furniture and sawn wood or plywood in antimicrobial interior products. In this paper, we present a state-of-the-art on birch products as a basis for value chains in Finland and discuss the market-driven trends, stressing new innovative value chains for the next decade. We provide an insight on the prospective development of birch product palette and role of raw materials as well as value networks and market and supply players.
Introduction 1.European silver birch (Betula pendula Roth) and pubescent birch (Betula pubescens Ehrh.) make up a considerable hardwood resource for forest products in northern Europe, Baltic Countries, Poland, Belorussia and Russia (e.g., Verkasalo et al. 2007). In Finland, birch species make up of 15% of the total wood volume and more than 80% of the hardwood volume (Natural Resources Institute Finland 2017).
Corresponding author: Tel.: +358295323020; E-mail: [email protected]
1Natural Resources Institute Finland (Luke)
Bio-based Business and Industry Natural Resources
and Bioproduction Joensuu, Finland
3Natural Resources Institute Finland (Luke)
Bio-based Business and Industry
Kokkola, Finland
2University of Eastern Finland (UEF)
Wood Materials Science Programme
Joensuu, Finland

Natural resources and bioeconomy studies 80/2017
82
Both birch species have been used for plywood, veneers and lumber and their further products and firewood more than 100 years, but also for pulping, paper and paperboard manufacturing since the 1960’s and advanced conversion for bioenergy from forest chips and side streams of mechanical
wood processing since the 1970’s (Luostarinen and Verkasalo 2000). During the recent ten years,
new innovative value chains of value-added raw materials and products have been initiated, and partly established for birch. They rely on new ways and aims of further processing of wood products, utilizing side streams of primary industries and specialty developing products relying on the unique chemical or physical characteristics of birch. Traditional wood products have found new pathways in further-processed products, such as veneer in safety and credit cards, plywood in design-shaped furniture and sawn wood or plywood in antimicrobial interior products.
The development on wood-based biorefinery scene in Finland is progressing fast, and there are plans to build many industrial plants of different technologies and scales in the near future. Biorefinery processes provide new fibre-based products as well as advanced liquid and solid fuels. Various technologies are also applied to manufacture specialty chemical raw materials and products for both large-volume techno-chemical industries as well as for specialized industries in health and well-being sector. Here, similarly to other species, birch products are used mainly as functional effective agents in the actual final products. Nature-based non-wood forest products, such as natural sap liquids and their derivatives, or special mushroom-based products provide new value chains for human well-being as well.
In Finland, birch industries typically obtain their raw materials through so-called shared supply chains where all timber from different species in individual logging stands is allocated to several mills or processes using one harvesting operator (Niemistö et al. 2008). Birch wood is normally supplied to 2-6 different processes or mills. Most of the birch wood is procured from Finnish private forests, timber trade and sourcing being key elements for well-functioning supply (Hynynen et al. 2010). In parallel, birch pulpwood and plywood logs have been the most imported timber assortments for the Finnish forest industries, the wood coming mostly from European Russia (e.g., Verkasalo et al. 2007). In the future the industries are counting largely on domestic birch raw materials due to the growing birch resources and well established procurement. Chemical biorefining and health and well-being sectors are also interested in the side streams of other birch processing industries.
Wood and timber quality of birch has undergone big changes during the last decades when birch-dominated timber stands have become rare and most birch is harvested from softwood dominated forests (Luostarinen and Verkasalo 2000, Niemistö et al. 2008). Birch raw materials from plantations (silver birch) and drained peatlands (downy birch) are increasingly entering the roundwood market, and competition on birch for different uses is growing. This alters the potential for qualities, raw material costs and added value, and may reflect in the product and marketing strategies and technology development needs among the birch industries.
Demand of Finnish birch-based products has been heavily dependent on export markets (Verkasalo et al. 2007). Plywood, veneer and all paperboards are typical export products, whereas bioenergy products, certain pulp grades and home and office furniture are typically sold to domestic markets. The composition of customers and the palette of end-products are under progress among the existing birch industries. The market and customer structure of the new product groups may be complex, consisting of both business-to-business and business-to-consumer approach; anyway, they differ considerably from the business as usual. As a result, they affect crucially the potential and needs of product, processing, marketing and distribution development.
In this paper, we present a state-of-the-art on birch utilization and value chains in Finland and discuss the market-driven trends, stressing innovative new value chains for the next decade. We provide an insight on the prospective development of value networks, composition of market and supply players, product palette and raw material benefits and drawbacks of birch. Scientific literature and expert viewing are our main sources of information, added with selected commercial materials from internet and discussions with professional among birch industries during the last 10 years. With

Natural resources and bioeconomy studies 80/2017
83
this approach, we aim to activate players among scientific forum, industries and public development sector to innovate, benchmark and promote new uses for birch-based raw materials and products and advanced manufacturing processes and formulate value networks, player profiles and future markets for the future. It should be noted that we exclude solid bioenergy products from the discussion.
Value chains – well-established 2.
Wood product based 2.1.Due to the wide availability of birch, as well as its multiple-use wood properties, birch made artefacts have a very long and versatile history in Finland. Birch has been and still is a common species in furniture, cabinetry, floorings, tool handles, sport equipment, and various household items. Its advantages include uniform light colour, good machinability, ease of finishing, good mechanical performance, lack of smell/odour, and small differences between corewood and outer wood. On the other hand, there are shortcomings in stem straightness of birch caused by its sympodial growth (e.g., Heräjärvi 2001, Niemistö et al. 2008), tendency of pith-enclosed wood to discolour in mature trees (Hallaksela and Niemistö 1998), poor resistance of wood against micro-organisms (e.g., Verkasalo 1993) as well as relatively high swelling and shrinkage, especially in tangential direction and low tensile strength in relation to weight (Luostarinen and Verkasalo 2000).
Industrial use of birch wood was first boosted by the development of sewing machines in the 19th century: the reels-of-thread were made of birch and at its highest Finland covered as much as 80% of the reel-of-thread world market in the1920’s (Jalava 1949), until birch wood was replaced
with plastics later in the century. Birch furniture design and manufacturing knowhow emerged during the 20th century as a result of world-famous Finnish designer and architect Alvar Aalto, who developed his most famous furniture series of birch and grounded his design and engineering innovations on extensive experimental wood testing work. His furniture, typically based on bent clear birch components, have been successfully manufactured for more than 70 years now (ARTEK).
The volume of sawn birch timber has remained at a stable level of 40,000-60,000 m3 per annum for some decades, consuming 100,000-150,000 m3 of logs, respectively (Natural Resources Institute Finland 2017). Only large sized and high quality logs are processed in sawmills nowadays. Small-sized logs were sawn 20 years ago as a result of temporary market created by IKEA for knotty birch, but the demand went down in some years. Currently the knot free or mildly knotty birch lumber ends up in furniture (visual and/or hidden load carrying components, glulam boards), parquetry, and floor planks. Solid birch wood suits to and is used in thermal modification (e.g., Lekounougou et al. 2011) and thermo-mechanical (e.g., Möttönen et al. 2015a, b) modification processes. These treatments darken the colour of birch wood and improve its dimensional stability, which is a challenge in unmodified birch.
Industrial production of birch plywood started more than 100 years ago in Finland (Jalava 1949). Nowadays Finland is the largest hardwood plywood producer in Europe, and plywood industries use 80-90% of the log sized birch timber in Finland (Natural Resources Institute Finland 2017. The seven operating plywood mills owned by companies UPM, Metsä Wood, Koskisen and Riga Wood Finland produce 300,000-500,000 m3 of customer quality birch plywood from around 0.8-1.2 Mm3 of logs and, with an export value of 500-1,000 million Euros per annum (Natural Resources Institute Finland 2017). Main end uses of birch plywood are in transport vehicles (buses, trains, vans, lorries, truck load container floors), liquefied natural gas (LNG) carrier ships, interior furniture, and structural applications. Birch plywood can be coated with a phenol or melamine film to increase its wear and weather resistance, durability, and hardness according to the customer demands. Plywood is the biggest single birch derived product group if measured by the value of production or export income in Finland. The best quality and largest birch logs are used in facing veneer production, the total

Natural resources and bioeconomy studies 80/2017
84
output of the veneer mills being some thousands of cubic metres. Now, there is only one particleboard and one fibreboard mill in Finland, both mainly basing their raw material supply on softwoods. Birch side streams from plywood, veneer and saw mills mostly end up to pulp production (wood chips) or heat and power plants (dry wastes, saw and grinding dust). Off-cutting and clipping wastes, and saw and grinding dust are used to some extent in particle board production. However, good statistics are not available on the supply and uses of different by-products from birch product industries, especially from the further-processing industries.
High-value special forms of birch, such as curly-grained Karelian birch (Betula pendula var. carelica) and flame-grained birch (special grain pattern occasionally appearing in mature B. pendula) provide rare but very valuable birch based value chains for little companies, private forest owners, or hobbyists (see: Hintikka 1941, Kosonen 2004). Industrial production of these specialties has not been established due to the insecure raw material supply chains (Viherä-Aarnio and Hagqvist 2017).
Some threats and various opportunities can be identified for birch product manufacturing and markets in Finland. Russian Federation, being supported by its vast birch resources and low-cost roundwood in comparison to Finland or the entire Baltic Sea region, has actively developed birch plywood and sawmilling industries. One advantage for the Russian companies is low-cost labour, which enables a labour-intensive approach in production, such as customizing and tailoring single product items according to the customer needs, which is not often possible in highly automatized industrial scale production. In Finland, the production is mostly focused to serve customers with large volume orders or stable long-term contracts.
While having the advantages of low cost labour and roundwood, there are considerable challenges in terms of roundwood logistics, overall accessibility of log supply, economic and ecological risks involved in investments and operating environment, and brand management in Russia. Finland, on the contrary, is relatively stable, secure and predictable country for industrial investments, and most importantly, Finnish plywood producers have a good reputation among the main customers. In order to maintain the frontline position, the Finnish plywood industries have to foster the remaining competitive advantages: customer service, trustworthiness, research and development driven innovativeness, and product quality.
Pulp based 2.2.
2.2.1. Pulping processes Mechanical pulping methods mainly use softwood as a raw material but in high yield pulps such as bleached chemi-thermo-mechanical pulp (BCTMP) hardwoods also occur ((Alén 2015). In CTMP products hardwoods compete with softwood feedstock due to their good properties including stiffness and dimensional stability (Pöyry). Chemical pulping accounts for about 70% of the total worldwide pulp production and approximately 90% of chemical pulps are produced by the Kraft process and its modifications. Birch (Betula pendula and B. pubescens) are the dominant hardwood species in Northern European countries (especially in Finland and Russia) used for pulp production (Miranda et al. 2013). Birch species are not separated in the production. Their properties differ slightly for yield but little in the important fibre characteristics (Hakkila and Verkasalo 2009), Several pulp mills operating in Finland convert hardwoods to pulp, but there has been some decrease in production volumes over the recent years. During the last 10 years, total production of hardwood pulps has been between 2.5 and 3.5 million tons a year of which more than 90% are birch-based pulps (Finnish Forest Industries Federation 2017). The production has consumed on average 12 Mm3 of roundwood a year (annual range 8.7-13.6). Imported roundwood, with a large majority coming from Russia, has vitally contributed to the supply with an average share of 39%, however, ranging annually between 26% and 54% (Natural Resources Institute Finland 2017).

Natural resources and bioeconomy studies 80/2017
85
Metsä Group produces Kraft hardwood pulp from birch and aspen at their Kemi unit for tissue and fine papers and also linerboard. Their old Äänekoski Kraft mill also produces hardwood pulp but the site will soon be closed and replaced with a novel bioproduct factory in which 2 Mm3 of birch will be processed each year. BCTMP mill in Kaskinen uses mostly hardwood for boards and book, tissue and specialty papers. Powerflute (Savon Sellu) in Kuopio is also an active user of birch in semi-chemical pulping that supplies their own fluting materials manufacture. Stora Enso uses birch to produce both bleached hardwood Kraft pulp and dissolving pulp (ca. 1 Mm3/a at Enocell mill), Kraft pulps also in Kemi, Heinola and Imatra. UPM has Kraft mills converting birch in three Finnish mills of Kaukas, Kymi and Pietarsaari to supply their own manufacture of packaging and carton boards, tissues, specialty papers and wood-free uncoated and coated printing and writing papers. In addition to the confirmed investment projects in Äänekoski and capacity adding projects in some other mills, plans of three green-field pulping-based biorefineries are progressing now, but these mills should rely on processing softwoods.
2.2.2. Papers and paperboards Total annual production of printing and writing papers in Finland has decreased to 5.5 million tons in 2016 since the peak year 2006 (over 10 million tons) (Finnish Forest Industries Federation). There are estimates that it will decrease further into 3.7 million tons by 2030 (Pöyry). Also, the production of other paper grades has decreased. Instead, paperboards show increasing trends due to the increasing demand of packaging materials. Hardwood pulps contribute to different fibrous products typically providing better softness and higher smoothness than softwood fibres. Chemi-mechanical hardwood fibers improve the absorption capacity of industrial and household towels and tissues. The high number of short fibre gives paper products good formation and desired surface properties, softness and uniform pore size distribution that allow high quality imprint formation. BCTMP fibre improves the bulk, stiffness and opacity of various paper products compared to chemical pulps. High-yield hardwood pulps are more photo-stable than softwoods, therefore desirable for many fine paper applications (Fjellström et al. 2007). Birch pulps bring high stiffness and uniformly white printing surface for packaging materials (Alén 2015).
2.2.3. Derivatives of cellulose and hemicelluloses Cellulose from dissolving pulping, i.e., pre-hydrolysis Kraft, acidic sulphite and multistage sulphite processes, are commonly used in the manufacture of cellulose derivatives (cellulose esters and ethers), and regenerated celluloses (Gullichsen and Lindeberg 2000). For example, viscose, rayon, lyocell and cellophane are obtained from cellulose xanthate intermediates (Alén 2015). The only producer of dissolving pulp in Finland today is Stora Enso Oyj (Enocell), their birch originating almost exclusively from Finland and Russia. Their dissolving pulp is used by their customers in the production of viscose fibre for the textile industries.
The products of dissolving pulp are widely used in various industrial products, such as textiles, tires, coatings, paints, and tobacco products, as well as food and pharmaceutical products (Duan et al. 2015). Cellulose esters with inorganic and organic acids were the first covalently modified cellulose derivatives on the market. The main derivatives counted to this group are cellulose nitrate, cellulose acetate and cellulose xanthogenate (Strunk 2012). Cellulose nitrate and acetate have found applications and markets in plastics, lacquers, adhesives, films, fibres and explosives. Alkyl cellulose (AC), methylcellulose (MC), hydroxypropylmethylcellulose (HPMC), hydroxyethylcellulose (HEC) and carboxymethylcellulose (CMC) are some of the cellulose ethers with varied end uses in food products, lubricants, pharmaceuticals, cosmetics, cleaning solutions, and other household products

Natural resources and bioeconomy studies 80/2017
86
as hypo-allergic and green thickeners, stabilizers and binders (Kamel et al. 2008, Wang 2009, Nasatto et al. 2015).
Preparation of viscose, which is one of the most common derivatives of dissolving pulp, requires enormous quantities of water, and the required reactions with carbon disulphide (CS2) cause substantial emissions. Another disadvantage is the generally poor fibre quality. More recent and environmentally friendly method to produce fibres include the Lyocell process (Berger 1994) or Tencel process (Davies 1993), while several methods using, for example, ionic liquids or deep eutectic solvents (DES) are currently under investigation (e.g., Sixta et al. 2015).
We should also recall also xylitol extracted from birch, which is categorized as a polyalcohol or sugar alcohol. Multiple studies utilizing electron microscopy have indicated that xylitol is effective in inducing remineralization of deeper layers of demineralized enamel, providing antiplaque and antigingivitis effects and reducing the incidence of acute middle ear infection in healthy children; therefore, xylitol is used in chewing gum, lozenges, nasal sprays, etc. (Steinberg et al. 1992, Miake et al. 2003, Azarpazhooh et al. 2011). Industrial production starts from xylan (a hemicellulose) which is hydrolyzed after extraction into xylose and catalytically hydrogenated into xylitol (Converti et al. 1999). Production of birch xylitol has so far been closed down in Finland, and replaced with a synthetized product manufactured in other countries.
Value chains – novel and future 3.
Building and living with birch wood 3.1.Despite of the high average flexural properties (e.g., Heräjärvi 2004a), hardness (Heräjärvi 2004b, Möttönen et al. 2004) and most other mechanical properties of birch wood (see: Jalava 1945), there is no production of structural birch lumber or glulam beams. This is caused by the large board-to-board property variation, especially in tensile strength, limited resistance against weather and lack of methods and non-destructive devices that could reliably grade the lumber by strength (Niemistö 2008). As soon as birch lumber can be strength graded, a range of new possibilities will arise in architecture and structural design. Solid or glued structural members from birch would allow visually ambitious wooden structures (longer spans with similar dimensions, more slender dimensions with similar spans, bent structures) that are too expensive or simply cannot be accomplished using softwoods. As learned from the furniture industries, birch suits perfectly to bent structures, which is a fascinating opportunity from the viewpoint of glulam beam manufacture and subsequent design options. Structural birch components would be desirable especially in keeping with applications where they are subjected to compressive or bending stresses. Birch plywood also suits to indoor structural applications, but its relatively high price hinders the use. Recently, Finnish furniture manufacturer ISKU Ltd. brought thermo-formable birch plywood into market. We expect that the resin chemistry and bonding techniques (lignin based resins, friction “welding”) play a key role in the
future of birch plywood product development. The currently renewing fire regulations in Finnish building legislation will allow slightly more
liberal use of wood in visible surfaces that facilitates the use of modern wooden construction products such as cross-laminated timber (CLT) and laminated veneer lumber (LVL), both having rapidly increasing production volumes in Finland. These products are currently made solely from softwoods, but birch has been considered and tested, too. CLT or LVL with birch interior surface provides the structural element with a different visual character compared to pine or spruce, and when combined with new finishing or modification methods the number of potential applications increases further (e.g., Pulkkinen 2016). Birch interior surfaces have, however, not only positive effects compared to softwoods. For example, the acoustic, moisture buffering, and thermal properties are not as favourable as in softwoods that have a lower density than birch.

Natural resources and bioeconomy studies 80/2017
87
Although thermal modification is mainly used for improving the properties of softwoods, it is also used for modifying of hardwood materials. Regarding birch, the main desirable changes in wood material are colour darkening and improved dimensional stability (International Thermowood …
2017). Thermal modification causes depolymerisation of the carbohydrates and especially hemicelluloses, which is the main reason for the changes in wood properties (Tjeerdsma et al. 1998). The changes are the stronger the higher the treatment temperature. As a result of degradation of hemicelluloses and acid hydrolysis the amount of hydroxyl groups is reduced, increasing hydrophobicity of wood (Pétrissans et al. 2003). The main products of thermally modified birch are interior furniture and surfacing products such as parquetry. A recent innovation is the combination of thermal modification with mechanical compression of wood, i.e., thermo-mechanical modification, which substantially decreases the spring-back phenomenon usually occurring in wood after compression (Laine et al. 2016, Möttönen et al. 2015a). Thermo-mechanical modification also increases the surface hardness and flexural properties of both hardwoods (Möttönen et al. 2015b) and softwoods (Sarpong 2017), and practically eliminates the case hardening problem (Marttila et al. 2017). This novel product was lately introduced in restaurant and sauna complex called Löyly in Helsinki, where the raw material of part of the interior panels is small dimensioned, thermo-mechanically modified birch glulam board (www.loylyhelsinki.fi). The manufacturing process of the panels uses a joint with lamellae planed into a crown shape and glued under mechanical compression and slight heat treatment.
Birch has also retained its place as a raw material for high-added-value wood products like parquet flooring, where hardness and wear properties improved by novel wood modification processes may be advantageous (Möttönen et al. 2015a,b). Artisans and craftsmen have continued the furniture design started by Alvar Aalto with new and innovative product lines based on birch wood (e.g., Studio Haekkinen 2017). The versatile properties and good machinability of birch enables its use for designed and shaped furniture and utility articles as either solid wood or composite based solutions. New pathways were recently found also in very specialized smart products, such as using veneer in safety and credit cards. High-end product categories also support the development of industrial production of valuable special forms of birch, such as flame-grained birch and curly-grained birch, the latter also being actively cultivated in Finland for decades already, thus securing raw material availability (Kosonen 2004, Viherä-Aarnio and Hagqvist 2017).
In the new product applications wood often makes up a hybrid with other materials, such as concrete, stone, metals, glass, and plastics. Combining wood with other materials provides the products with new features and properties. With the new characteristics, the cost-effectiveness of products can also increase. However, the ways to re-use or recycle the material become more challenging, which may turn out to be an essential feature in the adoption of bio-circular solutions. In the wooden furniture products, a new innovation is antimicrobial surface, developed by ISKU Ltd., which is based on natural copper and silver technology (ISKU 2017). This technology actively prevents contaminations and reduces the spread of infections. Studies have shown 80% less contamination on copper surfaces than non-copper equivalents (e.g., Grass et al. 2010).
Chemical biorefinery products 3.2.
3.2.1. New fibre-based products The leading pulp and paper producers have introduced composite materials in which sulphate pulp is mixed together with the plastic materials (mainly polyethylene PE or polypropylene PP) (Pöyry). The advantage of this approach is that pulp is 50% cheaper than PE or PP. In many applications pulp also improves the strength properties. For now, the volume of consumption of Kraft pulp in composite applications is small but it might increase in the future. Kraft and dissolving pulps are also considered as potential raw materials for different micro- and nanocelluloses with current and future
Natural resources and bioeconomy studies 80/2017
88
opportunities across a wide range of markets, including paper and paperboard, composites, biopackaging, coatings, films, healthcare, textiles, filtration, rheology modifiers, aerogels, 3D printing, and the printed and flexible electronics.
Cellulose nanocrystals were found in 1950 by Rånby and Ribi, who managed to produce stable suspension of colloidal cellulose crystals via the sulphuric acid hydrolysis of wood and cotton cellulose. Since then, an increasing number of researchers have studied such materials, with hardwood pulp or dissolving pulp being common raw materials (Lavoine et al. 2012). Wood-derived nanocelluloses can be classified in two main classes based on their dimensions, functions, and preparation methods: nanofibrillated celluloses (NFC) and cellulose nanocrystals (CNC) (Abdul Khalil et al. 2014).
Nanofibrillated celluloses (NFC) are produced from cellulosic materials using mechanical treatment usually following chemical or enzymatic treatments. They exhibit both amorphous and crystalline parts and present a web-like structure and the term microfibril or nanofibril is generally used to describe 2-10 nm fibrous cellulose structures with the length of several tens of microns. Microfibrillated cellulose (MFC) is typically in the range of 20-50 nm, since MFC usually consists of aggregates of cellulose microfibrils. Subjected to acid hydrolysis, cellulose microfibrils undergo transverse cleavage along the amorphous regions resulting in a material with a relatively low aspect ratio (length to width ratio) referred to as cellulose whiskers or cellulose nanocrystals (CNC). The typical diameter of these whiskers is around 2-20 nm and the length from 100 to 600 nm (Bajpai 2011).
3.2.2. Liquid and processed fuels Only few second-generation biofuels, such as ethanol and butanol, are produced from lignocellulosic feedstock through the biochemical process (Chapter 3.2.3), whereas all the other 2nd generation fuels are produced thermo-chemically (Singh and Singh 2011). The advantage of thermal conversion methods is that they can be readily applied to wood waste resources and to various by-products of pulping (Alén 2015). Thermochemical production of biofuels begins with gasification or pyrolysis. The syngas resulting from gasification requires catalytic conversion according to the Fischer-Tropsch process to produce hydrocarbon fuel (Alén 2015, Singh and Singh 2011). Bio-oils from pyrolysis can replace heavy or light fuel oil at heating plants and in industrial steam production (Fortum Ltd.). Emerging alongside these applications is the use of bio-oil to power marine diesel engines. In the near future, bio-oil can also be upgraded into transportation fuels. Numerous interesting applications may be found in the chemical industries as well.
The current bio-oil processes in use as well as the new planned processes may use both softwoods and hardwoods, with some raw material related designs or specifications. In Finland, softwoods are their main raw materials, but also hardwoods, such as birch, aspen, alders, willows etc. are used. Bio-oil has been produced since 2013 in a combined heat and power plant (CHP) in Joensuu from wood-based raw materials like forest residues, wood chips or sawdust using fast pyrolysis technology (Fortum Ltd.). The plant was the first of its kind in the world. The Finnish investor, North European Bio Tech Oy, associated company of SOK Corporation and energy company St1, built in 2015 the world’s first production facility of bioethanol from wood sawdust (St1). Their Cellunolix® ethanol plant in Kajaani uses sawdust from local saw mills to supply the current production capacity of 10 million liters of bioethanol per year. NEB has plans to build a larger Cellunolix® ethanol plant to Pietarsaari and to increase the production capacity of the Kajaani plant.
Several installations based on commercial gasification and pyrolysis technologies are currently under development, but many of them face issues with insecure operational conditions due to European policies seeking to affect carbon balance and use of biomass for fuel products (Eickhout 2017). This view poses severe implications on fund raising and market prospects for the investments among the respective companies. A large investment plan in Kemi, Northern Finland, aims to build a

Natural resources and bioeconomy studies 80/2017
89
second-generation biorefinery to produce biodiesel and bio-petroleum from wood-based biomass, such as small-sized wood, harvesting residues and stumps, sawdust and even leftover bark from the forest industries (Kaidi Finland Ltd.). Green Fuel Nordic Ltd. concept is based on utilizing pyrolysis technology to produce bio-oils from forest-based biomass using technology from BTG BioLiquids B.V. (GFN). In the near future, the company plans to build several biorefineries close to the Finnish feedstock.
3.2.3. Value-added specialty chemicals from sugars of birch Many important building-block chemicals (platform chemicals) can be produced from wood-derived sugars via biochemical or chemical conversions (Viikari and Alén 2011). These biochemicals can be subsequently converted into a wide range of high-value derivatives or used for synthetic materials using the biochemical transformation (feedstocks > hydrolysis > sugars > fermentation > chemicals), whereas chemical conversions predominate in the conversion of platform chemicals into derivatives and intermediates. Other biorefinery platforms are syngas (thermochemical), together with biogas (anaerobic digestion) and extractives (Chapters 3.2.2 and 3.2.4). Examples of fermentation products of glucose include alcohols (e.g., ethanol, butanol), carboxylic acids (e.g., acetic acid or lactic acid), and other products (e.g., amino acids, antibiotics and enzymes - Alén 2011). These chemicals can also be used as monomers for polymer synthesis or as precursors for the production of other chemicals, for example, through the addition of oxygen- or nitrogen-containing functional groups.
Among the most attractive raw materials for the production of value-added specialty chemicals are the different side-streams of forest industries (Chapter 3.2.4.). Especially birch bark has chemical components that have potential to be used in high-value products.
3.2.4. Other Side-stream utilization schemes With respect to by-products from future pulp mills, only chemical pulping is of economic importance, although the recovery of dissolved organic materials from semi-chemical and chemi-mechanical pulping is possible by similar methods as those generally applied to spent liquors from chemical pulping (Alén 2015). Black liquor (BL) composed of degradation products of lignin and polysaccharides in addition to minor fractions of extractives, forms the most significant by-product of Kraft pulping (Alén 2015), and approximately half of the total organics present in BL is lignin. Birch wood has lignin content of 20-25% (Alén 2000) of which almost 90-95% is degraded and solubilized in BL (Kumar 2016). The most common method for separation of lignin is precipitation by acidification from pH 13 to less than 10 (with strong mineral acids), or carbonation (passing CO2 with reduced pressure).
Recently, the most effective industrial-scale process for a partial recovery of pure lignin by carbonation is known as the LignoBoost process (Alén 2015, Kumar 2016). Lignin can be processed to a wide range of products, such as solid and liquid fuels, low-cost carbon fibre, activated carbon, resins for the plastic industry (“phenol mixtures”), and many other straightforward applications (e.g.,
binders, emulsifiers, surface and dispersing agents). Still, the easiest low cost use of the continuous bulk production of lignin (e.g., LignoBoost lignin) is still as a biofuel in the form of powder, pellets, or mixed with other fuels. Recent technology update from SCA enables the conversion a lignin fraction from BL also into renewable petroleum and diesel (SCA 2016).
Large amounts of carboxylic acids, both volatile (e.g., acetic and formic acids), and non-volatile hydroxy monocarboxylic and hydroxy dicarboxylic acids (e.g., glycolic and lactic acid) exist in BL due to carbohydrate degradation in the form of sodium carboxylates (Kumar 2016). The recovery of aliphatic carboxylic acids presents a complicated separation problem currently achieved only on a laboratory scale (Alén 2015, Kumar 2016). Aliphatic carboxylic acids such as formic, acetic, lactic, and glycolic acids are commercially important chemicals and are now being produced by alternative

Natural resources and bioeconomy studies 80/2017
90
methods. Hydroxy acids can be converted into corresponding derivatives, such as polycarboxylic, and the reaction products can be used as sequestering agents, tensides, and emulsifying agents, additives in plastics, surface treatment agents, and potential raw materials for the synthesis of chemicals.
The importance of acid sulphite pulping has clearly declined during recent decades (Alén 2015). It is technically possible to produce a variety of useful products from sulphite-spent liquors. These products include lignosulfonates (amount in birch black liquor is ca. 435 kg/ton of pulp), and carbohydrates (380 kg/ton of birch pulp, out of which monosaccharides 305 kg/ton). Hence, with the respect to a sugar platform, acid sulphite pulping would offer attractive possibilities as lignosulphonates are useful in such applications like dust control, crop protection, concrete admixture, leather tanning, especially because of their adhesion and dispersion properties (Alén 2011, Sappi).
Regarding the utilization of extractives, birch bark seems to be one of the most promising raw material options, but, at present, they are mainly burned for energy production (Gandini et al. 2006). Bark generally contains high quantities of extractives, which possess unique biological and therapeutic properties. These bioactive molecules are readily available through eco-friendly extraction processes using mild organic or aqueous solvents (Royer et al. 2012). Controlled and optimized extraction of extractives, for example, from residues prior to their use as combustible material represents an essential path leading to added intrinsic value.
Birch bark has special physical properties, which allows separation into inner and outer bark fractions by flotation in water, even in an industrial scale. Birch roundwood contains about 3.4% of outer bark and about 8% of inner bark (Pinto et al. 2009, Holmbom 2011). A birch Kraft pulp mill, with an annual pulp production of 400,000 ton/year generates about 28,000 ton of outer bark. Outer bark of Silver birch (B. pendula) is composed of about 40% of extractives, 45% of suberin, 9% of lignin, 4% of hemicelluloses, and 2% of cellulose (Holmbom 2011). Majority of the extractives fraction is composed of triterpenes.
Betulinol is the predominant extractives component in birch bark, with the proportion of 30% of the dry weight in the outer bark. The inner bark has a very high phenolic content of 8.55 % (Kähkönen et al. 1999). Phenolics are thought to have several health-promoting properties for humans (Liimatainen 2013). For example, long-term intakes of phenolics may prevent or reduce the risk of cardiovascular diseases, diabetes, obesity, and cancer. A range of bioactivities has been assigned to pentacyclic triterpenes of lupane structure (including betulin): bactericidal, antiviral, anti-inflammatory, cytotoxic and antitumoral (Royer et al. 2012). Betulinic acid stands out with its proven antiviral activity towards type I human immunodeficiency virus (HIV), apart from its selective cytotoxicity towards human melanoma. Betulin and birch bark extract are patented as adaptogenic remedies, interferon inducers, antihypoxitic products, hepatitis-C preventatives and treatments, anti-influenza and tuberculosis prophylactics, and as additives in cosmetics, pet foods, lipase inhibitors, and foods containing triterpenes (Krasutsky 2006). There are many cosmetic products containing betulin or birch bark extract on the market. As betulin and its derivatives form bark have shown capability to act as a human health promoting agent, extraction of betulin from bark gained as a side stream of plywood, veneer or saw mill production has gained interest (Alakurtti et al. 2006). By applying feasible extraction methods a new value chain from bark could be created.
Suberin hydroxy and epoxy derivatives of fatty acids in birch bark are relatively rare in nature, but may constitute interesting chemical precursors in the synthesis of polymeric materials, polyols, polyurethanes, and polyesters (Miranda et al. 2013). Suberinic ω-hydroxyfatty acids could be used in skin-care, anti-aging, hair-care, biodegradable plastics polyesters, individual chemicals for drug design, dietary supplements, anti-cholesterol and anti-obesity products (Krasutsky 2011). Suberinic ω-acids salts could be used in special washing materials, shampoos and hair care.
Sawmills, dimension mills, furniture and cabinet makers and carpentry are the main producers of saw and grinding dust as by-products (Liu et al.2014). Their supply from birch industries is, however, small in Finland. Traditionally, sawdust is used to prepare charcoal, as absorbent for nitroglycerin or

Natural resources and bioeconomy studies 80/2017
91
effluents containing heavy metals, as filler in plastics, as wood composts and in linoleum and paperboard. There has been work with the development of the method that utilizes sequential extractions to isolate the valuable components, lignin and hemicelluloses, instead of removing the water-soluble fraction by degradation (Liu et al. 2014). This approach preserves the unique structures of each component of wood material for further tailoring into functional materials, instead of removing the water-soluble fraction by degradation, which not only consumes more chemicals, but also wastes the biomass.
The lignin from sawdust could be tailored for the manufacturing of fine chemicals such as vanillin by oxidation or to produce carbon fibre, adhesives, resin and other products. The hemicelluloses could be further developed for food additive, pharmaceutical and cosmetic applications or as a starting material for the production of functional polymers or nanofibrillated cellulose (NFC) and its films from the cellulose residue after the sequential hot-water extractions of birch sawdust (Liu et al. 2014). Kilpeläinen et al. (2012) suggested the use of residue from pressurized hot water extraction for pulping and for enzymatic treatments to produce chemicals and fuels or to other industrial and biomedical applications. According to them, hardwoods are more favorable to hydrothermal treatments because they have more acetyl groups present, and accordingly more acetic acid is released from hardwoods than softwoods during pressurized hot-water treatments, which catalyzes hydro-thermic biomass degradation reactions further. Additionally, sawdust can be utilized as a raw material for liquid biofuel production (Chapter 3.2.2).
Novel special products from the distillates of birch wood obtained as a by-product from manufacturing barbecue coal or char coal with a slow pyrolysis process were introduced during the last decade. They have proved out biologically effective, cost-efficient and environmentally sound in controlling weeds and mosses, certain plant diseases and harmful molluscs, ants, voles, hares and rabbits in home gardens, ornamental plant and greenhouse cultivations, and even in protecting seedling stands from moose damage in forestry (Tiilikkala et al. 2011, Hagner 2013). Several products have been available in the market for some years, and new applications are continuously tested in Finland.
Non-wood forest products 3.3.Besides for veneer, furniture, building, pulpwood and firewood, birch is a vast source as non-wood forest products (NWFPs). These include sap, and mushrooms as well as and food supplement and medicinal products (Chapter 3.2.4).
Birch sap is the most common and well known non-wood product of birch. Demand for high quality sap is increasing as markets for tree waters are expanding and expected to reach two billion US dollars by year 2025 (Bouckley 2015). Finland has one of the biggest producers of tree waters in the world, and the abundance of birch in Finland makes birch sap production almost infinitely scalable. Tapping season is limited to some weeks during early spring but, one birch at its best can give a yield of 350 litres, but average yield varies between 50 to 100 litres of sap (Salo 2000, Potila et al. 2005). One tree can be used 10 years for tapping. Renting birch trees for 10-year sap tapping to a sap company, with the average yield of 50 l/tree/year, the rental income will exceed pulp wood revenue. If the average annual yield is 75 l/tree or above, the rental income will exceed veneer and pulp wood revenue, making sap tapping a good option for forest owners (Miina 2016).
New value chains based on specialty mushroom production have recently been introduced to the Finnish forestry. At its best the cultivation of these mushrooms accommodating birch stems and stumps can be integrated to the current management of birch, or forest owners can utilize set-aside birch stands in cultivation. Pakuri, chaga in English (Inonotus obliquus), Reishi (Ganoderma lucidium) and sheathed woodtuft (Kuehneromyces mutabilis) are the species where most of the research and development actions are set. These products aim for food, nutraceutical and food supplement markets. All of the above mentioned species exist naturally, but for viable value chains of these

Natural resources and bioeconomy studies 80/2017
92
products a higher and more stable supply of raw materials is needed. A growing demand for raw materials could be fulfilled by systematic and organized cultivation of the species (Vanhanen et al. 2014, Issakainen 2015).
Pakuri is a good example of making a NWFP more desirable to a consumer, and adding its value for forest owners and suppliers. The prices of fresh and dried pakuri are about 20 €/kg and 30–50 €/kg, respectively. By simple refining, drying and grinding Pakuri for tea uses its price will be
increased up to 100–200 €/kg. The most valuable Pakuri products are sold as instant extract powder
or liquid having a price of 1000 €/kg. NWFPs open variable income and business opportunities that are independent on timber
cuttings and stumpage price. Poor-quality birch stands that are still abundant can be profitable in this business as well. Future goal in forest management should be a procedure which better enables the joint production of timber and NWFPs.
Trends in value chains and markets 4.Future of birch in industrial production relies heavily on the unique chemical and physical properties that enable uses of the limited biomass resources in market niches with a high value add and/or limited competition. Therefore the business concepts, product strategies or value chains of birch should not imitate the patterns of softwoods, or aim to replace them in the market. On the other hand, birch resources are in a larger scale very suitable for many bulk products of biorefining and bioenergy and certain paper and paperboard grades, to be used in parallel or mixed with softwoods.
Birch-based value chains have stayed rather unchanged during the last two decades, but novel products will expand the product palette as well as composition and interactions of market players. Raw material supply from the forest looks to continue largely as a combined procurement to satisfy the needs of different users of birch, except for the non-wood forest products where small and medium-scale operators, even forest owners may develop to key suppliers and distributers. We can expect an increasing demand for pre-sorting, purification and upgrading of raw materials especially in the deliveries for processors for value-added biorefinery products. Novel product groups may also call for more segregation of forest management practises in different birch forests and diversifying market environments. Birch tree breeding is supposed to further improve raw material basis in volume, quality and resistance to biotic and abiotic hazards, both through traditional selective methods and molecular biological manipulation, hence, enabling feedstock optimization for different industrial uses.
The most significant changes in birch business can be seen in the networks of primary and further manufacturing enterprises, distribution and sales companies and supplying practitioners where new market players of biorefining and building with wood may set new requirements for just-in-time deliveries, quality control and homogeneity of raw materials and products. They also ask raw material origin, environmental labelling, carbon balance and sequestration and overall circular economy considerations.
New innovative value chains based on side streams of primary industries and specialty products relying on the unique characteristics of birch call for industrial symbiosis between large biorefining or mechanical wood processing companies and specialized manufacturers of value-added further processed products. Here, optimized scaling of production units, as themselves and in relation to each other, and consistent considerations of investment, production and logistics costs are key issues in planning of either integrated production plants, decentralized mills or miscellaneous industry parks.
Basic biorefinery processes providing fibre-based products and liquid and solid fuels are currently in the hands of large stock exchange companies. Manufacturers of specialty chemicals processing side streams of primary industry companies are typically private SMEs. However, their customers are both among large-volume techno-chemical industries and specialized industries in
Natural resources and bioeconomy studies 80/2017
93
health and well-being sector. Nature-based non-wood forest products and their derivatives, or high-value specialty mushrooms cultivated on stems provide totally new value networks aiming mainly to human well-being markets. Traditional wood products from birch have potential for new pathways in a variety of advanced further-processed products both for consumer and industrial uses, stressing smart adaptation to modern building, housing and logistics applications as well as progressing digitalization, cascading and urbanization. All these trends set new challenges for marketing and distribution strategies and networks of enterprises.
Diversification of product segments according to customer groups and geographic supply regions is supposed to go further within each sub-sector. Digitalization in sales and distribution is proceeding, and may open new markets for small and medium-scale producers and add to their competitiveness. Simultaneously, global competition obviously increases also in smaller product groups of birch – the development that has already taken place in such important products like plywood (Russian production) and fine papers (South-American eucalypt production).
References Abdul Khalil, H.P.S., Y. Davoudpour, Md. Nazrul Islam, A. Mustapha, K. Sudesh, R. Dungani, and M.
Jawaid. 2014. Production and modification of nanofibrillated cellulose using various mechanical processes: A review. Carbohydrate Polymers 99, 649-665.
Adams, R. and T. Banks. 1995. Drying Wood. Prentice Hall, Englewood Cliffs, New Jersey. 550 pp. Alakurtti, S., T. Mäkelä, S. Koskimies, and J. Yli-Kauhaluoma. 2006. Pharmacological properties of the
ubiquitous natural product betulin. European Journal of Pharmaceutical Sciences 29(1):1-13. Alén, R. 2000. Basic chemistry of wood delignification. In: Stenius, P. (ed.). Forest products chemistry.
Vol 3. Fapet Oy, 2000:59. Helsinki, Finland. Alén, R. 2011. Principles of biorefining. In: Alén, R. (ed.). Biorefining of Forest Resources, pp. 56-115.
Paper Engineers’ Association, Helsinki, Finland. Alén, R. 2015. Pulp mills and wood-based biorefineries. In: Industrial Biorefineries & White
Biotechnology, pp. 91-126. Elsevier, Amsterdam. Artek: http://www.artek.fi/fi/ Azarpazhooh, A., H. Limeback, H.P. Lawrence, and P.S. Shah. 2011. Xylitol for preventing acute otitis
media in children up to 12 years of age. The Cochrane Library (11): CD007095. Bajpai, P. (ed.). 2011. Nanocellulose in Paper and Board. Surrey, United Kingdom. Rav Lally, 74 pp. (e-
book). www.PIRA-INTERNATIONAL.com. Berger, W. 1994. Possibilities and Limitations of Alternative Processes for the Dissolution and Forming of
Cellulose, Lenzinger Berichte, Rudolstat, Germany, pp. 11-18, FW16-FW19. Bouckley, B. 2014. Power to the Plants! Tree waters tipped to corner $2bn market by 2025.
Beveragedaily.com http://www.beveragedaily.com/Markets/Power-to-the-Plants!-Tree-waters-tipped-to-corner-2bn-market-by-2025.
Converti, A., P. Parego, and J.M. Dominguez. 1999. Xylitol Production from Hardwood Hemicellulose Hudrosylates. Applied Biochemistry and Biotechnology 82: 141–151.
Davies, S. 1993. Courtaulds Tencel - A New Fibre for the Mass Market, Textile Outlook Int. 44: 8-18. Duan, C., Y. Long, J. Li, and Y. Ni. 2015. Changes of cellulose accessibility to cellulase due to fiber
hornification and its impact on enzymatic viscosity control of dissolving pulp. Cellulose, 22(4), 2729-2736.
Eickhout, B. 2017. On the proposal for a directive of the European Parliament and of the Council on the promotion of the use of energy from renewable sources. Draft Opinion of the Committee on the Environment, Public Health and Food Safety for the Committee on Industry, Research and Energy. 2016/0382(COD), 56 p.
Finnish Forest Industries Federation: https://www.metsateollisuus.fi/tilastot/toimialat/15-Massa-%20ja%20paperiteollisuus/
Fjellström, H., H. Höglund, and M. Paulsson. 2007. Light-induced yellowing of mechanical and chemimechanical pulp sheets: influence of wood raw material, process and ageing method. Nordic Pulp & Paper Research Journal 22(1):117-123.
Fortum: http://www.fortum.com/en/products-and-services/biooil/pages/default.aspx Gandini, A., C.P. Neto, and A.J.D. Silvestre. 2006. Suberin: A promising renewable resource for novel
macromolecular materials. Progress in Polymer Science, 31(10): 878-892. GFN: http://www.greenfuelnordic.fi/

Natural resources and bioeconomy studies 80/2017
94
Grass, G., C. Rensing, and M. Solioz. 2010. Metallic copper as an antimicrobial surface. Applied and Environmental Microbiology 77(5): 1541-1547.
Gullichsen, J. and H. Lindeberg. 2000. Byproducts of chemical pulping. In: Gullichsen, J. and C. Fogelholm (Eds.). Chemical Pulping. Fapet Oy, Helsinki, Finland, pp. B375.
Hagner, M. 2013. Potential of the slow pyrolysis products birch tar oil, wood vinegar and biochar in sustainable plant protection: pesticidal effects, soil improvement and environmental risk. Academic dissertation in environmental ecology. University of Helsinki, Department of Environmental Sciences. 42 p. + Appendices. Lahti, Finland.
Hakkila, P. and E. Verkasalo. 2009. Structure and properties of wood and woody biomass. In: Kellomäki, S. (ed.). Forest Resources and Sustainable Management, pp. 133-215. Paper Engineers’ Association, Helsinki, Finland.
Hallaksela, A.-M. and P. Niemistö. 1998. Stem discoloration of planted silver birch. Scandinavian Journal of Forest Research 13:169-176.
Heräjärvi, H. 2001. Technical properties of mature birch (Betula pendula and B. pubescens) for sawmilling in Finland. Silva Fennica 35(4): 469-485.
Heräjärvi, H. 2004a. Static bending properties of Finnish birch wood. Wood Science and Technology 37: 523–530.
Heräjärvi, H. 2004b. Variation of basic density and Brinell hardness within mature Finnish Betula pendula and B. pubescens stems. Wood and Fiber Science 36(2): 216-227.
Hintikka, T.J. 1941. Visakoivuista ja niiden anatomiasta – Über die Wisabirken und ihre Anatomie. 346 p. Helsinki, Finland (In Finnish with German summary).
Holmbom, B. 2011. Extraction and utilization of non-structural wood and bark components. In: Alén, R. (ed.). Biorefining of Forest Resources, pp. 178-224. Paper Engineers’ Association. Helsinki, Finland.
Hynynen, J., P. Niemistö, A. Viherä-Aarnio, A. Brunner, S. Hein, and P. Velling. 2010. Silviculture of birch (Betula pendula Roth and Betula pubescens Ehrh.) in northern Europe. Forestry 83:103-119.
International Thermowood Association: https://www.thermowood.fi/ ISKU: https://www.isku.com/en/health-2/ Issakainen, J. 2015. Herkkuruokaa puusta – syötävien lahottajasienten viljely maatalouden
sivuelinkeinona. Turun ammattikorkeakoulun raportteja 216. 192 p. (In Finnish) Jalava, M. 1945. Strength properties of Finnish pine, spruce, birch and aspen. Communicationes Insituti
Forestalis Fenniae 33(3): 1-66. (In Finnish with English summary) Jalava, M. 1949. Koivun ja koivuteollisuuden merkitys Suomessa. Metsätaloudellinen Aikakauslehti
1/1949: 3-6. (In Finnish) Kähkönen, M.P., A.I. Hopia, H.J. Vuorela, J.P. Rauha, K. Pihlaja, T.S. Kujala, and M. Heinonen. 1999.
Antioxidant activity of plant extracts containing phenolic compounds. Journal of Agricultural and Food Chemistry 47(10):3954-3962.
Kaidi Finland: http://www.kaidi.fi/biodiesel-en/?locale=en Kamel, S., N. Ali, K. Jahangir, S.M. Shah, and A.A, El-Gendy. 2008. Pharmaceutical significance of
cellulose: A review. Express Polymer Letters 2(11): 758–778. Kilpeläinen, P., K. Leppänen, P. Spetz, V. Kitunen, H. Ilvesniemi, A. Pranovich, and S. Willför. 2012.
Pressurised hot water extraction of acetylated xylan from birch sawdust. Nordic Pulp & Paper Research Journal 27(4): 680-688.
Kosonen, M. (ed.). 2004. Curly Birch – Visakoivu. Metsälehti Kustannus Ltd. 197 p. Helsinki, Finland. Krasutsky, P.A. 2011. Laboratory of Chemical Extractive.
http://www.nati.net/media/7446/pavel_a._krasutsky__oct2011.pdf Kumar, H. 2016. Novel concepts on the recovery of by-products from alkaline pulping. Academic
dissertation for the degree of doctor of philosophy. Department of Chemistry, University of Jyväskylä, Research Report No. 198, 48 p. + Appendices.
Laine, K., K. Segerholm, M. Wålinder, L. Rautkari, and M. Hughes. 2016. Wood densification and ther-mal modification: hardness, set-recovery and micromorphology. Wood Science and Technology 50(5): 883–894.
Lavoine, N., I. Desloges, A. Dufresne, and J. Bras. 2012. Microfibrillated cellulose- Its barrier properties and applications in cellulosic materials: A review. Carbohydrate Polymers 90: 735-764.
Lekounougou, S., D. Kokaefe, N. Oumarou, Y. Kokaefe, and S. Poncsak. 2011. Effect of thermal modification on mechanical properties of Canadian white birch (Betula papyrifera). International Wood Products Journal 2(2): 101-107.
Liimatainen, J. 2013. Phenolics of the inner bark of silver birch: Characterization and intraspecific variation. Doctoral thesis. Turun yliopiston julkaisuja – Annales Unuiversitatis Turkuensis. Sarja – Ser. A1 Osa – Tom. 477. 90 p.

Natural resources and bioeconomy studies 80/2017
95
Liu, J., R. Korpinen, K.S. Mikkonen, S. Willför, and C. Xu. 2014. Nanofibrillated cellulose originated from birch sawdust after sequential extractions: a promising polymeric material from waste to films. Cellulose 21(4): 2587-2598.
Luostarinen, K. and E. Verkasalo. 2000. Birch as Sawn Timber and in Mechanical Further Processing in Finland. A Literature Review. Silva Fennica Monographs 1. 40 p.
Marttila, J., V. Möttönen, and H. Heräjärvi. 2017. Case hardening and equilibrium moisture content of European aspen and silver birch after industrial scale thermos-mechanical timber modification. Proceedings of the International Scientific Conference on Hardwood Processing 2017. Lahti, Finland. In press.
Miake, Y., Y. Saeki, M. Takahashi, and M. Yanagisawa. 2003. Remineralization effects of xylitol on demineralized enamel. Journal of Electron Microscopy 52 (5): 471-476.
Miina, J. 2016 . Profitable production from birch sap for forest owners. Finnish Natural Products Conference 23.-24.11.2016, Joensuu.
Miranda, I., J. Gominho, and H. Pereira. 2013. Fractioning and chemical characterization of barks of Betula pendula and Eucalyptus globulus. Industrial Crops and Products, Volume41, January 2013, pp. 299-305.
Möttönen, V., Y. Bütün, H. Heräjärvi, J. Antikainen, and J. Marttila. 2015a. Physical properties and dimensional stability after combined compression and thermal modification of birch and aspen lumber. In: 5th International scientific conference on hardwood processing 2015, International academy of wood science - annual meeting, Sept. 15-17, 2015, Quebec City, Canada : Proceedings. FPInnovations. p. 147-154.
Möttönen, V., Y. Bütün, H. Heräjärvi, J. Marttila, and H. Kaksonen. 2015b. Effect of combined compression and thermal modification on mechanical performance of aspen and birch wood. Pro Ligno 11(4): 310-317.
Möttönen, V., H. Heräjärvi, H. Koivunen, and J. Lindblad. 2004. Influence of felling season, drying method and within-tree location on the Brinell hardness and equilibrium moisture content of wood from 27–35-year-old Betula pendula. Scandinavian Journal of Forest Research 19: 241–249.
Nasatto, P.L., F. Pignon, J.L.M. Silveira, M.E.R. Duarte, M.D. Noseda, and M. Rinaudo. 2015. Methylcellulose, a Cellulose Derivative with Original Physical Properties and Extended Applications. Polymers 7: 777-803.
Natural Resources Institute Finland 2017. Forest statistics. http://stat.luke.fi/en/metsa Niemistö, P., A. Viherä-Aarnio, P. Velling, H. Heräjärvi, and E. Verkasalo (eds.). 2008. Koivun kasvatus
ja käyttö. Finnish Forest Research Institute and Metsäkustannus Ltd. 254 p. (In Finnish) Pétrissans, M., P. Gérardin, I. El Bakali, and M. Serraj. 2003. Wettability of heat-treated wood.
Holzforschung 57 (3): 301-307. Pinto, P. C. R. O., A.F. Sousa, A.J.D. Silvestre, C.P. Neto, A. Gandini, C. Eckerman, C., and B.
Holmbom. 2009. Quercus suber and betula pendula outer barks as renewable sources of oleochemicals: A comparative study. Industrial Crops and Products 29(1): 126-132.
Potila, H., P. Niemistö, E.-M. Savonen, K. Siuruainen, E. Ala-Laurinaho, M. Haapalehto, and H. Raitio. 2005. Koivunmahlan ja kuusenkerkkien hyödyntäminen PK-elintarviketuotannossa – keruun vaikutukset puiden kasvuun ja terveydentilaan. Loppuraportti. Metsäntutkimuslaitos, Parkano. 30 s. (In Finnish)
Pöyry: https://tem.fi/documents/1410877/2772829/P%C3%B6yry_Suomen+mets%C3%A4teollisuus+2015-2035.pdf/ac9395f8-8aea-4180-9642-c917e8c23ab2
Pulkkinen, H.L. 2016. The features and use of CLT as a building material. Centria University of Applied science, Degree programme Industrial Management. 39 p. (in Finnish with English summary)
Royer M, R. Houde, Y. Viano, and T. Stevanovic. 2012. Non-wood forest products based on extractives-A new opportunity for the Canadian forest industry. Part 1: Hardwood forest species. Journal of Food Research 1(3):8.
Salo, K. 2000. Kaskikoivun mahla virtaa. In: Lovén, L. and H. Rainio (toim.). Kolin perintö. Kaskisavusta kansallismaisemaan. Metsäntutkimuslaitos - Geologian tutkimuskeskus, Helsinki. pp. 78-83. http://tupa.gtk.fi/julkaisu/erikoisjulkaisu/ej_038.pdf (in Finnish)
Sappi: https://www.sappi.com/lignosulphonate-application-areas Sarpong, B.O. 2017. Effects of thermo-mechanical treatment on the mechanical properties of Scots pine
(Pinus sylvestris L.) and Norway spruce (Picea abies K.) with several combinations of process parameters. Master’s thesis. Wood Materials Science, Faculty of Science and Forestry, University of Eastern Finland. 64 p.
SCA: http://www.sca.com/Documents/en/Shape/2016/Shape-no-2-2016/EN-SCA-magazine-SHAPE-2-2016-Millennials.pdf?epslanguage=en
Natural resources and bioeconomy studies 80/2017
96
Singh, N.P. and A. Singh. 2011. Production of liquid biofuels from renewable resources. Progress in energy and combustion science 37(1): 52-68.
Sixta, H., A. Michud, L. Hauru, S Asaadi, Y. Ma., A.W.T. King, I. Kilpeläinen, and M. Hummel. 2015. Ioncell-F: A High-strength regenerated cellulose fibre. Nordic Pulp & Paper Research Journal, 30(1): 43-57.
St1: http://www.st1biofuels.com/ Steinberg, L.M., F. Odusola, and I.D. Mandel. 1992. Remineralizing potential, antiplaque and
antigingivitis effects of xylitol and sorbitol sweetened chewing gum. Clinical preventive dentistry. 14 (5): 31–4.
Stora Enso: http://biomaterials.storaenso.com/products-and-services/for-textile-and-other-applications Strunk, P. 2012. Characterization of cellulose pulps and the influence of their properties on the process
and production of viscose and cellulose ethers. Academic dissertation. Department of Chemistry, Umeå University, Sweden, 82 p.
Studio Haekkinen: http://www.studiohaekkinen.fi/ Tiilikkala, K., I. Lindqvist, M. Hagner, H. Setälä, and D. Perdikis. 2011. Use of botanical pesticides in
modern plant protection. In: Stoytcheva, M. (Ed.) Pesticides in the modern world - pesticides use and management, In Tech., pp. 259-272.
Tjeerdsma, B.F., M. Boonstra, A. Pizzi, P. Tekely, and H. Militz. 1998. Characterisation of thermally modified wood: molecular reasons for wood performance improvement. Holz als Roh- und Werkstoff 56:149–153.
Vanhanen, H., R. Peltola, A. Ahtikoski, and A. Pappinen. 2014. Cultivation of Pakuri (Inonotus obliquus) - potential for new income source for forest owners. The 10th International Mycological Congress (IMC10), Bangkok, Thailand, 3-8.8.2014. In: IMC 10 Organizing Committee (Ed.), Book of Abstracts, p. 418.
Verkasalo, E. 1993. Deterioration of birch timber during prolonged storage in the forest and its effect on the yield, quality and value of rotary-cut veneer. Folia Forestalia 806. 31 p. (In Finnish with English summary)
Verkasalo, E., H. Heräjärvi, J., Arponen, and A. Toppinen. 2007. Perspectives of wood resources, industry competitiveness and wood product markets for birch industries in the Baltic Sea area. In: Blanchet, P. (ed.). ISCHP ’07 International Scientific Conference on Hardwood Processing, September 24-25-26, 2007, Quebec City, Canada. Proceedings, ss. 29 -35. FP Innovations Forintek Division, FCBA & IVALSA.
Viherä-Aarnio, A. and R. Hagqvist 2017. Curly birch (Betula pendula var. carelica), wooden “marble” from Finland – soon easily available. Proceedings of the International Scientific Conference on Hardwood Processing 2017. Lahti, Finland. In press.
Viikari, L. and R. Alén. 2011. Biochemical and chemical conversion of forest biomass. In: Alén, R. (ed.). Biorefining of Forest Resources, pp. 225-261. Paper Engineers’ Association, Helsinki, Finland.
Wang, H.H. 2009. Cellulose and Pulp. In: Owens, J. N. and H.G. Lunday (eds.) Forests and Forest Plants – Vol.2, Encyclopedia of Life Support Systems (EOLSS), pp. 158-177.
Woodings, C. 2001. Regenerated cellulose fibres, Woodhead Publishing Ltd, Cambridge England, pp.22-36.

Natural resources and bioeconomy studies 80/2017
97
Hardwood processing in Germany – Challenges and opportunities for the wood based panel industry
Dirk Berthold, Peter Meinlschmidt, Nina Ritter
Department of Technology for Wood-Based Materials Fraunhofer Institute for Wood Research / Fraunhofer WKI
Braunschweig, Lower Saxony, 38108, Germany
Abstract
In Europe, the wood products industry is primarily based on raw material from softwood species like spruce and pine. The high expansion of production capacities for wooden products and the shift in forest management (i.e., enhancement of hardwood and reduction of softwood stands) results in an increasing demand for softwood and in supply shortfalls and rising of softwood timber prices. On the other hand, hardwood species like beech or birch with high stocks in the European forests are hardly used for products with high added value. Consequently, the amount of hardwood forests has increased so that now, in Europe, almost 50% of forests are covered with hardwood species. Thus, there is need for new ways to use hardwood for high added value products. Besides flooring, stairs, doors, and high-end furniture from solid hardwood, plywood was an important way to use hardwood for advanced products. However, plywood lost most of its market share for furniture and even for house construction due to the competition by Oriented Strand Boards (OSB), Particle Boards (PB) and Medium Density Fibre Boards (MDF). In the view of price competitiveness, the future of plywood production will rely mostly on hardwood. The European hardwood species are ecologically advantageous and are in many cases a more economical choice than tropical hardwood species. Both new product innovations as well as new fields of application are necessary to improve the situation of the plywood industry which has not been profitable during the past 10 years. This paper highlights project approaches and results from WKI and partners aiming at an increased use of hardwoods in existing production lines and for new products.
Introduction 1.
Special situation of hardwood in selected countries 1.1.The utilisation of hardwood in the EU is quite heterogeneous. While Finland’s industries depend
mostly on birch - 357 million m3 of growing stock / 16% of the total volume - (Hynynen et al., 2010), France as a major hardwood producer relies mostly on oak with 720 million m3 of standing trees and 700 000 m3 of sawn products. Beech is the second major species in France, with 280 million m3 of standing trees and 390 000 m3 of sawn products. Chestnut is number three with 133 million m3 of standing trees, but only 60 000 m3 of sawn products (UNECE/FAO, 2010 & 2015). With an area of 1.6 million ha and a stock of 590 million m3, beech is the dominating hardwood species in Germany. Only 8 to 10 million m3 of beech timber are harvested annually, although a sustainable amount of 23 million m3 could be used every year. To strengthen the European economy, it is necessary to find new marketing solutions for hardwood raw material by developing new products, in particular in the construction sector, which can take benefit from the fundamental properties of the used species, such as strength, durability (chestnut/black locust), ability to be glued (beech) and weight (birch). Engineered products are a good way to increase the added value of the complete forestry-Timber value chain. The aim of many current projects is to (re-)establish the hardwood value chains that would lead to the production of high added value products made from hardwood (e.g. hybrid or sandwich boards). This can be achieved through increases in production efficiency and new products
Corresponding author: Tel.: +495312155452; E-mail: [email protected]

Natural resources and bioeconomy studies 80/2017
98
made from solid hardwood as well as hardwood lamellae and veneers with a focus on applications for furniture and construction.
Hardwoods in the wood-based panel industry 1.2.For the last 40 years the European woodworking industry concentrated its investments and technological developments on processing softwoods, whereas forestry developed silvicultural strategies that lead to enhancing the share of hardwood species. Consequently the growing stock of hardwood forests is increasing (almost 50% of European forests, in some southern countries up to about 85%) and this development will be significantly amplified within the next tree generations (100-150 years). The result is an increasing demand for softwood and supply shortfalls as well as rising prices for softwood. On the other hand, hardwood species like beech or birch with high stocks in the European forests (ash and alder in some Baltic and east European countries) are hardly used for products with high added value. Huge amounts of hardwood timber are not used at all or only for products with low added value (energetic use). Due to different physical and chemical properties, an immediate and 100% substitution of softwood by hardwood into existing processing technologies and final products is impossible. Thus, there is need for new ways to use hardwood for products with high added-value and meet the requirements of a changing hardwood processing. Furthermore, procurement of on-demand hardwood assortments, new products, process and service innovations, as well as new fields of application are necessary to drive increased utilisation of hardwood timber and to transform this biomass into long life, carbon storing products. Besides flooring, stairs, doors, and high-end furniture from solid hardwood, plywood was an important way to use hardwood for advanced products. However, plywood lost most of its market share for furniture and even for house construction due to the competition by Oriented Strand Boards (OSB), Particle Board (PB) and Medium Density Fibre Board (MDF). The reasons for this include the high production costs in Western Europe, especially for the energy needed for pre-treatment, and the relatively high weight of plywood made from hardwood as compared to softwood. Plywood and other veneer products covered in 2008 approximately 11% of the production of wood-based panels in Europe, but globally, the corresponding figure was 34%. The global production of plywood was about 77 million m3 in 2008, while China alone was producing 36 million m3. Finland as the 10th largest plywood producer of the world produced about 1.5 million m3. In the view of price competitiveness, the future of plywood production will rely mostly on hardwood. The European hardwood species are ecologically advantageous and are in many cases a more economical choice than tropical hardwood. New products, process and service innovations as well as new application fields are necessary to improve the situation of the plywood industry which has not been profitable during the past 10 years. It is widely acknowledged that plywood and veneer products have many chances for new products and for new customer segments which are not yet utilized. In addition, there are many already recognised but still unutilised ways to increase the efficiency of the industrial production processes, energy use, and end product quality in hardwood plywood and veneer industries.
Currently dominating hardwood tree species will probably not be available to the same extent or will be replaced by other species adapted to changed climate conditions in the future (Parmesan and Yohe, 2003). A very prominent example is the current Chalara dieback of ash (Hymenoscyphus
fraxineus), although ash was expected to profit from global change (e.g., by increased competitiveness against beech in warmer and dryer climates). This example shows that the wood based panel industry will not be able to rely on one tree species for the future production but has to be more flexible in the future. By the processing of hardwood species that are both expected to survive and/or profit from climate change and characterized by good mechanical timber properties and high durability like silver birch / Betula pendula or black locust / Robinia pseudoacacia), the wood industry can increase its product portfolio and offer new and innovative products. Timber of these tree species contain high amounts of different bioactive compounds, including terpenoids and

Natural resources and bioeconomy studies 80/2017
99
phenolics (Tegelberg et al. 2002; Laitinen et al. 2004, 2005; Dünisch et al. 2010), and are in high demand for outdoor products for its long-durability. Especially, condensed tannins found in both species are of special interest for their roles in plant resistance to microbial infestations and other biological effects (Ge et al. 2003).
Engineered Wood Products (EWP) production based on 1.3.hardwood
The state-of-the-art veneer production is energy- and cost intensive as well as water polluting cooking or steaming process, in which the logs have to be placed for days in hot water or steam to get wood blocks which are soft and free of tension for slicing or peeling it in a proper, crack-free way. Moreover the colour and therefore the price of the product can be influenced by the processing time, temperature, and the species of the treated wood. In the next step, thin sheets (0.5 to 5 mm) of veneer are sliced or peeled from the logs. For economic reasons, many logs are peeled in one piece leaving only a minor wood core in the machine. In the next costly step the veneers are dried (press, jet or roller drier) to a moisture content between 4% and 14%. Finally, the veneer sheets move through a clipping line, where edges are straightened and defects can be detected and cut out. This causes significant losses in wood raw material. At the same time a grading according to quality and dimensions will be done and the results are stored on a computer.
Softwood is the preferred raw material of the wood-based panel industry in most European countries. The production of OSB, MDF and PB is primary based on spruce, pine and fir. The production of plywood based on hardwood species like beech or birch decreased drastically in the last decades due to lowered profitability and outdated, ineffective production process.
Due to supply shortfalls and rising costs of softwood timber, EWP’s based on hardwood are currently of increasing interest for both science and industry. Therefore some smaller projects focussing on the utilisation of hardwood for the wood-based panel production were conducted in recent years (e.g. OSB based on old beech wood). Currently, these activities are being intensified by national and international project initiatives. There have been some attempts to scientifically analyse the product development needs and potential markets for hardwood plywood and veneer products. However, the attempts have mostly focused in recognition of prospective research needs, market trends, etc., whereas a systematic approach towards defining potential customer segments, as well as product and service development needs, has been missing.
Hardwood products for the building and construction industry 1.4.Globally, infrastructure and building construction consumes 60% of the raw materials extracted from the Earth (Bribian et al. 2011), while the built environment accounts for 35-40% of total carbon dioxide (CO2) emissions (Nelson et al. 2002). Therefore, the shift to “green building” is urgently
needed to pre-empt the deleterious effects of predicted population growth on resource depletion and climate change. Wood is a material of choice in many countries for residential and light commercial buildings. 90% of the residential buildings in the US (slightly less in Japan) are wood-frame constructions. The use of wood in green buildings is a logical choice, as wood is a renewable resource, and its production and transformation into construction and furniture products is generally non-polluting at all stages, although there have been instances in the past with polluted sites from chemical preservative processes (Buchanan 2006, 2010). Furthermore, using wood in construction and furniture will increase carbon sequestration, which is very important for tackling climate change (Kuittinen et al. 2013), despite green building programs not giving proper credit to wood and its low embodied energy (Bowyer 2008). To utilise the full range of possibilities provided by building design codes, new structural graded hardwood lumber must be delivered to the market. Many widely available hardwood species have clearly denser, stiffer and stronger wood than the current structural

Natural resources and bioeconomy studies 80/2017
100
softwood lumber species. However, only poor information exists on their load carrying capacity as structural components and limited data on the behaviour of structural adhesives and mechanical connections in hardwoods. Besides construction purposes, hardwood is an interesting resource for the production of furniture and insulation materials. Moreover, combined approaches – hardwood as construction and insulation materials – promise the highest level of hardwood timber use. Additionally, the developments of new construction materials and products have to take into account environmental performance. The main objective of many projects addressing the enhanced use of hardwood timber for various applications is the development of innovative hardwood-based products from underutilised species, with emphasis on the construction and furniture making sectors, leading to increased added value for the forest based industries’ value chains, new
marketing solutions, and enhanced competitiveness in this industry. The potential for utilisation of selected hardwood tree species (e.g., black locust, birch, oak and
beech) adapted to warmer/dryer climate conditions and with multiple interesting aspects (mechanical properties and durability) due to chemical-physical properties have to be analysed in current and future projects dealing with this topic. These projects should aim to solve problems regarding the weight and durability of many hardwood species to enable the substitution of softwood species primarily used in the structural panel industry, as well as for broader applications in the construction and furniture sectors.
2. Selected projects and results 2.Fraunhofer WKI conducted and participated in several projects addressing the enhanced utilization of hardwoods in the Wood Based Panel industry. Besides projects aiming at the substitution of softwood by hardwood in existing production lines for MDF, PB and OSB, WKI worked on the development of new and/or improved engineered wood products (EWP) based on hardwood timber.
Use of hardwood as a substitute for softwood 2.1.23 million m³ softwood and 1.1 million m³ hardwood logs are produced annually by saw mills in Germany (ZMP 2008). Besides the saw mill industry the wood based panel industry is the second largest consumer of wood in Germany (Marutzky 2004). To produce 10.5 million m3 of wood based panels (MDF, PB and OSB) this industry has a demand of 16.5 million m3 of raw material (VHI 2015). Therefore 7.5 million m3 of round wood – primarily softwood - is used (Mantau 2012). This high production capacity combined with the shift in forest management (enhancement of hardwood and reduction of softwood stands) led to the current supply shortfalls and rising softwood prices and forces the industry to review the raw materials used in the production as well as the production processes (Dieter 2003, Kharazipour 2005).
The utilization pattern for timber in Germany is in distinct contrast to the distribution of tree species in German forests: 43% of the forest area is covered by hardwood species, whereas only 25 % of the total timber consumption in 2012 was based on hardwood processing (Seintsch and Rosenkranz 2014). Obviously the use of softwood species (especially spruce) is often no longer sustainable (Dieter 2011), whereas great volumes of available hardwoods are not used at all. According to Spellmann (2013) currently only 50 % service capacity of oak wood and 65 % to 80 % of beech wood are used. Moreover, great volumes of hardwood species like birch or ash also remain in the forests or are used for products with low added value (energetic use). Projects and results addressing the utilization of hardwood species as a substitute for rare and expensive softwoods are presented below:

Natural resources and bioeconomy studies 80/2017
101
Beech wood for OSB Recently two projects dealing with the use of different beech wood timber assortments for the
industrial production of OSB were conducted at WKI. Concerning quality of beech wood timber Germany is facing two major problems: Large areas of young and thin beech wood trees with limited potential for the use in the wood industry, e.g., in some paper mills as resource for digital printing papers, High stocks of old beech wood of questionable quality (116 million m3 or 20% of the complete beech wood stock in Germany is stored in stands with an age >140 years). To analyze the usability of beech timber from both young (thinning wood) and old stands (stands older 140 years with the risk of wood decay due to fungal attack) for the OSB production, trials under industrial environments have been conducted at WKI.
Figure 1. Processing of beech wood assortments to OSB
Figure 1 shows the raw materials used in the trial as well as the produced OSB based on the material described above. It is obvious that - besides well-known physical and chemical problems regarding the use of beech wood in panel production – the beech wood supply of the industry will be dominated by assortments of low quality (especially with respect to material from old stands). Therefore the influence of the degraded timber on the quality of final product was of major interest within these projects.
OSB boards were produced using beech logs of different quality grades (see pictures in Figure 1) and tested according standard methods. The mechanical board properties are shown in Figure 2. It is evident that the wood quality has an influence on board properties, but the effect was not as high as expected. Advanced decay leads to lower bending strength (MOR) and E-modulus (MOE). Regarding internal bond (IB) results were not distinct. The same statement can be deduced from the results of boards thickness swelling (TS) testing. After 2h treatment boards produced from stronger decayed material seem to have higher values, but after 24 h treatment no differences can be observed anymore. On the other hand one major problem of the beech wood utilization for panel production becomes obvious: After 24 h of treatment boards show TS between 22 % and 25 % and will not pass the standards. Therefore effective methods and additives are needed to use beech wood as a substitute for softwood in panel production (see next chapter).

Natural resources and bioeconomy studies 80/2017
102
Figure 2. Mechanical properties of OSB boards produced from beech logs with different degree of wood decay
Figure 3. Thickness swelling of OSB produced from beech logs with different degree of wood decay
Beech wood for MDF and HDF
Thickness swelling and durability are the major problems of products based on beech timber. Product improvement regarding hygric properties (water uptake and thickness swelling) of beech based panels had been the major goal of projects aiming at a maximum substitution of softwoods (spruce, fir and pine) by beech timber in board production. To improve hygric properties of beech HDF and MDF both parameters during refining process (temperature, pressure, cooking time) and raw material pre-treatment were varied and different waxes adjusted to chemical composition of hardwoods were tested. Results of these trials are given in Figures 4 to 6.
In Figure 4 the thickness swelling of beech wood HDF in dependence of raw material quality (wood from young and old trees) and refining parameters (pressure and cooking time) is presented. In this trial no wax was added to improve the hygric properties of boards. TS after 24 hours of all variants were higher than 30% and therefore far away from passing the standard (maximum 25%). It seems that wood from old beech trees (with wood decay) leads to slightly higher water uptake and TS of boards compared to boards based on material from young trees (without visible decay); but these findings were not significant. It is obvious that refining conditions exert a much stronger effect on TS than raw material quality. HDF based on fibers produced under high pressure refining conditions (8 bar) show much higher TS than boards produced with fibers, which were refined with

Natural resources and bioeconomy studies 80/2017
103
lower pressures (3 or 5 bar). These results indicate, that hygric properties of board can be positively influenced by refining parameters adopted to the raw material primarily used for industrial production.
It is well known that acetylation improves timber durability as well as water uptake and thickness swelling. Therefore the trial presented in the section above (see Figure 4) was repeated with beech wood fibers that were treated with 0%, 10% and 40% of C4H6O3 (Figure 5). Treatment with C4H6O3 lowered TS from 30%-50% (untreated fibers) to 27% (10% C4H6O3) and 24% (40% C4H6O3). Again no difference between different raw material qualities (wood from old and young tree / with and without decay) could have been observed. Besides improving hygric properties of boards, fibers treatment with C4H6O3 seems to overlap the effect of refining conditions, i.e. boards based on fibers produced with higher pressure during refining did not show higher TS anymore.
To analysis the effect of acetylation on durability, wood decay of HDF samples with and without treatment was tested under standard conditions. In Figure 6 the fungal decay by Coniophora puteana (“Blight”) for four different board variants is presented:
MDF: Raw material “Mature Beech Wood”; Refined with 5 bar / 5 min; 12% UF (Reference) MDF W1: Raw material “Mature Beech Wood”; Refined with 5 bar / 5 min; 12% UF; 1,0% wax MDF A10: Raw material “Mature Beech Wood”; Refined with 5 bar / 5 min; 12% UF; 10 %
C4H6O3 MDF A40: Raw material “Mature Beech Wood”; Refined with 5 bar / 5 min; 12% UF; 40 %
C4H6O3 Mass loss after fungal attack of all variants was around 55 %, without significant differences
between C4H6O3 treated and not treated material. Regarding water uptake / wood moisture content variant MDF W1 containing 1% of wax showed significant lower values then the other variants (without wax), no effect of acetylation was observed. Obviously in this trial it was not possible to prevent fungal decay by C4H6O3 treatment of beech wood fibers.
Figure 4. Thickness Swelling of HDF based on 100% beech wood produced with different refining parameters

Natural resources and bioeconomy studies 80/2017
104
Figure 5. Thickness swelling of HDF based on 100% beech wood produced with different refining parameters and treatments
Figure 6. Mass loss and wood moisture of beech wood HDF after decay by Coniophora puteana
Under industrial production environments a substitution of 100% softwoods by hardwoods is not realistic, more likely a partial replacement will take place. This realistic approach was addressed in an additional trial, where spruce wood (Pa) was substituted by beech wood (Fs) to 25% and 50% (figure 7). Moreover, five different wax types were tested, all designed to improve hygric properties of hardwood based panels. Based on the findings of studies presented above, refining parameters were not varied and wood was disintegrated by 5 bars for 5 minutes. Compared to all results presented above, the significant improvement of thickness swelling of all board variants is obvious. Even after 24 h of water storage TS of samples was lower than 10%. Variants with 50% of beech wood material showed slightly higher values compared to boards produce with only 25% of beech wood, but these differenced were not significant. Comparing the five different wax types used in this study, performance regarding TS showed no significant differences. With respect to water absorption it seems that wax 3 shows a less good performance than the other wax types, but also here differences

Natural resources and bioeconomy studies 80/2017
105
were not significant. By reason of these findings it can be concluded, that the partial substitution of softwoods by hardwoods in industrial panel production can be realized without quality decrease, if the production parameters (refining conditions, degree of substitution, used wax type) are adapted to the type of panel produced, and the kind raw material dominantly used for the production.
Figure 7. Water Absorption and Thickness Swelling of HDF produced with different raw materials and hydrophobic agents (wax)
Renaissance of hardwood veneer based engineered wood 2.2.products
In an extensive national project called OptiPro the pretreatment of beech wood logs concerning cooking or steaming, using different temperatures from 40°C – 80°C and times from 3 days to weeks were tested. After the peeling and air drying process the quality of the veneer surfaces were evaluated concerning the roughness, colors and cracks. For the detection of lathe checks which occur only in the peeling process, a new ultrasound excited thermographic testing system was used to let the cracks appear as bright lines (see Figure 8b and thermogram in Figure 8c).
In the next step the dried veneer were sent to another Fraunhofer Institute (Umsicht) for a special impregnation process under a high-pressure CO2 atmosphere to reach different amounts of phenolic resin into the veneer.
Afterwards the impregnated veneers were send back for producing 7 layer plywood for testing the water uptake and its swelling and shrinkage behavior.
Finally, special test samples with different artificial but real defects were produced and mechanically tested for bending and compression strengths. The results of the bending tests are shown in the following graphics.

Natural resources and bioeconomy studies 80/2017
106
Figure 8. Peeling process at WKI (a); shape of test samples (b); thermogram of sample (c)
Figure 9. Test samples with a butt joint (left), a 4 cm long defect (center) and a 8 cm long defect (right)
Figure 10. MOE of different test samples showing best values with no defects and butt joints
Conclusions 3.Softwood is the preferred raw material of the wood-based panel industry in most European countries. The production of OSB, MDF and PB is primary based on spruce, pine and fir. The production of veneer based hardwood panels from species like beech or birch decreased drastically (plywood) in the last decades or was not established at all in Europe, because of problems regarding costs and effectivity of the production process (e.g. LVL). Due to supply shortfalls and rising costs of softwood timber, engineered wood products (EWP) based on hardwood is currently of increasing interest for both side’s sciences and industry. Therefore the results of projects focusing on the utilization of hardwood for the wood-based panel production conducted at Fraunhofer WKI in the

Natural resources and bioeconomy studies 80/2017
107
recent years (e.g. OSB based on old beech wood) are presented in this article. Currently these activities are being intensified by national and international project initiatives.
With respect to the substitution of softwood by hardwood for the production of wood-based panels like OSB or MDF it becomes obvious, that the utilization of hardwoods (focus: beech wood timber) is possible and already state of the art in industrial production lines. For a successful integration of hardwoods in these production processes, raw material disintegration (refining conditions) and use of additives (special type of wax and/or adhesives) have to be modified according to used timber species. Moreover it could have been shown that under industrial production environments a partial substitution of softwoods by hardwoods is the most realistic and sustainable solution.
Besides the substitution of softwood by hardwood in existing production lines for OSB, MDF or PB, a renaissance and redevelopment of hardwood veneer based Engineered Wood Products in Germany and Europe can be observed. Current projects of WKI are aiming at the optimization of the pre-treatment of logs and the peeling process itself. Besides that, new products and a greater range of use for these materials are in the focus of these studies.
Acknowledgements Our special thanks go to the funding Organizations supporting our work and enabling us to conduct the studies presented in this paper!
References Bowyer, J.; Shmulsky, R.; and Haygreen, J. (2007) Forest Products and Wood Science - an Introduction,
5th edition. Ames: Blackwell Publishing, 558 pp. Bribian, I.Z.; Capilla, A.V.; Uson, A.A. (2011) Life cycle assessment of building materials: Comparative
analysis of energy and environmental impacts and evaluation of the eco-efficiency improvement potential. Build. Environ. 46: 1133–1140.
Buchanan, A.H. (2006) Can Timber Buildings Help Reduce Global CO2 Emissions? Proceedings, World Conference on Timber Engineering. Portland, Oregon, USA (2006).
Buchanan, A.H. (2010) Energy and CO2 advantages of wood for sustainable buildings. Proceedings, World Conference on Timber Engineering. Riva-del-Garda, Italy
Dieter, M. 2003: Holzbilanzen 2001 und 2002 für die Bundesrepublik Deutschland. Arbeitsbericht des Instituts für Ökonomie 2003/2 der BFH-Hamburg, 4 Seiten
Dieter, M. 2011: Aufkommen und Verwendung von Buchenholz in Deutschland. Johann-Heinrich von Thünen-Institut Hamburg, Institut für Ökonomie der Forst- und Holzwirtschaft. Präsentation im Rahmen der Tagung „Perspektiven der stofflichen Nutzung der Buche“ vom 11. November 2011, Kompetenznetz für Nachhaltige Holznutzung e. V. (NHN), Göttingen. Folie 9
Dünisch, O., Richter, H.-G. and Koch, G. (2010) Wood properties of juvenile and mature hertwood in Robinia pseudoacacia L. Wood. Sci Technol. 44: 301-313.
FAO (2014): http://www.fao.org/faostat/en Ge, J.; Shi, X.; Cai, M.; Wu, R.; Wang, M. (2003) A novel biodegradable antimicrobial PU foam from
wattle tannin J. Appl. Polymer Sci. 90: 2756 Hynynen J.; Niemistö, P.; Viherä-Aarnio A.; Brunner, A; Hein, S. and Velling, P. (2010) Silviculture of
birch (Betula pendula Roth and Betula pubescens Ehrh.) in northern Europe. Forestry: An International Journal of Forest Research, Volume 83, Issue 1, 1 January 2010, Pages 103–119.
Kharazipour, A. 2005: Holz als Werkstoff. In: Jahrbuch Nachwachsende Rohstoffe, 2004/2005. Herausgeber: C.A.R.M.E.N. e. V.
Kuittinen M., Ludvig A., Weiss G. (2013) Wood in Carbon Efficient Construction; Tools, method and applications. HÄMEEN KIRJAPAINO OY, 163 pp.
Laitinen, M.-L.; Julkunen-Tiitto, R.; Yamali, K.; Heinonen, J.; Rousi, M. (2004) Variation in bark secondary compounds between and within clones: implication for herbivory. Oikos 104: 316-326.
Laitinen, M.-L.; Julkunen-Tiitto, R.; Tahvanainen, J.; Heinonen, J.; Rousi, M. (2005) Variation in birch (Betula pendula) bark secondary chemistry due to genotype, environment and ontogeny. J. Chem.Ecology 31 (4): 697-717.
Natural resources and bioeconomy studies 80/2017
108
Mantau, U. 2012: Standorte der Holzwirtschaft, Holzrohstoffmonitoring, Holzwerkstoff¬indus-trie – Kapazitätsentwicklung und Holzrohstoffnutzung im Jahr 2010. Universität Hamburg, Zentrum Holzwirtschaft. Arbeitsbereich Ökonomie der Holz- und Forstwirtschaft. Hamburg, 2012
Marutzky, R. 2004: Biomassen auf Basis von Holz als Brennstoffe in Österreich, der Schweiz und Deutschland. Nutzungssituationen – Theoretische und reale Potentiale – Qualitäten – Wettbewerbssituation – Preistendenzen. Download 2004 auf der Homepage des WKI
Nelson, W. (2002) Compressed Earth Blocks. In J. F. Kennedy, M. G. Smith & C. Wanek (Eds.), The Art of Natural Building (pp. 138-142). Gabriola Island BC: New Society Publishers.
Parmesan, C.; Yohe, G. (2003) A globally coherent fingerprint of climate change impacts across natural systems. Nature 421: 37-42.
Seintsch, B.; Rosenkranz, L. 2014: Mögliche Wirkungen des Waldnaturschutzniveaus auf die holzbasierte Wertschöpfung in Deutschland. Vortrag auf dem 3. Workshop der Dialogplattform Wald, 28.-29.4.2014 in Brilon http://www.forumue.de/uploads/media/2_Seintsch.pdf
Spellmann, H. 2013: Masse statt Klasse? Waldbauliche Konsequenzen aus einer veränderten Rohholznachfrage. AFZ/Der Wald, 68. Jg., 9, 10-15
Tegelberg, R; Julkunen-Tiitto, R.; Aphalo, P.J. (2002) The effects of long-term elevated ultraviolet-B radiation on phytochemicals in the bark of silver birch (Betula pendula). Tree Physiology 22: 1257-1263.
UNECE/FAO (2015): Forest Resources Assessment. http://www.unece.org/forests/areas-of-work/forest-resources.html
UNECE/FAO (2010): Growing stock by forest type. http://w3.unece.org/PXWeb2015/pxweb/en/STAT/STAT__26-TMSTAT1__010-TM15FR1/040_en_TM15_1_2b_r.px/?rxid=c1a6a45d-e4d4-408a-8713-561795f26369
VHI - Verband der deutschen Holzwerkstoffindustrie 2015: Branchendaten Holzwerkstoffe - Holzwerkstoffproduktion in Deutschland 2014. Online Dokument: http://vhi.de/holzwerkstoffe/branchendaten/
ZMP (2008): ZMP-Marktbilanz Forst und Holz 2008. ZMP Zentrale Markt- und Preisberichts-stelle, Bonn, 145 S.

Natural resources and bioeconomy studies 80/2017
109
U.S. secondary wood manufacturers are becoming larger – are there implications for hardwood sawmills?
Matthew Bumgardner1, Urs Buehlmann2, Omar Espinoza3
Abstract
Previous research has shown that large secondary wood manufacturers request numerous product-related services from their hardwood lumber suppliers. In addition, large secondary manufacturers also source more of their lumber directly from hardwood sawmills than do smaller secondary manufacturers, which tend to purchase more lumber from distributors. Current trends in the U.S. hardwood industry suggest that secondary manufacturers are becoming larger in size and more concentrated (excluding the wood household furniture sector), a reversal of a trend toward smaller size during the Great Recession that started in 2007. Furthermore, many secondary manufacturers have been focusing on reducing input costs in conjunction with more streamlined or lean manufacturing processes. Thus, it might be expected that these manufacturers would be seeking more services from hardwood sawmills regarding their lumber purchases. This notion is consistent with the results from a recent small survey, which indicated that hardwood sawmills are experiencing an increase in the services being requested by their customers. Concurrently, hardwood sawmills in the United States are showing a trend of increasing size and concentration as well, also reversing patterns evident during the Great Recession. Thus, many hardwood sawmills seem well-positioned to provide these extra services. The resource-based view of the firm states that larger firms possess more internal capabilities and resources, which in this case can help sawmills meet the market demand of providing more product-related services to secondary manufacturers.
Introduction 1.There are several compelling reasons why firms within a given industry tend to grow larger over time. In fact, the growth of the firm over time is the prevalent trajectory within a given economy (Penrose 1995). Some of the reasons for this include the advantages associated with economies of scale and scope, as well as experience effects (Ghemawat 1986). Additionally, the resource-based view (RBV) of the firm is consistent with the notion of firm growth over time and states that larger firms possess more internal capabilities and resources than smaller firms, giving them a competitive advantage (Hoopes et al. 2003). For example, several studies have shown that larger hardwood sawmills are more likely than smaller mills to be exporters (Bumgardner et al. 2016). Other RBV studies have suggested that investment capital and the skills needed to start up and exploit modern technology are resources associated with larger sawmills (Lähtinen et al. 2008).
While large firms generally are most competitive in expanding economies, previous research in the wood products industry has shown that smaller firms might actually have a competitive advantage when markets are declining (Bumgardner et al. 2011). The primary reason for this finding was that small firms (defined in the study as those with fewer than 20 employees) were closer to their customers and thus able to fully customize products when market conditions were difficult.
Corresponding author: Tel.: +15402319759; E-mail: [email protected]
1Northern Research Station U.S. Forest Service
Delaware, Ohio 43015 USA
3Department of Bioproducts and Biosystems
Engineering University or Minnesota
St. Paul, Minnesota 55108 USA
2Department of Sustainable Biomaterials
Virginia Tech Blacksburg, Virginia 24061
USA

Natural resources and bioeconomy studies 80/2017
110
During economic downturns, the inherent advantages associated with being a larger manufacturer are less compelling; for example, large firms have relatively high fixed costs and economies of scale are less favorable when demand contracts.
Given the discussion above, it might be expected that housing-related sectors in the United States (cabinets and millwork) would show a pattern of increasing firm size up to the Great Recession that started in 2007, followed by a period of declining firm size during the recession and associated housing downturn, to a return to growth coming out of the recession. The exception might be the wood household furniture industry, which has not been globally competitive in the United States for a number of years (Lihra et al. 2008; Luppold and Bumgardner 2009). For this sector, employment has been in long-term structural decline.
As secondary manufacturers grow larger, it might be expected that their manufacturing and supplier needs would change. It has been shown that larger firms in the secondary woodworking industry (20 employees or more) generally request more services from their lumber suppliers than do smaller manufacturers (Buehlmann et al. 2013). Out of the ten services investigated in that study, only S2S (surfacing lumber on two sides) was requested significantly more by smaller firms. Conversely, four of the ten services investigated were requested signficiantly more by larger firms. This is likely due to the fact that large secondary firms are seeking to reduce input costs in conjunction with more streamlined or lean manufacturing processes (Buehlmann et al. 2013). In addition to requesting more services from their suppliers, large secondary woodworking firms sourced more of their lumber directly from sawmills than did smaller firms, which relied more on distribution yards for their lumber purchasing. Nearly 45% of large firms’ lumber purchasing came
directly from sawmills, on average, while just 29% of small firms’ purchases came directly from
sawmills (Buehlmann et al. 2013).
Study objectives 1.1.The preceding discussion indicates that secondary hardwood manufacturers (except furniture manufacturers) generally would be expected to be growing larger in size (by number of employees) coming out of the Great Recession. For this paper, the recessionary period was expressed in annual terms as lasting from 2007 to 2009; the starting point for the analysis was chosen to be 2003 because another recession ended in 2002 (Luppold and Bumgardner 2016a).
Furthermore, large secondary manufacturers have been shown to require numerous services from their hardwood lumber suppliers and to source much of their hardwood lumber directly from sawmills. Taken together, it would be expected that if U.S. secondary manufacturers are in fact becoming larger, then U.S. hardwood sawmills would be realizing increasing demand for a number of product-related services. These notions were investigated using secondary data and the results from a survey.
Methods 2.
Secondary data component – firm size trends 2.1.Data available from the U.S. Bureau of Labor Statistics (2017) was used to determine average firm size from 2001 to 2015 for the follwing U.S. sectors: wood kitchen cabinet and countertops (North American Industry Classification System [NAICS] 337110), millwork (which includes flooring) (NAICS 32191), nonupholstered wood household furniture (NAICS 337122), and sawmills (NAICS 321113). Firm size was derived by dividing total employment by the total number of firms for each sector for each year. Although other measures of firm size are sometimes used (e.g., annual turnover, annual sales), employment and firm data were readily available from secondary sources and simple to track
Natural resources and bioeconomy studies 80/2017
111
through time. The resulting value is termed “average” firm size for this paper, even though it was
calculated as a ratio rather than a true average (an average would require a list firms and their corresponding number of employees).
For hardwood sawmills, average firm size was calculated using only states with at least 60% of their lumber production in hardwood as discussed in Bumgardner et al. (2016). This was necessary because sawmill employment is not separated by hardwood and softwood mills in the Bureau of Labor Statistics data, so the only way to develop data specific to hardwood lumber is to limit the analysis to primarily hardwood lumber-producing states. Sixteen states were included. Data for wood kitchen cabinets, nonupholstered wood household furniture, and millwork were national in scope since the breakdown of hardwood use by region was not known for these sectors. The latest year for which data was available at the time of the study was 2015.
Primary data component – changes in sawmill services 2.2.An internet-based survey was conducted in the winter and early spring of 2016 with members of the National Hardwood Lumber Association (NHLA). Sawmill representatives were invited to visit a website containing a 26-question survey instrument via NHLA and Virginia Tech newsletters (companies were not sent the questionnaire directly). A total of 12 usable questionnaires were returned; the responding mills collectively produced about 210 million board feet (MMBF) of lumber (495,000 cubic meters or m3) in 2015. This figure represented about 2.2% of U.S. hardwood lumber consumption (including exports) in 2014 (Luppold and Bumgardner 2016b). Although the sample size was quite small, the data could be used in conjunction with the secondary data analysis to help understand if the services being requested of hardwood sawmills were increasing.
Most of the mills (n=7) reported total hardwood lumber production in the range of 6 to 20 MMBF (14,160 to 47,200 m3) in 2015; two mills reported production of less than 6 MMBF and three mills reported production of 21 MMBF (49,560 m3) or more. Only 1 responding mill indicated that their production volume was lower in 2015 than in 2011. The respondents were dispersed geographically, with five located in the Midwest, four in the South, and three in the Northeast. Nearly all of the responding mills (n=10) exported hardwood lumber. Only one respondent reported that their average customer was smaller in 2016 compared to five years prior. Conversely, in previous research conducted during the housing downturn, 41% of hardwood sawmills had indicated that their average customer was smaller in size in 2008 than five years prior (Espinoza et al. 2011), which is consistent with the notion that firm size decreases during periods of economic decline.
The main research questions for the present study were: “What services were being requested
by your hardwood lumber customers in 2011 and 2015?” and “What services did you offer in 2015?” The response format was to check all that applied from a list of 18 potential product-related services.
Results 3.
Firm size trends 3.1.As shown in Figure 1, the expectations based on the the literature review were consistent with firm size trends in the wood kitchen cabinet sector (U.S. Bureau of Labor Statistics 2017). This sector, which remains competitive in the United States, showed a period of growth in average firm size through 2006, followed by a period of declining firm size during the Great Recession, and a return to growth coming out of the recession. The U.S. millwork sector showed a similar overall pattern and is illustrated separately from the other secondary sectors given its larger average firm size (Figure 2). In contrast, the U.S. nonupholstered wood household furniture sector realized a long-term decline in average firm size (Figure 1). Thus, in periods of market decline, whether due to cyclical economic

Natural resources and bioeconomy studies 80/2017
112
conditions (i.e., the case with the cabinet and millwork sectors), or long-term structural decline (i.e., the case with the wood houeshold furniture sector), it can be seen that firms tend to become smaller. Conversely, they grow larger when markets are expanding (such as the case with cabinets and millwork, pre- and post-recession). It is interesting to note that the year 2015 marked the first time in the data series where the average U.S. cabinet firm was larger than the average U.S. wood household furniture firm (Figure 1).
Figure 1. Number of employees per firm for the U.S. nonupholstered wood household (HH) furniture and wood kitchen cabinet sectors (developed from U.S. Bureau of Labor Statistics 2017).
Figure 2. Number of employees per firm for the U.S. millwork sector (developed from U.S. Bureau of Labor Statistics 2017).
Similar to the U.S. cabinet and millwork sectors, U.S. hardwood sawmills also showed a general trend toward increasing firm size with the exception being during the Great Recession (Figure 3). For hardwood sawmills, firm size growth actually seems to have accelerated since the recession.
9
11
13
15
17
19
21
23
2003 2004 2005 2006 2007 2008 2009 2010 2011 2012 2013 2014 2015
Empl
oyee
s pe
r firm
Wood HH Furniture Cabinets
22
24
26
28
30
32
34
36
2003 2004 2005 2006 2007 2008 2009 2010 2011 2012 2013 2014 2015
Empl
oyee
s pe
r firm
Millwork

Natural resources and bioeconomy studies 80/2017
113
Figure 3. Number of employees per firm for U.S. hardwood sawmills (developed from U.S. Bureau of Labor Statistics 2017).
Changes in sawmill services 3.2.The results of the primary research questions are shown in Table 1. Seven of the listed services were requested of at least half of the responding mills in 2015, including double-end trimming, kiln drying, S2S, special grading, width sorting, quick delivery, and color sorting.
The overall result was that for every responding mill, each service was requested the same or more in 2015 than 2011. Eight of the 18 services (or eight out of 12 services if considering only those services that were requested at least once) showed an increase in the number of mills indicating that they were requested more in 2015 than 2011. Two of these services, special grading and quick delivery, realized double-digit gains in requests over the period. The general trend is consistent with the notion that more services are being requested of hardwood sawmills. Table 1 also shows the percentage of responding mills providing each service in 2015. The levels of services provided generally are close to the percentages being requested in 2015, although several are slightly lower. However, there were two services whose offered percentage was somewhat lower than what was being requested (by double-digits), including S2S and width sorting.
Respondents also were given space on the questionnaire to respond to an open-ended question asking how their hardwood lumber customers were changing. Several of the comments anecdotally supported the notion that services were becoming increasingly important. For example, one respondent wrote that they were seeing “more specific specifications for widths, lengths, color and
grain.” Another indicated their customers were “more inventory conscious” and another respondend that customers were “more demanding.” One respondent wrote, “Our customers continually want
high quality, consistent lumber. Price does not drive orders as much as in the past.” Five respondents said they perceived no changes with customers and the remainder (n=3) mentioned other changes.
12
13
14
15
16
2003 2004 2005 2006 2007 2008 2009 2010 2011 2012 2013 2014 2015
Empl
oyee
s pe
r firm
Hardwood Sawmills

Natural resources and bioeconomy studies 80/2017
114
Table 1. Percentage of sawmills (n=12) receiving requests from customers for 18 product-related services in 2011 and 2015, and the percentage of those sawmills offering the services in 2015.
Service Requested
Requested 2011 (%)
Requested 2015 (%)
Increased, Equal, or
Decreased Offered 2015
(%) Double-end trim 83 92 + 92
Kiln drying 75 75 = 83 S2S 58 67 + 50
Special grading 50 67 + 58 Width sorting 58 67 + 50 Quick delivery 42 58 + 50 Color sorting 50 50 = 42
Just-in-time orders 33 42 + 42 Break bundles 17 25 + 33
S4S 17 17 = 17 Custom molding 0 8 + 8 Custom flooring 0 0 = 0
Imported species 0 0 = 0 Profile sanding 0 0 = 0
Priming 0 0 = 0 Embossing 0 0 = 0 Finishing 0 0 = 0
Other (i.e., “phytosanitary heat treat”)
8 8 = 8
Discussion 4.The results of the present study are interesting in that trends in average firm size are consistent with what would be predicted based on theories of the growth of firms. Namely, firms tend to grow larger over time with the exception of periods of market decline. Of the hardwood sectors investigated, only nonupholstered wood household furniture has shown a long-term decline in average firm size. Structural change has reduced the competitiveness of this sector in the United States. Therefore, smaller wood furniture firms are finding niches protected from larger scale production overseas, and “smallness” might actually have become a competitive advantage (Buehlmann et al. 2011). Other major parts of the secondary hardwood industry have realized increasing average firm size since 2010. Similarly, hardwood sawmills have been increasing in size since 2009.
As secondary wood firms grow larger in size, previous research suggests that they can be expected to request more services from their hardwood lumber suppliers. This notion was supported by the present small survey, which showed that several of the services invesitgated were being requested more frequently in 2015 than in 2011. None were being requested less frequently.
Going forward, sawmills likely will need to be prepared to offer more services to their customers. The RBV, which states that internal capabilities and resources are the main source of competitive advantage for firms, suggests that sawmills will be well-positioned to meet this market demand given that they too show a trend of increasing size over time (outside of the recessionary period). However, S2S and width sorting are services that currently might be under-provided by hardwood sawmills.

Natural resources and bioeconomy studies 80/2017
115
References Buehlmann, U., M. Bumgardner, and M. Sperber. 2013. How small firms contrast with large firms
regarding perceptions, practices, and needs in the U.S. secondary woodworking industry. BioResources. 8(2):2669-2680.
Bumgardner, M., U. Buehlmann, A. Schuler, and J. Crissey. 2011. Competitive actions of small firms in a declining market. Journal of Small Business Management. 49(4):578-598.
Bumgardner, M., S. Bowe, and W. Luppold. 2016. Are there regional differences in US hardwood product exports? Forest Products Journal. 66(3/4):140-146.
Espinoza, O., U. Buehlmann, M. Bumgardner, and B. Smith. 2011. Assessing changes in the U.S. hardwood sawmill industry with a focus on markets and distribution. BioResources. 6(3):2676-2689.
Ghemawat, P. 1986. Sustainable advantage. Harvard Business Review. 64(5):53-58. Hoopes, D.G., T.L. Madsen, and G. Walker. 2003. Guest editor’s introduction to the special issue: why is
there a resource-based view? Toward a theory of competitive heterogeneity. Strategic Management Journal. 24:889-902.
Lihra, T., U. Buehlmann, and R. Beauregard. 2008. Mass customization of wood furniture as a competitive strategy. International Journal of Mass Customization. 2(3/4):200-215.
Lähtinen, K., A. Haara, P. Leskinen, and A. Toppinen. 2008. Assessing the relative importance of tangible and intangible resources: empirical results from the forest industry. Forest Science. 54(6):607-616.
Luppold, W.G. and M.S. Bumgardner. 2009. The wood household furniture and kitchen cabinet industries: a contrast in fortune. Forest Products Journal. 59(11/12):93-99.
Luppold, W.G. and M.S. Bumgardner. 2016a. Employment changes in U.S. hardwood lumber consuming industries during economic expansions and contractions since 1991. BioResources. 11(2):3123-3135.
Luppold, W.G. and M.S. Bumgardner. 2016b. US hardwood lumber consumption and international trade from 1991 to 2014. Wood and Fiber Science. 48(3):162-170.
Penrose, E. 1995. The Theory of the Growth of the Firm. 3rd ed. Oxford University Press, Oxford, New York. 272 pp.
U.S. Bureau of Labor Statistics. 2017. Quarterly census of employment and wages. http://www.bls.gov/data/. Accessed January 18, 2017.

Natural resources and bioeconomy studies 80/2017
116
Hardwood research at the Georg-August University of Goettingen
Susanne Bollmus*, Antje Gellerich, Philipp Schlotzhauer, Georg Behr, Holger Militz
Wood Biology and Wood Products University of Goettingen, Lower Saxony, 37077, Germany
Abstract
Hardwood research along with softwood research has always been on the agenda of the Georg-August-University of Goettingen. During the last 15 years the focus was mostly set on wood modification and impregnation. In April 2012, a special research group was initiated and financed by the “German Federal Ministry of Food and Agriculture”. The title of the five-year project was “New markets and applications for native hardwood species”. The project was subdivided into three parts: (1) The use of deciduous lumber for structural purposes, (2) Deciduous lumber for exterior uses (3) The use of deciduous lumber for wood based composites. This paper aims on sketching the most important results from this project, which ended in February 2017. Part (1) looked at the European hardwoods and their suitability for structural applications – especially in glulam. Four candidate species were identified and sets of data were gathered, which are believed to help with the application of hardwoods in construction. Part (2) focused on the modification of four native hardwoods in order to adapt their characteristics to the requirements of outdoor applications such as cladding, decking and railway sleepers. Part (3) investigated the possibility of applying beech LVL in use classes 2 (under cover and exposed to the weather, wetting can occur) and 3 (exterior, above ground, exposed to weather) according to EN 335. Therefore, different modification and impregnation substances and processes were tested.
Introduction 1.New approaches to silviculture call for a maximum increase of biodiversity in forests through the creation of mixed forests. Therefore, more hardwood material will be available in the near future. It is the declared political will to introduce these hardwood resources into the building sector for a non-energetic use (Nds. Landesforsten 2011).
In 2012, softwoods covered more than 75 % of the total 70 Mio. m³ annual harvest in Germany. While 80 % of this total amount was used for wood and wood products, 20 % were processed for bio-energy use. For hardwoods, the proportion was the opposite, only 35 % were used in the building sector (BMEL 2016). Therefore, in the future it will be necessary to use hardwoods more extensively for non-bio-energy uses to meet upcoming demands. To ensure future resources for the wood industry new strategies for improving the utilization of hardwoods normally exclusively used for bio-energy are needed.
German forests (11.4 Mio. ha) are at present stocked with approximately 54 % of coniferous tree species and 43 % of deciduous tree species. Hardwood forest areas grew around 7.3 % from 2002 to 2012, while the softwood forest area shrunk by 4.3 % during the same time period. Most wood species are used sustainably. However, the use of Norway spruce (Picea abies) wood was 15 % higher than the sustainable growth rate. While the available softwoods in German forests are used extensively, there is still considerable potential for the use of hardwoods. Beech (Fagus sylvatica) and oak (Quercus sp.) wood is widely used (beech mainly for bio-energy) whereas species like birch (Betula sp.) and ash (Fraxinus excelsior) require further applications, e.g. based on their good mechanical properties. * Corresponding author: Tel.: +4955119514; E-mail: [email protected]
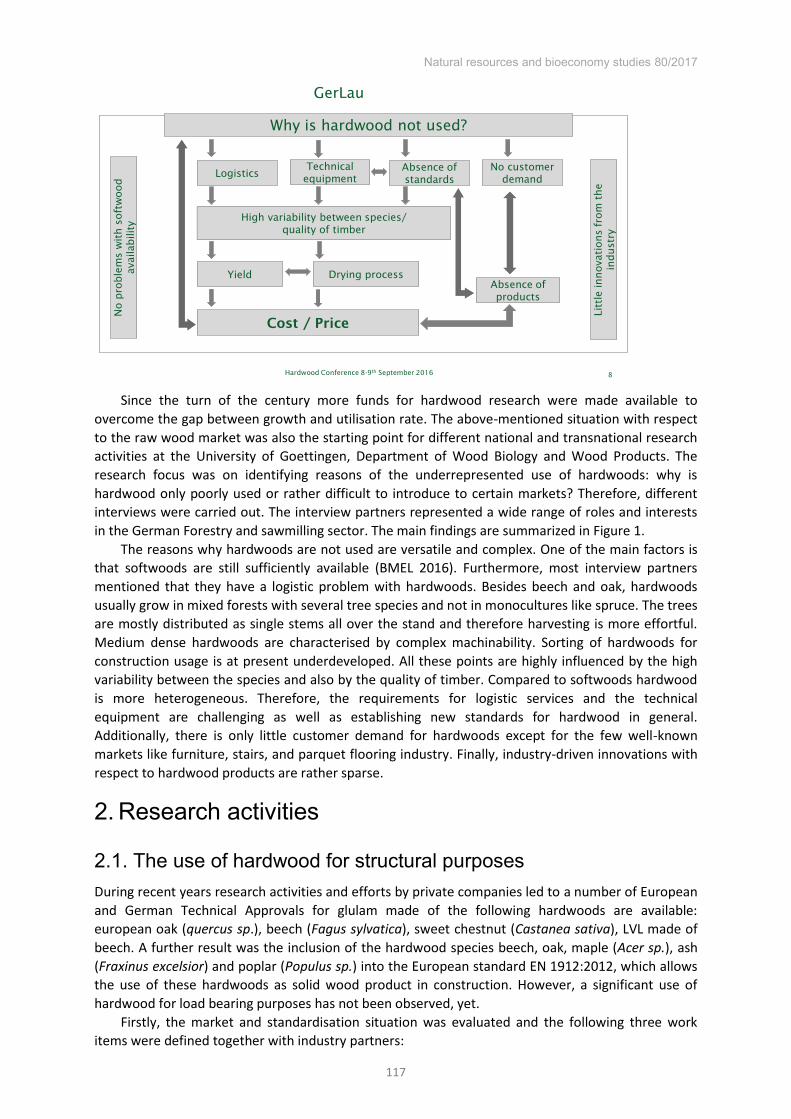
Natural resources and bioeconomy studies 80/2017
117
Figure 1. Flow chart “Why is hardwood not used
Since the turn of the century more funds for hardwood research were made available to overcome the gap between growth and utilisation rate. The above-mentioned situation with respect to the raw wood market was also the starting point for different national and transnational research activities at the University of Goettingen, Department of Wood Biology and Wood Products. The research focus was on identifying reasons of the underrepresented use of hardwoods: why is hardwood only poorly used or rather difficult to introduce to certain markets? Therefore, different interviews were carried out. The interview partners represented a wide range of roles and interests in the German Forestry and sawmilling sector. The main findings are summarized in Figure 1.
The reasons why hardwoods are not used are versatile and complex. One of the main factors is that softwoods are still sufficiently available (BMEL 2016). Furthermore, most interview partners mentioned that they have a logistic problem with hardwoods. Besides beech and oak, hardwoods usually grow in mixed forests with several tree species and not in monocultures like spruce. The trees are mostly distributed as single stems all over the stand and therefore harvesting is more effortful. Medium dense hardwoods are characterised by complex machinability. Sorting of hardwoods for construction usage is at present underdeveloped. All these points are highly influenced by the high variability between the species and also by the quality of timber. Compared to softwoods hardwood is more heterogeneous. Therefore, the requirements for logistic services and the technical equipment are challenging as well as establishing new standards for hardwood in general. Additionally, there is only little customer demand for hardwoods except for the few well-known markets like furniture, stairs, and parquet flooring industry. Finally, industry-driven innovations with respect to hardwood products are rather sparse.
Research activities 2.
The use of hardwood for structural purposes 2.1.During recent years research activities and efforts by private companies led to a number of European and German Technical Approvals for glulam made of the following hardwoods are available: european oak (quercus sp.), beech (Fagus sylvatica), sweet chestnut (Castanea sativa), LVL made of beech. A further result was the inclusion of the hardwood species beech, oak, maple (Acer sp.), ash (Fraxinus excelsior) and poplar (Populus sp.) into the European standard EN 1912:2012, which allows the use of these hardwoods as solid wood product in construction. However, a significant use of hardwood for load bearing purposes has not been observed, yet.
Firstly, the market and standardisation situation was evaluated and the following three work items were defined together with industry partners:
No p
roble
ms
wit
h s
oft
wood
avai
labili
ty
Technical equipment
Litt
le innova
tions
from
the
indust
ry
Why is hardwood not used?
GerLau
LogisticsAbsence of standards
High variability between species/quality of timber
Yield Drying processAbsence of products
Cost / Price
No customer demand
8Hardwood Conference 8-9th September 2016

Natural resources and bioeconomy studies 80/2017
118
(A) Strength grading, (B) Surface gluing, and (C) Yield.
Special emphasis was on item A (strength grading), where a high improvement potential was seen. The suitability for a wider use of the six European hardwood species oak, beech, ash, maple, lime (Tilia sp.) and birch (Betula pendula) was investigated. Therefore, timber availability and the distribution of characteristics of sawn timber (of typical, market-available assortments) were determined. For ash and maple a yield analysis from round wood sections to sorted glulam lamellas was carried out (work item C), which pointed out the need for improved sawing techniques (incl. sawing pattern), an optimised drying technology and adapted sorting schemes (Schlotzhauer et al. 2017b). When it comes to timber sorting, the grain angle is highly correlated with the final tensile strength of the glulam lamella It is technically complicated to determine the grain angle on hardwoods in a non-destructive way. In the course of this project, it was proved that for all the above-mentioned hardwood species it is possible to determine the grain angles by machine use (Schlotzhauer et al. 2017a). Furthermore, “size effect” were examined (Schlotzhauer et al. 2015) for
bending, tension and compression parallel to grain (for all six species) as well as tension and compression perpendicular to grain (for ash, maple and beech). In addition, compression and tension tests on glulam lamellas were carried out and the results were correlated with the sorting results (Schlotzhauer et al. 2017b). These experiments revealed the unused potentials (in standard strength values) of some of the hardwoods, but also pointed out the difficulties in increasing the final yield (e.g. lower production costs). The evaluation of the suitability of commercially available gluing systems for surface gluing (work item B) was carried out for the species ash, maple and beech. The resistance to delamination was often not satisfying (Persch 2016).
Hardwood for exterior uses 2.2.
2.2.1. Treatment of hardwood with conventional wood preservatives Without treatment most of the native hardwood species are not suitable for exterior use because of their low natural durability (EN 350:2016) and poor dimensional stability. To improve the resistance against wood destroying organisms and the swelling and shrinkage behaviour the use of conventional wood preservatives and different wood modification systems was investigated. In most European countries, wood preservatives are exclusively applied to softwoods. Therefore, formulation of wood preservatives, efficacy thresholds and schedules of impregnation processes are made for softwoods. However, due to different anatomical features and chemical composition, impregnation and fixation mechanisms in hardwoods are likely different from softwoods. Hence, the following research topics were of interest:
Penetration, distribution, and fixation of wood preservatives in different hardwoods Protective effectiveness of wood preservatives in hardwoods against brown and white rot
fungi (comparison of threshold values between softwoods and hardwoods) Impact of preservative treatment on mechanical properties of hardwood
Wood specimens made from beech, oak, poplar and birch were impregnated with different water borne preservatives. The wood preservatives, which were already approved for softwood, need to be adopted and optimized for hardwoods (Bollmus and Gellerich 2017). This study is still ongoing and further investigations will be carried out to understand the different modes of action in hardwoods and softwoods to optimize impregnation processes and the distribution of active ingredients within the wood matrix.

Natural resources and bioeconomy studies 80/2017
119
2.2.2. Wood modification of different hardwood species Different wood modification systems were considered to improve the usability of hardwoods outdoors focussing on use class 3 (EN 350: 2016) conditions (exterior, above ground, exposed to weather), e.g. for cladding or decking elements. Two wood modification systems (heat treatment and wood modification with methylated melamine formaldehyde resin) were applied, adapted and combined to produce competitive materials for outdoor applications made from native hardwoods. In close cooperation with industry partners, the scope of the investigation was the development of a solid wood-based substitute for tropical wood species. This two-step modification process was chosen to generate a technical and optical equivalent wood for this purpose.
Beech, ash, lime and poplar were chosen because of their high availability and treatability. The double modification increased dimensional stability and hardness. The modulus of elasticity (MOE) and the modulus of rupture (MOR) were almost unaffected, whereas the work in bending was negatively influenced (Behr et al. 2017a). It became also evident that an adjustment of the process parameters was necessary to improve the crack resistance and to reduce the embrittlement of the modified wood (Behr et al. 2017b). Therefore, different tests were carried out to optimize the modification process. The influence of the different parameters and the quality of the modification process were controlled by the determination of the nitrogen content, the fixation of the modification chemicals, the work in bending, and formaldehyde emissions (Behr et al. 2017c).
Secondly, German hardwoods were acetylated to enhance their performance. The investigations were carried out in cooperation with Accsys Technologies (Arnhem, The Netherlands). Accsys Technologies is working on the development of commercially viable acetylation processes for additional wood species. Beech, alder, lime and maple were acetylated in an industrial process to high loadings in commercial sizes. The resistance of the material against fungal decay was tested according to CEN/TS 15083-1 using Rhodonia (Poria) placenta and Trametes versiolor. Only very little mass losses were determined for the acetylated wood indicating significantly improved durability if exposed outdoors. Furthermore, dimensional stability tests (Anti-Swelling-Efficiency) showed that the acetylated wood was highly dimensional stable under cyclic changing moisture conditions. In addition, the performance under artificial weathering and the mechanical properties (hardness, bending strength and stiffness) of the acetylated woods were determined. The results were overall promising and upscale efforts will be made to demonstrate uniformity and reproducibility of the acetylated (German) hardwoods (Bollmus et al. 2015).
2.2.3. Potential substitute products for the use of creosote in railway sleepers made of Beech
An important field of application for beech wood in Germany are railway sleepers. Standard track sleepers are made of creosote impregnated beech. Creosote as an oil-based wood preservative is one of the oldest industrially used wood preservatives for products in heavy-duty applications (use class 4) like railway sleepers, timber bridges, utility poles and piles in the marine environment (use class 5). Because of its high variety of chemical compounds, creosote provides a wide spectrum of efficiency against wood destroying fungi (especially soft rot), insects and marine borers. Additionally, the hydrophobic character of the oil reduces the water uptake of impregnated timber. However, creosote is classified as harmful to the environment and human health. Therefore, its use is restricted for selected products and a complete ban is expected for the near future. This leads to the necessity for finding alternative products.
The first step of the project was, to investigate the reasons for (premature) failure of sleepers to use this information to create optimal novel protection systems for the impregnation of railway sleepers. It was investigated whether mechanical or biological defects are the main cause of failure.
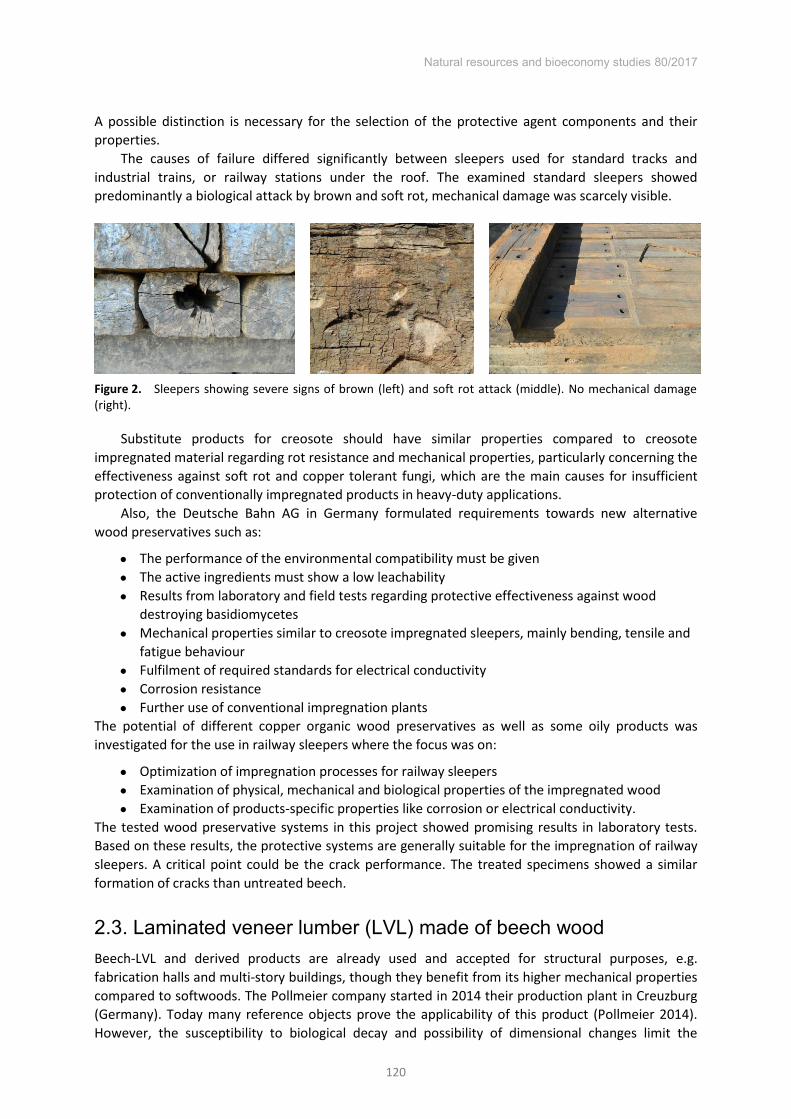
Natural resources and bioeconomy studies 80/2017
120
A possible distinction is necessary for the selection of the protective agent components and their properties.
The causes of failure differed significantly between sleepers used for standard tracks and industrial trains, or railway stations under the roof. The examined standard sleepers showed predominantly a biological attack by brown and soft rot, mechanical damage was scarcely visible.
Figure 2. Sleepers showing severe signs of brown (left) and soft rot attack (middle). No mechanical damage (right).
Substitute products for creosote should have similar properties compared to creosote impregnated material regarding rot resistance and mechanical properties, particularly concerning the effectiveness against soft rot and copper tolerant fungi, which are the main causes for insufficient protection of conventionally impregnated products in heavy-duty applications.
Also, the Deutsche Bahn AG in Germany formulated requirements towards new alternative wood preservatives such as:
The performance of the environmental compatibility must be given The active ingredients must show a low leachability Results from laboratory and field tests regarding protective effectiveness against wood
destroying basidiomycetes Mechanical properties similar to creosote impregnated sleepers, mainly bending, tensile and
fatigue behaviour Fulfilment of required standards for electrical conductivity Corrosion resistance Further use of conventional impregnation plants
The potential of different copper organic wood preservatives as well as some oily products was investigated for the use in railway sleepers where the focus was on:
Optimization of impregnation processes for railway sleepers Examination of physical, mechanical and biological properties of the impregnated wood Examination of products-specific properties like corrosion or electrical conductivity.
The tested wood preservative systems in this project showed promising results in laboratory tests. Based on these results, the protective systems are generally suitable for the impregnation of railway sleepers. A critical point could be the crack performance. The treated specimens showed a similar formation of cracks than untreated beech.
Laminated veneer lumber (LVL) made of beech wood 2.3.Beech-LVL and derived products are already used and accepted for structural purposes, e.g. fabrication halls and multi-story buildings, though they benefit from its higher mechanical properties compared to softwoods. The Pollmeier company started in 2014 their production plant in Creuzburg (Germany). Today many reference objects prove the applicability of this product (Pollmeier 2014). However, the susceptibility to biological decay and possibility of dimensional changes limit the

Natural resources and bioeconomy studies 80/2017
121
applicability to dry climate conditions. The aim of the project was therefore the development of a laminated veneer lumber (LVL) made of beech for application in use class 3 (external application without ground contact). First tests were carried out and 1) LVL was impregnated with conventional preservatives, and 2) LVL was produced from thermally treated veneers. Both approaches did not lead to satisfactory results, since crack performance and dimensional stability were not acceptable (Bollmus and Gellerich 2017). Therefore, LVL was modified on basis of phenol formaldehyde (Bicke and Militz 2015). This seemed to be more attractive than other chemical treatments or thermal modification, because earlier work showed a sufficient preservation of the mechanical properties, which is crucial for building applications. The treatment was applied to decrease the water uptake and the extent of dimensional changes by incorporating the phenol formaldehyde resin inside the cell wall polymers to achieve a permanent bulking and a resistance against fungal decay. Therefore, rotary cut beech veneers were treated with low molecular weight alkaline phenolic resins with the aim of an optimal cell wall modification. The process contained a two-step impregnation, where a vacuum was followed by atmospheric pressure and a pre-drying. The final curing of the resin took place while gluing the veneers in a heated press to form LVL-boards. The used resins were water-soluble alkaline types with a low molecular weight and commercially available. First results have shown that LVL from the PF-modified beech veneers is highly durable against degradation by the white rot fungus Trametes versicolor and at the same time dimensionally stable. The cell wall modification with PF also provides a higher compression at relatively low production pressures, wherefore increased modulus of elasticity (MOE) and modulus of rupture (MOR) are achieved. It has to be dealt with an increased stiffness and a reduced impact bending work. Thus, it will be a major challenge to identify the needed material characteristics for a specific product application and to adapt the process. Even though there is still research to be done concerning natural weathering and other corrupting influences, it is believed that the modification with PF at low and moderate weight percent gains (WPG) can lead to durable products in structural and outdoor applications.
Acknowledgements The authors gratefully acknowledge the financial support of the German Federal Ministry of Food and Agriculture.
References Behr, G. Bollmus, S. Gellerich, A. Militz, H. 2017a. Improvement of mechanical properties of thermally
modified hardwood through melamine treatment. Wood Material Science and Engineering. DOI: http://dx.doi.org/10.1080/17480272. 2017.1313313.
Behr, G., Gellerich, A., Bollmus, S.,and Militz, H. 2017b. Weathering protection of European hardwoods through double modification. Proceedings IRG Annual Meeting. IRG/WP 17-30715.
Behr, G., Gellerich, A., Bollmus, S.,and Militz, H 2017. The Influence of curing conditions on properties of melamine modified wood assessed by light microscopy and SEM-EDX. Wood Material Science and Engineering. Submitted.
Bicke, S. and Militz, H. 2015. Weathering stability of PF Treated veneer products of Beech Wood. European Conference on Wood Modification Helsinki, Finland. Proceedings.
BMEL 2016. Wald und Rohholzpotential der nächsten 40 Jahre – Ausgewählte Ergebnisse der Waldentwicklungs- und Holzaufkommensmodellierung 2013-2052. Federal Ministry of Food and Agriculture Berlin.
Bollmus, S., Bongers, F., Kalb, O., Lankveld, C., Alexander, J., and Militz, H. 2015. Acetylation of German hardwoods. European Conference on Wood Modification Helsinki, Finland. Proceedings.
Bollmus, S. and Gellerich, A 2017. New markets and applications for native hardwood species. Final report. Project financed by Federal Ministry of Food and Agriculture FKZ 2202421. University of Goettingen.
EN 350. 2016. Durability of wood and wood-based-products- Testing and classification of the durability to biological agents of wood and wood-based materials.

Natural resources and bioeconomy studies 80/2017
122
EN 1912. 2012. Structural Timber - Strength classes - Assignment of visual grades and species EN 4075-5.2008. Strength grading of wood – Part 5: sawn hardwood Nds. Landesforsten (2011) Das LÖWE Programm – 20 Jahre langfristige ökologische Waldentwicklung.
Niedersächsiche Landesforsten, Braunschweig. Schlotzhauer, P., Nelis, P.A., Bollmus, S., Gellerich, A., Militz, H., and Seim, W. 2015. Effect of size and
geometry on strength values and MOE of selected hardwood species, Wood Material Science & Engineering, DOI:10.1080/17480272.2015.1073175.
Schlotzhauer, P. Wilhelms, F., Lux, C. and Bollmus, S. 2017a. Machine grain angle determination on European hardwood lumber for construction use. European Journal of Wood and Wood Products, under revision.
Schlotzhauer, P., Kovryga, A., Emmerich, L., Van de Kuilen J.W., and Militz H. 2017b. Analysis of economic feasibility of ash and beech lamella production for engineered wood products (in process).
Pollmeier, R. 2014. Produktion und Weiterverarbeitung von Buchen-Furnierschichtholz. Holzbauforum Gamisch 14. Proceedings.
Persch, J. (2017): Einfluss relevanter Parameter auf die Verklebungseigenschaften von unbehandelten und modifizierten Laubhölzern für tragende Konstruktionen. MSc-thesis. University of Goettingen.
Wilhelms F (2015) Vergleichende Untersuchungen zur maschinellen Bestimmung des Faserverlaufs an Laubholzlamellen. MSc-thesis. University of Goettingen.

Natural resources and bioeconomy studies 80/2017
123
Cross laminated timber in the United States: Opportunity for hardwoods? Omar Espinoza1*, Urs Buehlmann2
Abstract
Cross Laminated Timber (CLT) is a relatively new building system that is just starting to gain traction in North America. CLT has attracted the attention of construction professionals, developers, and researchers across the world; in part due to its environmental, economic, and aesthetic advantages. Although virtually all CLT structures are manufactured using softwood species, there is growing interest in the possibility of manufacturing CLT panels out of hardwoods. However, at the present time, research on hardwood CLT is scarce but existing results suggest that it is technically feasible. In this paper, the authors explore the potential of manufacturing CLT using North American hardwood species; specifically, an analysis is made about technical feasibility and procurement issues are discussed as well.
Introduction 1.Cross-Laminated Timber, or CLT (Figure 1), a relatively new structural material, is defined by ANSI as “Prefabricated engineered wood product made of at least three orthogonally bonded layers of solid-
sawn lumber … (ANSI 2012, p. 3).” The cross-laminated configuration improves the rigidity, stability, and mechanical properties of the product (Evans 2013). As CLT panels are being built in sheltered, climate-controlled factories, where also the openings for windows, doors, and service channels are cut using CNC (Computer Numerical Controlled) routers, high precision and productivity can be achieved. After manufacturing, panels are transported to the construction site and assembled using metal connectors such as steel angles and metal splines (Crespell and Gagnon 2011).
CLT allows covering long spans without intermediate support and without compromising the structural integrity of the structure, which is impossible to attain using traditional wood products (Kwan 2013). CLT as a structural system allows for short erection times and lower labor costs compared to steel and concrete, with little waste and disturbance to a construction site’s
surroundings. CLT has also environmental benefits compared to other structural systems. Furthermore, abundant evidence of the environmental advantages of building with wood-based materials exist (CORRIM 2010, Hubbard and Bowe 2010, Lippke et al. 2004, Wilson et al. 2005). While production in CLT is still concentrated in Central Europe, it is believed that most of the growth during the next decade will occur outside this region (Plackner 2015). As of September 2016 there were four CLT producers in North America (Espinoza et al. 2016) , one in New Zealand, and seven in Japan. Plans for manufacturing facilities in other countries exist, such as Australia, Korea, and Chile.
The United States has abundant forest resources, with 7.5% of the world’s forest area and one-third of the country’s total area (FAO 2011). Some of the most productive forests are in the U.S., in areas such as the South eastern United States, the Appalachian region, or the Pacific Northwest, * Corresponding author: Tel.: +16126240770; E-mail: [email protected]
1Department of Bioproducts and
Biosystems Engineering University of Minnesota
St. Paul MN 55108
2Department of Biomaterials Virginia Tech
1650 Research Center Drive Blacksburg, Virginia 24061
USA

Natural resources and bioeconomy studies 80/2017
124
forests that contain numerous species (Figure 2). While the forests east of the Mississippi are predominantly populated with broadleaf trees, the west is dominated by gymnosperms. U.S. forests’
long-term sustainability faces significant challenges from insect and disease. The U.S. Forest Service estimates that approximately 56 million acres of National Forest lands need removal treatment (Forest Products Laboratory 2000) and 36% of these forests are at “most significant risk” of insect
attack and disease (Krist et al. 2014). Given the extent of damage by disease and pests, it is important to find uses for the affected material, which for the most part is still suitable for processing into numerous end-products (Forintek 2003, Uyema 2012).
Figure 1. Example softwood CLT panel sections.
There is also a pressing need to grow markets for high value-added forest products in the U.S. The industry is among the 10 top manufacturing employers in the states within the region, and is particularly important in rural communities. However, the forest industry has been facing challenges; for example manufacturers have been losing considerable market share to overseas producers for over two decades (Buehlmann and Schuler 2009, Buehlmann et al. 2007, Schuler and Buehlmann 2003). Further, the Great Recession from 2007-2009 has reduced domestic demand, resulting in plant closures and thousands of layoffs (Woodall et al. 2011), while substitute materials continue to take market share from wood (particularly for exterior siding and decking). Generating economically viable uses for the continent’s wood is critical for bolstering struggling economies in timber-reliant rural communities, and is a necessity for enhancing forest health and reducing the risk of wildfires and vulnerability to insect attack, disease, and drought (Levan-Green and Livingston 2001).
Figure 2. Forest concentration in the United States (Simmon 2011).

Natural resources and bioeconomy studies 80/2017
125
Objectives and methods 2.CLT is almost invariably made of softwood species, including Norway spruce (Picea abies), white fir (Abies alba), or Douglas fir (Pseudotsuga menziesii). However, there is increasing interest of using hardwood species in the manufacture of cross-laminated timber (CLT). Some of the reasons are the changing makeup of some forests, and the desire to make use of underutilized or low-value hardwoods. This paper explores the technical and economic feasibility of manufacturing CLT from hardwoods, with a focus on the United States. The method followed for this analysis was a review of current academic literature, including peer-reviewed journals, conference proceedings, theses and dissertations. Additionally, other sources were consulted, such as industry trade reports, industry associations, standards, news notes, and personal contacts with industry representatives, association officials, and researchers.
Results 3.The American Hardwood Export Council (AHEC), an international trade association of the American hardwood industry, whose major tasks is to promote U.S. hardwood products worldwide (AHEC 2016a), has undertaken the construction of urban installations made of Yellow Poplar (tulipwood, Liriodendron tulipifera) cross-laminated timber (CLT). For example, the Endless Stair (Slavid 2013), which was presented at the 2013 London Design Festival, consists of a large structure composed of 15 interlocking staircases. The endless stair was designed by Rijke Marsh Morgan Architects and engineered by Arup. Yellow Poplar CLT in three layers was used for the treads and railings (Slavid 2013).
AHEC also commissioned a life cycle analysis on the environmental impact of this project. One of the conclusions was that the total amount of carbon stored within the wood itself exceeded all of the carbon emissions resulting from the manufacturing, transport, and installation of the project. Also, the authors of this study calculated that it takes less than 2 minutes for the 100m3 of Yellow-poplar logs needed to produce the Endless Stair to be replaced by new growth (AHEC 2013).
More recently, The Smile, designed by Alison Brooks architects and engineered by Arup, was presented in the grounds of the Chelsea College of Arts in London. The Smile is an impressive curved and hollow structure 33 m long, over 3 m high, and 4.5 m feet wide (AHEC 2016b).
Figure 3. The Endless Stair (AHEC 2016b).

Natural resources and bioeconomy studies 80/2017
126
Existing research 3.1.Research on cross-laminated timber made of hardwood species for North American species is relatively scarce. However, research activity on this subject has gained speed in recent years as the industry and academia is starting to recognize the importance of the topic. Table 1 displays the country, the research institute, the title and the author(s) of research published on hardwood CLT in North America with a brief summary of each investigation being presented further below.
Table 1. Research published on hardwood CLT.
Country Institution Topic Reference Canada FPInnovations Performance of CLT made from
LVL, LSL and hardwood (Grandmont and Wang
2016) United States
Virginia Tech Design methods to predict mechanical performance of
hardwood CLT
(Beagley et al. 2014)
United States
West Virginia University
Adhesive bond quality of yellow-poplar CLT
(Hovanec 2015)
United States
Virginia Tech Mechanical properties of yellow-poplar CLT
(Mohamadzadeh and Hindman 2015)
United States
Oregon State University
Mechanical properties of hybrid poplar CLT
(Kramer et al. 2014)
Researchers at Virginia Tech and West Virginia University have carried out studies on the feasibility of using lower grade hardwoods for CLT manufacturing. These researchers focused on Yellow Poplar (Liriodendron tulipifera), one of the most abundant hardwood species in the U.S.
The quality of the adhesive bond of Yellow Poplar for CLT production was studied by Hovanec (2015), at West Virginia University. He studied the effects of factors such as adherent thickness, lamination orientation, and orthotropic orientation. Results showed that lamination orientation significantly affected bond strength. Adherent thickness was also found to influence bond strength. Interestingly, no differences were observed with failure or delamination when compared with softwood CLT.
At Virginia Tech, Mohamadzadeh and Hindman (2015) investigated the mechanical performance of CLT made out of Yellow-poplar, using the American standard ANSI/APA PRG 320 (ANSI 2012). Test values for bending stiffness, bending strength, and resistance to delamination exceeded the required values in the ANSI/APA PRG 320 standard (ANSI 2012), but were lower than the required values for resistance to shear and compression loading. Compared with softwood species (Southern pine) and hybrid poplar, bond line shear strength of Yellow-poplar CLT was 19 and 43% greater, respectively (Mohamadzadeh and Hindman, 2015).
Beagley et al. (2014), also at Virginia Tech, investigated various design methods for predicting mechanical performance of CLT. Methods included in the analysis were the Shear Analogy Method (SAM), Gamma method, k-Method, and the transformed section analysis, all approved for softwood species. Predicted values were compared with experimental data, obtained by non-destructive testing of Yellow-poplar (Liriodendron tulipifera), 5-layered CLT beams. The authors also listed the design methods most suitable for predicting different values of mechanical performance of CLT (Beagley et al. 2014).
Kramer et al. (2014) at Oregon State University evaluated poplar and hybrid poplar as a raw material for CLT. These researchers used environmentally-certified (FSC) plantation hybrid poplar (Pacific albus) of low density (specific gravity of 0.35) to manufacture and test ten CLT panels under the ANSI/APA PRG 320 (ANSI 2012) standard (Kramer et al. 2014). The authors indicated that hybrid poplar CLT exceeded shear and bending strength required by the standard ANSI/APA PRG 320 (ANSI 2012), but stiffness (MOE) was lower than the grade E3 of the standard.
Natural resources and bioeconomy studies 80/2017
127
In another experiment, researchers at FPInnovations in Canada, used hardwood species (yellow birch, aspen, sugar maple) used in engineered wood products (laminated strand lumber (LSL) and laminated veneer lumber (LVL) to build and test CLT panels (Grandmont and Wang 2016). These authors studied dimensional stability and appearance with changes of equilibrium moisture content (4.5, 12, and 16%). The performance of the panels produced was then compared with CLT panels made entirely from softwoods (spruce, pine, fir). According to the study’s results, higher density
species were prone to delamination. Checking and edge separation were also observed. The best results in respect to delamination were obtained when using engineered wood products such as Laminated Veneer Lumber and Laminated Strand Lumber Grandmont and Wang (2016) hypothesized that higher shrinkage values, chemical properties, and microscopic structure of the wood may interact to explain the observations made. Interestingly, using hardwood for the core layer and edge gluing the outer layers had a detrimental impact on performance. Lastly, a cost estimation and comparison with softwood CLT was carried out, with prices of hardwood CLT (solid or engineered) significantly higher than the softwood variety (Grandmont and Wang 2016).
The research presented in this section shows that it is technically feasible to manufacture CLT using hardwood species, with structural performance comparable to softwood CLT. The motivation behind studies involving the manufacturing of CLT using hardwoods species is driven by the need to develop high value-added uses for hardwood species that are relatively abundant and/or underutilized. Some authors have suggested that hardwood CLT may open new applications for this engineered wood product, while others maintain that hardwood CLT may simplify the design process. In the following sections, we discuss the practical implications of potentially manufacturing and using hardwood CLT in the United States.
Discussion 4.As discussed above, in recent years, a number of researchers in the U.S. and Canada have studied the feasibility of manufacturing CLT with hardwood species (Table 1). In the following paragraphs, we present and discuss various topics relevant to the possible adoption of hardwood species as raw material for CLT manufacturing and its use in construction.
ANSI/APA PRG 320 4.1.In 2012, the Engineered Wood Association, or APA, released the “Standard for Performance-Rated Cross-Laminated Timber,” ANSI/APA PRG 320 (ANSI 2012). This standard “provides requirements and
test methods for the qualification and the quality assurance for performance rated cross-laminated
timber (CLT) intended for use in construction applications” (ANSI 2012, p. iv). This ANSI/APA PRG 320
(ANSI 2012) standard specifies allowable design properties for CLT panels in seven grades. It also lists materials requirements for the manufacture of CLT panels for structural applications. Currently there are two producers in the U.S. and two in Canada certified to produce CLT for structural uses.
However, the current version of the ANSI/APA PRG 320 (ANSI 2012) standard recognizes only softwood species for CLT manufacturing. Thus, any future development of hardwood CLT in the U.S. must start with the inclusion of hardwoods as a recognized material in the American standard for CLT. The process to change the standard requires significant industry commitment and involvement including the generation of technical data to support and justify the inclusion of a new material. At the time of writing, the committee in charge of the revisions of the ANSI/APA ANSI/APA PRG 320 (ANSI 2012) standard was still active, but with revisions due by November of 2017 to meet the 2018 code deadline, potential inclusion of hardwoods is unlikely.

Natural resources and bioeconomy studies 80/2017
128
Material considerations 4.2.The ANSI/APA PRG 320 (ANSI 2012) standard requires that wood species to be used for CLT manufacturing have a specific gravity (SG) of 0.35 or greater. Most hardwoods have SG values higher than 0.35, as Table 2 shows. Moreover, this stipulation would exclude some softwoods, such as Northern white cedar (0.31), Western red cedar (0.32), sub-alpine fir (0.32, Forest Products Laboratory 2010). Although there is no requirement for shrinkage in ANSI/APA PRG 320 (ANSI 2012), hardwood species in general have values of shrinkage 30% higher than softwoods (Forest Products Laboratory 2010), which may have implications for the design, manufacture, construction, and service performance of CLT panels.
ANSI/APA PRG 320 (ANSI 2012) requires moisture content (MC) of 12 3%. Softwoods for structural purposes are dried to 19 or 15% moisture content. Hardwoods (and softwoods) used for value-added uses, such as furniture, flooring, kitchen cabinets, and millwork, are dried to lower MCs, usually 6 to 8%. This difference in practices in the softwood versus the hardwood lumber industry may work as an advantage for hardwood as raw material for CLT, as there is considerable experience in the industry for drying to lower moisture contents. However, drying times are in general longer for hardwoods than softwoods of the same thickness and final MC. For example, one-inch thick Yellow-poplar, one of the fastest drying hardwood, takes 3 to 6 days to dry from air-dried condition (20%) to 6% MC, and 6 to 10 days to dry from green condition, while these times for Eastern white pine (Pinus
strobus) are 2 to 3 days for material that is air-dried (20%) and 4 to 6 days for green lumber (Simpson 1991). Another difference between drying of hardwoods and softwoods is the amount of volatile organic compounds (VOCs) that they released during the drying process, with most hardwood species releasing lower amounts of VOCs. For example, drying of Yellow-Poplar releases 0.14 kg/m3 (0.71 lb/MBF, Rice and Erich 2006), whereas drying southern yellow pine releases 0.58 kg/m3 (3.0 lb/MBF, Milota and Mosher 2008).
Probably most important for material consideration for hardwood CLT is the higher mechanical properties of hardwoods. A comparison between spruce with oak, ash, and beech, shows that tension perpendicular to the grain of hardwoods can be more than 2.5 times that of softwoods, and more than 1.5 times in bending and compression parallel to the grain. This means that smaller cross-sections and larger spans are possible with hardwood CLT. The greater densities of hardwoods may also reduce the need for acoustic insulation. In floor applications, the modulus of elastic is of disproportionate importance. The outer layers define 95% of the stiffness properties of a CLT panel. Thus, hardwood does have properties that are beneficial for the performance of CLT panels; however, at the present time not enough research has been conducted to knowing exactly what benefits can be derived from using hardwoods for the manufacture of CLT panels.

Natural resources and bioeconomy studies 80/2017
129
Table 2. Specific gravity (12% MC) of selected American wood species (Forest Products Laboratory 2010).
Procurement and processing considerations 4.3.The American standard ANSI/APA PRG 320 (ANSI 2012) requires that the thickness of the layers for a CLT panel be between 5/8 and 2 inches (16 to 51mm). Furthermore, widths of the laminations must be equal or greater than 1.75 times the thickness for the parallel layers (major strength direction), and 3.5 times the thickness for perpendicular layers (minor strength direction, ANSI 2012). For

Natural resources and bioeconomy studies 80/2017
130
dimension lumber, this would exclude certain sizes, such as 2×2 and 2×3 for the parallel layers and 1×2, 1×3, 2×2, 2×3, 2×4 for the perpendicular layers. This limits the number of sizes that a dimension mill can supply to a CLT manufacturing plant and is a potential issue for hardwood sawmills as hardwood sawmills tend to cut thinner lumber of highly variable width compared to softwood lumber. Anderson (2016) in one calculation states that, if manufacturing costs and availability considerations are added to the analysis of the optimal combination of grade and size for the manufacture of softwood CLT, the best combination would be #2 and Better and nominal 2×8, respectively. Lumber of such grade and size has the lowest 10-year average price per thousand board feet, allows for a reasonable layer lay-up time, and represents about half of all product grade distribution of Western dimension mills. The same analysis concluded that, under this scenario, a hypothetical large CLT manufacturing facility in the western U.S. would need access to lumber from at least five dimension mills to supply 90,850 m3 (24 MMBF, Anderson 2016). This suggests procurement challenges for a potential hardwood CLT industry, as the typical hardwood sawmill in the U.S. has a capacity of under 16518 m3 (7 MMBF, Espinoza et al. 2011), thus limiting the feasibility to large mills. Moreover, hardwood sawmills typically saw a variety of species, sizes, and qualities (Espinoza et al. 2014), which may diminish the ability of most hardwood sawmills to supply a CLT manufacturing operation with the right species, dimensions, and qualities.
Differences in adhesion and gluing between hardwoods and softwoods also need to be addressed when planning to manufacture CLT using hardwood species. In general, a higher capacity press is needed for processing hardwoods to allow the compressing of stronger and stiffer wood in higher-density hardwoods. The higher density can also cause more stresses in the bond line because of dimensional changes from moisture variations. Some extractives, which occur in higher concentration in hardwoods, may interfere with gluing by limiting available bonding sites, and the acidity of some extractives may affect curing of adhesives. Thus, adhesives should be specifically formulated for hardwoods to assure proper bonding and performance. In addition, the use of a primer or additional surface preparation may be required as well as the careful monitoring of the maximum thickness of the glue line. Thus, the hardwood CLT industry must rely on a close collaboration with an adhesive provider to assure well-performing yet cost effective adhesive bonds in hardwood CLT.
Conclusions 5.The research reports reviewed in this publication suggest that hardwood CLT for structural uses is technically feasible. Furthermore, the higher mechanical properties of hardwoods could potentially expand the applications of CLT to greater spans and higher loads while reducing the size of the cross sections needed. However, there are some challenges to incorporating hardwood as a major raw material for CLT. The first one is the need to obtain inclusion of hardwood as a recognized material in the American CLT standard ANSI/APA PRG 320 (ANSI 2012). Also, technical issues such as procurement, gluing, and grading need to be investigated and resolved. Furthermore, the cost differences between hardwood and softwood lumber may have negative impacts on the economic feasibility of hardwood CLT.
Nonetheless, a hardwood CLT industry would certainly bring economic benefits, generating economic opportunities in rural communities, and expanding markets for underutilized and/or low-value hardwoods. Such an industry would most likely also support forest landowners in their fight against disease and pests by providing economic incentives to improve forest management.

Natural resources and bioeconomy studies 80/2017
131
References AHEC. (2016a). American Hardwood Export Council (AHEC). Retrieved from https://www.ahec.org/ AHEC. (2016b). The American Hardwood Export Council presents ‘The Smile’ by architect Alison Brooks
for the London Design Festival. Retrieved from http://americanhardwood.org/news-events/release/?tx_ttnews%5Btt_news%5D=1134&cHash=b2247a12635d4cc322ccf44fafb62b63
AHEC. (2013). Life cycle assessment of Endless stair. Retrieved from http://www.americanhardwood.org/fileadmin/docs/-Endless_Stair_LCA/Endless_Stair_LCA_final%20report.pdf
Anderson, R. (2016). A CLT Manufacturing Plant: If you build it will the lumber come? Paper presented at the Massive Timber Conference, Portland, OR.
ANSI. (2012). ANSI/APA PRG 320-2012: Standard for Performance-Rated Cross-Laminated Timber. American National Standards Institute (ANSI) and The Engineered Wood Association (APA).
Beagley, K. S. M., Loferski, J. R., Hindman, D. P., & Bouldin, J. C. (2014). Investigation of Hardwood Cross-Laminated Timber Design. Paper presented at the Proceedings of the World Conference on Timber Engineering (WCTE 2014). August 10-14, 2014, Quebec City, Canada.
Buehlmann, U., Bumgardner, M., Schuler, A., & Barford, M. (2007). Assessing the impacts of global competitition on the Appalachian hardwood industry. Forest Products Journal, 57(3):89-93.
Buehlmann, U. and Schuler, A.. 2009. The U.S. household furniture manufacturing industry in 2008 – status and opportunities. Forest Products Journal. 59(9):20-28.
CORRIM. (2010). The Consortium for Research on Renewable Industrial Materials. Retrieved from http://www.corrim.org/
Crespell, P., & Gagnon, S. (2011). Cross-Laminated Timber: a Primer [PowerPoint Presentation]. Vancouver, B.C. Canada: FPInnovations.
Espinoza, O., Bond, B., & Buehlmann, U. (2011). Energy and the US hardwood industry - Part 1: Profile and impact of prices. Bioresources, 6(4):3883-3898.
Espinoza, O., Buehlmann, U., Bumgardner, M., and Smith, B. 2014. Intermediaries in the U.S. hardwood lumber market: Comparing and contrasting sawmills and distributors. BioResources 9(4):6527-6539.
Espinoza, O., Buehlmann, U., Laguarda-Mallo, M. F., & Rodríguez-Trujillo, V. (2016). Status of Cross-Laminated Timber in North America. Paper presented at the Proceedings of the World Conference on Timber Engineering (WCTE 2016), August 22-25, 2016, Vienna, Austria.
Evans, L. (2013). Cross Laminated Timber: Taking wood buildings to the next level. Continuing Education Center. Retrieved from http://continuingeducation.construction.com/article.php?L=312&C=1138
FAO. (2011). State of the World's Forests 2011. Rome, Italy. Retrieved from: http://www.fao.org/forestry/sofo/en/
Forest Products Laboratory. (2000). Forest Products Laboratory Research Program on Small-Diameter Material. Madison, WI.
Forest Products Laboratory. (2010). Wood handbook - Wood as an engineering material. U.S. Department of Agriculture, Forest Service, Forest Products Laboratory. Madison, WI.
Forintek. (2003). Properties of Lumber with Beetle-Transmitted Bluestain. Vancouver, BC, Canada. Grandmont, J.-F., & Wang, B. (2016). Composite cross laminated timber (CCLT) made with engineered
wood products (EWP) and hardwood. Paper presented at the Proceedings of the World Conference on Timber Engineering (WCTE 2016). August 22-25, 2016, Vienna, Austria.
Hovanec, D. (2015). Effect of Wood Characteristics on Adhesive Bond Quality of Yellow-Poplar for Use in Cross-Laminated Timbers. (M.S. M.S.), West Virginia University, Morgantown, West Virginia. Retrieved from http://login.ezproxy.lib.umn.edu/login?url=http://search.proquest.com/docview/1708376446?accountid=14586
Hubbard, S. S., & Bowe, S. A. (2010). A Gate-to-Gate Life-Cycle Inventory of Solid Hardwood Flooring in the Eastern US. Wood and Fiber Science, 42 (Special Issue):79-89.
Kwan, J. (2013). An investigation of the new opportunities of wood in mid-rise construction in British Columbia. Bachelor of Science in Wood Products Processing Thesis, University of British Columbia.
Kramer, A., Barbosa, A., & Sinha, A. (2014). Viability of Hybrid Poplar in ANSI Approved Cross-Laminated Timber Applications. Journal of Materials in Civil Engineering, 26(7).
Krist-Jr., F. J., Ellenwood, J. R., Woods, M. E., McMahan, A. J., Cowardin, J. P., Ryerson, D. E., Sapio, F. J., Zweifler, M. O., Romero, S. A. (2014). 2013–2027 National Insect and Disease Forest Risk Assessment. United States Department of Agriculture, Forest Service, Forest Health Technology Enterprise Team.

Natural resources and bioeconomy studies 80/2017
132
Levan-Green, S. L., & Livingston, J. (2001). Exploring the Uses for Small-Diameter Trees. Forest Products Journal, 51(9), 10.
Lippke, B., Wilson, J., Perez-Garcia, J., Bowyer, J., & Meil, J. (2004). CORRIM: Life-Cycle Environmental Performance of Renewable Building Materials. Forest Products Journal, 54(6), 8.
Milota, M., & Mosher, P. (2008). Emissions of hazardous air pollutants from lumber drying. Forest Products Journal, 58(7/8):50-55.
Mohamadzadeh, M., & Hindman, D. (2015). Mechanical Performance of Yellow-Poplar Cross Laminated Timber. Blacksburg, VA Retrieved from: https://vtechworks.lib.vt.edu/bitstream/handle/10919/64863/Mohamadzadeh_Hindman_2015.pdf?sequence=1
Plackner, H. (2015). Potenzial ist riesig. HolzKurier, 12. 02. 2015. p.14. Rice, R. W., & Erich, M. S. (2006). Estimated VOC losses during the drying of six eastern hardwood
species. Forest Products Journal, 56(10):48-51. Schuler, A. & Buehlmann, U. 2003. Benchmarking the Wood Household Furniture Industry: A Basis for
Identifying Competitive Business Strategies for Today’s Global Economy. USDA Forest Service General Technical Report. GTR-NE-304. 18pp.
Simmon, R. (2011). Where the Trees Are. NASA Earth Observatory map. Retrieved from https://visibleearth.nasa.gov/view.php?id=76697
Simpson, W. T. (1991). Dry kiln operator's manual. U.S. Dept. of Agriculture, Forest Service, Forest Products Laboratory. Madison, WI.
Slavid, R. (2013). Endless Stair. Retrieved from http://www.americanhardwood.org/news-events/endless-stair/
Uyema, M. V. (2012). Effects of Mountain Pine Beetle on Mechanical Properties of Lodgepole Pine and Engelmann Spruce. Master of Science Thesis, Brigham Young University. Prove, UT.
Wilson, J. B., Lippke, B., Comnick, J., Johnson, L. R., Perez-Garcia, J., Dancer, E. R., & Puettmann, M. E. (Eds.). (2005). Special Issue: The Environmental Performance of Renewable Building Materials in the Context of Residential Construction (Vol. 37): Society of Wood Science & Technology.
Woodall, C. W., Ince, P. J., Skog, K. E., Aguilar, F. X., Keegan, C. E., Sorenson, C. B., Hodges, D.G, and. Smith, W. B. (2011). An Overview of the Forest Products Sector Downturn in the United States. Forest Products Journal, 61(8), 595-603.

Natural resources and bioeconomy studies 80/2017
133
Curly birch (Betula pendula var. carelica), wooden ´marble´ from Finland − soon easily available
Anneli Viherä-Aarnio*, Risto Hagqvist
Green Technology Natural Resources Institute Finland
PL 2, FI-00791 Helsinki, Finland
Abstract
Curly birch (Betula pendula var. carelica (Mercklin) Hämet-Ahti) is a special variety of silver birch, known for its hereditary and unique, highly decorative curly-grained and brown-figured wood. It is the most highly-priced variant of native tree species in the Nordic countries. Curly birch logs and veneer are used for furnishing and paneling e.g. banks, offices, luxury homes, ships and expensive cars. Wood with smaller dimensions is used in carpentry for highly valued products such as gifts, souvenirs, tools and furniture. Curly birch occurs naturally, but rare, in Northern Europe and parts of Eastern and Central Europe. Its cultivation has a long tradition in Finland. Interest in commercial cultivation of curly birch has, however, increased significantly since the 1980’s. As a result some 6500 hectares of curly birch stands have been established. They will soon start reaching their rotation age (35-50 years). Small-sized wood from thinnings is already available in abundance. The significantly increasing availability of this exceptionally beautiful wood resource makes it possible to develop new wood products based on this, now cultivated, variant. The wood material is suitable also for premium products with high class design. Earlier the poor availability of curly birch wood has prohibited developing such products. Now wood will soon be available regularly in larger quantities than today, enough for both domestic use and export. Silvicultural management of curly birch has to be done with special care, from plantation establishment, through right-timed thinnings to branch pruning and final cutting. In this article the wood characteristics and utilization, silvicultural practices and the rapidly changing market issues of this wooden ´marble´ are reviewed.
Introduction 1.Curly birch is known for its hereditary and unique, highly decorative curly-grained and brown-figured wood. Due to its rarity and very special wood, it has for centuries been sought after in the forests for purposes where decorative or strong wood was needed and it is still the most highly-priced variant of native tree species in the Nordic countries.
According to the current taxonomy (Hämet-Ahti 1987, Hämet-Ahti et al. 1992) curly birch (Betula
pendula var. carelica (Mercklin) Hämet-Ahti) is regarded as a special variety of silver birch, but several Latin names have been in use in course of time. A number of generic names have also been used, e.g. Masur or Mazer birch, Karelian birch and speckled birch (see Velling et al. 2000 and references therein).
Curly birch occurs naturally in southern Scandinavia and Finland, the Baltic countries and western Russia, Belorussia and Ukraine. Sporadic populations are to be found also in Poland, Germany and Slovakia (Pagan and Paganová 1994). Throughout its distribution area curly birch is rare, occurring as solitary trees or small groups of trees. Its distribution is often related to areas where shifting agriculture including burning of land was practiced until the early 1900’s (Heikinheimo
1951). Cultivation and research of curly birch have a long history in Finland, dating back to the first
experiments by Aaltonen and Heikinheimo in the 1920’s and 1930’s (Heikinheimo 1951). Thanks to
the active guidance and consulting by the Finnish Curly Birch Society (Huuri 1978), the enthusiasm and knowledge about curly birch increased, which led to a significant and long-lasting increase in its * Corresponding author: Tel.: +358295325512; E-mail: [email protected]

Natural resources and bioeconomy studies 80/2017
134
cultivation starting in the late 1980’s. Thus, in the near future wood of this earlier rare variant will be
available in larger quantities than before. The aim of this article is to review and discuss the special features of this unique variant in terms
of wood characteristics and utilization, silviculture and the rapidly changing market issues.
Curly wood formation and wood properties 2.Curly birch wood is the result of abnormality in the functioning of the cambium. Groups of cambium cells cease to divide, as the surrounding cells divide rapidly and wound callus and brown parenchyma cells are born and become incrusted in the wood (Hintikka 1941, Ruden 1954, Johnsson 1974). As a result, the annual rings become wavy, the tissue exceptionally oriented and the pith rays dilated. In the cross section of a curly-grained birch stem, V-shaped brown patterns are seen, which can form a pronounced and closed “curly-grain flower” configuration. When the bark is peeled off, the surface
of the stem has a decorative granulated appearance with small oblong swellings and depressions. A longitudinal tangential cut shows a lens-like configuration (Hintikka 1941, Ruden 1954, Saarnio 1976). Scientific studies of the technical properties of curly birch in Finland are practically nonexistent, in spite of the fact that curly birch is such a regional specialty in our country and the neighbouring areas. In Russian literature more studies may probably be found (see the literature list by Etholén and Huuri 1982).
Wood density and hardness of curly birch are higher than those of ordinary silver birch. Wood density and strength properties of curly birch were studied by Hintikka (2004). Oven-dry density ρ0 of wood samples consisting entirely of curly birch wood was 680 kg m-3 and air-dry density ρ12 (in 12% humidity) was 730 kg m-3, while air-dry density ρ15 of silver birch was 640 kg m-3. In wood samples which were mixtures of curly and normal wood the values were somewhat lower, i.e. oven-dry density ρ0 was 650 kg m-3 and air-dry density ρ12 700 kg m-3 (Hintikka 2004). The strength properties of curly birch reported by Hintikka (2004) were generally lower than those for silver birch. However, according to Sokolov (1937, cited in Hintikka 2004) the Janka-Brinell hardness of curly birch and normal silver birch was 471 kg cm-2 and 403 kg cm-2, respectively.
Growth form and various stem types of curly birch 3.Curly birch trees differ in many ways from normal silver birches in terms of external morphology. The stem form of curly birch varies from crooked multi-stemmed bushes to straight single-stemmed trees (Ljubavskaja 1978). Due to their slower growth curly birches remain shorter than normal silver birches (Heikinheimo 1951, Kärkkäinen et al. 2017). The trunk of curly birch, which is typically forked and leaning, contains swellings, knots and protuberances and is covered by thick, cracked and partly black bark. The abundance and appearance of the curly formation also varies (Mikkola 2004).
Saarnio (1976) described four stem types which differ regarding their external morphology and the abundance and type of internal curly configuration with brown figures in the wood: protuberance, neck, stripe and ring curl. The trunk of protuberance curl contains small knobs, approximately an inch in diameter, located close to each other. Usually they are externally visible and can be felt by hand. Straight-stemmed treelike individuals, suitable for turning (veneering) with abundant protuberance formation and rich curly configuration with brown figures in the wood are the most valuable and in highest demand (Mikkola 2004). In the trunks of the neck type there are distinct thickenings “muffs”, containing curly grain pattern in the wood, and thinner parts “necks”,
usually containing normal wood. The trunk of the stripe type contains vertical ridges with furrows in between, and that of the ring type transverse thickenings. The wood of these latter two types does not have brown configuration, but the ring type typically contains light-coloured patterns resembling wavy or flamy birch. Stripe and ring types are not planted or collected commercially for export (Mikkola 2004), since they are quite rare types. Most of the curly birch trees are, however, mixtures

Natural resources and bioeconomy studies 80/2017
135
of two curly types (Saarnio 1976). It should be noted that wavy and flamy wood forms are called “curly” e.g. in American classification of figured wood (Beals and Davis 1977). This differs from the
classification used in our paper. External signs of curliness on the stem do not always guarantee the existence of curly grained
wood with brown figures within it, and on the other hand, sometimes a fine curly pattern can be found in the cross-section of a felled stem without any visible external signs on the stem. According to the external appearance of the stem, the formation of curly-grained wood can usually be detected at 5-6-year-old seedlings (Johnsson 1951, Ruden 1954, Saarnio 1976), but the age for appearance of external signs can vary as much as 2-30 years. Trees growing on fertile sites and in wider spacings, usually express the curly-grain formation at an earlier age (Heikinheimo 1951). So far, there is no method for reliable identification of the quantity or quality of curly pattern on living trees or even the entire felled logs. Salmi et al. (2007) presented an ultrasound method for differentiating curly birch from silver birch on wood samples in laboratory circumstances indicating 93% probability of correct type classification using computerized clusterization.
Curliness is a hereditary trait 4.Several hypotheses have been presented on the primary cause of curly wood formation (Velling et al. 2000). Site nutrition and climatic factors were regarded as reasons for this abnormal development ‘Wisa disease’ by Hintikka (1922). It has also been attributed to viruses and other pathogens by e.g. Atanasoff (1967). However, Heikinheimo (1933) was the first to show that curliness is a hereditary trait and passed from generation to another via seeds. This has later been confirmed in several studies using different types of breeding material (Heikinheimo 1951, Johnsson 1951, Velling et al. 2000, Paganová 2004, Kärkkäinen et al. 2017).
The proportion of individuals expressing curly-grained pattern within the progeny depends a lot on the mother tree and on the amount of pollen coming from the surrounding curly trees, when seed is collected from solitary trees in the forests. It can, thus, vary from 1 to 50 % (Heikinheimo 1951, Johnsson 1951). Seed from controlled crosses of curly trees produces 60-70% trees with curly-grained wood (Kärkkäinen et al. 2017).
Like the basic cause of curly-grained wood formation, also the pattern of inheritance of curly trait has been speculated (Johnsson 1951, 1974, Ruden 1954). Ruden (1954) was the first one to explain the genetical back-ground of curly-grain formation on the basis of a dominant ‘masur gene’
that is lethal in homozygotic conditions. The hypothesis of Ruden (1954) was supported by the observations of Paganová (2004) and recently by Kärkkäinen et al. (2017).
The molecular and physiological basis of curly wood formation is, so far, poorly known and only a few studies are available. Pätiälä et al. (1978) observed differences in carbohydrate composition of the sap of curly and normal silver birches, of which only the latter ones contained sorbitol. Novitskaya (1998) reported accumulation of sucrose in the phloem of curly birch. Ahokas (1985) found higher cytokinin content in the spring sap of curly birch compared to that of normal silver birch, which could be the reason for the poorer apical dominance of curly birch trees and possibly even for the curly-grained wood formation itself, as suggested by Ahokas (1985). Because curliness in birch entails drastic changes in the wood structure, growth form and external morphology as well as the vitality of the trees, it can be assumed, that the gene(s) behind are important, and thus studies on this aberrant form can provide knowledge and understanding of wood formation and growth processes in general (Kärkkäinen et al. 2017).
Cultivation and silviculture of curly birch 5.Cultivation and silvicultural management of curly birch has to be done with special care, from plantation establishment, through branch pruning and right-timed selective thinnings to final cutting.

Natural resources and bioeconomy studies 80/2017
136
Successful management demands special expertise, significant effort and economic contribution from the forest owner. However, if the silvicultural measures are well-timed and carried out in a correct way, it is possible to reach 10 times greater profit than that for normal birch (Raulo and Sirén 1978, Hagqvist 1996).
The history of curly birch cultivation in Finland dates back to the 1920’s and 1930’s, when the
first large experiments were carried out mainly by professor Olli Heikinheimo (Heikinheimo 1951). Since then, the genetic quality of the seedlings cultivated has been improved by plus tree selection, crossings, progeny testing and production of genetically improved material in greenhouse seed orchards (Lepistö 1973). A tissue culture method for vegetative propagation of the valuable curly birch individuals was developed in 1986 (Ryynänen and Ryynänen 1986), and the micro-propagated plants are widely used (roughly 50% of all planting stock) for practical cultivation nowadays in spite of their higher price. Seed orchard seed produces 60-70% trees with curly-grained wood and vegetative micro-propagation 100%.
In Finland curly birch is mainly cultivated in the southern part of the country, where it grows best, but there are also a few encouraging examples from Northern Finland where cultivation of curly birch has succeeded well (Etholén 1978). For cultivation of curly birch a fertile upland site with light mineral soil and good aeration should be selected. Site preparation is needed before plantation establishment especially on former agricultural land (Hagqvist and Mikkola 2008). Usually 1600 seedlings are planted per hectare, but if there is a risk of damage by browsing animals, i.e. moose (Alces alces), hare (Lepus spp.) and voles (Microtus spp., Myodes spp.), it is recommended to plant up to 2500 seedlings per ha. When expensive micro-propagated plantlets are used, some 800-1000 plantlets (sometimes as low as 400) are used to reduce the costs. Seedlings can be protected against the moose by fencing and against voles and hares using plastic plant shields. Excess ground vegetation is removed from covering the seedlings during the first 2-3 years, and cleaning is needed to remove sprouts of other broadleaves.
Artificial branch pruning is practiced to maximize the amount of turnable wood in the stem (Heikinheimo 1951, Sarvas 1966). It should be started as early as after 2-3 years after plantation establishment and continued in stages until wanted height is reached, normally up to 2.5 – 5 meters. The best time to carry out pruning in Finland is from late June till late July (Hagqvist and Mikkola 2008).
Normal silver birches are removed from the stand at the age of about 10-13 years, when the dominant height is 7-9 m (Heikinheimo 1951, Sarvas 1966, Hagqvist and Mikkola 2008). Thereafter repeated thinnings from below are carried out to remove the curly trees with low quality to provide the best ones with sufficient space and light. As a general rule, the thinnings should be light and repeated at short intervals, because identification of curliness is unreliable especially in younger trees. The final cutting is usually conducted at the age of 35-50 years.
Processing of curly birch 6.Detailed instructions for processing curly birch were given by Kosonen (2004a), whose work is briefly cited below. Curly birch if preferably cut in the late winter, when the amount of water in the tree is smallest. In case the decorative outer surface of the curly birch beneath the inner bark is to be revealed, the best cutting time is in the sap season later in the spring, when the bark is easy to remove. If the trunk is to be dried as such, it is partly peeled from different sides along the length of the trunk, and then slowly dried for 2-3 years outdoors in a windy but sheltered location, in order to prevent splitting of the log. A dried round curly birch log is excellent material for making lathe-turned objects, and therefore such items of curly birch are very common. Grinding and finishing curly wood surface succeeds well (Kosonen 2004b). Curly birch wood suits well for turning, but as long massive items it bends and twists.

Natural resources and bioeconomy studies 80/2017
137
Curly birch logs are sawed immediately after cutting. The sawing adjustments depend on the use of the timber. If the use is not known it is recommended to saw the trunk into boards as thick as possible but with the log opened in the middle. The boards are then dried in the same way birch is usually dried. If light color of timber is desired, the drying should be carried out without high temperatures. The subsequent drying of curly birch after outdoor drying is carried out in normal indoor conditions (5-10 years). The dried board is worked and prepared just like ordinary silver birch (Kosonen 2004b).
Veneering of curly birch can be done either by rotary peeling transversely or by cutting longitudinally, the former being the most common method. Veneering is always begun with fresh time, even with the addition of humidity and temperature. The width of the veneer is usually 90-120 cm, which is due to the small number of straight curly birch logs. Cut curly birch logs provide long but narrow veneer. Making wide surfaces calls for composition, but it also permits more alternatives than rotary peeled veneer (Kosonen 2004b). From seed-borne curly birch trees every log is different, which means that in large works it is difficult to preserve the visual aspect unchanged. However, from clonal stands it is possible to get technically and visually uniform wood material in large quantities in the near future.
Traditional and modern uses of curly birch 7.Curly birch has been traditionally used in various vernacular tools and implements (Kosonen 2004c). Owing to the tough and non-splitting structure of the wood, curly birch has been suitable and sought after for purposes where durability and toughness is needed. Handles of knifes and chicels, stocks of veapons as well as cudgels were typically made of curly birch. In the kitchen, most of wooden vessels and containers were made of curly birch or burls before stave vessels were available. In addition, curly birch served people’s everyday life in many other functional items, like salt cellars, scale
weights, reelers, spool frames, sugar hammers, candlesticks etc. For traditional uses the durability of the wood, more than the decorativeness, was the starting point.
When industrial manufacturing of tools and vessels was started in the early 1900’s, there was no
more need to make things by hand. The skills and knowledge of the curly wood material among ordinary people and local carpenters was directed to making decorative objects. Curly birch began to be used by cabinet-making firms and furniture factories (Kosonen 2004c).
Curly birch has gained also symbolic meanings in addition to its value in vernacular use. Courts and members of the elite became interested in it owing to its rarity and decorativeness - particularly in Russia, where it was greatly valued at the Imperial court. Emperor Alexander I is known to have given Napoleon a set of curly birch furniture (Kosonen 2004c).
For the Finns, curly birch has been associated with the symbols of national existence. The Latin name of curly birch “var. carelica” refers to its important area of distribution in Karelia, where in turn
Kalevala, the National Epic of Finland was generated. The Finland pavilion of the Paris World Fair of 1900 and its Iris Room with curly-birch furniture by Gallen-Kallela and other art objects manifested our national identity. In the 1930’s the new Parliament House in Helsinki, the capital of the young republic of Finland, was fitted with curly and flamy birch furniture alongside items made from foreign types of timber. The simple forms of functionalist style in the 1930’s utilized curly birch by enhancing
the furniture with curly birch veneer. Famous Finnish architect, Alvar Aalto accepted curly birch veneer for the finish of some of his chair designs, but otherwise it was no more wanted in wooden products of the industrial era (Kosonen 2004c). However, during the 1990’s designers and cabinet-makers collaborated in projects involving various types of wood, which reintroduced curly birch in the modernization of wooden materials.
Curly birch wood can be highly decorative containing curly-grained and brown-figured pattern. However, being a visually prominent pattern, curly birch has been and is still used only as a part of interiors, on small surfaces. The interiors of lifts, table tops, cupboard doors and the front part of

Natural resources and bioeconomy studies 80/2017
138
counters are often lined with curly birch. Wood with smaller dimensions is used in handicrafts and carpentry for highly valued products such as gifts, souvenirs, tools and furniture. Curly birch items are very popular as corporate gifts. Chairmen’s gavels of organizations are one of the most common
symbolic uses for curly birch at present. After the Second World War curly birch was still rotary-cut into veneer in Finland, but at the
limited use of veneer and the development of rotary cutting brought an end to its manufacture on a large scale in Finland. The Mahogany company in Lohja has continued making curly veneer in small amounts. The veneer is mostly cut in Germany (Kosonen 2004c).
Curly birch timber trade 8.Curly birch is by far the most valuable and highly-priced variant of native tree species in Finland – and the only one that is sold by fresh weight. The price of a kilo of curly birch wood has clearly exceeded the price of sugar, with which it used to be compared earlier. However, the price of curly birch can vary a lot depending on the quality and quantity of the batch for sale. The quality requirements vary according to the buyer, and every deal is a unique case which is agreed precisely between the seller and the buyer (Hagqvist and Mikkola 2008).
Curly birch timber is generally divided into two main quality grades according to the size and quality: (i) wood without knots, suitable for turning and (ii) curly grained branch wood (Visaseura 2017). In the former category, the minimum length and diameter above bark of the log is 75-100 cm and 20 cm, respectively. In the latter category, the minimum length is 50 cm and diameter 10 cm. Both grades are further divided into two according to the quantity of the curly-grained pattern. In addition to these grades, even smaller curly-grained branch wood (till 5 cm in diameter) is bought, if it contains rich curly configuration. The price for curly birch suitable for turning varies between 3−5 €
kg-1 and the price for curly grained branch wood is around 0.5 € kg-1. Curly birch is mostly bought by dealers which market the timber further to users. The best time
for curly birch commerce is in the winter season from October to April, when there is no risk of the logs to get spoiled. In summertime the demand is low and only minor batches are bought. Curly Birch Society disseminates information between the sellers and buyers of curly birch timber.
Changing markets 9.Since the first cultivation experiments in the 1920’s, the annual cultivation area of curly birch remained very low – a few hectares at the most – till the 1980’s, although seed material was
available (Sarvas 1958) and the management methods were known sufficiently (Heikinheimo 1940, 1951, Sarvas 1966, Saarnio 1976). The Finnish Curly Birch Society (Visaseura ry) was established in 1956 to promote the cultivation and use of curly birch, and to co-ordinate the activities of curly birch growers, forest industry and research (Huuri 1978). Since then it has operated as a link between curly birch growers, enthusiasts and professionals and promoted cultivation, management, research, utilization and marketing of curly birch by information, guidance and consulting. Excursions, organized annually to interesting visiting points, have always been very popular among the members and the most important way of extension.
In 1980 the Finnish Dendrological Society nominated curly birch as the Tree of the Year, which raised new public interest in this variety and gradually led into launching of a new cultivation era. Genetically improved seedling material was soon available after establishment of the first curly birch seed orchard in 1981. Also the introduction of clonally micro-propagated plant material by the company Metsätyllilä Oy in the 1990’s kept interest in curly birch high promising even higher
monetary returns than growing of seedlings. These facts together with intensified extension especially by the Curly Birch Society and the Foundation for Forest Tree Breeding increased planting areas very rapidly between 1989 and 1998, from about 30 ha to 600 ha annually (Figure 1). After the
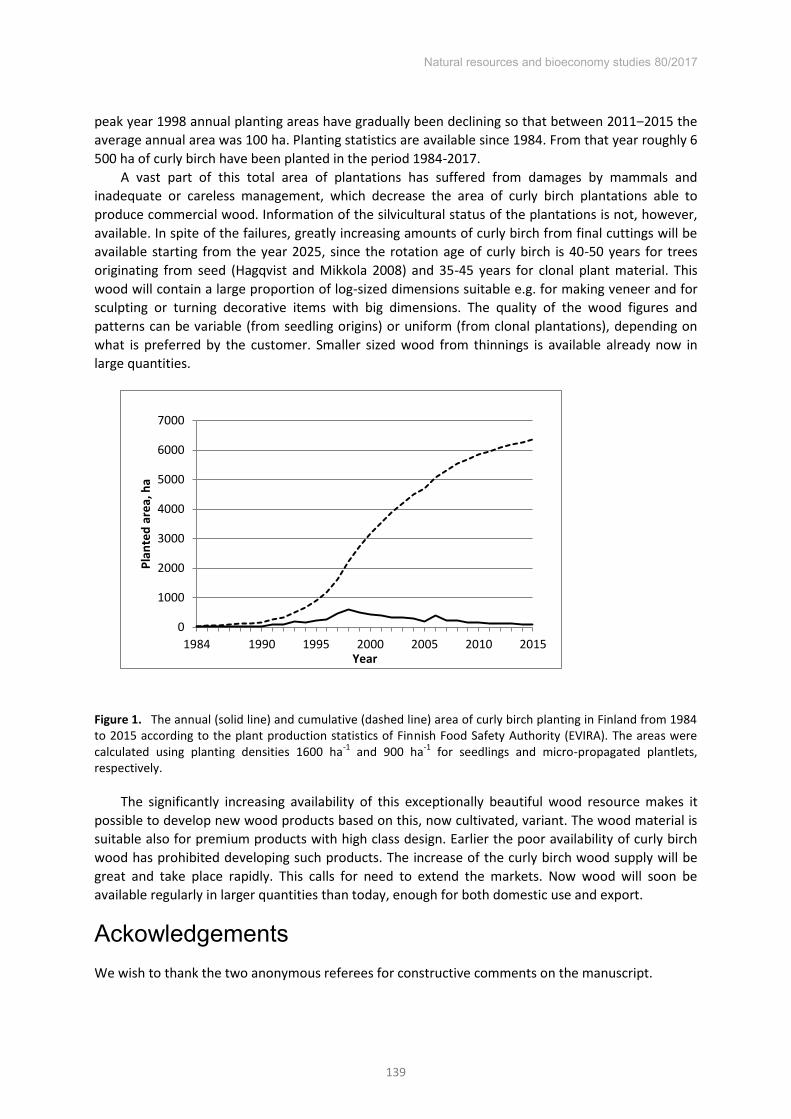
Natural resources and bioeconomy studies 80/2017
139
peak year 1998 annual planting areas have gradually been declining so that between 2011‒2015 the
average annual area was 100 ha. Planting statistics are available since 1984. From that year roughly 6 500 ha of curly birch have been planted in the period 1984-2017.
A vast part of this total area of plantations has suffered from damages by mammals and inadequate or careless management, which decrease the area of curly birch plantations able to produce commercial wood. Information of the silvicultural status of the plantations is not, however, available. In spite of the failures, greatly increasing amounts of curly birch from final cuttings will be available starting from the year 2025, since the rotation age of curly birch is 40-50 years for trees originating from seed (Hagqvist and Mikkola 2008) and 35-45 years for clonal plant material. This wood will contain a large proportion of log-sized dimensions suitable e.g. for making veneer and for sculpting or turning decorative items with big dimensions. The quality of the wood figures and patterns can be variable (from seedling origins) or uniform (from clonal plantations), depending on what is preferred by the customer. Smaller sized wood from thinnings is available already now in large quantities.
Figure 1. The annual (solid line) and cumulative (dashed line) area of curly birch planting in Finland from 1984 to 2015 according to the plant production statistics of Finnish Food Safety Authority (EVIRA). The areas were calculated using planting densities 1600 ha-1 and 900 ha-1 for seedlings and micro-propagated plantlets, respectively.
The significantly increasing availability of this exceptionally beautiful wood resource makes it possible to develop new wood products based on this, now cultivated, variant. The wood material is suitable also for premium products with high class design. Earlier the poor availability of curly birch wood has prohibited developing such products. The increase of the curly birch wood supply will be great and take place rapidly. This calls for need to extend the markets. Now wood will soon be available regularly in larger quantities than today, enough for both domestic use and export.
Ackowledgements We wish to thank the two anonymous referees for constructive comments on the manuscript.
0
1000
2000
3000
4000
5000
6000
7000
1984 1990 1995 2000 2005 2010 2015
Plan
ted
area
, ha
Year

Natural resources and bioeconomy studies 80/2017
140
References Ahokas, H. 1985. Cytokinins in the early sap of curly birch (Betula pendula f. carelica) and the non-curly
form. Journal of Plant Physiology 118:33-39. Atanasoff, D. 1967.Virus stem pitting of birch (Wisa and Maser Disease). Zeitschrift für
Pflanzenkrankheiten und Pflanzenschutz 74:205-208. Beals, H.O. and T.C. Davis. 1977. Figure in wood: an illustrated review. Agricultural Experiment Station,
Auburn University, Alabama. Bulletin 486. 79 pp. Etholén, K. 1978. Experimental growing of curly birch in Finnish Lapland. Kokemuksia visakoivun
kasvatuksesta Lapissa. (In Finnish with English Summary). Silva Fennica 12(4):264-274. Etholén, K. and L. Huuri. 1982. Bibliography on curly birch Betula pendula var. carelica (Mercklin). Folia
Forestalia 502:1-24. Hagqvist, R. 1996. Profitability of growing curly birch. Visakoivun kasvatuksen kannattavuus (In Finnish).
Presentation in a seminar of the National Forest Week. Finnish Forest Association. Esitelmä Metsäviikon Puun Vuoden Seminaarissa. Suomen Metsäyhdistys. Marina Congress Center, 26.3.1996, Helsinki.
Hagqvist, R. and A. Mikkola. 2008. Management and utilization of curly birch. Visakoivun kasvatus ja käyttö. (In Finnish). Metsäkustannus Oy and Visaseura ry. Hämeenlinna 2008. 168 pp.
Hämet-Ahti, L. 1987. Taxonomical problems of the Finnish birches. Suomen koivujen taksonomisia ongelmia. (In
Finnish with English Abstract). Sorbifolia 18(3):115-117. Hämet-Ahti, L., A. Palmén, P. Alanko, and P.M.A. Tigerstedt. 1992. Woody Flora of Finland. Suomen
puu- ja pensaskasvio. (In Finnish). Dendrologian Seura – Dendrologiska Sällskapet r.y., Helsinki. 373 pp.
Heikinheimo, O. 1933. The curly trait of birch is inherited to the next generation. Koivun visaominaisuus kulkee perintönä
seuraavaan sukupolveen.(In Finnish). Metsälehti 1933(1):4-5. Heikinheimo, O. 1940. Observations on cultivation of curly birch. Havaintoja visakoivun kasvattamisesta.
(In Finnish). Metsätieteellinen Aikakauskirja 57(7):41-46. Heikinheimo, O. 1951. Experiences on the growing of curly birch. Kokemuksia visakoivun kasvatuksesta
(In Finnish with English Summary). Communicationes Instituti Forestalis Fenniae 39(5):1-26. Hintikka, T.J. 1922. Die Wisa – Krankheit der Birken in Finnland. Zeitschrift für Pflanzenkrankheiten und
Gallenkunde 32(5/6):193-210. Hintikka, T.J. 1941. About curly birches and their anatomy. Visakoivuista ja niiden anatomiasta. Űber die
Wisabirken und ihre Anatomie. (In Finnish with German Referat). Printed in 2008. Kopio-Niini Oy Tampere. 346 pp.
http://hdl.handle.net/1975/7630. Hintikka, T. 2004. Determination of strength properties of curly birch experimentally. Visakoivun
lujuusominaisuuksien selvittäminen kokeellisesti. (In Finnish). Turun ammattikorkeakoulu. Päättötyö. Turun
ammattikorkeakoulun puheenvuoroja 15. 42 pp. Huuri, O. 1978. Curly Birch Society. Visaseura. (In Finnish with English Summary). Silva Fennica
12(4):241-244. Johnsson, H. 1951. Progeny of curly birch. Avkommor av masurbjörk. (In Swedish). Svensk
Skogsvårdsföreningens Tidskrift 49(1):34-45. Johnsson, H. 1974. Genetic characteristics of Betula verrucosa Ehrh. and Betula pubescens Ehrh.
Annales Forestales. Anali za Šumarstvo 6(4):1-149. Kärkkäinen, K., A. Viherä-Aarnio, P. Vakkari, R. Hagqvist, and K. Nieminen. 2017. Simple inheritance of
a complex trait: figured wood in curly birch is caused by one semi-dominant and lethal Mendelian factor? Canadian Journal of Forest Research 47(7):991-995.
Kosonen, M. (Ed.). 2004a. Curly birch – Visakoivu. (In Finnish and English). Kustannusosakeyhtiö Metsälehti. 208 pp.
Kosonen, M. 2004b. Työstö – Preparation. In: Kosonen, M. (Ed.). Curly birch. Visakoivu. MetsälehtiKustannus, Helsinki. pp.107-123.
Kosonen, M. 2004c. Käyttö – Use. In: Kosonen, M. (Ed.). Curly birch. Visakoivu. MetsälehtiKustannus, Helsinki. pp.125-173.

Natural resources and bioeconomy studies 80/2017
141
Lepistö, M. 1973. Accelerated birch breeding – in plastic greenhouses. The Forestry Chronicle 49(4):172-173.
Ljubavskaja, A.J. 1978. Carelian birch. Karelskaja berjoza. (In Russian). Lesnaja promyslennost. Moskva 156 pp.
Mikkola, A. 2004. Identifying curly birch. In: Kosonen, M. (Ed.). Curly birch. Visakoivu. MetsälehtiKustannus, Helsinki. pp. 89-101.
Novitskaya, L. 1998. Regeneration of bark and formation of abnormal wood. Trees (1998) 13:74-79. Paganová, V. 2004. Analysis of inheritance and growth of curly birch progenies from controlled
hybridization and possibilities of their utilization for timber production in agricultural landscape. Czech Journal of Genetics
and Plant Breeding 40(2):51-62. Pagan, J. and V. Paganová. 1994. Curly birch in Slovakia. Breza biela svalcovitá (Betula alba L. var.
carelica Merk.) na Slovensku. (In Chech with English Summary). Vedecké a pedagogické actuality 10/1994:1-75. Vydala
technick univerzita vo Zvolene Edičnom stredisku. Pätiälä, R-V., K. Blomberg, S. Piepponen, and Paakkanen, J. 1978. On carbohydrates of the sap of
silver birch and its form curly birch. Havaintoja raudus- ja visakoivun mahlan sokeripitoisuudesta. (In Finnish with English Summary). Silva Fennica 12(4):253-256.
Raulo, J. and G. Sirén. 1978. Yield and return of final cutting in four curly birch stands. Neljän visakoivikon päätehakkuun tuotos ja tuotto. (In Finnish with English Summary). Silva Fennica 12(4):245-252.
Ruden, T. 1954. On speckled birch (‘mazer-birch’) and some other forms of curled birch. Om valbjørk og endel andre unormale veddannelser hos bjørk. (In Norwegian with English Summary. Meddelerser fra Det Norske Skogforsøksvesen 43. pp. 455-505.
Ryynänen, L. and M. Ryynänen. 1986. Propagation of adult curly-birch succeeds with tissue culture. Silva Fennica 20(2):139-147.
Saarnio, R. 1976. The quality and development of cultivated curly-birch (Betula verrucosa f. carelica Sok.) stands in southern Finland. Viljeltyjen visakoivikoiden laatu ja kehitys Etelä-Suomessa. (In Finnish with English Summary). Folia Forestalia 263:1-28.
Salmi, A., T. Hintikka, T. Karppinen, P. Forsman and E. Hæggström. 2007. Computerized ultrasound differentiation of curly birch from silver birch. Journal of Applied Physics 101(2):024906-024906-5.
Sarvas, R. 1958. Collecting curly birch seed. Visakoivun siemenen hankkiminen (In Finnish). Visaseuran tiedonantoja nr. 1 pp. 11-15.
Sarvas, R. 1966. Establishment and silviculture of a curly birch stand. Visakoivikon perustaminen ja hoito. (In Finnish). Metsätaloudellinen Aikakauslehti 83(8):331-333.
Sokolov, N.O. 1937. The physical and mechanical properties of curly birch wood. (In Russian). Voprosi lesnova hasjaistva I lesnoi promislennosti Karelii. Pp. 207-225. Petrozavodsk. (Cited in Hintikka 2004).
Velling, P., A. Viherä-Aarnio, R. Hagqvist, and J. Lehto. 2000. Valuable wood as a result of abnormal cambial activity – the case of Betula pendula var. carelica. In: Savidge, R., Barnett, J. and Napier, R. (Eds.). Cell & Molecular Biology of Wood Formation. BIOS Scientific Publishers Ltd, Oxford. pp. 377-386.
Visaseura 2017. Visapuun kauppa. http://www.visaseura.fi/osto-ja-myynti/visapuun-myynti/ (visited 5.5.2017

Natural resources and bioeconomy studies 80/2017
142
Session III Hardwood product development and performance

Natural resources and bioeconomy studies 80/2017
143
Glue-line performance and mechanical properties of multilaminar based products from planted Acacia
and Eucalyptus forest resources for furniture manufacturing in Vietnam
Nguyen Quang Trung1*, Henri Bailleres2 , Nguyen Thanh Tung1, Adam Redman2
Abstract
Vietnam aims to use 80% of wood material from domestic sources for furniture making by 2020 whereby effective use of the plantation resource is a priority in the “Action plan of the forestry sector to year 2020”. Research on the effective use of timber plantations is oriented into two objectives: diversifying the products from timber plantations and increasing the value of products from this resource. The value of timber plantations is increasing leading to an increase in the price of plantation timber material. This is contributing to one of the five major components of the “Vietnamese forestry strategy 2006–2020”, such that forest growers’ income is improved. Nevertheless, currently most of the plantation material in Vietnam is being used for wood chip and construction material; a much smaller proportion of plantation resources are being used for furniture making and other value-added products such as veneer based products, which does not correspond to the potential of this resource. In order to meet the target of using wood material from domestic sources and increase the effective use of this plantation resource, particularly Acacia and Eucalyptus species, we investigated the potential of using peeled veneer for manufacturing multilaminar based products as raw materials for the furniture industry. Investigation of the potential of these products was requested by several members of the Vietnamese veneer processing industry. As the use of Acacia and Eucalyptus plantations for this purpose is in its infancy, research and development is needed to assist the industry to produce high value veneer based products from this resource. To meet these research needs the Australian Centre for International Agricultural Research (ACIAR), in conjunction with 11 partner organisations from Vietnam and Australia are funding a project titled Enhancement of veneer products from acacia and eucalyptus plantations in Vietnam and Australia (2012–2015).
Introduction 1.Acacia and Eucalyptus species are potential sources of timber for the wood processing industry in Vietnam. It is estimated that Acacia and Eucalyptus plantations represent more than 2 million ha of the 3.8 million ha of production forests in Vietnam (MARD 2016). Annual production of Acacia and Eucalyptus round logs is estimated at 21 million cubic meters per year.
The current use of Acacia and Eucalyptus logs is not compatible with the full potential of this resource. At present, planted timber utilization is limited, opportunities for value-adding are not being optimised and the economic effectiveness of this resource is limited. Over 70% of Acacia and Eucalyptus logs are used for wood chip production; The Vietnamese Government has encouraged plantation owners to develop their plantations to meet the requirements and demands for log material for veneer and sawn timber production.
As the current purpose of planting is providing logs for wood chip production, the planting duration cycle is short (from 5 to 6 years) and log quality does not meet the requirements set for saw logs or logs produced for veneer production. Typical defects of logs produced from plantations
* Corresponding author: Tel.: +84983199002; E-mail: [email protected]
1Vietnamese Academy of Forest Sciences (VAFS),
Duc Thang-Tu Liem- Hanoi
2Australian Scientist of FST 2008/039 project

Natural resources and bioeconomy studies 80/2017
144
developed for the wood chip industry include small diameter, wood with many eyes and deformations in sawn timber that arise during the processing phase.
The characteristics of planted Acacia and Eucalyptus trees in Vietnam at present are suitable for use in veneer production, which would result in high added value, contribute to the value of planted timber and increase income for plantation owners, most of whom are farmers.
Multilaminar blocks are a special product produced from Acacia and Eucalyptus peeled veneer which can be used as furniture material. The FST 2008/039 project implemented in Vietnam from 2013 to 2016 tested the production of multilaminar block material from small diameter trees from acacia plantations. Initial results show that Vietnam's current technological conditions meet the production technology requirements for producing furniture from these materials for.
This result ushered in new directions, creating new materials for the wood industry in Vietnam. The overall aim of this research is to promote higher value utilisation of Vietnamese Acacia and
Eucalyptus plantation timber by creating a new timber material ‘multilaminar base products’ for the
furniture industry.
Materials and methods 2.
Wood and adhesive material 2.1.The peeled veneer was produced from Acacia and Eucalyptus urophylla logs, which were logged at an age over 10 years old.
Adhesive used for LVL panels production was STbond UF 9128. Adhesive used for multilaminar blocks production (cold press gluing LVL blocks together) was Emulsion Polymer Isocyanate (EPI) Jowacoll 102.48 with the crosslinking agent Jowacoll 195.60. This adhesive has a viscosity of approximately 11,000 mPa (brookfield). It is 51% solids and has a pH value of 7. The open time is 10 ± 2 min, the pot life is a maximum of 2 hours. Adhesive application was to one face of the LVL panel at a rate of 200g/m2.
Figure 1. Diagram of production LVL in the laboratory
Hot Press
- Pressing time: 10 minute
- Pressing time: 10 minute
- Pressing time: 10 minute
Veneer lay up I
II
III
Adhesive Peeled veneer
Preparation
Glue application
Preparation
Natural resources and bioeconomy studies 80/2017
145
Manufacturing methodology 2.2.Laboratory manufactured LVL panels: In order to identify the best technical parameters to manufacture LVL panels, three different pressing treatment temperatures were tested as presented in Figure 1. Industry manufactured LVL panels and multilaminar blocks: LVL production technology was applied as it was tested in the laboratory. Multilaminar blocks were created by cold pressing of small dimension LVL plates which were cut from LVL boards.
Testing methods 2.3.Some mechanical and physical properties of the material were determined by the following standards:
Swelling in thickness: EN 317: 1993 Particleboards and fibreboards. Determination of swelling in thickness after immersion in water
Tensile strength: EN 319:1993- Particleboards and fibreboards. Determination of tensile strength perpendicular to the plane of the board
MOR and MOE: EN 310:1993. Wood-based panels. Determination of modulus of elasticity in bending and of bending strength
Bond quality value was tested by EN 314-1:2004 Plywood. Bonding quality. Test methods và EN 314-2 EN 314-2:1993 Plywood. Bonding quality. Requirements.
Results and dicussion 3.
Laboratory manufactured LVL panels 3.1.Figures 2 and 3 show the distribution of swelling and tensile strength of LVL panels which were made at three difeerent temperatures. The results show that the lowest value of swelling property was for the panels manufactured using treatment number III (temperature: 110°C). In other words, the technical parameters of this treatment created the best results for minimising the swelling. The highest value of the tensile strength recorded was also for the panels manufactured by treatment number III. This indicates that treament number III had the best glue-line performance.
The distribution of MOR and MOE of panels which were made at three diferrent temperatures are illustrated in Figures 4 and 5. Both the MOR and MOE values were the highest for the treatment III. This clearly shows that the treatment III is the most favourble in terms of MOR and MOE.
The results of all physical and mechanical properties tested show that the best performance for all properties was under treatment III. The higher temperature resulted in better glue-line quality under the same pressure and press time.
Subsequently, treatment III (pressing time of 10 minutes; temperature of 120°C; pressure of 1.2 N/mm2) is recommended for application in the manufacturing of LVL panels in the furniture industry.

Natural resources and bioeconomy studies 80/2017
146
Figure 2. Distribution of swelling (left)
Figure 3. Distribution of tensile strength (right)
Figure 4. Distribution of MOR (left)
Figure 5. Distribution of MOE (right)
Industry manufactured LVL panels and multilaminar blocks 3.2.Technical parameters applied for the manufacturing of LVL panels and multilaminar blocks at the industrial level are demonstrated in Figure 6. Adhessive used for LVL panels prodction was STbond UF 9128 which was used for LVL panel production at the laboratory.
4,60
4,32
4,18
Swelling.I (%)
Swelling.II (%)
Swelling.III (%)
3,9
4,1
4,3
4,5
4,7
4,9
5,1
5,3
Swel
ling
%
4,21 4,26 4,32
fk I (MPa) fk II(MPa)
fk III(MPa)
3,5
3,7
3,9
4,1
4,3
4,5
4,7
4,9
5,1
Tens
ile s
tren
gth
(MPa
)
66.51
69.54
77.23
σu.I
σu.II
σu.III
55
60
65
70
75
80
85
Mod
ulus
of R
uptu
re (M
Pa)
8 374,27
10 138,24
10 990,01
σu.I
σu.II
σu.III
6000
7000
8000
9000
10000
11000
12000
13000
Mod
ulus
of E
last
icity
(MPa
)

Natural resources and bioeconomy studies 80/2017
147
Figure 6. Diagram of manufacturing LVL panels and mulilamiar blocks at company
For both LVL panels and multilaminar blocks adhesive bonds were tested using the chisel test under dry conditions and for C type bonds according to Australian standard AS/NZS 2098:2012.
Under the dry condition chisel test, 100% of samples achieved the highest bond quality value (Figure 7). This means that the performance of glue-lines was excellent. However, bond quality values for the Type C bond test were very poor; most of the glue-line bond quality values did not meet the requirements of the standard. This could be because adhesive UF 9128 does not suit high moisture conditions while the type C bond test is designed for products which can be exposed to long-term high humidity or short-term extremely high humidity.
Both the dry and type C chisel tests had good bond quality values (Figure 8). Nevertheless, the average bond quality value of the type C chisel test was significantly lower than that of the dry chisel test even though the adhesive used for multilaminar blocks was a water resistant adhesive (Emulsion Polymer Isocyanate (EPI) Jowacoll 102.48). The reason for this was that when submerging the test
Hot Press
Veneer lay up
Adhesive
Preparation
Glue application (UF 9128)
Peeled veneer
Preparation
Acacia hybrid veneers are selected from company
Veneers are dried to moisture content of around 8%
- Press time: 10 Minute - Temperature: 1200C - Pressure: 1.2 N/mm2 - Adhesive: UF 9128
Cooling
Edge cutting and sanding
Manufacturing multilaminar
blocks
- Press time: 1 hour - Pressure: 0.7 N/mm2
- Cold press (room temperature) - Adhesive: Jowacoll EPI 102.48

Natural resources and bioeconomy studies 80/2017
148
pieces in water at 70°C, the test pieces absorbed water and then expanded while the already cured gluelines did not, resulting in a reduction of glue-line quality.
Figure 8 shows that the bond quality value in both test conditions was distributed over a wide range, indicating that the bond quality value was different within blocks and between blocks. The causes of this could be (I) as a result of variation in glue application on one face of the LVL panels when applied by hand or (II) because some LVL panels showed signs of bowing or bending under the pressure of creating a block and the LVL panels did not fully flatten. Nonetheless, when the block was released from pressure panels tended to go back to their original form whereas glue-lines were not 100% cured. This may have caused a reduction in the bond strength of glue-lines.
Figure 7. Distribution of bond quality value of LVL panels
Figure 8. Distribution of bond quality value of multilaminar block

Natural resources and bioeconomy studies 80/2017
149
Conclusion and recommendations 4. Multilaminar based products could be used as a new material for furniture manufacturing.
This will increase the value of plantation timber. The bond quality value of LVL panels under dry conditions was excellent using the adhesive
tested. However, the bond quality value was poor under long-term high humidity conditions and short-term extremely high humidity conditions.
In order to make sure that bond quality values are even within blocks and between blocks, glue should be applied on two faces of the LVL panels (during the cool press step) using a machine applicator for more consistency in the glue spread.
For LVL panels manufactured with urea formaldehyde, the products should be used under dry conditions.
In cases where products are to be used long-term in a high humidity environment, melamine formaldehyde or urea formaldehyde modified by melamine adhesives are strongly recommended for use.
More research is required to test different adhesives to find the most suitable adhesive for different applications and products.
Acknowledgements The authors thank ACIAR project (FST 2008/039) for its ongoing research funding and support to participation in the ISCHP 2017.
References Australian standard AS/NZS 2098:2012 Bonding quality of plywood (chisel test). MARD 2016. Announce forest status in 2015. Ministry of Agriculture and Rural Development. Technical data sheet ST bond UF 9128. Technical data sheet Jowacoll EPI 102.4. Vietnamese Standard (2007) TCVN 7756-5:2007 (EN 317) Wood based panel – Determination of
swelling thickness. Vietnamese Standard (2007) TCVN 7756-6:2007 (EN 310) Wood based panel - Determination of
modulus of elasticity in bending and bending strength. Vietnamese Standard (2007) TCVN 7756-9:2007 (EN 314-1) Wood based panel - Determination of
bonding quality.

Natural resources and bioeconomy studies 80/2017
150
Moisture buffering hardwood surfaces Katja Vahtikari*, Mark Hughes
Department of Biosystems and Bioproducts School of Chemical Engineering, Aalto University
Espoo, Finland
Abstract
Wooden surfaces are considered beautiful and natural and they are widely used in various interior applications due to their aesthetically pleasant visual appearance. In addition to the aesthetics, wood material could also bring functionality to the interior. Wood material has an ability to take up and release moisture and thus it can have an effect on the indoor air for example by reducing the humidity fluctuation. To maintain the functional properties of wooden surfaces, they must be coated in a way that allows water vapor to transfer trough the coating layer. Another option is to leave wooden surfaces untreated, but this option is not common in Finland. This paper describes research which was done in Aalto University as a part of WoodWisdomNet+ project Wood2New (Competitive wood-based interior materials and systems for modern wood construction). The studied hardwood species were Silver birch (Betula pendula), European White Elm (Ulmus laevis), Common Ash (Fraxinus excelsior), Common Oak (Quercus robur), Black Alder (Alnus glutinosa) and Norway maple (Acer platanoides). The moisture buffering value (MBV) was determined to the listed wood species. In addition to uncoated surfaces, the effect of permeable and impermeable coating on the moisture buffering capacity of wood was studied. Test results show that coatings alter the sorption behaviour of wooden surfaces significantly and thus change the moisture buffering behaviour of wood material. There were differences between the species as well, but they were less significant.
Introduction 1.Hygroscopic interior materials, like wood, are able to even-out moisture peaks in the interior environment (Hedegaard et al. 2005; Rode et al. 2005, Hameury 2006) and thus make living spaces more comfortable for the occupant. This ability of a material to moderate humidity fluctuations is termed its moisture-buffering capacity. To quantify this capacity, in a joint effort between European wood research institutes at the beginning of the millennium, a test methodology was developed (Rode et al. 2005). The proposal for the test protocol for what is known as the practical moisture buffering value (MBV) has been widely accepted amongst researchers, but so far it has not been included in product declarations listing the key materials properties of a building product, and thus information regarding its moisture buffering capacity is difficult to obtain. MBV is applicable also for the material systems such as coated wood. The Nordtest project determined five performance classes for the practical moisture buffering values. Materials in the best performance class excellent have in minimum a capacity for a moisture flow of 2g/(m2%RH)@8/16h which corresponds to the minimum required air change rate. The lowest performance class negligible has the capacity of 0-0.2g/(m2%RH)@8/16h. For example uncoated spruce boards reached the second best performance class good (1-2g/(m2%RH)@8/16h) in the Round Robin tests of the Nordtest project. Uncoated birch boards fell mostly into the class moderate (0.5-1g/(m2%RH)@8/16h), but some specimens reached the class good.
Easily accessible information about the moisture buffering capacity of various building products would allow architects, designers and end-users to compare the hydrothermal performance of various products and to employ them in creating passive means for indoor-climate control. Buildings without mechanical ventilation units would benefit directly from the use of hygroscopic building
* Corresponding author: Tel.: +358505056974; E-mail: [email protected]

Natural resources and bioeconomy studies 80/2017
151
materials but, in addition, the proper use of porous building materials could decrease the need for energy-consuming ventilation systems and thus enable savings in the operation costs of a building.
Material properties dictate the moisture buffering performance of a product. Density, porosity, water vapour permeability and other sorption properties have an effect on the ability of a product to take up and release moisture when exposed to indoor air. Properties of wood species differ from each other, but there is variation also within-species, of which pine is a good example. Even more variation derives from the coatings, which are frequently applied on wooden surfaces to protect them from moisture, wear and sunlight. Besides the protection, the layer of coating covering the hygroscopic material inhibits the material-moisture interaction needed to employ the moisture buffering capacity of the material. There are promising examples of ways to protect the surface without blocking it and thus allowing the water vapour to reach the porous material.
The appearance is of vital importance in interior products. Hardwood species have more versatile visual properties than commonly used Scandinavian softwood species like pine and spruce. Hardwood species appear both in light and to modified (Sundqvist 2002) and locally sourced light-colored species can be made to imitate darker imported species when modified. It is also possible to increase the surface hardness and improve the wear resistance of the wooden surfaces (Rautkari et al.2010). Research about the potential of wooden surfaces to serve as a moisture buffer has focussed mainly on softwood species. This paper presents results from moisture buffering tests carried out on six hardwood species. In addition to the difference between the species, the effect of cutting direction is discussed, as well as the effect of interior coatings.
Materials and Methods 2.The protocol of the Nordtest Method (Rode et al. 2005) was used for the moisture buffering test to determine the practical moisture buffering value (MBVpractical (kg/m2%RH)). MBVpractical defines the amount of moisture transported in to or out of a material per unit of open surface area, during a specified period of time, when the material is exposed to cyclic variations in relative humidity. In order to determine MBVpractical, the weight gain during absorption and the weight loss during drying were calculated, then averaged and normalized per open surface area and ΔRH. Average of weight gain and weight loss was taken for each cycle, and consequently MBVpractical was calculated as the average of three cycles.
Before the cyclic humidity loading started, the test specimens were conditioned at RH50%, T=23°C for several weeks. The cyclic humidity loading consisted of two intervals following each other for several days: an 8-hour interval with a high humidity load of RH75% and a 16-hour interval of low humidity of RH33%. A climate cabinet was used for the test. The temperature was maintained at 23ºC during the test. According to the test protocol, the materials tested should be exposed to the humidity variation in the same way as they would be in the real end-use environment. In the case of solid wood boards this means that only one surface is exposed, since boards are usually installed on a wall, floor or ceiling leaving only one side of the board visible. In the test, only one surface of the specimens was exposed; the remaining five sides being sealed with aluminum tape to prevent sorption. An analytical balance was used to monitor the mass change of the test specimens.
Wood Material 2.1.The hardwood species tested were silver birch (Betula pendula), European white elm (Ulmus laevis), common ash (Fraxinus excelsior), common oak (Quercus robur), black alder (Alnus glutinosa) and Norway maple (Acer platanoides) including both ring- and diffuse-porous species. Scots pine boards (Pinus Sylvestris) were included in the test for comparison purposes. Boards were kiln-dried and planed. Both flat-sawn and radially sawn boards were obtained for the test, because they differ visually from each other and they reveal different amount of latewood and early wood, which may

Natural resources and bioeconomy studies 80/2017
152
have an effect on the sorption behavior. The six hardwood species are presented in Figure 1. The exposed area of radial/tangential surfaces was 100mm*300mm.
The thickness of the boards was a limiting factor in the transverse surface sample preparation and therefore small cubes (25mm*25mm*25mm) of oak were used to explore the difference between the transverse and the radial/tangential surfaces (Figure 2).
Figure 1. Radially sawn (top) and flat-sawn hardwood boards used in moisture buffering test. Species from left: ash, birch, black alder, elm, maple and oak.
Figure 2. Transverse (left), tangential (middle) and radial (right) surface of oak (Quercus Rubur).
Surface Coatings 2.2.Coating experiments were carried out using Scots pine boards. The chosen coating was water-borne, transparent varnish. A permeable, diffusion-open, coated surface was created by diluting the coating with 10 % water and applying it by spraying with an application rate of 55 +/- 5 g /m². An impermeable, diffusion-closed coated surface was created by applying undiluted coating with an application rate of 110 +/-10 g /m².
Results and discussion 3.Due to the limited amount of replicates, the results are presented as average of all the specimens per specie and no division between the radial and tangential surfaces is done. For the cubic samples of oak, results for all the three directions are presented.

Natural resources and bioeconomy studies 80/2017
153
The effect of species and grain direction 3.1.Figure 3 shows the practical moisture buffering values of the tested hardwood species tested. All tested specimens fell into these two categories. Variation between various species is expected, since there are anatomical differences, the amount of extractives differs and some wood species like oak have more closed structure due to the tyloses.
Figure 3. Practical moisture buffering value (MBV) of the tested hardwood species. Birch, black alder and oak fell to the category good. Ash, elm and maple were in the category good.
In addition to the boards, the moisture buffering test was also run using cubic samples to see how the different grain directions differed from each other. As may be seen from Figure 4, the radial and tangential surfaces of oak fell into the ‘moderate’ category, but the transverse surface reached the category excellent (Figure 4). Especially in short and high moisture loads as in the wet spaces the ability of the material to quickly adsorb moisture is significant from the buffering perspective.
Figure 4. Practical moisture buffering value (MBV) of oak in different grain directions.

Natural resources and bioeconomy studies 80/2017
154
The effect of coatings on the moisture buffering value 3.2.The choice of a coating is critical when the moisture buffering potential of wood is to be maintained. Figure 5 shows schematically how the different coatings (permeable/impermeable) affect the hydrophobicity of the surface (contact angle) and water vapor transport to and from wood material.
Figure 5. Schematic representation of the effect of different coatings on the moisture buffering behaviour of wooden surfaces.
The test to study the effect of coatings was done with Scots pine specimens. Practical moisture buffering value of the untreated flat-sawn board was compared to similar board surfaces which were coated either with diffusion-closed (impermeable) or diffusion-open (permeable) coating. Both coatings decreased the moisture uptake and release, diffusion-open coating less than diffusion-closed coating. The practical moisture buffering class of the uncoated reference was moderate whereas the sample with diffusion-open coating fell into the category limited and the sample with diffusion-closed coating into the category negligible. Similar results were obtained by Hameury (2007) who tested both water-vapor permeable coatings and coatings with low water-vapor permeability. The biggest decrease in the moisture buffering value was more than 50% when using a coating with low water-vapor permeability. In his study the used wood species was Scots pine. The uncoated pine specimen reached the practical moisture buffering class good. Lozhechnikova et al. (2015) used Norway spruce in her study of the effect of new natural hydrophobic coatings and commercially available coatings on the moisture buffering capacity of wood. Her uncoated spruce reference belonged to the MBV class moderate. Her new wax particle coating did not decrease the moisture buffering capacity, but her results with linseed oil were similar to Hameury’s results with
traditional linseed oil based paint: a slight decrease in MBV. The application of wax and varnish decreased the MBV to the class limited (Lozhecnikova et al. 2015).
Conclusions 4.The practical moisture buffering values of birch, black alder and oak belong to the class moderate whereas ash, elm and maple reached the class good. These values are comparable to those of softwood species in for example Hameury’s (2007) and Lozhechnikova et al. (2015) studies. There
was a clear difference in the moisture buffering performance of wooden surfaces due to the anatomical orientation of the exposed surface. The tangential and radial surfaces of oak fell into the MBV class moderate, whereas the transverse surfaces were in the best performing class excellent. Wooden surfaces are usually coated in real end-use applications to prevent them from wear and soiling. Careful consideration is needed when the moisture buffering capacity of the surfaces is to be

Natural resources and bioeconomy studies 80/2017
155
maintained and simultaneously protection against dirt, liquids or other types of soiling is needed. In our test both coating variations decreased the moisture buffering capacity of the wood material.
Acknowledgements The research leading to these results has received funding from two projects: Wood Life and Wood2New. Wood Life is an interdisciplinary research project “Wood Life: Energy-efficient living spaces through the use of wooden interior elements”, where the focus is on the potential of wood material to enhancing the energy-efficiency of housing. It is part of the Aalto energy-efficiency research programme. Wood2New belongs to the WoodWisdom-Net Research Programme which is a transnational R&D programme jointly funded by national funding organisations within the framework of the ERA-NET Plus Action WoodWisdom-Net+.
References Hameury, S (2006) The hygrothermal inertia of massive timber constructions. Doctoral thesis. KTH,
Royal Institute of Technology, School of Architecture and the Built Environment, Dept. of Civil and Architectural Engineering, Stockholm, Sweden. 85p + papers I-VII.
Hameury, S (2007) Influence of coating system on the moisture buffering capacity of panels of Pinus sylvestris L. Wood Material Science and Engineering 2(3-4): 97-105
Hedegaard, L. Rode, C. & Peuhkuri, R. 2005. Full scale tests of moisture buffer capacity of wall materials. Proceedings of the 7th symposium on building physics in the Nordic countries, Reykjavik, Islanti. Vol. 2. S. 662–669.
Lozhechnikova, A., Vahtikari, K., Hughes, M., & Österberg, M. (2015). Toward energy efficiency through an optimized use of wood: The development of natural hydrophobic coatings that retain moisture-buffering ability. Energy and Buildings, 105, 37-42.
Rautkari, L., Properzi, M., Pichelin, F., & Hughes, M. (2010). Properties and set-recovery of surface densified Norway spruce and European beech. Wood science and technology, 44(4), 679-691.
Rode C, Peuhkuri R, Mortensen LH, Hansen KK, Time B, Gustavsen A, Ojanen T, Ahonen J, Svennberg K, Harderup LE & Arfvidsson J (2005) Moisture Buffering of Building Materials. Report. Technical University of Denmark. 78p.
Sundqvist, B. (2002). Color response of Scots pine (Pinus sylvestris), Norway spruce (Picea abies) and birch (Betula pubescens) subjected to heat treatment in capillary phase. European Journal of Wood and Wood Products, 60(2), 106-114.

Natural resources and bioeconomy studies 80/2017
156
Case hardening and equilibrium moisture content of European aspen and silver birch after industrial scale
thermo-mechanical timber modification Juhani Marttila1*, Barnes Owusu Sarpong1, Veikko Möttönen2,
Henrik Heräjärvi1
Abstract
Case hardening (CH) is an unwanted feature, which causes dried wood to deform after sawing and conditioning the moisture content. The tendency for CH depends on the drying parameters. Its probability increases due to increased internal stresses in rapid kiln drying, thus conditioning and steaming after the cooling minimises the problem. A process of thermo-mechanical timber modification (TMTM™), enables drying, compression and thermal modification of sawn timber in a single treatment unit. This process is a potential method for reducing CH. It also reduces the equilibrium moisture content (EMC) of wood. The aim of this study is to analyse the effect of initial moisture content, compression degree and thermal modification of the CH and EMC of European aspen (Populus tremula L.) and silver birch (Betula pendula Roth). A total of 252 clear wood CH specimens were manufactured from TMTM™ modified boards that had green dimensions of 40 × 100 × 2,700 mm. Modifications were carried out in one of two ways: the compression was started either on green state or after pre-drying to approximately 20% MC. After the compression phase, half of the boards were thermally modified at 190 °C. After storage of four years, specimens were conditioned and analysed according to the standard CEN/TS 14464. Compression increases the CH substantially, but subsequent thermal modification practically eliminates it in both studied hardwood species. Tangentially and radially compressed specimens did not differ from each other in terms of CH. An increase in process temperature also reduced the EMC of birch and especially aspen.
Introduction 1.The internal stresses that develop in wood during drying vary considerably according to the process conditions, especially temperature and relative humidity. As a basic factor in stress development, tensile stress develops if normal shrinkage is restrained (McMillen and Youngs 1960). Case hardening (CH) is a factor closely related to residual stresses in wood after drying. According to Ranta-Maunus et al. (2001), ‘Case hardening is a feature of dried wood to deform (cup) after re-sawing and equalizing of the moisture content’. McMillen and Young (1960) determine CH as ‘a condition of
stress and set in which the outer fibers are under compressive stress and the inner fibers under tensile stress, and the stresses persist when the wood is uniformly dry’. CH may impede machining
such as resawing because it results in a change in stress distribution (McMillen and Youngs 1960). Nevertheless, there are ways to prevent it. According to Milić and Kolin (2008), conditioning can
reduce residual stress and moisture content distribution, and therefore, significantly improve the drying quality. However, no data are available on case hardening of thermally modified wood.
Equilibrium moisture content (EMC) can be defined as the moisture content at which the wood neither gains nor loses moisture from the surrounding atmosphere (e.g., Hoadley 1980). EMC is a
* Corresponding author: Tel.: +358505955477; E-mail: [email protected]
1School of Forest Sciences University of Eastern
Finland Joensuu, Finland
2Natural Resources Institute Finland
Joensuu, Finland

Natural resources and bioeconomy studies 80/2017
157
function of both relative humidity and temperature of the surrounding air (Baronas et al. 2001). Tiemann (1920) noticed a decrease in equilibrium moisture content of wood through drying at high temperatures. Thermal degradation of hygroscopic hemicellulose in thermal treatment has a major effect on hygroscopicity of wood (e.g., Kollmann et al. 1975, Borrega 2011).
Densification of wood is a process where density is increased by reducing the void volume of lumens in wood material. The process is effective when wood is heated above the glass transition temperature of amorphous polymers of wood – hemicellulose and lignin (Kunesh 1968, Wolcott et al. 1994, Tabarsa and Chui 2001). The primary purpose is to improve mechanical strength, moisture sorption behaviour and physical properties of wood (Fukuta et al. 2008). Thus, it is presumed that the process parameters of densification have an influence on case hardening and equilibrium moisture content of treated wood material. A process of thermo-mechanical timber modification (TMTM™) developed and commercialised by Nextimber Ltd. in Finland, enables densification, drying
and thermal modification of sawn timber in a single treatment unit. The aim of this study is to investigate the effects of several combinations of initial moisture content and process parameters in densification and thermal modification on case hardening and equilibrium moisture content of European aspen (Populus tremula L.) and silver birch (Betula pendula Roth) after long-term storage.
Material and methods 2.Altogether 138 European aspen and 114 silver birch (hereafter, aspen and birch) boards were sawn from freshly harvested logs to nominal cross-cut dimensions of 40 × 100 mm. Logs were procured from final felling of fertile mineral soil stands: birch logs (100 years) from Maaninka, Finland and aspen logs (50–70 years) from Kuopio, Finland. The diameter of the logs was over 25 cm. Logs were harvested at the end of 2012. The boards were modified in eight batches using four different combinations of initial moisture content, target degree of compression and thermal modification (Table 1). Aspen and birch boards were modified separately. The modifications were executed in a pilot modification kiln of Nextimber Ltd. in Kuopio, Finland. The length of the boards was adjusted to 2,700 mm, which corresponds to the executive length of the modification kiln (Figs. 1 and 2).
Figure 1. (Left) A set of aspen boards (40 × 100 × 2,700 mm³) before the modification. Photo: Nextimber Ltd.
Figure 2. (Right) Aspen boards after the modification. Photo: Nextimber Ltd.
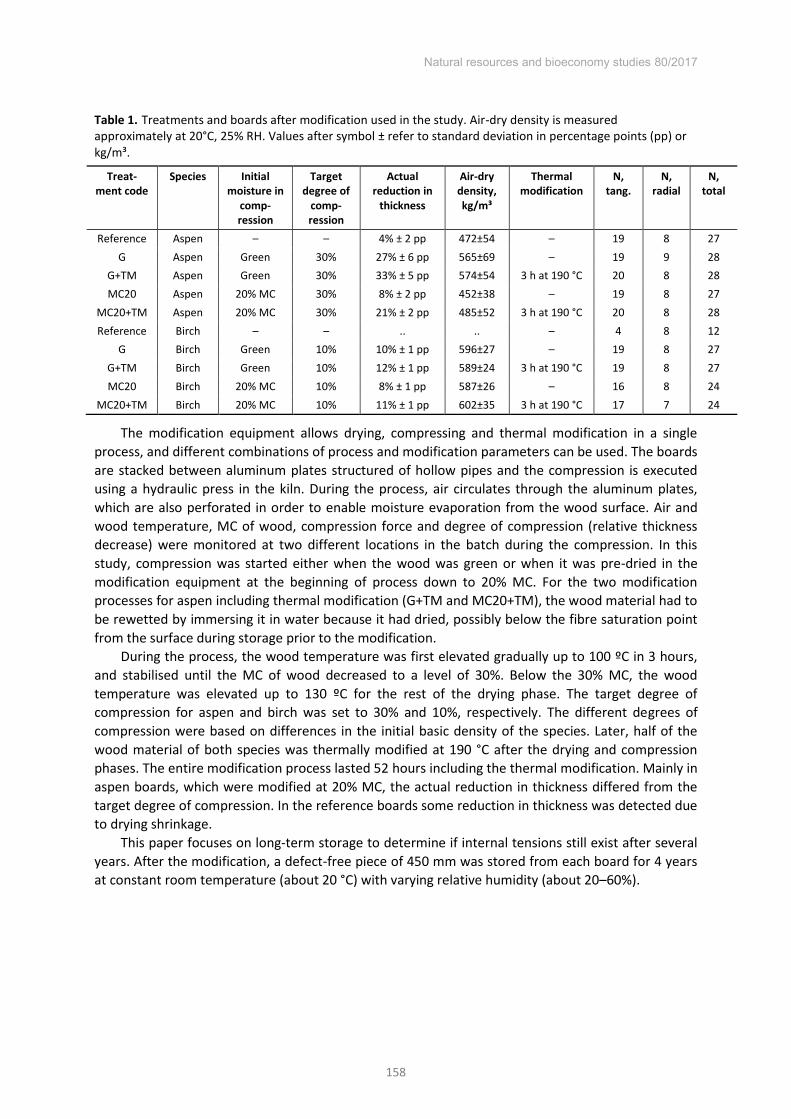
Natural resources and bioeconomy studies 80/2017
158
Table 1. Treatments and boards after modification used in the study. Air-dry density is measured approximately at 20°C, 25% RH. Values after symbol ± refer to standard deviation in percentage points (pp) or kg/m³.
Treat-ment code
Species Initial moisture in
comp-ression
Target degree of
comp-ression
Actual reduction in
thickness
Air-dry density, kg/m³
Thermal modification
N, tang.
N, radial
N, total
Reference Aspen – – 4% ± 2 pp 472±54 – 19 8 27 G Aspen Green 30% 27% ± 6 pp 565±69 – 19 9 28
G+TM Aspen Green 30% 33% ± 5 pp 574±54 3 h at 190 °C 20 8 28 MC20 Aspen 20% MC 30% 8% ± 2 pp 452±38 – 19 8 27
MC20+TM Aspen 20% MC 30% 21% ± 2 pp 485±52 3 h at 190 °C 20 8 28 Reference Birch – – .. .. – 4 8 12
G Birch Green 10% 10% ± 1 pp 596±27 – 19 8 27 G+TM Birch Green 10% 12% ± 1 pp 589±24 3 h at 190 °C 19 8 27 MC20 Birch 20% MC 10% 8% ± 1 pp 587±26 – 16 8 24
MC20+TM Birch 20% MC 10% 11% ± 1 pp 602±35 3 h at 190 °C 17 7 24
The modification equipment allows drying, compressing and thermal modification in a single process, and different combinations of process and modification parameters can be used. The boards are stacked between aluminum plates structured of hollow pipes and the compression is executed using a hydraulic press in the kiln. During the process, air circulates through the aluminum plates, which are also perforated in order to enable moisture evaporation from the wood surface. Air and wood temperature, MC of wood, compression force and degree of compression (relative thickness decrease) were monitored at two different locations in the batch during the compression. In this study, compression was started either when the wood was green or when it was pre-dried in the modification equipment at the beginning of process down to 20% MC. For the two modification processes for aspen including thermal modification (G+TM and MC20+TM), the wood material had to be rewetted by immersing it in water because it had dried, possibly below the fibre saturation point from the surface during storage prior to the modification.
During the process, the wood temperature was first elevated gradually up to 100 ºC in 3 hours, and stabilised until the MC of wood decreased to a level of 30%. Below the 30% MC, the wood temperature was elevated up to 130 ºC for the rest of the drying phase. The target degree of compression for aspen and birch was set to 30% and 10%, respectively. The different degrees of compression were based on differences in the initial basic density of the species. Later, half of the wood material of both species was thermally modified at 190 °C after the drying and compression phases. The entire modification process lasted 52 hours including the thermal modification. Mainly in aspen boards, which were modified at 20% MC, the actual reduction in thickness differed from the target degree of compression. In the reference boards some reduction in thickness was detected due to drying shrinkage.
This paper focuses on long-term storage to determine if internal tensions still exist after several years. After the modification, a defect-free piece of 450 mm was stored from each board for 4 years at constant room temperature (about 20 °C) with varying relative humidity (about 20–60%).

Natural resources and bioeconomy studies 80/2017
159
CH was assessed according to the technical specification CEN/TS 14464:2010. In March 2017, two 15-mm-long pieces were sliced with a blade saw from the middle of the boards. One piece from each board was divided into two equal parts in a vertical direction parallel to the cross-section of the test slice. A billhook and rubber hammer was used for splitting (Figure 3). Pieces were held in sealed plastic bags for 48 hours to equalise the moisture content. The pieces were placed across the test jig pins, which were at 75 mm pitch. The distance between the two test pieces at mid-point (hereafter, called simply ‘gap’) were measured with a calliper (Figure 4). The diameter of the test pins was subtracted and the value was multiplied by a factor of 1.78 to express the corresponding gap within a distance of 100 mm.
Figure 3. (Left) Method to split the specimens. Photo: Barnes Owusu Sarpong.
Figure 4. (Right) Method to measure the gap. Photo: Barnes Owusu Sarpong.
After analysis, the MC was measured by an oven-dry method. Homoscedasticity of the data was tested with Levene’s test. Differences between the groups were studied using analysis of variance
(ANOVA) with Games-Howell post-hoc test, because the data did not meet the homogeneity of variances assumption.
Results 3.The gap of the batches in the CH test is presented in Table 2. According to Levene’s test, the
variances between the groups were not homogeneous (P=0.000***). The variation in the gap corresponded to the variation in moisture content; in each batch, moisture content within the aspen boards had more variation than that in birch. An ANOVA test indicated significant differences in moisture content between the batches (P=0.000***). The differences are illustrated in Figure 5.

Natural resources and bioeconomy studies 80/2017
160
Table 2. Gap of specimens in case hardening test.
Aspen Birch Batch N σ N σ
Reference 27 0.3 mm 0.3 mm 12 0.2 mm
0.2 mm
Green 28 1.1 mm 0.4 mm 27 0.7 mm
0.2 mm
Green + TM 28 0.1 mm 0.3 mm 27 0.0 mm
0.2 mm
MC20 27 0.9 mm 0.4 mm 24 0.8 mm
0.2 mm
MC20 + TM 28 0.1 mm 0.3 mm 24 0.3 mm
0.2 mm
Table 3. Mean equilibrium moisture content (approximately at 20 °C, 25% RH) of specimens and standard deviation
Figure 5. Gap of specimens and differences between the batches. Thin bars represent standard deviation. Columns sharing the same letter show no significant differences (P>0.05) and those not sharing the same letter show significant differences (P≤0.05)
The gap was clearly at its highest in densified batches without thermal modification (G and MC20). According to the Games-Howell test, differences between those batches were found neither in aspen (P=0.850) nor in birch (P=1.000). In the batch G, the average gap was wider in aspen than in
Aspen Birch Batch N σ N σ
Reference 27 5.7% 0.2% 12 5.3% 0.1% Green 28 4.6% 0.2% 27 4.5% 0.1%
Green + TM 28 3.0% 0.2% 27 3.4% 0.2% MC20 27 4.9% 0.2% 24 4.9% 0.1%
MC20 + TM 28 3.1% 0.2% 24 3.6% 0.1%

Natural resources and bioeconomy studies 80/2017
161
birch (P=0.005**). In the batch MC20, such a difference was not detected (P=0.646). The gap was considerably smaller in the reference batch than in densified batches without thermal modification. In the reference batch, no differences between aspen and birch were detected (P=0.796). In MC20+TM the batch gap was, in general, smaller than in the reference batch. However, because of substantial variation, differences were found neither within those batches in aspen (P=0.085) nor in birch (P=0.365), though for aspen, the P value stands only for a weak indication of insignificance. In the MC20+TM batch no differences between aspen and birch were observed (P=1.000). In the G+TM batch, the gap was virtually non-existent. No differences between aspen and birch were detected (P=0.892). Also between groups MC20+TM and G+TM no differences in aspen (P=1.000) or birch (P=0.825) were detected.
No differences in the gap between the tangential and radial direction were detected in any batch. The only cases where the pairwise-comparisons of tangential and radial direction differed from P=1.000 in the Games-Howell test were as follows: reference in aspen (P=0.977), G in aspen (P=0.973) and G+TM in aspen (P=0.999).
Differences in CH are illustrated in Figure 6.
Figure 6. Examples of case hardening gaps in tested specimens. Specimens in the top row are thermally treated. Specimens on the left side are aspen and on the right side birch. Photo: Juhani Marttila.
Figure 7. Equilibrium moisture content of specimens and difference between the batches. Bars represent standard deviation. Columns sharing the same letter indicate no significant differences (P>0.05) and those not sharing the same letter indicate significant differences (P≤0.05).

Natural resources and bioeconomy studies 80/2017
162
EMC of the batches is presented in Table 3. According to Levene’s test, variances between the
groups were homogeneous (P=0.003**). EMCs between aspen boards had more variation than between birch boards. The ANOVA test identified significant differences between groups in the EMC (P=0.000***). Differences between the batches are illustrated in Figure 7.
EMC was at its highest in the reference boards. The EMC of the reference aspen was higher than that of the reference birch (P=0.000***). Densification in the MC20 group reduced the EMC in both aspen (P=0.000***) and birch (P=0.000***) compared with reference boards. However, no differences were detected between aspen and birch in this treatment group (P=0.969). Densification at the green state (G) further reduced the EMC both in aspen (P=0.000***) and in birch (P=0.000***) compared with the MC20 treatment group. No differences were detected between aspen and birch in this treatment group either (P=0.183).
Thermal treatment after densification (batches MC20+TM and G+TM) clearly lowered the EMC compared with corresponding treatment groups without thermal treatment (batches MC20 and G) in both aspen (P=0.000***) and birch (P=0.000***). After the thermal treatment, EMC was lower in aspen than in birch both in MC20+TM (P=0.000***) and in G+TM batches (P=0.000***). In aspen, thermal treatment equalised the EMC in batches G+TM and MC20+TM (P=0.466). However, the EMC of birch was lower in the batch G+TM compared with MC20+TM (P=0.039*).
Discussion 4.
Case hardening 4.1.The densification without subsequent thermal modification essentially increased the case hardening in both aspen and birch. This can be caused either by the densification phase if it generates internal stresses inside the board or by the conditioning process. When statistically significant differences between species differences were identified, the aspen specimens shower larger case hardening values than birch. This can be explained by the tendency of aspen to internal stresses, non-uniform final moisture content and substantial swelling differences in different directions after drying (Mackay 1975a, Mackay 1975b, Maeglin et al. 1985, De Boever et al. 2005, Heräjärvi et al. 2006, Heräjärvi 2009)
According to Milić and Kolin (2008), the gap opening decreases rapidly during the first hours of
conditioning and then approached a certain value asymptotically. Furthermore, Sandland (2001) points out the connection between a longer conditioning time and a reduction in case hardening. Therefore, the increasing conditioning in the modification process undoubtedly also decreases the gap size in this process. However, in this study, even low-speed air-drying of the reference boards caused case hardening to some extent.
The most remarkable thing is that thermal modification after densification eliminates case hardening almost completely. Therefore, TMTM™ is a suitable method for preventing set recovery
and in increasing dimensional stability in further processing. The cellular level changes might be like the macrostructural changes, which, according to Morsing and Hoffmeyer (1998), eliminate the spring-back effect. Churchill (1954) found that the temperature has an important role in the removal of case hardening set and stresses. The presence of water promotes hydrolysis process (Morsing and Hoffmeyer 1998). Hsu et al. (1988) concluded that partial hydrolysis of hemicelluloses reduces the tendency for stresses during compression. However, this assumption was not met in this study in terms of case hardening. No differences in case hardening between different initial moisture content in densification (G and MC20) were detected.
The splitting method caused relatively high variation in the results. Splitting by billhook is an efficient method, and split line in shear surface is very straight, but mechanical differences in earlywood and latewood and in some cases slope of grain caused slightly wavy surface to the opposite side. In CEN/TS 14464:2010, the splitting method is not determined, but with a

Natural resources and bioeconomy studies 80/2017
163
sophisticated method, statistically significant differences between the wood species might be seen. Furthermore, increasing the number of birch specimens in the reference group might also reveal differences between aspen and birch.
In every case, the variation in case hardening in aspen boards was more substantial than that in birch boards. This is probably due to significant relative mechanical differences between earlywood and latewood in aspen (Heräjärvi 2009), and higher variation in density of aspen boards compared to birch boards in this study. Despite a relatively long storage time of 4 years, it is noticeable that differences in case hardening between batches are still very clear. Therefore, the release of post-drying internal stresses is a very slow process.
Equilibrium moisture content 4.2.EMC differences between the batches were as expected. Reference batches had the highest EMC followed by densified batches without thermal modification (the highest temperature being 130 °C during the process). Thermally modified batches (at 190 °C) had the lowest EMC. Fang et al. (2012) have studied EMC of European aspen with several densification temperatures. In our study, the reduction in EMC of aspen was more substantial (up to 50% between references and G+TM treatment). There might be several reasons for this difference. In a study by Fang et al. (2012), relative moisture content was 50%, the number of samples was relatively small, and there were potential differences in process parameters.
Hemicellulose is more hygroscopic compared with cellulose or lignin and the least thermally stable. Even though chemical changes in hemicellulose begin at temperatures of approximately 150 °C (Beall 1969, Hill 2006), Hill (2006) noted that there is variation in the degradation temperature because hemicellulose is composed of several components. Therefore, presumably some components of hemicellulose already degraded at 130 °C, which was the process temperature in densification in this study.
In the previous studies, a decrease in EMC after thermal treatment has also been confirmed, e.g., for beech (Fagus sylvatica) by Morsing and Hoffmeyer (1998), for sessile oak (Quercus petraea Lieb.), chestnut (Castanea sativa Mill.), calabrian pine (Pinus brutia Ten.), and black pine (Pinus nigra Arnold.) by Akyildis and Ateş (2008), for tauari (Couratari oblongifolia), ash (Fraxinus excelsior), and northern red oak (Quercus rubra) by Zhou et al. (2013), and for wild cherry (Cerasus avium L.) by Aytin et al. (2015).
EMC of aspen decreased more rapidly than that of birch when the maximum treatment temperature increased. In the case of reference boards, aspen had higher EMC than birch, whereas in thermally modified batches the relationship was the opposite. Chirkova et al. (2013) noticed that the proportion of holocellulose reduces more rapidly in aspen than in birch when wood is heated up to 170 °C. Hence, presumably, hemicellulose in aspen (as a part of holocellulose) has some components that start to degrade at lower temperatures than hemicellulose components of birch. In the study by Zhou et al. (2013), EMC of specimens was inversely proportional to their dry density both in non-treated and in heat-treated wood at relative humidity of 50%. This conclusion supports the results of this study in reference boards, because aspen used in this study had clearly lower density than birch (see Möttönen et al. 2015). As in CH, also in EMC values, aspen boards had less variation than birch boards. This refers to the greater structural variability of aspen wood.
Natural resources and bioeconomy studies 80/2017
164
References Akyildis, M.H. and Ateş, S. 2008. Effect of Heat Treatment on Equilibrium Moisture Content (EMC) of
Some Wood Species in Turkey. Research Journal of Agriculture and Biological Sciences 4(6): 660–665.
Aytin, A., Korku, S., Ünsal, Ö. and Çakıcıer, N. 2015. The Effects of Heat Treatment with the ThermoWood Method on the Equilibrium Moisture Content and Dimensional Stability of Wild Cherry Wood. BioResources 10(2): 2083–2093.
Baronas, R., Ivanauskas, F., Juodeikienė, I. and Kajalavičius, A. 2001. Modelling of Moisture Movement in Wood during Outdoor Storage. Nonlinear Analysis: Modelling and Control 6(2): 3–14.
Beall, F.C. 1969. Thermogravimetric analysis of wood lignin and hemicelluloses. Wood and Fiber Science 1(3): 215–226.
Borrega, M. 2011. Mechanism affecting the structure and properties of heat-treated and high-temperature dried Norway spruce (Picea abies) wood. Dissertationes Forestales 134. 52 p. + Appendices.
CEN/TS 14464:2010. Sawn timber. Method for assessment of case-hardening. Chirkova, J., Andersone, I., Grinins, J. and Andersons, B. 2013. Sorption properties of hydrothermally
modified wood and data evaluation based on the concept of Hansen solubility parameter (HSP). Holzforschung 67(5): 595–600.
Churchill, J.W. 1954. The Effect of Time, Temperature, and Relative Humidity on the Relief of Case hardening Stresses. Jour. Forest Products Research Society 4(5): 264-270.
De Boever, L., Vansteenkiste, D. and Van Acker, J. 2005. Using poplar in light constructions: The problem of non-uniform moisture distributions after drying. In: Teischinger, A. & Van Acker, J. (eds.). Proceedings of the COST Action E44 Conference: Broad Spectrum Utilisation of Wood. June 14th–15th 2005, BOKU, Vienna, Austria. pp. 111–120.
Fang, C., Mariotti, N., Cloutier, A., Koubaa, A. and Blanchet, P. 2012. Densification of wood veneers by compression combined with heat and steam. European Journal of Wood Products 70(1–3): 155–163.
Fukuta, S., Asada, F. and Sasaki, Y. 2008. The simultaneous treatment of compression drying and deformation fixation in the compression processing of wood. Forest Products Journal 58(7–8): 82–88.
Heräjärvi, H., Junkkonen, R., Koivunen, H., Metros, J., Piira, T. and Verkasalo, E. 2006. Metsä- ja hybridihaapa sahatavaran ja jatkojalosteiden raaka-aineena. Working papers of the Finnish Forest Research Institute 31. 102 p. (In Finnish).
Heräjärvi, H. 2009. Effect of drying technology on aspen wood properties. Silva Fennica 43(3): 433–445. Hill, C.A.S. 2006. Wood modification: chemical, thermal and other processes. John Wiley & Sons Ltd,
West Sussex, 239 p. Hoadley, R.B. 1980. Understanding Wood – A craftman’s guide to wood technology. The Taunton Press,
Inc. Newtown, Connecticut. 256 p. Hsu, W.E., Schwald, W., Schwald, J. and Shields, J.A. 1988. Chemical and physical changes for
producing dimensionally stable wood-based composites. Part 1: Steam pretreatment. Wood Science and Technology. 22: 281–289.
Kollmann, F., Kuenzi, W. and Stamm, A. 1975. Principles of wood science and technology. Vol 2: Wood Based Materials. Springer-Verlag, Berlin/Heidelberg.
Kunesh, R.H. 1968. Strength and elastic properties of wood in transverse compression. Forest Products Journal 18:65-72.
Mackay, J.F.G. 1975a. Properties of northern aspen discolored wood related to drying problem. Wood and Fiber Science 6(4): 319–326.
Mackay, J.F.G. 1975b. Delayed shrinkage after surfacing of high temperature kiln-dried northern aspen dimension lumber. Forest Products Journal 26(2): 33–36.
Maeglin, R.R., Liu, J.Y. and Boone, R.S. 1985. High temperature drying and equalizing: effects on stress relief in yellow-poplar lumber. Wood and Fiber Science 17(2): 240–253.
McMillen, J. and Youngs, R. 1960. Stresses In Drying. Approved Technical Article. Forest Products Laboratory, Madison, Wisconsin & Forest Service, U.S. Department of Agriculture. https://www.fpl.fs.fed.us/documnts/pdf1960/mcmil60a.pdf. Accessed 29 May 2017.
Milić, G. and Kolin, B. 2008. Influence of Duration of the Conditioning Process on the Reduction of Case-Hardening Level in Kiln-Dried Beech and Oak Lumber, Drying Technology, 26(10): 1225–1231
Morsing, N. and Hoffmeyer, P. 1998. Densification of Wood: The influence of hygrothermal treatment on compression of beech perpendicular to gain. BYG-Rapport, No. R-79. Kgs. Lyngby, Technical University of Denmark.

Natural resources and bioeconomy studies 80/2017
165
Möttönen, V., Bütün, Y., Heräjärvi, H., Marttila, J. and Kaksonen, H. 2015. Effect of combined compression and thermal modification on mechanical performance of aspen and birch wood. Pro Ligno 11(4): 310–317.
Ranta-Maunus, A., Forsén, H. and Tarvainen, V. 2001. Analysis of Case Hardening. http://www.vtt.fi/inf/julkaisut/muut/2001/RTE_Ranta-Maunus7.pdf. Accessed 29 May 2017.
Sandland, K.M. 2001. Prediction of required duration of the conditioning process to reduce the casehardening level in LT-dried sawn timber – Initial experiments. Holz als Roh- und Werkstoff 59: 183–189.
Tabarsa, T. and Chui, Y.H. 2001. Characterizing microscopic behavior of wood under transverse compression. Part II. Effect of species and loading direction. Wood Fiber Science 33: 223–232.
Tiemann, H.D. 1920. The kiln drying of lumber. 3rd ed. J.B. Lippincott Company, Philadelphia and London. 318 p.
Wolcott, M.P., Kamke, F.A. and Dillard, D.A. 1994. Fundamental aspects of wood deformation pertaining to manufacture of wood-base composites. Wood and Fiber Science, 26(4): 496–511
Zhou, Q., Tu, D., Liao, L. and Guo, Q. 2013. Variation of Equilibrium Moisture Content of Heat-treated Couratari oblongifolia, Fraxinus excelsior, and Quercus rubra wood. BioResources 8(1): 182–188.

Natural resources and bioeconomy studies 80/2017
166
The green gluing of Eucalyptus grandis boards as a processing phase to reduce drying defects
in the semi-finished product Michela Nocetti1*, Marius-Catalin Barbu2,3,4, Michele Brunetti1,
Michael Dugmore4, Marco Pröller4, Brand Wessels4
Abstract
Currently pine is nearly the only wood species used as structural timber in South Africa. But, due to a shortage of suitable land for afforestation, it is estimated that the country will have to import a large volume of its structural timber requirements within the next two decades. Meantime, Eucalyptus trees are rarely processed into structural timber; the large areas of short rotation Eucalyptus plantations are used mainly for pulp production. This is largely due to processing problems associated with dimensional stability and splitting of the wood. A new method to produce structural products from young Eucalyptus grandis trees was recently conceptualised and tested. The process involves finger-jointing and lamination of green Eucalyptus into panels using a poly-urethane adhesive. These panels are dried and can be further processed into single boards or glued products. The potential advantage of this process is the suppression of excessive deformation and splitting normally associated with Eucalyptus. The experiment was divided in two parts: the first part aimed to investigate the bonding strength of the edge gluing of green boards; the second tested the entire process in practice and evaluated the benefits in term of check and warp reduction. Results showed that the green edge-gluing of Eucalyptus grandis can be considered to be effectively applicable in an industrial process. However, it was not able to contribute to the reduction of check, split and bow development in the wood during kiln drying, while cup and twist were significantly reduced.
Introduction 1.In South Africa, only 1% of the total land is dedicated to commercial forestry and it is mainly occupied by pines and Eucalyptus species (DAFF 2012, DAFF 2015). In this system, softwoods are processed as sawlogs and intended for structural uses, while Eucalyptus is mainly designated to pulp and paper products with a big amount of wood chips exported towards foreign markets (Chamberlain et al. 2005). In addition, over the past twenty years afforestation in the country has declined, due mainly to a scarcity of suitable land and restrictions on expanding plantation areas as new regulations regarding water usage were introduced by the government, while the demand of sawlogs is increased. Major benefits can therefore ensue from the exploitation of Eucalyptus timber as solid product: benefits both from the point of view of employment with a certain revitalization of the internal market, both from the technical point of view thanks to the good mechanical properties of this wood, far superior to those of currently used pines (Dowse and Wessels 2013, Wessels et al. 2014).
* Corresponding author: Tel.: +390555225754; E-mail: [email protected]
1CNR-IVALSA Istituto per la
Valorizzazione del Legno e delle Specie
Arboree Sesto Fiorentino, Italy
4Forest and Wood Science
Stellenbosch University Stellenbosch,
Western Cape, South Africa
2Department for Forest Products and Timber
Building Salzburg University of
Applied Science, Kuchl, Austria
3Faculty for Wood Engineering University of Transilvania
Brasov, Romania

Natural resources and bioeconomy studies 80/2017
167
In this respect, however, the main barrier to the expansion of Eucalyptus timber as solid product remains its tendency to warp and checks during processing, primarily due to high internal stresses and excessive shrinkage (Yang 2005, Yang and Waugh 2001, Malan 2003, Mugabi et al 2010, 2011). Most of these defects either originate or aggravate during the drying stage, so that the yields might be deeply reduced.
To tackle the problem, a new process has been conceived at Stellenbosch University. The idea is to edge glue the Eucalyptus boards before kiln drying, so that, during the loss of moisture content, the deformations and the splitting could be potentially reduced. A previous study carried out some early attempts aimed to evaluate the feasibility of the finger-jointing of green boards to be employed in roof trusses (Crafford and Wessels 2016). The results underlined a good potential both of the material (suitable mechanical properties) and the process, but deformations and checks still appeared on laminations dried after finger-jointing. Thus, a practical suggestion was to build roof trusses with green members, but it needed further verification. Additional tries verified the suitability to structural uses of green-glued, finger-jointed, and edge to edge laminated boards (Pröller et al. 2015), experiencing again a good potential, but highlighting the need of further research efforts to improve the bonding between boards and to prove the real amelioration with a bigger experiment.
Therefore, a new project was to design better set up the process and to assess the actual benefit to include the green gluing of Eucalyptus boards in the manufacture of structural products. Here, the results on the suitable process parameters, effective advantages in terms of dimensional stability and drying defects occurring on the lumber will be presented; and the feasibility of the entire process will be discussed.
The experiment was divided in two parts: the first part aimed to investigate the effect of some wood properties and process parameters on the bonding strength of the edge-gluing of green boards; the second tested the entire process in practice and evaluated the benefits in term of check and warp reduction.
Materials and methods 2.
Material 2.1.Eucalyptus grandis boards (cross section of approximately 38 x 114-120 mm2) were obtained from plantations located in Tzaneen, Limpopo, South Africa. The area where the trees were grown has a sub-tropical climate with an average temperature of 15°C in winter and 28°C during the summer months. Rainfall is predominantly found in mid-summer, between November and March, with an average of approximately 1230 mm per year. The altitude of the plantations is ranging from 900 up to 2000 m above sea level.
A one-component polyurethane (1C PUR) adhesive, manufactured by Henkel, was employed for this study. Although quality assurance testing on green wood was done successfully by the manufacturer (pers. comm. Ferreira-Netto, Henkel SA, 2015), a maximum wood moisture content between 16 and 18% is stated in the technical data sheet. Therefore, this type of adhesive was not particularly formulated for green gluing applications, but it was preferred because it is already being used in an industrial green gluing process for finger-jointed Eucalyptus grandis timber. The bonding strength of finger-joints in Eucalyptus grandis timber was tested in a large experiment and found to be very good (Crafford and Wessels, 2016). It was, therefore, decided to continue using the same adhesive in this study.

Natural resources and bioeconomy studies 80/2017
168
Influence of wood and process parameters on bonding strength 2.2.The variables investigated in the first phase of the study were wood density, moisture content, adhesive spread rate and press force; two grades (low and high) were assigned to each parameter (Table 1).
Table 1. Variables selected to study their influence on bonding strength, and their relative low and high grades
Variable Low High
Wood density (kg/m3) < 500 > 500
Moisture content (%) ~ 30 ~ 60
Adhesive spread rate (g/m2)
150 250
Pressure (MPa) 0.6 1.0
The boards were longitudinally sawn into strips 25 mm wide, then the strips were cross cut into pieces 50 mm long. The block specimens (30 x 25 x 50 mm3, T x W x L) were glued such as to obtain finally 10 gluelines for each group of the 4x2 full crossed design (4 variables x 2 grades).
After gluing the specimens were conditioned at 20°C and 65% RH and then subjected to shear tests according to the methodology provided for glulam (EN 14080: 2013) or cross-laminated timber (EN 16351: 2015), to calculate the shear strength of the bond line. Further details about the methods used can be found in Pröller et al. 2017.
Green edge glued panels 2.3.The material used for this part of the experiment came from two different plantations: one about 20 – 25 years old and the second 6 – 8 years of age. The boards cut from these logs were additionally divided according to the presence of pith, so to form 4 groups (Table 2). Moreover, the boards obtained from younger trees were horizontally finger-jointed (fingers visible on the narrow edges of the boards), with each board consisting of between four and five end-jointed pieces of timber. The boards had dimensions of roughly 2400 x 114 x 38 mm (L x W x T).
Six edge-glued panels were produced for each of the four groups. Furthermore, a control group, comprising 30 randomly selected non-laminated boards from the same source, was established for each group. Splits and checks of every control and edge-glued board were marked if already present after sawing in order to determine the increase in length during kiln drying.
Table 2. Experimental design consisting of four different material groups distinguished according to their characteristics; amount of edge-glued panels produced, edge-glued boards cut back from panels and control boards selected for each group
Group Characteristics No. Panels
No. of edge glued boards
No. of control boards
YUN_P1 6 - 8 years old, finger-jointed, including pith 6 30 30 YUN_P0 6 - 8 years old, finger-jointed, no pith
present 6 30 30
OLD_P1 20 - 25 years old, including pith 6 30 30 OLD_P0 20 - 25 years old, no pith present 6 30 30
To manufacture the edge glued panels, all boards were first processed to equal dimensions, i.e. cut into 2.4 m length and planed to a width of 102 mm in order to obtain a clean surface for edge gluing, which was carried out within the subsequent 24 hours. Five boards were randomly selected

Natural resources and bioeconomy studies 80/2017
169
for each panel and arranged alternately within the panel with respect to their growth-ring orientation (with ring facing alterative direction), in order to even out each other when glued together.
Both panels and control boards were then kiln-dried in equal conditions with drying schedule that allowed reaching a moisture content of timber below 12% in 24 days. After drying, panels were cut back to boards and the wood defects were evaluated according to definition and methodology reported in the South African grading standard for Eucalyptus (SANS 1707-1: 2010). The characteristics measured were the following.
Check: separation of the wood fibres along the grain but not passing through the piece; the lengths on both sides of the board were measured along the longitudinal axis of the board and summed up to a total length per face.
Split: separation of the wood fibres along the grain passing through the piece; the lengths along the longitudinal axis of the board were measured.
Warp: bow, cup and twist were measured according to figure 1 Only with regard to checks and splits, the edge-glued boards were measured twice: first, when
still bonded together in the form of panels, and second, after the panels were re-sawn apart into single boards in order to determine if the separation of the boards caused a change in their quantity or dimension.
Data analysis 2.4.The assumptions of normal distribution and homogeneity of variance were verified before performing a factorial design analysis of variance (ANOVA) on the test results, in order to determine how the different variables (wood density; moisture content; adhesive spread rate and pressure) influenced the shear strength of the bonded samples and how the age of the timber, the presence of pith and the edge-gluing influenced the development of the drying defects. Since checks and splits were measured before and after kiln drying, the increment during the drying stage was investigated as well.
Figure 1. Measurement of warp, (adapted from SANS 1707-1: 2010).
Results and discussions 3.
Shear strength of the edge bonds 3.1.Overall the values of shear strength ranged between 5.6 and 14.8 N/mm2, with an average value of 11.2 N/mm2. Considering that the requirement for the edge bonds of the cross laminated timber according to the European Standard EN 16351 (2015) is 3.5 N/mm2, even if it is thought for softwood, it can be stated that the results obtained for green gluing of Eucalyptus were far above the requirement.

Natural resources and bioeconomy studies 80/2017
170
From the analysis of variance performed to investigate the influence of the four factors included in the experiment on the shear strength, moisture content resulted the most important, with high level of MC (60%) corresponding to higher shear strength. A possible explanation could be the application of a moisture-curing adhesive (PUR), which uses moisture as the second component to react. In this system, curing is initiated by the reaction of isocyanate and water, which is taken from both the wood and the surrounding air. Studies done by Sterley (2004 and 2012) exhibited deeper penetration into green wood than dry wood.
Also wood density resulted to be a significant factor to determine shear strength: the specimens of high density groups (> 500 kg/m3) showed on average higher shear strength over low-density specimens. Observing that failure during tests often occurred in the wood tissues, it is likely that higher-density wood has higher mechanical properties.
Looking at the interaction between the parameters of the wood and those of process, it was observed that, for specimens with high MC, high or low pressures have given similar results. For high density, a high pressure might have favoured the outflow of adhesive instead of the absorption into the wood, resulting in lower shear strength; while for low density, a higher pressure was better in term of shear strength. The use of an intermediate pressure respect to what tested in the experiment seems the best solution.
As for the glue spread rate, if it was low, there were no differences in shear strength related to the other variables (high or low pressure, high or low MC) and the values were fairly high states. When the spread rate was high, have been achieved the best results of all possible combinations (for high MC), but also the worst in the case of low MC and low pressures. Therefore, the use of a low amount of adhesive has to be preferred, considering that it could also be an advantage from an economic point of view.
Further details can be found in Pröller et al. 2017
Drying defects after edge gluing 3.2.The moisture content of the boards obtained from the 6 – 8 years old Eucalyptus material was on average 83%, with an average basic density of 381 kg/m3. The same properties for the 20 – 25 years old material were 64% and 432 kg/m3 respectively. The differences are explained by the presence of mostly juvenile wood with either no or only little heartwood developed in the boards from young trees, while it could be assumed that all the boards cut from older trees exclusively consisted out of heartwood.
Given the results of the first part of the experiment, the edge gluing of the green boards to form the panels to be kiln dried was done with an adhesive spread rate of 180 g/m2 and a pressure of 0.75 MPa.
3.2.1. Checks Table 3 shows the average total length of checks per board for every material group. The same evaluation was performed on the edge-glued boards before and after they were re-sawn apart from panels into single boards after the re-sawing and no change in dimension or quantity of the checks occurred, thus this comparison does not appear in the table.
Table 3 shows that checks increased for all material groups during the kiln drying process. On average, the young boards (YUN) had a total check length of 36.9 (± 2.8) mm, whereas the old boards (OLD) showed significantly lower results with an average value of 16.8 (± 1.9) mm. However, about 60% of the total check length for all boards was already created before kiln drying (63.4% for group YUN and 56.9% for group OLD). Since checks develop at the early stage of drying, this was probably owed to preceding air-drying, which happens naturally after a tree is felled.

Natural resources and bioeconomy studies 80/2017
171
Table 3. The average total check length per board (± standard error) for each material group, both before and after kiln drying, including the increment. EG1 = edge-glued boards; EG0 = control boards, no edge-glued
Group Check length (mm) Before kiln drying After kiln drying Increment
YUN_P1_EG1 19.3 ± 3.9 33.9 ± 4.6 14.6 ± 2.7 YUN_P1_EG0 13.1 ± 2.2 29.2 ± 3.3 16.1 ± 2.7 YUN_P0_EG1 41.4 ± 7.8 50.6 ± 8.2 9.2 ± 2.0 YUN_P0_EG0 25.5 ± 4.4 33.8 ± 4.6 8.3 ± 1.6 OLD_P1_EG1 16.5 ± 3.3 29.0 ± 5.3 12.5 ± 2.8 OLD_P1_EG0 12.4 ± 2.7 23.5 ± 4.2 11.1 ± 2.3 OLD_P0_EG1 5.3 ± 0.9 7.3 ± 1.2 2.0 ± 2.3 OLD_P0_EG0 3.4 ± 0.6 7.5 ± 1.6 4.1 ± 1.2
Taking into account only the increment of checks after drying, an analysis of variance was performed to verify what material characteristic (age, presence of pith, edge-gluing) influenced the development of the defect during the drying process.
The only significant factors were the presence of pith and the age: an increased amount of checks was developed during kiln drying for pith-containing material (P1) compared to boards without pith (P0); the younger, finger-jointed material developed more checks during the kiln drying stage as compared to the older not finger-jointed boards. This corresponds with the results obtained by Crafford (2013), which exhibited a significant increase of checks for Eucalyptus grandis boards with an increased proportion of pith material and where 5-year-old boards exhibited significantly more checks than older boards with 11 and 18 years of age, respectively. The higher tendency to develop checks close to the pith can be attributed to the unfavourable properties of the juvenile wood, in particular the combination of compressive stresses, low basic density and increased longitudinal shrinkage, causing the comparably weak corewood tissue to rupture. Regarding the age, since sapwood contains significantly higher amounts of water than heartwood, this implies a more rapid initial moisture loss for the younger material; in consequence, a larger moisture gradient between the wet core and the drying shell was created for the young boards, which is known to be the cause for the creation of surface checking.
Since the statistical analysis did not find the edge-lamination to be a significant factor, it must be assumed that green edge-gluing was not able to contribute to the reduction of check development in Eucalyptus grandis lumber.
3.2.2. Splits As for checks, no changes in dimension or quantity were observed in the edge-glued boards before and after the re-sawing from the panels. Therefore, in table 4 only the comparison before and after the drying of the boards is presented. A general increase of split length was noticed after drying. Moreover, the older material exhibited an average total length of 5 mm per board, which was twice as much as compared to the younger boards (2.5 mm). The reason for that may have been the older age that leads to higher compressive stresses in the corewood of a tree and thus increased heart-check and end-split development.
Again, the only factor influencing the increment of split length during drying was the presence of the pith: a higher increment of split length was obtained for pith-containing boards as compared to boards with a greater distance from the pith. Since split occurred exclusively in the form of end-splits, this can be explained by the large proportion of juvenile wood in pith-containing boards. Juvenile wood in Eucalyptus is known for its growth-related longitudinal compressive stresses, which can cause end-splitting as well as heart-checks.

Natural resources and bioeconomy studies 80/2017
172
Since edge-gluing of the green boards was not found to be a significant factor for the increment of split during kiln drying, it must be assumed that it could not contribute to the reduction of split development.
Table 4. The average total split length per board for each material group, both before and after kiln drying, including the increment. EG1 = edge glued boards; EG0 = control boards
Group Split length (mm) Before kiln drying After kiln drying Increment
YUN_P1_EG1 0.7 ± 0.5 5.6 ± 2.0 4.9 ± 1.9 YUN_P1_EG0 0.8 ± 0.5 1.8 ± 0.8 1.0 ± 0.5 YUN_P0_EG1 0.0 ± 0.0 0.7 ± 0.5 0.7 ± 0.5 YUN_P0_EG0 0.6 ± 0.5 2.0 ± 1.0 1.4 ± 0.8 OLD_P1_EG1 3.9 ± 1.1 4.7 ± 1.2 0.8 ± 0.4 OLD_P1_EG0 4.3 ± 0.9 5.8 ± 1.2 1.5 ± 0.7 OLD_P0_EG1 2.2 ± 0.7 3.0 ± 0.9 0.8 ± 0.5 OLD_P0_EG0 6.8 ± 1.1 7.2 ± 1.2 0.4 ± 0.1
3.2.3. Bow Warps were measured only after drying and the total amount was included in an analysis of variance investigating the influence of the factors inserted in the experiment. Regarding bow development, two factors resulted significant in the analysis of variance: the interaction between age and pith and the edge gluing. The older material showed increased bow for boards with no pith enclosed, whereas no difference between P1 and P0 boards for the younger, finger-jointed material was obtained.
The development of bow increased when the boards were edge-glued before kiln drying. No logical explanation for this behaviour could be found as rather the opposite was expected to result. However, the magnitude of the average difference between the two groups EG0 and EG1 was very small, since a variation of about 0.6 mm on a board length of 2.4 m can be considered negligible.
Anyhow, it was visually observed that the bow of OLD_P0 boards, which already showed extensive bow before edge-gluing, could largely be suppressed while bonded together in the form of panels. This was probably due to the alternate layout with respect to the growth ring orientation of the individual boards within the panels, as well as the applied pressure from the vertical pneumatic clamps during gluing. However, the stresses locked inside the kiln dried panels were released upon the subsequent sawing into single boards, which hence went back to their initial bowed shape again.
3.2.4. Cup The edge bonding of green boards in general had a positive effect on the reduction of cup. This trend was however significantly more pronounced for boards with no pith than compared to pith-containing boards. The decrease in cup for green edge-glued material (EG1) was probably owed to the alternate arrangement of the single boards with respect to growth ring orientation. Since both bow and cup are related to the growth ring orientation, cup was also in alternate directions for neighbouring boards and the preceding edge-bonding of the boards was likely to have contributed to reduce their deformation.
3.2.5. Twist The edge gluing reduced the amount of twist for no-pith boards, whereas it had no significant effect on the twist development of pith-containing boards. Among the causes of twist development in sawn

Natural resources and bioeconomy studies 80/2017
173
timber are the spiral grain, which has its origin in the growth of a tree when the direction of the fibres deviate from the stem axis, but also sawing direction compared to the taper and fibre orientation. However, spiralled grain alone has only little effect on wet material as deformation is created by drying the boards below the fibre saturation point, due to unequal shrinkage between the radial and the tangential direction of the wood. Since during this period of drying the boards of the edge-glued group were restricted to warp, this explains the reduction of twist for the boards, which remained in a straighter shape after sawing the edge-glued panels into single boards.
Since the results showed that the edge-gluing before kiln drying could at least partially contribute to the reduction of twist development, it should be considered a possible measure to inhibit this defect. This might be particularly true for the edge-glued panels, as no twist was visually observed before they were re-sawn apart into single boards.
Conclusions 4.The green edge-gluing of Eucalyptus grandis showed favourable results in terms of shear strength values and it can be considered to be effectively applicable in an industrial process. However, the experimentation carried out on the entire process to determine a possible reduction of drying defects on the Eucalyptus boards did not give entirely positive results.
Check turned out to be the most critical defect because of its high presence (followed by split, twist and cup), even if about 60% of the final check length of the boards was already created before kiln drying and thus could not be influenced by the-edge gluing of the green lumber, which was not able to contribute to its reduction.
In terms of bow, the lengthwise curvature of the boards was largely suppressed while the boards were edge-bonded together in the form of panels, but, upon re-sawing the panels apart into single boards, they went back into a bowed shape. Cup was significantly decreased by the edge-gluing of the green boards before kiln drying, while twist could be reduced only for non-pith material, but remained mostly inhibited also for boards containing pith while edge-bonded together in the form of a panel.
Overall, cup and twist were the only two defects that were significantly reduced in the individual boards. If sawn timber is the intended end-product, it is doubtful that the slight reduction in these two properties will justify the green edge-gluing process. There are, however, other advantages such as the possibility of producing larger dimension timber products from lower grade material, which might still make this green-edge-bonding process attractive to timber producers. A more interesting option might be the production of panel-type products, such as cross laminated timber, from these edge-glued panels. In the case of CLT, the full panels will be used with real benefits, since only little or virtually no warp was observed in the produced panels before they were re-cut apart into individual boards.
Acknowledgements The authors want to thank the Directorate General for Country Promotion (Economy, Culture and Science) – Unit for Scientific and Technological Cooperation of the Italian Ministry of Foreign Affairs and South African Department of Science and Technology for funding the work within the framework of the Agreement of Scientific and Technological Cooperation between the Government of Italy and the Republic of South Africa for the years 2014-2016.

Natural resources and bioeconomy studies 80/2017
174
References Crafford, P. L., and C. B. Wessels. 2016. The potential of young, green finger-jointed Eucalyptus grandis
lumber for roof truss manufacturing. South. For. 78(1):1-11. Crickmay, D. G., J. Le Brasseur, J. A. Stubbings, and A. E. Daugherty. 2005. Study of Supply and
Demand of Industrial Roundwood in South Africa - Period 2005 to 2034. Crickmay and Associates (Pty) Ltd., South Africa.
DAFF. 2012. Integrated Growth and Development Plan. Department of Agriculture, Forestry and Fisheries, Republic of South Africa.
DAFF. 2015. Strategic Plan. Department of Agriculture, Forestry and Fisheries, Republic of South Africa. Dowse, G. P., and C. B. Wessels. 2013. The structural grading of young South African grown Pinus
patula sawn timber. South. For. 75(1):7-17. EN 14080. 2013. Timber structures – Glued laminated timber and glued solid timber – Requirements.
European Committee for Standardization, Brussels. EN 16351. 2015. Timber structures – Cross laminated timber – Requirements. European Committee for
Standardization, Brussels. Malan, F.S. 2003. The wood quality of the South African timber resource for high-value solid wood
products and its role in sustainable forestry. South. Afr. For. J. 198(1):53-62. Mugabi, P., T. Rypstra, H. F. Vermaas, and D. G. Nel. 2010. Relationships between drying defect
parameters and some growth characteristics in kiln-dried South African grown Eucalyptus grandis poles. Eur. J. Wood Prod. 68(3):329–340.
Mugabi, P., T. Rypstra, H. F. Vermaas, and D. G. Nel. 2011. Effect of kiln drying schedule on the quality of South African grown Eucalyptus grandis poles. Eur. J. Wood Prod. 69(1):19–26.
Palermo, G. P. de M., J. V. de F. Latorraca, A. M. Carvalho, F. W. Calonego, and E. T. D. Severo. 2015 Anatomical properties of Eucalyptus grandis wood and transition age between the juvenile and mature woods, Eur. J. Wood Prod. 73(6), 775 – 780.
Pröller M, M. Nocetti, M. Brunetti, M. C. Barbu, M. Blumentritt, and C. B. Wessels. 2017. Influence of processing parameters and wood properties on the edge gluing of green Eucalyptus grandis with a one-component PUR adhesive. Eur. J. Wood Prod. Submitted.
Pröller, M., C. B. Wessels, and M. C. Barbu. 2015. Green-gluing of Eucalyptus grandis for laminated wood products. XIV World Forestry Congress, Durban, South Africa, 7-11 September 2015.
SANS 1707-1. 2010. Sawn eucalyptus timber – Part 1: Proof-graded structural timber. South Africa National Standard.
Sterley, M. 2004. Green gluing of wood. Licentiate thesis, KTH - Royal Institute of Technology, Sweden. Sterley, M. 2012. Characterisation of green-glued wood adhesive bonds. Doctoral dissertation, Linnaeus
University, Sweden. Wessels, C. B., F. S. Malan, D. G. Nel, and T. Rypstra. 2014. Variation in strength, stiffness and related
wood properties in young South African-grown Pinus patula. South. For. 76(1):37–46. Yang, J. L. 2005. The impact of log-end splits and spring on sawn recovery of 32-year-old plantation
Eucalyptus globulus Labill. Holz. Roh Werkst. 63(1):442–448. Yang. J. L., and G. Waugh. 2001. Growth stress, its measurement and effects. Austr. Forestry
64(2):127-135.
Natural resources and bioeconomy studies 80/2017
175
Assessment of internal defects of structural elements made from hardwood with the aid of micro-drilling
resistance measurements. Wolfgang F. Gard1*, S. Sleeuwaegen1,
Jan-Willem van de Kuilen1,2
Abstract
Apart from spruce and pine, hardwoods have traditionally been used as a construction material in Europe. In the Middle Ages, mainly oak and softwoods were used for buildings and civil structures in Central Europe. In South and West Europe also, European chestnut was a common wood species for building structures. Some of these structures still exist, sometimes as individual buildings, but often also renovated and integrated in newer buildings. Also for hydraulic structures such as mooring poles, sheet pile walls, fenders, jetties and bridges European and tropical hardwood species have been used. In order to estimate the residual strength of those structures, a structural health assessment of the elements is sometimes needed. In many cases only the longitudinal surfaces of structural elements are visible but not the cross-sectional surfaces. Therefore, the visual inspection is limited to defects at the surface. However, also internal ´defects´ such as cracks, juvenile and intermediate wood as well as biological decay are influencing to mechanical performance. Even juvenile wood can have a significant lower density then the mature wood and thus lower mechanical properties. With the aid of micro-drilling resistance measurements, it has been investigated what kind of defects along the cross-section of wooden beams can be detected with the corresponding accuracy and reliability. This research has been carried out on beech, eucalypt, sipo and azobé, with selected anatomical characteristics and defects. The species represent clusters of wood species from tropical and temperate climate zones. It can be concluded that drilling resistant measurements allows detecting defects such as decay and cracks, but also high and low-density zones due to slow growth rates and juvenile areas.
* Corresponding author: Tel.: +31152789435; E-mail: [email protected]
1Faculty of Civil Engineering and Geosciences, TU Delft, Delft,
The Netherlands
2Holzforschung München, TU München, Munich,
Germany

Natural resources and bioeconomy studies 80/2017
176
Steam and vacuum treatment of large timber of mixed oak, yellow-poplar and southern yellow pine in solid
wood skids Zhangjing Chen1*, Marshall S. White1, Ron Mack2
Abstract
Forest pests are commonly transported with wood packaging materials. Ports in US continue to intercept invasive pests in cross section timbers packaged with steel or heavy consignments. The large cross section timbers present a greater risk because the fumigation and kiln treatment as currently used in treating wood packaging materials are not effective on large cross section materials. The objective of our study is to determine the effectiveness of steam and vacuum for heat treating large cross section timbers in wood skids and crates, according to the heat treating requirements of ISPM 15. Three wood species of large dimension (20.32×20.32 cm) timbers were tested. These represented a high density hardwood, a low density hardwood and commonly used softwood. These were mixed oak (Quercus spp), yellow-poplar (Liriodendron tulipifera) and southern yellow pine (Pinus spp.). Timbers were partially air dried and are typical of large timbers used in heavy skids. Larvae of the pinewood sawyer beetles (Monochamus spp.) were used as a representative surrogate for invasive cerambycids. During each test, three skids assembled from each wood species were treated. Separate and untreated large timber and a deckboard were set aside as controls. In each test, eight (8) larvae total were inoculated among two large timbers, and single larvae seeded in a deckboard. Four (4) larvae were inserted in the large control timber and one larva in the control deckboard. The initial vacuum pressure was 100mm Hg and test chamber temperature was set for 90°C. The treatment cycle continued until the core temperature of the large timber reached the required 56°C for 30 minutes. To measure temperature profiles within the timbers, thermocouples were placed at various locations. After each test, larvae were recovered and assessed for mortality.
Background 1.Heat has been used to kill insects, fungi and nematodes living in wood for a long time. Asians have used this method for thousands of years. There are early publications about the use of heat treatment to kill insects and fungi (Craighead 1921, Snyder 1923). Heat sterilization of wood, in various forms, is currently used for killing insects or pathogens to prevent their transfer from one geographical region to another (Allen 2001, Schauwecker 2006, Lambertz and Welling 2010, Chen et al 2011, 2012, Schröder et al 2013, Allen et al. 2017). One important concern is the amount of time required to heat wood of various cross-sectional sizes to a required temperature.
Treatments for logs and other wood commodities were reviewed by the US Forest Service in the early 1990s as the international movement of wood products was seen as a major risk to the importation of exotic forest pests (USDA 1991). Heat treatment is an effective method for killing pests that affect forest growth. This paper reviews the history of heat as a wood treatment, the scientific basis for its effect on wood pests (including insects, fungi, nematodes and bacteria), the industrial processes by which wood is heat treated and how heat treatment can be incorporated into
* Corresponding author: Tel.: +15402314403; E-mail: [email protected]
1Department of Sustainable Biomaterials
Virginia Tech University 1650 Ramble Road, Blacksburg,
VA 24060, USA
Detection and Exclusion Laboratory,
W. Truck Road, Otis ANGB, MA 02542, USA

Natural resources and bioeconomy studies 80/2017
177
phytosanitary measures to control forest pests. Heat can be from steam, hot air, and water or generated using the microwave energy.
Wood packaging has been recognized as a pathway for invasive forest pests (Allen and Humble 2001). The Asian Longhorned Beetle, Anoplophora glabripennis (Motschulsky), migrated into North America in infested packaging materials (Liebhold et al. 1995). Preshipment treatment to 56°C for 30 minutes was adopted by many countries as a method of controlling the migration.
The ports of Baltimore and Philadelphia continue to intercept invasive pests in heavy timbers of solid wood packing material (SWPM) used to ship steel or heavy consignments. The large size timbers (20 to 30 cm thick) are common and used in heavy duty skids and crates. These large timbers present a greater risk because fumigation and heat treatment as currently applied to SWPM are not effective or practical on such size wood material.
It is likely that the current Asian long horned beetle infestation in Bethel, Ohio was introduced through heavy skids used to ship tractor parts that were shipped to a local business in the core area. Certain dunnage, because of its irregular and large shapes remains a suspected carrier of invasive pests as well.
Chen et al. (2012) have shown that pallets with wood parts of smaller dimensions can be heat treated to ISPM 15 requirements of 56/30 with steam and vacuum in less than half the time and using 30% less energy than conventional hot air oven systems. Chen et al. (2011) have also shown that this process may be very effective for heat treating wood commodities with larger cross sections such a hardwood firewood and hardwood veneer logs. This process, which incorporates the latent heat of water phase transition, the exothermic reaction of condensation and vacuum to distribute the heat may effectively treat, large timber SWPM in skids and crates without adversely affecting the material quality and skid structural integrity.
Research objectives 2.To determine the effectiveness of steam and vacuum for phytosanitary heat treating large cross section timbers (20.32×20.32×182.9 cm) in wood skids and crates, according to the heat treating requirements of ISPM 15.
Test materials and specimens 3.
Large timber 3.1.Three wood species groups were tested to represent a range of wood densities and species currently used in skids. They are mixed oak (Quercus spp), yellow-poplar (Liriodendron tulipifera) and southern yellow pine (Pinus spp.). These timbers were partially air dried as is typical of large timbers used in heavy skids. Figure 1 is a photograph of the 20.32×20.32×182.9 cm (8 inches by 8 inches by 6 feet) long timbers used in tested wood skids. The 10.16×10.16 ×121.9 cm (4 inches by 4 inches by 4 feet) long deck timbers of the same wood species are shown in Figure 1.
Large skids 3.2.Skids were manufactured according to the base design in ASTM D 6039 “Standard specification for
crates, wood, open and covered”, for type V, style B crates. Figure 2 shows this basic design with the dimensions and test skids made ready for treatment. The parts were connected with lag screws in accordance with the specification.
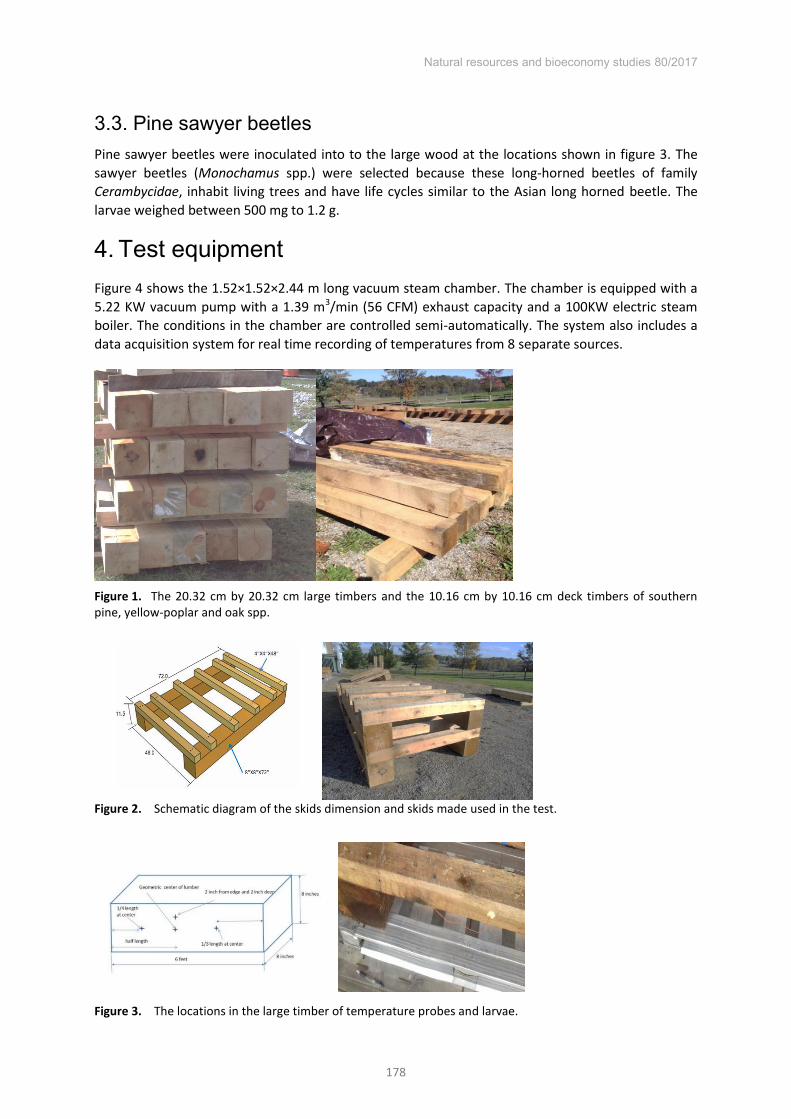
Natural resources and bioeconomy studies 80/2017
178
Pine sawyer beetles 3.3.Pine sawyer beetles were inoculated into to the large wood at the locations shown in figure 3. The sawyer beetles (Monochamus spp.) were selected because these long-horned beetles of family Cerambycidae, inhabit living trees and have life cycles similar to the Asian long horned beetle. The larvae weighed between 500 mg to 1.2 g.
Test equipment 4.Figure 4 shows the 1.52×1.52×2.44 m long vacuum steam chamber. The chamber is equipped with a 5.22 KW vacuum pump with a 1.39 m3/min (56 CFM) exhaust capacity and a 100KW electric steam boiler. The conditions in the chamber are controlled semi-automatically. The system also includes a data acquisition system for real time recording of temperatures from 8 separate sources.
Figure 1. The 20.32 cm by 20.32 cm large timbers and the 10.16 cm by 10.16 cm deck timbers of southern pine, yellow-poplar and oak spp.
Figure 2. Schematic diagram of the skids dimension and skids made used in the test.
Figure 3. The locations in the large timber of temperature probes and larvae.

Natural resources and bioeconomy studies 80/2017
179
Experimental design 5.Three skids were treated at a time to simulate commercial treatment of such structures. Each wood species skid was replicated three times. Therefore, nine skids of each species were treated. Additionally there is one control large timbers of each species that was not treated.
Figure 4. Photograph of vacuum steam chamber used in the tests.
Test procedures 6.Eight larvae were placed in two large timbers and one in a deckboard in each skid. Four larvae were placed in the large control timber and one in the small timber. After the tests, the larvae were retrieved and the mortality of larvae was checked.
Test conditions 6.1.The initial vacuum pressure was 100mm Hg and test chamber temperature was set to be 90°C. The treatment cycle continued until the core temperature of the largest timber reached the required 56 °C for 30 minutes.
Measuring temperatures 6.2. Thermocouples were placed in the large timbers as shown in Figure 3. One, randomly selected, 4×4 pieces of the skid was probed at the geometric center to monitor the core temperatures. This was done to determine the extent of the treating smaller wood pieces and whether this would degrade these pieces.
The holes of diameter of 0.48 cm (3/16 inches) were plugged with plumber putty and sealed after thermocouples were placed at the locations shown (Figure 3). Real time temperature profiles were recorded. Cycle times were determined.
Inoculation with live pests 6.3.Larvae of the pinewood sawyer beetles (Monochamus spp.) were used as simulants of the invasive longhorned beetle (Cerambycidae). The larvae were collected from the infested pine trees (Figure 5). After they are removed from the trees, larvae were placed on a diet prior to the use (Figure 5). The larvae were transported in the containers to Blacksburg, Virginia. During the tests, the larvae were placed at the same locations as the temperature probes shown in Figure 3. There were three large timbers during each test. One is used for measuring temperature and two for placing larvae. It was
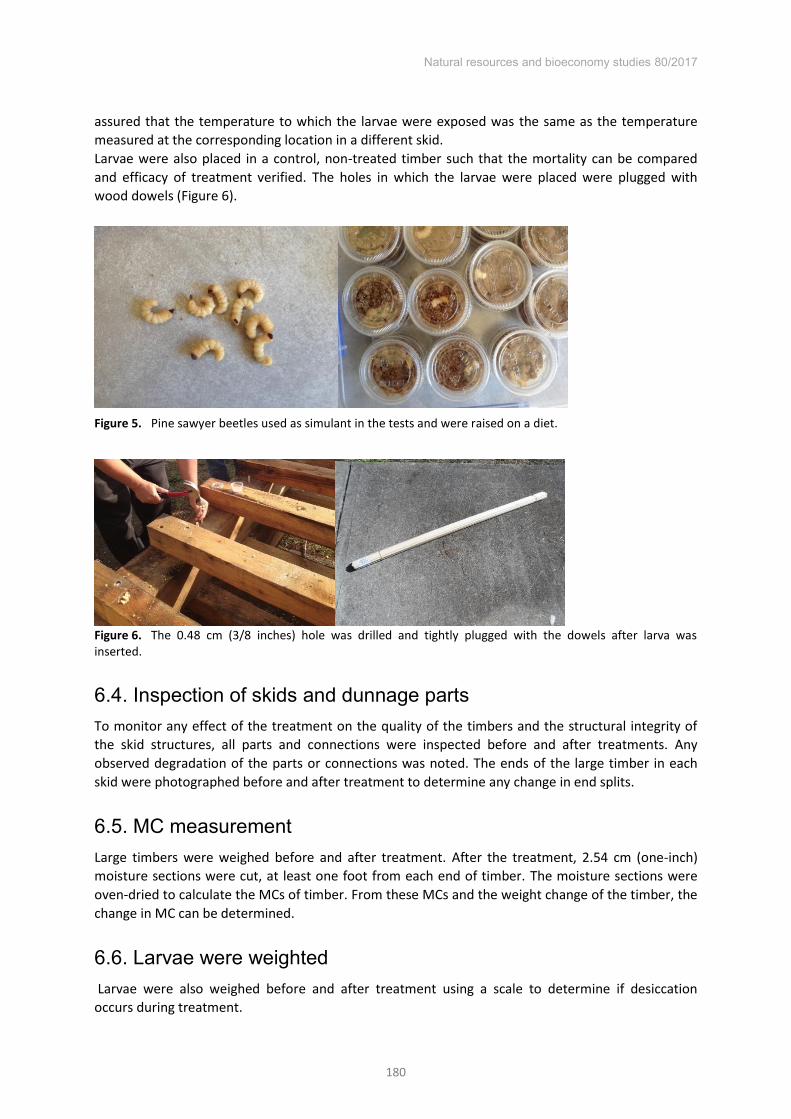
Natural resources and bioeconomy studies 80/2017
180
assured that the temperature to which the larvae were exposed was the same as the temperature measured at the corresponding location in a different skid. Larvae were also placed in a control, non-treated timber such that the mortality can be compared and efficacy of treatment verified. The holes in which the larvae were placed were plugged with wood dowels (Figure 6).
Figure 5. Pine sawyer beetles used as simulant in the tests and were raised on a diet.
Figure 6. The 0.48 cm (3/8 inches) hole was drilled and tightly plugged with the dowels after larva was inserted.
Inspection of skids and dunnage parts 6.4.To monitor any effect of the treatment on the quality of the timbers and the structural integrity of the skid structures, all parts and connections were inspected before and after treatments. Any observed degradation of the parts or connections was noted. The ends of the large timber in each skid were photographed before and after treatment to determine any change in end splits.
MC measurement 6.5.Large timbers were weighed before and after treatment. After the treatment, 2.54 cm (one-inch) moisture sections were cut, at least one foot from each end of timber. The moisture sections were oven-dried to calculate the MCs of timber. From these MCs and the weight change of the timber, the change in MC can be determined.
Larvae were weighted 6.6. Larvae were also weighed before and after treatment using a scale to determine if desiccation occurs during treatment.

Natural resources and bioeconomy studies 80/2017
181
Mortality of larvae was determined 6.7.Larvae were observed for two days. If no movement was evident that larvae were assumed dead.
Densities of large timber 6.8.Wood density was measured using the water displacement method. Oven-dried wood samples are pressed below the water surface in a beaker on a top loading balance. The volume of the wood is read accurately on the balance as the mass of the displaced water.
Test result and discussion 7.
Temperature profiles 7.1.Figures 7 to 9 are typical temperature profiles for each wood species. Temperature profiles for all tests are in the appendix. The chamber and surface temperatures increased rapidly as soon as steam entered the chamber. Next the temperature next to surface slowly rose. The temperature at center of timber initially remains unchanged for a certain time and linearly increases later to the final set point of 56°C. This profile is similar to those recorded when treating large diameter logs (Chen et al. 2012). The center of the 10.16 cm by 10.16 cm deck timber reached 56ºC within 60 to 90 minutes and remains at 85ºC for about 4 hours for many tests. The concern is the potential for degradation of small timber in an attempt to treat the large timber to 56/30. There is very little temperature gradient along length. The rate of heating is similar at ¼, 1/3 and ½ of the timber length. When wood cross sections are uniform along the length, probing the geometric center is recommended, but depending on the ease of thermocouple placement, it is not necessary. Theory implies any distance from the end greater than 2.5 times the distance to the center of timber.
Figure 7. Typical temperature profile of the 20.32 cm by 20.32 cm timber in the yellow-poplar skid at the initial vacuum pressure of 100 mmHg.
0102030405060708090
100
0 60 120 180 240 300 360 420
Tem
pera
ture
(C)
Treating time (Min)
1/2L at 2-inch deep
1/3L at 4-in deep
Geometric center of largetimber
1/4L at 4-in deep
Chamber
Timber surface
Deck timber center
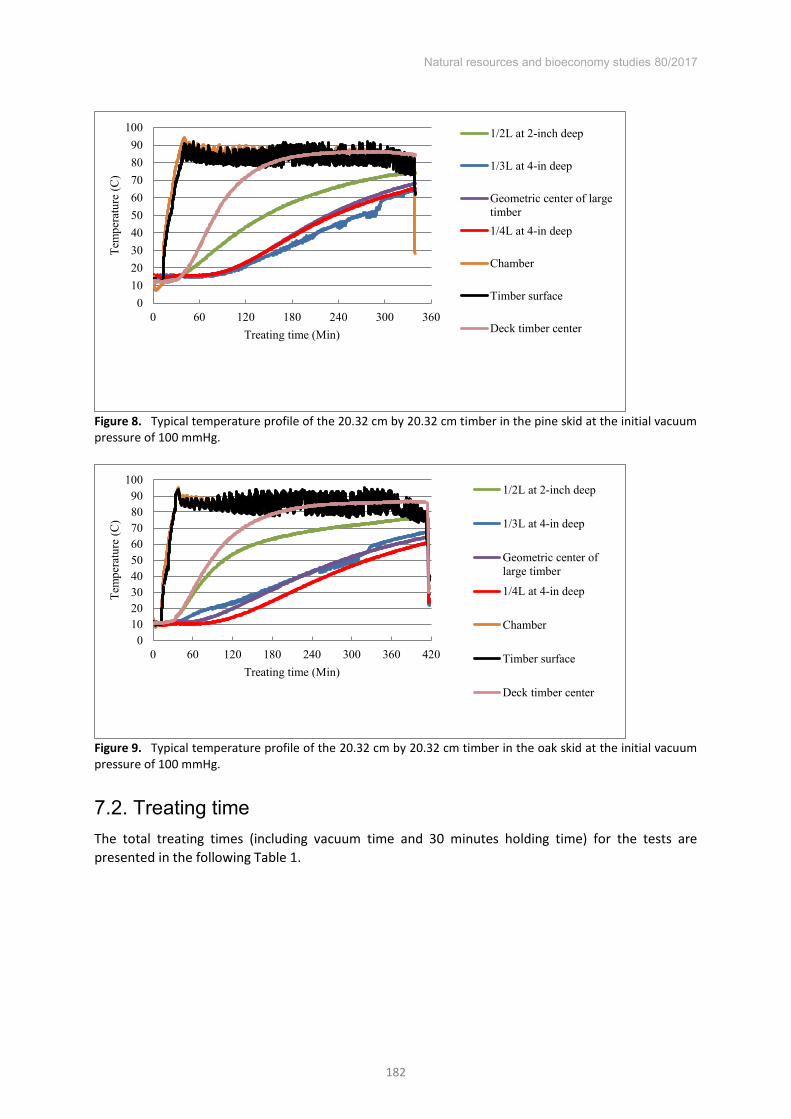
Natural resources and bioeconomy studies 80/2017
182
Figure 8. Typical temperature profile of the 20.32 cm by 20.32 cm timber in the pine skid at the initial vacuum pressure of 100 mmHg.
Figure 9. Typical temperature profile of the 20.32 cm by 20.32 cm timber in the oak skid at the initial vacuum pressure of 100 mmHg.
Treating time 7.2.The total treating times (including vacuum time and 30 minutes holding time) for the tests are presented in the following Table 1.
0102030405060708090
100
0 60 120 180 240 300 360
Tem
pera
ture
(C)
Treating time (Min)
1/2L at 2-inch deep
1/3L at 4-in deep
Geometric center of largetimber1/4L at 4-in deep
Chamber
Timber surface
Deck timber center
0102030405060708090
100
0 60 120 180 240 300 360 420
Tem
pera
ture
(C)
Treating time (Min)
1/2L at 2-inch deep
1/3L at 4-in deep
Geometric center oflarge timber
1/4L at 4-in deep
Chamber
Timber surface
Deck timber center

Natural resources and bioeconomy studies 80/2017
183
Table 1. Treating time at the initial vacuum of 100 mmHg for 20.32 cm by 20.32 cm timbers.
Test Red Oak Southern Pine Yellow-Poplar
Initial wood
T
Vacuum time
Total time
Initial wood
T
Vacuum time
Total time
Initial wood
T
Vacuum time
Total time
(°C) (min) (min) (°C) (min) (min) (°C) (min) (min) 1st 20 13 409 16 13 326 12 14 345 2nd 14 14 407 11 12 318 15 13 311 3rd 13 12 403 8 13 320 7 12 384
Average 16 13 406 12 13 321 11 13 347 The treatment duration of each log during each test is in Table 1 which includes vacuum time and a 30-minute hold time. From Table 1, the treating time for 20.32 cm by 20.32 cm varied from 311 minutes (5.2 hours) to 409 minutes (6.8 hours) depending on the wood species. Methyl bromide log fumigation schedules require at least 24. The result indicates that the large 20.32 cm by 20.32 cm timbers can be heat treated with vacuum steam technology to 56°C for 30 minutes, faster than fumigating.
In vacuum steam treatment, several variables affect the time required to heat wood to a given temperature. Heating time is influenced by wood density, wood MC, initial wood temperature, and geometry of wood.
The effect of species on the treatment time 7.3.From Table 1, it is clear that it takes the least time to treat southern pine. The hardwood of less dense wood, yellow poplar, has been heated up faster than the heavier wood, oak spp. Softwood, such as pine, has a straight, linear tracheid, which transport steam faster. The hardwood has more types of cells and its cells have irregular shape and arrangement.
Effect of size on the treating time 7.4.The larger the timber is, the longer the treating time. This is shown in the temperature profile (Figures 7-9). The average time for 10.16 cm by 10.16 cm oak deck timber of to reach 56°/30 minutes is about 100 minutes compared to the 311 to 409 minutes required to heat treat the 20.32 cm by 20.32 cm ( 8 by 8 inches) cross section. Larger cross sections require more time and energy to heat treat.
The vacuum steam process would be ideally suited for treating wood structures with different size timber. The process will not degrade smaller timber that will heat more rapidly and remain at higher temperature than the larger timber. A hot air system would likely degrade the small timbers in the skid.
Effect of wood density and initial MC on the treating time 7.5.In general, it took longer to treat the oak than yellow-poplar or southern pine. Southern pine required the shortest duration. Southern pine has the lowest density and oak the greatest. However, at the time of treatment, the oak timber contained about 57% more water. For this reason, it is not possible to separate the wood MC and oven-density effect. There is the linear relationship between the gross density (effect of both oven-dry density and MC) and the treating time with R-squared = 0.85 and p-value = 0.0004 for the slope. The higher the gross density is, the longer time to treat the timber. The oak with high MC has higher gross density than oak containing less water. It took longer to treat high MC oak timber even it has the same oven-dry density as oak timber containing less water.

Natural resources and bioeconomy studies 80/2017
184
Moisture gained during treatment 7.6.Based on MCs from the moisture sections measured in oven-dry method, the MC content before and after treatment for the large timber can be calculated. The moisture gained during the treatment was also calculated. The average MC increase from the large timber is about 4.1%. The average MC of hardwood timber averaged by 2.8% and southern pine timber increased by 6.8%.
Larva weight change during the treatment 7.7.The statistical analysis indicated that there is no significant difference in larvae’ weight before and
after treatment. Therefore, desiccation is not a mechanism of mortality as previously shown by Chen et al. (2008) where only vacuum is used for treatment.
Larva mortality 7.8.After each treatment, larvae were recovered from the treated and control large timbers. They were checked for mortality. They were then placed in the new diet and observed for two days. After the larvae were retrieved from the testing samples, they were soft and pale. Apparently, they were in a lethal state. If they remained immobile after two days they were assumed dead. 100% mortality was observed for those larvae in the treated timbers. All larvae that were retrieved from the control samples were alive. They burrowed into the diet and remained active.
Quality evaluation, checking and color change of large timbers 7.9.The timber quality of both control and treated timbers was carefully monitored and compared before and after treatment. The primary measure of the timber quality was any change the size and number of end splits. Photo images of the ends of the treated timbers were taken before and after treatment. Photos from three timbers of each species are shown in Figure 10. There were no obvious checks occurring after treatment or any measurable increase of the existing checks. The color of timbers did not change during the treatment.
The structural integrity of the skid structures was not affected. All connections were inspected and no difference was observed before and after treatment.

Natural resources and bioeconomy studies 80/2017
185
Sample Image before treatment Image after treatment
Yellow-poplar
Pine
Oak
Figure 10. Typical end grain images of large timbers before and after treatment.
Conclusion 8.1. Total treating time to achieve 56°C for 30 minutes at core was less than 7 hours for all three
wood species tested (100 mmHg and 90°C steam). Treating cycle is less than methyl bromide fumigation specified in ISPM 15.
2. There was complete mortality (100%) of larval surrogates as a result of treatment. 3. Quality of 20.32 cm by 20.32 cm, 10.16 cm by 10.16 cm timbers and skids was not affected
by the treatment. 4. During treatment, the average timber MC increased by 4.1%. 5. Vacuum and steam can be used to efficiently pre-shipment heat treat and to heat treat
quarantined, large timber SWPM in compliance with ISPM 15.

Natural resources and bioeconomy studies 80/2017
186
References Allen, E. A. 2001. Solid wood packing material as a pathway for non-indigenous species. In: Exotic
Forest Pest Online Symposium April 16–29, 2001. http://www.apsnet.org/online/proceedings/ExoticPest/Papers/allen.htm
Allen, E., M. Noseworthy, and M. Ormsby. 2017. Phytosanitary measures to reduce the movement of forest pests with the international trade of wood products. Biological Invasions, July 2017. DOI 10.1007/s10530-017-1515-0
Chen, Z., M. S. White, M. A. Keena, T. M. Poland, and E. L. Clark. 2008. Evaluation of vacuum technology to kill larvae of the Asian longhorned beetle, Anoplophora glabripennis (Coleoptera: Cerambycidae), and the emerald ash borer, Agrilus planipennis (Coleoptera: Buprestidae), in wood. Forest Products Journal 58(11):87-93.
Chen, Z., M.S. White, and Y. Wu. 2012. Vacuum-steam phytosanitation of hardwood pallets and stringers. Forest Products Journal 62(5): 378-382.
Chen, Z., M.S. White, and R. Mack .2011. Using vacuum and steam to sanitize hardwood veneer logs for export. Project final report to USDA, APHIS, PPQ, Raleigh, NC.
Craighead, F. C. 1921. Temperatures fatal to larvae of the red-headed ash borer as applicable to commercial kiln drying. Journal of Forestry 19: 250-254.
Lambertz, G., and J. Welling. 2010. Changes in extractives of Scots pine (Pinus sylvestris L.) after ISPM 15 heat treatment and their effect on fungal discoloration. Wood Material Science and Engineering 5(2):67-72.
Liebhold, A. M., W.L. MacDonald, D. Bergdahl, and V.C. Mastro. 1995. Invasion by exotic forest pests: a threat to forest ecosystems. Forest Science 41: 1-49.
Schauwecker, C. F. 2006. Pressure treatment of solid wood packaging materials with preservatives to mitigate phytosanitation isuuses. In: 60th International Convention, Forest Products Society, Newport Beach, CA. USA.
Schröder, T., J. Welling, and C. Aukamp-Timmreck. 2013. Efficacy of kiln drying as photosanitary treatment against wood borne nematodes. Berlin Julius Kühn-Institut 169:51-52.
Snyder, T. E. 1923. High temperatures as a remedy for Lyctus powder-post beetles. Journal of Forestry 21: 810-814.
USDA. 1991. Pest risk assessment of the importation of larch from Siberia and the Soviet far East. USDA Forest Service Miscellanous Publications 1495.

Natural resources and bioeconomy studies 80/2017
187
Roughness profile by laser method on native milled and thermally modified milled oak wood
Lukas Kaplan*
Czech University of Life Sciences Faculty of Forestry and Wood Sciences
Department of Wood Processing Prague - Suchdol, Czech Republic, 165 00
Abstract
This paper focuses on the surface quality assessment of thermally modified and native oak wood after plane milling while taking into account technological parameters which have substantial effects on the characteristic called processed wood surface’s arithmetic mean deviation of the roughness profile (Ra). The observation of roughness was carried out by the industrial laser confocal microscope Olympus LEXT OLS 4100. The milling process was affected by the cutting speed, varying from 20 to 60 m/s, with the feed speed of 4, 8, and 11 m/min and with tooth rake angles of 15, 20 and 25°. For the very research have been used four packages of test samples in total consisting of samples of thermally modified oak wood as well as test samples of oak wood without thermal treatment. The thermally modified samples have been divided in three groups according to degree of heat used during the process of thermal treatment: 160, 180 and 210 °C. And the 4th remaining group is made up of native test samples. The crafted native and thermally modified test oak samples were subject to the observation of influence of the parameters mentioned above on the predefined characteristic. This background enabled us to determine main goals of this paper. The first purpose is to learn how the variation of feed speed affects quality of surface in terms of roughness profile (Ra) of thermally modified and native oak wood. The second one is to find out how the variation of cutting speed influences quality of surface again from the view of roughness profile (Ra) of both kinds of oak wood. The third purpose was to determine the effect of tooth cutting angle on roughness profile (Ra).
Introduction 1.Wood as a natural material has been used by humans in exteriors as well as interiors for thousands of years. When used in exterior, wood must fulfil specific requirements in terms of quality, because its exposure to action of external factors may cause deterioration of its physical-mechanical and aesthetic characteristics. Among these requirements belong high dimensional stability, high degree of resistance and good aesthetic properties, which wood must keep throughout the duration of its use (Kokutse et al. 2006).
Various chemical methods are most frequently used to improve its resistance and durability. However, they are often non-ecological not only with regard to their application on wood, but also during their use and usually upon their removal.
Another kind of wood protection is its thermal modification. During the process of thermal modification is wood exposed to higher air temperature, while the atmospheric pressure is maintained and oxygen concentration is normal level or lowered. (Brito at al. 2006)
Wood is during the process of thermal treatment subjected to temperatures within a range from 160 to 250 °C. (Guedira 1988; Vovelle and Mellottee 1982) The higher the temperature of thermal modification is, the darker the hue of wood. (Kačík et al. 2012, Gündüz et al. 2008) Thermally
modified wood differs from native wood without thermal modification by higher degree of dimensional stability, lower hygroscopicity, colour changes and higher resistance to wood-rotting fungi and atmospheric agents. (Johansson 2008) Thermally modified wood is characterised by new properties, which make it a suitable material especially for both, outdoor and indoor use. Thanks to * Corresponding author: E-mail: [email protected]

Natural resources and bioeconomy studies 80/2017
188
the abovementioned characteristics one can consider thermal modification as being a sustainable solution adding value to native wood.
In these times milling is the most frequently used wood machining process by reason of its broad scope of application. Quality of machined surface may defer, depending on tool wear, characteristics of material and the very process of newly machined surface creation.
Throughout the machining, a processed object is exposed to action of forces, which are produced mainly by the tool. Application of the forces enables separation of chip and the very machining too (Kubs et al. 2016). However, the whole process is not only about the tooth and the workpiece, but it is affected also by other additional parameters (Kvietková et al. 2015, Kvietková et al. 2016). These basic parameters are technological parameters such as cutting speed, feed speed. The 2nd most significant parameter is angular geometry of tool adjustment, namely tooth angle, tool rake angle and tool clearance angle.
We can note further parameters such as quality of machinery on which the machining process takes place, types of additional used machinery and lubricants and last but not least vibrations between the tool and workpiece and machinery.
It has to be said, that for further wood processing it is important to follow obtained surface quality at each step of machining process. In terms of the quality of machined surface assessment of values of variable Ra (arithmetic mean deviation of roughness profile or surface roughness) is most frequently carried out.
The notion of roughness is to be understood as irregularities corresponding with microscopic changes on the surface. (Javorek, Osvald, 1998) Final quality is affected by both, individual factors and their mutual interaction.
Experimental 2.Oak belongs among ring-porous wood species. This parameter has not been taken into account in evaluation of roughness profile. Measurement was carried out solely on samples with tangential section.
Methods 2.1.
2.1.1. Procedure Thermal treatment
Each of three packages of oak samples underwent the same procedure of heat treatment. Wooden pieces were put on a metallic grate and afterwards they were placed into the thermal chamber model Katres (Czech Republic) (in Table 1 are stated technical parameters). The thermal treatment follows three steps which altogether form the ThermoWood® process. This process was developed by VTT in Finland. In the first place, the wood had to be dried and the chamber had to be heated to the desired temperature, 160, 180 or 210 °C. Secondly, when the desired temperature was reached, it would be maintained for the necessary time (Table 2). In the last third phase, the chamber and wood samples were gradually cooled. The wood was during the last step re-moisturized to achieve the final end-use moisture between 5 and 7 %.

Natural resources and bioeconomy studies 80/2017
189
Table 1. Parameters of Thermal Chamber
Input technical parameters
Moisture content of wood 2-4 % Filling capacity of TW furnace 1,0 m3
Maximum temperature achievable 210 °C Maximum temperatures reached 160 °C, 180 °C, 210 °C
For the experiment was used native (untreated) and thermally modified wood at several temperature degrees of thermal treatment. Duration of different phases of thermal treatment for individual degrees of heat undergone by wood are displayed in the Table 2.
Table 2. Thermal Modification Process Parameters
Thermal modification process
Parameters 160 ° C 180° C 210° C
Heating 8.3 Hours 7.7 Hours 7.9 Hours Thermisation 13.6 Hours 14.4 Hours 17.6 Hours
Cooling 15.8 Hours 17.2 Hours 20.7 Hours Total modification time 37.7 Hours 39.3 Hours 46.2 Hours
2.1.2. The Methods of Milling Process Three methods of milling process were used during the research in order to observe and gauge
their influence on surface quality of native and thermally modified oak wood. Firstly, variation of cutting speed starting from 20 m/s, continuing with 40 m/s and ending with 40 m/s. Secondly, variation of feed speed - 4, 8 and 11 m/min. The third method consisted in modification of tooth angle using 15, 20 and lastly 25 degrees.
Measurement, evaluation and calculation 2.2.Measurement of roughness was carried out by the industrial laser confocal microscope Olympus LEXT OLS 4100.
Influence of individual factors was recorded by means of measurement device and saved in MS Excel spreadsheet. Then, assessment was carried out in the STATISTICA 12 software (Statsoft Inc.; USA).
Results and discussion 3.On the figure 1 one can see part of oak samples obtained by milling process.
Figure 1. Oak samples after milling

Natural resources and bioeconomy studies 80/2017
190
Table 3 contains a statistical evaluation of the impact of the individual factors and individual two-, three- and four-factor interactions. Lower roughness values correspond to better surface quality.
Table 3. Statistical Evaluation of the Effect of Factors and Their Interaction on Ra by Laser Microscope
Monitored Factor Sum of Squares
Degree of Freedom Variance Fisher's
F- Test Significance
Level P Intercept 2569.194 1 2569.194 16896.25 ***
1) Cutting speed (m.s-1) “CS” 2.726 2 1.363 8.96 *** 2) Tool's rake angle (°) “TRA” 74.019 2 37.009 243.39 ***
3) Feed rate (m/min) “FR” 41.495 2 20.748 136.45 *** 4) Thermal modification °C “TM” 37.385 3 12.462 81.95 ***
“CS” * “TRA” 35.458 4 8.864 58.30 *** “CS” * “FR” 34.107 4 8.527 56.08 ***
“TRA” * “FR” 38.184 4 9.546 62.78 *** “CS” * “TM” 51.884 6 8.647 56.87 ***
“TRA” * “TM” 100.640 6 16.773 110.31 *** “FR” * “TM” 102.245 6 17.041 112.07 ***
“CS” * “TRA” * “FR” 146.273 8 18.284 120.24 *** “CS” * “TRA” * “TM” 93.626 12 7.802 51.31 *** “CS” * “TRA” * “TM” 89.542 12 7.462 49.07 *** “TRA” * “FR” * “TM” 278.739 12 23.228 152.76 ***
“CS” * “TRA” * “FR” * “TM” 126.152 24 5.256 34.57 *** Error 32.844 216 0.152
NS- not significant, *** - significant Figure 2 represents the effect of the cutting speed on values of arithmetic mean deviation of
roughness Ra. From data on the figure results that the cutting speed in terms of its effect on the values of observed characteristic is at the limit of statistical significance.
Figure 2. Effect of the Cutting Speed on the Roughness Profile Ra.
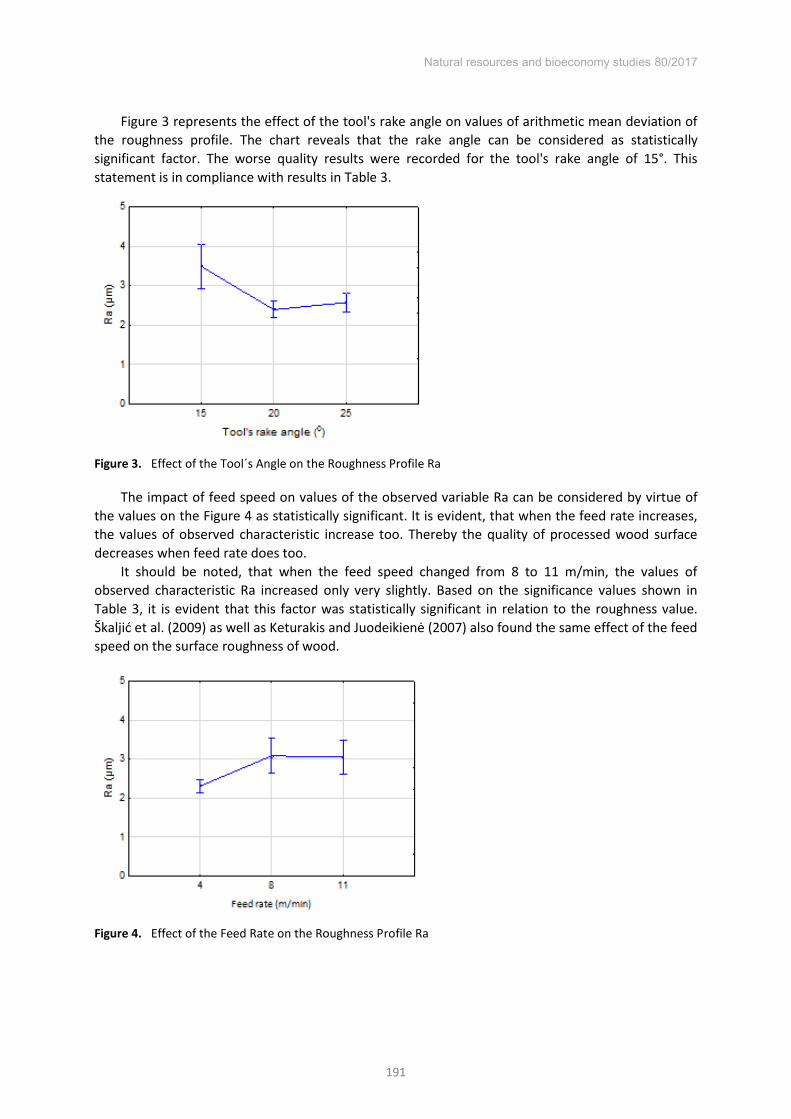
Natural resources and bioeconomy studies 80/2017
191
Figure 3 represents the effect of the tool's rake angle on values of arithmetic mean deviation of the roughness profile. The chart reveals that the rake angle can be considered as statistically significant factor. The worse quality results were recorded for the tool's rake angle of 15°. This statement is in compliance with results in Table 3.
Figure 3. Effect of the Tool´s Angle on the Roughness Profile Ra
The impact of feed speed on values of the observed variable Ra can be considered by virtue of the values on the Figure 4 as statistically significant. It is evident, that when the feed rate increases, the values of observed characteristic increase too. Thereby the quality of processed wood surface decreases when feed rate does too.
It should be noted, that when the feed speed changed from 8 to 11 m/min, the values of observed characteristic Ra increased only very slightly. Based on the significance values shown in Table 3, it is evident that this factor was statistically significant in relation to the roughness value. Škaljić et al. (2009) as well as Keturakis and Juodeikienė (2007) also found the same effect of the feed
speed on the surface roughness of wood.
Figure 4. Effect of the Feed Rate on the Roughness Profile Ra

Natural resources and bioeconomy studies 80/2017
192
Figure 5 shows that measured values of arithmetic mean deviation of the roughness profile for thermally modified oak wood in the range between 160 and 210 °C are higher than for native oak wood. Thermally modified oak wood exhibits always worse values of roughness than oak wood without treatment. Thermal modification is a statistically significant factor also according to Table 3.
Figure 5. Effect of the Thermal Modification on the Roughness Profile Ra
Conclusions 4.1. Thermal treatment of oak wood in the range between 160 and 210 °C has negative impact
on the roughness profile of processed surface when milled. The worst values are achieved for the thermal modification made at highest degrees.
2. When cutting speed during milling increased, it had a positive effect on the quality of the machined oak surface. Thereby, it can be stated, that the higher cutting speed, the lower the surface roughness.
3. On the contrary, higher feed speed had opposite effect on surface quality in terms of roughness. When the feed rate increased, the surface roughness of oak wood increased too; it is to note that this relation has statistical significance with a limit value.
Acknowledgments The author is grateful for the support of the University-wide Internal Grant Agency (CIGA) of the Faculty of Forestry and Wood Sciences of Czech University of Life Sciences Prague, project No. B05/16. No. 2016 - 4309.
References Brito, J.O., Garcia, J.N., Bortoletto, Jr.G., Pessoa, A.M.C., Silva, P.H.M., 2006: The density and
shrinkage behavior of Eucalyptus grandis submitted to different temperatures of thermorectification. (Densidade básica e retratibilidade da madeira de Eucalyptus grandis, submetida a diferentes temperaturas de termorretificação). Cerne, Lavras 12(2): 182-188 (in Portuguese).
Guedira, F., 1988: Slow pyrolysis of biomass: Compared behavior of dregs of olives, sugar cane bagasse and sawdust (maritime pine tree). (Pyrolyse lente de la biomasse: Comportement compare des tourteux d’olives, de la bagasse de canne à sucre et la sciure de bois (Pin maritime)). Ph. D Dissertation, Université Mohamed, Maroc (in French).
Gündüz, G., Korkut, S., and Korkut, D. S. (2008). “The effects of heat treatment on physical and technological properties and surface roughness of Camiyani black pine (Pinus nigra Arn. subsp.

Natural resources and bioeconomy studies 80/2017
193
pallasiana var. pallasiana) wood,” Bioresource Technology 99(7), 2275-2280. DOI: 10.1016/j.biortech.2007.05.015.
Javorek, Ľ., Oswald, J:(1998): Surface quality versus technological conditions (Kvalita povrchu verzus technologické podmienky). In: Acta facultatis technica Zvolen: TU Zvolen, 1998, 41 – 46 (in Slovak).
Johansson, D., 2008: Heat treatment of solid wood: Effects on absorption, strength and colour. Ph. D Dissertation (Divisions of wood Physics) – Luleå University of Technology, Sweden, 142 pp.
Kačík, F., Veľková, V., Šmíra, P., Nasswettrová, A., Kačíková, D., and Reinprecht, L. (2012). “Release of terpenes from fir wood during its long-term use and in thermal treatment,” Molecules 17(8), 9990-9999. DOI: 10.3390/molecules17089990.
Keturakis, G., and Juodeikienė, I. (2007). “Investigation of milled wood surface roughness,” Materials Science (Medžiagotyra) 13(1), 47-51.
Kokutse, A. D.; Stokes, A.; Baillères, H.; Kokou, K.; Baudasse, C. 2006. Decay resistance of Togolese teak (Tectona grandis L. f.) heartwood and relationship with colour. Trees 20: 219-223.
Kubs, J., Gaff, M., Barcík, Š. (2016). “Factors Affecting the Consumption of Energy during the of Thermally Modified and Unmodified Beech Wood,” BioResources 11(1), 736-747. DOI: 10.15376/biores.11.1.736-747.
Kvietková, M., Gaff, M., Gašparík, M., Kaplan, L., Barcík, Š. (2016). “Surface Quality of Milled Birch Wood after Thermal Treatment at Various Temperatures,” BioResources 10(4), 6512-6521. DOI: 10.15376/biores.10.4.6512-6521.
Kvietková, M., Gašparík, M., Gaff, M. (2015). “Effect of Thermal Treatment on Surface Quality of Beech Wood after Plane Milling ,” BioResources 10(3), 4226-4238. DOI: 10.15376/biores.10.3.4226-4238.
Škaljić, N., Beljo-Lučić, R., Čavlović, A., and Obućina, M. (2009). “Effect of feed speed and wood species on roughness of machined surface,” Drvna Industrija 60(4), 229-234. DOI: 10.1007/s10086-004-0655-x.
Vovelle, C., Mellottee, H., 1982: Modeling of oxidizing or non-oxidizing pyrolysis of wood or vegetable waste from their components. (Modélisation de la pyrolyse oxydante ou non oxydante de bois ou de déchets végétaux à partir de leurs composants). In: Energy from Biomass 2 ed. Applied Science, London. Pp. 925-929 (in French).

Natural resources and bioeconomy studies 80/2017
194
Session IV Hardwood processing, optimization and technology development for solid and composite products

Natural resources and bioeconomy studies 80/2017
195
Factors affecting dye uptake during the veneer dyeing process of Eucalyptus globulus
Ngoc Nguyen1*, Barbara Ozarska1, Peter Vinden1, Macarthur Fergusson2
Abstract
This study investigated the effect of different dye solutions on the wood permeability of Eucalyptus globulus grown on a plantation in Australia. The data on the dye uptake for the species was necessary for further research on the veneer coloring process of the species. The samples of two different moisture contents, 12% and green 80 ± 5%, were submerged in four different solutions of an acid dye and removed after a set time (0.5, 1, 2, 5, 10, 30, or 60 minutes). The four different solutions were: (1) an acid orange dye, (2) a wetting agent was added to solution 1, (3) sodium hydroxide was added to solution 1, (4) a non-ionic detergent was added to solution 3. The overall uptake of the dye was low. However, the results showed the descending order of the dye uptake: longitudinal > radial > tangential. The permeability of the dried samples resulted in a higher rate of uptake than the green samples. Sapwood samples were more permeable than heartwood, and there was a different pattern of uptake associated with different dye solutions. A descending order of the dye solutions was observed: solution 4 ≥ 3 > 2 ≥ 1 in relation to the wood permeability.
Introduction 1.The permeability of wood has a profound impact on wood processing procedures such as drying, pulping, preservative treatment, and wood dyeing (coloring). In the wood dyeing process, the permeability provides an indication of the ease in which dyes may penetrate wood samples. More permeable wood is more easily dyed with different colors. This information is also important in understanding the dyes’ transport processes in wood in relation to wood structure parameters, which in turn influence the quality of dyed wood.
Permeability is a measure of a material’s capacity to allow the flow of a fluid through it under
the influence of a pressure gradient. The fluid can be liquid or gas; a liquid is usually understood to be water, although other liquids can also be used (Choong et al., 1989). The permeability of wood can vary significantly between different species, among individual trees, and even within the same tree (Comstock, 1965).
In Australia, there are large plantations of blue gum (Eucalyptus globulus), which are mainly grown to produce pulpwood. This resource is not suitable for the production of appearance wood products due to low grades of wood and “dull” appearance. Many studies have explored the
utilization of this species for the production of peeled veneer and veneer-based engineered wood products, such as plywood and laminated veneer lumber (LVL) (McGavin et al., 2015). Developing methods that enhance the appearance of this low quality veneer would promote the production of high value wood products such as furniture, joinery or flooring.
* Corresponding author: Tel.: +61424718868; E-mail: [email protected]
1School of Ecosystem and Forest Sciences
the University of Melbourne Richmond, Victoria 3121
Australia
2Centre for Materials Innovation and Future Fashion
RMIT University Brunswick, Victoria 3056
Australia

Natural resources and bioeconomy studies 80/2017
196
One of the methods to enhance the appearance of low quality veneer involves the production of a multi-laminar veneer, also called “reconstructed veneer”(ALPI, 2014 n.d.). An important stage of the multi-laminar production is coloring the veneer, which is achieved by dyeing the veneer with dyes of different colors, depending on the type of appearance products, their design, and market demand.
Although veneer dyeing technology is well advanced in Italy, it has been mainly focused on poplar veneer from plantations. This wood is characterized by low density, even color, low defects, and high permeability. Conversely, the majority of plantation eucalypts have medium to high density, many defects, uneven color, and low permeability. A detailed study is therefore required to develop dyeing methods suitable for coloring eucalypt veneers. In order to conduct such a study, knowledge of wood permeability of Eucalypts globulus is needed to develop an understanding of dye uptake under different variables (moisture content, grain direction, and sapwood/heartwood).
This study examined the effect of different dye solutions, moisture content, grain direction and sapwood/heartwood on the dye uptake by small wood blocks made from plantation-grown Eucalyptus globulus in Australia.
The hypothesis for the study was that soaking of small blocks of wood would provide an indication of the permeability of E. globulus veneer and the potential for using soaking as a means of dyeing the veneer of this species.
Materials and methods 2.
Materials 2.1.Eucalyptus globulus was selected from a commercial plantation in Ballan, Victoria, Australia. The plantation was established in June 2000 at 4m x 2m spacing by Australian Bluegum Plantations Company and the trees were harvested in December 2015. The study trees were felled at an average stump height of 0.5 m. From each tree, three 1.8 m long billets were cut from the bottom of the logs as shown on Figure 1. Then, four discs (approximately 5 cm thick, 25 cm diameter) were cut from the upper (small) end and the lower (large) end of each billet for permeability tests.
Figure 1. Sampling strategy for disc sample from each tree
A total of 576 cubes samples (20 × 20 × 20 mm) were machined from the discs taken from the billets of five trees. Two levels of moisture content (green samples at 80 ± 5% and dried samples at 12%) were used for the study.
The soaking (dipping) method was used to conduct the experiments. The dye uptake of three flow directions - longitudinal (L), radial (R), and tangential (T) from both sapwood and heartwood samples was measured. Acid orange (the C.I. Acid Orange 7, Chemcolour Industries, Nottinghill, Victoria, Australia) was used for the tests. The C.I. Acid Orange 7 is an acid dye that does not fix on to cellulose; however, it will fix on any protein found in the timber. Hence the use of an alkaline pH is to

Natural resources and bioeconomy studies 80/2017
197
prevent any possible fixation. The issue with the green samples is that the presence of moisture will inhibit dye penetration and it is for this reason that the various chemicals are added to try to overcome the high moisture in the timber. There were four different dye solutions applied in the dye uptake tests (Table 1).
Table 1. Dye solutions
Solution 1 Solution 2 Solution 3 Solution 4 0.1g dye/200 mL of
water 0.1g dye/200 mL of
water 0.1g dye/200 mL of
water 0.1g dye/200 mL of
water 0.1g/l of wetting agent 0.1g/l of sodium
hydroxide 0.1g/l sodium
hydroxide 0.1g/l Triton X100
In solution 1, only dye was used. In solution 2, a wetting agent was added to improve the wettability of the cellulose fibers in the wood structure in order to increase the dye penetration. The wetting agent used in this solution was anionic surfactant product dioctyl sodium sulphosuccinate. This product is purely a wetting agent and does not have any detergent properties. In solution 3, the addition of sodium hydroxide was made to determine if the higher pH would improve the dye penetration. Sodium hydroxide will increase the swelling of the cellulose but will also react with any oily matter in the structure forming soap via the saponification reaction. Soap, therefore, being a natural detergent (M. Fergusson, personal communication, May 1, 2017). In solution 4, Triton X100 is a non-ionic detergent that has both wetting and detergent reaction. The aim of this addition was to determine if the presence of this detergent increases the dye penetration into the substrate. The presence of oils found in the timber may reduce the dye penetration.
The following full factorial experimental framework was developed for the study (Table 2).
Table 2. Experimental framework used for the dye uptake study
Variables Combinations of variables implemented Moisture content, % Green (80±5) 12
Part of wood Sapwood Heartwood Sapwood Heartwood Flow directions* L R T L R T L R T L R T
Solutions 1 2 3 4 1 2 3 4 1 2 3 4 1 2 3 4
Sample size There were 12 samples for each combinations Note *: Flow directions: Longitudinal (L), radial (R) and tangential (T).
Experiment and measurements 2.2.All experiments were conducted at a controlled temperature of 230C in the laboratory at The University of Melbourne, Burnley Campus.

Natural resources and bioeconomy studies 80/2017
198
Sealed face
Unsealed face
Figure 2. Sealing faces of the specimens for the permeability tests
The sample surfaces were sealed on different faces with silicone rubber, leaving only a pair of radial, tangential, or longitudinal faces exposed. Therefore, the relative permeability in different grain directions could be measured. For example, for longitudinal permeation measurement, the tangential (TL) and radial (RL) surfaces were sealed with silicone glue, while the transverse (TS) surface was left open to allow liquid penetration (Fig. 2). The cubes were kept in a glass desiccator in a cool room to minimize drying out while the silicon rubber glue dried. As only a very thin coating of silicone was applied, it did not affect the weight of the original cubes. The cubes were weighed before the experiments and their volumes were also measured.
One of the simplest techniques for measuring permeability is to measure the uptake of a liquid by cubes of wood using the dipping method (submerging the samples in a liquid and removing them after a set time). Based on Sugiyanto (2003), there are no significant uptake differences between 1 and 2 h soaking time. Preliminary experiments were conducted which confirmed this finding. Therefore, 1 h soaking time was used in this study. Experiments with samples of sapwood and heartwood, at two different moisture contents, using three flow directions (longitudinal, tangential, and radial) were conducted separately. The liquid uptake of every sample was measured by placing the wood cube on a balance at different times during submersion in the liquid (0.5, 1, 2, 3, 5, 10, 30, and 60 min). For instance, a cube was submerged in a liquid, and after the first 30 s it was removed and weighed. Similarly, after 1, 2, 3, 5, 10, 30, and 60 min, the sample was removed and weighed. The liquid uptake was measured against time because different periods of time indicate different absorption rates of the sample. When the experimentation was complete, the cubes were oven-dried at 102 °C to a constant weight and then the moisture content was calculated at the time of tests. The weight of the silicone was ignored.
The percentage uptake of liquid was used to measure the absorption (Eq. 1). It was assumed that the weight only changed during liquid soaking due to the absorption of the liquid into the void volume of the wood. The maximum possible absorption of each specimen was calculated as a percentage of void volume filled (saturation) (Sugiyanto, 2003),
S, % = 100 x (U1/F2) (1)
Flow directions Aspect of the sections
Transverse Tangential - Longitudinal Radial - Longitudinal TS1 TS2 TL1 TL2 RL1 RL2
Longitudinal Radial
Tangential
TSTS1
TL1
TL2 RL1
RL2

Natural resources and bioeconomy studies 80/2017
199
Where S is a percentage saturation or percentage of uptake (%), U1 is an initial liquid uptake (kg/m3), Fr is maximum possible absorption of liquid (kg/m3) = F×Dr, F is maximum possible absorption of water, (L/m3) = 1000-(Dw(MC+66.7)/100), Dr is density of liquid (kg/L), Dw is basic density of wood (kg/m3), and MC is moisture content (%).
Statistical analysis 2.3.GENSTAT 16th Edition was used in the statistical evaluation of the data. Analysis of variance was conducted on the percentage of liquid uptake at 60 minutes, with the four factors being moisture content (dry, green), part of wood (sapwood, heartwood), direction (longitudinal, tangential, radial), and dye solution (1-4). Factor effects were considered significant if the P-value was less than 0.05. Least significant difference (LSD) values at P = 0.05 were used to estimate variability between means of 12 samples per each combination of factors.
Results and discussion 3.
Uptake of different dye solutions in different directions 3.1.The results highlight the descending order of the liquid absorption: longitudinal > radial > tangential (Table 3). As expected, the permeability of dried samples was higher than green samples, and sapwood samples were more permeable than heartwoods.
The descending order of the dye solutions in relation to the dye absorption could be expressed as 4 ≥ 3 > 2 ≥ 1. The effect of solution was highly significant (P < 0.001), and it was not involved in any
significant interactions with the other factors. When averaged across the other factors, the means of the percentage of liquid uptake at 60 min were 3.35 (solution 1), 3.62 (solution 2), 4.02 (solution 3), and 4.09 (solution 4) (LSD = 0.28). Therefore, solutions 3 and 4 resulted in significantly greater dye absorption than solutions 1 and 2.
The movement of fluids through wood was the easiest along the grain. Therefore, longitudinal permeability for the dye uptake was much greater than the other directions. These results are different than the findings by Siau (1984), who stated that the longitudinal permeability of several hardwoods increased with higher moisture content, presumably due to a greater fractional volume of the vessels. However, the data showed that the tested wood samples above the fiber saturation point had very low dye absorption. A possible explanation for this tendency was that high capillary pressures must be overcome to force air bubbles through the pit openings (Siau, 1984).
The results of this study indicated that there was little difference between the dye absorption in radial and tangential directions. The contribution of the rays to the radial permeability of hardwoods is almost equal to that in the tangential direction, resulting from the pits on the radial surfaces of the fibers (Siau, 1984).

Natural resources and bioeconomy studies 80/2017
200
Table 3. The mean dye uptake of dye solutions calculated for the sapwood and heartwood parts of green and dried specimens in the longitudinal, tangential, and radial directions.
Samples Dye solutions Percentage of uptake in directions, %
Longitudinal Tangential Radial
Dried sapwood
1 7.34 2.88 3.66 2 7.63 3.30 3.84 3 8.05 3.67 3.95 4 8.69 3.92 4.53
Dried heartwood
1 5.74 2.06 2.62 2 6.01 2.67 2.68 3 6.22 2.71 2.95 4 6.45 2.73 2.97
Green sapwood
1 4.86 2.05 2.24 2 5.19 2.20 3.03 3 5.25 2.94 3.18 4 5.28 2.95 3.21
Green heartwood
1 3.76 1.27 1.36 2 3.78 1.38 1.73 3 4.13 1.50 2.63 4 4.19 1.53 2.67
Dye uptake in heartwood and sapwood 3.2.There are differences between the permeability of the heartwood and the sapwood in the treatment of timber, with sapwood being easier to treat than heartwood. In sapwood, penetration is primarily through the open vessels, then through rays, vertical parenchyma, and fibers through pit pairs. In heartwood, some of the vessels are closed by tyloses. In heartwood, the membrane surfaces are usually completely occluded when viewed as replicas in a transmission electron microscope, while in sapwood, the surfaces are always less occluded. When sapwood is transformed into heartwood, there are a number of structural changes that decrease permeability (Comstock, 1965). This is due to the closure of pits and the presence of tyloses and extractives. In hardwoods, the presence of tyloses decreases the permeability as it obstructs the main pathway in hardwoods. In many hardwood species, the vessels in the heartwood of the living trees are blocked off by tyloses, which sapwood lacks (Booker, 1977). The low permeability of heartwood is also due to the presence of extractives. Extractives increase the contact angle between aqueous liquids and the cell walls, which reduces wettability compared with sapwood (Hansmann et al., 2002). However, this paper does not include the analysis of the relationship between anatomical structure and the permeability of wood.

Natural resources and bioeconomy studies 80/2017
201
Dye uptake in relation to time 3.3.
Figure 3. The percentage of dye uptake of dried sapwood and heartwood samples at different test period using 4 types of dye solutions in longitudinal, tangential and radial direction.
The dye absorption (% of dye uptake) in the longitudinal direction of all dried specimens had a significant increase from the first set time to 1 h (Figure 3). In terms of dried sapwood in the longitudinal direction, the percentage of uptake reached 8.69%, compared to 6.22% for dried heartwood. This trend decreased in radial and tangential directions. The samples treated using solution 4 had a higher percentage of uptake than the other dye solutions.
The data (Figure 3) also shows the measured percentage of dye uptake of dried sapwood and heartwood samples in the three directions with four different dye solutions. Longitudinally, the percentage of liquid uptake was increased from 7.34% to 8.69% for sapwood and 5.74% to 6.45% for heartwood with the dye solutions 1 and 4, respectively. The longitudinal uptake was almost 100% higher than the radial and tangential directions in both the sapwood and heartwood of the species. There were similar trends in the percentage of dye uptake in the tangential and radial directions with the different solutions.

Natural resources and bioeconomy studies 80/2017
202
Figure 4. The percentage of dye uptake of green sapwood and heartwood samples at different test period using 4 types of dye solutions in longitudinal, tangential and radial direction.
The trend in the percentage of dye uptake in the three directions of all green specimens was similar to that of dried samples (Figure 4).
In the longitudinal direction, the percentage of dye uptake was increased slowly from 4.86% to 5.28% in sapwood and from 3.76% to 4.19% in heartwood with the dye solutions of 1 and 4, respectively.
Conclusions 4.1. The percentage of dye uptake in sapwoods was higher than in heartwoods in dried and
green specimens. 2. The green samples of the species showed lower dye uptake in all directions. 3. The descending order of percentage of uptake was longitudinal > radial > tangential. 4. The descending order of the four different dye solutions used as 4 ≥ 3 > 2 ≥ 1. The longitudinal uptake was also approximately 100% higher than the radial and tangential
directions in both green sapwood and heartwood of the species for all different solutions used. This result has significant implications on the veneer dyeing process where the dye penetration through the veneer thickness will be in radial direction.
The results indicated that solutions 3 and 4 achieved significantly greater dye absorption than solutions 1 and 2. The indication means that the addition of sodium hydroxide and triton X100 can
Natural resources and bioeconomy studies 80/2017
203
increase the swelling of the cellulose fibers in the wood structure in order to improve the dye penetration. This information is very important in understanding the dye solutions in relation to the addition of the chemical agents, which can be applied in the veneer dyeing study.
Overall, the dye uptake using soaking method was not high. Therefore, the soaking method for veneer dyeing may not be suitable. A study should be undertaken to investigate the suitability of soaking method for veneer dyeing; if not successful, an alternative method such as vacuum-pressure should be examined.
Acknowledgments The authors are grateful for the support of the Australian Centre for International Agricultural Research (ACIAR), the University of Melbourne, School of Ecosystem and Forest Sciences, and RMIT University, School of Fashion and Textiles. Australian Bluegum Plantations of Victoria also are acknowledged for providing the plantation resource, assistance with labour and equipment and access to the trial site. The authors are indebted to Mr. Philip Blackwell (Honorary member of the University of Melbourne) for his great help in the specimen preparation and guidance.
References LPI. (2014). Production of multilaminar veneer [Image] (n.d.). Retrieved from
http://www.alpiwood.com/en/Production_process Booker, R. (1977). Problems in the measurement of longitudinal sapwood permeability and hydraulic
conductivity. New Zealand Journal of Forestry Science, 7(3), 297-306. Choong, E., Achmadi, S., & Tesoro, F. (1989). Variables affecting the longitudinal flow of gas in
hardwoods. Cellulose and Wood-Chemistry and Technology, 1175-1196. Comstock, G. L. (1965). Longitudinal permeability of green eastern hemlock. Forest Products Journal,
15(10), 441-449. Hansmann, C., Gindl, W., Wimmer, R., & Teischinger, A. (2002). Permeability of wood - A review. McGavin, R. L., Bailleres, H., Hamilton, M., Blackburn, D., Vega, M., & Ozarska, B. (2015). Variation in
Rotary Veneer Recovery from Australian Plantation Eucalyptus globulus and Eucalyptus nitens. BioResources, 10(1), 313-329.
Siau, J. F. (1984). Transport processes in wood: Springer. Sugiyanto, K. (2003). Modification of Oil Palm Stem Properties Using Microwave Technology. University
of Melbourne, Institute of Land and Food Resources

Natural resources and bioeconomy studies 80/2017
204
Black oak wood for furniture application using a special heat pressure steaming process
Tillmann Meints1*, Florian Burgstaller2, Christian Hansmann1
Abstract
For long time designers of wood furniture and interior demand darker European wood species/colours. If you want to avoid the use of chemicals or additives it is possible to achieve darker wood colours by classical thermal modification. However, when aiming a nearly black wood colour, this process has limits, since it leads to strong mechanical decrease and can come along with unacceptable odours or VOC emissions. Especially oak wood is challenging in terms of wood modification. To prevent damage/cracks during the treatment, steaming processes at elevated temperatures were investigated. Using an autoclave as reactor, it was able on the one hand to generate a very dark oak wood colour, and on the other hand to design a reasonably short process time. During the process development, secondary requirements needed to be fulfilled. Even though macroscopically damage (cracks) could be prevented, the mechanically wood structure needed to be kept intact, to use the wood for furniture production. Additionally, the emission needed to be reduced regarding regulations and customer demands. Using an attenuated heating phase in combination with advanced elutriation steps it was possible to preserve sufficient mechanical properties and to fulfil the requirements for the VOC emission. After facile oil application the colour of the manufactured furniture surface appears nearly black. Finally, a process was developed that does not need any additives to generate an almost black oak wood colour using heat, steam and pressure exclusively.
Introduction 1.The benefits and disadvantages of thermal treated woods are broadly known and accepted. Because of that – especially cause of the odour and in relation to that the VOC emissions – strongly treated thermal woods are rarely found in indoor applications. However, furniture industry is strongly interested in local (European) dark or nearly black wood species. Wood modification via heat pressure steaming is a very time efficient way (approximately 1/10 compared to conventional steaming process) to change the colour of wood without additional chemicals (Riehl et al. 2002). Beside the change of colour, also the wood equilibrium moisture content can be reduced, resulting in a better dimensional stability (Stamm et al. 1946). Many publications can be found referring to softwoods in combination with steaming on the one hand and thermal treatment on the other hand (Bekhta and Niemz 2003, Stamm 1956, Stamm et al. 1946). Fewer publications can be found on the topic of explicit heat pressure steaming (HPS) (Dagbro et al. 2010, Riehl et al. 2002, Volkmer et al. 2014). In this study, European oak (Quercus robur/Quercus petraea) was investigated according to its behaviour under heat pressure steaming. Therefore the process parameter temperature, process time and pressure were varied to investigate the factors colour, strength and emissions.
* Corresponding author: Tel.: +4314765489132; E-mail: [email protected]
1Wood K plus - Kompetenzzentrum Holz GmbH
Altenberger Strasse 69, A-4040 Linz, Austria
2Team 7 Natürlich Wohnen Braunauer Str. 26, A-4910 Ried
im Innkreis, Austria
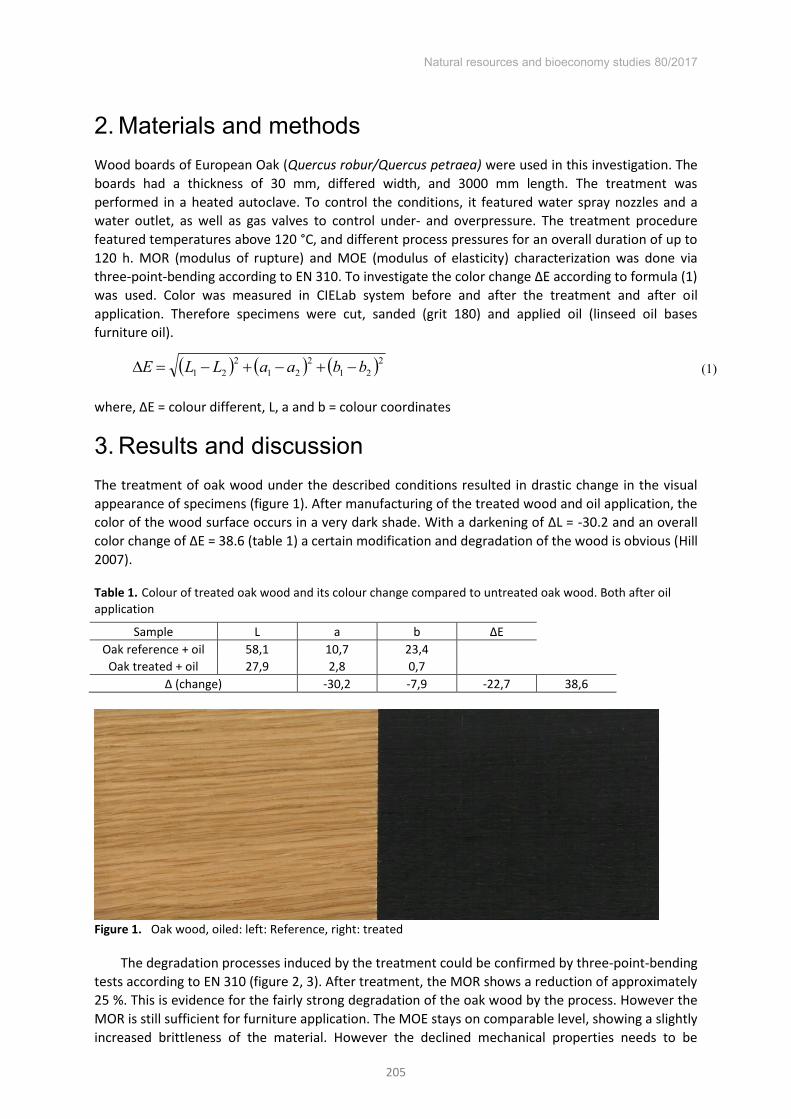
Natural resources and bioeconomy studies 80/2017
205
Materials and methods 2.Wood boards of European Oak (Quercus robur/Quercus petraea) were used in this investigation. The boards had a thickness of 30 mm, differed width, and 3000 mm length. The treatment was performed in a heated autoclave. To control the conditions, it featured water spray nozzles and a water outlet, as well as gas valves to control under- and overpressure. The treatment procedure featured temperatures above 120 °C, and different process pressures for an overall duration of up to 120 h. MOR (modulus of rupture) and MOE (modulus of elasticity) characterization was done via three-point-bending according to EN 310. To investigate the color change ∆E according to formula (1)
was used. Color was measured in CIELab system before and after the treatment and after oil application. Therefore specimens were cut, sanded (grit 180) and applied oil (linseed oil bases furniture oil).
(1)
where, ∆E = colour different, L, a and b = colour coordinates
Results and discussion 3.The treatment of oak wood under the described conditions resulted in drastic change in the visual appearance of specimens (figure 1). After manufacturing of the treated wood and oil application, the color of the wood surface occurs in a very dark shade. With a darkening of ∆L = -30.2 and an overall color change of ∆E = 38.6 (table 1) a certain modification and degradation of the wood is obvious (Hill 2007).
Table 1. Colour of treated oak wood and its colour change compared to untreated oak wood. Both after oil application
Sample L a b ∆E Oak reference + oil 58,1 10,7 23,4
Oak treated + oil 27,9 2,8 0,7 ∆ (change) -30,2 -7,9 -22,7 38,6
Figure 1. Oak wood, oiled: left: Reference, right: treated
The degradation processes induced by the treatment could be confirmed by three-point-bending tests according to EN 310 (figure 2, 3). After treatment, the MOR shows a reduction of approximately 25 %. This is evidence for the fairly strong degradation of the oak wood by the process. However the MOR is still sufficient for furniture application. The MOE stays on comparable level, showing a slightly increased brittleness of the material. However the declined mechanical properties needs to be
2212
212
21 bbaaLLE

Natural resources and bioeconomy studies 80/2017
206
accepted, since the degradation products cause the dark color, which is the main target of the treatment process.
Figure 2. MOR (modulus of rupture)
Figure 3. MOE (modulus of elasticity)
The national Austrian certificate “Österreichisches Umweltzeichen” demands certain VOC high-values. Due to optimization of the process parameters, the amount of VOC (volatile organic compounds) could be drastically reduced. A preliminary TVOC (total volatile organic compounds) investigation indicated that in the latest process development, emissions could be reduced sufficiently to fit the certificate requirements (figure 4). Compared to an early stage process, the emissions were reduced to very low amounts of around 250 µg/m³ at day 28 (benchmark: 400 µg/m³). Instead of the known odor of thermal treated wood, caused by volatile acetic acid and furfural, nearly no unwanted odor is detectable for the human olfaction. This step of development is the key to provide raw material for high quality furniture production.

Natural resources and bioeconomy studies 80/2017
207
Figure 4. TVOC emission trend for 28 days
Conclusion 4.Finally, a process was designed that enables the modification of natural oak wood color into a very dark color – through the whole cross section. After oil application, the surface appears nearly black, comparable to tropical wood species. Furthermore, the modified material features sufficient mechanically strength and pleasant odor, not comparable to classical TMT “smell”. Since the process
does not involve any additional chemicals, it follows the idea of pure and natural wooden furniture from local (central European) forest sources.
References Bekhta, P. and P. Niemz 2003. Effect of high temperature on the change in color, dimensional stability
and mechanical properties of spruce wood Holzforschung 57:539-546 Dagbro, O., P. Torniainen, O. Karlsson, T. Morén 2010 Colour responses from wood, thermally modified
in superheated steam and pressurized steam atmospheres Wood Material Science and Engineering 5:211-219
EN 310:1993 Wood-based panels; Determination of modulus of elasticity in bending and of bending strength
Hill, C.A. 2007 Wood modification: chemical, thermal and other processes vol 5. John Wiley & Sons. doi:10.1002/0470021748.ch2
Riehl, T., J. Welling, A. Frühwald 2002 Pressure steaming of sawn timber - Druckdämpfen von Schnittholz. University of Hamburg, Hamburg
Stamm, A.J., 1956 Thermal degradation of wood and cellulose Ind Eng Chem 48:413-417 Stamm, A.J., H.K. Burr, A.A. Kline 1946 Staybwood—heat-stabilized wood Industrial & Engineering
Chemistry 38:630-634 Volkmer, T., R. Moser, T. Lorenz, U. von Arx, P. Hass, P. Niemz 2014 Influence of heat-pressure-
steaming on visual appearance and emissions - Einfluss des Hitze‐Druck‐Dämpfens auf das optische Erscheinungsbild und das Emissionsverhalten von Eichenholz Bauphysik 36:80-86

Natural resources and bioeconomy studies 80/2017
208
Cross laminated timber made from large-leaf beech: Production, characterization and testing
Gatien Geraud Essoua Essoua*, Pierre Blanchet
Department of wood and forest, Université Laval, G1V 0A6, 2325 Rue de l’Université, Québec, QC, Canada and
CIRCERB Industrial Research Chair on Ecoresponsible Wood construction Université Laval, G1V 0A6, 2325 Rue de l’Université, Québec, QC, Canada
Abstract
Normally, cross laminated timber (CLT) is made from softwood. In Canada, the most important wood specie is black spruce (Picea mariana M.). In the province of Québec, to create value added for the beech wood volume available, CLT presents an interesting opportunity. With the aim to investigate the feasibility of CLT production from large leaf beech wood, this study was conducted. Large leaf beech (Fagus grandifolia Ehrh.) specimens were glued with different polyurethane adhesives. Black spruce wood specimens were used as reference to compare results. In order to qualify using of large leaf beech in CLT product, laminated glued and glued laminated timber were produced and tested. Block shear and delamination tests were performed. Results obtained were interesting and many averages values are up to the values indicated in the standard considered.
Introduction 1.Wood material is one of the oldest building materials. It contributes greatly to the human development. The coming of concrete, steel, alumina and other materials in building sector, offer concurrence and causes, decreasing of using wood material in the past. In the last decades, with the climate changes question and the sustainable management of the renewable resources, materials like wood are receiving increasing interest. Now there is a global competition about height wood building. In this field, CLT product is used. Generally built by softwood, in the last few years, researchers are trying to introduce hardwood in the CLT production (Gagnon and Pirvu 2011). With the hardwood production decreases in Quebec province, it’s necessary to give value to underutilized
hardwood species (MFFP 2014) Not much research has been carried out on the CLT hardwood subject. . Using hybrid wood
species to produce CLT was evaluated. Combination of softwood and hardwood in CLT production was carried out by Aicher et al. (2016). Different hardwood species have been considered in the laboratory research to produce glulam or CLT. In order to introduce hardwood in glulam or CLT products, Paricá (Schizolobium amazonicum Herb), Lyptus wood species (Eucalyptus grandis, W. H. and Eucalyptus urophylla, S.T.B ), European beech (Fagus sylvatica, L.) and Chestnut (Castanea sativa, M.) were used (De Almeida et al. 2014).
In southern of Quebec, beech cortical disease forces quick harvest of volumes available and makes it is necessary to find solutions to maximize the value of this wood species (Bernard et al. 2015). In response to this situation, CLT production was chosen as a solution. The significant potential of CLT represents an interesting commercial opportunity. In this work, two different wood species have been considered: Black spruce and large leaf beech of Quebec.
* Corresponding author: Tel.: +14186562131; E-mail: [email protected]

Natural resources and bioeconomy studies 80/2017
209
Materials and methods 2.
Materials. 2.1.The wood species used were Black spruce (B. spruce) and large leaf beech (L. L. beech). Wood materials were bought from Bois Delta a wood retailer in Quebec City. Structural polyurethane adhesives were used. The adhesive was Purbond GT20 with Loctite GT 205 as hardener and Loctite VN 3134. Adhesives were supplied by Henkel Corporation.
Methods 2.2.
2.2.1. Wood specimens’ preparation For each wood specie, planks were selected free of knots, resin pockets and any other defects. Two types of surfaces preparation were chosen: sanded surfaces using 80 grit sandpaper and helicoidal planed surfaces. The specimens were prepared and conditioned at 20±2°C and 60±4% relative humidity (RH). Dimensions of wood specimens were selected according to the standards used in this study. Table 1 shows the specimens dimensions used for each test.
Table 1. Wood specimens’ dimensions
Test Dimensions (mm) Product Standard Block shear 50.8 x 50.8 x38 Laminated glued ASTM D905-08
Delamination 75 x 75 x 67 Glued laminated timber CSA 0177-06 Block shear 75 x 75 x 67 Glued laminated timber CSA 0177-06
2.2.2. Wood specimens swelling and shrinkage The hydrophilicity property of wood is very important for the glued wood products. It affects the swelling and shrinkage of wood material. These two parameters, can affect the gluing durability, if the wood species had great swelling and shrinkage values. Before measuring the swelling and shrinkage of wood, the specimens were oven dried at 103±2 °C until mass balance. The tests were performed accordingly to ISO 4859-1982 and 4469-1981 respectively.
2.2.3. Wood gluing One-component polyurethane adhesives were used. Adhesives application was performed according to the technical sheets provided by producer (Table 2). Adhesive Loctite VN 3134 (LT) was applied directly after container agitation while adhesive purbond GT 20 was mix with hardener (GT) before applied on the wood surface. To ensure uniform adhesive thickness on the wood surfaces, threaded rod was used to distribute the glue.
Table 2. Adhesives information
Data LOCTITE VN3134 Purbond GT20 Fabricant Purbond Purbond
Grammage 100-180 g/m2 200-550 g/m2 Teneur en humidité du bois 9 à 12% 8 à 12%
Temps d’assemblage 70 minutes 60 minutes Temps de pressage 175 minutes 150 minutes
Pression 200 psi 200 psi Viscosity 5000 mPa.s (22 °C) Rabotage Max. 24h avant l’application Max. 24h avant l’application

Natural resources and bioeconomy studies 80/2017
210
2.2.4. Block shear and delamination tests To test the glue lines, for different surfaces qualities, a block shear test was performed according to the ASTM standard D905-08. Before the test, each block was prepared as presented in Figure 1 (A). Based on results, information regarding the best surface quality and the best adhesive for each wood species were obtained. Tests were performed using a Material Testing System: Alliance RT/50 KN (MTS, USA). For the glued laminated timber, block shear test was performed using an Alliance RT/500 KN (MTS, USA), Figure 1 (B). According to the CSA standard 0177-06 (Reapproved 2015) block shear and delamination tests were performed
Figure 1. (A. left)) Block preparation and (B, right) material testing system
Results and discussion 3.
Swelling and shrinkage tests 3.1.Results presented in Figure 2 show the volumetric swelling and shrinkage of both wood species. Volumetric swelling of beech is 7,48% higher than spruce. Regarding volumetric shrinkage, beech shrinkage is 4,20% more than spruce. These average values are different than those present in the literature. Peck (1957) presented the volumetric shrinkage from fibers saturation point to anhydride of B. spruce and L. L. beech at 11,3% and 16,3% respectively. The difference of average values between literature and this study, explains the importance to analyze the specific wood species used.
Figure 2. Average value of swelling and skrinkage test
Block shear test 3.2.After gluing, specimens were conditioned and the glue lines were tested. As presented in Figure 3 (A), load applied to shear specimens glued with LT adhesive is less than the one applied in the case of

Natural resources and bioeconomy studies 80/2017
211
specimens glued with GT in the same wood species. Load variation is high for beech than spruce. Surface quality and adhesive viscosity influence greatly the gluing quality. Planed surface and GT adhesive present high load values than sanded surface with the same adhesive for beech wood specimens.
Analysis of wood failure showed the spruce as a specie that can be glued very easily compared to beech with both polyurethane adhesives. Wood failure in spruce specimens was 73% higher. In the case of beech specimens, Purbond GT adhesive presented better results. For the beech specimens glued with Purbond LT, all failures occurred in the glue line (Figure 3 (B)).
Figure 3. Average load applied in the block shear test (A, left) and Average value of wood fibers failure by visuel analysis (B, right)
Glued laminated timber test 3.3.For the block shear test with the laminated glued specimens, different parameters were taken into account. Specifically, two surfaces qualities (sanded and planed) and two polyurethane adhesives (GT and LT). The results obtained in Figure 3, permit to exclude sanded surface and LT adhesive for the next step. Glued laminated timber was prepared with two parameters. Planed wood surfaces and Purbond GT adhesive were used. Shear test and wood fibers failure analysis were performed. As presented in Figure 4 (A), specimen failure was in the wood structure with average values at 100% and 95,65% for spruce and beech respectively. Percentage values obtained are up to 80%, acceptable limit value indicates in the CSA standard 0177-06.
Delamination test performed by 2 soaking-drying cycles, accordingly to CSA standard 0177-06, presented interesting results (Figure 4 (B)). Average delamination values were less than reference percentage value (10%) indicates in the same standard. Delamination of glue lines increased greatly from the first to the second soaking-drying cycle. It was 6,6% and 4% for beech and spruce wood species respectively.
2234
9
2093
3
2114
5
1731
8
3006
2
2551
8 3563
7
1937
5
GT LT GT LT
Sanded Planed
Ave
rage
load
(N)
Surface quality and adhesives types
B. spruce L. L. beech
95
73
99
75
60
3
74
1
GT LT GT LT
Sanded Planed
Woo
d fa
ilure
(%)
Surface quality and adhesives types
B. spruce L. L. beech

Natural resources and bioeconomy studies 80/2017
212
Figure 4. Visual analysis of wood failure surfaces (A, left) and delamination test (B, right) for glued laminated timber.
Conclusions 4.Investigation of using large leaf beech in CLT production is ongoing. Results obtained in the glued laminated timber, suggested that the large leaf beech wood species can be used in CLT product despite the high level of swelling and shrinkage. The next step, CLT production and testing with the same wood species and adhesive will confirm this feasibility.
The development of this structural product is a real opportunity for the structural wood products industry. It will create added value, not only for the local raw material using, but also a new product of wood for the construction market always more demanding.
References
Aicher, S., Hirsch, M. and Christian, Z. 2016. Hybrid cross-laminated timber plates with beech wood cross-layers. Construction and Building Materials. 124 (2016): pp. 1007–1018.
ASTM D905. 2008. Standard Test Method for Strength Properties of Adhesive Bonds in Shear by Compression Loading. West Conshohocken, PA: American Society of Testing Materials.
Bernard, A., Gélinas, N., Durocher, C., Duchateau, E. and Achim, A. 2015. Is wood from American beech visually appealing? A stakeholder’s perspective. ISCHP 2015, Québec-Cnada
CSA. 2011. CAN/CSA-O177-06. Qualification code for manufacturers of structural glued-laminated timber Etobicoke, Ontario: Association canadienne de normalisation.
De Almeida, D. H., Cavalheiro,R. S., De Macêdo, L. B., Neto, C. C., Christoforo, A. L., Carlito, C. J. and Lahr, F. A. R. 2014. Evaluation of Quality in the Adhesion of Glued Laminated Timber (Glulam) of Paricá and Lyptus Wood Species. International Journal of Materials Engineering. 4(3): pp. 114-118.
Gagnon, S.; Pirvu, C. 2011. Manuel sur le bois lamellé-croisé. Québec: FPInnovations. International Organisation for Standardisation. 1982. “ISO 4859 Wood – Determination of radial and
tangential swelling,” ISO, first edition, 1214 Vernier, Geneva, Switzerland. International Organisation for Standardisation. 1981. “ISO 4469 Wood – Determination of radial and
tangential shrinkage,” ISO, first edition, 1214 Vernier, Geneva, Switzerland. MFFP. 2014. Plan spécial d'aménagement UA 07151, 07251, 07351 - Maladie corticale du hêtre.
Gatineau. ftp://ftp.mrn.gouv.qc.ca/Public/Reg07/2015/Plan_special_HEG/PL_special_HEG_V1_20141110.pdf
Peck, E. C. 1957. How Wood Shrinks and Swells. Forest Products Journal. 7 (7): pp. 235-244
100
95,6
2 80
85
90
95
100
105
110
B. spruce L. L. beech
Woo
d fa
ilure
(%)
Wood species
B. spruce L. L. beech
0
4,1
0,5
7,1
012345678
B. spruce L. L. beech
Ave
rage
del
amin
atio
n va
lues
(%
)
Wood species
First soaking-drying cycle
Second soaking-drying cycle

Natural resources and bioeconomy studies 80/2017
213
The impact of log heating on veneer quality and plywood performance
Anti Rohumaa1*, Christopher G. Hunt2, Charles R. Frihart2, Jaan Kers3, Louis Denaud1, Mark Hughes4
Abstract
In veneer-based products manufacture, logs are commonly heated to soften the wood material prior to peeling. At a higher heating temperature, veneer properties like lathe checking and surface roughness generally decrease, but the literature has shown no clear effect of these changes on bond quality. One of the reasons could be that the evaluation methods used for roughness are not able to detect the depth of lathe checks or the integrity of the surface, which probably have a significant effect on bonding quality. In the present study silver birch (Betula pendula Roth) logs were used to prepare the veneer and a liquid phenol-formaldehyde (PF) resin was used in the bonding process. Lathe check depth, surface roughness, surface integrity and plywood bond strength were evaluated. This study indicated that the heating of the logs not only softened the wood during peeling, but also causes irreversible changes in the wood material which subsequently effects plywood bond strength development. During plywood bond testing according to SFS-EN 314, deep lathe checks in veneer significantly reduced the shear strength of PF bonded plywood, even though these checks are not mentioned in the standard. These findings not only confirm the importance of minimizing the depth of lathe checks for product quality, but also demonstrate how check depth could influence a test (SFS-EN 314) which was designed mainly for testing adhesive properties and evaluate adhesive cure.
Introduction 1.In veneer-based product manufacture, the logs are commonly heated to soften the wood prior to peeling (Marchal et al. 2009, Dupleix et al. 2013) and to obtain smoother veneer with minimised severity of lathe checks (Dupleix et al. 2013). The formation of lathe checks during peeling has been well studied (Denaud et al. 2007, Tomppo et al. 2009, Pałubicki et al. 2010, Denaud et al. 2012,
Dupleix et al. 2013, Antikainen et al. 2015, Darmawan et al. 2015, Pot et al. 2015). The literature shows that at higher peeling temperature the formation of deep lathe checks are reduced (Dupleix et al. 2013, Rohumaa et al. 2016a), which is beneficial since shallower checks are less detrimental to veneer strength perpendicular to the grain (Kontinen et al. 1992). However, several researchers have noticed that lathe checks also affect bond quality (Chow 1974, Neese et al. 2004, DeVallance et al. 2006, Rohumaa et al. 2013), but due to a lack of knowledge and consensus it is not clear how, and to what extent, the checks affect bonding quality.
Generally, it has been shown that the veneer surface characteristics correlate with adhesive bond quality. For example, the roughness of wood has frequently been used as a parameter to predict adhesive bond quality (Aydin 2004, DeVallance et al. 2007). However, the measurement of the true roughness taking part in bonding is ambiguous (Baldan 2012) and this is probably also the reason why in the available literature contradictions can be found on the effect of roughness in the
* Corresponding author: Tel.: +358415174661; E-mail: [email protected]
1 LaBoMaP, Ecole Nationale Supérieure
d'Arts et Métiers, Cluny, 71250, France
4Department of Bioproducts and
Biosystems, Aalto University, Espoo,
02150 Finland
2US Forest Service, Forest Products
Laboratory, Madison, WI 53726, USA
3Department of Material and Environmental Technology, Tallinn
University of Technology, Tallinn
19086 Estonia

Natural resources and bioeconomy studies 80/2017
214
bonding process. It is generally known that surfaces that are too rough can be detrimental, where the adhesive cannot make intimate contact with the wood surface (Marra 1992). However, the real magnitude of the roughness affecting bonding is not properly defined.
The main methods used today to evaluate surface roughness are based on stylus or laser displacement sensors (Sandak et al. 2004, Sandak and Negri 2005). These methods are based on a single roughness profile and cannot always adequately characterize the true surface roughness of veneer taking part in bonding since the parameters of lathe checks (depth and angle) cannot be measured with traditional surface roughness evaluation methods. Unfortunately, there are no surface roughness measurement techniques available which include the effect of lathe checks in bonding.
The bonding quality of plywood can be evaluated by testing saw kerfed specimens according the European standard SFS-EN 314. In this standard, percent wood failure (PWF) and shear strength are used in the assessment of bond quality. Generally, if the adhesive bond fails in the wood, it will most likely be accepted. It has also been shown that in testing according to EN 314, the results differ depending on whether the checks are pulled open or closed (Rohumaa et al. 2013). It has been reported that the shear strength of plywood with the checks pulled closed results in higher strength values than when the checks are pulled open, however, the magnitude of the strength difference varies from 14 up to 94% (Bethel and Huffman 1950, Koch 1965, Chow 1974, DeVallance et al. 2006). The variation in strength might be due to check depth, but in most published reports, the depth of checks is not measured or presented.
The aim of this study is to understand the effect of soaking on veneer quality and to evaluate the effect of lathe checks in bonding process.
Materials and methods 2.
Wood material 2.1.Two freshly felled birch trees were sectioned into 6 logs nominally 1.2 m in length and completely immersed in water tanks heated to either 20ºC or 70ºC for 48h, or 70ºC for 48h followed by cooling until the core temperature reached 20ºC. From each tree the logs were selected for both soaking temperature in order to decrease the variability caused by raw material variation. Then the logs were rotary cut on an industrial scale laboratory lathe (cutting speed 100 m min-1, knife bevel angle 21°, compression rate 10%) manufactured by the Raute Corporation (Model 3HV66; Raute Oyj, Lahti, Finland) into veneer. The veneer was visually inspected and specimens were cut from the veneer ribbon with dimensions of approx. 900 mm by 400 mm, free from obvious defects such as knots or sloping grain. The veneers were subsequently dried at 160ºC in a laboratory scale veneer dryer (Raute Oyj, Lahti Finland) to achieve an average MC of 6%.
Veneer quality evaluation 2.2.A Mitutoyo Surftest 402 was used to evaluate the roughness of the veneer surface across the veneer grain. In the roughness measurements the cut-off length was 2.5 mm, sampling length was 12.5 mm and the detector tip radius was 5 μm. Roughness parameters Ra, Rmax and Rz were obtained (SFS-EN ISO4288 1998).
Prior to bonding quality testing, the checks depths of each SFS-EN 314-1 (2005) test specimen were measured in the region where failure would occur. All plywood specimens were treated with the textile dye on one side of the test specimen (SFS-EN 314). The depths of all checks occurring between the saw kerfs were measured and the average check depth was calculated for each
Natural resources and bioeconomy studies 80/2017
215
specimen. This method was developed and used by Rohumaa et al. (2013). The method significantly improves the correlation between the bonding strength of plywood and lathe check depth.
The integrity of the veneer surface was evaluated with a Huygen internal bond tester (model 1314, Huygen Corporation, Wauconda, IL USA), which is commonly used to produce a high speed Z-direction rupture in paper and paperboard. In this study, the veneer was fixed between a stainless steel sample base and an aluminum angle using double-sided tape (P-02, Nitto Denko Corporation, Osaka Japan) by applying a constant pressure of 0.12 MPa for 5 s. After pressing, a pendulum, held in a horizontal position by an electro-magnet was released. The pendulum striking the vertical leg of the aluminium angle separated the tape from the veneer and allowed observation to be made of the attached wood particles on the tape surface. The method is described in detail by Rohumaa et al. (2016a).
Adhesive, bonding process and bond quality 2.3.In the present study a liquid phenol-formaldehyde (PF) resin (Prefere 14J021, Prefere Resins Finland Oy, Hamina, Finland) with 49% solids content was used as the adhesive.
Two different methods were used to evaluate bonding quality, the automated bonding evaluation system (ABES) and EN-314. In ABES testing, matched specimens, 20 x 117 mm2, were cut from the conditioned veneer sheets. For bonding, the resin was applied by a micropipette (HandyStep electronic, BRAND GMBH + CO KG, Wertheim, Germany) to an area of 5 x 20 mm2 at one end of the veneer specimens to give a resin spread rate of ~100 g m-2. After adhesive application, the veneer-resin assembly was placed in the ABES equipment (Adhesive Evaluation Systems, Inc., Corvallis, Oregon, USA) and hot pressing started immediately. Shear strength was measured after various pressing times ranging from 20 to 180 s. The platen temperature was 130°C and press pressure was 2.0 MPa. In total 400 specimens were prepared and at least 7 parallel samples were measured in each bonding group.
For testing according EN-314, the plywood was bonded with the same PF resin, with a spread rate of 155 g m-2. The 7-ply plywood was produced in a laboratory hot press. After lay-up, the panels were pre-pressed for 8 min at 0.8 MPa prior to hot pressing. The hot press time was 7 min, the platen temperature 128°C and press pressure 1.8 MPa. In this study 18 panels were produced with dimensions 400 x 400 mm2. Following hot pressing, the panels were hot stacked and finally conditioned at 20°C and 65% RH for one week prior to machining the specimens. In total 120 bonding quality specimens were produced according to SFS-EN 314-1 (2005) and plywood bonding quality was evaluated using the standard SFS-EN 314-2 (1993).
Results and discussion 3.
Lathe check depth and failure of plywood 3.1.The results show that the lathe checks depth (LCD) has a strong influence on the bonding quality of plywood. When the checks were pulled open (Figure 1b), shear strength dropped by approximately 40% when the check depth increased from 40 to 80% (Figure 1c).

Natural resources and bioeconomy studies 80/2017
216
Figure 1. Representative plywood specimens and evaluation results tested according to SFS-EN 314. a) Deep lathe checks pulled closed. b) Deep lathe checks pulled open. On both a) and b), upper and lower images represent matching fracture surfaces and the middle image represents a side view of test specimens. The arrows in diagram show the direction of applied force (F). c) Shear strength values of plywood tested according SFS-EN 314-2 with checks pulled open and closed (adapted from Rohumaa et al. 2013). d) Relationship between lathe check depth and percent wood failure.
When the checks were pulled closed (Figure 1a), limited strength loss was noted over the same interval of lathe check depth (Figure 1c). As shown in Figure 1c, the strength difference observed in the different pulling modes is mainly affected by the depth of the checks and the shallower the checks, the smaller the difference between the open and closed pulling modes.
Rohumaa et al. (2013) showed that specimens pulled closed fail primarily due to global in-plane shear, resulting from the propagation of fracture within the veneer itself. Therefore it is not surprising that the observed strength is almost independent of LCD (Figure 1c) when the checks are pulled closed. When checks are pulled open, however, the wood on either side of the check moves in opposite directions (i.e. a shearing action occurs), inducing localized mode I loading conditions at the bondline. This mechanism also explains why shallow lathe checks pulled open approach the value of specimens pulled closed in Figure 1c. Shallower checks are less effective at instigating mode I failure and therefore specimens with shallow checks pulled open behave very much like specimens pulled closed. These results could explain the differences in strength values reported by other researchers (Koch 1965, Chow 1974, DeVallance et al. 2006), who did not measure or record the lathe check depth in their study.
Another criteria commonly used in plywood standard testing to evaluate bonding quality is percent wood failure (PWF). These results clearly show that the PWF is smaller when checks are pulled open, compared to when the checks are pulled closed (Figure 1d). When checks are pulled open, the failure zone moves closer to the adhesive bondline and only a small amount of wood fibers are present in the failure surface (Figure 1b). Samples pulled closed fail mainly along a line delineated by the crack tips of lathe checks (Figure 1a, middle image). In this case, the failure zone is clearly

Natural resources and bioeconomy studies 80/2017
217
further from the bondline, resulting in the higher PWF values. The results also show that there is no correlation between PWF and LCD.
Effect of soaking on veneer and plywood quality 3.2.The LCD was significantly lower in veneer peeled from logs soaked at 70°C, even when the logs soaked at 20°C and 70°C were peeled under the same conditions. As reported by Rohumaa et al. (2013), during plywood bonding quality testing, deep lathe checks can initiate mode I failure. This finding suggests that reducing the LCD by heating logs before peeling could have a direct benefit in terms of plywood strength by minimizing the initiation of bond failure under mode I.
One problem with traditional roughness measurement techniques is their inability to distinguish loosely attached particles from the intact surface. As demonstrated by Rohumaa et al. (2013), adhesive does not always ‘heal’ the checks and may not fully fill them. Thus, lathe checks form potential loci of failure in plywood products and the expected correlation between roughness and bond strength will be weak. Currently, there is no standard procedure available for measuring the integrity of wood surfaces.
To evaluate the role of the loosely attached particles, e.g. lathe checks, on bond quality, an integrity test developed by Rohumaa et al. (2016a) was used. The results show that when tape was pulled off from the loose side of veneer, logs soaked at 20°C (Figure 2a) show much larger wood particles than logs soaked at 70°C (Figure 2b). Moreover, there are twice as many of the smallest particles on the surfaces of veneer produced from logs soaked at 70°C compared to 20°C (Figure 2c). The loose side also had more debris of every size than the tight side. Generally, the particles could be divided to three classes, where Figure 2c shows mainly the smaller particles formed by the disruption of cell wall, the size of these particles are generally less than 0.005 mm2. Large particles (Figure 2d, 2e) are formed by pulling off the weakly attached lathe checks and their size is generally greater than 0.045 mm2.
The smaller number of off-axis, partially attached fibers suggests more brittle wood cleavage on veneer produced from logs soaked at 20°C, compared to the tearing action on veneer at the higher temperature characteristic of ductile failure. This tearing at higher temperature will cause cell wall elements to fail and produce surfaces with a ‘hairy’ structure and larger surface area as described by Rohumaa et al. (2016a). The larger surface available for interaction with the adhesive could potentially yield a stronger bond, especially if the extra surfaces are well connected to the underlying veneer. In contrast, a loose surface could be expected to degrade bond quality.
Whilst it has been shown that the soaking of logs affects many veneer properties (Rohumaa et al. 2016a) and their bonding characteristics (Rohumaa et al. 2014), the mechanism behind the bond strength increase is not fully understood. What makes comprehension of the mechanism more complex is the fact that it is generally not clear what effects soaking has on the wood and the peeling process. On the one hand, soaking raises the temperature of the wood material during peeling and will soften the wood. On the other hand it has been shown that the soaking affects the chemistry of the veneer (Yamamoto et al. 2015). In this light, it is difficult to separate the contributions made to bonding arising simply from the ‘softening’ of the wood during peeling compared to the changes in
the surface physio-chemical properties of the veneer caused by the prior soaking. This might then lead to the misconception that the softening of material during peeling plays the main role in determining veneer quality and bond strength increase.

Natural resources and bioeconomy studies 80/2017
218
Figure 2. Effect of veneer side and soaking temperature on particle size and quantity results from the integrity test. a) and b) Representative images of particles removed from the veneer surfaces. Histograms (c,d,e) showing number of particles in each size range (adapted from Rohumaa et al. (2016a)).
To test this hypothesis, a study was conducted where one set of logs was soaked and peeled at 20C and two other groups of logs were underwent soaking at 70°C prior to peeling, eventually one set of these logs were peeled at 20°C (‘cooled’) and the other at 70°C (‘hot’). In this way it would be
expected that similar chemical changes, brought about by soaking at 70°C, would have occurred in both groups but, due to the different peeling temperatures, the physical properties of the material and its topography would most likely be affected by the material softening that occurs at higher temperature.
Our results show that cooling the logs prior to peeling did not have any effect on the surface roughness, measured by stylus. The roughness parameters are similar on both surfaces previously soaked at 70°C and statistical differences do not exist between the surfaces of veneer which have been peeled after cooling or when hot. The Ra values on the ‘cooled’ and ‘hot’ peeled surfaces are
respectively 9.30 μm and 9.64 μm. The bond strength results show that strength values did drop slightly on veneers which were
peeled from the cooled logs (Figure 3), but the results are still much higher (5.43 MPa) than values for veneers from logs which were soaked and peeled at 20°C, where the average bond strength was only 3.94 MPa after 180 s pressing.
Bond strength development on the cooled surface is closer to the bond strength development on material from logs soaked at 70°C and peeled hot than to the surface which was obtained from wood soaked and peeled at 20°C.

Natural resources and bioeconomy studies 80/2017
219
Figure 3. Effect of log heating and peeling temperature on bond strength development and colour of veneer (adapted from Rohumaa et al. (2016b)).
The results of the study show that the temperature history of a birch log prior to peeling is an important factor which will contribute to veneer properties and bond strength. The results also demonstrate that the peeling temperature has much less effect on bond strength than was expected and that material softening arising from the elevated peeling temperature did not have a remarkable effect on the surface roughness of the tight side of the veneer.
Conclusions 4.The results showed that check depth and pulling direction have a strong influence on the bond strength and percent wood failure of plywood tested according to SFS-EN 314, even though this is a test for adhesive bonding quality and not intended to measure wood quality.
This study also indicated that soaking temperature not only caused the softening of material in the peeling process, but also caused irreversible changes in wood material which subsequently has an effect on bond strength development.
The integrity test showed that large fiber bundles originating from deep lathe checks were easily removed from the loose side of the veneers peeled at low temperature. This finding suggests that reducing the lathe check depth by heating logs before peeling could have a direct benefit in terms of plywood strength by minimizing the initiation of bond failure under mode I.
Finally, to improve bonding quality of plywood the effect of checks should be minimized and the integrity of veneer improved. While measurements of bonding quality of plywood are driven by the uncontrolled effects of peeling such as lathe checks, further development of the understanding of bonding and development of new adhesive concepts will be hindered.
Acknowledgements This study was funded mainly by the Finnish Funding Agency for Innovation (Tekes) and industry (UPM-Kymmene Wood Oy, Tikkurila Oyj, Stora Enso Wood Products Oy and Dynea Chemicals Oy). Also the part of this work was performed thanks to the partnership initiated in a shared public-private laboratory called BOPLI, composed of the three following entities: the Bourgogne Franche-Comté region, the LaBoMaP, and the Society Fernand BRUGERE. The authors would also like to thank the Xylomat Technical Platform from the Xylomat Scientific Network funded by ANR-10-EQPX-16 XYLOFOREST.

Natural resources and bioeconomy studies 80/2017
220
References Antikainen, T., Eskelinen, J., Rohumaa, A., Vainio, T. and Hughes, M. (2015). Simultaneous
measurement of lathe check depth and the grain angle of birch (Betula pendula Roth) veneers using laser trans-illumination imaging. Wood Sci. Technol. 49:591-605.
Aydin, İ. (2004). Activation of wood surfaces for glue bonds by mechanical pre-treatment and its effects on some properties of veneer surfaces and plywood panels. Appl. Surf. Sci. 233:268-274.
Baldan, A. (2012). Adhesion phenomena in bonded joints. Int J Adhes Adhes 38:95-116. Bethel, J.S. and Huffman, J.B. (1950). Influence of lathe checks orientation on plywood shear test
results. Technical Report no. 1 School of Forestry, North Carolina State College, Raleigh. 9 pp. Chow, S. (1974). Lathe-check influence on plywood shear strength. Canadian forest service. Vancouver
BC Information report VP-X-122:24. Darmawan, W., Nandika, D., Massijaya, Y., Kabe, A., Rahayu, I., Denaud, L. and Ozarska, B. (2015).
Lathe check characteristics of fast growing sengon veneers and their effect on LVL glue-bond and bending strength. J. Mater. Process. Technol. 215:181-188.
Denaud, L.E., Bléron, L., Eyma, F. and Marchal, R. (2012). Wood peeling process monitor-ing: a comparison of signal processing methods to estimate veneer average lathe check frequency. European Journal of Wood and Wood Products 70:253-261.
Denaud, L.É, Bléron, L., Ratle, A. and Marchal, R. (2007). Online control of wood peeling process: acoustical and vibratory measurements of lathe checks frequency. Ann. For. Sci. 64:569-575.
DeVallance, D.B., Funck, J.W. and Reeb, J.E. (2007). Douglas-fir plywood gluebond quality as influenced by veneer roughness, lathe checks, and annual ring characteristics. For. Prod. J. 57:21-28.
DeVallance, D.B., Funck, J.W. and Reeb, J.E. (2006). Influence of several preparation con-ditions on Douglas-fir plywood gluebond quality test results. For. Prod. J. 56:47-50.
Dupleix, A., Denaud, L., Bleron, L., Marchal, R. and Hughes, M. (2013). The effect of log heating temperature on the peeling process and veneer quality: beech, birch, and spruce case studies. European Journal of Wood and Wood Products 71:163-171.
Koch, P. (1965). Effects of seven variables on properties of southern pine plywood. Part II, Maximizing wet shear strength. Forest Prod. J. 15:463-465.
Kontinen, P., Kivistö, A., Söyrilä, P. and Usenius, A. (1992). Automation of plywood manu-facturing. VTT Publications 756.
Marchal, R., Mothe, F., Denaud, L., Thibaut, B. and Bleron, L. (2009). Cutting forces in wood machining–Basics and applications in industrial processes. A review COST Action E35 2004–2008: Wood machining–micromechanics and fracture. Holzforschung 63:157-167.
Marra, A.A. (1992). Technology of wood bonding. Van Nostrand Reinhold, New York, NY, USA. 454 pp. Neese, J.L., Reeb, J.E. and Funck, J.W. (2004). Relating traditional surface roughness measures to
gluebond quality in plywood. For. Prod. J. 54:67-73. Pałubicki, B., Marchal, R., Butaud, J., Denaud, L., Bléron, L., Collet, R. and Kowaluk, G. (2010). A
Method of Lathe Checks Measurement; SMOF device and its software. European Journal of Wood and Wood Products 68:151-159.
Pot, G., Denaud, L. and Collet, R. (2015). Numerical study of the influence of veneer lathe checks on the elastic mechanical properties of laminated veneer lumber (LVL) made of beech. Holzforschung 69:337-345.
Rohumaa, A., Hunt, C.G., Hughes, M., Frihart, C.R. and Logren, J. (2013). The influence of lathe check depth and orientation on the bond quality of phenol-formaldehyde bonded birch plywood. Holzforschung, 67(7): 779–786.
Rohumaa, A., Hunt, C.G., Frihart, C.R., Saranpää, P., Ohlmeyer, M. and Hughes, M. (2014). The influence of felling season and log-soaking temperature on the wetting and phenol formaldehyde adhesive bonding characteristics of birch veneer. Holzforschung, 68(8): 965-970.
Rohumaa, A., Antikainen, T., Hunt, C.G., Frihart, C.R. and Hughes, M. (2016a). The influence of log soaking temperature on surface quality and integrity performance of birch (Betula pendula Roth) veneer. Wood Science and Technology, 50(3): 463-474.
Rohumaa, A., Yamamoto, A., Hunt, C.G., Frihart, C.R., Hughes, M. and Kers, J. (2016b). Effect of Log Soaking and the Temperature of Peeling on the Properties of Rotary-Cut Birch (Betula pendula Roth) Veneer Bonded with Phenol-Formaldehyde Adhesive. BioResources, 11(3): 5829-5838
Sandak, J. and Negri, M. (2005). Wood surface roughness–what is it 1:242-250. Sandak, J., Tanaka, C. and Ohtani, T. (2004). Evaluation of surface smoothness by a laser displacement
sensor II: comparison of lateral effect photodiode and multiele-ment array. Journal of Wood Science 50:22-27.

Natural resources and bioeconomy studies 80/2017
221
Sellers, T. (1985). Plywood and adhesive technology. CRC Press.680 pp. Tomppo, L., Tiitta, M. and Lappalainen, R. (2009). Ultrasound evaluation of lathe check depth in birch
veneer. European Journal of Wood and Wood Products 67:27-35. Yamamoto, A., Rohumaa, A., Kontturi, E., Hughes, M. and Vuorinen, T. (2015). The Effect of
Hydrothermal Treatment on the Color Stability and Chemical Properties of Birch Veneer Surfaces. BioResources 10:6610-6623

Natural resources and bioeconomy studies 80/2017
222
Glulam made by Poplar: delamination and shear strength tests
Carlos Martins1*, A. M. P. G. Dias1, Helena Cruz2
Abstract
European hardwoods have been increasingly used for structural purposes in Europe. Their presences in the European forests have increased too, as a result of forest management policy changes and as an attempt to overcome the restrictions to importing tropical wood species. Alike other countries in Europe, Portuguese forest are also changing, being nowadays hardwood species predominant (69%) compared to softwoods (31%). From 1995 until 2010 softwoods’ planted area suffered a huge drop of almost 200 000 ha while hardwoods area increased almost 60 000 ha. This paper describes an experimental campaign to assess the viability of using for glulam production hardwood species grown in Portuguese forest. In this study small glulam beam specimens with 1 m length and four lamellas were produced, using Poplar species. Poplar was considered due to the increase of availability in Portuguese forest and its relative low density combined with good mechanical properties. Several adhesives were used, including: phenol-resorcinol-formaldehyde, melamine urea formaldehyde, one-component polyurethane and emulsion polymer isocyanate, to identify the combinations with better performance. To assess the adhesion quality, delamination and shear strength tests on glue lines were performed, following the procedures specified in EN 14080. The results obtained are reported and discussed in the paper.
Introduction 1.Glued Laminated Timber (GLT) is a widely spread product in timber construction all over the world. In Portugal timber construction using GLT went into a growth especially in the beginning of the XXI century (Negrão, 2011). The GLT used is mostly imported from other European countries with a small amount being produced at national industry, mostly with imported raw material. In Europe, the most common species used for GLT production are softwoods namely Spruce and Fir. However, European hardwoods have been increasingly used for structural purposes as their presence in European forests has increased too.
GLT has been one of the engineered wood products most used in the last century. Despite having a solid knowledge about how to produce GLT with softwoods, in the last decades industry and research have attempted to produce GLT with hardwoods as they have increased significantly their presence in the European forests (Jiang et al. 2014).
The mechanical properties of Beech wood have been widely studied among the scientific community, as well as the bonding properties (Ohnesorge et al. 2010), namely its delamination and shear strength (Aicher and Reinhardt 2007, Schmidt et al. 2010) and the mechanical properties of glulam beams (Aicher and Ohnesorge 2011, Frese and Blass 2006). Ash and Birch woods were also studied in recent years regarding their suitability to produce GLT (Knorz et al. 2014, Zhang et al. 2011, Boruszewski et al. 2011).
* Corresponding author: E-mail: [email protected]
1ISISE, Department of Civil Engineering
University of Coimbra Coimbra, 3030-788,
Portugal
2Department of Structures LNEC
Lisboa, 1700-066, Portugal

Natural resources and bioeconomy studies 80/2017
223
Portuguese forest is changing, being 69% of its area occupied by hardwoods and 31% occupied by softwoods. Blue Gum (26%) is the main hardwood species, followed by Cork Oak (23%) and Holm Oak (11%) (ICNF 2013). Both Cork Oak and Holm Oak are protected by Portuguese law which, together with the anatomic characteristics, make these woods unsuitable for use as structural members. Other hardwoods that can be found in Portuguese forest although not reaching representative amounts are: Beech, Ash, Poplar, Chestnut and Oak. On the contrary, Poplar had a significant growth, being available to be used as raw material for glulam production. A recent study on Poplar (Populus x Canadensis) grown in Portuguese forest showed, that this species is suitable for structural purposes (Hodousek et al. 2017).
Over the last decades several studies were carried out with Poplar grown elsewhere, focused either on the mechanical characterization as lumber (Bayatkashkoli and Faegh 2014, Bayatkashkoli et al. 2012) or on mechanical properties of glulam beams (Zhang et al. 2008) or their reinforcement (Hu and Cheng 2009, Osmannezhad et al. 2014). The use of Poplar was also considered in combination with Eucalyptus for GLT production (Castro and Paganini 1999, Castro and Paganini 2003).
Despite some research on the use of Poplar for GLT production, no research was found on Poplar, specifically grown in Portuguese forest. In the present paper the resistance to delamination and shear strength of glulam elements were studied. For that purpose six different adhesives were chosen from 4 types of adhesives: PRF, MUF, EPI and PUR. The specimens cut from glulam elements were tested according to the procedures established in EN 14080 (CEN, 2013), namely: Annex C and Annex D, respectively for delamination test and shear strength test.
Materials and methods 2.The present research focuses on the study of hardwood grown in Portuguese forest for glulam production. To assess the viability of the use of Poplar wood, several elements were glued and tested following the specifications of European Standard, EN 14080 (CEN, 2013).
Raw material 2.1.The wood used in this study, comprised a sample of 192 boards from Poplar (Populus nigra), collected from a central region of Portugal (near Coimbra). The sample was conditioned at a climatic room with 20º C of temperature and 65±5% of relative humidity. Each board was measured (nominal dimensions: 2144 x 122 x 39 mm3 length by width by thickness) and weighted to determine their density.
Adhesives 2.2.Six different commercial adhesives for load bearing structures were considered. The adhesives could be divided in four main groups: i) Phenol-Resorcinol-Formaldehyde (PRF), ii) Melamine-Urea-Formaldehyde (MUF), iii) One-part polyurethane (PUR) and iv) Emulsion-Polymer-Isocyanate (EPI).
i. Three different PRF mixtures were considered varying the resin, the hardener or both. 1. The liquid PRF resin Prefere 4040 was mixed with the liquid hardener Prefere 5839 in a
ratio resin/hardener 100/20 parts by weight (pbw). 2. The liquid PRF resin Prefere 4040 was also considered mixing with the liquid hardener
Prefere 5840 in a ratio 10/20 pbw. 3. The liquid PRF resin Aerodux 185 was mixed with the powder hardener HRP 155 in a
ratio 100/20 pbw. i. One MUF mixture was considered mixing a liquid Prefere 4546 resin with a liquid
hardener Prefere 5021 in a ratio 100/20 pbw.

Natural resources and bioeconomy studies 80/2017
224
ii. One EPI mixture was considered mixing a liquid Prefere 6151 resin with a liquid hardener Prefere 6651 in a ratio 100/15 pbw.
iii. One PUR adhesive was considered, namely Purbond HB S 709. 1. The primer PR3105 especially developed for gluing Eucalyptus was applied on the
surface of the lamellas prior to the application of the adhesive.
Preparation of glulam elements 2.3.This paper presents the results obtained from a series of 46 glulam elements produced during a PhD thesis which is under development. The boards of Poplar had a significant amount of knots. In order to minimize its presence two different lengths were considered for glulam elements production, 500 mm (27 elements) and 1000 mm (27 elements). Each element was produced with 4 lamella with 24 mm of thickness and width varied between 90 mm and 115 mm.
Prior to adhesive application each board was planed to the final thickness, avoiding possible deterioration of the wood surface due to its oxidation or accumulation of dust. For the application of all the adhesives a ribbon spreader was used.
The assembly process was conducted following the respective adhesive technical data sheet (TDS) regarding to the amount of adhesive, assembly time and pressure (time and level). Two pressure levels were considered for all adhesives: i) 0.8 MPa and ii) 1.0 MPa, corresponding to the minimum and the average values recommended for hardwoods. The amount of adhesive adopted was defined as the average and closer to the maximum values of the interval defined by each specific TDS. The assembly time was divided into open and closed assembly time. The open assembly time (the time between the application of adhesive in each lamella and the assembly of the above lamella) was made as short as possible. The closed assembly time (CAT) is the time from the last lamella assembly up to pressure application. The minimum CAT recommended for each glulam element was always respected, the maximum CAT being 12 minutes.
Specimens preparation and tests 2.4.After gluing the elements were conditioned at a climatic room with 20º C and 65% RH for at least 7 days before cutting specimens for delamination and shear strength tests (Figure 1). From each glulam element with 1000 mm length 7 specimens were cut for delamination tests whilst from the glulam elements with 500 mm just 4 specimens were obtained. For shear strength tests parallel to glue line were collected 10 specimens from 1000 mm glulam elements and 4 specimens from 500 mm glulam elements. Additionally specimens with the same dimensions than those for glue line shear strength tests were obtained to perform wood shear tests parallel to grain.
2.4.1. Delamination tests Delamination tests followed Method A from Annex C of EN 14080 (CEN, 2013). A gradient of moisture is created in the wood specimens, which produce internal tensile stresses perpendicular to the glue lines between laminations. The test starts with the specimens soaked in water inside an autoclave, followed by a vacuum period of 5min and a pressure period of 60min. Each cycle of Method A consists on a two periods of vacuum and pressure followed by a drying period of 21-22h at a chamber with circulating air at a velocity of 2-3 m/s with a temperature of 65ºC and relative humidity of 15% or less. This process needs to be repeated at least twice. After the 2nd cycle the delamination measurement needs to be finished within a period of one hour.
The standard refers that if delamination between 5% and 10% is observed, an additional cycle (third) should be performed. If delamination is below 5% the gluing process fulfils the requirements, whereas if the delamination is higher than 10% the gluing process needs to be reconsidered.

Natural resources and bioeconomy studies 80/2017
225
2.4.2. Shear strength tests Shear strength test consists of the application of a shear load parallel to the glue line until failure occurs. Besides the shear strength it is also measured the wood failure percentage (WFP) for each test. The requirements established for this test are related to individual and average values combining the shear strength and WFP. The minimum average strength acceptable is 6 MPa. An individual value of 4 MPa is acceptable if the WFP is 100.
Results and discussion 3.
Delamination tests 3.1.Through the analysis of delamination results (Table 1) it is possible to conclude that the three different PRF adhesives did show a good performance. Prefere 4040 with hardener Prefere 5839 was used in a total of 10 glulam elements (55 specimens) with 4 different scenarios (Figure 1). All specimens presented individual values below the limits established for both 2nd and 3rd cycles. The increase of amount of adhesive considered did not present a relevant impact on the delamination results. However, it is possible to observe a drop of 1% of delamination with the increase of pressure from 0.8 MPa to 1.0 MPa for both adhesive amounts.
The main difference reported by TDS of Prefere 4040 with hardener Prefere 5840 is related with the pressing time which is 1h lower than the pressing time when using hardener Prefere 5839. From the tests on the 8 glulam elements glued with Prefere 4040 mixed with hardener Prefere 5840 it was not possible to define a trend. The increase of amount of adhesive led to different performances for different levels of pressure. For 0.8 MPa a decrease of delamination was observed whereas for 1.0 MPa the delamination values were higher than the ones observed for the other three scenarios. It was even observed that two specimens did not fulfill the established limits for the 2nd cycle and one of them also failed the limits for the 3rd cycle. The best performance was obtained with 450 g/m2 and 0.8 MPa leading to 1.3% of mean delamination after the 3rd cycle.

Natural resources and bioeconomy studies 80/2017
226
Table 1. Delamination and shear tests results for all adhesives
Adhesive
Amount of
adhesive (g/m2)
Pressure level
(MPa)
N. of specs
Total delamination
(maximum value) (%)
Shear strength tests
Glue line Timber
Density (kg/m3) 2nd
cycle 3rd cycle N. of specs
Shear strength
(MPa) / WFP (%)
Shear strength (MPa) (N. of
specs)
Prefere 4040 + Prefere
5839
350 0.8
474.0 15 1.0 (4.0) 1.8 (8.6) 44 11.0 / 90.0 10.1 (30)
450 472.2 15 1.2 (4.9) 1.5 (5.1) 44 11.2 / 96.1 10.1 (26)
350 1.0
465.9 11 0.3 (1.6) 0.6 (2.0) 29 11.0 / 94.0 11.4 (16)
450 476.2 14 0.2 (1.2) 0.3 (1.4) 63 11.2 / 95.8 10.4 (35)
Prefere 4040 + Prefere
5840
350 0.8
471.2 11 1.1 (2.6) 2.0 (5.1) 35 10.5 / 96.1 11.1 (23)
450 461.4 11 0.9 (3.6) 1.3 (5.0) 40 10.9 / 92.6 10.5 (21)
350 1.0
466.9 11 1.0 (3.1) 1.6 (4.7) 41 10.9 / 98.4 9.3 (24)
450 447.2 11 2.8 (5.5) 3.6 (6.9) 39 11.3 / 96.8 9.2 (22)
Aerodux 185 +
HRP 155
350 0.8
470.6 11 3.6 (8.3)
5.6 (13.1) 41 10.3 / 95.7 10.2 (21)
450 464.3 11 0.2 (1.1) 0.5 (1.3) 42 10.9 / 98.3 11.4 (22)
350 1.0
445.0 11 0.7 (3.0) 1.3 (3.8) 34 10.4 / 99.3 8.2 (22)
450 475.9 22 1.1 (5.3) 2.3 (8.0) 68 11.8 / 97.3 10.3 (46)
Prefere 4546 + Prefere
5021
350 0.8
492.8 11 0.6 (1.9) 0.9 (3.6) 42 11.0 / 95.7 11.1 (21)
450 466.4 11 0.3 (1.6) 0.6 (3.0) 38 10.3 / 96.8 11.1 (18)
350 1.0 456.3 11 0.1 (0.7) 0.2 (0.9) 38 11.2 / 98.8 11.8 (24)
Prefere 6151 + Prefere
6651
350 0.8 470.1 11 6.7
(11.7) 8.2
(13.4) 34 10.7 / 97.2 10.3 (22)
1.0 454.8 11 8.2 (19.9)
9.3 (20.9) 37 11.1 / 98.4 11.0 (24)
Purbond HB S 709
180* 0.8 460.1 11 11.8 (22.2)
13.7 (25.3)
36 11.2 / 89.7 10.0 (21)
180 0.8 442.0 11 4.1
(12.3) 5.1
(13.6) 40 10.6 / 87.3 10.4 (22)
1.0 456.7 22 3.6 (12.0)
4.4 (12.8)
64 10.2 / 88.6 10.2 (46)
Note: Bold values means that more than one specimen presented delamination higher than the respective limit. Underlined values mean that one specimen had delamination higher than established limits. Highlighted values mean that the values of delamination did not accomplish the limits. Asterisk means that the specimens
were obtained from an element glued without the use of primer.

Natural resources and bioeconomy studies 80/2017
227
Figure 1. Delamination specimen glued with PRF adhesive (Prefere 4040 + Prefere 5839): prior to delamination (left) and after 3rd cycle (right)
Figure 2. Delamination specimen glued with MUF adhesive (Prefere 4546 + Prefere 5021) prior to delamination (left) and after the 3rd cycle (right)
The results on elements glued with Aerodux 185 resin and HRP 155 hardener revealed a different trend when compared with Prefere 4040 mixtures. Whereas on Prefere 4040 + Prefere 5839 specimens the delamination values were mostly influenced by the pressure level, on Aerodux 185 + HRP 155 specimens the increase of adhesive amount caused a significant drop of delamination (3.4%). The increase of pressure level (0.8 to 1.0 MPa) also led to less delamination if we compare specimens with the same amount of adhesive, although for 1.0 MPa a slight increase of delamination was observed related with the increase of adhesive amount. The highest delamination was found for 350 g/m2 with 0.8 MPa, having 3 specimens with delamination above the 5 % established for the 2nd cycle. In a total of 55 specimens tested only 1 specimen (350 g/m2 and 0.8 MPa) did not fulfill the limit of 10% after the 3rd cycle of Method A.
Considering the white color adhesives a very good performance was observed when using the Prefere 4546 mixed with Prefere 5021 (Figure 2). All the considered scenarios presented average values of delamination below 0.6% and 0.9% after the 2nd and 3rd cycles, respectively. Delamination decreased slightly with the increase of adhesive amount (350 to 450g/m2 for 0.8 MPa) and decreased 0.5% with the increase of pressure level to 1.0 MPa (350 g/m2). In a total of 33 specimens tested (6 glulam elements) the maximum delamination registered was 1.9% and 3.6% at the end of 2nd and 3rd cycles respectively for 350 g/m2 and 0.8 MPa
EPI and PUR adhesives showed a different performance regarding delamination compared with the other adhesives. Concerning EPI adhesive the mixture of Prefere 6151 with Prefere 6651 did not accomplish the limits for both cycles and for the two scenarios considered (0.8 and 1.0 MPa, with

Natural resources and bioeconomy studies 80/2017
228
350 g/m2). In a total of 22 specimens, only 6 (27%) had delamination below the 5 % allowed for the 2nd cycle. After the 3rd cycle 64% of the specimens (14) had delamination below 10%. Despite being possible to study other scenarios related to the amount of adhesive and pressure level it seems clear that this specific adhesive is not suitable to produce glulam elements made with Poplar, at least for use in service class 3.
From the analysis of results obtained on specimens glued with Purbond HB S 709 it was possible to conclude that is not adequate to glue Poplar without using a primer combined with the adhesive. Only 1 specimen presented delamination below the limit after the 2nd cycle. However, with the primer Purbond PR 3105 specifically developed to glue Eucalyptus wood a significant drop of delamination (to about 8%) was observed. In a total of 11 specimens (180 g/m2 and 0.8 MPa) 73% of them fulfill the limit of 5%. Also the increase of pressure level to 1.0 MPa was tested. Regarding the average values, a slight drop of the delamination was observed, with 68% of the specimens having delamination below the limits. A comparison of the average values of each glulam element was made and a very good performance was found for two elements (0.3% and 1.60%) whereas the other two glulam elements showed higher delamination (4.8% and 9.3%) after the 2nd cycle. Further research with the same scenario or even with an increase of adhesive amount used should be done.
As a summary of delamination results, PRF adhesives fulfilled the limits established in EN 14080 (CEN, 2013) for service class 3 purposes. Prefere 4040 mixed with Prefere 5839 presented the best results with 450 g/m2 and 1.0 MPa, however Aerodux 185 mixed with HRP 155 presented similar values for the same amount of adhesive but less pressure. The main advantage of Aerodux adhesive is its shelf life (18 months for the resin and 36 months for the hardener) and the fact that the hardener is provided as powder which could be easier for storage at industrial facilities. Having in consideration aesthetic aspects like the color of adhesive, the MUF adhesive (Prefere 4546 mixed with Prefere5021) could be a very good option, as it also presented the best results of all adhesives considered in this paper. A disadvantage of using this adhesive could be the pressure time that is required. In the present study the pressure time was doubled (8h) than the minimum specified in the TDS, as we have used an higher amount of adhesive than 250 g/m2 for a ratio of 100/20 (resin/hardener). Further research should be conducted to check if less pressing time give similar results.
Shear strength tests 3.2.From each glulam element with 1 m length 14 specimens (6 from 0.5 m glulam elements) were cut with the dimensions defined in Annex D of EN 14080 (CEN, 2013). From those specimens 10 (4 in the 0.5 m glulam elements) were tested for glue line shear strength whereas 4 (2 in the 0.5 m glulam elements) were tested for wood shear strength at mid thickness of the lamella. The results are presented at Table 1 for all adhesives considered.
From the results obtained it was verified that the shear strength of glue lines was similar even slightly higher than shear strength of wood. Although glue line shear strength varied for different bonding conditions the values are similar for all the adhesives. Figure 3 shows the cloud of results obtained from shear strength tests on glue lines. It is possible to verify that from the six adhesives studied here only the PUR adhesive yielded values that did not accomplish the minimum requirements of EN 14080 (CEN, 2013). A specific analysis to PUR glulam elements showed that the glue lines that failed the requirements for shear strength were the same ones that showed higher delamination. The same conclusion was not observed on EPI glue lines that showed regular values of shear strength and WFP despite the higher delamination.

Natural resources and bioeconomy studies 80/2017
229
Figure 3. Shear strength values obtained for glue lines of all the adhesives.
Conclusions 4.The present research had as main focus the assessment of the use of Poplar grown in Portuguese forest for glulam application. To accomplish the aims of this work an extensive experimental campaign was carried out, involving gluing 46 glulam elements with 0.5 m and 1.0 m length. All glulam elements were composed of 4 lamellas 24 mm thick. The gluing process followed the specifications of EN 14080 (CEN, 2013) and the technical data sheet from each adhesive. Four main groups of adhesives were considered: PRF (3 different adhesives), MUF, EPI and PUR (without and with primer).
To check the bond quality of the produced glulam elements, all of them were cut into specimens to be tested to delamination and shear strength (glue line and wood) according to EN 14080 (CEN, 2013) respectively Annex C and Annex D. In total 253 specimens with complete cross section and 75 mm length were subjected to delamination test Method A, adequate for Service Class 3 exposure conditions. The assessment of shear strength was performed through tests on 849 glue lines complemented with 506 tests on wood.
From the six different adhesives tested a good performance was observed of most of them to be used for gluing Poplar. EPI adhesive did not show adequate performance in any of the scenarios considered (350 g/m2, with 0.8 MPa or 1.0 MPa). When considering PUR adhesive the performance was improved with the use of primer. However, despite the average value of delamination being lower than the defined limits for 2nd and 3rd cycles, several specimens did not fulfill the limits. However it was concluded that PUR adhesive without a prior application of primer did not accomplish the established limits. In general MUF adhesive (Prefere 4546 mixed with Prefere 5021) showed the best performance, with average values of delamination under 1.0% after the 3rd cycle. PRF adhesives have also shown good performance, with some scenarios showing a delamination similar to the one obtained with MUF adhesive. In spite of that the main disadvantage of PRF adhesives is its brown color which in a white wood as Poplar becomes highly visible. From the three PRF adhesives, the lower delamination values were found for Prefere 4040 mixed with Prefere 5839 especially for higher amounts of adhesive (450 g/m2) and higher pressure (1.0 MPa). Aerodux 185 with HRP 155 could be a good option when the pressure level of the industrial facility is limited, providing an extra advantage related to its extended shelf life of 18 months (resin) and 36 months (hardener).

Natural resources and bioeconomy studies 80/2017
230
Shear test results were not conclusive being quite similar among the various adhesives. Furthermore, when the comparison is made between glue line shear strength and wood the values are quite similar.
Further research is ongoing to check the delamination performance of PUR adhesive with primer and the fabrication of structural elements in order to achieve good mechanical properties of glulam made with Poplar.
Acknowledgements This work was partly financed by FEDER funds through the Competitiveness Factors Operational Programme – COMPETE and by national funds through FCT – Foundation for Science and Technology within the scope of the Project POCI-01-0145-FEDER-007633.
The authors wish to thank Foundation for Science and Technology for the PhD grant (PD/BD/52656/2014) given to Carlos Martins, and to Dynea AS and Henkel for providing the adhesives and finally to Pedrosa Irmãos for the collaboration given with the raw material.
References Aicher, S. and Ohnesorge, D. 2011. Shear strength of glued laminated timber made from European
beech timber. European Journal of Wood and Wood Products 69(1): 143-154. Aicher, S. and Reinhardt, H. W. 2007. Delamination properties and shear strength of glued beech wood
laminations with red heartwood. Holz Als Roh-Und Werkstoff 65(2): 125-136. Bayatkashkoli, A. and Faegh, M. 2014. Evaluation of mechanical properties of laminated strand lumber
and oriented strand lumber made from Poplar wood and Paulownia with urea formaldehyde adhesive containing nanoclay. International Wood Products Journal 5(4): 4.
Bayatkashkoli, A., Shamsian, M. and Mansourfard, M. 2012. The effect of number of joints on bending properties of laminated lumber made from poplar (Populus nigra). For. Stud. China 14(3): 5.
Boruszewski, P. J., Borysiuk, P., Maminski, M. and Grzeskiewicz, M. 2011. Gluability of thermally modified beech and birch wood. Wood Material Science and Engineering 6(4): 6.
Castro, G. and Paganini, F. 1999. Poplar-Eucalyptus Glued Laminated Timber. Proceedings of EUROWOOD Technical Workshop "Industrial end-uses of fast-grown species", Florence.
Castro, G. and Paganini, F. 2003. Mixed glued laminated timber of poplar and Eucalyptus grandis clones. Holz Als Roh-Und Werkstoff 61(4): 291-298.
CEN. 2013. EN 14080 - Timber structures - Glued laminated timber and glued solid timber - Requirements. Brussels.
Frese, M. and Blass, H. J. 2006. Characteristic bending strength of beech glulam. Materials and Structures 40(1): 3-13.
Hodousek, M., Dias, A.M.P.G., Martins, C., Marques., A. F. S. And Böhm, M. 2017. Comparison of Non-Destructive Methods Based on Natural Frequency for Determining the Modulus of Elasticity of Cupressus lusitanica and Populus x canadensis. Bioresources 12(1): 270-282.
Hu, Y. C. and Cheng, F. C. 2009. Reinforcement Design of Poplar Glulam. Eco-Materials Processing and Design X 620-622: 137-140.
ICNF. 2013. IFN6 – Áreas dos usos do solo e das espécies florestais de Portugal Continental em 1995, 2005 e 2010. ICNF. Lisboa.
Jiang, Y., Schaffrath, M., Knorz, M., and Winter, S. 2014. Bonding of Various Wood Species - Studies about Their Applicability in Glued Laminated Timber. Materials and Joints in Timber Structures: Recent Developments of Technology 9: 365-374.
Knorz, M., Schmidt, M., Torno, S., van de Kuilen, J. 2014. Structural bonding of ash (Fraxinus excelsior L.): resistance to delamination and performance in shearing tests. European Journal of Wood and Wood Products 72(3): 297-309.
Negrão, J. 2011. Structures of timber in Portugal – Present and recent past (in Portuguese). Proceedings of CIMAD 11 – 1º Congresso Ibero-LatinoAmericano da Madeira na Construção. 2011. Portugal
Ohnesorge, D., Richter, K., and Becker, G. 2010. Influence of wood properties and bonding parameters on bond durability of European Beech (Fagus sylvatica L.) glulams. Annals of Forest Science 67(6).

Natural resources and bioeconomy studies 80/2017
231
Osmannezhad, S., Faezipour, M. and Ebrahimi, G. 2014. Effects of GFRP on bending strength of glulam made of poplar (Populus deltoids) and beech (Fagus orientalis). Construction and Building Materials 51: 34-39.
Schmidt, M., Glos, P., and Weneger, G. 2010. Gluing of European beech wood for load bearing timber structures. European Journal of Wood and Wood Products 68(1): 43-57.
Zhang, R., Wang, Z., Lu, X. N., Na, B., and Yue, K. 2008. Optimizing design for glulam beams made of modified wood of fast-growing poplar. Proceedings of the Conference on Engineered Wood Products Based on Poplar/Willow Wood: 128-134.
Zhang, Y. H., Gu, J. Y., Zheng, Y. W., Tan, H. Y., Di, M. W., and Zhu, L. B. 2011. Study on Bonding Properties of birch with API adhesive. Advances in Composites, Pts 1 and 2 150-151: 551-555.

Natural resources and bioeconomy studies 80/2017
232
Using low-grade hardwoods for CLT Production: A yield analysis
R. Edward Thomas1, Urs Buehlmann2*
Abstract
Low-grade hardwood logs are the by-product of logging operations and, more frequently today, urban tree removals. The market prices for these logs is low, as is the value recovered from their logs when producing traditional forest products such as pallet parts, railroad ties, landscaping mulch, or chips for pulp. However, the emergence of cross-laminated timber (CLT) for building construction in North America may provide an additional and possibly a more valuable product market for low-grade, low-value hardwood logs. Using the RaySaw sawing and ROMI rough mill simulators and a digital databank of laser-scanned low-grade yellow-poplar (Liriodendron tulipifera) logs, we examine the yield-recovery potential for lumber used in the production of CLT.
Introduction 1.Cross‐Laminated Timber (CLT) developed in the 1980s in Switzerland and Austria, are essentially large‐scale, solid wood panels with windows and supply line openings pre‐cut using CNC equipment in the manufacturing plant. The resulting panels leave the manufacturing plant on trucks ready to be installed at the construction site, where they are installed with cranes with minimal disturbance to the surroundings at a fast pace (Crespell and Gagnon 2011). Indications exist that CLT may be a cost‐competitive construction method compared with concrete or steel, especially when all costs of erecting a building are accounted for (reThink Wood 2014, WoodWorks 2012).
Recently, CLT has been used for some tall buildings like the Stadthaus in London (Hopkins 2012, Lattke 2007), the Forte in Melbourne (Lend Lease Corporation 2013, Wells 2011), the Wood Innovation Design Center in BC, Canada (Partnership BC 2013), the Treet block of flats in Bergen, Norway (Economist 2016, The Nordic Page 2017) or the Brooks Commons Phase 1 building in Vancouver (Forestry Innovation Investment 2017). In the U.S., only a handful of small projects have been executed utilizing CLT. Examples include the Candlewood Hotel (The Redstone Rocket 2015), Franklin Elementary School (MSES Architects 2014) or projects under construction like the T3‐Hines (Star Tribune 2015) or the Albina Yard (Albina Yard 2017). Currently, there are only 3 manufacturers of CLT in the country (Smartlam 2017, D.R. Johnson 2017, and Euclid 2017), where only one is APA/ANSI PRG 320 certified (D.R. Johnson 2017). The market potential for CLT in the US is estimated at 2.1 ‐ 6.4 million m3 annually, e.g., two to six times today's annual production worldwide (Karacabeyli and Douglas 2013, Espinoza et al. 2015, Laguarda-Mallo and Espinoza 2014).
Although at present, virtually all CLT structures are manufactured using softwoods, there is growing interest in the possibility of manufacturing CLT panels made from hardwoods. Hasslacher, a forest products company in Austria, built a single-family home in St. Magdalena, Austria with CLT made from Birch (Hasslacher 2015). Today, Hasslacher's material is commercially available with * Corresponding author: Tel.: +15402319759; E-mail: [email protected]
1Northern Research Station USDA Forest Service
480 Cornbread Ridge Road Princeton, West Virginia
24740 USA
2Department of Biomaterials Virginia Tech
1650 Research Center Drive Blacksburg, Virginia 24061
USA

Natural resources and bioeconomy studies 80/2017
233
certification according to EN 1995‐1‐1 (European Standards 2004). The American Hardwood Export Council (AHEC) has promoted CLT made from yellow poplar (Liriodendron tulipifera), because it is abundant, inexpensive, has good mechanical properties compared to softwoods and is strong (AHEC 2017a). AHEC, together with cooperating companies, has built two demonstration objects to advance the use of hardwood CLT, i.e., "Endless Stairs (AHEC 2017b)" and "The Smile (AHEC 2017c, CNN 2016)". Thus, while research about hardwood CLT is scarce, results confirm that it is suitable for use and that the production of hardwood CLT is technically feasible (Hovanec 2015, Mahadzadeh and Hindman 2015, Jeitler et al. 2016, Franke 2016, Kramer et al. 2014).
While hardwood CLT is not well established yet, it has the potential to become a major application for low value hardwoods from U.S. forests with important implications throughout the U.S. hardwood value chain. However, at the present time, little understanding exists as to the implications of a potentially increased use of hardwoods for the manufacturing of CLT. This lack of knowledge makes informed decisions difficult and uncertain. This study sought to create knowledge needed for making informed public policy and business decisions to allow the U.S. forest products industry and U.S. forest landowners, both public and private, to achieve maximum benefit from the emergence of this promising new construction material.
Methods 2.A sample of 20 low-grade yellow-poplar (Liriodendron tulipifera) logs was randomly selected from two sites in the Central Appalachian region of the United States. The logs were graded to US Forest Service log grades to establish quality and market value (Rast et al. 1973). Under the Forest Service log grading rules, the best saw log grade is Factory 1, followed by Factory 2, and the lowest grade is Factory 3. As the grade decreases, the number of severe defects increase, and the length of clear areas, and number of clear faces decrease. Although the rules include Construction and Local Use as the lowest quality grades, these are not commonly sawn to produce graded lumber. However, the price and yield characteristics of the logs could make them suitable for the production of CLT timbers. For the purposes of this paper, any log grading lower than Factory 3 is described as below grade. Table 1 lists the logs and their quality, dimensions, and market value. Market value was determined by using an average of prices mills are paying for logs at the time of publication.
The log sample was imaged using the US Forest Service high-resolution laser scanner (Thomas et al. 2006 and 2008) and all surface defects were measured and recorded. This process results in a complete digital representation of a log that allows determination of accurate shape and volume measurements (Thomas and Bennett 2014). Figure 1 shows a scan of log number 14 (Table 1) from this study rendered in 3D. Note the large knots visible on the log shown in Figure 1. Overall, there were a total of 172 knots found on the 20 logs in the sample, with the average knot size being 152mm long and 157 mm wide. In addition, the largest knot found measured 597 mm by 368 mm.
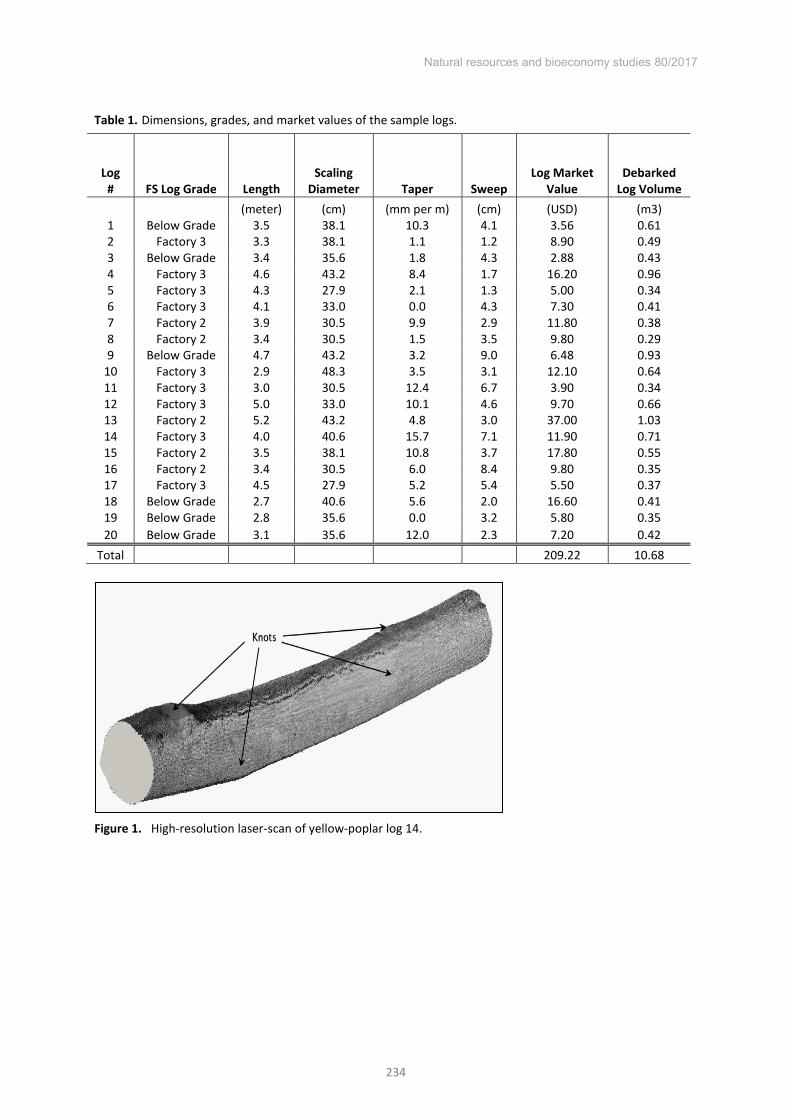
Natural resources and bioeconomy studies 80/2017
234
Table 1. Dimensions, grades, and market values of the sample logs.
Log # FS Log Grade Length
Scaling Diameter Taper Sweep
Log Market Value
Debarked Log Volume
(meter) (cm) (mm per m) (cm) (USD) (m3) 1 Below Grade 3.5 38.1 10.3 4.1 3.56 0.61 2 Factory 3 3.3 38.1 1.1 1.2 8.90 0.49 3 Below Grade 3.4 35.6 1.8 4.3 2.88 0.43 4 Factory 3 4.6 43.2 8.4 1.7 16.20 0.96 5 Factory 3 4.3 27.9 2.1 1.3 5.00 0.34 6 Factory 3 4.1 33.0 0.0 4.3 7.30 0.41 7 Factory 2 3.9 30.5 9.9 2.9 11.80 0.38 8 Factory 2 3.4 30.5 1.5 3.5 9.80 0.29 9 Below Grade 4.7 43.2 3.2 9.0 6.48 0.93
10 Factory 3 2.9 48.3 3.5 3.1 12.10 0.64 11 Factory 3 3.0 30.5 12.4 6.7 3.90 0.34 12 Factory 3 5.0 33.0 10.1 4.6 9.70 0.66 13 Factory 2 5.2 43.2 4.8 3.0 37.00 1.03 14 Factory 3 4.0 40.6 15.7 7.1 11.90 0.71 15 Factory 2 3.5 38.1 10.8 3.7 17.80 0.55 16 Factory 2 3.4 30.5 6.0 8.4 9.80 0.35 17 Factory 3 4.5 27.9 5.2 5.4 5.50 0.37 18 Below Grade 2.7 40.6 5.6 2.0 16.60 0.41 19 Below Grade 2.8 35.6 0.0 3.2 5.80 0.35 20 Below Grade 3.1 35.6 12.0 2.3 7.20 0.42
Total 209.22 10.68
Figure 1. High-resolution laser-scan of yellow-poplar log 14.

Natural resources and bioeconomy studies 80/2017
235
Sawing simulation 2.1.The RaySaw sawing simulator (Thomas 2013) was used to process the 20 laser-scanned yellow-poplar logs listed in Table 1 digitally into virtual timbers. RaySaw was configured to simulate a band sawmill operating with a 5mm thick kerf. Defect types, sizes, and locations on the timbers were predicted using modeled relationships among external defect indicators and internal features (Thomas 2009, 2016). The target thickness of the dried and surfaced CLT lamination layers was set to 34 mm, following the European Standard FprEN 16351 (European Committee for Standardization 2015). To determine the target green thickness to saw with RaySaw we added a green allowance based on yellow-poplar tangential shrinkage factor of 8.2% (i.e., 4 mm, Forest Products Laboratory 1999) a surfacing allowance of 6 mm, and a sawing variation of 1 mm. Using the tangential shrinkage factor provides a maximum drying loss and provides a conservative estimate of recovery. Thus, RaySaw was configured to saw rough timber of 45 mm thickness. Figure 2 shows an end view of log #5 (Table 1), including defect locations with a typical sawing pattern used in this study. Note, that in the sawing pattern used, we maximized the width of the timber that results from the clear face of the log. We then simulated drying by shrinking the timbers using the tangential shrinkage factor of 8.2% (Forest Products Laboratory 1999).
Figure 2. RaySaw sawing pattern design window for log # 5.
The digital timbers from RaySaw (Thomas 2013) are roughly edged (i.e., contain some wane) and contain defects not allowed for the manufacture of CLT. To remove these defects and generate material meeting manufacturing specifications (European Committee for Standardization 2015), we used the ROMI simulator (Thomas et al. 2015). ROMI processes rough random width and length timber lumber and produces dimensional parts that meet the user’s size and grade specifications. An
important component of the ROMI simulation is that it reports the number and volume of parts produced as well as the number of cutting operations required to achieve those results. Although ROMI can process parts using a rip-first, chop-first, or combined rip and chop-first combined operation, we used only its rip-first processing capabilities. This processing mode is the most common in real-world mills and traditionally offers greater mill throughput than do other processing modes.
CLT production specifications 2.2.In our simulations, CLT production was configured to meet the requirements outlined in the European Standard FprEN 16351 (Timber structures - Cross laminated timber - Requirements - Final

Natural resources and bioeconomy studies 80/2017
236
Draft, European Committee for Standardization 2015) and in the American Standard ANSI/APA PRg 320-2012 (ANSI/APA 2012). We simulated the production of three-layered panels and used edge-bonded timber layers rather than plain timber layers. For plain timber layers, the minimum lamination timber width for a 34mm lamination is 136mm (European Committee for Standardization 2015). However, for some of the logs in our sample, it would not be economical to obtain material this wide. Though, for edge-bonded timber layers, the European standard does not specify a minimum lamination timber width, yet the American standard (ANSI/APA 2012) specifies a minimum timber width of 1.5 times the lamination thickness, or 51mm for a 34 mm thick layer. Thus, we used 51 mm as the minimum acceptable timber width. We simulated the production of finger-jointed timbers with 20 mm long fingers. The minimum and maximum length of the timbers finger jointed was 200 mm and 5 meters, respectively.
The European standards ignore knots less than 6 mm in diameter, and exclude knots larger than 6 mm from a zone 20 mm plus 3 times the knot diameter from the end of the timber. However, the defect proximity rules were implemented in ROMI control defect placement only along the lengthwise edges of the strip, not along the ends (Thomas et al. 2015). Thus, to overcome this shortcoming of the ROMI software, two different simulation analyses were performed: one produced clear, defect free lamination timbers, the second produced sound lamination timbers and allowed defects as large 50 cm2 on 90 mm and wider timbers, and defects up to 15 cm2 on 51 mm wide timbers. Thus, the clear timber analysis provides a conservative baseline yield, while the sound simulations that allowed defects points to the full yield potential of using lower grade yellow-poplar for CLT production. In addition, our simulated drying process does not degrade the timbers, i.e., it does not "introduce" splits, checks, and warp normally encountered in the drying process. Thus, the results shown may be somewhat higher than can be expected in reality.
Results 3.Typically, when hardwoods are sawn, they are sawn such that the opening cut results in a timber of at least 100 mm wide for Common grade timber, or 150 mm for Selects and Better grades. However, in this study, we were sawing to maximize the production of timber for CLT manufacture. Thus, more flexibility in the design of the sawing patterns than sawyers normally has existed. By narrowing the opening face, we were able to reduce the amount of wood in the slabs (i.e., residues) and increase recovery on some logs. Table 2 lists the volumes and the number of timbers obtained from each log as well as production yields for the clear and the sound simulation analysis using RaySaw (Thomas 2013). Overall, 177 rough dimensioned timbers totaling 4.5 m3 (dry volume) were sawn from 10.7 m3 of logs.
Production yields 3.1.Table 2 presents the yield in CLT timber for the clear and the sound simulations for each log used in the simulations. For the clear simulations, primary yields ranged from a low of 58.44% to a high of 88.28% with an overall average yield of 71.24%. For the sound analysis, the results are similar. Here, yield for individual logs ranged from a low of 58.96% to a high of 89.15%, with an overall average yield of 71.84%. One might expect a greater difference in yield between the clear and sound analyses. However, we ran the simulation and put higher prioritization values on wider and longer part sizes. Thus, a wider or longer part is preferred over any combination of shorter, or narrower parts that could be cut from an area, even when a greater yield could be obtained. This was done to ensure the production of larger lamination timbers, which would require less handling and be more economical to glue-up into CLT panels.
While the clear and sound CLT production yields may seem similar, there are major differences. For the clear simulation runs, there were a total of 780 lamination timbers produced, while 7% fewer

Natural resources and bioeconomy studies 80/2017
237
timbers, i.e., 722, were produced by the sound timber simulations. Given that .03 m3 more volume was produced in the sound timber simulations, results indicate that longer parts were produced, reducing the need for costly finger jointing.
Table 3 lists the total length of laminations timber obtained from each log by length. Wider lamination timbers require fewer glue-joints and involve less handling and labor during production than narrower timbers. For the clear simulations, 488.58 lineal meters of timbers 110 mm and wider widths were produced. However, the sound simulations produced 540.44 lineal meters in the 110mm and wider widths, or 5% more. Further, examining the results by timber width shows that the clear simulations produced narrower lamination timbers (51 to 90 mm wide) compared to the sound simulations. Thus, a shift to wider parts occurred with the sound simulations thanks to the inclusion of certain timber characteristics. This is due to the ROMI simulator prioritizing wider and longer parts more than narrower and shorter parts, but is also a testament that the inclusion of a limited set of timber characteristics does not only improve yield, but also leads to longer and wider pieces being cut from the available resource. Interestingly, this preference can result in slightly lower overall yield in some cases as seen with timbers produced from log 1, where the clear simulation resulted in 74.55% yield, versus 74.19% for the sound simulations (Table 2). However, the sound simulation produced 3 meters more lamination timbers of 130mm wide from log 1 than did the clear simulation (Table 3).
Table 2. Yield and production overview for the clear and the sound timber production simulations.
Clear Timber Simulation Results Sound Timber Simulation Results Dry Primary Primary
Log Timber Board Part Primary Part Part Primary Part Number Volume Count Count Yield Volume Count Yield Volume
(m3) (percent) (m3) (percent) (m3) 1 0.281 13 54 74.55 0.209 49 74.19 0.208 2 0.239 12 40 59.23 0.141 42 61.98 0.148 3 0.158 10 41 64.59 0.102 41 65.20 0.103 4 0.363 10 57 79.25 0.288 49 80.39 0.292 5 0.127 6 18 76.15 0.097 17 78.64 0.100 6 0.160 7 46 61.72 0.098 40 68.07 0.109 7 0.149 7 11 81.91 0.122 10 82.64 0.123 8 0.127 7 32 74.80 0.095 29 76.86 0.098 9 0.382 10 70 68.83 0.263 68 69.00 0.264
10 0.349 13 39 73.94 0.258 38 74.07 0.259 11 0.108 7 19 88.28 0.095 17 89.15 0.096 12 0.328 9 64 58.44 0.192 60 58.96 0.193 13 0.500 12 54 74.91 0.375 49 73.39 0.367 14 0.253 9 37 66.89 0.169 38 68.91 0.174 15 0.210 8 31 79.23 0.176 26 78.63 0.165 16 0.121 4 24 70.02 0.085 22 70.91 0.086 17 0.158 6 33 64.39 0.102 22 66.09 0.105 18 0.173 10 29 71.12 0.123 45 69.40 0.135 19 0.123 8 32 69.18 0.085 32 71.15 0.088 20 0.195 9 49 68.25 0.133 28 71.33 0.123
Total 4.504 177 780 71.24 3.209 722 71.84 3.236

Natural resources and bioeconomy studies 80/2017
238
Table 3. Lamination timber width production overview.
Discussion 4.Although early yield experiments using the RaySaw (Thomas 2013) and the ROMI (Thomas et al. 2015) simulation software showed that CLT lamination timbers of 170 mm and wider can obtained from the resource, doubts exist that lamination timbers this wide would be suitable for CLT production. It is common for lumber from low-grade (yellow-poplar) logs to exhibit cupping and bowing during the drying process and resulting in high degrees of crook or sweep, as seen in logs 9,11,14, and 16 (Table 1). Thus, production of 170 mm and wider laminations timbers will likely result in low production yield after drying. Thus, we limited our study to 150mm and narrower timbers. However, further research is needed to investigate the implications of width on yield of lamination timbers after drying and the relationship of lamination timber width and the glue-up of CLT panels in respect of process and of mechanical properties.
The average yield difference between the clear and sound defect was only 0.60%. One reason for this small yield difference is due to the characteristics of the resource. Lower grade logs, by their grade definition, will contain more and larger knots than higher grade logs. In the log sample used in this study, the average surface knot measured 152 mm long by 157 mm wide, which means that rather large knots existed internally. With a large number of the lamination timbers sawn containing knots larger than allowed in the specifications for sound lamination timbers, yield gain due to knot inclusion in the lamination timbers sawn was rather small. Further research is needed to better understand the relationship between the type and size of allowable characteristics in the lamination timbers, yield improvements, drying results, and mechanical properties of the resulting panels.
Log Clear Timber Simulated Production Sound Timber Simulated Production Number 51mm 90mm 110mm 130mm 150mm 51mm 90mm 110mm 130mm 150mm
(m) (m) (m) (m) (m) (m) (m) (m) (m) (m) 1 19.39 14.02 6.64 13.44 8.56 16.22 11.17 6.64 16.43 8.57 2 13.18 12.66 16.89 0.00 2.65 13.18 7.81 22.63 0.00 2.65 3 5.87 5.13 16.75 0.00 2.29 5.87 5.13 17.00 0.00 2.29 4 19.71 8.99 41.67 0.00 12.55 19.72 8.99 42.63 0.00 12.63 5 3.87 6.61 3.86 7.18 4.15 3.87 6.84 3.86 7.71 4.15 6 12.93 0.83 10.61 3.41 3.29 7.67 6.06 8.53 6.05 3.08 7 1.13 3.65 6.46 10.69 6.81 1.13 3.82 6.46 10.76 6.86 8 6.01 5.53 6.11 2.71 6.04 6.01 6.08 6.14 2.83 6.08 9 28.49 10.29 21.89 4.87 14.24 25.63 11.22 22.62 4.87 14.24
10 25.18 14.18 18.98 2.72 16.10 25.37 14.18 19.01 2.72 16.10 11 6.92 5.64 5.22 6.72 2.85 6.92 5.64 5.28 6.72 2.98 12 21.95 10.96 13.39 5.08 7.91 21.97 11.03 13.55 5.72 8.04 13 39.71 22.17 28.62 3.71 20.77 43.04 17.78 23.78 7.38 21.18 14 19.47 5.34 19.90 2.58 5.79 22.44 5.07 20.07 2.58 5.80 15 20.31 3.19 9.95 3.43 12.75 16.71 3.20 6.53 3.43 16.20 16 10.26 3.91 6.07 0.00 5.94 10.26 3.91 6.09 0.00 6.14 17 9.51 7.53 3.35 5.79 4.28 6.80 4.24 3.83 6.16 7.03 18 14.16 10.50 11.98 2.55 1.43 14.08 4.79 9.43 2.62 9.06 19 3.71 3.30 3.00 3.56 1.37 9.10 6.86 3.50 5.41 2.36 20 15.17 6.44 7.57 4.29 7.19 14.16 10.50 11.98 2.62 1.43
Total 296.94 160.89 258.89 82.72 146.97 290.15 154.31 259.55 94.02 156.87

Natural resources and bioeconomy studies 80/2017
239
Conclusions 5.Rising interest in cross-laminated timber (CLT) by builders and the public have raised the question about CLT made of hardwoods. The technical feasibility of hardwood CLT has been shown and some model applications have been executed. Special attention is being paid to yellow poplar (Liriodendron-tulipifera) CLT panels, as yellow poplar is a strong yet rather light material, which is well suited for certain building applications. This study investigates the yield from low-grade yellow poplar logs for the manufacture of CLT panels.
This study focuses on low-grade yellow poplar logs as they are the by-product of logging operations and, more frequently today, urban tree removals. As the market value of such logs is limited, they may offer an economic source for the raw material needed for the manufacture of CLT panels. Possibly, increased demand for such logs, which historically have been used for traditional forest products such as pallet parts, railroad ties, landscaping mulch, or chips for pulp, may increase their market price and thus help landowners in their quest for profits.
Using the RaySaw sawing and the ROMI rough mill simulator and a digital databank of laser-scanned low-grade yellow-poplar logs, we examine the yield-recovery potential for lumber used in the production of CLT. The simulated sawing and cut-up of 20 low-grade yellow poplar logs resulted in overall primary part yields of 54% to 88% depending on the geometry and the characters found in particular logs for clear parts, i.e., no characters allowed in the resulting timbers. The overall average yield found for this simulation run was 71.24%. When allowing a limited set of characters in the lamination timbers, yield did not change much with the overall average yield found to be 71.84%. However, when a limited set of characters are accepted in the lamination timbers, wider widths and longer timbers are produced, helping to minimize the cost of fingerjointing and minimize the number of glue joints lengthwise. However, further research is needed to understand the relationship between the acceptance of characters and their size in lamination timbers to yield improvements and to the mechanical properties of resulting panels.
References AHEC. 2017a. Why Tulipwood CLT? [cited Jan. 6, 2017]; Available from:
http://www.americanhardwood.org/news‐ events/blog/post/?tx_ttnews%5Btt_news%5D=840&cHash=6142055a9ca8f2eff84df2be4b0ee73e
AHEC. 2017b. Endless stair. [cited Jan. 9, 2017]; Available from:http://www.americanhardwood.org/news-events/endless-stair/
AHEC. 2017c. The American Hardwood Export Council presents ‘The Smile’ by architect Alison Brooks for the London Design Festival. [cited Jan. 9, 2017]; Available from: http://www.americanhardwood.org/news-events/release/?tx_ttnews%5Btt_news%5D=1134&cHash=b2247a12635d4cc322ccf44fafb62b63
Albina Yard. 2017. Forest to frame. [cited Jan. 5, 2017]; Available from: http://www.albinayard.com/#the-building
ANSI / APA 2012. Standard for Performance-Rated Cross-Laminated Timber. ANSI/APA PRG 320-2012. American National Standards Institute (ANSI) and American Plywood Association (APA). The Engineered Wood Association, Tacoma, WA. 23p.
Crespell, P. and S. Gagnon. 2011. Cross-Laminated Timber: a Primer. FPInnovations: Vancouver, B.C. Canada.
CNN. 2016. Stronger than concrete? Why this new material could define our age. [cited Jan. 9, 2017]; Available from: http://www.cnn.com/2016/09/19/design/london-design-festival-the-smile-clt/
D.R. Johnson. 2017. The first U.S. certified manufacturer for cross-laminated timber. [cited Jan. 5, 2017]; Available from: http://oregonclt.com/
Economist. 2016. Building materials - top of the tree. [cited Nov. 14, 2016]; Available from: http://www.economist.com/news/science-and-technology/21706492-case-wooden-skyscrapers-not-barking-top-tree
Euclid. 2017. Welcome to Euclit. [cited Jan. 5, 2017]; Available from: http://www.euclidtf.com/

Natural resources and bioeconomy studies 80/2017
240
European Committee for Standardization. 2015. European Standard: Timber structures – Cross laminated timber – Requirements. Ref. No. FprEN 16351:2015E. CEN-CENELEC Management Centre, Brussels. 101p.
European Standards. 2004. CSN EN 1995-1-1 Eurocode 5: Design of timber structures - Part 1-1: General - Common rules and rules for buildings. [cited Jan. 6, 2017]; Available from: https://www.en-standard.eu/csn-en-1995-1-1-eurocode-5-design-of-timber-structures-part-1-1-general-common-rules-and-rules-for-buildings/
Espinoza, O., V. R. Trujillo, M. F. Laguarda-Mallo, and U. Buehlmann. 2015. Cross-laminated timber: status and research needs in Europe. BioResources, 11(1), 281-295.
Forest Products Laboratory. 1999. Wood handbook – Wood as an engineering material. Gen. Tech. Rep. FPL-GTR-113. Madison, WI: U.S. Department of Agriculture, Forest Service, Forest Products Laboratory. 463 p.
Forestry Innovation Investment. 2017. UBC Brooks Commons. [cited Jan. 19, 2017]; Available from: http://www.naturallywood.com/emerging-trends/tall-wood/ubc-brock-commons
Franke, S. 2016. Mechanical properties of beech CLT. Proceedings of the World Conference on Timber Engineering (WCTE 2016), August 22‐25, 2016, Vienna, Austria, Publisher: Vienna University of Technology, Austria. Eds.: J. Eberhardsteiner, W. Winter, A. Fadai, M. Pöll, Publisher: Vienna University of Technology, Austria.
Hasslacher Norica Timber. 2015. New: Cross-Laminated Timber in Birch. [cited Jan. 5, 2017]; Available from: https://www.hasslacher.com/data/_dateimanager/broschuere/HNT_News_Birke_BSP_EN_WEB.pdf
Hopkins, P. 2012. Timber challenges steel as the new apartment building stock. The Sydney Morning Herald.
Hovanec, D. 2015. Effect of Wood Characteristics on Adhesive Bond Quality of Yellow‐Poplar for Use in Cross‐Laminated Timbers. West Virginia University, Morgantown, WV.
Jeitler, G., M. Augustin, G. Schickhofer. 2016. Mechanical properties of glued laminated timber and cross laminated timber produced with the wood species birch. Proceedings of the World Conference on Timber Engineering (WCTE 2016), August 22‐25, 2016, Vienna, Austria, Publisher: Vienna University of Technology, Austria. Eds.: J. Eberhardsteiner, W. Winter, A. Fadai, M. Pöll, Publisher: Vienna University of Technology, Austria.
Karacabeyli, E. and B. Douglas. 2013. Cross-Laminated Timber Handbook. ed. E. Karacabeyli and B. Douglas. FPInnovations and Binational Softwood Lumber Council: Pointe-Claire, QC. 572 p.
Kramer, A., A. Barbosa, and A. Sinha. 2014. Viability of Hybrid Poplar in ANSI Approved Cross‐Laminated Timber Applications. Journal of Materials in Civil Engineering, 26(7) 3. Crespell, P. and S. Gagnon, Cross‐Laminated Timber: a Primer. 2011, FPInnovations: Vancouver, B.C. Canada.
MSES Architects. 2014. Franklin Elementary School. [cited Jan. 5, 2017]; Available from: http://www.msesarchitects.com/projects/franklin-elementary-school/
Mohamadzadeh, M., and D. Hindman. 2015. Mechanical Performance of Yellow‐Poplar Cross Laminated Timber. Report No. CE/VPI‐ST‐15‐13. Virginia Tech, Blacksburg, VA.
Laguarda-Mallo, M.F. and O. A. Espinoza. 2014. Outlook for cross-laminated timber in the United States. BioResources 9(4):7427-7443.
Lattke, F., S. Lehmann. 2007. Multi-storey timber constructions: Recent trends. 2007, J. Green Building, 2: p. 119-130.
Lend Lease Corporation. 2013. Forté Building. [cited Nov. 18, 2014]; Available from: http://www.forteliving.com.au/
Partnership BC. 2013. Wood Innovation and Design Centre Project. [cited Nov. 18, 2016]; Available from: http://www.partnershipsbc.ca/files-4/project-widc.php
Rast, E. D., D. L. Sonderman, G. L. Gammon. 1973. A Guide to Hardwood Log Grading. Gen. Tech. Rep. NE-1. Upper Darby, PA: U.S. Department of Agriculture, Forest Service, Northeastern Forest Experiment Station. 32 p.
reThink Wood. 2014. Tall wood takes a stand. [cited Nov. 18, 2014]; Available from: www.rethinkwood.com/sites/default/files/Tall‐Wood‐CEU‐Nov‐2014.pdf
Smartlam. 2017. Welcome. [cited Jan. 5, 2017]; Available from: http://smartlam.com/ Star Tribune. 2015. Developer breaks ground on modern all-timber office building in North Loop,
Minneapolis. [cited Jan. 5, 2017]; Available from: http://www.startribune.com/developer-breaks-ground-on-modern-all-timber-office-building-in-north-loop-minneapolis/318684551/
The Nordic Page. 2017. The World’s Tallest Wooden House under Construction in Bergen, Norway. [cited Jan. 17, 2017]; Availabe from: http://www.tnp.no/norway/panorama/4529-the-worlds-tallest-wooden-house-under-construction-in-bergen-norway

Natural resources and bioeconomy studies 80/2017
241
The RedstoneRocket. 2015. Timber hotel under construction at Redstone. [cited Jan. 5, 2017]; Available from: http://www.theredstonerocket.com/news/article_0a710de0-e8f9-11e4-b692-036d5c2a6577.html
Thomas, R. E. 2009. Modeling the relationships among internal defect features and external Appalachian hardwood log defect indicators. Silva Fennica. 43(3): 447-456.
Thomas, R. E. 2013. RAYSAW: a log sawing simulator for 3D laser-scanned hardwood logs. In: G. Miller, T. M. Schuler, K. W. Gottschalk, J. R. Brooks, S. T. Grushecky, B. D. Spong, J. S. Rentch, eds. Proceedings, 18th Central Hardwood Forest Conference; 2012 March 26-28; Morgantown, WV; Gen. Tech. Rep. NRS-P-117. Newtown Square, PA: U.S. Department of Agriculture, Forest Service, Northern Research Station: 325-334.
Thomas, L., L. Mili, R. E. Thomas, and C. A. Shaffer. 2006. Defect detection on hardwood logs using laser scanning. Wood and Fiber Science. 38(4):682-695
Thomas, R. E., L. H. Thomas, and C. A. Shaffer. 2008. Defect detection on hardwood logs using high-resolution laser scan data. In: Proceedings of the 15th international symposium on nondestructive testing of wood; 2007 September 10-12; Duluth, MN: Natural Resources Research Institute, University of Minnesota Duluth: 163-167.
Thomas, R. E and N. D. Bennett. 2014. Accurately determining log and bark volumes of saw logs using high-resolution laser scan data. In: Groninger, John W.; Holzmueller, Eric J.; Nielsen, Clayton K.; Dey, Daniel C., eds. Proceedings, 19th Central Hardwood Forest Conference; 2014 March 10-12; Carbondale, IL. General Technical Report NRS-P-142. Newtown Square, PA: U.S. Department of Agriculture, Forest Service, Northern Research Station: 299-310.
Thomas, R. E., T. Grueneberg, and U. Buehlmann. 2015. ROMI 4.0: Rough mill simulator 4.0 users manual. Gen. Tech. Rep. NRS-143. Newtown Square, PA: U.S. Department of Agriculture, Forest Service, Northern Research Station. 82 p.
WoodWorks. 2012. Solid advantages. [cited Nov. 18, 2014]; Available from: www.woodworks.org/wp‐content/uploads/IS‐CLT.pdf
Wells, M. 2011. Tall timber buildings: Applications of solid timber construction in multi-storey buildings. Council on Tall Buildings and Urban Habitat (CTBUH) 1: p. 24-26.

Natural resources and bioeconomy studies 80/2017
242
Influence of surface activation on silver birch veneer properties
Jussi Ruponen1*, Timo Lindroos2, Anti Rohumaa3, Kasperi Sokka4, Lauri Rautkari1
Abstract
The aim of this study is, firstly, to find out whether it is possible to reactivate the veneers that were inactivated during the manufacturing process. Secondly, it is being observed how surface activation treatment affects veneer properties and whether it is possible to improve the strength properties of the end products, e.g. plywood or laminated veneer lumber. The rotary-cut silver birch (Betula pendula Roth) veneers were activated by corona treatment. The effects of activation treatment were studied by contact angle measurements, by tensile-shear strength tests of freshly bonded veneers as well as by bending and tensile-shear strength tests of plywood manufactured from activated veneers. According to the results, the contact angle of birch veneers was improved as a result of a corona treatment. Additionally, the shear strength of the bonded veneers was improved, with 20-220 s curing times. Corona treatment also improved the bending strength of birch plywood when tested perpendicular to grain direction. In addition to this, standard deviation of plywood bending strength decreased compared to each tested reference group. Finally, the shear strength of birch plywood was improved as a result of corona treatment. To conclude, the corona activation treatment improved the veneer surface activity level when the activity is evaluated with contact angle measurements. Despite the difference within the wetting speed, untreated material will reach the same gluing properties as treated material if there is sufficient open assembly time for the glue line. Eventually, the effect of corona treatment decreases over time.
Introduction 1.
Adhesion on wood surface 1.1.Adhesion, the attraction between materials, is a surface phenomenon that is affected by characteristics and condition of interacting surfaces. For instance, topography with high surface area or reactive chemical composition of surface may improve adhesion whereas contamination of a surface will weaken adhesion. The level of adhesion may be evaluated in terms of wettability which describes how fast a liquid will be spread and be absorbed to a surface (Šernek 2004). In order to
achieve a proper adhesion, a close contact in molecular level is required which can be assumed through proper spreading and wetting of a liquid. Surface wettability properties, such as surface contact angle and surface free energy, are dependent on numerous wood material properties and processing methods but also surface contamination and exposure to light or moisture affect wettability (Gindl et al. 2004). Weak wettability may signify poor adhesion for bonding or coating wood surfaces. Several studies have reported that the inactivation of wooden surface has led to a decrease in surface free energy and thereby a decrease in wettability, which in overall has resulted in poor bonding properties. Wettability of a material can be assessed by contact angle measurement * Corresponding author: Tel.: +358505608964; E-mail: [email protected]
1Department of Bioproducts and
Biosystems Aalto University Espoo, FI-00076 AALTO, Finland
4MW Production & Technology
METSÄ WOOD Suolahti, FI-44200,
Finland
2Research & development
Isku Interior oy Lahti, FI-15210,
Finland
3LaBoMaP Ecole Nationale
Supérieure d'Arts et Métiers
Cluny, 71250, France

Natural resources and bioeconomy studies 80/2017
243
that describes both chemical and physical compatibility of a surface and an adhesive (Aydin and Demirkir 2010). However it has to be noted that in some cases surface wettability does not correlate with the quality of adhesion if wettability is measured with different liquid or adhesive than used in bonding as the chemical nature of a bonding resin affects wood surface wettability (Gindl et al. 2004, Šernek 2004).
Wood surface inactivation 1.2.Inactivation of a wood surface decreases the wettability level of the surface and it becomes more hydrophobic. Inactivation may occur relatively easily due to surrounding conditions and during time as even a single layer of organic contaminants can decrease significantly wettability and adhesion on the wood surface. On a fresh virgin wood surface, the chemical bonds keeping material components together are unbonded and are willing to bond to achieve stability, which makes the fresh surface reactive with adhesives but also with contaminants. The longer the bonds stay open the more contaminants have reacted with the surface, leading to increased inactivity within the surface. Inactivation does not occur only due to external influence but also because of physical and chemical inactivation mechanisms in wood material itself (Aydin and Demirkir 2010). Inactivation is affected for instance by hydrophobic or non-reactive extractives, wood surface oxidization or acidity, closing of micropores in wood material and molecular reorganization of wood surface functional groups (Gindl et al. 2004).
Wood surface consists of natural polymers that are able to reorganize themselves in order to form a low energy surface to prevent reactions with surrounding environment. Reorganization leads to decrease of reactive components that are able to cause chemical reactions or secondary adhesion with an adhesive. As a result, wood surface inactivates and becomes hydrophobic. Reorganization can be caused by natural degradation or processing conditions as higher temperatures and moisture will accelerate the phenomena (Šernek 2004).
Plasma activation of wood surface 1.3.Plasma, ionized gas, suitable for wood surface activation consists of highly energetic electrons, atoms and radicals whose ionization level and penetration energy is low (Acda et al. 2012, Rowell 2013). Plasma particles are able to break chemical compounds on a treated surface but plasma treatment does not affect the bulk, and its properties, of the treated wood like chemical activation methods may affect. Another benefit of plasma treatment is its environmental friendliness, as the use of it does not produce emissions harmful to the environment. Plasma activation can also be considered relatively low cost method after initial costs, as it requires only electricity and in some cases process gas (Acda et al. 2012, Aydin and Demirkir 2010). Plasma can be generated with various setups but atmospheric cold plasma is probably the most convenient method in case of wood, as it does not require vacuum chamber and the treatment temperature is still suitable for wood material.
Interaction mechanisms between plasma and treated surface are bombardment with high-energy particles and ultraviolet photons and chemical reactions taking place at the surface or near it. Interaction results in cleaning, ablation, cross linking and chemical modification at the treated surface (Acda et al. 2012, Rowell 2013). Plasmas containing oxygen or air will clean and remove contaminants like oils and waxes and produce functional groups containing oxygen on treated surface. Modifications in wood surface chemistry, as result of oxygen plasma treatment, are polar, which increases the surface free energy and enhances the wettability of the surface with polar liquids (Avramidis et al. 2009, Odrášková et al. 2008). Ablation and morphology modification at plasma
treated surface can increase surface area of the interface between surface and adhesive (Acda et al. 2012, Rowell 2013, Jamali 2011). Studies have shown that plasma treatment has mainly positive effect on wood surface wettability and enhanced adhesion. However, with correct process

Natural resources and bioeconomy studies 80/2017
244
parameters and setup it is also possible to increase hydrophobicity of a wood surface (Tino and Smatko 2014, Wascher et al. 2014). The effect of plasma treatment will diminish over time and the treated surface will inactivate again into more hydrophobic surface. Diminishing is greater directly after a treatment and lowers as a function of time. Treated surface may react either with surrounding environment or with low-energy compounds drift on the surface from the inner parts of the wood (Novak et al. 2011, Odrášková et al. 2008).
Materials and methods 2.The raw material used within this study was rotary-cut silver birch (Betula pendula Roth) veneer. Both five years old veneer and fresh veneer were studied. Old and fresh veneers were prepared similarly: Silver birch stems were sectioned into logs nominally 1.2 m in length and soaked in water tanks. The soaking took 48 h and the water was heated to either 20 ºC or 70 ºC. After soaking, the logs were rotary cut on an industrial scale lathe (Model 3HV66; Raute Oyj, Lahti, Finland) into veneer with nominal thicknesses of either 0.8 mm or 1.5 mm.
The green veneer mat was cut to sheets sized 900 x 450 x 0.8 (/1.5) mm3, corresponding to the longitudinal (L), tangential (T), and radial (R) directions, respectively. These veneer sheets were then dried at 160 ºC in a laboratory scale veneer dryer (Raute Oyj, Lahti Finland) to average final MCs of 6% (old veneers) and 10% (fresh veneers). After drying, the veneers were conditioned to equilibrium moisture content (EMC) of 7%, by applying a 35% relative humidity and a 20 ºC temperature.
The surface activity of veneers was evaluated by contact angle measurements using the sessile drop method with a droplet of 6.7 µl distilled water. The equipment applied was CAM200 (serial number 7238, KSV Instruments Ltd) and the equipment software KSV CAM Optical Contact Angle and Pendant Drop Surface Tension Software.
The corona treatment was conducted with a laboratory scale LabTEC corona treatment device (Tantec) at VTT Technical Research Centre of Finland Ltd. The veneers with an area of 120 x 210 mm2 were treated with the intensity of 0.1 kWh/m2 and with the treatment power 125 W. The voltage was set to 28 kV and was measured to be 24...25 kV. In order to study the permanence of corona treatment, the treatment time was 86 s. The stability of corona treatment on veneer surface was evaluated by contact angle measurements at various time intervals after treatment, ranging from 6 h to 1008 h.
The effect of corona treatment on adhesion was evaluated with ABES equipment (Adhesive Evaluation Systems, Inc., Corvallis, Oregon, USA). Veneers used in this test had somewhat shorter treatment time (71s) than that of the above-mentioned test, all other treatment parameters were the same as described previously. After treatment, specimens with dimensions of 117 x 20 x 0.8 mm3, (in the L x T x R, respectively), were cut from the veneer sheets with a bespoke cutter. Phenol formaldehyde resin (Prefere 14J021, with solid content 49%, Prefere Resins Finland Oy, Hamina, Finland) was applied with an electronic micropipette (HandyStep electronic, Brand GmbH + CO KG, Wertheim, Germany) to the bond area of 5 x 20 mm2 (L x T), with a spread rate 100 g/m2.
Each assembly was then placed in the ABES (Figure 1). This was followed by hot pressing of the veneer assembly, with pressing times ranging from 20 to 180 s, as presented within Table 1. The platen temperature was 130 ºC and the press pressure 2.2 MPa. After pressing, the tensile-shear strength of the bonded veneer joints was tested directly. The tensile-shear strength (τ) was
determined from the attained maximum force value (F) by utilizing the Equation (1) below, and knowing that the cross-section of the bond line (A) was 100 mm2:
τ = F / A. (1)

Natural resources and bioeconomy studies 80/2017
245
Table 1. The number of hot pressed birch veneers (both reference and corona treated veneers).
Hot pressing time (s) 20 30 40 60 90 120 160 180
Reference veneers 9 7 9 9 9 9 9 9
Corona treated veneers 9 7 9 9 9 9 9 9
The effect of corona treatment on plywood properties was evaluated by preparing cross-laminated 7-ply structured 400 x 400 mm2 sized plywood from fresh 1.5 mm thick birch veneers. The plywood was manufactured at the laboratory of Prefere Resins Finland Oy in Hamina, Finland. The adhesive spread rate was 160 g/m2. After lay-up phase the boards were pre-pressed for 8 min under a pressure of 0.8 MPa. After pre-pressing panels were hot-pressed at 128 ºC and under 1.8 MPa for 8 min. Finally, the boards were conditioned at 20 ºC and at 65% RH for 4 weeks and were then sawn to test specimens. The bending strength tests (n = 18 parallel to the grain direction, n = 17 perpendicular to the grain direction), according to the EN 310, and the bond line tensile-shear strength tests (n = 33 tested in dry condition, n = 40 tested after water soaking for 24 hours at 20 ºC), according to the EN 314, were conducted. Additionally, adhesive bonds were tested by open and closed modes as described previously by Rohumaa et al. (2013).
The attained plywood strength data was tested statistically by applying IBM SPSS Statistics 23 software. The analysis was completed with one-way t-test for two independent samples as well as with Mann-Whitney U test.
Results and discussion 3.Prior to experiments, the veneers were conditioned at a 35% relative humidity and at a 20 °C temperature. There, the veneers reached an equilibrium moisture content (EMC) of 7%. According to the results, soaking temperature influences the contact angle of the veneer surface and hence to veneer surface activity. The higher soaking temperature (70 °C) led to a lower contact angle of the rotary-cut birch veneer surface than that from a lower soaking temperature (20 °C). These results are illustrated in Figure 1, and are in line with earlier findings of Rohumaa et al. (2014), who reported that a higher soaking temperature results in a greater surface activity.
Figure 1. Influence of soaking temperature on contact angle for five years stored birch veneers. Contact angle is presented as a function of contact time. Above: soaking temperature 20 °C; below: soaking temperature 70 °C.
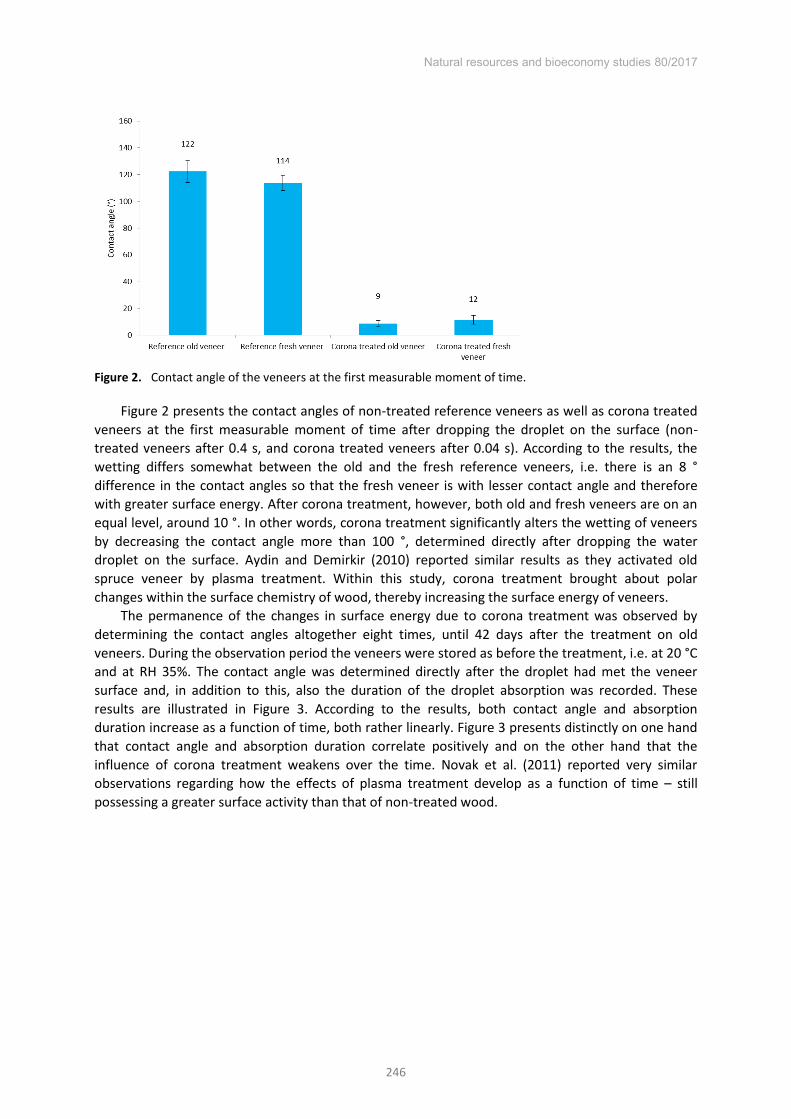
Natural resources and bioeconomy studies 80/2017
246
Figure 2. Contact angle of the veneers at the first measurable moment of time.
Figure 2 presents the contact angles of non-treated reference veneers as well as corona treated veneers at the first measurable moment of time after dropping the droplet on the surface (non-treated veneers after 0.4 s, and corona treated veneers after 0.04 s). According to the results, the wetting differs somewhat between the old and the fresh reference veneers, i.e. there is an 8 ° difference in the contact angles so that the fresh veneer is with lesser contact angle and therefore with greater surface energy. After corona treatment, however, both old and fresh veneers are on an equal level, around 10 °. In other words, corona treatment significantly alters the wetting of veneers by decreasing the contact angle more than 100 °, determined directly after dropping the water droplet on the surface. Aydin and Demirkir (2010) reported similar results as they activated old spruce veneer by plasma treatment. Within this study, corona treatment brought about polar changes within the surface chemistry of wood, thereby increasing the surface energy of veneers.
The permanence of the changes in surface energy due to corona treatment was observed by determining the contact angles altogether eight times, until 42 days after the treatment on old veneers. During the observation period the veneers were stored as before the treatment, i.e. at 20 °C and at RH 35%. The contact angle was determined directly after the droplet had met the veneer surface and, in addition to this, also the duration of the droplet absorption was recorded. These results are illustrated in Figure 3. According to the results, both contact angle and absorption duration increase as a function of time, both rather linearly. Figure 3 presents distinctly on one hand that contact angle and absorption duration correlate positively and on the other hand that the influence of corona treatment weakens over the time. Novak et al. (2011) reported very similar observations regarding how the effects of plasma treatment develop as a function of time – still possessing a greater surface activity than that of non-treated wood.

Natural resources and bioeconomy studies 80/2017
247
Figure 3. The permanence of corona treatment on old birch veneers as a function of time. Top most: the contact angle of reference veneer; in the middle: the contact angle of corona treated veneer; lowest: the absorption duration of corona treated veneer.
ABES device was utilized to study how corona treatment influences the adhesion properties of old and thus inactivated veneer. The bond line tensile-shear strength of hot pressed corona treated veneer assembly yielded greater value than that of reference veneer assembly. The results are presented in Figure 4. The bond line of corona treated veneer assembly reached its maximum strength level after 90 s hot pressing, whereas the bond line of reference veneer assembly yielded more strength until 160 s of hot pressing.
Figure 4. Tensile-shear strength of the veneer-assembly bond line. Above: corona treated veneers; below: reference veneers.
The influence of open assembly time on bond line tensile-shear strength could be seen in Figure 5. Corona treated fresh veneer surface yielded greater bond-line strength than that of non-treated reference veneers, as hot pressing is conducted directly after adhesive spreading. The reference veneers, however, reach the strength level of corona treated veneers already after five minutes open assembly time and neither veneer assemblies attains greater strength as open assembly time increases. The older, non-treated veneer reaches the maximum strength level after 10 minutes open assembly time. The results are very logic; greater inactivity of surface requires a longer adsorption time so that the maximum strength could be attained. Avramidis et al. (2011) reported similar results.

Natural resources and bioeconomy studies 80/2017
248
Figure 5. Tensile-shear strength of the veneer assembly bond line as functions of open assembly time. Line with squares: fresh veneer; line with dots: corona treated fresh veneer; line with triangles: old veneer.
Bending strength and Young’s modulus results for cross-laminated birch plywood are illustrated in Figure 6. According to the results, both bending strength and Young’s modulus of corona treated
material are somewhat greater than that of untreated material. Most significant increase for the corona treated material was observed for bending strength perpendicular to the wood grain whereas the smallest difference occurred within bending strength parallel to the wood grain. Young’s
modulus of the corona treated material increased the same amount in both directions compared to the untreated material.
Figure 6. Bending strength and Young’s modulus of cross-laminated birch plywood.
Differences within the strength properties between the materials were minor but still statistically significant. With the exception of bending strength parallel to the wood grain, all other tested properties were statistically significantly different. In addition to this, the standard deviation of corona treated material was smaller in all results compared to untreated material. The inspection of statistical results is provided within Table 2.

Natural resources and bioeconomy studies 80/2017
249
Table 2. Test results for bending strength and Young’s modulus of cross-laminated birch plywood.
test sample N mean (MPa) STD (MPa) p-value
MOR || corona 18 97,4 2,93 0,226 reference 18 96,5 3,81
MOE || corona 18 10,8 0,20 0,004 reference 18 10,5 0,40
MOR ⊥ corona 17 58,9 1,40 0,006 reference 17 57,1 2,43
MOE ⊥ corona 17 5,0 0,13 0,003 reference 17 4,9 0,14
Figure 7. Tensile-shear strength and the Percentage of Wood Failure of cross-laminated birch plywood.
Table 3. Test results for tensile-shear strength of cross-laminated birch plywood.
peeling cracks sample pretreatment N mean (MPa) STD (MPa) p-value
closed corona
24 h soaking 17 3.1 0.21
0.022 reference 18 2.9 0.17
open corona
24 h soaking 19 2.2 0.17
0.033 reference 17 2.1 0.28
closed corona
none 17 5.0 0.32
0.001 reference 13 4.6 0.27
open corona
none 15 4.2 0.27
0.000 reference 16 3.8 0.31
Tensile-shear strength results for cross-laminated birch plywood are illustrated in Figure 7. Within the tensile-shear strength test, higher values were achieved for corona treated material compared to untreated material. Half of the specimens were tested dry, without any pre-treatment, and half of the specimens were soaked in water for 24 h before testing. In addition to this, half of the specimens were prepared so that the orientation of the lathe checks is open in the testing direction and the other half closed as the orientation of the checks affects the results of the tensile-shear strength.
According to the results the tensile-shear strength of corona treated material is greater than that of untreated material in both open and closed check orientations and with both pre-treatments. With both pre-treatments more significant difference between corona treated and untreated
Natural resources and bioeconomy studies 80/2017
250
material occurred in open check orientation. Tensile-shear strength results were statistically significantly higher within the corona treated material with both pre-treatments and within both lathe check orientations. The inspection of statistical results is provided within Table 3
Conclusions 4.Corona treatment had an obvious influence on the surface energy of rotary-cut silver birch (Betula
pendula Roth) veneers. In other words, the treatment enabled reactivation of the inactivated veneers and therefore their wettability increased. This was observed by contact angle measurements and by wetting speed. Contact angle was also observed as a function of time from the corona treatment, and these results argue that the influence of the treatment decreases over the time. Birch veneer was further processed to cross-laminated plywood which was tested according to EN310 for bending strength and according to EN314 for tensile-shear strength. The results from the treated veneers and the untreated reference veneers were compared and the statistical significance was evaluated with a confidence level of 95%. According to the results, wettability of birch veneers was improved as a result of a corona treatment. Additionally, the shear strength of the bonded veneers was improved, with 20-220 s curing times. Corona treatment also improved the bending strength of birch plywood when tested perpendicular to grain direction. In addition to this, standard deviation of plywood bending strength decreased compared to each tested reference group. Finally, the shear strength of birch plywood was improved as a result of corona treatment. To conclude, the corona activation treatment improved the veneer surface activity level when the activity is evaluated with contact angle measurements. This improvement leads to faster wetting. Despite the difference within the wetting speed, untreated material will reach the same gluing properties as treated material, if there is sufficient open assembly time for the glue line. Eventually, the effect of corona treatment decreases over time.
Acknowledgements The authors are grateful for the support, facilities, and raw material provided by Metsä Wood, Prefere Finland Oy, and VTT Technical Research Centre of Finland Ltd.
References Acda, M.N., Devera, E., Cabangon, R. and Ramos, H. (2012) "Effects of plasma modification on
adhesion properties of wood", International Journal Of Adhesion And Adhesives, 2012, Vol.32, pp.70-75.
Avramidis, G., Hauswald, E., Lyapin, A., Militz, H., Viol, W. and Wolkenhauer, A. (2009) "Plasma treatment of wood and wood-based materials to generate hydrophilic or hydrophobic surface characteristics", Wood Material Science and Engineering; 2009
Aydin, I. and Demirkir, C. (2010) "Activation of Spruce Wood Surfaces by Plasma Treatment After Long Terms of Natural Surface Inactivation", Plasma Chemistry and Plasma Processing, 2010, Vol. 30(5), pp.697-706, vol. 30, no. 5, pp. 697-706.
Gindl, M., Reiterer, A., Sinn, G. and Stanzl-Tschegg, S. (2004) "Effects of surface ageing on wettability, surface chemistry, and adhesion of wood", Holz als Roh- und Werkstoff, vol. 62, no. 4, pp. 273-280.
Jamali, A. (2011) "Etching of wood surfaces by glow discharge plasma", Wood Science & Technology, vol. 45, no. 1, pp. 169-182
Odrášková, M., Ráhel’, J., Zahoranová, A., Tino, R. and Cernák, M. (2008) "Plasma Activation of Wood Surface by Diffuse Coplanar Surface Barrier Discharge", Plasma Chemistry and Plasma Processing, 2008, Vol. 28(2), pp.203-211.
Novak, I., Popelka, A., Vanko, V., Preto, J., Sedliacik, J., Chodak, I., Kleinova, A. and Pollak, V. (2011) "Modification of wood by low-temperature atmospheric discharge plasma", Annals of Warsaw University of Life Sciences - SGGW, Forestry and Wood Technology; 2011, pp. 141.

Natural resources and bioeconomy studies 80/2017
251
Rohumaa, A., Hunt, C.G., Hughes, M., Frihart, C.R. and Logren, J. (2013). The influence of lathe check depth and orientation on the bond quality of phenol-formaldehyde bonded birch plywood. Holzforschung, 67(7): 779–786.
Rohumaa, A., Hunt, C.G., Frihart, C.R., Saranpää, P., Ohlmeyer, M. and Hughes, M. (2014) "The influence of felling season and log-soaking temperature on the wet-ting and phenol formaldehyde adhesive bonding characteristics of birch veneer", Holzforschung, 2014, Vol.68(8).
Rowell, R.M. (2013) "Handbook of wood chemistry and wood composites", Handbook of wood chemistry and wood composites; 2013.
Šernek, M. (2004) "Comparative analysis of inactivated wood surfaces", Holzforschung, 2004, Vol. 58(1), pp.22-31.
Tino, R. and Smatko, L. (2014) "Modifying Wood Surfaces with Atmospheric Diffuse Coplanar Surface Barrier Discharge Plasma", Wood and Fiber Science, vol. 46, no. 4, pp. 459-464.
Wascher, R., Schulze, N., Avramidis, G., Militz, H. and Viol, W. (2014) "Increasing the water uptake of wood veneers through plasma treatment at atmospheric pressure", European Journal Of Wood And Wood Products, 2014, Vol.72(5), pp.685-687.

Natural resources and bioeconomy studies 80/2017
252
Use of phenolic resins for hardwood veneer modification for moulding applications
Tom Franke, Anja Kampe, Claudia Lenz, Nadine Herold, Alexander Pfriem*
Working Group “Chemistry and Physics of Wood and Chemical Engineering” Eberswalde University for Sustainable Development
Eberswalde, Brandenburg, 16225, Germany
Abstract
The aim of this study is to examine the treatability of European beech (Fagus sylvatica L.) with phenol-formaldehyde and their potential as plasticizing agent of beech for moulding applications.
Conclusions were drawn from swelling of the wood in combination with dynamical mechanical thermal analysis. Swelling of the cell walls can serve as indicator for plasticizing effects and provides information about the impregnability of the veneers with phenol-formaldehyde (PF) resins. Thus, macroscopic swelling of beech blocks and microscopic swelling of single cell walls was measured after PF impregnation and compared to water-saturated dimensions. Additionally, the bulking effect of the treated specimens was measured after curing of the specimens to evaluate the potential of PF to penetrate the cell walls. Dynamic mechanical thermal analyses (DMTA) were employed to assay the plasticizing effect of the PF after impregnation during heating. Therefore, three commercially available PF resols were used, representing a low molecular weight, a medium molecular weight and a high molecular weight resin. It was found that low and medium molecular weight prepolymers induced slightly increased swelling values compared to water saturated beech wood, indicating an improved plasticizing effect on beech wood. DMTA studies demonstrate the influence of temperature on the wood plasticization. The measured storage modulus E’ and the loss factor tan δ suggest a different potential of the used PF for veneer plasticization. With decreasing swelling values, plasticizing effects are also decreasing. Furthermore, the study indicates, that swelling of wood might be not the determining factor to evaluate plasticizing of wood.
Introduction 1.Bendability of wood can be considerably improved by various treatments. Traditional treatments such as hot water treatment or steaming are used during the last centuries. In the last years various treatments to increase bendability of wood were investigated. Examples are impregnation with ammonia solutions (Schuerch 1966), ethylene glycol (Olsen and Plow 1939) or furfuryl alcohol (Herold and Pfriem 2013).
Another suitable treatment to plastisize wood and improve bendability is the impregnation with phenol-formaldehyde (PF). PF resins are widely used in plywood industry, e.g. as water resistant adhesives. Furthermore, PF are known to improve the wood dimensional stability and reduce water absorption (Stamm and Seborg 1955, reviewed and reaffirmed 1960). The PF can be classified by various properties, e.g. molecular weight, molar ratio, used catalyst, pH-value or viscosity (Knop and Pilato 1985, Pizzi 2003). In particular, the molecular weight of the PF might be the determining factor for the modification of wood. Low molecular weight PF (lmwPF) can penetrate more easily into wood cell walls (Furuno et al. 2004) and act as modification agent. Impregnation of PF into the cell walls leads to bulking of the wood substance. According to Sadoh (1981) swelling of the wood substance is an indicator for improved plasticization of wood. The suitability of PF as plasticizing agent at elevated temperatures by compressing veneers were firstly described by Stamm and Seborg (1955, reviewed and reaffirmed 1960). Similar effects were later described by Shams et al. (2004) and Gabrielli and Kamke (2010) for various PF formulations. * Corresponding author: Tel.: +493334657377; E-mail: [email protected]

Natural resources and bioeconomy studies 80/2017
253
In this study, the plasticizing effect of three PFs with varying molecular weight on beech wood (Fagus sylvatica L.) is studied in respect to the swelling of the material. Therefore, the microscopic swelling of individual cells is compared to the macroscopic swelling of small wood blocks. As result and according to Buchelt et al. (2012), the area swelling coefficient (ASC) is determined. Additionally, dynamic mechanical thermal analyses (DMTA) were carried out to evaluate the potential of PF as plasticizing agent.
Materials and methods 2.
Chemicals 2.1.Three commercially available water-diluted resols were used. The resols were provided by Prefere Resins® Germany GmbH Erkner. The used resols are classified as low molecular weight PF (lmwPF), medium molecular weight PF (mmwPF) and high molecular weight PF (hmwPF). The most relevant technical information is summarized in Table 1.
Table 1. Technical specifications of the resols.
lmwPF mmwPF hmwPF
Viscosity [mPas] 13 196 242
Molecular weight MN 250 450 890
Solid content [%] 45 56 45
pH- value < 10 < 10 > 11
Microscopic swelling 2.2.Specimens for microscopic swelling investigations were prepared from beech blocks with a transverse section of 10 mm x 5 mm. For measurements a light microscope (Olympus BX 41 equipped with a digital CCD-camera) with the software TSO NewVidmess V.2.00.31 was used. The cell wall area was measured for 30-40 cell walls according to Figure 1, where each cell wall area was determined by the difference of the area measured along the middle lamella and the area of the cell lumen. Each cell wall area was estimated at four various states of the cell wall for each PF treatment. Therefore, semi thin microtome slices (15 µm) were prepared. The slices were firstly dried at 80 °C in an oven to constant weight and cell wall areas at absolute dry state were determined.
In a second step, specimens were saturated with deionized water for 24 h and the areas of same cell walls were measured as described before.
After drying the water-saturated specimens to absolute dry state, specimens were impregnated under vacuum conditions for 60 min at 10 kPa with the chosen PF. Subsequently, specimens kept submerged in the PF solution for 24 h before measuring the cell wall area.
In a last step, PF impregnated specimens were cured at 150°C for 90 min and cell wall areas were measured to estimate the bulking of the cell walls.

Natural resources and bioeconomy studies 80/2017
254
Figure 1. Microscopic evaluation of cell walls at various conditions.
Macroscopic swelling 2.3.Macroscopic swelling was determined of beech blocks with the dimensions of 25 mm × 10 mm × 30 mm (radial × tangential × longitudinal). 12 specimens were used for each PF treatment (lmwPF, mmwPF and hmwPF) as well as untreated control specimens. Prior impregnation, all specimens were dried to constant weight at 80 °C. Subsequently, dimensions were determined at two measurement points in radial and two measurement points in tangential direction. Afterwards, the specimens were impregnated in a pilot scale autoclave with the respective PF as well as for the control group with deionized water. First a vacuum of 15 kPa was applied for 30 min and subsequently a pressure of 600 kPa was applied for 90 min. In order to realize a maximum penetration of PF into the wood cell wall, specimens were kept submerged in the impregnation solution for 24 h.
Afterwards, the dimensions of each specimen were determined at the same measurement points as prior to impregnation.
In a last step, specimens were cured. Therefore, a temperature of 80 °C was applied for 120 min followed by a temperature of 140 °C for 60 min. Subsequently, dimensions were measured once more. Afterwards the weight percent gain (WPG) was determined according to Equation 1.
𝑊𝑃𝐺 =𝑚1−𝑚0
𝑚0× 100 (1)
where WPG is the weight percent gain [%], m1 is the weight after curing [g] and m0 is the absolute dry weight of the untreated specimen [g].
Area swelling coefficient 2.4.The area swelling coefficient (ASC) for microscopic (following referenced as ASCmic) as well as for macroscopic swelling (following referenced as ASCmac) was calculated according to Equation 2.
𝐴𝑆𝐶𝑚𝑖𝑐/𝑚𝑎𝑐 =𝐴𝑁−𝐴0
𝐴0× 100 (2)
where ASCmic/mac = Area swelling coefficient at the certain state (water-saturated, PF saturated and cured) [%], AN is the area of the current state (water-saturated, PF saturated and cured [µm2, respectively mm2] and A0 is the area of the absolute dry state [µm2, respectively mm2]. Declarations in µm2 were made for cell wall swelling and declarations in mm2 were made for macroscopic swelling. Macroscopic ASCmac were determined by calculating the area (radial × tangential).
Dynamic mechanical thermal analysis 2.5.For DMTA measurements specimens were prepared from beech with the dimensions of 10 mm × 0.6 mm × 45 mm (radial × tangential × longitudinal). Prior testing, the impregnated specimens were dried for 20 to 24 h in a desiccator filled with silica gel to a residual moisture content of appr. 10%. DMTA measurements were carried out in tensile mode using a Gabo® Eplexor 25 N

Natural resources and bioeconomy studies 80/2017
255
device. Both ends of the specimens were covered with temperature resistant foil (Exact Film 210 by Exact Plastics®) to prevent sticking to the clamps. The specimens were tested in radial direction with a clamp distance of 33.5 mm and at a heating ramp of 1 K/min at a temperature range between 25 °C and 160 °C. A dynamical strain of 0.02% and a frequency of 10 Hz were applied. During the measurement the static load was between 100 to 150% higher than the dynamic load to prevent specimens from buckling. Each measurement was repeated with three specimens to ensure reproducibility.
Results and discussion 3.According to Sadoh (1981) swelling of wood can serve as indicator for plasticizing wood and change transition temperatures of the structural wood components hemicelluloses and lignin during dynamic mechanical tests to lower temperatures. Various organic liquids, e.g. polyethylene glycols, are able to swell wood to greater extends than water does (Mantanis et al. 1994, Sadoh 1981). However, not only the degree of swelling but the mode of interaction with wood cell wall components is more related to the physical organization of the swelling agents inside the wood structure.
Figure 2 displays the microscopic and macroscopic swelling of beech wood expressed by the ASCmic/mac of PF impregnated and water-saturated specimens after impregnation and the bulking effect of the PF impregnated specimens after curing. Furthermore, the ASCmic at cell wall level and the ASCmac at macroscopic level is displayed in this figure. As described by Hill and Ormondroyd (2005) and Buchelt et al. (2012) macroscopic swelling of modified wood does not correspond entirely with swelling of modified cell walls. These findings are substantiated by the results of PF impregnated beech wood in the present study. The microscopically assessed PF impregnated cell walls display ASCmic values at least twice as high as the ASCmac found for macroscopic specimens. Since the chosen PF are water-diluted, swelling of the wood has to be interpreted as superposition of swelling caused by water and by the impregnated PF. At microscopic level, the ASCmic of the water-impregnated state display similar values compared to the lmwPF and mmwPF impregnated samples. According to ANOVA test no statistically significant differences were found at a 95 % confidence range (p > 0.05). In contrast, hmwPF evokes significant lower ASCmic values than water (p < 0.05). The macroscopic ASCmac of lmwPF and mmwPF impregnated samples display a swelling to higher extend compared to water-saturated specimens. Against, specimens impregnated with hmwPF display lower values compared to the control specimens. It is notable, that ASCmic provides higher variations compared to the macroscopic ASCmac values. Buchelt et al. (2012) explain the high variation of the microscopic swelling by the varying chemical compositions of particular single cells and a limited swelling due to surrounding cells. Furthermore, the distribution and penetration of PF within one cell wall remains unclear and can be also attributed to cell wall properties such as void volumes of the cell wall. Thus, microscopic swelling is not a suitable measure to determine minor differences in swelling.
Macroscopic ASCmac values conversely display the effect of swelling more pronounced. It can be seen that the specimens treated with lmwPF provide a significantly higher macroscopic swelling than the water-saturated specimens (p > 0.05). In contrast, specimens treated with mmwPF provide no statistically higher swelling than water treated specimens (p < 0.05). In contrast, hmwPF impregnated specimens demonstrate a lower swelling than water-saturated specimens (p < 0.05).
The bulking of the cell walls after PF curing prove the penetration of each PF into the beech wood cell walls (Figure 2). Highest cell wall bulking is provided by the lmwPF followed by the mmwPF. HmwPF displays lowest swelling values. Differences of the cell wall swelling were found statistically significant at a 95 % confidence range (p > 0.05). This also substantiating the hypothesis of Furuno et al. (2004) claiming that even small molecule fractions of PF with a high mean molecular weight (Mn) are able to penetrate wood cell walls. However, it is notable, that macroscopic swelling

Natural resources and bioeconomy studies 80/2017
256
of the hmwPF is only 1/6 of the microscopic swelling, whereas lmwPF and mmwPF display microscopic ASCmic values twice as high as macroscopic ASCmac. This can be attributed to the higher viscosity and, thus, a retarded penetration into the wood in case of the macroscopic wood samples. In contrast, hmwPF does not need to permeate the wood during microtome slice impregnation. Therefore, results of the microscopic ASCmic must be interpreted as the potential of penetration and the macroscopic swelling of the wood gave more realistic information about the penetration behaviour of the certain PF into the wood.
Figure 2. Area swelling coefficient (ASC) for low molecular weight (lmwPF), medium molecular weight (mmwPF) and high molecular weight (hmwPF) impregnation of beech cell walls (ASC microscopic) and of beech blocks (ASC macroscopic) in comparison to water-saturated control specimens and after curing of the various PF.
However, it should be noted that the WPG of the certain PF treated samples varied (Table 2) and thus there is an influence of the WPG on the bulking after curing of the PF treated specimens. However, from the ratio WPG : ASCmac it can be concluded that swelling of the wood substance differs in respect to the applied PF type. Lowest WPG : ASCmac ratio is obtained by lmwPF impregnation with 3.2 at a WPG of 53.5%. For the mmwPF the ratio is higher (4.5) indicating lower swelling in respect to the obtained WPG (59.5%). The hmwPF treated samples display a low degree of penetration into the wood substance with a ratio of 22.
Table 2. Ratio of WPG and the macroscopic ASCmac of the treated specimens after curing.
lmwPF mmwPF hmwPF
WPG [%] 53.5 (3.0) 59.5 (1.2) 47.0 (4.3)
ASCmac [%] 16.5 (1.2) 13.1 (1.6) 2.1 (0.5)
Ratio WPG : ASCmac 3.2 (0.2) 4.5 (0.5) 22.0 (4.9)
DMTA measurements evaluate the effect of temperature on wood plasticization. Figure 3 displays the normalized storage modulus E’ of the treated specimens at elevated temperatures. The
lmwPF and the mmwPF display a comparable softening behaviour of the wood specimens. Thereby, lmwPF reduces the storage modulus by a maximum of 60% at 110 °C and mmwPF decreases the storage modulus by 50% at 115 °C. The subsequent increase of the storage modulus can be attributed to the beginning of PF polycondensation reaction inside the wood. Similar onset temperatures of PF polycondensation were claimed by Kim et al. (1991) and Lei and Wu (2006). Results show a higher reduction of the storage modulus by lmwPF treatment compared to mmwPF treated samples. However, the hmwPF reveal a very different softening behaviour of the storage modulus. Between 25 °C and 50 °C the storage modulus slightly decreases. The magnitude of decreasing is significantly lower than observed for lmwPF and mmwPF impregnated beech wood. Corresponding to previous ASCmic/mac measurements showing lowest swelling values for hmwPF
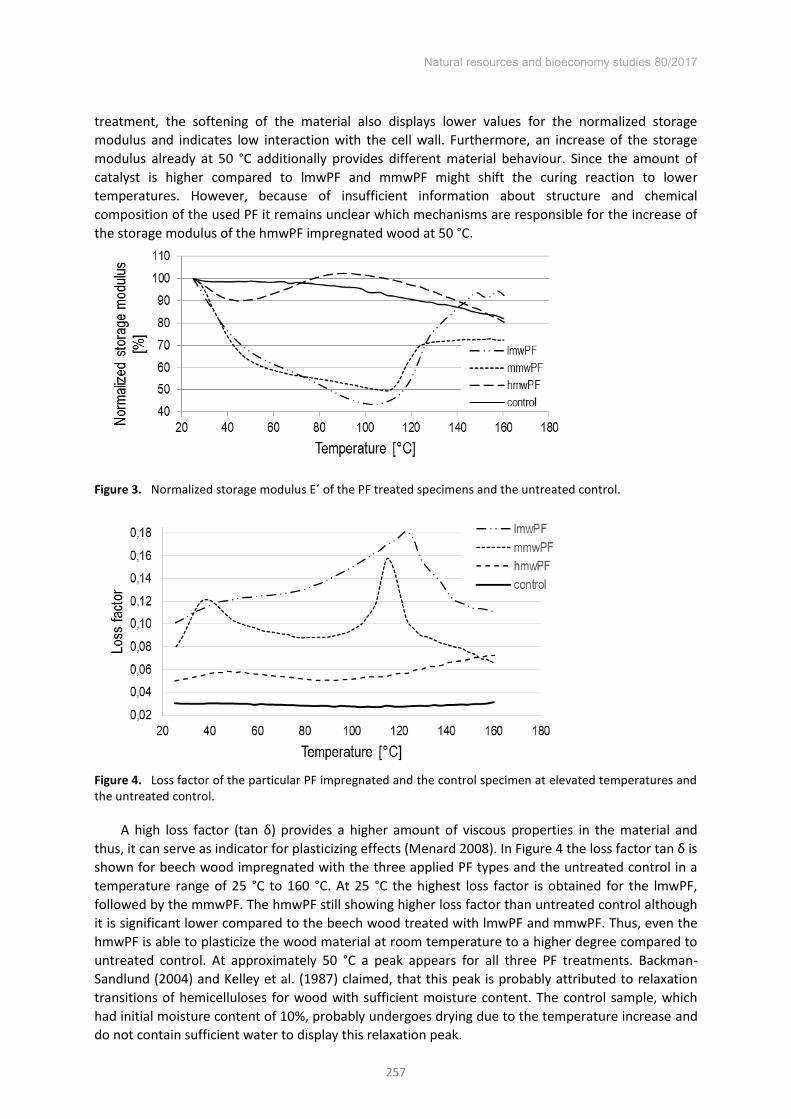
Natural resources and bioeconomy studies 80/2017
257
treatment, the softening of the material also displays lower values for the normalized storage modulus and indicates low interaction with the cell wall. Furthermore, an increase of the storage modulus already at 50 °C additionally provides different material behaviour. Since the amount of catalyst is higher compared to lmwPF and mmwPF might shift the curing reaction to lower temperatures. However, because of insufficient information about structure and chemical composition of the used PF it remains unclear which mechanisms are responsible for the increase of the storage modulus of the hmwPF impregnated wood at 50 °C.
Figure 3. Normalized storage modulus E´ of the PF treated specimens and the untreated control.
Figure 4. Loss factor of the particular PF impregnated and the control specimen at elevated temperatures and the untreated control.
A high loss factor (tan δ) provides a higher amount of viscous properties in the material and thus, it can serve as indicator for plasticizing effects (Menard 2008). In Figure 4 the loss factor tan δ is
shown for beech wood impregnated with the three applied PF types and the untreated control in a temperature range of 25 °C to 160 °C. At 25 °C the highest loss factor is obtained for the lmwPF, followed by the mmwPF. The hmwPF still showing higher loss factor than untreated control although it is significant lower compared to the beech wood treated with lmwPF and mmwPF. Thus, even the hmwPF is able to plasticize the wood material at room temperature to a higher degree compared to untreated control. At approximately 50 °C a peak appears for all three PF treatments. Backman-Sandlund (2004) and Kelley et al. (1987) claimed, that this peak is probably attributed to relaxation transitions of hemicelluloses for wood with sufficient moisture content. The control sample, which had initial moisture content of 10%, probably undergoes drying due to the temperature increase and do not contain sufficient water to display this relaxation peak.

Natural resources and bioeconomy studies 80/2017
258
A second peak appears at 115 °C for the mmwPF and at 120 °C for the lmwPF indicating the plasticization of lignin. This result is in accordance with findings from Salmen (1984) demonstrating similar temperatures of lignin plasticization under water-saturated conditions. The hmwPF displays no peak but an increasing of the loss factor attributed to the shift of curing reaction towards lower temperature.
The results from DMTA measurements suggests an interaction of PF with the cell wall compounds leading to a plasticization of the wood material. Additionally, the ASCmic/mac values show that swelling of wood can prinipially be affected by PF resulting in a higher degree of wood softening. Thus, swelling of wood due to PF impregnation has been found to be a determining factor for evaluating the potential of plasticizing of beech wood for lmwPF and mmwPF treatment. Mainly low molecular weight fractions seem to penetrate the wood cell walls. The deviating behaviour of the hmwPF indicates that more factors must be included to evaluate the potential of PF to plasticize wood. This conclusion supports findings from Sadoh (1981) proposing that swelling of the material is not solely responsible for plasticizing wood. Moreover, the particular chemical structure and certain interactions between swelling agent and wood substance have a dominant effect on the mode of plasticization.
Conclusions 4.Following claims can be concluded from the obtained results:
The used lmwPF and mmwPF impregnation induce a greater swelling of the wood compared to water-saturation. HmwPF treated samples display a lower swelling compared to water-saturation.
Even hmwPF can penetrate cell walls affecting a bulking effect in the material. It is conceivable, that only low molecular fractions penetrate the cell walls, whereas the higher molecular weight fractions remain in the cell lumina.
The lmwPF shows highest swelling values and display also the greatest plasticization of the wood specimens. Also, the mmwPF impregnation shows high swelling values as well as considerable plasticizing properties.
HmwPF treated samples display lowest swelling values and at the same time the lowest potential to plasticize the tested beech woos at elevated temperatures. Furthermore, hmwPF induces a different material behaviour of the treated wood. Thus, the potential of swelling the wood substance might be the only factor affecting the plasticization potential of PF.
Acknowledgements The authors gratefully acknowledge the German Federal Ministry for Education and Research for the financial support (grant number 03FH001PX4). Furthermore, we like to acknowledge Prefere Resins® Germany GmbH Erkner for providing the PF resins.
References Backman-Sandlund, A. C. 2004. A study of wood adhesion and interactions using DMTA. Doctoral
thesis, Lulea University of Technology, Skelleftea, Sweden. Buchelt, B., T. Dietrich and A. Wagenführ. 2012. Macroscopic and microscopic monitoring of swelling of
beech wood after impregnation with furfuryl alcohol. Eur J Wood Wood Prod. 70(6): 865–869. Furuno, T., Y. Imamura and H. Kajita. 2004. The modification of wood by treatment with low molecular
weight phenol-formaldehyde resin: a properties enhancement with neutralized phenolic-resin and resin penetration into wood cell walls. Wood Sci Technol. 37: 349–361.
Gabrielli, C. P. and F. A. Kamke. 2010. Phenol–formaldehyde impregnation of densified wood for improved dimensional stability." Wood Sci Technol. 44(1): 95–104.

Natural resources and bioeconomy studies 80/2017
259
Herold N, Pfriem A (2013) Impregnation of veneer with furfuryl alcohol for an improved plasticization and moulding. Eur J Wood Wood Prod. 71 (2): 281–282.
Hill, C. A. S. and G. A. Ormondroyd. 2005. Dimensional changes in Corsican pine (Pinus nigra Arnold) modified with acetic anhydride measured using a helium pycnometer. Holzforschung. 58 (5): 554–547.
Kelley S. S, S. G. Rials and W. G. Glasser. 1987. Relaxation behaviour of the amorphous components of wood. J Mater Sci. 22: 617–624.
Kim, M. G., W. L. S. Nieh and R. M. Meacham. 1991. Study on the curing of phenol-formaldehyde resol resins by dynamic mechanical analysis. Ind Eng Chem Res. 30: 798–803.
Knop, A. and L. A. Pilato. 1985 Phenolic resins. Chemistry, applications and performance-Future directions. Chapter 5. Springer Verlag, Berlin Heidelberg.
Lei Y. and Q. Wu. 2006. Cure kinetics of aqueous phenol-formaldehyde resins used for oriented strandbord manufacturing: Effect of wood flour. J Appl Polym Sci. 102: 3774–3781.
Mantanis, G. I., R. A. Young and R. R. Rowell. 1994. Swelling of Wood Part II. Swelling in Organic Liquids. Holzforschung. 48: 480 –490.
Menard, K. P. 2008. Dynamic mechanical analysis – A practical introduction. 2nd Edition. Chapter 2. Taylor & Francis Group, Boca Raton.
Olsen, E. and R. H. Plow. 1939 Lignin molding compound. Patent. US 2,156,160. Pizzi, A. 2003. Phenolic resins. In: Pizzi, A. and K. L. Mittal. Handbook of Adhesive Technology. 2nd
edition, Taylor & Francis, New York, Basel. Sadoh, T. 1981. Viscoelastic properties of wood in swelling systems. Wood Sci Technol. 15: 57–66. Salmén, L. 1984. Viscoelastic properties of in situ lignin under water-saturated conditions. J Mater Sci.
19(9): 3090–3096. Schuerch C. 1966. Method of forming wood and formed wood products. Patent. US 3,282,313. Shams, M. I., H. Yano and K. Endou. 2004. Compressive deformation of wood with low molecular weight
phenol formaldehyde (PF) resin I: effects of pressing and pressure holding. J Wood Sci. 50: 337–342.
Stamm A. J., R. M. Seborg. 1955. Resin-treated, laminated, compressed wood (Compreg). FPL Report 1381, reviewed and reaffirmed 1960, U.S. Department of Agriculture, Forest Products Laboratory, Madison, Wisconsin

Natural resources and bioeconomy studies 80/2017
260
Visual and machine strength grading of European ash and maple
Andriy Kovryga1*, Peter Stapel1, Jan-Willem van de Kuilen1,2
Abstract
Medium-dense hardwoods show higher tensile strength values compared to softwoods. These advantages cannot be utilized effectively as the grading of hardwoods is less developed. The aim of the present paper is to analyse the potential of European ash (Fraxinus sp.) and maple (Acer sp.) grown in Central Europe and graded using different grading methods. Therefore, for 869 hardwood boards, the visual grading characteristics were determined and the dynamic MoE and x-ray attenuation were measured using an industrial scanner. Afterwards, the specimens were tested in tension in accordance with EN 408:2010. The ash and maple boards graded after the German visual grading rules show characteristic strength values of 28 MPa and 30 MPa respectively. Higher characteristic strength values can be obtained for combined visual and machine strength grading (62 MPa for ash and 42 MPa for maple). The obtained values are in good agreement with tensile profiles of medium-dense hardwoods. The machine grading using a multisensory system allows higher strength prediction compared to the dynamic modulus of elasticity only.
Introduction 1.Medium-dense hardwoods such as beech, ash and oak are known for their excellent mechanical properties. This makes them favourable for engineered wood products, as the higher mechanical properties compared to softwoods can be utilized to create more slender structural elements, reach longer spans or reinforce softwood elements locally. The key role for utilizing the mechanical properties of hardwoods, particularly for the glulam production, is the strength grading of the boards. The mechanical properties estimated during the strength grading, particularly tensile strength and stiffness, are the required input parameters for modelling the mechanical properties of glulam beams (e.g. Frese and Blaß 2007).
Whereas beech remains the most studied species in Central Europe due to its high availability, other species have become more interesting due to increasing hardwoods forest area, as well as their attractive mechanical properties. Ash glulam, as reported by Van de Kuilen and Torno (2014), shows similarly high load bearing capacities comparable to beech glulam (Frese and Blaß 2007). However, characteristic tensile properties of graded ash lamellas have not been derived so far and classification is not optimized for this wood species. The visual grading is restricted to bending strength classes only with the tensile strength values derived on the safe side. For grading beech lamella used for glulam, the combination of dynamic modulus of elasticity and visual assessment has been proposed by Frese and Blaß (2007) and includes requirements on the dynamic modulus of elasticity Edyn for the high-quality boards. Recent work by Erhard et al. (2016) on beech confirms the selected approach; however, no optimized classification is available for ash or other species, such as maple, becoming interesting due to the climate change (Kolling 2007). * Corresponding author: Tel.: +4921806473; E-mail: [email protected]
1Holzforschung München Technische Universität
München Munich, Germany
2Faculty of Civil Engineering and Geosciences
Delft University of Technology Delft, the Netherlands

Natural resources and bioeconomy studies 80/2017
261
Within the present paper, the potential of the ash and maple boards is analysed with regard to different grading techniques – visual and combined visual and machine strength grading. Mechanical properties and yields are optimised for both species. Additionally, the mechanical properties are compared to the material properties profiles suitable for the glulam production presented by Kovryga et al. (2016b). Finally, the potential of machine strength grading using a combined predictor is analysed. The mechanical strength grading of hardwoods is currently limited to chestnut using only Edyn (Nocetti et al. 2010). Generally, a low correlation between Edyn and timber strength is found for hardwoods (Ravenshorst et al. 2004).
Materials 2.To study the mechanical properties of ash (Fraxinus sp.) and maple (Acer sp.) boards, a total of 862 specimens were sampled from Central and Northern Germany. Table 1 gives an overview of the cross-sections and sub-samples tested. The sample for ash included three sub-samples originating from northern Bavaria (BAY) and Thuringia (TH I and TH II) respectively and the sample for maple included only logs from Thuringia. The boards from Bavaria were cut from 200 to over 600 mm diameter logs to 5m long boards using a band saw omitting the pith. Usually, for hardwoods, a pith-free cutting pattern is chosen, as boards with pith tend to split and warp more frequently. The samples from Thuringia were cut to 3m boards from 200-390mm large logs. For Thuringia samples a cutting pattern including pith was chosen to study the possibility of utilizing the entire wood material and therefore to reduce “waste”.
Table 1. Sample sizes and dimensions for ash and maple species.
Speci- men
Sub- Sample
Height x width [mm] Sample size 25x100 25x125 25x85 30x100 30x125 35x100 35x125 35x160
Ash
BAY 84 95 179 TH I
83
83
TH II 78 73 69 220 Maple 84 61 57 66 69 44 381
Methods 3.
Visual strength grading 3.1.Visual strength grading is regulated in Europe in national grading standards and uses visible criteria to assign specimens to the visual grades. For the present study, German visual grading standard DIN 4074-5:2008 rules for boards (‘‘Brett/Bohle’’) were applied to ash and maple boards. The standard includes ten visual criteria to assign hardwood boards into the visual grading classes. In the current study, the knottiness, presence of the pith, bark inclusion, wane and fibre deviation are considered. The growth ring width is not included into the DIN 4074-5 and is not considered relevant for hardwoods when strength is concerned.
DIN 4074-5 defines several knottiness parameters to assess the quality of boards. Single Knot
(SK) or DIN Einzelast Brett (DEB) is defined as the ratio between the size of the largest knot related to the width of the board. The size includes dimensions (width parallel to the edge) of an individual knot on all board surfaces. Knot cluster (KC) or DIN Astansammlung Brett (DAB) is a multiple knot criterion, which considers all knots appearing in a moving window of 150 mm. Therefore, the spread of all knots over the 150 mm window is related to the width of the board. Both grading criteria (SK and KC) are relevant for the grading of boards and beams. Edge knot criterion (E) or Schmalseitenast is an optional criterion for boards, used for glulam production and represents the penetration depth

Natural resources and bioeconomy studies 80/2017
262
of the knots appearing on the edge side only. The low value of the visual grading criteria stands for either rare occurrence or small size of the strength reducing knots and vice versa.
The fibre deviation is defined as aberration of fibres from the loading direction over a certain length and is measured in % (grain angle). The fibre deviation occurs locally as the wood fibres envelop the knots and globally as an angle to the longitudinal board axis and in specific cases such as spiral or cross grain. The grain angle has a significant impact on the strength (Hankinson 1921). Most grading standards indicate that the fibre deviation can be measured on drying checks or by the scribbling method on the wood surface. Both methods are reported to have limited use for medium-dense hardwoods mainly because of indistinct or unclear fibre orientation and local fibre deviations (Glos and Lederer 2000, Frühwald and Schickhofer 2005). In the present study, the visible fibre deviation is detected on drying checks and, additionally, the surface is assessed qualitatively for fibre deviations exceeding the limits of DIN 4074-5. The specimens exceeding the limits are graded as ´reject´.
Hardwood boards are assigned to the visual grades LS13 (highest quality) to LS7 (lowest quality) based on boundaries listed in Table 2. To assign a lamella to the visual grade, all boundary values are to be met; otherwise, the specimen is assigned to the next lower grade or rejected.
Table 2. Boundary values for grading of hardwood lamellas after DIN 4074-5:2008
Grading parameter LS13 LS10 LS7
Single Knot (SK) 0.2 0.333 0.5
Knot Cluster (KC) 0.333 0.5 0.666
Edge knot (E)* - - -
Pith no no no
Fibre deviation 7% 12% 16% *no requirements on the parameter
Machine strength grading 3.2.The machine grading parameters were determined for both hardwood species. The dynamic modulus of elasticity longitudinal to the grain (Edyn) was measured using laboratory equipment and within a multi-sensor system, as shown below. Edyn combines the eigenfrequency measurement with density measurement using Eq.1 and is dependent on the length of the board. The R² between laboratory and in a multisensory-system is 99%.
Edyn = 4f2 l2ρ (1)
The machine strength grading was performed using the GoldenEye 706 by MiCROTEC. The multi-scanner system combines vibration measurement and x-ray scan to measure the dynamic modulus of elasticity, density and knottiness (Giudiceandrea 2005, Bacher 2008). These parameters are used to predict the mechanical properties. The combination of measured parameters yields in a mathematical model (indicating property, IP) allowing for the best strength prediction. For the current study, individual regression models (Eq. 2) combining Edyn and a knottiness parameter from x-ray scan (IPKNOTS) are created for each hardwood species. The tensile strength is log-normally transformed.
ln (IP ft) ~ IPKNOTS + Edyn (2)

Natural resources and bioeconomy studies 80/2017
263
Additionally, for grading of the boards, the combined visual and machine strength grading was applied. There, the Edyn measured in Eq.1 is combined with the visual assessment of boards (section 3.1) by applying separate boundaries for each of the parameters and without allowing the interaction of both parameters in the regression model. This option was suggested by Frese and Blaß (2007) for beech glulam and is used in the German technical approval Z-9.1-679.
Destructive tests 3.3.The specimens were tested in tension in accordance with EN 408:2010 and EN 384:2016 with a testing span of 9 times the width. For all the specimens the grade determining properties density, modulus of elasticity and tensile strength were measured after conditioning and testing under the reference conditions 20 °C and 65 % rel. humidity. The density was determined on the clear wood specimens after EN 408. The moisture content (m.c.) was measured in accordance with EN 13183-1:2002 and was on average 11 % for each of the species and sub-samples. The modulus of elasticity and density were adjusted to the reference moisture content of 12 % and the tensile strength adjusted to 150 mm width using the equations listed in EN 384:2016. The characteristic values were calculated in accordance with EN 14358:2016 using the non-parametric method.
Optimisation of the grading boundaries 3.4.The boundaries of the grading parameters for the visual grading (section 3.1) and for the combined visual and machine strength grading (section 3.2) are currently not optimized for ash and maple and their mechanical properties determined in a tension test (EN 408). In this study, the grading boundaries are optimized for both species individually with regard to both yield and mechanical properties (section 3.5). The desired objectives of both higher yield and higher strength class assignment are conflicting, as higher yields can only be obtained by reducing the values of assigned mechanical properties. To find solutions satisfying both conflicting objectives, the genetic algorithm NSGA-II presented by Deb et al. (2002) has been applied, which is a multi-objective optimization routine.
The idea of genetic algorithms roots in the evolutionary theory, particularly the extinction of weak and unfit species by the natural selection (Konak et al. 2006). Kovryga et al. (2016a) explain the application of the algorithm for wood grading in detail. The output of the algorithm is a set of boundary combinations better in at least one objective and not worse than the other solutions in all objectives (yield and mechanical properties).
Tensile strength classes 3.5.Currently, for hardwoods, no tensile strength classes are listed in the European strength class systems. The highest tensile strength class for softwoods is T30 (characteristic tensile strength 30 MPa). To study the potential of hardwood species, the material profiles derived by Kovryga et al. (2016b) are used. Table 3 shows the material profiles named DT (Deciduous Tensile) Classes.
Table 3. Proposed tensile strength classes for hardwoods, adapted from Kovryga et al. (2016b) Property DT18 DT22 DT25 DT28 DT30 DT34 DT38 DT42 DT46 DT50 DT54 DT58 DT62
ft,0,k [MPa] 18 22 25 28 30 34 38 42 46 50 54 58 62
E0,mean [GPa] 10 11.5 12.5 13.5 14 15 15.5 16 16.5 16.5 17 17.5 18
ρk [kg/m³] 550 550 550 550 550 610 620 620 630 630 640 640 650

Natural resources and bioeconomy studies 80/2017
264
Results and discussion 4.
Ungraded properties 4.1.Table 4 shows the values for the visible and mechanical properties of ungraded ash and maple boards. For ash, the mechanical properties are comparable to the values reported by Frühwald and Schickhofer (2005). However, the 5th percentile tensile strength is lower. Van de Kuilen and Torno (2014) reported higher values for specimens tested with a reduced free testing length to model ash glulam. Maple shows tensile properties lower than that of ash. Glos and Torno (2008) reported lower values compared to ash for maple bending strength as well.
The variation of tensile strength is very high for both species (CV = 0.49) and is similar to other studies on hardwoods (Erhardt et al. 2016, Frühwald and Schickhofer 2005, Van de Kuilen and Torno 2014).
Table 4. Descriptive statistics of visual and mechanical properties for ash (Fraxinus sp.) and maple (Acer sp.) lamella
Species N Statistics SK [-] KC [-] Edyn [GPa] ρ [kg/m³] Estatic [GPa] ft [MPa]
Ash
481 µ 0.077 0.099 15.3 685 14.5 61.7
CV [-] 1.25 1.29 0.15 0.08 0.19 0.50 Q0.05 0.00 0.00 10.8 577 9.6 21.7
Maple
381 µ 0.115 0.149 14.5 664 13.8 53.4
CV [-] 0.99 1.00 0.12 0.07 0.16 0.49 Q0.05 0.00 0.00 11.7 568 10.0 18.9
Observation of grading parameters 4.2.The effect of grading parameters, except the knots, on tensile strength can be observed in the cumulative distribution function of tensile strength for ash and maple lamellas (Fig. 1). The boards with visually observable fibre deviation show tensile strength values in the lower part of the strength distribution for both species. Despite that the fibre deviation is hard to measure on the surface and might not represent the real slope of grain (Frühwald and Schickhofer 2005) specimens showing a visible fibre deviation should be rejected. Rejecting those specimens affects the bottom part of the distribution (Fig. 1), and is a criterion used by Erhardt et al. (2016) for the grading of beech boards in classes reaching char. strength values of 50 MPa. Measuring the actual fibre deviation could improve the segregation between low and high strength boards even further.
For both ash and maple lamellas, the specimens containing pith (154 for ash and 137 for maple) show a higher frequency of lower strength values compared to the cumulative frequency distribution of the whole data set. The mean strength values for the pith boards are with 49.7 MPa and 44.9 MPa for ash and maple lower compared to pith-free boards with 67.2 MPa and 58.4 MPa. This supports the findings by Glos and Lederer (2000) and Frühwald and Schickhofer (2005) showing the strength reducing effect of the pith. Nevertheless, strength values of specimens containing pith range up to 130 MPa with a significant share of test values above 40 MPa (over 50% for ash and 40% for maple). Rejecting the pith during visual assessment oversimplifies the relationship and leads to lower yields and not necessary higher strength values. In addition, other criteria within boards showing pith such as knottiness or the fibre deviation have an impact on the strength. Figure 2 shows an example of pith board with failure induced by the slope of grain.

Natural resources and bioeconomy studies 80/2017
265
Figure 1. Empirical CDF of tensile strength grouped by the defect type for ash (left) and maple (right)
Figure 2. Maple specimen 7020, failure due to extreme slope of grain
The application of the pith criterion should be discussed in the light of the final product. Pith boards tend to have a higher number of splits and therefore negatively affect the properties of the glulam beam, such as tensile strength perpendicular to the grain. Hübner (2013) revealed that for ash glulam tensile strength perpendicular to the grain differs significantly between pith boards and the ones without pith.
Visual grading 4.3.Table 5 shows the visual grading results. The yield to the highest grade LS13 accounts for over 50% of ash and maple boards. The rejects make up the second highest category with over 30%. This supports the findings by Glos and Torno (2008) that the quality of hardwood timber is either high or on the rejectable quality level. The high share of rejects is mainly caused by a large number of pith boards due to the sawing pattern. Table 6 shows the mechanical properties of ash and maple lamellas. The high share of specimens to the highest grades does not allow assigning a property value for the pieces in lower grades. The mechanical properties for LS10 are calculated using the parametric method only. The characteristic tensile strength of LS 13 is 28.7 MPa for ash and 34 MPa for maple. The Estatic are similar for both ash and maple, however, the value is with 14.9 GPa slightly higher for ash.
If the specimens are assigned to the DT- Classes (Table 3), the characteristic value of ash exceeds the requirements of DT28, whereas the values of maple lamellas match the requirements of DT30, if the density value is not considered. For the assignment of LS13, the tensile strength was the grade-limiting property. Density values are slightly below the required threshold (550 kg/m³). However, the threshold values for density should be regarded cautiously. Due to the missing correlation between density and strength, as well as a large variety of specimens Frühwald and Schickhofer (2005) and Kovryga et al. (2016b) suggested to declare density separately.
LS 10 boards can be assigned to the T classes after EN 338:2016 only, as Kovryga et al. (2016a) do not specify classes lower than DT18 based on their analysis. Therefore, maple and ash match the

Natural resources and bioeconomy studies 80/2017
266
requirements of T13 and T16 respectively; however, due to the low sample size (< 40), the parametric method was applied. In this case, T-Classes utilise properties more efficiently, as for LS10 assigned to T Classes higher Estatic can be assigned even compared to DT22.
Table 5. Relative yields in [%] for the visual strength grading after DIN 4074-5 for ash and maple lamellas
Species LS13 LS10 LS7 Rej Ash 61.3 7.1 1.1 30.4
Maple 50.3 9.7 3.8 36.3
Table 6. Mechanical properties of ash (Fraxinus sp.) and maple (Acer sp.) lamellas graded in acc. with the German visual grading standard DIN 4074-5
Species Visual grade N
ρ [kg/m³] Mean [GPa] ft [MPa] Tensile class
µ CV[-] Q0.05 µ CV µ CV [-] Q0.05
Ash LS 13 276 678 0.92 559 14.9 0.19 74 0.41 28.7 DT28 LS 10 32** 690 0.68 613 12.3 0.16 31 0.28 17.0 T16
Maple LS 13 187 653 0.68 546* 14.5 0.15 66.9 0.35 34.0 DT30 LS 10 36** 679 0.46 615 12.6 0.17 32.9 0.34 13.4 T13
*characteristic density does not match the requirements of the strength class **sample size below 40
Although the differences between the samples are not addressed in this paper, the characteristic properties of samples from Thuringia (THI and TH II) exceed the values required for the class DT30 with characteristic strength of over 30 MPa, whereas for Bavarian boards with the characteristic tensile strength of 23.8 MPa an assignment to DT22 is possible.
Combined visual and machine strength grading 4.4.Combined visual and machine grading allows for higher characteristic values compared to the visual grading. In the following, the optimised boundary combinations are presented for ash and maple lamellas, allowing optimal yields for the desired mechanical properties. Generally, for ash lamellas boundaries for assigning lamellas to the characteristic tensile strength of 62 MPa are possible, however, the yields are low (11%). Compared to ash, maple shows lower characteristic tensile strength values with 42 MPa for the highest class assignment. Considering the economic benefits for the producer, class combinations with yields above 20% are more reasonable and are presented in the following.
Table 7 shows the selected optimal boundary combinations for ash. First, the combination (solution “A”) with the strength class allows economically attractive yield (23%) and high
characteristic properties (DT54). Solution “B” and “C” show the boundaries for assigning the highest grade to DT38. This appears to be currently the most efficient possibility, as for the ash using available glueing systems characteristic tension strength of finger joints of as high as 35.1 MPa can be achieved (Van de Kuilen and Torno 2014). The solution “B” and “C” differ in mechanical properties of
the second class (Grade 2). Combination “B” allows for assigning the second grade to DT34 and “C”
only to DT18, however, with the highest yields to Grade 1. DT38 with 49% and solution B, despite the low yields, allows grading the lower grade to DT34.
The coefficient of variation for combined grading is lower than for visual grading and falls for ash DT54 below 0.27 and 0.09-0.1 for the characteristic Estatic. For maple, the CV of Estatic is even lower (0.08-0.09).
Table 8 shows the boundary combinations for maple. Solution “A” allows obtaining the highest
possible mechanical properties comparable to DT42, derived on more than 40 specimens required for non-parametric calculation after EN 14358:2016. For all strength classes, the characteristic mechanical properties fit the required values, so that an increase in all values is required for a higher

Natural resources and bioeconomy studies 80/2017
267
strength class assignment. Grading to DT38 allows assigning the second lowest grade to DT25. The yield to DT25 can be as high as 31.5 %.
Table 7. Grading boundaries and mechanical properties for combined visual and machine strength grading of ash boards
Solution Boundary values Characteristic values Tensile
Class Yield [%] Grade SK [-] KC [-] E [-] Pith Edyn [GPa] ρk [kg/m³] E0,mean [GPa] ftk [MPa]
A Grade1 0.1 0.3 0.2 no 16.0 650 17.2 54.5 DT54 23.1 Grade2 0.2 0.5 1 yes 15.5 630 16.0 34.0 DT34 26.0 Reject 50.9
B Grade1 0.2 0.2 1 yes 16.5 650 17.3 40.6 DT38 27.8 Grade2 0.3 0.3 1 yes 15.5 630 15.5 34.4 DT34 23.1 Reject 49.1
C
Grade1 0.1 0.1 1 yes 13.1 630 16.0 38.4 DT38 56.4 Grade2 1 1 1 yes - 550 12.8 18.2 T18 43.6
Reject
0.0
For both ash and maple, the presented combinations allow grading to a combination of two grades (grade 1 and grade 2) in one pass. Due to the strict grading boundaries, applied to achieve high characteristic property values, the number of rejects is over 40 % for ash and over 30 % for maple. The high number of rejects is comparable to the classification after German approval Z-9.1-679 (2013) for beech lamellas with lower quality boards rejected. The share of rejects can be reduced by introducing new boundaries for lower valued individuals (introducing a lower grade). For that purpose, the utilization of the low quality specimens for the glulam production should be studied in more detail.
The optimised boundaries for grading ash or maple using the combined approach allows for pith in boards. In terms of characteristic properties, this works for all combinations with an exception for grading ash to DT54 (solution “A”). For achieving characteristic tensile strength values below 54 MPa
the pith criteria seems to be less important. The observation made for the pith criterion in the CDF for tensile strength in section 4.2 substantiates this conclusion. A separate analysis for the effect of pith on the properties of glulam is required.
Table 8. Grading boundaries and mechanical properties for combined visual and machine strength grading of maple boards
Solution Grade Boundary values Characteristic values Tensile
Class Yield [%] SK [-] KC [-] E [-] Pith Edyn[GPa] ρk [kg/m³] E0,mean [GPa] ftk [MPa]
A Grade 1 0.1 0.1 0.7 yes 15.0 620 16.0 42.0 DT42 24.2 Grade 2 0.2 0.2 0.9 yes 10.0 550 13.6 28.0 DT28 41.4
Reject 34.4
B Grade 1 0.1 0.1 0.8 yes 14.0 610 15.5 41.3 DT38 36.6 Grade 2 0.2 0.5 0.9 yes 12.5 600 13.6 26.3 DT25 31.5
Reject 32.0
Potential of machine strength grading 4.5.To assess the potential of the mechanical strength grading, the multiple regression approach is used. Figure 3 shows the scatter plot for predicted and tested tensile strength values. The model used is a combination of Edyn and knottiness obtained using x-ray radiation. Specimens not meeting the visual override criterion for fibre deviation are not considered for the analysis. The broad scatter in tensile strength values for increasing predicted strength tensile strength can be observed. The model explains 42.3 % of tensile strength variation for ash and 40.8 % for maple. The prediction strength is lower compared to similar softwood models, where R² of as high as 0.69 are reported (Bacher 2008).
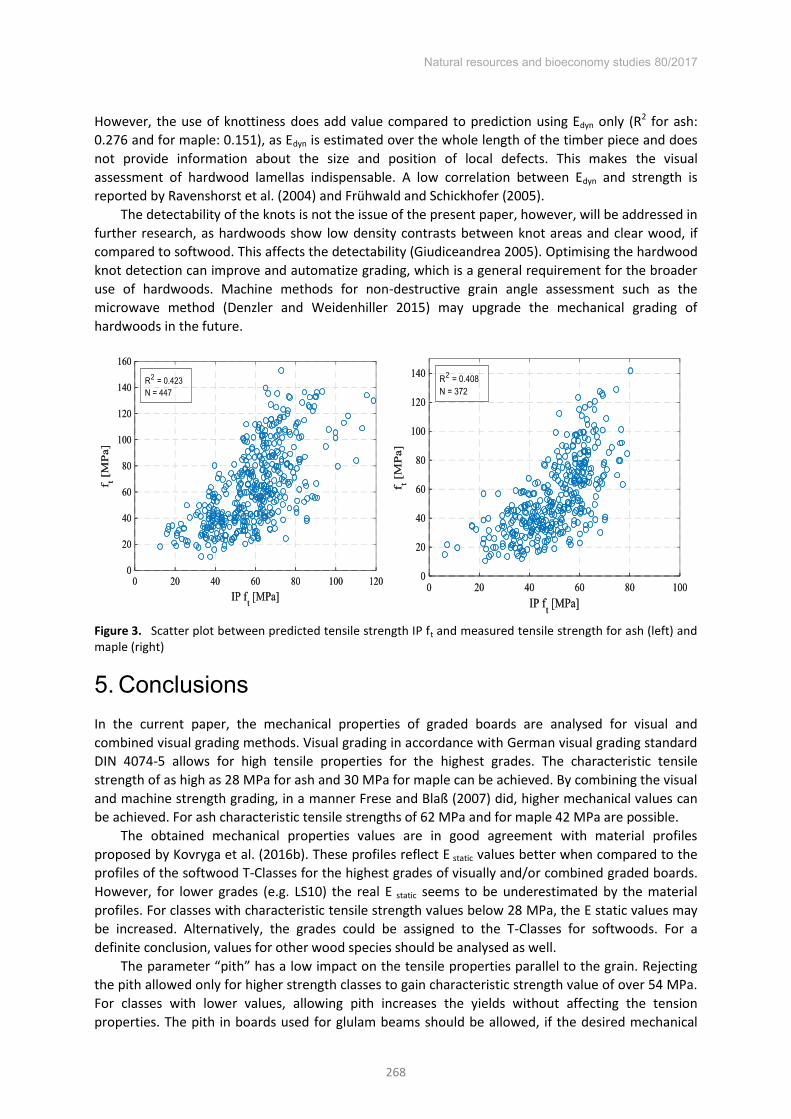
Natural resources and bioeconomy studies 80/2017
268
However, the use of knottiness does add value compared to prediction using Edyn only (R2 for ash: 0.276 and for maple: 0.151), as Edyn is estimated over the whole length of the timber piece and does not provide information about the size and position of local defects. This makes the visual assessment of hardwood lamellas indispensable. A low correlation between Edyn and strength is reported by Ravenshorst et al. (2004) and Frühwald and Schickhofer (2005).
The detectability of the knots is not the issue of the present paper, however, will be addressed in further research, as hardwoods show low density contrasts between knot areas and clear wood, if compared to softwood. This affects the detectability (Giudiceandrea 2005). Optimising the hardwood knot detection can improve and automatize grading, which is a general requirement for the broader use of hardwoods. Machine methods for non-destructive grain angle assessment such as the microwave method (Denzler and Weidenhiller 2015) may upgrade the mechanical grading of hardwoods in the future.
Figure 3. Scatter plot between predicted tensile strength IP ft and measured tensile strength for ash (left) and maple (right)
Conclusions 5.In the current paper, the mechanical properties of graded boards are analysed for visual and combined visual grading methods. Visual grading in accordance with German visual grading standard DIN 4074-5 allows for high tensile properties for the highest grades. The characteristic tensile strength of as high as 28 MPa for ash and 30 MPa for maple can be achieved. By combining the visual and machine strength grading, in a manner Frese and Blaß (2007) did, higher mechanical values can be achieved. For ash characteristic tensile strengths of 62 MPa and for maple 42 MPa are possible.
The obtained mechanical properties values are in good agreement with material profiles proposed by Kovryga et al. (2016b). These profiles reflect E static values better when compared to the profiles of the softwood T-Classes for the highest grades of visually and/or combined graded boards. However, for lower grades (e.g. LS10) the real E static seems to be underestimated by the material profiles. For classes with characteristic tensile strength values below 28 MPa, the E static values may be increased. Alternatively, the grades could be assigned to the T-Classes for softwoods. For a definite conclusion, values for other wood species should be analysed as well.
The parameter “pith” has a low impact on the tensile properties parallel to the grain. Rejecting
the pith allowed only for higher strength classes to gain characteristic strength value of over 54 MPa. For classes with lower values, allowing pith increases the yields without affecting the tension properties. The pith in boards used for glulam beams should be allowed, if the desired mechanical

Natural resources and bioeconomy studies 80/2017
269
properties of the final product glulam remain unaffected (e.g. tensile strength perpendicular to the grain).
Finally, the potential of fully automated grading system using a combination of the modulus of elasticity and knot detection is studied. With the coefficient of determination of 0.423 for ash and 0.408 for maple, an increase compared to the dynamic strength prediction can be reported. Further analysis and research are required for adoption of existing or the introduction of new technologies for grading of hardwoods.
Acknowledgements The research was supported by the German Federal Ministry of Food and Agriculture (BMEL).
References Bacher, M. 2008. Comparison of different machine strength grading principles. In: Proc. of Conference
COST E53. Delft, The Netherlands, 29-30 October. Deb, K., Pratap, A., Agarwal, S. and T. Meyarivan. 2002. A fast and elitist multi-objective genetic
algorithm: NSGA-II. IEEE transactions on evolutionary computation 6 (2): 182–197. Denzler, J. K. and A. Weidenhiller. 2015. Microwave scanning as an additional grading principle for sawn
timber. European Journal of Wood and Wood Products 73 (4): 423-431. DIN 4074-5:2008. Strength grading of wood - Part 5: Sawn hard wood. EN 13183-1:2002. Moisture content of a piece of sawn timber -
Part 1: Determination by oven dry method. EN 14358:2016. Timber structures‐Calculation of characteristic 5-
percentile and mean values for the purpose of initial type testing and factory production control. EN 338:2016. Structural timber – Strength classes. EN 384:2016. Structural timber -
Determination of characteristic values of mechanical properties and density. EN 408:2010. Timber structures -Structural timber and glued laminated timber -
Determination of some physical and mechanical properties. Erhardt, T., Fink, G., Steiger, R. and A. Frangi. 2016. Strength grading of European beech
lamellas for the production of GLT & CLT. In: Proc. of 49th INTER & CIB Meeting. Graz, Austria. Frese, M. and H. J. Blaß (2007): Characteristic bending strength of beech glulam. Mater Struct 40 (1): 3–
13. DOI: 10.1617/s11527-006-9117-9. Frühwald, K. and G. Schickhofer. 2005. Strength grading of hardwoods. In 14th International Symposium
on Nondestructive testing of wood, pp. 198–210. Giudiceandrea, F. 2005. Stress grading lumber by a combination of vibration stress waves and Xray
scanning. In: 11th International Conference on Scanning Technology and Process Optimization in the Wood Industry (ScanTech 2005), pp. 99–108.
Glos, P. and B. Lederer. 2000. Strength grading of beech and ash timber and determination of corresponding characteristic strength and stiffness values (in German). Report Nr. 98508. TU München.
Glos, P.and S. Torno. 2008. Allocation of domestic maple, ash and poplar species into the European Standard EN 1912: “Structural timber - Strength classes - Assignment of visual grades and species” (in German). Report Nr. 06517 B. TU München.
Hanikinson, R. L. 1921. Investigation of Crushing Strength of Spruce at Varying Angles of Grain. Air Service Information Circular No. 259. U.S. Air Service
Hübner, U. 2013. Mechanical properties of European beech, ash and robinia for load dispatching structural elements (in German). PhD Thesis. Technische Universität Graz.
Kolling, C. 2007. Climate shells for 27 forest tree specimens (in German). AFZ-DerWald (62), pp. 1242–1245.
Konak, A., David, W. C. and E.S. Alice. 2006. Multi-objective optimization using genetic algorithms: A tutorial. Reliability Engineering & System Safety 91 (9): 992–1007.
Kovryga, A., Stapel, P. and J. W. G. van de Kuilen. 2016a. Optimizing characteristic properties of visually graded soft- and hardwoods lamellas for the glulam production. In: Proceeding of WCTE 2016. Vienna, Austria, August 23-25. Wien: TU Verlag.

Natural resources and bioeconomy studies 80/2017
270
Kovryga, A., Stapel, P. and J. W. G. van de Kuilen. 2016b. Tensile strength classes for hardwoods. Paper 49-10-1. In: Proc. of 49th INTER & CIB Meeting. Graz, Austria.
Nocetti, M., Bacher, M., Brunetti, M., Crivellaro, A. and J.W.G. van de Kuilen. 2010. Machine grading of Italian structural timber: preliminary results on different wood species. In: Proceeding of WCTE 2010. Riva del Garda, Trento, Italy, June 20-24
Ravenshorst, G.J.P., van der Linden, M.L.R., Vrouwenvelder, T. and J.W.G. van de Kuilen. 2004. An economic method to determine the strength class of wood species. Heron 49 (4): 297-326.
Van de Kuilen, J.-W. G and S. Torno. 2014. Material properties of ash for application in glulam (in German). TU München.
Z-9.1-679 2013. German technical building approval issued by DIBt for “Glulam from beech wood and beech hybrid glulam beams” (in German). Approval issued first on 07. Oct. 2009; approval holder: Studiengemeinschaft Holzleimbau e. V

Natural resources and bioeconomy studies 80/2017
271
Session V Hardwood biorefining and value-added chemical products
Natural resources and bioeconomy studies 80/2017
272
Mathematical approach to build a numerical tool for mass loss prediction during wood torrefaction
Edgar Silveira1, Bo-Jhih Lin1, Baptiste Colin1*, Mounir Chaouch2, Anélie Pétrissans1, Patrick Rousset3, Mathieu
Pétrissans1
Abstract
Facing the decrease of fossil fuels resources, it becomes important to enhance the biomass use as a source of energy. Wood biomass and forest residues offer a large renewable energy source. However, wood has viscous-elastic and plastic behaviors and its grinding requires a lot of energy. Torrefaction is a heat treatment process that increases wood grindability, carbon content and thus the energy density. It has been shown that energy balance between the grinding energy gain, the increase of wood heating value and the energy consumption for torrefaction is favorable. In the same way, the heat treatment process can be used to produce a building material with improved properties (low hygroscopicity and high resistance to fungal attacks). In both cases, the properties of the treated material depend on the mass loss during the process. Hence, controlling the torrefaction process means to control accurately this parameter. The purpose of this study is to develop a numerical tool to predict the torrefaction mass loss. The mass loss kinetics for wood torrefaction was studied using equipment specially conceived to measure the mass sample during heat treatment. A two-step kinetic scheme, based on pseudo-components, was used to represent the decomposition of hardwood under heat effect. The mathematical formulation leads to differential equations describing the evolution of each pseudo-component as a function of time. The model’s parameters consist of preexponential factors and activation energies required to calculate the reaction constants based on the Arrhenius equation. The high temperature dependence of torrefaction process is thus considered through these kinetic constants. The numerical model is then solved using the commercial software Matlab in non-isothermal conditions and the parameters are determined by fitting the numerical and the experimental results.
Introduction 1.The heat treated wood is well known in the area of wood processing for the use as an energy source or as a material in the field of construction. In the first case, the heat treatment process is applied on wood chips and is classically called torrefaction. The aim is thus to improve wood properties by increasing its grindability (Bergman et al. 2005, Colin et al. 2017) and its energy content (Chew and Doshi 2011, Keipi et al. 2014) and by decreasing its hygroscopicity (Olek et al. 2012, Medic et al. 2012). The torrefied wood is then more suitable for the combustion in co-combustion processes with coal (Bergman et al. 2005) or for a further conversion as the gasification (Couhert et al. 2009, Fisher et al. 2012). In the case of the heat treatment to produce a building material, the treatment is applied to wood boards and the aim is to increase its dimensional stability (Militz 2002, Yildiz 2002) and its resistance to fungal attacks (Kamdem et al. 2002, Hakkou et al. 2006).
* Corresponding author: Tel.: +033372741838; E-mail: [email protected]
1Université de Lorraine, Inra, LERMaB, F88000
Epinal
3French Agriculture Research Centre for
International Development (CIRAD),
73 rue J. F. Breton, 34398 Montpellier, Cedex 5,
France
2Service de Recherche et d’Expertise en
Transformation des Produits Forestiers
25-5 rue Armand Sinclair, QC G5J 1K3, Amqui
Quebec, Canada

Natural resources and bioeconomy studies 80/2017
273
In both cases, the heat treatment consists in a heating of the material at a temperature in the range 160-280 °C (the treatment temperature is classically higher for torrefaction than for heat treatment of boards). This treatment is performed under an inert atmosphere (mainly nitrogen or vacuum) and leads to the modification of the wood cell components. Hemicelluloses undergo the major degradation (Sinoven et al. 2002, Nuopponen et al. 2004, Nguila et al. 2007) while the other components have lighter modifications as partial depolymerisation and reticulation for lignin (Zaman et al. 1984, Tjeerdsma and Militz 2005, Brosse et al. 2010) or change in the crystallinity for cellulose (Yildiz et al. 2006). These modifications lead to a mass loss of the wood that has been previously correlated to the properties conferred to the material (Chaouch et al. 2010, Willems and Militz 2013). When conducting a heat treatment process, the objective is thus to maximize the improvement of the properties while limiting the decomposition of the material. Consequently, the mass loss (or the mass yield) can be considered as the best indicator of the treatment intensity.
Nevertheless, in the industry of wood boards heat treatment, the treatment conditions are mainly determined empirically. A change in the composition of wood, in the size of the boards or in the quality of the raw wood can thus lead to production or quality issues. The aim of this study is to provide a numerical tool to predict the mass yield as a function of the temperature and the treatment duration.
In the literature, lot of studies proposed kinetic models to represent the degradation of wood during the heat treatment. These models, usually applied to TGA (thermogravimetric analysis) measurements in order to simulate the intrinsic decomposition of biomass, can be sorted in two major sections: the detailed models and the pseudo-components models. The most used of the detailed models was initially proposed by Ranzi et al. (2008) and further developed by Blondeau and Jeanmart (2012), Gauthier et al. (2013) and Anca-couce et al. (2014). This model considers separately the decomposition of the three major wood components and predicts the volatile matters that are produced. It is the only model based on the description of the chemical reactions occurring during the treatment. However, this model is complex and hard to extend to various species or heat treatment conditions. The pseudo-components models are the most used in the literature because of their simplicity. They aim to represent the global mass loss and can be based on a one-step reaction scheme (Repellin et al. 2010), on several reactions in parallel schemes (Ratte et al. 2009, Ratte et al. 2011, Cavagnol et al. 2013) or on several steps in series schemes (Cavagnol et al. 2013, Joshi et al. 2014, Peduzzi et al. 2014). These models, even if they are simpler, present the advantage to be easily adaptable.
In the present work, a pseudo-components model is described and the way to determine the associated kinetic constants is presented in details. This determination is then applied to fit the experimental results obtained during the treatment of boards in a conductive pilot process representative of the industrial conditions.
Materials and methods 2.In this study, the heat treatment has been performed on boards cut from hardwood species: poplar (Populus nigra). The dimensions of the boards were 2.5 x 11 x 25 cm3 (R, T, L) and the wood was previously dried in an oven at 103 °C until mass stabilization.
The experimental device used to carry out the thermal treatment (Figure 1) has been previously described by Chaouch et al. (2010). It is made of an insulated reactor containing two electrically heated plates. The sample is thus placed between these plates to make a conductive treatment. The reactor is swept with nitrogen thanks to a volumetric flow meter with a flow rate of 6.5 L/min. The temperature of the plates is controlled with a computer and two thermocouples are inserted into the board (one in the center and one close to the heated surface) to measure the temperature evolution inside the wood. The board and the heating plates are continuously weighed with an electronic balance and the weight signal is recorded.
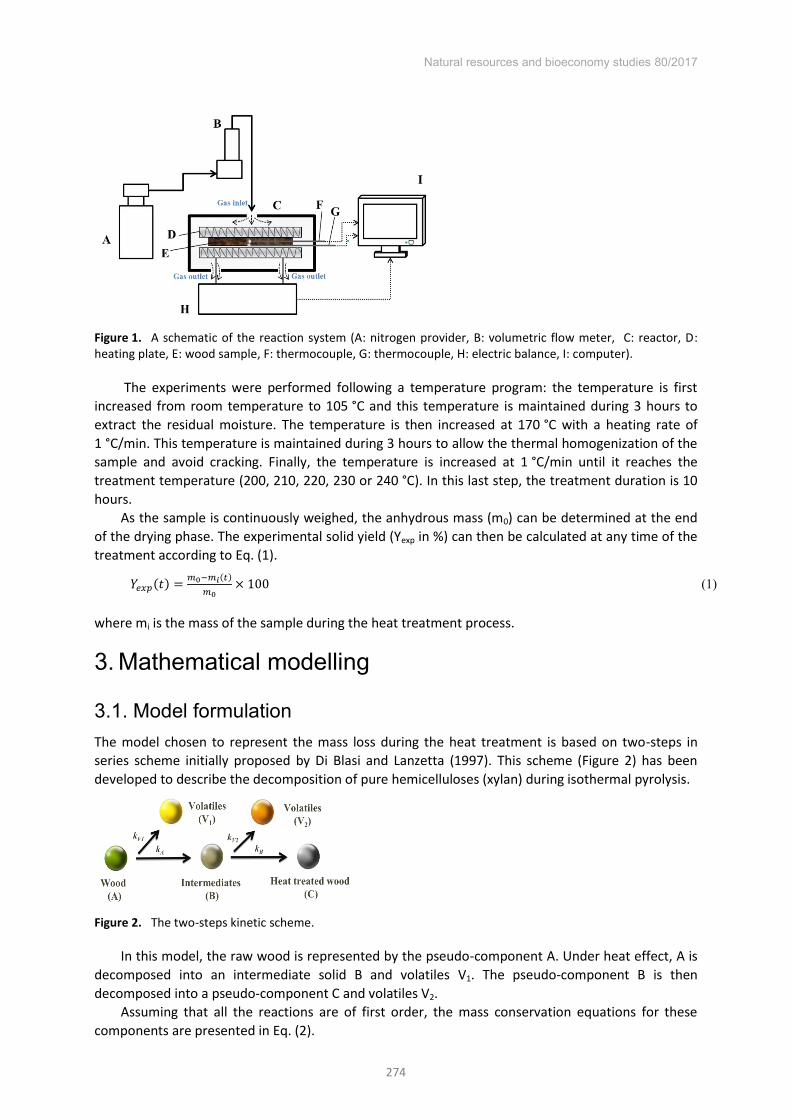
Natural resources and bioeconomy studies 80/2017
274
Figure 1. A schematic of the reaction system (A: nitrogen provider, B: volumetric flow meter, C: reactor, D: heating plate, E: wood sample, F: thermocouple, G: thermocouple, H: electric balance, I: computer).
The experiments were performed following a temperature program: the temperature is first increased from room temperature to 105 °C and this temperature is maintained during 3 hours to extract the residual moisture. The temperature is then increased at 170 °C with a heating rate of 1 °C/min. This temperature is maintained during 3 hours to allow the thermal homogenization of the sample and avoid cracking. Finally, the temperature is increased at 1 °C/min until it reaches the treatment temperature (200, 210, 220, 230 or 240 °C). In this last step, the treatment duration is 10 hours.
As the sample is continuously weighed, the anhydrous mass (m0) can be determined at the end of the drying phase. The experimental solid yield (Yexp in %) can then be calculated at any time of the treatment according to Eq. (1).
𝑌𝑒𝑥𝑝(𝑡) =𝑚0−𝑚𝑖(𝑡)
𝑚0× 100 (1)
where mi is the mass of the sample during the heat treatment process.
Mathematical modelling 3.
Model formulation 3.1.The model chosen to represent the mass loss during the heat treatment is based on two-steps in series scheme initially proposed by Di Blasi and Lanzetta (1997). This scheme (Figure 2) has been developed to describe the decomposition of pure hemicelluloses (xylan) during isothermal pyrolysis.
Figure 2. The two-steps kinetic scheme.
In this model, the raw wood is represented by the pseudo-component A. Under heat effect, A is decomposed into an intermediate solid B and volatiles V1. The pseudo-component B is then decomposed into a pseudo-component C and volatiles V2.
Assuming that all the reactions are of first order, the mass conservation equations for these components are presented in Eq. (2).
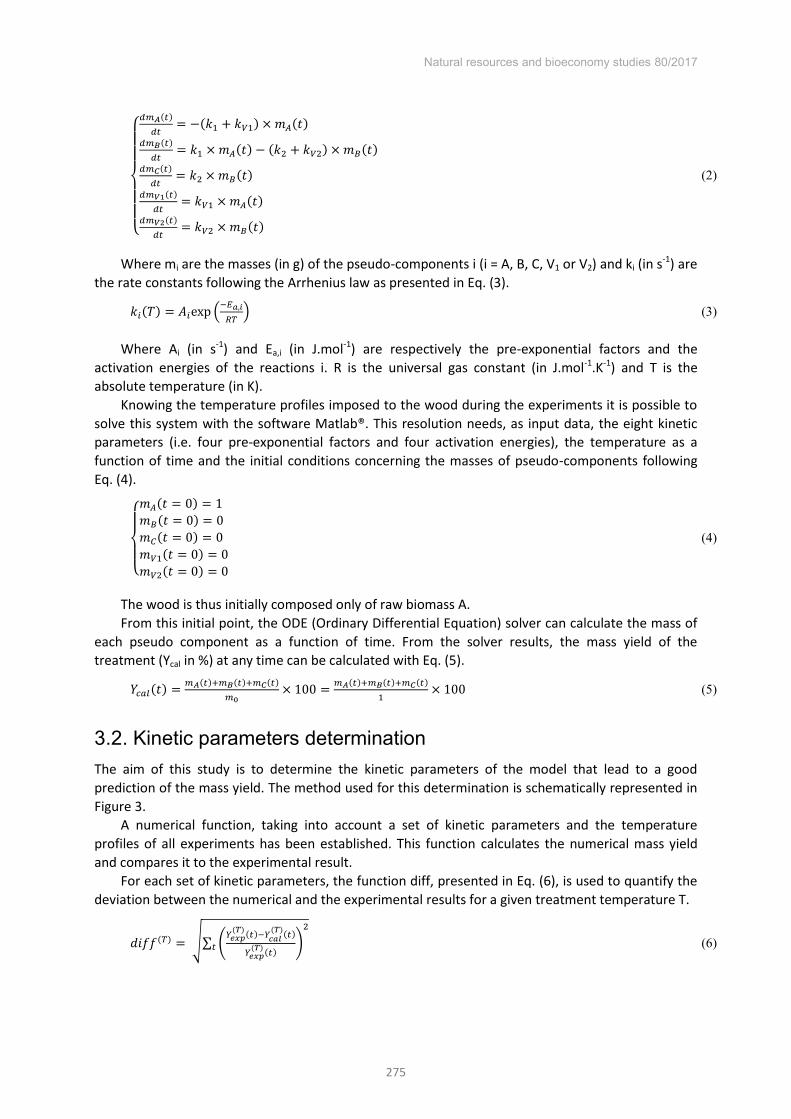
Natural resources and bioeconomy studies 80/2017
275
{
𝑑𝑚𝐴(𝑡)
𝑑𝑡= −(𝑘1 + 𝑘𝑉1) × 𝑚𝐴(𝑡)
𝑑𝑚𝐵(𝑡)
𝑑𝑡= 𝑘1 ×𝑚𝐴(𝑡) − (𝑘2 + 𝑘𝑉2) × 𝑚𝐵(𝑡)
𝑑𝑚𝐶(𝑡)
𝑑𝑡= 𝑘2 ×𝑚𝐵(𝑡)
𝑑𝑚𝑉1(𝑡)
𝑑𝑡= 𝑘𝑉1 ×𝑚𝐴(𝑡)
𝑑𝑚𝑉2(𝑡)
𝑑𝑡= 𝑘𝑉2 ×𝑚𝐵(𝑡)
(2)
Where mi are the masses (in g) of the pseudo-components i (i = A, B, C, V1 or V2) and ki (in s-1) are the rate constants following the Arrhenius law as presented in Eq. (3).
𝑘𝑖(𝑇) = 𝐴𝑖exp (−𝐸𝑎,𝑖
𝑅𝑇) (3)
Where Ai (in s-1) and Ea,i (in J.mol-1) are respectively the pre-exponential factors and the activation energies of the reactions i. R is the universal gas constant (in J.mol-1.K-1) and T is the absolute temperature (in K).
Knowing the temperature profiles imposed to the wood during the experiments it is possible to solve this system with the software Matlab®. This resolution needs, as input data, the eight kinetic parameters (i.e. four pre-exponential factors and four activation energies), the temperature as a function of time and the initial conditions concerning the masses of pseudo-components following Eq. (4).
{
𝑚𝐴(𝑡 = 0) = 1
𝑚𝐵(𝑡 = 0) = 0
𝑚𝐶(𝑡 = 0) = 0
𝑚𝑉1(𝑡 = 0) = 0
𝑚𝑉2(𝑡 = 0) = 0
(4)
The wood is thus initially composed only of raw biomass A. From this initial point, the ODE (Ordinary Differential Equation) solver can calculate the mass of
each pseudo component as a function of time. From the solver results, the mass yield of the treatment (Ycal in %) at any time can be calculated with Eq. (5).
𝑌𝑐𝑎𝑙(𝑡) =𝑚𝐴(𝑡)+𝑚𝐵(𝑡)+𝑚𝐶(𝑡)
𝑚0× 100 =
𝑚𝐴(𝑡)+𝑚𝐵(𝑡)+𝑚𝐶(𝑡)
1× 100 (5)
Kinetic parameters determination 3.2.The aim of this study is to determine the kinetic parameters of the model that lead to a good prediction of the mass yield. The method used for this determination is schematically represented in Figure 3.
A numerical function, taking into account a set of kinetic parameters and the temperature profiles of all experiments has been established. This function calculates the numerical mass yield and compares it to the experimental result.
For each set of kinetic parameters, the function diff, presented in Eq. (6), is used to quantify the deviation between the numerical and the experimental results for a given treatment temperature T.
𝑑𝑖𝑓𝑓(𝑇) = √∑ (𝑌𝑒𝑥𝑝(𝑇)
(𝑡)−𝑌𝑐𝑎𝑙(𝑇)(𝑡)
𝑌𝑒𝑥𝑝(𝑇)
(𝑡))
2
𝑡 (6)

Natural resources and bioeconomy studies 80/2017
276
Figure 3. The numerical solver flowchart.
This function allows the comparison between experimental and calculated mass yield values all along the treatment: from the heating phase to the end of the reaction phase.
As the objective of the study is to determine a unique set of parameters that gives good results for all the studied temperatures (200 to 240 °C), the deviations between experimental and numerical results for all the temperatures are then computed according to Eq. (7).
𝑑𝑒𝑣𝑖𝑎𝑡𝑖𝑜𝑛 = 𝑑𝑖𝑓𝑓(200)+𝑑𝑖𝑓𝑓(210) + 𝑑𝑖𝑓𝑓(220) + 𝑑𝑖𝑓𝑓(230) + 𝑑𝑖𝑓𝑓(240) (7)
A numerical solver is then used to determine the optimal kinetic parameters. This solver needs parameters estimation as input data. This estimation is thus taken from the results available in the literature. The solver has the objective to minimize the function deviation (Eq. 7) in order to have calculated results as close as possible to the mass yields experimentally observed.
As the pre-exponential factors and activation energies have different orders of magnitude (the ratio between these two kinds of parameters is classically higher than 1000), a variable change has been implemented to make the solution easier to find. This variable change, initially proposed by Reverte (2007) is presented in Eq. (8).
{𝐴𝑟,𝑖 = ln(𝐴𝑖)
𝐸𝑟,𝑖 =𝐸𝑎,𝑖
𝑅
(8)
The new variables Ar,i and Ea,i are thus in the same order of magnitude and the rate constants ki are calculated using the modified Arrhenius law presented in Eq. (9).
𝑘𝑖(𝑇) = 𝑒𝑥𝑝(𝐴𝑟,𝑖). 𝑒𝑥𝑝 (−𝐸𝑟,𝑖
𝑇) (9)
With this variable change, the minimization function has shown better results than with the non-modified Arrhenius law.
Results and discussion 4.During the determination of the kinetic constants, it has been observed that the results are strongly dependent on the initial values attributed to the kinetic variables. To obtain a good accordance between experimental and numerical results, a strategy not detailed here has been used. The kinetic constants have been approached using only one treatment temperature. The optimal kinetic parameters obtained for this temperature were then used as initial conditions for the determination

Natural resources and bioeconomy studies 80/2017
277
of the kinetic parameters suitable for treatments at two different temperatures. The new result given by the solver was then used as initial condition to calculate the constants for three different temperatures. This protocol was then used to obtain, step by step, a set of kinetic constants (see Table 1) that is able to predict accurately the mass yield evolution whatever the treatment temperature in the range of 200-240 °C. The final results are presented in Figure 4.
Figure 4. Evolution of experimental (points) and predicted (lines) mass yields as a function of time for the five temperatures studied
Table 1. Kinetic parameters obtained with the minimization function.
𝒌𝟏 𝒌𝑽𝟏 𝒌𝟐 𝒌𝑽𝟐
𝐴𝑖 (s-1) 1.04×10⁷ 1.91×10¹² 2.05×101 7.00×10⁷
𝐸𝑎,𝑖 (J.mol-1) 85 850 144 130 36 060 114 890
For a better readability of the figure, the curves are presented from the point at which a treatment temperature of 170 °C is reached. Indeed, it is the temperature where the thermal degradation begins. For lower temperatures, no significant mass loss can be observed and the mass yield remains at a stable value of 100 %.
It can be observed that the predicted values of the mass yield are in good accordance with the values experimentally obtained. The largest divergence between experimental and calculated values appears for the treatment at 210 °C. This observation can be explained by the low repeatability of the experiments at this temperature. This is probably due to the change in chemical reactions that occurs between 210 and 220 °C. Taking into account the accuracy of the measured mass yield for this temperature, it can be concluded that the calculated values are included into the uncertainty.
It is particularly of interest to observe that a good fitting has been achieved both at the beginning and at the end of the experiments. This shows that the chosen model is able to represent the high degradation rates of hemicelluloses when the temperature is increasing as well as the low degradation of all the wood components when the process begins to stabilize at the treatment temperature. Moreover, it has been previously shown that the chemical reactions occurring in the wood depend on the treatment temperature (Nocquet et al. 2014). The kinetic set determined here is thus able to take into account, from a macroscopic point of view, all the reactions that take place for the treatment temperatures ranging between 200 and 240 °C.

Natural resources and bioeconomy studies 80/2017
278
Conclusion 5.In this study, a mathematical model has been developed and numerically implemented to predict the mass yield of wood boards during heat treatment. The model has been presented and the strategy for the determination of the kinetic parameters has been explained in details.
This model, classically used to simulate intrinsic kinetics obtained by TGA (Thermogravimetric Analysis) on powders has then been successfully adapted to predict the mass yield of poplar boards with industrial dimensions. This work will now be extended to other species of wood and other treatment conditions (various heating rates and various atmospheres for example). It could be used in the industry of wood treatment as a tool to determine the treatment conditions that have to be imposed in the ovens to obtain a product with controlled properties.
Acknowledgements The authors gratefully acknowledge the program ANR-11-LABEX-0002-01 (Lab of Excellence ARBRE) for their financial support.
References Anca-couce, A., R. Mehrabian, R. Scharler and I. Obernberger. 2014. Kinetic scheme to predict product
composition of biomass torrefaction. Chemical Engineering Transactions. 37:43-48. Bergman, P.C., A. Boersma, R.. Zwart and J. Kiel. 2005. Torrefaction for biomass co-firing in existing
coal-fired power stations. Energy Research Center of Netherlands. Report ECN-C-05-013. Blondeau, J. and H. Jeanmart. 2012. Biomass pyrolysis at high temperature: prediction of the gaseous
species yields from an anisotropic particle. Biomass and Bioenergy. 41:107-121. Brosse, N., R. El Hage, M. Chaouch, M. Pétrissans, S. Dumarçay and P. Gérardin. 2010. Investigation of
the chemical modifications of beech wood lignin during heat treatment. Polymer Degradation and Stability. 95(9):1721-1726.
Cavagnol, S., E. Sanz, W. Nastoll, J.F. Roesler, V. Zymla and P. Perré. 2013. Inverse analysis of wood pyrolysis with long residence times in the temperature range 210-290°C: Selection of multi-step kinetic models based on mass loss residues. Thermochimica Acta. 574:1-9.
Chaouch, M., M. Pétrissans, A. Pétrissans and P. Gérardin. 2010. Use of wood elemental composition to predict heat treatment intensity and decay resistance of different softwood and hardwood species. Polymer Degradation and Stability. 95(12):2255-2259.
Chew, J. and V. Doshi. 2011. Recent advances in biomass pretreatment – Torrefaction fundamentals and technology. Renewable and Sustainable Energy Reviews. 15(8):4212-4222.
Colin, B., J.L. Dirion, P. Arlabosse and S. Salvador. 2017. Quantification of the torrefaction effects on the grindability and the hygroscopicity of wood chips. Fuel. 197:232-239.
Couhert, C., S. Salvador and J.M. Commandré. 2009. Impact of torrefaction on syngas production from wood. Fuel. 88(11):2286-2290.
Di Blasi, C. and M. Lanzetta. 1997. Intrinsic kinetics of isothermal xylan degradation in inert atmosphere. Journal of Analytical and Applied Pyrolysis. 40-41:287-303.
Fisher, E.M., C. Dupont, L.I. Darvell, J.M. Commandré, A. Saddawi, J.M. Jones, M. Grateau, T. Nocquet and S. Salvador. 2012. Combustion and gasification characteristics of chars from raw and torrefied biomass. Bioresource Technology. 119:157-165.
Gauthier, G., T. Melkior, S. Salvador, M. Corbetta, A. Frassoldati, S. Pierucci, E. Ranzi, H. Bennadji and E.M. Fisher. 2013. Pyrolysis of thick biomass particles: experimental and kinetic modelling. Chemical Engineering Transactions. 32:601-606.
Hakkou, M., M. Pétrissans, P. Gérardin and A. Zoulalian. 2006. Investigation of the reasons for fungal durability of heat-treated beech wood. Polymer Degradation and Stability. 91(2):393-397.
Joshi, Y., H. de Vries, T. Woudstra and W. de Jong. 2014. Torrefaction: unit operation modelling and process simulation. Applied Thermal Engineering. 74:83-88.
Kamden, D.P., A. Pizzi and A. Jermannaud. 2002. Durability of heat-treated wood. Holz als Roh- und Werkstoff. 60:1-6.
Keipi, T., H. Tolvanen, L. Kokko and R. Raiko. 2014. The effect of torrefaction on the chlorine content and heating value of eight woody biomass samples. Biomass and Bioenergy. 66:232-239.

Natural resources and bioeconomy studies 80/2017
279
Medic, D., M. Darr, A. Shah and S. Rahn. 2012. Effect of torrefaction on water vapor adsorption properties and resistance to microbial degradation of corn stover. Energy & Fuels. 26(4):2386-2393.
Militz, H. 2002. Heat treatment technologies in Europe: scientific background and technological state-of-art. The international research group on wood preservation – 33rd annual meeting, Cardiff.
Nguila Inari, G., S. Mounguengui, S. Dumarçay, M. Pétrissans and P. Gérardin. 2007. Evidence of char formation during wood heat treatment by mild pyrolysis. Polymer Degradation and Stability. 92(6):997-1002.
Nocquet, T., C. Dupont, J.M. Commandré, M. Grateau, S. Thiery and S. Salvador. 2014. Volatile species release during torrefaction of wood and its macromolecular constituents: Part 1 - Experimental study. Energy. 72:180-187.
Nuopponen, M., T. Vuorinen, S. Jamsa and P. Viitaniemi. 2004. Thermal modifications in softwood studied by FT-IR and UV resonance raman spectroscopie. Journal of Wood Chemistry and Technology. 24(1):13-26.
Olek, W., J. Majka and L. Czajkowski. 2012. Sorption isotherms of thermally modified wood. Holzforschung. 67(2):183-191.
Peduzzi, E., G. Boissonnet, G. Haarlemmer, C. Dupont and F. Maréchal. 2014. Torrefaction modelling for lignocellulosic biomass conversion process. Energy. 70:58-67.
Ranzi, E., A. Cuoci and T. Faravelli. 2008. Chemical kinetics of biomass pyrolysis. Energy & Fuels. 22(6):4292-4300.
Ratte, J., F. Marias, J. Vaxelaire and P. Bernada. 2009. Mathematical modelling of slow pyrolysis of a particle of treated wood waste. Journal of Hazardous Materials. 170(2-3):1023-1040.
Ratte, J., E. Fardet, D. Mateos and J.S. Héry. 2011. Mathematical modelling of a continuous biomass torrefaction reactor: TORSPYDTM column. Biomass and Bioenergy. 35(8):3481-3495.
Repellin, V., A. Govin, M. Rolland and R. Guyonnet. 2010. Modelling of weight loss of wood chips during torrefaction in a pilot kiln. Biomass and Bioenergy. 34(5):602-609.
Reverte, C. 2007. Experimental strategy for the determination of stoichio-kinetics models of thermal degradation reactions [in French]. 1-258.
Sinoven, H., S.L. Maunu, F. Sundholm, S. Jämsä and P. Viitaniemi. 2002. Magnetic resonance studies of thermally modified wood. Holzforschung. 56(6):648-654.
Tjeerdsma, B. and H. Militz. 2005. Chemical changes in hydrothermal treated wood: FTIR analysis of combined hydrothermal and dry heat treated wood. Holz als Roh- und Werkstoff. 63(2):102-111.
Willems, W. and H. Militz. 2013. From chemical process monitoring to direct control of thermally modified wood properties. COST Action FP0904, 3rd conference: “Evaluation, processing and prediction of THM treated wood behavior by experimental and numerical methods”, Lasi, Romania.
Yildiz, S. 2002. Effects of heat treatment on water repellence and anti-swelling efficiency of beech wood. International Research Group on Wood Preservation. Document No. IRG/WP 02-40223.
Yildiz, S., D. Gezer and U. Yildiz. 2006. Mechanical and chemical behavior of spruce wood modified by heat. Building and Environment. 41(12):1762-1766.
Zaman, A., R. Alen and R. Kotilainen. 1984. Heat behavior of Pinus Sylvestris and Betula Pendula at 200-230°C. Wood Fiber Sciences. 32(2):138-143.
Natural resources and bioeconomy studies 80/2017
280
Odorants in oak wood – a review of aroma-analytical approaches used for uncovering the olfactorily relevant
substances Rahil Ghadiriasli1,2, Angela Lopez Pinar1,
Jan-Willem van de Kuilen3,4, Andrea Buettner1,2*
Abstract
Oak wood has been used for centuries in the production of alcoholic beverages to induce desired sensorial aroma notes during the aging process. To explore the influence of oak on the aroma profiles of alcoholic beverages like wine, a series of influencing factors has been investigated, such as storage and thermal treatment of the oak barrels, tank staves or chips, as in seasoning, toasting or charring. These investigations resulted in comprehensive data on aroma compounds in wine maturated in oak barrels. Strategies to unveil the impact of oak wood on the aroma of beverages such as wine commonly comprise human sensory analyses, odorant recovery via extraction and distillation using techniques such as solvent-assisted flavor evaporation (SAFE), and targeted odorant identification, mostly applying a combination of human sensory and chemo-analytical techniques. In aroma analysis regarding foods and beverages, a systematic analytical concept is established since decades, comprising, in most cases, aroma extract dilution analysis (AEDA), which is based on gas chromatography-olfactometry (GC-O). Commonly, the odorants are identified via gas chromatography-mass spectrometry/olfactometry (GC-MS/O) and heart-cut two-dimensional gas chromatography-mass spectrometry/olfactometry (2D-GC-MS/O). The majority of the odorants reported to date as being associated with oak-wood in the context of alcoholic beverages comprise a series of terpenes, mainly mono- and sesquiterpenes, aldehydes, acids, lactones and a number of odorants containing a phenolic core moiety. The successful identification of these odorants creates a better understanding of the unique smell of oak wood, and helps unveiling its potential benefits in different applications.
Introduction 1.Oak has been traditionally used in winemaking. Wood aroma compounds are transferred to the wine by ageing in oak wood barrels or by applying floating chips or staves during wine fermentation. Wine is a highly valued beverage since ancient times. It goes without saying that winegrowing constituted a significant advancement in agriculture; in addition, it meant a relevant social and technological innovation for ancient societies. Nowadays, wine plays a major role in the economies of many producing countries such as France, Spain and Italy. Thereby, aging is an essential step and challenge for high quality wine-producing companies with regards to color formation, clarification and flavour development. Initially, oak wood was used as raw material for storage containers due to its
* Corresponding author: Tel.: +49 8161491-715; E-mail: [email protected]
1Department of Chemistry and
Pharmacy Friedrich-Alexander-Universität Erlangen-
Nürnberg Henkestraße 9, 91054
Erlangen, Germany
3TUM - Wood Research Institute, Winzererstraße
45, 80797 Munich, Germany
2Department of Sensory Analytics,
Fraunhofer Institute for Process
Engineering and Packaging IVV,
Giggenhauserstraße 35, 85354
Freising, Germany
4Faculty of Civil Engineering and
Gesociences, TU Delft,
The Netherlands

Natural resources and bioeconomy studies 80/2017
281
mechanical properties, i.e. its flexibility, strength, hardness and control of water evaporation, and controlled exposure to oxygen. Thereby, the wood pores and bunghole permit a minor level of oxidation in wine aging which is beneficial to both character and structure of the wine.
Physicochemical and anatomical characteristics of wood can vary according to the geographical origin, botanical species, natural seasoning and toasting. The oak material is composed of a series of constituents, namely cellulose, hemicelluloses, lignin and tannins, and also subcomponents which are inorganic minerals and organic extractives (Rodríguez Madrera, Blanco Gomis et al. 2003). To date, a large number of volatile compounds derived from oak have been identified in wine aged in oak wood barrels (Sefton, Francis et al. 1990, Spillman, Pollnitz et al. 1997, Cutzach, Chatonnet et al. 1999). Thereby, a series of odorants have been observed to exert a relevant impact on the wine aroma and flavor. For example, the cis- and trans-isomers of oak lactone elicit oak- or coconut-like notes (Chatonnet and Dubourdieu 1998).
Phenolic aldehydes result through oxidation, pyrolysis or hydrolytic reactions: e.g. pyrolysis of the lignin causes an increase in the levels of phenolic aldehydes and other components with desirable sensory effects (Pérez-Coello and Díaz-Maroto 2009). Among the phenolic aldehydes, vanillin is a characteristic compound being derived from lignin degradation. Other phenolic volatile compounds like eugenol, isoeugenol, and guaiacol contribute to clove-like or smoky notes and also have been shown to have sensory impact on matured wines. Moreover terpenes with balsamic and ethereal aromas have been identified in diverse wine samples (Pérez-Coello, Sanz et al. 1998).
This review focuses on reports of volatile and semi-volatile constituents in oak wood with a specific focus on those substances that have been reported to impact the gustatory and olfactory qualities of wines which have been fermented and/or maturated in oak barrels or treated with oak chips. To this aim, we report here the most important analytical methods that are commonly employed for the targeted characterization of odorous compounds.
Effect of botanical species and geographical origin on 2.constitution of volatiles in wood
Oak (genus Quercus) is the most commonly used botanical species for the construction of barrels used for wine aging; other species such as chestnut (genus Castanea), cherry, false acacia, and very seldom, mulberry and ash have also been provided as possible wood sources in the production of wine and other alcoholic beverages, albeit being less commonly used (Culleré, Fernández de Simón et al. 2013). Regarding the origin of oak, American oak (Quercus Alba), a member of white oak wood, is more commonly used in the United States. French oak is the most prevalent wood used for barrels, but oak wood from Hungary, Spain, Russia is increasingly becoming more attractive (Maria João B. Cabrita 2012). Thereby, the volatile compounds released from different types of wood result in characteristic profiles (Flamini, Vedova et al. 2007). Comparison of oak and chestnut revealed higher level of vanillin and eugenol in wine aged in oak wood, and wines stored in chestnut are more fruity and tannic flavoured (Culleré, Fernández de Simón et al. 2013), whereas oak leads to relevant levels of whiskey lactone. Hereby, American oak contains higher levels of whiskey lactone in comparison to French oak (Flamini, Dalla Vedova et al. 2007), (Fernández de Simón, Esteruelas et al. 2009). Variations in odorant composition even may occur between individual trees of the same species (Cadahía, Fernández de Simón et al. 2009) , but may be also related to geographical origin.(Garde-Cerdán, Lorenzo et al. 2010)
Natural resources and bioeconomy studies 80/2017
282
Effect of seasoning and toasting on odorant 3.composition in wood
Oak wood chemical composition largely depends on the types of wood treatment and the resulting modifications that the oak wood undergoes during seasoning and toasting. There are various studies on oak wood and other comparable woods with regards to their usage in cooperage. These studies mostly focused on the volatile components in naturally seasoned and toasted woods, (Cadahía, Fernández de Simón et al. 2003, Vichi, Santini et al. 2007). Natural green unmodified oak wood cannot be used in barrel making due to a high wood moisture content of up to 70%, but also because its extractible components contain bitter polyphenolic compounds and contain insufficient amounts of the desired aromatic components. Wood is usually air-dried under natural conditions for a period between 18 and 36 months. The wood loses moisture in the course of this process until an equilibrium moisture content of approximately 20% is reached. Moreover, the wood undergoes chemical changes and loses water-soluble polyphenolic compounds because of moisture diffusion and biological activity. Thereby, the level of ellagitannin is decreased resulting in a reduction of bitterness and astringency (Martinez, Cadahia et al. 2008, Yovel, Franz et al. 2008).
During the toasting process, heat is applied to the wood with medium intensity (185 oC, 45 min) (Matricardi and Waterhouse 1999). Consequently chemical bonds between biopolymers such as cellulose, hemicellulose, lignin, polyphenols and lipids are cleaved, resulting in polymer degradation and structural modifications in the course of this pyrolysis and thermolysis. Thermodegradation of lignin mainly results in volatile phenols, phenolic aldehydes, phenyl ketones and some phenyl alcohols. Thereby, phenolic and furanic aldehydes are the most significant volatile components identified in heated wood. Besides vanillin, contributing the characteristic vanilla note, several other spicy, smoky, toasty and caramel-like compounds are present in oak after thermal treatment (Cutzach, Chatonnet et al. 1997, Vichi, Santini et al. 2007). Accordingly, these processes can lead to formation of several volatile components depending on the degree of thermal treatment, that can be later on transferred to the wine in the course of wine aging in barrels: lactones, for example, are initially increased in their concentration at the beginning of toasting due to fat oxidation processes, but can be degraded in the course of an extended heating process (Chatonnet, Cutzach et al. 1999, Cadahía, Fernández de Simón et al. 2003, Díaz-Maroto, Guchu et al. 2008).
Oak wood aging and oak derived volatile compounds 4. Aroma is one of the most important quality parameters of wine, playing an essential role in the enjoyment of this fascinating product. Wine aroma diversity is related to the complexity and variability of its chemical composition, which is, in turn, influenced by winemaking practices, grape variety, region, and microbial activity, (Lopez Pinar, Rauhut et al. 2016, Lopez Pinar, Rauhut et al. 2017). Thereby, oak wood ageing constitutes an important source of aroma compounds. The outcome of this process is, of course, multi-faceted and likewise variable, depending on the chemical composition of the barrel itself that depends on the following factors: type of oak employed, geographical origin, drying treatment and degree of toasting, duration of oak-ageing and the number of times a barrel has been used.
Oak-derived aroma compounds comprise terpenes, lactones, phenolic aldehydes and furan derivatives. Some important phenolic aldehydes such as vanillin, the green smelling syringaldehyde or the almond-like smelling benzaldehyde stem from lignin and are generated through hydrolysis, pyrolysis and oxidation processes (Jackson 2014 ). In addition, guaiacol and its 4-ethyl and 4-vinyl derivatives together with its allylic derivatives eugenol and isoeugenol have a great sensory impact in oak wood-aged wines. These compounds have been described to exert spicy, toasted, smoky, and oak-like aromas. Furan derivatives are also important contributors to toasted, caramel-like aromas.

Natural resources and bioeconomy studies 80/2017
283
These compounds originate from both grape and oak wood, since they are formed from pyrolysis of carbohydrates during oak wood toasting or from enzymatic processes in grapes and later ripening processes in wine (Jackson 2008). Some relevant examples are furfural, 5-methylfurfural, furaneol and homofuraneol. Apart from the above mentioned compounds, many short- and medium-chain alkyl aldehydes, acids and alcohols and various compounds with fruity and floral smells like linalool oxide, phenylethanol and trans-cinnamaldehyde with spicy-cinnamon like notes have been shown to result from oak wood.
Aroma compounds are further generated during ageing by oxidation processes as porous wood allows entry of oxygen, resulting in formation of further important aroma compounds (Escudero, Hernandez-Orte et al. 2000, Silva Ferreira, Guedes De Pinho et al. 2002). One characteristic example is the savory-, curry-like smelling sotolon, which is formed via oxidative degradation of ascorbic acid (Pons, Lavigne et al. 2010).
Finally, glycosidically bound odor substances constitute an important reservoir of wine aroma. These may be released during wine ageing via slow acidic hydrolysis or may be liberated by glycosidases. Endogenous grape-derived and exogenous yeast-derived glycosidases cause a significant release of aroma precursors in wine but not in the grape, most likely due to compartmentation of enzymes and inhibition by glucose (Robinson, Boss et al. 2014). Alternatively, the release of glycosidically bound aromas may be enhanced by the addition of commercial enzyme preparations.
Off-odours produced in wine by ageing in oak barrels 5.The importance of cork taint stands out among all wine off-odours due to its relatively highest incidence. The main contributor to this defect is 2,4,6-trichloroanisole, which may originate from the chlorination of lignin degradation products during chlorine bleaching of corks (Buser, Zanier et al. 1982, Amon, Vandepeer et al. 1989, Sefton and Simpson 2005).
Furthermore, oxidation increases the concentration of methional, sotolone and acetaldehyde. Thereby, the presence of sotolone and methional have been related with the premature aging flavour in dry white wines (Escudero, Hernandez-Orte et al. 2000, Silva Ferreira, Guedes De Pinho et al. 2002, Pons, Lavigne et al. 2010). Off-odours in relation to wood have been rarely addressed, only some woody off-odours in wine, typically caused by over-aging the wine in the wine barrel or cask (Cadahía, Fernández de Simón et al. 2003). However, elucidation of the underlying odorant structures by means of targeted aroma analysis generally offers the possibility to develop hypotheses on their formation pathways. Based on the confirmation of such pathways, targeted avoidance strategies can then be developed, or desired smell effects can be enhanced. Such targeted smell elucidation has been recently reported in the field of wood research as well as research on wood-derived products such as fibres, paper and cardboard (Czerny and Buettner 2009, Schreiner, Loos et al. 2017).
Aroma analysis 6.
Isolation of volatile compounds 6.1.Odorants contributing to the aroma of a sample are often present in trace amounts and comprise a wide range of chemical compounds with different chemical and physical properties (Ortega-Heras, Gonzalez-SanJose et al. 2002). That makes the simultaneous recovery of the full range of aroma compounds a challenging task (Sides, Robards et al. 2000). In this respect, the isolation of volatile compounds is a crucial step that greatly influences the outcomes of the subsequent analyses.
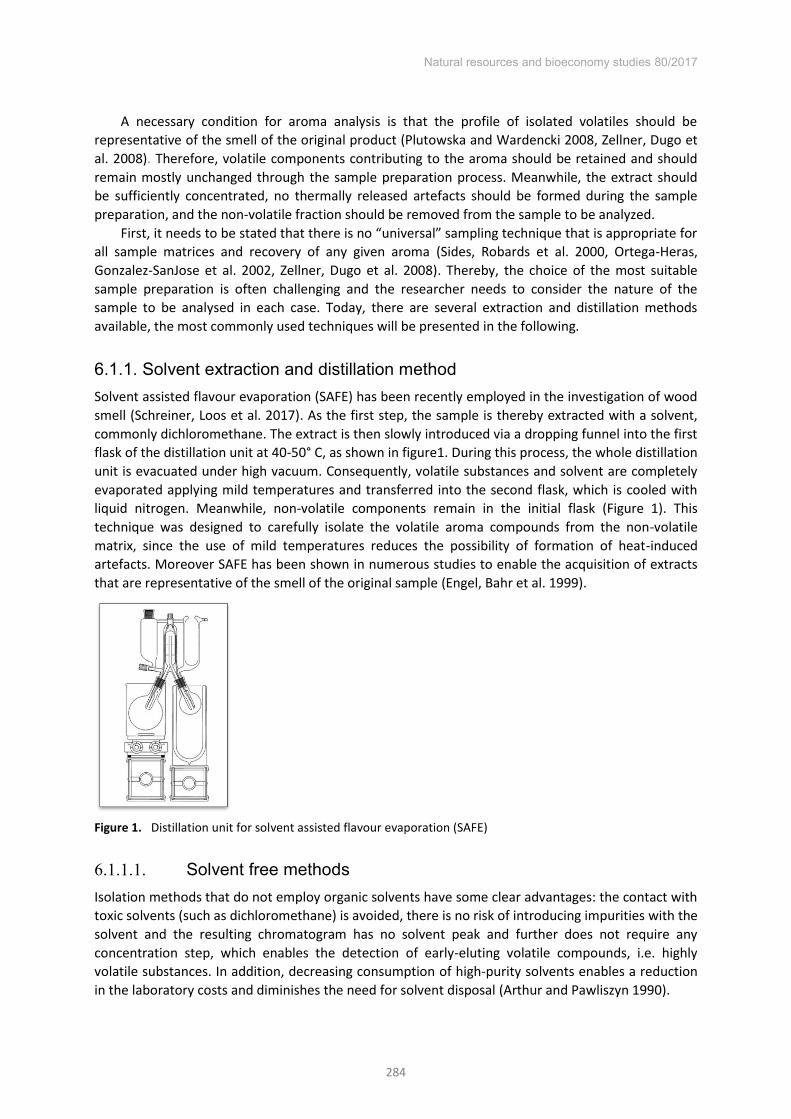
Natural resources and bioeconomy studies 80/2017
284
A necessary condition for aroma analysis is that the profile of isolated volatiles should be representative of the smell of the original product (Plutowska and Wardencki 2008, Zellner, Dugo et al. 2008). Therefore, volatile components contributing to the aroma should be retained and should remain mostly unchanged through the sample preparation process. Meanwhile, the extract should be sufficiently concentrated, no thermally released artefacts should be formed during the sample preparation, and the non-volatile fraction should be removed from the sample to be analyzed.
First, it needs to be stated that there is no “universal” sampling technique that is appropriate for
all sample matrices and recovery of any given aroma (Sides, Robards et al. 2000, Ortega-Heras, Gonzalez-SanJose et al. 2002, Zellner, Dugo et al. 2008). Thereby, the choice of the most suitable sample preparation is often challenging and the researcher needs to consider the nature of the sample to be analysed in each case. Today, there are several extraction and distillation methods available, the most commonly used techniques will be presented in the following.
6.1.1. Solvent extraction and distillation method Solvent assisted flavour evaporation (SAFE) has been recently employed in the investigation of wood smell (Schreiner, Loos et al. 2017). As the first step, the sample is thereby extracted with a solvent, commonly dichloromethane. The extract is then slowly introduced via a dropping funnel into the first flask of the distillation unit at 40-50° C, as shown in figure1. During this process, the whole distillation unit is evacuated under high vacuum. Consequently, volatile substances and solvent are completely evaporated applying mild temperatures and transferred into the second flask, which is cooled with liquid nitrogen. Meanwhile, non-volatile components remain in the initial flask (Figure 1). This technique was designed to carefully isolate the volatile aroma compounds from the non-volatile matrix, since the use of mild temperatures reduces the possibility of formation of heat-induced artefacts. Moreover SAFE has been shown in numerous studies to enable the acquisition of extracts that are representative of the smell of the original sample (Engel, Bahr et al. 1999).
Figure 1. Distillation unit for solvent assisted flavour evaporation (SAFE)
Solvent free methods 6.1.1.1.Isolation methods that do not employ organic solvents have some clear advantages: the contact with toxic solvents (such as dichloromethane) is avoided, there is no risk of introducing impurities with the solvent and the resulting chromatogram has no solvent peak and further does not require any concentration step, which enables the detection of early-eluting volatile compounds, i.e. highly volatile substances. In addition, decreasing consumption of high-purity solvents enables a reduction in the laboratory costs and diminishes the need for solvent disposal (Arthur and Pawliszyn 1990).

Natural resources and bioeconomy studies 80/2017
285
Headspace methods 6.1.1.2.These methods target compounds that are released into the gas phase surrounding a sample. To this aim, the original product is sealed in a vial or gas-tight device, and the headspace is sampled after a given period of equilibration. These techniques have multiple advantages: they are simple and rapid, they usually require relatively small amounts of sample (Wampler 1996), there is no risk of heat-induced artefacts and, since only the headspace is sampled, there is also no risk of introducing non-volatile components. On the other hand, they have an important limitation: since volatility varies among odor compounds, the relative concentration of the aroma substances in the headspace does not correspond to their relative concentration in the original sample (Zellner, Dugo et al. 2008). Moreover, there might be oxidation processes during the equilibration phase, and substance recovery is based on the partitioning of the odorants between matrix and gas phase. Accordingly, the volatile fraction is not quantitatively recovered, limiting sensitivity, especially for substances with lower volatility. Generally, there are two different concepts in headspace methodology:
Static headspace. The sealed sample is thermostated for a given period of time to allow for equilibration of the volatiles between the sample matrix and the vapour phase. Then, a sample of the surrounding headspace is withdrawn and directly injected into a GC. The main disadvantage of the static headspace method is its lack of sensitivity and low recoveries (Miller and Stuart 1999, Sides, Robards et al. 2000, Ortega-Heras, Gonzalez-SanJose et al. 2002).
Dynamic headspace. The main principle of this methodology is that the matrix is constantly swept by a flow of carrier gas. Therefore, two needles are introduced through the vial seal: the first one introduces carrier gas whereas the second needle provides an outlet. This effluent is commonly collected in a trap, which is heated to vaporize the collected compounds before injection into the GC. In comparison with static headspace, a better sensitivity but poorer reproducibility has been reported (Sides, Robards et al. 2000, Ortega-Heras, Gonzalez-SanJose et al. 2002).
Solid-phase micro extraction (SPME) 6.1.1.3.This method has been developed by Arthur and Pawliszyn (1990), and has become a widely used sampling technique in smell research. The main advantages of this technique are the relatively low costs, and that it is rapid and easy to operate while it has a high sensitivity (Sides, Robards et al. 2000). On the other hand, calibration and control of recovery can be real challenges, an aspect that is, at times, underestimated.
In this methodology, the volatile compounds are adsorbed onto a chemically modified fused silica fiber coated with a specific extraction phase (e.g. nonpolar polydimethylsiloxane or polar polyacrylate), which is selected according to the sample to be analysed. The fiber is located within the needle of a special syringe which pierces the seal of a vial containing the sample. After completion of the adsorption period, the compounds are thermally desorbed into a GC for further analysis. The main advantage of this method among the other headspace methods is that SPME has a higher sensitivity (Steffen and Pawliszyn 1996, Penton 1997, Miller and Stuart 1999). Moreover, it is possible to extract volatiles from different media: the fiber can be immersed in a liquid sample, in an extract or in the headspace above the sample, on condition that no non-volatile substances are adsorbed to the fiber that may undergo later degradation during the thermal desorption step, thereby creating the potential of artefact formation. Accordingly, on condition that the analytes are sufficiently volatile, headspace SPME is usually superior to immersion SPME as recovery of analytes is cleaner and faster, and the fiber lasts longer. However, SPME is very sensitive to experimental conditions, and any modification that influences the distribution coefficient consequently affects the

Natural resources and bioeconomy studies 80/2017
286
amount of target compounds adsorbed. Therefore, it may have a poor reproducibility if the influencing factors are not carefully controlled. Quantification, moreover, requires sophisticated calibration, ideally in conjunction with stable-isotope labeled internal standards (Buettner and Schieberle 2001).
Figure 2. Scheme of GC-O system
Analysis of odorous substances 6.2.
6.2.1. Gas Chromatography-Olfactometry (GC-O) For targeted odorant analysis amongst the multitude of volatile constituents, gas chromatography is coupled with olfactometry. Accordingly, the measurements are commonly carried out on a conventional GC that is equipped with a sniffing port in addition to other standard analytical detectors, i.e. FID or MS (Fig 2). This technique, that was first described in 1964, enables the human assessor to sniff the chromatographic effluent, thereby compensating the inability of the analytical detector to discriminate between odor-active and inactive volatile constituents (Fuller, Steltenkamp et al. 1964). Accordingly, its implementation was a turning point in the field of aroma analysis as it offers the possibility to assign the perceived smells to their corresponding chromatographic peaks, which is a necessary condition for the primary stage in aroma analysis: the identification of the compounds contributing to the aroma. Lately, this methodology is increasingly applied in the field of non-food smell research, and has successfully been employed for the decompilation of wood smell (Schreiner, Loos et al. 2017).
Data obtained by GC-O are influenced by several factors. The first factor is the choice of the sample preparation method for extraction of the volatile compounds, as discussed above. In addition, GC parameters such as the temperature program and the capillary column applied also have an impact on the results (Delahunty, Eyres et al. 2006). Since the second detector is a human assessor, it is indispensable that the panelists are properly trained in odor recognition and in naming the smells accurately. Likewise, it is essential that several panelists sniff the same sample in order to avoid missing important odor active areas due to partial anosmia or smell insensitivities.
6.2.2. GC-O data recording methods Dilution to threshold methods are the most widely used methods when it comes to the task of estimating the relative contribution of individual smell substances to the overall smell. Odorants may be present at different concentration levels, but additionally have different odor threshold levels. Accordingly, even minor concentrations of an odorant can impact the smell of a sample to a major extent, if its odor threshold level is sufficiently low. To screen for the potential contribution of individual odorants, and to gain insights into their relative intensities in a sample, the initial extract is

Natural resources and bioeconomy studies 80/2017
287
diluted stepwise and an aliquot of every dilution step is sniffed until a dilution step is reached in which no odor can be perceived. In this way, it is possible to rank the aroma compounds according to their intensities and that most likely impact the overall aroma of the analysed sample. Dilution to frequency methods are very time consuming and usually 1-3 panellists perform the complete analyses.
Figure 3. Schema of two dimensional gas chromatography-mass spectrometry/olfactometry
Meanwhile, detection frequency and time-intensity methodologies require a minimum of 8-10 assessors to obtain reliable results. There are two different modalities of dilution to threshold methodologies: Charm analysis and AEDA (Aroma Extract Dilution Analysis). In Charm analysis, the dilutions are evaluated in a randomised order, so that panellists are not influenced by the knowledge of the dilution to be sniffed. Panellists record the detection duration for each odor and the results are shown as an aromagram that represents duration of the odor against dilution value (Acree, Barnard et al. 1984). In AEDA, however, the dilutions are evaluated in increasing order. The flavor dilution (FD) factor is defined as the last dilution step at which the aroma compound can still be detected, and this value is stated to be roughly proportional to the compound’s contribution to
flavor (Ullrich and Grosch 1987). Nevertheless, it needs to be kept in mind that potential additive, synergistic or suppressive effects of the individual substances, as they would occur in a mixture, are not possible to be recorded using this approach.
One common obstacle in aroma analysis is the occurrence of chromatographic co-elutions, especially when complex matrices are investigated. Especially trace aroma compounds may be masked by larger odorless peaks. A possible solution for these problems is changing the capillary column but often this does not solve the issue as, in complex samples, this might only alter the combination of co-eluting peaks, with the problem remaining unsolved (Delahunty, Eyres et al. 2006). In order to address these problems, multidimensional GC-O is commonly employed. The basic principle of this methodology is that the separation capacities of two different capillary columns are combined (Fig 3). In “heart cutting” systems only a selected fraction containing the target odorant is
transferred from the first to the second dimension: in this way, it is possible to remove the interference from other substances eluting at a similar time in the first dimension.
GC-O is a fundamental technique for the investigation of the aromatic composition of food samples. However, there are some differences between the evaluation of the sample by GC-O and the aromatic perception of the original sample: In GC analyses, all aroma substances are volatilized (Grosch 1993, Acree 1997). In the original sample, however, only a proportion of the aroma compounds will be volatile; their release depends on their solubility and binding to the non-volatile fraction of the respective sample material (Guichard 2002, Pionnier, Engel et al. 2002, Madene, Jacquot et al. 2006). Moreover, smell substances are individually evaluated in GC-O. Therefore it is not possible to consider the interactions among the respective odorants in the mixture; the

Natural resources and bioeconomy studies 80/2017
288
perception may be moreover affected by synergistic, suppressive or additive effects as discussed above (Laska and Hudson 1991, Patterson, Stevens et al. 1993, Miyazawa, Gallagher et al. 2008). To finally resolve such perceptual effects, the respective odorants need to be quantified and reconstituted in adequate odorless matrices for final sensory evaluation of their impact. Only then can the question finally be answered to what extent specific substances contribute to a specific smell
Conclusion 7. A great number of studies revealed the extractives content in cooperage oak wood during natural seasoning and toasting, and other influencing parameters on chemical composition such as tree species, geographical origin, and single tree influences. A majority of studies targeted oak wood volatile compounds in the context of aroma modulation of alcoholic beverages. Nevertheless, the smell of the wood itself is rarely addressed in aroma analytical studies. However, common constituents are phenolic substances such as guaiacol and vanillin, fat degradation products yielding predominantly unsaturated carbonyl compounds such as (E)-2-nonenal, and (sesqui)terpene compounds such as pinenes, to name but a few. This contribution highlights the main strategies employed for elucidation of the chemical structures of the main odorants using a combined human-sensory and analytical approach. This concept has recently been successfully employed for the decompilation of important odorants in wood and wood-derived products. It helps to create a better understanding of natural wood components that generate the typical unique smell in different types of wood. This knowledge is required to resolve formation pathways of wood smell, and to develop strategies for the improvement of wood smell, and avoidance of the formation of undesired smells.
References Acree, T., J. Barnard and D. Cunningham (1984). "A procedure for the sensory analysis of gas
chromatographic effluents." Food Chemistry 14(4): 273-286. Acree, T. E. (1997). "Peer Reviewed: GC/Olfactometry GC With a Sense of Smell." Analytical chemistry
69(5): 170A-175A. Amon, J., J. Vandepeer and R. Simpson (1989). "Compounds responsible for cork taint in wine." Wine
Ind. J 4: 62-69. Arthur, C. L. and J. Pawliszyn (1990). "Solid phase microextraction with thermal desorption using fused
silica optical fibers." Analytical chemistry 62(19): 2145-2148. Buettner, A. and P. Schieberle (2001). "Evaluation of Aroma Differences between Hand-Squeezed
Juices from Valencia Late and Navel Oranges by Quantitation of Key Odorants and Flavor Reconstitution Experiments." Journal of Agricultural and Food Chemistry 49(5): 2387-2394.
Buser, H.-R., C. Zanier and H. Tanner (1982). "Identification of 2,4,6-trichloroanisole as a potent compound causing cork taint in wine." L. Agric. Food Chem. 30: 359-362.
Cadahía, E., B. Fernández de Simón and J. Jalocha (2003). "Volatile Compounds in Spanish, French, and American Oak Woods after Natural Seasoning and Toasting." Journal of Agricultural and Food Chemistry 51(20): 5923-5932.
Cadahía, E., B. Fernández de Simón, M. Sanz, P. Poveda and J. Colio (2009). "Chemical and chromatic characteristics of Tempranillo, Cabernet Sauvignon and Merlot wines from DO Navarra aged in Spanish and French oak barrels." Food Chemistry 115(2): 639-649.
Chatonnet, P., I. Cutzach, M. Pons and D. Dubourdieu (1999). "Monitoring Toasting Intensity of Barrels by Chromatographic Analysis of Volatile Compounds from Toasted Oak Wood." Journal of Agricultural and Food Chemistry 47(10): 4310-4318.
Chatonnet, P. and D. Dubourdieu (1998). "Comparative Study of the Characteristics of American White Oak (<em>Quercus alba</em>) and European Oak (<em>Quercus petraea and Q. robur</em>) for Production of Barrels Used in Barrel Aging of Wines." American Journal of Enology and Viticulture 49(1): 79-85.
Culleré, L., B. Fernández de Simón, E. Cadahía, V. Ferreira, P. Hernández-Orte and J. Cacho (2013). "Characterization by gas chromatography–olfactometry of the most odor-active compounds in extracts prepared from acacia, chestnut, cherry, ash and oak woods." LWT - Food Science and Technology 53(1): 240-248.

Natural resources and bioeconomy studies 80/2017
289
Cutzach, I., P. Chatonnet, R. Henry and D. Dubourdieu (1997). "Identification of Volatile Compounds with a “Toasty” Aroma in Heated Oak Used in Barrelmaking." Journal of Agricultural and Food Chemistry 45(6): 2217-2224.
Cutzach, I., P. Chatonnet, R. Henry and D. Dubourdieu (1999). "Identifying New Volatile Compounds in Toasted Oak." Journal of Agricultural and Food Chemistry 47(4): 1663-1667.
Czerny, M. and A. Buettner (2009). "Odor-Active Compounds in Cardboard." Journal of Agricultural and Food Chemistry 57(21): 9979-9984.
Delahunty, C. M., G. Eyres and J. P. Dufour (2006). "Gas chromatography‐olfactometry." Journal of Separation Science 29(14): 2107-2125.
Díaz-Maroto, M. C., E. Guchu, L. Castro-Vázquez, C. de Torres and M. S. Pérez-Coello (2008). "Aroma-active compounds of American, French, Hungarian and Russian oak woods, studied by GC–MS and GC–O." Flavour and Fragrance Journal 23(2): 93-98.
Engel, W., W. Bahr and P. Schieberle (1999). "Solvent assisted flavour evaporation-a new and versatile technique for the careful and direct isolation of aroma compounds from complex food matrices." Europe food research technology 209: 237-241.
Escudero, A., P. Hernandez-Orte, J. Cacho and V. Ferreira (2000). "Clues about the role of methional as character impact odorant of some oxidized wines." J. Agric. Food Chem. 48: 4266-4272.
Fernández de Simón, B., E. Esteruelas, Á. M. Muñoz, E. Cadahía and M. Sanz (2009). "Volatile Compounds in Acacia, Chestnut, Cherry, Ash, and Oak Woods, with a View to Their Use in Cooperage." Journal of Agricultural and Food Chemistry 57(8): 3217-3227.
Flamini, R., A. Dalla Vedova, D. Cancian, A. Panighel and M. De Rosso (2007). "GC/MS-positive ion chemical ionization and MS/MS study of volatile benzene compounds in five different woods used in barrel making." J Mass Spectrom 42(5): 641-646.
Flamini, R., A. D. Vedova, D. Cancian, A. Panighel and M. De Rosso (2007). "GC/MS-positive ion chemical ionization and MS/MS study of volatile benzene compounds in five different woods used in barrel making." Journal of Mass Spectrometry 42(5): 641-646.
Fuller, G. H., R. Steltenkamp and G. Tisserand (1964). "The gas chromatograph with human sensor: perfumer model." Annals of the New York Academy of Sciences 116(2): 711-724.
Garde-Cerdán, T., C. Lorenzo, J. M. Carot, M. D. Esteve, M. D. Climent and M. R. Salinas (2010). "Effects of composition, storage time, geographic origin and oak type on the accumulation of some volatile oak compounds and ethylphenols in wines." Food Chemistry 122(4): 1076-1082.
Grosch, W. (1993). "Detection of potent odorants in foods by aroma extract dilution analysis." Trends in Food Science & Technology 4(3): 68-73.
Guichard, E. (2002). "Interactions between flavor compounds and food ingredients and their influence on flavor perception." Food Reviews International 18(1): 49-70.
Jackson, R. ( 2014 ). "Wine Science : Principles and Applications." Elsevier book. Jackson, R. S. (2008). Wine science: principles and applications, Academic press. Laska, M. and R. Hudson (1991). "A comparison of the detection thresholds of odour mixtures and their
components." Chemical Senses 16(6): 651-662. Lopez Pinar, A., D. Rauhut, E. Ruehl and A. Buettner (2016). "Effects of Botrytis cinerea and Erysiphe
necator fungi on the aroma character of grape must: A comparative approach." Food Chem 207: 251-260.
Lopez Pinar, A., D. Rauhut, E. Ruehl and A. Buettner (2017). "Effects of bunch rot (Botrytis cinerea) and powdery mildew (Erysiphe necator) fungal diseases on wine aroma." Frontiers in Chemistry 5(20).
Madene, A., M. Jacquot, J. Scher and S. Desobry (2006). "Flavour encapsulation and controlled release–a review." International journal of food science & technology 41(1): 1-21.
Maria João B. Cabrita, R. G., Nuno Martins, Marco D.R. Gomes da Silva and Ana M. Costa Freitas Dr. Mustafa Ali Mohd (Ed.), InTech, (2012). "Gas Chromatography in the Analysis of Compounds Released from Wood into Wine, Advanced Gas Chromatography - Progress in Agricultural, Biomedical and Industrial Applications,."
Martinez, J., E. Cadahia, B. Fernandez de Simon, S. Ojeda and P. Rubio (2008). "Effect of the seasoning method on the chemical composition of oak heartwood to cooperage." J Agric Food Chem 56(9): 3089-3096.
Matricardi, L. and A. L. Waterhouse (1999). "Influence of Toasting Technique on Color and Ellagitannins of Oak Wood in Barrel Making." American Journal of Enology and Viticulture 50(4): 519-526.
Miller, M. E. and J. D. Stuart (1999). "Comparison of gas-sampled and SPME-sampled static headspace for the determination of volatile flavor components." Analytical Chemistry 71(1): 23-27.
Miyazawa, T., M. Gallagher, G. Preti and P. M. Wise (2008). "Synergistic mixture interactions in detection of perithreshold odors by humans." Chemical senses 33(4): 363-369.

Natural resources and bioeconomy studies 80/2017
290
Ortega-Heras, M., M. L. Gonzalez-SanJose and S. Beltran (2002). "Aroma composition of wine studied by different extraction methods." Anlytica chimica acta 458: 85-93.
Patterson, M. Q., J. C. Stevens, W. S. Cain and J. E. Cometto-Muniz (1993). "Detection thresholds for an olfactory mixture and its three constituent compounds." Chemical Senses 18(6): 723-734.
Penton, Z. E. (1997). "Sample preparation for gas chromatography with solid-phase extraction and solid-phase microextraction." Advances in chromatography 37: 205-236.
Pérez-Coello, M. S. and M. C. Díaz-Maroto (2009). Chapter 8C Volatile Compounds and Wine Aging in Wine chemistry and biochemistry. Editors: M. Victoria Moreno-Arribas and M. Carmen Polo, Springer.
Pérez-Coello, M. S., J. Sanz and M. D. Cabezudo (1998). "Gas chromatographic-mass spectrometric analysis of volatile compounds in oak wood used for ageing of wines and spirits." Chromatographia 47(7): 427.
Pionnier, E., E. Engel, C. Salles and J. Le Quere (2002). "Interactions between non-volatile water-soluble molecules and aroma compounds in Camembert cheese." Food chemistry 76(1): 13-20.
Plutowska, B. and W. Wardencki (2008). "Application of gas chromatography–olfactometry (GC–O) in analysis and quality assessment of alcoholic beverages – A review." Food Chemistry 107(1): 449-463.
Pons, A., V. Lavigne, Y. Landais, P. Darriet and D. Dubourdieu (2010). "Identification of a sotolon pathway in dry white wines." J Agric Food Chem 58(12): 7273-7279.
Robinson, A. L., P. K. Boss, P. S. Solomon, R. D. Trengove, H. Heymann and S. E. Ebeler (2014). "Origins of Grape and Wine Aroma. Part 1. Chemical Components and Viticultural Impacts." American Journal of Enology and Viticulture 65(1): 1-24.
Rodríguez Madrera, R., D. Blanco Gomis and J. J. Mangas Alonso (2003). "Influence of Distillation System, Oak Wood Type, and Aging Time on Composition of Cider Brandy in Phenolic and Furanic Compounds." Journal of Agricultural and Food Chemistry 51(27): 7969-7973.
Schreiner, L., H. M. Loos and A. Buettner (2017). "Identification of odorants in wood of Calocedrus decurrens (Torr.) Florin by aroma extract dilution analysis and two-dimensional gas chromatography–mass spectrometry/olfactometry." Analytical and Bioanalytical Chemistry 409(15): 3719-3729.
Sefton, M. A., I. L. Francis and P. J. Williams (1990). "Volatile norisoprenoid compounds as constituents of oak woods used in wine and spirit maturation." Journal of Agricultural and Food Chemistry 38(11): 2045-2049.
Sefton, M. A. and R. F. Simpson (2005). "Compounds causing cork taint and the factors affecting their transfer from natural cork closures to wine-a review." Australian journal of grape and wine research 11: 226-240.
Sides, A., K. Robards and S. Helliwell (2000). "Developments in extraction techniques and their application to analysis of volatiles in foods." TrAC Trends in Analytical Chemistry 19(5): 322-329.
Silva Ferreira, A. C., P. Guedes De Pinho, P. Rodrigues and T. Hogg (2002). "Kinetics of Oxidative Degradation of White Wines and How They Are Affected by Selected Technological Parameters." Journal of Agric. and Food Chem. 50: 5519-5924.
Spillman, P. J., A. P. Pollnitz, D. Liacopoulos, G. K. Skouroumounis and M. A. Sefton (1997). "Accumulation of Vanillin during Barrel-Aging of White, Red, and Model Wines." Journal of Agricultural and Food Chemistry 45(7): 2584-2589.
Steffen, A. and J. Pawliszyn (1996). "Analysis of flavor volatiles using headspace solid-phase microextraction." Journal of Agricultural and Food Chemistry 44(8): 2187-2193.
Ullrich, F. and W. Grosch (1987). "Identification of the most volatile flavour compounds formed during autoxidation of linoleic acid." Z. Lebensm. Unters. Forsch. 184: 277-282.
Vichi, S., C. Santini, N. Natali, C. Riponi, E. López-Tamames and S. Buxaderas (2007). "Volatile and semi-volatile components of oak wood chips analysed by Accelerated Solvent Extraction (ASE) coupled to gas chromatography–mass spectrometry (GC–MS)." Food Chemistry 102(4): 1260-1269.
Wampler, T. P. (1996). Analysis of food volatiles usig headspace-gas chromatographic techniques in Techniques for analyzing food aroma, CRC Press.
Yovel, Y., M. O. Franz, P. Stilz and H. U. Schnitzler (2008). "Plant classification from bat-like echolocation signals." PLoS Computational Biology 4(3): e1000032.
Zellner, B. d. A., P. Dugo, G. Dugo and L. Mondello (2008). "Gas chromatography–olfactometry in food flavour analysis." Journal of Chromatography A 1186(1): 123-143.

Natural resources and bioeconomy studies 80/2017
291
Characterization of VOCs emission profile from different hardwood core samples during moisture cycles Martina Sassoli1*, Marco Fioravanti1, Giacomo Goli1, Cosimo
Taiti2, Stefano Mancuso2
Abstract
The organic compounds emission from wood and wood-based products has been gaining more attention in the recent years. Indeed, the monitoring of specific volatile organic compounds (VOCs) is fundamental in evaluating the impact of the material on indoor environment, its effect on human health and on other selected materials. VOCs emitted from wood can be originally present in wood (such as terpenes and formaldehyde), but VOCs can also be formed through different chemical processes, such oxidation and hydrolysis, that involved wood components during its natural aging. The study deals with the characterization of VOCs emitted by wood cores of 13 different species (10 Hardwoods and 3 Softwoods) using Proton Transfer Reaction-Time of Flight-Mass Spectrometry (PTR-TOF-MS). This technique is able to provide the whole mass spectra of VOCs with short response time, high mass resolution and without sample preparation. Emissions were regularly measured at different interval of time. After the first measurement on green wood cores, the same specimens were subjected to three moisture cycles from FSP (fiber saturation point) to 12% MC. At each cycle, VOCs emissions were analysed at a moisture content of 12%. The green hardwood was characterized by a richness of volatile compounds: more than 80 mass peaks in the range of measured masses (m/z = 20-250) were detected. Whereas after the first moisture cycle, a more restricted number of masses was revealed. Moreover, the emission rates of methanol, acetaldehyde, ethanol, acetone, acetic acid and furan were monitored to understand if VOCs emissions can give useful information about the early structural changes and modification processes of the main polymers constituting the cell wall (particularly hemicellulose). The work brings new insight to the assessment of the VOCs emission from the wood of different species in green condition (i.e. immediately after tree felling or from increment cores sampling) and over the time in response to several conditioning cycles (i.e. variation of moisture content of the sample). These results have potential significance for 1) the understanding of the phenomena that characterised the processes of wood ageing (the change in material properties during the time), which is an essential factor for the conservation of the Wooden Heritage; 2) the characterisation of wood emission in indoor environments and 3) in exploring the possibility of using VOCs emission as a discriminant between different wood taxa after ageing.
Introduction 1.Volatile organic compounds (VOCs) represent a large and chemically diverse group of carbon-based molecules, such as hydrocarbons and other organic molecules, with a high vapour pressure at room temperature. They are emitted into the atmosphere from anthropogenic and biogenic sources (plants, animals, microorganisms, production processes, and/or their products) (Jantunen et al. 1997).
VOC emissions are also present in wood, and they are dependent upon many factors including species, age, and pH value; these emissions differ significantly between hardwoods and softwoods (Roffael 2006, Steckel et al. 2010, Roffael et al. 2015). VOCs from wood can originate either from compounds present in the native structure of wood, or through different chemical processes, such as oxidation and hydrolysis, that involve wood components (Roffael et al. 2015). In general, the most
* Corresponding author: Tel.: +39 055 2755615; E-mail: [email protected]
1GESAAF University of Florence Florence, 50145, Italy
2DISPAA University of Florence
Sesto Fiorentino, Florence, Italy

Natural resources and bioeconomy studies 80/2017
292
common VOCs emitted from wood are terpenes, aliphatic aldehydes, and organic acids (Schumann et al. 2012).
The aims of the present study were: i. assessing the VOCs emitted by the wood of different species in the green condition (e.g.
immediately after tree felling or increment cores sampling) and over the time in response to several conditioning cycles (e.g. variation of moisture content of the sample);
ii. estimating the possibility to use VOC emission as a discriminant between different wood taxa after ageing (e.g. after repetition of different cycles of moisture variation).
PTR-TOF-MS, used to characterize these emissions, is a useful analytical technique largely applied in order to provide an overview of the mass spectra of volatile compounds emitted by different materials (Han et al. 2010, Soukoulis et al. 2013, Cappellin et al. 2013).
This study was a preliminary trial for a larger research deal with the VOCs emission form wood over time in order to follow structural modification that affected polymeric components of wood cell wall during its inevitably ageing.
Material and methods 2.
Sampling design 2.1.Trees of 13 different species were chosen among individuals belonging to the same class size (height between 15m-20m, diameter at breast height over 20 cm) and from each plant, three fresh wood-core samples were extracted (Table 1) using a Pressler’s increment borer (diameter= 5mm) and a
core extractor. The specimens, made up both heartwood and sapwood, were analysed in the green condition and after several cycles of moisture variation.
Table 1. List of specimens studied: from each plant, three fresh wood-core samples, made up of both heartwood and sapwood, have been investigated.
Code number Species Species acronym
Family Group
1 Atlantic cedar (Cedrus atlantica Man.) CA Pinaceae Softwood 2 Austrian black pine (Pinus nigra Arn.) PiN Pinaceae Softwood 3 Common cypress (Cupressus
sempervirens L.) CS Cupressaceae Softwood
4 Bay laurel (Laurus nobilis L.) LN Lauraceae Hardwood 5 European walnut (Juglans regia L.) JR Juglandaceae Hardwood 6 Black poplar (Populus nigra) PoN Salicaceae Hardwood 7 Common fig (Ficus carica L.) FC Moraceae Hardwood 8 Almond (Prunus amygdalus (Mill.)
D.A.Webb) PAmy Rosaceae Hardwood
9 Wild cherry (Prunus avium L.) PAv Rosaceae Hardwood 10 Black locust (Robinia pseudoacacia L.) RP Fabaceae Hardwood 11 Turkey oak (Quercus cerris L.) QC Fagaceae Hardwood 12 Downy oak (Quercus pubescens Willd.) QP Fagaceae Hardwood 13 Evergreen oak (Quercus ilex L.) QI Fagaceae Hardwood
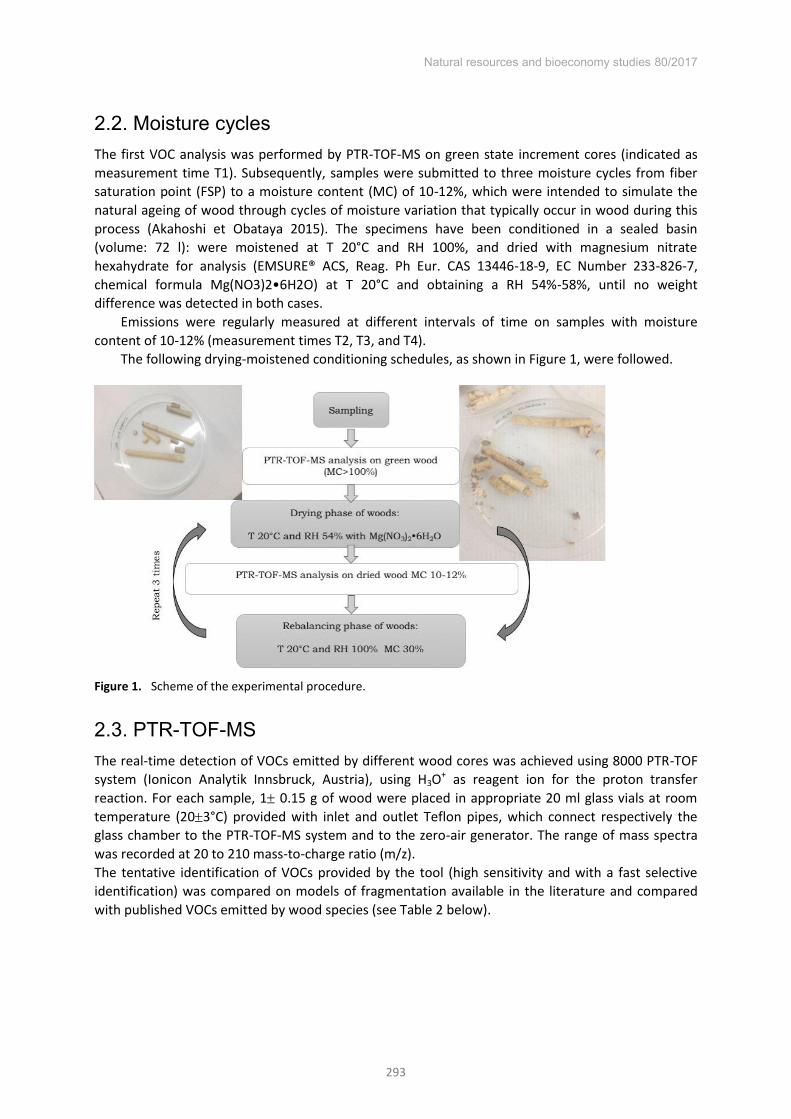
Natural resources and bioeconomy studies 80/2017
293
Moisture cycles 2.2.The first VOC analysis was performed by PTR-TOF-MS on green state increment cores (indicated as measurement time T1). Subsequently, samples were submitted to three moisture cycles from fiber saturation point (FSP) to a moisture content (MC) of 10-12%, which were intended to simulate the natural ageing of wood through cycles of moisture variation that typically occur in wood during this process (Akahoshi et Obataya 2015). The specimens have been conditioned in a sealed basin (volume: 72 l): were moistened at T 20°C and RH 100%, and dried with magnesium nitrate hexahydrate for analysis (EMSURE® ACS, Reag. Ph Eur. CAS 13446-18-9, EC Number 233-826-7, chemical formula Mg(NO3)2•6H2O) at T 20°C and obtaining a RH 54%-58%, until no weight difference was detected in both cases.
Emissions were regularly measured at different intervals of time on samples with moisture content of 10-12% (measurement times T2, T3, and T4).
The following drying-moistened conditioning schedules, as shown in Figure 1, were followed.
Figure 1. Scheme of the experimental procedure.
PTR-TOF-MS 2.3.The real-time detection of VOCs emitted by different wood cores was achieved using 8000 PTR-TOF system (Ionicon Analytik Innsbruck, Austria), using H3O+ as reagent ion for the proton transfer reaction. For each sample, 1 0.15 g of wood were placed in appropriate 20 ml glass vials at room temperature (203°C) provided with inlet and outlet Teflon pipes, which connect respectively the glass chamber to the PTR-TOF-MS system and to the zero-air generator. The range of mass spectra was recorded at 20 to 210 mass-to-charge ratio (m/z). The tentative identification of VOCs provided by the tool (high sensitivity and with a fast selective identification) was compared on models of fragmentation available in the literature and compared with published VOCs emitted by wood species (see Table 2 below).

Natural resources and bioeconomy studies 80/2017
294
Results and discussion 3.Several mass peaks in the range of measured masses (m/z = 20-210) were collected from 13 different wood species at four different sampling times; 80 mass peaks were detected in the specimens from the first measurement, but their number subsequently decreased after several ageing cycles. In Table 2 are reported the most significant putative molecules identified in the first analysis from wood in the green condition, including their measured m/z ratio, protonated molecular formula, chemical name, and related reference. The signals observed from green specimens varied in terms of the nature and intensity for each wood species.
According to our tentative identification, the main compounds detected were m/z = 33.033 methanol, m/z = 45.033 acetaldehyde, m/z = 47.049 ethanol, m/z = 59.049 acetone, m/z = 61.028 acetic acid, m/z = 69.036 furan, m/z = 81.069 monoterpene fragment, m/z = 93.070 toluene or p-cymene fragment, m/z = 153.127 terpenoid compound, m/z = 137.132 monoterpenes, and m/z = 205.195 sesquiterpenes. All these compounds were recorded in all the investigated species during the first measurement (Table 2). Their emission rates were successively monitored three times during the ageing of specimens (Figures 2 and 3).

Natural resources and bioeconomy studies 80/2017
295
Figure 2. Evaluation of signal intensity of some compounds (reported by m/z ratio) detected in the 13 species studied. Different symbols indicate a different time analysis (T1 for green state wood, whereas T2, T3 and T4 for samples after moisture cycles).

Natural resources and bioeconomy studies 80/2017
296
Figure 3. Evaluation of signal intensity of terpenes and terpenoid compounds detected in the 13 species analysed. Different symbols indicate a different time analysis (T1 for green state wood, whereas T2, T3 and T4 for samples after moisture cycles)

Natural resources and bioeconomy studies 80/2017
297
Table 2. Main compounds identified via PTR-TOF-MS during first measurement: Protonated masses (mass/charge = m/z), molecular formula, tentative identification, references of the investigated volatile compounds emitted from different wood species. The symbols indicate the presence (*) or the absence (-) in fresh wood cores. Measured
m/z Protonated formula Tentative identification References (PTR-MS #; Wood (plant and solid wood)*) Code species number
1 2 3 4 5 6 7 8 9 10 11 12 13 27.022 C2H2 H+ Acetylene (Vita et al. 2015)# * * * * * * * * * * * * * 33.033 CH4OH+ Methanol (Risholm-Sundman et al. 1998)*; (Maleknia et al. 2007)#* * * * * * * * * * * * * * 39.020 C3H2H+ Isoprene fragment (Maleknia et al. 2007)#* * * * * * * * * * * * * * 41.038 C3H4H+ Alkyl fragment: propadiene (Brilli et al. 2014)#* * * * * * * * * * * * * * 43.050 C3H6H+ Alkyl fragment: propene (Brilli et al. 2014) #* * * * * * * * * * * * * * 45.033 C2H4OH+ Acetaldheyde (Risholm-Sundman et al. 1998)*; (Filella et al. 2007)#* * * * * * * * * * * * * * 47.012 CH2O2H+ Formic acid/Formates (Sánchez Del Pulgar et al. 2014)# * * * * * * * * * * * * * 47.049 C2H6OH + Ethanol (Maleknia et al. 2007)#* * * * * * * * * * * * * * 49.011 CH4SH + Methanethiol (Papurello et al. 2012)#; (Blake et al. 2009)# * * * * - - * - - * * * - 53.040 C4H4H+ Alkyl fragment or cyclobutadiene (Sánchez Del Pulgar et al. 2014)# or (Vita et al. 2015)# * * * * * * * * * * * * * 55.055 C4H6H+ C4 aldehydes fragment (Sánchez Del Pulgar et al. 2014)# * * * * * * * * * * * * * 59.049 C3H6OH+ Acetone (2-propanone) (Risholm-Sundman et al. 1998)*; (Maleknia et al. 2007)#* * * * * * * * * * * * * * 61.028 C2H4O2H+ Acetic acid (Risholm-Sundman et al. 1998)*; (Maleknia et al. 2007)#* * * * * * * * * * * * * * 69.036 C4H4OH+ Furan (Maleknia et al. 2007)#* * * * * * * * * * * * * * 69.069 C5H8H+ Isoprene (1,4-pentadiene) (Maleknia et al. 2007)#* * * * * * * * * * * * * * 75.043 C3H6O2H+ Propanoic acid or Hydroxy-2-propanone (acetol) (Papurello et al. 2012)# or (Brilli et al. 2014) #* * * * * * * * * * * * * * 77.038 C6H4H+ Alkyl fragment (Goacher et al. 2010)#* * * * * * * * * * * * * * 79.054 C6H6H+ Phenyl ion or benzene (Maleknia et al. 2007)#* or (Brilli et al. 2014)#* * * * * * * * * * * * * * 81.070 C6H8H+ Monoterpenes fragment (Maleknia et al. 2007)#*; (Grabmer et al. 2006)#* * * * * * * * * * * * * * 83.085 C6H10H+ C6 compounds: frag. of hexanal or hexenol (Soukoulis et al. 2013)# or (Brilli et al. 2014)#* * * * * * * * * * * * * * 89.059 C4H8O2H+ Ethyl acetate or methyl-propanoate (Yener et al. 2015)# * * * * * * * * * * * * * 91.054 C7H6H+ Xylene fragment (Maleknia et al. 2007)#* * * * * * * * * * * * * * 93.069 C7H8H+ p-Cymene fragment or toluene (Maleknia et al. 2007)#* or (Holzinger et al. 2000)#* * * * * * * * * * * * * * 97.028 C5H4O2H+ Furfural (Brilli et al. 2014)#*; (Fernández de Simón et al. 2009)* * * * * * - * * - - * * - 99.080 C6H10OH+ Hexanals (Brilli et al. 2014)#* * * * * * - - - - * - * -
101.059 C6H12OH+ Hexanal (Risholm-Sundman et al. 1998)*; (Brilli et al. 2014)#*; * * * * * * * * - - * * * 105.069 C8H8H+ Olefin or styrene/ethylbenzene (Brilli et al. 2014)#* or (Yener et al. 2015)# * * * * * * * * * * * * * 107.049 C7H6OH+ Benzylaldehyde (Yener et al. 2015)#; (Roffael et al. 2015)* * * * * * * * * * * * * * 107.085 C8H10H+ Monoterpene fragment or p-xylene/ ethylbenzene (Maleknia et al. 2007)#* or (Brilli et al. 2014)#* * * * * * * * * * * * * * 123.116 C9H14
+H+ Sesquiterpene fragments (Demarcke et al. 2009)# * * * * * * * * * * * * * 135.117 C10H14H+ p-Cymene (Maleknia et al. 2007)#*; (Courtois et al. 2009)* * * * * * * * * - * * * * 137.137 C10H16H+ Monoterpenes (Risholm-Sundman et al. 1998)*; (Maleknia et al. 2007)#* * * * * * * * * * * * * * 153.126 C10H16OH+ Terpenoid-like compound/ ion of oxygenate terpenes (Maleknia et al. 2007)#*; (Courtois et al. 2009)* * * * * * * * * - * * * - 169.090 C9H12O3H+ 4-methylsiringol (Fernández de Simón et al. 2009)* * * * - * - - - - - - - - 205.195 C15H24H+ Sesquiterpenes (Courtois et al. 2009)* * * * * * * * * - * * * -

Natural resources and bioeconomy studies 80/2017
298
All the VOCs emissions taken into account decreased in intensity starting from the second analysis (after the first drying of wood), and they subsequently disappeared after the second and third steps, excluding some VOCs that continued to be emitted in minimum quantities by some species. For instance, Pinus nigra and Cupressus sempervirens showed the highest signal intensity and the highest number of total peaks in softwood during first sampling time (Figures 2 and 3), but in the subsequent analysis, only their emission rates of acetaldehyde and acetone were slightly higher in comparison with all other VOC species. More generally, the softwoods group (Cedrus, Pinus, and Cupressus) continued to emit more methanol than the hardwoods group.
Fresh hardwood species released higher amounts of acetic acid, probably originating from hydrolyses of acetyl groups in hemicellulose, than terpenes compounds (Figures 2 and 3). Regarding specific profile emission from hardwoods during ageing, only Populus nigra and Ficus carica showed ethanol emission even though in very low amounts, differentiating them from the other hardwood and softwood species here examined.
The emission intensity of compounds tentatively identified as terpenes, terpenoids, sesquiterpenes, and their fragments (m/z = 81.069; 93.070; 153.127; 137.132; 205.195) was higher in softwoods (Cedrus, Pinus, and Cupressus) in comparison with most hardwood species (Fig. 3), with terpene compounds being the essential part of the resin composition in many softwood species (Risholm-Sundman et al. 1998, Roffael et al. 2015, Baumann et al. 1999, Schumann et al. 2012). The only exception was represented by Bay laurel (Laurus nobilis) in green condition that showed similar peak intensities for the masses regarding terpenes, due to the richness of such compounds in this species (e.g. oxygenated monoterpenes and monoterpene hydrocarbons) (Flamini et al. 2007).
VOCs released from core wood samples belonging to 13 different species were analysed and subsequently a partial least squares discriminant analysis (PLSDA) approach was applied for the classification of the matrix of VOCs emitted x number of samples to discriminate the groups (softwood and hardwood) and the different tree species. Several models were built considering different time analyses (Taiti et al 2016, Sassoli et al. 2017). However, the blend of VOCs detected for each sample analysed was largely hardwood-softwood-specific and allowed assembling different samples in these two groups even after few drying cycles. On the contrary, the distinction among species was not possible for all the species analysed, considering emissions from green wood cores as well.
To sum up analysis showed the significant difference between the measurements at T1 (green wood) and the measurements after a few cycles of moisture variation (T2 to T4). In particular, the results of this study indicate that after the first cycle, both softwood and hardwood species tend to converge versus a common class of compounds, but a small residue of terpenes persists in the case of softwoods. It seems that green wood is still rich in compounds originated from physiological activity of the tree. Furthermore, it seems that the majority of these compounds are very volatile and, during moisture cycles, the residual compounds measured can be correlated to the processes of structural modification of the cell walls. This explanation finds confirmation in studies carried out on aged wood that show a lower content of hemicellulose, with also a significant reduction of its hygroscopicity (e.g. Obataya 2007). This analysis of VOCs indicates that this process starts when the first drying of wood occurs.
Conclusions 4.The results of this study have shown that, as consequence of the moisture cycles, the spectra of the VOC emissions of wood are significantly changed. The emission rates of all revealed compounds decreased after only a few ageing cycles, though we did not observe the increase of the emissions of some specific compounds or the presence of new compounds during the simulated ageing. During the moisture cycles in all the species studied, emission of VOCs has shown both a quantitative and a qualitative modification of the acquired spectra. Apparently, losing the compounds produced by the

Natural resources and bioeconomy studies 80/2017
299
metabolic activity of the tree, the wood emits compounds possibly due to structural changes and degradation processes of the main polymers constituting the cell wall; these polymers are common to all wood species excepting small percentage differences of chemical composition.
These results clearly indicate that the analysis of VOCs might be applied to the discrimination between softwood and hardwood groups even at the first steps of ageing of wood, while it could be applied to the identification of wood species only on very fresh wood, when the material still contains all the classes of compounds that are produced by the trees and that are characterized by strong volatility. For instance, concerning softwood samples in green conditions, Pinus nigra and
Cupressus sempervirens showed the highest signal intensity and the highest number of total peaks, whereas, dealing with fresh hardwood specimens, these released higher amounts of acetic acid than terpenes compounds, excepting Laurus nobilis. As soon as the natural cycle of variation of moisture content (i.e. moisture desorption and adsorption) starts, the composition of the emissions changes, making very weak the discriminant capacity even at the highest hierarchical level of the taxa (i.e. families).
It is necessary to extend the analysis of VOCs by PTR-TOF-MS on increasingly aged samples and on naturally aged wood samples, in order to monitor these emissions and eventually match them to specific degradation processes of wood components. The characterization and the monitoring of specific VOCs could contribute to understand the phenomena that characterised the processes of wood ageing and could be used to predict indoor air quality and improve conservation conditions of historical wooden objects. In fact, during the last years, emissions of VOCs form wood have continually gained importance as a property of wood products. Moreover, emission of aliphatic aldehydes, terpenes, and organic acid from wood materials (used as building products or as artefact itself) could create unhealthy condition for human beings or adverse condition for selected materials.
References Akahoshi H, Obotaya E (2015). Effects of wet–dry cycling on the mechanical properties of Arundo donax
L. used for the vibrating reed in woodwind instruments. Wood Science and Technology, 49(6): 1171–1183. – doi: 10.1007/s00226-015-0760-6
Baumann MGD, Batterman SA, Zhang GZ (1999). Terpene emissions from particleboard and medium-density fiberboard products. Forest products journal, 49(1): 49–56.
Blake RS, Monks PS & Ellis AM. (2009). Proton Transfer Reaction Mass Spectrometry. Chemical reviews 109(3): 861-896.
Brilli F, Gioli B, Ciccioli P, Zona D, Loreto F, Janssen IA, Ceulemans R (2014). Proton Transfer Reaction Time-of-Flight Mass Spectrometric (PTR-TOF-MS) determination of volatile organic compounds (VOCs) emitted from a biomass fire developed under stable nocturnal conditions. Atmospheric Environment, 97: 54-67.
Cappellin L, Loreto F, Aprea E, Romano A, Sánchez del Pulgar J, Gasperi F, Biasioli F (2013). PTR-MS in Italy: a multipurpose sensor with applications in environmental, agri-food and health science. Sensors, 13(9):11923–11955.
Courtois EA, Paine CET, Blandinieres PA,Stien D, Bessiere JM, Houel E, Baraloto C, Chave J (2009). Diversity of the volatile organic compounds emitted by 55 species of tropical trees: A survey in French Guiana. Journal of Chemical Ecology, 35(11): 1349–1362.
Demarcke M, Amelynck C, Schoon N, Dhooghe F, Van Langenhove H, Dewulf J (2009). Laboratory studies in support of the detection of sesquiterpenes by proton-transfer-reaction-mass-spectrometry. International Journal of Mass Spectrometry, 279(2–3): 156–162.
Fernández de Simón B, Esteruelas E, Muñoz ÁM, Cadahía E, Sanz M (2009). Volatile compounds in acacia, chestnut, cherry, ash, and oak woods, with a view to their use in cooperage. Journal of Agricultural and Food Chemistry, 57(8): 3217–3227.
Filella I, Wilkinson MJ, Llusia J, Hewitt CN, Penuelas J (2007). Volatile organic compounds emissions in Norway spruce (Picea abies) in response to temperature changes. Physiologia Plantarum, 130(1): 58–66.
Flamini G, Tebano M, Cioni PL, Ceccarini L, Ricci AS, Longo I (2007). Comparison between the conventional method of extraction of essential oil of Laurus nobilis L. and a novel method which uses microwaves applied in situ, without resorting to an oven. Journal of Chromatography A, 1143(1-2): 36–40.

Natural resources and bioeconomy studies 80/2017
300
Goacher RE, Jeremic D, Master ER (2010). Expanding the library of secondary ions that distinguish lignin and polysaccharides in time-of-flight secondary ion mass spectrometry analysis of wood. Analytical chemistry, 83(3): 804–812.
Grabmer W, Kreuzwieser J, Wisthaler A, Cojocariu C, Graus M, Rennenberg H, Steigner D, Steinbrecher R, Hansel A (2006). VOC emissions from Norway spruce (Picea abies L. [Karst]) twigs in the field-Results of a dynamic enclosure study. Atmospheric Environment, 40: 128–137.
Han KH, Zhang JS, Wargocki P, Knudsen HN, Guo B (2010). Determination of material emission signatures by PTR-MS and their correlations with odor assessments by human subjects. Indoor Air, 20(4): 341–354.
Holzinger R, Sandoval-Soto L, Rottenberger S, Crutzen PJ, Kesselmeier J (2000). Emissions of volatile organic compounds from Quercus ilex L. measured by proton transfer reaction mass spectrometry under different environmental conditions. Journal of Geophysical Research: Atmospheres 105: 573–579.
Jantunen M, Jaakkola JJ, Krzyzanowski M (1997). Assessment of exposure to indoor air pollutants (No. 78). WHO Regional Office Europe, pp.139.
Maleknia SD, Bell TL, Adams MA (2007). PTR-MS analysis of reference and plant-emitted volatile organic compounds. International Journal of Mass Spectrometry, 262(3): 203–210.
Obataya E (2007). Effects of Ageing and Heating on the Mechanical Properties of Wood. In Wood Science for Conservation of Cultural Heritage, Florence 2007 : Proceedings of the International Conference Hld by Cost Action IE0601 in Florence (Italy), 8-10 November 2007. Firenze : Firenze University Press (ITA), pp. 16-23.
Papurello D, Soukoulis C, Schuhfried E, Cappellin L, Gasperi F, Silvestri S, Santarelli M, Biasioli F (2012). Monitoring of volatile compound emissions during dry anaerobic digestion of the Organic Fraction of Municipal Solid Waste by Proton Transfer Reaction Time-of-Flight Mass Spectrometry. Bioresource Technology, 126: 254–265.
Risholm-Sundman M, Lundgren M, Vestin E, Herder P (1998). Emissions of acetic acid and other volatile organic compounds from different species of solid wood. Holz Als Roh-Und Werkstoff, 56(2): .125–129.
Roffael E (2006). Volatile organic compounds and formaldehyde in nature, wood and wood based panels. Holz als Roh- und Werkstoff, 64(2): 144–149.
Roffael E, Schneider T, Dix B (2015). Effect of oxidising and reducing agents on the release of volatile organic compounds (VOCs) from strands made of Scots pine (Pinus sylvestris L.). Wood Science and Technology, 49(5): 957–967.
Sassoli M, Taiti C, Guidi Nissim W, Costa C, Mancuso S, Menesatti P and Fioravanti M (2017). Characterization of VOC emission profile of different wood species during moisture cycles}. iForest - Biogeosciences and Forestry, 10(3): 576-584.
Sánchez del Pulgar J, Renaville B, Soukoulis C, Cappellin L, Romano A, Gasperi F, Piasentier E, Biasioli F (2014). Stearoyl-CoA desaturase and sterol regulatory binding protein 1 markers: Effect on the volatile profile of dry-cured Parma, San Daniele and Toscano hams as detected by PTR-ToF-MS. International Journal of Mass Spectrometry, 365–366: 343–350.
Schumann A, Lenth C, Hasener J, Steckel V (2012). Detection of volatile organic compounds from wood-based panels by gas chromatography-field asymmetric ion mobility spectrometry (GC-FAIMS). International Journal for Ion Mobility Spectrometry, 15(3): 157–168.
Soukoulis C, Cappellin L, Aprea E, Costa F, Viola R, Märk TD, Gasperi F, Biasioli F (2013). PTR-ToF-MS, A Novel, Rapid, High Sensitivity and Non-Invasive Tool to Monitor Volatile Compound Release During Fruit Post-Harvest Storage: The Case Study of Apple Ripening. Food and Bioprocess Technology, 6(10): 2831–2843.
Steckel V, Welling J, Ohlmeyer M (2010). Emissions of volatile organic compounds from convection dried Norway spruce timber. The Future of Quality Control for Wood & Wood Products: Proceedings of the Final Conference of COST Action E53: Quality Control for Wood & Wood Products 4 - 7th May 2010, Edinburgh, UK, Edinburgh Napier University, Forest Products Research Institute / Centre for Timber Engineering, pp. 222-230.
Vita F, Taiti C, Pompeiano A, Bazihizina N, Lucarotti V, Mancuso S, Alpi A (2015). Volatile organic compounds in truffle (Tuber magnatum Pico): comparison of samples from different regions of Italy and from different seasons. Scientific reports, 5: 12629.
Taiti C, Costa C, Guidi Nissim W, Bibbiani S, Azzarello E, Masi E, Pandolfi C, Pallottino F, Menesatti P, Mancuso S (2016). Assessing VOC emission by different wood cores using the PTR-ToF-MS technology. Wood Science and Technology. 1-23.
Yener S, Romano A, Cappellin L, Granitto PM, Aprea E, Navarini L, Märk TD, Gasperi F, Biasioli F (2015). Tracing coffee origin by direct injection headspace analysis with PTR/SRI-MS. Food Research International, 69: 235–243.

Natural resources and bioeconomy studies 80/2017
301
Clonal variation in hybrid aspen wood and bark basic density, heating value and nutrient concentrations
Jyrki Hytönen1, Egbert Beuker2*, Anneli Viherä-Aarnio3
Abstract
A breeding program with hybrid aspen (Populus tremula x P. tremuloides) was started in Finland during the mid-1990’s. Individual superior hybrid aspen trees were selected and cloned from stands and trials that were left over from an earlier period of hybrid aspen breeding during the 1950’s and 60’s. The main aim of the new program was to produce pulpwood, but hybrid aspen could be grown also as short-rotation crop for bioenergy. Besides growth, also the quality of the crop is an important factor for the user. A series of clone trials including 25 hybrid aspen clones was established in southern Finland in 1998 based on the new selections. To study the clonal differences in wood and bark properties, seven clones at the age of 12 years were selected from one trial. From each clone 5 trees were harvested, and biomass of each tree was measured. Samples were taken for determination of wood and bark basic density, heating value (qv(net)),and nutrient concentrations. We found statistically significant clonal differences in almost all studied properties. The heating value of hybrid aspen was lower than in conifers, but similar with that of some other hardwoods grown in Finland. The study suggests that there are possibilities for selecting nutrient-efficient clones having good growth. Clonal selection based on tree quality characteristics and growth could improve the suitability of hybrid aspen for various end uses.
Introduction 1.Hybrid aspen (Populus x wettsteinii Hämet-Ahti), a cross between the native European aspen (P. tremula L.) and American aspen (P. tremuloides Michx.), is considered to be the fastest growing tree species in Finland (Hynynen 1999, Beuker et al. 2016). A breeding program with hybrid aspen was started in Finland during the mid-1990’s with the aim to produce pulpwood (Beuker 2000). Individual
hybrid aspen trees, superior in growth and external shape, were selected from stands and trials that had been planted during the 1950’s and 60’s. Those selected trees were cloned through
micropropagation. For pulpwood production generally 1200 hybrid aspen seedlings are planted per hectare to be grown for 20 to 25 years without thinning. After harvesting a next generation can be established from root suckers, which are produced in abundance from the existing root system (McCarthy and Rytter 2015). Hybrid aspen can be used also as a short rotation tree species for bioenergy (Tullus et al. 2012). Another option for hybrid aspen management is a combination of short rotation cultivation for bioenergy or pulpwood followed by selective thinning, and production of timber with larger dimensions for veneer or sawn timber (Syörilä 1992, McCarthy and Rytter 2015). Hybrid aspens have been shown to have potential also for phytoremediation of contaminated soils (Hassinen et al. 2009).
Hybrid aspen grows best on fertile forest sites and former fields with good aeration and water conditions. At the most suitable sites in Southern Finland the yield of the first rotation stands can be up to 20 m3 ha-1 per year in about 20 year rotations (Beuker et al. 2016). Second rotation growth
* Corresponding author: Tel.: +358295324223; E-mail: [email protected]
1Management and production of renewable
resources Natural Resources Institute
Kokkola, 69100, Finland
3Green technology Natural Resources Institute
Helsinki, 00790, Finland
2Green technology Natural Resources
Institute Punkaharju, 58450, Finland
Natural resources and bioeconomy studies 80/2017
302
could be even higher due to denser stands and coppice vigour as a consequence of existing root system. Further north climatic conditions restrict the cultivation of hybrid aspen, because the clones used are of rather southern origin. Hybrid aspen is very susceptible to damage by mammal herbivores. Herbivore damage may not only affect the survival and growth rate of the plantations, but also have a major effect on wood quality. The plantations should be fenced against moose and the trees protected against voles and hares. Failures in the earlier plantations were often due to unsuitable origin or site, poor early management or damage by browsing mammals (Viherä-Aarnio 1999).
Several properties of the feed stock can be determined, depending on the end use. Wood properties can be described in terms of proximate and ultimate analysis, bulk density, heating value, composition and tree species (Nurmi 1993). Wood density is considered to be one of the most important quality traits, as high density has a positive effect on most of the mechanical strength properties (Heräjärvi 2004a, b). Native European aspen is known to have several favourable properties regarding mechanical processing (Söyrilä 1992, Heräjärvi et al. 2006), but studies on the corresponding properties of hybrid aspen are few (Heräjärvi et al.2006, Heräjärvi 2009). High wood density entails better pulp yield in pulping industry (Tammisola et al. 1995) and also higher heating value per volume. However, for aspen pulpwood fibre dimensions are the most important properties. They are measured as the average fibre length and fibre coarseness (Yu et al. 2001, Ranua, 2002). Low values of both fibre length and fibre coarseness are considered favourable for fine quality printing paper, while both of them correlate positively with wood density (Gort et al. 2009). Energy yield as measured by heating value is one of the most important quality characteristics of dedicated wood energy plantations (Kenney et al. 1990). The heating value of hybrid poplars and the clonal variation in heating value is poorly known. When poplars are used for phytoremediation the nutrient concentrations and especially those of heavy metals are important.
Knowledge of the properties and clonal variation of hybrid aspen wood and bark is still limited, and thus, screening of hybrid aspen clones regarding different characteristics is needed. In clonal forestry, as practiced with hybrid aspen, new traits could be easily introduced to commercial plantations. We studied variation among pulp-tree-sized hybrid aspen clones in a southern Finnish field trial. In this presentation, preliminary results are presented of growth and quality of the crop as determined by basic density, nutrient concentrations and heating value of bark and wood.
Materials and methods 2.The material for these studies was obtained from a hybrid aspen clonal trial in Urjala, Southern Finland (61°00’ N, 23°29’ E) that was established in spring 1998. The trial included 25 clones of hybrid
aspen and two clones of European aspen. The clones had been selected from stands and trials that were established in Southern and Central Finland during the 1950’s and 1960’s. The experimental
design consisted of 5 blocks and in each block ten trees per clone had been planted in row plots (2x5 trees per clone per plot) with a spacing of 2 m (between plants) x 4 m (between rows). The trial was situated at a former agricultural field on a sandy clay soil. Before planting, the soil was prepared by ploughing. No other weed control was carried out before or after planting. The site was fenced against moose and each individual tree was protected against voles and hares by a 50 cm high Tubex tube.
Seven hybrid aspen clones were selected for this study on the grounds of growth, branchiness and stem form (Table 1). All seven clones were amongst the ten best growing ones (height) in the trial. Clones differing in branchiness and stem form were selected for this study. The height and breast height diameter (DBH) of all trees were measured. From each block 1 tree per clone (i.e. 5 trees per clone) was harvested during winter after 12 growing seasons. After felling height (dm) and DBH (cm) of each tree were measured, and the trees were delimbed. From the stem 5 cm thick sample discs were sawn at 0.6 m, 1.3 m and 2 m from the stump and then every two meters to the

Natural resources and bioeconomy studies 80/2017
303
top of each tree. Each of the samples were marked (tree number, height from stump) and placed in plastic bags. The fresh weight of the stems was weighed with a scale in the field. The branches of each tree were collected, weighed and bundled. A sample consisting of 10 cm sections from middle, top and base sections of each branch bundle was taken for analysis. Allometric dry mass equations for hybrid aspen bark, wood and branch biomass with DBH as independent variable were calculated. Average biomass of all measured trees was calculated.
In the laboratory, the 5 cm thick stem sample discs were halved. One of the halves was used for determination of the bulk density using the water replacement method (Olesen 1971). After measuring the disc with bark it was debarked and re-measured to obtain the basic density of the bark. Then the bark and wood samples were dried at +105 °C to constant weight. The second half of each sample disc and a separate branch sample were used for analyzing nutrient concentration of bark, wood and branches, as well as their heating value. The sample discs were debarked carefully and the fresh weight of wood and bark was measured. The samples were dried at +70 °C to constant weight. The samples were milled and divided in to two samples. The first sample was used to determine effective (lower) heating value (qv (net)) of wood and bark with a bomb calorimeter. The calorimetric or higher heating value (qv (gross)) is determined with a bomb calorimeter and all other heating values are derived from it. The effective, or lower heating value of oven dry biomass (qv(net)) indicates the energy available in free combustion of oven dry biomass and is calculated as the calorimetric heating value minus the heat released by the condensation water that is created during combustion. The second sample was used to determine the element (N, P, K, Ca, Mg, B, Cd, Cr, Cu, Fe, Mn, Na, Ni, S and Zn) concentrations of stem, bark and branches. N and H concentrations of samples were analyzed with CHN analyzer and other elements with ICP following microwave digestion of the samples.
Means of tree height, diameter and biomass in each plot was calculated and the statistical analysis was performed on the plot means. The significance of clonal differences in the measured variables was tested with two-way analysis of variance (clone, block). The clonal means were compared using Tukey’s multiple range test at significance level p = 0.05.
Table 1. The hybrid aspen clones included in the study, their location of selection and the origin of their parents. EUR = Populus tremula, AME = Populus tremuloides. CA = Canada, FI = Finland, S = Sweden.
Clone Origin Long. Lat. Mother Origin of the mother Father Origin of the father
7 Vihti 60 20' 24 26' EUR Tuusula, FI AME Aleza Lake, Cariboo, BC, CA
14 Lapinjärvi 60 37' 26 11' EUR Toivakka, FI AME Maple, Ontario, CA
20 Nurmijärvi 60 30' 24 42' AME Aleza Lake, Cariboo, BC, CA EUR FI
21 Vihti 60 20' 24 26' EUR Helsinki, FI AME Galt, Ontario, CA
24 Vaajakoski 62 15' 25 54' EUR Tuusula, FI AME Maple, Ontario, CA
26 Vaajakoski 62 15' 25 54' AME Gothenburg bot. garden, S EUR Tuusula, FI
27 Loppi 60 37' 24 27' EUR Punkaharju, FI AME CA

Natural resources and bioeconomy studies 80/2017
304
Results 3.
Height, diameter and tree biomass 3.1.At the age of 12 years the hybrid aspens were on the average 10.9 m in height and 11.0 cm in DBH (Fig. 1A, B). There were significant clonal differences in height and DBH. The difference between the best and poorest clone in mean height and DBH was 1.3 m and 2.7 cm, respectively. There were also significant differences between clones in total leafless above-ground dry mass per tree (Fig. 1C) as well as in the fraction of branch dry mass of the total dry mass (Fig. 1D). The average dry mass was 31 kg tree-1, and difference between the best and poorest clone was 17 kg tree-1. The clone with the highest total dry mass per tree (clone 27) had also the highest fraction of its mass in the branches.
Figure 1. Mean height (A), breast heigh diameter (B), average tree dry mass (C) and the fraction (%) of branch dry mass of the total dry mass (D) of the studied hybrid aspen clones. Tree dry mass is calculated with biomass equations using all trees and fraction of branches is calculated on basis of sample trees. Means that do not differ from each other according to Tukey’s test at 0.05 significance level are marked with same letter.
Basic density 3.2.There were significant clonal differences in basic density both in wood and bark (Fig. 2). The difference between the best and poorest clone in basic density of wood and bark was 44 kg m-3 and 91 kg m-3, respectively. The average basic density of wood of all hybrid aspen clones was 378 kg m-3
and that of bark 450 kg m-3. No significant correlation was found between the basic density and the tree biomass. The share of bark was on the average 15.1% of the stem mass (without branches).

Natural resources and bioeconomy studies 80/2017
305
Figure 2. Basic density of wood and bark of the studied hybrid aspen clones. Means that do not differ from each other according to Tukey’s test at 0.05 significance level are marked with same letter.
Heating value 3.3.There were significant clonal differences in the effective heating value of both stem wood and stem bark of hybrid aspen clones. However, there were not significant differences in the heating value of the branches of different clones (F= 2.305, p =0.067). The heating value of wood was lower than that of bark, and that of branches was intermediate. The average effective heating value of wood was 18.259 MJ kg-1 , bark 19.265 MJ kg-1 and that of branches 18.732 MJ kg-1 The clonal difference in lowest and highest heating value of wood was 0.446 MJ kg-1 and that of bark 0.928 MJ kg-1. Clone 27 had highest heating value in wood, but lowest in bark. No significant correlation was found between the heating value and the tree biomass.
Figure 3. The effective heating value of oven dry biomass (qv(net)) of wood and bark of hybrid aspen clones. Means that do not differ from each other according to Tukey’s test at 0.05 significance level are marked with same letter.
Natural resources and bioeconomy studies 80/2017
306
Nutrient concentrations 3.4.There were statistically significant clonal differences in concentrations of wood N, P, K, Ca, Mg, Cu, and S. In hybrid aspen bark, clonal differences were significant in concentrations of N, P, K, Ca, Mg, Cd, Cu, Mn, Ni, S and Zn. Correspondingly statistically significant clonal differences of P, Mg, Ca, B, Cd, Cu, Mn and Ni concentrations were detected in branches. The concentration of all studied elements was considerably higher in bark than in wood and branches were intermediate (Table 2).
Table 2. The mean values for nutrient concentrations for wood, bark and branches
Element Unit Wood Bark Branches B mg kg-1 3.94 21.35 12.39
Ca g kg-1 0.79 10.93 7.03 Cd mg kg-1 0.22 0.68 0.56 Cr mg kg-1 0.25 0.20 0.18 Cu mg kg-1 1.97 2.30 4.26 Fe mg kg-1 4.60 15.61 12.94 K g kg-1 0.99 6.39 3.28
Mg g kg-1 0.23 1.01 0.91 Mn mg kg-1 5.349 22.866 17.613 N g kg-1 1.05 8.43 5.87
Na mg kg-1 3.79 11.07 10.51 Ni mg kg-1 0.19 0.72 0.75 P g kg-1 0.20 1.11 0.93 S mg kg-1 90.17 592.85 390.10
Zn mg kg-1 17.70 120.07 60.48 Ash % 0.45 3.86 2.36
Discussion 4.After 12 growing seasons the aspens were on the average 11 m in height. The trial in Urjala was one of a series of trials in Southern Finland including the same clones. Compared to the other trials the growth was not optimal (data not shown). This was probably mainly due to a lack of weed control. Especially after the first years after planting the trees suffered competition with weed. If no weed control is conducted, competition by weeds on former agricultural lands is strong (Hytönen and Jylhä 2005) and it can have a significant effect on survival and growth of Populus seedlings (Böhlenius and Övergaard 2015).
There were significant clonal differences in the growth, basic density of wood and bark, heating value and nutrient concentrations of wood and bark of the studied seven hybrid aspen clones. Height and diameter are usually the primary selection traits in tree breeding and clonal differences in these variables were 10-20%. Also in Sweden Rytter and Stener (2003) and in Estonia Tullus et al. (2010) reported clonal differences in hybrid aspen height and DBH or annual height growth. We found also clonal differences in basic density of wood and bark in accordance with results of Rytter and Stener (2003). The range of clonal variation in basic density reported in this study covered the values reported earlier by Rytter and Stener (2003) and Heräjärvi and Junkkonen (2006). The basic density values of wood of this study are also in line with the ones of 26-year-old seed-born hybrid aspen families presented by Illstedt and Gullberg (1993). According to Heräjärvi (2009) the average basic density of mature European and hybrid aspen wood was 420 kg m-3, which is somewhat higher value than in the 12-year-old trees of our study. No significant correlation was detected between wood density and growth, which is in line with Tsoumis (1991) that growth rate should have little direct

Natural resources and bioeconomy studies 80/2017
307
influence on the timber density of diffuse porous species such as aspen. Hybrid aspen can also have clonal differences in their cellulose content (Tullus et al. 2010).
The hybrid aspen wood and bark heating values (MJ kg-1) in this study were similar with those measured for native aspen and other Finnish deciduous tree species, except for silver birch and pubescent birch which have higher heating value for bark (Nurmi 1993). The conifers Scots pine and Norway spruce have slightly higher heating values for wood, but similar for bark (Nurmi 1993). The trees used in the studies by Nurmi (1993) were of approximately the same height as the hybrid aspen trees used in this study. Since the clonal differences in heating value were small in magnitude, the choice of clones suitable for biomass cultivation cannot be made on the basis of the heating value. Thus, energy yield of hybrid aspen plantations can be improved better by selecting clones for growth and yield than for heating value.
There were significant clonal differences in most hybrid aspen element concentrations measured in wood and bark. Also, Rytter and Stener (2003) reported genetic differences in 14-year-old hybrid aspen stem K, P and Mg concentrations. However, Tullus et al. (2010) did not find clonal differences at the age of seven years in N, P and K concentrations of four hybrid aspen clones. Calcium concentration in both wood and bark of the hybrid aspen clones was higher than concentration of any other element, which is generally the case (Hakkila and Kalaja 1983). Hybrid aspen clones have been shown to effectively accumulate heavy metals like Cd and Pb in their shoots, and especially in their roots (Malá et al. 2007, Hassinen et al. 2009). Thus, the differences in the Cd concentrations of the clones detected in this study may indicate a possibility to select better clones for phytoremediation of polluted soils.
Clonal selection based on tree quality characteristics and growth could improve the suitability of hybrid aspen for various end uses. An advantage of clonal selection is that the total genetic variation can be used. The study suggests that there are differences in nutrient-efficiency between the studied clones. However, when selecting for various characteristics also the correlation between characteristics should be taken into account (Bisoffi and Gullberg 1996, Yu et al. 2001) Low nutrient use efficiency is generally considered desirable but when objective is to use trees for phytoremediation high concentration of heavy metals, e.g. such as Cd showing high clonal variation in this study, are desired.
Conclusions 5.There were significant differences in the growth, basic density, heating value and nutrient concentrations of wood and bark between the studied seven hybrid aspen clones at age of 12 years. This suggests that these characteristics can be improved through breeding and selection. Including wood quality characteristics in hybrid aspen breeding programmes also offer the opportunity to select clones for specific end uses of the wood (e.g. pulpwood vs. energy wood).
Acknowledgements Jussi Tiainen, Heikki Kinnunen, Seppo Vihanta and Eero Saari are acknowledged for the field work and Seppo Vihanta for assisting in data processing. Reetta Kolppanen and Kaisa Jaakola at Luke Kannus laboratory are thanked for analysis.

Natural resources and bioeconomy studies 80/2017
308
References Beuker, E. 2000. Aspen breeding in Finland, new challenges. Baltic Forestry 6(2):81-84. Beuker, E., A. Viherä-Aarnio, and J. Hynynen. 2016. Growth potential of first generation hybrid aspen
plantations in southern Finland. In: Poplars and other fast-growing trees – Renewable resources for future green economies, International poplar commission, 25th session Berlin, Germany, 13-16 September 2016: Abstracts of submitted papers and posters. Working Paper IPC 14. 118 pp.
Bisoffi, S. and U. Gullberg. 1996. Poplar breeding and selection strategies. In Stettler, R.F., Bradshaw, Jr., H.D., Heilman, P.E., and T.M. Hinckley.(Eds.) Biology of Populus and its implications for management and conservation. Part I, Chapter 6. NRC Research Press, National Research Council of Canada, Ottawa, ON. Pp. 139-158.
Böhlenius, H. and R. Övergaard. (2015) Growth response of hybrid poplar to different types and levels of vegetation control,
Scandinavian Journal of Forest Research, 30(6):516-525. Gort, J., A. Zubizarreta Gerendiain, H. Peltola, P. Pulkkinen, J. Routa, and R. Jaatinen. 2009.
Differences in fibre properties in Scots pine (Pinus sylvestris L.) genetic entries grown at different spacing and sites. Silva Fennica 43(3): 55–368.
Hakkila, P. and H. Kalaja. 1983. The technique of recycling wood and bark ash. Puu- ja kuorituhkan palauttamisen tekniikka. (In Finnish with English Summary). Folia Forestalia 552:1-37.
Hassinen, V., Vallinkoski, V-M., Issakainen, S., Tervahauta, A., Kärenlampi, S. and K. Servonmaa. 2009. Correlation of foliar MT2b expression with Cd and Zn concentrations in hybrid aspen (Populus tremula x tremuloides) grown in contaminated soil. Environmental Pollution 157: 922–930
Heräjärvi, H. (2004a). Static bending properties of Finnish birch wood. Wood Science and Technology 37(2004):523-530.
Heräjärvi, H. (2004b). Variation of basic density and Brinell hardness within mature Finnish Betula pendula and B. pubescens stems. Wood and Fiber Science 36(2):216-227.
Heräjärvi, H. 2009. Effect of drying technology on aspen wood properties. Silva Fennica 43(3):433-445. Heräjärvi, H. and R. Junkkonen. 2006. Wood density and growth rate of European and hybrid aspen in
Southern Finland. Baltic Forestry 12(1): 2-8. Heräjärvi, H., R. Junkkonen., H. Koivunen., J. Metros, T. Piira, and E. Verkasalo. 2006. European and
hybrid aspen as the raw material of sawn timber and upgraded products. Metsä- ja hybridihaapa sahatavaran ja jatkojalosteiden raaka-aineena.(In Finnish). Working papers of the Finnish Forest Research Institute 31. 102 p.
Hynynen, J. 1999. Growth and yield of aspen and hybrid aspen. Haavan ja hybridihaavan kasvu ja tuotos (In Finnish). In: Hynynen, J. and A. Viherä-Aarnio. (edit.). Haapa ‒ monimuotoisuutta metsään ja metsätalouteen. Vantaan tutkimuskeskuksen tutkimuspäivä Tammisaaressa 12.11.1998. Metsäntutkimuslaitoksen tiedonantoja 725:25-37.
Hytönen, J. and P. Jylhä. 2005. Effects of competing vegetation and post-planting weed control on the mortality, growth and vole damages to Betula pendula planted on former agricultural land. Silva Fennica 39: 365-380.
Illstedt, B. and U. Gullberg. 1993. Genetic variation in a 26-year old hybrid aspen trial in southern Sweden. Scandinavian Journal of Forest Research 8:185-192.
Kenney, W.A., L. Sennerby-Forsse, and P. Layton.1990. A review of biomass quality research relevant to the use of poplar and willow for energy conversion. Biomass 21:163-188.
Malá, J., P. Máchova, H. Cvrčková, and T. Vaněk. 2007. Heavy metals uptake by the hybrid aspen and rowan-tree clones. Journal of Forest Science 53(11):491-497.
McCarthy, R. and L. Rytter. 2015. Productivity and thinning effects in hybrid aspen root sucker stands. Forest Ecology and Management 354: 215–223.
Nurmi J. 1993. Heating values of the above ground biomass of small-sized trees. Acta Forestalia Fennica 236: 1-30.
Olesen, P.O. 1971. The water displacement method. Forest Tree Improvement 3: 3–23. Ranua, J. 2002. Industrial use of aspen fibres. In: Pulkkinen, P., Tigerstedt, P.M.A. and Viirros, R. (edit.).
Aspen in papermaking. University of Helsinki, Department of Applied Biology, Publication No. 5: 1-4. Rytter, L.and L-G. Stener. 2003. Clonal variation in nutrient content of woody biomass of hybrid aspen
(Populus tremula L. x P. tremuloides Michx.). Silva Fennica 37(3): 313-324. Syörilä, P. 1992. Aspen as the raw material of veneer and plywood. Haapa viilun ja vanerin raaka-
aineena (In Finnish). Paperi ja Puu – Paper and Timber 74(8):621-627.

Natural resources and bioeconomy studies 80/2017
309
Tammisola, J., A. Varhimo, P. Velling, A. Viherä-Aarnio, V. Kauppinen, J. Sundquist, and S. Lapinjoki.(1995. Variation in the wood and pulping properties of European white birch. Paperi ja Puu – Paper and Timber 77(10):648-654.
Tsoumis, G. (1991). Science and technology of wood. Structure, properties and utilization. Van Norstand Reinhold, New York. 494 pp.
Tullus, A., M. Mandre, T. Soo, and H. Tullus, H. 2010. Relationships between cellulose, lignin and nutrients in stemwood of hybrid aspen in Estonian plantatations. Cellulose Chemistry and Technology 44(4-6): 101-109.
Tullus, A. L. Rytter, T. Tullus, M. Weih, and H. Tullus. 2012. Short-rotation forestry with hybrid aspen (Populus tremula L. x P. tremuloides Michx.) in Northern Europe. Scandinavian Journal of Forest Research 27: 10-29.
Viherä-Aarnio, A. 1999. Hybrid aspen ‒ a new crop tree after 40 years. Hybridihaapa – 40 vuoden takaa uudeksi viljelypuuksi (In Finnish). In: Hynynen, J. and A. Viherä-Aarnio. (edit.). Haapa ‒ monimuotoisuutta metsään ja metsätalouteen. Vantaan tutkimuskeskuksen tutkimuspäivä Tammisaaressa 12.11.1998. Metsäntutkimuslaitoksen tiedonantoja 725: 13–23.
Yu, Q., P. Pulkkinen, M. Rautio, M. Haapanen, R. Alen., L-G. Stener, E. Beuker, and P.M.A. Tigerstedt. 2001. Genetic control of wood physicochemical properties, growth and phenology in hybrid aspen clones. Canadian Journal of Forest Research 31(8): 1348-1356

Natural resources and bioeconomy studies 80/2017
310
Tree provenance affects the growth and bioenergy potential of juvenile silver birch
Antti Haapala1*, Sari Kontunen-Soppela2, Elina Oksanen2, Matti Rousi3, Blas Mola Yudego1
Abstract
The ever-growing need for renewable resources for energy production makes us look more closely at biomass reserves so far unused and considered insufficient in terms of energy content, availability or cost. In this study we present the first results of the calorific values and chemical composition of the branches of 12 micropropagated silver birch (Betula pendula) genotypes originating from 60°N to 67°N. The birches were planted at two different latitudes in Finland (62°N and 67°N) in a common garden experiment and harvested in juvenile stage during their fifth annual growth in Joensuu (62°N) in 2015 and during the sixth year in Kolari (67°N) in 2016. The results highlighted the calorific value ranges and their fair south-north gradient, while opposite trend was observed for the mass of branches upon harvest (green weight). The highest amount of extractives in branches was 15% w/w with methanol while water (13%) and acetone (10%) were also considered fairly efficient. Our preliminary results indicate that while the energy content and chemical composition vary by 12.5% along the latitudes of birch provenances, the most significant contribution to the available feedstock for bioenergy comes from branch quantity, being significantly higher in genotypes of southern latitudes grown in either of the common gardens. The indicated differences between the assessed genotypes based on preliminary description of data seem more profound in the trees grown in Joensuu (62°N)) than in Kolari (67°N)), possibly due to longer growing period and more substantial biomass yield in general able to differentiate between samples.
Introduction 1.Wood in its many forms, and most recently specifically as a secondary biomass available from industrial side streams or waste from its processing, is in the global context one of the most used energy sources. Woody biomass is a significant energy carrier and primary source for domestic energy in many parts of Africa and other developing countries, whereas energy production in industrialised nations in more diversified (Mola-Yudego et al. 2016). The discourse of circular economy and bioeconomy promote the active utilization of renewable resources and in forest industries this will translate to increased use of wood as a feedstock in industrial processes. It has also increased the interest in valorisation of side streams and residues currently considered as too expensive or low in refining value.
The efforts to minimize waste will promote not only the use of industrial side streams but also the harvest residues of forests. As the industrial conversion of these biomasses to higher added value materials and chemicals seems today costly, the use of thinnings, coppice or harvest residue from the forestry actions for bioenergy may increase. These residues are often subjected to controlled burning or are left in large piles, causing a negative environmental impact (Siqueira et al. 2010) and risks of pests and fire in warmer countries (Thakur et al. 2011). Forest residues also help in meeting
* Corresponding author: Tel.: +3585202849; E-mail: [email protected]
1School of Forest Sciences University of Eastern
Finland Joensuu, 80101, Finland
3Natural Resources Institute Finland
Vantaa research center Helsinki, 00790, Finland
2Department of Environmental and Biological Sciences
University of Eastern Finland
Joensuu, 80101, Finland

Natural resources and bioeconomy studies 80/2017
311
the EU-wide targets and policy objectives for the period between 2020 and 2030 to have at least a 27% share of renewable energy consumption (EU 2014). The recent European Parliament report demands some reconsideration for the acceptable feedstock for bioenergy and use of certain biofuels based on sustainability criteria but harvest residue remains on the shortlist of acceptable bioenergy sources (Eickhout 2017). Birch (Betula sp.) is one of possible candidates for profitable short-rotation energy biomass production (Jylhä et al. 2015, Jylhä & Bergström 2016) not yet significantly utilized as feedstock.
To achieve these expectations, it is necessary to determine whether these biomass streams comply with international quality standards and what the level and inherent variation of their energy content are. The calorific value of the wood, in general, is greatly influenced by the chemical composition of wood, mainly lignin and extractives (Nurmi 1992; Telmo and Lousada 2011, So and Eberhardt 2013). The calorimetric values are well known for most established feedstocks and it has been shown that the heating values are affected by such factors as species, tree part, component and size (Nurmi 2000). There is also some difference in the growth rate and composition of tree species between different regions (Montes et al. 2012), but this is not that well established for birch wood. In fact, the recently published papers on silver birch chemicals refer either to bark components (Karnaouri et al. 2016) or liquid extracts obtained by some form of industrial processing (e.g. Gabov et al. 2014). The biomass generation models for birch have been introduced previously by Repola (2009) but he does not consider the regional variation of wood quality or energy composition. For a deeper understanding of the differences in trees, more knowledge is required not only of the stemwood, but also of the branches and tree tops. Such analysis is best achieved from a pool of tree individuals well recorded for their genetic background to assure fair variation between specimens. Such experimental setup of the common garden trial providing the specimen for our analysis has been reported by Heimonen et al. (2015a, b).
The aim of this paper is to illustrate the ongoing work to assess the differences in the energy content and chemical composition of silver birch (Betula pendula) harvest residue, more specifically its branches without foliage. In this study we present the first results of the calorific values and chemical composition of the branches of 12 micropropagated silver birch genotypes originating from 60°N to 67°N. The preliminary results show the variation and latitudinal gradients in calorimetric energy and extractives content that reflect on the overall energy available from the harvest residue of silver birch with provenances and genetic variation ranging across Finland.
Materials and methods 2.
Silver birch provenances and the common garden experiment 2.1.Common garden experiments with similar setup was established in three locations: Tuusula, Natural Resources Institute Finland (hence forward Luke) (southern, 60° 21'N, 25° 00'E); Joensuu, UEF (central, 62°37'N, 29°49'E) and Kolari, Luke (northern, 67°20'N, 23°48'E) (Fig.1). The third common garden location in Tuusula is not considered here. Contrary to many previous experiments, the plant material has been clonally produced. The experimental setup provides a unique opportunity to study the performance of same genotypes in different environments for several years. Besides the length of growing season due to temperature, the common garden sites will also provide a steep gradient of change in photoperiod between the sites. The experimental setup is described in detail in Heimonen et al. (2015a, b).

Natural resources and bioeconomy studies 80/2017
312
Figure 1. Common garden sites (•), the provenances of birches (latitude°) and their position in different temperature sum regions (mean daily temperature >5°C = thermal growing season) in Finland. Modified from Heimonen et al. (2015a).
This paper refers to data acquired from 12 randomly selected silver birch (Betula pendula Roth) genotypes acquired from the central and northern gardens (2 genotypes from each location, 3-5 replicate stems from each) representing in total 105 individual trees that are a subset of specimen obtained from a larger common garden study of silver birch (table 1). The common garden setup represents a south-north cline from 60 to 67°N and include silver birch origins from 6 different sites; Loppi (60°N), Punkaharju (62°N), Vehmersalmi (63°N), Posio (65°N), Rovaniemi (66°N) and Kittilä (67°N) (Fig.1). Altogether 26 genotypes (five per provenance except for four from Loppi and 2 from Punkaharju) were used in the experiment, set up as a randomized block design (n=5), with two individuals of each genotype in each block. The micro-propagated trees of different provenances and clones were planted at 1.2 m distance between trees in the experimental sites during summer 2010. The experiment is described in more detail in Heimonen et al. (2015a and 2015b).
Birch survival rate (table 1) were measured for the stem height and green weight (i.e. fresh weight immediately after cutting the trees and separating branches from the stemwood) of branches on the site. A random subsample of the branches without leaves was collected and dried to be used later in calorimetric and chemical composition analyses.
Calorimetric analysis 2.2.Random specimen of branches from all trees were collected during mid-June 2015 (Joensuu) and mid- June 2016 (Kolari), oven dried in 50 °C for 1 week and grinded with a centrifugal mill (Retch ZM200, Germany) collecting the wood powder passing 1 mm sieve. The calorimetric value of acclimatized samples of grinded branches was analysed with a calorimeter (EN ISO 1716 Bomb Calorimeter, Fire Testing Technology Ltd, UK) according to ISO 1716:2010 Determination of the gross heat of combustion. The sample size in each analysis was 0.5 g and the reported values are always an average of 2-3 parallel analyses for the collection samples. Values for higher heating value (HHV) and lower heating value (LHV) were determined from the results. The calorimetric value or the higher heating value (HHV) was determined with a bomb calorimeter and the effective, or lower heating

Natural resources and bioeconomy studies 80/2017
313
value (LHV) derived from it. LHV indicates the energy available in free combustion of oven dry biomass and is defined as the calorimetric value minus the heat released by the condensation water created during combustion.
Analyses for chemical composition 2.3.The total extractives contained in the wood material of branches were determined by solid–liquid successive extraction with different solvents of increasing polarity, using acetone, methanol and distilled water in Soxhlet (2050 Soxtec Avanti, Foss Tecator SB; Sweden). Similar to calorimetric values, the branch biomass subjected to chemical analysis (total content of extractives) was started by grinding the specimen with a centrifugal mill (Retch ZM200, Germany) and collecting the wood powder passing 1 mm sieve. The sample size in each analysis was 1.0 g in 80 ml of solvent and the reported values are always an average of 1-2 parallel analyses for the collection samples. The extraction processes were 135 min followed by 30 minute rinsing stage, for water and acetone the extraction temperature was at 180 °C while for methanol 225 °C was used (internal method). The liquid extracts were collected, evaporated in an oven for 24 hours (105 °C), cooled and dried in desiccator and weighted after which the total amount of extracts (% w/w) was determined.
Results and discussion 3.
Biomass from silver birch 3.1.Birch survival was very good (80-100%) at both sites (Table 1). The biomass properties at the time show that the average stem height was greater in Joensuu than in Kolari. There were also variations in the green weight of branches along the provenances following a latitudinal pattern. The differences were larger in the case of the Joensuu-based trial, and less variation was observed in Kolari (Table 1, Figure 2). In general, the green weight of branches was higher for those provenances from southernmost latitudes, by a factor of 5 in the case of Joensuu. Also in Kolari, the two northernmost provenances (66°N and 67°N) had less green weight in comparison to the other provenances. The difference between sites and tree genotypes may be due to the longer growing season (Heimonen et al. 2017) and higher temperatures in the Joensuu site (Heimonen et al. 2015b), which allow the juvenile trees to better represent the inherent differences in their growth already in a shorter experiment over the sum of 5-6 years. The variation within the locations tends to be systematically smaller in northern genotypes.
An efficient selection of adequate provenances can be the basis for more efficient plantation systems, for instance oriented to the production of high amounts of biomass in more intensive management regimes than conventional birch forests. However the long term performance of the different provenances must be the subject of further investigation. Despite the latitude 67° and 65° specimen (genotypes K1, K8, P1, P7) other genotypes from lat. 66° to 60° showed increase in the stemwood biomass yield in Joensuu (Fig. 2) in comparison to Kolari, despite having a one year shorter growth. The same trend can be seen in the fresh weight of branches collected from trees in both gardens, the lat. 67° genotypes being the only group not showing an increase in branch biomass when collected from Joensuu site (Fig. 2).

Natural resources and bioeconomy studies 80/2017
314
Table 1. Sample provenance, latitude and survival rates of the host plants from Joensuu and Kolari common gardens. Clones were planted in 2010 and collected 2015. Sample number specified the genotype collected from a specific site for clonal reproduction.
Sample provenance and designation # Latitude (°) Survival rate (%)
Joensuu Survival rate (%)
Kolari Kolari 1 (K1) 67 100 100
Kolari 8 (K8) 67 100 100
Rovaniemi 3 (R3) 66 100 100
Rovaniemi 8 (R8) 66 100 100
Posio 1 (P1) 65 90 100
Posio 7 (P7) 65 100 100
Vehmersalmi 4 (V4) 63 100 100
Vehmersalmi 14 (V14) 63 100 80 Punkaharju 17 (Pu17) 62 90 90
Punkaharju 25 (Pu25) 62 100 -
Loppi 6 (L6) 60 100 -
Loppi 15 (L15) 60 100 -
Figure 2. Variation of green weight of branches (kg) and length (m) along locations following a latitudinal gradient. The box-and-whisker plot represents the median (black line) as well as the variation of the data (the box area represents the upper and lower 25% of the data and the whiskers indicate the highest and lowest values. The points (•) represent outliers in the data more than 1.5 times the length of the box from either end of the box.
Calorimetric values of branch biomass 3.2.The calorimetric analysis revealed latitudinal differences of opposite sign to those observed in the branch green mass, although the variation was moderate (Fig. 3). The differences in calorimetric values were, however, minor. The results show also that both the HHV and LHV value medians are consistently higher in Joensuu-based samples than the branches obtained from Kolari site. While the highest values in both sites were found in the northernmost genotypes from Kittilä provenance (67°N) (LHV 18.39 MJ/kg in Joensuu garden and 17.61 MJ/kg in Kolari), the difference is unlikely to contribute much in terms of energy efficiency in any industrial process.

Natural resources and bioeconomy studies 80/2017
315
Figure 3. Variation of Higher Heating Value (HHV) and Lower Heating Value (LHV) along locations following a latitudinal gradient. The boxplots are organized similar to Fig.2.
The total energy contents in branches reproduced the variations observed in branch fresh weight (Figure 4), as faster growth seems to translate in slightly lower energy densities while the low magnitude of differences is in good agreement with previous studies (Nurmi 1993 ). The higher heating values in provenances from the northern latitudes, however, did not seem to overcome the faster increment in branch weight in genotypes originating south from latitude 63° as these genotypes consistently present the higher overall energy content in branches. In addition, trees grown in the Joensuu site showed a significantly higher median values for the energy content available by combusting the more abundant volume of branches than what could be recovered in the Kolari site. The use of harvest residue from more southern genotypes and growth sites would clearly be more favorable in terms of energy yield simply due to higher mass of combustible biomass.

Natural resources and bioeconomy studies 80/2017
316
Figure 4. Variation of total energy content in branches (MJ) along locations following a latitudinal gradient. The boxplots are organized similar to Fig.2.
Chemical composition of branches 3.3.The energy content of wood depends on the chemical components present in wood (Kataki and Konwer 2001), while the chemical build-up of wood is controlled by genetic and environmental factors. Calorific value (heating value) of wood is determined by the proportions of its main elemental constituents (carbon, hydrogen and oxygen), with the share of C and H increasing it and the share of O decreasing it. More energy-rich compounds include resins, lipids and lignin, while cellulose and hemicellulose are less energy-rich (Tullus et al. 2014).
The silver birch branches have reportedly ca. 20% lignin content while content of extractive components in branches is around 7% for the woody part and 27% for the branch bark with moderate variation (Nurmi 1997). Knowledge about climate change effects on chemical composition of birch wood is quite limited and mainly restricted to elevated temperature, CO2 and O3 (Kostiainen et al. 2008). The extractives comprise of lipophilic compounds (terpenes, resin acids, steroids, fat, waxes, etc.), phenolics (stilbenes, tannins, lignans, flavonoids, etc.), carbohydrates and more exotic alkaloids and amino acids, among other chemical subgroups difficult to analyze in detail with simple methods. The different polar solvents can be selected for isolation of the carbon-rich extractives to obtain a fairly representative view on the carbon-rich components, assessing the content of lignin would require additional organic solvent or alkaline treatments.
The analysis of the extractive components content in birch branches from Joensuu site show, almost regardless of the extraction solvent, that the total concentration of extractives, and hence the total carbon content in samples was markedly higher in the most northern genotypes with a visible latitudinal gradient (Figure 5). The differences in water and acetone extracted components between the genotypes from 60 and 67°N more than double. The gradient of results is very similar to those obtained for calorimetric values (Figure 4) and it seems likely that the differences in the extractives content explain substantial part of the noted differences there. The tendency for birch to have elevated extractives content in more extreme than benign climate conditions have been reported by previous investigations (Nurmi 1993, So and Eberhardt 2013, Tullus et al 2014). Our setup offers interesting possibilities for future analyses on how the climate chance induced to northern genotypes via translocation may alter their growth and chemical and calorimetric content.
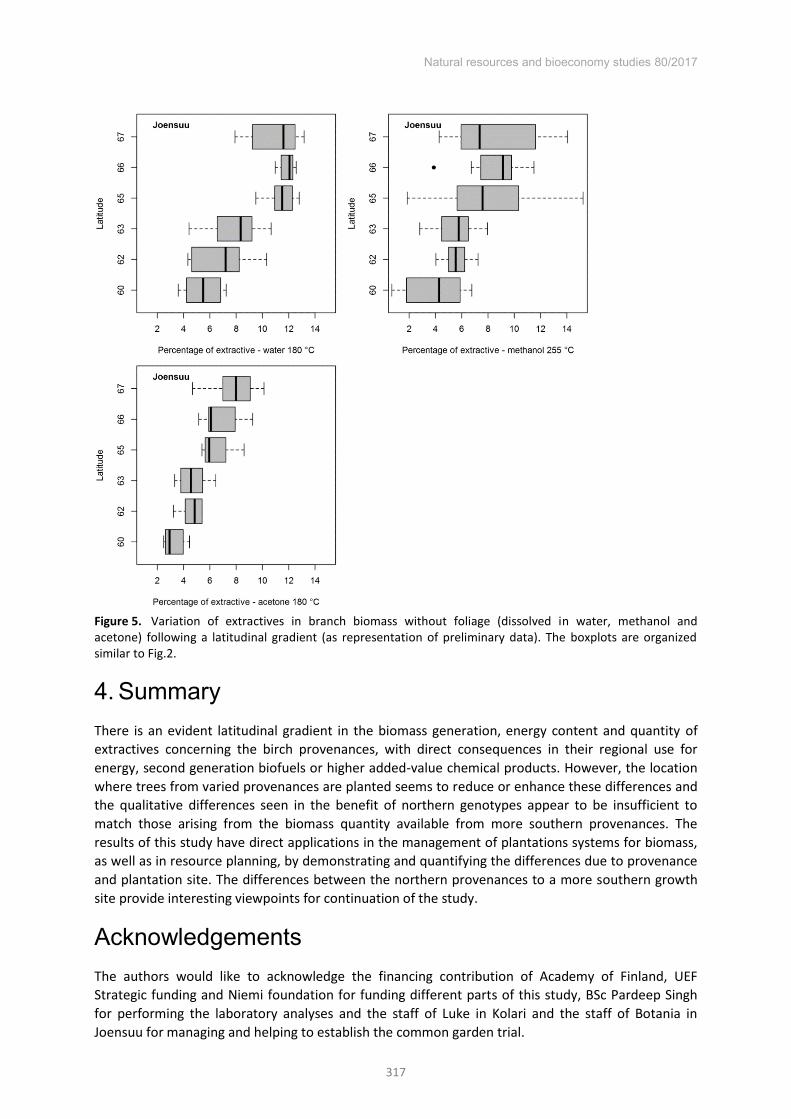
Natural resources and bioeconomy studies 80/2017
317
Figure 5. Variation of extractives in branch biomass without foliage (dissolved in water, methanol and acetone) following a latitudinal gradient (as representation of preliminary data). The boxplots are organized similar to Fig.2.
Summary 4.There is an evident latitudinal gradient in the biomass generation, energy content and quantity of extractives concerning the birch provenances, with direct consequences in their regional use for energy, second generation biofuels or higher added-value chemical products. However, the location where trees from varied provenances are planted seems to reduce or enhance these differences and the qualitative differences seen in the benefit of northern genotypes appear to be insufficient to match those arising from the biomass quantity available from more southern provenances. The results of this study have direct applications in the management of plantations systems for biomass, as well as in resource planning, by demonstrating and quantifying the differences due to provenance and plantation site. The differences between the northern provenances to a more southern growth site provide interesting viewpoints for continuation of the study.
Acknowledgements The authors would like to acknowledge the financing contribution of Academy of Finland, UEF Strategic funding and Niemi foundation for funding different parts of this study, BSc Pardeep Singh for performing the laboratory analyses and the staff of Luke in Kolari and the staff of Botania in Joensuu for managing and helping to establish the common garden trial.

Natural resources and bioeconomy studies 80/2017
318
References Determination of the gross heat of combustion (calorific value) (ISO 1716:2010). Eickhout B (2017) On the proposal for a directive of the European Parliament and of the Council on the
promotion of the use of energy from renewable sources. Draft Opinion of the Committee on the Environment, Public Health and Food Safety for the Committee on Industry, Research and Energy. 2016/0382(COD), 56 p.
EU (2014) A policy framework for climate and energy in the period from 2020 to 2030. Communication from the commission to the European Parliament, the Council, the European Economic and Social Committee and the Committee of the Regions. COM(2014) 15 final, 18 p.
Gabov, K., Gosselink, R. J. A., Smeds, A. I., & Fardim, P. (2014). Characterization of lignin extracted from birch wood by a modified hydrotropic process. J. Agric. Food Chem., 62(44), 10759-10767.
Heimonen K, Valtonen A, Kontunen-Soppela S, Keski-Saari S, Rousi M, Oksanen E, Roininen H. (2015a) Colonization of a host tree by herbivorous insects under a changing climate. Oikos 124:1013-1022
Heimonen K, Valtonen A, Kontunen-Soppela S, Keski-Saari S, Rousi M, Oksanen E, Roininen H. (2015b). Insect herbivore damage on latitudinally translocated silver birch (Betula pendula) – predicting the effects of climate change. Clim. Change 131: 245-257.
Heimonen K, Valtonen A, Kontunen-Soppela S, Keski-Saari S, Rousi M, Oksanen E, Roininen H. (2017) Susceptibility of silver birch (Betula pendula) to herbivorous insects is associated with the size and phenology of birch – implications for climate warming. Scand. J. For. Res. 32: 95-104
Jylhä P, Hytönen J, Ahtikoski A. (2015) Profitability of short-rotation biomass production on downy birch stands on cut-away peatlands in northern Finland. Biomass Bioenerg., 75, 272-281.
Jylhä P, Bergström D. (2016. Productivity of harvesting dense birch stands for bioenergy. Biomass Bioenerg., 88, 142-151.
Karnaouri A, Rova U, Christakopoulos P (2016) Effect of Different Pretreatment Methods on Birch Outer Bark: New Biorefinery Routes. Molecules, 21(4), 427-442.
Kataki R, Konwer D. (2001) Fuelwood characteristics of some indigenous woody species of north-east India. Biomass Bioenerg., 20, 17-23.
Kostiainen K, Kaakinen S, Warsta E, Kubiske ME, Nelson ND, Sõber J, Karnosky DF, Saranpää P, Vapaavuori E. (2008) Wood properties of trembling aspen and paper birch after 5 years of exposure to elevated concentrations of CO2 and O3. Tree Phys., 28: 805–813.
Mola-Yudego B, Díaz-Yáñez O, Haapala A (2016) Wood energy on a global scale. In: Mononen K & Pitkänen S. (eds.) Sustainable Fuelwood Management in West Africa. University of Eastern Finland, ISBN: 978-952-61-2286-1, p. 3-26.
Montes CS, Weber JC, Silva DA, Andrade C, Muñiz GIB, Garcia RA, Kalinganire A. (2012). Effects of region, soil, land use, and terrain type on fuelwood properties of five tree/shrub species in the Sahelian and Sudanian ecozones of Mali. Ann. For. Sci., 69(6), 747-756.
Moriana R, Vilaplana F, Ek M (2015) Forest residues as renewable resources for bio-based polymeric materials and bioenergy: chemical composition, structure and thermal properties. Cellulose, 22:3409-3423.
Ngangyo-Heya M, Foroughbahchk-Pournava R, Carrillo-Parra A, Rutiaga-Quiñones J G, Zelinski V, Pintor-Ibarra L F. (2016) Calorific Value and Chemical Composition of Five Semi-Arid Mexican Tree Species. Forests, 7, 58.
Nurmi J. (1992) Measurement and evaluation of wood fuel. Biomass Bioenerg., 2(1-6), 157-171. Nurmi J. (1993) Heating values of the above ground biomass of small-sized trees. Acta For. Fenn., 236. 30 p. Nurmi J (1997) Heating values of mature trees. Acta For. Fenn., 256:28p. Nurmi J. (2000) Characteristics and storage of whole-tree biomass. The Finnish Forest Research Institute,
Research Papers 758: 42 p. So, C, Eberhardt TL. (2013) A mid-IR multivariate analysis study on the gross calorific value in longleaf pine:
Impact on correlations with lignin and extractive contents. Wood Sci. Technol., 47(5), 993-1003. Telmo C, Lousada J. (2011) The explained variation by lignin and extractive contents on higher heating value
of wood. Biomass Bioenerg., 35(5), 1663-1667. Repola, J. (2008). Biomass equations for birch in finland. Silva Fenn., 42(4), 605-624. Siqueira G, Abdillahi H, Bras J, Dufresne A (2010) High reinforcing capability cellulose nanocrystals extracted
from Syngonanthus nitens (Capim Dourado). Cellulose 17(2):289–298. Thakur VK, Singha AS, Thakur MK (2011) Fabrication and physico-chemical properties of high-performance
pine needles/green polymer composites. Int. J. Polym. Mater. 62:226-230 Tullus A, Sellin A, Kupper P, Lutter R, Pärn L, Jasińska AK. Alber M, Kukk M, Tullus T, Tullus H, Lõhmus K,
Sõber A. (2014) Increasing air humidity - A climate trend predicted for northern latitudes - alters the chemical composition of stemwood in silver birch and hybrid aspen. Silva Fenn., 48(4).

Natural resources and bioeconomy studies 80/2017
319
Experimental and numerical analysis of poplar thermodegradation
Bo-Jhih Lin1, Edgar Silveira1, Baptiste Colin1*, Mounir Chaouch2, Anélie Pétrissans1, Patrick Rousset3,
Mathieu Pétrissans1
Abstract
Wood heat treatment (WHT) is an eco-friendly preservation process to improve material properties, such as dimensional stability and durability. This value-added technique had a huge development in the last decades and, concerning heating rate and treatment duration, presents similar operating conditions to slow pyrolysis. The treatment is conducted within an inert atmosphere (nitrogen or vacuum) with a temperature ranging between 180 °C and 240 °C and is characterized by a low heating rate in the order of 0.25 to 1 °C min
-1. Due to heat effect, wood
polymers undergo a thermodegradation characterized by a mass loss. This parameter characterizes treatment progress and is used as a quality control indicator. The present study aims to analyze the effect of treatment intensity (operating temperature for a given process duration) on thermodegradation of a hardwood species (Poplar, Populus nigra). Experiments were performed within a conduction oven under nitrogen on large scale boards (25 x 11 x 2.5 cm). Five temperatures were studied in a stablished range between 200-240 °C with a slow heating rate of 1 °C min
-1 and 10 h of treatment duration. A maximum mass loss of 21.02 wt% was observed at
the higher temperature (240 °C). The lower mass loss value 6.19 wt% was recorded for the experiment performed at 200 °C. Based on measured data, a numerical model for instantaneous mass loss prediction during thermal process has been developed. A two-step kinetic mechanism was adopted to simulate reaction rate of wood components degradation. The reaction rates from numerical results agree with observations reported in literature showing a more pronounced thermodegradation when treatment temperature increases. A comparison between experimental and numerical results allows the model’s accuracy evaluation.
Keywords: Numerical model, poplar, thermodegradation, wood heat treatment.
Introduction 1.Technology of wood heat treatment (WHT) started to develop rapidly, because of energy crisis and environmental policy in the early 1980s. Nowadays, WHT is a very well developed technique and industry in the world. WHT is an eco-friendly preservation process to improve material properties, such as dimensional stability and durability (Sandberg and Kutnar 2016).The process is conducted within an inert atmosphere (nitrogen or vacuum) with a temperature ranging between 180 °C and 240 °C and is characterized by a low heating rate in the order of 0.25 to 1 °C min-1 (Pétrissans et al., 2014).
In Europe, there are five main different processes that have been commercialized for WHT. They are PLATO, ThermoWood, Le Bois Perdure, Retification, and OHT, respectively (Sandberg and Kutnar
* Corresponding author: Tel.: +033372741838; E-mail: [email protected]
1Université de Lorraine, Inra, LERMaB, F88000
Epinal
3French Agriculture Research Centre for
International Development (CIRAD),
73 rue J. F. Breton, 34398 Montpellier, Cedex 5,
France
2Service de Recherche et d’Expertise en
Transformation des Produits Forestiers
25-5 rue Armand Sinclair, QC G5J 1K3, Amqui
Quebec, Canada

Natural resources and bioeconomy studies 80/2017
320
2016; Esteves and Pereira 2009). PLATO (Proving Lasting Advanced Timber Option) process has been developed in Netherlands in 1980s, and is now used in Plato company. The WHT is carried out with two major steps: hydrothermolysis step, and curing step. ThermoWood is the largest producer of heat treated wood, and probably the most successful in Europe. This process has been developed in Finland in 1990. Wood is heated by using steam vapour at a temperature of 185-215 °C. Considering Retification and Le Bois Perdure, both were developed in France. Le Bois Perdure process and reactor were set up by Company BCI-MBS in 1990. They use fresh wood directly, and treat it under steam atmosphere at high temperature. Retification process has been developed by the Ecole des Mines de Saint-Etienne in 1997. In this process, dried wood was put in a specific chamber heated slowly under nitrogen with less than 2 % of oxygen atmosphere. OHT was developed in Germany in 2000. This process was very different, because wood was put inside oil at high temperature in the range of 180-220 °C for heat treatment. This operation was performed in a closed process vessel. The main difference between these processes is the heating medium and the treatment conditions used during WHT. Table 1 summarizes the processing conditions from above commercial processes.
Table 1. Major wood heat treatment processes in Europe and operating conditions
Process Atmosphere Operating conditions Country PLATO Saturated steam/
heated air Temperature:
160-190 °C (hydrothermolysis); 170-190 °C (heat treatment)
Process duration: 4-5 h (hydrothermolysis); 14-16 h (heat treatment)
Netherlands
ThermoWood Steam Temperature: 130 (drying); 185-215 °C (heat treatment)
Process duration:30-70 h
Finland
Le Bois Perdure Steam Temperature: 200-300 °C Process duration: 12-36 h
France
Retification Nitrogen (with less 2% of oxygen)
Temperature: 160-240 °C Process duration: 8-24 h
France
OHT Vegetable oils Temperature:180-220 °C Process duration: 24-36 h
Germany
In laboratories, experiments of WHT were conducted by thermogravimetric analysis (TGA), Thermodesorption- GC-MS (TD-GC-MS), or fixed-bed reactors to investigate thermodegradation, chemical products and properties of wood product during or after WHT. Aydemir et al. (2011) used TGA to study the thermodegradation of hornbeam and fir during heat treatment at different temperatures. The changes of chemical constituents between raw sample and treated sample were also examined by Fourier transform infrared spectroscopy (FTIR). Candelier et al. (2011) identified the chemical products during heat treatment by TD-GC-MS. There were 5 different wood species (pine, beech, fir, poplar, and ash) treated under nitrogen between 180 and 230 °C for 15 min. Nguila Inari et al. (2009) treated pine and beech blocks under nitrogen at 240 °C by a conduction fixed bed reactor. The heat-treated sample was reacted by chemical immersion method to determine the chemical reactivity of wood after treatment. Brosse et al. (2010) conducted heat treatment of beech wood within a conduction oven. In this study, holocellulose, klason lignin and milled wood lignin (MWL) of beech wood were examined before and after treatment in order to investigate the chemical modifications of wood lignin during heat treatment.
According to the literature review, it has thus been observed that the thermodegradation of wood has a high dependence on the process parameters, such as drying stage, heating medium, and treatment intensity (temperature and duration). The present study aims to analyse the effects of treatment intensity (operating temperature for a given process duration) on thermodegradation of a hardwood species (Poplar, Populus nigra). The experiments were performed within a conduction

Natural resources and bioeconomy studies 80/2017
321
oven under nitrogen. Moreover, based on measured data, a numerical model for instantaneous mass loss prediction during thermal process has been developed. A two-step kinetic mechanism was adopted to simulate reaction rate of wood degradation.
Experimental and numerical method 2.
Material and experiment 2.1.The wood boards were cut from poplar (Populus nigra), and dimensions of the boards used for heat treatment were 2.5 x 11 x 25 cm3 (R, T, L). The boards were dried in an oven at 103 °C for 48 h before experiments. The experiments were carried out in the wood heat treatment system. The system involved three subsystems: a gas feeding subsystem, a heat treatment subsystem and a power and recording subsystem, as shown in Fig. 1. In the gas feeding subsystem, a N2 cylinder was used to provide carrier gas, and a mass flow meter controlled the N2 flow rate. Before launching the experiment, the system was purged by nitrogen (6.5 L min-1) for 4 min. In regard to the heat treatment subsystem, it was composed of a chamber, two heating plates, two thermocouples, and an electric balance. In the chamber, the wood sample was put between the two heating plates, and the thermocouples were used to examine the temperatures of wood surface and wood center. The balance measured continuously the weight of sample and was connected to the recording subsystem. Considering the power and recording subsystem, a computer controlled reaction temperature, and recorded temperature profile and weight of sample during heat treatment. In the present study, mass loss of sample and solid yield during wood heat treatment are expressed by Eq. (1) and Eq. (2)
(1)
(2)
Where m0 is the initial dry basis weight of sample before heat treatment and mi is the dry basis weight of sample during heat treatment process.
Figure 1. A schematic of the reaction system (A: N2 cylinder; B: mass flow meter; C: chamber; D: heating plate; E: wood sample; F: thermocouple; G: thermocouple; H: electric balance; I: computer).
100×m
m-m=(wt%) loss Mass
0
0i
loss Mass-100=(wt%) yield Solid
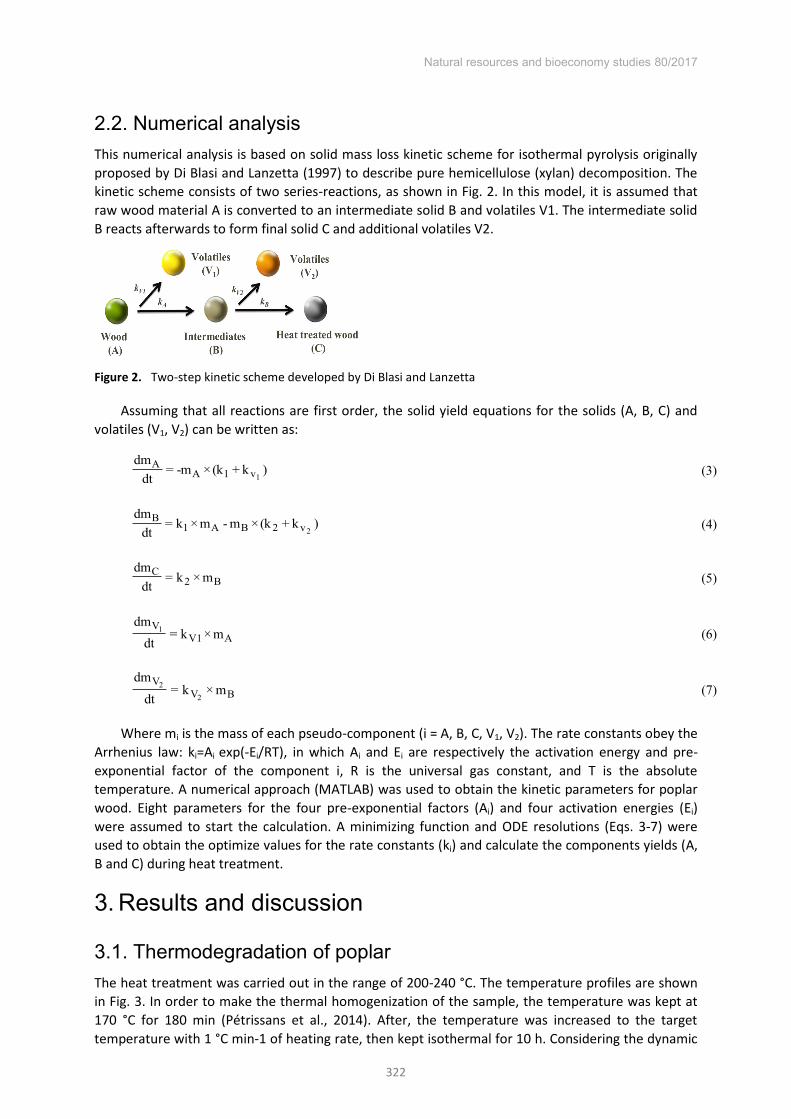
Natural resources and bioeconomy studies 80/2017
322
Numerical analysis 2.2.This numerical analysis is based on solid mass loss kinetic scheme for isothermal pyrolysis originally proposed by Di Blasi and Lanzetta (1997) to describe pure hemicellulose (xylan) decomposition. The kinetic scheme consists of two series-reactions, as shown in Fig. 2. In this model, it is assumed that raw wood material A is converted to an intermediate solid B and volatiles V1. The intermediate solid B reacts afterwards to form final solid C and additional volatiles V2.
Figure 2. Two-step kinetic scheme developed by Di Blasi and Lanzetta
Assuming that all reactions are first order, the solid yield equations for the solids (A, B, C) and volatiles (V1, V2) can be written as:
(3)
(4)
(5)
(6)
(7)
Where mi is the mass of each pseudo-component (i = A, B, C, V1, V2). The rate constants obey the Arrhenius law: ki=Ai exp(-Ei/RT), in which Ai and Ei are respectively the activation energy and pre-exponential factor of the component i, R is the universal gas constant, and T is the absolute temperature. A numerical approach (MATLAB) was used to obtain the kinetic parameters for poplar wood. Eight parameters for the four pre-exponential factors (Ai) and four activation energies (Ei) were assumed to start the calculation. A minimizing function and ODE resolutions (Eqs. 3-7) were used to obtain the optimize values for the rate constants (ki) and calculate the components yields (A, B and C) during heat treatment.
Results and discussion 3.
Thermodegradation of poplar 3.1.The heat treatment was carried out in the range of 200-240 °C. The temperature profiles are shown in Fig. 3. In order to make the thermal homogenization of the sample, the temperature was kept at 170 °C for 180 min (Pétrissans et al., 2014). After, the temperature was increased to the target temperature with 1 °C min-1 of heating rate, then kept isothermal for 10 h. Considering the dynamic
)k+(k×-m=dt
dm1v1A
A
)k+(k×m-m×k=dt
dm2v2BA1
B
B2C m×k=
dtdm
AV1V
m×k=dt
dm1
BVV
m×k=dt
dm2
2

Natural resources and bioeconomy studies 80/2017
323
weight losses, also shown in Fig. 3., it can be observed that there were very small percentages of mass loss (in the range of 0.18-0.38 wt%) before 170°C. It was attributed to vaporization of volatile extractives and of bound water absorbed on the wood fibers (Chaouch et al., 2010). The wood start to decompose at around 180 °C, and it is mainly due to thermodegradation of hemicelluloses from poplar. Some of studies have pointed out that thermodegradation of wood starts at the temperature of 180-200 °C (Martín-Lara et al., 2017; Chen et al., 2015; Sebio-Puñal et al., 2012; Zhou et al., 2016). During heat treatment of wood, hemicelluloses are depolymerized into oligomeric and monomeric units and further dehydrated to aldehydes under acidic conditions, leading to fewer hydroxyl groups and thus to a material less hygroscopic. However, due to stronger molecular structure of cellulose and lignin, the effects of heat treatment on depolymerisation of cellulose and lignin are rather limited. Some studies have reported that the crystallinity of cellulose slightly increases after treatment. Concerning the lignin, it is the least reactive component. However, the reactive lignin derivatives during heat treatment increase the degree of cross-linking in the cell wall of wood (Esteves et al., 2009; Ramage et al., 2017).
In order to realize the effects of temperature on WHT more clearly, Fig. 4 shows the mass losses after heat treatment at different temperatures. A strong influence of treatment temperature on thermodegradation of wood is observed. The mass loss increases with increasing temperature, and the percentages of mass loss at the end of the final step are 6.19, 10.03, 12.49, 15.57, and 21.02 wt%, for the treatments at 200, 210, 220, 230 and 240 °C respectively.
Figure 3. Temperature profiles and solid yield dynamics profiles during heat treatment
Figure 4. Mass losses after heat treatment under different temperatures
Time (min)
Tem
pera
ture
(o C)
Sol
idyi
eld
(wt%
)
0 100 200 300 400 500 600 700 800 9000
50
100
150
200
250
75
80
85
90
95
100
105
200 oC
240 oC
230 oC
220 oC
210 oC
Mas
slos
s(wt
%)
0
5
10
15
20
25
240 oC200 oC 210 oC 220 oC 230 oC

Natural resources and bioeconomy studies 80/2017
324
Prediction of mass loss and kinetic parameters 3.2.In this part, a two-step kinetic model is established and used to predict dynamic mass loss during wood treatment. The mass loss is predicted by a curve-fitting to fit to the experimental data (as shown in Fig 3). It is found that accurate fits between the simulated and experimental data are achieved in Fig. 5. The rate constants corresponding to the five temperatures from k1, kV1, k2, kV2 are sketched in Fig. 6. Furthermore, when ln (k) with respect to T-1 is plotted, the activation energies and pre exponential factors can be obtained from the regression lines. As a result, kinetic parameters are in a reasonable range compared with the kinetic parameters for the degradation of xylan reported in the literature (Di Blasi and Lanzetta 1997). The rate constants and activation energies are: k1=1.04 x 10⁷ s-1, E1=85.85 kJ mol-1; kV1=1.91 x 10¹² s-1, EV1= 144.13 kJ mol-1; k2=2.05 x 101 s-1, E2=36.06 kJ mol-1; kV2=7.00 x 10⁷ s-1, EV2=114.89 kJ mol-1. It is found that reaction rates are higher during degradation of the initial wood material (A) to form the intermediate (B & C), then those in the second step during further decomposition of the intermediate to produce the final solid (Bach et al., 2016).
Figure 5. Predicted (lines) and experimental (symbols) curves for heat treatment of poplar.
Figure 6. Arrhenius plot of k1, kv1, k2, kv2 for heat treatment of poplar.
Time (min)
Mas
slo
ss(w
t%)
0 100 200 300 400 500 600 70075
80
85
90
95
100
200 oC
240 oC
230 oC
220 oC
210 oC
1/T
lnK
0.00195 0.002 0.00205 0.0021 0.00215-15
-12.5
-10
-7.5
-5
-2.5
y=-13819x+18.064
y=-10326x+16.13
y=-17336x+28.279
y=-4336.8x+0.7181
k1
kV2
k2
kV1

Natural resources and bioeconomy studies 80/2017
325
Summary 4.The thermodegradation of poplar (Populus nigra L) is examined in this study. The maximum mass loss of 21.02 wt% is observed at 240 °C. Concerning to the minimum mass loss value 6.19 wt% is recorded for the experiment performed at 200 °C. Based on measured data, a numerical model for instantaneous mass loss prediction during thermal process has been developed. A two-step thermal kinetic model is developed, and the kinetic parameters (k1, kV1, k2, and kV2) are calculated based on this model. Overall, the thermodegradation distribution from the kinetic model fits the experiment results well. In order to establish a widely suitable model for industry, the model requires the determination of kinetic parameters for different wood species, treatment temperature, and heating rate. A more generalized way would be developed in our future work.
Acknowledgements The authors gratefully acknowledge for the financial support (program ANR-11-LABEX-0002-01, Lab of Excellence ARBRE).
References Aydemir D, Gunduz G, Altuntas E, Ertas M, Sahin HT, M. Alma M. 2011. Investigating changes in the
chemical constituents and dimensional stability of heat-treated hornbeam and Uludag fir wood. Bioresources, 6(2), pp. 1308-1321.
Bach QV, Chen WH, Chu YS, Skreiberg, Ø. 2016. Predictions of biochar yield and elemental composition during torrefaction of forest residues. Bioresource Technology, 215, pp. 239–246.
Brosse M, El Hage R, Chaouch M, Dumarcay S, Pétrissans M, Gérardin P. 2010. Investigation of the chemical modifications of beech wood lignin during heat treatment. Polymer Degradation and Stability 95, pp. 1721-1726.
Candelier K, Chaouch M, Dumarcay S, Pétrissans A, Pétrissans M, Gérardin P. Utilization of thermodesorption coupled to GC–MS to study stability of different wood species to thermodegradation. Journal of Analytical and Applied Pyrolysis, 92, pp. 376–383.
Chaouch M, Pétrissans M, Pétrissans A, Gérardin P. 2010. Use of wood elemental composition to predict heat treatment intensity and decay resistance of different softwood and hardwood species. Polymer Degradation and Stability, 95, pp. 2225-2259.
Chen WH, Peng J, Bi XT. 2015. A state-of-the-art review of biomass torrefaction, densification and applications. Renewable and Sustainable Energy Reviews, 44, pp. 847-866.
Di Blasi, C, Lanzetta, M. 1997. Intrinsic kinetics of isothermal xylan degradation in inert atmosphere. J. Anal. Appl. Pyrol,40–41, pp. 287–303.
Esteves BM, Pereira HM 2009. Wood modification by heat treatment: a review. Bioresources, 4(1), pp. 370-404.
Martín-Lara MA, Blázquez G, Zamora MC, Calero M. 2017. Kinetic modelling of torrefaction of olive tree pruning. Applied Thermal Engineering, 113, pp. 1410-1418.
Nguila Inari G, Pétrissans M, Gerardin P. 2007. Chemical reactivity of heat-treated wood. Wood Science and Technology, 41, pp.157-168.
Pétrissans A, Younsi R, Chaouch M, Gérardin P, Pétrissans M. 2014. Wood thermodegradation: experimental analysis and modeling of mass loss kinetics. Maderas. Ciencia y tecnología, 16(2), pp. 133-148.
Ramage MH, Burridge H, Busse-Wicher M, Fereday G, Reynolds T, U. Shah D, Wu G, Yu L, Fleming G, Densley-Tingley D, Allwood J, Dupree P, Linden PF, Scherman O. 2017. The wood from the trees: The use of timber in construction. Renewable and Sustainable Energy Reviews, 68, pp. 333–359.
Rapp AO. 2001. Review on heat treatments of wood. In: Proceedings of Special Seminar held in Antibes, France on 9 February 2001.
Sandberg D, Kutnar A. 2016. Thermally modified timber: recent developments in Europe and North America, Wood Fiber Sci. 48, pp. 28–39.
Sebio-Puñal T, Naya S, López-Beceiro J, Tarrío-Saavedra J, Artiaga R. 2012. Thermogravimetric analysis of wood, holocellulose, and lignin from five wood species. Journal of Thermal Analysis and Calorimetry, 109, pp. 1163-1167
Zhou, X, Li W, Mabon R, Broadbelt LJ. 2016. A critical review on hemicellulose pyrolysis. Energy Technology 2016, 4, pp. 1-29.

Natural resources and bioeconomy studies 80/2017
326
Poster Session

Natural resources and bioeconomy studies 80/2017
327
Utilizing hardwoods for sustainable furniture products Eva Haviarova*, Zuzana Toncikova
Purdue University Forest and Natural Resources
175 Marsteller Street, West Lafayette, IN 47907, USA
Abstract
Wood is the most environmentally sound material: renewable, recyclable, biodegradable, highly versatile, grown in relatively low effort, and emitting far less carbon than other materials. Therefore, global demand for solid wood, especially hardwoods, are increasing due to the increased population, standards of living, and demand for renewable materials with low environmental impact. Wood is having a special place in production or furniture, by itself or in combination with other materials. COMBO stools were designed for project “Integration of eco-design rules into the educational process for designers”. This design study shows the difference between environmental impacts of basic materials used in furniture production. The great challenge for designers is to understand how the environmental impact of product is affected by choices, such as product shape, material combination, as well as production technology. The quantitative product Life Cycle Analysis was conducted with the software SimaPro 8, Traci method. The methodology was based on the benchmarking of three almost identical stools, which were designed and manufactured with a combination of different materials and production technologies. The outputs of this project should help designers to integrate eco-design procedures into the process of their creative thinking, as well as calculate the environmental impact of basic materials used in the furniture industry. Outcome of this study could also reinforce the importance of wood as a good sustainable material choice for the furniture.
* Corresponding author: E-mail: [email protected]

Natural resources and bioeconomy studies 80/2017
328
Web-based database development for commercial and lesser-used hardwood timber species in Zambia
Phillimon Ng’andwe1*, Elisha Ncube1, Justine Ngoma1, Fabian Malambo1, Nchimunya Chaamwe2
Abstract
Zambia is a well forested country in Southern Africa with 60% of area under forest cover. However, the country is one of the top 10 greenhouse gas emitting countries in the World with deforestation rates of 276,021 hectares per annum. The over exploitation of preferred species has led to a decline in such species some of which no longer appear on the current top 10 abundant hardwood species in Zambia. The aim of this project is to make collections of Zambian wood and to develop a web-based electronic database as a national wood science research and technology repository. Samples were collected from two agro-ecological zones receiving 700 to 1000 mm of rainfall per annum. An initial collection included Baikiaea plurijuga Harms, Ficus sycomorus Bambara, Combretum hereroense Schinz, Pterocarpus angolensis DC, Diplorhynchus candylocarpan Mull.Arg, Pteleopsis anisoptera Welw, and Baphia massaiensis Taub. The timber species were identified by using their morphological features and indigenous knowledge. So far, gross - macroscopic and microscopic examination of samples was carried out on Baikiaea plurijuga Harms, Pterocarpus angolensis DC, and Pteleopsis anisoptera Welw. These examined hardwood species exhibit similar anatomical features characterized by diffused pores and indistinct to distinct growth rings. Information collected for each species will be uploaded on the web-based xylarium database under construction.
Introduction 1.Zambia is a well forested country in Southern Africa with 60% of land area under forest cover. This forest cover reduced from 66% in 2008 to 60% in 2016 arising from deforestation which was estimated in 2015 to be 276,021 hectares per annum (Shakacite et al. 2016). The increasing rate of deforestation is known to greatly affect the tree species relative abundance (Turner et al. 1997) as well as species diversity (Denslow 1987). The 2010-2015 national biophysical assessment results in Zambia showed that the top ten, in the list of industrial grade hardwoods with highest national relative abundance (RA), were lesser used (LU) and lesser known (LK) hardwoods (Shakacite et al. 2016). The top ten list included species used for charcoal production such as Julbernadia paniculata (Benth.) Troupin (rank 1 and RA of 7.3%), brachystegia boehmii Taub (rank 2 and RA of 6.5%), Brachystegia spiciformis Benth (rank 3 and RA of 5.2) and Diplorhynchus condylocarpon Mull.Arg (rank 4 and RA of 4.6%) (Shakacite et al. 2016). The often exploited durable commercial hardwoods such as Pterocarpus angolensis DC, ranked 9th and RA of 2.7%, while Baikiaea plurijuga Harms, Guibourtia coleosperma (Benth.) J. Léonard, and Afzelia quanzensis Welw. were not among the top ten relative abundance list (Shakacite et al. 2016). Earlier, the LU and LK hardwoods were recognized by Ng’andwe et al (2015) as a potential future raw material source for industrial hardwood processing that could sustain the growing demand. The apparent consumption of industrial
* Corresponding author: Tel.: +260977244672; E-mail: [email protected]
1Department of Biomaterial Science and Technology
Copperbelt University, P.O. Box 21692
Kitwe, 02, Zambia
2Department of Computer Science, Copperbelt
University, P.O. Box 21692 Kitwe, 02, Zambia, Computer science

Natural resources and bioeconomy studies 80/2017
329
hardwoods in Zambia increased over the years from 1.8 million m3 in 2010 to over 3 million m3 in 2016 (Ng’andwe et al. (2015). On the other hand, wood fuel production accounted for over 90% of hardwoods harvested from forests by households (Ratnasingam et al. 2014) which could otherwise be used for industrial processing. The major constraint to their industrial utilization has been attributed to lack of knowledge on the properties of LU and LK species that affect their end use (Ratnasingam and Ng’andwe, 2012).
The xylarium is intended as a display of different wood species of well-curated authenticated wood specimens, not only for industrial purposes but also for scientific research, education, conservation and other programs (Stern 1988, Beeckman 2008, Maniatis et al. 2011). It is also used in art as a wondrous wood collection, which explores cultural expressions of time and memory in the forest using, for example, growth rings (dendrochronology) as an index of seasons of long ago (Joelle 2013). Using wood samples from the xylarium, Maniatis et al (2011) demonstrated that wood collections (xylaria) can be used to determine the basic density (specific gravity) needed for aboveground biomass estimations and concluded that xylaria hold information that could be useful for ecologists, technologists and environmentalists in understanding of forest dynamics cost effectively. Research on wood properties and potential uses of commercial timber species in Zambia was carried out in the 1960’s during the colonial rule and continued after independence in 1970’s at
the Forest Products Research Centre in Kitwe (Storrs 1962). At independence Zambia had a well-stocked wood collection (xylarium) mainly for industrial purposes but currently the collections are dilapidated, lost or deteriorated (Ratnasingam and Ng'andwe 2012).
The lack of a catalogue of wood properties limit optimum utilization of LU and LK species in Zambia will continue to be a major constraint to their development as observed by Ratnasingam and Ng'andwe (2012). Shakacite et al. (2016) reported over 200 tree species in Zambia but knowledge of the technical properties was lacking. In many Universities, museums and research institutes around the world, such wood collections exist and information is available for users. The xylarium at Oxford University in United Kingdom (UK), under their innovative plant research herbaria contains about 24,000 wood blocks and 13,000 microscope slides (http://herbaria.plants.ox.ac.uk/bol/oxford). Another example is the Kew garden (UK) whose wood collections project was initiated in 1847 and anatomical characterization was started around 1930s (Cornish et al. 2014). According to Cornish et al (2014) the Kew garden has over 34,314 wood collections stored in their xylaria and that African sources contributed 17% hardwood collections, second to Asia tropical which contributed over 33% of the total collection in the Kew xylarium.
With the development of computer technology stored wood collections can be backed up with electronic web databases making the search for information on species name, properties and use much easier. Globally, there are a number of wood databases which vary in purpose and content. Some wood databases are in electronic format such as InsideWood, PROTA4U, the woodexplorer, while others are in a text book form (Oteng-Amoako 2006), or a combination of both (Loupe 2008 and Lemmens 2012). For example, the North Carolina State University developed a website (InsideWood) database using peer reviewed wood anatomy monographs (InsideWood 2004-ownwards) and is freely available to the global users. The plant resources of tropical Africa (PROTA) website hosts an interactive free wood database (PROTA4U.org) that provides international documentation on the useful plants of tropical Africa for extension, education, research. The wood explorer database also provides online encyclopedia on over 1600 commercial hardwood species (woodexplorer.com) while the Timber Research and Development Association (TRADA) hosts a timber database (www:trada.co.uk) and is recognized as a centre of excellence on the specification and use of timber and wood products in the UK and internationally.
Compared to other tropical countries or sub-tropical countries such as Ghana, Nigeria, Mozambique and others, Zambia does not have a xylarium for hardwood timber species. Yet information on wood anatomy and properties is a critical resource, not only for the timber industry, academics and researchers but also for providing forensic evidence on crime scenes (UNOCC 2016).

Natural resources and bioeconomy studies 80/2017
330
Lack of such knowledge my lead to fraudulent claims on species identity and purported suitable use by various users (Oteng-Amoako, 2006). On the market place the color of wood influences its price (Klumpers et al. 1993, Ishiguri, et al. 2013). In addition, convincing users of the potential uses of lesser-used/-known species will help relieve pressure on the traditionally valuable species thus giving them a chance to recover. The purpose of this project is to make collections of Zambian wood and to develop a web-based electronic database as a national wood science research and technology repository. In this paper we, therefore, report on the methods used in the collection and preliminary results obtained.
Figure 1. Study sites and agro-ecological zones in Sesheke (AEZ I), Namwala (AEZ I and IIa) and Kabompo (AEZ IIb) sites in Zambezi teak forest of Zambia. Zone IIa consists of a sub-region of the plateau including the main farming areas on the plateau of central, eastern, and southern provinces, whereas zone IIb comprises the Kalahari (Barotse) sand plateau and the Zambezi flood plains. Both zones receive the same amount of rainfall (800–1000mm/year) (Wamunyima, 2014 personal communication).
Method 2.
Field data collection 2.1.In order to collect primary data, the forest areas of interest were determined following their distribution across agro-ecological zones (AEZ) in Zambia. The sampled areas are also regions where wood harvesting is one of economic activities at both industrial and household level within the Zambezi teak forest (MTENR 2008). Thus, samples were taken from Namwala, Sesheke and Kabompo sites located in Southern, Western, and North-western provinces of Zambia, respectively. The average tree densities of valuable species in these sample areas were 21.1 m3/ha, 40.3 m3/ha and 80.5 m3/ha in Southern, Western and Northwestern provinces, respectively (MTENR 2008). While Sesheke is located in the drier ecological zone I (<700mm), Kabompo is found in zone IIb (800-1000mm) and the Namwala site stretches in both zones I and IIa (Figure 1). At the Sesheke site samples were taken from Masese forest reserve, at the Kabompo site we collected samples from Kabompo forest reserve and at the Namwala site from from Ila forest reserve. In addition to ecological distribution of the sampled sites, we also selected the sites based on the prior knowledge of the availability of species of interest and accessibility of the reserves.
A two stage sampling was carried out. In the first phase, a forest inventory was conducted in each sample area, in 60m x 60m quadrants, to determine the rank of species importance value index (IVI). The IVI was determined as the sum of Relative Density (RDe), Relative Frequency (RF) and Relative Dominance (RDo) (Curtis and McIntosh 1950). We ranked the species from 1 to10 (1 =
Rainfall distribution (mm)
I - <700mm
IIa - 800-1000mm
IIb - 800-1000mm
III - >1000mm
Sesheke
Namwala
Kabompo
I
III
IIa
III
IIb

Natural resources and bioeconomy studies 80/2017
331
highest IVI) and the first three important species were identified for the study (Curtis and McIntosh 1950). In the second stage, the identified species of interest with more than 5cm diameter at breast height were selected randomly from Kabompo, Namwala and Sesheke sites. At each site, the selected species of interest that met the two criteria were cut. Stem, branch and root wood sample categories were collected from felled trees including those accidently cut during the process of felling. The collected timber species for the xylarium from each sample area were designated as commercial (C), lesser-used (LU) and lesser-known (LK) based on MTENR (2008).
Laboratory analysis 2.2.The one-meter logs were cut using a through-and-through sawing method to obtain plain and quarter sawn boards, 28mm thick × 78mm wide, and then kiln dried to 12% moisture content. The kiln dried straight grained and defect free sawn timber were planed all round (PAR) to 25mm thickness (Radial Longitudinal Section (RLS), Tangential Longitudinal Section (TLS) × 76mm wide (RLS, TLS) × and cross-cut into 152mm long xylarium specimens. Some of the kiln dried timber strips, PAR to 10mm × 10mm cross-section were cross-cut into 10mm cubes bearing true Transverse (TS), radial and tangential surfaces (ASTM D5535-94 (2004).
Wood sample preparation for anatomy characterisation followed a method documented by Wheeler et al. (1989) and Ngoma et al (2017) while strength and physical properties were determined following the ASTM 5536-94 (2004) and Oteng-Amoako (2006). Microscope slides, each set consisting of three thin sections revealing transverse, radial and tangential surfaces were prepared from the 10mm wood cubes. The cubes were then softened by boiling in a solution of 1:3:1 (95% ethanol: 99% glycerin: distilled water) until a good section could be sliced. to 15-25m with a sliding microtome. The sections were then kept in ethanol to maintain their saturated state.
Permanent slides were then made by staining the sections with safranin and iodine (depending on the wood microscopic property of interest). We cleansed the stained slides with bleaching solution (made from Calcium hypochlorite), mounted with mounting media, and oven dried them at 50-60C for 24 hours. The collections included both sections of vegetative (leaf, stem, root and wood) as well as floral material. Wood material corresponding to each xylarium specimen was cut cleanly by a surgical blade for macroscopic examination by eye and ×10 hand held lenses. The features observed were used to identify each wood specimen using an appropriate dichotomous key in conjunction with descriptions and micrographs in literature to corroborate the identity. A data sheet for each species’ (i) vegetative tree identification features, (ii) gross physical features such as
colour, heartwood and sapwood (iii) macro-/microscopic anatomical features including growth rings, porosity, vessels, (iv) properties such as specific gravity, grain direction, texture and (v) end-use applications were compiled on Microsoft excel as monographs. The information compiled for each timber species will be entered in MS access for encoding into a standard database language - Structured Query Language (SQL) for relational database management systems.
Results and discussions 3.
Important value indicators 3.1.The species being reported in this paper include Baikiaea plurijuga harms, Combretum hereoense Schinz, Pterocarpus angolensis DC, Diplorhynchus candylocarpan (mull.arg), Pteleopsis anisoptera,Welw and Baphia massaiensis Taub, as part of the phase one work. The highest IVI of 149 was observed in B. plurijuga – a commercially valuable species, across the rainfall zones I and II suggesting that this species was dominant in the Zambezi teak forest regions located in parts of Sesheke Namwala (IVI of 139.4) and Kabompo (IVI of 48.4) districts. P. angolensis – another
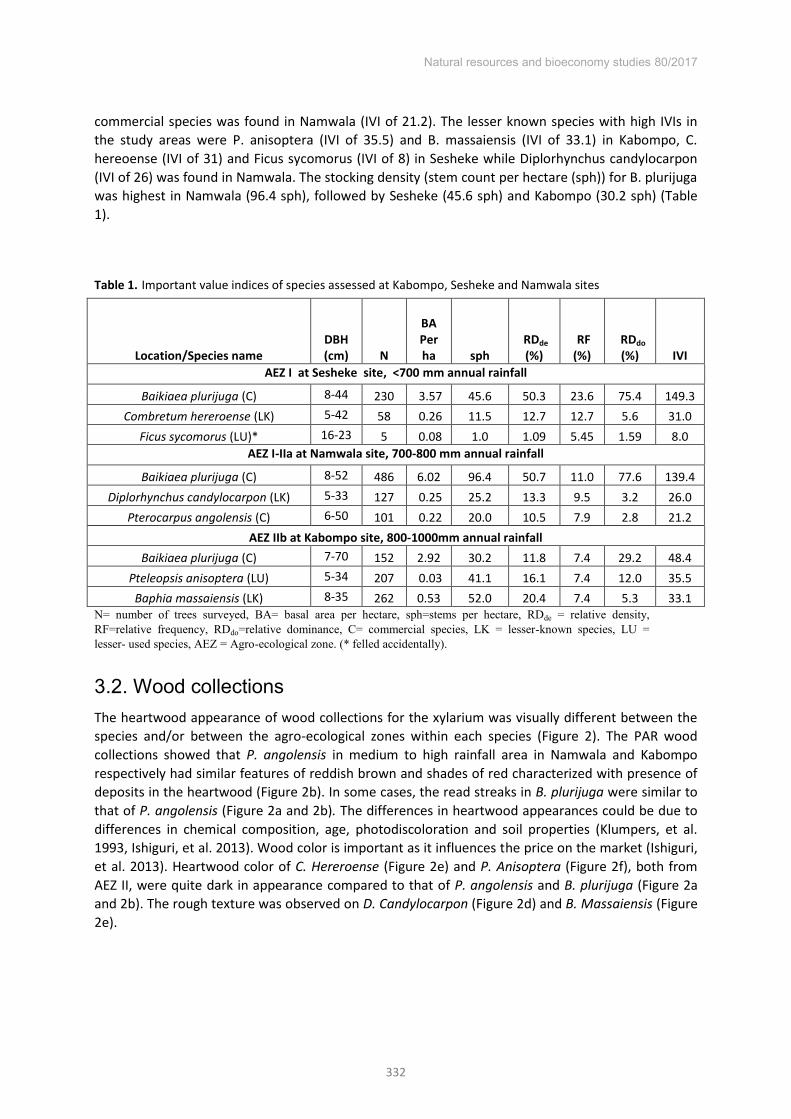
Natural resources and bioeconomy studies 80/2017
332
commercial species was found in Namwala (IVI of 21.2). The lesser known species with high IVIs in the study areas were P. anisoptera (IVI of 35.5) and B. massaiensis (IVI of 33.1) in Kabompo, C. hereoense (IVI of 31) and Ficus sycomorus (IVI of 8) in Sesheke while Diplorhynchus candylocarpon (IVI of 26) was found in Namwala. The stocking density (stem count per hectare (sph)) for B. plurijuga was highest in Namwala (96.4 sph), followed by Sesheke (45.6 sph) and Kabompo (30.2 sph) (Table 1).
Table 1. Important value indices of species assessed at Kabompo, Sesheke and Namwala sites
Location/Species name
DBH (cm)
N
BA Per ha sph
RDde (%)
RF (%)
RDdo (%) IVI
AEZ I at Sesheke site, <700 mm annual rainfall
Baikiaea plurijuga (C) 8-44 230 3.57 45.6 50.3 23.6 75.4 149.3 Combretum hereroense (LK) 5-42 58 0.26 11.5 12.7 12.7 5.6 31.0
Ficus sycomorus (LU)* 16-23 5 0.08 1.0 1.09 5.45 1.59 8.0 AEZ I-IIa at Namwala site, 700-800 mm annual rainfall
Baikiaea plurijuga (C) 8-52 486 6.02 96.4 50.7 11.0 77.6 139.4 Diplorhynchus candylocarpon (LK) 5-33 127 0.25 25.2 13.3 9.5 3.2 26.0
Pterocarpus angolensis (C) 6-50 101 0.22 20.0 10.5 7.9 2.8 21.2 AEZ IIb at Kabompo site, 800-1000mm annual rainfall
Baikiaea plurijuga (C) 7-70 152 2.92 30.2 11.8 7.4 29.2 48.4 Pteleopsis anisoptera (LU) 5-34 207 0.03 41.1 16.1 7.4 12.0 35.5 Baphia massaiensis (LK) 8-35 262 0.53 52.0 20.4 7.4 5.3 33.1
N= number of trees surveyed, BA= basal area per hectare, sph=stems per hectare, RDde = relative density, RF=relative frequency, RDdo=relative dominance, C= commercial species, LK = lesser-known species, LU = lesser- used species, AEZ = Agro-ecological zone. (* felled accidentally).
Wood collections 3.2.The heartwood appearance of wood collections for the xylarium was visually different between the species and/or between the agro-ecological zones within each species (Figure 2). The PAR wood collections showed that P. angolensis in medium to high rainfall area in Namwala and Kabompo respectively had similar features of reddish brown and shades of red characterized with presence of deposits in the heartwood (Figure 2b). In some cases, the read streaks in B. plurijuga were similar to that of P. angolensis (Figure 2a and 2b). The differences in heartwood appearances could be due to differences in chemical composition, age, photodiscoloration and soil properties (Klumpers, et al. 1993, Ishiguri, et al. 2013). Wood color is important as it influences the price on the market (Ishiguri, et al. 2013). Heartwood color of C. Hereroense (Figure 2e) and P. Anisoptera (Figure 2f), both from AEZ II, were quite dark in appearance compared to that of P. angolensis and B. plurijuga (Figure 2a and 2b). The rough texture was observed on D. Candylocarpon (Figure 2d) and B. Massaiensis (Figure 2e).
Natural resources and bioeconomy studies 80/2017
333
Figure 2. Variation of macroscopic features of evaluated hardwoods found in Zambia (a) B. plurijuga from AEZ I, dark brown (b) P. angolensis from AEZ II, shades of red and brown (c) D. candylocarpon from AEZ II, reddish (d) C. hereroense from AEZ II, shades of red, (e) B. Massaiensis from AEZ II, light dark, (f) P. anisoptera from AEZ, II, dark.
Anatomical features 3.3.Based on Wheeler (1989) anatomical features were prescribed in phase I of this project for only B.
plurijuga, P. angolensis and Pteleopsi anisoptera across the three agro ecological regions for growth rings (1= growth ring boundaries distinct, 2= growth ring boundaries indistinct or absent), vessel porosity (3= wood ring porous, 4= wood semi-ring porous, 5= wood diffuse porous), vessel arrangement (6= vessels in tangential bands, 7= vessels in diagonal and/or radial pattern, 8= vessels in dendritic pattern), vessel grouping (9=vessels exclusively solitary, 10=vessels in multiples of 4 or more common, 11= vessels in clusters common, 12 = solitary vessels). Geographical location (181 = Southern African region), habitat (189 = tree, 190= shrub, 191=Vine/liana), commercial importance (192), 193 for low basic specific gravity ≤ 0.40, 194 for medium basic specific gravity 0.40–0.75 and 195 for high, ≥ 0.75. The heartwood color was described as dark (196), brown or shades of brown (197) and heartwood color falling between 198-202 IAWA codes.
The anatomical features prescribed so far showed that in B. plurijuga, growth rings in all the regions studied varied from distinct (1), but varying greatly in specimens (1v), to indistinct (2) and also within specimen variations (2v), as seen in transverse section (ts). B. plurijuga is a diffuse porous hardwood (5) with vessels grouped in clusters (11), while in some specimens pores were exclusively solitary (12). Wood of B. plurijuga is of commercial importance (192) with basic specific gravity high, ≥ 0.75 (195). The heartwood color is quite dark than sapwood (196), with shades of brown (197) and characterized with dark streaks (201) (Figure 3a).
Anatomical features of P. angolensis are also characterized by growth ring boundaries which are typically distinct (1) to indistinct or absent. Wood is diffuse porous (5) and vessels are exclusively solitary (9). Wood is of commercial importance (192) with medium basic specific gravity of 0.40-0.75 (194). The heartwood color is brown or shades of brown (197) and characterized with reddish streaks (201) (Figure 3b)
The growth ring boundary of the lesser known P. anisoptera is characterized by growth ring boundaries which vary from distinct (1) to indistinct or absent. Wood is diffuse porous (5) and vessels are exclusively solitary (9). Wood of P.anisoptera is not commercially important. Basic specific gravity high is ≥ 0.75 (195) and the heartwood color is very dark and not prescribed in the IAWA hardwood
codes (Figure 3c). The growth rings of all the hardwood evaluated macroscopically and microscopically (x 10
magnification) were variable (distinct to indistinct) within and across the agro-ecological zones. All the three species were diffused porous hardwoods with basic specific gravity over 0.6. Other features in tangential longitudinal section (tls) and radial longitudinal section (rls) also support what has been observed in the transverse sections (ts).

Natural resources and bioeconomy studies 80/2017
334
Figure 3. Variation of anatomical features of hardwood in transverse (ts), tangential longitudinal (tls) and radial longitudinal (rls) sections from agro-ecological zones I and II in Zambia. Coded features in ts include: 1v 2v 5 11 181 18 192 195 196 197 201, Baikiaea plurijuga, x10 - Figure 2a. Coded features in ts include: 1v 2v 5 12 181 189 194 196 197 201, Pterocarpus angolensis, x10 - Figure 2 and similarly 1v 2v 5 181, 189 195 202, Pteleopsi anisoptera, x10 – Figure 2c.
Conclusion 4.Based on the important value indicators, seven hardwood species have been collected, identified and samples stored in the xylarium. The macro/micro evaluations of B. plurijuga, P. angolensis and P.
anisoptera have been carried out and preliminary monographs produced for the web wood collection database. The project has been mainstreamed as an on-going academic and research activity. The web-based electronic database of indigenous LU and LK species of Zambia, under construction, is envisaged to provide a critical link to the xylaria facilitating the identification and description of Zambian timbers. This project is expected to ultimately improve knowledge and capacity to sustainably manage hardwood timbers through improved accessibility of detailed information on timber species and suitable end-uses. The project will also contribute towards the country’s attainment of its international obligation on the conservation of biological diversity.
Aknowledgements We would like to thank, field persons and laboratory technicians who participated in the Collection of samples and processing. Thanks are also due to the Copperbelt University who provided funds for this project and the ISCHP2017 Hardwood Conference organizers and reviewers for guidance.
References ASTM D 5536 – 94 2004. "Standard Practice for Sampling Forest Trees for Determination of Clear Wood
Properties". West Conshohocken, PA: ASTM International. Azanzi, P., L. Putzel, D. Gumbo and M. Mupeta. 2014. Rural livelihoods and the Chinese timber trade in
Zambia's Western Province. International Forestry Review, 16, 447. Beeckman, H. 2008. A xylarium for the sustainable management of biodiversity: the wood collection of
the royal museum for central Africa, Tervuren, Belgium. Le bulletin de l’APAD no. 26, Gestion des Ressources Naturelles. Participations et médiations:Online:Google Scholar: [http://apad.revues.org/3613 accessed 4 July 2017]

Natural resources and bioeconomy studies 80/2017
335
Cottam, G. and J.T. Curtis. 1956 The Use of Distance Measures in Phytosociological Sampling. Ecology, 37.
Cornish, C., P. E. Gasson and M. Nesbitt. 2014. The wood collection (xylarium) of the Royal Botanic Gardens, Kew. IAWA Journal 35: 85–104.
Curtis, J. T. and R. P. McIntosh. 1950. The interrrelations of certain analyttical and synthentic phtosociological characters' Ecology, Vol. 31, 434-455.
Denslow, J.S. 1987 Tropical rain forest gaps and tree species diversity. Annual review of ecology and systematics. Vol. 18 (1987) 431:-451
GRZ 2010. UN Collabnorative Programm on Reducing Emmissions From Deforestation and Forest Degradation in developing countries National Joint Programme Document - Zambia Quick Start Initiative. In: MTENR (ed.). Lusaka, Zambia.
InsideWood 2004-ownwards. Published on the Internet. http://insidewood.lib.ncsu.edu/search [accessed 14 March 2017].
Ishiguri,F. S. Maruyama, K. Takahashi, Z. Abe, S. Yokota, M. Andoh and N. Yoshizaw. (2003) Extractives relating to heartwood color changes in sugi (Cryptomeria japonica) by a combination of smoke-heating and UV radiation exposure J Wood Sci (2003) 49: 135. doi:10.1007/s100860300021
Joel, N . 2013. Year of tilting’: Gleaning the Leaning Xylarium. Dandelion: postgraduate arts journal and research network Natalie Joelle Vol. 4, No. 2 (Winter 2013).
Klumpers, J. Janina, M. Beckerb and G. Lévy. 1993. The influences of age, extractive content and soil water on wood color in oak: the possible genetic determination of wood color Ann. For. Sci. 50 (1993) 403s-409s DOI: 10.1051/forest:19930746
MTENR 2008. Ministry of Tourism, Environment and Natural Resources Integrated Land Use Assessment Report 2005-2008, Forestry Department. Lusaka, Zambia.
Lemmens, R.H.M.J., D. Louppe and A.A Oteng-Amoako (Editors). 2012. Plant Resources of Tropical Africa 7(2). Timbers 2. PROTA Foundation, Backhuys publishers, Wageningen, Nertherlands, 804p
Louppe, D., A. A. Oteng-Amoako and M. Brink (Editors), 2008. Plant Resources of Tropical Africa 7(1). Timbers 1. PROTA Foundation, Backhuys publishers, Wageningen, Nertherlands, 704p.
Maniatis, D, L. Saint André, M. Temmerman, Y. Malhi, and H. Beeckman. 2011. The potential of using xylarium wood samples for wood density calculations: a comparison of approaches for volume measurement. Italian Society of Silviculture and Forest Ecology doi: 10.3832/ifor0575-004. vol. 4, pp. 150-159
Mwitwa, J. and A. Makano. 2012. Charcoal demand, production and supply in the Eastern and Lusaka Provinces. Lusaka, Zambia. Mission Press, Ndola (unpublished).
Ng’andwe, P. and E. Ncube 2011. Modelling carbon dioxide emission reduction through the use of improved cook stoves; a case for pulumusa, portable clay and fixed mud stoves in Zambia, UNZA Journal of Science and technology (2011) Vol. 15(2): 5-17.
Ng’andwe, P., H. Beeckman and P.E. Gason. 2012. Wood anatomy note of Microdesmis puberula. PANDACEAE, In: InsideWood database maintained by the North Carolina State University (NCSU), USA. http://insidewood.lib.ncsu.edu/description.9.
Ng’andwe, P., J. Mwitwa and A. Muimba-Kankolongo. 2015. Forest policy, economics and markets in Zambia, United Kingdom, Elsevier, Academic Press.
Oteng-Amoako, A. A. 2006. 100 Tropical African timber trees from Ghana- tree description and wood identification with notes on distribution, ecology, silviculture, ethnobotany and wood uses, Ghana, Graphic packaging.
Ratnasingam, J and P. Ng'andwe. 2012. Forest industries opportunity study - synthesis report submitted to the Forestry Department integrated land use assessment II and the Food and Agriculture Organisation (FAO) of the United Nations (unpublished).
Shakacite, O., D. Chungu, P. Ng’andwe, B. Chendauka, A Siampale, R. Tavani, W. Roberts and L. Vesa. 2016. Integrated Land Use Assessment Phase II – Report for Zambia. The Food and Agriculture Organization of the United Nations and the Forestry Department, Ministry of Lands and Natural Resources, Lusaka, Zambia. Lusaka, Zambia (unpublished).
Storrs, A. E. G. 1982. More about trees: A sequel to “Know your trees", Ndola, Forest Department, Zambia.
Stern WL (1988). Index xylariorum. Institutional wood collections of the World 3. IAWA Bulletin 9: 203-252. :Google Scholar:
Turner, I., Y. K. Wong, P. T. Chew and A. Ibrahim. 1997. Tree species richness in primary and old secondary tropical forest in Singapore. Biodiversity and conservation 6, 537-543.
UNODC 2016. United Nations Office on Drugs and Crime, Best Practice Guide for Forensic Timber Identification. Laboratory and Scientific Section and Global Programme for Combating Wildlife and Forest Crime, Vienna.

Natural resources and bioeconomy studies 80/2017
336
Vinya, R., S. Syampungani, E.C. Kasumu, C. Monde and R. Kasubika. 2012. Preliminary Study on the Drivers of Deforestation and Potential for REDD+ in Zambia. A consultancy report prepared for Forestry Department and FAO under the national UN-REDD+ Programme Ministry of lands & Natural Resources. Lusaka, Zambia.
Wheeler, E. A., P. Baas and P.E. Gasson. 1989. IAWA list of microscopic features fo rhardwood identification with an appendix on non-anatomical information. IAWA, Bull. n.s. 10, 219–332.
Xylarium (2017) Oxford University herbaria (1985-2017) http://herbaria.plants.ox.ac.uk/bol/oxford/Xylarium [accessed 4 July 2017].

Natural resources and bioeconomy studies 80/2017
337
Properties of the wood of the Mediterranean Castanea sativa affected by the “roig” coloration:
Preliminary results Eduard Correal-Mòdol1*, Brigitte Mies2,
Carmen Iglesias-Rodríguez3
Abstract
The sweet chestnut (Castanea sativa Mill.) is a common hardwood in the mountains of the Mediterranean north coast of the Iberian Peninsula. However, in these places the growing conditions are warmer and drier than in most places of the natural distribution of the species. Quite often, apparently healthy trees show a reddish coloration in their heartwood, while the sapwood does not have aesthetic variations. This feature is known among foresters as a type of wood discoloration called "roig", meaning "Red" in Catalan. Unfortunately, this is only detected once the trees are cut because they do not show significant decrease in growth or visible symptoms in the leaves, bark or trunk appearance. This phenomenon represents a significant loss of product yield and economic benefit because sawmills do not accept this raw material to produce lumber. In this way, logs with “roig” are automatically rejected and only used as firewood or wood chips. Until now the cause of the coloration was unknown, and it was unclear whether there is an agent or agents that cause it. This work brings together our early research work carried out to study the causes of this color change. The wood was analyzed by histological and chemical techniques that provided an overview of the differences between the normal wood and the wood affected by the roig. Preliminary, the coloration seems to be caused by metabolic wastes and does not cause any significant changes in most properties that we studied on chestnut wood.
Introduction 1.Sweet chestnut (Castanea sativa) is a thermophilic hardwood species native from Anatolia and the Tyrrhenian in the eastern Mediterranean region. The species expanded its original distribution during the end of the glacial era, helped by the human management. The species was cultivated for obtaining chestnuts and using its timber mostly because of its very durable wood. As a consequence, the species is quite common in the most humid mountains of the Mediterranean coast of the Iberian Peninsula.
This hardwood can be found in several mountains of the Mediterranean coast of the Iberian Peninsula. In this region, "El Montseny" and "Les Guilleries" are the mountains with the best growth and the biggest trees with diameters larger than 20 cm at least. In contrast, the species have small annual growth in the majority of the other forests because of the global warming and the lack of forest management along the XXth century. As a consequence, the species suffers two important pathologies in Catalonia: the sweet chestnut blight, caused by the fungus Cryphonectria parasitica, and the red stain (roig). The causes and effects of the chestnut blight are already well known and
* Corresponding author: Tel.: +34973481752; E-mail: [email protected]
1Catalan Institute of Wood Forest Sciences
Centre of Catalonia Solsona
Catalonia, 25280, Spain
1Catalan Institute of Wood Forest Sciences
Centre of Catalonia Solsona
Catalonia, 25280, Spain
3Department of Agricultural and Forest Engineering
University of Lleida Lleida, Catalonia, 25198,
Spain
2Laboratory of Wood Biology
Salzburg University of Applied Sciences
Kuchl, Salzburg, 5431, Austria

Natural resources and bioeconomy studies 80/2017
338
have been described extensively since many years ago (Colinas & Uscuplic 1999). However, the red stain is a far more complex pathology and little information is available (Yurkewich 2017). In any case, the incidence on the properties of wood has not been described yet.
Sweet chestnut timber can be used for many wood products. The high natural durability of the heartwood and the small amount of sapwood makes this species favourable for making poles or pilings. In fact, nowadays this is the most common use together with carpentry, mostly windows and furniture. Historically the structural use has also played a starring role. Veneers and handles for tools are secondary products in terms of volume. Wine barrels are barely produced even though at early XXth century they were a very important product for the local wood industry. Regarding tannins, so appreciated for producing wine, there existed a whole industry related to this chemical compound mainly used for tanning leather. Bioenergy is obviously an alternative, but sweet chestnut is considered a fuel of low quality.
Related to the use of structural timber with rectangular cross section the approval of the EU Regulation No 305/2011 and the standard EN 14081 made the CE marking compulsory for this product when being used in construction. For this reason, Spain developed the standard UNE 56544:2013. At that point, it was considered important to study the incidence of the roig and its effects on the strength of timber to see if its presence was acceptable or not. The reason was the need not to reduce the sawing yield of the species because of these characteristics. This study was done in the PhD dissertation of the author (Correal-Mòdol 2013).
This paper studies the physiology and the chemical composition of the sweet chestnut wood affected and non-affected by the stain called “roig” and makes a comparison of their properties. The aim is to determine whether the stained wood is good enough for making high quality wood products or on the other hand can only be used for biofuel.
Materials and methods 2.
Provenance of the samples 2.1.The woods samples were selected from five forests located in the natural areas of el Montseny, Gulleries-Savassona and Montnegre-Corredor, all of them located in the province of Barcelona.
Table 1. Provenance of the wood samples from the five forests of sweet chestnut.
Can Planes Can Prat La Rocassa El Vilar de Sant Andreu
Can Preses
Municipality Fogars de Montclús
Gualba Espinelves Vilanova de Sau
Sant Iscle de Vallalta
Natural area Montseny Montseny Guilleries Guilleries Montnegre Altitude 900 m 865 m 907 m 950 m 640 m Average age 51 years 23 years 26 years 40 years 18 years Average diameter
401 mm 223 mm 217 mm 229 mm 120 mm
Trees 100 100 40 11 55 Sample description
Healthy wood from branches Decayed trees
Healthy wood from the stem.
Healthy wood from the stem
Wood from the stem thoroughly stained
Trunks with healthy wood. Young trees with cancers

Natural resources and bioeconomy studies 80/2017
339
Analytical methods 2.2.A battery of different analytical methods was carried out to determine the differences between stained wood and normal wood. In addition, a microscopic analysis was done using several staining techniques. This analytical strategy was designed because wood is chemically heterogeneous and there is not any testing method reported to achieve a comprehensive description of the material with “Roig”.
Determination of ash content: Both the normal and the stained wood were burned following the method described on the standard TAPPI T 211 om-07 “Ash in wood, pulp, paper and
paperboard: combustion at 525°C”. Analysis of elemental composition of ashes: The analysis of the elemental composition of the
ashes was done on an ICP-OES over a sample of ashes digested with fluorhydric acid on a platinum crucible. The elements checked were: calcium, copper, iron, lead, magnesium, manganese, phosphorus, potassium, silicon, sodium and zinc.
Determination of calorific value: The determination of the calorific value also implies determining the moisture content. This was done according to the standard EN 14774-3:2010 “Solid
biofuels. Determination of moisture content. Oven dry method. Part 3: Moisture in general analysis sample”. The calorific value was determined by using an adiabatic calorimetric pump according to
the standard EN 14918:2011 “Solid biofuels. Determination of calorific value”. pH and buffer capacity: both properties were determined with the methods described at the
standards TAPPI T 252 om-07 “pH and electrical conductivity of hot water extracts of pulp, paper,
and paperboard” and UNE 57032:1991 “Pulps, paper and board. Determination of pH of aqueous
extracts”. The buffer capacity was checked by using 0.01N Sulfuric acid (H2SO4) and 0.01N Sodium hydroxide (NaOH).
Extraction of low molecular weight carbohydrates: The samples were prepared according to the TAPPI T 257 cm-02 “Sampling and preparing wood for analysis” and analysed with the procedure described at TAPPI T 212 om-02 “One percent sodium hydroxide solubility of wood and pulp”.
Determination of the acid-insoluble lignin: Acid hydrolysis was performed with sulfuric acid to extract the lignin according to the method described at TAPPI T 222 om-02 “Acid-insoluble lignin in wood and pulp”.
Determination of soluble non-volatile extractives: Wood has a great variety of non-volatile compounds and to extract them two solvents were used following the method described at the standard TAPPI T 204 cm-97 “Solvent extractives of wood and pulp”. Dichloromethane (CH2Cl2) and toluene (Methylbenzene) were used to extract waxes, fats, resins, sterols from the cellular walls, carbohydrates and salts non-soluble in water. Benzene was discarded because of its high toxicity.
Extraction of tannins and soluble solids in water: The tannins content was determined following the “Filter method” developed by AIICA (Asociación de Investigación de las Industrias del Curtido y
Anexas - Research Association of the Tanning and Auxiliary Industries) (Adzet 1990). This procedure consists on boiling at 136 ºC along two hours wood chips with water and sodium metabisulfite to force the tannins to combine with collagen. Therefore, this method can determine the total solid residue, the tannin content and the substances non-soluble in water by difference of weight.
Microscopic analysis: The light microscopy allows to analyse the state of the tissues and to detect the possible histological alterations of the stained wood. Nevertheless, wood samples have to be stained with dyes to make visible the different cells, tissues and compounds of wood. For this reason, the wood samples were stained using five different dyes.
Unstained: natural colours. Compounds, cells and tissues can hardly be distinguished. ACN: Astra blue, chrysoidin and new fuchsin. Samples are dehydrated with isopropanol. The
lignin is dyed red, the cellulose remains undyed and the cell nuclei can be dyed red or blue. The overall appearance of the tissues is garnet.

Natural resources and bioeconomy studies 80/2017
340
FCA: Staining based on New fuchsin, chrysoidin and alcian green. This method stains the cell walls in light pink and the cell content in blue. The overall aspect is between pink and blue.
Kallichrom: Preparation of auramine and brillant cresyl violet. The cell nucleus turns dark blue, the xylem and the fibers are stained of green and the cellulose gets red or pink.
Roeser: This dye is composed by 1% safranin, fuchsin and Astra blue. The samples get stained to purple and pink. The fibres turn pink and the radius dark purple.
Toluidine blue: Dye based on tolonium chloride. Aqueous solution between 0.1 to 1% toluidine blue, a dye derived from aminotoluol. The cellulose becomes purple and the lignified walls are stained blue or blue-green. It is widely used in histology to stain cell nuclei.
Microscopic Images were done with the Zeiss Axio L.A1 light microscope, the digital camera Axio Cam ERc 5s and the Zeiss Imaging-Software Axio Vision REl.4.8 with the following objectives for the different amplifications:
Zeiss 5 x-0,12 for the 50 times amplification Zeiss A-Plan 10x-0,25 for the 100 times amplification Zeiss A-Plan 40x-0,65 for the 400 times amplification
Results 3.Ash content and elemental composition: The average content of ashes of the wood from the branches was 9.5%. The wood from young stems had an average content of ashes of 7.1% and the wood from old stems had 7.6%. The stained wood had an average content of ashes of 7.5%. The ash content of the wood from "la Rocassa" was not determined because the samples was thought to be very similar to the sample from Can Prat. See Table 2 for the elemental composition of ashes.
Calorific value: According to EN 14918:2011 the calorific value of the normal wood was 19,426 J/g meanwhile the discoloured wood was 21,163 J/g.
pH and buffer capacity: The logs affected by the “roig” had a pH of 3.59. The pH of the old
unstained logs was 3.97. The young stems had a pH of 4.47 and the branches had a pH of 6.40. Thus, the pH increased with the age and the discolouration. The discoloured and the normal wood have similar buffer capacity. Both have strong buffer capacity against acids but low against bases.
Low molecular weight carbohydrates: The average solubility on NaOH of the stained wood was 32.60%, the regular wood was 30.43% and the wood from the branches was 26.98%.
Acid-insoluble lignin: The average solubility of the lignin from stained tree trunks was 24.76% and from a normal log was 20.32%.
Soluble non-volatile extractives: the amount of extractives obtained using dichloromethane was 0,26% on stained wood, 0.3% on regular wood and 0.11% on average on wood from the branches. When using methylbenzene, the percentage of extractives was 5.99% on stained wood, 10.09% on regular wood and 5.81% on wood from the branches.
Tannins and soluble solids in water: Making an extraction with water on normal wood the separation obtained 10.2% of tannins and 6.1% of non-tannin substances. When using metabisulfite, the amounts increased up to 12.2% of tannins and 9.1% of non-tannins. The same procedure done with water but on stained wood obtained 9.9% of tannins and 10.5% of non-tannins. When using metabisulfite the figures raised to 10.9% of tannins and 13.5% of non-tannins.
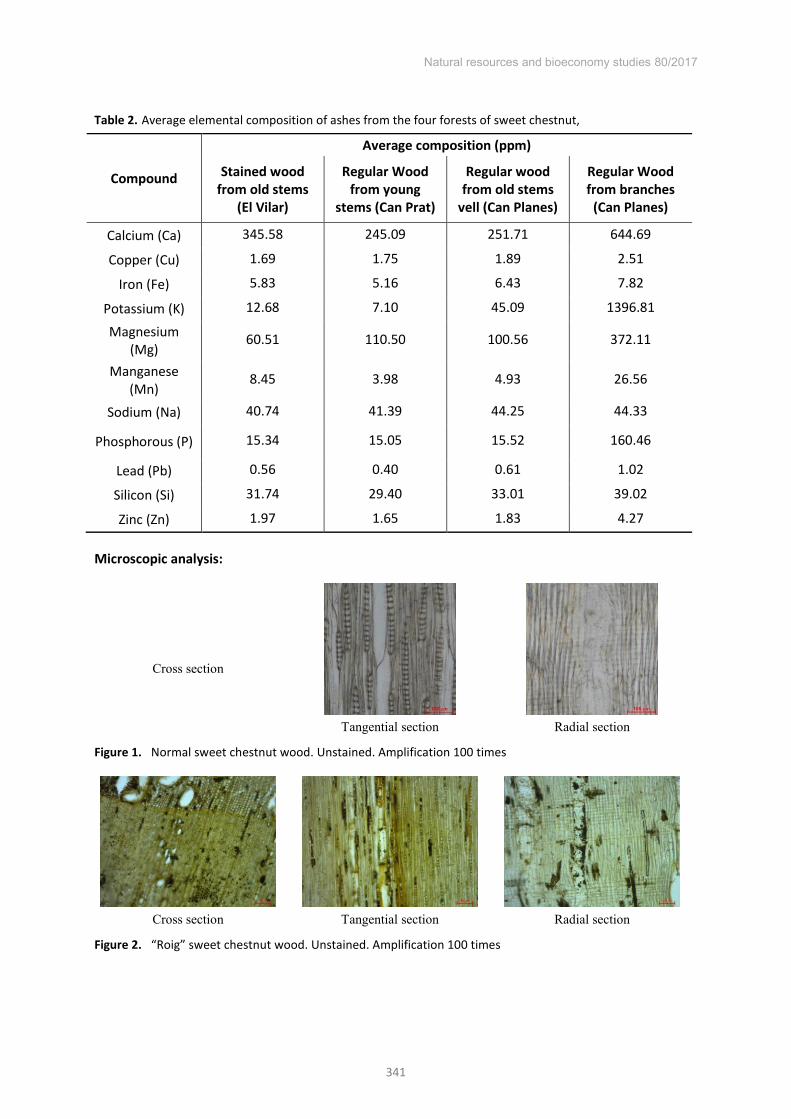
Natural resources and bioeconomy studies 80/2017
341
Table 2. Average elemental composition of ashes from the four forests of sweet chestnut,
Compound
Average composition (ppm)
Stained wood from old stems
(El Vilar)
Regular Wood from young
stems (Can Prat)
Regular wood from old stems
vell (Can Planes)
Regular Wood from branches
(Can Planes)
Calcium (Ca) 345.58 245.09 251.71 644.69
Copper (Cu) 1.69 1.75 1.89 2.51
Iron (Fe) 5.83 5.16 6.43 7.82
Potassium (K) 12.68 7.10 45.09 1396.81
Magnesium (Mg)
60.51 110.50 100.56 372.11
Manganese (Mn)
8.45 3.98 4.93 26.56
Sodium (Na) 40.74 41.39 44.25 44.33
Phosphorous (P) 15.34 15.05 15.52 160.46
Lead (Pb) 0.56 0.40 0.61 1.02
Silicon (Si) 31.74 29.40 33.01 39.02
Zinc (Zn) 1.97 1.65 1.83 4.27
Microscopic analysis:
Cross section
Tangential section
Radial section
Figure 1. Normal sweet chestnut wood. Unstained. Amplification 100 times
Cross section
Tangential section
Radial section
Figure 2. “Roig” sweet chestnut wood. Unstained. Amplification 100 times

Natural resources and bioeconomy studies 80/2017
342
Cross section
Tangential section
Radial section
Figure 3. “Roig” sweet chestnut wood. Staining ACN. Amplification 100 times
Cross section
Tangential section
Radial section
Figure 4. “Roig” sweet chestnut wood. Staining FCA. Amplification 100 times
Cross section
Tangential section
Radial section
Figure 5. “Roig” sweet chestnut wood. Staining Kallichrom. Amplification 100 times
Cross section
Tangential section
Radial section
Figure 6. “Roig” sweet chestnut wood. Staining Roeser. Amplification 100 times
Cross section
Tangential section
Radial section
Figure 7. “Roig” sweet chestnut wood. Staining Toluidine blue. Amplification 100 times

Natural resources and bioeconomy studies 80/2017
343
Discussion 4.Considering the chemical analysis, it is clear that “roig” wood is poor in non-volatile minerals, like all the metabolically non-active tissues and the content on calcium and manganese is higher. However, magnesium content is lower. It is estimated that their carbon content is the same as in normal wood, since the samples did not show any mass loss or any lower calorific value. Moreover, the amount of the rest of the elements is similar in comparison with other species (Etiégni and Campell 1990, Liodakis et al. 2009, Misra et al. 1993, Passialis et al. 2008). The data of (Burriel et al. (2000- 2004) also confirms that calcium is the most abundant element followed by magnesium, and that potassium is the most abundant in the branches.
In addition, the stained wood is poor in waxes, fats, resins, sterols in the cell walls and volatile hydrocarbons. It has maintained the proportion of tannins and has significantly increased the proportion of soluble solids in water. The “roig” wood had a higher proportion of low molecular weight carbohydrates, probably degraded cellulose and hemicellulose (holocellulose), and a greater proportion of lignin. Moreover, it had solid cytoplasmic substances that accumulate in the idioblasts of the radial and axial parenchyma as can be seen in the microscopic images. The analysis showed that these dark inclusions are not minerals, tannins nor reserve substances. Thus, the most feasible theory is that are metabolic waste substances of low molecular weight, soluble and heterogeneous, that create the tyloses that dye the wood.
Microscopical images showed that the tissues of the wood affected by the “roig” contain
reddish-brown inclusions that have a texture like liquid. These inclusions were visible in all three cutting directions (cross, tangential and radial sections) of the microscopic slides. Especially a high amount of latewood vessels were filled with this reddish-brown coloured suspension. The vessels and the wood rays were completely expanded.
Despite these inclusions, the microscopic slides showed that there is neither damage nor destruction of the anatomical structure of the heartwood of Castanea sativa. Moreover, there are no other structural damages or presence of mycelium since the fungi cells should be visible in the higher magnification of the microscopic samples. These findings do not fit the research of Yurkewich et al. (2017) who found up to nine fungi in the "roig" stained samples including two species known to cause decay in chestnut. According to these authors plus Cartwright (1937) and Rogers et al. (1999), Fistulina hepatica appears to be the most likely candidate for the causal agent of the decay. However, no fruiting bodies on the bark or other evidence were detected at the selected trees in our study.
Conclusions 5.The wood affected by the "roig" suffers a tylose caused by the accumulation of metabolic waste substances. These substances are heterogeneous and have low molecular weight. Moreover, “roig”
has a low content of extractives and a higher proportion of soluble carbohydrates. The presence of fungi cannot be discarded but it is clear that certain wood tissues can suffer
staining without being invaded by a mycelium. Therefore, further research is needed.
Acknowledgements This research was conducted in the framework of a Short Scientific Mission of the COST Action FP1006 “Bringing new functions to wood through surface modification“at the Fachhochschule Salzburg (Austria). The research is a part of the PhD of the main author done at the Universitat de Lleida (Spain). The authors also want to acknowledge the support of the Catalan Institute of Wood (Incafust) of the Forest Sciences Centre of Catalonia.

Natural resources and bioeconomy studies 80/2017
344
References Adzet, J. M. 1990. II Symposium Internacional de Curtición Vegetal. Igualada, Spain: Escuela Superior
de Tenería. ISBN: 8460074706. Burriel, J. A. et al. (2000-2004). Inventari Ecològic i Forestal de Catalunya. Bellaterra [Barcelona]:
CREAF. ISBN 84-931323-0-6. Cartwright, K. T. St. G. 1937. A reinvestigation into the cause of “Brown oak”, Fistulina hepatica (Huds.)
Fr. Transactions of the British Mycological Society, 21: 68–83. Colinas González, C.; Uscuplic, M. 1999. Studies on chestnut blight (Chryphonectria parasitica (Murr.)
Barr in north-east Spain. In: International Symposium on Chestnut. Proceedings of the Second International Symposium on Chestnut. Bordeaux, France; ISHS Acta Horticulturae. pp. 495-500. ISBN 978-90-66059-41-2.
Correal-Mòdol, E. 2013. Propietats químiques, físiques, mecàniques i resistents de la fusta massissa i laminada de castanyer del sistema mediterrani català (Doctoral dissertation). Lleida, Spain: Departament d’Enginyeria Agroforestal, Universitat de Lleida.
EN 14081:2016. Timber structures. Strength graded structural timber with rectangular cross section. Part 1: General requirements. European Committee for Standardization. Brussels.
Etiégni, L., Campbell, A.G. 1991. Physical and chemical characteristics of wood ash. Bioresource Technology, 37: 173-178.
Europe. 2011. Regulation (EU) No 305/2011 of the European Parliament and of the Council of 9 March 2011 laying down harmonised conditions for the marketing of construction products and repealing Council Directive 89/106/EEC. Brussels.
UNE 56546:2013. Visual grading for structural sawn timber. Hardwood timber. Asociación Española de Normalización y Certificación. Madrid.
Liodakis, S. Tsoukala, M., Katsigiannis, G. 2009. Laboratory study of leaching properties of Mediterranean Forest Species Ashes. Water, Air & Soil Pollution, 203: 99-107.
Misra, M. K., Ragland, K. W., Baker, A. J. 1993. Wood ash composition as a function of furnace temperature. Biomass and Bioenergy, 4-2: 103-116.
Passialis, C., Voulgaridis, E., Adamopoulos, S., Matsouka, M. 2008. Extractives, acidity, buffering capacity, ash and inorganic elements of black locust wood and bark of different clones and origin. Holz als Roh-und Werkstoff, 66-6: 395-400.
Rogers, S. O., Holdenrieder, O., & Sieber, T. N. 1999. Intraspecific comparisons of Laetiporus sulphureus isolates from broadleaf and coniferous trees in Europe. Mycological Research, 103: 1245–1251.
Yurkewich, J. I., Castaño, C., Colinas, C. 2017. Chestnut Red Stain: Identification of the fungi associated with the costly discolouration of Castanea sativa. Forest Pathology. 00:e12335. https://doi.org/10.1111/efp.12335. 9 pp.

Natural resources and bioeconomy studies 80/2017
345
Drying of low quality birch timber – quality, time and energy consumption
Fritz Wilhelms*, Susanne Bollmus, Philipp Schlotzhauer, Holger Militz
Wood Biology and Wood Products University of Goettingen, Lower Saxony, 37077, Germany
Abstract
In the future in Germany it will be necessary to use hardwood more extensively in a non-energetic way to meet upcoming demands. Especially low quality hardwoods (e.g. small diameter and low quality) will play a major role. To ensure future resources for the wood industry, new strategies and products for low value hardwoods are needed. During processing of low value hardwood from round wood to final boards, yield is a main concern. One process step that is affecting the yield is the drying process. In this project, low quality birch timber was dried in a conventional way. The conventional drying process should show that low value birch timber is comparable in its drying properties with high quality birch timber. Furthermore, it should also be a reference for the following accelerated processes.
Introduction 1.Since the mid-1990s the annual raw wood consumption in Germany has been showing an increase. While the harvested timber and wood consumption showed numbers of 48.5 Mio. m3 respectively 47.7 Mio m3 in 2002, the values grew up to 72.4 Mio. m3 and in 68.4 Mio. m3 2010. Due to EU-wide program aiming to raise the renewable resource share in primary energy consumption to 20 % until 2020, wood as a thermal resource plays a particularly important role today. This development will continue within the next years and therefore there will be consequences for the wood industry (Seintsch & Weimar 2012).
In 2012, softwoods covered more than 75 % of the total 70 Mio. m3 annual felling. While 80 % were used in construction wood & wood products etc., 20 % were processed for energetic use. For hardwoods the proportion of the total felling of 17.4 m3 was the opposite. Therefore, in the future it will be necessary to use hardwood more extensively in a non-energetic way to meet upcoming demands. To ensure future resources for the wood industry, new strategies for the substitution of the mostly energetically used low value hardwood are needed. (Spellmann 2013)
The above mentioned situation, with respect to the raw wood market, was the starting point for a joint project between different research institutes in the field of wood and forest science (Table 1). The aim of the project is to find an ecologically acceptable, non-energetic and sustainable solution for the use of low value hardwood timber. Along the value chain of the potentially usable hardwood species developments are on their way.
First interviews with different partners from the sawmilling and forest industry show very different regional aspects of availability and demand for different hardwood species. The reasons are diverse, e.g.: Wood species like ash are expected to show a major availability increase in the next years (parasites). Species like birch are available but only as single trees in the stands and therefore remain in the stands. Some tree species are not harvested, because their wood is not “en vogue” at
the moment. Many trees of low quality remain in the forests due to expensive costs of felling and little payment for the quality. Moreover, the species and assortment range of hardwood trees is
* Corresponding author: Tel.: +495513922051; E-mail: [email protected]

Natural resources and bioeconomy studies 80/2017
346
higher compared to softwood trees, therefore sorting and storage is more complicated and more expensive.
Table 1. Research institutes and projects.
Research Institute Research project Northwest German Forest Research Institute
(NW-FVA) Tree species specific potential analysis of the hardwood
timber with expected quality and diameter University of Goettingen: Department of
Forest Economics and Forest Management The value chain of hardwood with regard to the material use
of low value ranges Frauenhofer Institute for Wood Research
(WKI) The use of industrial defibered technology and the
production of fibreboards with low value hardwood University of Goettingen: Department of
Molecular Wood Biotechnology and Technical Mycology
Production of new wood composites with special focus on particle boards and fibre boards
University of Goettingen: Department of Wood Biology and Wood Products
Low value hardwood timber in the sawmill industry; special focus on yield and drying methods
University of Goettingen: Department of Wood Biology and Wood Products
Production of wood fibre insulating materials with low value hardwood
The Department Wood Biology and Wood Products of the University of Goettingen choose the wood species birch for first investigations. While birch wood is used extensively in Finland and other Baltic states (Luostarinen et al. 2002) there is a potential for future usage in Germany. The availability and demand in the future, good mechanical properties and possible glulam products out of birch wood are the reasons for the selection. The first focus of the investigations is set on drying processes.
In general, drying of hardwood lumber is more complex and more challenging than drying softwood lumber (Stenudd 2013). Due to the more complicated anatomical structure and higher density, the drying of hardwoods often takes more time and has a higher energy consumption (Welling 2012). Despite these facts, there are hardly any drying schedules for drying low quality hardwood timber available. Therefore the main goal in these first investigations is to shorten the drying time with a consistent good drying quality and low energy consumption. Besides common methods of conventional hot air vent drying and air drying, super-heated steam drying and alternating climate drying are promising options in order to reduce drying time and or improving drying quality. With a well-managed process it is also possible to reduce the energy consumption (Pang and Pearson 2004). During hot steam drying wood is dried in pure super-heated steam, i.e. atmospheric pressure (1 bar) and a temperature higher than 100 °C. While the super-heated steam is overheated during temperatures above 100 °C it gives heat to the drying medium. The water within the wood vaporizes and the steam flows out of the wood. Through overpressure valves the redundant steam is being released out of the drying chamber. Airflow for moisture outtake is not necessary. According to Weinbrenner (1965) shorter drying times and less energy consumption are possible. Another method is alternating climate drying which means that the drying wood is exposed to different repeating climate conditions (T and RH) during the drying process. According to Rémond et al. (2013) these alternating climates lead to a higher creep behavior of the wood. This effect is called “mechano-sorptive creep”. During technical drying the elastic limit across the grain of the wood is quickly reached. Plastic deformation is more likely after this point and cracks occurring after maximum elongation. Alternating climate drying can increase the maximum elongation which leads to reduced crack occurrence. Additionally the moisture gradient within the wood can be influenced by alternating climate drying. The core parts of the wood are affected more than the surface by the alternating climate. After climate change (for example drop of temperature) the core parts are having a higher temperature for a longer time than the surface parts. According to conventional drying the moisture content of alternating climate drying wood can be lower at the same drying

Natural resources and bioeconomy studies 80/2017
347
time. Therefore the slight changes in the moisture profile within the wood result in reduced drying times or drying stress (Welling at al. 2003).
The goal of this first investigation was to show that low quality birch timber, dried in a conventional way, is comparable in its drying quality with high quality birch timber. Furthermore, it should be used as a reference for following processes. The future goal is to find drying processes with a short drying time, low energy consumption and consistent drying quality for low quality birch wood. With super-heated steam drying and accelerated climate drying two promising options are given.
Experimental design 2.For this paper birch round wood was sorted according to the German round wood standards (RVR 2015) to detect the quality and dimension class that was needed. After sawing the round wood to lamellas, the birch timber was dried in a conventional way. The drying quality was examined according to European Drying Group (EDG) recommendations – Assessment of drying quality of timber. The conventional drying process (heat and vent system) from this paper will be the reference to all above mentioned future drying experiments. For each drying process, current and future, a batch of 70 lamellas was randomly assigned from the same round wood material.
Raw material 2.1.For the round wood material 13 birch (Betula pendula R.) trees were selected by visual quality examination. The growing site is located nearby Goettingen. The stand is fresh to moderate summer dry with moderate nutrient supply. Main trees are spruce and pine from planting, while the birch trees were grown from natural regeneration. The stand is about 70 years old. After harvest the trees were cut into 48 log sections of 3 m length. Each of the log sections were sorted according to the “Framework agreement for the raw wood trade in Germany”. With a mobile block band saw (SERRA
ME 90 2.0) log sections were cut into lamellas with the cross section of 90-150 x 50 mm3. Dimensions were chosen for a possible use for glulam in the future. Afterwards, bowing, weight, cracks and dimensions for each lamella were measured.
As mentioned above, the round wood was sorted according to RVR. Wood characteristics like branch diameter, bowing etc. were examined. After examination the log sections were sorted in the quality classes A, B, C and D (where A stands for excellent quality, D for quality that is not sortable to A,B or C quality) as well as the dimension classes 2a (20-25 cm), 2b (25-30 cm), 3a (30-35 cm) and 3b (35-40 cm). Figure 1 shows the round wood quality classes according to RVR. The majority of the sorted round wood is sorted to the quality classes C and D. The main reason for the quality examinations to classes C and D was bowing, big branches & rot. As Figure 2 shows the dimension classes of the round wood were from 2a to 3b, i.e. low diameter logs.

Natural resources and bioeconomy studies 80/2017
348
Figure 1. Round wood dimension classes according to RVR
Figure 2. Round wood quality classes according to RVR.
Reference drying process 2.2.For the drying process a semi-industrial kiln (HB drying systems) was used. The kiln has a capacity of about 2 m3 and can reach a maximum temperature of 220 °C. As drying schedule a process for high quality birch wood given by HB drying systems was used. Slight changes were made in the case of maximum temperature and fan rotation. The conventional drying process was executed with a maximum temperature of 64 °C and a drying time of three weeks. Targeted moisture content (MC) of the lamellas was 12 %. Table 2 shows the drying schedule with values for Air temperature, Relative humidity (RH) and moisture content (MC). The first four phases are the actual drying phases, were the temperature rises, the RH falls and the moisture is transported out of the wood. Phases 5 & 6 are for cooling and conditioning of the wood.
Table 2. Conventional drying process schedule.
Phase 1 2 3 4 5 6 Air T. [°C] 45 55 60 64 30 30
RH [%] 83 57 43 27 51 51 MC [%] 57 26 15 12 12 12
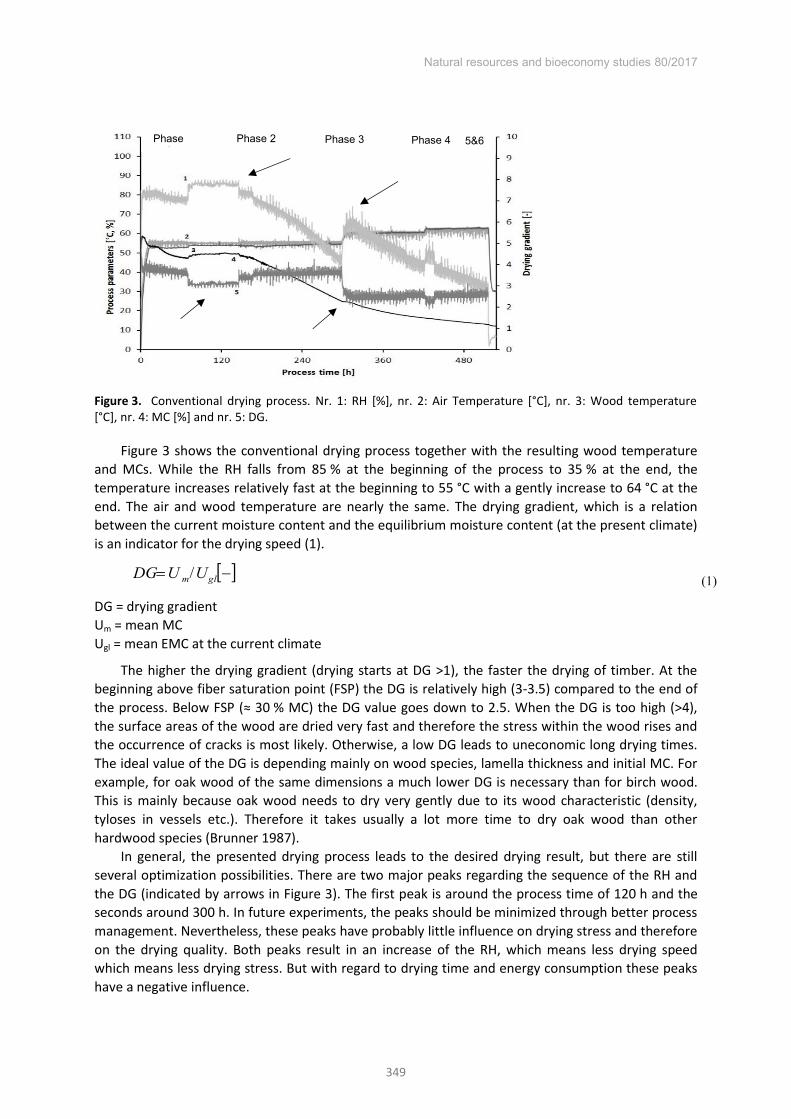
Natural resources and bioeconomy studies 80/2017
349
Figure 3. Conventional drying process. Nr. 1: RH [%], nr. 2: Air Temperature [°C], nr. 3: Wood temperature [°C], nr. 4: MC [%] and nr. 5: DG.
Figure 3 shows the conventional drying process together with the resulting wood temperature and MCs. While the RH falls from 85 % at the beginning of the process to 35 % at the end, the temperature increases relatively fast at the beginning to 55 °C with a gently increase to 64 °C at the end. The air and wood temperature are nearly the same. The drying gradient, which is a relation between the current moisture content and the equilibrium moisture content (at the present climate) is an indicator for the drying speed (1).
glm UUDG / (1)
DG = drying gradient Um = mean MC Ugl = mean EMC at the current climate
The higher the drying gradient (drying starts at DG >1), the faster the drying of timber. At the beginning above fiber saturation point (FSP) the DG is relatively high (3-3.5) compared to the end of the process. Below FSP (≈ 30 % MC) the DG value goes down to 2.5. When the DG is too high (>4), the surface areas of the wood are dried very fast and therefore the stress within the wood rises and the occurrence of cracks is most likely. Otherwise, a low DG leads to uneconomic long drying times. The ideal value of the DG is depending mainly on wood species, lamella thickness and initial MC. For example, for oak wood of the same dimensions a much lower DG is necessary than for birch wood. This is mainly because oak wood needs to dry very gently due to its wood characteristic (density, tyloses in vessels etc.). Therefore it takes usually a lot more time to dry oak wood than other hardwood species (Brunner 1987).
In general, the presented drying process leads to the desired drying result, but there are still several optimization possibilities. There are two major peaks regarding the sequence of the RH and the DG (indicated by arrows in Figure 3). The first peak is around the process time of 120 h and the seconds around 300 h. In future experiments, the peaks should be minimized through better process management. Nevertheless, these peaks have probably little influence on drying stress and therefore on the drying quality. Both peaks result in an increase of the RH, which means less drying speed which means less drying stress. But with regard to drying time and energy consumption these peaks have a negative influence.
Phase 1
Phase 2 Phase 3 Phase 4 5&6
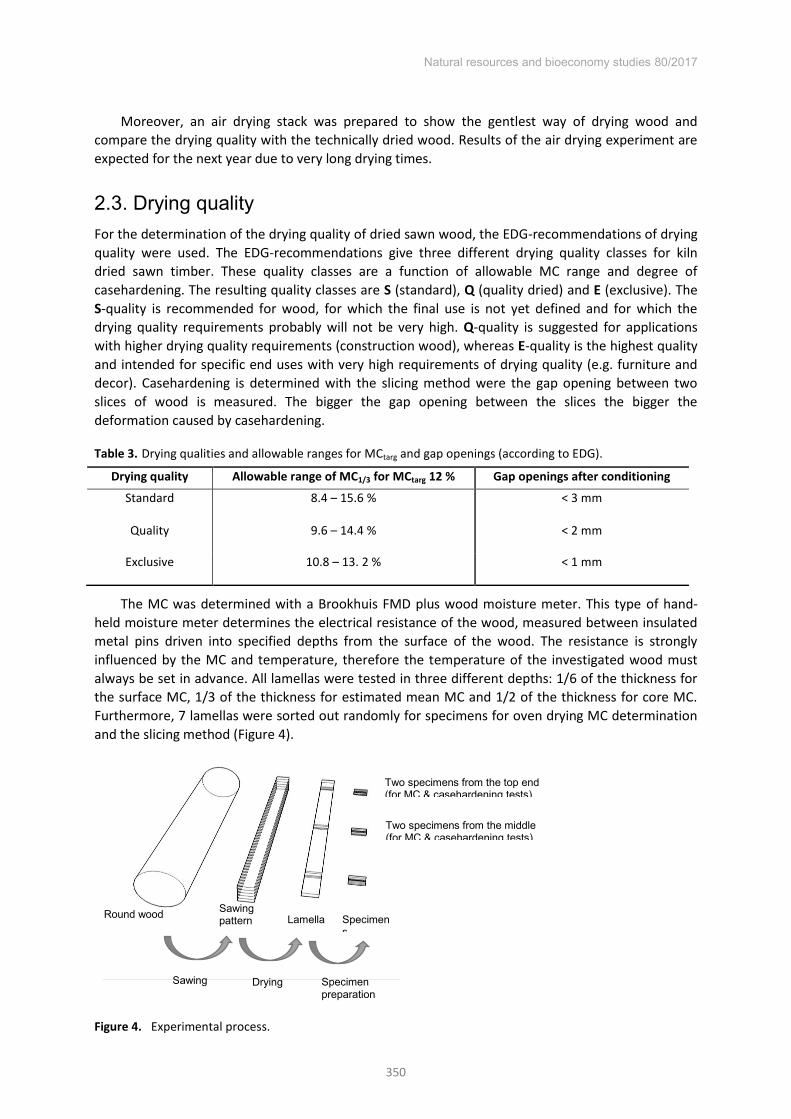
Natural resources and bioeconomy studies 80/2017
350
Moreover, an air drying stack was prepared to show the gentlest way of drying wood and compare the drying quality with the technically dried wood. Results of the air drying experiment are expected for the next year due to very long drying times.
Drying quality 2.3.For the determination of the drying quality of dried sawn wood, the EDG-recommendations of drying quality were used. The EDG-recommendations give three different drying quality classes for kiln dried sawn timber. These quality classes are a function of allowable MC range and degree of casehardening. The resulting quality classes are S (standard), Q (quality dried) and E (exclusive). The S-quality is recommended for wood, for which the final use is not yet defined and for which the drying quality requirements probably will not be very high. Q-quality is suggested for applications with higher drying quality requirements (construction wood), whereas E-quality is the highest quality and intended for specific end uses with very high requirements of drying quality (e.g. furniture and decor). Casehardening is determined with the slicing method were the gap opening between two slices of wood is measured. The bigger the gap opening between the slices the bigger the deformation caused by casehardening.
Table 3. Drying qualities and allowable ranges for MCtarg and gap openings (according to EDG).
Drying quality Allowable range of MC1/3 for MCtarg 12 % Gap openings after conditioning
Standard 8.4 – 15.6 % < 3 mm
Quality 9.6 – 14.4 % < 2 mm
Exclusive 10.8 – 13. 2 % < 1 mm
The MC was determined with a Brookhuis FMD plus wood moisture meter. This type of hand-held moisture meter determines the electrical resistance of the wood, measured between insulated metal pins driven into specified depths from the surface of the wood. The resistance is strongly influenced by the MC and temperature, therefore the temperature of the investigated wood must always be set in advance. All lamellas were tested in three different depths: 1/6 of the thickness for the surface MC, 1/3 of the thickness for estimated mean MC and 1/2 of the thickness for core MC. Furthermore, 7 lamellas were sorted out randomly for specimens for oven drying MC determination and the slicing method (Figure 4).
Figure 4. Experimental process.
Round wood Sawing pattern Lamella Specimen
s
Drying Sawing Specimen preparation
Two specimens from the top end (for MC & casehardening tests)
Two specimens from the middle (for MC & casehardening tests)

Natural resources and bioeconomy studies 80/2017
351
Figure 5. Specimen preparation for the slicing test (EDG).
Casehardening was determined by performing the slicing test method (Figure 5). The slicing test can be used for quantitative assessment of the effects caused by casehardening. For the test a slice of 15 mm in the longitudinal direction is cut out of the lamellas. Afterwards the cross-section of the slice is cut in half and stored for a minimum of 48 h for conditioning at 20 C ° and 65 RH. To determine the drying quality according to EDG-recommendations, the gap between the two slices is measured. A small gap opening (<1 mm) means that there is very little deformation caused by casehardening (E quality). The bigger the gap the more deformation is caused by casehardening. Specimens were taken from lamellas with flat sawn, quarter sawn and 45° ring orientation to exclude the effect of the ring orientation. Furthermore, specimens were taken in equal parts from the top end, the butt end and the middle of the boards.
Figure 6. Drying quality for MC tests acoording to EDG.
In Figure 6 the drying qualities for the MC measurements are shown. Most measurements are in the range of exclusive (E) or quality (Q) drying quality (Table 3). Very little measurements are in the standard quality range. These results were expected due to a relatively gentle drying process. Therefore a homogenous MC throughout the whole thickness of the lamellas is very likely. While wood is a heterogeneous material, variations are always possible. The oven dried MC samples show the same result. Figure 7 shows the drying quality for the casehardening tests for flat sawn, quarter sawn and 45 ° ring orientation lamellas. All measurements show a quality (Q) drying result. Therefore no gap opening was smaller than 1 mm but also not larger than 3 mm (according to Table 3). There is also no difference between the three annual ring orientations. In comparison to the MC measurements, just 7 different lamellas respectively 21 specimens out of the lamellas were tested

Natural resources and bioeconomy studies 80/2017
352
due to the destructive nature of the slicing method. The remaining lamellas are needed for further investigations.
Figure 7. Drying quality for casehardening tests according to EDG.
Preliminary conclusions 3.The drying quality of the conventional drying process shows good results according to MC measurements and the slicing method for casehardening determination. The MC measurements show exclusive (E) qualities regarding the targeted MC. The slicing method showed optimization potentials in case of gap openings, but are still good in the overall picture. Based on the fact that the slicing method showed quality (Q) drying results, the overall drying quality cannot be considered as exclusive (E). For further investigations the aim is to reach exclusive (E) overall drying quality. In general it can be said that this process is suitable as a reference process for further experiments.
In future experiments super-heated steam drying as well as alternating climate drying will be carried out. As mentioned in the introduction the aim of the super-heated steam process and the alternating climate drying is to shorten the drying time with consistent drying quality and a lower energy consumption compared to the conventional drying process. Acceleration of the drying process and less energy consumption with a consistent drying quality is the main goal for future experiments.
References Brunner, R. 1987. The sawn timber drying (in german). 5. Auflage. Hannover. 322 pp. European drying group. 1994. EDG-Recommendation, Assessment of drying quality of timber, pilot
edition (for testing) Editor: J. Welling. 27 pp. Luostarinen, K., Möttönen, V., Asikainen and A., Luostarinen, J. 2002. Birch (Betula pendula) Wood
Discolouration during Drying. Effect of Environmental Factors and Wood Location in the Trunk. Holzforschung 56: 348-354.
Pang, S. and Pearson, H. 2004. Experimental Investigation and Practical Application of Superheated Steam Drying Technology for Softwood Timber. Drying technology Vol. 22 (9) pp 2079-2094.
Rémond, R., De la Cruz, M., Aléon, D. and Perré, P. 2013. Investigation of oscillating climates for wood drying using the flying wood test and loaded beams: Need for a new mechano-sorptive model. Madereas: Ciencia y Technologia 15 (3): pp 269-280.

Natural resources and bioeconomy studies 80/2017
353
Seintsch, B. and Weimar, H. 2012. Actual situation and future perspectives for supply and demand of hardwood in Germany. In: The 5th Conference on Hardwood Research and Utilisation in Europe, eds. R. Németh and A. Teischinger. Sopron, Hungary, pp. 301-312. University of West Hungary Press, Sopron.
Spellmann, H. 2013. Mass instead of class? Silvicultural consequences from a raw wood request (in german). AFZ/Der Wald. 86 (9), pp.10-15
Stenudd, S. 2013. Colour response in drying Nordic hardwoods. Doctoral dissertation, Department of Forestry and Wood Technology, Linnaeus University, Växjö. 78 pp.
Weinbrenner, R. 1965. Wood drying (in german). Holzwirtschaftliches Jahrbuch Nr. 15. Stuttgart. 403 pp. Welling, J., Riehl, T., Kruse K., Rose, B. 2003. Improved sawn timber drying in fresh air / tumble dryers
through alternating climate (in german). Bundesforschungsanstalt für Forst- und Holzwirtschaft und das Holzwirtschaftliche Zentrum der universität Hamburg. 87 pp.
Welling, J. 2012. Differences between soft and hardwoods and their influence on processing and application (in german). Presentation at the BMEVL Laubholztagung, Würzburg.

Natural resources and bioeconomy studies 80/2017
354
Bark of European deciduous trees as a potential source for production of proanthocyanidins-rich extract Sarmite Janceva*, Maris Lauberts, Liga Lauberte, Alexandr
Arsanica, Tatiana Dizbite, Galina Telysheva
Latvian State Institute of Wood Chemistry, Dzerbenes Street 27, Riga, Latvia, LV-1006
Abstract
In the present study, the bark of deciduous trees (hardwood) species: grey alder (Alnus incana), black alder (Alnus glutinosa), goat willow (Salix caprea) and silver birch (Betula pendula) is considered as perspective feedstock for production of oligomeric proanthocyanidins (OPCs) rich extracts (OPCEs). OPCEs were isolated using one-step and sequential extraction from the above-mentioned bark of hardwood trees. Optimization of extraction conditions of the OPCs and OPCEs from bark of alder species were performed varying solvents (ethanol, distilled water), extraction methods (conventional and microwave assisted extraction) and extraction times (5–60 minutes). The optimal extraction conditions established in the work provide 87 % OPCs transition from the bark to hydrophilic extracts. The yields of OPCE from all the bark under study varied between 7 % and 29 % on the oven-dry (ovd) bark. The content of OPCs in OPCEs varied between 42-68 %. The OPCEs were characterised by antioxidant activity using ABTS●+ radical scavenging test. All extracts being introduced into lipid-based substrates, namely in mayonnaise and a basic lipid composition of cosmetic cream, showed antioxidant activity comparable or even excel (in case OPCE from black alder) with the reference commercial synthetic antioxidant tert-Butylhydroquinone (TBHQ).
Keywords: antioxidant activity; hydrophilic extract; deciduous tree bark; hardwood; lipid oxidation; proanthocyanidins.
Introduction 1.Unique compositional characteristics of bark biomass and possibility of numerous value added products (individual compounds and mixtures of synergetic activity) obtaining promotes researches aimed at incorporation of bark utilization in integrated biorefinery schemes of wood processing. The creation of a technology for the non-waste processing of hardwood using the production from the bark of new biologically active natural products able to satisfy the needs of medicine, pharmacy, cosmetic and food industry was the strategic aim of lignin chemistry laboratory for several last year.
Forest industries produce huge quantities of barks (0.5 million m3 in year for Latvia) that represent a potential source of green chemicals, including biological active compounds. Unfortunately, at present, the wood bark is mainly burned for energy production or used as a compost or mulching products for use in horticulture and decorative landscape development. Silver birch, grey alder, black alder and goat willow cover, respectively, 30.6; 7.2; 2.9; 0.7 % of Latvian forest area. Silver birch and grey alder are the dominant hardwood species in Northern European countries, especially in Latvia. Bark content from total tree biomass varies from 2-4% up to 10% from the total tree biomass, depending on tree species and age. The tree bark is recognized as underexploited lignocellulosic renewable raw material. Proanthocyanidins rich extracts are industrially available. As a major materials for their production currently bark from following hardwood are used: quebracho tree (Schinopsis balansae, Argentine) and mimosa (Acacia mearnsii, Brazil and South Africa) (Kemppainen et al. 2014, Bianchi et al. 2015). The search of novel sources of
* Corresponding author: Tel.: +37125148850; E-mail: [email protected]

Natural resources and bioeconomy studies 80/2017
355
proanthocyanidins is continued. It was shown that the bark from deciduous trees growing in Latvia can be considered as a source of OPCE production, it has also well prospectively.
Proanthocyanidins, known also as condensed tannins, are widely distributed in the plant kingdom and belong to a class of polyphenolic oligomers or polymers compounds of polyhydroxy flavan3ol units, such as (+)catechin and (−)epicatechin, Fig. 1 (Park et al. 2011)].
Figure 1. Chemical structure of B-type oligomeric procyanidine (catechin trimer)
The content of the OPCs in alders bark hydrophilic extract is 25-46 %. The data on the proanthocyanidins content in Silver birch bark from Latvia's forests is absent. Qualitative analysis of bark extract from goat willow growing in Latvia have shown high content of polyphenolic compounds (in average 50-60 % on extracts) investigated that make its perspective as a source of low molecular weight or oligomeric polyphenolic compounds, including proanthocyanidins (Janceva et al. 2015).
The TOF-MS and 13C-NMR analyses have shown that the OPCs isolated from the bark of Latvian alders (Alnus incana and Alnus glutinosa) are the proanthocyanidins of the B-type, where the monomeric units of catechin/epicatechin are connected with a C4-C8 bond in oligomers with the degree of polymerization of 2-5 (Janceva et al. 2015 and Janceva et al. 2016). Hydroxyl groups of OPCs play a basic role in the protective effects exerted against a wide range of human diseases. OPCs promote digestive processes, and help organisms to resist many diseases such as atherosclerosis, diabetes, cancer, etc. Nowadays, the antioxidant properties and biological activity of proanthocyanidins are challenge for the synthetic products foreseen for application in the similar areas, especially for food products and health care due to some risky for human health. Among the synthetic antioxidant frequently used for food are butylated hydroxyanisole (BHA), butylated hydroxytoluene (BHT), propyl gallate (PG) and tert-butyl hydroquinone (TBHQ) (Elgazar 2013). The incorporation of a green antioxidant into the systems for prevention of oxidative processes is becoming more and more important in the food and beauty industries. The knowledges about antioxidant activity of OPCEs isolated from the bark of the Northern hardwood trees are rather limited. Therefore, the aim of the present work was estimation of OPCEs prospects as antioxidants for lipid rich systems that is exemplified by mayonnaise and commercial cosmetic cream.
Experimental 2.
Materials 2.1.The samples of hardwood trees (Alnus incana, Alnus glutinosa, Salix caprea and Betula pendula) bark were collected from the forest in the East-South part of Latvia. The age of trees was between 25 and 30 years. Average bark samples had been obtained from ten trees, with a diameter (45-55 cm) in different plots at a height ranging between 50 and 250 cm. The bark was dried at room temperature,

Natural resources and bioeconomy studies 80/2017
356
ground using knife mill (SM100) and sieved to select the particles between 1 and 2 mm. The selected bark fractions were stored at -8°C.
All solvents of high purity, ABTS+• (2,2’-Azino-bis(3-ethylbenzothiazoline-6-sulfonic acid) diammonium salt) as well as reference antioxidants, Trolox (6-hydroxy-2,5,7,8-tetramethylchroman-2-carboxylic acid) and TBHQ, have been purchased from Sigma–Aldrich. The analytic standards such as Gallic acid have been supplied from Sigma–Aldrich but Procyanidin B2 - from Extrasynthese (France). The OPCEs were stored at -8°C. All test solutions were prepared just before use.
Mayonnaise without additives “Kedainiu” has been purchased in Lithuania. The basic lipid composition of commercial cosmetic cream without antioxidants/ stabilisers has been obtained from Latvian company Fide Ltd.
Figure 2. Schema of OPCE isolation from bark
Isolation of OPCEs 2.2.Hydrophilic extracts enriched with OPCs were obtained from the bark as the products of the final stage (40 % EtOH, 80 °C, 30 min.) using conventional one-step or sequential extraction, as well as microwave assisted extraction. The ethanol was removed from extract under vacuum, and the remaining aqueous solution was freeze-dried to yield a brown solid final product. The yields of the fractions are presented as a percentage based on oven dry (ovd) bark (% w/w).
Chemical composition of OPCEs 2.3.Dry crude extracts were dissolved in aqueous acetonitrile (v/v 50:50) with an approximate concentration of 2 mg •mL-1 and filtered. The obtained solution was used for UHPLC-ESI-MS/MS experiments. The LC analysis of the samples was performed on Acquity UPLC system (Waters Corp., Singapore) coupled with a quadrupole-time of flight (Q-TOF) MS instrument (UPLC/Synapt Q-TOF MS, Waters, Milford, MA, USA) with an electrospray ionization (ESI) source. The separation was carried out on a U-HPLC column (2.1 mm x 50 mm i.d., 1.8 µm, UPLC HSS BEH C18) (Waters Acquity) at a flow rate 0.35 mL•min-1. The eluent was 0.1% formic acid (A) and acetonitrile (B). A gradient solvent system was used: 0-7 min, 5% - 95% (B); 7-10 min, 5 % (B) and the injection volume was 1 μL. The
major operating parameters for the Q-TOF MS were set as follows: capillary voltage 2.2 kV (-); cone voltage 40 V; cone gas flow 100 L/h; collision energy 6 eV; source temperature 120°C; desolvation
Bark from hardwood
Extraction with aqueous EtOH solutions
1. step: extraction with hexane Lipophilic componds
2. step: extraction with ethyl acetate
Low molecular weight poliphenolic compounds
3. step: extraction with aqueous EtOH solutions OPCE
One-step extraction Sequential extraction

Natural resources and bioeconomy studies 80/2017
357
temperature 650°C; collision gas argon; desolvation gas nitrogen; flow rate 9 L/min; data acquisition range m/z 50 - 2000 Da; and ionization mode negative.
Total phenolic content was determined by the Folin-Ciocalteu method using Gallic acid as a reference compound (Blainski et al. 2013). Oligomeric proanthocyanidins were quantified by the butanol-HCl method using procyanidin B2 as a reference compound (Schofield et al. 2001). The content of OPCs in OPCE is presented as a percentage based on oven dry (ovd) extract (% w/w).
Radical scavengining activity of OPCEs 2.4.The OPCEs were tested for their radical scavenging activity using the ABTS●+ assay (Baltrusaityte et al. 2007, Dizhbite et al. 2004). Free radical scavenging activity was expressed as the concentration of antioxidant, mg·L-1, required for a 50% inhibition of the free radical (IC50). The lower the IC50 value, the higher the radical scavenging activity of the compounds is. Trolox was tested as a reference antioxidant.
Antioxidant activity of OPCEs in the prevention of oxidation of 2.5.lipid-based systems
Effect of OPCEs on the oxidative stability of lipid-based system: the core compositions of mayonnaise and cosmetic cream containing no antioxidant additives were studied using the Oxipress apparatus (Mikrolab Aarhus). The lipid content in mayonnaise and cosmetic cream was 63% and 23%, respectively. The oxidative stability was determined under the optimal conditions: 20 g of the reaction mixture (corresponding to 5 g of the lipid phase), oxygen pressure of 0.5 MPa, and the temperature of 120°C. TBHQ was tested as a reference antioxidant. The lipid-based systems without antioxidants were used as a control. First, 0.01-0.4 g of antioxidant was mixed in the reaction vessel with the lipid-based substrate (5 g in terms of lipids), and then thoroughly mixed for 30 minutes under an inert atmosphere. Then the reaction vessel was filled with O2 to 0.5 MPa, placed into a furnace at 120°C, and the changes of O2 pressure depending on time were recorded. OPCEs or OPC protection factor (PF) was calculated as (1),
PF = IPx/IPc (1)
where IPx and IPc are the induction period of substrate oxidation in the presence of OPCE samples (IPx) and that of the control (IPc), respectively.
Results and discussion 3.
Optimization of OPCEs extraction 3.1.Different extraction time, temperature, ethanol concentration, and ratio of extraction solvent to raw material were investigated for the optimization of extraction regimes of OPCE from hardwood bark. The highest OPCE yield was obtained using 40% EtOH as a solvent and 30 minutes’ duration of
extraction at 80°C temperature (Fig 3). The effect of various factors on the OPCE is exemplified using the grey alder. The optimal
extraction condition established provides 87 % OPCs transition from the bark to hydrophilic extract at one-step extraction.

Natural resources and bioeconomy studies 80/2017
358
Depending on the tree species and regional needs in other biologically active natural compounds, such as lipophilic compounds or/and low molecular weight polyphenols, besides OPCE and OPCs, the sequential extraction with hexane and ethyl acetate can be used. The later approach allows providing some higher proanthocyanidins content in final hydrophilic extract, see Table 1.
Figure 3. The effect of various factors on the OPCE yield from the grey alder bark at one-step extraction: A- Yield of OPCE depending on the EtOH concentration in water; B- Yield of OPCE depending on the extraction time; C- Yield of OPCE depending on the ratio of extraction solvent to raw material.
Table 1. Effects of described extraction technique on the yields of OPCE and OPCs from hardwood bark
Hardwood tree species
Yield of final hydrophilic extract, %
on ovd bark
Content of OPCs in final hydrophilic extract, % on
ovd extract
Yield of OPCs, % on ovd bark
One-step extraction with 40 % EtOH
Grey alder (Alnus incana) 19.6±0.1 35.7±0.02 7.0±0.1
Black alder (Alnus glutinosa) 28.6±0.1 21.7±0.01 6.2±0.01
Silver Birch (Betula pendula) 14.7±0.1 27.9±0.03 4.1±0.02
Goat willow (Salix Caprea) 22.7±0.1 41.2±0.01 9.4±0.01
Sequential extraction using hexane-ethyl acetate-40 % EtOH
Grey alder (Alnus incana) 17.2±0.1 42.4±0.01 7.3 ±0.02
Black alder (Alnus glutinosa) 16.8±0.1 50.1±0.01 8.4±0.01
Silver Birch (Betula pendula) 8.2±0.1 67.7±0.02 5.4±0.01
Goat willow (Salix Caprea) 16.2±0.1 64.5±0.02 10.4±0.02
Chemical composition of OPCE from bark of hardwood trees 3.2.For identification of polyphenolic compounds representing the major part (0.60-0.70 GAE•g-1on the extract) of the extract from the bark of hardwood trees, the freeze-dried OPCEs were analysed using UHPLC-ESI-MS/MS. The dominant ingredients of OPCEs are polyphenols (including
0
5
10
15
20
25
96 80 60 40 20 Water
Yield
of O
PCE,
%
EtOH concentration, %
0
5
10
15
20
25
0 10 20 30 40 50 60
Yield
of O
PCE,
%
Extraction time, min
BA
14151617181920
6 7 10 12 14
Yield
of O
PCE,
%
Ratio of extraction solvent to raw material, mL/g C

Natural resources and bioeconomy studies 80/2017
359
proanthocyanidins) and their glycosides. The major polyphenolic compounds identified in OPCEs from alders bark were catechin, catechin dimer, catechin trimer, hydroxyoregonin, and oregonin. All these chemical compounds are biologically active and can be used as natural antioxidants, antimicrobial agents, and ingredients in the formulation of different medications.
The dominant chemical constituents in OPCE from the bark of silver birch and goat willow were low molecular weight proathocyanidins
Antioxiadant activity of OPCEs obtained from bark of deciduous 3.3.trees
The OPCEs revealed the high radical scavenging capacities in ABTS●+ test that increase with growth of OPC content in extracts. It was found that OPCs have a significant role in radical scavenging activity of hydrophilic extracts from bark. For example, the activity of OPCE with higher OPC content in the ABTS+● test with free, stable radicals was higher. The comparison with the reference antioxidant Trolox, which is water soluble derivative of E vitamin (IC50 = 4.0 mg•L-1in ABTS+● test) have shown that all OPCEs under the study is characterised with higher radical scavenging activity (IC50 = 2.2 – 3.6 mg•L-1 in ABTS+● test), see Table 2. The highest level of antioxidant activity was detected for the OPCE from bark of goat willow, that is in conformity with the high content of polyphenolic compounds (0.70 GAE•g-1) and proanthocyanidins (65 % on oven-dry extract) in the composition of extract.
Table 2. Antioxidant activity and protection factor of OPCEs obtained from hardwood bark using one-step extraction
Extract samples ABTS●+ test, IC50, mg∙L-1
Protection factor, PF
0.05 % on lipid content in mayonnaise
0.1 % on lipid content in mayonnaise
OPCE from grey alder 3.6±0.03 1.6±0.1 1.7±0.1
OPCE from black alder 3.5±0.04 1.6±0.1 2.2±0.1
OPCE from goat willow 2.2±0.02 1.3±0.1 1.6±0.1
OPCE from silver birch 3.4±0.01 1.5±0.1 1.7±0.1
Trolox 4.0±0.02 1.2±0.1 1.3±0.1
TBHQ 2.7±0.01 1.5±0.1 1.6±0.1
The antioxidant activity of the OPCEs from hardwood bark samples was evaluated by their influence on oxidation stability of the lipid-based systems (mayonnaise and cosmetic cream). The results obtained show that the hydrophilic extracts from all the bark under study are promising agents for stabilisation of lipid-based systems. All the extracts introduced into lipid-rich substrates non-containing antioxidant additives show protection activity comparable or exceeded that for the reference antioxidant TBHQ and Trolox. The protection factor (PF) of OPCEs isolated from the bark of grey alder, black alder, silver birch, goat willow introduced into mayonnaise in the amount of 0.05-0.1% of lipid content varied from 1.3 to 2 (see, Table 2). Application of the above mentioned OPCEs for cosmetic cream in the amount of 2 % of lipid content protection factor ranged from 1.8 to 2.4. The comparison of the results of oxidative stability for all OPCEs showed that OPCE from the bark of black alder characterized by the highest induction time and protection factor values.

Natural resources and bioeconomy studies 80/2017
360
Energy consumption 3.4.The energy efficiency is one of the predominate factor in any technological process. In order to reduce the required energy consumption to obtain OPCE, one-step microwave-assisted (MW) extraction was used. It was found that MW extraction allow to obtain during 5 minute the yield of OPCE from alder bark 1.6 times higher than that obtained during 30 minute conventional extraction.
Figure 4. The energy consumption and yield of OPCE from grey alder bark using conventional extraction (CE) and MW extraction
Conclussion 4. Among hardwood trees bark under study the largest yield of OPCE and content of oligomeric
proantocianidns (OPCs) in them is obtained from goat willow and silver bark; The optimal extraction conditions for obtaining of OPCE and OPCs from hardwood trees bark
in one-step extraction have been determined: 40 % EtOH as an extracting agent, 30 minute extraction at 80 ⁰C temperature.
Sequential extraction with hexane, ethyl acetate and 40 % EtOH allow, it is possible to additionally obtain lipophilic compounds and low molecular polyphenols, while ensuring providing some higher proanthocyanidins content in final hydrophilic extract.
The high antioxidant activity of OPCEs from the bark of hardwood trees effectively improve the oxidative stability of the lipids containing products ensures their perspectives as ecologically safe antioxidants.
Acknowledgements The authors gratefully acknowledge the financial support from the Latvian budget, National Research Programme “Forest and earth entrails resources: research and sustainable utilization – new products and technologies” (ResProd) Project Nr. 3 “Biomaterials and products from forest resources with versatile applicability” and grant 564/2012.
Natural resources and bioeconomy studies 80/2017
361
References Baltrušaitytė, V., Venskutonis, P.R., Čeksterytė, V. 2007. Radical scavenging activity of different floral
origin honey and beebread phenolic extracts. Food Chem. 101:502–514. Bianchi, S., Kroslakova, I., Janzon, R., Mayer, I., Saake, B., Pichelin, F. 2015. Characterization of
condensed tannins and carbohydrates in hot water bark extracts of European softwood species. Phytochemistry 120: 53–61
Blainski, A., Lopes, G.C., Palazzo de Mello, J.C. 2013. Application and analysis of the Folin Ciocalteu method for determination of the total phenolic content from Limonium brasilience. Molecule 18:6852–6865.
Dizhbite, T., Telysheva, G., Jurkjane, V., Viesturs, U. 2004. Characterizations of the radical scavenging activity of lignin – natural antioxidants. Bioresour Technol. 95:309–317.
Elgazar F. Effects of Butylated Hydroxytoluene and Butylated Hydroxyanisole against hepatotoxicity induced by carbon tetrachloride in rats. 2013. World Applied Sciences Journal 22 (1): 63–69.
Janceva, S., Dizhbite, T., Telysheva, G., Vevere, L., Krasilnikova, J., Dzenis, M. 2016. Assessment of alder trees bark potential as a renewable source of proanthocyanidins in Latvia. Mat Sci Appl. 33:26–30.
Janceva, S., Dizhbite, T., Vevere, L., Telysheva, G., Dzenis, M. 2015. Characterization of bark rich-in-tannins extracts from deciduous trees with emphasis on their antioxidant activity. IOP Conference Series: Materials Science and Engineering 111, Baltic Polymer Symposium 2015:1–4.
Kemppainena, K., Siika-ahoa, M., Pattathil, S., Giovandoc, S., Kruus K. 2014. Spruce bark as an industrial source of condensed tannins and non-cellulosic sugars. Industrial Crops and Products 52: 158–168.
Park, Y. S., Jeon, M. H., Hwang, H. J, Park, M. R., Lee, S. H., Kim, S. G., Kim M. 2011. Antioxidant activity and analysis of proanthocyanidins from pine (Pinus densiflora) needles. Nutr Res Pract. 5 (4), 281– 287.
Schofield, P., Mbugua, D.M., Pell, A.N. 2001. Analysis of condensed tannins: a review. Anim Feed Sci Techn. 91:21–40.

Natural resources and bioeconomy studies 80/2017
362
Comparison of physicochemical characterization of pretreated bamboo fibers
Ma Li1, Chu Jie1*, Zhangjing Chen2
Abstract
Pretreatment is a critical step in the conversion of lignocellulose to fermentable sugars. Here, present raw bamboo pretreatment with acid, alkali and glycerol at 117°C and 135 °C for 1h. Additionally, the structural features of the pretreatment samples and the native sample were characterized and compared using a set of spectroscopy and wet chemistry methods including, XRD, and TGA. The results showed that the holocellulose and cellulose yields increased significantly and that the lignin removal rate was better for dilute alkali (NaOH) pretreatment than for dilute acid (H2SO4) and glycerol pretreatments; Furthermore, for the same solutions, the compositional changes were more remarkable at 135 °C than at 117 °C, and the similar degradation of hemicelluloses was observed for different processing. And with sodium hydroxide at 135 °C, as shown by the 30.18% increase of cellulose and by 3.25% decrease of hemicelluloses in the average ratio relative to native bamboo, and the removal of lignin reaches to 17%. Moreover, the pretreatment in sand bath than that of water bath in same processing time.
Keywords: Bamboo, Chemical pretreatment, X-ray diffraction, TGA
Introduction 1.Pretreatment is a critical step in the enzymatic conversion of lignocellulosic substrate to sugars (Zhao et al. 2012; Xie et al. 2015). In order to obtain greater efficiency of saccharification, a lot of research is to realize the reservation of cellulose and hemicellulose, maximum limit in addition to lignin, This is because cellulose reacts by hydrolysis to produce glucose in the catalysis of strong acid, and there is a lot of sugar, such as ribose, xylose, galactose, and mannose in addition to glucose in hemicellulose. However, pretreatment of biomass is much more complicated, and therefore, the influence of composition changes and the effect of pretreatments on the obtained functional groups and crystallinity should be further investigated. In addition, the lignocelluloses consist of complex structures including cellulose, hemicelluloses, lignin, and a small amount of extract (Shishir et al. 2011; Zhou et al. 2004; Merino-Pérez et al. 2014). The pretreatment solution and treatment temperature have an important effect on the variation of the content of each component. Due to the importance and high cost of the pretreatment process and the chemical conversion of functional groups, the change of the crystallinity and cellulose molecular weight during pretreatment will be subject to increasing attention from researchers in the future.
Based on the current pretreatment processing technology, Jiang studied the development of bamboo cellulose crystallinity changes using X-ray diffraction (Nguila et al. 2011) The results obtained by Jiang and Ren agree with intensity changes of the X-ray diffraction of bamboo fiber; Abdulkhani et
* Corresponding author: E-mail: [email protected]
1Northwest Agriculture & Forestry University
Shan’xi Yang ling 712100, China
2Department of Sustainable Biomaterials
Virginia Tech University 1650 Research Center Drive
Blacksburg, VA 24060

Natural resources and bioeconomy studies 80/2017
363
al.2014 studied the trends in the bamboo crystal area changes after alkali treatment and found that these differed from the trends obtained in previous studies, with the fiber crystallinity changes of bamboo first increasing and then decreasing (Abdulkhani et al.2014). Wang suggested that the two important factors leading to the worse performance of bamboo are high crystallinity and the orientation structure; additionally, she found an effective method for using alkali treatment of bamboo to quickly reduce the bamboo crystallinity index. R.C.Sun et al.2010 provided pretreated bamboo to isolate cellulose for the further utilization of bioethanol (Li et al. 2010).
Among the representative technologies for the pretreatment of wood biomass, some researchers indicated the digestion absorption rate (92.7-93.5%) of the bamboo structure after different pretreatments with acid, alkali and sulfate (Xin et al. 2015 ); D.S. and Eric. M et al. studied the chemical composition changes due to bamboo pretreatment (DS et al. 2013; Karp et al. 2015); Fei and Jiang showed that the application of dilute organic acids in the pretreatment of bamboo can be effective and clearly influenced the cell-wall structure and enzymatic digestibility of bamboo (Li et al. 2013); Li and Jiang also showed that the pretreatment of bamboo with the same sodium hydroxide loading at higher pretreatment temperature led to greater hemicellulose and lignin removal. These investigations showed that alkali pretreatment of bamboo is a more effective way to Improve hydrolysis than other approaches used in the production of bioethanol and other fields (Li et al. 2014). However, to the best of our knowledge, less attention has been focused on the chemistry and molecular structure changes, with fewer studies on the mechanism causing the changes of the chemical composition of lignocellulosic biomass materials after chemical treatment. Nevertheless, a considerable amount of research has been performed on bamboo cellulose fermentation and the saccharification process under the condition of alkali treatment in the past few years. To the best of our knowledge, there are few results on cellulose crystallinity size changes (Himmel et al. 2007).
The objective of the study was to optimize the pretreatment reaction conditions with three different solutions as major solvent component. At the same time, the heating equipment with sand bath to pretreat the bamboo. According to changes of the functional groups and the mechanism of the chemical pretreatment of wooden biomass resources, further reveal the rules governing the compositional changes found after the application of the different chemical treatment methods.
Materials and methods 2.
Materials 2.1.The bamboo powder sample (Phyllostachys heterocycla) was acquired from USDA Forest Service, Southern Research Station in Pineville, USA, in the summer of 2015. Prior to chemical pretreatment, air-dried bamboo was milled using a hammer mill with a screen opening size of 1.0 mm. The average moisture content of the ground air-dried bamboo was 6.18% (wt). The bamboo was sealed in a zipper-lock bag and kept at 4 ºC in a refrigerator until use.
H2SO4, NaOH, NaClO2, glycerol, toluene, methanol, ethanol, and glacial acetic acid were used; these were purchased from Fisher Scientific (Pittsburgh, PA) and used as received. Pretreatment equipment mainly included the electronic sand bath pot and thermometer produced in JAMs experimental equipment factory (USA). Pretreatment processing
Samples were obtained by different processing methods, with the processing parameters and processes shown in Fig. 1.
Fig.1 illustrate the pretreatment processing of six bamboo samples, including native sample, the sample treated by sulfuric acid at 135 ℃(SA135) and at 117 ℃(SA117), the sample treated by alkali at 135 ℃(SH135) and at 117 ℃(SH117), and the sample treated by glycerol at 117 ℃(GL117),and 2g samples were put into high pressure reaction kettle in sand bath for 1 h, sand bath, the reaction

Natural resources and bioeconomy studies 80/2017
364
temperature of sand by the temperature controller(Fig. 2) ,then the pretreated samples were cool, drying and weighting.
Figure 1. Scheme for the preparation of samples and cellulose, hemicelluloses, and lignin. The Native is original bamboo; The SH117 sample is pretreated with sulfuric acid at 117 ℃; The SH135 sample is pretreated with sulfuric acid at 135 ℃; the SA 117 sample is pretreated with Alkali at 117 ℃; The SA135 sample is pretreated with alkali at 135 ℃; The GL117 sample is pretreated with glycerol at 117 ℃.
Measurements 2.2.Chemical analysis The moisture content of the bamboo samples was measured by drying in an oven for 24 h at 105 ± 2 °C. The holocellulose and cellulose contents of the samples were determined using a Soxhlet extractor. An electric muffle furnace (programmable ramping) was used to determine the ash in the
samples of bamboo. The lignin content of unpretreated and pretreated bamboo was determined according to the National Renewable Energy Laboratory (NREL) Analytical Procedure: Determination of the structural carbohydrates and lignin in biomass.15 Each test was performed for three parallel samples at the same time, with the average used as the measured value.(Xie et al.,2014)
The bamboo samples were evaluated in accordance with ASTM D1105-96 (ASTM 1996) and ASTM D-1102-84(ASTM 1990) Each evaluation was performed twice.
Analysis of crystallinity by X-ray diffraction (XRD)
The crystallinity of the samples was determined by X-ray diffraction (XRD) using Rigaku Ultima3 x (Louisiana State University, USA) with the scanning parameters of Ni-filtered Cu K α radiation(λ= 1.54060).
Thermo gravimetric analysis
Thermo gravimetric analysis (TG/DTG) of the native bamboo and pretreated bamboo was conducted using a thermal analyzer, TGA Q50, to simultaneously obtain the thermo gravimetric data. Approximately 2 mg of sample was used for the TG/DTG analysis. The samples were heated to 600℃ under a flow of 60 ml/min of nitrogen gas with a heating rate of 20℃/min.

Natural resources and bioeconomy studies 80/2017
365
Figure 2. Reaction temperature of sand bath controller
Results and discussion 3.
Changes in the chemical composition of pretreated bamboo 3.1.Fig.3 shows the main chemical components obtained for different pretreatment conditions. The holocellulose content decreases in the order of SH135 > SH117> SA135 > SA117> GL117 > NA; the cellulose content change decreases in the order of SH135 > SH117 > SA117 > SA135 > GL117 > NA; the amount of lignin removal decreases in the order of SH135 > SH117 > SA135> > SA117 > GL117 > NA; and the degree of hemicellulose degradation decreases in the order of SH135 > GL117 > SA117 > SA135 > SH117.
Figure 3. Main chemical components obtained with the use of different pretreatment conditions

Natural resources and bioeconomy studies 80/2017
366
Comparison of pretreatments with sodium hydroxide and 3.2.sulfuric acid
The results obtained by pretreatment with sodium hydroxide are much better than those obtained after sulfuric acid pretreatment at both 117°C and 135°C; in particular, the cellulose yield showed a clear increase after the sodium hydroxide pretreatment at 135°C, with a 29.6% higher average ratio than that of the native material. However, pretreatment with glycerol was found to be not ideal. A remarkable lignin removal effect was also observed for the sodium hydroxide pretreatment at 117 ° C, with the average removal rate reaching 14.69%.
Analysis of the bamboo samples by XRD 3.3.According to the diffraction spectroscopy characteristics of bamboo fiber, the 002 peak and the 004 peak indicate the length and width of the cellulose crystal area, respectively. In most cases, the 040 peak is not obvious, and we therefore calculated the diffraction intensity and position of the 002 peak to discuss the changes in the cellulose crystallization area. We use the Scherer formula (Segal 1959 ) to calculate D, d and CrI as follows.
D=(k · λ)/(Bhkl · cosθ) (1); d=λ/2sinθ (2); C r I =(I002 − Iam)/I002×100% (3)
where D is the length or width of the crystalline region;D is the crystal layer spacing (nm);λ is the incident wavelength(0.154 nm); B h k l is the diffraction peak half width; θ is the diffraction
angle; and K is diffraction constant,0.89. CrI is the relative degree of crystallinity(%), I002 is the great strength of the 002 diffraction
angle, and I a m is the background diffraction scattering intensity when 2θ is equal to 180º. Based on the 002 crystal crystallization index and Eqns. (1), (2), and (3), the crystallization
parameters can be obtained for different pretreatment conditions (Table 1).
Table 1. Crystal Values of sample of native pretreated bamboo
Sample Pretreated temperature (℃) 2θ C r I(%) D(nm) f d(nm)
Native ---- 21.9622 50.9183 3.301137 2.46376 0.404882
SA135 135 22.4817 46.6676 3.303459 2.1299 0.396294
SA117 117 22.2089 42.6309 3.302315 2.03897 0.399813
SH135 135 22.3617 48.4235 3.303224 2.27287 0.396969
SH117 117 22.1914 40.5003 3.302214 1.82029 0.400104
GL117 117 22.2853 38.0931 3.302753 2.62202 0.398448
Table 1 showed the change of the crystalline region width D. The width of the crystalline region increases after different pretreatments, showing that the grain size of the crystalline region decreased. Examination of the data shows that the rate of change rate is significantly higher for pretreatment at 135 ℃ than at 117 ℃. However, no obvious differences were observed between the SA135, SH135, SA117 and SH117 samples. This indicated that the pretreatment temperature has a stronger influence on the grain size of the crystalline region. After glycerol pretreatment, a significantly smaller grain size was found.
Obtaining the fine grain structure is the most effective approach for improving the strength and toughness of bamboo, therefore, the improvement of the degree of crystalline parameters through chemical heat treatment has important implications for the enhanced use and performance of bamboo.

Natural resources and bioeconomy studies 80/2017
367
The change of the half peak width (f) of the crystalline region indicated the grain size of the crystalline region: a smaller peak width(f) implies that the grain size is smaller as well (Nishimiya et al. 1998; Inari et al. 2007). It further illustrates the change of the crystalline region grain size. The half peak width (f) is lower for pretreatment at 117 ℃ than at 135 ℃; this is especially pronounced for treatment with alkali at 117℃, where the half peak width of the crystallization area is minimum, showing that alkali treatment will be the most effective approach for obtaining tiny crystalline bamboo particles.
The changes of the crystalline region layer spacing (d), with the layer spacing dimension exhibited a trend of significant decrease after pretreatment and a more obvious concentration at 135 ℃ compared to that at 117 ℃. Investigation of the origin of this effect showed that adsorption on the cell walls of bamboo was gradually enhanced and that the oligosaccharide in the crystalline region of cellulose surface molecular chain was dissolved (Yang et al. 2008); due to the interaction between hemicelluloses and a weak base, a peeling reaction may occur, leading to decreased layer spacing ( Foreman et al. 1993).
Analysis of various crystallization parameters of the different 3.4.pretreatments
Six different test samples were prepared based on the use of different alkali and glycerol media and heating temperatures; XRD scans showed obvious changes of the 002 peak position and intensity (Fig. 4). X-ray diffraction patterns of pretreatment and native bamboo in (1),and Layer spacing variation for the 002 crystal plane diffraction peak (2).
Examination of Fig. 4(1) shows that the angle of diffraction (2θ), that is, the position of the 002
crystal plane diffraction peak, changed significantly, and the peak exhibits an obvious offset after different pretreatments. This phenomenon shows that the lattice parameters of the crystalline region and the interplanar spacing decrease (Foreman et al. 1993; Mansfield et al. 1999; Liu et al. 2008 ). The effect of the chemical pretreatment is beneficial, as the decreased bamboo crystal spacing improves the dimensional stability of bamboo and provides a strong reference value for composite processing. These results are consistent with previous research (Hagedorn et al. 2003; Tamura et al. 2003). The change rate of chemical pretreatment at 135 ℃ is significantly higher than that at117 ℃.
As shown in Fig. 4(2), the 002 peak is high and sharp, with the degree of crystallinity increasing significantly after pretreatment. The trend of a first reduced and then increased intensity, motivating the present research to achieve a consistent increase of crystallinity of pretreated bamboo. Bamboo crystallinity declined at 117 ℃; however, the diffraction peaks become sharp; when the temperature rose to 135 ℃, the diffraction peaks increased gradually. The results showed that after pretreatment with sulfuric acid at 135 ℃, the bamboo crystallinity fell by 5% and the relative crystallinity increased by 3%; by contrast, the bamboo crystallinity fell by 15% and the relative crystallinity increased by 9% after pretreatment with alkali at 135 ℃; after heat treatment, the crystallinity increased and the most obviously decreased pretreatment was with glycerol, where two irregular peaks appeared near the 040 peak; the elucidation of the reason for this effect requires further study.
Due to the stronger cell wall adsorption, following the alkali pretreatment for bamboo, the oligosaccharide in the crystalline region of the cellulose surface molecular chain is dissolved and the reactive amorphous zone reactive is exposed. Moreover, the interaction between hemicellulose and a weak base led to decreased crystallinity because of the swelling of the cellulose matrix and the increase in the amorphous area (Yang et al. 2008). Similarly, this led to a relative reduction in the shaped area of the cellulose, making an additional contribution to the further decrease of crystallinity. Hemicelluloses of bamboo hydrolysis are used to produce acetic acid involving the degradation of microfibrils in the amorphous region and in the setting area of cellulose (Yang et al.

Natural resources and bioeconomy studies 80/2017
368
2007) for the pretreatment temperature of 135℃, resulting in the decrease of the cellulose crystallinity.
Additionally, the density of the bamboo crystalline region increased after pretreatment that caused the enhancement of the diffraction peak.
Figure 4. X-ray diffraction patterns of pretreatment and native bamboo (1),and Layer spacing variation for the 002 crystal plane diffraction peak (2) (a.GL117;b.SH117;c.SH135;d.SA117;e.SA135;f.Native)
Thermo gravimetric analysis 3.5.The DTG curves of the native bamboo and pretreated samples are shown in Fig.5. While the DTG curves of the native and pretreated samples were recorded to comparatively characterize their thermal properties to distinguish the thermal degradation characteristics at different temperatures, all of the sample are listed and their characteristics are compared. Significant differences were also found for the sharp peaks corresponding to the maximum degradation rates in the DTG curves for all of the samples, as shown in Fig.5. The DTG curves for SA135 and SH135 showed higher degradation rates and lower maximum degradation rate temperatures compared to those obtained with higher temperatures/longer reaction times. Native bamboo exhibited intermediate values of the maximum degradation rate and temperature. This is consistent with recent studies (Xie et al. 2014). During the different pretreatment of samples, degradation temperatures of 279℃ and 310℃ were obtained for SA135 and SH135, respectively; these are lower than the 346℃ value for native bamboo. Based on the findings of Yang et al. (2007) that the main decomposition of commercial hemicelluloses and cellulose occurred in the 220–315 ℃ and 315–400 ℃ ranges and that the mass losses occurred in the 300–420℃ range, possibly due to the degradation of lignin, these differences in the degradation rate observed in this work are largely due to the differences in chemical components between the native bamboo and residue samples. This shows that the hemicellulose and cellulose compositions are relatively larger for thermal degradation at low temperatures after pretreatment with acid and alkali; there is a greater amount of lignin in native bamboo, Thermal degradation occurred in order, from lowest to highest, at 279℃(SA135) >310℃(SH135) >312℃(SH117) >325℃(SA117) >330℃(GL117) >346℃(Native). The higher weight loss for GL117 at 330℃ requires further investigation.
1 2

Natural resources and bioeconomy studies 80/2017
369
Figure 5. DTG curves for samples of pretreated and native bamboo. The SA117 sample is pretreated with sulfuric acid at 117 ℃; The SA135 samples is pretreated with sulfuric acid at 135 ℃; The SH117 sample is pretreated with Alkali at 117 ℃;The SH135 sample is pretreatment with alkali at 135 ℃; The GL117 samples is pretreated with glycerol at 117 ℃;Native bamboo is maintained in its original state.
Conclusions 4.Comparison of the hemicellulose degradation degree and rate of lignin removal obtained shows that the yield of cellulose is increasing; for the lignin removal efficiency after different pretreatments, the effect of pretreatment with sodium hydroxide is relatively better than that with sulfuric acid under the same conditions, with an obvious enhancement of cellulose output with sodium hydroxide at 135 °C, as shown by the 30.18% increase in the average ratio relative to native bamboo, the removal of lignin reaches to about 17%. Investigations of the cellulose depolymerization behavior in the pretreatment shows that the DP values are relatively low for all pretreatments, despite the DP cellulose rich scores to extend the time of ultrasonication. The yield of holocellulose and cellulose increased significantly after pretreatment, with a stronger effect observed for dilute alkali (NaOH) than for dilute acid (H2SO4) and glycerol (glycerol). The DT showed that successive pretreatments resulted in a partial removal of carbohydrates and lignin. XRD, results present the same trend in the degree of heat transfer and crystallization for all the samples.
Acknowledgments Open access funding provided by Natural Science Foundation of China (Grant No 31270622) and Natural Science Foundation of Shaan xi province in China "Research on wood bioresources for low carbon economy" (Grant No 2014K02-12-04).
Natural resources and bioeconomy studies 80/2017
370
References American Society for Testing and Materials (ASTM) Standard Test Method for Ash in Wood. ASTM D-
1102-84. American Society for Testing and Materials: Philadeliphia, U.S.A.1990 American Society for Testing and Materials (ASTM) Standard Test Method for Acid-Insoluble Lignin in
Wood. ASTM D-1105-96. American Society for Testing and Materials: Philadeliphia, U.S.A. 1996 D Xin, Z Yang, F Liu, X Xu, J Zhang (2015) Comparison of aqueous ammonia and dilute acid
pretreatment of bamboo fractions:struture properties and enzymatic hydrolysis . Bioresour. Technol 175:529-536
Eric M. Karp, Michael G. Resch, Bryon S. Donohoe (2015) Alkaline pretreatment of switchgrass. ACS Sustain. Chem. Eng 3 (7):1479–1491
Foreman, D. W., Jakes, K. A (1993 ) X-Ray Diffractometric Measurement of Microcrystallite Size, Unit Cell Dimensions, and Crystallinity: Application to Cellulosic Marine Textiles. Text Res .J 63 (8):455-464
GN Inari, M Petrissans, P Gerardin (2007) Chemical reactivity of heat-treated wood. Wood Science and Technology 41(2):157-168
Himmel, M. E.; Ding , S. Y.; Johnson, D. K.; Adney, W. S.;Nimlos, M. R.; Brady, J. W.; Foust, T. D (2007). Biomass recalcitrance: Engineering plants and enzymes for biofuels. Prod, Sci 315:804−807
J Xie, CY Hse, TF Shupe, J Qi (2014) Liquefaction behaviors of bamboo residue samples in a glycerol‐based solvent using microwave energy. J Appl Polym Sci 131(9):40207
J Xie, CY Hse, TF Shupe, T Hu (2015) Physicochemical characterization of lignin recovered from microwave-assisted delignified lignocellulosic biomass for use in biobased materials. Appl. Polym. Sci 132(40):42635
K Nishimiya, T Hata, Y Imamura, S Ishihara (1998) Analysis of chemical structure of wood charcoal by X-ray photoelectron spectroscopy. Journal of Wood Science 44(1):56-61
Li, Z., Yang, Q., Jiang, Z., Fei, B., Cai, Z., and Pan, X (2014) Comparison of bamboo green,timber and yellow in sulfite,sulfuric acid and sodium hydroxide pretreatments for enzymatic saccharification. Bioresour. Technol 151:91-99
Mansfield, S.D., Mooney, C., Saddler, J.N (1999) Substrate and enzyme characteristics that limit cellulose hydrolysis. Biotechnol. Progr 15:804–816
Muller-Hagedorn, M.; Bockhorn, H.; Krebs, L.; Muller, U (2003) A comparative kinetic study on the pyrolysis of three different wood species. J.Anal. Appl. Pyrolysis 68/69:231-249
N. Tamura, A. A. ;MacDowell, R.; Spolenak, B. C.; Valek, J. C.; Bravman, W. L. ;Brown, R. S.; Celestre, H. A.; Padmore, B. W. Batterman and (2003) Scanning X-ray microdiffraction with submicrometer white beam for strain/stress and orientation mapping in thin films.J. Synchrotron Rad 10:137-143
Segal L, Creely JJ, Martin AE Jr, Conrad CM (1959) An empirical method for estimating the degree of crystallinity of native cellulose using the X-ray diffractometer. Text Res J 29:786– 794
Shao S.L.liu Shao, G.F Wen, Z.F. Jin (2008) Changes in chemical characteristics of bamboo (Phyllostachys pubescens) components during steam explosion. Wood Sci.Technol 42:439–451
Shishir P.S. Chundawat,, Gregg T. Beckham, Michael E. Himmel, Bruce E. Dale (2011) Deconstruction of Lignocellulosic Biomass to Fuels and Chemicals. Chem. Biomol. Eng 2:121-145
Yang, H.P, Yan, R., Chen, H.P., Lee, D.H., Zheng, C.G.( 2007) Characteristics of hemicellulose, cellulose and lignin pyrolysis. Fuel 86:1781–1788
Y Zhao, N Yan, M Feng (2012) Polyurethane foams derived from liquefied mountain pine beetle-infested barks .Appl. Polym. Sci 123(5):2849–2858
Z Yang, S Xu, X Ma, S Wang (2008 ) Characterization and acetylation behavior of bamboo pulp. Wood Science and Technology 42 (8):621-632
Zhang, D.S., Yang, Q., Zhu, J.Y., Pan, X.J ( 2013) Sulfite (SPORL) pretreatment of switchgrass for enzymatic saccharification. Bioresour. Technol 129:127–134

Natural resources and bioeconomy studies 80/2017
371
The properties of wax impregnated birch wood Juho Peura, Olli Paajanen*, Hannu Turunen
Mikpolis Research Unit South-Eastern Finland University of Applied Sciences
Mikkeli, 50100, Finland
Abstract
Wax impregnation is modification technique that is used for improving the properties and performance of various wood products, especially in applications demanding high durability. A research project focused on wax modification was conducted in the South Eastern University of Applied Sciences in Mikkeli, Finland. A new piece of modification equipment was built as a part of the research project. A series of tests were conducted where silver birch (Betula Pendula) was used as the raw material. The aim was to protect all surfaces against moisture ingress. After the wax impregnation process the specimens were tested using water soak tests and dimensional stability tests. The test series provides information about the properties of birch wood in a wax impregnation process. According to the results, a consistent wax layer prevents the water absorption effectively.
Introduction 1.Wax impregnation is a technique used to improve the properties of wood products. As the wood-water relationship affects the behavior of wood in many situations and applications, reducing the uptake of water can bring many benefits. High melting point waxes are often used to reduce the water uptake in wood products. There are many wax types that are classed as high melting point waxes. For instance, in a study by Scholz et al. (2010) Scots pine (Pinus sylvestris L.) and beech (Fagus sylvatica L.) were impregnated with five different waxes. It was found that while pine sapwood was impregnated thoroughly, the lateral wax penetration within beech was found to be quite low and irregular. Besides wood species, the impregnation results depend on the wax type as well as the process temperature and duration. Chau et al. (2015) concluded that treatments with paraffin wax emulsions decreased the equilibrium moisture content as well as the moisture absorption rate of wood. This affected the swelling properties. Lesar and Humar (2010) studied how several wax emulsions affect sorption and decay properties of impregnated wood and concluded that the wax emulsions have potential to be used for wood protection in less hazardous outdoor applications. The Montan wax emulsion reduced water uptake. Also, it was found that while some of wax emulsions slow the decay down considerably, staining is not prevented. Waxes can also be mixed with other treatment agents. While the wax treatment protects the wood by reducing water uptake, the UV durability can be improved by adding pigments in the impregnant. The leaching of chemicals is often a problem in the use of impregnated or modified wood products. Wax processes can be combined with other treatments with the aim of reducing the leaching of impregnates. One such example is boron, which improves the biological durability of wood. Lesar et al. (2009) found that montan wax combined with boron improved both the protection against decay as well as reduced the leaching. Humar et. al (2016) found that a process combining both wax and heat treatments had a synergetic effect on the wood properties. In the study presented in this paper, silver birch (Betula pendula) specimens were impregnated with wax at two temperatures. After processing, the specimens were subjected to water soak tests.
* Corresponding author: Tel.: +35840 6210 477; E-mail: [email protected]

Natural resources and bioeconomy studies 80/2017
372
Materials and methods 2.In this study, silver birch (Betula pendula) specimens were impregnated with a petroleum based microcrystalline wax. The wax has a trade name Sasolwax SW1800 and it is a commonly used e.g. in candle manufacturing. The wax has a melting point of 80 °C and congealing point of 68...73°C. A black pigment was mixed in the wax. The pigment was a candle colouring agent and it contains charcoal black. 1 % of pigment was used in the mixture. Two different impregnation processes were conducted using the wax. The processes were done at temperatures of 120 and 160 °C. Untreated birch was used as reference. The specimen size was 300 mm x 80 mm x 18 mm. Three replicates were prepared for each test and the specimens were cut from different boards. The test specimens were processed together with a larger batch of test materials. The device used for the treatments is a pilot scale wood modification reactor, which was acquired in 2015 to Mikkeli University of Applied Sciences (the previous name of the South-Eastern Finland University of Applied Sciences). The impregnation chamber is 380 mm in diameter and the maximum specimen length is 2200 mm. The device can be used for pilot scale tests, as relatively large products fit in the chamber. Maximum operating temperature is 200°C, maximum pressure in nitrogen atmosphere is 11 bar and 15.5 bar with air. There are two cylinders, one is for storing treatment chemicals and the other is used for the actual treatment process. Temperature and pressure in both cylinders are controlled separately. Heating and cooling of the cylinders is managed using a separate temperature control units. The equipment can be utilized with many different kinds of processes, from drying and heat treatment to various impregnation and modification techniques. The wax specimens were treated using to two processes utilizing the impregnation principle patented by Rüping (1902). The parameters for the first process were 120 °C, pressure of 8 bars and 1 hour pressure period. The second process was done in higher temperature of 160 °C, slightly higher pressure of 9 bars and 1 hour pressure period. After the treatment, there was excess wax left on the surfaces of the specimens and they were heated and cleaned. After the treatment process, the specimens were subjected to a water absorption tests. The tests were adapted from two standards. Some changes were made due to e.g. scheduling constraints. Also the specimen size was larger, as the aim was to use the same specimens also in a natural weathering test EN 927-3 (2012). The first test setup was based on the standard EN 927-5 (2007). In the standard, only one face of the specimen is tested and the remaining sides are carefully sealed using e.g. a lacquer. As the wax treatment aims to protect the product from all sides, the sealant was not used. The specimens were stored in 20 °C RH 35 for several weeks before testing. The weights of the specimens were measured before testing and after soaking them in water for 48 and 120 hours. During soaking, the specimens floated freely in water. After the soaking test, the specimens were immersed under water to study their behavior under extreme conditions. The specimens were kept immersed using weights. EN 317 is a standard for testing wood based panels. In the standard the immersion times are specified according to product types, however in this case, 48 h was deemed sufficiently long, considering the preceding soaking. The dimensions and weights of the specimens were recorded before the soaking test and after the immersion test. Also, in this test, the specimen size was non-standard.

Natural resources and bioeconomy studies 80/2017
373
Figure 1. Penetration of wax in specimens, from the left 120 °C and 160 °C
Results and discussion 3.Measured after the post process cleaning stage, the average weigh percent gain was similar in both treatment processes, 20.6 % and 20.7 % respectively. The initial moisture content of the specimens before processing was 8...9 %. Figure 1 shows the cut specimens after testing. The specimens have been first cut in half from the middle. Some water has been spread on the cross section surfaces, which highlights the wax penetration depth. The lighter coloured specimens on the left are from the 120 °C process. The cross section cuts show that the wax has penetrated several millimeters into the wood. From the ends of the specimens, the longitudinal wax penetration is several centimeters, although it is poorly visible from the picture. The depth of penetration was comparable to previous research, for instance Scholz et. al. (2010).
The results of the tests are shown in next figures. Table 1 show the weight changes during the tests and Figure 2 shows the relative water absorption. The test results show that the wax coating prevents water absorption effectively. After soaking the test pieces for 48 the average weight increase of the wax specimens from 120°C process was 1.2 % and for the 160°C process 1.5 %. The average weight increase for the reference was 37.2 %. After the final 4 day immersion in water, the average weight increase of the wax specimens from 120°C process was 5.4 % and for the 160°C process 6.7 %. The weigh increase of the reference was 64.8 %.
Table 1. The results from water uptake tests, the average weight change percentage at different stages
SW1800 (120°C) SW1800 (160°C) Reference average min/max average min/max average min/max
Density after treatment kg/m3 719.1 686/759.5 707.9 678.6/762.2 623.4 558.6/686.3
Mass change after soaking
48 h % 1.2 1.0/1.2 1.5 1.3/1.6 37.2 26.8/47.2
Mass change after soaking
120 h % 2.8 2.1/3.3 3.2 2.9/3.6 46.7 34.3/59.7
Mass change after
immersion 96 h
% 5.4 4.3/6.1 6.7 6.0/7.5 64.8 59.6/74.8

Natural resources and bioeconomy studies 80/2017
374
Figure 2. The relative water absorption of the specimens: average, maximum and minimum values
Figure 3. Dimensional changes or swelling of the specimens after immersion: average, maximum and minimum values
The relative water absorption is presented in Figure 2. The results show again the major difference between the waxes treated specimens and reference. The dimensional changes after water immersion are in the Figure 3. The swelling results were in line with the water absorption tests. When there is consistent wax coating and penetration, the dimensional changes are small.
Conclusions 4. The wax treatments reduced the water absorption significantly compared to the reference. The results were quite similar compared to previous wax impregnation researches with other wood species. The wax treatments reduce both the water uptake and swelling. This may have positive implications e.g. when other treatment substances are combined in the process. The wax coating protects the surface of the test specimen well, if the wax layer is consistent. Therefore products should be treated in their final form and the surface quality must be acceptable. Further processing may reduce the thickness of the coating. When analyzing the results from wax treatment experiments, the quality of the final product must also be considered. For instance, a thick layer may be preferable to prevent the water ingress, but the products must also be visually presentable. The

Natural resources and bioeconomy studies 80/2017
375
impact of the higher process temperature on the mechanical properties was not included in this study. However, the specimens will be subjected to outdoor weather testing in the future.
The choice of specimen size is always a compromise. The relatively large specimens used in these tests provide results that are close to the actual products. The downside is that a large batch of impregnant is needed for the process, and the specialized equipment must be available. On the other hand, the process itself is comparable to a possible industrial scale device and it is possible to produce materials also for other tests from the same run, in this case specimens for outdoor testing. One conclusion from the wax treatment tests is that pilot scale process development takes time and repeated tests are often needed until the process runs satisfactorily and all practical issues are solved.
Acknowledgements The equipment used in this study was funded by European Regional Development Fund through South Savo Regional Council and the companies involved in two projects; South-Eastern Finland University of Applied Sciences, Hexion Oy, Karelia-Ikkuna Oy, Kurikka-Timber, Lieksan Saha Oy, Stora Enso Wood Products Oy Ltd and Tehomet Oy.
References Chau, T., Ma, E., and Cao, J. 2015). Moisture adsorption and hygroexpansion of paraffin wax emulsion-
treated southern pine (Pinus spp.). BioResources 10(2): 2719-2731. EN 927-3. 2012. Paints and varnishes. Coating materials and coating systems for exterior wood. Part 3:
Natural weathering test. EN 927-5. 2007. Paints and varnishes. Coating materials and coating systems for exterior wood. Part 5:
Assessment of the liquid water permeability. EN 317. 1993. Particleboards and fiberboards, determination of swelling in thickness after immersion. Humar, M., Kržišnik, D., Lesar, B., Thaler, N., Ugovšek, A., Zupančič, K., and Žlahtič, M. 2016. Thermal
modification of wax-impregnated wood to enhance its physical, mechanical, and biological properties. Holzforschung, 71(1): 57-64
Lesar, B., Kralj, P., & Humar, M. 2009. Montan wax improves performance of boron-based wood preservatives. International Biodeterioration & Biodegradation, 63(3), 306-310.
Lesar, B. and Humar, M. 2010. Use of wax emulsions for improvement of wood durability and sorption properties. European Journal of Wood and Wood Products, 69(2), pp.231-238
Rüping M.. 1902. U.S. Patent No. 709,799. Scholz G., Krause A., and Militiz H. 2010. Exploratory study on the impregnation of Scots pine sapwood
(Pinus sylvestris L.) and European beech (Fagus sylvatica L.) with different hot melting waxes. Wood Science and Technology 44(3): 379-388.

Natural resources and bioeconomy studies 80/2017
376
Industry and field visits

Natural resources and bioeconomy studies 80/2017
377
Raute Corp. Raute is a technology and services company that serves the wood products sector worldwide. Raute is a part of the wood-processing value network by providing the wood products industry with veneer, plywood and LVL (Laminated Veneer Lumber) production processes and the services required for using and maintaining them.
The company is the global market leader in its largest customer sector, the plywood industry. Raute’s position in the LVL industry is particularly strong: more than half of the LVL manufactured in
the world is produced on machines supplied by Raute. Raute is a financially sound Small Cap company with a strong family background. Raute’s net
sales on 2016 were 113MEur and operating profit 8.6MEur. The company’s series A shares are listed
on Nasdaq Helsinki Ltd Raute has over 650 professionals around the world in ten countries. Raute's production plants
are located in Nastola, Finland, Vancouver BC, Canada and Shanghai, China. The company's sales and services network has a global reach.
Raute’s R&D is mainly done in the headquarters in Nastola Finland. Permanent strength of
technology organization is around 40 people and Raute co-operates with universities and SME’s
which will provide supplementary resources and knowhow for the development projects.

Natural resources and bioeconomy studies 80/2017
378
Curly birch (Betula pendula var. carelica) timber size plantation, Nastola, Lahti This point is hosted by Visaseura ry (Finnish Curly Birch Society) Speaker: Antti Sipilä, Head of Degree Programme, HAMK - Häme University of Applied Sciences Forest owners: Mrs. Liisa Vuorikko and Mr. Harri Villanen
Curly birch produces highly decorative, curly-grained and brown figured wood. It is the most highly-prized variant of native tree species in the Nordic countries. Its stem form can vary from crooked multi-stemmed bushes to straight single-stemmed trees. Considerable improvement in stem and wood quality and growth rate have been achieved by tree breeding, followed by seed orchard seed production and clonal propagation of plants since the 1980s.
Timber size plantation and wood characteristics of curly birch are demonstrated at this point. The age of the stand is 23 years. The area of the stand is 0.6 ha.
The stand originates from genetically improved seed orchard seed (orchard no 353). One-year-old, 30 cm long containerized seedlings were planted in the area in spring 1996. Before planting, the site was prepared by patch scarification. The plantation was fenced with 2-meter-high chicken wire-netting and the seedlings were protected against voles with 20 cm tube-like shields.
Branch pruning has been carried out annually since the age of 5 years. Normal silver birches have been removed since the age of 11 years. Normal silver birches are those which have not inherited the curly-forming gene, normally one third of the stock. The first thinning of curly birches was carried out in winter 2015, when small trees and trees with low quality were removed. The thinning produced 2000 kg of usable timber. In order to guarantee favourable development of the stand, next thinning will be carried out within next 3 years, and thinnings will be repeated every few years until the final cutting after 20-25 years.
Management of curly birch stands requires special expertise, significant effort and economic contribution from the forest owner. By now, the estimated total cost for management of this stand has been 12 500 €. The owners aim at revenue of 100 000 €, which would require a harvest of 20 000
kg timber suitable for turning and 20 000 kg of small-sized wood.
Curly birch plantation. Photo: Antti Sipilä

Natural resources and bioeconomy studies 80/2017
379
Koskisen Ltd. Koskisen Ltd. has been a recognized and international family business for 109 years in the wood industry, combining about thousand employees with uncompromising dedication to wood and customers. This is reflected in both long customer and employee relationships. Koskisen's annual revenue in 2016 was EUR 264 million, and slightly more than half of the production was exported. Koskisen Group consists of four different production units:
Panel industry, manufacturing birch plywood and chipboard Saw mill industry, manufacturing spruce and pine sawn timber, and planed timber from
spruce and pine sawn timber Housing industry, manufacturing Herrala single-family houses for consumers, and wooden
elements for wooden blocks of flats and additional floors for blocks of flats Thin plywood industry, manufacturing birch veneer and thin birch plywood In addition, Koskisen Group includes Koskitukki Ltd., which is responsible for Koskisen's wood
procurement and produces bioenergy for neighboring power plants. We are familiar with the end-use requirements of our wood products and we want to promote
our customers' business with innovative product and service solutions. We provide our customers with a comprehensive range of wood products, state of the art technology, excellent sales network, genuine customer service and the ability to tailor products to customers' needs.

Natural resources and bioeconomy studies 80/2017
380
ISCHP 2019
he next edition of the International Scientific Conference on Hardwood Processing will be held end of August 2019 in Delft, in The Netherlands. The venue will be at the Delft
University of Technology (TU Delft).
Delft is known for its historic town centre with plenty of canals, Delft Blue pottery, the famous painter Johannes Vermeer and its association with the royal House of Orange-Nassau. Delft is a couple of steps from the city of Rotterdam (biggest port of Europe) and The Hague (Seat of the Dutch government and International Court of Justice). The largest Technical University of the Netherlands with about 22.000 students is located in Delft. Delft is easy to reach by plane and train from all over the world.
Only 11% of the land area of the Netherlands is covered by forests. Most of the forests are for recreation. However, it is remarkable that the consumption of wood is about 0.8 m3 per capita. 80% of the wood has to be imported for consumption. About 20% of the sawn timber consumption is (tropical-) hardwood. Main applications of hardwoods are hydraulic structures such as lock gates, sheet pile walls, mooring poles, etc., facades, windows and doors.
The conference will be organized by the Section of Bio based Structures and Materials which is part of the Department of Structural Engineering of TU Delft in cooperation with the Dutch Timber Industry. You are very welcome to Delft in two years to celebrate the 7th edition of the ISCHP conference.
Conference Organizers: Wolfgang Gard and Jan-Willem van de Kuilen
T

Natural Resources Institute Finland Latokartanonkaari 9 FI-00790 Helsinki, Finland tel. +358 29 532 6000
Copyright © 2022 FDOKUMEN