Preqin Private Equity Benchmarks: - Venture Capital ...
23
Preqin Private Equity Benchmarks: Venture Capital Benchmark Report As of 30th June 2013 alternative assets. intelligent data.
-
Upload
khangminh22 -
Category
Documents
-
view
0 -
download
0
Transcript of Preqin Private Equity Benchmarks: - Venture Capital ...

Preqin Private Equity Benchmarks:Venture Capital Benchmark Report
As of 30th June 2013
alternative assets. intelligent data.
This publication is not included in the CLA Licence so you must not copy any portion of it without the permission of the publisher.
All rights reserved. The entire contents of the report are the Copyright of Preqin Ltd. No part of this publication or any information contained in it may be copied, transmitted by any electronic means, or stored in any electronic or other data storage medium, or printed or published in any document, report or publication, without the express prior written approval of Preqin Ltd. The information presented in the report is for information purposes only and does not constitute and should not be construed as a solicitation or other offer, or recommendation to acquire or dispose of any investment or to engage in any other transaction, or as advice of any nature whatsoever. If the reader seeks advice rather than information then he should seek an independent fi nancial advisor and hereby agrees that he will not hold Preqin Ltd. responsible in law or equity for any decisions of whatever nature the reader makes or refrains from making following its use of the report.
While reasonable efforts have been used to obtain information from sources that are believed to be accurate, and to confi rm the accuracy of such information wherever possible, Preqin Ltd. Does not make any representation or warranty that the information or opinions contained in the report are accurate, reliable, up-to-date or complete.
Although every reasonable effort has been made to ensure the accuracy of this publication Preqin Ltd. does not accept any responsibility for any errors or omissions within the report or for any expense or other loss alleged to have arisen in any way with a reader’s use of this publication.
Preqin Private Equity Benchmarks:Venture Capital Benchmark Report
As of 30th June 2013
Report Produced on 12th March 2014

Preqin Private Equity Benchmarks ® are calculated using performance information available from our online Performance Analyst database, the world’s most extensive, transparent database of private equity fund performance. Users of the online database have access to all of the underlying fund performance data used to calculate these benchmarks. With performance for over 6,700 private equity funds, the Performance Analyst online database is regularly updated and fully searchable. Further information can be found at www.preqin.com/pa.
All the performance figures used to generate the Preqin Private Equity Market Benchmarks are net position to investor – i.e. all commitments, contributions, distributions, remaining values and IRRs are all based on the net position for the institutional investor before tax but after the management fees and carry of the general partner.
The Preqin Venture Capital Market Benchmark is based on performance data for 897 venture funds of vintages 1982 to 2013 as of 30th June 2013.
Preqin gathers fund returns information from a very wide and diverse range of sources, including public institutions via freedom of information legislations, published reports of a number of listed fund of funds vehicles and GP voluntary contributions. The sheer extent of the data sources that we now use provides many opportunities to crosscheck and verify data for an individual partnership from different sources, and increases our confidence in the data.
A growing number of GPs have concluded that it is in their best interests to voluntarily share information on their partnerships: given that many prospective investors are seeing this information, it is better that they should have access to the most current and accurate figures possible. Even where data comes direct from the GP, however, our aim is still to show the net position for LPs, after management fees and carry. We are again very grateful to the significant number of GPs who now share data with us in this way; currently 800 GPs are contributing data on their funds. If you would like further details on contributing information on your firm please contact us at [email protected].
Preqin Private Equity Benchmarks:Venture Capital Benchmark Report
As of 30th June 2013
Report Produced on 12th March 2014
Median Benchmark - Venture Capital All Regions - As of 30th June 2013 ....................................p4.
Median Benchmark - Venture Capital North America - As of 30th June 2013 .............................p6.
Median Benchmark - Venture Capital Europe - As of 30th June 2013 ..........................................p8.
Median Benchmark - Venture Capital Asia - As of 30th June 2013 .............................................p10.
Weighted Benchmark - Venture Capital All Regions - As of 30th June 2013 ..............................p12.
Pooled Benchmark - Venture Capital All Regions ..........................................................................p14.
Horizon IRRs - As of 30th June 2013...................................................................................................p16.
List of Constituent Funds ....................................................................................................................p20.

Q2 2013 Preqin Private Equity Benchmarks: Venture Capital Benchmark Report
4 © 2014 Preqin Ltd. / www.preqin.com
Preqin Median Benchmarks: Venture Capital All Regions is calculated using data for 897 funds of vintages between 1982 and 2013 with performance as of 30th June 2013 and includes liquidated funds. Preqin holds performance data for 1,617 venture capital funds. All returns are net of management fees, expenses and carry.
Preqin Median Benchmarks: Venture Capital All Regions as of 30th June 2013
Median Fund Multiple Quartiles (X) IRR Quartiles (%) IRR Max/Min (%)
Vintage No. Funds
Called (%)
Dist (%) DPI
Value (%) RVPI Q1 Median Q3 Q1 Median Q3 Max Min
2013 9 5.2 0.0 92.3 1.00 0.92 0.68 n/m n/m n/m n/m n/m2012 31 23.5 0.0 91.0 1.00 0.91 0.75 n/m n/m n/m n/m n/m2011 32 45.3 0.0 98.0 1.20 1.06 0.88 n/m n/m n/a n/m n/m2010 22 62.8 0.7 110.0 1.28 1.16 1.04 16.5 8.6 4.2 77.8 -7.22009 21 65.0 4.7 103.7 1.60 1.21 0.98 23.1 13.9 -0.7 34.3 -33.02008 59 78.6 15.2 88.9 1.32 1.16 0.96 15.0 7.3 1.5 55.6 -17.42007 64 89.1 13.8 98.2 1.56 1.24 0.96 16.3 7.4 -0.8 59.7 -23.62006 51 93.3 29.1 81.9 1.52 1.15 0.77 10.6 4.3 -5.5 26.4 -25.52005 44 96.6 38.2 64.4 1.49 1.16 0.77 10.7 5.3 -4.7 104.9 -66.32004 39 99.4 36.2 62.0 1.34 1.10 0.83 6.2 1.5 -2.5 66.7 -21.02003 21 98.1 75.9 53.1 1.41 1.21 0.94 9.3 5.1 -1.9 27.6 -12.92002 25 100.0 65.7 25.0 1.65 1.07 0.79 9.6 2.8 -5.0 42.7 -17.52001 55 100.0 81.7 26.6 1.75 1.25 0.84 11.3 3.9 -4.1 30.0 -23.92000 78 100.0 78.7 20.0 1.29 1.06 0.78 7.1 1.3 -3.6 42.8 -12.81999 41 100.0 72.9 8.3 1.43 0.83 0.43 9.5 -2.1 -13.1 154.7 -40.61998 40 100.0 105.4 0.0 1.70 1.09 0.66 18.5 5.6 -7.8 1015.7 -46.11997 36 100.0 223.3 0.0 3.61 2.28 1.28 79.5 40.9 7.9 267.8 -30.01996 22 100.0 161.3 0.0 2.36 1.64 0.81 39.4 11.0 -1.5 188.4 -33.31995 20 100.0 263.4 0.0 5.47 2.71 1.61 89.7 28.3 6.1 218.3 -22.01994 16 100.0 218.5 0.0 5.71 2.19 1.37 63.8 27.1 7.1 94.1 -15.91993 24 100.0 261.8 0.0 4.41 2.62 1.21 61.7 25.0 2.6 87.4 -29.11992 20 100.0 162.1 0.0 2.44 1.62 1.16 24.4 13.3 3.3 87.2 -20.11991 10 100.0 232.5 0.0 2.98 2.33 1.25 30.8 20.1 2.9 63.0 1.21990 16 100.0 190.0 0.0 2.64 1.90 1.06 26.6 13.4 3.2 74.4 -4.21989 23 100.0 211.6 0.0 2.33 2.12 1.11 17.5 13.3 4.5 198.5 -42.11988 12 100.0 264.8 0.0 3.61 2.65 1.82 32.1 22.4 10.0 43.4 -9.31987 15 100.0 159.2 0.0 2.04 1.64 1.20 14.7 7.5 3.6 17.8 -12.41986 11 100.0 156.3 0.0 2.01 1.56 1.31 10.3 8.0 3.3 13.8 1.41985 16 100.0 274.9 0.0 3.29 2.75 1.95 19.4 14.0 10.4 24.7 8.51984 12 100.0 199.1 0.0 2.55 1.99 1.44 12.8 10.1 7.4 15.3 1.71983 5 100.0 164.9 0.0 n/a 1.65 n/a n/a 9.6 n/a 17.2 -3.51982 7 100.0 191.3 0.0 n/a 1.91 n/a n/a 8.9 n/a 16.7 -1.6
Source: Preqin Performance Analyst
Q2 2013 Preqin Private Equity Benchmarks: Venture Capital Benchmark Report
5 © 2014 Preqin Ltd. / www.preqin.com
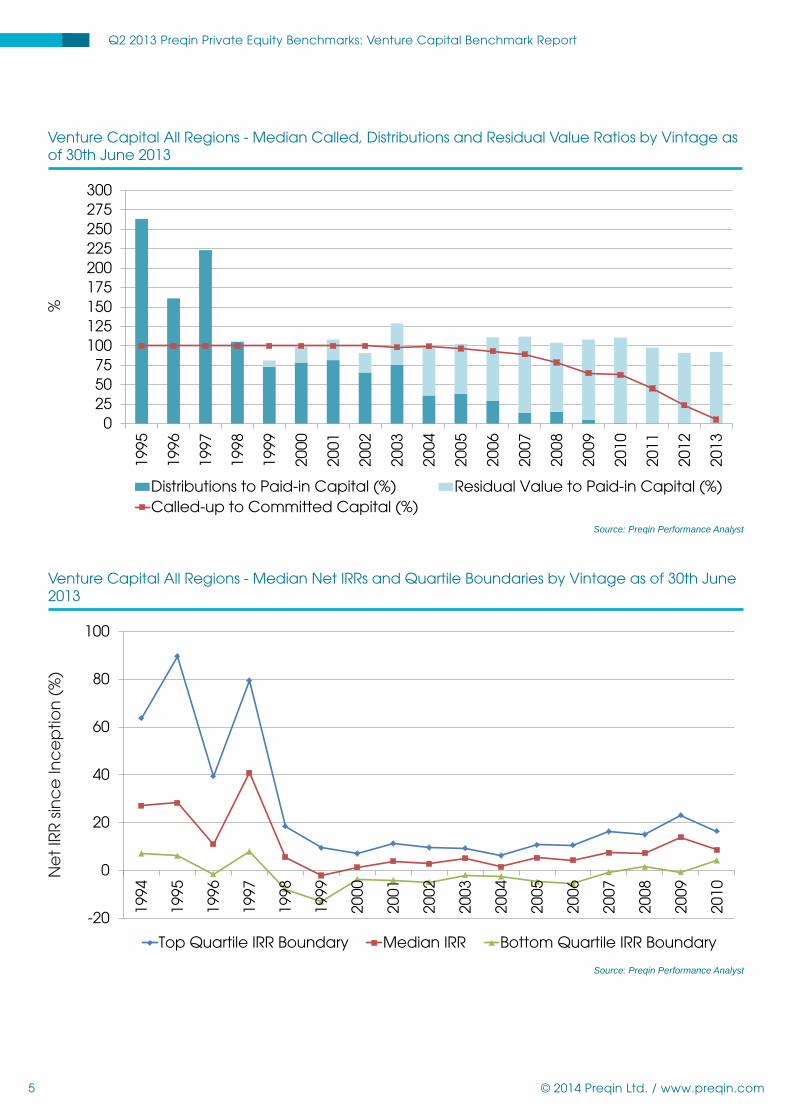
Venture Capital All Regions - Median Called, Distributions and Residual Value Ratios by Vintage as of 30th June 2013
0255075
100125150175200225250275300
1995
1996
1997
1998
1999
2000
2001
2002
2003
2004
2005
2006
2007
2008
2009
2010
2011
2012
2013
Distributions to Paid-in Capital (%) Residual Value to Paid-in Capital (%)Called-up to Committed Capital (%)
%
Source: Preqin Performance Analyst
Venture Capital All Regions - Median Net IRRs and Quartile Boundaries by Vintage as of 30th June 2013
-20
0
20
40
60
80
100
1994
1995
1996
1997
1998
1999
2000
2001
2002
2003
2004
2005
2006
2007
2008
2009
2010
Top Quartile IRR Boundary Median IRR Bottom Quartile IRR Boundary
Ne
t IR
R s
inc
e In
ce
ptio
n (
%)
Source: Preqin Performance Analyst

Q2 2013 Preqin Private Equity Benchmarks: Venture Capital Benchmark Report
6 © 2014 Preqin Ltd. / www.preqin.com
Preqin Median Benchmarks: Venture Capital North America is calculated using data for 652 funds of vintages between 1984 and 2012 with performance as of 30th June 2013 and includes liquidated funds. Preqin holds performance data for 1,203 North American venture capital funds. All returns are net of management fees, expenses and carry.
Preqin Median Benchmarks: Venture Capital North America as of 30th June 2013
Vintage No. Funds
Median Fund Multiple Quartiles (X) IRR Quartiles (%) IRR Max/Min (%)Called
(%)Dist
(%) DPIValue
(%) RVPI Q1 Median Q3 Q1 Median Q3 Max Min
2013 8 4.9 0.0 93.4 1.00 0.94 0.79 n/m n/m n/m n/m n/m2012 16 26.6 0.0 93.0 1.09 0.94 0.83 n/m n/m n/m n/m n/m2011 17 39.5 0.0 98.9 1.20 1.09 0.85 n/m n/m n/m n/m n/m2010 17 60.5 4.9 110.5 1.25 1.18 1.09 17.9 10.4 5.1 77.8 -2.92009 14 63.2 6.4 117.2 1.68 1.34 1.09 23.1 16.0 8.3 29.8 -7.02008 37 79.9 16.1 92.4 1.32 1.12 1.00 14.0 6.8 0.1 38.3 -17.42007 46 91.1 20.3 99.3 1.76 1.32 1.05 18.0 8.7 2.3 59.7 -23.62006 43 93.3 27.9 83.9 1.53 1.15 0.81 10.1 4.1 -5.0 26.4 -25.12005 29 96.7 43.4 64.8 1.51 1.24 0.79 9.8 5.3 -5.6 38.3 -66.32004 31 99.0 34.4 62.0 1.44 1.07 0.86 7.6 1.2 -3.0 66.7 -19.32003 15 98.1 85.0 46.7 1.43 1.35 1.17 11.0 6.9 0.4 27.6 -12.92002 18 100.0 56.3 23.3 1.45 0.97 0.66 8.5 -0.7 -6.3 20.9 -17.02001 41 100.0 84.1 25.9 1.66 1.22 0.84 10.8 3.0 -4.9 30.0 -23.92000 60 100.0 82.1 23.6 1.45 1.12 0.79 7.7 1.5 -3.5 42.8 -12.71999 37 100.0 65.2 6.8 1.35 0.80 0.42 6.2 -2.5 -13.4 154.7 -40.61998 31 100.0 94.7 0.0 1.60 0.91 0.48 16.6 2.0 -10.0 514.3 -46.11997 28 100.0 240.9 0.0 3.79 2.46 1.28 120.7 40.9 8.7 267.8 -14.31996 16 100.0 161.3 0.0 2.77 1.64 0.96 43.7 11.9 -1.5 188.4 -33.31995 16 100.0 330.0 0.0 6.56 3.38 1.39 101.0 33.1 3.4 218.3 -22.01994 14 100.0 209.5 0.0 5.71 2.10 1.00 59.7 27.1 7.0 94.1 -15.91993 21 100.0 259.9 0.0 3.56 2.60 1.17 62.7 24.2 2.0 87.4 -29.11992 15 100.0 183.0 0.0 3.90 1.83 1.04 38.1 16.8 2.2 87.2 -20.11991 4 100.0 242.9 0.0 n/a 2.43 n/a n/a 21.6 n/a 63.0 12.51990 11 100.0 209.8 0.0 4.00 2.10 1.38 31.2 16.0 3.9 74.4 -4.21989 21 100.0 213.1 0.0 2.33 2.13 1.36 17.4 12.0 2.0 198.5 -42.11988 9 100.0 287.8 0.0 3.83 2.88 2.28 37.1 26.8 20.6 43.4 10.91987 10 100.0 151.1 0.0 1.94 1.54 1.20 14.8 6.2 2.5 17.8 -12.41986 11 100.0 156.3 0.0 2.01 1.56 1.31 10.3 8.0 3.3 13.8 1.41985 10 100.0 257.7 0.0 3.58 2.58 1.79 18.8 14.0 9.9 21.3 8.51984 6 100.0 177.9 0.0 n/a 1.78 n/a n/a 9.5 n/a 13.8 6.4
Source: Preqin Performance Analyst
Q2 2013 Preqin Private Equity Benchmarks: Venture Capital Benchmark Report
7 © 2014 Preqin Ltd. / www.preqin.com
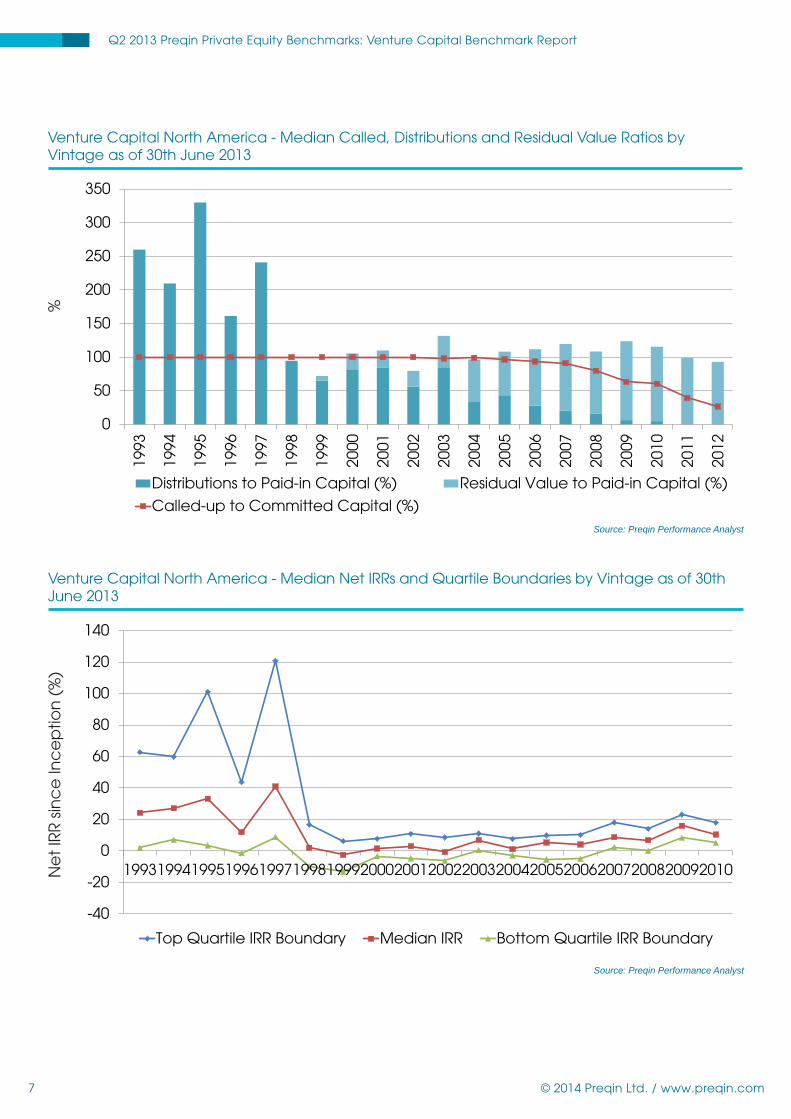
Venture Capital North America - Median Called, Distributions and Residual Value Ratios by Vintage as of 30th June 2013
0
50
100
150
200
250
300
350
1993
1994
1995
1996
1997
1998
1999
2000
2001
2002
2003
2004
2005
2006
2007
2008
2009
2010
2011
2012
Distributions to Paid-in Capital (%) Residual Value to Paid-in Capital (%)
Called-up to Committed Capital (%)
%
Source: Preqin Performance Analyst
Venture Capital North America - Median Net IRRs and Quartile Boundaries by Vintage as of 30th June 2013
-40
-20
0
20
40
60
80
100
120
140
199319941995199619971998199920002001200220032004200520062007200820092010
Top Quartile IRR Boundary Median IRR Bottom Quartile IRR Boundary
Ne
t IR
R s
inc
e In
ce
ptio
n (
%)
Source: Preqin Performance Analyst

Q2 2013 Preqin Private Equity Benchmarks: Venture Capital Benchmark Report
8 © 2014 Preqin Ltd. / www.preqin.com
Preqin Weighted Benchmarks: Venture Capital All Regions is calculated using data for 780 funds of vintages between 1991 and 2013 with performance as of 30th June 2013 and includes liquidated funds. Preqin holds performance data for 1,617 venture capital funds. All returns are net of management fees, expenses and carry.
Preqin Weighted Benchmarks: Venture Capital All Regions as of 30th June 2013
Vintage No. FundsWeighted Fund IRR Max/Min (%)
Called (%) Dist (%) DPI
Value (%) RVPI Multiple (X) IRR (%) Max Min
2013 9 10.3 0.0 93.0 0.93 n/m n/m n/m2012 31 26.7 1.2 92.0 0.93 n/m n/m n/m2011 32 52.7 5.5 101.8 1.07 n/m n/m n/m2010 22 63.2 7.3 113.4 1.21 15.2 77.8 -7.22009 21 74.1 18.0 114.4 1.32 16.6 34.3 -33.02008 59 76.4 19.9 101.5 1.21 8.3 55.6 -17.42007 64 85.4 35.4 104.9 1.41 9.6 59.7 -23.62006 51 93.2 33.2 88.9 1.22 4.1 26.4 -25.52005 44 99.1 127.6 15.8 1.43 14.7 104.9 -66.32004 39 96.0 52.6 68.7 1.22 0.5 66.7 -21.02003 21 96.3 67.1 50.1 1.17 3.2 27.6 -12.92002 25 99.1 77.7 37.9 1.18 2.9 42.7 -17.52001 55 98.3 99.2 33.8 1.33 4.9 30.0 -23.92000 78 99.0 83.0 15.0 0.98 0.1 42.8 -12.81999 41 98.2 66.4 9.1 0.75 -6.1 154.7 -40.61998 40 100.2 188.3 3.1 1.90 36.0 1015.7 -46.11997 36 100.0 322.6 0.3 3.23 36.8 267.8 -30.01996 22 99.6 263.1 1.5 2.65 24.9 188.4 -33.31995 20 99.9 290.2 0.1 2.90 19.6 218.3 -22.01994 16 100.0 656.8 0.1 6.57 59.8 94.1 -15.91993 24 100.0 375.8 1.0 3.77 44.0 87.4 -29.11992 20 99.9 169.1 0.0 1.69 7.8 87.2 -20.11991 10 99.9 130.0 0.0 1.30 3.9 63.0 1.2
Source: Preqin Performance Analyst

Q2 2013 Preqin Private Equity Benchmarks: Venture Capital Benchmark Report
9 © 2014 Preqin Ltd. / www.preqin.com
Venture Capital All Regions - Weighted IRRs by Vintage as of 30th June 2013
-10
-5
0
5
10
15
20
25
30
35
40
1996 1997 1998 1999 2000 2001 2002 2003 2004 2005 2006 2007 2008 2009 2010
We
igh
ted
Ne
t IR
R s
inc
e In
ce
ptio
n (
%)
Source: Preqin Performance Analyst
Venture Capital All Regions - Weighted Multiples by Vintage as of 30th June 2013
0.0
0.5
1.0
1.5
2.0
2.5
3.0
3.5
1996
1997
1998
1999
2000
2001
2002
2003
2004
2005
2006
2007
2008
2009
2010
2011
2012
2013
We
igh
ted
Mu
ltip
le (
X)
Source: Preqin Performance Analyst

Q2 2013 Preqin Private Equity Benchmarks: Venture Capital Benchmark Report
10 © 2014 Preqin Ltd. / www.preqin.com
Preqin Pooled Benchmarks: Venture Capital All Regions is calculated using cash fl ow data for 561 venture funds of vintages between 1992 and 2013. Preqin holds cash fl ow data for more than 2,400 private equity funds. All returns are net of management fees, expenses and carry.
Preqin Pooled Benchmarks: Venture Capital All Regions
Vintage No. of Funds (Pooled)
Weighted Fund Pooled FundCalled (%) Dist (%) DPI Value (%) RVPI Multiple (X) IRR (%)
2013 12 9.6 0.0 93.2 0.93 n/m2012 20 26.8 1.1 91.6 0.93 n/m2011 23 28.5 0.6 89.1 0.89 5.12010 18 62.9 6.3 111.5 1.18 10.12009 13 74.6 18.9 107.2 1.26 17.62008 39 76.2 24.5 96.1 1.21 11.22007 54 84.1 34.0 100.7 1.35 10.32006 41 88.1 78.3 31.8 1.10 3.82005 30 99.5 59.5 29.2 0.89 5.72004 24 99.5 115.5 20.9 1.37 2.12003 16 89.9 156.6 12.7 1.70 -2.02002 23 99.0 135.6 11.9 1.49 3.02001 42 98.1 95.6 35.5 1.31 4.12000 71 98.3 79.2 16.8 0.95 -0.81999 37 98.0 71.7 12.6 0.86 -4.91998 27 100.0 157.1 5.5 1.61 26.71997 18 99.9 320.4 1.3 3.18 45.11996 16 99.9 281.8 3.3 2.85 57.91995 12 99.8 288.7 0.2 2.89 81.71994 7 100.0 638.1 0.1 6.38 46.71993 9 100.3 421.3 0.7 4.22 44.11992 9 99.9 194.7 0.0 1.95 35.7
Source: Preqin Performance Analyst

Q2 2013 Preqin Private Equity Benchmarks: Venture Capital Benchmark Report
11 © 2014 Preqin Ltd. / www.preqin.com
Venture Capital All Regions - Pooled IRRs by Vintage
-10
0
10
20
30
40
50
60
70
80
90
1992
1993
1994
1995
1996
1997
1998
1999
2000
2001
2002
2003
2004
2005
2006
2007
2008
2009
2010
Po
ole
d IR
R s
inc
e In
ce
ptio
n (
%)
Source: Preqin Performance Analyst
Q2 2013 Preqin Private Equity Benchmarks: Venture Capital Benchmark Report
12 © 2014 Preqin Ltd. / www.preqin.com
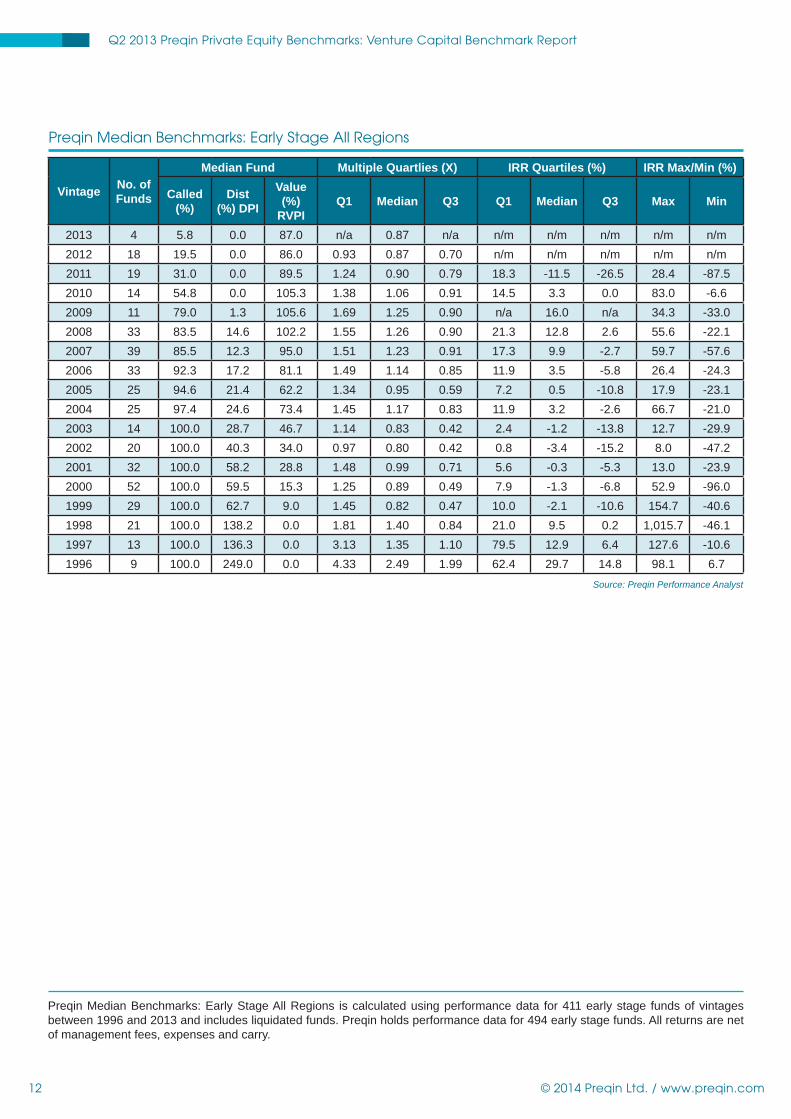
Preqin Median Benchmarks: Early Stage All Regions is calculated using performance data for 411 early stage funds of vintages between 1996 and 2013 and includes liquidated funds. Preqin holds performance data for 494 early stage funds. All returns are net of management fees, expenses and carry.
Preqin Median Benchmarks: Early Stage All Regions
Vintage No. of Funds
Median Fund Multiple Quartlies (X) IRR Quartiles (%) IRR Max/Min (%)
Called (%)
Dist (%) DPI
Value (%)
RVPIQ1 Median Q3 Q1 Median Q3 Max Min
2013 4 5.8 0.0 87.0 n/a 0.87 n/a n/m n/m n/m n/m n/m2012 18 19.5 0.0 86.0 0.93 0.87 0.70 n/m n/m n/m n/m n/m2011 19 31.0 0.0 89.5 1.24 0.90 0.79 18.3 -11.5 -26.5 28.4 -87.52010 14 54.8 0.0 105.3 1.38 1.06 0.91 14.5 3.3 0.0 83.0 -6.62009 11 79.0 1.3 105.6 1.69 1.25 0.90 n/a 16.0 n/a 34.3 -33.02008 33 83.5 14.6 102.2 1.55 1.26 0.90 21.3 12.8 2.6 55.6 -22.12007 39 85.5 12.3 95.0 1.51 1.23 0.91 17.3 9.9 -2.7 59.7 -57.62006 33 92.3 17.2 81.1 1.49 1.14 0.85 11.9 3.5 -5.8 26.4 -24.32005 25 94.6 21.4 62.2 1.34 0.95 0.59 7.2 0.5 -10.8 17.9 -23.12004 25 97.4 24.6 73.4 1.45 1.17 0.83 11.9 3.2 -2.6 66.7 -21.02003 14 100.0 28.7 46.7 1.14 0.83 0.42 2.4 -1.2 -13.8 12.7 -29.92002 20 100.0 40.3 34.0 0.97 0.80 0.42 0.8 -3.4 -15.2 8.0 -47.22001 32 100.0 58.2 28.8 1.48 0.99 0.71 5.6 -0.3 -5.3 13.0 -23.92000 52 100.0 59.5 15.3 1.25 0.89 0.49 7.9 -1.3 -6.8 52.9 -96.01999 29 100.0 62.7 9.0 1.45 0.82 0.47 10.0 -2.1 -10.6 154.7 -40.61998 21 100.0 138.2 0.0 1.81 1.40 0.84 21.0 9.5 0.2 1,015.7 -46.11997 13 100.0 136.3 0.0 3.13 1.35 1.10 79.5 12.9 6.4 127.6 -10.61996 9 100.0 249.0 0.0 4.33 2.49 1.99 62.4 29.7 14.8 98.1 6.7
Source: Preqin Performance Analyst
Q2 2013 Preqin Private Equity Benchmarks: Venture Capital Benchmark Report
13 © 2014 Preqin Ltd. / www.preqin.com
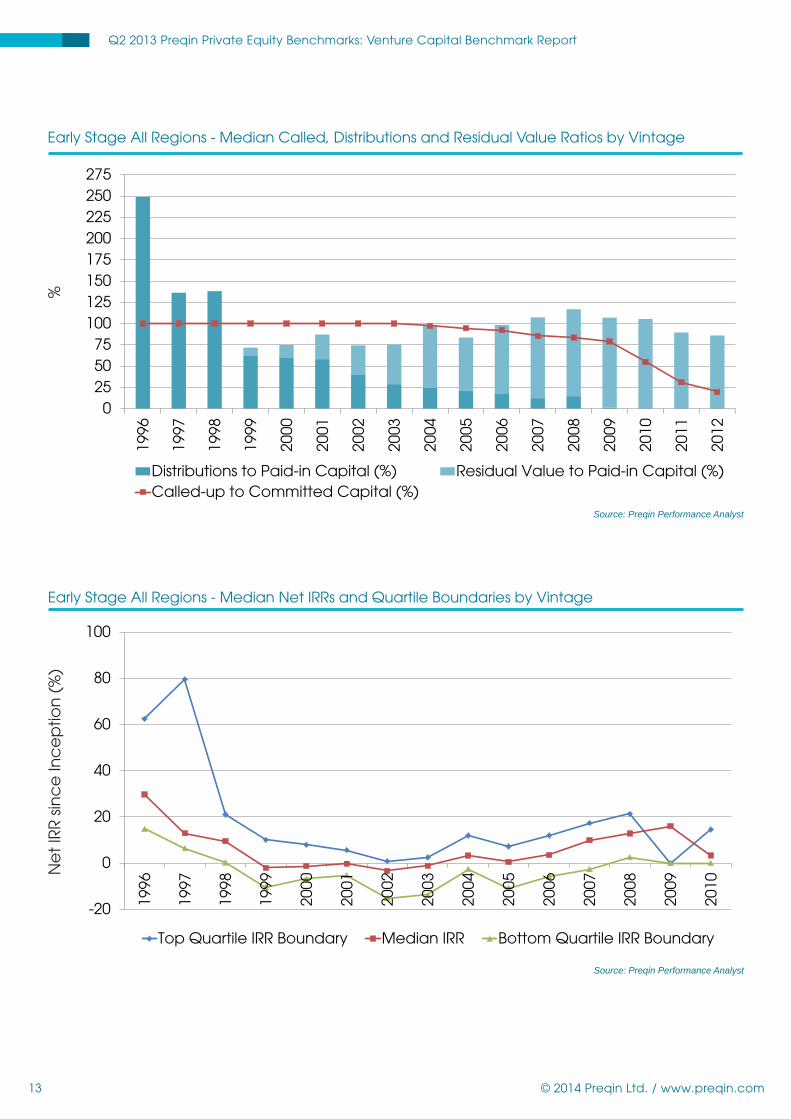
Early Stage All Regions - Median Called, Distributions and Residual Value Ratios by Vintage
0255075
100125150175200225250275
1996
1997
1998
1999
2000
2001
2002
2003
2004
2005
2006
2007
2008
2009
2010
2011
2012
Distributions to Paid-in Capital (%) Residual Value to Paid-in Capital (%)Called-up to Committed Capital (%)
%
Source: Preqin Performance Analyst
Early Stage All Regions - Median Net IRRs and Quartile Boundaries by Vintage
-20
0
20
40
60
80
100
1996
1997
1998
1999
2000
2001
2002
2003
2004
2005
2006
2007
2008
2009
2010
Top Quartile IRR Boundary Median IRR Bottom Quartile IRR Boundary
Ne
t IR
R s
inc
e In
ce
ptio
n (
%)
Source: Preqin Performance Analyst

Q2 2013 Preqin Private Equity Benchmarks: Venture Capital Benchmark Report
14 © 2014 Preqin Ltd. / www.preqin.com
Preqin Weighted Benchmarks: All Regions Early Stage is calculated using data for 411 funds of vintages between 1996 and 2013 and includes liquidated funds. All returns are net of management fees, expenses and carry.
Preqin Weighted Benchmarks: Early Stage All Regions
Vintage No. of Funds
Weighted Fund IRR Max/Min (%)
Called (%) Dist (%) DPI
Value (%) RVPI Multiple (X) IRR (%) Max Min
2013 4 n/a n/a n/a n/a n/m n/m n/m2012 18 23.9 3.0 88.6 0.92 n/m n/m n/m2011 19 32.7 2.2 92.8 0.95 -15.6 28.4 -87.52010 14 62.2 5.4 104.7 1.10 6.6 83.0 -6.62009 11 71.3 12.2 114.4 1.26 12.9 34.3 -33.02008 33 78.1 24.3 100.9 1.25 8.2 55.6 -22.12007 39 87.1 27.6 109.9 1.39 12.3 59.7 -57.62006 33 92.2 28.0 89.9 1.18 3.3 26.4 -24.32005 25 99.2 135.2 7.7 1.43 15.7 17.9 -23.12004 25 92.4 48.6 86.9 1.38 0.2 66.7 -21.02003 14 98.4 29.3 45.1 0.73 -7.9 12.7 -29.92002 20 97.0 44.8 46.4 0.89 -4.6 8.0 -47.22001 32 99.0 82.3 33.1 1.15 1.9 13.0 -23.92000 52 98.4 71.5 30.0 1.00 -0.5 52.9 -96.01999 29 98.0 69.3 13.4 0.83 -4.5 154.7 -40.61998 21 99.5 151.9 9.1 1.61 42 1015.7 -46.11997 13 100.0 347.9 3.7 2.05 53.5 127.6 -10.61996 9 99.8 467.1 2.2 4.69 46.3 98.1 6.7
Source: Preqin Performance Analyst
Q2 2013 Preqin Private Equity Benchmarks: Venture Capital Benchmark Report
15 © 2014 Preqin Ltd. / www.preqin.com
Early Stage All Regions - Weighted IRRs by Vintage
-20
-10
0
10
20
30
40
50
60
1996
1997
1998
1999
2000
2001
2002
2003
2004
2005
2006
2007
2008
2009
2010
We
igh
ted
Ne
t IR
R s
inc
e In
ce
ptio
n (
%)
Source: Preqin Performance Analyst
Early Stage All Regions - Weighted Multiples by Vintage
0.0
0.5
1.0
1.5
2.0
2.5
3.0
3.5
4.0
4.5
5.0
1996
1997
1998
1999
2000
2001
2002
2003
2004
2005
2006
2007
2008
2009
2010
2011
2012
We
igh
ted
Ne
t M
ulti
ple
(X
)
Source: Preqin Performance Analyst

Q2 2013 Preqin Private Equity Benchmarks: Venture Capital Benchmark Report
16 © 2014 Preqin Ltd. / www.preqin.com
Preqin Pooled Benchmarks: Early Stage All Regions is calculated using cash fl ow data for 170 early stage funds of vintages between 1996 and 2012. Preqin holds cash fl ow data for more than 2,400 private equity funds. All returns are net of management fees, expenses and carry.
Preqin Pooled Benchmarks: Early Stage All Regions
Vintage No. of FundsWeighted Fund Pooled Fund
Called (%) Dist (%) DPI Value (%) RVPI Multiple (X) IRR (%)2013 4 n/a n/a n/a n/a n/m2012 8 23.9 3.0 88.6 0.92 n/m2011 8 32.7 2.2 92.8 0.95 0.02010 6 62.2 5.4 104.7 1.10 4.12009 4 71.3 12.2 114.4 1.26 18.82008 14 78.1 24.3 100.9 1.25 10.92007 16 87.1 27.6 109.9 1.39 8.62006 16 92.2 28.0 89.9 1.18 3.52005 10 99.2 135.2 7.7 1.43 1.92004 11 92.4 48.6 86.9 1.38 4.42003 5 98.4 29.3 45.1 0.73 -8.42002 11 97.0 44.8 46.4 0.89 -0.92001 13 99.0 82.3 33.1 1.15 2.52000 25 98.4 71.5 30.0 1.00 -0.11999 13 98.0 69.3 13.4 0.83 -5.71996 4 99.8 467.1 2.2 4.69 42.01997 13 100.0 347.9 3.7 2.05 53.51996 9 99.8 467.1 2.2 4.69 46.3
Source: Preqin Performance Analyst

Q2 2013 Preqin Private Equity Benchmarks: Venture Capital Benchmark Report
17 © 2014 Preqin Ltd. / www.preqin.com
Early Stage All Regions - Pooled IRRs by Vintage
-20
-10
0
10
20
30
40
50
1996
1999
2000
2001
2002
2003
2004
2005
2006
2007
2008
2009
2010
Po
ole
d N
et
IRR
sin
ce
Inc
ep
tion
(%
)
Source: Preqin Performance Analyst
Q2 2013 Preqin Private Equity Benchmarks: Venture Capital Benchmark Report
18 © 2014 Preqin Ltd. / www.preqin.com
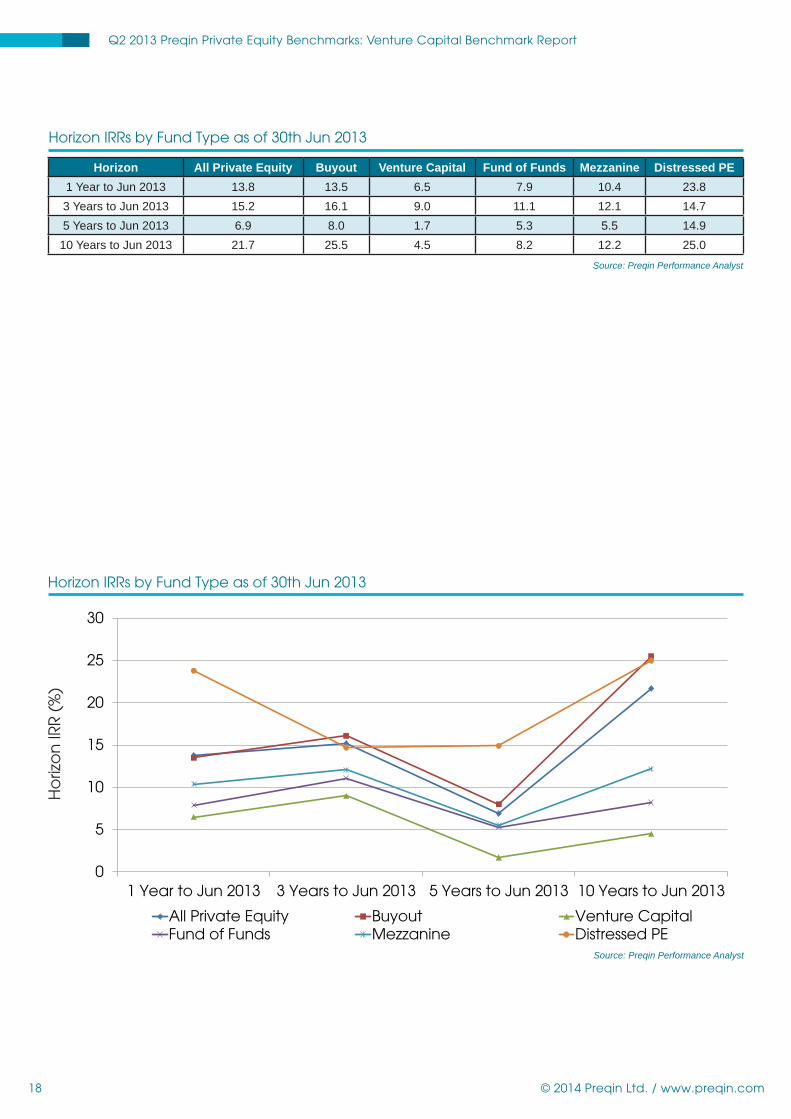
Horizon IRRs by Fund Type as of 30th Jun 2013
Horizon All Private Equity Buyout Venture Capital Fund of Funds Mezzanine Distressed PE1 Year to Jun 2013 13.8 13.5 6.5 7.9 10.4 23.83 Years to Jun 2013 15.2 16.1 9.0 11.1 12.1 14.75 Years to Jun 2013 6.9 8.0 1.7 5.3 5.5 14.9
10 Years to Jun 2013 21.7 25.5 4.5 8.2 12.2 25.0Source: Preqin Performance Analyst
Horizon IRRs by Fund Type as of 30th Jun 2013
0
5
10
15
20
25
30
1 Year to Jun 2013 3 Years to Jun 2013 5 Years to Jun 2013 10 Years to Jun 2013
All Private Equity Buyout Venture CapitalFund of Funds Mezzanine Distressed PE
Ho
rizo
n IR
R (
%)
Source: Preqin Performance Analyst

Q2 2013 Preqin Private Equity Benchmarks: Venture Capital Benchmark Report
19 © 2014 Preqin Ltd. / www.preqin.com
Rolling One-Year Horizon IRRs by Fund Type
All Buyout Venture Capital Fund of Funds Mezzanine Real Estate1 Year to Dec 2000 10.1 3.6 38.1 -1.3 14.0 11.41 Year to Dec 2001 -2.7 -3.2 -34.3 -5.2 13.8 7.81 Year to Dec 2002 -9.1 -4.0 -31.6 -23.2 -2.1 6.71 Year to Dec 2003 17.5 24.3 -6.0 -15.1 6.8 14.91 Year to Dec 2004 25.0 30.3 7.1 7.5 20.4 19.81 Year to Dec 2005 27.0 29.7 4.5 16.9 13.6 60.81 Year to Dec 2006 29.1 32.3 15.8 17.9 31.7 42.61 Year to Dec 2007 26.0 30.7 21.3 23.2 18.8 13.51 Year to Dec 2008 -27.6 -31.0 -16.2 -12.0 4.0 -39.91 Year to Dec 2009 13.8 16.7 5.0 0.2 2.3 -25.31 Year to Dec 2010 18.8 22.6 10.9 13.3 8.6 4.71 Year to Dec 2011 9.2 8.4 8.4 7.8 15.7 14.61 Year to Dec 2012 12.9 15.1 7.0 8.7 10.0 6.51 Year to Jun 2013 13.8 13.5 6.5 7.9 10.4
Source: Preqin Performance Analyst
Rolling One-Year Horizon IRRs by Fund Type
-60
-40
-20
0
20
40
60
80
1 Y
ea
r to
De
c 2
000
1 Y
ea
r to
De
c 2
001
1 Y
ea
r to
De
c 2
002
1 Y
ea
r to
De
c 2
003
1 Y
ea
r to
De
c 2
004
1 Y
ea
r to
De
c 2
005
1 Y
ea
r to
De
c 2
006
1 Y
ea
r to
De
c 2
007
1 Y
ea
r to
De
c 2
008
1 Y
ea
r to
De
c 2
009
1 Y
ea
r to
De
c 2
010
1 Y
ea
r to
De
c 2
011
1 Y
ea
r to
De
c 2
012
1 Y
ea
r to
Ju
n 2
013
All Buyout Venture Capital Fund of Funds Mezzanine Real Estate
Ho
rizo
n IR
R (
%)
Source: Preqin Performance Analyst

Q2 2013 Preqin Private Equity Benchmarks: Venture Capital Benchmark Report
20 © 2014 Preqin Ltd. / www.preqin.com
Rolling Three-Year Horizon IRRs by Fund Type
All Buyout Venture Capital Fund of Funds Mezzanine Real Estate3 Years to Dec 2000 14.9 11.7 62.4 21.9 16.8 3.23 Years to Dec 2001 10.6 4.0 87.3 8.9 12.2 7.33 Years to Dec 2002 -4.9 -4.9 -17.6 -13.1 1.2 7.43 Years to Dec 2003 4.3 6.0 -19.0 -10.6 5.4 8.63 Years to Dec 2004 10.2 15.8 -8.5 -4.5 7.2 12.53 Years to Dec 2005 23.0 27.8 3.0 8.3 12.6 23.43 Years to Dec 2006 26.2 30.4 8.6 20.3 19.0 38.03 Years to Dec 2007 30.2 34.4 14.3 23.5 21.1 36.93 Years to Dec 2008 11.3 14.1 5.4 7.0 26.5 0.03 Years to Dec 2009 0.3 0.2 0.3 1.3 6.5 -18.33 Years to Dec 2010 0.8 0.9 -0.7 0.8 3.4 -12.23 Years to Dec 2011 13.9 15.7 7.0 8.0 9.3 -2.63 Years to Dec 2012 13.3 15.3 8.9 10.4 10.0 6.43 Years to Jun 2013 15.2 16.1 9.0 11.1 12.1
Source: Preqin Performance Analyst
Rolling Three-Year Horizon IRRs by Fund Type
-40
-20
0
20
40
60
80
100
3 Ye
ars
to
De
c 2
000
3 Ye
ars
to
De
c 2
001
3 Ye
ars
to
De
c 2
002
3 Ye
ars
to
De
c 2
003
3 Ye
ars
to
De
c 2
004
3 Ye
ars
to
De
c 2
005
3 Ye
ars
to
De
c 2
006
3 Ye
ars
to
De
c 2
007
3 Ye
ars
to
De
c 2
008
3 Ye
ars
to
De
c 2
009
3 Ye
ars
to
De
c 2
010
3 Ye
ars
to
De
c 2
011
3 Ye
ars
to
De
c 2
012
3 Ye
ars
to
Ju
n 2
013
All Buyout Venture Capital Fund of Funds Mezzanine Real Estate
Ho
rizo
n IR
R (
%)
Source: Preqin Performance Analyst

Performance Analyst is the most comprehensive, detailed source of private equity performance data available today. Preqin’s team of analysts collect and monitor data from a number of different sources, including from GPs themselves, in order to provide the most comprehensive private equity performance data available.All of our performance data conforms to the same standardized metrics, with all data representing net-to-LP returns. We currently hold transparent net-to-LP performance data for over 6,500 private equity funds of all types and geographic focus. In terms of aggregate value, this represents around 70% of all capital ever raised.This high level of coverage enables us to produce the most meaningful benchmarking and comparative tools available in the industry.
Key features of this powerful database include:
• View performance data online: for private equity funds worldwide. Compare individual funds against each other and the appropriate benchmarks.
• Compare funds of all types: venture, buyout, mezzanine, distressed, special situations, real estate, natural resources, fund of funds, secondary.
• Assess key performance data for each fund: size, vintage, type, called-up, distributed, unrealised value, multiple, IRR.
• View historic performance for over 36,000 data points to assess how performance data has changed overtime (Premium access required).
• Keep current with developments: with monthly updates you always have access to the latest data.
• View cash fl ow graphs for over 2,400 funds: assess how quickly funds have called and distributed capital and what their net cash fl ow position is.
• Select, compare and analyze funds according to your criteria: by type, size, vintage year etc.
• Assess each fi rm’s long-term track record: quartile performance over several fund generations.
• Median, pool, weighted and average Benchmarks: view fully transparent market benchmarks by fund type and region focus. Benchmarks data is available for called-up, distribution, value and top, median and bottom quartile IRRs and multiples. View details of constituent funds behind the benchmarks.
• Top Performing GPs: view a list of fi rms that have consistently had funds ranked in the 1st and 2nd quartiles.
• Unlimited Excel downloads for further analysis (Premium access required).• Create a tailored peer group of funds for comparative purposes.
Performance Analyst (Standard)USD 2,150 / EUR 1,550 / GBP 1,295
Performance Analyst (Premium)USD 4,450 / EUR 3,195 / GBP 2,695
For a demo or to fi nd out more about this product, please visit:
www.preqin.com/pa
f (S )
Preqin Private Equity Performance Analyst

Q2 2013 Preqin Private Equity Benchmarks: Venture Capital Benchmark Report
22 © 2014 Preqin Ltd. / www.preqin.com
List of Constituent Funds
21st Century Communications Partners5AM Ventures Fund5AM Ventures Fund II5AM Ventures Fund IIIAberdare II Annex FundAberdare Ventures IIAberdare Ventures IIIAberdare Ventures IVAbingworth Bioventures IVAbingworth VenturesAccel EuropeAccel IIIAccel IVAccel VAccel VIAccel VI - SAccel VIIIAccelerated Technologies Partners IIAccess Venture Partners IIAcorn General Fund OneAcorn Venture Technology Fund IAdams Street 2010 Direct FundAdams Street 2011 Direct FundAdams Street Direct Fund VAdams Street Direct Fund VIAdvent International Network FundAfrica Agricultural CapitalAfrican LionAfrican Lion Fund IIIAfrican Lion IIAisling Capital IIIAlliance ScanEast FundAllos I FundAllos II FundAlloy Ventures 2002Alloy Ventures 2005 Alta Biopharma Partners IIAlta California Partners IIAlta California Partners IIIAlta Communications VIIAlta IVAlta VAlta Ventures Mexico Fund IAltos Ventures IVAM Pappas Life Science Ventures IIAM Pappas Life Science Ventures IIIAM Pappas Life Science Ventures IVAMCVFAmpersand 1994Ampersand 1995AMV Partners IAMWIN Innovation FundAnnapolis IAnnapolis IIAnnapolis IIIAnnapolis IVAnnapolis VAnnapolis VIApax Capital Risque IIIApax Germany IApax Partners - Germany IIApax UK VApax UK VIApax Ventures Capital FundApax Ventures IIApax Ventures IIIApax Ventures IVApex Investment Fund IApex Investment Fund IIApex Investment Fund IIIApex Investment Fund IVApex Investment Fund VApex Investment Fund VIAravis Biotech IIAravis Venture IArboretum Ventures IArboretum Ventures IIArboretum Ventures IIIArch Development Fund IARCH Venture Fund IIARCH Venture Fund IIIArral Pacifi c Equity Trust IIArrowPath Fund IIArtiman VenturesArtiman Ventures IIArtiman Ventures IIIArtiman Ventures Special Opportunities FundAscend VenturesAscent Venture Partners IAscent Venture Partners IIAscent Venture Partners IIIAscent Venture Partners IVAscent Venture Partners VAsia Pacifi c Healthcare Fund IIAsian Lion Fund
Asset Management Partners 2004ATF IAthenian Venture PartnersAthenian Venture Partners IIAthenian Venture Partners IIIAtlante Private EquityAtlante SeedAtlante VenturesAtlante Ventures MezzogiornoAtlantic Medical CapitalAtlas Ventures VIAustin Ventures IVAustin Ventures IXAustin Ventures VAustin Ventures VIAustin Ventures VIIAustin Ventures VIIIAustin Ventures XAustralian Mezzanine Investment No. 1 TrustAustralian Mezzanine Investment No. 2 TrustAustralian Mezzanine Investment No. 3 Trust Avalon Ventures IXAvalon Ventures VIIAvalon Ventures VIIIAVP Ohio Technology IAzure Capital Partners IIBain Capital Venture FundBain Capital Venture Fund 2009Bain Capital Venture Fund 2012Bain Capital Venture Partners 2005Bain Capital Venture Partners 2007Baird Venture Partners IBaird Venture Partners IIBaird Venture Partners IIIBaltCap Latvia Venture Capital Fund Baltic Investment Fund IIIBaltic SME FundBattery Ventures IVBattery Ventures VIBattery Ventures VIIBattery Ventures VIIIBattery Ventures XBAVPBay City Capital Fund IBay City Capital Fund IIBay City Capital Fund IIIBay City Capital Fund IVBay City Capital Fund VBay Partners XBay Partners XIBenchmark Capital PartnersBenchmark Capital Partners IIBeta PartnersBioDiscovery IIBioDiscovery IIIBioDiscovery IVBioPacifi cVenturesBiotechnology Venture FundBirchmere Ventures IIBlue Chip Capital FundBlue Chip Capital Fund IIBlue Chip Capital Fund IIIBlue Chip Capital Fund IVBlue Chip Capital Fund VBlue Chip Opportunity FundBlue Hill Investment PartnersBlueRun Ventures IIIBlueRun Ventures IVBluestream VenturesBoston Millennia Partners IIBrandon Bioscience Fund No. 1Brantley Venture Partners IIBrantley Venture Partners IIIBrentwood Associates IVBrentwood Associates VIBridgescale Partners IBright Capital Digital FundBright Capital IBrown Shipley Development Capital FundCaduceus Private Investments IICaduceus Private Investments IIICaduceus Private Investments IVCalCEF Angel FundCanaan Equity VIICapMan Life Science IVCapMan Technology 2007Cardinal Health PartnersCardinal Health Partners IICardinal Health Partners IIICarlyle Venture Partners IICarlyle Venture Partners IIICarmel Software FundCarmel Venture Fund II
Carmel Ventures IIICastile Ventures IIICatalyst VenturesCauris InvestissementCDH Venture Partners IICentennial Bus. Dev. FundCentennial FundCentennial Fund IICentennial Fund VICentro ImpresaCEO Venture FundCeyuan Ventures IICH Transition FundCHAMP Ventures Investments Trust No. 5Charter Life SciencesCHL Medical Partners IIChrysalix Energy IIICID Equity Capital VIIICID Fund VCID Seed FundClaremont Creek Ventures IIClarus VenturesClarus Ventures IIClearstone Venture Partners I-BClearstone Venture Partners IICM Capital Venture Trust 4CM Capital Venture Trust No. 3CMEA Ventures ICMEA Ventures IIICoates Myer Innovation Investment Fund Columbia Capital Equity Partners I-AColumbia Capital Equity Partners I-BColumbia Capital Equity Partners IIColumbia Capital Equity Partners IVColumbia Capital Equity Partners VColumbine Venture Fund IICommerce Health Ventures Commonwealth BioVentures IICommonwealth BioVentures IIICommonwealth BioVentures VCommonwealth Capital Ventures ICommonwealth Capital Ventures IICommonwealth Capital Ventures IVConnecticut Future FundCopley Partners 1Copley Partners 2Cornerstone Equity Investors IVCostella Kirsch VCottonwood Technology FundCottonwood Technology Fund IICovera Ventures ICraton Equity Partners ICREAFUND IICrescendo IICrescent Capital ICrosslink Ventures IIICrosslink Ventures IVCrosslink Ventures VCrosslink Ventures VICrown Associates IIICT - Greene VenturesCT Financial Development FundCVM Equity Fund IIICVM Equity Fund IVCVM Equity Fund VDAG Ventures Fund IIIDavis Venture PartnersDayton Region Signature FundDBL Equity Fund-BAEF IIDelta Capital Growth FundDelta VCDelta VC 2DFJ Frontier FundDFJ Frontier IIDGF CAPITAL 1 (REIF)DMP Fund IDoll Technology Investment Fund IIIDomain IIDomain IIIDomain PartnersDomain Partners IVDomain Partners VDomain Partners VIDomain Partners VIIDomain Partners VIIIDominion Fund IIIDoughty Hanson & Co TechnologyDoughty Hanson & Co Technology IIDraper Atlantic Venture Fund IIDraper Fisher Jurvetson VIIDraper Fisher Jurvetson XDraper Triangle IIDSV PartnersDT Capital China Growth FundDT Ventures China II
Dunrath Capital Infrastructure Surety FundEarlybird 2012Earlybird I/IIEarlybird IIIEarlybird IVEast Midlands Regional Venture Capital FundEaston Capital PartnerseCAPITAL III CleantecheCAPITAL Technologies Fonds IIEdison IEdison IIEdison IIIEdison IVEdison VEdison VIEdison VIIEl Dorado Ventures IVElement Partners IIElevar Equity IIEmerald Stage2 VenturesEmergence Capital Partners IIEnterprise Partners IIIEnterprise Venture Fund IEspírito Santo Ventures IIIEspírito Santo Ventures Innovation and Internationalisation FundEssex Woodlands Health VenturesEssex Woodlands Health Ventures VEssex Woodlands Health Ventures VIEUROMED FundEuroventures Ukraine Fund IIEvergreen IEvergreen IIEvergreen IIIEvergreen IVEvergreen VExcelsior IIFirst Century Partners IIIFirstMark Capital IFirstMark Capital IIFlagship Ventures Fund IFlagship Ventures Fund IIFlagship Ventures Fund IIIFlagship Ventures Fund IVFleming VenturesFletcher Spaght VenturesFletcher Spaght Ventures IIFocus Ventures IIFocus Ventures IIIFondo per il Mezzogiorno Foresite Capital Forward Ventures IIIForward Ventures IVForward Ventures VFoundry Group Venture Capital Fund IFountain Healthcare Partners Fund IFrazier Healthcare IIFrazier Healthcare VFrazier Healthcare VIFrazier Technology Ventures IIGalen Partners IVGalen Partners VGarage California Entrepreneurs FundGateway Venture Partners IIIGemini Israel IIIGeneral Catalyst Group IIGeneral Catalyst Group VIGenesis Seed FundGeocapital EurofundGeocapital IIIGeocapital IVGGV Capital IVGiza Venture Fund VGlobal Catalyst Partners IIGlobal Catalyst Partners IIIGlobal Life Science Venture FundGlobal Venture Capital Fund IGlobal Venture Capital IIGlobespan Capital Partners IVGlobespan Capital Partners VGranite Global VenturesGranite Global Ventures IIGranite Global Ventures IIIGranite Ventures IIGreycroft PartnersGreycroft Partners IIGrotech Partners VIIGrotech Ventures IIGSR Ventures IIIGVP IHalo Fund IHalo Fund IIHalpern & Denny IIHarbert Venture Partners IHarbert Venture Partners II
Harbert Venture Partners IIIHarbourVest FalconHeadland Asian Ventures Fund 2Headland Asian Ventures Fund 3Headland Technology FundHealthcap IVHealthcare Focus FundHighland Capital Partners VHighland Capital Partners VIHighland Capital Partners VIIHighland Capital Partners VIIIHighland Consumer Fund IHighway 12 Venture Fund IIHill Partnership IIIHispania Private Equity IIHopewell VenturesHorizon TechventuresHudson Venture Partners IIHyde Park Venture PartnersI-Hatch VenturesIB Australian BioSciences Fund IIDEA Energy Effi ciency and Sustainable Development FundIDG Ventures India Illinois Emerging Technologies FundIndex Ventures IIIndex Ventures IIIInfi nity Capital Venture 1999Information Technology VenturesInformation Technology Ventures IIInnovacom 1Innovacom 2Innovacom 3Innovacom 4Innovacom 5Innovacom 6InnoVentures Capital Partners IInnoVentures Capital Partners IIInroads Capital PartnersInSight Venture Partners (Cayman) IIInSight Venture Partners (Cayman) IIIInSight Venture Partners (Cayman) IVInSight Venture Partners VInSight Venture Partners VIInstitutional Venture Partners VInstitutional Venture Partners VIInstitutional Venture Partners XInstitutional Venture Partners XIIIInstitutional Venture Partners XIVIntersouth Partners IIIntersouth Partners IVIntersouth Partners VIntersouth Partners VIIntersouth Partners VIIInterWest Partners IIInterWest Partners IIIInterWest Partners IVInterWest Partners IXInterWest Partners VInterWest Partners VIInterWest Partners VIIInterWest Partners VIIIInterWest Partners XINVESCO Private Capital Fund IInvestecIP Cathy OneIP Cathy TwoIP Fund IIP Fund IIIP Fund IIIIPV Capital IIPV Capital IIIsrael Seed Partners IVISTART-1JAFCO America Technology Fund IIIJAFCO G-3JAFCO G-4JAFCO G-5JAFCO G-6(A)(B)JAFCO G-7(A)(B)JAFCO G-8(A)(B)JAFCO No 1JAFCO No 2JAFCO No 3JAFCO No 4JAFCO No 5JAFCO No 6JAFCO R-3JAFCO R1(A)(B)JAFCO R2JATFJAVPJAVP 2Jerusalem Venture Partners IJK&B Capital IVJMI Equity Fund IIIKBA Partners
Q2 2013 Preqin Private Equity Benchmarks: Venture Capital Benchmark Report
23 © 2014 Preqin Ltd. / www.preqin.com
KBA Partners IIKentucky Seed Capital FundKeystone IVKeystone Minority Capital FundKeystone VKhosla Ventures IVKhosla Ventures SeedKitty Hawk Capital IIIKleiner Perkins Caufi eld & Byers VIKleinwort Benson VenturesKnife Capital Growth Equity Fund 1 - HBDLC Fund VLehman Brothers Communications PartnersLighthouse Capital Partners IIILighthouse Capital Partners IVLightspeed Venture Partners VILightspeed Venture Partners VIILightspeed Venture Partners VIIILitCapital ILithuania SME FundLiveOak Venture Partners ILongitude Venture PartnersLongitude Venture Partners IILouisiana Fund ILoyalhanna Venture FundMangrove IIMangrove IIIMangrove NTVC IMarquette Venture IIMateria VenturesMatrix Partners IIMatrix Partners IIIMatrix Partners IVMatrix Partners VMayfi eld India IMayfi eld XIVMedia / Communications PartnersMedia / Communications Partners IIMedia / Communications Partners VIMedical Research Commercialisation Fund IIFMediphase Venture Partners IIMenlo Evergreen VMenlo Ventures IIIMenlo Ventures IVMenlo Ventures IXMenlo Ventures VIMenlo Ventures VIIMenlo Ventures VIIIMenlo Ventures XMenlo Ventures XIMentorTech 2005MentorTech IIMeritech Capital Partners IVMesirow Capital Partners IIIMesirow Capital Partners VMesirow Capital Partners VIMesirow Capital Partners VIIMiami Valley Venture FundMiami Valley Venture Fund IIMidland Montagu InvestissementMidtown Fund IIIMining Investments Separate AccountMobius Technology Ventures VIMohr Davidow Ventures IIIMohr Davidow Ventures IVMorgan Holland IIMorgan Stanley Venture Partners 2002Morgan Stanley Venture Partners IIMorgan Stanley Venture Partners IIIMorgan Stanley Venture Partners IVMorgenthaler Venture Partners IIIMorgenthaler Venture Partners IVMorgenthaler Venture Partners VIIMPM BioVentures I MPM BioVentures IIMPM BioVentures IVMPM BioVentures VMPM SunStates FundMTIMTI IVMTI VenturesMultinational Industrial FundMultinational Industrial Fund IIMurphree Venture Partners IVMutual Capital Partners Fund IMutual Capital Partners Fund IIMVP II Liquidating Trust National Pension 05-2 Korea Investment Venture Capital Fund XNauta Tech Invest INauta Tech Invest IINauta Tech Invest IIINazem & Company IIINB PINCT Ventures Fund INeoMed IINeoMed IIINeoMed IVNeoMed VNEPA Venture INEPA Venture IINew Atlantic Venture Fund III
New Atlantic Venture Fund IVNew Court VenturesNew Enterprise Associates IVNew Enterprise Associates VNew Enterprise Associates XNew Enterprise Associates XIINew Enterprise Associates XIIINew Enterprise Associates XIVNew Europe Venture Equity FundNew Leaf Venture IINew Leaf Ventures INewMargin Partners INewSpring Growth Capital IINewSpring Growth Capital IIINewSpring Health Capital IINewSpring VenturesNextStage CapitalNGEN Partners IINGEN Partners IIINGP Energy Technology PartnersNGP Energy Technology Partners IINokia Ventures Fund (Blue Run Venture)Nord Ovest ImpresaNordic BiotechNordic Biotech Opportunity FundNordic Biotech Venture Fund IINorth Bridge Venture Partners IVNorth Bridge Venture Partners VNorthern Investment CompanyNorthern Venture Partnership FundNorthwest Ohio Venture FundNovak Biddle Venture Partners INovak Biddle Venture Partners IINovak Biddle Venture Partners IIINovak Biddle Venture Partners IVNovak Biddle Venture Partners VNth Power IVO’Donnell & MasurOak Investment Partners IXOak Investment Partners VOak Investment Partners VIOak Investment Partners VIIIOak Investment Partners XOak Investment Partners XIOak Investment Partners XIIOak Investment Partners XIIIOld Court VenturesOlympic Venture Partners IIOlympic Venture Partners IIIOlympic Venture Partners IVOlympic Venture Partners VOne Liberty Fund IIIOpenView Venture PartnersOpus Capital IOpus Capital VIOriginate Growth FundOsage Venture Partners IIIOSCCO IIIOVP Venture Partners VIOVP Venture Partners VIIOxford Bioscience Partners IOxford Bioscience Partners IIIOxford Bioscience Partners IVP/A FundP/S BankInvest New Energy SolutionsPacifi c Synergies IVPaladin IIIPalomar Ventures IIPangaea Ventures Fund IPangaea Ventures Fund IIParagon PartnersParagon Venture Partners IIPartech International Ventures IVPCG Corporate Partners FundPennsylvania Early Stage Partners IIIPeriscope Fund IPermira France Venture IPermira U.K. Venture I ExtensionPermira UK Venture Fund IIIPermira UK Venture Fund IVPermira UK Venture IPermira UK Venture IIPerseus Soros Bio PharmPhiladelphia Ventures IIPhillips-Smith Specialty Retail Group IIIPhoenix PartnersPhoenix Partners IIPinnacle Equity Fund IPinnacle Equity Fund IIPinnacle Venture Debt IPinnacle Venture Debt IIPinnacle Venture Debt IIIPioneer Ventures AssociatesPitango Venture Capital Fund IIIPitango Venture Capital Fund IVPLSG Accelerator Fund IPlymouth Venture Partners IPlymouth Venture Partners IIPolaris Venture PartnersPolaris Venture Partners IVPolaris Venture Partners VPractica Seed Capital FundPractica Venture Capital FundPrelude Technology Fund II
Prime Technology Ventures IPrime Technology Ventures IIPrime Technology Ventures IIIPrime VIIIPrimus Capital Fund IPrimus Capital Fund IIPrimus Capital Fund IIIPrimus Capital Fund VIPrimus Capital Fund VIIPrism Venture Partners IPrism Venture Partners IIPrism Venture Partners IVProQuest Investments IProQuest Investments IIProQuest Investments IIIProQuest Investments IVProspect Venture PartnersProspect Venture Partners IIPrudential Venture Partners IIPsilos Capital IIIPTV Sciences AnnexPTV Sciences IPTV Sciences IIQuadrant Capital Fund IRedpoint Ventures IIRembrandt Venture PartnersRFG Private Equity 1RHO Canada Ventures IRHO Canada Ventures IIRHO Ventures IRHO Ventures IIRHO Ventures IIIRHO Ventures IVRHO Ventures VRHO Ventures VIRiverVest Venture Partners IIRiverwood Capital IRockport Capital Partners IIIRoyalton Capital Investors RS & Co. Venture Partners IVRustic Canyon/Fontis PartnersSail Venture Partners IISalix Affi liates IISalix Ventures ISalix Ventures IISanderling IVSanderling Venture Partners VIScale Venture Partners IIScale Venture Partners IIISCP Private Equity ISCP Private Equity IISEED Capital Denmark II K/SSEED Capital Denmark K/SSention KasvurahastoSEP IVSequel Limited Partnership IISequel Limited Partnership IIISevin Rosen Fund IVSevin Rosen Fund VSevin Rosen Fund VISevin Rosen Fund VIISevin Rosen Fund VIIIShasta Ventures FundShawmut Equity PartnersSierra Ventures IVSierra Ventures VSierra Ventures VIIISJF Venture IISkyline IIISocial Capital Partnership IISofi nnova Venture Partners VIISofi nnova Venture Partners VIIISoftbank China Venture Capital Fund IIISouth Atlantic Venture Fund IISoutheastern Technology Fund ISoutheastern Technology Fund IISpring Mill Venture Fund StarVest Partners IIStorm Ventures Fund IStorm Ventures Fund IIStorm Ventures Fund IIISummit Accelerator FundSummit Partners Venture Capital Fund IISummit Partners Venture Capital Fund IIISummit V Companion FundSummit VenturesSummit Ventures IISummit Ventures IIISummit Ventures IVSummit Ventures VSummit Ventures VISunwestern Venture IIISV Life Sciences Fund ISV Life Sciences Fund IISV Life Sciences Fund IIISV Life Sciences Fund IVSV Life Sciences Fund VSVB India Capital Partners ISyndicated Communications Ventures IISyndicated Communications Ventures IVSyndicated Communications Ventures V
Tallwood IITarget Partners Fund ITarget Partners Fund IITCW Special Placement IITCW Special Placement IIITech Ventures ITech Ventures IITech Ventures IIITechnocomTechnocom 2Technologies for Information & Entertainment IIITechnology Crossover VenturesTechnology Crossover Ventures IITechnology Crossover Ventures IIITechnology Partners Fund VTechnology Partners Fund VITechnology Partners West Fund IVTelecom Partners IITelecom Partners IIITenaya Capital VITerra Venture Partners TH Lee Putnam Parallel VenturesThe Column GroupThe Third Brown Shipley FundThird Rock Ventures Third Rock Ventures IIThomas McNerney & Partners IIThree Arch CapitalThree Arch Partners IIIThree Arch Partners IVTiconderoga SBICTL VenturesTL Ventures IITL Ventures IIITL Ventures IVTL Ventures VTMT VenturesTPG Biotechnology PartnersTPG Biotechnology Partners IITPG Biotechnology Partners IIITransatlantic Capital Bio-Sciences FundTriathlon Medical VenturesTrident Capital Fund VTrinity Ventures VIIITriumph Investment Fund IITTV Capital ITTV Capital IIITVM ITVM IITVM III (German Fund)TVM III (US Fund)TVM IVTVM Life Science Venture VITVM Life Science Ventures VIITVM Medical VenturesTVM V Information TechnologyTVM V Life ScienceUnion Square VenturesUnion Square Ventures IIUnion Square Ventures IIIUnited Utilities Venture FundUnitus Equity FundUpdata Partners IV Updata Venture Partners IIUpfront IUpfront IIUpfront IIIUpfront IV US Venture Partners VUS Venture Partners VIUS Venture Partners VIIUS Venture Partners VIIIUSIT IUSIT IIUV Partners Fund IIIUV Partners Fund IVValhalla Partners IIValley Ventures IIVantagePoint Cleantech Partners VantagePoint CleanTech Partners IIVantagePoint Venture Partners IIIVantagePoint Venture Partners IVVantagePoint Venture Partners VVector Capital IIVector Fund IVVentech Capital FVentech Capital IVentech Capital IIVentech Capital IIIVentech PartnersVenture Capital Fund of New England IIVenture Capital Fund of New England IIIVenture Investors of WisconsinVenture Lending & Leasing IIIVietnam Equity FundVista Group IIIWalden Venture Capital VIWalden Venture Capital VIIWalnut Growth PartnersWellington Financial IWellington Financial IIWellington Financial IIIWellington Financial IV
Worldview Technology Partners IWorldview Technology Partners IIWorldview Technology Partners IIIWorldview Technology Partners IVWPG Enterprise FundWPG Enterprise Fund IIWPG Enterprise Fund IIIWPG Venture Associates IVWPG Venture Associates VXPV Water FundYellow&Blue Clean Energy InvestmentsYourNest Angel FundYsios BioFund IZesiger Capital GroupZN Mexico Trust