Preliminary study for detection and classification of swallowing ...
188
HAL Id: tel-02443938 https://tel.archives-ouvertes.fr/tel-02443938 Submitted on 17 Jan 2020 HAL is a multi-disciplinary open access archive for the deposit and dissemination of sci- entific research documents, whether they are pub- lished or not. The documents may come from teaching and research institutions in France or abroad, or from public or private research centers. L’archive ouverte pluridisciplinaire HAL, est destinée au dépôt et à la diffusion de documents scientifiques de niveau recherche, publiés ou non, émanant des établissements d’enseignement et de recherche français ou étrangers, des laboratoires publics ou privés. Preliminary study for detection and classification of swallowing sound Hajer Khlaifi To cite this version: Hajer Khlaifi. Preliminary study for detection and classification of swallowing sound. Bioengineering. Université de Technologie de Compiègne, 2019. English. NNT: 2019COMP2485. tel-02443938
-
Upload
khangminh22 -
Category
Documents
-
view
1 -
download
0
Transcript of Preliminary study for detection and classification of swallowing ...

HAL Id: tel-02443938https://tel.archives-ouvertes.fr/tel-02443938
Submitted on 17 Jan 2020
HAL is a multi-disciplinary open accessarchive for the deposit and dissemination of sci-entific research documents, whether they are pub-lished or not. The documents may come fromteaching and research institutions in France orabroad, or from public or private research centers.
L’archive ouverte pluridisciplinaire HAL, estdestinée au dépôt et à la diffusion de documentsscientifiques de niveau recherche, publiés ou non,émanant des établissements d’enseignement et derecherche français ou étrangers, des laboratoirespublics ou privés.
Preliminary study for detection and classification ofswallowing sound
Hajer Khlaifi
To cite this version:Hajer Khlaifi. Preliminary study for detection and classification of swallowing sound. Bioengineering.Université de Technologie de Compiègne, 2019. English. NNT : 2019COMP2485. tel-02443938

Par Hajer KHLAIFI
Thèse présentée pour l’obtention du grade de Docteur de l’UTC
Preliminary study for detection and classification of swallowing sound
Soutenue le 21 mai 2019 Spécialité : Bio-ingénierie et Sciences et Technologies de l’Information et des Systèmes : Unité de Recherche Biomécanique et Bio-ingénierie (UMR-7338) D2485

DOCTORAL THESIS
Preliminary study for detection andclassification of swallowing sound
By: Hajer KHLAIFI
jury member:
Rapporteur: Yannick KERGOSIEN, Professeur, University of Cergy Pontoise,UFR of Science and Technology
Rapporteur: Mohamed Ali MAHJOUB, MCF-HDR, National Engineering Schoolof Sousse, LATIS Laboratory
Examiner: Sophie DABO, Professeur, University of Lille, Wooden bridge area,LEM UMR CNRS 9221 Laboratory
Examiner: Monia TURKI, University Professor, National Engineering Schoolof Tunis, University Campus - El Manar II
Examiner: Sofiane BOUDAOUD, Maître de Conférences, University of Tech-nology of Compiègne, BMBI UMR 7338
Invited guest: Carla TARAMASCO TORO, Professeur, Escuela de IngenieríaCivil Informática Universidad de Valparaíso, Chile
Thesis Director: Jacques DEMONGEOT, Professeur Emérite, AGEIS EA 7407UGA Grenoble
Thesis Director: Dhafer MALOUCHE, MCF-HDR, Higher School of Statisticsand Information Analysis, Tunis
Thesis Director: Dan ISTRATE, ECC Rang A, University of Technology ofCompiègne, BMBI UMR 7338
A thesis submitted in fulfillment of the requirements
for the degree of Bioengineering, Information Science and Technology and systems
Date of defense: 21 Mai 2019
prevotla
Texte tapé à la machine
prevotla
Texte tapé à la machine
prevotla
Texte tapé à la machine
prevotla
Texte tapé à la machine
prevotla
Texte tapé à la machine
prevotla
Texte tapé à la machine
prevotla
Texte tapé à la machine
prevotla
Texte tapé à la machine
prevotla
Texte tapé à la machine
prevotla
Texte tapé à la machine
prevotla
Texte tapé à la machine
prevotla
Texte tapé à la machine
prevotla
Texte tapé à la machine
prevotla
Texte tapé à la machine
prevotla
Texte tapé à la machine
prevotla
Texte tapé à la machine
prevotla
Texte tapé à la machine
prevotla
Texte tapé à la machine
prevotla
Texte tapé à la machine
prevotla
Texte tapé à la machine
prevotla
Texte tapé à la machine
prevotla
Texte tapé à la machine
Spécialité :
prevotla
Texte tapé à la machine
Bio-ingénierie et Sciences et Technologies de l'Information et des Systèmes
prevotla
Texte tapé à la machine
prevotla
Texte tapé à la machine
prevotla
Texte tapé à la machine
prevotla
Texte tapé à la machine
prevotla
Texte tapé à la machine
prevotla
Texte tapé à la machine
prevotla
Texte tapé à la machine
prevotla
Texte tapé à la machine

ii

iii
To mum and dad...To my dear brother Anis who is always by my side.... . .


v
Abstract
The diseases affecting and altering the swallowing process are multi-faceted, affect-
ing the patient’s quality of life and ability to perform well in society. The exact
nature and severity of the pre/post-treatment changes depend on the location of the
anomaly. Effective swallowing rehabilitation, clinically depends on the inclusion
of a video-fluoroscopic evaluation of the patient’s swallowing in the post-treatment
evaluation. There are other available means such as endoscopic optical fibre. The
drawback of these evaluation approaches is that they are very invasive. However,
these methods make it possible to observe the swallowing process and identify areas
of dysfunction during the process with high accuracy.
"Prevention is better than cure" is the fundamental principle of medicine in gen-
eral. In this context, this thesis focuses on remote monitoring of patients and more
specifically monitoring the functional evolution of the swallowing process of people
at risk of dysphagia, whether at home or in medical institutions, using the minimum
number of non-invasive sensors. This has motivated the monitoring of the swallow-
ing process based on the capturing only the acoustic signature of the process and
modeling the process as a sequence of acoustic events occuring within a specific
time frame.
The main problem of such acoustic signal processing is the automatic detection
of the relevent sound signals, a crucial step in the automatic classification of sounds
during food intake for automatic monitoring. The detection of relevant signal re-
duces the complexity of the subsequent analysis and characterisation of a particular
swallowing process. The-state-of-the-art algorithms processing the detection of the
swallowing sounds as distinguished from environmental noise were not sufficiently
accurate. Hence, the idea occured of using an adaptive threshold on the signal re-
sulting from wavelet decomposition.
The issues related to the classification of sounds in general and swallowing sounds
in particular are addressed in this work with a hierarchical analysis that aims to first
identify the swallowing sound segments and then to decompose them into three

vi
characteristic sounds, consistent with the physiology of the process. The coupling
between detection and classification is also addressed in this work.
The real-time implementation of the detection algorithm has been carried out.
However, clinical use of the classification is discussed with a plan for its staged de-
ployment subject to normal processes of clinical approval.
Keywords: Wavelet decomposition, signal processing, detection, classification,
GMM, HMM.. . .

vii


ix
Résumé
Les maladies altérant le processus de la déglutition sont multiples, affectant la qual-
ité de vie du patient et sa capacité de fonctionner en société. La nature exacte
et la gravité des changements post/pré-traitement dépendent de la localisation de
l’anomalie. Une réadaptation efficace de la déglutition, cliniquement parlant, dépend
généralement de l’inclusion d’une évaluation vidéo-fluoroscopique de la déglutition
du patient dans l’évaluation post-traitement des patients en risque de fausse route.
La restriction de cette utilisation est due au fait qu’elle est très invasive, comme
d’autres moyens disponibles, tels que la fibre optique endoscopique. Ces méthodes
permettent d’observer le déroulement de la déglutition et d’identifier les lieux de
dysfonctionnement, durant ce processus, avec une précision élevée.
"Mieux vaut prévenir que guérir" est le principe de base de la médecine en
général. C’est dans ce contexte que se situe ce travail de thèse pour la télésurveil-
lance des malades et plus spécifiquement pour suivre l’évolution fonctionnelle du
processus de la déglutition chez des personnes à risques dysphagiques, que ce soit
à domicile ou bien en institution, en utilisant le minimum de capteurs non-invasifs.
C’est pourquoi le principal signal traité dans ce travail est le son.
La principale problématique du traitement du signal sonore est la détection au-
tomatique du signal utile du son, étape cruciale pour la classification automatique
de sons durant la prise alimentaire, en vue de la surveillance automatique. L’étape
de la détection du signal utile permet de réduire la complexité du système d’analyse
sonore. Les algorithmes issus de l’état de l’art traitant la détection du son de la dég-
lutition dans le bruit environnemental n’ont pas montré une bonne performance.
D’où l’idée d’utiliser un seuil adaptatif sur le signal, résultant de la décomposition
en ondelettes.
Les problématiques liées à la classification des sons en général et des sons de

x
la déglutition en particulier sont abordées dans ce travail avec une analyse hiérar-
chique, qui vise à identifier dans un premier temps les segments de sons de la dég-
lutition, puis à le décomposer en trois sons caractéristiques, ce qui correspond par-
faitement à la physiologie du processus. Le couplage est également abordé dans ce
travail.
L’implémentation en temps réel de l’algorithme de détection a été réalisée. Cepen-
dant, celle de l’algorithme de classification reste en perspective. Son utilisation en
clinique est prévue.
Mots-clés : Déglutition, sons déglutitoires, décomposition en ondelettes, traite-
ment de signal, détection, classification, GMM, HMM.

xi


xiii
Acknowledgements
Firstly, I would like to express my sincere gratitude to several persons who helped
me morally and professionally to conduct this work. I owe a deep sense of gratitude
to my teachers, Mr. Dan ISTRATE, Mr. Jacques DEMONGEOT, Mr. Jérôme BOUDY
and Mr. Dhafer MALOUCHE, for their sincere guidance and inspiration in complet-
ing this project.
I am extremely thankful to Ms. Catherine MARQUE, Ms. Carla TARAMASCO,
Ms. Pascale CALABRESE, Ms. Gila BENCHETRIT, Ms. Pascale VIGNERON, Mr.
Atta BADII, Mr. Sofiane BOUDAOUD, Mr. Mounim A. EL YACOUBI, Mr. Hassan
ESSAFI, Mr. Antonio GLARIA, Mr Salim BOUZEBDA and all UTC members for
their kind guidance and encouragement.
Besides my advisors, I would like to thank my friends and my office colleagues,
Meriem YAHIAOUI, Khalida AZUDIN, Tomas RODENAS, Vincent ZALC, Teddy
HAPPILLON, Jean-Baptiste TYLCZ and Halim TANNOUS, Nassreddine NAZIH,
Ala Eddine YAHIAOUI, who have more or less contributed to the preparation of
this work.
To everyone I met during this project.
I thank my little brother, Zied, for his presence and understanding... I would like
to let him know how precious his presence was, during the months he stayed with
me.
Last but not the least, I would like to thank my family: my parents, my sisters
and my brothers for supporting me spiritually throughout writing this thesis and
my life in general.. . .


xv
Contents
Acknowledgements xiii
1 Introduction 1
1.1 Ageing of the population . . . . . . . . . . . . . . . . . . . . . . . . . . . 1
1.2 Dysphagia consequences . . . . . . . . . . . . . . . . . . . . . . . . . . . 3
1.2.1 Epidemiology of dysphagia . . . . . . . . . . . . . . . . . . . . . 3
1.2.2 Multidisciplinary care of dysphagia . . . . . . . . . . . . . . . . 4
1.3 Medical desertification . . . . . . . . . . . . . . . . . . . . . . . . . . . . 6
1.4 Telemedicine . . . . . . . . . . . . . . . . . . . . . . . . . . . . . . . . . . 8
1.5 e-SwallHome project . . . . . . . . . . . . . . . . . . . . . . . . . . . . . 10
1.6 Objectives . . . . . . . . . . . . . . . . . . . . . . . . . . . . . . . . . . . 11
1.7 Document organisation . . . . . . . . . . . . . . . . . . . . . . . . . . . . 12
2 Anatomy and Physiology 13
2.1 Swallowing and breathing: fundamental couple . . . . . . . . . . . . . 13
2.1.1 Anatomy . . . . . . . . . . . . . . . . . . . . . . . . . . . . . . . . 13
2.1.2 Physiology . . . . . . . . . . . . . . . . . . . . . . . . . . . . . . . 16
2.2 Dysphagia . . . . . . . . . . . . . . . . . . . . . . . . . . . . . . . . . . . 18
2.2.1 Etiology of Dysphagia . . . . . . . . . . . . . . . . . . . . . . . . 21
2.2.2 Semiology of dysphagia . . . . . . . . . . . . . . . . . . . . . . . 23
3 State-of-the-art 27
3.1 Screening for dysphagia . . . . . . . . . . . . . . . . . . . . . . . . . . . 27
3.2 Swallowing Monitoring Modalities . . . . . . . . . . . . . . . . . . . . . 32
3.3 Sound Recognition Domain . . . . . . . . . . . . . . . . . . . . . . . . . 42
3.4 Breathing monitoring . . . . . . . . . . . . . . . . . . . . . . . . . . . . . 54
3.5 Conclusion . . . . . . . . . . . . . . . . . . . . . . . . . . . . . . . . . . . 56

xvi
4 Proposed system 59
4.1 The proposed Automatic Detection Algorithm . . . . . . . . . . . . . . 59
4.1.1 The Gaussian mixture model . . . . . . . . . . . . . . . . . . . . 64
4.1.2 Hidden Markov Model (HMM) . . . . . . . . . . . . . . . . . . . 66
4.1.3 Local maximum detection algorithm . . . . . . . . . . . . . . . . 66
4.1.4 Classification types . . . . . . . . . . . . . . . . . . . . . . . . . . 68
4.2 Methods for breath analysis . . . . . . . . . . . . . . . . . . . . . . . . . 70
4.3 Conclusion . . . . . . . . . . . . . . . . . . . . . . . . . . . . . . . . . . . 71
5 Results 73
5.1 Recording protocol and swallowing monitoring database . . . . . . . . 73
5.1.1 Data acquisition protocol . . . . . . . . . . . . . . . . . . . . . . 73
5.1.2 Materials . . . . . . . . . . . . . . . . . . . . . . . . . . . . . . . . 76
5.1.3 Procedure and Database . . . . . . . . . . . . . . . . . . . . . . . 77
5.1.4 Sound signals . . . . . . . . . . . . . . . . . . . . . . . . . . . . . 78
5.1.5 Breathing signals . . . . . . . . . . . . . . . . . . . . . . . . . . . 83
5.2 Automatic detection algorithm results . . . . . . . . . . . . . . . . . . . 84
5.2.1 Evaluation methodology . . . . . . . . . . . . . . . . . . . . . . . 85
5.2.2 Developed detection application . . . . . . . . . . . . . . . . . . 86
5.3 Classification results . . . . . . . . . . . . . . . . . . . . . . . . . . . . . 88
5.3.1 Evaluation methodology . . . . . . . . . . . . . . . . . . . . . . . 88
5.3.2 Classification . . . . . . . . . . . . . . . . . . . . . . . . . . . . . 89
5.3.3 Assessment of Swallowing Sounds Stages . . . . . . . . . . . . . 97
5.4 Breathing analysis results . . . . . . . . . . . . . . . . . . . . . . . . . . 101
5.4.1 Discussion . . . . . . . . . . . . . . . . . . . . . . . . . . . . . . . 103
6 Conclusions and perspectives 105
Bibliography 109
A List of Publications 125
B Theory and Methods for signal processing and pattern recognition 127
B.1 Fourier Decomposition . . . . . . . . . . . . . . . . . . . . . . . . . . . . 127
B.1.1 Continuous Fourier transform . . . . . . . . . . . . . . . . . . . 127
B.1.2 Discrete Fourier Transform . . . . . . . . . . . . . . . . . . . . . 128

xvii
B.1.3 Fast Fourier transform . . . . . . . . . . . . . . . . . . . . . . . . 128
B.2 Wavelet Decomposition . . . . . . . . . . . . . . . . . . . . . . . . . . . 129
B.2.1 The Continuous Wavelet Transform . . . . . . . . . . . . . . . . 130
B.2.2 Discrete wavelet transform . . . . . . . . . . . . . . . . . . . . . 131
B.2.3 Fast wavelet transform . . . . . . . . . . . . . . . . . . . . . . . . 131
B.3 Acoustical features . . . . . . . . . . . . . . . . . . . . . . . . . . . . . . 133
B.4 The Gaussian mixture model . . . . . . . . . . . . . . . . . . . . . . . . 135
B.4.1 Expectation Maximisation (EM) algorithm . . . . . . . . . . . . 137
B.5 Markovian models . . . . . . . . . . . . . . . . . . . . . . . . . . . . . . 137
B.5.1 Markovian process . . . . . . . . . . . . . . . . . . . . . . . . . . 137
B.5.2 Hidden Markov Model (HMM) . . . . . . . . . . . . . . . . . . . 138
B.5.3 Forward-Backward Probabilities . . . . . . . . . . . . . . . . . . 139
B.5.4 Recognition method . . . . . . . . . . . . . . . . . . . . . . . . . 140
The a Posteriori Marginal Method (PMM) . . . . . . . . . . . . . 140
Viterbi algorithm . . . . . . . . . . . . . . . . . . . . . . . . . . . 141
EM algorithm for parameter estimation . . . . . . . . . . . . . . 142
C Identification grid for swallowing disorders and associated factors 145
D Information note-Consent 147
E Protocol 153
F Programs-codes 159


xix
List of Figures
1.1 Distributions of otolaryngologists on French territory . . . . . . . . . . 7
1.2 Distributions of physiotherapists on French territory . . . . . . . . . . . 7
2.1 Anatomy of human superior digestive system BCCampus (https://open-
textbc.ca/anatomyandphysiology/2303-anatomy-of-nose-pharynx-mouth-larynx/) 14
2.2 Respiratory and digestive tracts in Human . . . . . . . . . . . . . . . . 16
2.3 Lateral view of bolus propulsion during swallowing . . . . . . . . . . . 19
3.1 Dynamic sEMG topography in a swallowing process . . . . . . . . . . 37
3.2 Sensor placement on the body and Frame axes . . . . . . . . . . . . . . 42
3.3 Characteristics of the swallowing sound wave . . . . . . . . . . . . . . 50
4.1 Global Proposed System . . . . . . . . . . . . . . . . . . . . . . . . . . . 60
4.2 Diagram of the automatic detection algorithm . . . . . . . . . . . . . . 60
4.3 Wavelet decomposition into 12 levels . . . . . . . . . . . . . . . . . . . . 61
4.4 Reconstructed Signal as linear combination of selected details . . . . . 62
4.5 Procedure of detection algorithm with different calculated features . . 63
4.6 Recognition process . . . . . . . . . . . . . . . . . . . . . . . . . . . . . . 65
4.7 Hidden Markov Model algorithm . . . . . . . . . . . . . . . . . . . . . . 66
4.8 Local maximum detection algorithm . . . . . . . . . . . . . . . . . . . . 67
4.9 The Visuresp interface . . . . . . . . . . . . . . . . . . . . . . . . . . . . 71
5.1 Best microphone position (in yellow) . . . . . . . . . . . . . . . . . . . . 77
5.2 A typical swallowing sound (a) time-domain signal (b) the correspond-
ing spectrogram. (’au’ arbitrary units for normalised amplitude Aboofazeli
and Moussavi (2004)) . . . . . . . . . . . . . . . . . . . . . . . . . . . . . 79
5.3 A typical swallowing sound of water in time-domain signal and its
corresponding spectrogram . . . . . . . . . . . . . . . . . . . . . . . . . 82
5.4 Microphone position on Visuresp gilet . . . . . . . . . . . . . . . . . . . 82

xx
5.5 Respiratory signals and the corresponding apnea segment . . . . . . . 84
5.6 Result of the proposed automatic detection algorithm . . . . . . . . . . 85
5.7 Some examples of automatic detection and errors that can be vali-
dated by the detection algorithm where green panels refer to reference
event and pink panels refer to detections . . . . . . . . . . . . . . . . . 85
5.8 Graphical interface of the recording and detection application in real
time . . . . . . . . . . . . . . . . . . . . . . . . . . . . . . . . . . . . . . . 87
5.9 Detection results . . . . . . . . . . . . . . . . . . . . . . . . . . . . . . . . 87
5.10 Classification evaluation process with leave-one-out approach . . . . . 89
5.11 Good recognition rate per class using manually annotated segments . 90
5.12 Good recognition rate per class using sounds obtained from micro-
phone fixed on the vest . . . . . . . . . . . . . . . . . . . . . . . . . . . . 92
5.13 Good recognition rate per class using Grenoble database . . . . . . . . 92
5.14 Good recognition rate per class using different data . . . . . . . . . . . 93
5.15 Spectrograms of the sounds of compote swallowing . . . . . . . . . . . 94
5.16 Spectrograms of the sounds of water swallowing . . . . . . . . . . . . . 94
5.17 Spectrograms of the sounds of saliva swallowing . . . . . . . . . . . . . 94
5.18 Good recognition rate per class using manual annotated swallowing
sounds according to textures . . . . . . . . . . . . . . . . . . . . . . . . . 95
5.19 Typical decomposition of the swallowing sound into three character-
istic sounds . . . . . . . . . . . . . . . . . . . . . . . . . . . . . . . . . . 98
5.20 Respiratory signal and detected boundaries of respiratory phases (in-
spiration and expiration) during the subject’s rest . . . . . . . . . . . . 102
5.21 Results of automatic detection on the synchronized sound and respi-
ratory signals . . . . . . . . . . . . . . . . . . . . . . . . . . . . . . . . . 102
B.1 Wavelet Functions Examples . . . . . . . . . . . . . . . . . . . . . . . . 132
B.2 Mel filter bank (containing 10 filters and starts at 0Hz and ends at
8000Hz) . . . . . . . . . . . . . . . . . . . . . . . . . . . . . . . . . . . . . 134
B.3 Steps of MFCC features calculation . . . . . . . . . . . . . . . . . . . . . 134
C.1 Identification grid for swallowing disorders and associated factors
(Desport et al., 2011) . . . . . . . . . . . . . . . . . . . . . . . . . . . . . 146

xxi
List of Tables
3.1 State-of-the-art summary . . . . . . . . . . . . . . . . . . . . . . . . . . . 53
4.1 Roll-off point calculated according to textures (*Comp=Compote) . . . 62
4.2 Correspondence of the coefficients in mel and frequency scales for
each coefficient using 24 filters . . . . . . . . . . . . . . . . . . . . . . . 65
5.1 Sound database . . . . . . . . . . . . . . . . . . . . . . . . . . . . . . . . 78
5.2 Swallowing event duration . . . . . . . . . . . . . . . . . . . . . . . . . 81
5.3 Swallowing event duration according to textures . . . . . . . . . . . . . 81
5.4 Grenoble’s database (acquired as part of the e-SwallHome project by
Calabrese et al. (1998)) . . . . . . . . . . . . . . . . . . . . . . . . . . . . 83
5.5 Sehili’s database . . . . . . . . . . . . . . . . . . . . . . . . . . . . . . . . 83
5.6 Automatic detection results . . . . . . . . . . . . . . . . . . . . . . . . . 88
5.7 Confusion matrix of the classification of manually annotated segments 91
5.8 Automatic Detection Algorithm results for data obtained from micro-
phone attached to the vest . . . . . . . . . . . . . . . . . . . . . . . . . . 91
5.9 Confusion matrix using sounds obtained from microphone fixed on
the vest . . . . . . . . . . . . . . . . . . . . . . . . . . . . . . . . . . . . . 92
5.10 Confusion matrix of Grenoble database . . . . . . . . . . . . . . . . . . 93
5.11 Confusion matrix of the classification of manually annotated swal-
lowing sounds according to textures . . . . . . . . . . . . . . . . . . . . 95
5.12 Confusion matrix of the classification of automatically detected sounds 97
5.13 Confusion matrix of the classification of automatically detected swal-
lowing sounds according to textures . . . . . . . . . . . . . . . . . . . . 97
5.14 Swallowing phases duration for Water sounds . . . . . . . . . . . . . . 97
5.15 Swallowing phases duration for Compote sounds . . . . . . . . . . . . 97
5.16 Mean ± standard deviation for delay in detection of boundaries of
swallowing sound phases obtained by HMM . . . . . . . . . . . . . . . 99
xxii
5.17 Confusion matrix of the classification of water sounds of the swallow-
ing phases using HMM . . . . . . . . . . . . . . . . . . . . . . . . . . . . 99
5.18 Delays in detection boundaries of swallowing phases in water sounds
(ms) . . . . . . . . . . . . . . . . . . . . . . . . . . . . . . . . . . . . . . . 99
5.19 Confusion matrix of the classification of compote sounds of the swal-
lowing phases using HMM . . . . . . . . . . . . . . . . . . . . . . . . . 100
5.20 Delays in detection boundaries of swallowing phases in compote sounds
(ms) . . . . . . . . . . . . . . . . . . . . . . . . . . . . . . . . . . . . . . . 100
5.21 Confusion matrix of the classification of water sounds of the swallow-
ing phases using local maximum algorithm . . . . . . . . . . . . . . . . 100
5.22 Confusion matrix of the classification of compote sounds of the swal-
lowing phases using local maximum algorithm . . . . . . . . . . . . . . 100
5.23 Delays in detection boundaries of swallowing phases in water sounds
(ms) . . . . . . . . . . . . . . . . . . . . . . . . . . . . . . . . . . . . . . . 101
5.24 Delays in detection boundaries of swallowing phases in compote sounds
(ms) . . . . . . . . . . . . . . . . . . . . . . . . . . . . . . . . . . . . . . . 101
F.1 Automatic detection results . . . . . . . . . . . . . . . . . . . . . . . . . 162

xxiii
List of Abbreviations
ANR National Research Agency NRA
BTS Bolus Transit Sound
CA Cervical Auscultation
DREES Directorate of Research, Studies, Evaluation and Statistics
DWT Discrete Wavelet Transform
ECPFR Echelles Cliniques Prédictives de Fausse Route
EGG Electroglottography
EM Expectation Maximisation
EMG Electromyography
ENMG Electroneuromyogram
FAR False Alarm Rate
FDS Final Discrete Sound
FEES Fiberoptic Endoscopic Evaluation Swallowing
FFT Fast Fourier Transform
GMM Gaussian Mixture Model
GUSS Gugging Swallowing Screen
HMMs Hidden Markov Models
ICT Information an Communication Technologies
IDS Initial Discrete Sound
IESEI Inspiration Expiration Swallowing Expiration Inspiration
IESI Inspiration Expiration Swallowing Inspiration
ISEI Inspiration Swallowing Expiration Inspiration
IMU Inertial Measurement Unit
INED National Institute for Demographic Studies
INSEE National Institute of Statistics and Economic Studies
KNN K-Nearest Neighbours
LDA Linear Discriminant Analysis
LES Lower Esophageal Sphincter

xxiv
LFCC Linear Frequency Cepstral Coefficients
LIRA Limited Receptive Area
MEBD Modified Evan’s Blue Dye
MER Missed Event Rate
MFCC Mel Frequency Cepstral Coefficients
MsFS Mel-scale Fourier Spectrum
ORR Overall Recognition Rate
PASS Practical Aspiration Screening Schema
PER Partial Event Rate
RIP Respiratory Inductance Plethysmography
sEMG Surface Electromyography
STFT Short Time Fourier Transform
SVM Support Vector Machine
TOR-BSST Toronto Bedside Swallowing Screening Test
UES Upper Oesophageal Sphincter
VER Validated Event Rate
VFSS Videofluoroscopic Swallowing Study
WDT Waveform Dimension Trajectory
WFD Waveform Fractal Dimension
WHO World Health Organization
WPD Wavelet Packet Decomposition

1
Chapter 1
Introduction
Breathing, drinking, eating, protection from cold and heat are among the essential el-
ements for survival. Some primary needs are met by nature, including breathing, but
the majority of them are not and require voluntary action by the individual. Among
them, swallowing is one of these needs. Swallowing is a complex and vital process
in humans. It provides two vital functions at once: nutrition and protection of the
respiratory tract. Swallowing, defined as a voluntary act, enables transport of sub-
stance, saliva or liquid or chewed solids, from the oral cavity to the stomach passing
through the pharynx, œsophagus while ensuring the airways security. Swallowing
is a repetitive act that occurs 300 times per hour during a meal and is estimated to
occur about 600 to 2000 times a day in healthy people Amft and Troster (2006). Eat-
ing and drinking are physiological necessities, but also a source of individual and
social pleasure. Indeed, to eat is to gather, to share, to desire, to see, to smell, to
salivate, to taste, and so on. If eating is a necessity for everyone, a pleasure for many,
a sin for some, it is also a danger for others. Difficulties in swallowing, disorders
are known as dysphagia. Dysphagia can occur at any age, but it is more common in
older adults in general and their management requires a multidisciplinary approach
to recognise, characterise and propose rehabilitation measures. However, in France,
the number of practitioners is decreasing across the healthcare professions including
general practitioners, specialised doctors or medical auxiliaries.
1.1 Ageing of the population
Dysphagia in the elderly is called presbyphagia. It can be divided into two cate-
gories: (i) Primary presbyphagia which refers to the effects of normal ageing on the
organs involved in swallowing and (ii) Secondary presbyphagia which refers to the

2 Chapter 1. Introduction
accumulation of normal aging and related changes to diseases which can lead to se-
vere dysphagia such as stroke and Parkinson’s disease. Mccomas, Upton, and Sica
(1974) found that there is a little loss of functioning motoneurons before the age of
60 years but there is a striking and progressive depletion subsequently with age,
by applying electrical stimuli of low, gradually increasing intensity, to single motor
units.
As a world phenomenon, the ageing populations effects both developed and
emerging countries. The French population like other European peoples is also age-
ing.People aged 65 and over increased from 13.9% in 1990 to 18.8% in 2016. The chal-
lenge will be to adapt the capacities of the structures caring the loss of autonomy so
that they accompany this important increase. By 2050, according to the population
projections calculated by Eurostat, the number of people aged 65 and over would be
27.2% which is a significant and increasing demographic trend.
Swallowing disorders are common in the elderly, from 9% for those aged 65 to
74 living at home to 28% after 85 years Audrey (2013). Previous studies estimate
that the prevalence of dysphagia after stroke ranges from 33% to 73% Mann, Han-
key, and Cameron (2000) and Paciaroni et al. (2004). In another study, cited by var-
ious authors, Greuillet and Couturier estimate a prevalence ranging from 12% to
68% among institutionalised elderly populations. For home-stay patients, a ques-
tionnaire study found that 10% to 16% had symptoms of dysphagia Audrey (2013).
In institutions, dysphagia reaches 30% to 60%. According to the Nestlé Institute of
Health Science Science (2016), 40% of people over 75 have swallowing disorders. Up
to 66% of those affected are residents of a Medico-Social Institution.
As the world’s population ages, these statistics will increase. In France, the per-
centage of people living alone in their homes between 65 and 79 years is 27.1%
whereas for people aged 80 or over is 48.8% according to the National Institute of
Statistics and Economic studies (INSEE). The higher risks associated with dyspha-
gia for those living alone, make for an alarming situation given that a significant
percentage of dysphagic elderly live in institutions and at home.
Ageing, according to Stedman’s Medical Dictionary (26th edition, p 38) is "the
gradual deterioration of a mature organism from time-dependent irreversible changes
in structure that are intrinsic to the particular species, and that eventually lead to a
decreased ability to cope with the stresses of the environment, thereby increasing
1.2. Dysphagia consequences 3
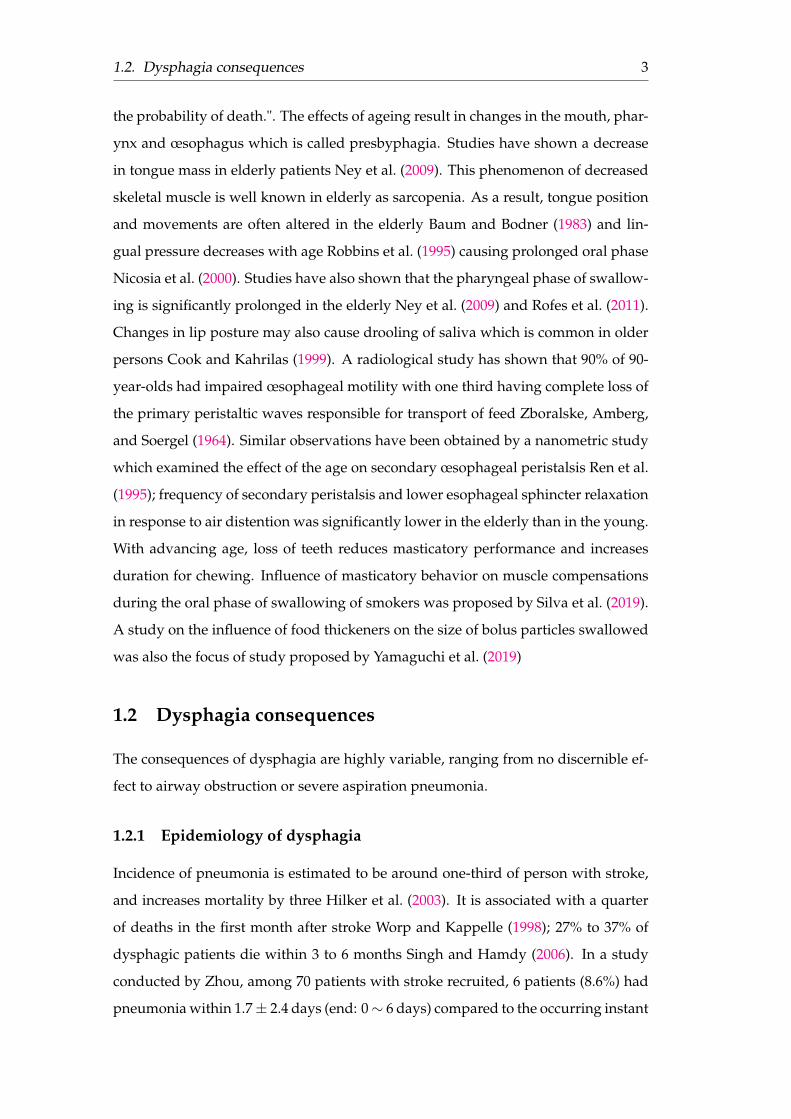
the probability of death.". The effects of ageing result in changes in the mouth, phar-
ynx and œsophagus which is called presbyphagia. Studies have shown a decrease
in tongue mass in elderly patients Ney et al. (2009). This phenomenon of decreased
skeletal muscle is well known in elderly as sarcopenia. As a result, tongue position
and movements are often altered in the elderly Baum and Bodner (1983) and lin-
gual pressure decreases with age Robbins et al. (1995) causing prolonged oral phase
Nicosia et al. (2000). Studies have also shown that the pharyngeal phase of swallow-
ing is significantly prolonged in the elderly Ney et al. (2009) and Rofes et al. (2011).
Changes in lip posture may also cause drooling of saliva which is common in older
persons Cook and Kahrilas (1999). A radiological study has shown that 90% of 90-
year-olds had impaired œsophageal motility with one third having complete loss of
the primary peristaltic waves responsible for transport of feed Zboralske, Amberg,
and Soergel (1964). Similar observations have been obtained by a nanometric study
which examined the effect of the age on secondary œsophageal peristalsis Ren et al.
(1995); frequency of secondary peristalsis and lower esophageal sphincter relaxation
in response to air distention was significantly lower in the elderly than in the young.
With advancing age, loss of teeth reduces masticatory performance and increases
duration for chewing. Influence of masticatory behavior on muscle compensations
during the oral phase of swallowing of smokers was proposed by Silva et al. (2019).
A study on the influence of food thickeners on the size of bolus particles swallowed
was also the focus of study proposed by Yamaguchi et al. (2019)
1.2 Dysphagia consequences
The consequences of dysphagia are highly variable, ranging from no discernible ef-
fect to airway obstruction or severe aspiration pneumonia.
1.2.1 Epidemiology of dysphagia
Incidence of pneumonia is estimated to be around one-third of person with stroke,
and increases mortality by three Hilker et al. (2003). It is associated with a quarter
of deaths in the first month after stroke Worp and Kappelle (1998); 27% to 37% of
dysphagic patients die within 3 to 6 months Singh and Hamdy (2006). In a study
conducted by Zhou, among 70 patients with stroke recruited, 6 patients (8.6%) had
pneumonia within 1.7± 2.4 days (end: 0∼ 6 days) compared to the occurring instant

4 Chapter 1. Introduction
of stroke. In a retrospective study of 40 dysphagic patients in the geriatric category,
Croghan et al. (1994) described the occurrence of pneumonia in 43% within one year
compared to the first videoradioscopic examination of swallowing and at 30% of
deaths related to these pneumonias.
Dysphagia is responsible for about 4000 deaths per year in France Audrey (2013).
According to the National Institute for Demographic Studies (INED), the mortality
rate in France in general population in relation to suffocation by swallowing disorder
is 5.99 per 100000 for men, and 6.1 per 100000 for women.
The consequences of dysphagia are multiple, ranging from a deterioration in a
patient’s quality of life to death. The medical management of dysphagia for reha-
bilitation purposes requires multidisciplinary care to ensure rehabilitation and good
practice of swallowing and to avoid any incidence of dysphagia.
1.2.2 Multidisciplinary care of dysphagia
The objective of the management of swallowing disorders is to ensure a feeding
modality that guarantees the safest possible nutritional state with regard to respira-
tory function and respects the person’s quality of life as much as possible, whether
in terms of reducing the discomfort caused by the dysphagia experienced or in terms
of eating pleasure. For populations at risk of swallowing disorders, the prevention
of complications of this disorder leads to the development of screening tests based
on care protocols. For a patient for whom the diagnosis of dysphagia has been con-
firmed, the clinician must understand the cause of the disorder and how well it is
tolerated.
Following a swallowing complication, the diagnosis of dysphagia begins with a
simple questioning of the patient and his or her relatives. Clinical examination is
essential for the diagnosis of dysphagia, but it is not effective in detecting and pre-
venting cases of food chocking, which are often silent. The treatment of dysphagia
is mainly etiological. Videoradiography is the gold standard for determining the
mechanism of dysphagia and the modalities of symptomatic treatment. Rehabilita-
tion and adaptation of food textures Ross et al. (2019) to the mechanisms of dyspha-
gia can help preserve oral nutrition. In addition to enteral nutrition, maintaining an
oral diet is important to preserve the patient’s quality of life Professionnelles (2007)
and Audrey (2013). This involves multidisciplinary follow-up.

1.2. Dysphagia consequences 5
The therapeutic aspect is essentially based on multidisciplinary care that requires
cooperation between medical staff (doctors, the nursing staff), the patient, their fam-
ily or the members of the institution where they reside. Rehabilitation and dietary
management techniques are the most widespread.
The nurse ensures the good practice of medical and logopedic instructions and
tracks the warning signs encountered during food intake.
Otorhinolaryngology physicians perform a detailed clinical assessment such as
screening test with replenishment such as the "3 Oz Water Swallow Test" validated
by DePippo, Holas, and Reding (1993), which is considered perfectly adapted to
stroke victim population Bassols and Puech (2011), and also, the functional ability
test of swallowing by Guatterie and Lozano (2005). In addition, the no-feedback
test is presented as predictive aspiration clinical scales ECPFR (Echelles Cliniques
Prédictives de Fausse Route). Practical Aspiration Screening Schema (PASS) Zhou
(2009) combines the ECPFR and the 3 Oz Water Swallow Test.
There is also the Videofluoroscopic Swallowing Study (VFSS), which is a tech-
nique used to observe and film radiographic swallowing to follow the food bolus
coated with a product that allows contrast. Videofluoroscopy makes the entire swal-
lowing process visible. In case of an aspiration, it enables quite precisely, the de-
termination as to how much material has entered the airways, at what level, when
and how the patient responds Martin-Harris and Jones (2008). VFSS enables the to
determination of the effect of various behavioural and sensory interventions on the
physiological function of the swallowing mechanism. However, these techniques
are invasive and uncomfortable requiring an active patient participation, and are
therefore not always applicable in the elderly.
After a detailed clinical assessment, the therapist identifies appropriate strategies
in order to re-educate the deficit phase. The physiotherapist manages the respiratory
function by using various techniques. The ergotherapist ensures the optimal use of
rehabilitative skills in the management of daily life activities or the compensation of
deficits by use of appropriate technical aids. The dietician adapts the diet in relation
to medical and logopedic instructions, but also to the taste of the patient and realises
the feasibility of these recommendations in an institution. The psychologist detects
a possible depressive reaction syndrome, ensures the acceptance of the disease and
the integration of the patient in their environment.

6 Chapter 1. Introduction
1.3 Medical desertification
Today, in France, few territories in the regions still escape medical desertification.
According to statistics published by the Directorate of Research, Studies, Evaluation
and Statistics (DREES), otolaryngologists and head and neck surgery physicians and
physiotherapists are not evenly distributed across the territory. However, there are
disparities between regions. Figures 1.1 and 1.2 show the distribution of otolaryn-
gologists and physiotherapists on French territory. Overall, the otolaryngology has
a density of 4.6 otolaryngologists per 100 000 inhabitants. Thus, the Ile-de-France
have privileged access to this medical service with a density of 6.6 otolaryngologists
per 100 000 inhabitants. According to the Demography of Physiotherapists report
(Situation on 31 August 2017), the average French number of physiotherapists per
10 000 inhabitants is 12.6. This Figure can be described as low compared to other
European countries such as Belgium which have 25.8 physiotherapists per 10 000
inhabitants.
Also, the management of dysphagia must, in order to be effective, be carried
out in collaboration with the family and staff of the institution in which the person
resides. This could not be the case according to the large number of people living
alone. Clear and accurate information must be provided so that the evolution of
the disorder and its possible complications can be understood, Allepaerts, Delcourt,
and Petermans (2008). Access to care in good conditions, participation in the choices
that concern them; continuing to have confidence in their health system: these are
the expectations of patients and users, especially patients at risk.
The complexity and compartmentalization of the current system often enable
the patient to coordinate the different professionals themselves. A complexity that
professionals feel every day and that patients perceive in their daily lives. Social
difficulties such as ageing, increased health spending and medical deserts are also
relevant.
The reforms to be undertaken to overcome these difficulties can only be envis-
aged in a global approach including the hospital and the medico-social sector. This
transformation must aim to improve all subjects: access to care, prevention, quality
of care, regulation of health insurance expenditure, but also the medico-social link,
the transformation of the hospital and the modernisation of medicine. It is the en-
tire health system that must be challenged to meet today’s challenges and prepare

1.3. Medical desertification 7
Figure 1.1: Distributions of otolaryngologists on French territory
Figure 1.2: Distributions of physiotherapists on French territory
for tomorrow’s health system. To do so, the patient must more than ever be at the
centre of future thinking and developments. From this point of view, medicine is
evolving and starting on "e-health".
8 Chapter 1. Introduction
e-health is a multi-disciplinary domain which involves many stakeholders, in-
cluding clinicians, researchers and scientists with a wide range of expertise in health-
care and engineering. Digital health is the convergence of digital technologies with
healthcare, living, and society to enhance the efficiency of healthcare delivery and
make medicine more personalised and precise. It involves the use of information
and communication technologies to help to address the health problems and chal-
lenges faced by patients. These technologies include both hardware and software
solutions and services, including telemedicine.
1.4 Telemedicine
Telemedicine is the performance of a remote medical procedure. Telemedicine brings
together medical practices permitted or facilitated by telecommunications. It is an
exercise in medicine by use of telecommunications and technologies that enables
distance health benefits and the exchange of medical information related to it. Dif-
ferent in application, telemedicine has to provide a rapid medical response to a pa-
tient’s problem. It makes it possible to establish a preventive follow-up or a post-
therapeutic follow-up for patients at risk. Already in 2016, the World Health Or-
ganisation (WHO-Organisation Mondiale de la Santé OMS) reported on e-health in
Europe encouraged the deployment of national health policies on telemedicine. De-
livering e-health, i.e. the use of information and communication technologies (ICT)
for health is a relatively recent healthcare practice dating back to at least 1999 Mea
(2001). e-health is considered as the death of telemedicine; "e-health can be consid-
ered to be the health industry equivalent of e-commerce:". e-health is deemed to be a
fashionable name for telemedicine. It includes electronic/digital processes in health,
namely health applications. Telemedicine has four components:
• Tele-consultation: which is a remote consultation,
• Tele-regulation: which takes the form of a service that puts a person in touch
with an operator if there is a problem at home,
• Tele-expertise: when doctors consult each other between them, and
• Tele-monitoring which is a remote monitoring of a patient by transmission of
medical data between patients and different medical staffs.

1.4. Telemedicine 9
Telemedicine was born in medical practice in the 1970s in rural America and
northern Norway. It has also been tested very early independently in 1966 in USA,
Russia and France with telephonic transmission of ECGs. It has been said that it orig-
inated in January 1905 in Netherlands, when W. Einthoven’s assistant transmitted a
ECG record via a telephone line from the hospital of Leyden to his laboratory located
1.5 kms away. Telemedicine aims to optimise the care of the patient upstream of his
care path, giving him access to a general practitioner through a videoconference con-
sultation. Telemedicine uses signals obtained from different sensors, installed in the
patient’s home or in intelligent socio-medical institutions, in order to extract infor-
mation needed for diagnosis. This first step enable direct orientation according to
their situation, for a physical consultation or referral to a specialist. It is the birth of
a hybrid model that alternates physical and remote consultations between a doctor
and his patient. Above all, it provides the patient with a panel of specialists who can
follow him at regular intervals, overcoming the obstacle of distance. Beyond the re-
mote consultation, the monitoring of physiological parameters can be carried out in
real time or in a delayed manner if the data are stored. The surveillance is willing to
follow the progress of a patient at risk which in some cases becomes vital. This aspect
is very important in the case of patients at risk of dysphagia that can lead to dramatic
consequences even the death of the patient if intervention is not timely. Therefore,
telemedicine opens up new opportunities and better access to health care, particu-
larly for emergencies where a diagnosis must be made quickly. These technologies
can significantly improve access to health care, especially in medical deserts.
In Europe, telemedicine is developing rapidly. In France, it has been included
in the Public Health Code since 2010, and is governed by the HSPT law (hospi-
tal, health, patients, territory). Since January 2019, the teleconsultation act has been
recognised and reimbursed by the national health insurance fund. Doctors are in
favour of the evolution of this technology. Already today, 84% of them use smart-
phones or digital tablets in their work. Telemedicine is a recent phenomenon in the
health field consisting of the use of services that allow clinicians and patients to come
into direct contact, almost instantaneously, through the use of new technologies.
The work of this thesis is part of the telemedicine and it is presented as a telemon-
itoring application. It is based on the processing of sound signals acquired during
food intake.

10 Chapter 1. Introduction
1.5 e-SwallHome project
The work of this thesis is part of the e-SwallHome (Déglutition & Respiration : Mod-
élisation et e-Santé à domicile) project. e-SwallHome, funded by National Research
Agency (ANR), aims to explain the normal behaviour of three coupled functions
in humans; swallowing, breathing and phonation, to better understand the mech-
anisms underlying dysphagic, dysphonic and dyspnoeic pathological behaviours,
following in particular a stroke. To do so, it works on a set of protocols for diag-
nosis, home monitoring, education and rehabilitation in subjects at risk of death by
aspiration, asphyxiation or fall without the possibility of voicing any oral expres-
sions as warning signals.
The theme of e-SwallHome is e-health which brings all applications of Infor-
mation and Communication Technologies (ICT) in the field of health, with a wider
scope than telemedicine. This discipline aims at the use of distance medicine aiming
at well-being on topics related to medicine but without medical constraints. Thus
focus on, home-based tele-accompaniment, combining technological innovation in
health and contributing, through a better acceptability on the part of the patient, to
the improvement of adherence to therapeutic recommendations and rehabilitation
protocols (by speech therapists and physiotherapists), and thus to prevent the com-
plications induced by chronic dyspnoea / dysphagia / dysphonia disorders related
to the initial stroke.
The target population in the e-SwallHome project is healthy subjects and pa-
tients who have suffered from stroke. Healthy subjects included in this study must
be aged between 18 and 40 years, raised in a monolingual French-speaking environ-
ment and not presenting language, neurological and/or psychiatric disorders. Vol-
unteers signed an informed consent form. The inclusion criteria for stroke patients
included in this project were to be more than 18 years of age, first cerebral infraction
and confirmed by MRI ≤ 15 days, absence of severe leukoaraiosis, swallowing dis-
orders identified by a GUSS scale less than 20, identified neurological deficit and the
patient has to be able to cooperate.
This thesis is part of the research project e-SwallHome. In revising the initial as-
sumption of inclusion criteria of patients, has been reoriented to include only healthy
subjects due to lack of access to patient’s medical records. So, it was proposed to
work only with healthy subjects while keeping the same objectives of e-SwallHome

1.6. Objectives 11
project to be used subsequently for evaluating pathological signals in this study.
1.6 Objectives
The thesis subject, proposed as part of the diagnosis system described above, based
on home telemonitoring, participates in the home monitoring of patients suffer-
ing from dysphagia, by proposing automatic monitoring methods and evaluation
of functional rehabilitation. The end goal of this PhD is to develop a tool able to
monitor swallowing in real time using the least invasive sensor, ambulatory, while
ensuring the comfort and the good quality of the daily life of the person. Limited
to data in healthy subjects, the proposed system has to be a part of a rehabilitation
support that could be provided to the patient and clinicians.
This PhD study enables telemonitored patients to follow the pregress of people
at risk. More specifically, it concerns dysphagia in the elderly and seeks to identify
automatically the specific characteristics that could be used in the assessment of the
health status of patients at risk of dysphagia.
The analysis and extraction of information from the sound is an important as-
pect for medical telemonitoring of dysphagia. In this context, this thesis analyses
and proposes solutions to the problems specific to sound processing for medical
telemonitoring. In addition, breath signal analyses are also performed for the same
purposes.
Among these problems, the automatic classification of sounds of swallowing in
the context of everyday life has been little explored and a sound analysis system is
proposed. This thesis sets out the problems and objectives of medical telemonitoring
of dysphagia. The study of the sound signal must be able to highlight the various
characteristics of the normal functional state of swallowing process and thus also the
state of its malfunctioning.
Among the problems of telemonitoring that have been studied in this thesis are:
signal quality, and adaptation of sound recognition techniques to the classification
of sounds of swallowing in everyday life during food intake.
The quality of the signal influences the result of the recognition and signal pro-
cessing systems. Taking into account the difficulties related to the quality of the
signal, the work of this thesis focused on the signals with a sampling frequency of

12 Chapter 1. Introduction
16 kHz as well as its treatment by decomposing it in order to extract the most signif-
icant frequency bands as assessed to be adequate for the processing of swallowing
events. This step must guarantee the best performance of the used algorithms in
terms of the error rate, which is an important problem. The algorithms must ensure
sufficient performance.
To be able to test, improve and validate the algorithms proposed in this thesis,
a database was created as there was no access available to existing databases. An
adaptation of sound recognition techniques has been carried out. The frequency
characteristic of swallowing and those of other sound classes have differences and
similarities, which requires finding suitable parameters to differentiate them.
1.7 Document organisation
The document starts with an introduction followed by a physiological description of
the swallowing process and anatomy. Chapter 2 presents the etiology and semiology
of dysphagia. Chapter 3 presents the state-of-the-art of the different methodologies
for investigating the swallowing process and the different modalities used. Chapter
4 describes the different methodologies used and proposed in this work for the pro-
cessing of sound and respiratory signals. Chapter 5 describes the data acquisition
protocol followed, the sensors proposed and the procedure followed. The results
of the methodology for performing the tests built to validate detection, classifica-
tion and detection-classification coupling are presented in Chapter 6. The document
concludes with conclusions and perspectives in Chapter 7 and the Appendices.

13
Chapter 2
Anatomy and Physiology
Swallowing is the set of coordinated acts that ensure the transfer of solid food or
liquids from the mouth to the stomach, through the pharynx and oesophagus. Ac-
cording to Guatterie and Lozano (2005), dysphagia is the difficulty of performing the
action of eating, to swallow with a feeling of discomfort or stop in the transit, painful
or not, with possible misconceptions when swallowing food, liquids or saliva and,
by extension, any abnormalities in the passage of food to the stomach. To be able to
monitor the swallowing process, understanding the normal physiology and patho-
physiology of swallowing is fundamental to evaluate the signs of the swallowing
disorders and develop dysphagia rehabilitation programs.
2.1 Swallowing and breathing: fundamental couple
The oral cavity, larynx, pharynx and œsophagus are the structures used in swallow-
ing. They are described by Bassols and Puech (2011), which will serve as the main
reference for anatomy. Figure 2.1 shows the anatomy of the upper human digestive
system.
2.1.1 Anatomy
The oral cavity is composed of several structures which are involved in swallowing:
The lips close the oral cavity and maintain the food between the cheeks and teeth
during chewing. The tongue with a mobile front is connected to the pharynx and the
edge of the epiglottis by the glossoepiglottic fold on each side of which are located
the valleys.The soft palate forms with its front and rear pillars and the palatal tonsils,
the isthmus of the throat, passage between the oral cavity and the oropharynx. The
mandible is mobilised by muscular activity in all three planes to crush the food with

14 Chapter 2. Anatomy and Physiology
Figure 2.1: Anatomy of human superior digestive system BCCam-pus (https://opentextbc.ca/anatomyandphysiology/2303-anatomy-of-nose-
pharynx-mouth-larynx/)
the teeth before swallowing: the pieces decrease in size and are unsalivated. The
mouth floor is made up of three of the suprahyoid muscles that connect the mandible
with hyoid bone: digastric, mylo-hyoidal and geniohyoidal.
The larynx is located at the front of the neck, it is moored at the top to the base
of the tongue and bone hyoid, below it extends into the trachea. This musculocar-
tilaginous duct communicates with the pharynx backwards. The larynx performs
the functions of breathing, swallowing and phonation and can be considered as a
valve that opens and closes the glottis. The larynx is divided into three levels. The
supraglottic stage, or vestibule, is located above the vocal cords and includes the
ventricular bands. The glottic layer corresponds to the plane of the vocal cords. The
subglottic layer, located under the vocal cords, extends from the lower part of the
vocal folds to the lower edge of the cricoid cartilage. The laryngeal skeleton consists
of cartilage, among which two important joints can be mentioned. The crico-thyroid
joint enables the thyroid cartilage to shift from the thyroid cartilage to the cricoid

2.1. Swallowing and breathing: fundamental couple 15
cartilage, and thus to put the vocal cords under tension. The crico-arytenoid joint
enables the arytenoid cartilage to shift in or out the cricoid cartilage to bring the
strings closer or further apart, as well as a forward or backward shift to change their
length. The larynx consists of two categories of muscles. The intrinsic muscles en-
able adduction or abduction movements, as well as than tension or relaxation of the
vocal cords. The constrictor and tightening muscles bring the vocal folds closer to-
gether in order to close the glottis when swallowing, and the dilators open the glottis
for breathing. The extrinsic muscles ensure the suspension and mobility of the lar-
ynx in the neck. Some are subhyoidal and lower the larynx and hyoid bone, others
are suprahyoids and elevators of the larynx and hyoid bone.
The pharynx is located behind the oral, nasal and laryngeal cavities, this con-
duit musculomembranous consists of constrictor muscles, responsible for pharyn-
geal peristalsis, and elevating muscles. It is divided into three floors. The rhinophar-
ynx is located behind the nasal passages; its role is respiratory and it is closed by the
velopharyngeal sphincter during the oral time of swallowing. The oropharynx, be-
hind the oral cavity, is the crossroads of the aerodigestive pathways: the swallowed
food bowl and the breathed air circulate through it. It contains the pillars anterior
and posterior of the soft palate, the tongue base, the valleys and the face lingual
epiglottis. The hypopharynx circles the larynx backwards and sideways and ends at
the bottom with the œsophagus. It contains the piriform sinuses which are a depres-
sion of the mucous membrane between the larynx and pharynx forming two cavities
through which the food bolus passes during swallowing.
The œsophagus is a muscular tube connecting the pharynx with the stomach.
The œsophagus is lined by moist pink tissue called mucosa. The upper œsophageal
sphincter (UES) is a bundle of muscles at the top of the œsophagus. The muscles of
the UES are under conscious control, used when breathing and eating and keep food
and secretions from going down the trachea. The lower œsophageal sphincter (LES)
is a bundle of muscles at the low end of the œsophagus, where it meets the stomach.
The LES muscles are not under voluntary control.
As acknowledged, swallowing and breathing are a paradoxical couple because of
the common structure involved in both functions. The breathing air passes through
the mouth or nose, pharynx, larynx and trachea. The air of phonation uses the lar-
ynx, pharynx, mouth and nose. The swallowed food passes through the mouth,
pharynx and œsophagus. Breathing, phonation and swallowing therefore share a

16 Chapter 2. Anatomy and Physiology
common crossroads: the mouth and pharynx. Figure 2.2 shows simultaneously the
respiratory and digestive tracts.
Figure 2.2: Respiratory and digestive tracts in Human
2.1.2 Physiology
Swallowing is a process resulting from muscle contraction under nervous control.
Swallowing is initiated by the sensory impulses transmitted as a result of the stim-
ulation of receptors on the tongue, soft palate and posterior pharyngeal wall. Then,
sensory impulses reach the brainstem first through the VII, IX and Xth cranial nerves,
while the efferent function is mediated through the IX, X and XIIth cranial nerves.
Then, the fact that the bolus reaches the posterior pharyngeal wall triggers the relax-
ation and the opening of the cricopharyngeal sphincter which is reflexive.
The Aero-digestive junction is an area with complex but vital anatomy and func-
tions. The aero-digestive junction is the crossroads of the airways that enables the
passage of air between the outside of our body and the lungs and digestive tract that
enables us to feed. Swallowing refers to the placement of food in the mouth, its mas-
tication if necessary, prior to initiate swallow when the bolus is propelled backward
by the tongue to the pharynx and to the œsophagus through the upper œsophagus
sphincter.

2.1. Swallowing and breathing: fundamental couple 17
Classically, swallowing is described in three phases: oral, pharyngeal and œsophageal.
Swallowing is initiated by the introduction of the food into the oral cavity and its
preparation by the process of mastication and insalivation. Once the bolus is formed
and is ready to be expelled to the pharynx, the tip of the tongue is raised up and ap-
plied against the alveolar ridge of the upper incisors and the tongue takes the form of
a spoon where the bolus slips and forms a single mass. The latter moves backwards
by the moving tongue which gradually applies to the palate from front to back. At
this moment, the soft palate realises the closure of the oropharynx and prevents the
penetration of the bolus into the pharynx, however, the larynx is still open. By the
time the bolus penetrates the throat isthmus, the oral time (voluntary time) is over.
The back of the tongue moves forward and forms an inclination allowing the bolus
to move towards the oropharyngeal cavity. Thus, the pharyngeal phase is triggered
by the contact of the bolus with the sensory receptors of the throat isthmus and of
the oropharynx.
The pharyngeal process is a continuous phenomenon in time, considered as a
reflex accompanied simultaneously by the velopharyngeal closure by the velum, by
the laryngeal occlusion assured by the elevation of the larynx, and by the retreat
of the tongue’s base, the movement at the bottom of the epiglottis, the pharyngeal
peristalsis and finally the opening of the upper sphincter of the œsophagus allows
the passage of the food bolus into the œsophagus. This phase lasts less than one
second. The opening of the upper sphincter of the œsophagus is initiated by the
arrival of the pharyngeal peristalsis and passage through the esophagus is ensured
by the continuity between the pharyngeal and the œsophageal peristalsis.
The pharyngeal stage triggered by the end of the oral stage becomes involun-
tary and is called the swallowing reflex. Velum is raised to close the nasal cavities
and avoids any passage of food into the nose and facilitates the passage of the bolus
downwards towards the œsophagus through the pharynx. Precisely at this moment,
the passage of food into the trachea is avoided. The larynx opens during chewing, to
allow breathing, and is closed as soon as the bolus arrives on the base of the tongue.
At the same time, the vocal cords are embracing to ensure airway closure, the mov-
ing cartilages of the larynx (arytenoids) swing forward in the laryngeal vestibule,
covered by the rocking of the epiglottis. The larynx is pulled up and down by the
hyoid muscles, which place it under the protection of the base of the tongue.
18 Chapter 2. Anatomy and Physiology
As a result, breathing is interrupted and at the same time the last stage of swal-
lowing begins with the introduction of the bolus into the œsophagus and its progres-
sion through the œsophageal peristaltic waves (muscle contractions) to the stomach.
The œsophagus is indeed a muscular tube, the two extremities of which are sphinc-
ter zones, the upper œsophageal sphincter and the lower œsophageal sphincter act
as a valve preventing reflux of food or acidity from the stomach.
The pharyngeal and œsophageal phases constitute the reflex of swallowing, with-
out voluntary control Bassols and Puech (2011), Guatterie and Lozano (2005), and
Jones (2012). The swallowing reflex is the result of the laryngopharyngeal activity,
which is triggered by intrapharyngeal and sometimes laryngeal stimuli and is in-
troduced in humans during the fourth month of intrauterine life and observed by
ultrasound from the 6th monthGuatterie and Lozano (2005) in order to protect air-
ways from any passage of food.
The functions associated (breathing and phonation) with swallowing are impor-
tant in an evaluation of the swallowing since they involve the same neuro-anatomical
structures. During the preparation of the food bolus, breathing continues through
the nasal passages. Once the food bolus is prepared, it is time to propel it to the
pharynx by back. First, the mandible closes and the food bowl is gathered on the
back, from the tongue to the palatal vault. The apex is supported by the alveo-
lar ridges, and the floor of the mouth contracts. The tongue exerts pressure by a
movement anteroposterior and from bottom to top against the palate. The velopha-
ryngeal sphincter closes (the palate veil rises and hardens until it comes into contact
with the oropharyngeal wall) to avoid leakage of the food bolus to the nasal cavities,
and therefore to the pharynx while the airways are still open. Finally, the tongue
base contracts, and the food bolus slides to the pillars of the veil. The patient must
strongly block their breathing before swallowing, which produces an early adduc-
tion of the vocal cords before swallowing.
An unchanging coordination is well defined in order to avoid choking of the
element being swallowed the wrong way(Figure 2.3 everydayhealth (2017)).
2.2 Dysphagia
Dysphagia or swallowing disorder is a defect of protection of the airway during the
passage of the alimentary bolus towards the œsophagus. It results in a swallowing

2.2. Dysphagia 19
Figure 2.3: Lateral view of bolus propulsion during swallowing
choking incident or inhalation of food in the airway, and a disorder of the transit
of the alimentary bolus towards the œsophagus, leaving residues in the pharynx,
which can leads to a secondary swallow choking incident. Dysphagia can be also
manifested by difficulties of transport of the bolus into the œsophagus. The etiol-
ogy of swallowing disorders is very varied insofar as any damage to the anatomical
structures of the aerodigestive junction or structures allowing the neurological con-
trol of swallowing can be involved. The etiology of dysphagia is dominated by neu-
rological and tumoral pathologies of aerodigestive tract or brain tumors affecting
swallowing functionality.
Two types of dysphagia are distinguished; oropharyngeal and œsophageal dys-
phagia. Oropharyngeal dysphagia is defined as the difficulty of transferring the
bolus from the mouth to the pharynx and the œsophagus. As for œsophageal dys-
phagia, this occures during the third phase of the swallowing process whereby there
is difficulty in passageof the bolus along the œsophagus to the stomach. Dysphagia
can manifest in the form of a blockage to the passage of foods (stasis), a slowing
down in the progression of the food bolus or in a lack of coordination of breathing
and swallowing. In all these cases, aspiration can occur.
There are four different types of aspiration:
1. the aspiration before swallowing when the bolus passes before the swallow-
ing reflex is triggered and this results in the absence of the swallowing reflex
20 Chapter 2. Anatomy and Physiology
(when the bolus slides on the base of the tongue, but the absence of swallow-
ing reflex does not trigger the closure of the larynx, which remains open, and
therefore the respiratory function is active, and the aspiration occurs after ac-
cumulations of food in the pharynx). This absence of swallowing reflex results
in neuromotive disorganisation of this reflex. The aspiration can also occur
due to a delayed swallowing reflex. In such cases, the swallowing reflex is
slow to trigger, the bolus has time to flow on the base of the tongue and fill the
bottom of the pharynx before swallowing is triggered.
2. Aspiration during swallowing when laryngeal protective structures are defi-
cient.
3. Aspiration after swallowing (secondary or indirect aspiration) that occurs upon
resumption of breathing, leading to food stasis in the trachea or nasal fossa.
4. Eventually, the most dangerous of aspiration is the silent one, which can occur
before, during or after swallowing and does not cause reflex coughing. 71%
of silent aspiration were found in elderly patients hospitalized in a long stay
with acquired community pneumonia, compared to 10% for control popula-
tion without pneumonia in a control study Marik and Kaplan (2003).
Among the clinical signs of the aspiration is the reflex cough that may be ab-
sent (as in the case of silent aspiration), only coincidental and not very effective
in clearing the channel if blocked. The alteration of the voice too can be a sign of
aspiration. In addition, pain during food intake, vomiting, weight loss and recur-
rent pneumopathies. Short-term complications can result in aspiration, respiratory
complications, suffocation and severe lung infection. In the long term, the person
expresses his disinterest and anxiety about the meal and its duration, which may be
longer than normal DePippo, Holas, and Reding (1994) and Deborah J. C. Ramsey
and Kalra (2003), which causes chronic malnutrition and inflammation of the lungs.
Swallowing disorders in a chronic context may be related to chronic diseases such
as stroke, degenerative diseases such as Alzheimer’s and Parkinson’s, Oto-Rhino-
Laryngology surgery, drugs and aging structures and functions (presbyphagia).
Occasional difficulty in swallowing, which may occur when a person eats too fast
or does not chew the food well is not a cause for concern. However, when it is persis-
tent, it may indicates a serious medical condition requiring treatment and functional
2.2. Dysphagia 21
rehabilitation. Persistent swallowing disorders cause many inconveniences, ranging
from the deterioration of the quality of life of the patient to the risk of death Schmidt
et al. (1994). The majority of dysphagic cases often remain undiagnosed and are
therefore not treated. An undetected, untreated or inadequate swallowing disor-
der definitely leads to malnutrition and/or dehydration, the consequences of which
pose a risk of serious harm to the person. In fact, when swallowing is no longer
be safe, the person experiences the pain of physical and social disability response
to the loss of the pleasure of eating and drinking, and anorexia. The person may
also have anxiousness associated with meals for themselves and for their relatives
because of, for example, the drooling during food intake which consequently leads
to social isolation.
2.2.1 Etiology of Dysphagia
The etiologies of swallowing disorders are numerous and its treatment depends on
the cause. Dysphagia can result from a wide variety of diseases and disorders listed
below.
Oral pathologies
Pathology affecting teeth, such as infection or caries, can also affect mastication of
food. A congenital anomaly can also be one cause of dysphagia such as the malfor-
mation of the œsophagus, Leflot et al. (2005), cleft lip and palate Tanaka et al. (2012)
causing food and fluids drooling and reflux into nasal fossae when swallowing and
the formation of bolus is also impaired. Upper œsophageal sphincter (UES) dysfunc-
tion is the leading cause of pharyngeal dysphagia such as failure of UES relaxation
which is a motor disorder Cook (2006).
Xerostomia is also known as a cause of abnormally low volume of saliva which
causes dysphagia. Furthermore, it causes the loss of the antibacterial protection that
saliva affords. A person with xerostomia is more at risk of aspiration pneumonia if
aspiration occurs due to a higher oral bacterial load Rofes et al. (2011).
Obstructions and diverticula
Obstructions, which can be caused by different conditions such as tumours of the
head and/or neck, can cause swallowing difficulties since tumours can affect the
22 Chapter 2. Anatomy and Physiology
motility of structures involved in swallowing Logemann et al. (2006). Directly, if
there exists a tumour in the neck in the form of obstructions blocking the tract of
the bolus through the oral cavity or/and the pharynx. Indirectly, if there exists a
tumour in the head causing damage to the nerves of oral cavity or pharynx Pauloski
et al. (2000). Diverticula of the pharyngeal and œsophagus mucosa, pouches that
protrude outward in a weak portion of the pharynx or œsophageal lining, are also
a cause of dysphagia, namely Zenker’s diverticulum Sasegbon and Hamdy (2017),
which is located just above the cricopharyngeal muscle causing complications that
include aspiration and pneumonia Bergeron, Long, and Chhetri (2012) and Jonathan
M. Bock and Blumin (2012).
Medications
Medications can be the origin of dysphagia. A recent study showed that up to 64%
of patients with xerostomia take medications which cause this xerostomia Guggen-
heimer and MOORE (2003). Chemical radiotherapy of head and neck cancers often
results in delayed swallowing, decreased pharyngeal transport, and inefficient la-
ryngeal protection Eisbruch et al. (2002) and Grobbelaar et al. (2004). In 2007, Elting
et al. (2007) presented their study on a group of 204 patients receiving radiother-
apy (RT) to head and neck primary cancers and showed that 91% of these patients
developed oral mucositis, which is manifested by a painful swelling of the mucous
membranes lining the digestive tract, which can lead to a different form of swallow-
ing difficulties during mastication or the different stages of swallowing. Also, 50%
of the general elderly population use at least one anticholinergic medication Mul-
sant et al. (2003) which is well recognised as a common cause of xerostomia Bostock
and McDonald (2016). Another study showed that dysphagia in Parkinson’s pa-
tients is induced by some medications Leopold (1996) causing abnormalities during
all swallowing stages.
Neurological diseases
Neurological conditions that cause damage to the brain and nervous system can
cause dysphagia, such as Parkinson’s disease and dementia Easterling and Robbins
(2008) and Coates and Bakheit (1997), Huntington disease, Alzheimer’s dementia
Secil et al. (2016), cerebral tumours Frank et al. (1989), stroke Paciaroni et al. (2004),
cranial pairs damages and some sequelae of neurological interventions. Kalf and al.

2.2. Dysphagia 23
Kalf et al. (2011) showed that the presence of oropharyngeal disease after stroke can
be as high as 82%. Stroke is also known as the most common cause of oropharyngeal
disease of acute onset Daniels (2006).
The most common cause of dysphagia is stroke. In France, one stroke occurs ev-
ery 4 minutes, which implies 13 000 hospitalisations per year. Stroke causes severe
sequelae. It represents the first cause of acquired handicap of the adult Santé (2012).
Previous studies have suggested that complications in hospitalised stroke patients
are frequent ranging from 40% to 96% of patients Langhorne et al. (2000). Dysphagia
are frequent and are estimated at 42 to 76% following an acute stroke Group (1999)
and Zhou (2009). Many studies have attempted to establish the incidence of dys-
phagia after stroke with values ranging from 23% to 50% Singh and Hamdy (2006).
Available statistics differ from one study to another, but their frequency seems high.
In terms of economics, the hospitalisation of stroke patients is very expensive for
health insurance-social security because the stroke is 100% covered by social secu-
rity from the moment it is considered debilitating.
Swallowing is a complex process which requires the intervention of several mus-
cles and cranial nerves with a very precise temporal coordination.
2.2.2 Semiology of dysphagia
Semiology is the study of the signs of diseases and so helps guide the diagnosis. For
dysphagia, there is a specific semiology determining the physio-pathological mech-
anisms of the swallowing disorder. Swallowing disorder or dysphagia is defined as
difficulty of synchronisation between the progression of the alimentary bolus to the
œsophagus and the protection of the airways, or / and mastication disorder.
Dysphagia is common in human pathology and can be caused by a variety of
diseases affecting neural, motor and/or sensory systems that contribute to the swal-
lowing function. It is due in a large number of cases to neurological damage Mann,
Hankey, and Cameron (2000) and Counter and Ong (2018). Swallowing disorders
can be described chronologically by classifying the various mechanisms according to
airways protection defects and bolus transportation defects. Below are described the
pathophysiological mechanisms present chronologically Bassols and Puech (2011):
• During the preparatory phase
– Defect of contention:

24 Chapter 2. Anatomy and Physiology
∗ Forward: default of lip closure,
∗ Backward: default of oropharyngeal closure
– Insalivation disorders
– Chewing disorders
• During the oral transport phase
– Disorders of initiation of oral time
– Failure to close the oral cavity:
∗ Anterior
∗ Posterior
– Bolus control defects in the oral cavity
– Bolus propulsion default
– Default of initiation of pharyngeal time
– Failure to trigger pharyngeal time
• During the pharyngeal phase
– Failure to protect the airways
∗ Upper = Default of velopharyngeal closure
∗ Lower =
· Default of laryngeal closure
· Default of expulsion mechanisms
– Pharyngeal transport defects:
∗ Failure of pharyngeal peristalsis
∗ Default of basi-lingual decline
– Dysfunction of the sphincter of the œsophagus
• During œsophageal time
– Default of expulsion mechanisms
Swallowing disorders include several symptoms such as coughing, voice mod-
ification and prolonged mealtimes. Dysphagia may not be accompanied by cough
in many cases but is silent. Signs suggestive of swallowing disorder may be listed
using a swallowing disorders scorecard (Annex 1) Desport et al. (2011).

2.2. Dysphagia 25
Drooling of food or liquids can be at the level of the mouth, for example due to
insufficient labial closure, or by the nose. When the patient cannot keep the food
bolus long enough in the mouth, the bolus can slip into the oropharynx prematurely
before triggering the swallowing reflex. Food residues may persist in the mouth
after swallowing and then the already swallowed bolus may sometimes regurgitate
from the œsophagus to the mouth. The duration of the meal or mastication may
be prolonged and a change in the voice may occur during swallowing. Other signs
may give evidence of swallowing disorders such as alteration of breathing rhythm
or coughing during a meal, and also a progressive change in the type of texture
accepted by the patient.
As mentioned above, swallowing is the transport of food from the oral cavity to
the stomach. Knowledge of the anatomical structures involved and their physiology
is necessary for the assessment and management of swallowing disorders caused
mainly by neurological disorders. To study and monitor the swallowing process,
several studies have been proposed by processing different signals, several of which
are presented in the following chapter.


27
Chapter 3
State-of-the-art
The state-of-the-art of this thesis is multidisciplinary because the monitoring of swal-
lowing can be made using several modalities. Firts, the clinical screening modalities
of dysphagia will be presented continuing with the state-of-the-art in the technical
field. Thereafter, more detail on the state-of-the-art of sound recognition and the
analysis of the breathing signal will be set because these are the two modalities used
in this work.
3.1 Screening for dysphagia
The clinical dysphagia examination demonstrates multiple abnormalities includ-
ing slowed, laboured feeding, inefficient mastication and impaired lingual motility
Leopold and Kagel (1996), Bushmann et al. (1989), and Athlin et al. (1989).
The material being swallowed is a critical factor in determining the type of swal-
low. Increased volume to be swallowed has an impact on the duration and width
of opening of the upper œsophageal sphincter as well as the duration of airways
closure increase Logemann (2007). Dividing the liquid into two or more segments
or piecemeal deglutition was observed in normal subjects after 20 ml volume of wa-
ter. However, patients with neurogenic dysphagia are obliged to divide the bolus
into two or more swallows successively, below the 20 ml volume of drinking water
Ertekin and Aydogdu (2003).
Swallowing assessment can be carried out in different ways in order to iden-
tify any sign of dysphagia, including careful questioning and physical examination.
There are three types of clinical tests: tests with food intake, tests with no food intake
which are generally a food choking predictive score and others combining tests with

28 Chapter 3. State-of-the-art
and without food intake. The general clinical examination, guided by the interro-
gation, will begin looking for a pathology of the cardiorespiratory, cervico-thoracic
or neurological sphere. Particular attention will be paid to the examination of the
oro-facial sphere. Thus, the following will be evaluated successively: oral hygiene,
salivation, motor skills and the sensitivity of the bucco-facial sphere, oral and fa-
cial praxies and the possibility of performing voluntary actions such as swallowing
saliva or coughing. If necessary, an observation of the patient during a meal or dur-
ing a swallowing attempt may complete the assessment.
The interview with the patient and / or the companion/carer of the patient is
fundamental and crucial. It is the clinical non-instrumental evaluation of the dys-
phagic patient which is called also “bedside examination”. It facilitates the un-
derstanding and identifying of the signs of swallowing disorders. Anamnesis by
means of questionnaire obtaining all relevant information from the patient and his
entourage about the history of the disorders or the circumstances that preceded it. A
simple grid (Annex) was proposed by Desport et al. (2011) which contains different
questions to ask the patient such as: with which food(s) do you encounter difficul-
ties? Are there foods you avoid? Do you ever choke on food? How much time do
you take to eat your meal? Do you lose weight? Do you have frequent lung infec-
tions? By this questions doctors can notice the texture causing swallowing disorders,
characteristics of altered voice and some features related to food intake such as meal
duration, food choking location, food reflux, head posture during meal, etc. . .
In the clinic, standard swallowing screening is set up using instrumental meth-
ods. Clinical examination is to record the physical signs. The primary tool for swal-
lowing assessment is Cervical Auscultation (CA). CA is noninvasive tool that uses
a stethoscope to detect cervical sounds during swallowing or breathing sounds. CA
is adopted by dysphagia clinicians as a tool for swallowing evaluation. It enables
estimation of some dysphagic conditions such as aspiration Takahashi, Groher, and
Michi (1994b) and Takahashi, Groher, and Michi (1994a). Sensitivities and specifici-
ties of CA in detecting dysphagic conditions varied widely among several studies.
A sensitivity varying from 23% to 94% and a specificity varying from 50% to 74% La-
garde, Kamalski, and Engel-Hoek (2015) and Nozue et al. (2017). These wide varia-
tions among the CA studies are caused by the differences of targeted sounds. CA is a
technique which assesses the sounds of swallowing and swallowing related breath-
ing. Some studies focused on expiratory sounds before and after swallow Zenner,

3.1. Screening for dysphagia 29
Losinski, and Mills (1995) and HIRANO et al. (2001). Other researchers have focused
just on the swallowing sound Bergstrom, Svensson, and Hartelius (2013), Stroud,
Lawrie, and Wiles (2002), and Santamato et al. (2009). Fibereoptic Endoscopic Eval-
uation of Swallowing (FEES) Langmore, Schatz, and Olsen (1988) and Nacci et al.
(2008) is another method used for studying swallowing disorders enabling the ex-
amination of the motor and sensory functions of swallowing. It is a method which
involves the passing of a thin flexible scope through the nose to the pharynx. FEES
is an invasive tool and it can result in some complications such as discomfort of
patient, vomiting and in some cases laryngospasm Aviv et al. (2000).
The instrumental method currently considered as the “gold standard” for study-
ing swallowing is videofluoroscopy Palmer et al. (1993). Videofluoroscopy enables
the observation and filming in real-time of the swallowing process using X-ray in
order to follow the bolus coated with a barium that enables its outlines to become
visible during the phases of swallowing as it is viewed by this process. Videofluo-
roscopy makes the entire swallowing process visible. Videofluoroscopy Swallowing
Study (VFSS) is widely used in the field of dysphagia management. It is very ef-
fective in diagnosing dysphagia in order to decrease the risk of aspiration and food
choking. In case of difficult swallowing, it allows to determine quite precisely the
cause of the dysphagia and in case of penetration of food in airways, it allows to de-
termine how much material has entered the airways, at what level, when, and how
the patient reacts Martin-Harris and Jones (2008). It makes it possible to detect silent
choking food and to test textures and positions. VFSS is an invasive examination
with radiation exposure to the patients through fluoroscopic procedures however it
allows the diagnosis of the swallowing process in the presence of the patient and the
responsible medical staff.
Different screening tests for swallowing disorders have been developed includ-
ing the 3 Oz Water Swallow Test, the swallowing test of 50 ml of water, validated by
Depippo in the context of stroke DePippo, Holas, and Reding (1993). The 3 Oz Water
Swallow Test is considered perfectly adapted to the post-stroke population Bassols
and Puech (2011). Gordon, Hewer, and Wade (1987) have defined dysphagic indi-
viduals as those who could not drink 50ml of water or who coughed more than once
after completion of the water swallow test, in a study of patients in the acute phase of
stroke. They found that 45% of patients were dysphagic on admission. Many other
tests have been developed in order to improve the Depippo test DePippo, Holas, and

30 Chapter 3. State-of-the-art
Reding (1993) by examining the validity of volume used, the proposed texture and
the effectiveness of the indicators of mis-routed bolus false road including food stasis
for example. Many other tests have been developed in order to answer these ques-
tions e.g. the Gugging Swallowing Screen (GUSS) Trapl-Grundschober et al. (2007)
and John and Berger (2015) as developed in 2006 at the Landesklinikum Donau-
region Gugging in cooperation with the Department for Clinical Neurosciences and
Preventive Medicine of the Danube University Krems in Austria. The test starts with
saliva swallowing followed by swallowing of semiliquid, fluid and solid textures.
The GUSS is divided into 2 parts; the preliminary assessment or indirect swallowing
test, subset 1, and the direct swallowing test which consists of 3 subsets. Sequen-
tially performed, in the indirect swallowing test, saliva swallow has been realised
because most patients are often unable to sense such a small amount of water. Pa-
tients who are unable to produce enough saliva because of dry mouth are given
saliva spray as a substitute. Vigilance, voluntary cough, throat clearing, and saliva
swallowing are assessed. This subset is set up according to most swallowing tests
and, researchers start with a specified quantity of water, the smallest used volume is
1 ml in the bedside test of Logemann, Veis, and Colangelo (1999) and Daniels et al.
(1998). In the indirect swallowing test, swallowing is sequentially performed start-
ing by semiliquid, then liquid and finally solid textures. During the four subsets,
vigilance, voluntary and/or involuntary cough, drooling and voice change are as-
sessed. The evaluation is based on a point system and, for each subset a maximum of
5 points can be reached. Twenty points are the highest score that a patient can reach
and indicate the swallowing ability without a choking food risk. Then, four levels of
severity can be determined as follows: i) 0-9 points: severe dysphagia and high risk
of aspiration, ii) 10-14 points: moderate dysphagia and moderate risk of aspiration,
iii) 15-19 points: mild dysphagia and mild risk of aspiration, iv) 20 points: normal
swallowing ability. According to the test result, different diet recommendations are
given.
The Toronto Bedside Swallowing Screening Test (TOR-BSST) is also a dysphagia
screening tool. It is a psychometric study published by Martino et al. (2008). The
TOR-BSST was tested on 311 stroke patients which demonstrated a validity with
sensitivity at 91.3% and negative predictive values at 93.3% in acute and 89.5% in
rehabilitation settings. TOR-BSST contains 5 items including test of voice, lingual

3.1. Screening for dysphagia 31
motricity and sensitivity of the posterior wall of the throat, following by water in-
take; the patient is asked to swallow ten boluses of 5ml of water in a teaspoon fol-
lowed by a sip from a cup. The patient is asked to say “ah” after each swallow. If
any voice alteration or coughing occurs, test is immediately stopped for the patient’s
safety.
Another screening test for dysphagia has been developed: the timed swallow
test Nathadwarawala, Nicklin, and Wiles (1992). The test was designed for use in pa-
tients with neurologic dysphagia. In regard to calculating swallowing speed (ml/s),
it has been demonstrated that it is independent of flavour or temperature. Swal-
lowing speed ≤ 10 mm/s is considered as an index of abnormal swallowing. The
swallowing speed test had a sensitivity of 96% and a specificity of 69%. During this
test, the subject was asked to drink 150 ml of cold tap water from a standard glass.
Patients who have swallowing difficulties receive less water. The subject is asked to
drink the water as quickly as possible, but to stop immediately if difficulties arise.
Incidence of aspiration in patients with tracheostomies or endotracheal tube in
place was studied using the Evans blue dye test G (1977) and Cameron, Reynolds,
and Zuidema (1973). This test applies 4 drops of 1% solution of Evans blue dye on
the tongue every 4 hours with tracheal suctioning at set intervals. The presence of
the dye upon suctioning was considered as an evidence of aspiration. This proce-
dure was modified by mixing foods and liquids with the dye, giving the modified
Evan’s Blue Dye (MEBD) Thompson-Henry and Braddock (1995).
Another model of food choking screening, is the Practical Aspiration Screen-
ing Schema (PASS), was proposed by Zhou (2009); this requires 3-oz water to be
Swallowed DePippo, Holas, and Reding (1993). The test was presented as a predic-
tive clinical scale for food choking (Echelles Cliniques Prédictives de Fausse Route
(ECPFR)), which includes primitive reflexes, voluntary swallowing, laryngeal block-
ing and a total score ranging from 0 to 42 points (Annex) Guinvarc’h et al. (1998). It
makes it possible to detect food choking incidents with a high sensitivity of 89% and
accurate rate of specificity of 81%.
All the tests cited below are used as a diagnostic tool to identify dysphagic pa-
tients who are aspirating and who need further clinical assessment. Strategies in-
clude different dietary patterns that can be distinguished according to their modal-
ities which are non-invasive methods through viscosity, volume and consistency of
foods and liquids Bisch et al. (1994), Reimers-Neils, Logemann, and Larson (1994),

32 Chapter 3. State-of-the-art
Raut, McKee, and Johnston (2001), and Steele et al. (2014), postural adaptation Al-
ghadir et al. (2017), Md et al. (2011), Bisch et al. (1994), and Welch et al. (1993) and,
invasive methods as the non-oral nutrition using a nasogastric tube or a gastrotomy
Pearce and Duncan (2002).
Screening tests for swallowing disorders vary from one study to another, rang-
ing from a simple questionnaire to a real medical diagnosis with or without food
intake. The questionnaires proposed in some studies give an idea of the presence or
not of a swallowing problem, but they are not precise. The tests with food intake
are controlled (volumes, textures), which are not as varied as the typical range and
amount of daily food intake in real life. Medical means are precise, but they can not
be used at home for continuous monitoring of the swallowing process. These modal-
ities have not the potential to prevent food choking in real life. Then, the scientific
community has been interested in physiological signals using several sensors.
3.2 Swallowing Monitoring Modalities
The use of physiological signals such as sounds, EMG, videos, radiography, etc...,
is widespread in the field of dysphagia. The literature is dense with measurement
methods and studies used to establish a strong understanding of the nature of swal-
lowing disorders and estimate the degree of abnormalities.
Cook et al. (1989) proposed to evaluate and quantify the timing of events associ-
ated with the oral and pharyngeal phases of liquid swallows using video-radiographic,
electromyographic and manometric methods. The study, through healthy subjects,
finds that there are two types of swallow according to the localisation of the bo-
lus relative to the position of the tongue tip and the tongue base movement as well
as superior hyoid movement and mylohyoid myoelectric activity during swallowing
triggering. The common “incisor-type” swallow starts with the bolus positioned on
the tongue with the tongue tip pressed against the upper incisors and maxillary alveolar
ridge. The “dipper-type” swallow corresponds to a bolus located beneath the ante-
rior tongue and the tongue tip scooping the bolus to a supralingual location. Timing
of events during the oral and pharyngeal phases of swallowing for graded bolus
volumes shows an increasing time for both types of swallow. A timing of glottic
closure during swallowing was also studied by Daele et al. (2005) through an elec-
tromyographic and endoscopic analysis. It was noticed that arytenoid movement

3.2. Swallowing Monitoring Modalities 33
consistently preceded full glottis closure and was associated with the cessation of
activity of the posterior crioarytenoid muscle. An early closure of vocal folds occurs
during super-supraglottic swallow. The use of video radiography is considered as a
reference in relation to electromyographic and manometric signals, which are con-
sidered more or less invasive.
Using simultaneously electrocardiogram signals and swallowing movements with
a thin wallet rubber capsule fixed on the neck above the thyroid cartilage, Sherozia,
Ermishkin, and Lukoshkova (2003) showed that swallowing induced tachycardiac
responses, a marked increase in heart rate. Signals were acquired in 23 healthy
subjects. Deglutition tachycardia was clearly observed in 21 subjects. In the two
remaining subjects, tachycardia induced by the first swallow was masked by respi-
ratory arrhythmia. However, even with this case, heart rate changes associated with
swallowing were successfully revealed. Swallowing is considered then as a stimulus
which disturbs the autonomic regulation of the heart for a short time, but, are there
other mechanisms generating the same effect such as movement ?
A study conducted in 1986 by Armstrong, McMillan, and Simon (1985) inves-
tigated the link between swallowing and syncope assuming that swallowing is in
some cases the cause of syncope. They presented five cases through patients having
a spectrum of gastrointestinal tract or cardiovascular disease. For each presented
case, there was a clear association between swallowing and syncope. The different
electrocardiograms showed a period of asystole during swallowing. ECG showed
complete atrioventricular block with 4.5 seconds period of asystole while the pa-
tient (58-year-old woman presented with an 8-year history of a "seizure disorder")
was drinking hot water. The same interpretation was seen with a 53-year-old man
suffering from myocardial infarction complicated by ventricular fibrillation and atri-
oventricular block; the cardiograph showed 7 seconds of asystole and a high-degree
atrioventricular block, while drinking ice water during near syncope. Medical ob-
servations of the cardiac behaviour of different cases during swallowing are strongly
linked, but there is no explanation of the neurological process. This hypothesis has
not been investigated from a signal processing and comparison point of view be-
tween healthy and patient subjects. For unhealthy subjects this may lead to another
way of identifying the source of the disease. Cardiac behaviour can be monitored.
Today, there are mobile sensors capable of continuously recording cardiac signals
such as the "eMotion mobile FAROS sensor".
34 Chapter 3. State-of-the-art
Dynamic swallowing MRI has been used to visualize anatomical details, soft tis-
sues and their movements as well as the path of the food bowl. Its temporal resolu-
tion is less interesting than in videofluoroscopy. On the other hand, this examination
can be non-irradiating. Its application to the analysis of physiology and the patho-
physiology of swallowing has been the subject of work for some twenty years DM
et al. (2003).
Maniere-Ezvan, Duval, and Darnault (1993) examined the tongue muscle struc-
ture using real time ultrasound performed using the sub-hyoid approach. The study
was performed on 30 subjects. It consists of scanning the tongue at rest and swal-
lowing mechanism with and without a liquid bolus. Examining static and dynamic
ultrasound images, they can differentiate between different structures. They find
that the movement of the tongue is variable in form and amplitude depending on the
subject. Synthetic analysis shows that the tongue changes shape and gives successive
pushes to the bolus from pressing tongue tip against the palate to changing the form
of the lingual base to push the bolus into the oropharynx.
Using the same technique, real time ultrasound, Shawker et al. (1983) showed
swallowing in eight healthy subjects and one neurologically impaired patient with
dysphagia and chronic aspiration. Initially, the subject was asked to keep his tongue
on the floor of the mouth and keep it motionless for 10 seconds followed by a single
swallow of 5 cc of water after holding it in the front of the mouth. Resting mid-
tongue thickness and timing of events during single swallow was then studied and
compared between healthy and pathologic patients. Average length of the tongue
in normal patients was 7.3±0.2 cm and the height and length of the bolus in the
midtongue position in five healthy volunteers was 1.3 cm and 1.9 cm respectively.
However, in three normal subjects the tongue margins were not visible enough for
adequate measurement. For normal subjects, the bolus velocity was 15.1 cm/sec.
the time in which the bolus reached the back of the tongue and the posterior tongue
went back to its normal configuration averaged 0.72 seconds for normal subjects.
In the patient who had 12th cranial nerve weakness, there was complete absence of
normal tongue activity and no midtongue bolus formation or transmission. In both
cases of rest and during swallowing, the tongue appeared generally thick. Contrary
to the normal case, the hyoid was visible in the scanning plan during rest and dur-
ing swallowing which suggests an abnormal elevation. Also the swallowing process

3.2. Swallowing Monitoring Modalities 35
was markedly prolonged. Using real time ultrasound, Stone and Shawker (1986) fo-
cused on tongue movement during swallowing. They calculated tongue length dur-
ing swallowing with six female adults aged between 20 and 40 years old. To do this,
they fixed a pellet 4.5 cm back on the protruded tongue and they added the posterior
tongue length to get total tongue length. Distances were obtained through ultra-
sound scanner in the midsagittal plane. The movement of the pellet was divided
into four stages according to its path: forward, upward, steady and downward. A
large variability of swallowing patterns was observed through these experiments.
Average hyoid timing of 24 swallows was calculated: ascending movement time was
about 500 ms, hyoid in elevated position time duration was about 300 ms and hyoid
descending movement was about 350 ms.
Ultrasound imaging shows good observations of the sequential movements of
the tongue and its shape during swallowing. The static images recorded by the ul-
trasound scanner in real time can be analysed sequentially by the doctor responsible
for monitoring the patient at risk of food choking. The intervention for the reading
and interpretation of ultrasound images requires expertise for the best positioning of
the probe which should be held very precisely and positioned at a well-defined loca-
tion to be able to view the structures involved in the swallowing process. Ultrasound
is non-invasive, but there are no automatic image analysis methods nowadays. In
addition to the subjects, there is a great variability in the deformation of the tongue
and its shape, however it is important to know if the patients studied by ultrasound
had a normal or atypical swallowing mechanism.
Bulow, Olsson, and Ekberg (2002) evaluated the impact of supraglottic swal-
low, effortful swallow and chin tuck on the intrabolus pressure using simultane-
ously videoradiography and solid state manometry in 8 patients with different levels
of pharyngeal dysfunction. Videofluoroscopic image and the manometric registra-
tion were simultaneously acquired. Three swallows were registered for each type
of swallow. Supraglottic swallow, effortful swallow and chin tuck did not alter the
peak intrabolus or duration of this pressure when measured at the level of the in-
ferior pharyngeal constrictor. Using manometry is too invasive compared to other
modalities because sensors were fixed in the food path.
Electromyography (EMG) or electroneuromyogram (ENMG) is a medical tech-
niques used for a long time to study the function of nerves and muscles. Taking into
account that muscles are controlled by a peripheral nerve ensuring the propagation

36 Chapter 3. State-of-the-art
of nerve impulses, EMG enables the study of the quality of muscle contraction. It
is used also to understand the swallowing process. Sochaniwskyj et al. (1987) have
studied the frequency of swallowing and drooling in normal children and in children
with cerebral palsy. Twelve subjects were taken from each group. For each subject,
five sessions were undertaken. For each session, two phases were designed in order
to determine the frequency of swallowing while the child sat quietly and watched a
pre-taped television program for 15 minutes to one-half hour according to the child’s
attention span. The proposed tasks were i) sitting, ii) one distinct sip of 5ml of juice
from a cup followed by a swallow, iii) three distinct sips of approximately 5ml of
juice from a total of 15 ml, each sip followed by a swallow and iv) continuous drink-
ing of 75ml of juice. Infrahyoid muscle group EMG was recorded during this period.
Electromyography activity of three orofacial groups: masseter, orbicularis oris and in-
frahyoid group of muscles, was recorded via three Beckman electrode channels. Swal-
lowing frequency was determined by a software peak detection. Drooling saliva
were collected simultaneously with EMG. The correlation between the frequency of
swallowing and the rate of drooling in cerebral palsy children suggests that drool is
caused by both ineffective and infrequent swallowing.
In 2013, Yu et al. (2013) investigated the feasibility of surface electromyography
(sEMG) as a new approach for continuously visualising muscle activity of normal
swallowing. The dynamic sEMG of swallowing was recorded from three subjects
without any history of swallowing disorders. A 16x6 (96 electrodes) mono-polar
electromyographic electrodes grid was placed at the neck and a reference electrode
placed on the right wrist. Three healthy subjects aged 23-25 were the volunteers for
data acquisition. During acquisition session, the subjects were seated comfortably.
First, an acquisition of sEMG signals was performed without swallowing for nor-
malisation. Subsequently, three different swallowing exercises were performed for
each subject: dry swallowing (saliva), single swallowing of 5ml of water from an
open cup and single swallowing of 15ml from an open cup. Each subject carries out
each exercise three times. For the swallowing of the water, the volunteer was asked
to hold the water in their mouth for a while, then they swallowed it normally by
holding their head forward and avoiding any movement of the head. EMG signals
analysis were based on sEMG RMS calculated through a sliding window of 100ms.
Figure 3.1 shows the typical sEMG RMS maps during a normal swallowing of 15ml

3.2. Swallowing Monitoring Modalities 37
of water. It shows the dynamics of swallowing and the corresponding muscle con-
traction. Two symmetric EMG activities were located at the top of maps near the
palate at the beginning of swallowing and then moved downward and the intensity
of EMG activities were gradually increasing along the swallowing progress. The
intensity of EMG activities was weakening gradually until it disappeared at frame
20. During swallowing 5ml of water, the location of high intensity was moving
down gradually from the upper edge to the centre of the map and then disappeared.
Unlike swallowing 5ml of water, dry swallow was marked by a long-lasting high
intensity sEMG activity during the final stage. Variability of swallowing patterns
between subjects was not too high.
Figure 3.1: Dynamic sEMG topography in a swallowing process
In 2008, Amft and Troster (2008) studied dietary food activity using different sen-
sors for the recognition, at once, of arm movements, chewing cycle and swallowing
cycle. For arm movements, they used an inertial sensor containing an accelerome-
ter, gyroscope and compass sensor. For chewing cycle recognition, they used an ear
microphone and finally for swallowing process recognition, he used both the stetho-
scope and electromyographic electrodes (EMG) attached at the infrahyoid throat po-
sition. The approach for the detection and classification of food activities is based
on three main steps: an explicit segmentation of signals to define the search limits,
an event detection using an algorithm extraction similarity characteristics, defining
dynamically the size of the observation, and a selective fusion of detection results
using independent sources of error to filter false positives and obtain a classification
of events. After processing, they concluded from first trials that EMG is disrupted by
different muscles activations, regardless of swallowing, as the muscle studied (hyoid
muscle) is covered by several muscle layers. Thus, they preferred simple activity de-
tection using time domain characteristics such as signal peaks. Their findings report
38 Chapter 3. State-of-the-art
high accuracy for body movements and chewing sound identification but swallow-
ing requires more investigation. Sample recognition rates were 79% for movements,
86% for chewing and 70% for swallowing. The recognition rate of swallowing was
68% for the fusion approach of EMG and sound versus 75% for EMG alone and 66%
for sound alone.
In their previous work of 2006, Amft and Troster (2006) proposed almost the
same investigation on the detection and classification of normal swallowing from
muscle activation and sound acquired respectively by electromyography and a mi-
crophone posed on the sternal head (sternal fork). They compare methods for de-
tecting an individual event of swallowing in order to separate swallowing events
from the sound of the sensor used and the daily activities and various functions of
the pharynx. In addition, they present a comparison of the classifiers (Linear Dis-
criminant Analysis (LDA), K-nearest Neighbour (KNN) and Hidden Markov Mod-
els (HMMs)) of the properties of the deglutition event: volume and viscosity. They
recorded sEMG to capture the variability of volume viscosity and sound to analyse
volume variability and pharyngeal density. Two classes of low and high volume as
well as viscosity were considered because of the weak performance obtained when
using three classes of each. The classification revealed that the sound provides im-
portant discrimination for the volume as well as for the viscosity. But the classifica-
tion result from EMG was weak for both and best result was achieved using fusion
data EMG and sound.
The surface electromyography method in swallowing study has some limita-
tions. The swallowing mechanism involves the coordination of a surface and deep
muscles group. This method does not record the electrical activities of the deep
muscles, which is also a major criterion in the choice of muscles considered in the
studies. The use of surface EMG can also lead to signal cancellation. In fact, a part
of the EMG signal is lost leading to an underestimation of muscle electrical activity
Farina, Merletti, and Enoka (2004) and Keenan et al. (2005).
Huckabee et al. (2005) and Huckabee and Steele (2006) evaluated the forced swal-
lowing manœuvre on pharyngeal pressure and surface electromyographic ampli-
tude under the chin by studying the influence of the tongue on the contractions of
the chin muscles and the oral and pharyngeal pressure. They used three pressure
sensors placed at the level of the œsophagus with a manometric catheter and a pair
of bipolar surface electrodes at the molars under the mandible. Forced deglutition is

3.2. Swallowing Monitoring Modalities 39
applied according to two strategies. The first consists of applying force with the neck
during swallowing (“as you swallow, I want you to squeeze hard with the muscles
of your throat, but do not use your tongue to generate extra strength”) this is called
the; Mendelson’s manœuvre. The second strategy consists to apply force with the
tongue against the soft palate (“as you swallow push really hard with your tongue”).
Forced swallowing is a compensatory technique and a therapeutic technique for the
management of swallowing disorders such as the Mendelson maneuver which con-
sists of maintaining the larynx for a few seconds at the highest position in the neck
by voluntary muscular contractions. Maintaining the larynx at the upper level si-
multaneously means a wider opening of the upper œsophageal sphincter. For exper-
imental editing of data acquisition, there were finally three exercises; the first was
normal swallow swallowing, the second was forced swallowing of saliva by apply-
ing a force from the base of the tongue to the soft palate during swallowing, and the
last was Mendelson’s manœuver. Data collection is performed during two sessions
per participant (for forced swallowing) to account for intersessional variability. The
effortless swallowing of saliva is considered as a reference exercise in this study. No
significant statistical difference was observed in the intersessional pressure (ampli-
tudes) between the different positions (mid-pharyngeal, post-pharyngeal and upper
œsophageal sphincter (UES)) for non-forced swallowing. To evaluate the effect of
the two strategies of forced swallowing (applying basilingual force and applying the
Mendelson’s manœuver), they used the general ANOVA model. In fact, there was a
statistically significant effect for five variables (Surface Electromyography, Midline
Pressure, Posterior Tongue Pressure, Upper Pharyngeal Pressure, Lower Pharyn-
geal Pressure). In any case, the strategy of force applied by the tongue against the soft
palate produces a significant change in normal swallowing pressure. Electromyo-
graphic recordings were also significantly higher during the Forced Tongue Palate
strategy, which confirms that the activity detected by electromyography is not spe-
cific to the muscles of the sub-chin guard but also includes intrinsic lingual activity.
In the same approximation, Ding et al. (2002) studied the difference between
two types of swallowing, normal and forced, using the Mendelson’s manœuver, in
healthy subjects. The signals studied were acquired via electromyography and elec-
troglottography (EGG) in order to record laryngeal displacement and muscle activ-
ity respectively. Electromyography was measured from five groups of muscles (up-
per and lower orbicularis, masseter, submental and hyoid muscles). As a result, they
40 Chapter 3. State-of-the-art
found that there is a temporal relationship between submental muscle activity and
laryngeal elevation measured non-invasively by EGG. During normal swallowing,
the maximum laryngeal elevation is approximately 0.5 sec (0.25-0.33 sec), while the
Mendelson’s manœuver is extended and the cricopharyngeal opening is at its widest.
The limits of each EMG activity of each muscle group and the EGG were manually
established on the signals. The relevant EMG variables are: the maximum ampli-
tude of each electrode during swallowing, the average amplitude of EMG activity at
each electrode location and the duration of EMG activity at each electrode location.
ANOVA analysis of variance was carried out for the measurements of the different
retained variables of the EMG of the different groups of muscles.
Lapatki et al. (2004) developed a small sEMG electrode mounted on a thin flexi-
ble electrode grid that can be easily attached to the skin. In 2005, they conducted a
study Lapatki et al. (2006) to characterise the motor activity of the chin musculature
by an analysis of the action potential of the motor unit by selective contractions via
a grid of 120 electromyographic electrodes. The analysis of the acquired data was
based on spatio-temporal amplitude characteristics. In addition, in their 2010 study
Lapatki et al. (2009), suggested optimal locations for bipolar electrodes in the lower
facial muscles. The optimal position for a bipolar electrode was the location on the
muscle where the sEMG signal with the maximal amplitude was registered. The
recommended position of a bipolar electrode is in the upper portion of the depressor
anguli oris. Note that the studies of Lapatki et al. (2004), Lapatki et al. (2006), and
Lapatki et al. (2009) did not aim to study in particular the problem of swallowing,
but rather to evaluate the sEMG material that he designed on the facial musculature.
Similarly, Guzman-Venegas, Biotti, and Rosa (2015) showed that the masseter activ-
ity is organised into three functional compartments anterior, middle anterior and
posterior, three positions relative to the location of the EMG grid.
Stepp (2012) presented a comprehensive study of the system of swallowing and
speech using sEMG, a non-invasive method providing real-time muscle activation
information. The sEMG signal is often referred to as an interference signal present-
ing the overall activity of the muscles and containing a variety of parameters (ampli-
tude, frequency, etc.), that can be estimated from the raw signal commonly used to
obtain more reliable information on specific functions like speech and swallowing.
Ertekin and Aydogdu (2003) presented a revue of studies dedicated to the neu-
rophysiology of oropharyngeal swallowing. The sequential and orderly activation

3.2. Swallowing Monitoring Modalities 41
of the muscles of the swallowing can be recorded during swallowing. The masseter
muscle is the first activated in EMG during the oral phase Murray, Larson, and Lo-
gemann (1998). In fact, in normal subjects, orbicularis oris and buccinators muscles
firmly close the mouth to prevent drooling. Then, the submental muscles are subse-
quently activated while the larynx is being raised by the hyoid bone with the contrac-
tion of the submental/suprahyoid muscles. It was observed that perioral muscle activity
is ended just before the pharyngeal phase of swallowing. However, masseter activity
can continue or reappear during the pharyngeal phase Stepp (2012).
In 2014, Imtiaz et al. (2014) proposed a system comprised of an Inertial Measure-
ment Unit1 (IMU) and an electromyography sensor able to measure the head-neck
posture and the activity of the submental muscles during swallowing. Four healthy
male subjects were included in this study. The IMU used in this investigation con-
tained a 3-axis gyroscope, a 3-axis accelerometer, and a 3-axis magnetometer. Two
IMUs were used; one of which was fixed on the back of the head with a Velcro band
and the second one was fixed over the seventh cervical vertebra. In addition, an
EMG sensor was attached underneath the subject’s chin, over the suprahyoid muscle
using medical grade tape (Fig. 2.3). Five repetitions of three 10ml water swallowing
actions were made at different head-neck angles. During the three trials, subjects
were asked to: i) keep the head at a neural rest position facing forward, ii) rotate the
head upwards to a chin up position and iii) rotate the head downwards to a chin tuck
position. Orientation quaternion was calculated and converted into a rotation ma-
trix from the IMU sensor. Then, a relative rotation matrix between both IMU sensors
was converted into Tait-Bryan angles of XYZ convention, the roll, pitch and yawn
angles. Acceleration norm and jerk norm were also considered. Averaged RMS error
of Roll, Pitch and Yawn were calculated for all sessions and EMG RMS signals were
used to identify swallowing events.
Another system has been proposed by Pehlivan et al. (1996), "Digital Phagome-
ter", a portable electronic system. This device is composed of a piezoelectric sensor
and a digital event counter/recorder. It is able to detect any upward and down-
ward movement of the Larynx produced by spontaneous movements. The spe-
cially designed sensor was placed at the coniotomy area between thyroid and cricoid
in order to control movements. For the evaluation of the deglutition frequency
1Inertial sensor or Inertial Measurement Unit (IMU) is an electronic device that measures specificforce ratios of a body, angular velocity, and sometimes the magnetic field surrounding the body, usinga combination of accelerometers and gyroscopes, and sometimes magnetometers.

42 Chapter 3. State-of-the-art
Figure 3.2: Sensor placement on the body and Frame axes
and duration, two different populations were present in this study: healthy peo-
ple and Parkinsonian patients. Mean frequency of spontaneous swallow was about
1.22±0.11 (mean±standard error mean) swallow/minute during 1 hour of awaking
period. For Parkinson patients, whether complaining or not of dysphagia, mean fre-
quency of spontaneous swallowing was significantly lower, about 0.92±0.12 swal-
low/min. Unlike healthy subjects, Parkinson patients have been marked by a long
time duration to swallow 200 ml of water.
3.3 Sound Recognition Domain
A considerable number of studies have been carried out on the sounds of swallow-
ing thanks to its diagnostic potential. Acoustic analysis seems to be a non-invasive
promising way to develop an objective measure of different swallowing sounds
characteristics in order to identify swallowing events and to say if it is a normal
or dysphagic swallow.
Movahedi et al. (2017) compared microphone signals and a matrix axial accelerom-
eter in 72 patients with and without stroke, which support fluoroscopic examination.
Temporal and frequency characteristics were extracted from the swallowing signal
of thick liquids of different consistencies. They found that swallowing sounds had
higher values for vibration frequency domain characteristics than sounds. In ad-
dition, Lempel-Zivcomplexity was more effective at swallowing vibrations than at

3.3. Sound Recognition Domain 43
swallowing sounds and swallowing sounds had higher deurtosis values than swal-
lowing vibrations.
Taveira et al. (2018) evaluated the diagnostic validity of different methods for
evaluating swallowing noise compared to the videofluroscopic swallowing study
for oropharyngeal dysphagia. They showed that Doppler has excellent diagnostic
accuracy on the discrimination of swallowing sounds, while the microphone re-
ported good sensitivity for the discrimination of swallowing sounds of dysphasic
patients and the stethoscope showed the best screening test on the discrimination of
swallowing sounds.
Anaya (2017) conducted a study in Colombia to determine the time and noise of
swallowing in 306 people aged 20 to 50 years. A recording of the swallowing noise
was made using a neck auscultation. The average ingestion time in this study was
0.387 second.
Hsu, Chen, and Chiu (2013) proposed a system for discriminating the sever-
ity of dysphagia for patients with myasthenia gravis. They recorded the sound of
swallowing water using a non-invasive Adam’s apple microphone and surface elec-
tromyography. They discriminate in severity, which makes it possible to evaluate
the severity levels of dysphagia by determining the degree of severity of the pha-
ryngeal phase disruption according to the characteristics of each swallowing phase
and the onset of cough. Experimental results show that the system can provide con-
crete features that allow clinicians to diagnose dysphagia.
Takahashi, Groher, and Michi (1994b) attempted to provide a benchmark method-
ology for administering cervical auscultation. They provided information about the
acoustic detector unit best suited to pick up swallowing sounds and the best cervi-
cal site to place it on the neck. Using the same site for cervical auscultation, Cichero
and Murdoch (2002) provided the feasibility and the ability of cervical auscultation
for the diagnosis of dysphagia. Belie, Sivertsvik, and Baerdemaeker (2003) studied
the differences in chewing sounds of dry-crisps snacks by multivariate data anal-
ysis. They used foods of different textures emitted sounds were recorded using a
microphone placed over the ear canal. They showed that the spectral power ob-
tained from the chewing sounds was able to distinguish the different food textures.
The best recognition rate was about 86%. Vickers (1985) showed that auditory sen-
sations are sufficient to evaluate crispness and crunchiness. They led a study for bite
sounds and chew sounds for both crispness and crunchiness. Its was proved that

44 Chapter 3. State-of-the-art
crispness scores were higher for bite sounds than for the chew sounds. The correla-
tion between eating manner and individual food sounds was highly significant for
both crispness and crunchiness scores.
Lazareck and Moussavi (2004b) and Lazareck and Moussavi (2004a) proposed a
non-invasive and acoustic based method able to differentiate between individuals
with and without dysphagia. Sounds were recorded using an accelerometer over
the suprasternal notch of the trachea. 15 subjects with no history of swallowing dis-
orders and 11 patients with different degrees of swallow disorders were included in
this study. Volunteers participated in one of the two recording sessions, videoflu-
oroscopic swallow or audiorecording session. Subjects were fed with food having
three textures, “semisolid,” “thick liquid,” and “thin liquid” corresponding respec-
tively to pudding, diluted pudding with milk and fruit juice. Manually annotating
the beginning and end of each segment, swallowing sounds were extracted from
each recording. Segmentation of swallowing segments were made using Waveform
Dimension Trajectory (WDT), in which significant changes mark the boundaries of
characteristic segments of the swallowing sound. Then, opening and transmission
sections were identified. The opening section corresponds to the bolus entering the
pharynx (the opening of the crico-pharyngeus muscle). The transmission section
corresponds with the bolus traveling down the œsophagus and the return of the
epiglottis. Results show that durations of opening, transmission and total sections
were significantly longer for abnormal than for normal swallowing sounds, for both
semisolid and thick liquid textures. Same research team, Aboofazeli and Moussavi
(2004) developed an automated method based on multilayer feed forward neural
networks able to decompose tracheal sound into swallowing and respiratory seg-
ments. Temporal and frequency characteristics were used as input to the neural
network model such as root mean square of the signal, the average power extracted
from the frequency band 150-450 Hz and waveform fractal dimension. Applying
the method on 18 tracheal sound recordings obtained from seven healthy volunteers
shows 91.7% of well detected swallows.
The studies above treat the swallowing sound signal as a single, undecomposed
event. In 2005, as first team, Moussavi (2005) developed a method based on the
Hidden Markov Model (HMM) in order to investigate different stages in swallow-
ing sounds. In fact, they showed that a normal swallowing sound may be divided
into three distinct characteristic sounds : Initial discrete sound (IDS), Bolus Transit

3.3. Sound Recognition Domain 45
Sound (BTS) and Final Discrete Sound (FDS) corresponding each to a physiological
swallowing step which are oral, pharyngeal and œsophageal Aboofazeli and Mous-
savi (2004). In Moussavi (2005), proposed automatically extracting the limits of each
phase using Hidden Markov Models since swallowing sounds are non-stationary
and stochastic signals. The assumptions for this model were :
• The consideration of three states similar to physiology, oral, pharyngeal and
œsophageal stages,
• The current state depends only on the precedent state and not on the others,
• The transition probabilities are stationary,
• The observations are independent of past values and states.
Using the fact that Waveform Dimension Trajectory (WDT) is the best feature
for classification between normal and dysphagic swallows, it was used to train the
Hidden Markov Model by the initial guesses detailed above. The Viterbi algorithm
was used to find the most likely states. Results show three states for all swallowing
sounds of different subjects with different textures. Two years later, Aboofazeli and
Moussavi (2008) presented the same Hidden Markov Model (HMM) for segmen-
tation and classification of swallowing sounds with the same assumptions. They
compared different features among Waveform Dimension Trajectory (WDT) which
show the best performance in the HMM-based classification of swallowing sounds.
They also tested different number of states of the HMM from 3 to 8. For the segmen-
tation step, estimated sequences have been found applying the Viterbi algorithm.
The estimated boundaries of the states were compared to the manually detected
sequences; in the majority of cases using different features, the delay in detection
of the beginning of the Initial Discrete Sound (IDS) occurs before the manually de-
tected boundary. For the classification step, HMM parameters were set through the
EM algorithm. Considering the entire range of swallowing sound signals, the accu-
racy of classification hardly reached 60%. Classification using BTS segments did not
make a difference and classification using IDS segments improved the accuracy up
to 84%. As a second stage of classification, classification of normal and dysphagic
subjects was been set up. The subject was considered normal if more than 50% of his
swallowing record was classified as normal. Otherwise he was considered as being
at risk of dysphagia. All normal subjects were correctly classified except only one

46 Chapter 3. State-of-the-art
healthy subject when using RMS as a characteristic feature of swallowing sounds
and 8 states. When WFD or MSP1 was used, the number of misclassified raised to
two.
Rempel and Moussavi (2005) investigated the effect of swallowing pudding and
liquid on the breath-swallow pattern in individuals with cerebral palsy. Acoustical
signals of swallow and breath were acquired. During feeding, the airflow signal
was also recorded using nasal cannulae attached to a Fleisch pneumotachograph
and a Validyne differential pressure transducer. Two accelerometers were attached
to intercostal space in the midclavicular line to record breathing sounds and deglu-
tition apnoea. They confirm their assumption, thirteen normal subjects aged 13-30
years without any history of swallowing disorders or lower respiratory tract infec-
tion were included in the study as controls. In addition, eight subjects aged 15-25
years affected by cerebral palsy were also included in this study. These subjects were
all wheelchair users with good head control but no independent sitting ability. Three
common swallow patterns in relation to the respiratory cycle were observed:
1. Inspiration– Swallow–Expiration–Inspiration (ISEI)
2. Inspiration–Expiration–Swallow–Expiration–Inspiration (IESEI)
3. Inspiration–Expiration–Swallow– Inspiration (IESI)
Occasionally, other patterns such as ISESI and ISI were observed and were consid-
ered as belonging to only one class. Results show that subjects with cerebral palsy
had a significantly higher rate of post swallow inspiration than controls during the
drinking of thin liquid. Furthermore, duration of deglutition apnoea was greater in
cerebral palsy subjects than in controls.
In 2006, Aboofazeli and Moussavi (2006) presented an automated method for
extraction of swallowing sounds in a record of the tracheal breathing and swal-
lowing sounds. Considering the non-stationary nature of swallowing sounds com-
pared to breath sound, a wavelet transform based filter was applied to the sound
signal in which a multiresolution decomposition reconstruction process filtered the
signal. The signal is decomposed into band limited components and broken into
many lower resolution components. Multiresolution decomposition of the sound
was made at levels 6 using Daubechies-5. Swallowing sounds were detected in
the filtered signal. Fifteen healthy and 11 dysphagic subjects were included in this

3.3. Sound Recognition Domain 47
study. The results were validated manually by visual inspection using airflow mea-
surement and spectrogram of the sounds as well as auditory means. The proposed
filtering method is not able to separate the two swallowing and breath sounds with
accurate boundaries.
In 2007, Makeyev et al. (2007) proposed a swallowing sound recognition tech-
nique based on the limited receptive area (LIRA) neural classifier. Recognition of
swallowing sounds using continuous wavelet transform in combination with the
LIRA neural classifier was compared with the same approach using short time Fourier
transform. Twenty sound instances were recorded for each of three classes of sounds:
swallow, talking and head movement, with a commercially available miniature throat
microphone (IASUS NT, IASUS Concepts Ltd.) located over the laryngopharynx
on a healthy subject without any history of swallowing disorder, eating or nutri-
tion problems, or lower respiratory tract infection. Useful signals (swallowing, head
movements and speech sounds) were extracted from the recordings using an empiric
algorithm which looks for the beginning and end of each sound using a threshold
set above the background noise level. Then, a scalogram of sound instances was
calculated using Morlet mother wavelet with a wave-number of 6, 7 octaves and 16
sub-octaves. Results were better with a continuous wavelet transform in the differ-
ent case of Test/Validation size compared to short time Fourier transform.
Amft, Kusserow, and Troster (2007) proposed an automated methodology to ex-
tract occurences of similar chewing instances from chewing sound recordings. Four
volunteers without a known chewing or swallowing abnormality were included in
this study. Participants were asked to eat potato chips (25 pieces), meat lasagne
(250 gm), one apple (100 gm) and 12 pieces of chocolate (40 gm). Chewing sound
was recorded using a miniature microphone (Knowles, TM-24546) embedded in an
ear-pad. The surface EMG from left and right side of masseter muscle was recorded.
Chewing cycles were annotated based on an EMG recording. Then time domain fea-
tures and spectral features were calculated. The assumption used consists of consid-
ering a complete sequence of chewing cycle as a set of successive phases described
as a set of successive sequences of food. Non-supervised Sorting Genetic algorithm
II was applied in order to select appropriate features followed by induction step in
which hierarchical clustering on chewing observations was applied. The results led
to the hypothesis that a sequential structure can be found in chewing sounds from
brittle or rigid foods.

48 Chapter 3. State-of-the-art
In 2009, Santamato et al. (2009) tested the predictive value of a pathological pat-
tern of swallowing sounds. 60 healthy subjects and 15 patients affected by various
neurological diseases were included in their study. characteristics of dysphagia level
were marked by the mean duration of the swallowing sound and post swallowing
apnoea duration. The mean duration of swallowing sounds for a liquid of 10 ml wa-
ter was significantly different between healthy subjects and patients with dysphagia
disorders.
Huq and Moussavi (2010) presented a method based on several parameters de-
rived from the phase duration from tracheal breath sound able to differentiate be-
tween breath phases, inspiration and expiration. Breath sounds were recorded using
a Sony condenser microphone, and airflow was measured using a Biopac transducer/flow-
meter. Both signals were acquired from 6 healthy volunteer non smokers. The flow
signal was used as a reference to annotate the respiratory phases. Logarithm of
variance was calculated from the filtered sound signal (band-pass filtered between
150 and 800Hz) using a sliding window of 25 ms with 50% overlap. Five param-
eters were derived from the breath sounds as the phase index, sound intensity in
each phase, the duration parameter of the phase measured in seconds, pseudo-
volume parameters and falling gradient of each breath phase. Then, a decision
matrix was calculated based on the individual votes of the five parameters. The
proposed method shows an accuracy of 93.1% for breath phase identification.
Sazonov et al. (2010) studied two methods of acoustical swallowing detection
from sounds contaminated by motion artefacts, speech and external noise. Data sig-
nals were acquired from 20 volunteers of whom seven had body mass index greater
than 30 (obese). Each subject participated in four visits, each of which consisted
of a 20 minute resting period followed by a meal, followed by another 20 minutes
resting period. The duration of the acquired dataset was about 64 hours with a to-
tal of 9966 swallows. Swallowing sounds detection was tested by a method based
on mel-scale Fourier spectrum (msFS) and wavelet packet decomposition (WPD)
for time-frequency representation and support vector machine (SVM) for automatic
recognition of characteristic sounds of swallowing. Average automatic detection of
swallowing sound rate was 84.7%.
In 2011, Fontana, Melo, and Sazonov (2011) made a comparison in detection
of swallowing sounds by sonic (20- 2500 Hz) and subsonic (≤ 5Hz) frequencies.

3.3. Sound Recognition Domain 49
Two microphones were used including ambient microphone and swallowing micro-
phone. Swallowing sounds in the sonic range were detected by a piezoelectric mi-
crophone placed over the laryngopharynx and swallowing sounds in the subsonic
range were detected by a condenser microphone placed on the throat at the level of
the thyroid cartilage. Data signals were acquired from seven healthy subjects who
participated in a single session consisting on registering 5 minutes of resting where
the subject is sitting quietly followed by 5 minutes of reading aloud, followed by
a meal time where the subject repeats talking for 20 seconds period, followed by a
single bite-chewing-swallow phase. The protocol has been conceived by the way to
ensure presence of speech during meal. Hence, arises the interest of using two mi-
crophones recording signals on different band frequencies. The ambient microphone
registers intrinsic speech, but not swallowing sounds. This allows the identification
of the voice frequency intervals and then, its removal from the required throat signal
to detect swallowing. Talking intervals were removed from the swallowing sounds
signal by replacing their values by zeros in the same time interval. Resulting signal
was smoothed using a moving average filter and a threshold level to detect swal-
lows. A swallowing event was detected when the amplitude of the smoothed signal
was higher than the threshold level for a period longer than 0.6 seconds, the min-
imum duration to cover a complete swallow. Their proposed method was able to
achieve an accuracy of 68.2% averaged across all subjects and food items.
In the same research focus, Nagae and Suzuki (2011) proposed a wearable inter-
face for sensing swallowing activities by an acoustical sensor mounted on the back
of the neck giving a real time information reading swallowing movements. Method
based on wavelet transform analysis with Gaussian window was used. The de-
vice used both frequency and amplitude characteristics to discriminate between the
swallowing sound, vocalising and coughing. The device presents also LEDs to give
feedback information consisting of three possible patterns: a blue light indicating
the start of measurement, a green light indicating that swallowing is normal and red
light indicating that an abnormal sound was detected or that the swallowing sound
was longer than usual. Comparing to young group and older group, they conclude
that the duration of swallowing action has a tendency to decrease with age. Feature
considered for this conclusion was the ratio of the total length of the swallowing
action and the time from the start of the swallowing until the bolus passes through
the œsophagus. Phases are delimited as shown in the Figure 3.3. Limit of the device

50 Chapter 3. State-of-the-art
Figure 3.3: Characteristics of the swallowing sound wave
was the detection of several false positives when the subject coughed or vocalized.
Walker and Bhatia (2011) presented a swallowing sound analysis and a com-
parison was made with various other noises captured from a throat mounted mi-
crophone in order to manage obesity. A throat Microphone System used to record
tracheal sound was placed around the throat over the laryngeal prominence. Exper-
iments consisted of recording swallows, of liquid, solid and no substance, vocal cord
activation, clearing of the throat and coughing. Data were acquired from two male
subjects. Fourier analysis in the form of the Short Time Fourier Transform (STFT) in-
dicates that swallow sounds have a strong presence in the upper frequencies when
compared with the other sounds. To get higher temporal resolution, wavelet decom-
position was applied in the form of the Discrete Wavelet Transform (DWT). Interest-
ing frequency interval was covered by the first two levels of wavelet decomposition.
The resulting signal was compared to a single digital filter based on ideal high-pass
half-band filter. The first method for detection consisted of calculating the energy by
using a sliding window and a simple thresholding to detect an event. The second
event detection method consisted of analysing the maximum of the absolute value
of the signal using a sliding window. At each detected maximum over each sliding
window, if the value of the signal was also the maximum attained over the duration
of the next time window, this value was labelled and recorded as such. Comparison
between wavelet decomposition and a single high-pass filter showed similar results.
In 2012, Dong and Biswas (2012) presented their conception for a wearable swal-
low monitoring system in the form of wearable piezo-respiratory chest-belt detect-
ing breathing sound. The system works based on the swallowing apnoea; the person
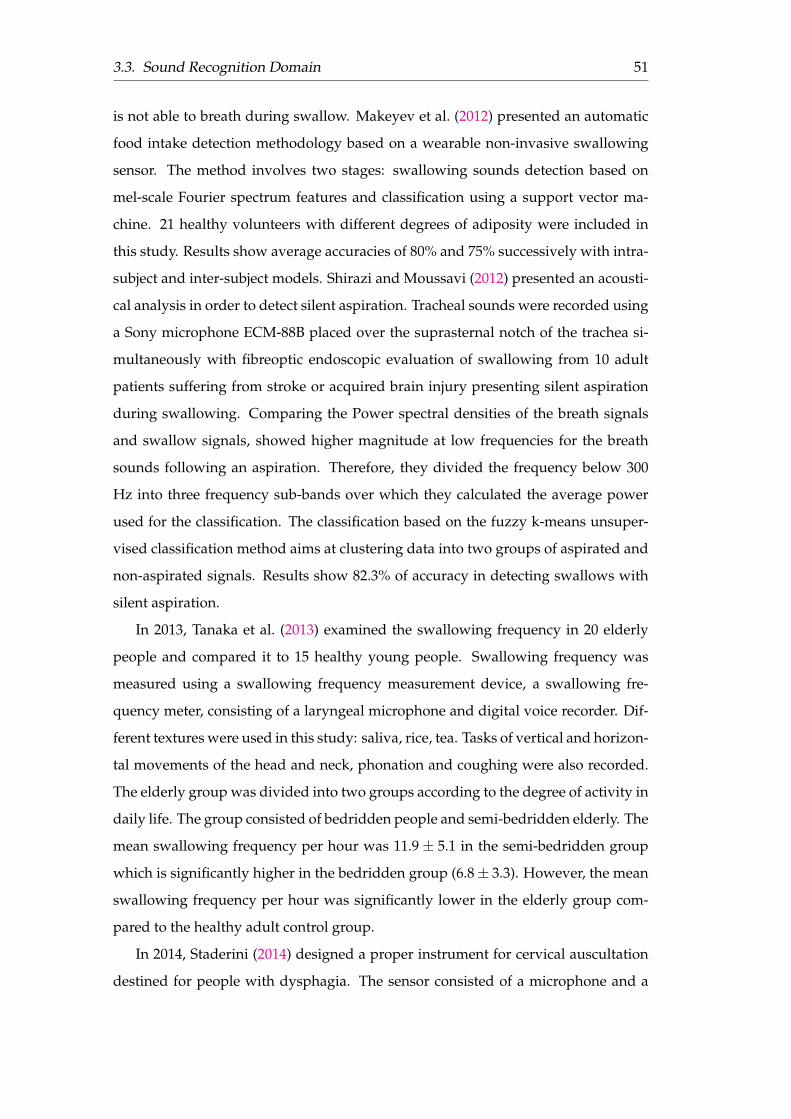
3.3. Sound Recognition Domain 51
is not able to breath during swallow. Makeyev et al. (2012) presented an automatic
food intake detection methodology based on a wearable non-invasive swallowing
sensor. The method involves two stages: swallowing sounds detection based on
mel-scale Fourier spectrum features and classification using a support vector ma-
chine. 21 healthy volunteers with different degrees of adiposity were included in
this study. Results show average accuracies of 80% and 75% successively with intra-
subject and inter-subject models. Shirazi and Moussavi (2012) presented an acousti-
cal analysis in order to detect silent aspiration. Tracheal sounds were recorded using
a Sony microphone ECM-88B placed over the suprasternal notch of the trachea si-
multaneously with fibreoptic endoscopic evaluation of swallowing from 10 adult
patients suffering from stroke or acquired brain injury presenting silent aspiration
during swallowing. Comparing the Power spectral densities of the breath signals
and swallow signals, showed higher magnitude at low frequencies for the breath
sounds following an aspiration. Therefore, they divided the frequency below 300
Hz into three frequency sub-bands over which they calculated the average power
used for the classification. The classification based on the fuzzy k-means unsuper-
vised classification method aims at clustering data into two groups of aspirated and
non-aspirated signals. Results show 82.3% of accuracy in detecting swallows with
silent aspiration.
In 2013, Tanaka et al. (2013) examined the swallowing frequency in 20 elderly
people and compared it to 15 healthy young people. Swallowing frequency was
measured using a swallowing frequency measurement device, a swallowing fre-
quency meter, consisting of a laryngeal microphone and digital voice recorder. Dif-
ferent textures were used in this study: saliva, rice, tea. Tasks of vertical and horizon-
tal movements of the head and neck, phonation and coughing were also recorded.
The elderly group was divided into two groups according to the degree of activity in
daily life. The group consisted of bedridden people and semi-bedridden elderly. The
mean swallowing frequency per hour was 11.9± 5.1 in the semi-bedridden group
which is significantly higher in the bedridden group (6.8± 3.3). However, the mean
swallowing frequency per hour was significantly lower in the elderly group com-
pared to the healthy adult control group.
In 2014, Staderini (2014) designed a proper instrument for cervical auscultation
destined for people with dysphagia. The sensor consisted of a microphone and a

52 Chapter 3. State-of-the-art
MP3 recorder for use in an ambulatory way. Yagi et al. (2014) proposed a non-
invasive swallow-monitoring system using acoustic analysis. They recorded swal-
lowing sounds using a sensor fixed on the neck and breath signals using a nasal
cannula. Three approaches are presented in this study where Approach 1 extracts
swallowing sound with frequency analysis. Approach 2 extracts swallowing event
only from breathing information. The approach 3 takes into acount both, frequency
analysis and breathing information. Frequency analysis uses Fast Fourier Transform
(FFT). Breathing information is based on the physiology of paradoxal couple breath-
ing and swallowing apnoea, which is necessary to drive food safely to the œsoph-
agus. Frequency analysis shows an increase in high frequency band power during
swallowing. Of the three approaches, Approach 3 performed the highest specificity
of 86.36%.

3.3. Sound Recognition Domain 53
Tabl
e3.
1:St
ate-
of-t
he-a
rtsu
mm
ary

54 Chapter 3. State-of-the-art
3.4 Breathing monitoring
Breathing is inseparable from the swallowing process, both processes being depen-
dent and necessary for the person’s survival. Dysphagic people present risks of
choking, malnutrition, dehydration and in extreme cases death. These health risks
reveal the essential need to understand the mechanism of swallowing in relation
to breathing. In fact, many studies evaluate the swallowing process by analysing
the coordination between breathing and swallowing Zenner, Losinski, and Mills
(1995), HIRANO et al. (2001), Rempel and Moussavi (2005), Aboofazeli and Mous-
savi (2006), and Huq and Moussavi (2010). In recent developments, involving the
estimation of the acoustic air flow rate Moussavi, Leopando, and Rempel (1998) and
Yap and Moussavi (2002), reveal the need to detect swallowing segments and auto-
matically extract them from the breathing segments.
In 1989, Benchetrit et al. (1989) evaluated the breathing pattern in healthy adult
subjects to test whether their resting pattern of breathing was reproducible over
time. To do so, they measured several respiratory features such as inspiratory time,
expiratory time, total breath time and the shape of the entire airflow profile. Af-
ter a statistical study, they concluded that the breathing pattern is maintained over
a long period despite changes which can affect breathing, like smoking habits and
respiratory diseases.
The coordination of breathing and swallowing have been investigated over a
long periodof time. In 1981, Wilson et al. (1981) studied spontaneous swallow-
ing during sleep and awakening in nine premature infants using pharyngeal pres-
sure, submental electromyography and respiratory airflow as characteristics. Dur-
ing swallowing, a decrease in pharyngeal or œsophageal pressure produced an out-
ward movement of the œsophagus or pharynx. Swallowing signals were recorded
framed by respiratory signal, inspiration or expiration. The duration of airway clo-
sure during swallowing was independent of the respiratory rate. A brief "swallow-
breath" was associated with swallow onset in most instances.
In the same context, through a study carried out by Smith et al. (1989), authors
studied the coordination of swallowing and breathing in adults using respiratory
inductive plethysmography for breathing signal and submental electromyogram for
swallowing recordings. They concluded that swallowing is almost exclusively an
expiratory activity which is consistent with the observation of Wilson et al. (1981)

3.4. Breathing monitoring 55
and which is a protective role in preventing aspiration. The breathing pattern be-
comes increasingly irregular during meals, by recording respiration and swallow-
ing simultaniously successively by inductance plethysmography, submental elec-
tromyography and a throat microphone in healthy subjects. The same observation
of a brief swallow apnoea associated with swallows were noted in a paper by Preik-
saitis and Mills (1996). In this study, expiration before and after the swallow apnoea
was the preferred pattern with all swallowing tasks. A breathing pattern associated
with single bolus swallow is different with distinct textures and volume which can-
not remain the same with regular eating and drinking behaviour associated with
successive swallowing events.
In 2018, Huff et al. (2018) studied the effect of incremental ascent on swallow
pattern and swallowing-breathing coordination in healthy adults. Signals were ac-
quired using submental surface electromyograms and spirometry for breathing. Tasks
were carried out using saliva and water. Saliva swallows were with ascent. Water
swallows showed a decrease in submental duration activity and a shift in submental
activity with respect to earlier in the swallow-apnoea period. Therefore, swallow-
breathing pattern is also affected by ascent.
Swallow-breathing coordination was also studied in chronic obstructive pulmonary
disease Gross et al. (2009). Respiratory inductance plethysmography and nasal ther-
mistry were used simultaneously to track respiratory signals in 25 patients with
chronic obstructive pulmonary disease. Swallow events were referred using the sub-
mental surface electromyography. Tasks were random and spontaneous swallowing
solids and semi-solids. The first remarkable observation comparing to healthy sub-
ject is that swallowing of solid food in patients occurs during inspiration frequently
and significant differences in deglutitive apnoea durations were also found.
Rempel and Moussavi (2005) investigated the effect of different viscosities on the
breath-swallow pattern in patient with cerebral palsy. A high rate of post-swallow
inspiration was noted during thin liquid swallowing. Subjects with cerebral palsy
had greater variability and duration of deglutition apnoea than controls.
In 2016, Fontecave-Jallon and Baconnier (2016) showed different swallow-breathing
patterns observed on respiratory inductive plethysmography signal acquired from
11 healthy subjects. The first pattern was represented by swallows occurring during
inspiration and followed by expiration. The second pattern is presented by swallows
occurring during the expiratory phase which ends with the end of the swallow. The

56 Chapter 3. State-of-the-art
latest swallow-breathing pattern is presented by swallowing in expiration which is
followed by an active expiration, which decreases the respiratory volume under the
Functional Residual Volume.
Yap and Moussavi (2002) proposed a parametric exponential model to estimate
airflow from the sound of breathing. The model parameters were derived from each
breathing phase (inspiration and expiration) separately, because the average power
of the two phases is different. The tracheal sound was recorded by accelerometers
placed at the chest and the air flow was measured by a pneumotachograph.
Moreau-Gaudry et al. (2005a) and Moreau–Gaudry et al. (2005b) focused on the
Respiratory Inductance Plethysmography (RIP) signal with the aim to automatically
detect swallowings events from respiratory records. During swallowing, the airflow
is interrupted by the closure of the larynx. This results in zero values in the airflow
signal curve. During the time-marked swallow, the airflow signal varies about zero
non monotonously. Using a statistical test on a threshold calculated on the airflow
signal, segments of swallow and breathing without swallow are identified. Results
shown a sensitivity of 91.37% and a specificity was of 87.20%. They were not very
precise in terms of border detection.
Moussavi, Leopando, and Rempel (1998) proposed an acoustical method able to
automatically detect respiratory phases. Respiratory sounds were acquired using
an accelerometer placed over trachea in 11 healthy children and 6 healthy adults.
Airflow was simultaneously recorded. The average power spectra of inspiratory
and expiratory phases were calculated separately for each signal. The average power
was compared within different frequency bands. The best of which was given by the
one who gave the greatest difference in power between inspiration and expiration
phases.
3.5 Conclusion
Early detection of dysphagia is the key to reduce the risks of untreated dyspha-
gia, such as malnutrition, dehydration or respiratory complications. Several studies
have shown that a screening tool can significantly reduce the risk of complications
Cichero, Heaton, and Bassett (2009). Currently, many screening measures are avail-
able. All share the common point of being able to divide patients into two categories:
those at risk of chocking food and in need of an accurate diagnosis for swallowing

3.5. Conclusion 57
and those who normally swallow without risk. Several types of tests are available,
ranging from questionnaires to screening tests with food intake cited above used
to observe and interpret the swallowing process. Swallowing process was studied
using several modalities ranging from more to less invasive.
The objective of our study is to monitor the process of swallowing at home non
ivasively and using the minimum of sensors which are considered comfortable and
do not modify the person’s quality of life but rather improve it. This is why we
did not choose to study MRI images for example which are very good for the diag-
nosis but it is not possible for a home monitoring. Analysis of the interactions be-
tween swallowing and breathing in patients could improve understanding and thus
prevent inhalation risks. Then, we chose to record the breathing and sound of the
swallowing with tools that can be easily installed at home following a well-defined
protocol: microphone and Visuresp vest described in Chapter 5.
The following chapter describes the system proposed for processing the recorded;
sound and respiratory signals.


59
Chapter 4
Proposed system
This work aims to detect useful signals from continuous audio flow analysis in real
time. For the acoustical method, the first step is dedicated to automatically detect
sounds event from the recording. For this purpose an algorithm based on wavelet
decomposition was proposed. Once the stage of the automatic detection of the use-
ful signals is validated, a sound classification was made based on the Gaussian Mix-
ture Model (GMM) through Expectation Maximisation (EM) algorithm (improved
under the name of CEM by Celeux and Govaert between 1990 and 1994 Celeux
and Govaert (1992) and Gilles and Gérard (1994)) on three hierarchical levels. On
the first level of the classification step, it was proposed to classify sounds through
three specific classes representing respectively swallowing, speech and environmen-
tal sounds among which were coughing, yawning and all the other sounds that
could be recorded during the recording session. Next, the sounds of swallowing
were classified according to textures. Finally, the specific sounds from the different
phases of swallowing were classified still using the GMM model and the detection
of the boundaries of each phase of the sound of swallowing were searched for by ap-
plying two different methods, the first of which was based on the Hidden Markov
Model (HMM) and the second took the form of a peak search algorithm in a single
swallowing sound containing a single swallowing event. The global algorithm for
the proposed system is presented in Figure 4.1 below:
4.1 The proposed Automatic Detection Algorithm
Recently, the analysis of swallowing sounds has received a particular attention Lazareck
and Moussavi (2002), Aboofazeli and Moussavi (2004), Shuzo et al. (2009), and Amft
and Troster (2006), whereby swallowing sounds were recorded using microphones
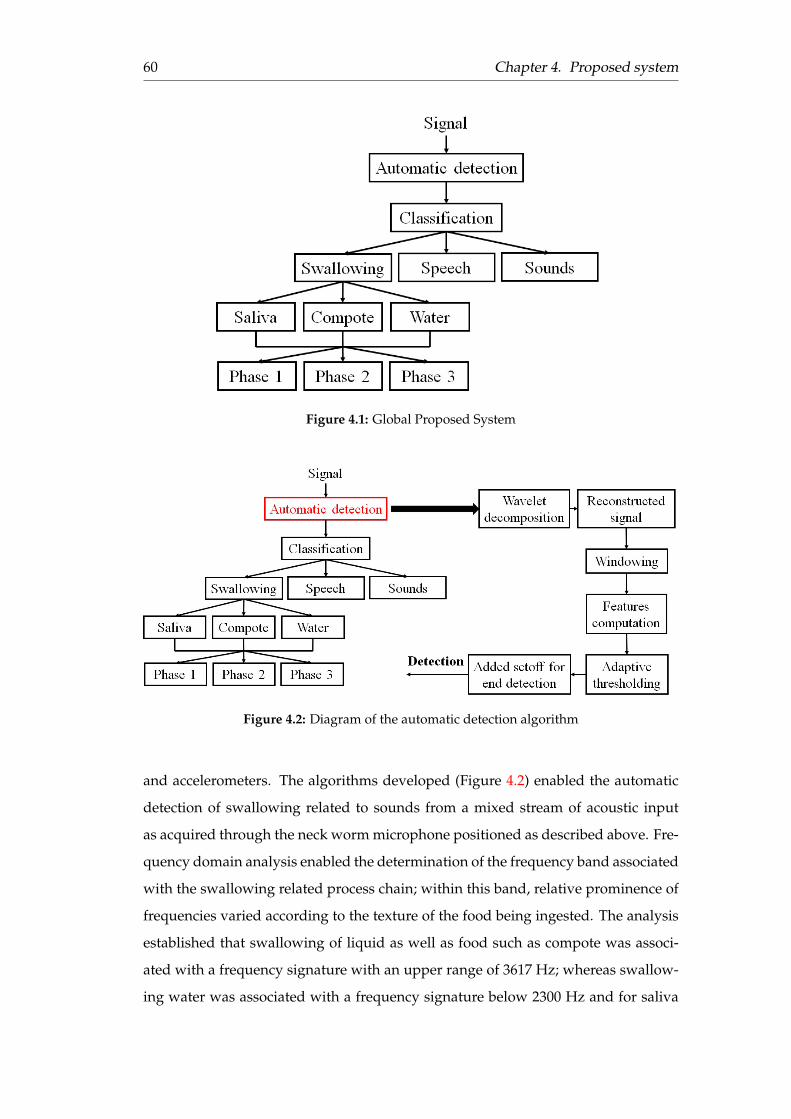
60 Chapter 4. Proposed system
Figure 4.1: Global Proposed System
Figure 4.2: Diagram of the automatic detection algorithm
and accelerometers. The algorithms developed (Figure 4.2) enabled the automatic
detection of swallowing related to sounds from a mixed stream of acoustic input
as acquired through the neck worm microphone positioned as described above. Fre-
quency domain analysis enabled the determination of the frequency band associated
with the swallowing related process chain; within this band, relative prominence of
frequencies varied according to the texture of the food being ingested. The analysis
established that swallowing of liquid as well as food such as compote was associ-
ated with a frequency signature with an upper range of 3617 Hz; whereas swallow-
ing water was associated with a frequency signature below 2300 Hz and for saliva

4.1. The proposed Automatic Detection Algorithm 61
the corresponding maximum frequency component remained below a maximum of
200 Hz. To distinguish between the different frequency bands, it was decided to
apply for processing wavelet decomposition and not the Fourier transform which is
explained by the extremely short signals in time which are positioned at a precise
moment in the sound recording signal. That is why a time and frequency analysis
is required. In time-frequency analysis, slippery Fourier transform was carried out.
Considering that the signals are very short, it is the wavelet transform that better
matches the analysis of the signals. Wavelet decomposition was then achieved using
symlet wavelets at level 12. After comparison of different combinations of wavelet
detail coefficients and considering the frequency band of the different sounds of
swallowed textures, details 5, 6 and 7 were selected for optimal decomposition and
resolution of the swallowing related sounds corresponding respectively to the fre-
quency bands 500-1000 Hz, 250-500 Hz and 125-250 Hz as shown in Figure 4.3.
Figure 4.3: Wavelet decomposition into 12 levels
Accordingly, a new signal was reconstituted as the linear combination of the
swallowing related sounds thus recovered, as shown in Figure 4.4.
Sound signals were resampled to 16 KHz. Frequency band associated with swal-
lowing, according to textures, was studied. The Roll-off point was calculated for
different swallowing segments. The Roll-off point is the frequency below which a
percentage of the signal energy is located. It was calculated for 90%, 95% and 99%
respectively. The results obtained are summarised in table 4.1.
Swallowing with the same texture was associated with high variability of the
frequency signature excluding the sounds of saliva. Swallowing water and compote

62 Chapter 4. Proposed system
Figure 4.4: Reconstructed Signal as linear combination of selected de-tails
§
Table 4.1: Roll-off point calculated according to textures(*Comp=Compote)
Frequency AnalysisCompote
Comp 1 Comp 2 Comp 3 Comp 4 Comp 5 Comp 6 Mean_freqFreq_90% 861 172 1894 172 172 1550 803Freq_95% 1378 172 2067 689 172 2239 1119Freq_99% 2067 172 3273 1722 172 3617 1837
WaterWater 1 Water 2 Water 3 Water 4 Water 5 Water 6 Mean_freq
Freq_90% 172 861 172 172 172 172 287Freq_95% 172 1378 172 172 172 172 373Freq_99% 172 2239 172 516 172 172 574
SalivaSaliva 1 Saliva 2 Saliva 3 Saliva 4 Saliva 5 Saliva 6 Mean_freq
Freq_90% 172 172 172 172 172 172 172Freq_95% 172 172 172 172 172 172 172Freq_99% 172 172 172 172 172 172 172
were associated with a frequency signature below 2300 Hz and for saliva the corre-
sponding maximum frequency component remained below a maximum of 200 Hz.
Next, analysis was performed on this reconstituted signal. The different features,
shown in Figure 4.5 were calculated using a sliding window along the signal with
an overlap of 50%. The blue line refers to the energy calculated as the average energy
of preceeding windows of the current one. Accordingly, a threshold for the start and
end of each event was established presented by green line. Using only this threshold,

4.1. The proposed Automatic Detection Algorithm 63
event detections were very short in such a way as to detect just the peaks. So, events
were not correctly and quickly detected. For this reason the threshold was modified
by adding an offset to the end-point detected (red line). Thus, the decision is made
based on this modified threshold. The start point is detected when the energy ex-
ceeds the modified threshold. The end-point is not detected when energy becomes
lower than the modified threshold, but a pause is taken during the added offset and,
if there is a new detection, detection is continued if not end-point is marked by the
end of the added offset.
Figure 4.5: Procedure of detection algorithm with different calculatedfeatures
The combination of the selected details was analysed using a sliding window
running along the signal with an overlap of 50%. For each position of the current
sliding window, simultaneously, an associated energy criterion was initially com-
puted as the average energy of the ten preceding windows and accordingly, a thresh-
old for the start and end points of swallowing related sounds was established. This
threshold was calculated as a function of the average energy as follows:
Thresholdi = ε ∗ APWi + α (4.1)
where APWi corresponds to an average of the n preceding windows of each po-
sition (position i). Thus, following this framework, the starting point of a swal-
lowing related signal would be detected when the value of its associated energy as
calculated according to the above method, exceeded the threshold and its end-point
would be detected when the associated energy decrease below the threshold level

64 Chapter 4. Proposed system
of the energy. However, experiments showed the application of the above associ-
ated energy criterion to result in significant start-end detection errors as the extreme
peaks of the signal still affected the start-end points detection disproportionately.
Accordingly, it was proposed to not stop detection of swallowing related sounds at
the position where the associated energy falls below the threshold computed as de-
scribed above, but to continue detecting and validating through a two-pass process
whereby validated start-end points were ultimately established.
4.1.1 The Gaussian mixture model
GMM was used to model the different sounds. According to previous work, pro-
posed for sound classification, GMM has given good results Istrate (2003) and Se-
hili (2013). The combination of gaussian mixture model with support-vector ma-
chines has not improved the performance of the classification system proposed for
the recognition of environmental sounds in a home control context by Sehili (2013).
However, random-forest and support-vector machines combined, gives a good Fish
Sounds classification rate Malfante et al. (2018). GMM involves two stages of learn-
ing and testing. The training step with the Expectation Maximisation algorithm was
used for classification of the three types of sounds in the input stream mixed as
set out previously: the swallowing-related, the speech and the ambient noise sig-
nal components.The EM algorithm is robust to random initialization and provides
equal or comparable performance compared to Kmeans Sarkar and Barras (2013).
The signal to be classified cannot be used directly because the information it con-
tains is in its raw state with a lot of redundancy. By transforming the time signal
into a collection of acoustic parameters the amount of information is reduced. Sev-
eral parameters were tested in this section such as the Cepstre at the outlet of a Mel
scale filter bank, the Mel Frequency Cepstral Coefficients (MFCC) and in the linear
scale, the Linear Frequency Cepstral Coefficients (LFCC), and their delta and delta-
delta, differences between coefficients obtained from one analysis window to an-
other, to include the signal temporal variations. In order to take into consideration
the swallowing-related frequency band, only 14 coefficients were chosen through
24 filters in order to consider only coefficients contained in the 2000 Hz frequency
band. The time window for calculating the acoustic parameters was chosen to be
16 ms with a 50% overlap. Knowing that speech is stationary over 16 ms and that
swallowing sounds are also human sounds, it is considered that sounds in a 16 ms

4.1. The proposed Automatic Detection Algorithm 65
Table 4.2: Correspondence of the coefficients in mel and frequencyscales for each coefficient using 24 filters
Coefficient 1 2 3 4 5 6 7 8 9 10Mel scale 0 113.6 227.2 340.8 454.4 568 681.6 795.2 908.8 1022.4Frequency (Hz) 0 74.2 156.3 247.1 347.6 458.7 581.6 717.5 867.8 1034.1Coefficient 11 12 13 14 15 16 17 18 19 20Mel scale 1136 1249.61363.21476.81590.4 1704 1817.61931.22044.82158.4Frequency (Hz) 1218 1421.51646.51895.32170.6 2475 2811.83184.23596.24051.8
Coefficient 21 22 23 24Mel scale 2272 2385.62499.22612.8Frequency (Hz) 4555.8 5113.25729.76411.6
window are also stationary. Table 4.2 below shows the correspondence between the
coefficients in mel and frequency scales for each coefficient:
The first step in the calculations is to determine the GMM model from all the files
of a sound class. Then, each of the files to be tested is evaluated according to each
GMM model calculated previously. The average likelihood rate is calculated on the
total duration of the sound to be classified which is finally allocated to the class for
which there exists the highest average, as shown in Figure 4.6.
Figure 4.6: Recognition process
The model is applied at two levels. Firstly, it is used for the recognition of sounds
by assuming that there are three global classes represented by swallowing sounds,
speech and environmental sounds that may exist during food intake such as cough-
ing and sneezing, etc.. Secondly, it is then used to recognise swallowed textures:
water, saliva and compote.

66 Chapter 4. Proposed system
4.1.2 Hidden Markov Model (HMM)
The Hidden Markov Model (HMM) was used, in which the number of hidden states
was set to three representing the swallowing sound phases. The state sequence
must begin in state 1. For this reason, the initial state probabilities are given by
πi = 1 i f i = 1; 0 i f i 6= 1 . Since the number of swallowing sounds was not large
enough to randomly divide the swallowing sounds into training and testing data
sets, a leave-one-out approach was used in which one swallow sound from the data
set was removed for testing and the HMM model was trained using the rest of the
data step for which the sequences of sound signal features and sequences of manu-
ally annotated states were used. A trained HMM model was used for segmentation
of the swallow sound which had been removed. A discrete HMM model was used
to model the different sound phases. Different temporal and frequency characteris-
tics (such as LFCC, MFCC,Skewness, etc...) were calculated on the different sound
segments and used as input to the model for learning step. For recognition step, the
hidden realisation are restored using bayesian methods to calculate the joint distri-
bution P(Y|X), where Y is the Markov sequence and X is the observed sequence.
Once the HMM model was trained, the Viterbi algorithm was used to find the most
likely state sequence and therefore, the boundaries of the states assigned by HMM
were compared to those annotated manually.
HMM steps are presented in Figure 4.7 below. The evaluation was carried out by
comparing the resulting sequence of the HMM with the reference sequence (manu-
ally annotated) state by state.
Figure 4.7: Hidden Markov Model algorithm
4.1.3 Local maximum detection algorithm
Based on the fact that the swallowing sound is characteristic of three specific sounds:
Initial discrete sound (IDS), Bolus Transit Sound (BTS) and Final Discrete Sound
(FDS) corresponding each to one of the physiological swallowing steps which are

4.1. The proposed Automatic Detection Algorithm 67
Figure 4.8: Local maximum detection algorithm
oral, pharyngeal and œsophageal Aboofazeli and Moussavi (2004) and Vice et al.
(1990). The IDS sound corresponds to the opening of the cricopharyngeal sphincter,
in order to enable the bolus to pass from the pharynx into the œsophagus. The BTS
sound corresponds to the gurgle sounds generated by bolus transmission into the
œsophagus during the pharyngeal phase. The FDS sound immediately precedes the
respiratory sound, which follows the swallowing sounds. According to the obser-
vations, the FDS are not always present in the swallowing sounds. The idea of the
algorithm (Figure 4.8) is to look for the location of the local maxima of the signal by
imposing a minimal distance between two peaks. The signal chosen for this search is
the detail 4 obtained from the wavelet decomposition using symlet wavelets at level
5 from which the mean and standard deviation are calculated using a sliding win-
dow of 16 ms duration. Then, a new signal is obtained corresponding to the sum
of the mean and the standard deviation on which values that are below a certain
threshold, defined according to the overall signals, are reset. Then, the maxima is
looked for. According to the local maximum number found, the boundaries of each
phase are decided.
• If the number of local maximum number ≥ 2: the beginning of the BTS sound
is taken as the first peak and the beginning of the FDS sound is taken as the
latest detected peak.
BBTS = f irst pic (4.2)
where BBTS corresponds to the beginning of the BTS sound and
BFDS = latest pic (4.3)
where BFDS corresponds to the beginning of the FDS sound.

68 Chapter 4. Proposed system
• If the number of local maximum number = 1: the beginning of the BTS sound
is defined following the equation below:
BBTS = pic− duration(1 : pic)/3 (4.4)
where duration(1 : pic) corresponds to duration of the segment preceding the
peak, and
BFDS = pic + duration(1 : pic) ∗ 2/3 (4.5)
4.1.4 Classification types
For the classification step, first swallowing events regardless of the texture swal-
lowed were classified. Secondly, swallowing events based on the texture swallowed
were defined. Then, the different phases of a single swallow by detecting the bound-
aries of each phase were classified. Below, the description of each step is given.
Classification: Deglutition-Speech-Sounds
For this purpose, it was proposed to classify three different sound classes using the
GMM model through the EM algorithm. For each sound class, a model was made
during the training step using files supposedly representative of this sound class.
Subsequently, the step of checking the membership of any sound to this class was
performed. During the learning phase of the model, the statistical modelling of the
acoustic parameters of the sound was carried out and the distribution of acoustic
parameters of a sound class was modelled by a sum of Gaussian probability densi-
ties. Practically, for an analysis window (16 ms), the system evaluates the acoustic
parameters corresponding to the sound signal. To estimate the likelihood ratio of
a sound file (acoustic vector), the observation distribution belonging to the same
sound class by a weighted sum of K Gaussian distributions was modelled. For the
test step, the signal to be tested was transformed into an acoustic vector X. It will
most likely belong to the class i for which p(x| Thetai) is maximum:
p(x|Θl) =K
maxk=1
(p(x|Θk)) (4.6)

4.1. The proposed Automatic Detection Algorithm 69
Textures
For the classification of different textures, for each texture a specific GMM model
(saliva, water and compote) was created and in the same way as that described
above in a) for the test step, the likelihood ratio versus each model is calculated
and related to the class that has the maximum likelihood.
Swallowing Phases
For the classification of swallowing phases and identification of the boundaries of
the different characteristics of sounds (phases) of a swallowing process, two meth-
ods were tested. First, HMM was applied in order to generate sequences of observa-
tions. The number of hidden states of HMM model was set to three representing the
swallowing sound phases, i.e., the oral, pharyngeal and esophageal phases in swal-
lowing sounds. A state sequence must begin in state 1. For this reason, the initial
state probabilities πi = 1 i f i = 1; 0 i f i 6= 1. The next state follows only after the
current state, and therefore it is dependent only on the current state and not on the
others. The second assumption for this model is that transmission probabilities are
stationary, that is to say that the probability from the state i to j at time t1 is the same
as that at time t2:
p(xt1+1 = j|xt1+1 = i) = p(xt2+1 = j|xt2+1 = i), ∀t1, t2 (4.7)
The last assumption of the model is that the observations are independent of past
values and states, which means that the probability that pharyngeal sound for ex-
ample will be produced at time t depends only on the current state and it is con-
ditionnaly independent of the past. In this study several acoustic features were
tested. Each feature of swallowing sounds with HMM were modeled in two steps
of training and secondly calculating the most likely states using Viterbi algorithm.
Initial values for the transmission probability were taken the same as in the study of
Aboofazeli and Moussavi (2008):
Tinitial =
0.5 0.5 0
0 0.5 0.5
0 0 1
(4.8)

70 Chapter 4. Proposed system
Since the number of swallowing sounds was not large enough for randomly di-
viding the swallowing sounds into training and testing data sets, the leave-one-out
approach was used in which one swallow sound from the data set was removed for
test and the HMM model was trained using the rest of data, step for which, the se-
quences of sound signal features and sequences of manually annotated states were
used. Trained HMM model was used for segmentation of the swallow sound which
had been removed. Once the HMM model was trained, the Viterbi algorithm was
used to find the most likely state sequences and therefore the boundaries of the states
assigned by HMM were compared to those annotated manually.
4.2 Methods for breath analysis
Respiration and swallowing have been studied in healthy subjects Guatterie and
Lozano (2005), Preiksaitis and Mills (1996), Smith et al. (1989), and Nishino, Yonezawa,
and Honda (1986) and the elderly using several methods Hirst et al. (2002) and
Benchetrit et al. (1989). During swallowing, breathing is inhibited.
In this work, the respiratory signal was acquired via the Visuresp vest of which
the measuring principle is based on the Plethysmography by inductance. The sys-
tem enables the acquisition of thoracic and abdominal respiratory volumes and their
display with the respiratory volume and flow calculated from the Thorax and Ab-
domen signals. The calculated flow was used for processing where convex curve
refers to expiratory phase and concave curve refers to inspiration phase. Figure 4.9
shows the interface of the sensor. In this work, the reconstituted flow rate of the
respiratory volume (Débit Rec) was measured in litres/second, which is calculated
as a function of the thoracic and abdominal volume.
The observation of swallowing in the recordings made shows that the most fre-
quent dominated swallowing-breathing pattern was presented by swallows occur-
ring during expiratory phase which takes its end after the end of the swallow. Based
on this assumption, in the first step of processing, the automatic detection of the
respiratory phase inspiration and expiration was important. For this purpose, an
algorithm was developed for automatically detecting the boundaries of each respi-
ratory phases.
The idea was based on fixing a threshold on the reconstituted flow rate of the
respiratory volume such that any value below this threshold was reset to zero. Then,

4.3. Conclusion 71
Figure 4.9: The Visuresp interface
based on this signal, the transition points from/to zero to/from positive values were
detected. The detected point was considered as the beginning of the inspiratory
phase if it was a transition from zero to a positive value. The point at the end of the
inspiratory phase or at the beginning of the expiratory phase was identified as the
transition from a positive value to zero.
Based on the observation that swallowing occurred during expiratory phase, the
possibility of automatically detect expiratory segments containing swallowing was
studied. The hypothesis that has been put forward is that the duration of the exhala-
tion is longer than that at rest, for this reason, the average duration of each recording,
was from the three minutes of rest at the beginning of each recording (for each sub-
ject). Detected expiration which has a shorter duration than a fixed threshold was
merged with the cycles before and after the phase concerned. So, the end of the pre-
ceding phase and the start of the next phase were deleted. Then, for each recording
(each subject), a threshold was defined and, whether an expiration contains events
(swallowing, speech, cough,...) or not was considered.
4.3 Conclusion
The methods of resolution of the swallowing sound are detailed in this chapter in
addition to a brief description of the methodology used to process breathing signals.
For automatic detection of useful sounds, a method based on wavelet decomposition

72 Chapter 4. Proposed system
was applied in order to use only signals in frequency band that that interest us.
Wavelet decomposition is one type of filtering bu signal de-noising step can lead also
to a filtered signal which can represent better or not events that we are looking for. To
review whether or not some additional filtering types before wavelet decomposition
will improve the results.
Gaussian Mixture Model (GMM) and Hidden Markov Model (HMM) are de-
tailed in this section as in a supervised classification. So for each class, we learn
first the considered sound classes. But what about sound classification in an unsu-
pervised case? In the case of GMM, one gaussian component can not represent one
sound class (considering three classes). In addition, I think that the short duration of
such sounds (swallowing) will influence the performance of the classification. For
HMM, still to be tested the unsupervised case.
For the proposed method of local maximum detection still a new strategy for
signal segmentation, but the exploitation of the signal envelope remains a track to
be explored.
The breathing signals should be re-examined and merged with the sound signal.
In the next chapter, results are presented.

73
Chapter 5
Results
In this chapter, the different results obtained using methods described above are
presented. First, the protocol and procedure for data acquisition and the equipment
used are presented as well as the resulting database. Next, the recorded database
and the different proposed patterns are set out according to the state-of-the-art.
Then, the results of the automatic detection algorithm are presented followed by the
results of classification, first, of manually annotated segments and then, by coupling
a classification and automatic detection algorithm. Classification is made at differ-
ent levels; first, different sounds are classified in order to distinguish swallowing
sounds from speech and other sounds. Secondly, the result of textures classification
is presented. Finally, the segmentation of a swallowing sound into three characteris-
tic sounds is presented according to swallowing physiology and swallowing phases:
oral, pharyngeal and œsphageal.
5.1 Recording protocol and swallowing monitoring database
This section is divided into two parts; first, the data acquisition protocol and mate-
rials are presented followed by the procedure and resulted database.
5.1.1 Data acquisition protocol
As part of the e-SwallHome project, a first step for the team was to develop the se-
quence of physiological signal acquisition sequences measured non-invasively in
order to study the functions of spontaneous breathing, phonation and swallow-
ing as well as their temporal organisations. The PRETA team (Physiologie cardio-
Respiratoire Expérimentale Théorique et Appliquée) in TIMC-IMAG (Techniques de

74 Chapter 5. Results
l’Ingénierie Médicale et de la Complexité - Informatique, Mathématiques et Appli-
cations, Grenoble) laboratory has the necessary authorisations for the recording of
physiological signals acquired non-invasively on healthy volunteers and patients
with different degrees of swallowing disorders.
The clinical evaluation of swallowing disorders includes a certain number of
tools the relevance of which are well-established Pouderoux, Logemann, and Kahri-
las (1996) and Tohara et al. (2003). Ventilatory system protection processes are eval-
uated by estimating ventilation control, ability to perform voluntary apnoea, and
voluntary coughing. In stroke patients, it has been shown that the weakness of vol-
untary cough is correlated with the severity of the inhalation Hammond et al. (2001)
and that a failure of the cough reflex (evaluated by an abnormal test using tartaric
acid nebulisation) may increase the risk of developing pneumonia Addington et al.
(1999). The water test consists of drinking water (quantity ranging from 50 to 100
ml) with successive boluses of 5 ml spoon McCullough et al. (2000) or free by glass
Mari et al. (1997), Splaingard et al. (1988), DePippo, Holas, and Reding (1993), and
Gottlieb et al. (1996) and is positive if the patient coughs or has an impaired voice.
The advantage of the test is to be simple with a satisfactory predictive value of in-
halations in neurological patients Mari et al. (1997), DePippo, Holas, and Reding
(1993), and Splaingard et al. (1988) or with other pathologies Miyazaki, Arakawa,
and Kizu (2002). However, it carries a risk of exposing the patient to choking on
food. A test based on the same principle is this time to ask the patient to swallow
various textures (liquid or gelled water and cream) while checking during and after
each swallowing a number of parameters (voice, discomfort, movement of the lips,
cough, etc ...).
There are other specialised methods of exploration. Endoscopic examination by
an otolaryngologist provides an opportunity to see abnormal anatomical structures
and gives information on the mobility of the components involved during swal-
lowing. Videofluoroscopy, a dynamic functional analysis of swallowing based on a
video recording of the patient’s ingestion of a barium-based contrast medium, is con-
sidered as the gold standard for diagnosing dysphagia. Videomanometry (manom-
etry associated with a videoradiography) makes it possible to study the pressure
variations during swallowing and thus to quantify the forces exerted on the bolus
during the pharyngeal phase of swallowing. Oropharyngeal videoscintigraphy en-
ables a qualitative and quantitative study of the transit of the Technetium labelled
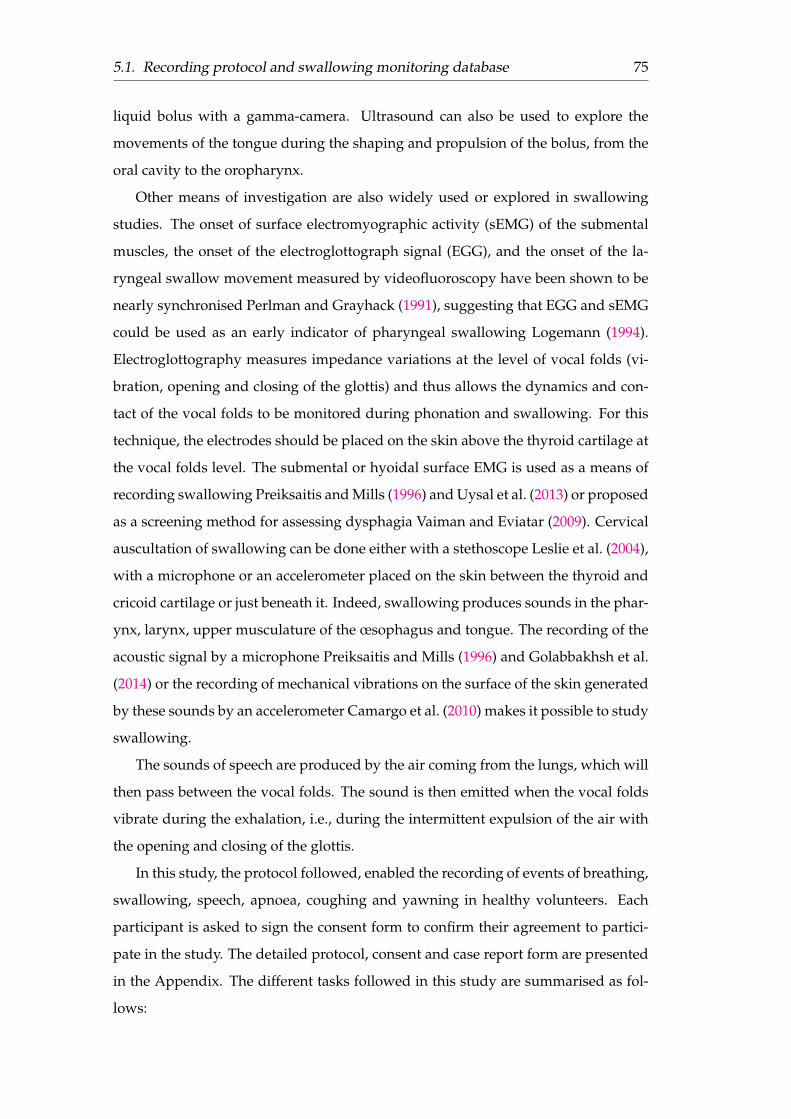
5.1. Recording protocol and swallowing monitoring database 75
liquid bolus with a gamma-camera. Ultrasound can also be used to explore the
movements of the tongue during the shaping and propulsion of the bolus, from the
oral cavity to the oropharynx.
Other means of investigation are also widely used or explored in swallowing
studies. The onset of surface electromyographic activity (sEMG) of the submental
muscles, the onset of the electroglottograph signal (EGG), and the onset of the la-
ryngeal swallow movement measured by videofluoroscopy have been shown to be
nearly synchronised Perlman and Grayhack (1991), suggesting that EGG and sEMG
could be used as an early indicator of pharyngeal swallowing Logemann (1994).
Electroglottography measures impedance variations at the level of vocal folds (vi-
bration, opening and closing of the glottis) and thus allows the dynamics and con-
tact of the vocal folds to be monitored during phonation and swallowing. For this
technique, the electrodes should be placed on the skin above the thyroid cartilage at
the vocal folds level. The submental or hyoidal surface EMG is used as a means of
recording swallowing Preiksaitis and Mills (1996) and Uysal et al. (2013) or proposed
as a screening method for assessing dysphagia Vaiman and Eviatar (2009). Cervical
auscultation of swallowing can be done either with a stethoscope Leslie et al. (2004),
with a microphone or an accelerometer placed on the skin between the thyroid and
cricoid cartilage or just beneath it. Indeed, swallowing produces sounds in the phar-
ynx, larynx, upper musculature of the œsophagus and tongue. The recording of the
acoustic signal by a microphone Preiksaitis and Mills (1996) and Golabbakhsh et al.
(2014) or the recording of mechanical vibrations on the surface of the skin generated
by these sounds by an accelerometer Camargo et al. (2010) makes it possible to study
swallowing.
The sounds of speech are produced by the air coming from the lungs, which will
then pass between the vocal folds. The sound is then emitted when the vocal folds
vibrate during the exhalation, i.e., during the intermittent expulsion of the air with
the opening and closing of the glottis.
In this study, the protocol followed, enabled the recording of events of breathing,
swallowing, speech, apnoea, coughing and yawning in healthy volunteers. Each
participant is asked to sign the consent form to confirm their agreement to partici-
pate in the study. The detailed protocol, consent and case report form are presented
in the Appendix. The different tasks followed in this study are summarised as fol-
lows:

76 Chapter 5. Results
1. Make 8 seconds of voluntary apnoea,
2. Realise 3 minutes of rest (normal breathing) where spontaneous swallowing
can be annotated,
3. Swallowing tasks:
(a) Swallowing induced saliva on command: 6 times every 30 seconds,
(b) Swallowing water free by glass (random proportions),
(c) Swallowing compote with a teaspoon (100 g),
4. Speech: Read aloud sentences in a paragraph phonetically balanced:
(a) Read 3 sentences, repeat twice,
(b) Read a sequence of sentences and then a text excerpt.
5. Make an apnoea of 3 seconds (repeat 3 times),
6. Make an apnoea of 8 seconds (repeat 3 times),
7. Make a volunteer cough (repeat 3 times),
8. Make a volunteer yawn (repeat 3 times),
9. Make a voluntary apnoea of 8 seconds.
5.1.2 Materials
In this project, non-invasive equipment was used to simultaneously record sounds
associated with the swallowing process and other ambient sounds and also respi-
ratory habits during food intake. Sounds were recorded using a discrete miniature
omni-directional microphone capsule (Sennheiser-ME 102) with an IMG Stageline
MPR1 microphone pre-amplifier, placed on the neck at a pre-studied position mid-
way between the Jugular Notch and the Laryngeal Prominence optimised for the
most effective acquisition of the swallowing related signals, marked in yellow in
Figure 5.1. The microphone has been attached with an elastic band around the neck
that does not harm the person.
Breathing is measured using a Visuresp Vest, RBI, France, using Induction Res-
piratory Plethysmography. Its principle is based on measuring, with the aid of an

5.1. Recording protocol and swallowing monitoring database 77
Figure 5.1: Best microphone position (in yellow)
elastic vest slipped over the subject’s clothing, variations in the volume of the chest
cage and the abdomen, from which the variations of the pulmonary volume are es-
timated (linear combination of thoracic and abdominal volumes).
5.1.3 Procedure and Database
The recording includes apnoea at the beginning and end of each recording session,
followed by 3 minutes of spontaneous ventilation during which spontaneous swal-
lowing will be annotated, then swallowing events will be induced in sequence by
ingesting random volumes of different homogeneous textures (saliva, water and
compote), sequences of reading aloud will then be recorded, followed by voluntary
apnoea, voluntary coughs and voluntary yawning.
Regarding to sounds recordings, sounds were recorded at a 44.1 KHz sampling
rate. The Signal was re-sampled at 16 KHz for the processing as required. Partici-
pants were seated comfortably on a chair. They were told that the equipment would
record swallowing-related sounds. The baseline function of each participant’s swal-
lowing process for the most fluid-like foods was established by capturing the data
from participants during the swallowing of water and saliva as was also the case
when fed with compote in a teaspoon. Additionally, they were asked to read aloud
phonologically balanced sentences and paragraphs. The sounds of their coughing
and yawning were also recorded.

78 Chapter 5. Results
For the annotation of events, a free software named "TranscriberAG" was used
Transcriber (http://transag.sourceforge.net/) which is designed for segmenting, labelling
and transcribing events from a sound recording to enable the manual annotation of
speech signals. It provides a user-friendly graphical user interface (GUI) for seg-
menting long duration speech recordings, transcribing them, labelling speech turns,
topic changes and acoustic conditions. The different records were used to evalu-
ate the detection and the classification algorithms and coupling between them. For
speech segments, it was not too difficult to define their boundaries but that was not
the case for swallowing sound which is drowned sometimes in the noise because
of its low power. For this purpose, the events were manually segmented by listen-
ing and monitoring the swallowing signals in both time and frequency domains. In
total, there were 39 records obtained in 27 healthy volunteers with a total duration
of approximately 11 hours with 3493 manually annotated segments. The detailed
database is described in the Table 5.1 below:
Table 5.1: Sound database
Classes Number of files Duration3*Swallowing Compote3*1949567 40 minutes
Water 647Saliva 735
Speech 705 1h 31 minutesSounds 839 29 minutes
The database contains two types of signals: sound signals and breathing signals.
Below, first the sound signals and the associated interpretations used for segmenta-
tion are set out. Next, the respiratory signal and its relationships to the sound signal
are presented.
5.1.4 Sound signals
In several studies, normal swallowing sound may be divided into three distinct char-
acteristic sounds. According to the state-of-the-art, different patterns of swallowing
sound segmentation were proposed. The researcher’s team Aboofazeli and Mous-
savi (2008), Aboofazeli and Moussavi (2004), and Moussavi (2005) at the University
of Manitoba considered that the swallowing sound can be divided into three distinct
segments: Initial Discrete Sound (IDS), Bolus Transit Sound (BTS) and Final Discrete
Sound (FDS) as shown in Figure 5.2. According to their observations, FDS may not
be present all the time.

5.1. Recording protocol and swallowing monitoring database 79
Figure 5.2: A typical swallowing sound (a) time-domain signal (b)the corresponding spectrogram. (’au’ arbitrary units for normalised
amplitude Aboofazeli and Moussavi (2004))
The same characteristic sounds were explored by Nagae and Suzuki (2011). The
sounds correspond respectively to: the epiglottis closing, the bolus passing the œsoph-
agus and the epiglottis opening as shown in Figure 3.3. The interpretation of the
click that appears in the sound signal of the swallow is the same but the difference
is on the shape of the two signals. The signal acquired by Aboofazeli and Mous-
savi (2004) are using two Siemens accelerometers (EMT25C) which were attached
by double-sided adhesive tape rings to the skin over the trachea at the suprasternal
notch to record breathing and swallowing sounds and at the left or right second in-
tercostal space in the midclavicular line to record breath sounds. The typical pattern
observed contains a first phase which is described as quiet followed by the second
phase which is started by initial discrete sounds (IDS) corresponding to the open-
ing of the cricopharyngeal sphincter during the pharyngeal phase. During the next
phase, the third phase, a gurgle sound is heard due to the transmission of the bolus
into the œsophagus named the Bolus Transfert Sound which does not necessarily
have a peak. Another characteristic sound in the form of click occurs at the end of
swallowing process known as the Final Discrete Sound (FDS) which is not present
in all recorded segments. The swallowing process is followed by expiration which is

80 Chapter 5. Results
explained by the inhibition of inspiratory neuron activity during swallowing proved
by Hukuhara and Okada (1956).
In the work of Nagae and Suzuki (2011), swallowing sounds were acquired us-
ing their own interface to detect swallowing sounds. The measurement device was
not placed through the trachea. Based on a study of measurement location related
to the frequency and intensity of the detected signal, the best location was fixed on
either side of the central axis of the neck. The swallowing sound contains three char-
acteristic sounds: the sound of the epiglottis closing, the sound of the bolus passing
the œsophagus and the sound of the epiglottis opening. The three characteristic
sounds have peaks in the signal unlike what was observed in the signal recorded in
the Aboofazeli and Moussavi (2004) study, in which the second characteristic sound
does not have a peak and takes a flat form.
The interpretations of the two models highlight two important aspects that influ-
ence the quality of the swallowing sound signal: the position of the sensor sensitive
to the swallowing sound and the sensor itself. Accordingly, using an preamplified
microphone, a matrix of 12 positions (4x3) was proposed on the neck with two ref-
erence positions to normalize measurements from one subject to another, located re-
spectively at the sternal point and the tip of the chin protuberance (at the end of the
chin) as shown in the Figure 5.1. Signal quality evaluation is performed by analysing
the signal-to-noise ratio of the swallowing segments according to textures. The best
value of signal-to-noise ratio is given by position 8 above the sternal point at about
37.5% of the distance between the two references points considered. So, for the next
step, this position was chosen to be registered in the database. Once the recordings
are obtained, the event annotations are also performed by listening and monitoring
the sound signals in both time and frequency domains.
It should be noted that the swallowing segments include one or more succes-
sive swallows. Durations of the swallowing event presented below are calculated
from segments containing a single swallowing event. The duration of a swallow-
ing event without taking into account the texture is about 1.007 ± 0.407s (mean ±
standard deviation). The duration of a single swallowing process according to tex-
ture did not show a significant difference between water and compote. However, the
duration for saliva is slightly longer. Durations of different segments are presented
in Tables 5.2 and 5.3:
Swallowing sounds are highly variable even if recorded from the same subject.

5.1. Recording protocol and swallowing monitoring database 81
Table 5.2: Swallowing event duration
SwallowingDuration (s) 1.007± 0.407
Table 5.3: Swallowing event duration according to textures
Compote Water SalivaDuration (s) 0.990± 0.319 0.979± 0.276 1.095± 0.687
They do not have a unique temporal and durational pattern. The swallowing sound
signal is a not-stationary signal. In physiological terms and according to the state-of-
the-art, swallowing occurs in three phases: oral, pharyngeal and œsophageal. The
sound thus recorded is generated by the various movements of the bolus during the
swallowing process. A different interpretation of the swallowing sound is presented
here. The waveform of a typical swallowing sound signal of water and its three
phases are shown in Figure 5.3. Considering always that swallowing sounds contain
three characteristic peaks, the first characteristic sound corresponding to the first
peak is represented on Figure 5.3. This sound corresponds to the opening of the
cricopharyngeal sphincter and the closing of the epiglottis referenced in Figure 5.3
by the IDS segment. The second phase BTS can be divided into two subphases.
The first subphase noted by BTS1 in the Figure 5.3 is in accordance with what was
presented in the work of Aboofazeli and Moussavi (2004), which corresponds to the
bolus transmission sounds (BTS) which are due to the transmission of the bolus from
the oropharynx into the œsophagus during the pharyngeal phase. Otherwise, it is
assumed that the BTS2 segment, which takes the form of a flat wave, corresponds to
the propulsion of the bolus at the upper part of the œsophagus and finishes with the
opening of the epiglottis referring to the third characteristic sound FDS.
Another microphone position used was fixed on the Visuresp vest (Figure 5.4).
Swallowing sounds were approximately 188 samples with a duration of 100 seconds
in total. They were recorded from 10 persons (5 females and 5 males) aged be-tween
23 and 34 years. Participants were seated comfortably on a chair. They were told
that the equipment would record swallowing sounds and respiration signals. Dur-
ing the test, all of them were asked to drink or eat freely to promote an ambient
environment. They were fed with thick liquid (compote-100 grams) using teaspoon
and a glass of water (200 ml).
In addition to the databases belonging to the team, two other databases were
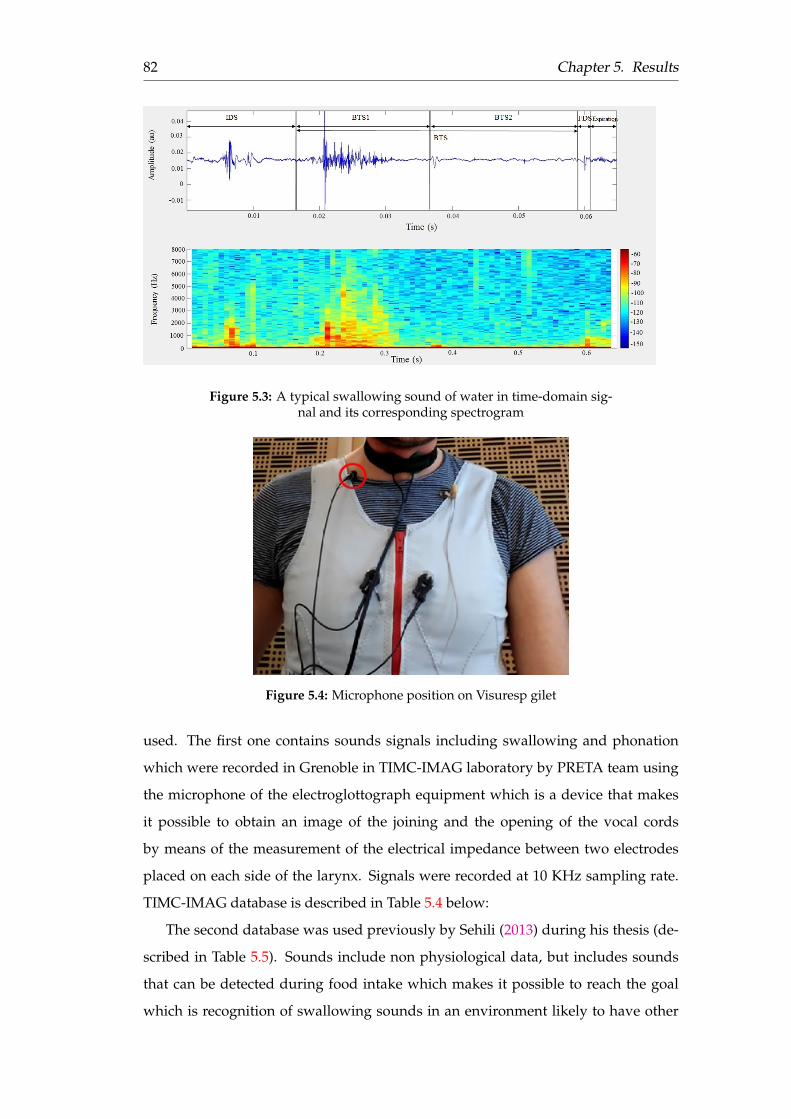
82 Chapter 5. Results
Figure 5.3: A typical swallowing sound of water in time-domain sig-nal and its corresponding spectrogram
Figure 5.4: Microphone position on Visuresp gilet
used. The first one contains sounds signals including swallowing and phonation
which were recorded in Grenoble in TIMC-IMAG laboratory by PRETA team using
the microphone of the electroglottograph equipment which is a device that makes
it possible to obtain an image of the joining and the opening of the vocal cords
by means of the measurement of the electrical impedance between two electrodes
placed on each side of the larynx. Signals were recorded at 10 KHz sampling rate.
TIMC-IMAG database is described in Table 5.4 below:
The second database was used previously by Sehili (2013) during his thesis (de-
scribed in Table 5.5). Sounds include non physiological data, but includes sounds
that can be detected during food intake which makes it possible to reach the goal
which is recognition of swallowing sounds in an environment likely to have other

5.1. Recording protocol and swallowing monitoring database 83
Table 5.4: Grenoble’s database (acquired as part of the e-SwallHomeproject by Calabrese et al. (1998))
Sounds Number of samples Total Duration (s)
Swallowing 923 1538.6
Speech 351 2047.6
Sounds 126 166.2
types of ambient sounds (i.e. noise).
Table 5.5: Sehili’s database
Sounds Number of samples Total Duration (s)
Breathing 50 106.44
Cough 62 181.69
Yawn 20 95.87
Dishes 98 03.77
Glass breaking 101 99.52
Keys 36 166.33
Laugh 49 166.33
Sneeze 32 51.67
Water 54 84.72
5.1.5 Breathing signals
In this study, ventilation is monitored using repiratory inductive plethysmography
via the Visuresp vest. The system enables the measurement of the thoracic and ab-
dominal respiratory volumes, but also, it enables the derivation of two other signals:
the respiratory volume and flow calculated from the Thorax and Abdomen signals
(Figure 4.9). In this work, the reconstituted flow rate was used as it was considered
to be more representative of respiratory variation by the team that designed the vest.
The annotations are considered to be the same as those obtained from sound.
This is why the synchronisation of sound and respiratory signals is required. The
apnoea sequences at the beginning and end of each recording play a crucial role in
synchronisation. Apnea is characterised by a flat signal in the respiratory records,
as shown in Figure 5.5, but not in the sound signal. For this reason, at the beginning
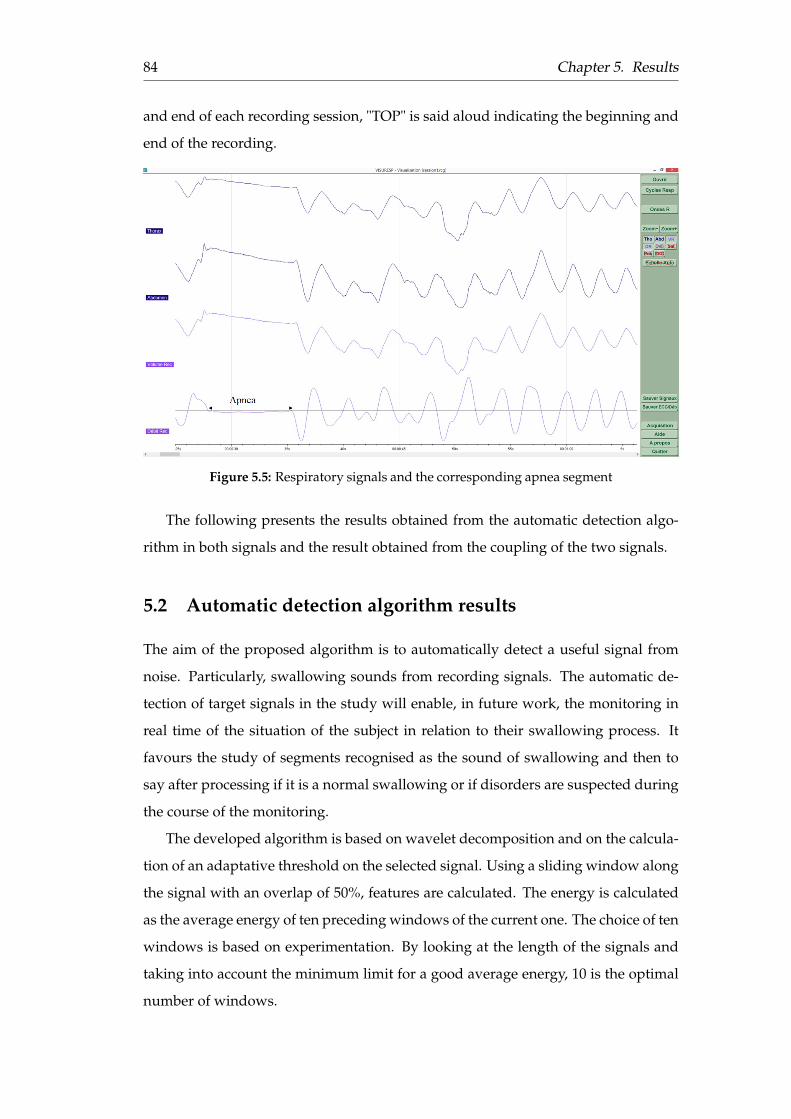
84 Chapter 5. Results
and end of each recording session, "TOP" is said aloud indicating the beginning and
end of the recording.
Figure 5.5: Respiratory signals and the corresponding apnea segment
The following presents the results obtained from the automatic detection algo-
rithm in both signals and the result obtained from the coupling of the two signals.
5.2 Automatic detection algorithm results
The aim of the proposed algorithm is to automatically detect a useful signal from
noise. Particularly, swallowing sounds from recording signals. The automatic de-
tection of target signals in the study will enable, in future work, the monitoring in
real time of the situation of the subject in relation to their swallowing process. It
favours the study of segments recognised as the sound of swallowing and then to
say after processing if it is a normal swallowing or if disorders are suspected during
the course of the monitoring.
The developed algorithm is based on wavelet decomposition and on the calcula-
tion of an adaptative threshold on the selected signal. Using a sliding window along
the signal with an overlap of 50%, features are calculated. The energy is calculated
as the average energy of ten preceding windows of the current one. The choice of ten
windows is based on experimentation. By looking at the length of the signals and
taking into account the minimum limit for a good average energy, 10 is the optimal
number of windows.
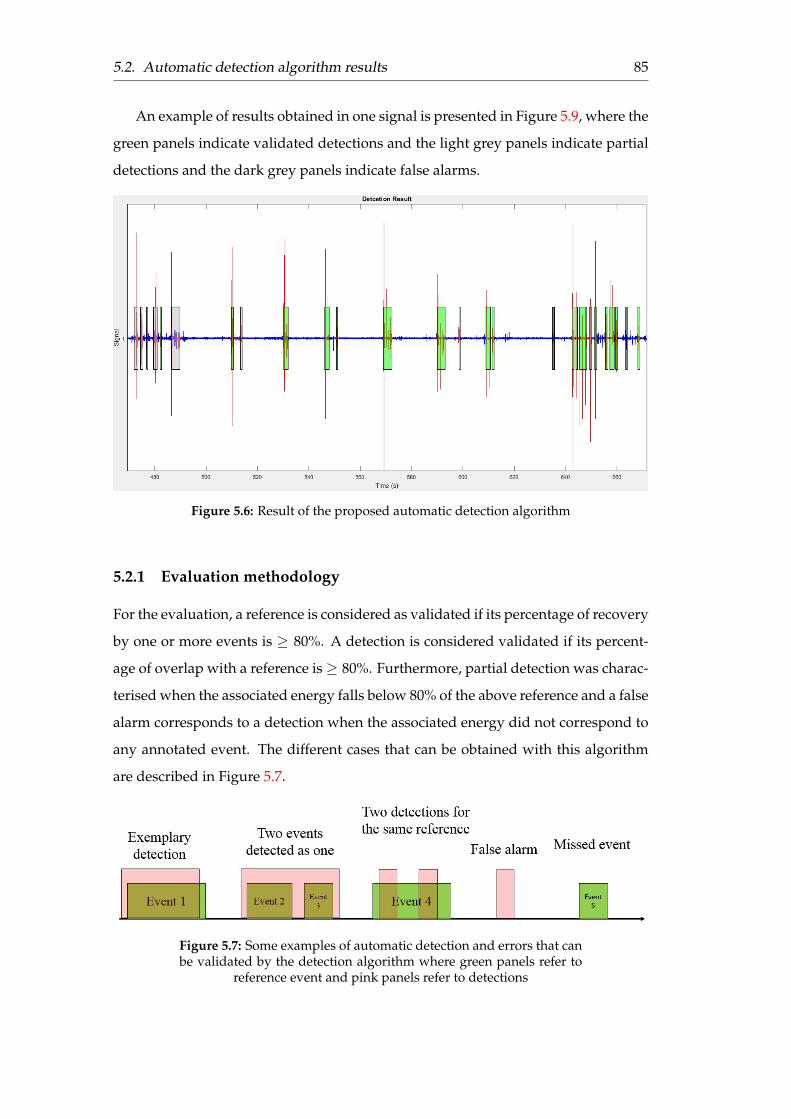
5.2. Automatic detection algorithm results 85
An example of results obtained in one signal is presented in Figure 5.9, where the
green panels indicate validated detections and the light grey panels indicate partial
detections and the dark grey panels indicate false alarms.
Figure 5.6: Result of the proposed automatic detection algorithm
5.2.1 Evaluation methodology
For the evaluation, a reference is considered as validated if its percentage of recovery
by one or more events is ≥ 80%. A detection is considered validated if its percent-
age of overlap with a reference is≥ 80%. Furthermore, partial detection was charac-
terised when the associated energy falls below 80% of the above reference and a false
alarm corresponds to a detection when the associated energy did not correspond to
any annotated event. The different cases that can be obtained with this algorithm
are described in Figure 5.7.
Figure 5.7: Some examples of automatic detection and errors that canbe validated by the detection algorithm where green panels refer to
reference event and pink panels refer to detections
86 Chapter 5. Results
The false alarm rate (FAR) is calculated as shown in equation 5.1:
FAR =Number o f f alse alarms
Number o f f alse alarms + Number o f re f erences to be detected(5.1)
Validated event rate (VER) is calculated in equation 5.2:
VER =Number o f validated re f erences
Number o f re f erences to be detected(5.2)
Partial event rate (PER) is calculated in equation 5.3:
PER =Number o f partial re f erences
Number o f re f erences to be detected(5.3)
Missed event rate (MER) is calculated in equation 5.4:
MER =Number o f missed re f erences
Number o f re f erences to be detected(5.4)
5.2.2 Developed detection application
The algorithms were integrated into an application developed through Matlab which
enables the acquisition and detection of useful signals in real time. The graphical
interface (Figure 5.8) of the application contains two panels. The first of which cor-
responds to the place where the curve of the signal acquired in real time will be
presented. The second panel corresponds to the options available in the form of two
push-buttons corresponding respectively to the beginning of the recording and the
end of the recording. The black line shows the sound acquired in real time and the
red line refers to the decision indicating the start point shown by the red curve going
from zero to one. The end-point is shown in the red curve going from one to zero.
The sound signal was recorded by the microphone positioned on the pre-studied
position on the neck. The microphone has been connected to the computer through
a signal amplifier (Img Stage Line Microphone Preamplifier), which is connected to
an external DeLOCK sound card in the form of a sound box connected to the PC via
a USB 2.0 cable. A signal is required with a sample rate of 16 kHz with an analysing
window of 0.08 second.
Results showed an overall rate of validated events of 86.14% of which 22.19%
were validated events and 63.95% were partial events. The rate of missed events

5.2. Automatic detection algorithm results 87
Figure 5.8: Graphical interface of the recording and detection appli-cation in real time
is about 13.85%. The false alarm rate is about 24.92%. Results are summarised in
Figure 5.9 and Table F.1 below.below.
Figure 5.9: Detection results
Once the results of the automatic detection algorithm have been validated, the
next step is to classify a new sound among the different sound classes.

88 Chapter 5. Results
Table 5.6: Automatic detection results
Number of references to be detected = 3501Events References
Number of Validated Events 67.55% Number of Validated References 22.19%Number of Partial Events 30.13% Number of Partial references 63.95%Number of False Alarms 24.92% Number of Missed References 13.85%
5.3 Classification results
In this section, the results of classification algorithms are presented in order to iden-
tify firstly swallowing sounds from other sounds. Secondly, the results for the classi-
fication of textures are presented. Finally, the results obtained to identify the bound-
aries of the different characteristic sounds from the sound of the single swallow are
set out.
5.3.1 Evaluation methodology
For classification evaluation, a large corpora is needed for training the models and
also a large (in order to have good statistics) corpora for testing. If sufficient data are
available, usually, the corpora are divided into 2/3 for training and 1/3 for testing.
If the corpora size is not sufficient, the a k-folds method was used.
The k−folds method consists of randomly splitting the database into k equal
parts and then removing part of the learning and using it as a test, then repeat-
ing this manoeuvre for each part. The k−fold cross-validation divides the original
sample of size n into k sub-samples, then selects k − 1 sub-samples as learning set
and the last sample serves as validation set. Since there was not enough data, the
leave-one-out cross validation approach was used, a particular case of k−fold cross
validation for k = 1. Practically, the first observation was used as a validation sam-
ple and the n− 1 remaining observations as a learning set. Then, this procedure was
repeated n times by choosing as validation observation the 1st,2nd,3d etc..., the last
one, and taking each time the other observations as learning set. The leave-one-out
method is a particular case which is only used for test data set-up.
The choice of leave-one-out cross validation approach (5.10) minimises the inter-
dependence between samples and thus comes as close as possible to the effective
accuracy of the evaluated system.

5.3. Classification results 89
Figure 5.10: Classification evaluation process with leave-one-out ap-proach
5.3.2 Classification
The first intention, while respecting the initial goal of the project, is to be able to
recognise the sounds of swallowing from other sounds. To do this, three sound
classes were worked on; representing swallowing sounds, speech sounds and other
sounds such as coughing, yawning and breathing. For this purpose a Gaussian Mix-
ture Model (GMM) through the EM algorithm was used. For each sound class, a
model was made using the fourteen LFCCs and their first and second derivatives cal-
culated for each sound using a sliding window of 16 ms with an overlap of 50%. For
the test step, the membership of each sound was checked for each model created pre-
viously during the learning phase by taking the maximum of the log-likelihood.The
evaluation process is presented here with the leave-one-out approach evaluation
process result obtained using the database described in Table 5.1. First, the results
obtained using the manually annotated segments are presented (ideal case) followed
by the coupling of the automatic detection results and classification.
Optimization of Gaussian numbers for the GMM model
In practice, automatic learning implies the optimization of a performance criterion.
It was then that the Gaussian number to be used for the model of each sound class
was optimized. Two scenarios are displayed: an optimization of the number of
Gaussian for the classification taking into account three sound classes representing

90 Chapter 5. Results
swallowing, speech and environmental sounds respectively. And other optimisa-
tion step for classification of swallowing sounds according to the swallowed tex-
ture. following steps for training and testing, by varying the number of gaussian
components in each studied case. By consulting the confusion matrix for each case,
the optimal number of Gaussian is 8 in the case of the classification of sounds con-
sidering swallowing, speech and all other sounds. And in the case of classification
of the sound of swallowing according to the swallowed texture: saliva, water and
compote, the optimal number of gaussian components is 4.
Swallowing-Speech-Sounds classification of manually annotated sounds
For the manually annotated segments, an overall recognition rate (ORR) was ob-
tained of 95.49% with a recognition rate of 100% for swallowing sounds. The results
are presented in Table 5.7. The good recognition rates corresponding to each sound
class are presented in Figure 5.11. The recognition rate for speech is 91.49% and for
sounds 94.98%. The risk of confusion with the class of speech and sounds is low;
8.51% of speech are recognised as sounds and 5.02% of sounds are recognised as
speech.
Figure 5.11: Good recognition rate per class using manually anno-tated segments

5.3. Classification results 91
Table 5.7: Confusion matrix of the classification of manually anno-tated segments
ORR = 95.49% SwallowingSpeechSoundsSwallowing 100% 0 0Speech 0 91.49% 8.51%Sounds 0 5.02% 94.98%
Swallowing-Speech-Sounds classification-Comparison with other databases
This sub-section presents a comparison of the results of the detection algorithm and
classification applied using different databases other than the database used here
(Tables 5.4 and 5.5).
Results of the automatic detection algorithm, applied on the sounds obtained
from the microphone attached to the vest, show a global rate of good detection of
87.31% among the different events of swallowing, speech and sounds as shown in
Table 5.8 and a global rate of false detection of 36.49%. Then to show the impact of
partial detection in the classification system, the detections that contain more than
50% of the reference event are observed, which represent 82.9% of global good auto-
matic detections.
Table 5.8: Automatic Detection Algorithm results for data obtainedfrom microphone attached to the vest
Figure 5.12 shows the confusion matrix using just the UTC database using GMM
trained through the Expectation Maximisation (EM) algorithm and leave-one-out
approach. It shows a good rate of recognition of 84.57% for swallowing events
and 75% and 70.57% respectively for speech and sounds events. On other hand,
results show a false positive rate of swallowing events of 4.26% and 11.17% classi-
fied respectively in speech and sounds events which means that some swallowing
events will be missed. Also, sounds events are sometimes misclassified as swallow-
ing events which means false alarm of swallowing event. This result is obtained
using segments manually annotated and extracted. The same test has been applied
to the Grenoble database. The results in Figure 5.13 show a good rate of recognition
for three classes Swallowing, Speech and Sounds respectively of 95.94%, 98.92% and
67.46%.

92 Chapter 5. Results
Figure 5.12: Good recognition rate per class using sounds obtainedfrom microphone fixed on the vest
Table 5.9: Confusion matrix using sounds obtained from microphonefixed on the vest
Swallowing Speech SoundsSwallowing 84.57% 4.26% 11.17%Speech 0% 75% 25%Sounds 14.96% 14.46% 70.57%
Figure 5.13: Good recognition rate per class using Grenoble database

5.3. Classification results 93
Table 5.10: Confusion matrix of Grenoble database
Swallowing Speech SoundsSwallowing 95.94% 1.22% 2.85%Speech 1.08% 98.92% 0%Sounds 11.11% 21.43% 67.46%
Results of classification have produced comparable results but the best recog-
nition rate was obtained using sounds recorded with a microphone fixed in a con-
trolled and pre-studied position on the neck. It shows the importance of the position
of the used microphone. The results also show that sound recognition depends on
the quality of the signal and therefore indirectly on the type of microphone used for
recording and its position. The comparison between the results, shown in the Fig-
ure 5.14 below, shows good results when using the preamplified microphone with a
pre-studied position.
Figure 5.14: Good recognition rate per class using different data
Moreover, we also would like to test classification using different data. So, mod-
els were trained using UTC data and test with Grenoble data. Obviously the results
deteriorate because signals were not recorded in the same environmental conditions
and were acquired with different sensors. To remedy this degradation, in future
work it is intended to apply a GMM and MAP (Maximum a Posteriori) adaptation
approach.

94 Chapter 5. Results
Unlike the recognition of manually annotated swallowing sounds, the recogni-
tion of swallowing sounds according to the swallowed texture is not well recognised
and the risk of confusion between the three classes is very high. This is explained
by the similarity intra-subjects of the sound components of the swallowing sounds
independently of the textures and their great variability inter-subjects. Below, exam-
ples are shown of the sound signals referring to the different textures of swallowing
sounds and their corresponding spectrograms (Figure 5.15, 5.16 and 5.17).
Figure 5.15: Spectrograms of the sounds of compote swallowing
Figure 5.16: Spectrograms of the sounds of water swallowing
Figure 5.17: Spectrograms of the sounds of saliva swallowing

5.3. Classification results 95
Textures classification of manually annotated sounds
In this section, it was proposed to classify textures using GMM. To do so, models
were created for each sound class of texture according to the swallowed textures of
compote, water and saliva respectively. Good recognition rates for each considered
class are given in Figure 5.18. The detailed results are summarised in Table 5.11.
Good recognition rate for each considered texture are presented in Figure 5.18
Figure 5.18: Good recognition rate per class using manual annotatedswallowing sounds according to textures
Table 5.11: Confusion matrix of the classification of manually anno-tated swallowing sounds according to textures
ORR = 70.24% Compote Water SalivaCompote 45.26% 30% 24.74%Water 19.07% 68.84% 12.09%Saliva 23.27% 26.12% 50.61%
Coupling between detection and classification
This section presents the results of the coupling between the sound event detection
system and the sound classification system. The detection of a sound event consists
of determining the time of appearance end detection of a signal, after which the
classification system is activated in order to identify the event. The critical point
affecting the coupling between classification and detection is the performance of the

96 Chapter 5. Results
algorithm for automatic detection of useful signals. In other words, the detection of
the beginning and end of the detected signals. Among the possible failures are:
• Early detection of the signal or the start is detected before the actual start of
the signal and the cost part of the detected signal contains only noise (same
remark for the detection of the end after the actual end of the signal),
• Delayed detection of the signal or the start is detected after the actual start of
the signal and therefore part of the useful signal is not taken into account (same
remark for the detection of the end before the actual end of the signal),
• Detection that merges several events, i.e. the detected signal contains both
useful signals and noise. This does not pose a problem for classification if the
merged events are of the same nature, for example swallowing-deglutition, but
for example in the case of merging swallowing and speech, the segment will
be attracted to one of the two classes. It should be noted that the classification
of automatically detected signals containing or not noise does not influence
the classification that is carried out with a GMM system that does not take into
account the time evolution of the signal,
• Detection of false alarms that do not correspond to any useful signal.
The detection algorithm based on the wavelet transform, proposed in Chapter
4, has good detection performance and good accuracy in determining the time of
signal start and end. But it also has constraints in the form of event merging, delayed
detection of the beginning and end of each event, and detection of false alarms.
Three global sound classes are obtained from the algorithm of automatic detec-
tion: validated detections, partial detections and false alarms. The same procedure
of classification is done using GMM model using the automatically detected sounds.
Taking into account all the outputs of the detection, an additional class has been
added to the system previously proposed. The classification based on GMM models
was performed using the leave one out approach. Each class is learned at each iter-
ation from the validated segments. The results of the classification are summarised
in the Table 5.12. The overall recognition rate of the system is 88.87% with a good
recognition rate of swallowing sounds of 87.10%. False alarm sounds are all well
recognised (100%). However, the risk of confusion between classes is almost impor-
tant for sounds of which 25.44% is recognised as swallowing, which can be explained

5.3. Classification results 97
by the similarity between the segments of the swallow and those of the automatically
detected sounds caused by the noise contained in the detected segments.
Table 5.12: Confusion matrix of the classification of automatically de-tected sounds
ORR = 88.87% Swallowing Speech Sounds False alarmSwallowing 87.10% 12.58% 0.32% 0%Speech 3.46% 95.60% 0.94% 0%Sounds 25.44% 1.78% 72.78% 0%False alarm 0% 0% 0% 100%
The same interpretation for the classification of textures for automatically de-
tected swallowing sounds, the risk of confusion between classes is remarkably high
as shown in table 5.13.
Table 5.13: Confusion matrix of the classification of automatically de-tected swallowing sounds according to textures
ORR = 62.55% Compote Water SalivaCompote 33.33% 58.02% 0%Water 15.15% 67.42% 1.52%Saliva 13.40% 68.04% 6.19%
5.3.3 Assessment of Swallowing Sounds Stages
As described above, single swallowing sounds were manually segmented into three
phases by visual aids such as spectrogram and auditory means (by listening to the
sounds repeatedly). Figure 5.19 shows examples of decomposition of swallowing
sounds for swallowing of water and compote into three phases.
The duration of each swallowing phase in healthy subjects is presented in Tables
5.15 and 5.14 below:
Table 5.14: Swallowing phases duration for Water sounds
Phase 1 Phase 2 Phase 3Duration (s) 0.240± 0.109 0.439± 0.149 0.299± 0.137
Table 5.15: Swallowing phases duration for Compote sounds
Phase 1 Phase 2 Phase 3Duration (s) 0.222± 0.111 0.461± 0.167 0.308± 0.128
To automatically identify the boundaries of each phase of the swallowing phases
described above, it was proposed to apply two algorithms.

98 Chapter 5. Results
(a) Water swallowing sound
(b) Compote swallowing sound
Figure 5.19: Typical decomposition of the swallowing sound intothree characteristic sounds
Assessment of Swallowing Sounds Stages with HMM
Several features were tested as inputs for each swallowing sound: LFCCs, MFCCs,
mean, standard deviation, mean frequency, mean power, root mean square, vari-
ance, waveform fractal dimension (WFD), skewness and kurtosis measures. Table
5.16 shows the mean and standard deviation for delays in the detection of bound-
aries of swallowing sound phases among all tested data. Negative values in the
delays mean that the boundary detected by the Vitervi algorithm occurs before the
manually annotated boundary.
Based on the results shown in Table 5.16, the best results were achieved using
LFCC_2 and 8LFCC where LFCC_2 refers to the second coefficient of LFCCs and
8LFCC refers to the first eight LFCCs coefficients. It was expected at the beginning
that the best result would be obtained from WFD as was the case in the study of
Moussavi (2005), but the model does not change state for all the segments tested.

5.3. Classification results 99
Table 5.16: Mean ± standard deviation for delay in detection ofboundaries of swallowing sound phases obtained by HMM
Features Delay in detection of Delay in detection ofthe beginning of IDS (ms) the beginning of BTS (ms)
LFCC_2 13.56± 40.67 −0.44± 39.158LFCC 2.67± 38.70 −0, 64± 63.768MFCC 22.32± 51.67 −56.91± 53.33MFCC_2 16.23± 38.13 −39.31± 44.54Mean −9.98± 39.77 −88± 55.38Standard deviation −34.13± 18.22 −127.62± 56.75Mean frequency 17.37± 52.48 −72.38± 51.39Mean power −36.50± 16.72 −102.48± 65.73Root Mean Square −34.13± 18.22 −137.37± 51.03Variance −36.50± 16.72 −144.84± 40.26Waveform fractal dimension X XSkewness 7.31± 46.88 −68.11± 65.68Kurtosis 9.22± 50.75 −35.81± 64.39
It could be explained by the quality of the signal which is acquired using different
sensors, compared to this study. In the following, the results obtained are presented
separately with the sounds of water and compote using parameter LFCC_2 that gave
the best results. Table 5.17 shows the confusion matrix of the classification of water
sounds, which shows that the first phase is the best recognised phase unlike phase 2
and phase 3 which is consistent with what was found by Moussavi (2005). The clas-
sification using IDS segment improves the accuracy up to 73%. Delays of detection
boundaries are shown in Table 5.18.
Table 5.17: Confusion matrix of the classification of water sounds ofthe swallowing phases using HMM
ORR = 52.83% Phase 1 Phase 2 Phase 3Phase 1 73.35% 20.62% 6.03%Phase 2 41.96% 37.29% 20.74%Phase 3 18.40% 36.74% 44.86%
Table 5.18: Delays in detection boundaries of swallowing phases inwater sounds (ms)
Detection delays of IDS Detection delays of BTS6.49± 55.11ms −49.15± 68.98 ms
Results using HMM were almost similar for the compote sounds, always using
LFCC_2 as input feature for HMM, as shown in Table 5.19 with a delay of detection
IDS of 16.10± 60.12ms, and detection of BTS boundaries are well in advance of what
it was annotated manually (Table 5.20).

100 Chapter 5. Results
Table 5.19: Confusion matrix of the classification of compote soundsof the swallowing phases using HMM
ORR = 46.29% Phase 1 Phase 2 Phase 3Phase 1 72.36% 19.15% 8.49%Phase 2 48.16% 29.36% 22.47%Phase 3 28.60% 34.24% 37.15%
Table 5.20: Delays in detection boundaries of swallowing phases incompote sounds (ms)
Detection delays of IDS Detection delays of BTS16.10± 60.12ms −43.04± 68.76 ms
The accuracy of classification by HMM hardly reached 52%. In the next section,
the results obtained by the algorithm based on the detection of local maxima de-
scribed in section 4 are presented.
Local maximum detection algorithm results
Assuming that a single swallowing sound contains three specific sounds charac-
terised by three peaks, the main idea is to look at the location of the local maxima
of the signal by imposing a minimal distance between two peaks. Accordingly, the
boundaries of each phase are determined according to the number of local maxima
detected. Results showed good results for recognition of phases with an overall rate
recognition of 80.27% for water and 70.95% for compote as shown in Tables 5.21 and
5.22.
Table 5.21: Confusion matrix of the classification of water sounds ofthe swallowing phases using local maximum algorithm
ORR = 80.27% Phase 1 Phase 2 Phase 3Phase 1 93.60% 6.40% 0%Phase 2 19.81% 71.11% 9.09%Phase 3 0% 23.89% 76.11%
Table 5.22: Confusion matrix of the classification of compote soundsof the swallowing phases using local maximum algorithm
ORR = 70.95% Phase 1 Phase 2 Phase 3Phase 1 73.11% 26.76% 0.14%Phase 2 11.36% 81.16% 7.48%Phase 3 0% 41.43% 58.57%
Detection of boundary of IDS is always delayed compared to manual annotation
by 13.49± 20.42ms for water and 0.71± 29.68ms for compote. Delay for detection of

5.4. Breathing analysis results 101
the BTS boundary also occurs in advance compared to manual annotation for water
sounds indicated by the negative values in Tables 5.23 unlike delay for detection of
BTS boundary for compote.
Table 5.23: Delays in detection boundaries of swallowing phases inwater sounds (ms)
Detection delays of IDS Detection delays of BTS13.49± 20.42ms −0.61± 30.45ms
Table 5.24: Delays in detection boundaries of swallowing phases incompote sounds (ms)
Detection delays of IDS Detection delays of BTS0.71± 29.68ms 19.69± 36.25ms
Considering feature sequences as the features of the entire swallowing sound
signals considered as one segment of a single swallowing process, the accuracy of
classification by the proposed algorithm of looking for pics reached an overall good
recognition rate of 80.27% with a good recognition rate of 93.60% considering only
the IDS segment and around 71% and 76% for BTS and FDS segments for water. For
compote, results are deteriorating with an overall recognition rate of 70.95%.
The proposed algorithm gives good results for identifying the boundaries of each
swallowing phase that enables the comparison of the duration of normal swallowing
phases with those of pathological swallowing.
5.4 Breathing analysis results
As described in chapter 4, the dominated swallowing-breathing pattern is reported
by swallowing process occuring during expiratory phase. Hence, the idea consists
of detecting the beginning and end of each respiratory phase. Below, the Figure 5.20
shows the respiratory flow signal reconstructed at the beginning and end of each
detected respiratory phase. Red star refers to the beginning of inspiratory phase (or
the end of expiratory phase) and green star refers to the end of inspiratory phase (or
the beginning of expiratory phase).
Detecting boundaries of the respiratory phases enables the identification of the
exhalation segments, during which swallowing can occur. Based on the duration of
the expiratory phase, by imposing a threshold from which it is considered that the
identified phase does not only include exhalation, but also swallowing. Figure 5.21

102 Chapter 5. Results
Figure 5.20: Respiratory signal and detected boundaries of respira-tory phases (inspiration and expiration) during the subject’s rest
shows the detection results obtained on both the sound signal and the respiratory
signal. It can be seen that the majority of the detected expiratory phases merge
several reference events as shown in the Figure 5.21 with the segments marked by
green arrows. In other examples, missed events were noticed, indicated by arrows
and red circles on the same Figure below, where events of swallowing take place at
the transition inspiration-expiration as it is impossible that it will occur during the
inspiration phase Hukuhara and Okada (1956) and they are of a very short duration.
Figure 5.21: Results of automatic detection on the synchronizedsound and respiratory signals
5.4. Breathing analysis results 103
At this stage, the breathing signal was processed for data fusion with the swal-
lowing signal as obtained. Accordingly it was possible to detect respiratory phases
and swallowing apnoea segments characterised by a flat shape fluctuating around
zero. Apnoea can indicate a distress situation for the subject if the duration exceeds
a certain defined threshold. A through investigation was necessary to accurately
identify the segments of swallowing on the respiratory signal.
5.4.1 Discussion
The first part of the proposed system concerns the detection of useful sound, regard-
less of its nature, from a sound recording. In this regard, I proposed an algorithm
based on wavelet decomposition, a method that allows the signal to be analyzed in
specific frequency bands. This allows us to study in particular the frequency band
of the swallowing sound, the sound that is of specific interest to us. The analysis of
the algorithm’s performance shows good results, but there are still imperfections to
be reviewed and improved in the next work. Among these imperfections are early
or delayed detections of the beginning and/or end of the desired signal. The more
we detect that the desired signal, the more we avoid processing the sound noise
that contains no events. Including noise in the sound segments automatically detect
reduces the performance of the next steps in the system, such as classification.
The second part of the proposed system concerns noise classification. The latter
was present in three levels; first, we chose to recognize the sounds of the swallowing
of any other sound event. Once the swallowing event has been well recognized, the
swallowed texture can either be recognized or segmented directly into three charac-
teristic phases.
In order to achieve optimal system performance, it was decided to process the
manually annotated sound segments. This resulted in a 95.49% overall good recog-
nition rate. But once we move on to the detection-classification coupling, the results
deteriorate. For the recognition of the sound segments of swallowing among the oth-
ers, three classes have been established: swallowing, speech and sounds. The GMM
were thus exploited in a supervised way and therefore a learning step of each sound
class was performed before assigning the test sound files to the most likely class. For
the learning of a sound class, while assuming the three classes mentioned above, an
experimental study was carried out to determine the optimal number of Gaussian
components. Thus, Gaussian model was learned for each class. It was not possible

104 Chapter 5. Results
to use a single model with three Gaussian components representing the three fixed
classes because a single component is not sufficient to model the different sounds
sufficiently diversified within the same class. The choice of the number of the class
and their nature is quite critical. We have both human and non-human sounds. An
in-depth study should be carried out on the number of classes and their nature to be
more appropriate with the isolation of each sound class.
Results on average are good for all considered classes: swallowing, speech, sounds
and false alarm. The worst recognition rate was obtained with the sounds class
which is largely (about 25%) recognized as swallowing sounds. This could be ex-
plained by the very short duration of the detected sounds, which are similar to
swallowing sounds using the chosen acoustic features. Furthermore, The differen-
tiation of the swallowed texture is not well established but the segmentation into
three phases characteristic of the sound of swallowing has given promising results
allowing in the presence of pathological signals to determine the abnormal phase of
swallowing.
For the segmentation of the swallowing sound into three characteristic sounds,
two methodologies were used, the first based on Markovian models and the second
based on the search for peaks limiting the different phases. The same spirit of ap-
plication was used for the classification of the different states using HMM. A new
approach was also applied to the segmentation of the sound of swallowing. It is
based on the detection of peaks characteristic of phase boundaries. This approach
has yielded good results and an overall rate of good phase recognition of = 80.27%.
The processing of breathing signals requires a thorough study and, if necessary,
a fusion with the results of the sound signal in order to improve the performance of
the system based on both sound and breathing.
105
Chapter 6
Conclusions and perspectives
For several years, the processing of physiological signals of the swallowing process
has been enhanced in order to meet the needs of patients suffering from pathologies
affecting the normal conduct of swallowing. The signals and informations useful
for processing the swallowing process used in the various studies come from a vari-
ety of invasive and non-invasive sources such as video-fluoroscopy, microphone or
questionnaires, with varying degrees of accuracy. The main objective of this thesis
according to the initial objective of the e-SwallHome project is to develop a tool able
to process swallowing signals in real time using the least non-invasive ambulatory
sensors that do not interfere with the person’s quality of life. For this reason, it has
been proposed to use mainly the sound of swallowing because of its potential for
the diagnosis of dysphagia.
This PhD study has been conducted within the overall framework of telemedicine
and telemonitoring applications research. In this context, the focus of this study has
been to exploit acoustic signal processing deployed in the detection and analysis of
swallowing process acoustic signatures during food intake for medical monitoring.
An important issue in monitoring the swallowing process that has been covered
in this work is the detection of sound events from a recording acquired in real time
or not. The performance of this proposed algorithm is essential to the next step in
sound recognition during food intake. Signal quality also has a significant role to
play in the performance of the algorithm. It depends on the sensor used and its
position. Therefore, a study of the best position for the sensor was carried out.
The adaptation of methods for recognizing different sounds was also an issue
addressed in this work. To do so, a search was performed for the acoustic parameters
the best adapted to the sounds of swallowing. The work presented consists of two
parts: the automatic detection of sound events and the classification of sounds.

106 Chapter 6. Conclusions and perspectives
The main contributions of this work are as follows:
Establishment of the sound database: A database was created to make up for the
lack of an available swallowing sound database with a total duration of 2 hours and
40 minutes distributed in three global classes; swallowing sounds, speech sounds
and other sounds consisting of breathing sounds, coughing sounds, yawning sounds,
etc... The recording was performed using a data acquisition protocol to record swal-
lowing of different textures (saliva, water and compote), speech, apnoea, coughing
and yawning. The annotation of the various events was done using the free Tran-
scriberAG software, which is designed for assisting manual annotation.
Detection of sound events: The detection of sound events is discussed in Chapter
4. The proposed algorithm is based on the wavelet transform of the signal helping
to work on specific frequency bands on all types of sound events and more specif-
ically on swallowing sounds which are characterised by low amplitudes and are
sometimes drowned in noise. According to the observations, the strength of the
swallowing signal depends on several factors including the persons themselves and
the way they swallow.
The classification of sounds: The classification algorithms were used to classify
sounds first to identify swallowing sounds, second to identify swallowed texture
and finally to detect the boundaries of each phase in the swallowing sound. The
choice of using the Gaussian Mixture Algorithm (GMM) is explained by the fact
that a giant database is not required, unlike other models such as Deep Learning.
For the application, several parameters were tested and those that gave the best
performance were selected.
The identification of the swallowing segments was well achieved with a good
recognition rate both for the ideal case on the manually annotated segments and
with the proposed coupling system. However, the recognition of the swallowed tex-
ture did not give good results. For the segmentation of the swallowing sound into
three characteristic sounds as described in Chapter 6, the hidden Markov models
were adapted to recognise the state sequences. However, the accuracy of classifi-
cation hardly reached 52%. Consequently, and based on the typical shape of the
swallowing sound, which includes three characteristic peaks, an algorithm was de-
veloped based on the search for the positions of these peaks, deciding the limits of

Chapter 6. Conclusions and perspectives 107
each phase according to these positions. Evaluation shows a good recognition rate
of 80.60% which enables an automatic measuring phase swallowing duration, which
could be markers indicating dysphagic swallowing.
The detection-classification coupling: The coupling of automatic detection of use-
ful signal and the classification is very critical. Indeed, its performance is fundamen-
tal to guarantee a better result for the final system namely for the classification step.
The detection algorithm has a good rate, but with some failure described above. The
main limitation of this algorithm is a fusion of events which can be of a similar na-
ture, which is not a problem for the sound recognition but, if they are of different
types, poses a problem for the classification, because the proposed algorithm pro-
cesses the signal of a single swallowing. Then, it is necessary to adapt the algorithm
to treat all the automatic detections recognised as swallowing.
Perspectives
Detection of sound events uses algorithm based on the wavelet transform, keeping
only the details with frequency bands contained in the frequency band of 0-1000 Hz
and using an adaptative thresholding for each analysis window. Temporal energy
was measured to follow the temporal evolution of the signal under consideration.
Using frequency parameters could allow a better detection accuracy. The improve-
ment of the algorithm is crucial in order to typically detect the beginning and end
of each event and guarantee a better performance for the classification stage. In the
home monitoring application, one of the limitations of the algorithm is that it is not
designed to detect sound even in the presence of environmental noise such as the
presence of a television or radio set on during food intake.
For the classification step, the recognition of swallowing sounds performed with
GMM model is good. However, for texture recognition, it does not obtain a good
recognition rate and it may be that using another model may provide better results.
The segmentation of a single swallow sound is made by two algorithms. The first
one is HMM, which gave poor results and has barely reached 52%. The second
algorithm is based on a signal processing method and not a statistical one but it
shows a high recognition rate of the different phases. A statistical method may give
better results.

108 Chapter 6. Conclusions and perspectives
The potential uses of the acoustic signature detection approach to monitor the
swallowing process can be exploited to monitor patients with certain swallowing
problems such as patients who have undergone long-term tracheal intubation or
tracheostomy after the tracheal tube is removed (extuberation) or in case of tra-
cheotomy which could be permanent and require deflation of the tracheostomy cuff
before eating or drinking.
The patency of the organs involved in the swallowing process, particularly the
œsophageal canal, is essential for normal swallowing and it would be useful if there
were a non-invasive method of monitoring the swallowing, especially after removal
of the tracheal tube of tracheostomy and of course for patients with permanent tra-
cheostomy who are subject to infections etc....
Speech processing before and after swallowing must be investigated in order to
identify biomarkers from the sound and respiratory signals. The study must be car-
ried out on healthy and pathological signals in order to compare, but no pathological
signals were recorded to be able to properly evaluate the proposed methods.
Another extremely important point is also the collaboration with the medical
staff in all the stages of the study, in particular the segmentation of the signals, which
could have been more precise if it had been carried out with videofluoroscopy con-
ducted by doctors.

109
Bibliography
Aboofazeli, M and Z Moussavi (2006). “Automated Extraction of Swallowing Sounds
Using a Wavelet-Based Filter”. In: 2006 International Conference of the IEEE Engi-
neering in Medicine and Biology Society, pp. 5607–5610.
Aboofazeli, Mohammad and Z Moussavi (2004). “Automated classification of swal-
lowing and breadth sounds”. In: The 26th Annual International Conference of the
IEEE Engineering in Medicine and Biology Society 2, pp. 3816–3819.
Aboofazeli, Mohammad and Zahra Moussavi (2008). “Analysis of swallowing sounds
using hidden Markov models”. In: Medical & Biological Engineering & Computing
46.4, pp. 307–314.
Addington, W Robert et al. (1999). “Assessing the laryngeal cough reflex and the
risk of developing pneumonia after stroke”. In: Archives of Physical Medicine and
Rehabilitation 80.2, pp. 150 –154.
Alghadir, Ahmad H. et al. (2017). “Effect of posture on swallowing”. In: African
Health Sciences 17, p. 133.
Allepaerts, S., S. Delcourt, and J. Petermans (2008). “Les troubles de la déglutition
du sujet âgé : un problème trop souvent sous-estimé”. In: Rev Med Liège 63.12,
pp. 715–721.
Amft, O, M Kusserow, and G Troster (2007). “Automatic Identification of Temporal
Sequences in Chewing Sounds”. In: 2007 IEEE International Conference on Bioin-
formatics and Biomedicine (BIBM 2007), pp. 194–201.
Amft, O. and G. Troster (2006). “Methods for Detection and Classification of Nor-
mal Swallowing from Muscle Activation and Sound”. In: 2006 Pervasive Health
Conference and Workshops, pp. 1–10.
Amft, Oliver and Gerhard Troster (2008). “Recognition of dietary activity events us-
ing on-body sensors”. In: Artificial intelligence in medicine 42, pp. 121–36.
Anaya, William Armando Álvarez (2017). “Neck auscultation using acoustic analy-
sis to determine the time and the sounds of swallowing mechanics”. In: Revista
de Logopedia, Foniatría y Audiología 37.2, pp. 70 –74.

110 BIBLIOGRAPHY
Armstrong, Paul W, Denis G McMillan, and Jerome B Simon (1985). “Swallow syn-
cope”. In: Canadian Medical Association journal 132, pp. 1281–4.
Athlin, Elsy et al. (1989). “Aberrant eating behavior in elderly parkinsonian patients
with and without dementia: Analysis of video-recorded meals”. In: Research in
nursing & health 12, pp. 41–51. DOI: 10.1002/nur.4770120107.
Audrey, G. R. (2013). La prise en charge des troubles de la déglutition en EHPAD, Etude
descriptive des pratiques professionnelles des Médecins Coordonnateurs dans 27 EHPAD
d’un groupe privé associatif. Université René Descartes, Paris V, Faculté Cochin-
Port Royal.
Aviv, Jonathan E. et al. (2000). “The Safety of Flexible Endoscopic Evaluation of Swal-
lowing with Sensory Testing (FEESST): An Analysis of 500 Consecutive Evalua-
tions”. In: Dysphagia 15, pp. 39–44.
Bassols, Virginie Woisard and Michèle Puech (2011). La réhabilitation de la déglutition
chez l’adulte Le point sur la prise en charge fonctionnelle.
Baum, B. J. and L. Bodner (1983). “Aging and oral motor function: Evidence for al-
tered performance among older persons”. In: Journal of dental research 62, pp. 2–
6.
BCCampus. https://opentextbc.ca/anatomyandphysiology/2303-anatomy-of-nose-pharynx-
mouth-larynx/.
Belie, Nele De, Morten Sivertsvik, and Josse De Baerdemaeker (2003). “Differences
in chewing sounds of dry-crisp snacks by multivariate data analysis”. In: Journal
of Sound and Vibration 266, pp. 625–643.
Benchetrit, G et al. (1989). “Individuality of breathing patterns in adults assessed
over time”. In: Respiration physiology 75, pp. 199–209.
Bergeron, Jennifer L., Jennifer L. Long, and Dinesh K. Chhetri (2012). “Dyspha-
gia Characteristics in Zenker’s Diverticulum”. In: Otolaryngology–head and neck
surgery : official journal of American Academy of Otolaryngology-Head and Neck Surgery
147.
Bergstrom, Liza, Per Svensson, and Lena Hartelius (2013). “Cervical auscultation as
an adjunct to the clinical swallow examination: A comparison with fibre-optic
endoscopic evaluation of swallowing”. In: International journal of speech-language
pathology 16.

BIBLIOGRAPHY 111
Bisch, Elizabeth M. et al. (1994). “Pharyngeal Effects of Bolus Volume, Viscosity, and
Temperature in Patients With Dysphagia Resulting From Neurologic Impairment
and in Normal Subjects”. In: Journal of speech and hearing research 37, pp. 1041–59.
Bostock, Clare and Christopher McDonald (2016). “Antimuscarinics in Older People:
Dry Mouth and Beyond”. In: Dental Update 43, pp. 186–8, 191.
Bulow, Margareta, Rolf Olsson, and Olle Ekberg (2002). “Supraglottic Swallow, Ef-
fortful Swallow, and Chin Tuck Did Not Alter Hypopharyngeal Intrabolus Pres-
sure in Patients with Pharyngeal Dysfunction”. In: Dysphagia 17, pp. 197–201.
Bushmann, Maureen et al. (1989). “Swallowing abnormalities and their response to
treatment in Parkinson’s disease”. In: Neurology 39.10, pp. 1309–1309.
Calabrese, Pascale et al. (1998). “Effects of resistive loading on the pattern of breath-
ing”. In: Respiration Physiology 113.2, pp. 167 –179.
Camargo, Fernanda Pereira de et al. (2010). “An evaluation of respiration and swal-
lowing interaction after orotracheal intubation”. In: Clinics 65, pp. 919 –922.
Cameron, J. L., J. Reynolds, and G. D. Zuidema (1973). “Aspiration in Patients with
Tracheostomy”. In: Surgery, gynecology & obstetrics 136, pp. 68–70.
Celeux, Gilles and Gérard Govaert (1992). “A classification EM algorithm for cluster-
ing and two stochastic versions”. In: Computational Statistics Data Analysis 14.3,
pp. 315 –332.
Cichero, J and Bruce Murdoch (2002). “Detection of Swallowing Sounds: Methodol-
ogy Revisited”. In: Dysphagia 17, pp. 40–9.
Cichero, J. A., S. Heaton, and L. Bassett (2009). “Triaging dysphagia: nurse screening
for dysphagia in an acute hospital”. In: Journal of Clinical Nursing 11.18.
Coates, C. and Magid Bakheit (1997). “Dysphagia in Parkinson’s Disease”. In: Euro-
pean neurology 38, pp. 49–52.
Cook, Ian (2006). “Clinical disorders of the upper esophageal sphincter”. In: GI Motil-
ity online.
Cook, Ian and Peter Kahrilas (1999). “AGA Technical review on management of
oropharyngeal dysphagia”. In: Gastroenterology 116, pp. 455–78.
Cook, Ian et al. (1989). “Timing of videofluoroscopic, manometric events, and bolus
transit during the oral and pharyngeal phases of swallowing”. In: Dysphagia 4,
pp. 8–15.
Counter, Paul R. and Jen H. Ong (2018). “Disorders of swallowing”. In: Elsevier,
Surgery - Oxford International Edition 36, pp. 535–542.

112 BIBLIOGRAPHY
Croghan, John E. et al. (1994). “Pilot study of 12-month outcomes of nursing home
patients with aspiration on videofluoroscopy”. In: Dysphagia 9, pp. 141–6.
Daele, Douglas Van et al. (2005). “Timing of Glottic Closure during Swallowing: A
Combined Electromyographic and Endoscopic Analysis”. In: The Annals of otol-
ogy, rhinology, and laryngology 114, pp. 478–87.
Daniels, Stephanie et al. (1998). “Aspiration in Patients With Acute Stroke”. In: Archives
of physical medicine and rehabilitation 79, pp. 14–9.
Daniels, Stephanie K. (2006). “Neurological Disorders Affecting Oral, Pharyngeal
Swallowing”. In: GI Motility online.
Davis, S and P Mermelstein (1980). “Comparison of parametric representations for
monosyllabic word recognition in continuously spoken sentences”. In: IEEE Trans-
actions on Acoustics, Speech, and Signal Processing 28.4, pp. 357–366.
Deborah J. C. Ramsey, David Smithard and Lalit Kalra (2003). “Early Assessments
of Dysphagia and Aspiration Risk in Acute Stroke Patients”. In: Stroke; a journal
of cerebral circulation 34, pp. 1252–7.
DePippo, K. L., M. A. Holas, and M. J. Reding (1994). “The Burke dysphagia screen-
ing test: validation of its use in patients with stroke”. In: Arch. Phys. Med Rehabil
75, pp. 1284–1286.
DePippo, Kathleen L., Marlene A. Holas, and Michael Reding (1993). “Validation
of the 3-oz Water Swallow Test for Aspiration Following Stroke”. In: Archives of
neurology 49, pp. 1259–61.
Desport, Jean-Claude et al. (2011). “Évaluation et prise en charge des troubles de la
déglutition”. In: Nutrition Clinique et Métabolisme 25.4, pp. 247 –254.
Ding, Ruiying et al. (2002). “Surface Electromyographic and Electroglottographic
Studies in Normal Subjects Under Two Swallow Conditions: Normal and During
the Mendelsohn Manuever”. In: Dysphagia 17, pp. 1–12.
DM, Hartl et al. (2003). “Ciné-IRM de la déglutition: Techniques, indications limites”.
In: In: Savoir faire en imagerie ORL- Tome I, Sauramps Médical, pp. 171 –181.
Dong, Bo and Subir Biswas (2012). “Swallow monitoring through apnea detection in
breathing signal”. In: Conference proceedings : ... Annual International Conference of
the IEEE Engineering in Medicine and Biology Society. IEEE Engineering in Medicine
and Biology Society. Conference 2012, pp. 6341–4.
Easterling, Caryn and Elizabeth Robbins (2008). “Dementia and Dysphagia”. In:
Geriatric nursing (New York, N.Y.) 29, pp. 275–85.

BIBLIOGRAPHY 113
Eisbruch, Avraham et al. (2002). “Objective assessment of swallowing dysfunction
and aspiration after radiation concurrent with chemotherapy for head-and-neck
cancer”. In: International Journal of Radiation Oncology*Biology*Physics 53.1, pp. 23
–28.
Elting, Linda et al. (2007). “Risk, Outcomes, and Costs of Radiation-Induced Oral
Mucositis Among Patients With Head-and-Neck Malignancies”. In: International
journal of radiation oncology, biology, physics 68, pp. 1110–20.
Ertekin, Cumhur and Ibrahim Aydogdu (2003). “Neurophysiology of swallowing”.
In: Clinical Neurophysiology 114.12, pp. 2226 –2244.
everydayhealth (2017). https://www.everydayhealth.com/multiple-sclerosis/symptoms/deal-
with-dysphagia-when-you-have-ms/.
Farina, Dario, Roberto Merletti, and Roger M. Enoka (2004). “The extraction of neu-
ral strategies from the surface EMG”. In: Journal of Applied Physiology 96.4, pp. 1486–
1495.
Fontana, Juan M, Pedro Lopes de Melo, and Edward S Sazonov (2011). “Swallow-
ing detection by sonic and subsonic frequencies: A comparison”. In: 2011 An-
nual International Conference of the IEEE Engineering in Medicine and Biology Society,
pp. 6890–6893.
Fontecave-Jallon, J and P Baconnier (2016). “A simple mathematical model of spon-
taneous swallow effects on breathing based on new experimental data”. In: 2016
38th Annual International Conference of the IEEE Engineering in Medicine and Biology
Society (EMBC), pp. 4260–4263.
Frank, Yitzchak et al. (1989). “Chronic Dysphagia, Vomiting and Gastroesophageal
Reflux as Manifestations of a Brain Stem Glioma: A Case Report”. In: Pediatric
neuroscience 15, pp. 265–8.
G, A E (1977). “Aspiration Pneumonia: Incidence of Aspiration with Endotracheal
Tubes”. In: Journal of Occupational and Environmental Medicine 19, p. 146.
Gilles, Celeux and Govaert Gérard (1994). “Fuzzy Clustering and Mixture Models”.
In: Compstat. Ed. by Dutter Rudolf and Grossmann Wilfried. Heidelberg: Physica-
Verlag HD, pp. 154–159.
Golabbakhsh, Marzieh et al. (2014). “Automated Acoustic Analysis in Detection of
Spontaneous Swallows in Parkinson’s Disease”. In: Dysphagia 29.5, pp. 572–577.
Gordon, C., R. Langton Hewer, and Derick Wade (1987). “Dysphagia in acute stroke”.
In: British medical journal (Clinical research ed.) 295, pp. 411–4.

114 BIBLIOGRAPHY
Gottlieb, D et al. (1996). “Validation of the 50 ml3 drinking test for evaluation of
post-stroke dysphagia”. In: Disability and Rehabilitation 18.10, pp. 529–532.
Grobbelaar, E. J. et al. (2004). “Nutritional challenges in head and neck cancer”. In:
Clinical otolaryngology and allied sciences 29, pp. 307–13.
Gross, Roxann Diez et al. (2009). “The coordination of breathing and swallowing
in chronic obstructive pulmonary disease.” In: American journal of respiratory and
critical care medicine 179 7, pp. 559–65.
Group, ECRI Health Technology Assessment (1999). “Diagnosis and treatment of
swallowing disorders (dysphagia) in acute-care stroke patients.” In: Evid Rep
Technol Assess (Summ) 8, pp. 1–6.
Guatterie, Michel and Valérie Lozano (2005). “déglutition-respiration : couple fon-
damental et paradoxal”. In: Kinéréa 42, p. 1.
Guggenheimer, James and PAUL A. MOORE (2003). “Xerostomia: Etiology, recogni-
tion and treatment”. In: The Journal of the American Dental Association 134.1, pp. 61
–69.
Guinvarc’h, Sandrine et al. (1998). “[Proposal for a predictive clinical scale in dys-
phagia]”. In: Revue de laryngologie - otologie - rhinologie 119, pp. 227–32.
Guzman-Venegas, Rodrigo, Jorge Biotti, and Francisco Berral J Rosa (2015). “Func-
tional Compartmentalization of the Human Superficial Masseter Muscle”. In:
PLoS ONE 10, e0116923.
Hammond, Carol et al. (2001). “Assessment of aspiration risk in stroke patients with
quantification of voluntary cough”. In: Neurology 56, pp. 502–6.
Hilker, Rüdiger et al. (2003). “Nosocomial Pneumonia After Acute Stroke: Implica-
tions for Neurological Intensive Care Medicine”. In: Stroke; a journal of cerebral
circulation 34, pp. 975–81.
HIRANO, Kaoru et al. (2001). “Evaluation of accuracy of cervical auscultation for
clinical assessment of dysphagia.” In: Japanese Journal of Oral & Maxillofacial Surgery
47, pp. 93–100.
Hirst, Lisa J et al. (2002). “Swallow-Induced Alterations in Breathing in Normal
Older People”. In: Dysphagia 17.2, pp. 152–161.
Hsu, Chien-Chang, Wei-Hao Chen, and Hou-Chang Chiu (2013). “Using swallow
sound and surface electromyography to determine the severity of dysphagia in
patients with myasthenia gravis”. In: Biomedical Signal Processing and Control 8.3,
pp. 237 –243.

BIBLIOGRAPHY 115
Huckabee, Maggie-Lee and Catriona Steele (2006). “An Analysis of Lingual Contri-
bution to Submental Surface Electromyographic Measures and Pharyngeal Pres-
sure During Effortful Swallow”. In: Archives of physical medicine and rehabilitation
87, pp. 1067–72.
Huckabee, Maggie-Lee et al. (2005). “Submental Surface Electromyographic Mea-
surement and Pharyngeal Pressures During Normal and Effortful Swallowing”.
In: Archives of physical medicine and rehabilitation 86, pp. 2144–9.
Huff, Alyssa et al. (2018). “Swallow-breathing coordination during incremental as-
cent to altitude”. In: Respiratory Physiology & Neurobiology.
Hukuhara, Takesi and Hiromasa Okada (1956). “Effects of deglutition upon the spike
discharges of neurones in the respiratory center”. In: The Japanese journal of phys-
iology 6, pp. 162–6.
Huq, Saiful and Zahra Moussavi (2010). “Automatic Breath Phase Detection Using
Only Tracheal Sounds”. In: Conference proceedings : Annual International Confer-
ence of the IEEE Engineering in Medicine and Biology Society. IEEE Engineering in
Medicine and Biology Society. Conference 2010, pp. 272–5.
Imtiaz, Usama et al. (2014). “Application of wireless inertial measurement units and
EMG sensors for studying deglutition - Preliminary results”. In: 2014 36th An-
nual International Conference of the IEEE Engineering in Medicine and Biology Society,
EMBC 2014 2014, pp. 5381–4.
Istrate, Dan (2003). “Sound Detection and Classification for medical telemonitoring”.
PhD thesis. Institut National Polytechnique de Grenoble - INPG.
John, Jennilee St and Linley Berger (2015). “Using the Gugging Swallowing Screen
(GUSS) for Dysphagia Screening in Acute Stroke Patients”. In: Journal of continu-
ing education in nursing 46, pp. 103–104.
Jonathan M. Bock, John Petronovich and Joel H. Blumin (2012). “Dysphagia Clinic:
Massive Zenker’s Diverticulum”. In: Ear Nose Throat J 91.8, 319–320.
Jones, B. (2012). Normal and abnormal swallowing: Imaging In Diagnosis And Therapyl.
2nd. Springer.
Kalf, Johanna et al. (2011). “Prevalence of oropharyngeal dysphagia in Parkinson’s
disease: A meta-analysis”. In: Parkinsonism & related disorders 18, pp. 311–5.
Keenan, Kevin G. et al. (2005). “Influence of amplitude cancellation on the simulated
surface electromyogram”. In: Journal of Applied Physiology 98.1, pp. 120–131.

116 BIBLIOGRAPHY
Lagarde, Marloes, Digna Kamalski, and Lenie Van den Engel-Hoek (2015). “The re-
liability and validity of cervical auscultation in the diagnosis of dysphagia: A
systematic review”. In: Clinical rehabilitation 30.
Langhorne, P. et al. (2000). “Medical Complications After Stroke : A Multicenter
Study”. In: Stroke; a journal of cerebral circulation 31, pp. 1223–9.
Langmore, Susan, K. Schatz, and Nels Olsen (1988). “Fiberoptic endoscopic exami-
nation of swallowing safety: A new procedure”. In: Dysphagia 2, pp. 216–9.
Lapatki, B G et al. (2004). “A thin, flexible multielectrode grid for high-density sur-
face EMG”. In: Journal of applied physiology (Bethesda, Md. : 1985) 96, pp. 327–36.
Lapatki, Bernd G et al. (2006). “Topographical characteristics of motor units of the
lower facial musculature revealed by means of high-density surface EMG”. In:
Journal of neurophysiology 95, pp. 342–54.
— (2009). “Optimal placement of bipolar surface EMG electrodes in the face based
on single motor unit analysis”. In: Psychophysiology 47, pp. 299–314.
Lazareck, L J and Z Moussavi (2004a). “Swallowing Sound Characteristics in Healthy
and Dysphagic Individuals”. In: The 26th Annual International Conference of the
IEEE Engineering in Medicine and Biology Society. Vol. 2, pp. 3820–3823.
Lazareck, L J and Z K Moussavi (2002). “Automated algorithm for swallowing sound
detection”. In: Canadian Med. and Biol. Eng. Conf.
Lazareck, L J and Z M K Moussavi (2004b). “Classification of normal and dysphagic
swallows by acoustical means”. In: IEEE Transactions on Biomedical Engineering
51.12, pp. 2103–2112.
Leflot, L. et al. (2005). “Pathologie de l’œsophage chez l’enfant”. In: Emc - Radiologie
2, pp. 494–526.
Leopold, Norman A. (1996). “Dysphagia in drug-induced parkinsonism: A case re-
port”. In: Dysphagia 11.2, pp. 151–153.
Leopold, Norman A. and Marion C. Kagel (1996). “Prepharyngeal dysphagia in
Parkinson’s disease”. In: Dysphagia 11.1, pp. 14–22.
Leslie, Paula et al. (2004). “Reliability and validity of cervical auscultation: A con-
trolled comparison using videofluoroscopy”. In: Dysphagia 19.4, pp. 231–240.
Logemann, JA (1994). “Non-imaging techniques for the study of swallowing”. In:
Acta oto-rhino-laryngologica Belgica 48.2, 139—142.
Logemann, Jeri A. (2007). “Swallowing disorders”. In: Best Practice & Research Clinical
Gastroenterology 21.4. Severe Gastrointestinal Motor Disorders, pp. 563 –573.

BIBLIOGRAPHY 117
Logemann, Jeri A., Sharon Veis, and Laura Colangelo (1999). “A Screening Procedure
for Oropharyngeal Dysphagia”. In: Dysphagia 14, pp. 44–51.
Logemann, Jeri A. et al. (2006). “Site of disease and treatment protocol as corre-
lates of swallowing function in patients with head and neck cancer treated with
chemoradiation”. In: Head & neck 28, pp. 64–73. DOI: 10.1002/hed.20299.
Makeyev, O et al. (2007). “Limited receptive area neural classifier for recognition
of swallowing sounds using continuous wavelet transform”. In: 2007 29th An-
nual International Conference of the IEEE Engineering in Medicine and Biology Society,
pp. 3128–3131.
Makeyev, Oleksandr et al. (2012). “Automatic food intake detection based on swal-
lowing sounds”. In: Biomedical Signal Processing and Control 7.6. Biomedical Image
Restoration and Enhancement, pp. 649 –656.
Malfante, Marielle et al. (2018). “Automatic fish sounds classification”. In: Journal of
the Acoustical Society of America 143.5.
Mallat, Stephane and Gabriel Peyré (2009). A Wavelet Tour of Signal Processing The
Sparse Way. Ed. by ELSEVIER.
Maniere-Ezvan, A, J M Duval, and P Darnault (1993). “Ultrasonic assessment of the
anatomy and function of the tongue”. In: Surgical and radiologic anatomy : SRA 15,
pp. 55–61.
Mann, G., G. J. Hankey, and D. Cameron (2000). “Swallowing Disorders follow-
ing Acute Stroke: Prevalence and Diagnostic Accuracy”. In: Cerebrovasc Dis 10,
pp. 380–386.
Mari, Fabiola et al. (1997). “Predictive value of clinical indices in detecting aspiration
in patients with neurological disorders”. In: Journal of Neurology, Neurosurgery &
Psychiatry 63.4, pp. 456–460.
Marik, Paul E. and Danielle Kaplan (2003). “Aspiration Pneumonia and Dysphagia
in the Elderly”. In: Chest 124.1, pp. 328 –336.
Martin-Harris, Bonnie and Bronwyn Jones (2008). “The Videofluorographic Swal-
lowing Study”. In: Physical Medicine and Rehabilitation Clinics of North America
19.4. Dysphagia, pp. 769 –785.
Martino, Rosemary et al. (2008). “The Toronto Bedside Swallowing Screening Test
(TOR-BSST) Development and Validation of a Dysphagia Screening Tool for Pa-
tients With Stroke”. In: Stroke; a journal of cerebral circulation 40, pp. 555–61.
118 BIBLIOGRAPHY
Mccomas, A.J., A.R.M. Upton, and Roberto Sica (1974). “Motoneuron disease and
ageing”. In: Lancet 2, pp. 1477–80.
McCullough, Gary H et al. (2000). “Inter- and Intrajudge Reliability of a Clinical
Examination of Swallowing in Adults”. In: Dysphagia 15.2, pp. 58–67.
Md, Dmsc et al. (2011). “Body Positions and Functional Training to Reduce Aspira-
tion in Patients with Dysphagia”. In: Japan Medical Association Journal 54.
Mea, Vincenzo Della (2001). “What is e-Health (2): The death of telemedicine?” In: J
Med Internet Res 3.2, e22.
Miyazaki, Yoshiko, Motoki Arakawa, and Junko Kizu (2002). “Introduction of simple
swallowing ability test for prevention of aspiration pneumonia in the elderly and
investigation of factors of swallowing disorders.” In: Yakugaku zasshi : Journal of
the Pharmaceutical Society of Japan 122 1, pp. 97–105.
Moreau-Gaudry, Alexandre et al. (2005a). “Use of Computer and Respiratory In-
ductance Plethysmography for the Automated Detection of Swallowing in the
Elderly”. In: Connecting Medical Informatics and Bio-Informatics,R. Engelbrecht et al.
(Eds.)ENMI.
Moreau–Gaudry, Alexandre et al. (2005b). “Use of Respiratory Inductance Plethys-
mography for the Detection of Swallowing in the Elderly”. In: Dysphagia 20,
pp. 297–302.
Moussavi, Z (2005). “Assessment of Swallowing Sounds’ Stages with Hidden Markov
Model”. In: 2005 IEEE Engineering in Medicine and Biology 27th Annual Conference,
pp. 6989–6992.
Moussavi, Z K, M T Leopando, and G R Rempel (1998). “Automated detection of
respiratory phases by acoustical means”. In: Proceedings of the 20th Annual Inter-
national Conference of the IEEE Engineering in Medicine and Biology Society. Vol.20
Biomedical Engineering Towards the Year 2000 and Beyond (Cat. No.98CH36286), 21–
24 vol.1.
Movahedi, Faezeh et al. (2017). “A comparison between swallowing sounds and
vibrations in patients with dysphagia”. In: Computer Methods and Programs in
Biomedicine 144, pp. 179 –187.
Mulsant, Benoit H. et al. (2003). “Serum Anticholinergic Activity in a Community-
Based Sample of Older Adults”. In: Archives of general psychiatry 60, pp. 198–203.

BIBLIOGRAPHY 119
Murray, Kathleen A, Charles Larson, and Jeri A Logemann (1998). “Electromyo-
graphic Response of the Labial Muscles during Normal Liquid Swallows Using
a Spoon, a Straw, and a Cup”. In: Dysphagia 13, pp. 160–6.
Nacci, A. et al. (2008). “Fiberoptic endoscopic evaluation of swallowing (FEES): pro-
posal for informed consent”. In: Acta otorhinolaryngologica Italica : organo ufficiale
della Società italiana di otorinolaringologia e chirurgia cervico-facciale 28, pp. 206–11.
Nagae, M and K Suzuki (2011). “A neck mounted interface for sensing the swallow-
ing activity based on swallowing sound”. In: 2011 Annual International Conference
of the IEEE Engineering in Medicine and Biology Society, pp. 5224–5227.
Nathadwarawala, K. M., J. Nicklin, and Charles Wiles (1992). “A timed test of swal-
lowing capacity for neurological patients”. In: Journal of neurology, neurosurgery,
and psychiatry 55, pp. 822–5.
Ney, Denise et al. (2009). “Senescent Swallowing: Impact, Strategies, and Interven-
tions”. In: Nutrition in clinical practice : official publication of the American Society for
Parenteral and Enteral Nutrition 24, pp. 395–413.
Nicosia, Mark et al. (2000). “Age effects on the temporal evolution of isometric and
swallowing pressure. J Gerontol A Biol Sci Med Sci 55(11):M634-M640”. In: The
journals of gerontology. Series A, Biological sciences and medical sciences 55, pp. M634–
40.
Nishino, Takashi, T Yonezawa, and Y Honda (1986). “Effects of swallowing on the
pattern of continuous respiration in human adults”. In: The American review of
respiratory disease 132, pp. 1219–22.
Nozue, Shinji et al. (2017). “Accuracy of cervical auscultation in detecting the pres-
ence of material in the airway”. In: Clinical and Experimental Dental Research 3.
Paciaroni, Maurizio et al. (2004). “Dysphagia following Stroke”. In: European neurol-
ogy 51, pp. 162–7.
Palmer, Jeffrey et al. (1993). “A protocol for the videofluorographic swallowing study”.
In: Dysphagia 8, pp. 209–14.
Pauloski, Barbara et al. (2000). “Pretreatment swallowing function in patients with
head and neck cancer”. In: Head & neck 22, pp. 474–82.
Pearce, Callum and H D Duncan (2002). “Enteral feeding. Nasogastric, nasojejunal,
percutaneous endoscopic gastrostomy, or jejunostomy: Its indications and limi-
tations”. In: Postgraduate medical journal 78, pp. 198–204.

120 BIBLIOGRAPHY
Pehlivan, Murat et al. (1996). “An Electronic Device Measuring the Frequency of
Spontaneous Swallowing: Digital Phagometer”. In: Dysphagia 11, pp. 259–64.
Perlman, A L and J P Grayhack (1991). “Use of the electroglottograph for measure-
ment of temporal aspects of the swallow: Preliminary observations”. In: Dyspha-
gia 6.2, pp. 88–93.
Pouderoux, P, J A Logemann, and P J Kahrilas (1996). “Pharyngeal swallowing elicited
by fluid infusion: role of volition and vallecular containment”. In: American Jour-
nal of Physiology-Gastrointestinal and Liver Physiology 270.2, G347–G354.
Preiksaitis, Harold G and Catherine A Mills (1996). “Coordination of breathing and
swallowing: effects of bolus consistency and presentation in normal adults”. In:
Journal of Applied Physiology 81.4, pp. 1707–1714.
Professionnelles, Service de Recommandations (2007). Management strategy in the case
of protein-energy malnutrition in the elderly. Haute Autorité de Santé.
Raut, Vivek V., Gary J. McKee, and Brian Johnston (2001). “Effect of bolus consis-
tency on swallowing - Does altering consistency help?” In: European archives of
oto-rhino-laryngology : official journal of the European Federation of Oto-Rhino-Laryngological
Societies (EUFOS) : affiliated with the German Society for Oto-Rhino-Laryngology -
Head and Neck Surgery 258, pp. 49–53.
Reimers-Neils, Lynn, Jerilyn Logemann, and Charles Larson (1994). “Viscosity ef-
fects on EMG activity in normal swallow”. In: Dysphagia 9, pp. 101–6.
Rempel, Gina and Zahra Moussavi (2005). “The Effect of Viscosity on the Breath–
Swallow Pattern of Young People with Cerebral Palsy”. In: Dysphagia 20.2, pp. 108–
112.
Ren, J. F. et al. (1995). “Effect of aging on the secondary esophageal peristalsis: Pres-
byesophagus revisited”. In: The American journal of physiology 268, G772–9.
Reynolds, D and R Rose (1995). “Robust text-independent speaker identification us-
ing Gaussian mixture speaker models”. In: Speech Commun 17. Wearable Com-
puting and Artificial Intelligence for Healthcare Applications, pp. 121 –136.
Robbins, Joanne et al. (1995). “Age Effects on Lingual Pressure Generation as a Risk
Factor for Dysphagia”. In: The journals of gerontology. Series A, Biological sciences
and medical sciences 50, pp. M257–62.
Rofes, Laia et al. (2011). “Diagnosis and Management of Oropharyngeal Dysphagia
and Its Nutritional and Respiratory Complications in the Elderly”. In: Gastroen-
terology research and practice 2011.

BIBLIOGRAPHY 121
Ross, Alexander I.V. et al. (2019). “Relationships between shear rheology and sen-
sory attributes of hydrocolloid-thickened fluids designed to compensate for im-
pairments in oral manipulation and swallowing”. In: Journal of Food Engineering
263, pp. 123 –131.
Santamato, Andrea et al. (2009). “Acoustic analysis of swallowing sounds: A new
technique for assessing dysphagia”. In: Journal of rehabilitation medicine : official
journal of the UEMS European Board of Physical and Rehabilitation Medicine 41, pp. 639–
45.
Santé, Haute Autorité de (2012). Accident vasculaire cérébral : méthodes de rééducation de
la fonction motrice chez l’adulte Méthode " Recommandations pour la pratique clinique
", ARGUMENTAIRE SCIENTIFIQUE. Haute Autorité de Santé.
Sarkar, Achintya K and Claude Barras (2013). “Anchor and UBM-based Multi-Class
MLLR M-Vector System for Speaker Verification”. In: Interspeech 2013. Lyon, France:
ISCA.
Sasegbon, A and S Hamdy (2017). “The anatomy and physiology of normal and
abnormal swallowing in oropharyngeal dysphagia”. In: Neurogastroenterology &
Motility 29.11, e13100.
Sazonov, Edward S. et al. (2010). “Automatic Detection of Swallowing Events by
Acoustical Means for Applications of Monitoring of Ingestive Behavior”. In: IEEE
Transactions on Biomedical Engineering 57, pp. 626–633.
Schmidt, John et al. (1994). “Video-fluoroscopic evidence of aspiration predicts pneu-
monia but not dehydration following stroke”. In: Dysphagia 9, pp. 7–11.
Science, Nestlé Health (2016). https://www.nestlehealthscience.ch/fr/produits/resou-rce/dysphagie.
Secil, Yaprak et al. (2016). “Dysphagia in Alzheimer’s disease”. In: Neurophysiologie
Clinique/Clinical Neurophysiology 46.3, pp. 171 –178.
Sehili, M. E. A. (2013). “Reconnaissance des sons de l’environnement dans un con-
texte domotique”. PhD thesis. Institut National des Telecommunications.
Shawker, Thomas H et al. (1983). “Real-time ultrasound visualization of tongue move-
ment during swallowing”. In: Journal of clinical ultrasound : JCU 11, pp. 485–90.
Sherozia, O P, V Ermishkin, and Elena Lukoshkova (2003). “Dynamics of Swallowing-
Induced Cardiac Chronotropic Responses in Healthy Subjects”. In: Bulletin of ex-
perimental biology and medicine 135, pp. 322–6.

122 BIBLIOGRAPHY
Shirazi, Samaneh Sarraf and Zahra Moussavi (2012). “Silent aspiration detection by
breath and swallowing sound analysis”. In: Conference proceedings : ... Annual In-
ternational Conference of the IEEE Engineering in Medicine and Biology Society. IEEE
Engineering in Medicine and Biology Society. Conference 2012, pp. 2599–602.
Shuzo, M et al. (2009). “Discrimination of eating habits with a wearable bone con-
duction sound recorder system”. In: SENSORS, 2009 IEEE, pp. 1666–1669.
Silva, Gabriela Rodrigues da et al. (2019). “Influence of Masticatory Behavior on
Muscle Compensations During the Oral Phase of Swallowing of Smokers”. In:
International Archives of Otorhinolaryngology. DOI: 10.1055/s-0039-1688812.
Singh, Salil and S. Hamdy (2006). “Dysphagia in stroke patients”. In: Postgraduate
medical journal 82, pp. 383–91.
Smith, John et al. (1989). “Coordination of Eating, Drinking and Breathing in Adults”.
In: Chest 96.3, pp. 578 –582.
Sochaniwskyj, AE et al. (1987). “Oral motor functioning, frequency of swallowing
and drooling in normal children and in children with cerebral palsy”. In: Archives
of physical medicine and rehabilitation 67, pp. 866–74.
Splaingard, ML et al. (1988). “Aspiration in rehabilitation patients: videofluoroscopy
vs bedside clinical assessment”. In: Archives of physical medicine and rehabilitation
69.8, 637—640.
Staderini, E M (2014). “Inexpensive microphone enables everyday digital recording
of deglutition murmurs”. In: 2014 8th International Symposium on Medical Informa-
tion and Communication Technology (ISMICT), pp. 1–5.
Steele, Catriona et al. (2014). “The Influence of Food Texture and Liquid Consistency
Modification on Swallowing Physiology and Function: A Systematic Review”.
In: Dysphagia 30.
Stepp, Cara (2012). “Surface Electromyography for Speech and Swallowing Systems:
Measurement, Analysis, and Interpretation”. In: Journal of speech, language, and
hearing research : JSLHR 55, pp. 1232–46.
Stone, Maureen and Thomas H Shawker (1986). “An ultrasound examination of
tongue movement during swallowing”. In: Dysphagia 1, pp. 78–83.
Stroud, A. E., B. W. Lawrie, and Charles Wiles (2002). “Inter and intra-rater reliabil-
ity of cervical auscultation to detect aspiration in patients with dysphagia”. In:
Clinical rehabilitation 16, pp. 640–5.
BIBLIOGRAPHY 123
Takahashi, Koji, Michael Groher, and Ken ichi Michi (1994a). “Symmetry and repro-
ducibility of swallowing sounds”. In: Dysphagia 9, pp. 168–173.
Takahashi, Koji, Michael E. Groher, and Ken ichi Michi (1994b). “Methodology for
detecting swallowing sounds”. In: Dysphagia 9.1, pp. 54–62.
Tanaka, N et al. (2013). “Swallowing frequency in elderly people during daily life”.
In: Journal of Oral Rehabilitation 40.10, pp. 744–750.
Tanaka, Shoichiro A. et al. (2012). “Updating the epidemiology of cleft lip with or
without cleft palate”. In: Plastic and reconstructive surgery 129, 511e–518e.
Taveira, Karinna Veríssimo Meira et al. (2018). “Diagnostic validity of methods for
assessment of swallowing sounds: a systematic review”. In: Brazilian Journal of
Otorhinolaryngology 84.5, pp. 638 –652.
Thompson-Henry, Sheri and Barbara Braddock (1995). “The modified Evan’s blue
dye procedure fails to detect aspiration in the tracheostomized patient: Five case
reports”. In: Dysphagia 10, pp. 172–4.
Tohara, Haruka et al. (2003). “Three Tests for Predicting Aspiration without Vide-
ofluorography”. In: Dysphagia 18.2, pp. 126–134.
Transcriber. http://transag.sourceforge.net/.
Trapl-Grundschober, Michaela et al. (2007). “Dysphagia Bedside Screening for Acute-
Stroke Patients The Gugging Swallowing Screen”. In: Stroke; a journal of cerebral
circulation 38, pp. 2948–52.
Uysal, Hilmi et al. (2013). “The interaction between breathing and swallowing in
healthy individuals”. In: Journal of Electromyography and Kinesiology 23.3, pp. 659
–663.
Vaiman, Michael and Ephraim Eviatar (2009). “Surface electromyography as a screen-
ing method for evaluation of dysphagia and odynophagia”. In: Head & Face Medicine
5.1, p. 9.
Vice, F. L. et al. (1990). “Cervical auscultation of suckle feeding in newborn infants”.
In: Developmental Medicine and Child Neurolog Vol 32, pp. 760–768.
Vickers, Zata M (1985). “THE RELATIONSHIPS OF PITCH, LOUDNESS AND EAT-
ING TECHNIQUE TO JUDGMENTS OF THE CRISPNESS AND CRUNCHI-
NESS OF FOOD SOUNDS2”. In: Journal of Texture Studies 16.1, pp. 85–95.
Walker, William and Dinesh Bhatia (2011). “Towards automated ingestion detection:
Swallow sounds”. In: Conference proceedings : ... Annual International Conference of

124 BIBLIOGRAPHY
the IEEE Engineering in Medicine and Biology Society. IEEE Engineering in Medicine
and Biology Society. Conference 2011, pp. 7075–8.
Welch, M V et al. (1993). “Changes in Pharyngeal Dimensions Effected by Chin
Tuck”. In: Archives of physical medicine and rehabilitation 74, pp. 178–81.
Wilson, S. L. et al. (1981). “Coordination of breathing and swallowing in human
infants”. In: Journal of Applied Physiology 50.4, pp. 851–858.
Worp, H. B. van der and L. J. Kappelle (1998). “Complications of Acute Ischaemic
Stroke”. In: Cerebrovascular diseases (Basel, Switzerland) 8, pp. 124–32.
Yagi, N et al. (2014). “Swallow-monitoring system with acoustic analysis for dys-
phagia”. In: 2014 IEEE International Conference on Systems, Man, and Cybernetics
(SMC), pp. 3696–3701.
Yamaguchi, Erika et al. (2019). “The influence of thickeners of food on the particle
size of boluses: a consideration for swallowing”. In: Odontology.
Yap, Yee Leng and Z. Moussavi (2002). “Acoustic airflow estimation from tracheal
sound power”. In: IEEE CCECE2002. Canadian Conference on Electrical and Com-
puter Engineering. Conference Proceedings (Cat. No.02CH37373). Vol. 2, 1073–1076
vol.2.
Yu, Bin et al. (2013). “A pilot study of high-density electromyographic maps of mus-
cle activity in normal deglutition”. In: vol. 2013, pp. 6635–6638.
Zboralske, F. Frank, John R. Amberg, and Konrad H. Soergel (1964). “Presbyesoph-
agus: Cineradiographic Manifestations 1”. In: Radiology 82, pp. 463–7.
Zenner, Pamela M., Diane S. Losinski, and Russell H. Mills (1995). “Using cervical
auscultation in the clinical dysphagia examination in long-term care”. In: Dys-
phagia 10, pp. 27–31.
Zhou, Zhou (2009). “Accidents Vasculaires cérébraux (AVC) : Conséquences fonc-
tionnelles et Dysphagie Associée”. PhD thesis. Université de Limoges.

Appendix A
List of Publications
Journal Papers:
• Khlaifi H., Istrate D., Demongeot J., Malouche D., Swallowing Sound Recogni-
tion at Home Using GMM, IRBM, 39(6):407 - 412. JETSAN, Feb. 2018.
• Demongeot J., Istrate D., Khlaifi H., Mégret L., Taramasco C. and Thomas R.,
From conservative to dissipative non-linear differential systems. An applica-
tion to the cardio-respiratory regulation, Discrete Continuous Dynamical Sys-
tems, Feb. 2019.
International Conferences:
• Hajer KHLAIFI, Atta BADII, Dan ISTRATE, Jacques DEMONGEOT, Auto-
matic detection and recognition of swallowing sounds, 12th international con-
ference on Health Conference, Feb, 2019.
National Conferences:
• Hajer Khlaifi, Dan Istrate, Jacques Demongeot, Jérôme Boudy, Dhafer Mal-
ouche, Swallowing Sound Recognition at Home Using GMM. Journées d’Etude
sur la TéléSANté, 6ème édition, May 2017, Bourges, France. (https://hal.archives-
ouvertes.fr/hal-01692422/document)


127
Appendix B
Theory and Methods for signal
processing and pattern recognition
In this section, the theory and different algorithms are described which are used
by the proposed system (see Chapter 4). In the sound signal processing, there is
pre-processing (different transform of the signal in order to focus on the interest
characteristics) and statistical learning (GMM and HMM approach) in order to au-
tomatically recognise the swallowing sounds.
B.1 Fourier Decomposition
The Fourier transform diagonalises time-invariant convolution operators. It rules
over linear time-invariant signal processing. The description below is extracted from
Mallat and Peyré (2009)
B.1.1 Continuous Fourier transform
Fourier analysis represents any finite energy function f (t) as a sum of sinusoidal
waves eiωt:
f (t) =1
2π
∫ ∞
−∞δ(ω)eiωtdω (B.1)
The amplitude f (ω) of each sinusoidal wave eiωt is equal to its correlation with f ,
also called Fourier transform:
f (ω) =∫ ∞
−∞f (t)eiωtdt (B.2)
The more regular f (t),the faster the decay of the sinusoidal wave amplitude | ˆf (ω)|
when frequency increases. When f (t) is defined only on an interval, say [0, 1],

128Appendix B. Theory and Methods for signal processing and pattern recognition
then the Fourier transform becomes a decomposition in a Fourier orthonormal basis
ei2πmtm∈Z of L2[0, 1]. If f (t) is uniformly regular, then its Fourier transform coeffi-
cients also have a fast decay when the frequency 2πm increases, so it can be easily
approximated with few low-frequency Fourier coefficients. The Fourier transform
therefore defines a sparse representation of uniformly regular functions.
Over discrete signals, the Fourier transform is a decomposition in a discrete or-
thogonal Fourier basis ei2πkn/N0≤k≤No f CN , which has properties similar to a Fourier
transform on functions. Its embedded structure leads to fast Fourier transform (FFT)
algorithms,which compute discrete Fourier coefficients with O(NlogN) instead of
N2.This FFT algorithm is a cornerstone of discrete signal processing.
B.1.2 Discrete Fourier Transform
The space of signals of period N is an Euclidean space of dimension N and the inner
product of two such signals f and g is:
< f , g >=N−1
∑n=0
f [n]g ∗ [n] (B.3)
Any signal with period N can be decomposed as a sum of discrete sinusoidal
waves. The family ek[n] = exp( i2πknN )0≤k≤N is an orthogonal basis of the space of
signals of period N. Since the space is of dimension N, any orthogonal family of N
vectors is an orthogonal basis. Any signal f of period N can be decomposed on this
basis:
f =N−1
∑k=0
< f , ek >
||ek||2ek (B.4)
By definition, the discrete Fourier transform (DFT) of f is:
f [k] =< f , ek >=N−1
∑n=0
f [n]exp(−i2πkn
N) (B.5)
Since ||ek||2 = N, B.4 gives an inverse discrete Fourier formula:
f [n] =1N
N−1
∑k=0
f [k]exp(i2πkn
N) (B.6)
B.1.3 Fast Fourier transform
For a signal f of N points, a direct calculation of the N discrete Fourier sums

B.2. Wavelet Decomposition 129
f [k] =N−1
∑n=0
f [n]exp(−i2πkn
N), f or0 ≤ k ≤ N, (B.7)
requires N2 complex multiplications and additions. The FFT algorithm reduces
the numerical complexity to O(Nlog2N) by reorganising the calculations.
When the frequency index is even, the terms n and n + N/2 are grouped:
f [2k] =N/2−1
∑n=0
( f [n] + f [n + N/2])exp(−i2πkn
N/2) (B.8)
When the frequency index is odd, the same grouping becomes:
f [2k] =N/2−1
∑n=0
exp(i2πn
N)( f [n] + f [n + N/2])exp()
i2πknN/2
(B.9)
Equation B.8 proves that even frequencies are obtained by calculating the DFT of
the N/2 periodic signal:
fe[n] = f [n] + f [n + N/2]. (B.10)
Odd frequencies are derived from by computing the Fourier transform of the
N/2 periodic signal:
fo[n] = exp(i2πn
N( f [n]− f [n + N/2] (B.11)
A DFT of size N may thus be calculated with two discrete Fourier transforms of
size N/2 plus O(N) operations. The inverse FFT of f is derived from the forward
fast Fourier transform of its complex conjugate f ∗ by observing that:
f ∗[n] =1N
N−1
∑k=0
f ∗[k]exp(−i2πkn
N) (B.12)
B.2 Wavelet Decomposition
The wavelet transform makes it possible to analyse the local structures of a signal
in time frequency domain, with a zoom that depends on the scale considered. This
transform makes it possible to analyse signals by focusing on the desired frequen-
cies with a precise resolution in time and frequency (which is not the case of Fourier
transform). Simply, the signal is decomposed to better analyse it. There are two
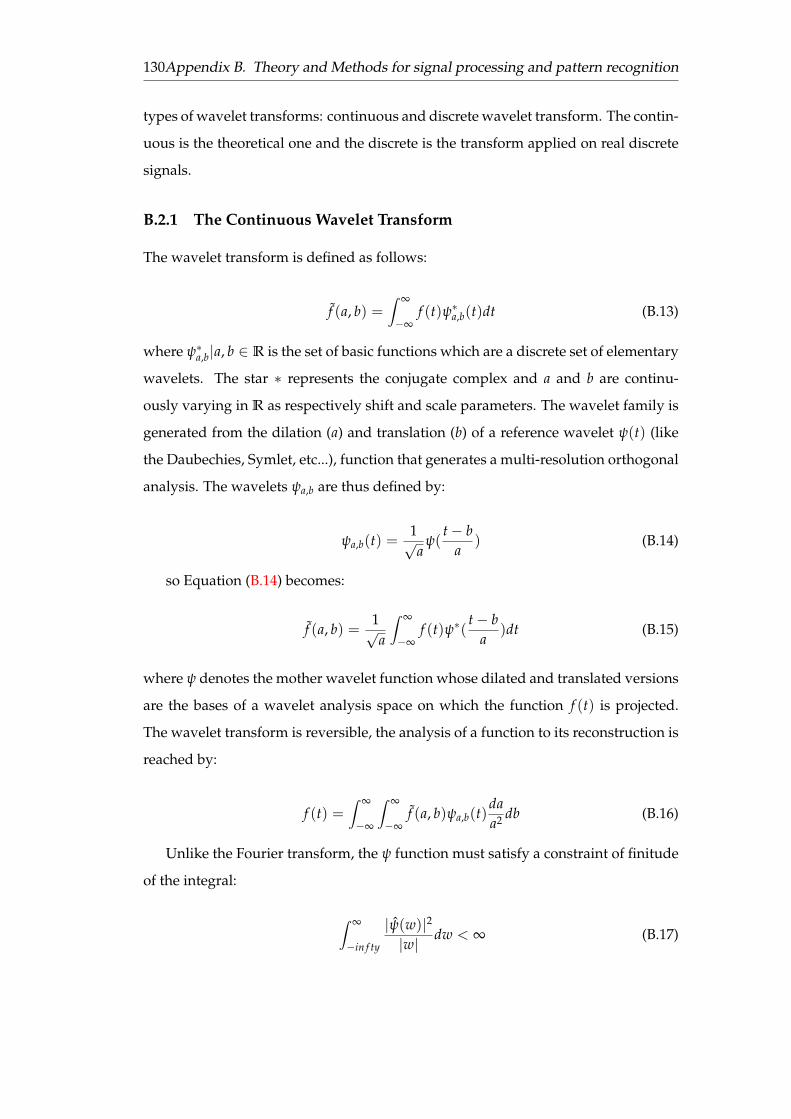
130Appendix B. Theory and Methods for signal processing and pattern recognition
types of wavelet transforms: continuous and discrete wavelet transform. The contin-
uous is the theoretical one and the discrete is the transform applied on real discrete
signals.
B.2.1 The Continuous Wavelet Transform
The wavelet transform is defined as follows:
f (a, b) =∫ ∞
−∞f (t)ψ∗a,b(t)dt (B.13)
where ψ∗a,b|a, b ∈ R is the set of basic functions which are a discrete set of elementary
wavelets. The star ∗ represents the conjugate complex and a and b are continu-
ously varying in R as respectively shift and scale parameters. The wavelet family is
generated from the dilation (a) and translation (b) of a reference wavelet ψ(t) (like
the Daubechies, Symlet, etc...), function that generates a multi-resolution orthogonal
analysis. The wavelets ψa,b are thus defined by:
ψa,b(t) =1√a
ψ(t− b
a) (B.14)
so Equation (B.14) becomes:
f (a, b) =1√a
∫ ∞
−∞f (t)ψ∗(
t− ba
)dt (B.15)
where ψ denotes the mother wavelet function whose dilated and translated versions
are the bases of a wavelet analysis space on which the function f (t) is projected.
The wavelet transform is reversible, the analysis of a function to its reconstruction is
reached by:
f (t) =∫ ∞
−∞
∫ ∞
−∞f (a, b)ψa,b(t)
daa2 db (B.16)
Unlike the Fourier transform, the ψ function must satisfy a constraint of finitude
of the integral:
∫ ∞
−in f ty
|ψ(w)|2|w| dw < ∞ (B.17)

B.2. Wavelet Decomposition 131
where ψ is the Fourier transform of ψ. Moreover, |ψ(w)|2 = 0. So it can be said
that the ψ function is a bandpass filter. This implies that∫ ∞
0 ψ(t)dt = 0 and therefore
ψ is zero average, it must oscillate and so ψ is a wave.
B.2.2 Discrete wavelet transform
The continuous wavelet transform is applied to signals theoretically defined for
which there is an equation, but, it cannot be applied to real signals that for which it is
not known how they are defined and whether they are stationary or not. In order to
apply wavelet transformation to discrete signals (like digitalised sound signal), the
ψ function should be described using discrete values. Therefore a grid of discrete
values is imposed taken by the ψ function. Therefore, discrete wavelet transform is
given by:
f (m, n) = a−m2
0
∫ ∞
−∞f (t)ψ(a−m
0 t− nb0)dt (B.18)
where a0 and b0 ∈ Z
At each level of decomposition, the approximation contains the low frequency
part of the signal and the detail the high frequency part. The more the levels are
lower, the more frequency bands are lower and the more signal is smoother. There
are several types of mother wavelet functions: Morlet wavelet, Mexican hat, Daubechies,
Symlet, etc... B.1. In this study, it was decided to decompose the signal by mul-
tiresolution analysis in 12 wavelet levels using as mother wavelet functions, Symlet
through the detection step.
Once the detection is done, the classification can be performed but the sound sig-
nals cannot be used directly because they are redundant. The information contained
therein must then be reduced by calculating various acoustic parameters which is
described below.
B.2.3 Fast wavelet transform
A fast wavelet transform decomposes successively each approximation PVj f into a
coarser approximation PVj+1 f , plus the wavelet coefficients carried by PWj+1 f . In the
other direction, the reconstruction from wavelet coefficients recovers each PVj f from
PVj+1 f and PWj+1 f .

132Appendix B. Theory and Methods for signal processing and pattern recognition
Figure B.1: Wavelet Functions Examples
Since φj,nn∈Zand ψj,nn∈Z
are orthonormal bases of Vj and Wj,the projection in
these spaces is characterised by:
aj[n] =< f , φj,n > and dj[n] =< f , ψj,n > (B.19)
These coefficients are calculated with a cascade of discrete convolutions and sub-
samplings. x[n] = x[−n] and
x =
x[p] i f n = 2p
0 i f n = 2p + 1
At the decomposition
aj+1[p] =∞
∑n=−∞
h[n− 2p]aj[n] = aj.h[2p], (B.20)
dj+1[p] =∞
∑n=−∞
g[n− 2p]aj[n] = aj.g[2p], (B.21)
At the reconstruction

B.3. Acoustical features 133
aj[p] =∞
∑n=−∞
h[p− 2n]aj+1[n] +∞
∑n=−∞
g[p− 2n]dj+1[n] = aj+1.h[p] + dj+1.g[p] (B.22)
B.3 Acoustical features
Sound processing tasks need in first feature extraction for sound scene and event
analysis. There are three types of features: temporal features (computed directly on
the temporal waveform), spectral shape features (derived from frequency represen-
tations of a signal) and cepstral features (allowing the decomposition of the signal
according to the source-filter model widely used to model speech production.).
• Mel Frequency Cepstral Coefficients (MFCC): MFCC coefficients are cepstral
coefficients very often used in automatic speech recognition Davis and Mer-
melstein (1980). By definition, the Mel frequency scale is given by the equa-
tion:
M(ν) = 2595 log(1 +ν
700) (B.23)
where ν represents the frequency in Hz. M(ν) is then a frequency in the Mel
frequency scale. The calculation of the MFCC parameters uses a non-linear
Mel-frequency scale. Figure B.3 presents the process of creating MFCC fea-
tures. The first step consists of framing the signal into frames by applying a
sliding window throughout the signal. The duration of the analysis window is
of 16 millisecond duration all along this work. The reason for taking small sec-
tions of the signal is that it is considered as statistically stationary. The next step
consists of the discrete Fourier transform of each frame. Let x(t) (1 ≤ t ≤ T)
denote the signal acquired in an observation window of length T. Then, the
spectrum of the signal is filtered by triangular filters whose bandwidths are of
a variable width in the frequency range Mel (Figure B.2). The boundary values
Bm of the Mel frequency scale filters are calculated from the formula B.24:
Bm = B1 + mBh − Bl
M + 1; where 0 ≤ m ≤ M + 1 (B.24)
where M corresponds to the number of filters, Bh corresponds to the highest
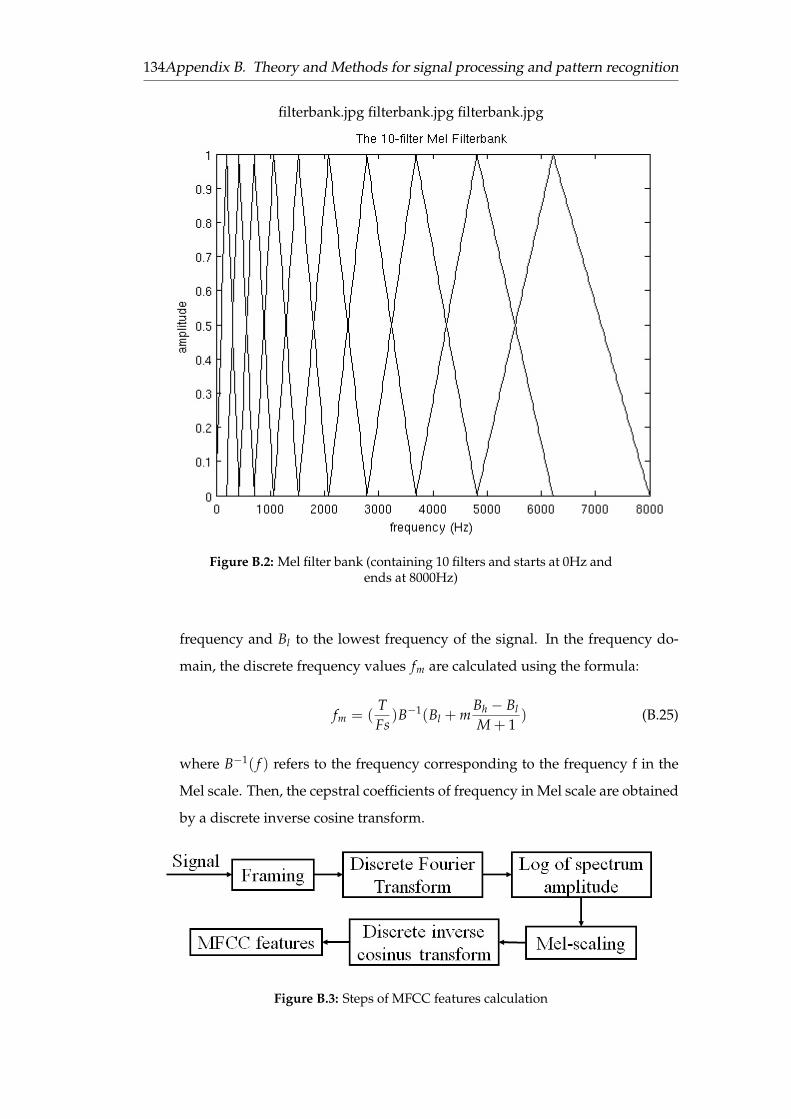
134Appendix B. Theory and Methods for signal processing and pattern recognition
filterbank.jpg filterbank.jpg filterbank.jpg
Figure B.2: Mel filter bank (containing 10 filters and starts at 0Hz andends at 8000Hz)
frequency and Bl to the lowest frequency of the signal. In the frequency do-
main, the discrete frequency values fm are calculated using the formula:
fm = (TFs
)B−1(Bl + mBh − Bl
M + 1) (B.25)
where B−1( f ) refers to the frequency corresponding to the frequency f in the
Mel scale. Then, the cepstral coefficients of frequency in Mel scale are obtained
by a discrete inverse cosine transform.
Figure B.3: Steps of MFCC features calculation

B.4. The Gaussian mixture model 135
• Linear Frequency Cepstral Coefficients (LFCC): The LFCC coefficients are cal-
culated in the same way as the MFCC, but the difference resides in that the
frequencies of the filters are uniformly distributed on the linear scale of fre-
quencies and no longer on a Mel scale.
• The derivatives of the coefficients (∆ and ∆∆): To be able to take into account
the variations in the time scale of the parameters, the derivative of the parame-
ters enabling the measurement of their variations in time have been calculated.
The approximations used for this purpose are as follows:
∆vt =−(vt+2 − vt−2) + 8.(vt+1 − vt−1)
12(B.26)
where vt corresponds to the current value and vt−2, vt−1, vt+1 and vt+2 corre-
spond respectively to the two values preceding the current value and the next
two values. The ∆∆ is given by:
∆∆vt =−(vt−2 − 16vt−1 + 30vt − 16vt+1 + vt+2
12(B.27)
• The Roll-off point (RF): is the frequency below which 95% of the signal energy
is located. It can be considered as an index of the distribution of the signal
power spectrum. It is calculated according to the formula B.28 with Y = 0.95.
RF = α where ∑k<α
X(k) = Y ∑k
X(k) (B.28)
The different sound features calculated are tested and used as empirical statisti-
cal inputs of the models used in this work and described below.
B.4 The Gaussian mixture model
The Gaussian Mixture Model (GMM) is established as one of the most statistically
mature methods for clustering Reynolds and Rose (1995). GMM has been deployed
widely in acoustic signal processing such as speech recognition and music classifi-
cation. Accordingly GMM is used to classify signals without a priori information
about the generation process; this is conducted in two steps as required: a training
step and a recognition step.

136Appendix B. Theory and Methods for signal processing and pattern recognition
Multivariate Gaussian model is a flexible alternative for representing a set of
clusters of size K in which each cluster is modeled by a Multidimensional Gaussian.
The Gaussian clusters may overlap that is to say that each pattern may probabilis-
tically belong to many Clusters. This method evolves in two steps: a training step
and a recognition step:
• Training step: The training is initiated for each class wk of signals and gives a
model containing the characteristics of each Gaussian distribution of the class:
the likelihood, the mean vector and the covariance matrix. These values are
achieved after 20 iterations of an ”EM” algorithm (Expectation Maximisation).
The matrices are diagonal.
• Recognition step: The recognition step aims to calculate the likelihood of
membership of a class wk for each acoustical vector calculated on the signal,
taking into account the parameters calculated during training step.
A Gaussian mixture model is a parametric probability density function repre-
sented as a weighted sum of M component Gaussian densities as given by the equa-
tion below :
p(x|Θ) =M
∑i=1
πi f (x|µi, Σi) (B.29)
where x is a d-dimensional continuous-valued data vector; in this case it represents
feature acoustic vector, πi, i = 1, ..., M, are the mixture weights, and f (x|µi, Σi), i =
1, ..., M, are the component Gaussian densities. The mixture weights satisfy the con-
straint that ∑Mi=1 πi = 1. Each component density is a d-variate Gaussian function
which takes the form :
f (x|µi, Σi) =1
(2π)d/2|Σi|1/2 exp−12(x− µi)
′Σ−1i (x− µi) (B.30)
where µi is the mean vector and Σi is the covariance matrix. Gaussian Mixture Model
is parametrised by the mean vector, covariance matrix and mixture weights denoted
:
Θ = (pii, µi, Σi) (B.31)

B.5. Markovian models 137
B.4.1 Expectation Maximisation (EM) algorithm
Given training acoustic vectors and an initial GMM configuration Θ, the aim is to
estimate the parameters of the optimal GMM model which corresponds to the dis-
tribution of the training features vectors. There are several techniques to estimate
model parameters. The well-established method is Expectation Maximisation (EM),
an iterative algorithm which its basic idea is to start with the initial model to es-
timate a new model Θ with maximum likelihood (p(x|Θ) ≥ (p(x|Θ))). At each
iteration, the new model is becoming the initial model. This step is repeated until a
convergence threshold ε is reached which is expressed by the equation below:
L(Θ; x)− L(θ; x) < ε (B.32)
where L is the likelihood of the model. On each EM iteration, the re-estimation of
parameters is done in the following way:
Gaussian Component Weights
πi =1T
T
∑i=1
P(z|xi, Θ) (B.33)
Mean
µi =∑T
i=1 P(z|xi, Θ)xi
∑Ti=1 P(z|xi, Θ)
(B.34)
Variance
Σi =∑T
i=1 P(z|xi, Θ)(xi − µi)(xi − µi)′
∑Ti=1 P(z|xi, Θ)
(B.35)
where µi, xi and Σi refer to the ith elements of µ, X and Σ and z refers to the zth
component.
B.5 Markovian models
B.5.1 Markovian process
The Markovian character of the process corresponds to the independency of Xi with
respect to all X′js (j < i), except for j = i − 1: A discrete-time Markov process is
a sequence of random variables X1, ..., Xn with values in the finite state space Ω =
x1, ..., xm that validate equation B.36. The different elements of the state space are
called classes.
138Appendix B. Theory and Methods for signal processing and pattern recognition
∀k ∈ 1, 2, ..., n : P(Xk|X1, X2, ..., Xk−1) = P(Xk|Xk−1) (B.36)
The description of the current state is done from the previous state, this corre-
sponds to the models of order 1. Generalisation to k-order models is feasible, in
which the current state is predicted using the last k states.
Being interested in discrete state Markov processes, of order 1, Markov Chain of
order 1 is discussed.
The law of a Markov chain is denied by the law of X0 and a transition matrix
family giving the probabilities of passing from one state xi to another state xj. This
probability is given by:
Tk(xi, xj) = P(Xk+1 = xj|Xk = xi) (B.37)
I assume that the chain is homogeneous. The chain is homogeneous if the tran-
sition probability does not depend on n. This corresponds to its independence from
time.
∀(i, j) ∈ 1, 2, ..., m2 : P(Xk+1 = xj|Xk = xi) = Ti,j/(xi, xj) (B.38)
Therefore, the probability of having observed the sequence: x0, x1, ..., xn is equal
to:
P(x0, x1, ..., xn) = P(x0)T(xi0 , xi1)...T(xil−1 , xil ) ∀ ij ∈ 1, 2, ..., m (B.39)
B.5.2 Hidden Markov Model (HMM)
A Hidden Markov Model (HMM) is a process composed of a double sequence of
random variables (X,Y), such that X is a Markov sequence, and the process Y is real.
Each Yi depends only on the corresponding state Xi. X and Y respectively will be
called hidden variable (unobserved) and observed variable.
The law of an HMM is defined by the law of X which is a Markov sequence and
the law Y conditionally to X. The law of X is defined by the original law π = p(x0)
and the transition matrix (xi, xj) = p(Xn+1 = xj|Xn = xi). So, the sequence of
observations x0, x1, ..., xn has a probability equal to:

B.5. Markovian models 139
p(x0, x1, ..., xn) = p(x0)p(x1|x0)p(x2|x1)...p(xn|xn−1) (B.40)
Assuming that the random variables Yn are conditionally independent of X, the
law of Y conditional to X is defined as follows:
p(y|x) = p(y0|x0)...p(yn|xn) (B.41)
The law of Yn conditional to X is equal to its law conditional to Xn:
p(Yn|X = x) = p(Yn|Xn = xn) (B.42)
Based on the above definitions:
p(x, y) = p(x0)p(x1|x0)...p(xn|xn−1)p(y0|x0)p(yn|xn) (B.43)
B.5.3 Forward-Backward Probabilities
This paragraph recalls the definitions of Forward-Backward probabilities, which
play a crucial role both in parameter estimation and in the actual restoration de-
scribed in the following sections.
To estimate X’s hidden achievements from the observed achievement Y, knowl-
edge of the value of X a posteriori is essential. This law a posteriori p(xi+1|xi, y)
contains any information on X contained in the observations Y. This a posteriori
probability can be calculated from the Forward probabilities αt(xi) = p(y0, ..., yi, xi)
and the Backward probability βi(xi) = p(yi+1, ..., yn, xi). The following recursivities
are used to calculate the Forward and Backward probabilities at each moment of the
Markov model.
• Forward probability: αt(i) refers to the following probability:
αt(i) = p(Xt = xi, Y1 = y1, ..., Yt = yt) (B.44)
This expression can be calculated in a recursive way:
– Initialisation: πi fi(y1) ∀ 1 ≤ i ≤ k where πi = p(X0 = xi) and fi is the
law of Y conditionally to X

140Appendix B. Theory and Methods for signal processing and pattern recognition
– Induction: αi+1(xj) = [∑ki=1 αt(xi)axixj ] fxj(yi+1) ∀ 1 ≤ j ≤ k and 1 ≤ t ≤
n− 1 where aij is the transition probability from state xitostatexj.
• Backward probability: The calculation is similar to the previous approach.
The Backward probability is defined by:
βi(xi) = p(Yt+1 = yt+1, ..., Yn = yn|Xt = xi) (B.45)
referring to the joint probability of the partial sequence of the observation from
instant t + 1 to the final time n. βt is obtained from βt+1 by a regressive recur-
rence:
– Initialisation: βn(i) = 1 ∀ 1 ≤ i ≤ k
– Induction: βi(xi) = ∑kj=1 axixj fxj(yi+1)βi+1(xj) ∀ 1 ≤ i ≤ k and 1 ≤ t ≤
n− 1
B.5.4 Recognition method
To restore the hidden realisation, Bayesian methods are used. The Bayesian estima-
tion derives its name from the intensive use of Bayes law, which allows from the two
distributions P(X) and P(Y|X) to go back to the joint distribution P(X,Y) given by:
P(X, Y) = P(Y|X)P(X) (B.46)
The a Posteriori Marginal Method (PMM)
This algorithm consists in maximising for each state the subsequent marginal state
P(Xt = xt|Y = y) expressed as a function of the probabilities Forward and Back-
ward.
ξt(i) = P(Xi = xi|Y = y) =αt(i).βt(i)
∑1≤l≤k αt(l)βt(l)(B.47)
Thus, the solution is calculated directly, without iterative procedures based only
on αt(i) and βt(i) and so the marginal posterior probabilities ξt(i). Thereafter, the
classification is established by choosing the maximising class maximising ξt(i).
xt = arg maxxi
P(Xt = xi|Y = y) (B.48)

B.5. Markovian models 141
Viterbi algorithm
The Viterbi algorithm (VA) is a recursive algorithm of estimating the state sequence
of a discrete time finite-state Markov process. The Viterbi algorithm is used for find-
ing the most likely sequence of hidden states called the Viterbi path that results in a
sequence of observed events. It is based on the calculation of probabilities
δt(i) = maxx1,x2,...,xt−1
P(X1 = x1, X2 = x2, ..., Xt−1 = xt−1, Xt = ωi, Y1, Y2, ..., Yt−1) (B.49)
corresponding to the optimal path, each one ranging from x1 to xi visited at in-
stant t.
By recurrence:
δt+1(j) = maxx1,x2,...,xt
P(X1 = x1, X2 = x2, ..., Xt = xt, Xt+1 = xj, Y1, Y2, ..., Yt) (B.50)
Otherwise:
δt+1(j) = maxxt
[P(Xt+1 = xi|Xt = xt) maxx1,...,xt−1
P(X1 = x1, X2 = x2, ..., Xt = xt, Y1, Y2, ..., Yt)]
(B.51)
δt+1(j) = maxxi
[P(yt| = Xt = xi). maxx1,...,xt−1
P(X1 = x1, X2 = x2, ..., Xt = xi, Y1, Y2, ..., Yt−1)]
(B.52)
The argument that achieves the maximum is given by:
γt+1(j) = arg maxxi
(aij. fi(yt).δt(i)) (B.53)
Algorithm
• Initialisation:
δ1(i) = P(X1 = xi) = πi ∀1 ≤ i ≤ k (B.54)
• Recurrence, ∀t = 2, 3, ..., T, δt(j) are kept for all j and the corresponding γt(j)
where δt+1(j) = maxxi(aij. fi(yt).δt(i)) and γt+1(j) = arg maxxi(aij. fi(yt).δt(i)).

142Appendix B. Theory and Methods for signal processing and pattern recognition
• End of the recurrence The maximum a posteriori is given by: maxx P(X =
x, Y = y) = maxi δT(i) and xT = arg maxi δT(i).
• Then, the optimal path is given by performing a downward reading of the
stored values: xt = γt+1(xt+1)∀T − 1 ≥ t ≥ 1
EM algorithm for parameter estimation
It consists in maximising the likelihood function of the observation Y=y with respect
to the model parameters. It is used to determine from an initial value θ0 of the
parameters, a sequence (θq)q∈N whose likelihood in Y = y is an increasing function
converging towards a local maximum.
In the following, the iterations of the EM-algorithm are briefly described in the
case of the hidden Markov model.
Noting by ψt(i, j) the joint probability of being at time t in class ωi and at the next
time in class ωj knowing the sequence of observations:
ψt(i, j) = p(Xt = xi, Xt+1 = xj|Y = y) =p(Xt = xi, Xt+1 = xj, Y = y)
p(Y = y)(B.55)
This expression can be written according to Forward-Backward probabilities:
ψt(i, j) =αt(i)aij f j(yt+1)βt+1(j)
∑kl=1 ft(yt+1)∑k
j=1 αt(j)ail(B.56)
A posteriori probability P(Xt = xi|Y = y) can also be written according to the
ψt(i, j):
P(Xt = xi|Y = y) =k
∑j=1
ψt(i, j) (B.57)
The formulas for re-estimating the parameters of the model at iteration q+1 are
the following:
• Initial probabilities and transition matrix at iteration q + 1:
π(q+1)i =
1n
n
∑t=1
P(q)(Xt = xi|Y = y) (B.58)

B.5. Markovian models 143
and
a(q+1)ij =
∑nt=1 ψ
(q)t (i, j)
∑nt=1 P(q)(Xt = xi|Y = y)
(B.59)
• Parameters characterising Gaussians:
µ(q+1)i =
∑nt=1 yt.P(q)(Xt = xi|Y = y)∑n
t=1 P(q)(Xt = xi|Y = y)(B.60)
and
(σ2i )
(q+1) =∑n
t=1(yt − µ(q+1)i )2.P(q)(Xt = xi|Y = y)
∑nt=1 P(q)(Xt = xi|Y = y)
(B.61)


145
Appendix C
Identification grid for swallowing
disorders and associated factors

146Appendix C. Identification grid for swallowing disorders and associated factors
Figure C.1: Identification grid for swallowing disorders and associ-ated factors (Desport et al., 2011)

147
Appendix D
Information note-Consent

1/2
NOTE D’INFORMATION
Titre du projet : « ESwallHome ».
Institution : UTC.
Responsable scientifique : Dr. Jacques Demongeot
Madame, Monsieur,
Nous vous proposons de participer à une recherche intitulée « Suivi de la déglutition à domicile ». Il est
important de lire attentivement cette note d’information avant de prendre votre décision. N’hésitez pas à
demander des explications et poser librement toutes vos questions.
Si vous décidez de participer à cette recherche, un consentement écrit vous sera demandé.
I. OBJECTIFS DU PROJET
Le principal objectif de ce projet est de créer un outil non-invasif d’analyse en temps réel de l’activité de déglutition permettant d’aider le médecin dans le diagnostic précoce et le suivi thérapeutique des troubles de déglutition. Votre participation est totalement volontaire et ne sera pas rétribuée. Vous pouvez décider d’arrêter votre
participation à tout moment sans subir aucun préjudice ni conséquence.
II. PROCEDURE
Les sessions d’enregistrements se dérouleront au cours de votre présence au sein de l’Université de
Technologie de Compiègne, au centre d’Innovation, dans la salle 02-28 ou bien dans les locaux de l’hôpital
pendant une journée où vous aurez rendez-vous avec votre médecin.
Durant chaque rencontre, quelques différents exercices vous seront proposés afin de relever des échantillons
de votre activité de déglutition et de votre voix. Chaque rencontre durera à peu près une demi-heure.
Pendant les exercices de déglutition, il vous serait demandé de faire déglutir plusieurs textures d’aliments. Au
cours de la déglutition, votre voix sera enregistrée à l’aide de deux microphones ; un mis au niveau du cou et
l’autre sera mis sur la table pour accueillir le son environnemental. De plus, il vous sera demandé de porter un
gilet qui permet d’acquérir le signal de la respiration pendant la prise alimentaire. Les informations seront
recueillies de façon confidentielle et utilisées exclusivement dans le cadre de la recherche scientifique.
III. RISQUES ET INCONVENIENTS
Il n’existe pas de risque prévisible ou attendu dans cette recherche. Elle nécessite simplement d’être disponible
pendant trente minutes à chacune des sessions pour y participer.
IV. AVANTAGES ET PROGRES ESCOMPTES
En participant au projet de recherche « ESwallHome », vous contribuez de façon importante à la recherche sur
le développement de moyens technologique numériques au service de la médecine. Les données collectées
durant cette étude permettront de mieux connaître les influences de certaines maladies sur des opérations

2/2
quotidiennes. Leur exploitation permettrait de faciliter le diagnostic et le suivi thérapeutique de ces maladies, y
compris de façon précoce. Ceci présenterait un progrès et une aide certaine pour les médecins.
V. CONFIDENTIALITE
Les données sont recueillies de façon non identifiante et confidentielle. Les informations traitées lors de
l’analyse apparaîtront dans les rapports mais de telle façon qu’aucune identification des personnes, source des
informations, ne soit possible.
Les résultats de cette recherche pourront être publiés dans des revues scientifiques, présentés dans des
réunions d’information clinique, toujours dans le respect de la confidentialité. Votre accord pour l’utilisation de
ces informations est valable jusqu’au terme du projet, sauf si vous y mettez fin avant.
Dans le cas où vous décideriez votre retrait du projet de recherche, vos données ne seraient plus traitées, mais
il ne serait pas possible de modifier les documents existants déjà publiés ou les rapports terminés.
Conformément à la loi « Informatique et libertés » du 6 janvier 1978, vous bénéficiez d’un droit d’accès et de
rectification aux informations qui vous concernent. Si vous souhaitez exercer ce droit et obtenir la
communication des informations vous concernant, veuillez-vous adresser à Dan Istrate, professeur à l’UTC au
sein du laboratoire BMBI.
VI. PERSONNES CONTACTS
Pour plus d’informations sur cette étude, vos droits en tant que participant, si vous n’étiez pas satisfait ou si vous aviez des questions concernant cette recherche, merci de bien vouloir contacter les investigateurs :
Dan Istrate UTC – Laboratoire BMBI
[email protected] VII. CONFIRMATION
Si vous acceptez de participer à la recherche après avoir lu cette note d’information, merci de signer et dater le
formulaire de consentement éclairé ci-après (2 exemplaires).

FORMULAIRE DE CONSENTEMENT
Je soussigné(e), Madame, Mademoiselle, Monsieur
(nom, prénom)………………………………………………………...................................................................................
accepte librement de participer à la recherche intitulée :
« Suivi de la déglutition à domicile »
organisée par e-SwallHome, sous la responsabilité scientifique du Dr. Jacques Demongeot.
- J’ai pris connaissance de la note d’information m’expliquant l’objectif de cette recherche, la façon
dont elle va être réalisée et ce que ma participation va impliquer,
- Je conserverai un exemplaire de la note d’information et du consentement,
- J’ai reçu des réponses adaptées à toutes mes questions,
- Mon consentement ne décharge en rien le médecin responsable de la recherche ni l’hôpital de leurs
responsabilités et je conserve tous mes droits garantis par la loi.
Signature de la personne participant à la recherche Signature de l’investigateur
NOM Prénom :
Date :
Signature :
(faire précéder de la mention « Lu et approuvé »)
NOM Prénom :
Date :
Signature :
(faire précéder de la mention « Lu et approuvé »)
Pour toute question relative à la recherche, ou pour vous retirer de la recherche, vous pouvez
communiquer avec :
Monsieur Dan ISTRATE, enseignant-chercheur, au numéro de téléphone : 03 44 23 45 06 ou à
l’adresse de courriel suivante : [email protected]
Exemplaire pour le participant.

FORMULAIRE DE CONSENTEMENT
Je soussigné(e), Madame, Mademoiselle, Monsieur
(nom, prénom)………………………………………………………...................................................................................
accepte librement de participer à la recherche intitulée :
« Suivi de la déglutition à domicile »
organisée par e-SwallHome, sous la responsabilité scientifique du Dr. Jacques Demongeot.
- J’ai pris connaissance de la note d’information m’expliquant l’objectif de cette recherche, la façon
dont elle va être réalisée et ce que ma participation va impliquer,
- Je conserverai un exemplaire de la note d’information et du consentement,
- J’ai reçu des réponses adaptées à toutes mes questions,
- Mon consentement ne décharge en rien le médecin responsable de la recherche ni l’hôpital de leurs
responsabilités et je conserve tous mes droits garantis par la loi.
Signature de la personne participant à la recherche Signature de l’investigateur
NOM Prénom :
Date :
Signature :
(faire précéder de la mention « Lu et approuvé »)
NOM Prénom :
Date :
Signature :
(faire précéder de la mention « Lu et approuvé »)
Pour toute question relative à la recherche, ou pour vous retirer de la recherche, vous pouvez
communiquer avec :
Monsieur Dan ISTRATE, enseignant-chercheur, au numéro de téléphone : 03 44 23 45 06 ou à
l’adresse de courriel suivante : [email protected]
Exemplaire pour l’équipe de recherche.


153
Appendix E
Protocol

Protocole d’acquisition de données
Séquences d’enregistrement
1. Apnée (8 secondes) et Respiration spontanée (3 min)
Faire une apnée de 8 secondes suivi de 3 minutes de repos du sujet où les déglutitions
spontanées pourront être annotées.
2. Déglutition
a. Salive (2-3 min)
Déglutitions provoquées de salive sur commande : 6 fois toutes les 30
secondes environ
b. Eau liquide
Déglutir deux verres d’eau à des proportions égales.
c. Compote
Prise d’une cuillère à café de compote (100 g),
3. Parole
Lire 3 phrases, répéter deux fois
Lire un enchainement de phrase puis un extrait de texte
Consignes de lecture :
Mettre l’intonation en lien avec la ponctuation
Phrase 1 :
Le caractère de cette femme est moins calme.
Phrase 2 :
Vous poussez des cris de colère ?
Phrase 3 : Lentement, des canes se dirigent vers la mare.
Consignes de lecture :
Lire en continue en tenant compte de la ponctuation et donc de l’intonation
Paragraphe :
C’est en forgeant qu’on devient forgeron. Je voudrais des frites s’il vous plait. Quant à moi, je
n’ai pas envie d’y aller. C’est une fille tout à fait à la page. Tu mets combien d’œufs pour
préparer une quiche ? Marie-Hélène roule en moto tandis que Céline se déplace en métro.
Voulez-vous lui passer le beurre ? Moi, ce que je veux, c’est la tranquillité pour chacun. Il
s’occupe de ses oignons ! La perte de ma mère m’a jeté hors de mes gonds.

Consignes de lecture :
Lire en continue en tenant compte de la ponctuation et donc de l’intonation
« Personne ne me connaissait à Buckton. Clem avait choisi la ville à cause de cela ; et d’ailleurs,
même si je m’étais dégonflé, il ne me restait pas assez d’essence pour continuer plus haut vers
le Nord. A peine cinq litres. Avec mon dollar, la lettre de Clem, c’est tout ce que je possédais.
Ma valise, n’en parlons pas. Pour ce qu’elle contenait. J’oublie : j’avais dans le coffre de la
voiture le petit revolver du gosse, un malheureux 6,35 bon marché ; il était encore dans sa poche
quand le shérif était venu nous dire d’emporter le corps chez nous pour le faire enterrer. »
Boris Vian, “j'irai cracher sur vos tombes“
4. Apnée-Sons (Toux, Bâillement)
Faire une apnée de 3 secondes, à répéter 3 fois
Faire une apnée de 8 secondes, à répéter 3 fois
Tousser, à répéter 3 fois
Bailler, à répéter 3 fois
Faire une apnée de 8 secondes.

Cahier d’observation (1/2)
Sujet Code sujet Date naissance Poids (Kg) Taille (cm) Prise thé Prise café
Oui Non Oui Non
Enregistrement Heure début Heure fin Température (°C)
Déglutitions spontanées (3 min ventilation spontanée) :
Déglutitions volontaires de salive : toutes les 30 secondes 1ere fois 2ième fois 3ième fois 4ième fois 5ème fois 6ème fois
Prise d’eau liquide Volume Support 1ere fois 2ième fois 3ième fois
5/10/15 ml Verre/Paille début fin début fin début fin
Cahier d’observation (2/2)
Prise de compote de fruits Quantité 1ere fois 2ième fois 3ième fois
début fin début fin début fin
1 cuillère café

Parole : lecture de phrases phonétiquement équilibrées Lecture Ordre 1ere fois 2ième fois
début fin début fin
Phrase 1
Phrase 2
Phrase 3
Enchaînement de phrases
Extrait de livre
Apnée Durée Ordre 1ere fois 2ième fois 3ième fois
début fin début fin début fin
3 secondes
8 secondes
Toux 1ere fois 2ième fois 3ième fois
début fin début fin début fin
Bâillement 1ere fois 2ième fois 3ième fois
début fin début fin début fin
________________________________________________________________
Commentaires
-------------------------------------------------------------------------------------------------
-------------------------------------------------------------------------------------------------
-------------------------------------------------------------------------------------------------
-------------------------------------------------------------------------------------------------
-------------------------------------------------------------------------------------------------
-------------------------------------------------------------------------------------------------
-------------------------------------------------------------------------------------------------


159
Appendix F
Programs-codes

Real-time sound recording
Wavelet decomposition
(Symlet 5)
Decomposed signal (details+residues) Reconstructed signal (details 5+6+7)
Energy and Threshold calculation
Keep on recording
Detection
Energy ≥ Threshold
Energy ≤ Threshold
Automatic Detection

Sound recordings
Manual transcription
Swallowing
Speech
Sounds
Extraction of features
Extraction of features
GMM learning step
Swallowing
Speech
Sounds
Signal
Recognition step
Assignment to the most likely class
Recognition Learning
Sound Classification

162 Appendix F. Programs-codes
Table F.1: Automatic detection results
Number of references to be detected = 3501Events References
Number of Validated Events 67.55% Number of Validated References 22.19%Number of Partial Events 30.13% Number of Partial references 63.95%Number of False Alarms 24.92% Number of Missed References 13.85%