Preliminary Findings from an Analysis of Building Energy Information System Technologies
23
eScholarship provides open access, scholarly publishing services to the University of California and delivers a dynamic research platform to scholars worldwide. Lawrence Berkeley National Laboratory Lawrence Berkeley National Laboratory Title: Preliminary Findings from an Analysis of Building Energy Information System Technologies Author: Granderson, Jessica Publication Date: 10-15-2009 Publication Info: Lawrence Berkeley National Laboratory Permalink: http://escholarship.org/uc/item/4n39t1rc
-
Upload
independent -
Category
Documents
-
view
5 -
download
0
Transcript of Preliminary Findings from an Analysis of Building Energy Information System Technologies

eScholarship provides open access, scholarly publishingservices to the University of California and delivers a dynamicresearch platform to scholars worldwide.
Lawrence Berkeley National LaboratoryLawrence Berkeley National Laboratory
Title:Preliminary Findings from an Analysis of Building Energy Information System Technologies
Author:Granderson, Jessica
Publication Date:10-15-2009
Publication Info:Lawrence Berkeley National Laboratory
Permalink:http://escholarship.org/uc/item/4n39t1rc

Preliminary Findings from an Analysis of Building Energy Information System Technologies
Jessica Granderson
Mary Ann Piette Girish Ghatikar
Phillip Price Lawrence Berkeley National Laboratory

DISCLAIMER
This document was prepared as an account of work sponsored by the United States Government. While this document is believed to contain correct information, neither the United States Government nor any agency thereof, nor The Regents of the University of California, nor any of their employees, makes any warranty, express or implied, or assumes any legal responsibility for the accuracy, completeness, or usefulness of any information, apparatus, product, or process disclosed, or represents that its use would not infringe privately owned rights. Reference herein to any specific commercial product, process, or service by its trade name, trademark, manufacturer, or otherwise, does not necessarily constitute or imply its endorsement, recommendation, or favoring by the United States Government or any agency thereof, or The Regents of the University of California. The views and opinions of authors expressed herein do not necessarily state or reflect those of the United States Government or any agency thereof or The Regents of the University of California.
Preliminary Findings from an Analysis of Building Energy Information System Technologies
Jessica Granderson Mary Ann Piette
Girish Ghatikar Phillip Price
Lawrence Berkeley National Laboratory
Synopsis Energy information systems comprise software, data acquisition hardware, and communication systems that are intended to provide energy information to building energy and facilities managers, financial managers, and utilities. This technology has been commercially available for over a decade, however recent advances in Internet and other information technology, and analytical features have expanded the number of product options that are available. For example, features such as green house gas tracking, configurable energy analyses and enhanced interoperability are becoming increasingly common. Energy information systems are used in a variety of commercial buildings operations and environments, and can be characterized in a number of ways. Basic elements of these systems include web-based energy monitoring, web-based energy management linked to controls, demand response, and enterprise energy management applications. However the sheer number and variety of available systems complicate the selection of products to match the needs of a given user. In response, a framework was developed to define the capabilities of different types of energy information systems, and was applied to characterize approximately 30 technologies. Measurement is a critical component in managing energy consumption and energy information must be shared at all organizational levels to maintain persistent, efficient operations. Energy information systems are important to understand because they offer the analytical support to process measured data into information, and they provide the informational link between the primary actors who impact building energy efficiency - operators, facilities and energy managers, owners and corporate decision makers. In this paper, preliminary findings are presented, with a focus on overall trends and the general state of the technology. Key conclusions include the need to further pursue standardization and usability, x-y plotting as an under-supported feature, and a general convergence of visualization and display capabilities.
About the Authors Dr. Jessica Granderson is a Postdoctoral Research Fellow in the Environmental Energy Technologies Division at the Lawrence Berkeley National Laboratory. Dr. Granderson holds an AB in Mechanical Engineering from Harvard University, ad a PhD in Mechanical Engineering

from UC Berkeley. Dr. Granderson is a member of the commercial building systems and lighting research groups, with a background in intelligent user-centered lighting controls, and quantification of whole-building energy performance. Mary Ann Piette is a Staff Scientist and Deputy Head of the Building Technologies Environment Department at Lawrence Berkeley National Laboratory. She has been at Berkeley Laboratory for more than 20 years, with research interests covering commercial building energy analysis, commissioning, diagnostics, controls, and energy information system. She has a B.S. in Physical Science from and a Masters in Mechanical Engineering from UC Berkeley, and a Licentiate in Building Services Engineering from the Chalmers University of Technology in Sweden. Girish Ghatikar is a Systems and Business Analyst at LBNL overseeing Open Auto-DR technology and standards activities, and technical related issues to energy and software systems. He has an MS in telecommunications systems and computer technologies and MS in infrastructure planning. Dr. Phillip Price has a PhD in physics, and has worked at Lawrence Berkeley National Laboratory since arriving as a postdoctoral researcher in 1992. Past research has included application of Bayesian techniques to spatial environmental problems; development of novel computational methods for applying computed tomography to map airborne pollutants; and predicting the spread of toxic material into and within buildings. He now works on various aspects of predicting, measuring, and analyzing energy use in commercial buildings.
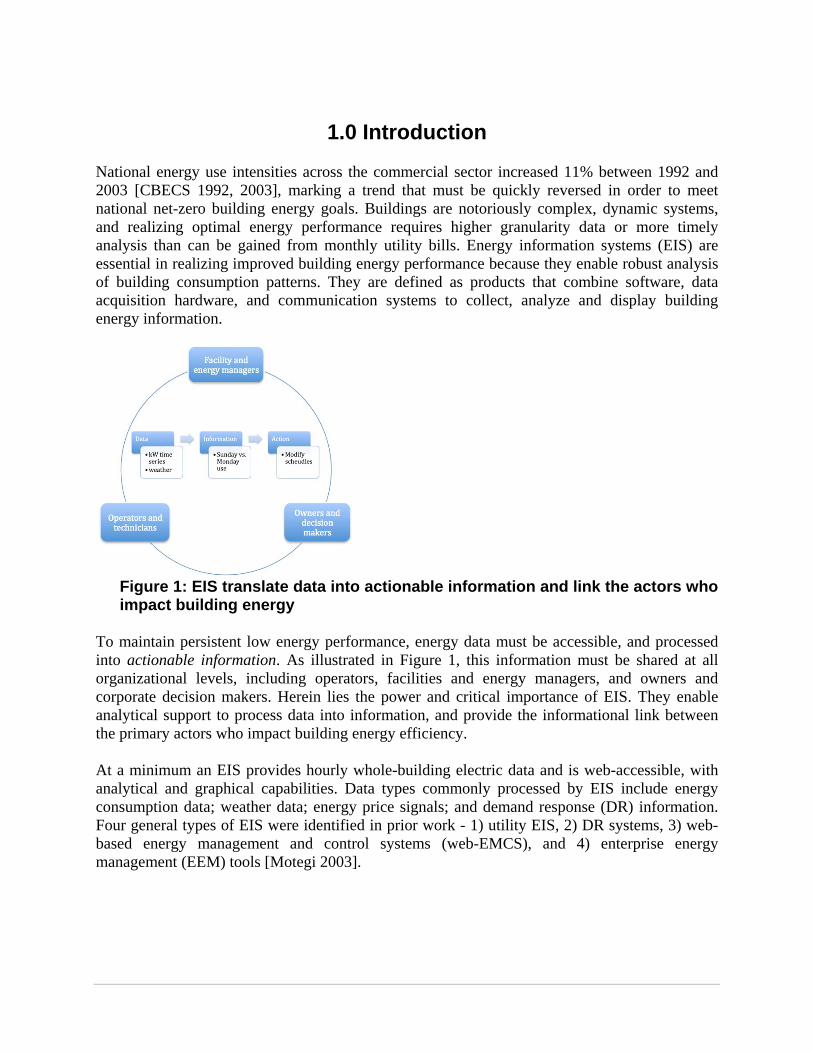
1.0 Introduction National energy use intensities across the commercial sector increased 11% between 1992 and 2003 [CBECS 1992, 2003], marking a trend that must be quickly reversed in order to meet national net-zero building energy goals. Buildings are notoriously complex, dynamic systems, and realizing optimal energy performance requires higher granularity data or more timely analysis than can be gained from monthly utility bills. Energy information systems (EIS) are essential in realizing improved building energy performance because they enable robust analysis of building consumption patterns. They are defined as products that combine software, data acquisition hardware, and communication systems to collect, analyze and display building energy information.
Figure 1: EIS translate data into actionable information and link the actors who impact building energy
To maintain persistent low energy performance, energy data must be accessible, and processed into actionable information. As illustrated in Figure 1, this information must be shared at all organizational levels, including operators, facilities and energy managers, and owners and corporate decision makers. Herein lies the power and critical importance of EIS. They enable analytical support to process data into information, and provide the informational link between the primary actors who impact building energy efficiency. At a minimum an EIS provides hourly whole-building electric data and is web-accessible, with analytical and graphical capabilities. Data types commonly processed by EIS include energy consumption data; weather data; energy price signals; and demand response (DR) information. Four general types of EIS were identified in prior work - 1) utility EIS, 2) DR systems, 3) web-based energy management and control systems (web-EMCS), and 4) enterprise energy management (EEM) tools [Motegi 2003].

Figure 2: Types of EIS and overlapping functional intent [Motegi 2002]
As indicated in Figure 2, EIS consist of the intersection of support tools from a number of domains. The distinction between what is and is not an EIS is better understood using EMCS as example. While their traditional design intent is to monitor and control building systems, EMCS can integrate whole-building utility meters and weather sensors. In turn, this data can be used to define energy performance metrics that can be included in plots, calculations, and reports. In addition, some EMCS are web-accessible. If the control-focused features of an EMCS are implemented and used in this manner, the web-based EMCS can be considered an EIS. That is, the functionality of some EMCS can be applied to whole-building data in such a way that the software serves as an EIS, although scaling issues for data management and storage may be encountered in large enterprises. This is in contrast to conventional EIS that have no control capability and no subsystem data, but rather embody a design intent to understand patterns of whole-building energy use. EIS help provide information for benchmarking, baselining, anomaly detection, off-hours energy use, load shape optimization, energy rate analysis, retrofit and retro-commissioning savings. In this way, traditional building automation or control systems, or equipment specific diagnostic software tools do not fall within the scope of EIS. In contrast to EIS software, “dashboards” are single-screen graphical displays of the most critical information necessary for a job or task, and have commonly been used to communicate business information [Few 2006]. Recently they have gained popularity in energy applications due to the ability to distill a large cohort of complex data into a summative set of graphics that can be interpreted at-a-glance. Common graphical elements in dashboards include gauges and dials evocative of a vehicle dashboard, and graphs and charts that are often color-coded to map quantitative measures to qualitative terms. While there is clearly overlap between the two, the dashboard concept is not particularly useful in understanding EIS capabilities and features. EIS may certainly include dashboard views or layouts, however their power and benefit is in the underlying analysis. This study extends and updates the outcomes of similar research conducted in 2003, that established features to characterize EIS, and reviewed 17 representative systems [Motegi 2003]. Evolving trends in the industry have prompted a renewed investigation of EIS capabilities, and real-world uses. In response, this work is framed by two high-level objectives: 1) to develop an EIS characterization framework to facilitate an understanding of different technology offerings; 2) to evaluate EIS usability through case studies. The case studies are intended to answer questions such as: Which features have proved most useful in attaining energy savings? What

actions are taken based on the information provided via an EIS? How much of a building’s low energy use or energy savings can be attributed to the use of an EIS? In this paper, preliminary findings are presented, with a focus on overall trends and the general state of the technology. A more comprehensive report is to follow, including specific case study outcomes, further details concerning the characterization framework, and evaluations of commercial EIS products. This paper is expected to be of use to a wide audience of stakeholders including building operators and energy managers, EIS vendors and developers, energy service providers, policy makers, and researchers.
2.0 EIS Characterization Framework The EIS characterization framework was developed iteratively, beginning with the features that were relevant in 2003. That set of features was augmented to better fit today’s systems based on preliminary knowledge of industry advances, and a cursory scoping of current systems. Feedback from a technical advisory group, and a small number of vendors was solicited and incorporated in revisions. In its final form, the framework consists of 8 categories with 5-10 features each (see Appendix A). The categories within the framework, and associated features include:
• Data collection, transmission, storage and security o Accepted energy inputs, storage capacity, minimum trend interval, upload
frequency, supported protocols and interoperability, archived and exported data formats, and security measures
• Display and visualization o Daily, summary, or calendar plotting intervals, daily and trend display overlays,
3-dimensional plotting, DR status and reduction, and x-y plotting • Energy analysis
o Averages, high/lows, efficiencies, normalization, carbon tracking, multi-site, historical, and standards-based benchmarking
• Advanced analysis o Forecasting, fault detection and diagnostics (FDD), data gaps, statistics, on-site
generation, renewables, and load shape analysis • Financial analysis
o Simple and tariff-based energy costing, meter/bill verification, estimation of savings from capital or operational changes, bill processing/payment, and end use allocation
• Demand response o Signal notification, event response recording, manual vs. automated response, opt
out, black out, test dates, response analysis and quantification • Remote control and management • General information
o Browser support, purchase and subscription costs, intended user, number of users, vendor description, traditional and newly targeted markets

This framework characterizes standard out-of-the-box functionality across a broad spectrum of EIS technologies. Depending on the specific software under consideration, not every feature may be applicable. The framework is most applicable to systems that target end users at the facilities level, with a minimum level of bundled or optional services. However, even tools with a number of options can be characterized with a bit of annotation beyond simple yes/no assignments.
3.0 Commercial EIS Characterization Following formalization of the framework, approximately 30 were characterized. Out of scope products included most EMCS, energy information ‘dashboards’ for occupants or owners, GHG footprint calculators, batch analysis tools, and general building environment tools. Each system in the study was reviewed based on publicly available online material and demos. It is not possible to fully characterize an EIS offering based purely on brochures and website information, so vendor feedback and input was included in the evaluation. Where possible we characterized features through interviews with the vendor, although in some cases the vendor preferred to evaluate their offering independently. Appendix B lists the vendors and systems that were included in the study, with a description of their intended users. 3.1 Business Models It is quite difficult to map the diversity of EIS offerings to traditional software business models. The array of optional services, varying degrees of customization or configuration, and alternatives for data and IT management and pricing quickly blur the lines that define common software models. Nevertheless, some of the familiar structures are useful in attempting to understand the EIS market. Standard software products are typically purchased with a one-time fee, are licensed according to number of installations, and include limited support with no additional services. Enterprise client-server applications are commonly licensed based on the number of users, and include one-time fees as well as support and upgrade subscriptions. Application Service Providers (ASP) offer solutions in which the ASP owns operates and maintains the software and servers for web-based applications that are usually priced according to monthly/annual fees. Turnkey solution providers offer fully-packaged solutions that include pre-installed software, hardware and accessories in a single ‘bundle’. Although it is rare to find an EIS vendor that cleanly fits into a single model, EIS offerings and providers can be differentiated according to the following considerations: • ASP or traditional ownership - who houses, owns, and maintains the servers application? • Bundled or optional services - data and IT management, interface customization, and energy-
specific data analysis • Intended end user - energy service providers, aggregators, operators, facilities managers,
corporate enterprise managers, utilities, systems integrators • Hardware requirements - does the offering include specific or proprietary hardware, no
hardware, or hardware only as necessary for the clients’ objectives? • Payment options - per site, per user, billing frequency, subscription or one-time fee
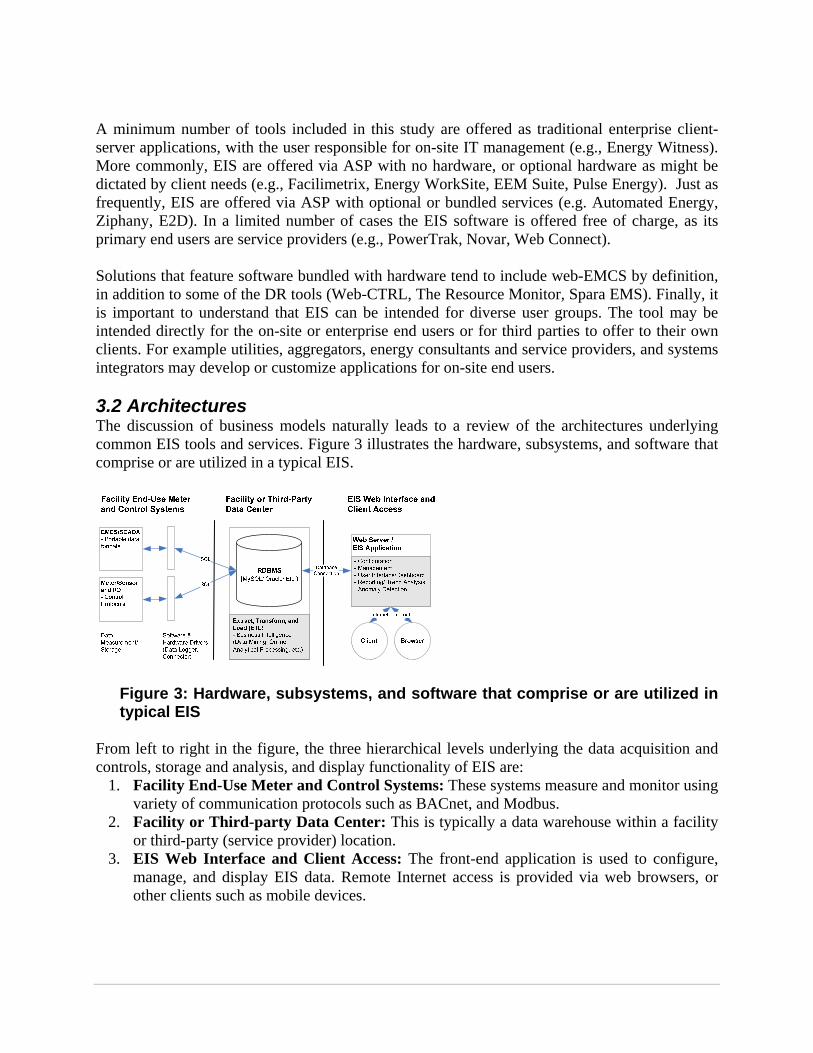
A minimum number of tools included in this study are offered as traditional enterprise client-server applications, with the user responsible for on-site IT management (e.g., Energy Witness). More commonly, EIS are offered via ASP with no hardware, or optional hardware as might be dictated by client needs (e.g., Facilimetrix, Energy WorkSite, EEM Suite, Pulse Energy). Just as frequently, EIS are offered via ASP with optional or bundled services (e.g. Automated Energy, Ziphany, E2D). In a limited number of cases the EIS software is offered free of charge, as its primary end users are service providers (e.g., PowerTrak, Novar, Web Connect). Solutions that feature software bundled with hardware tend to include web-EMCS by definition, in addition to some of the DR tools (Web-CTRL, The Resource Monitor, Spara EMS). Finally, it is important to understand that EIS can be intended for diverse user groups. The tool may be intended directly for the on-site or enterprise end users or for third parties to offer to their own clients. For example utilities, aggregators, energy consultants and service providers, and systems integrators may develop or customize applications for on-site end users. 3.2 Architectures The discussion of business models naturally leads to a review of the architectures underlying common EIS tools and services. Figure 3 illustrates the hardware, subsystems, and software that comprise or are utilized in a typical EIS.
Figure 3: Hardware, subsystems, and software that comprise or are utilized in typical EIS
From left to right in the figure, the three hierarchical levels underlying the data acquisition and controls, storage and analysis, and display functionality of EIS are:
1. Facility End-Use Meter and Control Systems: These systems measure and monitor using variety of communication protocols such as BACnet, and Modbus.
2. Facility or Third-party Data Center: This is typically a data warehouse within a facility or third-party (service provider) location.
3. EIS Web Interface and Client Access: The front-end application is used to configure, manage, and display EIS data. Remote Internet access is provided via web browsers, or other clients such as mobile devices.
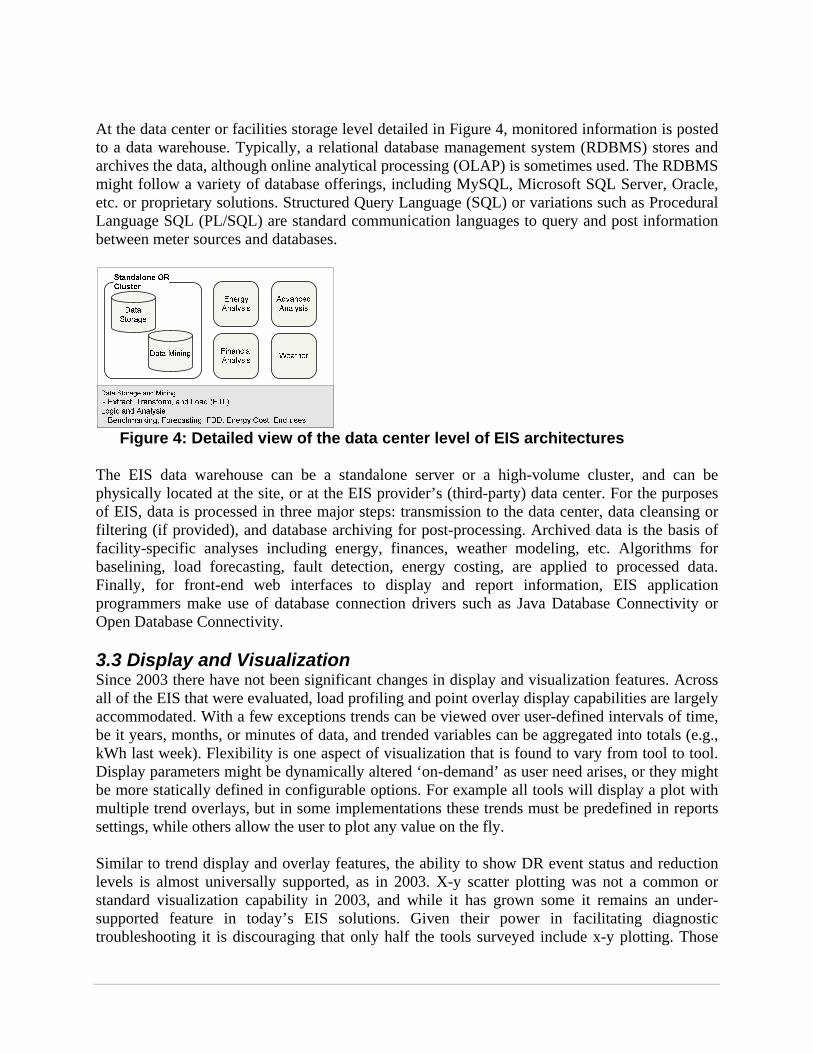
At the data center or facilities storage level detailed in Figure 4, monitored information is posted to a data warehouse. Typically, a relational database management system (RDBMS) stores and archives the data, although online analytical processing (OLAP) is sometimes used. The RDBMS might follow a variety of database offerings, including MySQL, Microsoft SQL Server, Oracle, etc. or proprietary solutions. Structured Query Language (SQL) or variations such as Procedural Language SQL (PL/SQL) are standard communication languages to query and post information between meter sources and databases.
Figure 4: Detailed view of the data center level of EIS architectures
The EIS data warehouse can be a standalone server or a high-volume cluster, and can be physically located at the site, or at the EIS provider’s (third-party) data center. For the purposes of EIS, data is processed in three major steps: transmission to the data center, data cleansing or filtering (if provided), and database archiving for post-processing. Archived data is the basis of facility-specific analyses including energy, finances, weather modeling, etc. Algorithms for baselining, load forecasting, fault detection, energy costing, are applied to processed data. Finally, for front-end web interfaces to display and report information, EIS application programmers make use of database connection drivers such as Java Database Connectivity or Open Database Connectivity. 3.3 Display and Visualization Since 2003 there have not been significant changes in display and visualization features. Across all of the EIS that were evaluated, load profiling and point overlay display capabilities are largely accommodated. With a few exceptions trends can be viewed over user-defined intervals of time, be it years, months, or minutes of data, and trended variables can be aggregated into totals (e.g., kWh last week). Flexibility is one aspect of visualization that is found to vary from tool to tool. Display parameters might be dynamically altered ‘on-demand’ as user need arises, or they might be more statically defined in configurable options. For example all tools will display a plot with multiple trend overlays, but in some implementations these trends must be predefined in reports settings, while others allow the user to plot any value on the fly. Similar to trend display and overlay features, the ability to show DR event status and reduction levels is almost universally supported, as in 2003. X-y scatter plotting was not a common or standard visualization capability in 2003, and while it has grown some it remains an under-supported feature in today’s EIS solutions. Given their power in facilitating diagnostic troubleshooting it is discouraging that only half the tools surveyed include x-y plotting. Those

tools that do, usually accommodate the feature through correlation analyses. The EIS that originated in the industrial sector are especially likely to support x-y or correlational plotting due to the historic demand for site-specific key performance indicators. 3.4 Energy Analysis Features related to greenhouse gas (GHG) analysis did not appear in the 2003 study, but are an element of the EIS framework. Two thirds of the EIS that were reviewed feature carbon tracking and analysis as a standard capability, or provide custom or configurable options to do so. The majority of analyses apply a simple energy/CO2 relationship, however about half account for regional differences in generation, or other standards. For example:
• PowerTrak uses EPA’s eGRID (emissions and generation resource integration) database paired with client zip codes
• Ion EEM determines emissions factors based on Scope 1 and 2 of the GHG International Protocol, a standard global GHG accounting framework
• Automated Energy, EIServer, and Energy Witness apply knowledge of utility-specific fuel mixes
• Energy WorkSite uses Department of Energy values for state-by-state emissions Time-varying GHG intensities are not yet frequently addressed. Time variance is expected to be a useful feature for sites that significant perform load shifting, for example via thermal energy storage systems. The few exceptions that were encountered include EPO and ION EEM, both of which permit the definition of multiple emissions factors, and Commercial Energy Suite that cites time-variance as an optional feature. Energy Witness reports that the feature is under development for upcoming releases.

Figure 5: ION EEM emissions reporting module1, and Noveda Carbon Footprint Monitor2
Normalization is an important feature of energy analysis that is widely accommodated, although at diverse levels of rigor. Only a handful of tools report that they offer no means of normalization (e.g., Utility Vision, EEM Suite, The Resource Monitor, Web Connect, InSpire), or require that data be exported to 3rd party software such as Excel to do so. Normalization capabilities may be offered via reporting options or definable arithmetic calculations (monthly kWh divided by monthly degree days), or plottable trend points created from other trends (e.g., ION EEM, Operational Insight). Weather normalization may make use of environmental sensors that are integrated into the EIS database, external sources of weather data (e.g., Automated Energy uses Accuweather), or manual entry within calculation functions. Quantification of a building’s historic energy performance baseline is supported in nearly every EIS in the study. The majority implement trend-based or report-based solutions, while weather-normalized baselining or implementation of standard methodologies are far less prevalent. Some exceptions include ION EEM energy modeling module, and Powerit Solutions and Novar who integrate expert knowledge and heuristics.
1 http://www.powerlogic.com/literature/3000HO0603R1108_IONDemand.pdf 2 http://www.noveda.com/en/page/105?l1=3&l2=5&l3=0
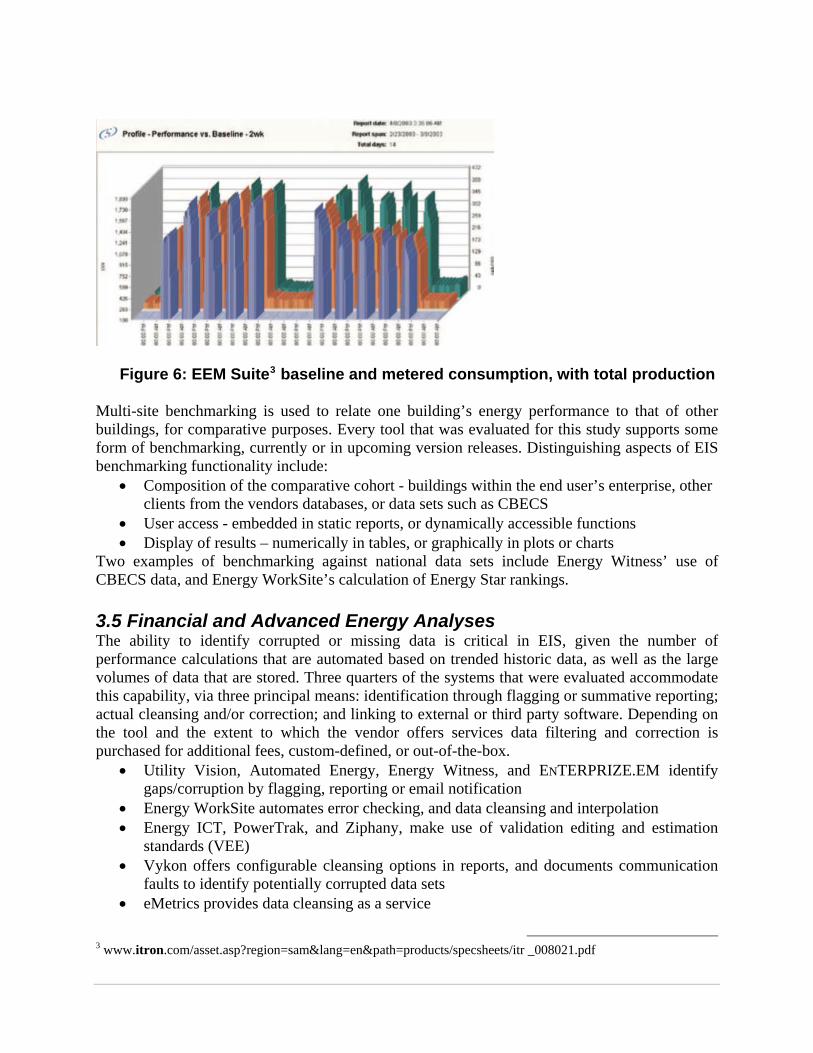
Figure 6: EEM Suite3 baseline and metered consumption, with total production Multi-site benchmarking is used to relate one building’s energy performance to that of other buildings, for comparative purposes. Every tool that was evaluated for this study supports some form of benchmarking, currently or in upcoming version releases. Distinguishing aspects of EIS benchmarking functionality include:
• Composition of the comparative cohort - buildings within the end user’s enterprise, other clients from the vendors databases, or data sets such as CBECS
• User access - embedded in static reports, or dynamically accessible functions • Display of results – numerically in tables, or graphically in plots or charts
Two examples of benchmarking against national data sets include Energy Witness’ use of CBECS data, and Energy WorkSite’s calculation of Energy Star rankings. 3.5 Financial and Advanced Energy Analyses The ability to identify corrupted or missing data is critical in EIS, given the number of performance calculations that are automated based on trended historic data, as well as the large volumes of data that are stored. Three quarters of the systems that were evaluated accommodate this capability, via three principal means: identification through flagging or summative reporting; actual cleansing and/or correction; and linking to external or third party software. Depending on the tool and the extent to which the vendor offers services data filtering and correction is purchased for additional fees, custom-defined, or out-of-the-box.
• Utility Vision, Automated Energy, Energy Witness, and ENTERPRIZE.EM identify gaps/corruption by flagging, reporting or email notification
• Energy WorkSite automates error checking, and data cleansing and interpolation • Energy ICT, PowerTrak, and Ziphany, make use of validation editing and estimation
standards (VEE) • Vykon offers configurable cleansing options in reports, and documents communication
faults to identify potentially corrupted data sets • eMetrics provides data cleansing as a service
3 www.itron.com/asset.asp?region=sam&lang=en&path=products/specsheets/itr _008021.pdf
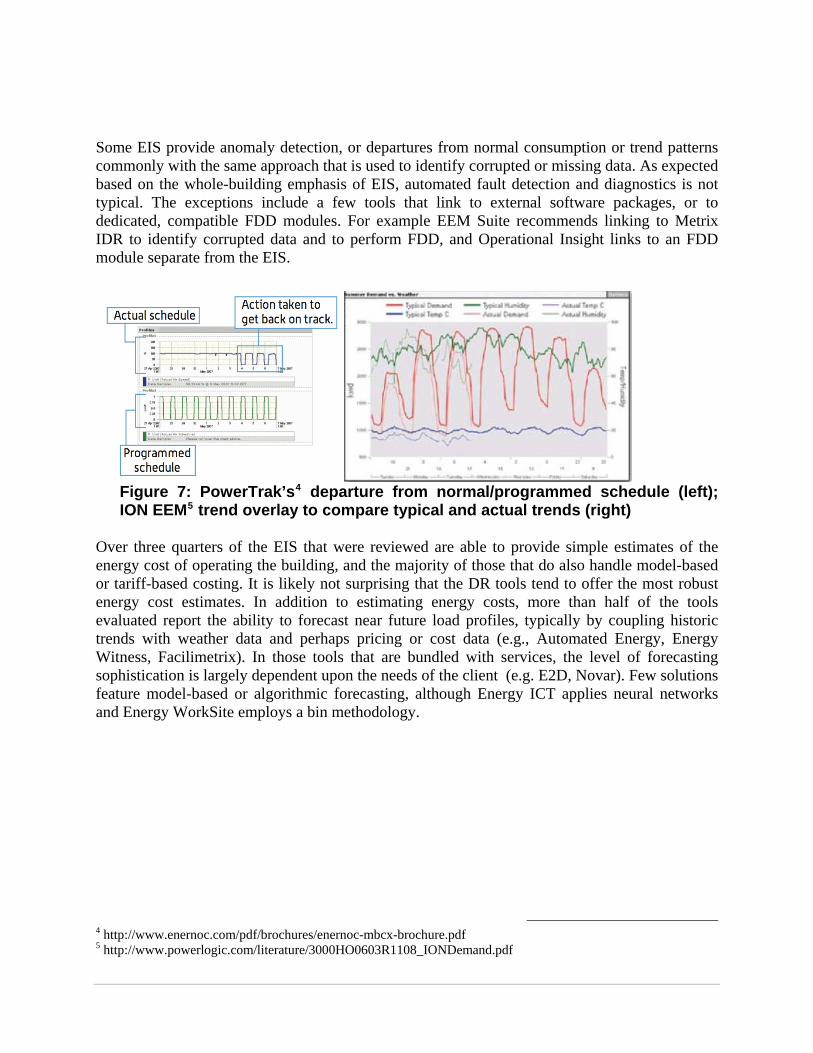
Some EIS provide anomaly detection, or departures from normal consumption or trend patterns commonly with the same approach that is used to identify corrupted or missing data. As expected based on the whole-building emphasis of EIS, automated fault detection and diagnostics is not typical. The exceptions include a few tools that link to external software packages, or to dedicated, compatible FDD modules. For example EEM Suite recommends linking to Metrix IDR to identify corrupted data and to perform FDD, and Operational Insight links to an FDD module separate from the EIS.
Figure 7: PowerTrak’s4 departure from normal/programmed schedule (left); ION EEM5 trend overlay to compare typical and actual trends (right)
Over three quarters of the EIS that were reviewed are able to provide simple estimates of the energy cost of operating the building, and the majority of those that do also handle model-based or tariff-based costing. It is likely not surprising that the DR tools tend to offer the most robust energy cost estimates. In addition to estimating energy costs, more than half of the tools evaluated report the ability to forecast near future load profiles, typically by coupling historic trends with weather data and perhaps pricing or cost data (e.g., Automated Energy, Energy Witness, Facilimetrix). In those tools that are bundled with services, the level of forecasting sophistication is largely dependent upon the needs of the client (e.g. E2D, Novar). Few solutions feature model-based or algorithmic forecasting, although Energy ICT applies neural networks and Energy WorkSite employs a bin methodology.
4 http://www.enernoc.com/pdf/brochures/enernoc-mbcx-brochure.pdf 5 http://www.powerlogic.com/literature/3000HO0603R1108_IONDemand.pdf
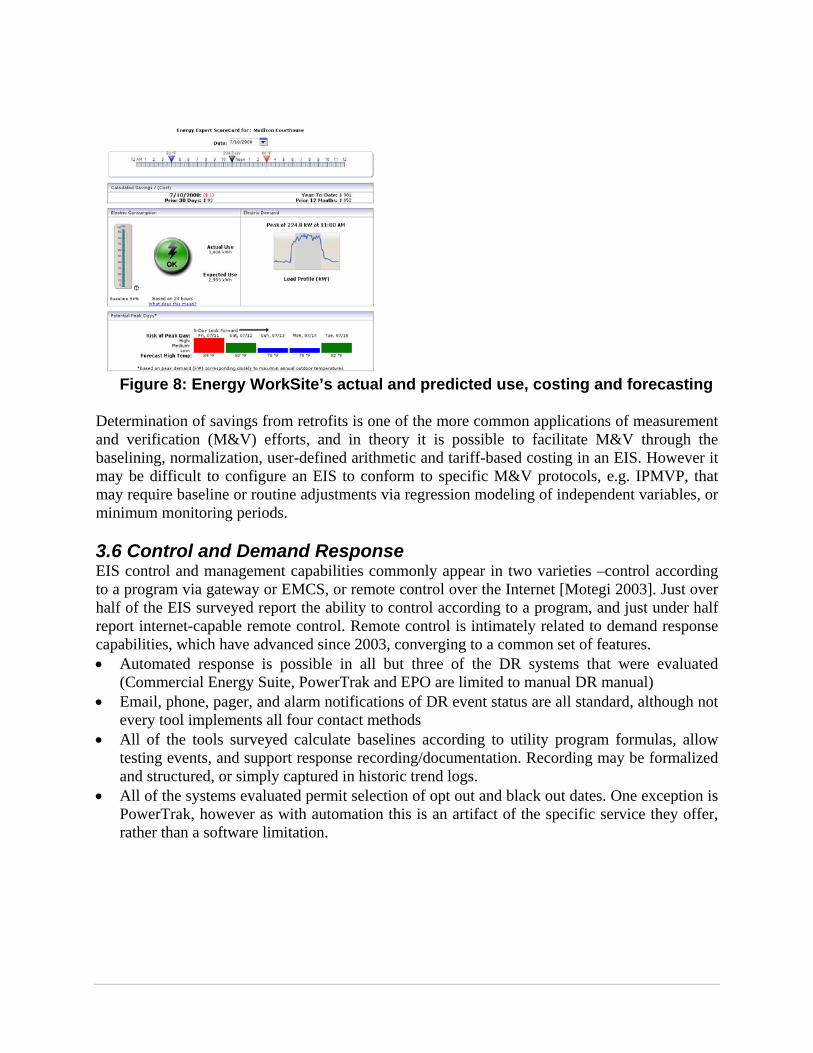
Figure 8: Energy WorkSite’s actual and predicted use, costing and forecasting
Determination of savings from retrofits is one of the more common applications of measurement and verification (M&V) efforts, and in theory it is possible to facilitate M&V through the baselining, normalization, user-defined arithmetic and tariff-based costing in an EIS. However it may be difficult to configure an EIS to conform to specific M&V protocols, e.g. IPMVP, that may require baseline or routine adjustments via regression modeling of independent variables, or minimum monitoring periods. 3.6 Control and Demand Response EIS control and management capabilities commonly appear in two varieties –control according to a program via gateway or EMCS, or remote control over the Internet [Motegi 2003]. Just over half of the EIS surveyed report the ability to control according to a program, and just under half report internet-capable remote control. Remote control is intimately related to demand response capabilities, which have advanced since 2003, converging to a common set of features. • Automated response is possible in all but three of the DR systems that were evaluated
(Commercial Energy Suite, PowerTrak and EPO are limited to manual DR manual) • Email, phone, pager, and alarm notifications of DR event status are all standard, although not
every tool implements all four contact methods • All of the tools surveyed calculate baselines according to utility program formulas, allow
testing events, and support response recording/documentation. Recording may be formalized and structured, or simply captured in historic trend logs.
• All of the systems evaluated permit selection of opt out and black out dates. One exception is PowerTrak, however as with automation this is an artifact of the specific service they offer, rather than a software limitation.

Figure 9: Ziphany’s load curtailment platform for utilities6
While the features detailed above are standard across all DR systems, the ability to predict savings from a given response is a key distinguisher of EIS capability. The near uniformity in features offered in today’s DR systems begs the question of what would expand today’s response capabilities? One potential advance is to allow for several increasingly severe DR strategies that could be implemented if the primary strategy were not effecting large enough demand reductions to meet target. In addition, calculation of DR potential or expected savings might be enhanced through model-predictive or intelligent algorithms. Ultimately, as automated DR becomes commonplace in commercial buildings, post-event rebound will become more critical, and DR systems that address rebound will be an advantage.
4.0 Discussion Energy information systems encompass a diverse set of technologies that are sold under an array of business models, with a complicated mix of features, architectures, and optional or required services. The sheer number and variety of options, in combination with rapidly advancing analytical and IT capabilities makes it difficult to distinguish one product from another or to understand the general state of the technology. In response, a framework to characterize today’s EIS market was developed and applied to several dozen commercial products. At a high level these evaluations indicated that overall, visualization and analytical features are distinguished by the degree to which they accommodate dynamic user-defined selections versus statically defined reporting, calculation, and plotting parameters. Rigorous energy analyses that include normalization, standards-based calculations, actionable anomaly detection, and forecasting are either more or less robustly integrated depending on the specific product. While exceptionally helpful in gaining an understanding of the state of the technology, individual product characterizations and conclusions regarding software capabilities do not answer questions of usability and real-world utilization. The case studies included in the scope of this study will provide some initial insights, and previous research indicates that some of the most effective use of EIS are seen in large enterprise operations and university campuses. However, it remains to be seen if other success models exist. Given the shifting composition of the EIS market and the number of EIS that offer analytical services, it is unclear what the future balance
6 http://www.ziphany.com/Files/drp-utilities.pdf

will be between on-site analysis of energy information, and outsourcing. Contemporary organizational structures do not always include roles dedicated exclusively to energy management, yet without personnel to actively engage with EIS energy information, the potential for sustained improved performance cannot be realized. It is assumed that EIS can be successfully used internally by the enterprise or site, however it may be that in the future energy/EIS service providers will perform the majority of energy analysis, with the EIS as the central link that supports the flow of information between corporate decision makers, facilities managers and operators. On a closely related theme, identifying the most suitable EIS for a given commercial building implementation must begin with a purposeful consideration of the site’s operational and energy goals. Once the immediate and longer-term needs are understood, high-priority features and functionality can help narrow down the options, and the most appropriate technology can be selected. For example, an organization that uses tailored benchmark models to gauge performance might prioritize flexible definition of metrics and calculations over dynamic configuration; a large enterprise that requires proof of savings from large retrofit initiatives may require robust baselining, data cleansing, and tariff-specific energy costing.
5.0 Future Work The full report documenting the outcomes of this work will provide further details on the characterization framework such as vendor-specific evaluations and case study findings. This research suggests a number of potential next steps for future research. Moving forward, two dependent themes merit considerable attention – usability and standardization. EIS offer a wide range of features, however it is not clear that users are universally aware of how to use these features to transform time series data into energy-saving information. Anecdotes indicate several instances in which feature-packed EIS offered by utilities have been surprisingly underused, leading to several questions. To what extent are the features in the framework used, and for what purposes? Which features are potentially useful but underutilized or not available? How can existing functionality be made more valuable? In addition to fully understanding usability, standardized metrics such as weather normalized EUIs, and common time series analyses are required so that energy use and building performance can be communicated across owners, throughout the commercial building industry. Returning to the concept of a shared information loop between owners, operators, and energy managers, there is also a need for all building stakeholders to migrate to a common language. While an operator may view a month of time series data to determine that a chiller is not running according to the intended off-hours schedule, an energy manager may observe unexpected changes in load duration, and an owner may note rises in off-peak energy costs. EIS developers will certainly play an important role in facilitating and supporting the adoption of these necessary metrics and common language to communicate building performance.
Acknowledgement Vendor participation was critical to the success of this study, and the authors wish to acknowledge their generosity and willingness to be included in this work. This work was supported by the California Energy Commission, and the California Institute for Energy and the Environment, under Contract No. MUC-08-04 and by the Assistant Secretary of Renewable Energy and Energy Efficiency, Office of the Building Technologies Program, under Contract No. DE-AC02-05CH11231. References Commercial Buildings Energy Consumption Survey (CBECS). Energy information Administration; 1992. Available from: http://www.eia.doe.gov/emeu/cbecs/detailed_tables_1992.html. Commercial Buildings Energy Consumption Survey (CBECS). Energy information Administration; 2003. Available from: http://www.eia.doe.gov/emeu/cbecs/cbecs2003/detailed_tables_2003/detailed_tables_2003.html#consumexpen03. Few, Steven. Information dashboard design: The effective visual communication of data. O’Reilly Media, Inc. 2006. Motegi, N., and Piette, M.A. Web-based energy information systems for large commercial buildings. March 29, 2003. Lawrence Berkeley National Laboratory. Paper LBNL-49977. �Available from: http://repositories.cdlib.org/lbnl/LBNL-49977. Motegi, N., Piette, M.A., Kinney, S., and Herter, K. Web-based energy information systems for energy management and demand response in commercial buildings. April 18, 2003. Lawrence Berkeley National Laboratory. Paper LBNL-52510. Available from: http://repositories.cdlib.org/lbnl/LBNL-52510.
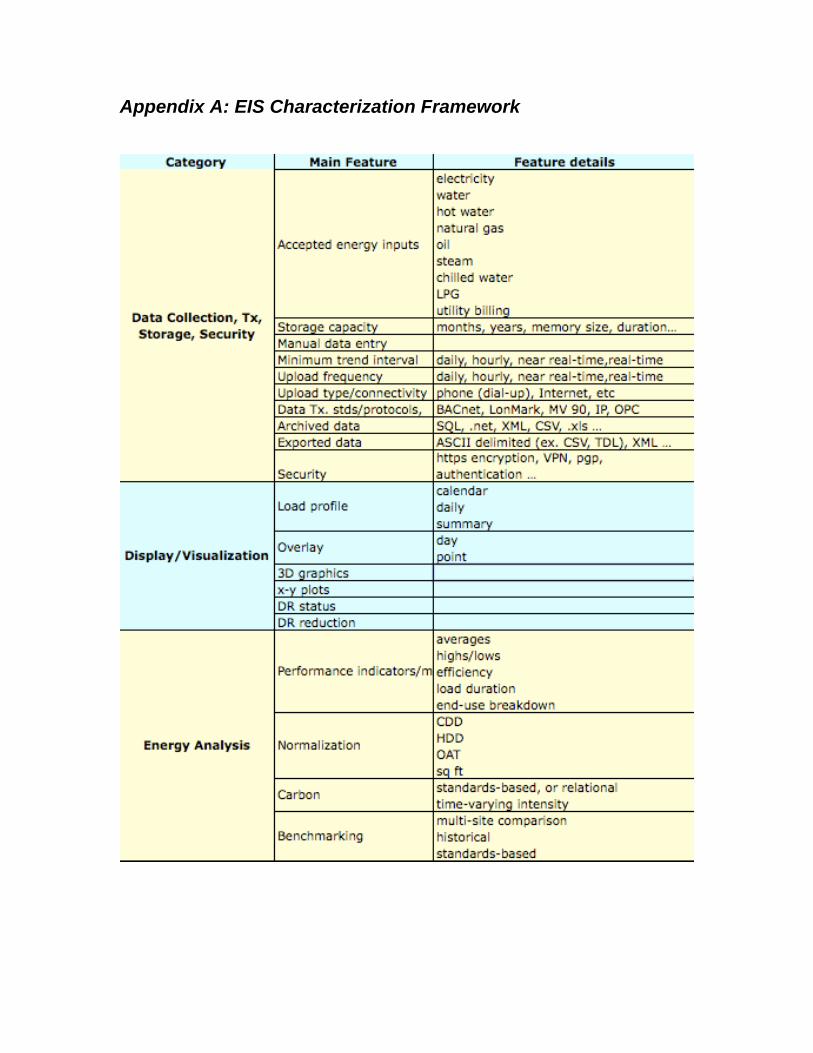
Appendix A: EIS Characterization Framework

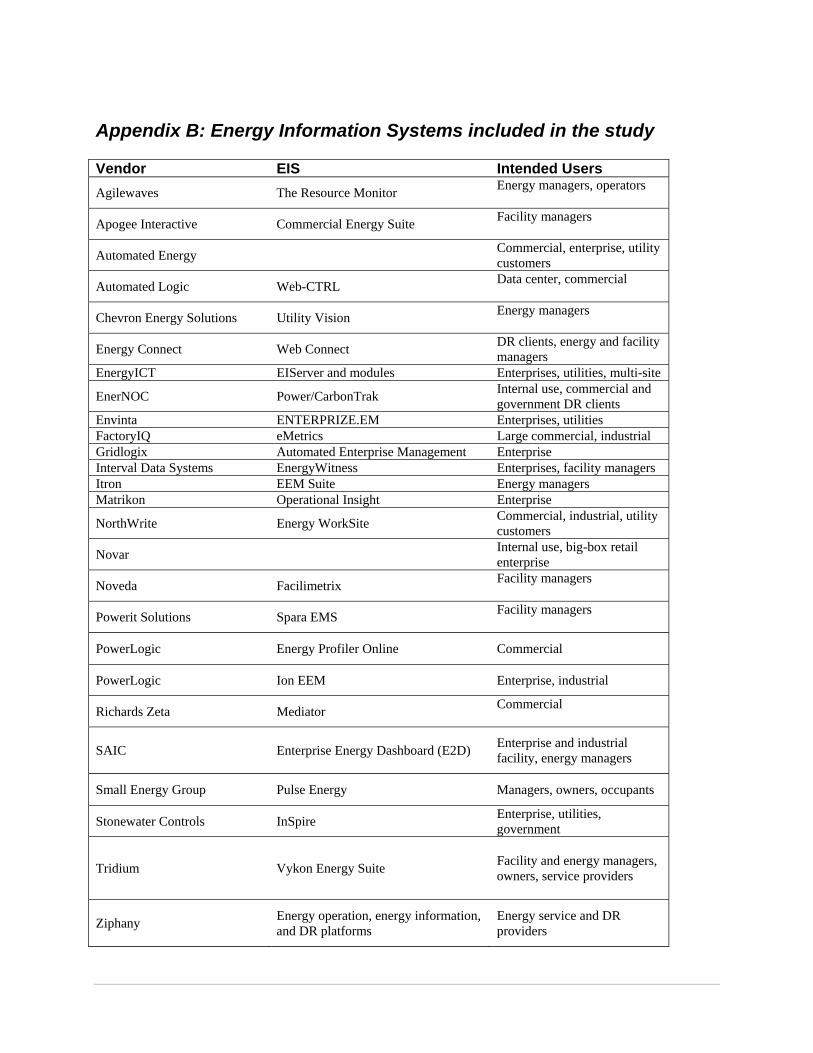
Appendix B: Energy Information Systems included in the study Vendor EIS Intended Users Agilewaves The Resource Monitor Energy managers, operators
Apogee Interactive Commercial Energy Suite Facility managers
Automated Energy Commercial, enterprise, utility customers
Automated Logic Web-CTRL Data center, commercial
Chevron Energy Solutions Utility Vision Energy managers
Energy Connect Web Connect DR clients, energy and facility managers
EnergyICT EIServer and modules Enterprises, utilities, multi-site
EnerNOC Power/CarbonTrak Internal use, commercial and government DR clients
Envinta ENTERPRIZE.EM Enterprises, utilities FactoryIQ eMetrics Large commercial, industrial Gridlogix Automated Enterprise Management Enterprise Interval Data Systems EnergyWitness Enterprises, facility managers Itron EEM Suite Energy managers Matrikon Operational Insight Enterprise
NorthWrite Energy WorkSite Commercial, industrial, utility customers
Novar Internal use, big-box retail enterprise
Noveda Facilimetrix Facility managers
Powerit Solutions Spara EMS Facility managers
PowerLogic Energy Profiler Online Commercial
PowerLogic Ion EEM Enterprise, industrial
Richards Zeta Mediator Commercial
SAIC Enterprise Energy Dashboard (E2D) Enterprise and industrial facility, energy managers
Small Energy Group Pulse Energy Managers, owners, occupants
Stonewater Controls InSpire Enterprise, utilities, government
Tridium Vykon Energy Suite Facility and energy managers, owners, service providers
Ziphany Energy operation, energy information, and DR platforms
Energy service and DR providers