Using Measures of Number Sense to Screen for Difficulties in Mathematics: Preliminary Findings David...
13
http://aei.sagepub.com/ Intervention Assessment for Effective http://aei.sagepub.com/content/30/2/3 The online version of this article can be found at: DOI: 10.1177/073724770503000202 2005 30: 3 Assessment for Effective Intervention David J. Chard, Ben Clarke, Scott Baker, Janet Otterstedt, Drew Braun and Rachell Katz Preliminary Findings Using Measures of Number Sense to Screen for Difficulties in Mathematics: Published by: Hammill Institute on Disabilities and http://www.sagepublications.com can be found at: Assessment for Effective Intervention Additional services and information for http://aei.sagepub.com/cgi/alerts Email Alerts: http://aei.sagepub.com/subscriptions Subscriptions: http://www.sagepub.com/journalsReprints.nav Reprints: http://www.sagepub.com/journalsPermissions.nav Permissions: at UNIV OF OREGON on August 3, 2011 aei.sagepub.com Downloaded from
-
Upload
independent -
Category
Documents
-
view
1 -
download
0
Transcript of Using Measures of Number Sense to Screen for Difficulties in Mathematics: Preliminary Findings David...

http://aei.sagepub.com/Intervention
Assessment for Effective
http://aei.sagepub.com/content/30/2/3The online version of this article can be found at:
DOI: 10.1177/073724770503000202
2005 30: 3Assessment for Effective InterventionDavid J. Chard, Ben Clarke, Scott Baker, Janet Otterstedt, Drew Braun and Rachell Katz
Preliminary FindingsUsing Measures of Number Sense to Screen for Difficulties in Mathematics:
Published by:
Hammill Institute on Disabilities
and
http://www.sagepublications.com
can be found at:Assessment for Effective InterventionAdditional services and information for
http://aei.sagepub.com/cgi/alertsEmail Alerts:
http://aei.sagepub.com/subscriptionsSubscriptions:
http://www.sagepub.com/journalsReprints.navReprints:
http://www.sagepub.com/journalsPermissions.navPermissions:
at UNIV OF OREGON on August 3, 2011aei.sagepub.comDownloaded from

3
Using Measures of Number Sense to Screen for Difficultiesin Mathematics: Preliminary FindingsDavid J. ChardUniversity of OregonBen Clarke and Scott Baker
Pacific Institutes for Research/University of Oregon
Janet OtterstedtPacific Institutes for Research
Drew BraunBethel School District
Rachell Katz
Pacific Institutes for Research/University of Oregon
As recent research efforts have focused on preventing reading difficulties and enhancing the effectivenessof special education services for students with reading problems, similar efforts in mathematics have notbeen realized. This article describes the development and preliminary field testing of a set of measuresdesigned to screen students in kindergarten and first grade to identify those at risk for potential mathe-matics difficulties. Evidence-based steps to streamline the screening process are described, and plans fortesting the predictive validity of the measures are outlined.
Persistent evidence that remediation effortsfor struggling learners do not result in improvedoutcomes have led to a focus on prevention of
leaming and behavioral problems before theystart (Walker et al., 1996). This preventionapproach has intensified work on the develop-ment and implementation of procedures forearly identification of students at risk for laterlearning difficulties in key academic areas suchas literacy development (Fletcher et al., 2002;Good, Simmons, & Kame’enui, 2001;Kaminski & Good, 1992). A prevention-firstapproach borrows heavily from a public healthmodel in which investments are made in pre-venting the number of new cases of a health
problem rather than waiting for the problems tooccur and then following them with less thanoptimal treatment (Simeonsson, 1994).
Currently, federally funded research cen-ters are examining the extent to which this
model is effective when applied to readinginstruction (Good, Kame’enui, Simmons, &
Chard, in preparation; Vaughn, Linan-
Thompson, & Hickman, 2003). Results ofthese studies are still emerging, but prelimi-nary findings suggest that a prevention modelas conceptualized by these research efforts
may be a promising approach to improvingliteracy outcomes for students at risk for read-ing difficulties while concomitantly decreas-ing the number of students identified and
needing special education. However, a similarapproach has yet to be studied in the area ofmathematics.
Compared to research on reading and read-ing instruction, educational research onmathematics is still in its infancy. To illustratethis point, recent meta-analyses of mathemat-ics instructional research for students with
learning disabilities or low-achieving students
at UNIV OF OREGON on August 3, 2011aei.sagepub.comDownloaded from

4
revealed fewer than 50 studies published overthe past 25 years (Baker, Gersten, & Lee,2002; Gersten, Chard, Baker, & Lee, 2002).In contrast, a report by the National ReadingPanel (2000) based on a meta-analysis of
reading instruction included many hundredsof studies. Despite the relative dearth ofresearch on mathematics instruction and
learning, the importance of early mathemati-cal development cannot be underestimated(National Research Council [NRC], 2001).There is increasing support that, like reading,mathematics proficiency is represented by acombination of important knowledge andskills, including conceptual understanding,procedural fluency, strategic competence,adaptive reasoning, and productive mathe-matical disposition (NRC, 2001).
In the primary grades, students begin todevelop a wide range of knowledge in mathe-matics, including concepts and vocabulary(e.g., more than/less than, equal), time, sim-ple measurement, two- and three-dimension-al figures, directionality, and basic operations.Despite the relatively limited knowledge baseon mathematics, some research has demon-strated that students in the primary gradeswho demonstrate later difficulties with math-ematics may, in particular, lack a strong senseof number compared to their typically devel-oping peers (Geary, Bow-Thomas, & Yao,1992). Number sense &dquo;refers to a child’s fluid-ity and flexibility with numbers, the sense ofwhat numbers mean, and an ability to performmental mathematics and to look at the worldand make comparisons&dquo; (Gersten & Chard,1999, p. 19). Early mathematical skills thathave been associated with number sense in
young children include rote counting, objectcounting, sequencing numbers, determiningwhich of two numbers is the larger, identify-ing a missing number in a sequence, deter-mining which of two numbers is closer to athird number, and counting on from a givennumber (Gersten & Chard, 1999; Griffin,1998; NRC, 2001; Siegler, 1991).Over the past 10-15 years, early reading
research has demonstrated the significance ofphonological awareness as a necessary precur-sor to the development of independent read-ing. In mathematical learning the develop-ment of number sense may play an analogousrole (Gersten & Chard, 1999). Preliminaryevidence from intervention studies that focuson number knowledge instruction (Griffin,Case, & Siegler, 1994) supports this assertion.
In preliminary research, we studied the pre-dictive validity of number knowledge assessedin kindergarten on students’ mathematicsachievement in grade 1 (Baker, Gersten, Katz,Chard, & Clarke, 2002). This predictive val-idation study utilized a nonexperimentalapproach in which students’ math skills wereassessed once at the end of kindergarten andagain at the end of first grade. Results haveshown moderately strong correlations (rang-ing from .52 to .73) between a brief kinder-garten screening measure, the Number
Knowledge Test (Okamato & Case, 1996)and a first-grade standardized measure of mathachievement, the Stanford Achievement Test(SAT 9) (Harcourt Brace Educational
Measurement, 1996a). This finding indicatesa promising direction for efficient and earlyidentification of students who may requireintervention to prevent the diagnosis of
learning disabilities in the area of mathemat-ics.
Clearly, efficacy of general and special edu-cation must be improved by shifting focusfrom remediation to prevention and betteraligning mathematics assessment and instruc-tion for students at risk for mathematical dif-ficulties. Fuchs and Fuchs (2001) have arguedthat prevention of mathematics difficultiesnecessitates a model similar to those beingtested for preventing reading difficulties. Toput a prevention system in place, we contendwill require a focus on two specific areas ofresearch and development: (a) improvementof general education instruction in mathe-
matics, and (b) an approach to assessmentthat identifies learners who are likely to strug-gle with mathematics difficulties in later
at UNIV OF OREGON on August 3, 2011aei.sagepub.comDownloaded from
5
grades and will allow teachers to monitor
individual students’ progress over time.
Unfortunately, diagnostic measures to identi-fy specific difficulties or disabilities in mathe-matics do not exist (Geary, 2004). Moreover,because mathematics disabilities are oftendefined in terms of students’ efforts to retrieveand apply basic math facts and operation,efforts to develop measures of students’
progress in mathematics have focused entirelyon basic number facts, computation, and
problem solving.To address the need for an early mathemat-
ics screening instrument, we teamed with alocal school district to field-test a set of earlymathematics measures designed to identifystudents who are likely to experience difficul-ties in later mathematics leaming. The pur-pose of this article is to describe the field-test-
ing results of these measures. Specifically, weexamined the efficacy of our potential screen-ing measures when compared to a validatedoutcome measure, the Number KnowledgeTest (Okamoto & Case, 1996). When used inour previous work (Baker et al., 2002), theNumber Knowledge Test was found to be
highly correlated with a published measure ofmathematics achievement (i.e., SAT-9;Harcourt Brace Educational Measurement,1996b) in both kindergarten and first-gradesamples.
Method
Participants
Participants were 436 kindergarten and483 first-grade students in seven schools in amedium-sized school district of 5,500 studentslocated in the Pacific Northwest. We assessedall of the students who were in the classroomsof these schools and report findings for thosestudents who were in class for the fall, winter,and spring assessments (n = 168 in kinder-garten and n = 207 in Grade 1). Across theseven schools, the percent of students whoqualified for free and reduced lunch rangedfrom 27% to 69%. Thirteen percent of the
students in the district were minorities and
approximately 4% were English languagelearners. In kindergarten and first grade, 4%and 12.6% of students were on IEPs.
Measures
Participants were administered a set of
experimental measures and one criterion
measure over the course of the study ( i.e.,from fall 2002 to spring 2003). All of theexperimental measures were administered inthe fall. Based on fall performance, a subset ofthese measures was administered again in thewinter and spring. A description of the mea-sures follows.
Experimental Screening MeasuresThe experimental measures used in this
study were based on two research literatures,number sense and curriculum-based measure-ment. Our goal was to select measures of pro-ficiency in early number skills and knowledgethat were important in the development ofsubsequent mathematics learning knowledge(e.g., counting). Early proficiency with num-ber knowledge has been identified as an
important precursor to later mathematics suc-cess (Gelman & Gallistel, 1978; Gelman &
Meck, 1983; Gersten & Chard, 1999; Griffin& Case, 1997). Geary (2004) provides a
detailed description of the conceptual devel-opment of &dquo;number&dquo; in young children. Our
thinking about the development of potentialscreening measures was also influenced byprinciples of curriculum-based measurement(Deno, 1989), which has been studied exten-sively and validated primarily in the area ofreading, where oral reading fluency has beenfound to be a consistent and excellent mea-sure of overall reading proficiency (Shinn etal., 1992).
Clarke and Shinn (in press) assessed thepsychometric properties of a set of curricu-lum-based mathematics measures in a small-scale validation study. To build an assessmenttool that would effectively screen students for
at UNIV OF OREGON on August 3, 2011aei.sagepub.comDownloaded from

6
mathematics difficulties, we combined theClarke and Shinn measures with a set of othermeasures related primarily to the concept ofnumber sense, including counting, countingon from an identified number, count bys, andnumber writing (Geary, 2004).
Counting Measures
Count to 20 (C-20) . The C-20 measuresrequired participants to orally count to 20starting with 1. No student materials wereused. An examiner recorded participantresponses by following along on a scoringsheet. Numbers that were correctly countedin sequence were scored as correct. Numbersthat were not correctly counted in sequencewere scored as incorrect. Participants wereallowed to continue counting to 20 evenwhen errors occurred in the sequence.
Count from 3 and 6 (CF3; CF6). TheCounting From measures required students tocount starting at a given number with a max-imum of five correct. For example, the partic-ipant orally counted starting at 6 for fivenumbers ( i.e., to 11). Students were stoppedonce they reached the fifth correct number.
CountBys 2, 5, and 10 (CB2: CBS: CB10).The Count By measures required participantsto count by a given number. For example,count by twos required the student to count 2,4, 6 ... with a maximum correct of 10 countbys (i.e. to 20 by twos).
Number Identification Measure 1-20
(Clarke & Shinn, in press)The Number Identification 1-20 measure
required participants to identify orally num-bers between 0 and 20 when presented with aset of printed number symbols. Participantswere given a sheet of randomly selected num-bers formatted in an 8 by 7 grid. Numbers thatwere correctly identified were counted as cor-rect. Numbers that were not correctly identi-fied or skipped were counted as incorrect. If
participants struggled or hesitated to correctlyidentify a number for 3 seconds, they were
instructed to &dquo;try the next one.&dquo; Participantperformance was reported as the total numbercorrectly identified in 1 minute. The test-
retest reliability of the Number Identication-20 measure ranged from .76 to .99, and con-current and predictive validities ranged from.60 to .72 (Clarke & Shinn, in press). A vari-ation of the Number Identification-20 mea-
sure, administered to kindergarten students,included numbers between 1 and 10 (NumberIdentification-10).
Number Writing (NW)
Participants were orally given a numberand required to write the corresponding num-ber symbol. All students were given the num-bers 1 to 20 in random order and then givenfive more random numbers from 20 to 100.
Quantity Discrimination Measure Verbal 1-20 (Clarke & Shinn, in press)
The Quantity Discrimination-V 20 mea-sure required students to name the larger oftwo visually presented numbers. Studentswere given a sheet of paper with a grid of indi-vidual boxes, each including two randomlysampled numbers from 1 to 20. Boxes in
which the student correctly identified the
larger number were counted as correct. Boxesin which the student named the smaller num-ber, named any number other than the biggernumber, or did not state a number werecounted as incorrect. If a student stopped,struggled, or hesitated for 3 seconds, the stu-dent was instructed to &dquo;try the next one.&dquo;Student performance was reported as thenumber of correctly identified larger numbersin 1 minute. The Quantity Discrimination-V-20 measure demonstrated test-retest reliabili-
ty that ranged from .85 to .99 and concurrentand predictive validity coefficients that
ranged from .70 to .80 (Clarke & Shinn, inpress).
In the fall, students were allowed to eitherpoint or respond verbally (QuantityDiscrimination-V/P) to the larger number in
at UNIV OF OREGON on August 3, 2011aei.sagepub.comDownloaded from

7
the comparison. In winter, the mode of
response (i.e., verbal or pointing) (QuantityDiscrimination-V/P) was tested experimen-tally to determine whether there was any ben-efit to allowing students to point rather thanverbalize their response. Similar to theNumber Identification measure, each of thedifferent response modes for quantity discrim-ination was also tested with a restricted rangeof numbers from 1 to 10 for kindergarten stu-dents (Quantity Discrimination-10).
Missing Number Measure Blank Varied1-20 (Clarke & Shinn, in press)The Missing Number measure required stu-
dents to name the missing number from astring of numbers between 0 and 20. Studentswere given a sheet with 21 boxes, each con-taining strings of three numbers with eitherthe first, middle, or last number of the stringmissing. Students were instructed to orallystate the number that was missing. Numbersmissing that were correctly identified werescored as correct. Numbers missing that werenot correctly identified or skipped were scoredas incorrect. If students struggled or hesitatedfor 3 seconds to correctly identify a numbermissing, they were provided the number bythe examiner and instructed to &dquo;try the nextone.&dquo; Subject performance was reported as
the number of missing numbers correctlyidentified in 1 minute. The Missing Number-BV-20 measure demonstrated test-retest relia-
bility coefficients ranging from .78 to .98 andconcurrent and predictive validity coeffi-cients ranging from .67 to .78. Variations ofthe Missing Number measure included a mea-sure in which the missing blank was always inthe last position of the number string(Missing Number-BE) and a measure in
which the range of numbers used was between1 and 10 (Missing Number-BV 10).
Criterion Measure
To determine the degree to which the
experimental measures accurately identify
early mathematics difficulties, we selected atechnically adequate criterion measure of
early number sense. This measure is describedbelow.
Number Knowledge Test (Okamoto &
Case, 1996)
The Number Knowledge Test (Okamoto &Case, 1996) has been used to chart children’sdevelopmental profiles of numerical compe-tency (Okamoto & Case, 1996) and to studythe effect of math instruction on kinder-
garteners from low-SES families (Griffin,1998). Administered individually, this mea-sure allows the tester to understand the
&dquo;depth of understanding of numbers&dquo; (Griffin,1998, p. 1) that a student has developed relat-ed to a particular concept.The Number Knowledge Test was used to
assess students’ conceptual and proceduralknowledge of numbers. Students answerednumber knowledge questions at increasinglevels of difficulty. The first level, which con-sisted of four items, began by asking the stu-dents to count five chips. The next two levelseach consisted of nine items, some with two
parts. Students were required to answer bothparts correctly in order to earn credit for eachtwo-part item. The final and most difficultitem consisted of &dquo;How much is 47 take away21 ?&dquo;
The interview nature of the Number
Knowledge Test allowed the tester to probestudents’ knowledge networks to determinethe level of their understanding on each con-cept. Its informal nature was ideal for 5- and
6-year-olds. Appropriate ceilings were estab-lished and, depending on the performance ofthe student, the measure was administered in4-6 minutes. Each correct item received ascore of 1 and the total score consisted of thesum of all completed levels.
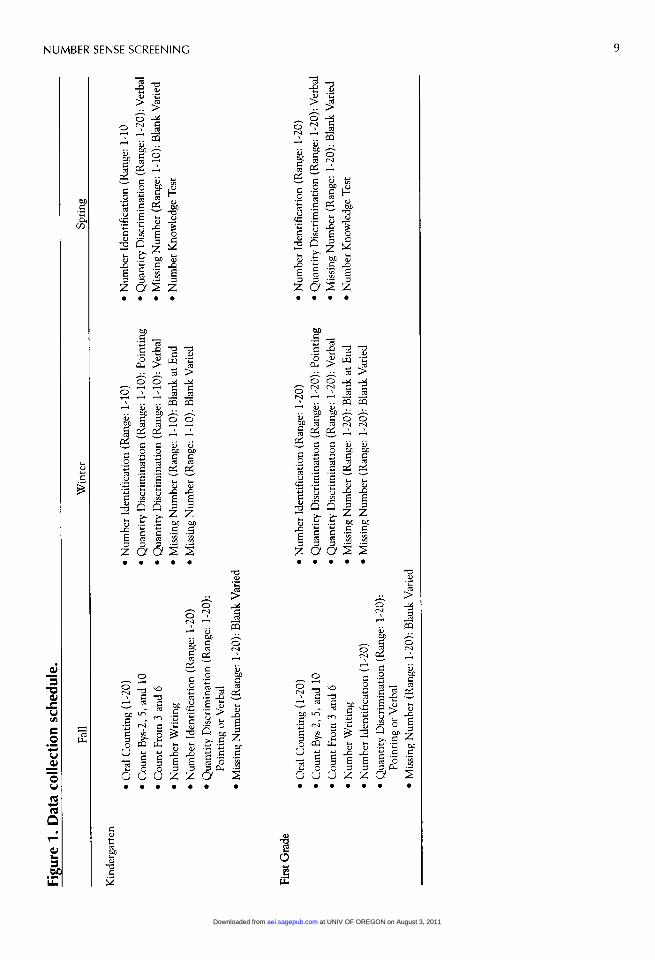
Data Collection
Data were collected three times during2002-2003 academic year in September (fall),
at UNIV OF OREGON on August 3, 2011aei.sagepub.comDownloaded from
8
January (winter), and May (spring), with
approximately 16 weeks between data collec-tion periods. The data collection schedule is
displayed in Figure 1.Examiners with a background in early
childhood assessment were trained to admin-ister and score the experimental and criterionmeasures. The training session consisted ofinstruction on administering the measures
according to standardized directions and fol-lowing standard protocols for scoring themeasures. Data collectors were observed
administering and scoring each measure, andappropriate feedback was provided. Feedbackincluded what to do when students failed to
supply an answer ( i.e., wait 3 seconds andthen ask the student to move to the next
stimulus) or when students skipped items
(i.e., mark them as incorrect.). Followuptrainings were conducted prior to each datacollection period.
Preliminary FindingsOur goal was to evaluate the effectiveness
of a set of early mathematics measures thatmight be administered in the fall of kinder-garten and first grade to screen students forpotential mathematics difficulties. As part ofthis screening battery, we wanted measuresthat were relatively quick to administer,showed potential for administration at both
kindergarten and first grade, and demonstrat-ed the potential to assess student growth overthe course of the year.The first level of analysis was to calculate
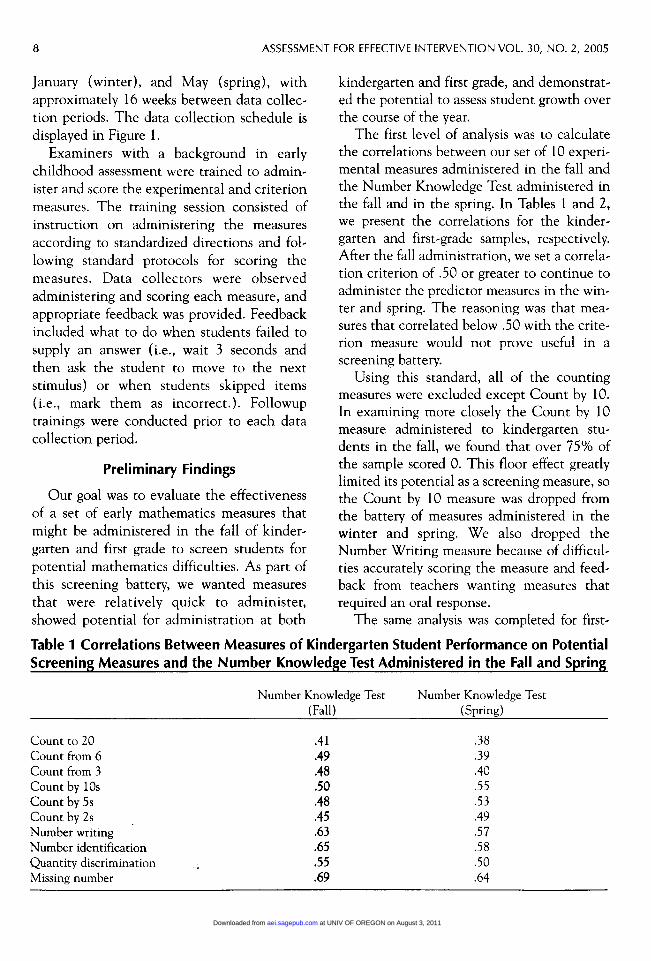
the correlations between our set of 10 experi-mental measures administered in the fall andthe Number Knowledge Test administered inthe fall and in the spring. In Tables 1 and 2,we present the correlations for the kinder-
garten and first-grade samples, respectively.After the fall administration, we set a correla-tion criterion of .50 or greater to continue toadminister the predictor measures in the win-ter and spring. The reasoning was that mea-sures that correlated below .50 with the crite-rion measure would not prove useful in a
screening battery.Using this standard, all of the counting
measures were excluded except Count by 10.In examining more closely the Count by 10measure administered to kindergarten stu-
dents in the fall, we found that over 75% ofthe sample scored 0. This floor effect greatlylimited its potential as a screening measure, sothe Count by 10 measure was dropped fromthe battery of measures administered in thewinter and spring. We also dropped theNumber Writing measure because of difficul-ties accurately scoring the measure and feed-back from teachers wanting measures thatrequired an oral response.The same analysis was completed for first-
Table 1 Correlations Between Measures of Kindergarten Student Performance on PotentialScreening Measures and the Number Knowledge Test Administered in the Fall and Spring
at UNIV OF OREGON on August 3, 2011aei.sagepub.comDownloaded from
9
6&dquo;’5*ca~
uU)
c0
°011w
..S~Õw
~3
(Za
4ciam
. LXLL.
at UNIV OF OREGON on August 3, 2011aei.sagepub.comDownloaded from
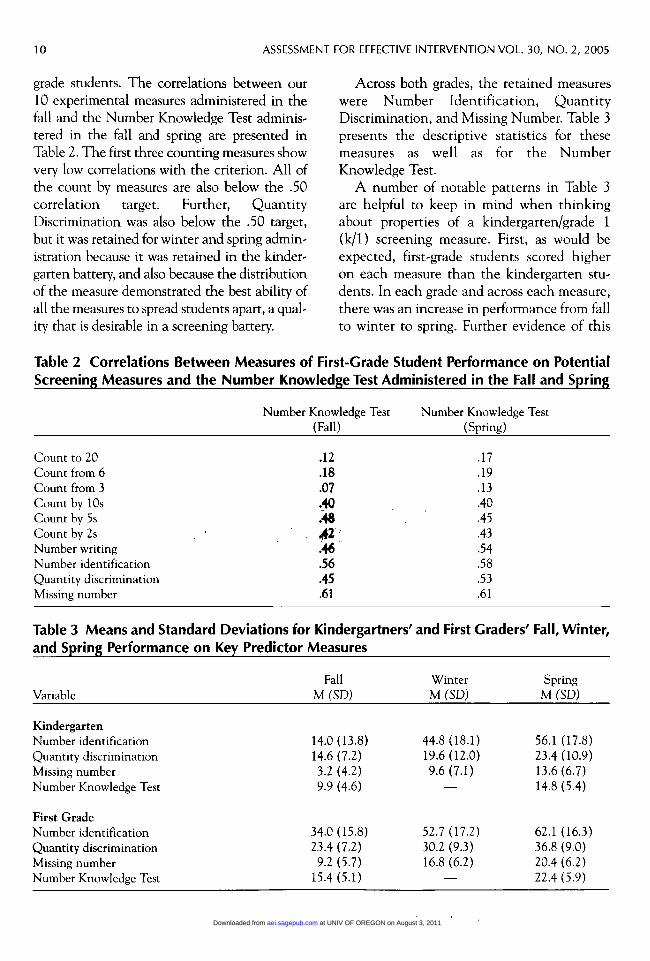
10
grade students. The correlations between our10 experimental measures administered in thefall and the Number Knowledge Test adminis-tered in the fall and spring are presented inTable 2. The first three counting measures showvery low correlations with the criterion. All ofthe count by measures are also below the .50correlation target. Further, QuantityDiscrimination was also below the .50 target,but it was retained for winter and spring admin-istration because it was retained in the kinder-
garten battery, and also because the distributionof the measure demonstrated the best ability ofall the measures to spread students apart, a qual-ity that is desirable in a screening battery.
Across both grades, the retained measureswere Number Identification, QuantityDiscrimination, and Missing Number. Table 3presents the descriptive statistics for thesemeasures as well as for the Number
Knowledge Test.A number of notable patterns in Table 3
are helpful to keep in mind when thinkingabout properties of a kindergarten/grade 1
(k/1 ) screening measure. First, as would beexpected, first-grade students scored higheron each measure than the kindergarten stu-dents. In each grade and across each measure,there was an increase in performance from fallto winter to spring. Further evidence of this
Table 2 Correlations Between Measures of First-Grade Student Performance on Potential
Screening Measures and the Number Knowledge Test Administered in the Fall and Spring
Table 3 Means and Standard Deviations for Kindergartners’ and First Graders’ Fall, Winter,and Spring Performance on Key Predictor Measures
at UNIV OF OREGON on August 3, 2011aei.sagepub.comDownloaded from

11
school-based performance factor is that per-formance in the spring of kindergarten is
higher on each measure than is performancein the fall of first grade. Since these are cross-sectional data, it is not possible to state thatfor specific students there was a decrease inperformance from spring of kindergarten tothe fall of first grade, but it plausible to con-clude that the summer off from school mayhave an adverse effect on performance onthese measures. In other words, there is evi-
dence that the measures are sensitive to
school effects.A second interesting pattern is that only
Number Identification showed substantial
growth from fall to spring. This change factorrelates to a measure’s ability to index the
progress students make over time. Measureswhere there is more change from one point intime to another have more potential to effec-tively measure student progress because thereis more room to identify change in perfor-mance over time. Quantity Discriminationand Missing Number show less change fromfall to spring and, therefore, may not be assensitive to the actual learning that occurswithin students over time. In addition, it is
interesting to note that the magnitude of thechange differences is similar in kindergartenand first grade across the three measures fromfall to winter to spring.
To further determine how well our set of
potential screening measures, administered inthe fall, were able to account for variance onthe Number Knowledge Test administered inthe spring, we conducted a linear multiple-regression analysis on the kindergarten andfirst-grade data. In both samples, the three pre-dictor measures entered into the regressionwere Missing Number, Number Identification,and Quantity Discrimination. The criterion
measure was performance on the Number
Knowledge Test administered in the spring. Inkindergarten, a model with two predictor mea-sures, Missing Number and QuantityDiscrimination, was statistically significant (F =
63.0, df (2, 165), R = .66, p < .01). Since this is
a kindergarten sample, and the predictor mea-sures were administered early in the school year,we felt the amount of variance accounted forwas substantial.
With the grade-1 sample, the combinationof predictor measures that accounted for thelargest amount of variance on the NumberKnowledge Test in the spring included allthree measures. Together, Missing Number,Number Identification, and QuantityDiscrimination were statistically significant,meaning that all three measures accounted for
significant and unique variance in theNumber Knowledge Test (F = 59.2, df (3,203), R = .683, p < .01). As with the kinder-garten sample, we felt the amount of varianceaccounted for by these relatively brief mea-sures was substantial.
Discussion
As a result of an expanding research basedetailing the difficulty in remediatingachievement gaps in reading (Torgesen, 2002;Vaughn, Linan-Thompson, & Hickman,2003), fundamental changes in the teachingand assessment of reading have occurred.Educational researchers, program developers,and teachers have renewed efforts to focus on
early intervention reading services for stu-
dents who may be at risk for later reading fail-ure. A prerequisite to the provision of earlyliteracy instruction was a correspondingassessment system that could both identifystudents most at risk for reading difficulty andmonitor their growth toward critical early lit-eracy outcomes predictive of later readingsuccess.
Similar assessment systems have not been
developed in mathematics. A primary purposeof the research described in this article, there-fore, was to develop a measure or set of mea-sures to be used in screening kindergarten andfirst-grade students who might be at risk forlater difficulties in mathematics. Different
types of measures were explored. After pre-liminary analysis in the fall, a set of potential
at UNIV OF OREGON on August 3, 2011aei.sagepub.comDownloaded from

12
measures emerged. Each of these measureswas a short-duration fluency-based measuredesigned to meet several critical features(Fuchs & Fuchs, 1999) and to function asboth an indicator of overall early math per-formance and a tool to monitor growth overtime. The measures, Number Identification,Quantity Discrimination, and MissingNumber (collectively Early NumeracyCurriculum-Based Measurement; EN-CBM )had previously been researched with first-
grade students only (Clarke & Shinn, in
press).Clarke and Shinn (in press) offered evi-
dence of the reliability (alternate form, test-retest, interrater) and validity (concurrentand predictive) of the EN-CBM measureswith first-grade students. Although reliabilitydata were not collected, the results from thepresent study replicate the findings of theClarke and Shinn study with first graders andprovide preliminary evidence of predictiveand concurrent validity with kindergartenstudents. In addition, preliminary evidenceindicates that each measure demonstrated
varying capacity to index growth over theduration of the school year. For example,Number Identification scores increased by42.1 and 28.1 for kindergarten and first-gradestudents, respectively, from fall to spring. Thisfinding replicates and expands the findings ofClarke and Shinn.
While the current study and previous workoffer a starting point, further questions remainto be answered. Foremost among these ques-tions is the need to replicate reliability findingswith first-grade students and collect initial reli-ability data with kindergarten students. From avalidity standpoint, future research should focuson examining predictive validity across multi-ple school years. Our ongoing program ofresearch will allow us to examine these ques-tions by conducting followup data collectionwith kindergarten and first-grade students asthey advance through the early elementarygrades. Evidence that the EN-CBM measurespredict achievement on high-stakes outcomes
in later grades (e.g., state benchmark tests)would offer a compelling reason for schools touse EN-CBM measures to identify at-risk stu-dents and provide them with intensive inter-vention services. While each measure can beexamined individually, analysis utilizing multi-ple regression would provide insight into thebest combinations of measures that allow accu-rate and meaningful predictions regarding a stu-dent’s at-risk status.
Determining which combination of mea-sures &dquo;work best&dquo; requires not only statisticalanalysis but consideration of other factors aswell. For example, while multiple regressionshowed statistical significance in predictingspring Number Knowledge Test scores fromQuantity Discrimination and MissingNumber for kindergarten students in the fall,the role of Number Identification should notbe discounted without additional evidence.Number Identification demonstrated the
greatest growth over time and, thus, its valueas a tool to monitor progress should be takeninto consideration when designing a measure-ment net for early mathematics. In addition,future decisions about the suitability of eachmeasure must consider reliability, validity,ability to identify students at risk for furtherdifficulties, and ability to monitor progress.
The multiple factors that must be consideredwhen selecting and evaluating early math mea-sures demonstrate the complexity of early mathresearch programs. While the research programdescribed in this article is in its infancy, thepotential applications of developing a compre-hensive assessment system for early mathemat-ics to make valid and reliable screening andprogress monitoring decisions offers a numberof exciting possibilities. Foremost among thesepossibilities is the opportunity to increase thelikelihood that all children will become suc-cessful with mathematics.
References
Baker, S., Gersten, R., Katz, R., Chard, D. J., & Clarke,B. (2002). Preventing mathematics difficulties in youngchildren: Focus on effective screening of early number
at UNIV OF OREGON on August 3, 2011aei.sagepub.comDownloaded from

13
sense delays (Technical Report #0305). Eugene, OR:Pacific Institutes for Research.
Baker, S., Gersten, R., & Lee, D. (2002). A synthesis ofempirical research on teaching mathematics to lowachieving students. Elementary School Journal, 103,45-74.
Clarke, B., & Shinn, M. R. (in press). A preliminaryinvestigation into the identification and develop-ment of early mathematics curriculum-based mea-surement. School Psychology Review.
Deno, S. L. (1989). Curriculum-based measurement andspecial education services: A fundamental and directrelationship. In M. Shinn (Ed.). Curriculum-basedmeasurement: Assessing special children (pp. 1-17).New York: Guilford Press.
Fletcher, J. M., Foorman, B. R., Boudousquie, A.,Bames, M. A., Schatschneider, C., & Francis, D. J.(2002). Assessment of reading and learning disabili-ties : A research-based intervention-oriented
approach. Journal of School Psychology, 40, 27-63.Fuchs, L. S., & Fuchs, D. (2001). Principles for the pre-
vention and intervention of mathematics difficulties.
Learning Disabilities Research & Practice, 16(2), 85-95.Fuchs, L. S., & Fuchs, D. (1999). Monitoring student
progress toward the development of reading compe-tence : A review of three forms of classroom-basedassessment. School Psychology Review, 28, 659-671.
Geary, D. C. (2004). Mathematics and learning disabil-ities. Journal of Learning Disabilities, 37, 4-15.
Geary, D. C., Bow-Thomas, C. C., & Yao, Y. (1992).Counting knowledge and skill in cognitive addition:A comparison of normal and mathematically dis-abled children. Journal of Experimental Child
Psychology, 54, 372-391.Gelman, R., & Gallistel, C. R. (1978). The child’s under-
standing of number. Cambridge, MA: Harvard
University Press.Gelman, R., & Meck, E. (1983). Preschooler’s counting:
Principles before skill. Cognition, 13, 343-359.Gersten, R., & Chard, D. (1999). Number sense:
Rethinking arithmetic instruction for students withmathematical disabilities. Journal of SpecialEducation, 33(1), 18-28.
Gersten, R., Chard, D. J., Baker, S., & Lee, D. (2002).A synthesis of empirical research on teaching mathemat-ics to students with learning disabilities. Los Alamitos,CA: Instructional Research Group.
Good, R. H., Kame’enui, E. J., Simmons, D. C., &
Chard, D. J. (in preparation). Using DynamicIndicators of Basic Early Literacy Skills in a schoolwidemodel for primary, secondary, and tertiary prevention.Eugene: University of Oregon.
Good, R. H., Simmons, D. C., & Kame’enui, E. J.(2001). The importance and decision-making utilityof a continuum of fluency-based indicators of foun-
dational reading skills for third-grade high-stakesoutcomes. Scientific Studies of Reading, 5(3), 257-288.
Griffin, S. (1998, April). Fostering the development ofwhole number sense. Paper presented at the AmericanEducational Research Association, San Diego, CA.
Griffin, S., & Case, R. (1997). Re-thinking the primaryschool math curriculum: An approach based on cog-nitive science. Issues in Education, 3(1), 1-49.
Griffin, S., Case, R., & Siegler, R. S. (1994). Rightstart:Providing the central conceptual prerequisites forfirst formal learning of arithmetic to students at riskfor school failure. In K. McGilly (Ed.). Classroomlessons: Integrating cognitive theory and classroom prac-tice (pp. 25-49). Cambridge, MA: MIT Press.
Harcourt Brace Educational Measurement. (1996a).Stanford Achievement Test-Ninth Edition [SAT-9].Orlando, FL: Harcourt.
Harcourt Brace Educational Measurement. (1996b).Stanford Early School Achievement Test-Fourth Edition[SESAT-2]. Orlando, FL: Harcourt.
Kaminski, R. A., & Good, R. H. (1996). Toward a tech-nology for assessing basic early literacy skills. SchoolPsychology Review, 25, 215-227.
National Reading Panel. (2000). Report of the NationalReading Panel: Teaching children to read: An evidence-based assessment of the scientific research literature onreading and its implications for reading instruction.
Washington, DC: National Institute of Child Healthand Human Development.
National Research Council. (2001). Adding it up:Helping children learn mathematics. J. Kilpatrick, J.Swafford, & B. Findell (Eds.). Mathematics LearningStudy Committee, Center for Education, Division ofBehavioral and Social Sciences and Education.
Washington, DC: National Academy Press.Okamoto, Y., & Case, R. (1996). Exploring the
microstructure of children’s central conceptual struc-tures in the domain of number. In R. Case & Y.
Okamoto (Eds.), The role of central conceptual structuresin the development of children’s thought: Monographs of theSociety for Research in Child Development (Vol. 1-2, pp.27-58). Malden, MA: Blackwell Publishers.
Shinn, M. R., Good, R. H., Knutson, N., & Tilly, W. D.(1993). Curriculum-based measurement of oral read-ing fluency: A confirmatory analysis of its relation toreading. School Psychology Review, 21(3), 459-479.
Siegler, R. S. (1991). In young children’s counting, pro-cedures precede principles. Educational PsychologyReview, 3, 127-135.
Simeonsson, R. J. (1994). Promoting children’s health,education, and well-being. In R. J. Simeonsson
(Ed.), Risk, resilience, & prevention (pp. 3-11).Baltimore: P. H. Brooks.
Torgesen, J. K. (2002). The prevention of reading diffi-culties. Journal of School Psychology, 40, 7-26.
at UNIV OF OREGON on August 3, 2011aei.sagepub.comDownloaded from

14
Vaughn, S., & Fuchs, L. (2003). Redefining learningdisabilities as inadequate response to instruction:
The promise and potential problems. LearningDisabilities Research and Practice, 18, 137-146.
Vaughn, S., Linan-Thompson, S., & Hickman, P.
(2003). Response to instruction as a means of iden-tifying students with reading/learning disabilities.
Exceptional Children, 69, 391-409.Walker, H. M., Horner, R. H., Sugai, G., Bullis, M.,
Sprague, J. R., Bricker, D., et al. (1996). Integratedapproaches to preventing antisocial behavior pat-terns among school-age children and youth. Journalof Emotional and Behavioral Disorders, 4, 194-209.
at UNIV OF OREGON on August 3, 2011aei.sagepub.comDownloaded from