Force and position control of grasp in multiple robotic mechanisms
Nuurops?chol,,gro, Val 30, No. IO, pp. 877-897, ,992 PrInted in Great Br,ta,n
0028-3932192 S5.OO+OOC ‘c 1992 Pergamn Press Ltd
PREHENSION MOVEMENTS DIRECTED TO APPROACHING OBJECTS: INFLUENCE OF STIMULUS VELOCITY ON THE
TRANSPORT AND THE GRASP COMPONENTS
S. CHIEFFI, L. F~GASSI, V. GALLESE and M. GENTILUCCI*
Istituto di Fisiologia Umana, Universita di Parma, via Gramsci 14, 43100 Parma, Italy
(Receiwd 11 October 1991; accepted 10 June 1992)
Abstract--In this investigation we studied the influence of object velocity on the transport and on the grasp components of prehension movements directed to approaching objects. Three experiments were carried out. In the first experiment six subjects were required to reach and grasp a sphere that approached them with a constant velocity. The effects of four velocities were studied. The results showed that the end point of the arm movement changed with object velocity: nearer the body with higher than with lower object velocities. Transport velocity increased with movement amplitude and the deceleration phase decreased in duration with higher object velocities. On the contrary the grasp component was not affected by object velocity. The second experiment was a control experiment carried out in order to verify whether a possible influence of object velocity on the grasp could be revealed in an experimental condition in which grasp planning relies without doubt on visual computation of all object features. In this experiment object velocity and object size were randomly varied. The results showed that the grasp was not influenced by object velocity, whereas it was sensitive to changes of object size. The third experiment had the two-fold aim of establishing (1) whether transport velocity was influenced by object velocity once the location in space at which the object had to be grasped was fixed and (2) whether the grasp kinematics differed for prehension movements directed respectively to stationary or to moving objects. Results showed that the first part of the transport is affected only by distance, whereas the deceleration phase decreased with increasing object velocity. This last result suggests that subjects minimized object displacements in order to grasp the sphere correctly. The grasp component differed between the conditions of stationary and moving stimuli only in the relative timing between finger aperture and closure phases. The closure phase decreased in the condition of moving stimuli. The results of the three experiments indicate the dependence of transport parameters on object velocity, whereas grasp parameters appear to be unaffected.
INTRODUCTION
IT HAS BEEN HYPOTHESIZED that two distinct visualkmotor channels are involved in planning prehension movements directed to visual stimuli [l]. The first channel is involved in programming arm proximal movements (the transport component) necessary to bring the hand from the starting position to the location of the object to be grasped. The second channel is responsible for selecting the type ofgrip congruent with size and shape of the object and for planning the execution of finger movements (the grasp component). Kinematic [9-l l] and electrophysiological[7,8, 14, 163 studies have shown that the two visual-motor channels extract different attributes from the object in order to plan the two components. The transport channel derives extrinsic (spatial position) object properties. The grasp channel derives intrinsic (size and shape) object properties.
*Address for correspondence: M. Gentilucci, Istituto di Fisiologia Umana, Universitii di Parma, via Gramsci 14, 43100 Parma, Italy.

878 S. CHIEFFI et ul
The above cited kinematic studies have postulated the dependence of the transport component on extrinsic object properties (spatial object location) and the dependence of the grasp component on intrinsic object properties (object size) on the basis of the findings that transport velocity increases proportionally with object distance and maximal finger aperture increases proportionally with object size [9-l 11.
These studies have dealt with prehension movements directed to stationary stimuli, but not to moving stimuli. Up to now the possible influence of stimulus velocity on the transport and grasp components has not been addressed. The present study was designed to determine how arm reachingggrasping movements directed to an approaching object are organized. Our hypothesis was that stimulus velocity, as object extrinsic property, would have influenced the transport component, but not the grasp component.
Three experiments were carried out. In the first experiment we studied the kinematics of reaching-grasping movements directed to an object approaching the subject with different constant velocities. If, as hypothesized, the transport component is influenced by object velocity, then movement amplitude and/or arm velocity might be modified. If movement amplitude varies then arm velocity might also change, as a consequence. Indeed it has been found that arm velocity increases proportionally with movement amplitude [S, 6,11,13, IS]. Alternatively, subjects might reach the moving object at the same distance regardless of stimulus velocity. In this case arm velocity would be directly influenced by object velocity. According to our hypothesis, stimulus velocity, as extrinsic object property, should not influence the grasp component. Variation in object velocity should not modify maximal finger aperture and the temporal relations between finger aperture and closure phases.
The results of experiment 1 showed that movement amplitude and arm velocity of the transport component varied with object velocity, whereas the grasp component remained unmodified. On the basis of these results we carried out two experiments. The experiment 2 was a control experiment in which the possible effects due to the knowledge of object size on the grasp planning were prevented by randomly presenting moving objects with different sizes. The results ofthis experiment confirmed that the grasp kinematics are not influenced by object velocity. The experiment 3 aimed (1) to determine whether arm velocity is modified by object velocity when the location at which subjects are asked to reach and grasp the object is kept constant, and (2) to determine whether the grasp component kinematics planned for moving objects are different from those planned for stationary objects.
The results of the three experiments indicated that the kinematics of the transport component are affected by object velocity, whereas the shaping of the grip is independent from this extrinsic property of the object.
EXPERIMENT 1
Subjects. Six right-handed male students (age 20 25) participated in the experiment. All of them were naive as to the purpose of the experiment.
Apparatus und procedure. The subjects sat on a comfortable chair with their trunk fastened to its back. Their right hand rested on a table at a fixed position (hand starting position), placed along the subject’s sagittal axis. The distance along the sagittal axis between a reference point put on the styloid process of the radius at the wrist and another reference point put on the trunk was 28 cm. The forearm was flexed about 80’) the hand was in line with the forearm, prone and holding the index finger and thumb in pinch position.
The stimulus was a plastic sphere (diameter 4 cm) placed on a carrier. The carrier was driven by an electrical motor towards the subject at four constant velocities (Vl =25 cm,‘sec; V2=38 cmjsec; V3 =51 cm/set; V4=64 cmisec) along a fixed straight track put on the table. The movement of the sphere was along the subject’s

PREHEiGSlOK MOVEMFNTS DIRECTED TO APPROA(‘HI~G OHIFCTS 879
sagittal axis. Only the stimulus and not the carrier could be seen from the subject. Each trial began when the sphere was suddenly presented through a screen located at I15 cm far from the hand starting position. White noise was delivered to the subject through headphones in order to prevent velocity discrimination based upon the noise produced by the electrical motor of the carrier.
The experimental session consisted of 40 successive trials (10 trials for each velocity). The sequence of stimulus velocities was randomized.
Subjects were instructed to reach and grasp the object as fast and accurately as possible and to bring it back to the hand starting position.
Moremrnr rt,cording crnd data analy.sis. Hand movements and stimulus movements ofeach trial were recorded and analysed with the ELITE system 131. This system consists of two infrared TV cameras (sampling rate 50 Hz) and a processor. The TV-cameras were 3 m away from the working space where the apparatus w’as placed. The cameras were 3 m apart and were inclined at 30 on the vertical axis. The vvorking space was a parallelepiped I50 cm long, 120 cm high and 30 cm deep. The length and the height of the parallelepiped coincided approximately with the subject’s sagittal and vertical axes respectively.
The cameras were connected to the processor which computed the position of body points on which passive markers were placed. The markers were plastic spheres (I cm diameter) covered with reflecting material. The ELITE processor elaborated the video images in real time and recognized the shape of the markers. The coordinates of the marker centroids were sent to a host computer (PDP I I :53). The host computer performed in succession the following operations: (a) three-dimensional reconstruction of the marker positions; (b) data filtering using a FIR linear filter (2); (c) computation of the following kinematic parameters; trajectory, movement. linear velocity and acceleration. The first marker was placed on the trunk, in order to have a fixed reference point. The second marker was placed on the styloid process of the radius at the wrist. The third and the fourth markers were placed on the tips of the index finger and the thumb respectively. Finally, the lifth marker was placed on the moving stimulus.
The marker placed on the subject’s wrist was used to analyse the kinematics (movement amplitude, velocity, acceleration) of the transport component. This marker was used as reference point to localize the hand starting position and also served to measure the end point of the prehension movement. The end point was calculated as difference between the position of the sphere when it was reached and grasped and the hand starting position. The grasp component was studied by analysing the time course of the distance between the tips of the thumb and index finger, on which two markers were placed.
Since the spatial error of the ELITE system measured on a stationary stimulus is 0.4 mm, transport and grasp movements were considered to start and to stop in those frames in which the marker displacement was greater and lesser than 0.4 mm. respectively. These frames were used to compute time data.
Results
Transport component. Figure 1 shows representative examples of the wrist trajectory in the sagittal plane during reachingggrasping movements directed to the approaching object with the four examined velocities. VI corresponds to the lowest velocity and V4 to the highest one. The curves are approximately parabolic. Note that movement amplitude increases with lower velocities.
Figure 2 shows a representative example of velocity profiles in the four conditions. Note that peak velocity increases with lower object velocity. No secondary submovements were observed in velocity profiles.
Table 1 shows the kinematic parameters of the transport component studied in this experiment. Repeated measure analyses of variance (ANOVA) were performed on them. The main factor was Object Velocity. Separate ANOVAs carried out on movement amplitude and transport time showed that both parameters increased significantly as Object Velocity decreased [movement amplitude: F(3, 15)= 19.30, P<O.OOl; transport time: F(3, 15)= 16.42, P<O.OOl]. Object Velocity influenced significantly also the end point [F(3, 15)= 10.05, P<O.OOl]. Subjects reached and grasped the sphere nearer when the stimulus velocity was higher.
Peak velocity varied significantly with Object Velocity [F (3, 15)= 6.72, P<O.O05]. It increased with lower object velocity. The same result was found also for peak acceleration [F(3, 15)=9.33, P<O.OOl].
The variations of transport peak velocity could be correlated with the changes of movement amplitude [S, 6, 11, 13, 181. We calculated the correlation coefficients between

880 s. '.?HltPbI Pt a/
25
25
Vl 25
E 0
---.
0-’ I 1
cm 30 0 cm 30
v2
-
Fig. 1, Representative examples of transport component trajectories. Four individual movements are represented in the sagittal plane (Subject Max). Vl corresponds to the lowest object velocity. V4 to the highest one. The abscissa corresponds to the subject’s sagittal axis, the ordinate to the subject’s
vertical axis.
peak velocity and movement amplitude over all trials and separately for each subject. As can be seen in Table 2 the coefficients are high in all subjects.
The time to peak velocity (Tl) remained constant in the four conditions [F (3, lS)=O.lO] whereas time after peak velocity (T2) [F (3, 15)=44.44, P<O.OOl] and its percentage with respect to transport time (%T2) [F(3, lS)= 16.33, Pt0.0011 decreased with higher velocities.
Since the end point was farther from the subject with lower than with higher object velocities, it could be that the subject started to move when the stimulus was at a fixed distance from the hand starting position (object distance at the movement initiation) regardless of object velocity. In Table 1 (first row) the values of object distances at the movement initiation in the four conditions are shown. ANOVA showed that this parameter varied significantly with Object Velocity [F (3, 1.5) = 4.7 1, P < 0.021. Object distance at the movement initiation was farther with higher than with lower velocities.
Grasp component. The subjects grasped the approaching objects, using the thumb and the index finger. Figure 3 shows a representative example of the time course of the distance between the tips of the thumb and index finger in the four conditions. The kinematic parameters of the grasp component are shown in Table 1. Grasp time, like transport time, increased significantly with lower object velocities [F (3, 15)= 11.50, P<O.OOl]. Maximal finger aperture [F (3, 15)=0.08] and the percentage of time to maximal finger aperture [F (3, 15)= 1.011 were not significantly influenced by Object Velocity.
Discussion
The results of experiment 1 indicate that object velocity influenced the transport component. Both movement amplitude and peak velocity increased with lower stimulus velocity. The variations of peak velocity could be related to the variations of movement amplitude [S, 6, 11, 13, IS]. This interpretation is supported by the high significance of the

PREHENSION MOVEMENTS IIIRECTED TO APPROACHING OBJE(‘TS X81
130
P F
6
0
130
x F
6
0
Vl 130, v2
/\ ;/\
1 msec 500
I I 0 msec 500
A, ‘.A , msec 500 0 msec 500
Fig. 2. Representative examples of transport tangential velocity profiles. Four individual movements, corresponding to the four experimental conditions, are represented (same movements as in Fig. I). The zel-o value in the time axis corresponds to the arm movement onset. Other conventions as in
Fig. I.
correlation coefficients between the two parameters. However it cannot be excluded that wrist velocity might have been also influenced by object velocity prr se, independently of variations in movement amplitude.
The temporal relations between the acceleration and deceleration phases were affected by object velocity. The deceleration phase decreased, both in absolute value and in percentage terms, with increasing object velocity, when movement amplitude also decreased. Previous experiments have shown that the deceleration phase in pointing and reaching--grasping movements decreases with lower movement amplitudes [S, 203. However the variations observed in our experiment were greater than those previously reported for prehension movements [S].
In accordance with the hypothesis that extrinsic object properties are not computed by the visual-motor channel of the grasp component, variations of object velocity did not modify the grasp component. Maximal finger aperture and the percentage of time to maximal finger aperture did not change with variations in object velocity.
The results of experiment 1 left some questions unanswered. The first question was whether grasp kinematics are really independent of object velocity. In experiment 1 subjects could have had the opportunity to learn the size of the object, and consequently they could have ignored the visual information about it. If this was the case, the grip scaling could have remained unchanged with variations of object velocity because the grasp planning was not driven by visual information. To prevent this effect we carried out a control experiment

882 S. CHIEFFI rf al.
Table I, Mean of medians* (S.D.) of the kinematic parameters of the transport and the grasp components measured in experiment I
VI v2 V3 v4
Object distance at the movement initiation (mm)
End point (mm)
Movement amplitude (mm)
Transport time (msec)
Peak velocity (cm/set)
Peak accclcration (cm;scc’)
Time to peak velocity (msec)
Time after peak velocity (T?) (mscc)
O/UT2
Grasp time (msec)
Maximal finger aperture (mm)
Percentage of time to maximal fngcr aperture
S.D. of maximal finger aperture (mm)
526.2
(34.9) 433.2 (44.X) 264.2 (35.2)
410.0 (59.3) 130.8 (27.2)
1092.7 (345.6) 211.7 (34.9 I 196.3 (25.3) 4x.0 (3.7)
420.0 (70.4) 112.1 (15.2) 56.3 (3.2) 4.6
(0.9)
521.7 (33.9) 384.5 (26.5) 231.9 (26.X) 373.3 (54.3) 11X.7 (19.0) 999.9
(312.7) 200.0 (31.6) 176.3 (27.3) 46.X (2.8)
383.3 (60.9) 1 I I .4 (15.7) 58.2
(4.3) 4.6
(1.4)
550.9 (49.1) 369.3 (35.3) 214.6 (32.9) 365.0 (43.7) 113.5 (23.4) 952.3
(330.5) 201.7 (27.1) 162.1 (29.6) 43.6
(5.2) 366.7 (30.8) 112.2 (14.5) 57.9
(3.3) 5.1
(I .4)
563.5 (53.7) 344.5 (35.3) lY3.7 (32.X) 355.0 (48.9) 107.4 (25.6) X66.X
(315.9) 20x.3 (27.1) 14x.2 (24.4) 41.7
(3.3) 350.0 (41.9) I1 1.7 (13.3) 58.5
(2.7) 4.2
(1.3)
*Except last row: Means of S.D.
Table 2. Correlation coefficients between transport peak velocity and movement amplitude (experiment 1)
Subject 1 2 3 4 5 6
0.79 0.8 I 0.88 0.85 0.88 0.73
(experiment 2) in which object velocity and object size were randomly varied. In this way subjects were forced to use visual information to drive the grasp movement.
The second question was whether arm velocity is directly influenced by object velocity. This issue was addressed in the experiment 3 by studying transport kinematics when the subjects were required to reach and grasp approaching objects at predetermined locations. In this way we attempted to avoid movement amplitude effects on transport velocity.
EXPERIMENT 2
Subjects. Six new right-handed male university students (age 22 30) participated in the experiment. All of them were nai’ve as to the purpose of the experiment.
Appurulus und procedure. The apparatus was the same as in experiment 1. The subjects were required to reach and grasp an approaching object. the size of which was varied during the experimental session. Three plastic spheres of

PREHENSION MOVEMENTS DIRECTEIJ TO APPROACHING ORJECTS 883
11% Vl 115- v2
6 5 __
3 o- ,P, 30 0 ms?c 500
_P, 0 msec 500
11 5
k
30
v3
P
11 t
:
1 30 tnsec 500 msec 5ClO
Fig. 3. Representative examples of time course of grip in the four experimental conditions (same movements as in Fig. 1). Other conventions as in Fig. 2.
different diameters were used as target of the prehension movement. The small sphere had a diameter of 3 cm (S I). the middle sphere of4 cm (the same object used in experiment 1) (S2). the large one of 5 cm (S3). Our prediction was that the grip scaling would have shown significant variations for this difference ofsphere diameter, according to the results of a previous investigation [12]. Moreover an unique type of grasping, in which the thumb and the index linger are only employed, could be easily used for these dimensions of the stimulus. The use of an unique type of grasping would have allowed a precise comparison of finger shaping among the grasps of different objects. The sphere approached the subject with the lowest (VI) or the highest velocity (V4) used in experiment 1. Both object size and object velocity were randomly varied during the experiment.
Six conditions were studied: small stimulus moving with velocity VI; small stimulus moving with velocity V4: middle stimulus moving with velocity Vl; middle stimulus moving with velocity V4: large stimulus moving with velocity VI; large stimulus moving with velocity V4.
M~W~WU rc~rdin~/ unrl rlutu unal~sis. Ten trials of each condition were recorded and analysed using the ELITE system (3). Five markers positioned as in experiment I were used.
Data analysis was the same as in experiment I.
Results
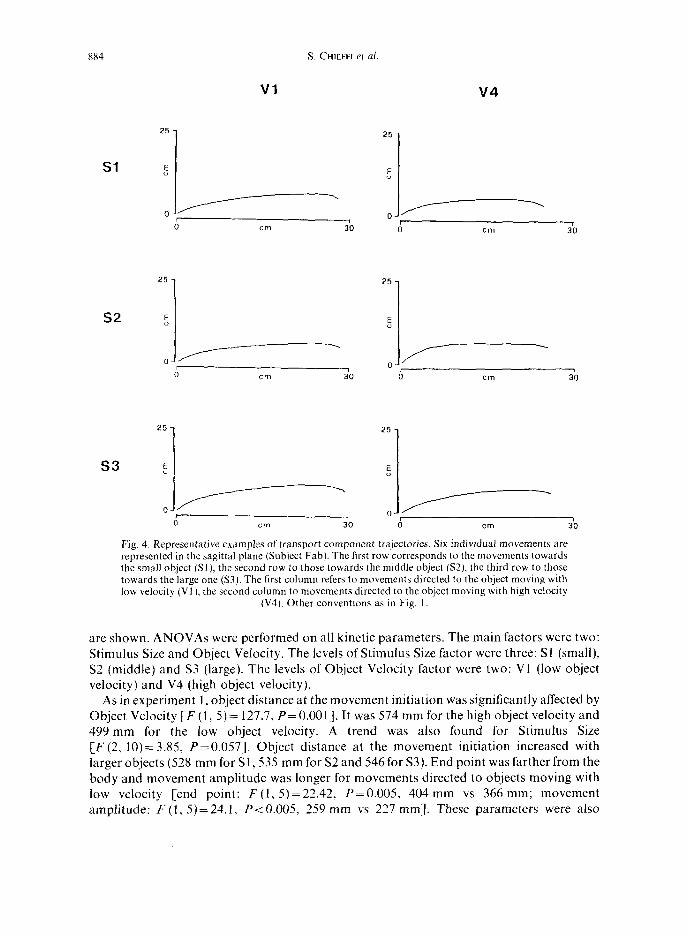
Trunsporf componenf. Representative examples of wrist trajectory and wrist velocity profiles are shown in Figs 4 and 5, respectively. The upper row shows the movements towards the small stimulus (Sl). The middle and lower rows show the movements towards the middle (S2) and large (S3) object, respectively. The first column refers to movements directed to the stimulus moving with low velocity (Vl); the second column to movements directed to the stimulus moving with high velocity (V4). Note that movement amplitudes and peak velocities decrease for movements directed to the objects moving with the high velocity and to the smaller stimuli.
In Table 3 the kinematic parameters of the transport component studied in this experiment
884 S. CHIEFFI et al.
Vl v4
25
Sl ,E I
o&------ , 0 cm 30
25 7
s2 u E
“-7 I 0 ,
cm 30
25 -
s3
:_y------ 0 cm 30
25
E ”
1 0 ,v 1
0 cm 30
25 -
E ”
,/------ 1
0 cm 30
---.
0 cm 30
Fig. 4. Representative examples of transport component trajectories. Six individual movements are represented in the sagittal plane (Subject Fab). The first row corresponds to the movements towards the small object (Sl), the second row to those towards the middle object (SZ), the third row to those towards the large one (S3). The first column refers to movements directed to the object moving with low velocity (VI), the second column to movements directed to the object moving with high velocity
(V4). Other conventions as in Fig. I.
are shown. ANOVAs were performed on all kinetic parameters. The main factors were two: Stimulus Size and Object Velocity. The levels of Stimulus Size factor were three: St (small), S2 (middle) and S3 (large). The levels of Object Velocity factor were two: Vl (low object velocity) and V4 (high object velocity).
As in experiment 1, object distance at the movement initiation was significantly affected by Object Velocity [F (1, 5) = 127.7, P=O.OOl]. It was 574 mm for the high object velocity and 499 mm for the low object velocity. A trend was also found for Stimulus Size [F(2, 10)=3.85, P=O.O57]. Object distance at the movement initiation increased with larger objects (528 mm for Sl, 535 mm for S2 and 546 for S3). End point was farther from the body and movement amplitude was longer for movements directed to objects moving with low velocity [end point: F (1, 5) =22.42, P=O.O05, 404 mm vs 366 mm; movement amplitude: F (1, 5)= 24.1, P<O.O05, 259 mm vs 227 mmJ. These parameters were also

PKEHENSION MOVEMENTS DIRECTED TO APPROACHING OBJECTS xx5
150
Sl P P E ”
a
Vl
150
1-
ii
2
\ , 0
msec 500
V4
1507
s2 f
o_,A , 0 msec 500
150-
x ? E 0
olth , 0 rns?c 500
0
Fig. 5. Representative examples of transport tangential velocity profiles in the six experimental conditions (same movements as in Fig. 4). The zero value in the time axis corresponds to the arm
movement onset. Other conventions as in Fig. 4.
influenced by the size of the object [end point: F (2, 10)=4.25, P-cO.05, 374 mm for Sl vs 386 mm for S2 vs 393 mm for S3; movement amplitude: F (2, lo)= 3.62, P=O.O66,236 mm for Sl vs 245 mm for S2 vs 248 mm for S3].
Transport time was only influenced by Object Velocity [F (1, 5)= 17.35, P~0.01, 372 msec for Vl and 354 msec for V43. Peak velocity was significantly higher with low object

886 S. CHIEFFI et ul.
Table 3. Means of medians* (S.D.) of the kinematic parameters of the transport and the grasp components measured in experiment 2
Object distance at the movement initiation (mm) End point
(mm) Movement amplitude (mm) Transport time (msec) Peak velocity (cm;sec) Peak acceleration (cm,‘sec’) Time to peak velocity (msec) Time after peak velocity (T2) (msec) XT2
Grasp time (msec)
Maximal finger aperture (mm) Percentage of time to maximal finger aperture S.D. of maximal finger aperture
(mm)
Sphere with diameter of 3 cm Sphere with diameter of 4 cm Sphere with diameter of 5 cm Stimulus Stimulus Stimulus Stimulus Stimulus StimUllls
moving at low movmg at high moving at low moving at high movmg at low moving at high velocity (VI) velocity (V4) velocity (VI) velocity (V4) velocity (VI ) velocity (V4)
492.2 (29.8) 395.6 (37.6) 254.3 (44.1) 380.0 (30.0) 135.8 (28.0)
1123.2 (338.6) 206.0 (26.0) 170.0
(8.0)
45.1 (3.5)
414.0 (48.0) 95.6
(11.7) 57.4
(7.6)
3.9
(0.X)
563.3 (48.2) 353.3 (50.8) 217.3 (52.8) 352.0 (20.0) 123.7 (32.8)
1057.4 (322.7) 214.0 (32.0) 136.0 (14.0)
40.1
(4.6) 390.0 (64.0) 97.9
(13.0) 55.9
(4.9)
4.4
(1.7)
497.5 (26.2) 402.0 (27.8) 259.0 (37.6) 368 .O (28.0) 139.6 (25.2)
1197.4 (269.1) 204.0 (24.0) 168.0 (12.0)
45.2 (2.9)
420.0
(6.0) 103.7 (11.3) 55.5 (4.3)
3.8
(1.4)
573.6 (40.4) 370.6 (39.9) 231.5 (46.3) 352.0 (24.0) 130.2 (30.9)
1089.2 (334.0) 206.0 (30.0) 142.0 (14.0)
41.6
(5.0) 400.0 (70.0) 105.4 (11.9) 55.7
(4.0)
3.9
(0.4)
506.8 (22.1)
413.8 (22.9) 263.7 (37.2) 370.0 (34.0) 141.2 (28.7)
1216.0 (326.9) 206.0 (12.0) 164.0 (18.0)
44.8
(3.0) 414.0 (70.0) 113.3 (12.0) 59.9
(8.0)
5.2
(2.0)
585.8 (24.8) 373.5 (35.2) 233.2 (41.8) 356.0 (36.0) 130.8 (28.6)
1113.3 (288.1) 210.0 (24.0) 142.0 (10.0)
39.3 (4.0)
444.0 (40.0) 113.9 (11.5) 54.3
(5.8)
3.9
(1.2)
*Except last row: Means of S.D.
velocity [F (1, 5)= 10.80, P<O.O5, 139 vs 128 cm/set] and with the larger stimuli [F (2, 10) = 5.26, P < 0.05, 130 vs 135 vs 136 cm/set]. As in experiment 1, peak velocity was significantly correlated to movement amplitude (see Table 4). Peak acceleration was significantly affected by Object Velocity [F (1, 5)= 12.3, P<O.O5,1179 vs 1087 cm/set’] and Stimulus Size [F (2, 10) = 4.1, P=O.O5, 1090 vs 1143 vs 1164 cm/sec2] in the same way as peak velocity.
Table 4. Correlation coefficients between transport peak velocity and movement amplitude (experiment 2)
Subject 1 2 3 4 5 6
0.80 0.88 0.52 0.89 0.65 0.55
PKEHENSION MOVEMENTS DIKtCTED TO APPKOACHING OBJECTS 887
Time to peak velocity was affected neither by Object Velocity [F (1, 5) =0.69] nor by Object Size [F (2, 10) = 0.303. Time after peak velocity (T2) and its percentage with respect to transport time (%T2) were significantly affected only by Object Velocity [T2: F (1, 5) = 39.4, P<O.O25; %T2: F (1, 5)= 13.5, P<O.O5]. There was a decrease of deceleration phase with the high object velocity [T2: 168 vs 140 msec; %T2: 45.1 vs 40.31.
Grusp component. The subjects grasped the three spheres using the thumb and the index finger. In Fig. 6 representative examples of the time course of grasp in the six conditions examined in experiment 2 are presented. Note that maximal finger aperture is greater with larger stimuli whereas it does not change when the object moved with different velocities. Table 3 shows the values of kinematic parameters of the grasp. Maximal finger aperture increased significantly with the increase of object size [F (2, 10)=96.3, P<O.OOOl; 96.8 vs 104.6 vs 113.5 mm]. Post-hoc comparisons (Newman-Keuls) showed a significant difference (PcO.01) between the three values. As in experiment 1, maximal finger aperture was not significantly affected by Object Velocity [F (1, 5) = 3.33. The percentage of time to maximal finger aperture was influenced neither by Object Velocity [F (1, 5) = 1.261 nor by Stimulus Size [F (2, 10)=0.2]. No other significances were found for grasp parameters.
Discussion
The main aim ofexperiment 2 was to verify whether the grasp kinematics might show some effects to changes of object velocity when subjects undoubtedly use visual information about all object features to drive the finger shaping. To this purpose we varied randomly both object size and object velocity. Results showed that maximal finger aperture was not affected by object velocity. It was sensitive only to stimulus size. As found in a previous experiment [ 123, the variation ofmaximal finger aperture was of about 0.8 cm for variations in the object diameter of 1 cm. The percentage of time to maximal finger aperture was not influenced by object velocity.
The comparison between the standard deviations of maximal grip aperture in experiments 1 and 2 (see last row of Table 1 and Table 3) can give an insight on the question whether the grasp planning in experiment 1 relies on visual information about object size. In the first experiment. in which object size was constant, a stereotyped maximal finger aperture could be automatically repeated if, after learning, intrinsic object properties were not visually analysed. On the contrary in the second experiment, in which object size was randomly varied, a different maximal finger aperture had to be planned trial by trial, after visual object size analysis. Consequently, if this hypothesis is correct, the variability of maximal finger aperture should have been higher in the experiment 2 than in experiment 1. This was not the case. As one can see in Tables 1 and 3, the standard deviations in the two experiments are comparable. Thus it is reasonable to suppose that also in experiment 1 subjects used visual information to reprogram the finger shaping after each trial.
The transport component was affected by object velocity in the same way as in experiment 1. Moreover it was also influenced by object size. The end point was nearer the body and peak velocity decreased for movements directed to smaller objects. The changes of peak velocity were likely the consequence of the variations in movement amplitude. Indeed the two parameters were significantly correlated (see Table 4). The finding that object size influences the transport component confirms the results of previous experiments in which peak velocity changed for prehension movements directed to objects with different sizes [S,

888 S. CHIEFFI et al
Vl v4
Sl
s2
s3
12 07 12.0-
3P , :F 0 msec
500 , 0 msec 500
12 o- 12.0-
3P ( 0 l”SK 500 :_p , 0 ms?c 500
120
,E
32
P 12.0
:
1 32 :-
\
0 msec 500 0 msec 500
Fig. 6. Representative examples of time course of grip in the six experimental conditions (same movements as in Fig. 4). Other conventions as in Fig. 5.
12, 13, 17, 181. In these experiments in which the target was stationary the variations of the Index of Difficulty (see FITTS’ law [4]) related to different object sizes determined a change of arm velocity. In our experiment in which objects with different sizes were moving it is likely that movement amplitude was varied in order to maintain constant the Index of Difficulty.

PREHENSION MOVEMENTS DIRECTED TO APPROACHING OBJECTS 889
EXPERIMENT 3 Methods
Subjects. Six new right-handed male university students (age 20-24) participated in the experiment. All of them wcrc nai’ve as to the purpose of the experiment.
Apparatus and procedure. The apparatus was the same as in experiment I. The subjects were required to reach and grasp the same stimulus used in experiment 1 at each of two fixed locations. The locations were marked on the track along which the sphere approached the subject. These locations were chosen by using the values of the end points obtained in experiment 1, for the lowest (V 1) and the highest (V4) object velocity. The value of the end point relative to the highest object velocity (V4) was 34.4 cm (Dl), the value relative to the lowest object velocity (Vl) was 43.3 cm
(D2). For each subject two blocks of IO trials (stationary stimulus) and two blocks of 20 trials (moving stimulus) were
run. In the blocks with stationary stimuli subjects were required to reach and grasp the object placed either at distance Dl or D2. In the blocks with moving stimuli subjects were required to reach and grasp the moving object at one of the two locations marked on the table. The sphere approached the subject with Vl or V4 velocity randomly presented. The order of the blocks was counterbalanced across subjects.
Six conditions were studied: distance Dl-stationary stimulus (VO); distance Dl-stimulus moving with velocity VI: distance Dl-stimulus moving with velocity V4; distance D2-stationary stimulus (VO); distance D2-stimulus moving with velocity VI; distance DZ-stimulus moving with velocity V4.
Mowment ram-ding and datu anal~,sis. Ten trials of each condition were recorded and analysed using the ELITE system [3]. Five markers positioned as in experiment 1 were used. Another marker (marker 6) was placed either at DI or at D2 according to the distance used on that trial. Marker 6 and the marker placed on the sphere were used to measure the error in the trials during which the sphere approached the subject.
Data analysis was the same as in experiments 1 and 2.
Results
Trunsport component. Representative examples of wrist trajectory and wrist velocity profiles are shown in Figs 7 and 8, respectively. The upper row shows the movements towards the near target location (Dl). The lower row shows the movements towards the far target location (D2). The first column refers to movements directed to the stationary stimulus (VO). The second and third columns refer to movements directed to the stimulus approaching with low (VI) and high (V4) velocity, respectively. Note that peak velocity increased with distance, but it was not modified by object velocity. Submovements in velocity profiles were not observed.
Table 5 shows the kinematic parameters of the transport component studied in this experiment. ANOVAs were performed on all kinematic parameters. The main factors were two: Object Velocity and Distance. The levels of Object Velocity factor were three: VO (stationary stimulus); Vl (low object velocity); V4 (high object velocity). The levels of Distance factor were two: Dl (near position); D2 (far position).
Object Velocity had a significant effect on movement amplitude [F(2, IO)= 14.44, P=O.OOl]. Post-hoc comparisons (Newman-Keuls) showed that movement amplitude was shorter in condition V4 than in conditions VO and V 1 (P < 0.05). No differences were found between conditions VO and Vl. Thus the subjects undershot the target when the object had the high velocity. An ANOVA was computed on movement errors measured as the difference between the position of the sphere along the sagittal axis at the moment when it was reached and the position of the marker placed in the predetermined position. The main factors were Distance (Dl and D2) and Object Velocity (Vl and V4). Object Velocity main effect was significant [F(l, 5)=46.98, P~O.0011. The movement error was -0.9 cm in condition VI and -2.5 cm in condition V4. The Distance x Velocity interaction showed a trend to be significant [F ( 1, 5) = 4.98, P= O.OS]. Post-hoc comparisons (Newman-Keuls) revealed that the error was significantly greater in condition D2V4 (P~0.05) than in the other conditions. The error was greater when the object moving with high velocity had to be grasped at the far djstarice. In this condition task difficulty was the greatest because subjects were required to

vo
Vl
v4
25
25 E 0
257
25
D2
6 E u
0-y
O-
0 cm
30
25 E u
25 E 0
-
1 0
cm
30
-
cm
3’0
Fig.
7.
Rcp
rcsc
ntat
ive
exam
ples
of
tra
nspo
rt
com
pone
nt
traj
ecto
ries
. Si
x in
divi
dual
m
ovem
ents
ar
e re
pres
ente
d in
the
sag
ittal
pl
ane
(Sub
ject
Pi
e).
The
fir
st r
ow
corr
espo
nds
to
the
mov
emen
ts
tow
ards
th
e ne
ar
obje
ct
(Dl)
, th
e se
cond
ro
w
to t
hose
to
war
ds
the
far
one
(D2)
. T
he t
hree
co
lum
ns
refe
r to
mov
emen
ts
dire
cted
to
sta
tiona
ry
(VO
), a
ppro
achi
ng
with
lo
w
(VI)
an
d hi
gh
velo
city
(V
4) o
bjec
t. O
ther
co
nven
tions
as
in
Fig.
1.

D2 {
0
PKEHFTSION MOWMENTS I~IKECTEU TO APPKOACHING OHJFCTS
vo Vl
1 msec 500
A 130
u 9
6
0
x91
v4
,- ’ 7
A 1
Fig. 8. Representative examples of transport tangential velocity profiles in the six experimental conditions (same movements as m Fig. 7). The zero values in the time axis corresponds to the arm
movement onset. Other conventions as in Fig. 7.
reach and grasp the object moving with the highest velocity at a location farther than that spontaneously selected from subjects in experiment I.
Transport time increased significantly with Distance [F (I, 5) = 14.62, P~0.02; 325.5 vs 359.4 msec:] and decreased with Object Velocity although only a trend was found [F (2, 10) = 3.96, P = 0.0641. The main effect of Distance was significant for transport peak velocity [F (1, .5)= 153.65, P<O.OOl]. Peak velocity was 112.8 cm/set at Dl distance and 144.5 cm/set at D2 distance. Peak velocity remained constant with Object Velocity [F (2, 10) = 0.921. Also transport peak acceleration was influenced significantly by Distance [F (1, 5) = 29.85, P < O.OOS], but not by Object Velocity [F (2, 10) = 2.841. Peak acceleration was 1045.7 cm/set’ at Dl distance and 1290.8 cm/set* at D2 distance.
A significant main effect of Distance was found for the time to peak velocity [F (1, 5) = 7.98, PC 0.051. The values of this parameter were 184.4 msec for distance Dl and 192.8 msec for distance D2. The time after peak velocity (T2) was influenced by both Distance [F(l, 5)=11.29, P-co.021 and Object Velocity [F(2, 10)=15.06, P<O.OOl]. It increased with distance (141 .l vs 160.0 msec) and decreased with object velocity (174.2 vs 150.8 vs 126.7 msec). The same results were obtained for the percentage of time after peak velocity (%T2) [F (1, 5)=9.96, P-cO.025, for Distance; F (2, lo)= 12.28, P<O.O02, for Object Velocity). There was an increase of XT2 with distance (41.9 vs 44.6%) and a decrease
892 S. CHIEFFI et al.
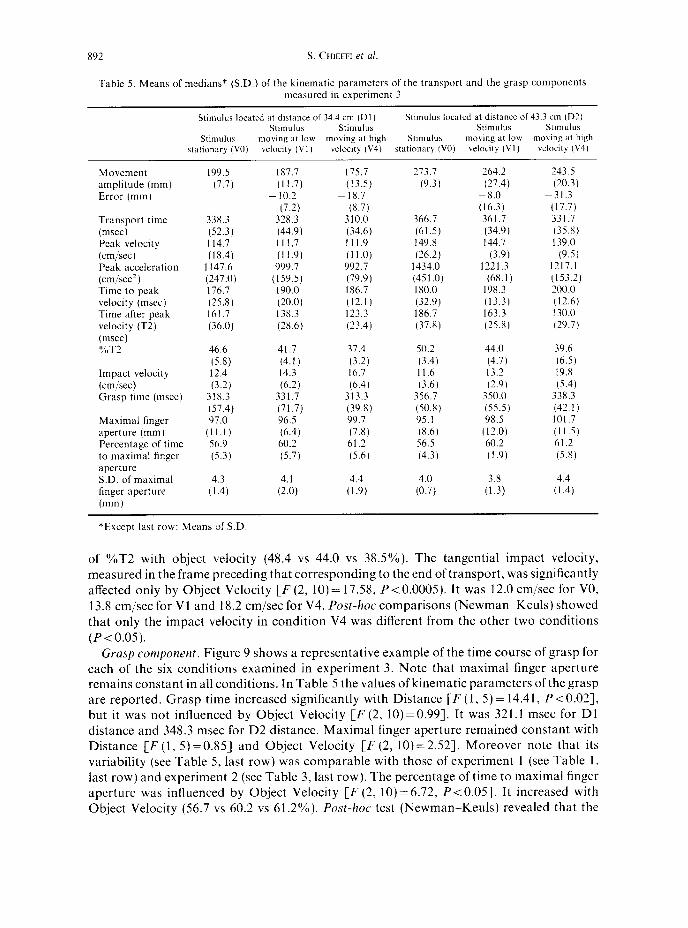
Table 5. Means of medians* (S.D.) of the kinematic parameters of the transport and the grasp components measured in experiment 3
Stimulus located at distance of 34.4 cm (Dl) Stimulus located at distance of 43.3 cm (D2)
Stimulus Stimulus StiIllUlUS Stimulus
Stimulus moving at low moving at high Stlmulua moklg at low mobing at high
stationary (VO) velocity (VI) velocity (V4) stationary (VO) \&city (VI) velocity (V4)
Movement amplitude (mm) Error (mm)
Transport time (msec) Peak velocity (cm,‘sec) Peak acceleratton (cm;sec’) Time to peak velocity (msec) Time after peak velocity (T2) (msec) XT2
Impact velocity (cm.!sec) Grasp time (msec)
Maximal finger aperture (mm) Percentage of time to maximal finger aperture S.D. of maximal finger aperture
(mm)
199.5
(7.7)
338.3 (52.3) 114.7 (18.4)
1147.6 (247.0) 176.7 (25.8) 161.7 (36.0)
46.6 (5.8) 12.4 (3.2)
318.3 (57.4) 97.0
(11.1) 56.9 (S.3)
4.3
(1.4)
1x7.7 (11.7)
- 10.2
(7.2) 32X.3 (44.9) III.7 (11.9) 999.7
(159.5) 190.0 (20.0) 138.3 (28.6)
175.7 (13.5)
~ 18.7
(8.7) 310.0 (34.6) 111.9 (11.0) 992.7 (79.9) 186.7 (12.1) 123.3 (23.4)
41.7
(4.1) 14.3
(6.2) 331.7 (71.7) 96.5
(6.4) 60.2
(5.7)
4.1
(2.0)
37.4
(3.2) 16.7
(6.4) 313.3 (39.X) 99.7
(7.8) 61.2
(5.6)
4.4
(1.9)
273.7
(9.3)
366.7 (61.5) 149.8 (26.2)
1434.0 (451.0) 180.0 (32.9) 186.7 (37.X)
50.2
(3.4) 11.6
(3.6) 356.7 (50.8) 95.1
(8.6) 56.5 (4.3)
4.0
(0.7)
264.2 (27.4)
-8.0 (16.3) 361.7 (34.9) 144.7
(3.9) 1221.3
(68.1) 198.3 (13.3) 163.3 (25.8)
243.5 (20.3)
-31.3 (17.7) 331.7 (35.X) 139.0
(9.5) 1217.1 (153.2) 200 .o (12.6) 130.0 (29.7)
44.0
(4.7) 13.2 (2.9)
350.0 (55.5) 98.5
(12.0) 60.2 (1.9)
3.8
(1.3)
39.6
(6.5) 19.X
(5.4) 338.3 (42.1) 101.7 (11.5) 61.2
(5.8)
4.4
(1.4)
*Except last row: Means of S.D.
of %T2 with object velocity (48.4 vs 44.0 vs 38.5%). The tangential impact velocity, measured in the frame preceding that corresponding to the end of transport, was significantly affected only by Object Velocity [F (2, lo)= 17.58, P<O.O005). It was 12.0 cm/set for VO, 13.8 cm/set for Vl and 18.2 cm/set for V4. Post-hoc comparisons (NewmanKeuls) showed that only the impact velocity in condition V4 was different from the other two conditions (P<O.O5).
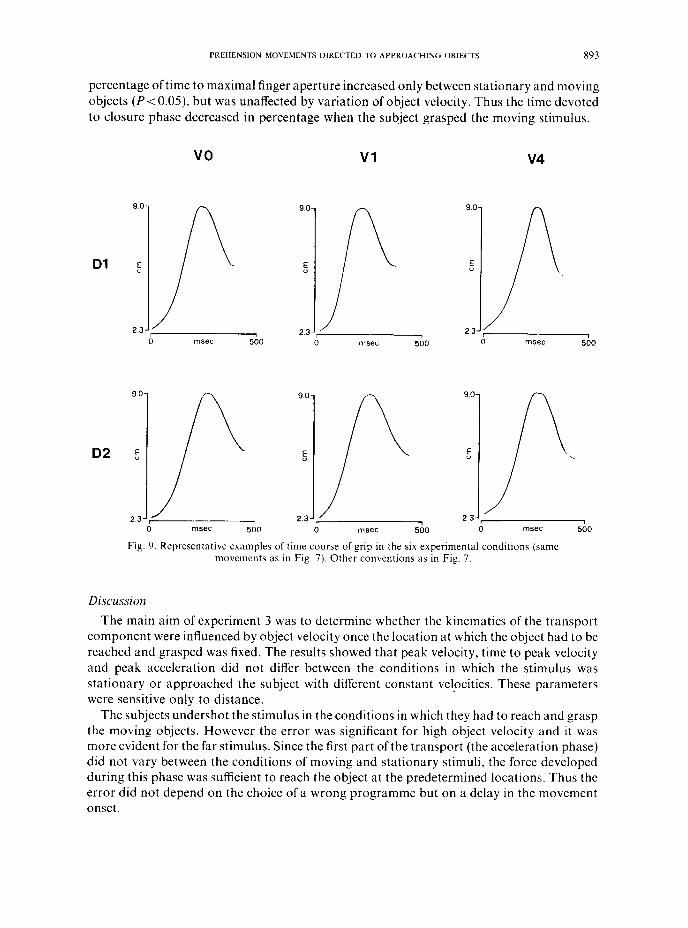
Grasp component. Figure 9 shows a representative example of the time course of grasp for each of the six conditions examined in experiment 3. Note that maximal finger aperture remains constant in all conditions. In Table 5 the values of kinematic parameters of the grasp are reported. Grasp time increased significantly with Distance [F (1, 5) = 14.41, P-C 0.021,
but it was not influenced by Object Velocity [F (2, 10)=0.99]. It was 321.1 msec for Dl distance and 348.3 msec for D2 distance. Maximal finger aperture remained constant with Distance [F (1, 5)=0.85] and Object Velocity [F (2, 10)=2.52]. Moreover note that its variability (see Table 5, last row) was comparable with those of experiment 1 (see Table 1, last row) and experiment 2 (see Table 3, last row). The percentage of time to maximal finger aperture was influenced by Object Velocity [F (2, 10)=6.72, P~O.051. It increased with Object Velocity (56.7 vs 60.2 vs 61.2%). Post-hoc test (Newman-Keuls) revealed that the
PREHENSION MOVEMENTS DIRECTED TO APPROACHING OBJECTS 893
percentage of time to maximal finger aperture increased only between stationary and moving objects (P-C 0.05), but was unaffected by variation of object velocity. Thus the time devoted to closure phase decreased in percentage when the subject grasped the moving stimulus.
SC
Dl 5
vo
9.0
23
Vl
go-
23_p (
5
0 ms?c 500
90
E v
23.
v4
P go-
E u
2 3- )P,
0 ms?c 500
Fig. 9. Representative examples of time course of grip in the six experimental conditions (same movements as in Fig. 7). Other conventions as in Fig. 7.
Discussion
The main aim of experiment 3 was to determine whether the kinematics of the transport component were influenced by object velocity once the location at which the object had to be reached and grasped was fixed. The results showed that peak velocity, time to peak velocity and peak acceleration did not differ between the conditions in which the stimulus was stationary or approached the subject with different constant vel_ocities. These parameters were sensitive only to distance.
The subjects undershot the stimulus in the conditions in which they had to reach and grasp the moving objects. However the error was significant for high object velocity and it was more evident for the far stimulus. Since the first part of the transport (the acceleration phase) did not vary between the conditions of moving and stationary stimuli, the force developed during this phase was sufficient to reach the object at the predetermined locations. Thus the error did not depend on the choice of a wrong programme but on a delay in the movement onset.
894 S. CHIEFFI PI ul
The second part of the transport component appeared to be modified not only by distance, but also by object velocity. The deceleration phase decreased with increasing object velocity. A possible explanation of this finding is that the deceleration phase had the same duration, but it was not completed because the subjects undershot the target. Against this possibility there are two findings. Firstly, the error was significant only for the highest object velocity, whereas the deceleration phase decreased also between the conditions of stationary and moving stimuli with low velocity. Secondly, if the deceleration phase was interrupted, impact velocity had to increase with the shortening of the deceleration phase. This was found only for velocity V4. Thus, it seems reasonable to suppose that the deceleration phase was tuned by object velocity.
The results of experiment 3 confirmed that maximal finger aperture was not modified by object velocity. Moreover the values of this parameter remained unaltered when stationary and moving stimuli were used. The percentage of time to maximal finger aperture increased when the reaching-grasping movements were compared between stationary and moving objects. The subjects closed their fingers more quickly when moving stimuli were used. However, as in experiments 1 and 2. no differences were observed when the stimulus moved with different velocities.
GENERAL DISCUSSION
The main aim of this study was to investigate how reaching-grasping movements are organized when they are directed to objects approaching with different constant velocities. We sought to determine which kinematic parameters of the transport and the grasp components, if any, were influenced by stimulus velocity. Our hypothesis was that, since velocity is an extrinsic property of the object, the transport component would be affected by velocity, whereas the kinematics of grasp were expected to remain unchanged.
Transport component
The results of experiments 1 and 2 showed that object velocity influenced the selection of the spatial location (the end point) at which the object was reached and grasped. The end point was farther with low than with high velocities.
The variations of the end point can be explained as compensative for increasing task difficulty with higher object velocities (see the results of experiment 3 concerning errors). Since the object had to be reached and grasped with the same accuracy regardless of its velocity, subjects grasped the objects moving with higher velocities at nearer distances. In fact, according to FITTS' law [4], the Index of Difficulty decreases if stimulus size remains constant, and stimulus distance decreases. Another possibility might be that the selection of different end points was the consequence of the existence of a spatial fixed barrier that triggers the arm movement. The object distance at the movement initiation increased significantly with higher object velocities in both experiments 1 and 2. Consequently this hypothesis, although very appealing, was not confirmed by experimental data.
The transport peak velocity was affected by object velocity in experiments 1 and 2, but it remained unmodified in experiment 3. These results deserve some comment. In experiments 1 and 2 object velocity affected the location at which the object was reached and accordingly the arm velocity was varied. When the object had to be reached at a fixed location, as in experiment 3, arm velocity remained constant. It must be emphasized that, in
PKEHENSION MOVEMENTS UIKECTED TO APPKOACHING OBJECTS 895
principle, in this experiment different arm velocities could be used by varying the time of movement onset. This result confirms that the selection of arm velocity was based on distance, independently of object velocity.
Unlike the first phase of transport, which was influenced only by the spatial location of the end point selected in response to variations of object velocities, the second phase of the movement, the deceleration phase, appeared to be affected directly by object velocity. The decreasing duration in percentage of the deceleration phase with higher object velocities appears to reflect a modification of the transport motor programme [15]. An hypothesis that might explain this result is that the final phase of the movement was shortened in order to minimize object displacements. Consequently, grasp was facilitated during the final finger closure phase. However variation in the decelaration phase could also depend on final corrections due to inaccurate prediction of the object’s arrival at the final position. The observation of undershooting errors in experiment 3 for the highest object velocity made this hypothesis possible. Against this last hypothesis are the following findings: (1) variations in the deceleration phase were found also in experiments 1 and 2 in which subjects were free to vary the final object position; (2) no corrections in velocity profiles were found in all experiments.
In summary, our data indicate that object velocity affected the transport component. The first part ofthe movement, the acceleration phase, depended only on the end point selected in response to variations of object velocity; the second part, the deceleration phase, was directly affected by object velocity.
Grasp component
The maximal finger aperture remained constant to variations of object velocity in the three experiments. It was sensitive (see the results of experiment 2) only to changes of object size. This result confirms the findings of previous experiments showing that this kinematic parameter is influenced only by intrinsic and not by extrinsic object properties [5,9, 10, 1 I, 17, 191.
In experiments 1 and 2 the temporal relations between the finger aperture and closure phases were not modified by object velocity. In experiment 3 differences were found only between stationary and moving stimuli, but not as a function of object velocity, thus confirming the results of experiments 1 and 2. When the stimulus was stationary the percentage of closure time was longer than when it was moving.
Differences in the relative duration of the finger aperture and closure phase between stationary and moving stimuli could be interpreted in favour of the dependence of the grasp component on this extrinsic object property. It is generally accepted that the dependence of the transport and the grasp components on a particular object feature is based on the variation of their parameters proportional to changes of that feature. Indeed the dependence of the grasp component on size (intrinsic object property) is proved by the finding that maximal finger aperture increases proportionally with object size [l 1, 121 (see the results of experiment 2), and the dependence of the transport component on distance (extrinsic object property) by the finding that transport peak velocity increases proportionally with distance [S, 6, 11, 13, 181. Therefore if the grasp component depends on object velocity, the duration of finger closure might be expected to change in percentage for each variation of the object velocity. This result was not found in the three experiments.
A possible explanation of the finding that finger closure phase decreases between stationary and moving stimuli is that moving objects require a brief closure phase in order to

896 S. CHIEFFI et a/
decrease the distance covered from the object during finger closure. In this way the object manipulation is made easier. The lack of variations of finger closure phase with changes of object velocity likely depends on the fact that the different displacements of the object with changes of object velocity during closure phase may be compensated by different angular displacements at the wrist joint. Although we have not measured this kinematic parameter, we can have its indirect measure considering the difference between the end point (measured on the sphere) and the movement amplitude (measured on the wrist). These differences in experiments 1 and 2 (see second and third row of Tables 1 and 3) decreased with the increase of object velocity. Thus the increase of stimulus velocity was likely compensated by an increase of the wrist flexion.
A final finding deserving some comment is that in experiment 3 the reduction in the transport deceleration phase (in percentage) corresponded to the reduction of the finger closure phase (in percentage) between the conditions of moving and stationary stimuli. This finding could be interpreted as due to a temporal coordination between the two components. If this hypothesis is correct, finger closure phase had to change for each variation of deceleration phase. Close inspection of our data does not support this last hypothesis. Whereas the transport deceleration phase changed in percentage in the three experiments when objects moved with different velocities and in experiment 3 between the conditions of stationary and moving stimuli, the finger closure phase changed in percentage only in experiment 3 between the conditions of stationary and moving stimuli. Thus it is difficult to conceive a rigid temporal coordination between the two final phases.
Alternatively, the decrease in the arm deceleration phase as well as in the finger closure phase found for moving stimuli with respect to stationary stimuli can be due to the same demand to facilitate the final phase of the prehension movement, minimizing object displacements. As a consequence of this requirement the kinematics of arm, wrist and fingers were differently varied among the different experimental conditions. In this sense the link between the two components appears to be functional more than rigidly temporal.
In conclusion, the results of this study confirm that stimulus velocity, as object extrinsic property, influenced the transport component. On the contrary it poorly affected the grasp component. The main kinematic parameter of grasp (grip size) remained unmodified by object velocity and the temporal kinematic parameters of this component were found to vary only between the conditions of stationary and moving stimuli.
Acknowledgements-We thank Prof. G. Rizzolatti for discussion of the data and Prof. A. Allport for his comments on the manuscript. We thank Dr R. Brianti for his help in part of the experiments. The work was supported by a Research Grant from Human Frontier Science Program, by EEC Contract No. SCl*-0177-C and by grants CNR and MPI to M.G. S. Chieffi was supported from “Dottorato di Ricerca in Neuroscienze, Napoli”.
REFERENCES 1. AK~IB, M. A. Perceptual structures and distributed motor control. In Handbook ofPhysiology, Section 1: The
Nervous System, Vol. 2: Motor Control, pp. 1449-1480. American Physiological Society, Bethesda, Maryland, 1981
2. D’AMI~~, M. and FERRIGNO, G. Technique for the evaluation of derivatives from noisy biomechanical displacement using a model-based bandwidth-selection procedure. IEEE Trans. BME 28, 407415, 1990.
3. FERRICNO, G. and PEDOTTI, A. ELITE: a digital dedicated hardware system for movement analysis via real-time signal processing. 1EEE Trans. BME 32, 943.-950, 1985.
4. FITTS, P. M. The information capacity of the human motor system in controlling the amplitude of movement. J. exp. Psq’chol. 47, 381-391, 1954.
5. GENTILUTCI, M., CASTIELLO, U., CORRADINI, M. L., SCARPA, M., UMILTA, C. and RIZZOLATTI, G. Influence of
PREHENSION MOVEMENTS DIRECTED TO APPROACHING; OBJECTS 897
different types of grasping on the transport component of prehension movements. Nruropspcholoyia 29, 361-378, 1991.
6. GENTILUCY‘I, M., CHIEFFI, S., SCARPA, M. and CASTIELLO, U. Temporal coupling between transport and grasp components during prehension movements: effects of visual perturbation. Behac. Bruin Res. 47, 71-82, 1992.
7. GENTILUWI, M., FOGASSI, L., LUPPINO, G., MATELLI, M., CAMARDA, R. and RIZZOLATTI, G. Functional organization of inferior area 6 in the macaque monkey: I. Somatotopy and control of proximal movements. Exp. Brain Res. 71, 475490, 1988.
8. GEI‘;TILUC(Y, M. and RIZZOLATTI, G. Cortical motor control ofarm and hand movements. In Vision and Action: The Control of Grasping, M. A. GOODALE (Editor). pp. 147 162. Norwood, New Jersey, 1990.
9. JEANNEROI), M. The formation of finger grip during prehension: a cortically mediated visuomotor pattern. Behw. Brain Res. 19, 99- 116, 1986.
10. JEANNEROD. M. Intersegmental coordination during reaching at natural visual objects. In Atlrnrion and Pwfhrmanc~e, J. LONG and A. BADDELY (Editors), Vol. 9, pp. 153 168. Erlbaum, Hillsdale, NJ, 1981.
Il. JEANNEROD. M. The timing of natural prehension movement. J. Mof. Behao. 16, 235-254, 1984. 12. MARTENIUK, R., G., LEAVITT, J. L., MACKENZIE, C. L. and ATHENES, S. Functional relationships between grasp
and transport components in a prehension task. Hum. Mot). Sci. 9, 149 -176. 1990. 13. MARTEXIIJK, R. G., MACKENZIE, C. L., JEANNEROD, M., ATHEXES, S. and DUGAS, C. Constrains on human arm
movements trajectories. Can. J. e.xp. Psychol. 41, 365 378, 1987. 14. RIZZOLATTI, G., CAMARDA, R., F~GASSI, L., G~NTILUCCI. M.. LUPPINO, G. and MATELLI, M. Functional
organization of inferior area 6 in the macaque monkey: II. Area F5 and the control of distal movements. Exp. Brain Res. 71, 491-507, 1988.
15. SCHMIDT, R. A. Motor Learning and Control: A Behacioral Emphasis. Champaign, IL, 1988. 16. TAIRA, M., MINE, S., GEORGOPOULOS, A. P., MURATA, A. and SAKATA, H. Parietal cortex neurons ofthe monkey
related to visual guidance of hand movement. E.Y~. Brain Res. 83, 29 36, 1990. 17. VON Hots-rEN. C. and RO~NQVIST, L. Preparation for grasping an object: A developmental study. J. rxp.
Psycho/.: Hum. Prrcrpr. Perform. 14, 61G621, 1988. 18. WALLACE, S. A. and WEEKS. D. L. Temporal constrains in the control of prehensile movements. J. Mot. Behar.
15.81-105. 1988. 19. WING, A. M. and FRASER. C. The contribution of the thumb to reaching movements. Q. J. exp. Ps~chol. 35A,
297 309. 1983. 20. ZELAZNIK, H. L., SCHMIDT, R. A. and GIELEN. S. C. A. N. Kinematic properties of rapid aimed hand movements.
J. Mar. Behur. 18, 353-372. 1986.
Copyright © 2022 FDOKUMEN