Preference of Processed Poultry Meat in the Greater Accra Region of Ghana
12
Transcript of Preference of Processed Poultry Meat in the Greater Accra Region of Ghana
36
This article can be downloaded from http://www.iajavs.com/currentissue.php
Indo-Am. J. Agric. & Vet. Sci., 2015 Richard Takyi- Mensah and Richard Kwasi Bannor, 2015
PREFERENCE OF PROCESSED POULTRY MEAT IN THEGREATER ACCRA REGION OF GHANA
Richard Takyi-Mensah1 and Richard Kwasi Bannor2*
The study explored identifying the preference of locally processed poultry meat comparedto imported processed meat. The results show majority of consumer respondentsrepresenting 84(77.8%) always bought processed poultry meat for cooking and 24 (22.2%)bought unprocessed or live birds and processed before cooking with it. The majority,80(74.1%), of the consumers interviewed preferred locally processed poultry meat toimported processed poultry meat whereas 28(25.9 %) of the consumer respondentspreferred imported processed poultry meat to locally processed poultry meat. On theparts of poultry meat commonly purchased by consumers, 17(15.7%) of consumerscommonly bought a full chicken, 14(13.0%) bought wings, 46(42.6%) bought thighs,2(1.9%) bought drumstick, 4(3.7%) bought gizzard, 1(0.9%) bought breast, 10(9.3%)commonly bought wings, thighs and drumstick combined,7(6.5%) commonly boughtgizzard, thighs and breast combined and 7(6.5%) commonly bought wings, thighs andback combined. Generally there is high selling of imported processed layers and broilerswings, drumsticks and full chicken compared to locally processed meat parts of poultry,even though most sellers and consumers agree that the taste of the locally processedbroiler and layer are best but for affordability opts for imported processed ones
Keywords: Poultry, Accra, Ghana, Descriptive statistics, Layers, Broilers and Preference
*Corresponding Author: Richard Kwasi Bannor � [email protected]
INTRODUCTIONSince the 1970s, global production, consumptionand trade of poultry meat have grown faster thanthat of any other meat. During the 1990s, whendemand growth slowed for other meats, includingfish, demand growth for poultry meat acceleratedand poultry continued to lead the expansion ofmeat trade (Barbut, 2002). Per capitaconsumption of poultry meat varies around the
1 Head of Agriculture/Science Department, Abakrampa Senior High School, Abakrampa-Ghana.2 Institute of Agribusiness Management, SK Rajasthan Agricultural University, Bikaner-India.
Indo-Am. J. Agric. & Vet. Sci., 2015 ISSN 2321–9602 www.iajavs.com
Vol. 3, No. 1, March 2015
© 2015 Meghana Publications. All Rights Reserved
Research Paper
world, ranging from 0.7 kg in India to 44 kg perannum in the US (Bilgili, 2002). With apopulation of more than 20 million and anincreasing real per capita income, Ghanaconstitutes a potential market for poultry meat(Kudzodzi, 2008).
Again, from 1970 to now, worldwide meatproduction has witnessed an annual growth of2.8% (Lubchenco, 2003), with poultry and pig
37
This article can be downloaded from http://www.iajavs.com/currentissue.php
Indo-Am. J. Agric. & Vet. Sci., 2015 Richard Takyi- Mensah and Richard Kwasi Bannor, 2015
production growing at a double level thanruminants. Meat production therefore hasincreased to fulfil the demand of developingcountries. The phenomenon represents a widowof economic opportunities for poultry meatproduction in most developing countries suchas Ghana. Recent reports (for instance OECD/FAO, 2006) on the future of chicken meatconsumption indicate that developed countriessuch as the United States, United Kingdom,Holland and France will continue to be importantimport markets. This paints brighter futureprospects for the poultry industry in countrieslike Ghana and represents good opportunity forher to participate in the lucrative internationalmarket, so as to enhance economic growth andreduce hunger and poverty (Rivera-Ferre, 2009)
The demand increase has also occurs in thecountry such that, poultry meat, which used tohave a highly seasonal demand pattern, is nowin constant demand throughout the year. Thechange in demand for chicken, paradoxically,has not been entirely to the benefit of the localpoultry industry. For some time now, theGhanaian market has witnessed an influx ofcheap, frozen poultry products from Europe, SouthAmerica and other parts of the world. For thelocal poultry industry to stay competitive, thepoultry meat should be processed to meetconsumer preferences. Hence, an improvedknowledge on the demand for and marketing oflocally processed poultry in the country cancontribute to the effective competitive advantageand even commercialisation of small scalepoultry farmers. An understanding of the maindrivers influencing the consumer demand ofprocessed poultry is important in developingrelevant strategies for the commercialisationof locally processed poultry products andimproving the effectiveness and efficiency ofproduction and marketing. The objective of thisstudy is therefore to create a betterunderstanding of consumer preferences relatedto processed poultry products and itsimplications on the local marketing of locallyprocessed locally poultry meat in the GreaterAccra region of Ghana
METHODOLOGY
Description of the Study AreaThe Greater Accra region is the study area.Greater Accra region was purposively selectedbased on the fact that according to Aning (2006),Greater had the highest number of poultrypopulation in 2005 amongst the ten regions ofGhana as depicted by Table 2. Greater Accraregion is the smallest region in terms oflandmass covering a total surface area of 4,450sq. km. It is centrally located within the coastalbelt of Ghana and shares boundaries with theEastern Region to the north, Central region tothe west and Volta Region to the east. To the southof the region lies the Gulf of Guinea which spans22 0km coastline stretching from Langma nearKasoa in the west to Ada in the east.
According to GSS (2012), the total population ofthe Greater Accra Region is 4,010,054 whichconsist of 1,938,225 males, 2,071,829 females andin all Greater Accra Region accounts for 16.3% ofthe total national population. In the Greater Accra,the agricultural sector employs 41.6% of theeconomically active population aged 15 years andolder. (GSS, 2012). The main agricultural activitiesare livestock and poultry production, fishing, andproduction of maize, cassava, vegetables notablypepper, okro, garden eggs, cabbage, tomatoes,Asian vegetables, fruits such as pineapple, watermelon pawpaw and tree crops such as mango.Greater Accra region dominates in terms of poultrybirds’ population in the country. Exotic birds arekept for commercial purposes, and they are moreabundant in the urban areas of Greater Accrawhere markets for their products exist (LPIU,2006).
SAMPLING PROCEDURE ANDSAMPLE SIZE
Method of Data AnalysisDescriptive statistics was used to analyse thedata. Descriptive statistics is a field that focuseson simply describing different characteristics of
38
This article can be downloaded from http://www.iajavs.com/currentissue.php
Indo-Am. J. Agric. & Vet. Sci., 2015 Richard Takyi- Mensah and Richard Kwasi Bannor, 2015
a data. The tools that were employed for theanalysis using descriptive statistics are mean,frequency, percentages and cross tabulations.
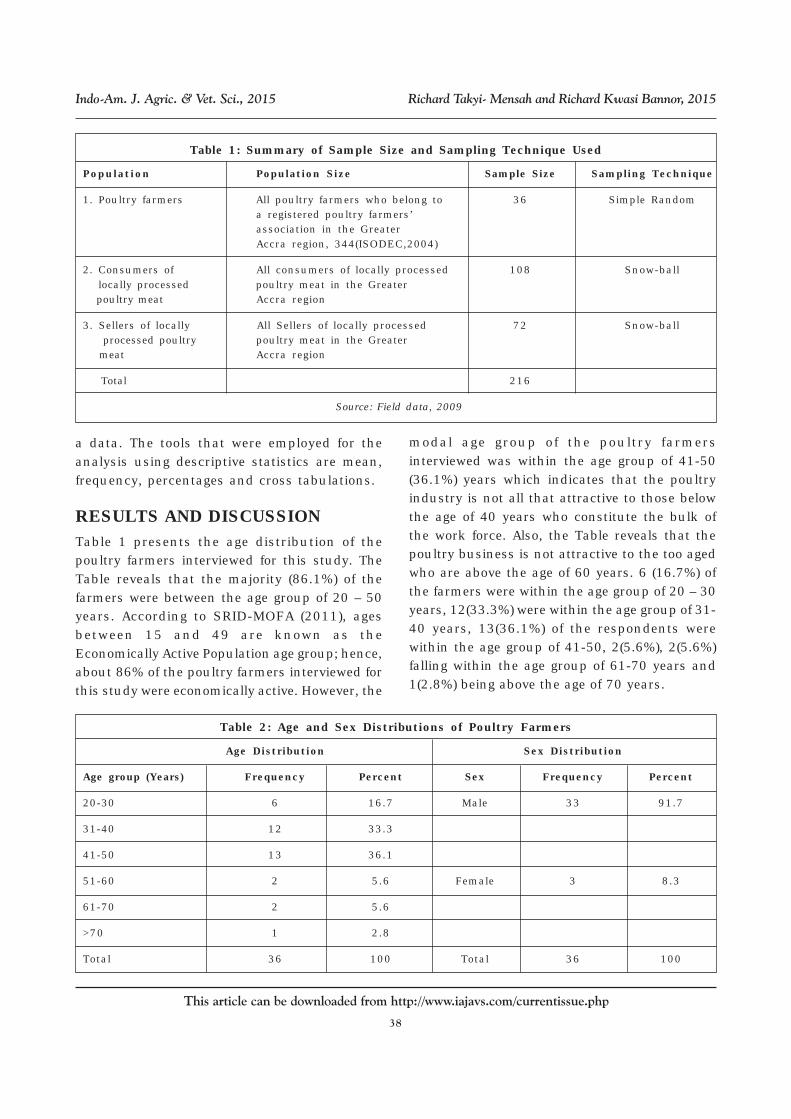
RESULTS AND DISCUSSIONTable 1 presents the age distribution of thepoultry farmers interviewed for this study. TheTable reveals that the majority (86.1%) of thefarmers were between the age group of 20 – 50years. According to SRID-MOFA (2011), agesbetween 15 and 49 are known as theEconomically Active Population age group; hence,about 86% of the poultry farmers interviewed forthis study were economically active. However, the
modal age group of the poultry farmersinterviewed was within the age group of 41-50(36.1%) years which indicates that the poultryindustry is not all that attractive to those belowthe age of 40 years who constitute the bulk ofthe work force. Also, the Table reveals that thepoultry business is not attractive to the too agedwho are above the age of 60 years. 6 (16.7%) ofthe farmers were within the age group of 20 – 30years, 12(33.3%) were within the age group of 31-40 years, 13(36.1%) of the respondents werewithin the age group of 41-50, 2(5.6%), 2(5.6%)falling within the age group of 61-70 years and1(2.8%) being above the age of 70 years.
Table 1: Summary of Sample Size and Sampling Technique Used
Population Population Size Sample Size Sampling Technique
1. Poultry farmers All poultry farmers who belong to 36 Simple Randoma registered poultry farmers’association in the GreaterAccra region, 344(ISODEC,2004)
2. Consumers of All consumers of locally processed 108 Snow-ball locally processed poultry meat in the Greater poultry meat Accra region
3. Sellers of locally All Sellers of locally processed 72 Snow-ball processed poultry poultry meat in the Greater meat Accra region
Total 216
Source: Field data, 2009
Table 2: Age and Sex Distributions of Poultry Farmers
Age Distribution Sex Distribution
Age group (Years) Frequency Percent Sex Frequency Percent
20-30 6 16.7 Male 33 91.7
31-40 12 33.3
41-50 13 36.1
51-60 2 5.6 Female 3 8.3
61-70 2 5.6
>70 1 2.8
Total 36 100 Total 36 100
39
This article can be downloaded from http://www.iajavs.com/currentissue.php
Indo-Am. J. Agric. & Vet. Sci., 2015 Richard Takyi- Mensah and Richard Kwasi Bannor, 2015
Also, Table 1 presents the details of the sexdistributions of the poultry farmers interviewed.The table shows that generally, the poultryindustry is predominantly a male job. Out of the36 poultry famers interviewed, 33(91.7%) weremales and the females and the females were3(8.3%).
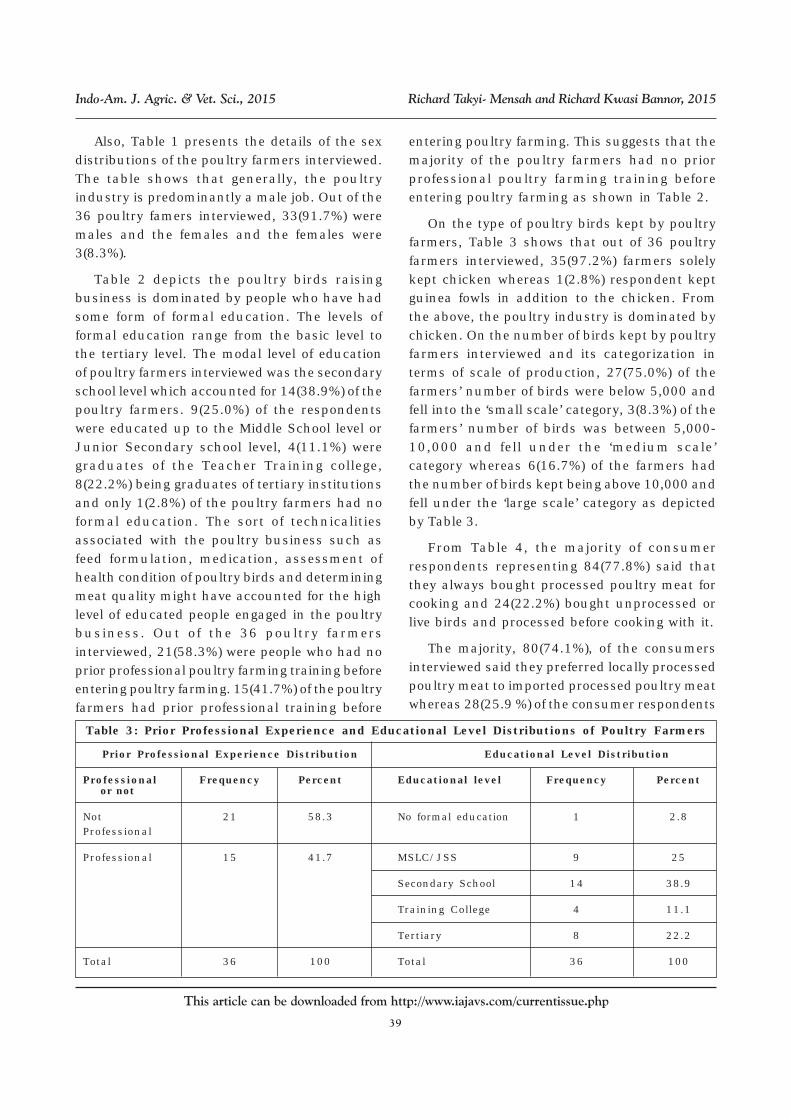
Table 2 depicts the poultry birds raisingbusiness is dominated by people who have hadsome form of formal education. The levels offormal education range from the basic level tothe tertiary level. The modal level of educationof poultry farmers interviewed was the secondaryschool level which accounted for 14(38.9%) of thepoultry farmers. 9(25.0%) of the respondentswere educated up to the Middle School level orJunior Secondary school level, 4(11.1%) weregraduates of the Teacher Training college,8(22.2%) being graduates of tertiary institutionsand only 1(2.8%) of the poultry farmers had noformal education. The sort of technicalitiesassociated with the poultry business such asfeed formulation, medication, assessment ofhealth condition of poultry birds and determiningmeat quality might have accounted for the highlevel of educated people engaged in the poultrybusiness. Out of the 36 poultry farmersinterviewed, 21(58.3%) were people who had noprior professional poultry farming training beforeentering poultry farming. 15(41.7%) of the poultryfarmers had prior professional training before
entering poultry farming. This suggests that themajority of the poultry farmers had no priorprofessional poultry farming training beforeentering poultry farming as shown in Table 2.
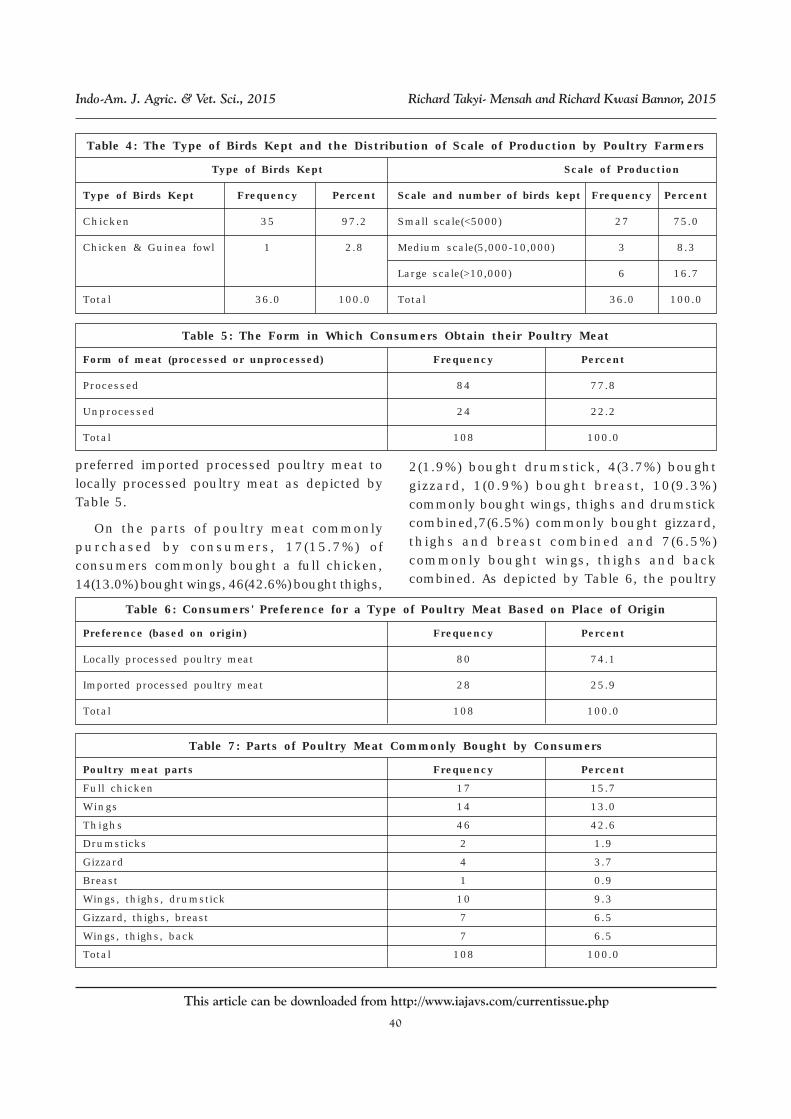
On the type of poultry birds kept by poultryfarmers, Table 3 shows that out of 36 poultryfarmers interviewed, 35(97.2%) farmers solelykept chicken whereas 1(2.8%) respondent keptguinea fowls in addition to the chicken. Fromthe above, the poultry industry is dominated bychicken. On the number of birds kept by poultryfarmers interviewed and its categorization interms of scale of production, 27(75.0%) of thefarmers’ number of birds were below 5,000 andfell into the ‘small scale’ category, 3(8.3%) of thefarmers’ number of birds was between 5,000-10,000 and fell under the ‘medium scale’category whereas 6(16.7%) of the farmers hadthe number of birds kept being above 10,000 andfell under the ‘large scale’ category as depictedby Table 3.
From Table 4, the majority of consumerrespondents representing 84(77.8%) said thatthey always bought processed poultry meat forcooking and 24(22.2%) bought unprocessed orlive birds and processed before cooking with it.
The majority, 80(74.1%), of the consumersinterviewed said they preferred locally processedpoultry meat to imported processed poultry meatwhereas 28(25.9 %) of the consumer respondents
Table 3: Prior Professional Experience and Educational Level Distributions of Poultry Farmers
Prior Professional Experience Distribution Educational Level Distribution
Professional Frequency Percent Educational level Frequency Percent or not
Not 21 58.3 No formal education 1 2.8Professional
Professional 15 41.7 MSLC/JSS 9 25
Secondary School 14 38.9
Training College 4 11.1
Tertiary 8 22.2
Total 36 100 Total 36 100
40
This article can be downloaded from http://www.iajavs.com/currentissue.php
Indo-Am. J. Agric. & Vet. Sci., 2015 Richard Takyi- Mensah and Richard Kwasi Bannor, 2015
preferred imported processed poultry meat tolocally processed poultry meat as depicted byTable 5.
On the parts of poultry meat commonlypurchased by consumers, 17(15.7%) ofconsumers commonly bought a full chicken,14(13.0%) bought wings, 46(42.6%) bought thighs,
2(1.9%) bought drumstick, 4(3.7%) boughtgizzard, 1(0.9%) bought breast, 10(9.3%)commonly bought wings, thighs and drumstickcombined,7(6.5%) commonly bought gizzard,thighs and breast combined and 7(6.5%)commonly bought wings, thighs and backcombined. As depicted by Table 6, the poultry
Table 4: The Type of Birds Kept and the Distribution of Scale of Production by Poultry Farmers
Type of Birds Kept Scale of Production
Type of Birds Kept Frequency Percent Scale and number of birds kept Frequency Percent
Chicken 35 97.2 Small scale(<5000) 27 75.0
Chicken & Guinea fowl 1 2.8 Medium scale(5,000-10,000) 3 8.3
Large scale(>10,000) 6 16.7
Total 36.0 100.0 Total 36.0 100.0
Table 5: The Form in Which Consumers Obtain their Poultry Meat
Form of meat (processed or unprocessed) Frequency Percent
Processed 84 77.8
Unprocessed 24 22.2
Total 108 100.0
Table 6: Consumers' Preference for a Type of Poultry Meat Based on Place of Origin
Preference (based on origin) Frequency Percent
Locally processed poultry meat 80 74.1
Imported processed poultry meat 28 25.9
Total 108 100.0
Table 7: Parts of Poultry Meat Commonly Bought by Consumers
Poultry meat parts Frequency Percent
Full chicken 17 15.7
Wings 14 13.0
Thighs 46 42.6
Drumsticks 2 1.9
Gizzard 4 3.7
Breast 1 0.9
Wings, thighs, drumstick 10 9.3
Gizzard, thighs, breast 7 6.5
Wings, thighs, back 7 6.5
Total 108 100.0
41
This article can be downloaded from http://www.iajavs.com/currentissue.php
Indo-Am. J. Agric. & Vet. Sci., 2015 Richard Takyi- Mensah and Richard Kwasi Bannor, 2015
meat part that the majority of consumers bought
was the thigh and this was in line with the
findings of Asuming-Brempong et al. (2006).
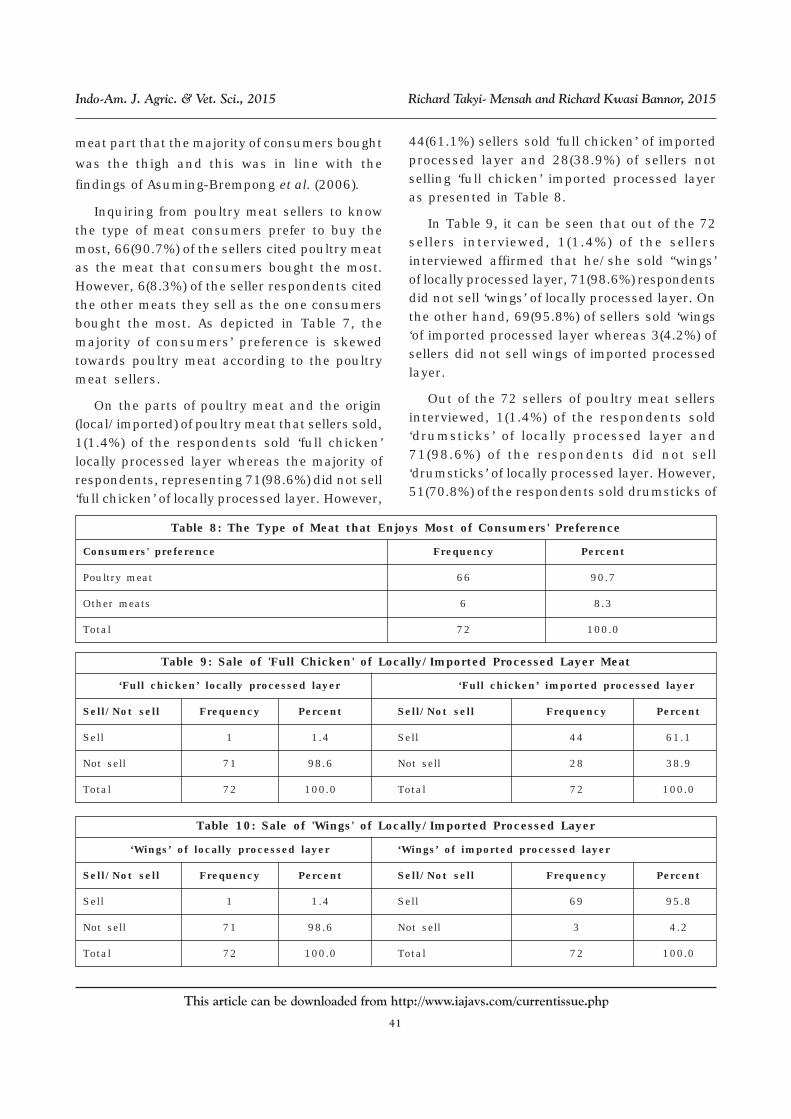
Inquiring from poultry meat sellers to knowthe type of meat consumers prefer to buy themost, 66(90.7%) of the sellers cited poultry meatas the meat that consumers bought the most.However, 6(8.3%) of the seller respondents citedthe other meats they sell as the one consumersbought the most. As depicted in Table 7, themajority of consumers’ preference is skewedtowards poultry meat according to the poultrymeat sellers.
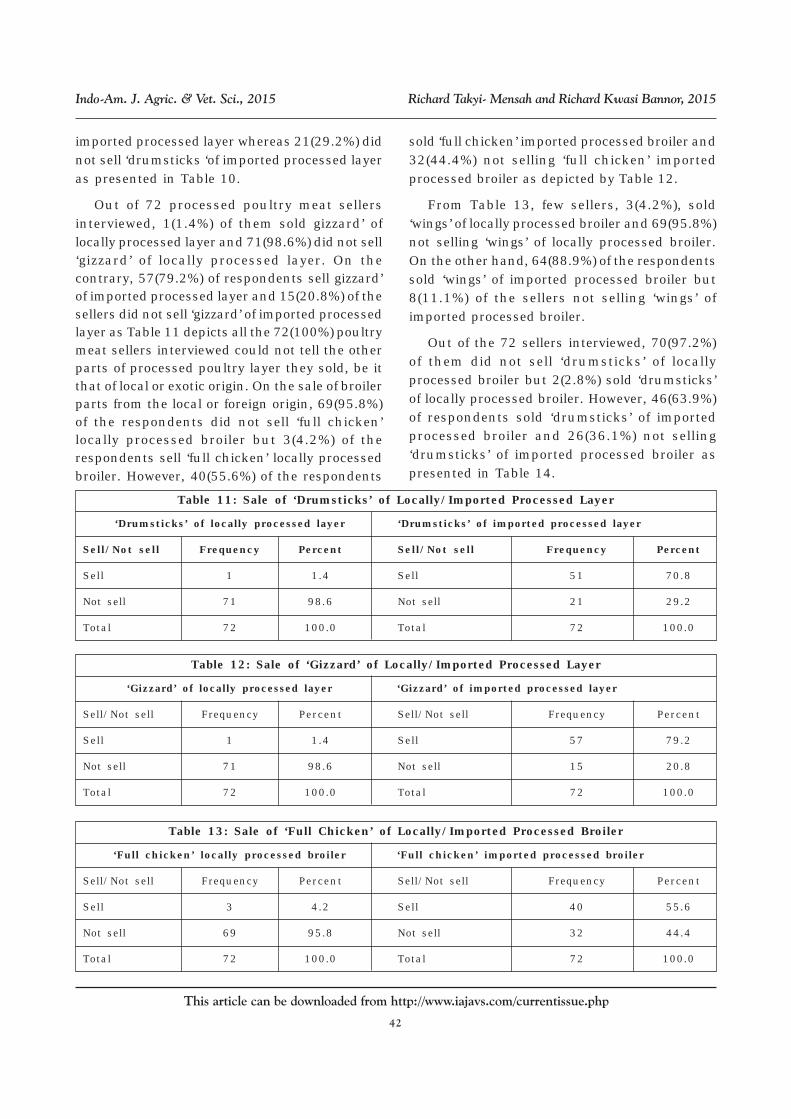
On the parts of poultry meat and the origin(local/imported) of poultry meat that sellers sold,1(1.4%) of the respondents sold ‘full chicken’locally processed layer whereas the majority ofrespondents, representing 71(98.6%) did not sell‘full chicken’ of locally processed layer. However,
44(61.1%) sellers sold ‘full chicken’ of importedprocessed layer and 28(38.9%) of sellers notselling ‘full chicken’ imported processed layeras presented in Table 8.
In Table 9, it can be seen that out of the 72sellers interviewed, 1(1.4%) of the sellersinterviewed affirmed that he/she sold “wings’of locally processed layer, 71(98.6%) respondentsdid not sell ‘wings’ of locally processed layer. Onthe other hand, 69(95.8%) of sellers sold ‘wings‘of imported processed layer whereas 3(4.2%) ofsellers did not sell wings of imported processedlayer.
Out of the 72 sellers of poultry meat sellersinterviewed, 1(1.4%) of the respondents sold‘drumsticks’ of locally processed layer and71(98.6%) of the respondents did not sell‘drumsticks’ of locally processed layer. However,51(70.8%) of the respondents sold drumsticks of
Table 8: The Type of Meat that Enjoys Most of Consumers' Preference
Consumers' preference Frequency Percent
Poultry meat 66 90.7
Other meats 6 8.3
Total 72 100.0
Table 9: Sale of 'Full Chicken' of Locally/Imported Processed Layer Meat
‘Full chicken’ locally processed layer ‘Full chicken’ imported processed layer
Sell/Not sell Frequency Percent Sell/Not sell Frequency Percent
Sell 1 1.4 Sell 44 61.1
Not sell 71 98.6 Not sell 28 38.9
Total 72 100.0 Total 72 100.0
Table 10: Sale of 'Wings' of Locally/Imported Processed Layer
‘Wings’ of locally processed layer ‘Wings’ of imported processed layer
Sell/Not sell Frequency Percent Sell/Not sell Frequency Percent
Sell 1 1.4 Sell 69 95.8
Not sell 71 98.6 Not sell 3 4.2
Total 72 100.0 Total 72 100.0
42
This article can be downloaded from http://www.iajavs.com/currentissue.php
Indo-Am. J. Agric. & Vet. Sci., 2015 Richard Takyi- Mensah and Richard Kwasi Bannor, 2015
imported processed layer whereas 21(29.2%) didnot sell ‘drumsticks ‘of imported processed layeras presented in Table 10.
Out of 72 processed poultry meat sellersinterviewed, 1(1.4%) of them sold gizzard’ oflocally processed layer and 71(98.6%) did not sell‘gizzard’ of locally processed layer. On thecontrary, 57(79.2%) of respondents sell gizzard’of imported processed layer and 15(20.8%) of thesellers did not sell ‘gizzard’ of imported processedlayer as Table 11 depicts all the 72(100%) poultrymeat sellers interviewed could not tell the otherparts of processed poultry layer they sold, be itthat of local or exotic origin. On the sale of broilerparts from the local or foreign origin, 69(95.8%)of the respondents did not sell ‘full chicken’locally processed broiler but 3(4.2%) of therespondents sell ‘full chicken’ locally processedbroiler. However, 40(55.6%) of the respondents
sold ‘full chicken’ imported processed broiler and32(44.4%) not selling ‘full chicken’ importedprocessed broiler as depicted by Table 12.
From Table 13, few sellers, 3(4.2%), sold‘wings’ of locally processed broiler and 69(95.8%)not selling ‘wings’ of locally processed broiler.On the other hand, 64(88.9%) of the respondentssold ‘wings’ of imported processed broiler but8(11.1%) of the sellers not selling ‘wings’ ofimported processed broiler.
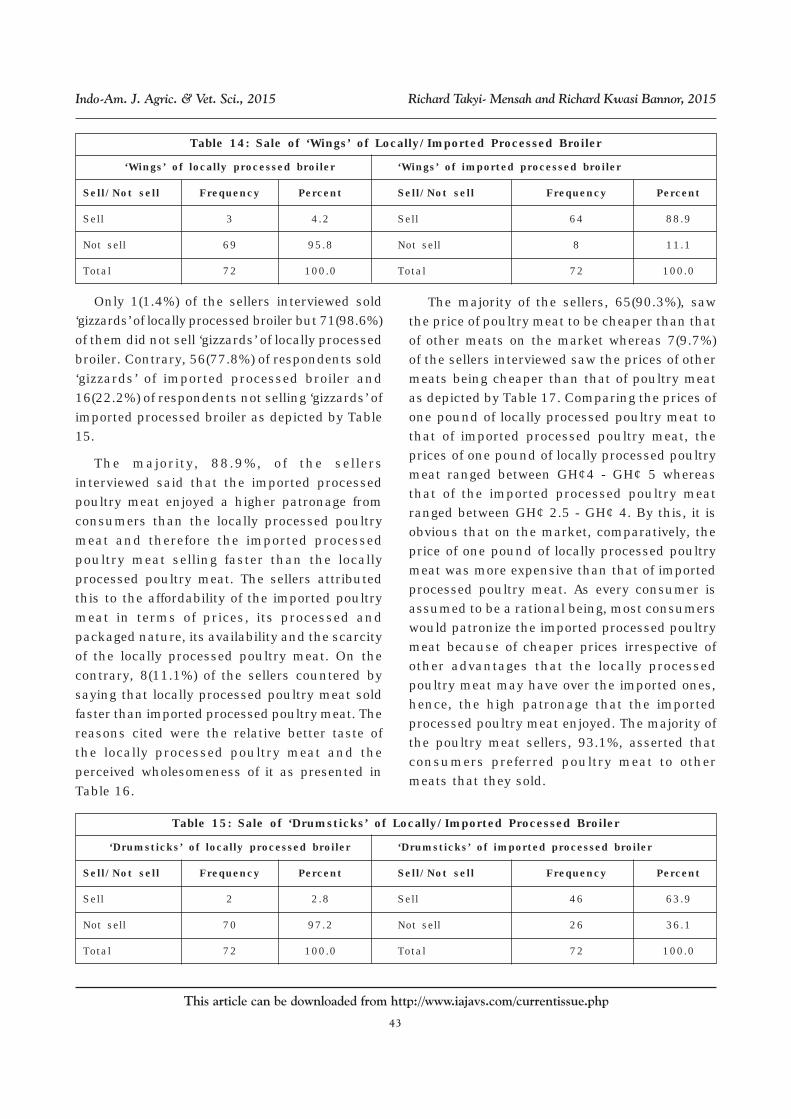
Out of the 72 sellers interviewed, 70(97.2%)of them did not sell ‘drumsticks’ of locallyprocessed broiler but 2(2.8%) sold ‘drumsticks’of locally processed broiler. However, 46(63.9%)of respondents sold ‘drumsticks’ of importedprocessed broiler and 26(36.1%) not selling‘drumsticks’ of imported processed broiler aspresented in Table 14.
Table 11: Sale of ‘Drumsticks’ of Locally/Imported Processed Layer
‘Drumsticks’ of locally processed layer ‘Drumsticks’ of imported processed layer
Sell/Not sell Frequency Percent Sell/Not sell Frequency Percent
Sell 1 1.4 Sell 51 70.8
Not sell 71 98.6 Not sell 21 29.2
Total 72 100.0 Total 72 100.0
Table 12: Sale of ‘Gizzard’ of Locally/Imported Processed Layer
‘Gizzard’ of locally processed layer ‘Gizzard’ of imported processed layer
Sell/Not sell Frequency Percent Sell/Not sell Frequency Percent
Sell 1 1.4 Sell 57 79.2
Not sell 71 98.6 Not sell 15 20.8
Total 72 100.0 Total 72 100.0
Table 13: Sale of ‘Full Chicken’ of Locally/Imported Processed Broiler
‘Full chicken’ locally processed broiler ‘Full chicken’ imported processed broiler
Sell/Not sell Frequency Percent Sell/Not sell Frequency Percent
Sell 3 4.2 Sell 40 55.6
Not sell 69 95.8 Not sell 32 44.4
Total 72 100.0 Total 72 100.0
43
This article can be downloaded from http://www.iajavs.com/currentissue.php
Indo-Am. J. Agric. & Vet. Sci., 2015 Richard Takyi- Mensah and Richard Kwasi Bannor, 2015
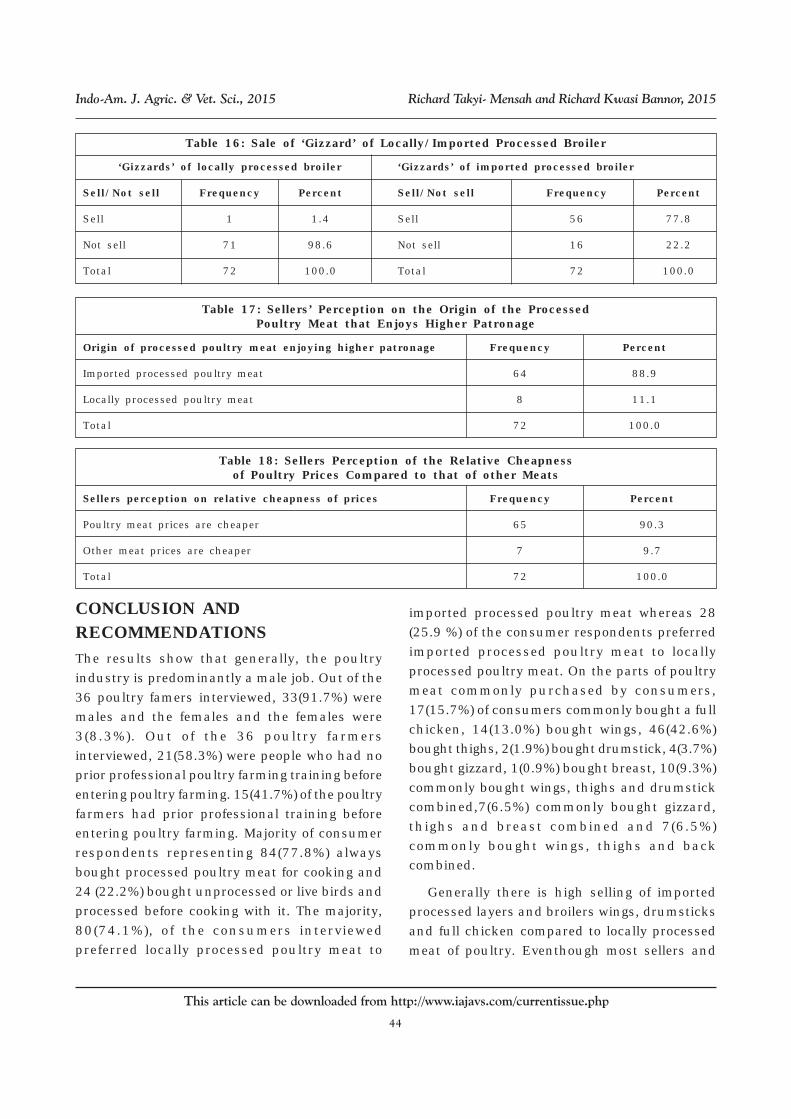
Only 1(1.4%) of the sellers interviewed sold‘gizzards’ of locally processed broiler but 71(98.6%)
of them did not sell ‘gizzards’ of locally processed
broiler. Contrary, 56(77.8%) of respondents sold
‘gizzards’ of imported processed broiler and
16(22.2%) of respondents not selling ‘gizzards’ of
imported processed broiler as depicted by Table15.
The majority, 88.9%, of the sellers
interviewed said that the imported processedpoultry meat enjoyed a higher patronage from
consumers than the locally processed poultry
meat and therefore the imported processed
poultry meat selling faster than the locally
processed poultry meat. The sellers attributedthis to the affordability of the imported poultry
meat in terms of prices, its processed and
packaged nature, its availability and the scarcity
of the locally processed poultry meat. On the
contrary, 8(11.1%) of the sellers countered by
saying that locally processed poultry meat soldfaster than imported processed poultry meat. The
reasons cited were the relative better taste of
the locally processed poultry meat and the
perceived wholesomeness of it as presented in
Table 16.
The majority of the sellers, 65(90.3%), sawthe price of poultry meat to be cheaper than thatof other meats on the market whereas 7(9.7%)of the sellers interviewed saw the prices of othermeats being cheaper than that of poultry meatas depicted by Table 17. Comparing the prices ofone pound of locally processed poultry meat tothat of imported processed poultry meat, theprices of one pound of locally processed poultrymeat ranged between GH¢4 - GH¢ 5 whereasthat of the imported processed poultry meatranged between GH¢ 2.5 - GH¢ 4. By this, it isobvious that on the market, comparatively, theprice of one pound of locally processed poultrymeat was more expensive than that of importedprocessed poultry meat. As every consumer isassumed to be a rational being, most consumerswould patronize the imported processed poultrymeat because of cheaper prices irrespective ofother advantages that the locally processedpoultry meat may have over the imported ones,hence, the high patronage that the importedprocessed poultry meat enjoyed. The majority ofthe poultry meat sellers, 93.1%, asserted thatconsumers preferred poultry meat to othermeats that they sold.
Table 14: Sale of ‘Wings’ of Locally/Imported Processed Broiler
‘Wings’ of locally processed broiler ‘Wings’ of imported processed broiler
Sell/Not sell Frequency Percent Sell/Not sell Frequency Percent
Sell 3 4.2 Sell 64 88.9
Not sell 69 95.8 Not sell 8 11.1
Total 72 100.0 Total 72 100.0
Table 15: Sale of ‘Drumsticks’ of Locally/Imported Processed Broiler
‘Drumsticks’ of locally processed broiler ‘Drumsticks’ of imported processed broiler
Sell/Not sell Frequency Percent Sell/Not sell Frequency Percent
Sell 2 2.8 Sell 46 63.9
Not sell 70 97.2 Not sell 26 36.1
Total 72 100.0 Total 72 100.0
44
This article can be downloaded from http://www.iajavs.com/currentissue.php
Indo-Am. J. Agric. & Vet. Sci., 2015 Richard Takyi- Mensah and Richard Kwasi Bannor, 2015
CONCLUSION ANDRECOMMENDATIONSThe results show that generally, the poultry
industry is predominantly a male job. Out of the
36 poultry famers interviewed, 33(91.7%) were
males and the females and the females were
3(8.3%). Out of the 36 poultry farmers
interviewed, 21(58.3%) were people who had no
prior professional poultry farming training before
entering poultry farming. 15(41.7%) of the poultry
farmers had prior professional training before
entering poultry farming. Majority of consumer
respondents representing 84(77.8%) always
bought processed poultry meat for cooking and
24 (22.2%) bought unprocessed or live birds and
processed before cooking with it. The majority,
80(74.1%), of the consumers interviewed
preferred locally processed poultry meat to
Table 16: Sale of ‘Gizzard’ of Locally/Imported Processed Broiler
‘Gizzards’ of locally processed broiler ‘Gizzards’ of imported processed broiler
Sell/Not sell Frequency Percent Sell/Not sell Frequency Percent
Sell 1 1.4 Sell 56 77.8
Not sell 71 98.6 Not sell 16 22.2
Total 72 100.0 Total 72 100.0
Table 17: Sellers’ Perception on the Origin of the ProcessedPoultry Meat that Enjoys Higher Patronage
Origin of processed poultry meat enjoying higher patronage Frequency Percent
Imported processed poultry meat 64 88.9
Locally processed poultry meat 8 11.1
Total 72 100.0
Table 18: Sellers Perception of the Relative Cheapnessof Poultry Prices Compared to that of other Meats
Sellers perception on relative cheapness of prices Frequency Percent
Poultry meat prices are cheaper 65 90.3
Other meat prices are cheaper 7 9.7
Total 72 100.0
imported processed poultry meat whereas 28
(25.9 %) of the consumer respondents preferred
imported processed poultry meat to locally
processed poultry meat. On the parts of poultry
meat commonly purchased by consumers,
17(15.7%) of consumers commonly bought a full
chicken, 14(13.0%) bought wings, 46(42.6%)
bought thighs, 2(1.9%) bought drumstick, 4(3.7%)
bought gizzard, 1(0.9%) bought breast, 10(9.3%)
commonly bought wings, thighs and drumstick
combined,7(6.5%) commonly bought gizzard,
thighs and breast combined and 7(6.5%)
commonly bought wings, thighs and back
combined.
Generally there is high selling of imported
processed layers and broilers wings, drumsticks
and full chicken compared to locally processed
meat of poultry. Eventhough most sellers and
45
This article can be downloaded from http://www.iajavs.com/currentissue.php
Indo-Am. J. Agric. & Vet. Sci., 2015 Richard Takyi- Mensah and Richard Kwasi Bannor, 2015
consumers agree that the taste of the locally
processed broiler and layer are best but foraffordability opts for imported processed ones.
The results indicate clearly if governmentendeavour to assist in reducing the cost ofproduction of local poultry coupled with highertarification on imported processed poultry meat,the poultry industry in Ghana will revive and becompetitive not only in Ghana but Africa and allover the world. We therefore suggest thefollowing:
i. There should be improvement inproduction technology so to ensurereduction in cost of production.
ii. The Ministry of Finance in collaborationwith the Ministry of Trade and Industryneed to consider waiving off or reducingdrastically taxes on imported inputs for thepoultry industry.
iii. The Ministry of Finance, AgriculturalDevelopment Bank, Rural Banks and NGOsneed to extend more loan/ credits facilitiesto poultry farmers at very minimal interestrates.
iv. The Ministry of Food and Agriculture withMinistry of Finance should considerassisting poultry farmer associations whichpossess poultry feed mill to go into largescale cereal production so that feed cost willcome down.
v. MOTI, MOFA, NCCE and NGOs shouldeducate consumers on the positives ofbuying locally processed poultry meat andalso provide consumers and sellers with adatabase of farms from which to source theirlocally processed poultry meat.
vi. The Ministry of Trade and Industry shouldconsider imposition of heavy tariffs onimported processed poultry meat.
REFERENCES1. Asuming-Brempong S, Osei-Asare Y B and
Anim-Somuah H (2006), Food andAgriculture Organization (FAO) import surgestudy: A case study of rice, poultry meat andtomato paste imports to Ghana. Rome: FAO.
2. Aning K G (2006), The structure andimportance of the commercial and villagebased poultry. Accessed from http://www.fao.org/docs/eims/upload/213723/agal_poultryreview_ghana_aug06.pdf
3. Barbut S (2002), Poultry products processing,New York: CRC Press.
4. Bilgili S F (2002), Poultry products andprocessing in the international market place,London: World Markets Research Center.
5. GSS (2012), 2010 Population & housingcensus: Summary report of final results,Accra: Ghana Statistical Service.
6. Kudzodzi W (2008), Trade Ghana: The chillingeffect of frozen poultry imports. Accessed onOctober 17, 2008, from http://www.ipsnews.net/news.asp? idnews=32293.
7. Lubchenco J (2003), “The blue revolution:A global perspective”, World Aquaculture, Vol.34, No. 4, pp. 8-10.
8. LPIU ( 2006), “Projections of the veterinaryservices directorate livestock censusfigures of (1995/1999)], Accra: MOFA
9. MOFA-SRID (2011), Agriculture in Ghana:Facts and figures (2010). Accessed fromhttp://mofa.gov.gh/site/wp-content/uploads/2011/10/AGRICULTURE-IN-GHANA-FF-2010.pdf on 10th February,2015.
10. OECD/FAO (2006), OECD-FAO agriculturaloutlook: 2006-2015: Highlights. New York:OECD Publishing.
11. Rivera-Ferre M G (2009), “Supply vs. demandof agroindustrial meat and fish products: Achicken and egg paradigm?”, InternationalJournal of Sociology of Agriculture and food,Vol. 16, No. 2, pp. 90-105.