Street Vendors in Accra, Ghana - WIEGO
54
Street Vendors in Accra, Ghana Street Vendors in Accra, Ghana by Nana Akua Anyidoho July 2013 Accra IEMS Informal Economy Monitoring Study IEMS Informal Economy Monitoring Study
-
Upload
khangminh22 -
Category
Documents
-
view
0 -
download
0
Transcript of Street Vendors in Accra, Ghana - WIEGO
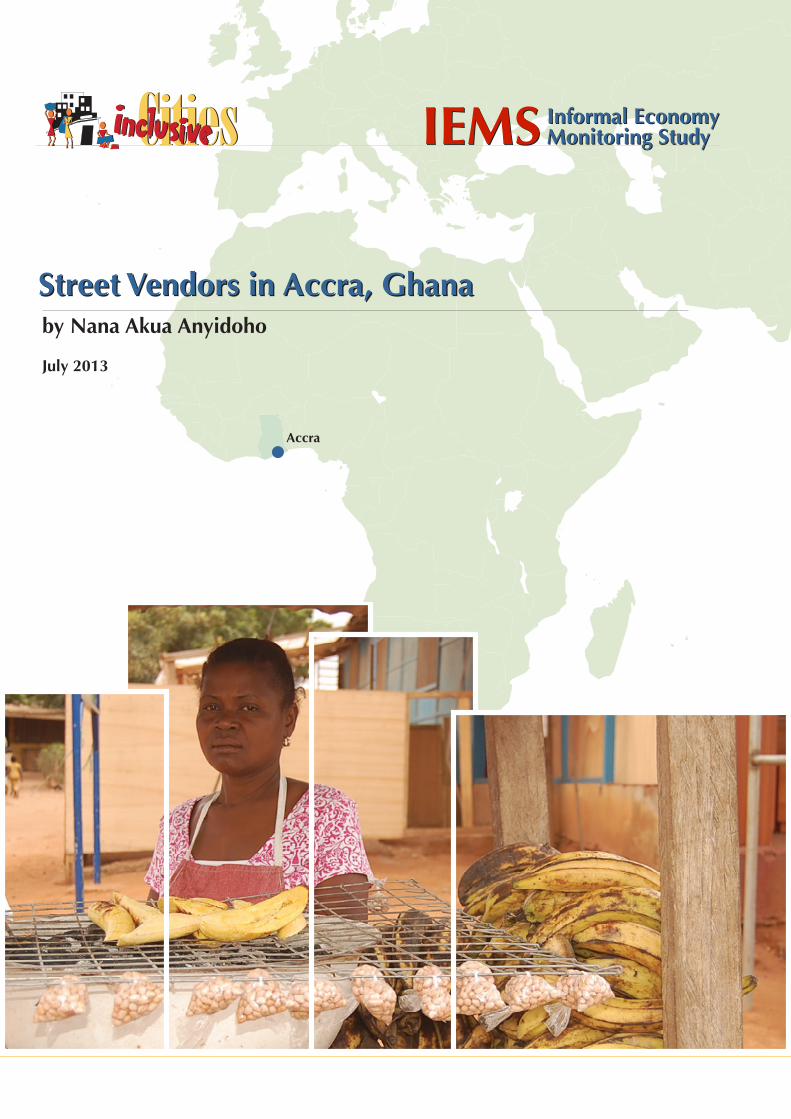
Street Vendors in Accra, GhanaStreet Vendors in Accra, Ghanaby Nana Akua Anyidoho July 2013
Accra
IEMS Informal EconomyMonitoring StudyIEMS Informal EconomyMonitoring Study

Informal Economy Monitoring Study: Street Vendors in Accra, Ghana Field research for this report was conducted in Accra between July - November 2012. The Accra Research Team consisted of: Nana Akua Anyidoho, Clement Adamba, Robert Afutu-Kotey, Dorcas Ansah and Kweku Kyere.
AuthorNana Akua Anyidoho is a Senior Research Fellow at the Institute of Statistical, Social and Economic Research (ISSER) at the University of Ghana. She has a BA in Psychology and a PhD in Human Development and Social Policy.
Nana Akua is interested in the intersection of policy processes with people’s everyday lives. Her recent research focuses on the work aspirations and prospects of young people; policy discourses on women’s empowerment; and the informalization of women’s work.
Membership-Based Organization CoordinatorDorcas Ansah is an experienced development practitioner with a background and expertise in facilitating processes, organizational development interventions, gender mainstreaming and training. Dorcas is the Voice and Advocacy Manager of Strengthening Transparency, Accountability and Responsiveness in Ghana (STAR-Ghana) a multi-donor fund support programme which aims at increasing the influence of civil society and Parliament in the governance and management of public resources.
Technical AdvisorsFrancie Lund is director of WIEGO’s Social Protection Programme, and a Senior Research Associate at the University of KwaZulu-Natal, Durban. She is lead researcher in WIEGO’s Occupational Health and Safety Research and Advocacy for Informal Workers project, and Accra is one of the six cities, in five countries, engaged in this project. She is especially interested in the intersection between social protection and urban planning.
Mike Rogan is a WIEGO Research Officer for the Informal Economy Monitoring Study (IEMS) and is based in South Africa. He is currently a part-time lecturer in the graduate programme of the School of Built Environment & Development Studies at the University of KwaZulu-Natal (UKZN), South Africa. Mike holds a PhD and a Master’s degree from UKZN and a Bachelor of Arts in International Studies from the University of Washington in Seattle. Prior to completing his PhD, he was a research fellow at the Health Economics and HIV/AIDS Research Division at UKZN. His research interests include: gender, employment, health, poverty and inequality, evaluation methodologies and reproductive health.
AcknowledgementsThis report is based on research conducted by Nana Akua Anyidoho, Clement Adamba and Robert Afutu-Kotey of the Institute of Statistical, Social and Economic Research (ISSER) at the University of Ghana. George Owusu provided logistics and administrative support for the quantitative survey. Dorcas Ansah and Kweku Kyere facilitated the research as liaisons between the researchers and the membership-based organizations that participated in the research. We are very grateful to the leaders and members of StreetNet Ghana Alliance in the following locations who took time off work to share their experiences in the focus groups and survey: Makola, Kantamanto, Circle, Madina, Abokobi and Agbogba. We hope that the outcome of the Informal Economy Monitoring Study will be of eventual benefit to you and to other informal workers.
Publication date: July 2013
ISBN number: 978-92-95095-68-7
Published by Women in Informal Employment: Globalizing and Organizing (WIEGO). A Charitable Company Limited by Guarantee – Company No. 6273538, Registered Charity No. 1143510
WIEGO Secretariat WIEGO Limited Harvard University 521 Royal Exchange 79 John F. Kennedy Street Manchester M2 7EN Cambridge, MA 02138, USA United Kingdom
www.wiego.org
Copyright © WIEGO. This report can be replicated for educational and organizing purposes as long as the source is acknowledged.
Full citation: Anyidoho, Nana Akua. 2013. Informal Economy Monitoring Study: Street Vendors in Accra, Ghana. Manchester, UK: WIEGO.
Cover photograph by: D. Mireku
Design by: Julian Luckham of Luckham Creative

About the Informal Economy Monitoring Study The Informal Economy Monitoring Study (IEMS) is a major, longitudinal study of the urban informal economy being undertaken initially at two points in time, 2012 and 2015, in 10 cities around the world: Accra, Ghana; Ahmedabad, India; Bangkok, Thailand; Belo Horizonte, Brazil; Bogota, Colombia; Durban, South Africa; Lahore, Pakistan; Lima, Peru; Nakuru, Kenya; and Pune, India. The study combines qualitative and quantitative research methods to provide an in-depth understanding of how three groups of urban informal workers – home-based workers, street vendors, and waste pickers – are affected by and respond to economic trends, urban policies and practices, value chain dynamics, and other economic and social forces. The IEMS will generate panel data on the urban informal economy.
In each city, a team of five researchers worked in collaboration with a local membership-based organization of informal workers from April 2012 to April 2013 to collect and analyze the first round of the data.
All city research reports, as well as sector reports (one each for home-based work, street vending and waste work), a global report, and other information on the study can be found at www.inclusivecities.org and www.wiego.org.


vStreet Vendors in Accra, Ghana
Table of Contents
Executive Summary 1Policy and Advocacy Recommendations 3
Introduction 4Study Objectives 4Conceptual Framework 4Methodology 5Profile of Member-Based Organizations (MBOs) 7Overview of Street Vending in Accra 7
Part 1: Workers, Households and Enterprises/Sectors 91.1 Characteristics of Individual Workers and their Households 91.2 Characteristics of Workers’ Enterprises 12 Turnover and Working Hours 12 Use of Paid and Unpaid Help 131.3 Descriptions of Sector Activities and Value Chains 14 Categories of Goods and Services 14 Items Sold by Gender and Location 15 Sources of Goods 16 Customers 17
Part 2: Changes in the Sector 192.1 Driving Forces 19 Macroeconomic Forces 19 Government Policies and Practices 21 Value Chain Dynamics 24 Other Driving Forces 262.2 Informal Workers’ Responses to Driving Forces 28 Responses to Macroeconomic Driving Forces 28 Responses to Government-Related Driving Forces 30 Responses to Value Chain Driving Forces 30 Responses to Other Driving Forces 302.3 Intermediary Factors 31 Institutions and Actors 31 Role of Institutions in Obstructing or Supporting Informal Workers 31 Membership-Based Organizations 34
Part 3: Linkages and Contributions 363.1 Economic Linkages 363.2 Policy/City Linkages 373.3 Contributions of the Sector 38
Part 4: Policy Implications 404.1 Summary of Key Findings 404.2 Policy Recommendations 42
References 43
Appendix 44

vi IEMS Informal Economy Monitoring Study
List of TablesTable 1 - Respondents’ Level of Education by Sex (%) 9Table 2 - Selected Household Characteristics by Sex 9Table 3 - Main Source of Household Income by Sex (%) 10Table 4 - Access to Other Types of Household Income, by Sex (%) 11Table 5 - Status in Employment by Sex (%) 11Table 6 - Mean Turnover and Working Hours, by Sex and Location 12Table 7 - Stability of Earnings and Work, by Sex and Location (%) 13Table 8 - Number of Paid and Unpaid Helpers, by Sex and Location 13Table 9 - Types of Support when Unable to Work, by Sex and Location (%) 14Table 10 - Type of Goods Sold by Sex and Location 16Table 11 - Main Customers by Location (%) 18Table 12 - Positive Macroeconomic Driving Forces 19Table 13 - Negative Macroeconomic Driving Forces 20Table 14 - Positive Government Policies and Practices Driving Forces 21Table 15 - Negative Government Policies and Practices Driving Forces 22Table 16 - Positive Value Chain Driving Forces 24Table 17 - Negative Value Chain Driving Forces 25Table 18 - Positive Other Driving Forces 26Table 19 - Negative Other Driving Forces 26Table 20 - Other Types of Work-Related Problems Associated with Street Vending (%) 27Table 21 - Reported Changes in Street Vending Work over the Past Year (%) 27Table 23 - Matrix of Institutions Showing Frequency of Mention and Perception 31Table 24 - Types of Organizations that Are Identified as Being “Unhelpful” 33Table 25 - Types of Organizations that Are Identified as Being “Helpful” 34Table 26 - Institutional Matrix, Accra Focus Group Report 2 35Table 27 - Main Ways Goods Are Acquired, by Location (%) 36Table 28 - Types of Services Used, by Location (%) 37Table 29 - Contribution of Sector to City/Nation (Frequency) 38Table 30 - Mean Monthly Expenditure on Licenses and Permits, by Location (Cedis) 39Table 31 - Mean Monthly Expenditure on Licenses and Permits, by Sex (Cedis) 39
List of Figures, Diagrams and ChartsFigure 1 - Categorization of Items Sold or Work Done 15Figure 2 - Spatial Map, Accra Focus Group Report 2 17Figure 3 - Causal Flow Diagram of Most Important Macroeconomic Negative Driving Force,
Accra Focus Group Report 3 21Figure 4 - Causal Flow Diagram of First Negative Driving Force – Accra Focus Group Report 6 24Figure 5 - Causal Diagram of Most Important Value Chain Negative Driving Force –
Accra Focus Group Report 1 25
1Street Vendors in Accra, Ghana
Executive SummaryRecent statistics show the majority of workers in developing countries earn their livelihoods in the informal economy. The Informal Economy Monitoring Study (IEMS) is a qualitative and quantitative study designed to evaluate the reality for these workers’ lives. With research conducted over three years in 10 cities, the IEMS aims to provide credible, grounded evidence of the range of driving forces, both positive and negative, that affect conditions of work in the informal economy over time. Informal workers and their membership-based organizations (MBOs) are at the centre of the analysis.
The Research in AccraIn Accra, WIEGO partnered with the Institute of Statistical, Social and Economic Research (ISSER) and StreetNet Ghana Alliance, which is composed of MBOs of vendors, traders and hawkers. Two variables were selected in order to draw a purposive quota sample: 1) sex; and 2) location – whether the vendors traded in the city’s Central markets or in non-Central locations. Vendors were selected from three Central market associations: Makola Traders Association, Kantamanto Traders Association, and Circle Traders Association. In the non-Central locations, vendors were sampled from three branches of the Ga East Traders Association: Madina, Agbogba and Abokobi. All participants were fixed-market vendors.
Fieldwork consisted of 15 focus groups involving 75 vendors, held in July and August of 2012. Forty participants were from Central markets and 35 from non-Central locations. Focus groups had between four and six participants each and utilized nine tools – organized around the themes of sector characteristics, driving forces and responses, the institutional environment, and contributions of the sector to the city – to generate data related to the conceptual framework. A subsequent survey was administered between September 5 and November 6, 2012 to 150 vendors, including the 75 focus group participants. In total, 51 men and 99 women took the survey – 76 from Central and 74 from non-Central locations.
Key FindingsThis report analyzes the survey responses and the data in the detailed focus group reports.
The study confirms that informal work is essential to urban livelihoods. Almost 88 per cent of participants rely on informal work as the primary income for their household. Fewer than 9 per cent said their primary source of household income is formal sector wage employment. While the most common form of other income is remittances – received by over 26 per cent of households – only about 3 per cent primarily rely on these.
Men on average enjoy significantly higher turnover (total value of sales) than women vendors, most likely because men more often trade in higher value items, while women tend to sell food or small items. Also, those within Central locations reported turnovers more than twice that of their non-Central counterparts, probably due to the higher customer traffic in the city centre.
However, overall the vendors experience financial instability and hardship, despite working between 56-66 hours in a week. Over 60 per cent reported their revenue had fallen in the past year – yet nearly the same percentage reported a greater volume of sales. This highlights the declining profitability in the sector that many of the vendors described.
Livelihood difficulties within the sector are heightened, the vendors said, mainly by negative macroeconomic forces, problems accessing credit, competition, and a lack of support from local governments.
Positive and Negative Driving ForcesAccra’s market vendors emphasized the impact of negative driving forces over the positive. When they did identify positive forces, all groups most frequently cited special occasions that increased demand for goods. Occasions that slowed sales – whether holidays or rains – had a corresponding negative impact. The second most important positive factor was a healthy economy that increases demand through higher employment and disposable income among the customer base.
A good economy also means loans are more readily available at lower interest rates. In fact, the availability of loans from a variety of sources (including non-bank financial institutions and group-organized rotating savings systems) was a top-ranked positive macroeconomic driving force.

2 IEMS Informal Economy Monitoring Study
However, vendors expressed ambivalence about loans because of high interest rates and the risk that they will be unable to repay their debts. Nonetheless, loans are needed to increase or maintain working capital – and became more necessary due to negative macroeconomic forces. As one noted, “You know, this was not what it was like before. At first, you didn’t have to take loans because you could make enough money to live on, but now….” Another vendor picked up the thread. “There are so many people who have had to run away because they have defaulted on their loans.”
Negative forces loomed larger in the vendors’ lives. Here again, the findings reveal the significant impact of the overall Ghanaian economy on informal workers. The two most frequently cited negative forces, a falling currency and growing inflation, posed great concern. Inflation drove up the cost of living and affected work capital. The depreciating cedi combined with high import tariffs to increase the cost of imported goods, affecting profit margins. While participants frequently gauged the cedi against the rising value of the US dollar, it was noted that for traders who import goods from neighbouring countries, the value of the cedi against the CFA (the currency of francophone West Africa) and the Nigerian naira was just as important. As one male vendor said, “You have to use more of the cedi to buy fewer goods than you would’ve previously.”
However, the most obvious responses to address these problems are not always achievable – 31 per cent of vendors said negotiating lower prices from suppliers is difficult, while 55 per cent said negotiating higher prices with customers is difficult. Losing customers, in particular, is a fear. This is exacerbated by competition from larger retailers and supermarkets.
Competition was an oft-cited concern. Cheap imported goods in the market place were another facet of this problem. In the focus group discussions, competition was often linked to the presence of “foreigners”. While the vendors saw some positive effects of foreign contractors, they saw the activities of foreign traders as detrimental. Seizure of goods by city task forces was also linked to competition when manufacturers call in officials to seize and destroy fake items that are in breach of patents, causing the informal vendors to take a loss.
Perceptions and Relations with GovernmentThe vendors almost uniformly perceived governments negatively, both for their inaction and for actions. Only two positive driving forces were identified in relation to any government. Vendors in one group stated that the city’s designation of a market site and allocation of space to vendors helped them avoid evictions and seizures of goods. Expansion of electricity to new settlements – particularly in the non-Central areas of Agbogba and Abokobi – was the second positive force because it could result in more customers as people move into these areas.
Among the overwhelmingly negative driving forces related to government, the greatest concern was the lack of an environment conducive for work. Vendors cited municipal failures to provide electricity, pipe-borne water, toilet facilities and refuse disposal. In addition to being basic necessities, electricity and pipe-borne water were described by vendors as inputs for their work; food sellers used water to cook, for instance, and tailors needed electricity for their sewing machines. While survey data showed the vast majority of vendors had access to toilets, water and storage, the focus group discussions suggested the quality of the facilities was inadequate. The issue of cost was also raised; for instance, toilet facilities may be privately owned rather than a public provision.
Participants in centrally located Kantamanto market identified garbage piling up as their most urgent concern. In the market there are no designated refuse dump sites and the garbage cans provided by the city (at the insistence of the vendors) are not emptied. This makes for an unhealthy environment that has implications for their personal health and their businesses.
Non-Central vendors were concerned with factors that prevented customers from residing in their area. For instance, women in Abokobi listed bad roads and erratic power supply. Vendors in other areas also identified erratic power supply. Power outages can bring business to a standstill, interfere with access to goods or raw materials, and even cause conflict with clients when deadlines are not met.
The combination of high levies by the city and high taxes by the national government was the second most important negative driving force. These included a variety of fees, levies and taxes collected by city and Central governments, including licenses for stores, daily tolls for use of space, VAT and other income taxes. Duties on imported goods were also mentioned. Vendors complained that these “taxes” are high and increasing, and have been set and increased without consultation with vendors. The

3Street Vendors in Accra, Ghana
point was made that despite collecting revenue, local and national governments do not fulfill their duties towards vendors by providing basic amenities.
Demolition of trading spaces and confiscation or destruction of goods came up as a negative driving force resulting from government action. In particular, vendors decried the policy of removal of vendors and their goods from “unauthorized” locations without providing adequate alternatives. Traders would attempt to find other spaces to trade in, but this was said to be difficult and expensive. The lack of trading spaces was especially acute for non-Central city vendors.
The Accra Metropolitan Assembly (AMA), Ga East District Assembly (GEDA), Madina Zonal Council (MZC) and foreign traders were noted to pose the greatest hindrance in the businesses of participants. The AMA was mentioned most frequently with references to “harassment”, corruption (demanding bribes), and lack of attention to maintenance of markets. (The AMA came up even in focus groups with non-Central vendors who fall under GEDA administration. Most likely, the vendors are not aware of the distinction between the two local governments; some vendors believed that GEDA is under AMA rule.)
Perceptions of MBOs and Other InstitutionsThe survey revealed the vendors felt part of a supportive community. Vendors saw their membership-based organizations, NGOs, and other workers and trade unions as being the most helpful to their work. However, while they viewed MBOs as helpful, when asked in focus groups to name institutions they found influential, StreetNet and its market associations were spontaneously mentioned only rarely.
Financial institutions were perceived as both helping and hindering. As much as participants valued the access to loans, they were as quick to say that the requirement for receiving a loan, and the interests rates and other terms of payments, were unfavourable.
Vendors’ ContributionsThe study made clear that the informal and formal economies in Ghana interact, and that street vendors make significant contributions in both arenas. For example, as their enterprises create banking and credit needs, they become customers of formal financial institutions. They also provide for people’s needs by making goods and services accessible. Especially in the newly-settled locations outside of central Accra, vendors bringing goods into those spaces saves their customers travel time and money. While other informal workers comprise a significant part of the vendors’ customer base, they also sell to workers with formal employment and students in formal institutions.
The informal vendors emphatically stated that they contribute to the city through taxes, fees and levies, and that this revenue and their businesses promote development and bolster the economy. They expressed anger that they do not, in turn, receive adequate services or respect commensurate with their value to the city and the economy.
Policy and Advocacy RecommendationsThe policy environment was found to be inconsistent and generally unsupportive of informal workers at all levels of governance. Recognition of the contribution of street vendors to the economy is essential. National and local governments should shift from an adversarial mode to acknowledging street vendors as citizens, residents and workers with a right to make a living, and greater attention should be paid to the impact of policies and the macroeconomic environment on informal livelihoods. Through active engagement with vendors, officials should find ways to support rather than hinder. This may be through provision of better infrastructure, for example, or by ending practices of harassment and eviction.
Any improvement in the circumstances of informal street vendors will require more mobilization of informal workers. This responsibility will rest on street vendors, but will necessitate outside support. In particular, the Ghana Trades Union Congress, which historically has been a strong advocate for workers’ rights, needs to make a greater effort to overcome the challenges to organizing informal workers.
Finally, care should be taken not to homogenize street vendors. In both policymaking and advocacy, the differing realities of vendors based on their sex and their location should be taken into account.

4 IEMS Informal Economy Monitoring Study
Introduction
Study ObjectivesIt is now widely recognized that the majority of workers in the developing world earn their livelihoods in the informal economy. Advancements in official statistics show that informal employment accounts for more than half of total non-agricultural employment in most regions, and as much as 82 per cent in South Asia and 80 per cent in many sub-Saharan African countries (WIEGO website 2013). Though many studies offer theories to explain the persistence, characteristics and growth of informal employment, few have evaluated the grounded realities of work in the informal economy – and none have done so over time and across a sufficiently large number of sectors and cities. The IEMS seeks to fill this gap.
More specifically, the objective of the study is to provide credible, grounded evidence of the range of driving forces, both positive and negative, that affect conditions of work in the informal economy over time. The study, which places informal workers and their organizations at the centre of the analysis, examines not only the impact of these forces but also informal workers’ strategic responses to them. It is based on a collaborative approach between researchers and membership-based organizations (MBOs) of informal workers to monitor, on an ongoing basis, the state of the working poor in three sectors – home-based work, street vending, and waste picking – and also to build the capacity of MBOs to assess and mediate the driving forces that affect their work.
The study is based in 10 cities, as follows:
Sector(s) Local Partner
Africa
Accra, Ghana Street Vending Institute of Statistical, Social and Economic Research (ISSER) and StreetNet Ghana Alliance
Durban, South Africa Street Vending, Waste Picking
Asiye eTafuleni (AeT)
Nakuru, Kenya Street Vending, Waste Picking
Kenya National Alliance of Street Vendors and Informal Traders (KENASVIT)
Asia
Ahmedabad, India Home-Based Work, Street Vending
Self-Employed Women’s Association (SEWA)
Bangkok, Thailand Home-Based Work HomeNet ThailandLahore, Pakistan Home-Based Work HomeNet PakistanPune, India Waste Picking Kagad Kach Patra Kashtakari Panchayat (KKPKP)
Latin America
Belo Horizonte, Brazil Waste Picking Instituto Nenuca de Desenvolvimento Sustentável de Belo Horizonte
Bogota, Colombia Waste Picking Asociación de Recicladores de Bogotá (ARB)Lima, Peru Street Vending Federación Departamental de Vendedores
Ambulantes de Lima y Callao (FEDEVAL)
Conceptual FrameworkIn the IEMS, the term “driving forces” is used to refer to systemic factors that may impact, in either positive or negative ways, the occupations or livelihoods of urban informal workers. Three categories of “driving forces” anchor the study. First, the IEMS explores the economy as a driving force: that is, the macroeconomic conditions such as inflation, recession, and patterns of growth that may influence working conditions in the informal economy. Second, the IEMS examines government policies and practice, specifically, but not exclusively, at the city level, including urban planning and policies, zoning regulations, sector-specific policies, regulatory norms, and urban infrastructure and service

5Street Vendors in Accra, Ghana
delivery. Third, the IEMS considers sector-specific value chain dynamics, including the power relations between informal workers and their suppliers and buyers, and the role of intermediaries in the value chain. The framework also allows for the identification of other driving forces, such as migration, that may have a significant impact on working conditions in a particular sector or city.
The IEMS assumes that the impact of these driving forces is mediated by institutions and actors related to the particular sector under study in each city. The study examines a range of institutions including government institutions, civil society organizations, and, fundamentally, MBOs of informal workers. It explores the responses of informal workers to key driving forces in each city, as well as the economic, political, and spatial linkages within each sector. Finally, through its sampling design, the study allows for comparisons at the individual level by sex (in cities in which both men and women belong to the partner MBO), employment status, and location of the workplace.
A number of prevailing “myths” about the informal economy informed the study hypotheses and the design of the data collection tools:
Myth #1: The informal economy is not linked to the formal economy. Hypothesis #1: Informal workers are closely linked to the formal economy.
Myth #2: The informal economy is not a part of the modern economy. Hypothesis #2: Informal workers are part of modern chains of production, distribution and services that download risks and costs to informal workers.
Myth #3: Informal workers intentionally “hide” from regulations and avoid the costs of formalization. Hypothesis #3: Informal workers are not hiding from regulations; rather, regulations are unknown, inappropriate, or hostile to informal workers. Hypothesis #4: Economic policies and urban reforms/policies are not supportive of urban informal livelihoods.
Myth #4: The informal economy does not contribute to the city (e.g. informal workers do not pay taxes). Hypothesis #5: Informal workers do pay taxes and other types of fees, but do not get the benefits thereof. Hypothesis #6: Informal workers contribute to the city in a variety of ways. Hypothesis #7: Informal workers are critically dependent on urban infrastructure, but deficits in the quality and appropriateness of infrastructure often undermine their livelihoods.
MethodologyThe IEMS is based on both qualitative and quantitative methods. The qualitative component consists of a participatory informal economy appraisal (PIEA), an innovative method designed to capture systematically the perceptions and understandings of informal workers in their own words, in a focus group setting.1 Each city team conducted 15 focus groups (per sector), in which nine tools – organized around the themes of sector characteristics, driving forces and responses, the institutional environment, and contributions of the sector to the city – were used to generate data related to the conceptual framework. The results of the focus groups were recorded in reports of about 12 pages, on average, immediately after each focus group was conducted; those reports were then analyzed.
The quantitative component consists of a survey questionnaire administered to all 75 focus group participants, plus another 75 workers. Thus an overall sample size of about 150 was achieved (with minor variation in the sample size in some cities/sectors). The questionnaire is designed to supplement the data collected through the focus groups by collecting information on the household profile and income sources of the workers; the assets profile of the workers’ households; detailed information on the enterprise or occupation of the workers; and linkages between the informal economy and the formal economy. The questionnaires were administered using a data-capture tool. It took approximately 90 minutes for each respondent to complete the questionnaire.
1 The methodology was developed collaboratively with Caroline Moser, Angélica Acosta, and Irene Vance, who also trained the city teams in the data collection methods and later in data analysis. PIEA is an adaptation of earlier participatory meth-odologies developed by Chambers (1994), Moser and Holland (1997), Moser and McIlwaine (1999, 2004), and Moser, Acosta and Vásquez (2006).

6 IEMS Informal Economy Monitoring Study
Collectively, the focus groups and questionnaires provide data on the context within which informal workers earn their livelihoods, and the forces that impact, both positively and negatively, on workers’ incomes and working conditions. We are also able to understand how workers adapt their work strategies in the face of these economic, social and institutional forces.
The sampling approach was designed to maintain comparability in results across the 13 city-sectors, on the one hand, and to allow some flexibility as demanded by local circumstances, on the other hand. To the maximum extent possible, the following principles were followed in every city-sector:
• Only MBO members were included in the sample.2
• Each sector sample was based on two variables, as shown in the following table, where possible:
Sector Sampling Variable 1 Sampling Variable 2
Home-Based Work Employment Status Product Category
Self-Employed Sub-Contracted Category 1 Category 2
Street Vending Sex Location of Workplace
Women Men Central city Periphery
Waste Picking Sex Source of Materials
Women Men Fixed Variable
• Each city team developed the “best sample possible,” based on the sampling variables outlined above. “Best” was defined as (a) the most representative sample possible of the study population of MBO members, and (b) the most sensible, feasible, and locally appropriate sample possible. In cities where the partner MBO maintains an updated registry of members with data on the sampling variables, for example, it was possible to develop a stratified random sample that was statistically representative of the MBO population on the sampling variables; in cities where there was no accurate registry, the city team used a quota sampling approach. In each city, the local researchers worked with the MBO to identify what the best possible sample would be, based on local circumstances.
• The second sampling variable – product category for home-based workers, location of workplace for street vendors, and source of materials for waste pickers – was designed to correlate with a degree of vulnerability that stems from sector-specific circumstances. In the street vending sector, for example, vendors who work in the Central city are typically more vulnerable to evictions than those who work in the periphery. Each city team identified the best way to operationalize this variable according to local circumstances.
In Accra, the sampling design was implemented by sampling from three market associations in the Central locations: Makola Traders Association, Kantamanto Traders Association, and Circle Traders Association. In the non-Central locations, we sampled from three branches of the Ga East Traders Association: Madina, Agbogba and Abokobi. We oversampled from the largest associations in both the Central and non-Central locations – Makola and Madina respectively – to make the sample composition somewhat reflective of the relative sizes of the associations, and in an attempt to cover the diversity in types of trades within these larger associations. All participants were fixed-location market vendors. While all the Central vendors worked within (or at least were allocated space in) designated markets, the majority of traders in the non-Central location traded outside of designated markets.
Fieldwork was conducted from July 26 to November 6, 2012 and consisted of data collection through focus groups and a survey carried out at the various market locations. Working with the MBO coordinators and MBO leaders, the researchers selected 75 vendors to take part in 15 focus groups in July and August of 2012. Forty were from the Central markets and 35 from the non-Central locations.3
2 Substantively, being a “member” of an MBO means different things in different cities; in some cities it means being formally registered, for example, while in other cities it implies a looser affiliation.
3 This slight imbalance in number of participants per location reflected differences between the two sets of locations in size of membership, level of organization and accessibility of vendors.

7Street Vendors in Accra, Ghana
The subsequent survey involved 150 questionnaires administered between September 5 and November 6, 2012. In total, 51 men and 99 women participated in the survey – 76 from the city centre, and 74 from the periphery. Included in the survey were 75 respondents of the focus groups.
Profile of Member-Based Organizations (MBOs)4
StreetNet Ghana Alliance (SGA) is a national affiliate of StreetNet International, an alliance of market and street traders working around the world. Formed in 2003, SGA is composed of membership-based organizations (MBOs) of vendors, traders and hawkers.5 Its primary objective is to promote and protect the rights and interests of street vendors. To achieve this objective, it aims to expand SGA at district, regional and national levels; build the leadership capacity of women; collect, document and disseminate information; and engage in advocacy for policies that promote the interests of street vendors.
The alliance has approximately 6,000 members in street and market trading, two-thirds of whom are women. SGA labels itself a national organization and aims to branch out to all 10 regions of Ghana, but currently has two branches in two cities (the capital Accra in the Greater Accra Region and Takoradi-Sekondi in the Western Region). SGA also partners with the Ghana Trades Union Congress (TUC); indeed, two of its MBOs, Makola Market Traders Union of Ghana and the Ga East Traders Union, are associate members of TUC.
For this study, four StreetNet-affiliated MBOs were sampled:
• Makola Market Traders Association
• Circle Traders Association
• Kantamanto Traders Association
• Ga East Traders Association
The first three associations are named for three areas in the Accra city centre in which large markets are located. Makola is the biggest and oldest of the three. The majority of the 2,000 members of the Makola MBO are women, and a large number are traders in cloth. However, they sell other goods including food, clothes and silverware. The pedestrian mall at Kwame Nkrumah Circle is known for the sale of shoes, clothing and mobile phones. Circle has more active male members than Makola. The third market, Kantamanto, has predominantly women vendors selling food products such as bananas, plantain and oranges.
The Ga East Traders Association is made up of three smaller associations: Madina, Agbogba and Abokobi. Of the three, only Madina is a designated market; member vendors in Agbogba and Abokobi often work from a table top in the town or by the road side. In Ga East, some members have a stall in the market but will most of the time sell on the street. Madina is the biggest market in the Ga East District and has a majority male membership. Vendors trade in shoes, provisions, and food products. Trade in the Agbogba and Abokobi localities is on a much smaller scale, with many of the vendors selling provisions and food products such as plantain, cassava and vegetables. Members of the Ga East Traders Association market association are predominantly women.
Overview of Street Vending in Accra Street vending in Ghana is a characteristic of the urban informal economy and must be understood within the contexts of urbanization and a dominant and growing informal economy.
Ghana, like many African countries, is experiencing rapid urbanization, which means that an increasing proportion of the population resides in urban areas. The rate of urbanization is partly explained by the expansion and development of urban areas, and by high birth rates in these areas (Yankson and Bertrand 2012). A third factor is migration into urban spaces because of an ‘’urban bias” in development that sees resources concentrated in a few urban areas (ibid.). The most urbanized region is Greater Accra, which hosts the capital city Accra. It is the smallest of the country’s 10
4 Much of the information in this section was taken from the websites of StreetNet International (streetnet.org.za) and WIEGO (wiego.org/wiego/streetnet-ghana-alliance). Additional information was gathered through key informant interviews with StreetNet leadership.
5 StreetNet Ghana Alliance and StreetNet International make reference to street vending, market trading and hawking as dif-ferent types of activities – trading is in fixed locations, street vending and hawking are itinerant. In this report, we refer to the people engaged in all these activities as “street vendors”.

8 IEMS Informal Economy Monitoring Study
regions, with about 1.4 per cent of total land area, but as of 2010 was home to just over 15 per cent of the country’s population (Government of Ghana n.d.).6 Accra is described as a major city not only because of its disproportionately large population, but also because it is the political, economic and social centre of the country (ibid.).
The urban informal economy can be considered a by-product of the creation of a formal sector during colonial rule from 1884 to 1957. The structure of the economy and colonial administration provided for non-agricultural employment opportunities in urban areas, which were more accessible to men, to the educated, and to urban residents (Tsikata 2008). Others remained on the fringes of this economic structure in what became the urban informal economy (Anyidoho, Dzorgbo and Prah 2013). It is still the case that informal work in Ghana has an overconcentration of women and rural residents, and is less remunerative, and less secure than formal work (Tsikata 2008; Tsikata and Darkwah 2013).
With the economic liberalization policies that were implemented in Ghana from the 1980s as part of an economic reform programme, and the phenomenon of “jobless growth” from the 1990s, the informal economy has expanded to absorb more of the labour force, even as the formal economy has shrunk (Otoo, Osei-Boateng and Asafu-Adjaye 2009; Tsikata 2008). In 1999, the Ghana Statistical Service put the proportion of workers who work in the informal economy at 80.3 per cent and, by some estimates, it is now around 90 per cent (Otoo, Osei-Boateng, Asafu-Adjaye 2009). The majority of informal workers in Ghana are engaged in agriculture, with 25 per cent of workers in informal non-agriculture work. In terms of the urban informal economy, trade employs 46 per cent of workers, out of which 58 per cent are women and 27 per cent men (Budlender 2011). Accurate statistics for the numbers of street vendors is difficult to obtain, although it is known that women dominate informal trade (ibid.).
Policymaking has largely been focused on the formal economy, while the informal is ignored, trivialized or criminalized. As a sub-group of informal workers, street vendors are characterized broadly by policymakers and in the media as nuisances, and there are frequent attempts to constrain them in the name of development, or in order to “beautify” or “decongest” the city (Ghana Trades Union Congress 2011; see also Anyidoho and Asante 2008). This outlook no doubt informed the passage in 2011 and the enforcement of Accra Metropolitan Assembly by-laws that, among other stipulations, prohibit vendors from selling in the street or on pavements. Attempts to enforce the laws through the arrest of vendors and seizure of their goods have resulted in allegations of intimidation, harassment, and assault of vendors by the city task forces (Ghana Trades Union Congress 2011 for illustrative news reports). Sporadic actions by city authorities to corral vendors into market facilities that are neither well-planned nor adequate for their numbers and needs (Ghana Trades Union Congress 2011) is also symptomatic of a disregard for street vendors.
6 Ghana government website at www.ghana.gov.gh

9Street Vendors in Accra, Ghana
Part 1: Workers, Households and Enterprises/Sectors
1.1 Characteristics of Individual Workers and their HouseholdsThe 51 male and 99 female vendors who participated in the survey ranged in age from 20 to 75 years, with a mean age of 41 years. Generally, the male respondents were younger with a median age of 37 compared to a median age of 41 for female respondents. Out of this group of 150 survey respondents, half (37 men and 38 women) participated in the focus groups.
Table 1- Respondents’ Level of Education by Sex (%)
Men Women Total
None 1.96 9.18 6.71Some primary 5.88 9.18 8.05Completed primary 1.96 7.14 5.37Some secondary 54.90 54.08 54.36Completed secondary 25.49 15.31 18.79At least some tertiary 7.84 4.08 5.37Completed tertiary 1.96 1.02 1.34N 51 99 150
Source: Accra IEMS survey data (2012)
The majority (80 per cent) of the 150 survey respondents had at least some secondary education and 14 per cent had at least some primary school education. Only 7 per cent had no formal schooling (table 1). A greater proportion of men than women had completed secondary school and/or had attended tertiary institutions (ibid.).
There was little difference between locations in terms of participants who had some amount of secondary education. However, nine participants from the Central market compared to one in the non-Central location had started or completed tertiary level education, which indicates a higher level of education among our Central sample.
Table 2 - Selected Household Characteristics by Sex
Men Women Total
Household size 3.64 4.24 4.04Number of children7 1.43 1.56 1.52Number of working-age adults 2.15 2.54 2.40Number of pensioners8 0.19 0.12 0.08Ratio of workers to total household size 0.59 0.56 0.57Number of adults who completed secondary school 0.7 1.1 1.0Percentage with:
Other workers in the household 64.71 77.55 73.33Other informal workers in the household 62.75 55.10 57.33Other formal workers in the household 9.80 32.65 25.33
N 51 98 149
Source: Accra IEMS survey data (2012)
7 In the study, children were defined as persons 15 years and younger.8 In Ghana, the compulsory age for retirement for workers in the formal sector is 60 years.

10 IEMS Informal Economy Monitoring Study
Table 2 shows that the dependency ratio of the households of our sample of vendors was 0.6. Roughly three-quarters of respondents were in a household with at least one other worker, and this worker was twice as likely to be an informal rather than a formal worker.
There were observed differences between the sexes with regard to household characteristics. The household sizes of women were higher than those of men, and more likely to have other workers in them. Further, more women reported having formal workers in their households.
Table 3 - Main Source of Household Income by Sex (%)
Men Women Total
Your own informal business/enterprise/work 96.08 69.39 78.52Earnings from informal work by other household members
0.00 14.29 9.40
Formal sector wage employment (respondent) in public sector
1.96 1.02 1.34
Formal sector wage employment (respondent) in private firm
1.96 2.04 2.01
Formal sector wage employment (other household members) in public sector
0.00 8.16 5.37
Formal sector wage employment (other household members) in private firm
0.00 0.00 0.00
Non-agricultural business of other household members
0.00 0.00 0.00
Social assistance/pension/other benefits 0.00 0.00 0.00Rent, interest, dividends, savings 0.00 1.02 0.67Remittances 0.00 4.08 2.68N 51 98 149
Source: Accra IEMS survey data (2012)
Table 3 shows that 79 per cent of survey respondents provided the main source of income for their households through their informal work. A much higher proportion of men (96 per cent), compared to women (69 per cent), were the main breadwinners for their households.
A very small number of the vendors interviewed (3 per cent or five vendors) had primary occupations in the private or public formal sector, from which their households obtained their main source of income. Another 5 per cent of respondents, all women, reported that their household’s main source of income was from public sector formal work undertaken by another household member.
Overall, then, formal work accounted for the main income of less than 9 per cent of respondents’ households, while informal work (by respondents or another household member) provided the main source of income for 88 per cent of the households of respondents.
Table 3 also shows that about 3 per cent of households, and exclusively those of female respondents, relied on remittances as their main source of household income. As shown in table 4, remittances were a means of supplementary income for about a quarter of households.

11Street Vendors in Accra, Ghana
Table 4 - Access to Other Types of Household Income, by Sex (%)
Men Women Total
Government grants 0.00 2.04 1.34Unemployment payout 1.96 0.00 0.67Worker’s compensation 5.88 2.04 3.36Rental income 7.84 15.31 12.75Retrenchment package 9.80 5.10 6.71Child maintenance 0.00 17.35 11.41Remittances 11.76 33.67 26.17Pension 1.96 4.08 3.36N 51 98 149
Source: Accra IEMS survey data (2012)
There were striking gender differences with regards to other sources of income. While remittances were the most significant source of additional household income for both men and women, women were more likely to report this. Further, the women’s households were more likely to benefit from rental income and child maintenance. Income related to wage employment (worker’s compensation, retrenchment packages, unemployment payouts, and pension) were relatively insignificant. Where these were available, male respondents and their households were more likely to receive them, according to their self-reports. The exception was pensions, which were more available to female vendors and their households (table 4.)
Table 5 - Status in Employment by Sex (%)
Men Women Total
Own account worker 92.16 95.92 94.63Employer 0.00 0.00 0.00Contributing family worker 1.96 1.02 1.34Employee 5.88 3.06 4.03Member of a co-operative 0.00 0.00 0.00Casual day labourer 0.00 0.00 0.00Industrial outworker 0.00 0.00 0.00N 51 98 149
Source: Accra IEMS survey data (2012)
The vast majority (95 per cent) of workers surveyed were own account workers. Four per cent were employees and 1 per cent contributing family workers (table 5). In keeping with the sampling design, which targeted members of vendor associations, we did not have in our sample casual day labourers, industrial outworkers or members of co-operatives.

12 IEMS Informal Economy Monitoring Study
Earnings vs. Turnover The data presented here were generated through a question designed to capture turnover—that is, the total value of sales. They do not take into consideration the cost of sales (opening stock plus later purchases of stock) or other expenses incurred in generating the sales, such as transport, storage, and fees. The literature on income clearly establishes that it is very difficult to capture distinctions between turnover, gross earnings, and net earnings reliably. As with similar studies, these data should not be taken out of context and should be interpreted with caution.
Data on turnover from all cities included in the IEMS study showed very high standard deviations and means that far exceeded medians. Means (rather than medians) for turnover are presented in the IEMS city reports.
1.2 Characteristics of Workers’ Enterprises
Turnover and Working HoursThe survey aimed to establish patterns of difference in working hours and turnover (total value of sales), by sex and by the location of vendors. (See the text box “Earnings vs. Turnover” for a discussion of terminology.)
Table 6 - Mean Turnover and Working Hours, by Sex and Location
Central Non-Central
Men Women Men Women
Mean monthly turnover (cedis)
3,677.70 2,491.73 1,464.78 1,081.44
Mean hours per week (last week)
66.03 55.95 57.50 58.72
Mean months per year
11.33 11.34 11.29 10.27
N 27 47 24 51
Source: Accra IEMS survey data (2012)
Vendors in the markets in the city centre reported higher turnover than those on the periphery: the former reported average turnover of ¢2,924 per month compared to ¢1,204 for non-Central vendors.9 As a percentage, the average turnover of non-Central vendors was 41 per cent of that of Central vendors.
Male vendors reported higher turnover on average: the combined average monthly turnover for men in Central and non-Central locations was ¢2,636; for women it was ¢1,758. In other words, across all locations, women’s average turnover was about two-thirds of men’s turnover. The difference between the sexes was slightly more marked between men and women in the Central markets, where women’s reported turnover was 68 per cent of men’s turnover, compared to 74 per cent for women in the non-Central locations.
Vendors reported working an average of 59 hours a week, which is nearly 10 hours a day in a six-day work week. Men in the Central location appeared to work the most hours in a week (table 6). Vendors reported working a little more than 11 months out of the year, with the exception of women in the non-Central locations, who worked about a month less than everyone else. The differences in time expended on work do not appear to be significant enough to explain the differences in turnover between locations and between men and women. Rather, part of the explanation may lie in the segmentation in goods sold by location and sex (see section 1.3 on sector activities and value chain).
9 The cedi-dollar exchange rate at the time of fieldwork in August 2013 was approximately US $1 = ¢1.86.

13Street Vendors in Accra, Ghana
Table 7 - Stability of Earnings and Work, by Sex and Location (%)
Central Non-Central
TotalMen Women Men Women
Revenue fallen over past 12 months 62.96 59.57 62.50 62.75 61.74Would have liked more hours 18.52 17.02 25.00 15.69 18.12Have a second job 18.52 4.29 50.00 28.00 22.15N 27 47 24 51 149
Source: Accra IEMS survey data (2012)
Sixty-three per cent of vendors stated that their revenue had fallen in the past year (table 7). Despite this, when asked if they would want to work additional hours in their current work, only 18 per cent of the vendors interviewed said “yes”. Moreover, only 33 vendors (22 per cent) said they had second jobs; out of these, 12 said their second job still involved trading.
Interestingly, a greater number of vendors in the non-Central location (half the men and more than a quarter of the women) had second jobs. This might be a reflection of our observation that non-Central vendors generally have smaller enterprises, which may leave room for, or even necessitate, other income-generating work.
Use of Paid and Unpaid HelpAbout a third of vendors surveyed reported having used unpaid help in the previous week compared to 17 per cent who had used paid help. During the busier times of the year, more vendors made use of help – though still most commonly unpaid help from family members (table 8).
Table 8 - Number of Paid and Unpaid Helpers, by Sex and Location
Central Non-Central
Men Women Men Women
Last WeekPercentage with:
Unpaid family 11.11 14.89 37.50 31.37Unpaid non-family 0.00 4.26 0.00 3.92Paid (both family and non-family) 29.63 10.64 29.17 17.65
At the busiest time of the yearPercentage with:
Unpaid family 11.11 14.89 37.50 33.33Unpaid non-family 0.00 4.26 0.00 9.80Paid (both family and non-family) 40.74 10.64 29.17 21.57N 27 47 24 51
Source: Accra IEMS survey data (2012)
Vendors in the non-Central locations made greater use of unpaid family members than those in the Central locations, and more male vendors made use of paid help. Both these facts could plausibly be explained by the differences in size of enterprise and in the type of goods sold by location and sex of vendor. Generally, non-Central vendors tended to have smaller trades and sold less expensive products; the women in particular tended to sell cooked food. These smaller enterprises might lend themselves to involvement by family members. With regard to the use of paid help by more men than women, that might be explained by the fact that men have higher turnover of goods (see table 6) and may more easily be able to afford such support.

14 IEMS Informal Economy Monitoring Study
Table 9 - Types of Support when Unable to Work, by Sex and Location (%)
Central Non-Central
TotalMen Women Men Women
No support 44.44 40.43 16.64 45.10 38.93An employee will take over 25.93 10.64 25.00 13.73 16.77Household member will take over 11.11 19.15 37.50 41.18 28.19Friend will take over 3.70 12.77 12.50 0.00 6.88Another informal worker will take over 14.81 23.40 16.67 3.92 14.43Will work more on return to work 0.00 2.13 4.17 0.00 1.34N 27 47 24 51 149
Source: Accra IEMS survey data (2012)
Vendors were asked about support available to them when they were unable to work. Table 9 shows that the most frequent response was there would be no support, which implies that the business would close temporarily. The second most common response was that a household member would take over; this option seemed to be more used by non-Central vendors. Again, the explanation for this could be the smaller sizes of their trade, which could lend themselves more easily to someone taking over; that is to say, the nature of their trade may not require considerable skill or knowledge to undertake. Also, many of the non-Central vendors sold their goods close to their homes, unlike the Central vendors who were all located in or around bigger markets. This might make it easier for family members of non-Central vendors to be available to look after the businesses.
Tables 8 and 9 indicate that vendors make use of paid family and non-family help. This appears to contradict table 5, which indicates that there were no self-reported employers in our sample. The explanation may be found in vendors’ description of how they used such help; they tend to hire workers either for a period, such as when the vendor is indisposed, or to provide a particular service, such as unloading goods or packing up wares. If vendors use paid help occasionally and for short-term engagements, then they might not think of these helpers as “employees” or themselves as “employers” per se.
1.3 Descriptions of Sector Activities and Value ChainsThe study gathered information on sector activities and value chains primarily in the focus group discussions with vendors, rather than through the survey.
Categories of Goods and ServicesVendors categorized their trade into five groups based on items that were frequently sold together by the same vendor (e.g. canned food, rice and other provisions) or consumed or used together (e.g. jeans, shirts and shoes).
Food: Food, whether cooked or uncooked, was the most commonly sold item. Cooked foods were sold almost exclusively by women in the non-Central locations; examples of such food were rice, roasted plantain, banku and fufu. Uncooked food included perishable items (e.g. fruits, vegetables, honey, bread, meat and frozen foods) and non-perishable goods (e.g. water, drinks, canned goods and gari).
Items of clothing: This category consisted mostly of items of clothing such as materials, used shoes, used clothes and bags, as well as perfume and cosmetics. In one group, participants included linens (towels, bedsheets, chair backs, etc.) with clothing.
Construction materials: Materials used in the construction industry were sold exclusively in the non-Central areas, and mainly by men. This is likely because these are growing settlements where there are many on-going construction projects, both residential and business. Items sold by vendors included cement, tiles, and electrical items such as wiring and bulbs.

15Street Vendors in Accra, Ghana
Services: Participants distinguished the activity of buying and selling (which they referred to as “trading”) from manufacturing goods for sale. The latter set of activities – dressmaking, masonry, shoe-making, hairdressing, furniture making, etc. – were characterized as “services”.
Other goods: In the focus groups, there were often items that tended to be put in a category by themselves because they often did not fall into any of the above-mentioned four categories. Goods in this category included cooking pans, spectacles, mobile phones, books, car spare parts, CDs, and vouchers for making mobile phone calls.
Figure 1 shows one such categorization in a focus group of food items on the extreme left, a number of items that can be classified under “other” and, in the middle, the “service” of dressmaking.
Figure 1 - Categorization of Items Sold or Work Done
Bush meatfresh
TraderSelling generalgoodsMen’s clothes
Electrical andElectronics
Nails, Sharpeningof cutlass andcarpentry
Bush meatdry
Sometimesoranges,(phone)units, and roasted corn
Source: Three women and three men, Accra street vendors, 30 August 2012
Items Sold by Gender and LocationTable 10 indicates that the two most frequently sold items by vendors were food products and clothes. More women than men sold food items, and more men than women sold cloth and clothes. From table 10 and the focus groups discussions, it seemed that men sold imported, durable and higher value goods than women; these included used clothes, building materials, books and stationary, spectacles, electrical and so on.
There also appeared to be differences in items sold by location. For instance, within the focus group sample of 75, there were more vendors in clothing material and other clothing items in the Central city groups, while the vendors in cooked food were all from the non-Central markets. The focus groups also included a number of vendors dealing in construction materials who were located in non-Central markets, around which settlements are growing. Within the city centre itself, the markets were physically segregated by goods so that, for example, cloth vendors were predominantly located in Makola market, perishable foods in Kantamanto and used clothes at Circle.

16 IEMS Informal Economy Monitoring Study
Table 10 - Type of Goods Sold by Sex and Location
Item Category Total
Sex Location
Men Women Central non-Central
Food – cooked 9 1 8 0 9Food – uncooked 20 4 16 14 6Clothes, clothing material and other items of clothing (shoes, bags, etc.)
22 15 7 17 5
Cosmetics 2 0 2 1 1Building materials 6 5 1 0 6Service 6 6 0 3 3Other 10 6 4 5 5Total 75 37 38 40 35
Source: Accra IEMS focus group data (2012)
Sources of Goods A spatial map was created by each focus group as a pictorial representation of the locations from which vendors sourced supplies, the location of their businesses and of their customers. Figure 2 is a map developed by a focus group of three men and three women from the Central Makola market and the non-Central Abokobi market, located approximately 12 kilometres apart. (The bottom of the map shows a road leading from the centre of town, Kwame Nkrumah Circle, out to the Abokobi, Agbogba and Madina areas in the Ga East district).
The three Central vendors were located in officially designated and organized markets – Makola and the Circle pedestrian mall – in contrast to the three non-Central vendors who operated from roadsides or outside of designated market spaces. In terms of their customers, the vendors in this group sold to other established businesses such as chop bars, stores, carpenters and electricians, as well as to the general public. The three women in this focus group sold food; this is consistent with the finding that women dominated this type of trade (see table 10).
The spatial map (which was done in the focus groups) shows the links between vendors in the two locations, with the non-Central vendors often sourcing their products from the city centre. For example, a woman in a non-Central location sold imported Chinese shoes she sourced from Central Accra. Other vendors procured their goods locally within Accra, but were able to report that these products were originally from outside the country. The cloth sellers mentioned that they sourced their products from Togolese traders who imported goods from their country into Ghana. The vendor of dried cow meat also mentioned her products came in from Niger. In other focus groups, vendors said that the used shoes they purchased from Kantamanto market for resell originated from the United Kingdom and Spain.

17Street Vendors in Accra, Ghana
Figure 2 - Spatial Map, Accra Focus Group Report 2
Source: Three men and three women, Central and non-Central, August 30, 2012
CustomersIn the survey, as well as in the focus groups, vendors referred to “the general public” as their main customer base (table 11). The focus group discussions highlighted sub-groups of the general public, depending on goods sold and location of the vendor. In the focus groups, “workers” were consistently identified as an important subset of customers. This may be because workers are income-earners who have purchasing power. It could also be because many of the traders were mainly in Central Accra where many businesses, both formal and informal, are situated.

18 IEMS Informal Economy Monitoring Study
Table 11 - Main Customers by Location (%)
Central Non-Central Total
Formal businesses 2.70 7.89 5.33Informal businesses 8.11 9.21 8.67Other informal workers 10.81 10.53 10.67Personal family/Friends 47.30 35.53 41.33General public 91.89 82.89 87.33Private individuals 78.38 47.37 62.67Other 0.00 9.21 4.70N 74 76 150
Source: Accra IEMS survey data (2012)
Another group commonly mentioned both in Central and non-Central locations were students; this group was described as consumers of clothes, provisions for school, books, cooked food. One woman who had traded in clothing for 24 years targeted both individual students and workers and their institutions as customers. She said having orders from schools and companies was good for business but, she said, “You don’t get orders like these all the time” (Focus Group Report 4, July 8, 2012).
Vendors also identified other vendors as customers. This would be in cases where one vendor might supply inputs to another or sell items in bulk for retail. In many cases, as we have discussed, vendors in the non-Central locations would source their inputs or products from those in Central Accra. For instance, those vendors that manufactured goods or provided “services” such as tailoring were in turn customers of vendors who sold the inputs they needed. One set of focus group participants mentioned the importance of foreigners as a set of customers: “When foreigners come to our countries, it helps our businesses since they like to buy the African wear that we sew” (Male participant, Focus Group Report 6, July 20, 2012).
While the majority of vendors had customers within the city, others said they had customers outside Accra or even outside the Greater Accra Region, who would either come to the market to make purchases or to whom the vendors might sometimes travel to do business. In figure 3, traders showed that their customers were in Makola (the major market in the city centre), in the larger Accra area, but also in Kumasi and Mankessim in the Ashanti and Central Regions.
Note that workers, students and foreigners are likely included under the label of the “general public”, “private individuals”, “personal family/friends” and “other informal workers” in the survey responses (table 11).

19Street Vendors in Accra, Ghana
Part 2: Changes in the Sector
2.1 Driving ForcesIn the focus groups, vendors were asked to identify the changes in the sector that were either supporting or hindering their work. These forces were categorized as relating to the macro economy, government policies and practices (especially at the city level), the value chain, and a category for “other” forces outside of these three. For each category, the focus groups were asked first to list as many positive and negative forces as they could, and then to rank them according to degree of importance. The tables in this section show how often a particular force was ranked as the first, second or third most important across all the focus groups.
Macroeconomic ForcesTable 12 makes clear that the top-ranked positive driving force was availability of loans for their enterprises. They cited a variety of sources, including non-bank financial institutions and group-organized rotating savings systems. Vendors described loans as a way to increase or maintain working capital. They said this was necessitated by the falling value of the cedi and the rising prices of supplies, which were both identified as important negative driving forces, as we will discuss. It is important to note, however, that vendors expressed some ambivalence about loans because of the high interest rates, which they said could have the undesirable effect of driving one into further debt.
Table 12 - Positive Macroeconomic Driving Forces
Frequencies
Ranked #1 Ranked #2 Ranked #3 Total Frequency
Availability of loans 2 0 1 3
Money in the system 1 1 0 2
Development projects 0 1 1 2
Fall in price of inputs 0 0 1 1
Source: Accra IEMS focus group data
The next two positive forces – “money in the system” and development projects – were related to the ability of consumers to make purchases. A positive driver for business was when the economy was generally good and customers had greater disposable income, or in more specific periods such as the end of the month when workers had been paid. A second positive driver was when people invested in building houses or real estate, resulting in money circulating within the economy, ultimately benefitting vendors.
By far the most frequently mentioned negative macroeconomic driving force in the focus groups was the depreciation of Ghana’s currency, the cedi, against other currencies (table 13). Participants frequently gauged the value of the cedi against the rising value of the dollar10 but, as participants in one focus group pointed out, for traders who imported goods from neighbouring African countries, the value of the cedi against the CFA (the currency of francophone West Africa) and the Nigerian naira was just as important:
“People hear more about the way the cedi is falling against the dollar because this affects the bank people11 who sit in offices. No one is talking about the way the cedi is falling against the CFA.”
Male participant, Accra Focus Group Report 9, August 2, 2012
Figure 3 is a causal flow diagram that shows the effects of the depreciation of the cedi on vendors’ work. Participants in this focus group said that the depreciation of the cedi to the dollar affected all aspects of the economy. An important effect on work, participants said, was the loss in revenue and business capital.
10 From January to August of 2012, the cedi depreciated by 18 per cent (Ghana Business News, September 12, 2012, Ghana cedi falls 18% against US dollar first eight months of 2012 – BoG. Accessed February 15, 2013 on http://www.ghanabusiness-news.com/2012/09/12/ghana-cedi-falls-18-against-us-dollar-first-eight-months-of-2012-bog/)
11 In the context of his use of the term and the general discussion, it appears this was a reference to office workers generally.

20 IEMS Informal Economy Monitoring Study
P. (male vendor) said, “We are unable to buy more inventory to trade in. You have to use more of the cedi to buy fewer goods than you would’ve previously.” A. (male vendor) added, “If you have, say, GHC 100, what you can buy now is less than what you used to get with the same amount of money.”
A.M. (male vendor) also noted that depreciation of the cedi “leads to increases in the cost of inputs leading to increase in the cost of products.” And yet, A. (male vendor) said, when the wholesale prices did increase, they were unable to increase their prices by the same proportion because they would lose customers.
Focus Group Report, Accra FG 3, July 5, 2012
Table 13 - Negative Macroeconomic Driving Forces
Frequencies
Ranked #1 Ranked #2 Ranked #3 Total Frequency
Currency depreciation 5 3 0 8
High prices of inputs/supplies
3 3 1 7
Bad economy 0 0 2 2
High interest rates 1 0 0 1
Unemployment 1 0 0 1
Unavailable supplies 0 0 1 1
Source: Accra IEMS focus group data (2012)
The second ranked negative economic driving force was what vendors referred to as “high” and “increasing” prices. Their reference here was to the prices of inputs and imports, as well as the cost of living generally, as the following quotes indicate:
“The prices of [raw] materials go up often, sometimes even on a weekly basis,” G. said. GR gave an illustration of the seriousness of this problem: “Just about a week ago, I went to buy some materials for GHC 3.00. I went there again a couple of days ago and the price has been increased to GHC 5.00. How do we survive under these conditions?”
Focus Group Report, Accra FG 6, July 20, 2012
“The price of everything – including rent, school fees, etc. – goes up and this has an effect on how much money we have to trade.”
Male participant, Focus Group Report, Accra FG 9, August 2, 2012
When asked in the survey to identify work-related problems associated with street vending (outside of infrastructure issues and harassment), 31 per cent of vendors mentioned the difficulty of negotiating lower prices from suppliers and 55 per cent mentioned the difficulty of negotiating higher prices with customers (which might otherwise be a viable strategy for offsetting some of the increase in cost of inputs). These were the two problems with the highest mentions, in addition to the problem of competition from larger retailers and supermarkets, which was identified as a problem by 33 per cent of vendors surveyed.
The three other driving forces in table 13 are loosely related to the depreciation of the currency and to inflation: high interest rates, unemployment, and a bad economy (including the situation of workers not being paid on time). Vendors explained that interest rates affected their work to the extent that they had to spend potential business capital on repayment of loans. Unemployment and a bad economy implied a reduction in the disposable income of customers and, by extension, lower sales for vendors.

21Street Vendors in Accra, Ghana
Figure 3- Causal Flow Diagram of Most Important Macroeconomic Negative Driving Force, Accra Focus Group Report 3
Effects Response
It affects everything: books, cloths, food.
We cannot buy more because of the
increased rate.
Cost of sales rise; more money is
required to purchase the same.
We increase the price of the products by high
percentage. That will help us to get more money.
We are forced to increase prices, hence reduction
in sales.
We are unable to shift
the cost to the buyer.Increase of dollar
Cost of inputs go up, hence there is an increase in cost of
production.
Source: Four men, street vendors in non-Central Accra (Madina), July 5, 2012
Government Policies and PracticesIn the focus groups, the government was almost uniformly perceived as, at best, unhelpful and, at worse, a hindrance to vendors. Thus, only two positive driving forces were identified in relation to the city and the national government (table 14). Vendors in one group stated that in the cases where the city had designated a site for the market and allocated space to vendors, this helped them to avoid “harassment” in the form of evictions and seizures of goods (Accra Focus Group Report 3, July 5, 2012).
Second, the expansion of electricity access to new settlements in the non-Central areas of Agbogba and Abokobi, in particular, meant an increase in customers as people would likely move into these areas (Accra Focus Group Report 8, July 29, 2012).
Table 14 - Positive Government Policies and Practices Driving Forces
Frequencies
Ranked #1 Ranked #2 Ranked #3 Total Frequency
Having permanent/allocated site 1 0 0 1
Infrastructure (expansion of electricity access)
0 1 0 1
Source: Accra IEMS focus group data
The negative driving forces related to the government were the actions and inaction of local and national public bodies (table 15).

22 IEMS Informal Economy Monitoring Study
Table 15 - Negative Government Policies and Practices Driving Forces
Frequencies
Ranked #1 Ranked #2 Ranked #3 Total Frequency
Infrastructure/work environment (city)
1 1 1 3
Taxes and duties (national) and city levies
1 1 1 3
Harassment from government authorities (city and national)
0 0 2 2
Lack of publicity (city) 0 0 1 1
Source: Accra IEMS focus group data
The first ranked force was the lack of an environment conducive for work. Vendors attributed this situation to the government’s failure to provide four basic amenities – electricity, pipe-borne water, toilet facilities and refuse disposal. In addition to being basic necessities, electricity and pipe-borne water were described by vendors as inputs for their work; food sellers used water to cook, for instance, and tailors needed electricity for their sewing machines.
Participants in a focus group held in Kantamanto market in Central Accra, who identified poor sanitation as their most urgent problem, described garbage piling up in the market because there were no designated refuse dump sites and because the garbage cans that the city authorities had provided (at the insistence of the women) were not emptied. This, they said, made for an unhealthy environment that had implications for their personal health and for their businesses:
“We don’t have a place to dump refuse generated from the market. The market becomes filthy and this keeps customers away,” said R. (female vendor). M. (female vendor) stated it even more forcefully: “Our sheds have been engulfed by filth; it’s difficult to breathe in the market.” R. came in again, “The people who come to empty the toilet come in the morning and the whole place becomes difficult to stay in. This drives away customers.” Though the traders said they had made many complaints about the sanitary conditions in the market to StreetNet and the AMA, nothing had been done.
Focus Group Report, Accra FG 7, July 27, 2012
The situation described in the focus groups appears at odds with survey data that show very high levels of access to toilets, water and storage, with at least 85 per cent of vendors surveyed stating that they had access to each of these facilities. (The figure was higher for the Central vendors, with 100 per cent of respondents saying they had access to toilets, and over 90 per cent saying they had access to running water and storage facilities). However, merely asking whether vendors have access to these amenities does not get to the question of their adequacy. What the focus group discussions perhaps suggest is that it is the quality of the facilities that is in question. There is also the issue of their cost; for instance, toilet facilities may be available but these might be privately owned rather than a public provision.
The combination of high levies by the city and high taxes by the national government was the second most important negative driving force in this section. Frequent mention was made in the various focus groups of “taxes”, but it is clear from the discussion that this was a generic term for a variety fees, levies and taxes collected by city and Central governments, including license for stores, daily tolls for use of space, VAT and other income taxes. Included in this category also were duties on imported goods. Vendors complained that these various “taxes” were high and increasing and were set and increased without consultation with vendors. Also, the discussion of these taxes and fees was in the context of local and national governments not fulfilling their duties towards vendors by providing basic amenities and services in the market, such as garbage disposal, toilets, and market cleaning among others. As one Central city vendor put it, “When it comes to taking money, they are very active, but they don’t help in the development of the market” (Male participant, Focus Group Report, Accra FG 9, August 2, 2012).

23Street Vendors in Accra, Ghana
The third-ranked negative driving force was “harassment” of vendors by both city authorities and by the national government over vendors setting up shop or doing business in “unauthorized” locations. Yet, vendors pointed out, the authorities did not provide vendors with adequate or convenient places from which to operate:
Participants said that the city authorities hindered their businesses by chasing traders from streets and sometimes physically assaulting them. J. (female vendor) recounted an incident involving the task force and a member of their union who was beaten and then locked up in a police cell.
Focus Group Report, Accra FG 14, August 22, 2012
Vendors also expressed the opinion that the city authorities were not even-handed in allocating space to vendors in the markets:
A. (male vendor) added that the task force allowed the Nigerian traders to sell where they were not supposed to because these other traders bribed the task force personnel.
Focus Group Report, Accra FG 14, August 22, 2012
M. (female vendor) started on the government about how badly they treated traders in not giving them places to trade, and chasing them around instead. Another participant started to chip in a point in agreement. “No, no, wait, let me finish” M. said, rising out of her chair. “They (the government) will say they are building a market, but when it’s finally done, people with more money would have taken it over and then those who originally wrote their names are left out. They need to think of us poor people.”
Focus Group Report, Accra FG 2, July 1, 2012
Lack of publicity as a negative driving force was specific to the Pedestrian Mall in the centre of Accra, at the Kwame Nkrumah Circle. Vendors complained about slow business in the market and attributed it in part to the lack of effort on the part of the city to advertise the market.
Figure 4 relates to the first ranked negative driving force of inadequate infrastructure. The figure is taken from a focus group with vendors in Makola market in Accra Central who described the impact on their business situation of unreliable electricity supply:
Participants identified four key areas by which the erratic power supply situation in the city impacted their businesses. In particular, for the designing and tailoring trade, which relied heavily on electricity, a blackout meant that business came to a standstill.... Second was the conflict that arose between the traders and their clients when orders were not delivered on schedule….The erratic power supply brought about challenges with regard to access to raw materials or products since the production activities of the suppliers themselves might be affected by the lack of electricity. When supplies are scarce, prices go up, affecting sales and profit margins.
Focus Group Report, Accra FG 6, July 20, 2012

24 IEMS Informal Economy Monitoring Study
Figure 4 - Causal Flow Diagram of First Negative Driving Force – Accra Focus Group Report 6
Effects Response
Reduces income
Have problems with
customers
We are put under pressure
About 2% can afford to use
generators
Leave shop to avoid quarrel with
customers
Explain to customers politely
to understand
Difficult access to goods
Unstable power supply
Source: Five men, focus group with Makola vendors, July 20, 2012
In general, non-Central city vendors, some of who were not located in formal markets, were concerned with general development questions such as access to electricity and good roads that would attract more residents into their areas, giving them a larger customer base. For instance, in one focus group of Abokobi women, the negative factors listed included bad roads and erratic power supply (Focus Group Report, Accra FG 1, June 26, 2012). By contrast, vendors in the city centre tended to be concerned with infrastructure and services that were specific to the markets in which they were located (see Focus Group Report, Accra FG 9, August 2, 2012).
Value Chain DynamicsThe focus groups explored positive and negative forces operating in the value chains in which the workers operated.
Table 16 - Positive Value Chain Driving Forces
Frequencies
Ranked #1 Ranked #2 Ranked #3 Total Frequency
Credit from suppliers 2 1 0 3
Quality of inputs 0 1 2 3
Contract with companies 0 0 1 1
Low transport costs 0 0 1 1
Inputs delivered on time 0 0 1 1
Low cost when buying in bulk 0 1 0 1
Source: Accra IEMS focus group data (2012)
Out of the six factors shown in table 16 that vendors presented as positive driving forces in terms of the value chain, five related to inputs. Particularly in the face of a depreciating cedi and rising cost of inputs, the ability to obtain goods on credit from suppliers was an important support for vendors, and was ranked as the most important helping factor. A good quality of inputs was ranked second. Lower per unit cost when buying in bulk and low transport cost related to the cost of inputs.
In terms of negative driving forces, vendors ranked highest the tendency of customers to purchase goods on credit (table 17). Figure 5 shows the effects on vendors’ enterprises of granting credit facilities to customers. The illustration is taken from a focus of group of women in the non-Central settlement of Abokobi who identified customer demand for credit facilities as the number one hindrance to business. The women mainly had small trades in food, and in small retail items such as cosmetics. This was a problem for them likely because they traded in a small settlement, and their customers were mostly neighbours or other people personally known to them.

25Street Vendors in Accra, Ghana
J. (female vendor) made the first point that extending credit to customers reduced the capital one had to trade with. That meant one could not buy adequate quantities of inputs for one’s business. She added other impacts of extending credit to customers: “It makes your business go down and that means you can’t do the things you need to do, like pay your children’s school fees. It also means you can’t expand your business.”
B. said giving credit might result in a trader having to dip into her savings to make up for lost capital. When the customer paid their bill, then the money could be replaced. (This was presented both as an effect and a response.)
As another response, J. said, “When people don’t pay back what they owe, then we stop giving credit. That’s when we write [a sign] ‘If credit, come tomorrow’.”
J. made a final point: “Sometimes we go to the people who owe money and tell them to pay us.” “But,” D. added, “sometimes the person you’re asking the money from doesn’t have any so that doesn’t always work.”
Focus Group Report, Accra FG 1, July 1, 2012
Figure 5 - Causal Diagram of Most Important Value Chain Negative Driving Force – Accra Focus Group Report 1
Effects Response
Capital goes down Take loans
Affects savings Stop accepting credit
Cannot pay school fees Replace savings
Credit
Cannot expand Talk to creditors
Source: Five women, street vendors in non-Central Accra (Abokobi), 26 June 2012
Table 17 - Negative Value Chain Driving Forces
Frequencies
Ranked #1 Ranked #2 Ranked #3 Total Frequency
Problems with creditors 0 1 2 3
Competition (imported goods) 0 1 1 2
Seizure of fake goods 0 1 0 1
Suppliers trading directly to retailers
0 0 1 1
Source: Accra IEMS focus group data (2012)
The second ranked value chain problem across the focus group was competition from cheap imported goods in the market place; in some cases, these goods were sold directly to customers by foreign retailers physically located in local market places. Seizure of goods by city task forces was also linked to competition; vendors explained that it was usually the manufacturers who called in city officials to seize and destroy fake items that were in breach of patents.

26 IEMS Informal Economy Monitoring Study
Other Driving Forces The two most important categories in this section concerned seasonality of two kinds – the coming of the rains and the academic calendar. “Calendar events” – special occasions such as Christmas, Easter, and the beginning of the school year, as well as social events such as wedding and funerals – gave a boost to sales. These occasions were by far the most cited positive influence on vendors’ work (table 18).
Table 18 - Positive Other Driving Forces
Frequencies
Ranked #1 Ranked #2 Ranked #3 Total Frequency
Calendar events 7 8 5 20
Higher population 0 1 1 2
Seasons (dry seasons) 1 0 0 1
“Foreigners” as customers 0 1 0 1
Source: Accra IEMS focus group data (2012)
A distant second was the increase in population in growing areas in the Ga East District, which had the effect of expanding the market. Finally, the presence of foreigners and the dry season were each mentioned as helps to business.
As the inverse of the positive impact of the dry season, the rainy season was mentioned frequently in focus groups as a hindrance to work (table 19), as illustrated by this quote from a mixed-sex group from Central and non-Central Accra:
F. [female vendor] and T. [female vendor], both of whom sold meat, said that during the rainy season, it was difficult to get a supply of meat. A couple of participants said that the rain prevented customers from coming to the market. Participants also agreed that this situation resulted in low sales when then led to low profits. The rains also made it difficult for them to repay loans, and could eventually lead to them losing their business capital.
Focus Group Report, Accra FG 15, August 30, 2012
Again, while generally special occasions were perceived as having a positive impact on work, some calendar events, such as the Moslem fasting periods and school vacations, slowed down business for some goods and were ranked second as a negative force in the “other” category (table 19).
Table 19 - Negative Other Driving Forces
Frequencies
Ranked #1 Ranked #2 Ranked #3 Total Frequency
Seasons (rainy season) 3 2 0 5
Calendar events 0 2 1 3
Negative public perception 0 0 1 1
Source: Accra IEMS focus group data (2012)
In summary, the focus group discussions emphasized negative driving forces over positive. The most important helping factors were special occasions and calendar events that increased demand for goods. The second most important factor was a healthy economy that drove demand through higher employment and more disposable income among the customer base. A good economy also meant increased availability of loan facilities at lower interest rates.
Of the negative forces, those related to the larger Ghanaian economy were the most frequently cited. In particular, the interconnected factors of a falling currency and inflation were of great concern to vendors. The importance of these two factors was evident in vendors’ responses in the survey. When asked what problems they faced (aside from those related to infrastructure and the actions of

27Street Vendors in Accra, Ghana
institutions such as the local government), vendors appeared most concerned with both obtaining lower prices from suppliers and negotiating higher prices with customers (table 20), likely in an attempt to offset the rising cost of supplies.
Table 20 - Other Types of Work-Related Problems Associated with Street Vending (%)
Do you encounter any of the following problems in your work?
Difficulty negotiating higher prices from customers 54.67Competition from large retailers or supermarkets 32.67Difficulty negotiating lower prices from suppliers 30.67Lack of information about local regulations/training in dealing with local authorities 12.00No relevant training in accounting, marketing, other business skills 10.67Harassment by local authorities (e.g. police or other officials) 8.00Evictions/ lack of support during evictions/lack of protection from or warnings before evictions
7.33
Insecurity of vending site/problems securing a vending site when needed 6.67No assistance with court cases or other legal strategies 4.00Difficulty negotiating with other street vendors/mitigating conflicts among street vendors
3.33
Confiscations of goods/difficulty getting merchandise back after it is confiscated 3.33Other 3.33N 150
Source: Accra IEMS survey data (2012)
Table 21 presents another perspective on this issue. Almost half of all vendors reported selling more in the past year and 60 per cent said they had charged higher prices for goods. And yet, 62 per cent of vendors reported a fall in revenue in the past year (see table 7). The answer to this seeming contradiction may be in the fact that three-quarters of vendors also reported an increase in the cost of supplies, which may have offset the increased revenue from sales.
Table 21 - Reported Changes in Street Vending Work over the Past Year (%)
More LessStay the
same
Do you think you are able to sell more, less or the same amount of products/services compared with this time last year?
44.67 38.00 5.33
Do you think you are able to charge higher prices compared with this time last year?
64.67 12.00 11.33
Do you think your supplies have become more expensive compared with this time last year?
76.67 6.67 4.67
Do you think there are more people buying the products/services that you sell compared with this time last year?
52.00 30.67 5.33
Do you think there are more people selling the products/services that you sell compared with this time last year?
57.33 6.00 11.33
Source: Accra IEMS survey data (2012)

28 IEMS Informal Economy Monitoring Study
Another factor related to both the macro economy and the value chain was the perceived increase in competition for market for their goods in the past year. In table 20, a third of vendors specifically identified competition from larger retailers or suppliers to be a major obstacle. In the focus group discussions, the increase in competition was often linked to the presence of “foreigners”:
Participants made the distinction between foreign contractors and foreign traders. Although they saw some positives on the impact of foreign contractors, they saw the activities of foreign traders as hindering their sector. E. said, “Foreign traders sometimes sell at lower prices. We travel to places like Dubai to buy products and the foreign traders bring in these goods at lower prices.” AM added, “Foreign traders have taken over our table-top businesses. They are coming from China, and Nigeria. If you listen to the news in recent times, you hear more about the phenomenon.” P. thought the foreign traders were a nuisance because they sold their products directly to consumers, instead of wholesaling to the traders.
Focus Group Report, Accra FG 3, July 5, 2012
E. started the discussion by adding to his earlier point … about the Nigerians undercutting them with cheaper goods. He said these foreign traders had become itinerant; that is, they now went around and offered their low prices to customers.
“It’s true, there’s a white man selling socks just at the traffic lights outside,” SO said.
T. said, “But not only are the Chinese importing their products into the country, but they are themselves selling them here now.” There was agreement [from the other vendors] that this was indeed happening.
The general feeling was that the activities of these traders slowed down business and led to lower profits.
Focus Group Report, Accra FG 11, August 5, 2012
2.2 Informal Workers’ Responses to Driving ForcesOverall, and regardless of type of driving force, the responses of street vendors were mostly at the individual level (see appendix). Secondly, only two responses were directed outward to others: one was seeking loans from lending institutions, and the other was seeking financial help from family (ibid.).
Responses to Macroeconomic Driving ForcesThere was much discussion in the focus groups about the high prices of their supplies, which was related to the loss in value of the cedi against major currencies, inflation and high interest rates on loans. This created the dilemma of whether or not to increase the sale prices to customers; if the vendors did, they risked losing customers or demand, and if they did not, they risked losing income on sales:
“People don’t buy when the price goes up. Those who buy from us negotiate and buy at lower prices. If we don’t sell we lose because the good [banana] is perishable. If we sell at the prices they want to buy, we are unable to get our money back. We therefore find it difficult to make profit from this business.”
Female vendor, Accra FG 12, August 13, 2012
If customers were unwilling or unable to buy at these revised prices, then the traders might be forced to give credit, with the risk that their customers would default or delay repayment, which then might lead the vendors to seek loans.

29Street Vendors in Accra, Ghana
In the focus group discussions, vendors expressed ambivalence about taking loans even though this was described as a common response, with one vendor opining, “Ninety per cent of us traders do it” (Male vendor, Focus Group Report, Accra FG 11, August 5, 2012). The problem with the loans, vendors explained, was that the same macroeconomic and personal factors that necessitated loans made default a real risk:
ST said earnestly, “You know, this was not what it was like before. At first, you didn’t have to take loans because you could make enough money to live on, but now….”
SO picked up the narrative, “There are so many people who have had to run away because they have defaulted on their loans.”
“They just leave their businesses?” the facilitator asked.
“Yes, they run away.”
Focus Group Report, Accra FG 11, August 5, 2012
Taking loans, vendors said, can result in many unpleasant difficulties:
“I know a woman who took a loan of GHS 2000.00 and she’s being asked to pay 2900.00. Taking a loan doesn’t really help us,” said S. “I used to save with a bank for many years. About three years ago, I needed GHS 1000.00 and when I went to the bank they said they would need to have one of the bank officials to go to my house to inspect the place before giving me the loan. Can you imagine - and this is a bank that I have an account with. In the end I just gave it up. Plus, the banks seize the goods of people who default their loans,” said S. On the issue of default of loans, F. thought that the falling value of the cedi was one reason why people defaulted – their businesses were going down as a result of the devaluation, which meant they weren’t able to make enough money to make their loan repayments.
[F.’s comment] brought about a short debate as to which of the sexes is able to withstand the pressure that comes with taking a loan from either banks or micro finance institutions. The consensus [among the all-male group] was that women were more likely to take loans but that men were better able to manage the pressure of repayment such as being chased up by bank officials, etc.
Focus Group Report, Accra FG 9, August 2, 2012
Another common response to the identified negative macroeconomic forces was to reduce the size of one’s inventory or reduce cost (see appendix).
Vendors also spoke about the strategy of temporarily stopping work or even changing one’s trade:
A last resort, M. said, was to stay at home.
“Just stay at home?” G. queried.
“Yes! Selling iced water at home is better than taking out a loan and not being able to pay it back because business is bad.”
Focus Group Report, Accra FG 2, July 1, 2012
ST said, “Sometimes you have to stop the job you’re doing.” Urged by the facilitator to give an example of how this might happen, he said, “If I can’t get my usual inventory of second-hand shoes because the importers are not bringing in enough, I’ll sell something else that doesn’t need to be imported. Take my wife, for example – she was selling second-hand children’s clothes, but had to switch to selling food because of the dollar exchange rate.” He added that he himself was thinking of going to drive a taxi. “It’s like you’re in my head!” SO jumped in, “I have been thinking the same thing.”
Focus Group Report, Accra FG 11, August 5, 2012

30 IEMS Informal Economy Monitoring Study
Responses to Government-Related Driving ForcesDemolition of trading spaces and confiscation or destruction of goods in the process came up as a negative driving force resulting from government action. Traders would attempt to find other spaces to trade in, but this was said to be difficult and expensive. If vendors did not find alternative space, they would become itinerant or, as a last resort, stay at home.
This problem of demolitions of structures used by vendors was raised during a focus group of four men from non-Central Madina:
[A. said,]“We have to move our goods from point to point looking for places to sell. Sometimes our goods are destroyed and the business comes to a standstill making us become poorer…. Sometimes, we try to relocate by asking for money from friends, looking for money from a bank, but this doesn’t often work as relocating is quite expensive and it is difficult to raise the money.”
Participants noted that sometimes because of a demolition exercise, they might have capital in hand but they would have nowhere to sell and would be unable to purchase goods. P. explained this further: “We stop buying goods because we do not have anywhere to display or store them. When this happens, we have to survive on our capital. We also lose customers and this leads to loss of income.” A. supported P.’s point: “Demolitions lose us customers. When this happens, our homes become unhappy places. It is difficult maintaining the household and even more difficult to pay school fees for our children.”
As a response to the demolition exercise by the city authority, P. said, “What I do is to advertise on radio that I have moved. I spend money publicizing my new place of operation”. However, the other participants said that this was not a widespread strategy. A. said, “Publicizing is something a few individuals choose to do, and it’s mainly the shop owners. Table top operators do not have enough money to relocate, much less to advertize.”
E. offered another response, “I sometimes keep my goods at home while I try to find another place.”
A. said that some vendors, particular the table-top operators, might become itinerant vendors, and carry their goods around on their heads.
Focus Group Report, Accra FG 3, July 5, 2012
The lack of trading spaces was especially a concern for non-Central city vendors, such as those in the preceding example, some of whom are in developing areas without city-demarcated market spaces.
Responses to Value Chain Driving ForcesIn the focus group, vendors were not only credit seekers (taking loans from financial institutions), but also credit givers. Vendors felt compelled to give credit to demanding customers who were often unreliable at paying back their debts. This affected vendors’ trading capital. When this happened, vendors were compelled to dip into their savings or to take loans in order to make up for the lost capital. One response was to stop giving credit altogether, or to give credit only to people they trusted: “We no longer sell on credit to people we don’t know. If we’re familiar with you and have much trust in you, we’ll sell on credit. However, if we don’t know you, we’ll never sell on credit to you” (Female participant, Accra FG 12, August 13, 2012).
Responses to Other Driving ForcesThe main driving force in this category was the advent of rains during the rainy season. Vendors were resigned to the fact that this season would slow down business. Their responses were to stay at home or stop selling goods when it rained. More proactively, they might reduce their personal and household expenses to make up for the lost income.

31Street Vendors in Accra, Ghana
2.3 Intermediary Factors
Institutions and ActorsVendors were asked to identify institutions and actors that had a significant impact on their work, whether positively or negatively. Taking all the institutions that the vendors listed as a whole, vendors perceived institutions as generally negative in their influence on street vendors.
Table 23 - Matrix of Institutions Showing Frequency of Mention and Perception
Institutions Freq (+) Freq (-) Freq (±) Total Frequency
AMA 11 1 12
Local government12 5 5
Central government 3 3
Government regulating bodies (e.g. Food and Drugs Board)
1 1 2
IRS 1 1 2
Financial institutions 2 2 10 14
Police 1 1 2
Schools 1 1
Hospitals 1 1
Utilities (water & electricity) 1 2 3
Market associations 2 2
StreetNet 1 1
TUC 2 1 2 5
WIEGO 1 1
Foreign businesses (competition) 1 1 2
Suppliers 3 2 1 6
Middlemen 1 1
Accra Chiefs 1 1
TV & radio 1 1
Church 1 1
Market queens 1 1
N 150
Source: Accra IEMS focus group data (2012)
Table 23 indicates an emphasis on government as an institution, which includes the Accra Metropolitan Assembly (AMA) and other local councils, as well as public regulatory bodies. Next in importance were financial institutions. Persons or groups in the value chain such as suppliers, middlemen and the foreign businesses that provide competition, were ranked third. Fourth in importance (according to frequency of mention) were the Trades Union Congress (TUC), StreetNet and the various market associations, all institutions that belong to or that advocate for street vendors.
Role of Institutions in Obstructing or Supporting Informal WorkersTable 23 suggests that the perception of government, especially at the local level, was overwhelmingly negative both for their actions (“harassment” and “demolitions”) as well as for their inaction
12 In the decentralized system of government, zones are units of districts. Districts are second-level administrative units, below regions. In this report, we use the term “local government” to refer to the district-level administration which is governed by a Chief Executive (appointed by the President) and an assembly made up of elected and appointed members. There are 216 districts in Ghana. Larger districts are referred to as municipalities and metropolises.

32 IEMS Informal Economy Monitoring Study
(failure to provide basic amenities such as toilets, electricity and garbage collection). The AMA was mentioned most frequently with references to “harassment”, corruption (demanding bribes), and lack of attention to maintenance of the market despite the fact that traders pay levies and taxes that would entitle them to such services. In the two excerpts below, vendors describe the obstructive actions of the AMA and its counterpart in the Ga East District, the Madina Zonal Council:
“They [AMA] don’t help us in any way and they don’t worry us either as we’re inside the market. However, they don’t come to take the refuse from the market. We don’t even know whether they are supposed to clean the market or not. I’m a bit elderly and remember the Kwame Nkrumah era. The AMA people were very efficient in cleaning the markets. All they do now is to come and take their levies and ticket money from us.”
Female participant, Focus Group Report, Accra FG 12, August 13, 2012
The AMA, Ga East District Assembly (GEDA), Madina Zonal Council (MZC) and foreign traders were noted to pose the greatest hindrance in the businesses of participants.…The Madina Zonal Council (MZC) is another institution identified as hindering the activities of traders by participants. A. stated, “They [MZC] worry us a lot.” P. expanded on this point, “The Madina Zonal Council worry traders especially those that operate by the roadside by harassing them… [And] they take too much money from us.” There was a consensus among participants that the local council officials took bribes from the traders. A.M. said, “We have paid a lot of bribe to these officers. Today one will come for this and tomorrow another comes to take money for something else.”
Focus Group Report, Accra FG 3, July 5, 2012
It is worth noting that the AMA came up in focus groups with non-Central vendors, who are part of a different local administration, GEDA. One reason may be that some of these vendors carried out business within the Accra metropolis, and therefore operated part of the time within the AMA. A second reason for the preoccupation with the AMA may be that traders are not aware that they were not within the administrative area of the AMA.13 In fact, in one non-Central focus group, a heated discussion arose about the relative influence of AMA and GEDA. One man tried to convince the rest of the group that it was actually the GEDA that had authority of their area, and so the GEDA and not the AMA was to blame for the demolitions they were complaining about. But he was opposed vigorously by another participant who insisted that GEDA was under the AMA (Focus Group Report, Accra FG 3, July 5, 2012).
Another important set of institutions was the commercial banks and non-bank lending institutions. These loomed large in the minds of traders as sources of loans. As indicated in the matrix of responses, traders often resorted to taking loans to make up their trading capital. The reason that the financial institutions were perceived as both helping and hindering (table 23) was because, as much as participants valued the loan facilities provided by these institutions, they were as quick to say that the requirement for receiving a loan, and the interests rates and other terms of payments, were unfavourable. Discussions among, first, women in non-Central Madina, and second among men in the city centre, brought out these tensions:
“I tried to get a loan from UT Bank,” Georgina said, “but they didn’t give it to me – they said I had to have a container.”14 In lieu of a loan, the traders might try to buy input on credit from their suppliers.
Focus Group Report, Accra FG 2, July 1, 2012
The consensus was that the banks needed to lower their interest rates on loans. E. added that they should also reconsider the conditions for a loan, specifically the requirement that one had to have savings with them for a period. “They’ll ask you to deposit 500 cedis.” SO scoffed, “If I had 500 cedis, why would I need a loan?”
13 Perhaps it is because the AMA, as the largest local government is often in the news. There may also be a confusion between the AMA, an administrative unit, and the common or popular use of “Accra” to refer to a larger area than the Accra Metro-politan area.
14 Presumably, the bank believed that a container (metal shipping containers commonly converted into shops in Ghana) would serve as collateral or indicate higher business capital.

33Street Vendors in Accra, Ghana
S.T. expressed displeasure with the loan recovery procedures of the banks. “If you’re late with your payment by just two days, then they’re fighting with you.”
“And they charge your interest on the amount that is late,” S.O. added.
“But that is part of the contract you sign with them, isn’t it?” the facilitator said.
“I’m talking about if you’ve paid consistently for say eight months, and then you have a period where you’ve gotten to the end of your inventory and your profits are low, so it takes some time to amass enough money for the next payment,” Stephen said.
“So the bank needs to give a grace period of a week or two,” S0 concluded.
“And this business of guarantor – that’s the biggest problem!” ST said.
“That’s very true,” E. said. “It’s a big problem. You (the bank) know where my business is, you know where my church is, but you insist my brothers who don’t live in Accra or my pastor needs to come to the bank to guarantee the loan—”
“And nowadays people don’t like to underwrite loans,” Stephen said. “It’s not that they don’t think you’re an honest person, it’s just the way the world is now, they don’t want to get themselves into trouble.”
Focus Group Report, Accra FG 11, August 5, 2012
Table 24 - Types of Organizations that Are Identified as Being “Unhelpful”, by Sex and Location (%)
Central Non-Central
Men Women Men Women
National government 44.44 12.77 4.17 21.57Local government 44.44 8.51 12.50 21.57NGOs 7.41 2.13 0.00 9.8MBO 7.41 2.13 0.00 3.92Police 11.11 4.26 0.00 17.65Other workers 0.00 0.00 12.50 19.61Trade union 3.70 0.00 0.00 13.73Worker’s co-op 0.00 0.00 4.17 13.73Supermarkets or large retailers 0.00 10.64 8.33 31.37N 27 47 24 51
Source: Accra IEMS survey data (2012)
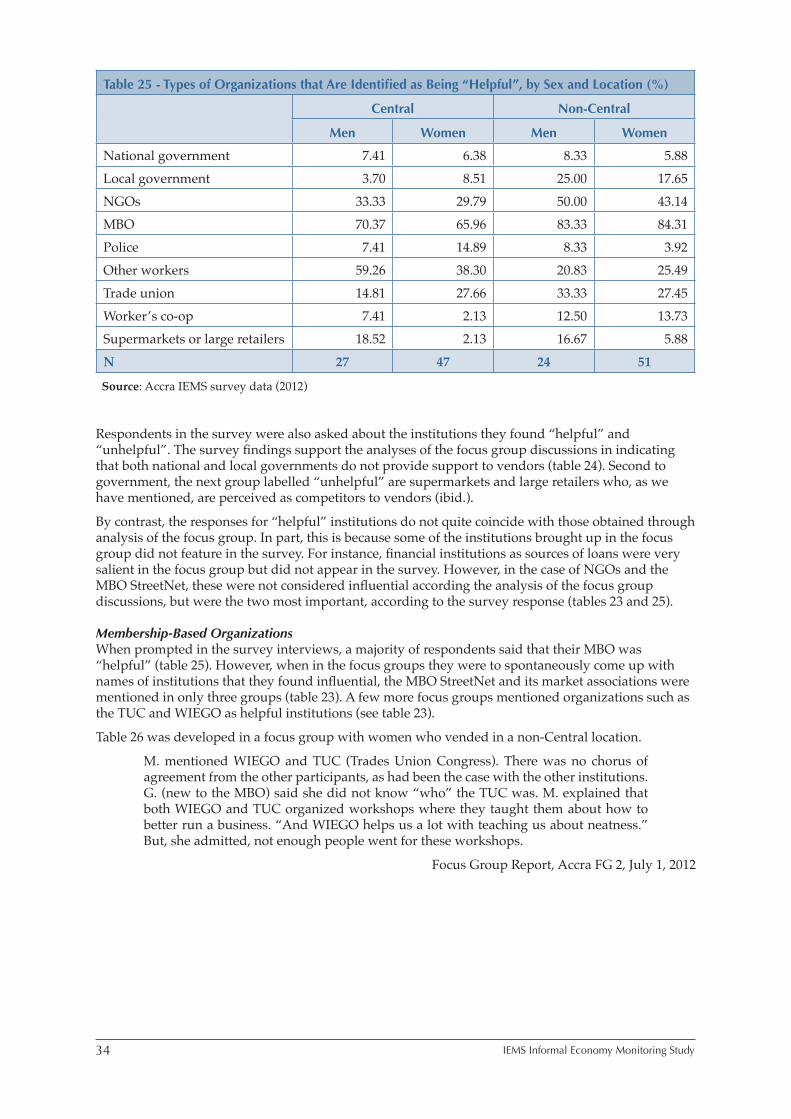
34 IEMS Informal Economy Monitoring Study
Table 25 - Types of Organizations that Are Identified as Being “Helpful”, by Sex and Location (%)
Central Non-Central
Men Women Men Women
National government 7.41 6.38 8.33 5.88Local government 3.70 8.51 25.00 17.65NGOs 33.33 29.79 50.00 43.14MBO 70.37 65.96 83.33 84.31Police 7.41 14.89 8.33 3.92Other workers 59.26 38.30 20.83 25.49Trade union 14.81 27.66 33.33 27.45Worker’s co-op 7.41 2.13 12.50 13.73Supermarkets or large retailers 18.52 2.13 16.67 5.88N 27 47 24 51
Source: Accra IEMS survey data (2012)
Respondents in the survey were also asked about the institutions they found “helpful” and “unhelpful”. The survey findings support the analyses of the focus group discussions in indicating that both national and local governments do not provide support to vendors (table 24). Second to government, the next group labelled “unhelpful” are supermarkets and large retailers who, as we have mentioned, are perceived as competitors to vendors (ibid.).
By contrast, the responses for “helpful” institutions do not quite coincide with those obtained through analysis of the focus group. In part, this is because some of the institutions brought up in the focus group did not feature in the survey. For instance, financial institutions as sources of loans were very salient in the focus group but did not appear in the survey. However, in the case of NGOs and the MBO StreetNet, these were not considered influential according the analysis of the focus group discussions, but were the two most important, according to the survey response (tables 23 and 25).
Membership-Based OrganizationsWhen prompted in the survey interviews, a majority of respondents said that their MBO was “helpful” (table 25). However, when in the focus groups they were to spontaneously come up with names of institutions that they found influential, the MBO StreetNet and its market associations were mentioned in only three groups (table 23). A few more focus groups mentioned organizations such as the TUC and WIEGO as helpful institutions (see table 23).
Table 26 was developed in a focus group with women who vended in a non-Central location.
M. mentioned WIEGO and TUC (Trades Union Congress). There was no chorus of agreement from the other participants, as had been the case with the other institutions. G. (new to the MBO) said she did not know “who” the TUC was. M. explained that both WIEGO and TUC organized workshops where they taught them about how to better run a business. “And WIEGO helps us a lot with teaching us about neatness.” But, she admitted, not enough people went for these workshops.
Focus Group Report, Accra FG 2, July 1, 2012
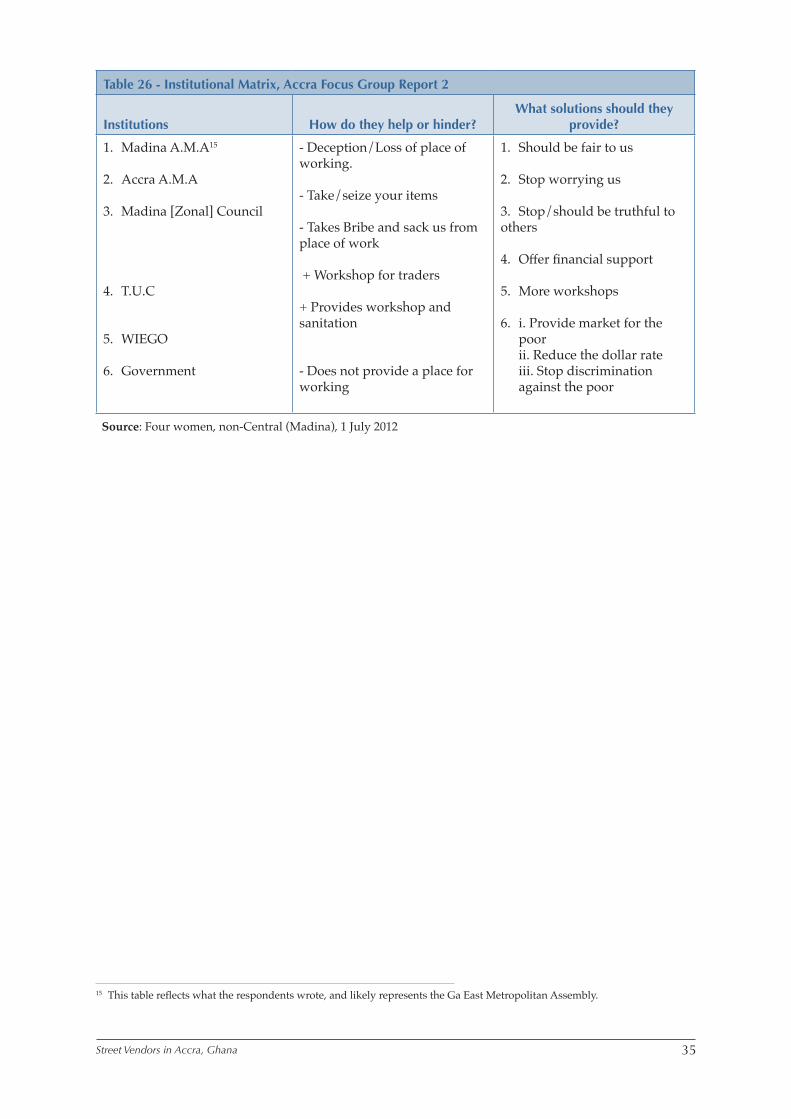
35Street Vendors in Accra, Ghana
Table 26 - Institutional Matrix, Accra Focus Group Report 2
Institutions How do they help or hinder?What solutions should they
provide?
1. Madina A.M.A15
2. Accra A.M.A
3. Madina [Zonal] Council
4. T.U.C
5. WIEGO
6. Government
- Deception/Loss of place of working.
- Take/seize your items
- Takes Bribe and sack us from place of work
+ Workshop for traders
+ Provides workshop and sanitation
- Does not provide a place for working
1. Should be fair to us
2. Stop worrying us
3. Stop/should be truthful to others
4. Offer financial support
5. More workshops
6. i. Provide market for the poor ii. Reduce the dollar rate iii. Stop discrimination against the poor
Source: Four women, non-Central (Madina), 1 July 2012
15 This table reflects what the respondents wrote, and likely represents the Ga East Metropolitan Assembly.

36 IEMS Informal Economy Monitoring Study
Part 3: Linkages and Contributions
3.1 Economic LinkagesTable 27 shows that, overall, fully 95.98 per cent of the sample acquired their goods from an informal enterprise or by making or growing goods themselves.
Table 27 - Main Ways Goods Are Acquired, by Location (%)
Central Non-Central Total
Buy them from an informal enterprise 82.43 56.00 69.13Make or grow them myself 16.22 37.33 26.85Other 1.35 4.00 2.68Buy them from another street vendor 0.00 2.67 1.34Acquire them free 0.00 0.00 0.00Buy them from a formal enterprise 0.00 0.00 0.00Acquire them from formal supplier to sell on commission
0.00 0.00 0.00
Total 100.00 100.00 100.00N 74 75 149
Source: Accra IEMS survey data (2012)
Analysis of survey and focus group data shows up economic linkages between informal enterprises. To begin with, vendors reported that their main source of supplies were other informal businesses (table 27). This was supported by focus group discussions in which vendors reported buying items such as cloth, used clothing and shoes, fruits and so on in bulk from other informal businesses for retail. Further, the focus group discussions revealed a link between the Central and non-Central locations, in which the latter depended on the Central markets for their goods to sell or for inputs with which to make their products.
The purchase of goods from other informal businesses was especially pertinent in the case of goods brought into Accra from other regions in the country, or imported from other West African countries, Europe and Asia, usually by non-Ghanaian or “foreign” business people. Traders would often buy these imported goods from middlemen (rather than from importers directly). These links to imported goods came up often in discussion in reference to some of the most frequently mentioned negative driving forces: Vendors explained that, for such goods, a falling currency and high import duties meant an increase in the cost of imported goods, with implications for the profitability of their businesses. They also mentioned the competition that came from “foreign” business people entering the market to compete with them by selling at much lower prices and cutting out the middle-people and retailers.
Another area in which there is the possibility of economic linkages is in the provision to vendors of such services as security, storage, transportation and delivery, and so on. However, according to the survey data, the majority of vendors (71 per cent) did not use any of these services (table 28).
There is little evidence of linkages between their informal enterprises and formal businesses. However, when it comes to the other end of the value chain – the sale of goods and services to customers – we do see both informal-informal and informal-formal linkages to the extent that many of the consumers of these goods are in both formal and informal work. Vendors mentioned in particular workers and students located in formal institutions as a good source of business (see section 1.3 on sector activities and value chains).
The linkages between informal enterprises and foreign-based informal and formal business are also worth remarking on, particularly in a situation where many goods and inputs are imported. Even in cases where their direct source was a local Ghanaian market, vendors were aware of the foreign sources of their goods and of the impact that import tariffs and currency exchange rates therefore had on their work.

37Street Vendors in Accra, Ghana
Table 28 - Types of Services Used, by Location (%)
Central Non-Central Total
Carriers 5.41 3.95 4.67Porters 9.46 9.21 9.33Storage Facilities 17.57 10.53 14.00Security/Guards 1.35 3.95 2.67Repair services 4.05 5.26 4.67Delivery Services 2.70 1.32 2.00Private transport for materials/goods 0.00 2.63 1.33Public toilets 0.00 11.84 6.00Day care 0.00 0.00 0.00Municipal services 0.00 0.00 0.00None 74.32 67.11 70.67Other 0.00 0.00 0.00N 74 76 150
Source: Accra IEMS survey data (2012)
3.2 Policy/City LinkagesIn the focus group discussion, government institutions were perceived negatively as obstructive in their policies and actions, as has been discussed (see section 2.3 on institutions). In particular, vendors decried the policy of removal of vendors and their goods from “unauthorized” locations without providing adequate alternatives.
More commonly, vendors described the AMA as negligent. For example, traders in Central Accra said they had resorted to contributing money to hire the services of a waste management company to collect garbage from the market when it became clear that the AMA would not do it.
One situation peculiar to the pedestrian mall in the city centre, near Kwame Nkrumah Circle, was the process of constructing the mall. The process of developing the market was perceived by vendors as non-participatory, with vendors describing city authorities as paternalistic and neglectful of the vendors in those locations. This issue was discussed at length in two focus groups with vendors in the Circle market:
“When they (AMA) were setting up the market, they didn’t consult us because they saw us as ‘below people’. And they didn’t follow up to find out what was happening here. And they haven’t told anybody that we’re here; they haven’t advertised. I don’t support selling on the streets, because we’re all growing old and we need a stable place. But what do people do when they don’t have a choice?”
Male participant, Focus Group Report, Accra FG 11, August 5, 2012
[F. (male vendor) said,] “AMA has not commissioned the market. If you build a house, don’t you do a house warming? They have not commissioned the market. Even hairdressers when they build a kiosk to do their work, don’t they perform some rites before starting work? The AMA didn’t perform the customary rites before bringing us here. The spiritual aspect is very important but the AMA doesn’t care enough about us to do it”….
[He continued,] ‘”Politics is another factor that is affecting our businesses over here. This market was built under the previous administration and so the current administration does not pay attention to the market.” S. [male vendor] provided another anecdote about the politics of the market: “During the last floods, the mayor visited the bridge near the Neoplan bus station to sympathise with those affected there by the flood, but he didn’t come to us here [at the Pedestrian market] even though they were survivors

38 IEMS Informal Economy Monitoring Study
here also.” The traders related another story about how the AMA sold the billboard that advertises the market to MTN (an international telecom company), which put its own ads on it. In effect, this meant that the market had lost the main billboard that advertised its presence.
The participants segued from politics to the related issue of partiality and nepotism in the allocation of the sheds in the market. T. said, “The market was built for us but during the allocation, the areas close to the main road were given to people on a ‘protocol list’. Those shops were allocated to people who have money. The areas allocated for us are further out, away from customers. Those on the protocol list who got access to shops have now rented out their shops to people and are making money from it. They are not actually trading in these shops.”
Participants further identified the physical structure of the market as a negative driving force. F. [male vendor] commented:
“The way the market has been built is not good enough. If you are outside the market, it is difficult to see what goes on in the inside of the market. If you look at the Commercial Bank, it is open and people can see the inside from outside. (But) the wall bordering the market is high. Also, our market is divided by the lorry station so there isn’t a good flow of people from one end to the other.”
(Focus Group Report, Accra FG 9, August 2, 2012).
One explanation for this negative perception of city officials could be that vendors do not understand policy or government activities. However, vendors themselves, by and large, believed they understood these regulations: three-quarters of vendors surveyed said the rules about where and when to sell goods were easy to understand. Further, 68 per cent said they thought these were enforced “fairly and equally” to all street vendors. This second statement in particular was somewhat at odds with the discussion in the focus groups, which strongly indicates a negative perception of the actions of local government.
3.3 Contributions of the SectorIn the focus groups, vendors were asked to describe the contribution of their sector to the city. As table 29 shows, by the far the most frequently mentioned contributions were taxes, fees and levies.
Table 29 - Contribution of Sector to City/Nation (Frequency)
Item Category
Location
TOTALCentral Non-Central Mixed Central
& non-Central
Tax revenue 21 9 27 57
Provide for people’s needs 1 7 1 9
Make goods accessible 1 5 1 7
Provide income and employment
6 0 0 6
Promote development/help economy
0 4 0 4
Clean the market/city 1 0 1 2
Source: Accra IEMS focus group data (2012)
The category “promote development and help the economy” (table 29) was closely related to the question of taxes because, as vendors explained, the revenue that the local and Central governments gained from their work improved the economy generally. It was used for specific development projects, such as making roads.
Another set of contributions summarized in table 29 was providing for people’s needs (whether for food, books, entertainment, etc.) and also making goods and services accessible to people. The latter

39Street Vendors in Accra, Ghana
response was more frequently offered in the newly-settled locations in non-Central Accra: vendors spoke about how they were able to bring goods into those spaces and thereby save customers the time and money it would take to go into Central Accra.
Relative to the vendors in the city centre, those in the non-Central locations did not couch their contributions in relation to their cities or to the country but were more aware of “helping” the people in their immediate environment by bringing goods and services closer to their doorsteps. By contrast, those in Accra centre perceived themselves to be contributing to the revenue stream of the city through various taxes and levies. This is curious given that overall non-Central vendors pay more in licenses and permits (table 30). It may be that vendors in the city centre have more of a sense of themselves as a collective and are better able to think of their aggregate contribution. A second explanation may be that the vendors in Accra, either by virtue of their length of participation in the MBO or of a more active MBO, have been more educated about their contribution as members of the informal economy.
Indeed, the survey data and focus group discussions show that most vendors pay a variety of fees and levies imposed by the city, by the national government and, in some cases, by market associations on their members. Importantly, vendors often paid several different fees simultaneously, some on a daily basis and others monthly or yearly (tables 30 and 31).
About 60 per cent of vendors paid fees for operating permits and 15 per cent paid fees for use of space (although it is not clear whether these fees were all to the local government; it could also include rent to private land or property owners for use of their space).
Table 30 - Mean Monthly Expenditure on Licenses and Permits, by Location (Cedis)
Central Non-Central Average
Formal permit to operate 14.35 7.41 11.86License fees 3.22 9.38 4.40Fee to secure the space used for your activities 18.71 41.75 25.72Income tax 19.58 4.79 12.18Other tax 2.51 4.18 3.01
Source: Accra IEMS survey data (2012)
Table 31 - Mean Monthly Expenditure on Licenses and Permits, by Sex (Cedis)
Men Women Average
Formal permit to operate 10.81 12.34 11.86License fees 6.73 3.53 4.39Fee to secure the space used for your activities 23.58 27.09 25.72Income tax 32.91 3.89 12.18Other tax 2.19 3.90 3.00
Source: Accra IEMS survey data (2012)
Forty-two per cent of vendors paid license fees and again, the figures were higher in the non-Central locations.
A small proportion (less than 10 per cent) paid income tax but, out of these, men and Central vendors reported paying much higher taxes than women and non-Central vendors (table 31).

40 IEMS Informal Economy Monitoring Study
Part 4: Policy Implications
4.1 Summary of Key FindingsThe findings of this study suggest vendors feel, overall, that the macro economy, city policies and practices, and the value chain have a negative effect on their work. The most important negative driving force (according to frequency of mention) was the macro economy. Vendors reported that the interrelated problems of currency depreciation, rising costs of inputs and living, high interests rates and unemployment had the combined effect of reducing their profits and the value of their working capital. The second most important set of negative forces were the actions and inactions of national and city governments. In particular, vendors complained about the failure of local and national officials to provide enough designated market spaces and other amenities (such as electricity, pipe-borne water, toilet facilities and refuse disposal) necessary for a healthy and conducive environment for work. They also accuse these authorities of “harassment”, corruption, and the imposition of high taxes, fees and import duties. Surprisingly, seasonality in terms of the rainy season and calendar events (such as Ramadan or school vacations) that lowered demand for goods were the third most frequently mentioned set of negative forces. Finally, factors related to the value chain were mentioned; these included the inability to obtain goods on credit and competition from imported goods and from foreign traders.
When asked explicitly to describe positive driving forces, the most frequently cited was the advent of calendar events such as the holidays, the end of month when workers were paid, or any other occasion during which consumer buying power or demand was higher than usual. Forces described as positive were generally the inverse of the negative driving forces: events in the macro economy or actions by suppliers, creditors or customers that increased the customer base and demand, decreased prices, or made available credit to offset high prices.
While vendors clearly identified the hindrances to their work and were able to provide causal explanations for these, they seemed less able to identify effective solutions, especially those that involved collective action. Many of the responses to the negative driving forces involved coping strategies such as reducing or increasing the selling price of goods, giving goods on credit, contracting one’s business or dipping into personal savings to run the business. Taking out capital for household expenditures, reducing personal expenditures to compensate for low earnings, or simply waiting the situation out, which might mean temporarily closing down the business, were other responses mentioned. Sometimes vendors switched from one location or type of trade, or stopped trading altogether. Another set of responses were those that involved assistance from a second party such as negotiating with customers and suppliers, and seeking financial help from family or from financial institutions. However, the option of taking loans from private companies, in particular, was fraught with challenges including high interest rates and other unfavourable terms, and the risk of defaulting on the loans.
The only collective action mentioned in the 15 focus groups was in relation to keeping the market environment clean by organizing sweep-ups or pooling resources to hire refuse collectors. As this was in response to the inaction of the city authorities that are supposed to provide these services, one could say that this self-help response is not adaptive; it simply allows city officials to offload their responsibilities onto vendors.
Vendors generally perceived as negative the influence of various institutions on their work. Vendors said local and national government bodies had the most impact on their work, but that this influence was overwhelmingly negative. Financial institutions were next in importance and were described as being both helpful and unhelpful. Suppliers and competitors had similarly mixed ratings. Fourth in importance were traders associations and other organizations that partnered with vendors, although it seemed very few vendors were familiar with or involved with these sets of institutions.
The study turned up interesting differences in the experiences of vendors in the city centre who were in designated markets and those in the periphery, many of whom worked outside of established markets in less built-up areas. Vendors in the city centre earned considerably more than those in the non-Central locations. Non-Central vendors also made greater use of unpaid family members, while those in the Central locations, especially male vendors, used paid workers. The higher turnover of Central vendors, and their use of paid workers, can be partly explained by the types and values of good sold by vendors in the two locations. Further, the higher turnover may be due to the larger

41Street Vendors in Accra, Ghana
customer base since Central vendors were more likely to be in designated public markets with higher human traffic.
The study provides supporting evidence for, but also contradicts, previous research on the informal sector in Ghana. The study confirms the importance of informal work to urban livelihoods, with 88 per cent of vendors reporting that the primary income for their households came from informal work, either their own or that of another worker in their household. However, these households received other sources of income, mainly remittances.
Although the informal and formal economies in Ghana are often treated as two discrete spheres of activities, they do interact and overlap in terms of workers and production and distribution chains (Tsikata 2008). Our study had mixed findings on this question. Our respondents indicated that very few of their households relied on formal work as primary income (9 per cent) or received formal work-related social security such as unemployment benefits, worker’s compensation, or pensions. In terms of the value chain, 96 per cent in the survey sample received their goods from other informal workers, and/or made their own products. Perhaps this is not surprising given the small size of the formal economy, and the nature of the goods traded in the markets, but it does suggest little direct interaction with formal business. On the positive side, however, informal workers are connected in the distribution chain as suppliers of goods and services to workers and students, some of who operate in the formal economy. Street vendors are also a source of revenue for local and central governments, and are customers for formal financial institutions.
The study further debunks the idea that the informal and formal (“modern”) economies operate independently of each other with evidence of the impact of macroeconomic issues of exchange rates, tariffs and taxation on vendors’ work. In fact, the most important negative driving forces vendors identified were macroeconomic – namely, the depreciation of the currency and attendant inflation. Further, vendors reported links to the global economy through their trade in goods originating from West Africa, Europe and Asia, among other places.
Finally, vendors were articulate about their contribution to the city and the national economy, mainly through various fees and taxes. They also expressed their contribution in terms of the need they fulfilled for easy access to goods and services, especially for customers in the non-Central locations who might otherwise have to travel to the city centre. At the same time, vendors were quick to point out that they do not, in turn, receive adequate services or respect (from local and national governments) commensurate with their value to the city and the general economy.
4.2 Policy RecommendationsThe policy environment for urban informal work is inconsistent and generally unsupportive of informal workers. This is evident at all levels of governance, whether at the level of macroeconomic and social policymaking or in the actions of city authorities. Demolitions of market spaces, for example, contradict stated policy: on the one hand, the Ghanaian government is concerned about unemployment, but, through these demolitions, they destroy the businesses that these workers struggle to set up. It is not surprising then that vendors in this study perceive city officials and the national government as hostile, or at best indifferent to vendors’ rights and needs (see Ghana Trades Union Congress 2011).
There is a need, therefore, for recognition of the contribution of street vendors to the economy variously through their participation in the production and distribution systems for goods and services, and through their taxes and other fees. This would mean that national and local governments shift from an adversarial mode to acknowledging street vendors as citizens, residents and workers with a right to make a living. This change will not occur automatically but can be boosted by a more effective engagement of vendors with national and local government policy processes.
The leaders of various market associations around the country who make up the National Executive Committee regularly meet with the Accra Metropolitan Assembly. These executives can be provided with training on policy processes and advocacy, and on technical skills such as budgeting and budget analysis, in order to more effectively represent their constituents. Given that being more effective in influencing policy implies challenging government power, it may not be reasonable to expect that this capacity-building work can be left to the government alone; it should be supported by organizations such as WIEGO that represent workers’ interests. We also recommend that other organizations
42 IEMS Informal Economy Monitoring Study
representing vendors’ interests be invited into these spaces of policy engagement in order to have different voices and perspectives at the table.
A recognition of street vending as a significant and important part of the economy should be attended by a greater attention to the impacts of policies and macroeconomic phenomena on their work and livelihoods. As a basic and concrete step in this direction, official analysis of macroeconomic and social policy should include reference to the effects on informal workers.
More immediately, the government should respond to the concrete suggestions that vendors made during the study, the foremost being for a concerted effort to designate and fairly allocate market spaces to vendors; this is especially important for non-Central vendors who were less likely to be in officially demarcated markets. Vendors also called for improvements to their work environment, including providing amenities such as electricity, toilet and water and refuse collection that will provide a more sanitary and productive working environment. A conducive working environment would be an environment safe from destructive fires. In the months leading up to the publication of this report, there have been a number of fire outbreaks that have devastated markets in Accra which have been blamed both on traders’ unauthorized electrical rewiring and carelessness with naked fires, as well as on the seeming unwillingness of the city authorities and the electricity company to provide vendors with proper electrical connections (see Vidza 2013). This is an issue on which some immediate action can be taken by local authority, including, or better supervising, electrical works for the markets and, where needed, providing education on fire safety for vendors.
Any change in the circumstances of vendors will involve further organizing of informal workers. This responsibility will rest on street vendors, but will also involve some outside support. In particular, the Ghana Trades Union Congress, which historically has been a strong advocate for workers’ rights, needs to make greater effort to overcome the challenges to organizing and eventual unionization of informal workers.
Finally, in all these processes of policymaking and advocacy, it will be important to avoid homogenizing street vendors, and to take into account differences in the experiences and needs of vendors that, as our research shows, differ by gender and location. Research such as this study undertaken by WIEGO will be important to gaining a further understanding of the experiences of street vendors in order to better support their work.

43Street Vendors in Accra, Ghana
ReferencesAnyidoho, Nana Akua, Dan-Bright Dzorgbo and Mansah Prah. 2013. “Social Relations.” In Dzodzi Tsikata, ed., Social Development Outlook. Accra: Institute of Statistical, Social and Economic Research [ISSER].
Anyidoho, Nana Akua and Kofi Asante. 2008. “Social Inclusion and the Ghana@50 Celebrations.” Ghana Studies, Vol. 11, pp. 139-173.
Budlender, Debbie. May 2011. Statistics on Informal Employment in Ghana. WIEGO Statistical Brief No. 4. Available at www.wiego.org. Accessed on 10 February 2013.
Chambers, Robert, 1994. “The Origins and Practice of Participatory Rural Appraisal,” World Development, Vol. 22(7), July, pp. 953-969.
Ghana Trades Union Congress. 2011, September. The State of the Urban Informal Economy: A Focus on Street Vendors. Accra: Ghana Trades Union Congress.
Government of Ghana. No date. Web page www.ghana.gov.gh. Accessed on 20 April 2013.
Moser, Caroline and Jeremy Holland. 1997. Urban Poverty and Violence in Jamaica. Washington DC: IBRD/World Bank Latin American and Caribbean Studies.
Moser, Caroline and Cathy McIlwaine. 1999. “Participatory Urban Appraisal and Its Application for Research on Violence.” Environment and Urbanization, Vol. 11, No. 2, pp. 203–226.
Moser, Caroline and Cathy McIlwaine. 2004. Encounters with Violence in Latin America. Urban Poor Perceptions from Colombia and Guatemala. New York and London: Routledge.
Moser, Caroline, Angélica Acosta and María Eugenia Vásquez. 2006. Mujeres y paz. Construcción de consensos. Bogota: Social Policy International.
Otoo, Kwabena, Clara Osei-Boateng and Prince Asafu-Adjaye. 2009. The Labour Market in Ghana: A Descriptive Analysis of the Labour Market Component of the Ghana Living Standards Survey V. Labour Research and Policy Institute (Ghana Trades Union) Research Paper No. 2009/01.
Tsikata, Dzodzi. 2008. Informalization, the Informal Economy and Urban Women’s Livelihoods in Sub-Saharan Africa since the 1990s. In Shahra Razavi, ed., The Gendered Impacts of Liberalization: Towards “Embedded Liberalism”? New York: Routledge.
Tsikata, Dzodzi and Akosua Darkwah. 2013. “Employment.” In Dzodzi Tsikata, ed., Social Development Outlook. Accra: Institute of Statistical, Social and Economic Research [ISSER].
Vidza, Joyce. 2013, May 13. “Fire Outbreaks: Market Women Lament Over Unprecedented Regularity” Radio Gold (Accra). Available online at: http://www.myradiogoldlive.com/index.php/general-news/2664-fire-outbreaks-market-women-lament-over-unprecedented-regularity (accessed August 31, 2013)
WIEGO website. 2013. “Statistical Picture.” Available at http://wiego.org/informal-economy/statistical-picture (accessed 01 May 2013).
Yankson, Paul W. K. and Monique Bertrand. 2012. “Challenges of Urbanization in Ghana.” In Elizabeth Ardayfio-Schandorf, Paul W.K. Yankson, and Monique Bertrand, eds., The Mobile City of Accra: Urban Families, Housing and Residential Practices. Dakar: Council on the Development of Social Science Research in Africa [CODESRIA].
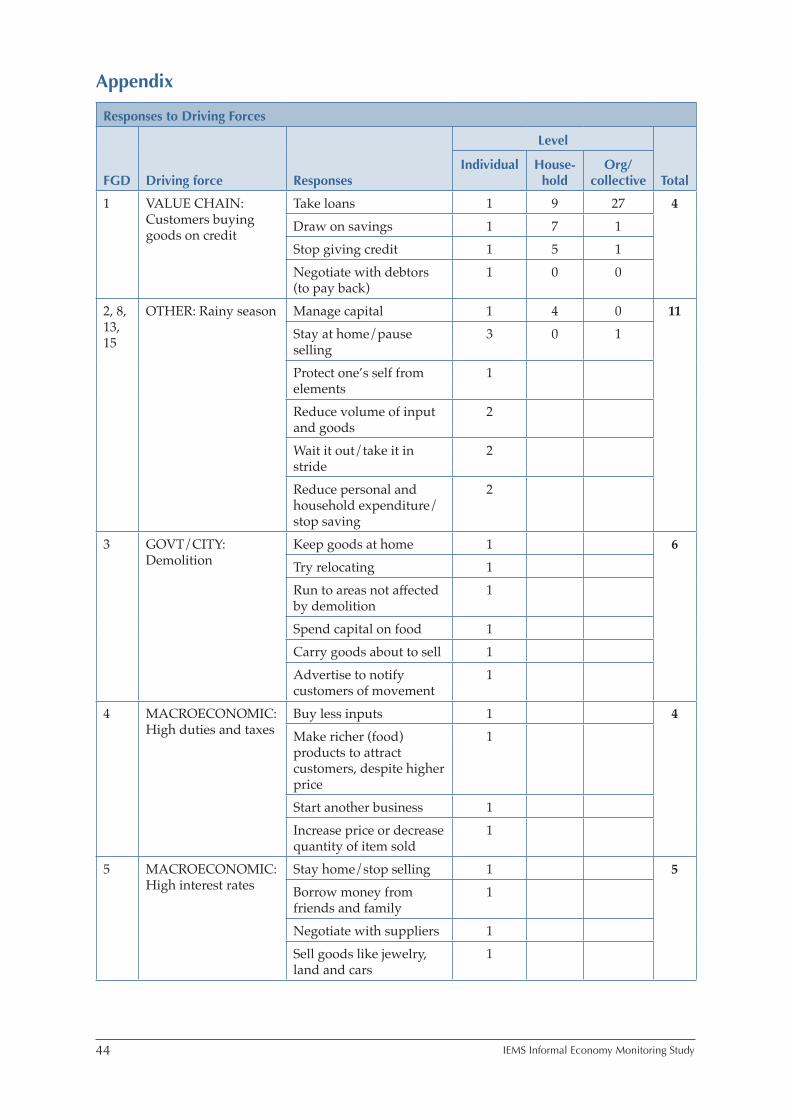
44 IEMS Informal Economy Monitoring Study
Appendix
Responses to Driving Forces
FGD Driving force Responses
Level
TotalIndividual House-
holdOrg/
collective
1 VALUE CHAIN: Customers buying goods on credit
Take loans 1 9 27 4
Draw on savings 1 7 1Stop giving credit 1 5 1Negotiate with debtors (to pay back)
1 0 0
2, 8, 13, 15
OTHER: Rainy season Manage capital 1 4 0 11
Stay at home/pause selling
3 0 1
Protect one’s self from elements
1
Reduce volume of input and goods
2
Wait it out/take it in stride
2
Reduce personal and household expenditure/stop saving
2
3 GOVT/CITY: Demolition
Keep goods at home 1 6
Try relocating 1Run to areas not affected by demolition
1
Spend capital on food 1Carry goods about to sell 1Advertise to notify customers of movement
1
4 MACROECONOMIC: High duties and taxes
Buy less inputs 1 4
Make richer (food) products to attract customers, despite higher price
1
Start another business 1Increase price or decrease quantity of item sold
1
5 MACROECONOMIC: High interest rates
Stay home/stop selling 1 5
Borrow money from friends and family
1
Negotiate with suppliers 1Sell goods like jewelry, land and cars
1

45Street Vendors in Accra, Ghana
Responses to Driving Forces
FGD Driving force Responses
Level
TotalIndividual House-
holdOrg/
collective
6 GOVT/CITY: Unstable power supply
Use generator (very few vendors)
1 3
Explain situation (inability to produce) to customers OR leave shop to avoid conflict with customers
2
7, 12, 14
MACROECONOMIC: High prices of supplies and inputs (including fuel)
Reduce prices 1 6
Sell on credit 1Go for loans 1Seek help from family 1Obtain credit from supplier
1
Wait for price to go down 1Reduce cost, buy at discount
2
Increase prices 19, 10, 11
MACROECONOMIC: Falling value of cedi
Take loans 2 7
Reduce price of goods 1Increase prices of goods 1Fall back on savings 1Change jobs/trade 1Adjust household expenses
1
Source: Accra IEMS focus group data (2012)

46 IEMS Informal Economy Monitoring Study

47Street Vendors in Accra, Ghana
The Informal Economy Monitoring Study (IEMS) is a part of the Inclusive Cities project. Inclusive Cities is a collaboration of membership-based organizations (MBOs) of the working poor, international alliances of MBOs and support organizations working together as partners to improve the situation of the working poor. Launched in late 2008, Inclusive Cities aims to strengthen MBOs in the areas of organizing, policy analysis and advocacy in order to ensure that urban informal workers have the tools necessary to make themselves heard within urban planning processes.
The Informal Economy Monitoring Study is being led by Women in Informal Employment: Globalizing and Organizing – WIEGO (see www.wiego.org) – a global action-research-policy network that seeks to improve the status of the working poor in the informal economy, especially women. WIEGO has convened a Technical Advisory Committee (TAC) to guide the project.
Core Members of the TAC are:
Imraan Valodia (University of KwaZulu-Natal), IEMS Director
Martha Chen (Harvard University), TAC Chair
Sally Roever (WIEGO), IEMS Qualitative Research Coordinator
Michael Rogan (University of KwaZulu-Natal), IEMS Quantitative Research Coordinator
Additional Members of the TAC:
Sonia Dias (WIEGO Waste Sector Specialist and Federal University of Minas Gerais)
Rhonda Douglas (WIEGO Global Projects Director)
Zoe Horn (WIEGO Research Officer, IEMS)
Francie Lund (University of KwaZulu-Natal)
Melanie Samson (WIEGO Africa Waste Picker Programme Coordinator and PARI)
Shalini Sinha (WIEGO Home-based Work Sector Specialist)
Caroline Skinner (WIEGO Urban Policies Programme Director, African Centre for Cities and University of Cape Town)
Caroline Moser, Angélica Acosta and Irene Vance led the development of, and training for, the qualitative modules of the study.