Poultry Industry in India
22
Poultry Industry in India Selvan Kannan 27 th September 2018 Barneveld
-
Upload
khangminh22 -
Category
Documents
-
view
3 -
download
0
Transcript of Poultry Industry in India

Poultry Industry in IndiaSelvan Kannan
27th September 2018
Barneveld

Agenda
•Indian economy overview
•Broiler market overview
•Layer market overview

India at a glance…
• Vibrant democracy: Single party govt from 2014 (lacks Upper House majority)
• Reforms back in focus (Ease of business, Make in India, Start-up India, Skill India, Land/Labor reforms); Big bet on Modi
• GST: Unified, simple indirect tax regime driving GDP up by 100-150bps
• Demonetization: 50-100 dip in GDP in short-term; long-term growth intact
Political context Current ‘disruptions’
• $2T economy, 10 yrs behind China
• Consumption, domestic, services driven
• Entrepreneurial, family-owned businesses, unorganized
• Wide disparities (socio-economic, rural-urban, states)
Unique profile
• Fastest growing large economy (7-8%)
• Improving macro indicators (fiscal, inflation, forex)
• Investments, M&A on rise (FDI, FII, PE, VC)
• Demographics & rising middle-class
• Human capital
• Urbanization, infra
• Digital disruptions
• Federalism, rise of progressive states
Stronger macro-economic fundamentals
(vs historical, vs EM)Mega trends
• Attractive economic outlook (7-8% annual); #1 priority is employment, inclusive growth
• MNCs have won in India, but by following India-specific formula
• Key risks: Reforms delay, lower global priority for investments, global shocks (e.g. oil price)

India is a ~$2T economy - Attained a high growth rate with a
vibrant and world’s largest democracy…
1955-80
Low GDP growth(~4%)
1981-90
Medium GDP growth (~5%)
1991-2018
High GDP growth(6-10%)
• Congress party rule for most part of the decade
• GDP/Capita: $262 (FY55), $358 (FY80)
• Nationalization of industries with socialist focus
• GDP/Capita: $374 (FY81), $503 (FY90)
• Light reforms
• Reduction in state control
• GDP/Capita: $520 (FY91), ~$2400 (FY18)
• Economic liberalization (foreign investments, Privatization, tax reforms)
• War with Pakistan in 1999
• Coalition governments at the center until FY14
• Single party majority government from May ‘14
• Independence in 1947
• Parliamentary democracy
• Wars with China and Pakistan
Econom
ic
situation
Political
situation
India Real GDP, at market price (FY05 constant prices)
Source: RBI database; Lit. search;

…and following the same trajectory as China, with a lag of 10 yrs
Source: Euromonitor, “The past, present and future of China’s automotive industry” by Edinburgh Research Explorer; Business Monitor International; China Association of Automobile Manufacturers; Lit Search;
Per capita GDP(USD, current prices, y-o-y exchange rates)
IndiaAxis

India profile is different to China with a focus on domestic
consumption and a growing workforce to sustain GDP growth
Note: Real GDP calculated by adding GDP componentsSource: World bank: RBI; Euromonitor; TRAI
DOMESTIC, CONSUMPTION FOCUS LARGE GROWING WORKING POPULATION
GovernmentFederal democracy: Significant power with
states
Single party communist state
% Working age
(Additions ‘13-30)
66% (~200M) 73% (-19M)
GDP & GDP per capita (2015)
$2.8T/~$2,400 $12T/~$6400
% Rural population
(2030F)67% (60%) 45% (31%)
Nature of businesses
• Unorganized
• SMEs
• ~60% family-owned businesses
• SOE
• Significant presence of MNCs
• Large set of first generation businesses
Real GDP by component(FY18, US$T)

India has performed and held up well in recent past
Real GDP Growth Rates (CY)
Source: IMF; EIU; Bloomberg; RBI; Euromonitor
INDIA OVERTOOK CHINA IN GROWTH IN 2015
INDIA HAS SHOWN IMPROVING MACRO TRENDS OVER LAST 5-10 YEARS
Fiscal deficit (% of GDP)
Current account
(% of GDP)
Government debt
(% of GDP)
CPI y-o-y
Forex Reserves ($)
INR/USD
Current
FY16: 3.9%FY17E: 3.5%
FY16: 1.4%
FY15: 69%
FY16: 5%
Oct’16:~360B
Dec’16: 68
Historical
FY10: 6.5%
FY12: 6.3%
FY12: 69%
FY12: ~8%
FY05: ~100B
Jan’15: 62

Addition to working age population (15-64 years) from 2013 to 2030E
India is expected to add several times more working age population
than major countries combined by 2030
Note: National population estimates as on 1st Jan, 2013
Working-age Population % (15-64 years), 2014
AT ~850M, INDIA HAD ONE OF THE HIGHEST WORKING-AGE POPULATIONS IN 2014; EXPECTED TO ADD ~200M BETWEEN 2013 AND 2020, MORE THAN ALL MAJOR COUNTRIES COMBINED

As income segments increase exp. increases >2.5x across categories
Low Income
HH
Lower-mid
Income HH
Upper-mid
Income HH
Low Income
HH
Low Income
HH
Low Income
HH
F&B
Living
Connectivity
Consumer Services
High Income
HH
1.8X 2.4X 2.6X
2.5X 3.2X 2.7X
2.5X 3.2X 2.5X
2.7X 3.6X 3.1X
Lower-mid
Income HH
Upper-mid
Income HH
High Income
HH
Lower-mid
Income HH
Upper-mid
Income HH
High Income
HH
Lower-mid
Income HH
Upper-mid
Income HH
High Income
HH
As working population and incomes increase, there is a likely
2.5x increase in spend in F&B, accelerating meat consumption
This is likely to increase India’s meat consumption by 2.5x over the next 3-5 years
Poultry meat consumption in India expected to grow from 3 kg to 7-8 kg by 2021

Agenda
•Indian economy overview
•Broiler market overview
•Layer market overview

India is the world’s fifth largest producer of broiler meat; annual
broiler feed requirement of 13M tons
INDIA HAS BEEN GROWING THE FASTEST AMONG LARGE PRODUCERS AT ~6% P.A. OVER LAST 3 YEARS
…AND HAS FY17 BROILER FEED REQUIREMENT OF 13M TONS
Source: CLFMA data, Market inputs, Management interviews
3.5BTotal broiler bird placements in an year in India
13Mtons of feed required (1.7 FCR i.e. need 1.7 kg feed to increase bird weight by 1kg)
$5 BnTotal value of broiler feed consumed (assuming average feed price of INR 26/ kg)
7Mtons of meat produced every year (typical bird weight is 2kg)

Indian broiler industry is largely concentrated in five states, which
account for >50% share of total production
Source: CLFMA data
5-10% mkt. share
<5% mkt. share
11-20% mkt. share
Legend
Kerala(5%)
UP(6%)
Haryana(6%)
Karnataka(9%)
Maharashtra(13%)
Tamil Nadu(13%)
West Bengal(13%)
AP + Telangana(12%)

The industry is dominated by vertically integrated players; ~90%
of market uses branded feed
~63% of the market typically uses branded feed (manufactured in-house) as they are integrated across the value chain
~10% of the market typically uses backyard mixed feed because of lack of awareness
…LEADING TO LARGE SHARE BY INTEGRATORS WITH HIGH
WORKING CAPITAL
INDEPENDENT FARMS RELY ON EXTERNAL FEED DUE TO
LACK OF SCALE CASH FLOW IS A KEY ISSUE IN
THE BROILER INDUSTRY…
• Periodic inflows of cash
- Cash in-flow only when birds are sold to slaughterhouses after maturing
• High dependence on credit
- Periodicity of cash flow leads to cash deficit for feed purchase
• Significant risk
- Risk of mortality of birds
- Risk of disease
Key characteristics of broiler industry
~37% of the market typically uses branded feed purchased from third party players as they lack scale to manufacture own feed
Source: CLFMA data; Dept. of Animal Husbandry, Dairying and Fisheries reports; Management interviews

Customer requirements and use of branded feed vary across the
broiler lifecycle
BROILER FEED REQUIREMENTS ARE SPLIT ACROSS THREE STAGES
CONSUMERS HAVE DIFFERENT BUYING BEHAVIORS ACROSS LIFECYCLE STAGES
ANIMALLIFECYCLE
TYPICALNUTRITION
PERIOD
CUSTOMER BUYING BEHAVIOR
PRE-STARTER(15% of volume)
• 0 - 10th day
• Prefer high quality feed to reduce mortality
• Integrated players have significant presence in this segment, since they can offer feed + DOC
STARTER(25% of volume)
• 11th - 20th day• Prefer low quality, low cost
feed
FINISHER(60% of volume)
• 21st – 40th day
• Prefer feeds with high nutrition, to reduce FCR and achieve final weight in fewer days
• Discounts & credit are important purchasing criteria
Source: World’s Poultry Science Journal, National Centre for Biotechnology Information, US Food & Agriculture Org.
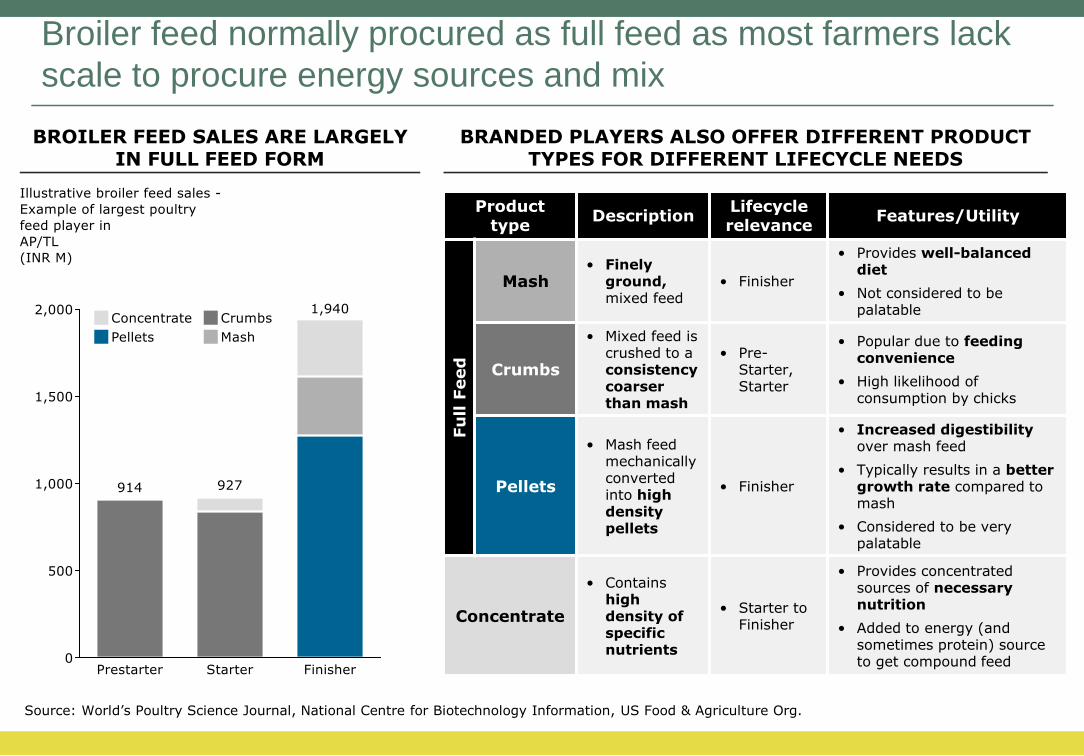
Broiler feed normally procured as full feed as most farmers lack
scale to procure energy sources and mix
Source: World’s Poultry Science Journal, National Centre for Biotechnology Information, US Food & Agriculture Org.
Product type
DescriptionLifecycle relevance
Features/Utility
Fu
ll F
eed
Mash• Finely
ground,mixed feed
• Finisher
• Provides well-balanced diet
• Not considered to be palatable
Crumbs
• Mixed feed iscrushed to a consistency coarser than mash
• Pre-Starter, Starter
• Popular due to feeding convenience
• High likelihood of consumption by chicks
Pellets
• Mash feed mechanically convertedinto high density pellets
• Finisher
• Increased digestibility over mash feed
• Typically results in a better growth rate compared to mash
• Considered to be very palatable
Concentrate
• Contains high density of specific nutrients
• Starter to Finisher
• Provides concentrated sources of necessary nutrition
• Added to energy (and sometimes protein) sourceto get compound feed
BROILER FEED SALES ARE LARGELY IN FULL FEED FORM
BRANDED PLAYERS ALSO OFFER DIFFERENT PRODUCT TYPES FOR DIFFERENT LIFECYCLE NEEDS

Agenda
•Indian economy overview
•Broiler market overview
•Layer market overview

India has the world’s third-largest population of layer birds;
annual layer feed requirement of 13M tons
INDIA HAS BEEN GROWING THE FASTEST AMONG LARGE PRODUCERS AT ~6% PER ANNUM OVER THE
LAST 5 YEARS …AND HAS FY17 LAYER FEED REQUIREMENT OF 13M TONS
China contributes 40% of global egg production with significant exports across Asia, Europe, ANZ and North
America
Source: CLFMA data, FAOstats, Statista, DAHD, Market inputs, Management interviews
334M Egg laying birds in the country
13M tons of feed required (40 kg feed/ bird/ year)
$4 BnRupees total value of layer feed consumed (full feed cost of INR 23/ kg); concentrate market of ~$1.5 Bn
India is third largest producer; contributes 5% of the global egg production. Most egg
production is for domestic consumption

Indian layer industry is largely concentrated in three states,
accounting for 50%+ share of total industry
Source: CLFMA data
5-10% mkt. share
<5% mkt. share
11-20% mkt. share
Legend
Andhra Pradesh(17%)
Tamil Nadu(19%)
West Bengal(7%)
Karnataka(6%)
Telangana(17%)
Maharashtra(6%)
Punjab(6%)
Haryana(6%)

Industry dominated by large integrated farmers; only 40% market
uses branded feed
~60% of the market typically manufactures own feed due to scale economics and desire to control cost and quality
~40% of the market typically uses branded
concentrate or full feed due to lack of scale to produce own feed
…LEADING TO DOMINATION BY LARGER FARMS THAT CAN INVEST AND ABSORB RISK…
…WHO BUY ONLY CONCENTRATE OR ENTIRELY
MAKE THEIR OWN FEED
LAYER INDUSTRY REQUIRES HIGH INVESTMENT, HAS LONG
RECOVERY TIMES AND RISK…
• High upfront investments
- Build bird cages
- Setup egg collection mechanisms
• Long gestation periods
- Egg laying does not begin for first 20 weeks of bird lifecycle
• Large risk
- Risk of mortality of birds
- Risk of disease
- Risk of low egg yield
Key characteristics of layer industry
Source: CLFMA data; Dept. of Animal Husbandry, Dairying and Fisheries reports; Management interviews

Split between branded feed bought from standalone
players, and feed sourced
from DOC providers
Even within branded segment, external sourcing of feed is mainly
during laying period
FEED IS EXTERNALLY SOURCED LARGELY IN LAYER STAGE…
…WITH QUALITY & CREDIT BEING IMPORTANT PURCHASE CRITERIA
ANIMALLIFECYCLE
TYPICALNUTRITION
PERIOD
CUSTOMERBEHAVIOR
SHARE OF BRANDEDPLAYERS
LAYER CHICK(~3% of feed
volume)
• 0-8th week
• Feed typically purchased from integrated players, who provide DOC as well
• 55-60% of market is organized
LAYER GROWER
(~12% of feed volume)
• 9th -20th
week
• Feed typically purchased from integrated players, who provide DOC as well
• 40% concentratetypically bought (rest is the energy source – mixed directly by farmers)
• ~50% of market is organized
LAYER(~85% of feed
volume)
• 21st – 72nd
week
• 35% concentrate(protein + additives) typically bought
• Product quality & credit are important inputs to buying decision
• Primarily branded feed
Primarily procured from branded feed
manufacturers
Source: World’s Poultry Science Journal, National Centre for Biotechnology Information, US Food & Agriculture Org.

Within external feed, most volumes procured are of layer
concentrate
Source: World’s Poultry Science Journal, National Centre for Biotechnology Information, US Food & Agriculture Org.
Product type DescriptionLifecycle relevance
Features/Utility
Fu
ll F
eed
Mash• Finely ground,
mixed feed• Layer
• Provides well balanced diet
• Not considered to be palatable
Crumbs
• Mixed feed iscrushed to a consistency coarser than mash
• Chick
• Popular due to feeding convenience
• High likelihood of consumption by chicks
Pellets
• Mash feed mechanically converted into high density pellets
• Grower
• Increased digestibility over mash feed
• Typically results in a better growth rate compared to mash
• Considered to be very palatable
Concentrate
• Contains high density of specific nutrients
• Grower, Layer
• Provides concentrated sources of necessary nutrition
• Added to an energy (and sometimes protein) sourceto get compound feed
LAYER FARMERS LARGELY PROCURE CONCENTRATE FROM BRANDED PLAYERS
HOWEVER, BRANDED PLAYERS ALSO OFFER OTHER PRODUCT TYPES ACROSS LIFECYCLE REQUIREMENTS OF THE BIRD

Thank you